

Form 6-K dLocal Ltd For: Mar 31
 Tweet
Tweet Share
Share
UNITED STATES
SECURITIES AND EXCHANGE COMMISSION
Washington, D.C. 20549
FORM 6-K
REPORT OF FOREIGN PRIVATE ISSUER
PURSUANT TO RULE 13a-16 OR 15d-16
UNDER THE SECURITIES EXCHANGE ACT OF 1934
For the month of May 2022
Commission File Number: 001-40451
DLocal Limited
(Exact name of registrant as specified in its charter)
Dr. Luis Bonavita 1294
Montevideo
Uruguay 11300
+1 (424) 392-7437
(Address of principal executive office)
Indicate by check mark whether the registrant files or will file annual reports under cover of Form 20-F or Form 40-F:
Form 20-F ☒ Form 40-F ☐
Indicate by check mark if the registrant is submitting the Form 6-K in paper as permitted by Regulation S-T Rule 101(b)(1):
Yes ☐ No ☒
Indicate by check mark if the registrant is submitting the Form 6-K in paper as permitted by Regulation S-T Rule 101(b)(7):
Yes ☐ No ☒
TABLE OF CONTENTS
EXHIBIT
|
|
|
99.1 |
|
Press release dated May 17, 2022 - DLocal Limited Reports 2022 First Quarter Results |
|
||
99.2 |
|
DLocal Limited Unaudited Consolidated Condensed Interim Financial Statements as of March 31, 2022 and for the three-month periods ended March 31, 2022 and 2021 |
|
||
99.3 |
|
Quaterly Report 2022 - dLocal Reports 2022 First Quarter Financial results |
|
||
99.4 |
|
dLocal Q1 2022 Earnings Presentation |
SIGNATURE
Pursuant to the requirements of the Securities Exchange Act of 1934, the registrant has duly caused this report to be signed on its behalf by the undersigned, thereunto duly authorized.
|
DLocal Limited |
|
|
|
|
|
|
|
By: |
/s/ Diego Cabrera Canay |
|
|
Name: |
Diego Cabrera Canay |
|
|
Title: |
Chief Financial Officer |
|
Date: May 18, 2022

DLocal Limited Reports 2022 First Quarter Financial Results
First Quarter 2022
US$2.1 billion Total Payment Volume, up 127% year-over-year
Revenues of US$87.5 million, up 117% year-over-year
190% Net Revenue Retention Rate
38% Adjusted EBITDA Margin
dLocal reports in US dollars and in accordance with IFRS as issued by the IASB
Montevideo, Uruguay May 17, 2022 — DLocal Limited (“dLocal”, “we”, “us”, and “our”) (NASDAQ: DLO), a technology- first payments platform, announced its financial results today for the first quarter ended March 31, 2022.
“We are pleased to share that we are off to a strong start to the year, delivering record Q1 results, with TPV surpassing US$2 billion and increasing 127% year-over-year. For the fifth consecutive quarter we grew our revenue triple digits, increasing it by 117% year-over-year to US$87 million, and we continue to deliver positive Adjusted EBITDA, increasing it by 84% year-over-year to US$33 million. Our performance this quarter reinforces our strong growth momentum, and we expect to continue delivering growth supported by the performance of our existing and new merchants using our platform.
While Q1 2022 has been marked by a challenging global macro environment due to specific factors such as higher interest rates, higher inflation in some developed markets, challenges in logistics in specific geographies, the Russia - Ukraine conflict, our business has shown resilience and continues to benefit from the diversity of our merchants across industry verticals, geographies, products, and consumer behavior patterns. Our business has no exposure to Russia or Ukraine.
We continue to expand our footprint in emerging markets, launching operations in two new countries, Ivory Coast and Rwanda, bringing the total number of countries in which we make our services available to 37. We continue to make disciplined investments in our infrastructure and people to support our expansion strategy while maintaining an Adjusted EBITDA margin of 38%. Our total number of employees increased to 562 by the end of March 2022, a 54% year-over-year increase,” said Sebastian Kanovich.
First Quarter 2022 Financial Highlights
The following table summarizes our key performance metrics:
|
Three months ended |
||
March 31, 2022 |
|
March 31, 2021 |
|
(in millions of US$ except for %) |
|||
Key Performance Metrics |
|
|
|
TPV |
2,104 |
|
926 |
TPV growth YoY |
127% |
|
139% |
Revenue |
87.5 |
|
40.3 |
Revenue growth YoY |
117% |
|
124% |
Adj. EBITDA |
32.9 |
|
17.8 |
Adj. EBITDA Margin |
38% |
|
44% |
First Quarter 2022 Business Highlights
Special Note Regarding Adjusted EBITDA and Adjusted EBITDA Margin
dLocal has only one operating segment. dLocal measures its operating segment’s performance by Revenues, Adjusted EBITDA and Adjusted EBITDA Margin, and uses these metrics to make decisions about allocating resources.
Adjusted EBITDA as used by dLocal is defined as the profit from operations before financing and taxation for the year or period, as applicable, before depreciation of property, plant and equipment, amortization of right-of-use assets and intangible assets, and further excluding the changes in fair value of financial assets and derivative instruments carried at fair value through profit or loss, impairment gains/(losses) on financial assets, transaction costs, share-based payment non-cash charges, secondary offering expenses, and inflation adjustment. dLocal defines Adjusted EBITDA Margin as the Adjusted EBITDA divided by consolidated revenues.
Although Adjusted EBITDA and Adjusted EBITDA Margin may be commonly viewed as non-IFRS measures in other contexts, pursuant to IFRS 8, (“Operating Segments”), Adjusted EBITDA and Adjusted EBITDA Margin are treated by dLocal as IFRS measures based on the manner in which dLocal utilizes these measures. Nevertheless, dLocal’s Adjusted EBITDA and Adjusted EBITDA Margin metrics should not be viewed in isolation or as a substitute for net income for the periods presented under IFRS. dLocal also believes that its Adjusted EBITDA and Adjusted EBITDA Margin metrics are useful metrics used by analysts and investors, although these measures are not explicitly defined under IFRS. Additionally, the way dLocal calculates operating segment’s performance measures may be different from the calculations used by other entities, including competitors, and therefore, dLocal’s performance measures may not be comparable to those of other entities.
The table below presents a reconciliation of dLocal’s Adjusted EBITDA and Adjusted EBITDA Margin to net income:
In thousands of U.S. dollars |
Three-months ended March 31 |
|
|
2022 |
2021 |
Profit for the period |
26,273 |
16,927 |
Income tax expense |
1,213 |
1,379 |
Depreciation and amortization |
1,723 |
515 |
Secondary offering expenses1 |
89 |
705 |
Transaction costs |
— |
113 |
Share-based payment non-cash charges |
2,034 |
565 |
Other operating (gain)/loss |
— |
(2,896) |
Other charges, net |
1,524 |
533 |
Adjusted EBITDA |
32,856 |
17,841 |
|
|
|
Revenues |
87,453 |
40,256 |
Adjusted EBITDA |
32,856 |
17,841 |
Adjusted EBITDA Margin |
37.6% |
44.3% |
1 Secondary expenses for Q1 2022 corresponds to expenses assumed by dLocal in relation to the secondary offering of its shares occurred in 2021.
Earnings per share:
We calculate basic earnings per share by dividing the profit attributable to equity holders by the weighted average number of common shares issued and outstanding during the three-months periods ended March 31, 2022 and 2021.
Our diluted earnings per share is calculated by dividing the profit attributable to equity holders of dLocal by the weighted average number of common shares outstanding during the period plus the weighted average number of common shares that would be issued on conversion of all dilutive potential common shares into common shares.
The next table presents the information used as base for such calculation
|
For the three-month period ended March 31 |
|
|
2022 |
2021 |
Profit attributable to common shareholders (U.S. Dollars) |
26,291,715 |
16,919,575 |
Weighted average number of common shares |
295,044,763 |
271,140,500 |
Adjustments for calculation of diluted earnings per share |
18,144,357 |
22,954,000 |
Weighted average number of common shares for calculating diluted earnings per share |
313,189,120 |
294,094,500 |
Basic earnings per share |
0.09 |
0.06 |
Diluted earnings per share |
0.08 |
0.06 |
This press release does not contain sufficient information to constitute an interim financial report as defined in International Accounting Standards 34, “Interim Financial Reporting” nor a financial statement as defined by International Accounting Standards 1 “Presentation of Financial Statements”. The financial information in this press release has not been audited.
Conference Call and Webcast
dLocal’s management team will host a conference call and audio webcast on May 18, 2022 at 9:00 a.m. Eastern Time. The conference call may be accessed by dialing (888) 705-0197/ (409) 981-0764 (Conference ID – 7488285 –) and requesting inclusion in the call for dLocal.
The live conference call can be accessed via audio webcast at the investor relations section of dLocal’s website, at https://investor.dlocal.com/. An archive of the webcast will be available for a year following the conclusion of the conference call. The investor presentation will also be filed on EDGAR at www.sec.gov.
About dLocal
dLocal powers local payments in emerging markets, connecting global enterprise merchants with billions of emerging market consumers in 37 countries across APAC, the Middle East, Latin America, and Africa. Through the “One dLocal” platform (one direct API, one platform, and one contract), global companies can accept payments, send pay-outs and settle funds globally without the need to manage separate pay-in and pay-out processors, set up numerous local entities, and integrate multiple acquirers and payment methods in each market.
Definition of Selected Operational Metrics
“API” means application programming interface, which is a general term for programming techniques that are available for software developers when they integrate with a particular service or application. In the payments industry, APIs are usually provided by any party participating in the money flow (such as payment gateways, processors, service providers) to facilitate the money transfer process.
“Enterprise Global Merchants” means merchants with at least US$6 million of annual TPV processed through our platform.
“Local payment methods” refers to any payment method that is processed in the country where the end user of the merchant sending or receiving payments is located, which include credit and debit cards, cash payments, bank transfers, mobile money, and digital wallets.
“NRR” means net revenue retention rate, which is the U.S. dollar-based measure of retention and growth of our merchants. We calculate the NRR of a period by dividing the current period revenue by the prior period revenue. The prior period revenue is the revenue billed by us to all of our merchant customers in the corresponding period for the prior fiscal year. The current period revenue is the revenue billed by us in the corresponding period for the current fiscal year to the same merchant customers included in the calculation of the prior period revenue. Current period revenue includes any upsells and cross sells of products, geographies, and payment methods to such merchant customers, and is net of any contractions or attrition, but excludes revenue from new customers on-boarded during the last 12 months.
“Pay-in” means a payment transaction whereby dLocal’s merchant customers receive payment from their customers.
“Pay-out” means a payment transaction whereby dLocal disburses money in local currency to the business partners or customers of dLocal’s merchant customers.
“Revenue from New Merchants”: means the revenue billed by us to merchant customers that we did not bill revenues in the same quarter (or period) of the prior year.
“Revenue from Existing Merchants”: means the revenue billed by us in the last twelve months to the merchant customers that we billed revenue in the same quarter (or period) of the prior year.
Forward Looking Statements
This press release contains certain forward-looking statements. These forward-looking statements convey dLocal’s current expectations or forecasts of future events. Forward-looking statements regarding dLocal involve known and unknown risks, uncertainties and other factors that may cause dLocal’s actual results, performance or achievements to be materially different from any future results, performances or achievements expressed or implied by the forward-looking statements. Certain of these risks and uncertainties are described in the “Risk Factors,” “Forward-Looking Statements” and “Cautionary Note Regarding Forward-Looking Statements” sections of dLocal’s filings with the U.S. Securities and Exchange Commission. Unless required by law, dLocal undertakes no obligation to publicly update or revise any forward-looking statements to reflect circumstances or events after the date hereof.
DLocal Limited
Certain interim financial information
Consolidated Condensed Statements of Comprehensive Income for the three-month periods ended March 31, 2022 and 2021
(In thousands of U.S. dollars, except per share amounts, unaudited)
|
|
March 31, 2022 |
|
March 31, 2021 |
Continuing operations |
|
|
|
|
Revenues |
|
87,453 |
|
40,256 |
Cost of services |
|
(43,899) |
|
(16,989) |
Gross profit |
|
43,554 |
|
23,267 |
Technology and development expenses |
|
(1,406) |
|
(520) |
Sales and marketing expenses |
|
(2,844) |
|
(1,042) |
General and administrative expenses |
|
(10,294) |
|
(5,762) |
Impairment gain/(loss) on financial assets |
|
75 |
|
(54) |
Other operating gain |
|
— |
|
2,896 |
Operating profit |
|
29,085 |
|
18,785 |
Finance income |
|
6 |
|
18 |
Finance costs |
|
(1,299) |
|
(463) |
Inflation adjustment |
|
(306) |
|
(34) |
Other results |
|
(1,599) |
|
(479) |
Profit before income tax |
|
27,486 |
|
18,306 |
Income tax expense |
|
(1,213) |
|
(1,379) |
Profit for the period |
|
26,273 |
|
16,927 |
Profit attributable to: |
|
|
|
|
Owners of the Group |
|
26,292 |
|
16,920 |
Non-controlling interest |
|
(19) |
|
7 |
Profit for the period |
|
26,273 |
|
16,927 |
Earnings per share |
|
|
|
|
Basic Earnings per share |
|
0.09 |
|
0.06 |
Diluted Earnings per share |
|
0.08 |
|
0.06 |
Other comprehensive Income |
|
|
|
|
Items that may be reclassified to profit or loss: |
|
|
|
|
Exchange difference on translation on foreign operations |
|
1,162 |
|
212 |
Other comprehensive income for the period, net of tax |
|
1,162 |
|
212 |
Total comprehensive income for the period |
|
27,435 |
|
17,139 |
Total comprehensive income for the period is attributable to: |
|
|
|
|
Owners of the Group |
|
27,454 |
|
17,123 |
Non-controlling interest |
|
(19) |
|
16 |
Total comprehensive income for the period |
|
27,435 |
|
17,139 |
DLocal Limited
Certain interim financial information
Consolidated Condensed Statements of Financial Position as of March 31, 2022 and December 31, 2021
(In thousands of U.S. dollars, except per share amounts, unaudited)
|
|
March 31, 2022 |
|
December 31, 2021 |
ASSETS |
|
|
|
|
Current Assets |
|
|
|
|
Cash and cash equivalents |
|
410,064 |
|
336,197 |
Financial assets at fair value through profit or loss |
|
1,286 |
|
1,004 |
Trade and other receivables |
|
217,191 |
|
190,966 |
Other assets |
|
1,188 |
|
1,339 |
Total Current Assets |
|
629,729 |
|
529,506 |
Non-Current Assets |
|
|
|
|
Deferred tax assets |
|
578 |
|
133 |
Property, plant and equipment |
|
2,377 |
|
2,485 |
Right-of-use assets |
|
3,799 |
|
3,915 |
Intangible assets |
|
48,056 |
|
46,969 |
Total Non-Current Assets |
|
54,810 |
|
53,502 |
TOTAL ASSETS |
|
684,539 |
|
583,008 |
LIABILITIES |
|
|
|
|
Current Liabilities |
|
|
|
|
Trade and other payables |
|
346,776 |
|
277,160 |
Borrowings |
|
6,077 |
|
5,014 |
Lease liabilities |
|
502 |
|
502 |
Tax liabilities |
|
13,568 |
|
13,126 |
Derivative financial instruments |
|
1,121 |
|
221 |
Provisions |
|
1,759 |
|
1,710 |
Contingent consideration liability |
|
665 |
|
665 |
Total Current Liabilities |
|
370,468 |
|
298,398 |
Non-Current Liabilities |
|
|
|
|
Deferred tax liabilities |
|
576 |
|
883 |
Lease liabilities |
|
3,367 |
|
3,426 |
Total Non-Current Liabilities |
|
3,943 |
|
4,309 |
TOTAL LIABILITIES |
|
374,411 |
|
302,707 |
EQUITY |
|
|
|
|
Share Capital |
|
590 |
|
590 |
Share Premium |
|
157,750 |
|
157,151 |
Capital Reserve |
|
14,534 |
|
12,741 |
Other Reserves |
|
1,466 |
|
(30) |
Retained earnings |
|
135,825 |
|
109,867 |
Total Equity Attributable to owners of the Group |
|
310,165 |
|
280,319 |
Non-controlling interest |
|
(37) |
|
(18) |
TOTAL EQUITY |
|
310,128 |
|
280,301 |
dLocal was incorporated on February 10, 2021, as a Cayman Islands exempted company with limited liability, duly registered with the Cayman Islands Registrar of Companies. The contribution of dLocal Group Limited (a limited liability company incorporated in Malta, the former holding entity or “dLocal Malta”) shares to dLocal was the Cayman Islands company has been finalized as of April 14, 2021. Until the contribution of dLocal Malta shares to it, dLocal had not commenced operations, consequently the historical information previous to that date presented in here corresponds to dLocal Malta, our predecessor. This reorganization was done, among other things, to facilitate the initial public offering of the Group. dLocal had no prior assets, holdings or operations.
Investor Relations Contact:
Media Contact:
Exhibit 99.2
DLocal Limited
Unaudited Consolidated Condensed Interim Financial Statements as of March 31, 2022 and for the three-month periods ended March 31, 2022 and 2021
DLocal Limited
Consolidated Condensed Interim Statements of Comprehensive Income
For the three-month periods ended March 31, 2022 and 2021
(All amounts in thousands of U.S. Dollars except share data or as otherwise indicated)
|
|
Notes |
|
March 31, 2022 |
|
March 31, 2021 |
Continuing operations |
|
|
|
|
|
|
Revenues |
|
6 |
|
87,453 |
|
40,256 |
Cost of services |
|
6 |
|
(43,899) |
|
(16,989) |
Gross profit |
|
|
|
43,554 |
|
23,267 |
Technology and development expenses |
|
7 |
|
(1,406) |
|
(520) |
Sales and marketing expenses |
|
8 |
|
(2,844) |
|
(1,042) |
General and administrative expenses |
|
8 |
|
(10,294) |
|
(5,762) |
Impairment gain/(loss) on financial assets |
|
14 |
|
75 |
|
(54) |
Other operating gain |
|
|
|
— |
|
2,896 |
Operating profit |
|
|
|
29,085 |
|
18,785 |
Finance income |
|
|
|
6 |
|
18 |
Finance costs |
|
|
|
(1,299) |
|
(463) |
Inflation adjustment |
|
|
|
(306) |
|
(34) |
Other results |
|
|
|
(1,599) |
|
(479) |
Profit before income tax |
|
|
|
27,486 |
|
18,306 |
Income tax expense |
|
11 |
|
(1,213) |
|
(1,379) |
Profit for the period |
|
|
|
26,273 |
|
16,927 |
Profit attributable to: |
|
|
|
|
|
|
Owners of the Group |
|
|
|
26,292 |
|
16,920 |
Non-controlling interest |
|
|
|
(19) |
|
7 |
Profit for the period |
|
|
|
26,273 |
|
16,927 |
Earnings per share |
|
|
|
|
|
|
Basic Earnings per share |
|
12 |
|
0.09 |
|
0.06 |
Diluted Earnings per share |
|
12 |
|
0.08 |
|
0.06 |
Other comprehensive Income |
|
|
|
|
|
|
Items that may be reclassified to profit or loss: |
|
|
|
|
|
|
Exchange difference on translation on foreign operations |
|
|
|
1,162 |
|
212 |
Other comprehensive income for the period, net of tax |
|
|
|
1,162 |
|
212 |
Total comprehensive income for the period |
|
|
|
27,435 |
|
17,139 |
Total comprehensive income for the period is attributable to: |
|
|
|
|
|
|
Owners of the Group |
|
|
|
27,454 |
|
17,123 |
Non-controlling interest |
|
|
|
(19) |
|
16 |
Total comprehensive income for the period |
|
|
|
27,435 |
|
17,139 |
The accompanying notes are an integral part of these Consolidated Condensed Interim Financial Statements.
DLocal Limited
Consolidated Condensed Interim Statements of Financial Position
As of March 31, 2022 and December 31, 2021
(All amounts in thousands of U.S. Dollars except share data or as otherwise indicated)
|
|
Notes |
|
March 31, 2022 |
|
December 31, 2021 |
ASSETS |
|
|
|
|
|
|
Current Assets |
|
|
|
|
|
|
Cash and cash equivalents |
|
13 |
|
410,064 |
|
336,197 |
Financial assets at fair value through profit or loss |
|
|
|
1,286 |
|
1,004 |
Trade and other receivables |
|
14 |
|
217,191 |
|
190,966 |
Other assets |
|
15 |
|
1,188 |
|
1,339 |
Total Current Assets |
|
|
|
629,729 |
|
529,506 |
Non-Current Assets |
|
|
|
|
|
|
Deferred tax assets |
|
|
|
578 |
|
133 |
Property, plant and equipment |
|
|
|
2,377 |
|
2,485 |
Right-of-use assets |
|
|
|
3,799 |
|
3,915 |
Intangible assets |
|
16 |
|
48,056 |
|
46,969 |
Total Non-Current Assets |
|
|
|
54,810 |
|
53,502 |
TOTAL ASSETS |
|
|
|
684,539 |
|
583,008 |
LIABILITIES |
|
|
|
|
|
|
Current Liabilities |
|
|
|
|
|
|
Trade and other payables |
|
17 |
|
346,776 |
|
277,160 |
Borrowings |
|
|
|
6,077 |
|
5,014 |
Lease liabilities |
|
|
|
502 |
|
502 |
Tax liabilities |
|
18 |
|
13,568 |
|
13,126 |
Derivative financial instruments |
|
19 |
|
1,121 |
|
221 |
Provisions |
|
20 |
|
1,759 |
|
1,710 |
Contingent consideration liability |
|
|
|
665 |
|
665 |
Total Current Liabilities |
|
|
|
370,468 |
|
298,398 |
Non-Current Liabilities |
|
|
|
|
|
|
Deferred tax liabilities |
|
|
|
576 |
|
883 |
Lease liabilities |
|
|
|
3,367 |
|
3,426 |
Total Non-Current Liabilities |
|
|
|
3,943 |
|
4,309 |
TOTAL LIABILITIES |
|
|
|
374,411 |
|
302,707 |
EQUITY |
|
|
|
|
|
|
Share Capital |
|
12 |
|
590 |
|
590 |
Share Premium |
|
12 |
|
157,750 |
|
157,151 |
Capital Reserve |
|
12 |
|
14,534 |
|
12,741 |
Other Reserves |
|
12 |
|
1,466 |
|
(30) |
Retained earnings |
|
12 |
|
135,825 |
|
109,867 |
Total Equity Attributable to owners of the Group |
|
|
|
310,165 |
|
280,319 |
Non-controlling interest |
|
|
|
(37) |
|
(18) |
TOTAL EQUITY |
|
|
|
310,128 |
|
280,301 |
The accompanying notes are an integral part of these Consolidated Condensed Interim Financial Statement
DLocal Limited
Consolidated Condensed Interim Statements of Changes in Equity
For the three-month periods ended March 31, 2022 and 2021
(All amounts in thousands of U.S. Dollars except share data or as otherwise indicated)
|
|
Notes |
|
Share |
|
Share |
|
Capital |
|
Other Reserves |
|
Retained |
|
Total |
|
Non- |
|
Total |
Balance as of January 1st, 2022 |
|
|
|
590 |
|
157,151 |
|
12,741 |
|
(30) |
|
109,867 |
|
280,319 |
|
(18) |
|
280,301 |
Comprehensive Income for the period |
|
|
|
|
|
|
|
|
|
|
|
|
|
|
|
|
|
|
Profit of the period |
|
|
|
— |
|
— |
|
— |
|
— |
|
26,292 |
|
26,292 |
|
(19) |
|
26,273 |
Exchange difference on translation on foreign |
|
|
|
— |
|
— |
|
— |
|
1,496 |
|
(334) |
|
1,162 |
|
— |
|
1,162 |
Total Comprehensive Income for the period |
|
|
|
— |
|
— |
|
— |
|
1,496 |
|
25,958 |
|
27,454 |
|
(19) |
|
27,435 |
Transactions with Group owners in their |
|
|
|
|
|
|
|
|
|
|
|
|
|
|
|
|
|
|
Share-options exercise |
|
12 |
|
— |
|
599 |
|
(241) |
|
— |
|
— |
|
358 |
|
— |
|
358 |
Forfeitures |
|
12 |
|
— |
|
— |
|
(73) |
|
— |
|
— |
|
(73) |
|
— |
|
(73) |
Share-based payments |
|
9 |
|
— |
|
— |
|
2,107 |
|
— |
|
— |
|
2,107 |
|
— |
|
2,107 |
Transactions with Group owners in their |
|
|
|
— |
|
599 |
|
1,793 |
|
— |
|
— |
|
2,392 |
|
— |
|
2,392 |
Balance as of March 31st, 2022 |
|
|
|
590 |
|
157,750 |
|
14,534 |
|
1,466 |
|
135,825 |
|
310,165 |
|
(37) |
|
310,128 |
Balance as of January 1st, 2021 |
|
|
|
602 |
|
— |
|
12,582 |
|
119 |
|
31,749 |
|
45,052 |
|
(4) |
|
45,048 |
Comprehensive Income for the period |
|
|
|
|
|
|
|
|
|
|
|
|
|
|
|
|
|
|
Profit of the period |
|
|
|
— |
|
— |
|
— |
|
— |
|
16,920 |
|
16,920 |
|
7 |
|
16,927 |
Exchange difference on translation on foreign |
|
|
|
— |
|
— |
|
— |
|
160 |
|
43 |
|
203 |
|
9 |
|
212 |
Total Comprehensive Income for the period |
|
|
|
— |
|
— |
|
— |
|
160 |
|
16,963 |
|
17,123 |
|
16 |
|
17,139 |
Transactions with Group owners in their |
|
|
|
|
|
|
|
|
|
|
|
|
|
|
|
|
|
|
Issue of ordinary shares |
|
12 |
|
26 |
|
46,314 |
|
|
|
— |
|
— |
|
46,340 |
|
— |
|
46,340 |
Share-options exercise |
|
12 |
|
— |
|
3,221 |
|
(3,221) |
|
— |
|
— |
|
— |
|
— |
|
— |
Share-based payments |
|
9 |
|
— |
|
— |
|
565 |
|
— |
|
— |
|
565 |
|
(163) |
|
402 |
Transactions with Group owners in their |
|
|
|
26 |
|
49,535 |
|
(2,656) |
|
— |
|
— |
|
46,905 |
|
(163) |
|
46,742 |
Balance as of March 31st, 2021 |
|
|
|
628 |
|
49,535 |
|
9,926 |
|
279 |
|
48,712 |
|
109,080 |
|
(151) |
|
108,929 |
The accompanying notes are an integral part of these Consolidated Condensed Interim Financial Statements.
DLocal Limited
Consolidated Condensed Interim Statements of Cash Flows
For the three-month periods ended March 31, 2022 and 2021
(All amounts in thousands of U.S. Dollars except share data or as otherwise indicated)
|
|
Notes |
|
March 31, 2022 |
|
|
March 31, 2021 |
|
||
Cash flows from operating activities |
|
|
|
|
|
|
|
|
||
Profit before income tax |
|
|
|
|
27,486 |
|
|
|
18,306 |
|
Adjustments: |
|
|
|
|
|
|
|
|
||
Interest income from financial instruments |
|
|
|
|
(6 |
) |
|
|
(26 |
) |
Interest charges for lease liabilities |
|
|
|
|
163 |
|
|
|
3 |
|
Other finance expense |
|
|
|
|
1,136 |
|
|
|
460 |
|
Amortization of Intangible assets |
|
10 |
|
|
1,422 |
|
|
|
427 |
|
Depreciation of Property, plant and equipment |
|
10 |
|
|
188 |
|
|
|
51 |
|
Amortization of Right-of-use asset |
|
10 |
|
|
113 |
|
|
|
37 |
|
Revenue reduction related to prepaid assets |
|
15 |
|
|
158 |
|
|
|
50 |
|
Share-based payment expense, net of forfeitures |
|
9 |
|
|
2,034 |
|
|
|
565 |
|
Net exchange differences |
|
|
|
|
1,490 |
|
|
|
174 |
|
Fair value gain on financial assets at fair value through profit or loss |
|
|
|
|
— |
|
|
|
8 |
|
Other operating gain |
|
19 |
|
|
— |
|
|
|
(2,896 |
) |
Net Impairment (gain)/loss on financial assets |
|
14 |
|
|
(75 |
) |
|
|
54 |
|
|
|
|
|
|
34,109 |
|
|
|
17,213 |
|
Changes in working capital |
|
|
|
|
|
|
|
|
||
Increase in Trade and other receivables |
|
14 |
|
|
(26,200 |
) |
|
|
(20,062 |
) |
Increase in Other assets |
|
15 |
|
|
(141 |
) |
|
|
(469 |
) |
Increase in Trade and other payables |
|
17 |
|
|
69,616 |
|
|
|
7,558 |
|
Decrease in Tax Liabilities |
|
18 |
|
|
(200 |
) |
|
|
(171 |
) |
Increase/(decrease) in Provisions |
|
20 |
|
|
49 |
|
|
|
(33 |
) |
Cash from operating activities |
|
|
|
|
77,233 |
|
|
|
4,036 |
|
Income tax paid |
|
12 |
|
|
(1,323 |
) |
|
|
(641 |
) |
Net cash from operating activities |
|
|
|
|
75,910 |
|
|
|
3,395 |
|
Cash flows from investing activities |
|
|
|
|
|
|
|
|
||
Acquisitions of Property, plant and equipment |
|
|
|
|
(80 |
) |
|
|
(435 |
) |
Additions of Intangible assets |
|
16 |
|
|
(2,509 |
) |
|
|
(1,215 |
) |
Advance Payment for Assets acquisition |
|
|
|
|
— |
|
|
|
(38,670 |
) |
Net collections of financial assets at FVPL |
|
|
|
|
618 |
|
|
|
7,050 |
|
Interest collected from financial instruments |
|
|
|
|
6 |
|
|
|
26 |
|
Net cash used in investing activities |
|
|
|
|
(1,965 |
) |
|
|
(33,244 |
) |
Cash flows from financing activities |
|
|
|
|
|
|
|
|
||
Proceeds from issuance of shares |
|
12 |
|
|
— |
|
|
|
46,340 |
|
Proceeds from transaction between shareholders |
|
|
|
|
— |
|
|
|
149,411 |
|
Increase in Restricted cash |
|
|
|
|
— |
|
|
|
(149,411 |
) |
Share-options exercise |
|
|
|
|
358 |
|
|
|
— |
|
Interest payments on lease liability |
|
|
|
|
(163 |
) |
|
|
(3 |
) |
Principal payments on lease liability |
|
|
|
|
(92 |
) |
|
|
(49 |
) |
Other finance expense paid |
|
|
|
|
(37 |
) |
|
|
(460 |
) |
Net cash provided by financing activities |
|
|
|
|
66 |
|
|
|
45,828 |
|
Net increase in cash flow |
|
|
|
|
74,011 |
|
|
|
15,979 |
|
Cash and cash equivalents at the beginning of the period |
|
|
|
|
336,197 |
|
|
|
111,733 |
|
Effects of exchange rate changes on cash and cash equivalents |
|
|
|
|
(144 |
) |
|
|
(211 |
) |
Cash and cash equivalents at the end of the period |
|
|
|
|
410,064 |
|
|
|
127,501 |
|
The accompanying notes are an integral part of these Consolidated Condensed Interim Financial Statements.
DLocal Limited
Notes to the Consolidated Condensed Interim Financial Statements
At March 31, 2022
(All amounts in thousands of U.S. Dollars except share data or as otherwise indicated)
1. General information and Significant Events during the period
1.1. General information
DLocal Limited (“dLocal” or the “Company”) is a holding company, referred to together with its subsidiaries as the “Group”. dLocal is a limited liability company. The Group was established on October 5, 2016, under the holding company dLocal Group Limited, domiciled and incorporated in Malta, and on April 14, 2021 it was reorganized under dLocal, domiciled and incorporated in the Cayman Islands. The Company is the ultimate controlling party of the Group.
The Group processes online payment transactions, enabling enterprise merchants located in developed economies (mainly United States, Europe and China) to get paid (“payins”) from customers in emerging markets and to make payments (“payouts”) to customers in emerging markets. As of the date of issuance of this Consolidated Condensed Interim Financial Statements, the Group continued to focus on its expansion efforts bringing the total number of countries in the geographic network to 37.
In order to conduct its business, the Group has direct connections with banks, acquirers and payments processors to process payments locally in emerging markets. It also operates with financial institutions to expatriate/ repatriate the funds to/from the developed economies where the merchant customers elect to settle their funds in the currency of their preference (mainly U.S. Dollar and Euro). These consolidated condensed interim financial statements include dLocal’s subsidiaries and details of the structure are included under Note 4: Consolidation of subsidiaries.
The Group is licensed and regulated in the EU as an Electronic Money Issuer, or EMI, and Payment Institution, or PI, and registered as a Money Service Business with the Financial Crimes Enforcement Network of the U.S. Department of the Treasury, or FinCEN, and we operate and are licensed, as applicable, in 37 in emerging markets, primarily in the Americas, Asia and Africa.
In addition, the Group is subject to laws aimed at preventing money laundering, corruption and the financing of terrorism. This regulatory landscape is constantly changing, including as a consequence of the implementation of the Fourth Anti-Money Laundering Directive (Directive 2015/849/EU, “MLD4”) and the proposed amendments to the MLD4, often referred to as the fourth Anti-Money Laundering Directive.
1.2. Significant events during the period
On May 2, 2022, the Group filed its annual report on Form 20-F as of December 31, 2021, and 2020 and for the years ended December 31, 2021, 2020, and 2019.
On March 3, 2022, DLocal Group Limited (the “Borrower”) entered into a Credit Agreement (the “Agreement”) with Bank J. Safra Sarasin (Gibraltar) Ltd, acting through its London Branch (the “Bank”), pursuant to which the Bank grants a facility to the Borrower of a maximum amount of a total of U$S 4,000 (the “Credit Facility”). The Borrower may utilize the Credit Facility for options and futures transactions as well as structured products subject to margin requirements.
2. Presentation and preparation of the Consolidated Condensed Interim Financial Statements and significant accounting policies
2.1. Basis of preparation of consolidated condensed interim financial information
These Consolidated Condensed Interim Financial Statements for the three-month periods ended March 31, 2022 have been prepared in accordance with International Accounting Standard 34, “Interim Financial Reporting” as issued by the International Accounting Standard Board.
These Consolidated Condensed Interim Financial Statements do not include all the notes of the type normally included in an annual consolidated financial statement. Accordingly, this report should be read in conjunction with the annual consolidated financial statements for the year ended December 31, 2021 (the “Annual Financial Statements”).
The accounting policies and critical accounting estimates and judgments adopted, except for those explicitly indicated on these Consolidated Condensed Interim Financial Statements, are consistent with those of the previous financial year and corresponding interim reporting period.
All amounts are presented in thousands of U.S. Dollars except share data or as otherwise indicated.
These Consolidated Condensed Interim Financial Statements for the three-month periods ended March 31, 2022 were authorized for issuance by the dLocal’s Board of Directors on May 17, 2022.
2.2. Share-based payments
During the three-month period ended March 31, 2022 , the Group granted new share options and restricted share units under the Amended and Restated 2020 Global Share Incentive Plan to executives and employees in return for their services, which represented changes in the composition of share options outstanding at the end of the period.
2.2.1. Employee Share Purchase Plan (“ESPP”)
Set out below are summaries of restricted share units and share options granted under the plan:
|
|
March 31, 2022 |
|
December 31, 2021 * |
||||
|
|
Average |
|
|
|
Average |
|
|
|
|
exercise price |
|
|
|
exercise price |
|
|
|
|
per share |
|
|
|
per share |
|
|
|
|
option |
|
Number of |
|
option |
|
Number of |
|
|
(U.S. Dollars) |
|
options and RSUs |
|
(U.S. Dollars) |
|
options and RSUs |
At the beginning of the period |
|
1.16 |
|
4,032,345 |
|
1.22 |
|
17,361,000 |
Granted during the period |
|
29.56 |
|
263,622 |
|
3.69 |
|
2,371,345 |
Exercised during the period |
|
3.17 |
|
(113,000) |
|
2.03 |
|
(15,685,000) |
Forfeited during the period |
|
5.94 |
|
(21,912) |
|
4.15 |
|
(15,000) |
At the end of the period |
|
5.13 |
|
4,161,055 |
|
1.16 |
|
4,032,345 |
Vested and exercisable at the end of the period |
|
2.00 |
|
641,688 |
|
3.54 |
|
486,750 |
* Retroactively adjusted to reflect the effect of the stock split described in Note 1 to the Annual Financial Statements for the year ended December 31, 2021.
No options expired during the periods covered by the above table.
Share options and restricted share units outstanding at the end of the period have the following expiry dates and exercise prices:
Grant date |
|
Vesting period |
|
Expiry date |
|
Exercise price |
|
Share options and |
|
Share options and |
|
August 1st, 2018 |
|
3 years |
|
August 1st, 2021 |
|
0.74 |
|
90,500 |
|
90,500 |
|
October 1st, 2019 |
|
3 years |
|
October 1st, 2022 |
|
2.18 |
|
77,000 |
|
90,000 |
|
August 24th, 2020 |
|
5 years |
|
August 24th, 2025 |
|
3.30 |
|
735,000 |
|
835,000 |
|
November 15th, 2020 |
|
4 years |
|
November 15th, 2024 |
|
4.15 |
|
135,000 |
|
135,000 |
|
November 23rd, 2020 |
|
5 years |
|
November 23rd, 2025 |
|
3.88 |
|
525,500 |
|
525,500 |
|
January 1st, 2021 |
|
5 years |
|
January 1st, 2026 |
|
3.88 |
|
210,000 |
|
210,000 |
|
March 1st, 2021 |
|
1 year |
|
March 1st, 2022 |
|
0.002 |
|
5,500 |
** |
5,500 |
** |
March 2nd, 2021 |
|
5 years |
|
March 2nd, 2026 |
|
7.44 |
|
10,000 |
|
10,000 |
|
March 11th, 2021 |
|
5 years |
|
March 11th, 2026 |
|
0.002 |
|
1,031,000 |
|
1,031,000 |
** |
March 11th, 2021 |
|
5 years |
|
March 11th, 2026 |
|
7.44 |
|
36,000 |
|
36,000 |
|
March 12nd, 2021 |
|
5 years |
|
March 12nd, 2026 |
|
7.44 |
|
7,000 |
|
7,000 |
|
March 15th, 2021 |
|
5 years |
|
March 15th, 2026 |
|
7.44 |
|
— |
|
7,500 |
|
March 29th, 2021 |
|
5 years |
|
March 29th, 2026 |
|
7.44 |
|
— |
|
10,000 |
|
May 11th, 2021 |
|
5 years |
|
May 11th, 2026 |
|
7.44 |
|
927,500 |
|
927,500 |
|
May 11th, 2021 |
|
3 years |
|
May 11th, 2024 |
|
0.002 |
|
22,500 |
** |
22,500 |
** |
May 18th, 2021 |
|
5 years |
|
May 18th, 2026 |
|
16.17 |
|
10,000 |
|
10,000 |
|
December 9th, 2021 |
|
5 years |
|
December 9th, 2026 |
|
0.002 |
|
75,833 |
** |
79,345 |
** |
February 21st, 2022 |
|
5 years |
|
February 21st, 2027 |
|
0.002 |
|
6,604 |
** |
— |
|
March 16th, 2022 |
|
5 years |
|
March 16th, 2027 |
|
30.47 |
|
20,000 |
|
— |
|
March 16th, 2022 |
|
5 years |
|
March 16th, 2027 |
|
30.47 |
|
180,862 |
|
— |
|
March 28th, 2022 |
|
5 years |
|
March 28th, 2027 |
|
30.27 |
|
55,256 |
|
— |
|
Total |
|
|
|
|
|
|
|
4,161,055 |
|
4,032,345 |
|
|
|
|
|
|
|
|
|
|
|
|
|
Weighted average remaining contractual life of restricted share units and share options outstanding at end of the year |
|
|
|
3.71 years |
|
4.24 years |
|
||||
* Retroactively adjusted to reflect the effect of the stock split described in Note 1 to the Annual Financial Statements for the year ended December 31, 2021. ** It corresponds to Restricted Share Units (RSUs) granted.
2.3. New accounting pronouncements
The Group has not early adopted any standard, interpretation or amendment that has been issued but is not yet effective. The Group did not change its accounting policies or make retrospective adjustments as a result of new accounting standards made applicable on January 1, 2022.
3. Accounting estimates and judgments
Accounting estimates and judgments are continually evaluated and are based on historical experience and other factors, including expectations of future events that are believed to be reasonable under the circumstances.
The critical accounting estimates and judgments adopted on these Consolidated Condensed Interim Financial Statements are consistent with those of the previous financial year and corresponding interim reporting period.
4. Consolidation of subsidiaries
DLocal Limited, located in Cayman Islands, is the parent company of the Group and acts as a holding company for subsidiaries whose main activity is cross-border and local payments, enabling international merchants to access end customers in emerging markets. Its revenue comes from dividends receivable from subsidiaries and share of profit from subsidiary partnership.
The consolidated financial statements of the Group include the following subsidiaries:
|
|
|
|
|
|
% of equity interest held by Dlocal |
||
Entity name |
|
Country of incorporation |
|
Principal activities |
|
March 31, 2022 |
|
December 31, 2021 |
Dlocal Group Limited |
|
Malta |
|
Holding Company |
|
100% |
|
100% |
Dlocal Limited |
|
Malta |
|
Payments provider |
|
99.999% |
|
99.999% |
Dlocal Markets Limited |
|
Malta |
|
Holding Company |
|
100% |
|
100% |
Dlocal Hold Ops Limited |
|
Cayman Islands |
|
Holding Company |
|
100% |
|
- |
Dlocal LLP |
|
United Kingdom |
|
Payments provider |
|
99.999% |
|
99.999% |
Dlocal Corp LLP |
|
United Kingdom |
|
Payments provider |
|
99.99% |
|
99.99% |
Dlocal Inc. |
|
United States of America |
|
Holding Company |
|
100% |
|
100% |
Dlocal PTE Limited |
|
Singapore |
|
Holding Company |
|
100% |
|
100% |
Dlocal Technologies S.A. |
|
Uruguay |
|
Service provider |
|
100% |
|
100% |
Dlocal Uruguay S.A. |
|
Uruguay |
|
Collection agent |
|
100% |
|
100% |
Dlocal Israel Limited |
|
Israel |
|
Service provider |
|
100% |
|
100% |
Dlocal Brasil Instituição de Pagamento S.A. |
|
Brazil |
|
Collection agent |
|
100% |
|
100% |
Demerge Brasil Facilitadora de Pagamentos Ltda. |
|
Brazil |
|
Collection agent |
|
100% |
|
100% |
Dlocal Brasil Holding Financeira |
|
Brazil |
|
Holding Company |
|
100% |
|
100% |
Webpay Brasil Pagamentos Ltda. |
|
Brazil |
|
Collection agent |
|
100% |
|
- |
Dlocal Argentina S.A. |
|
Argentina |
|
Collection agent |
|
100% |
|
100% |
Demerge Argentina S.A. |
|
Argentina |
|
Service provider |
|
100% |
|
100% |
Dlocal Services Arg S.A. |
|
Argentina |
|
Service provider |
|
100% |
|
100% |
Demerge Mexico S.A. de C.V. |
|
Mexico |
|
Collection agent |
|
99.999% |
|
99.999% |
Dlocal Mexico S.A. DE C.V. |
|
Mexico |
|
Collection agent |
|
99.999% |
|
99.999% |
Dlocal Technologies Mexico S.A. DE C.V. |
|
Mexico |
|
Service provider |
|
100% |
|
100% |
Dlocal Chile SPA |
|
Chile |
|
Collection agent |
|
100% |
|
100% |
Demerge Chile SPA |
|
Chile |
|
Collection agent |
|
100% |
|
100% |
Pagos y Servicios Limitada |
|
Chile |
|
Collection agent |
|
99% |
|
100% |
Dlocal Colombia S.A.S. |
|
Colombia |
|
Collection agent |
|
100% |
|
100% |
Demerge Colombia S.A.S. |
|
Colombia |
|
Collection agent |
|
100% |
|
100% |
W-Collect S.A.S. |
|
Colombia |
|
Collection agent |
|
100% |
|
100% |
BH Collect S.A.S. |
|
Colombia |
|
Collection agent |
|
100% |
|
100% |
Kupa Colombia S.A.S. |
|
Colombia |
|
Collection agent |
|
100% |
|
- |
Demerge Peru S.A.C. |
|
Peru |
|
Collection agent |
|
99% |
|
99% |
Depansum Solutions Private Limited |
|
India |
|
Collection agent |
|
99% |
|
99% |
Dlocal India Pvt Limited |
|
India |
|
Collection agent |
|
99.99% |
|
99.99% |
Guisol Solutions Private Limited |
|
India |
|
Collection agent |
|
100.00% |
|
- |
Demerege Ecuador S.A. (1) |
|
Ecuador |
|
Collection agent |
|
0.15% |
|
0.15% |
PT Dlocal Solutions Indonesia |
|
Indonesia |
|
Collection agent |
|
100% |
|
100% |
DLocal Bangladesh Limited |
|
Bangladesh |
|
Collection agent |
|
100% |
|
100% |
Dlocal Egypt LLC |
|
Egypt |
|
Collection agent |
|
100% |
|
100% |
DLocal Morocco SARL AU |
|
Morocco |
|
Collection agent |
|
100% |
|
100% |
Demerge Nigeria Limited |
|
Nigeria |
|
Collection agent |
|
100% |
|
100% |
Dlocal Panama S.A. |
|
Panama |
|
Collection agent |
|
100% |
|
100% |
Dlocal Paraguay S.A. |
|
Paraguay |
|
Collection agent |
|
100% |
|
100% |
Demerge República Dominicana SAS |
|
República Dominicana |
|
Collection agent |
|
99.99% |
|
99.99% |
Depansum PTY Limited |
|
South Africa |
|
Collection agent |
|
100% |
|
100% |
Dlocal El Salvador S.A de C.V. |
|
El Salvador |
|
Collection agent |
|
100% |
|
- |
Dlocal Payments Kenya Limited |
|
Kenya |
|
Collection agent |
|
100% |
|
- |
Dlocal Vietnam Company Limited |
|
Vietnam |
|
Collection agent |
|
100% |
|
- |
Demerge Japan Ltd |
|
Japan |
|
Collection agent |
|
66% |
|
- |
Depansum Malaysia SDN. BHD. |
|
Malaysia |
|
Collection agent |
|
100% |
|
- |
Demerge (Thailand) Co. LTD |
|
Thailand |
|
Collection agent |
|
49% |
|
- |
(1) Although Dlocal is the owner of 0.15% of Demerege Ecuador S.A., the Group controls its operations according to the guidelines in IFRS 10.
5. Segment reporting
The Group operates in a single operating segment, which is “payment processing”. Operating segments are defined as components of an enterprise for which separate financial information is regularly evaluated by the chief operating decision maker, who in the Group’s case is the Executive Team, in deciding how to allocate resources and assess performance. The Executive Team is composed of the Chief Executive Officer (“CEO”), the Chief Operating Officer (“COO”), the Chief Financial Officer (“CFO”) and the President of Dlocal Limited.
The Executive Team evaluates the Group’s financial information and resources and assesses the financial performance of these resources on a consolidated basis on the basis of Revenues, Adjusted EBITDA and Adjusted EBITDA margin as further described below.
The Group’s revenue, results and assets for this one reportable segment can be determined by reference to the Consolidated Condensed Statement of Comprehensive Income and Consolidated Condensed Statement of Financial Position.
As required by IFRS 8 Operating Segments, below are presented applicable entity-wide disclosures related to dLocal’s revenues.
Revenue breakdown by region
The Group’s revenues arise from operations in 35 countries, where the merchants´ customers are based.
Based on the region where payments from/to such customers are processed this is the revenue breakdown:
|
|
March 31, 2022 |
|
YoY% |
|
March 31, 2021 |
LatAm 1 |
|
77,608 |
|
116.0% |
|
35,923 |
Asia and Africa |
|
9,845 |
|
127.2% |
|
4,333 |
Revenues 2 |
|
87,453 |
|
117.2% |
|
40,256 |
Revenue with large customers
During the three-month period ended March 31, 2022 the Group operated with more than 475 merchants (more than 300 merchants in the period ended March 31, 2021).
For the three-month period ended March 31, 2022, the Group’s revenue from its top 10 merchants represented 54.0% of revenue (62% of revenue for the three-month period ended March 31, 2021). For the three-month period ended March 31, 2022 there are no customers (one for the three-month period ended March 31, 2021) that on an individual level accounted for more than 10% of the total revenue.
Adjusted EBITDA and Adjusted EBITDA Margin
The Executive Team assesses the financial performance of the Group’s sole segment by Revenues, Adjusted EBITDA and Adjusted EBITDA Margin. The Adjusted EBITDA is defined as the consolidated profit from operations before financing and taxation for the year or period, as applicable, before depreciation of property, plant and equipment, amortization of right-of-use assets and intangible assets, and further excluding the changes in fair value of financial assets and derivative financial instruments carried at fair value through profit or loss, impairment gain/loss on financial assets, transaction costs, share-based payment non-cash charges, secondary offering expenses and inflation adjustment. The Group defines Adjusted EBITDA Margin as the Adjusted EBITDA divided by consolidated revenues.
The Group reconciles the segment’s performance measure to profit for the period as presented in the Consolidated Condensed Statements of Comprehensive Income as follows:
|
|
Note |
March 31, 2022 |
|
March 31, 2021 |
Profit for the period |
|
|
26,273 |
|
16,927 |
Income tax expense |
|
11 |
1,213 |
|
1,379 |
Inflation adjustment |
|
|
306 |
|
34 |
Interest charges on leases |
|
|
163 |
|
3 |
Interest income from financial assets at FVPL |
|
|
(6) |
|
(26) |
Fair value losses / (gains) on financial assets at FVPL |
|
|
— |
|
8 |
Other operating (gain) / loss |
|
19 |
— |
|
(2,896) |
Other finance expense |
|
|
1,136 |
|
460 |
Impairment loss / (gain) on financial assets |
|
14 |
(75) |
|
54 |
Depreciation and amortization |
|
10 |
1,723 |
|
515 |
Secondary offering expenses (i) |
|
8 |
89 |
|
705 |
Transaction costs (ii) |
|
8 |
— |
|
113 |
Share-based payment non-cash charges, net of forfeitures |
|
9 |
2,034 |
|
565 |
Adjusted EBITDA |
|
|
32,856 |
|
17,841 |
|
|
|
|
|
|
Revenues |
|
6 |
87,453 |
|
40,256 |
Adjusted EBITDA |
|
|
32,856 |
|
17,841 |
Adjusted EBITDA Margin |
|
|
37.6% |
|
44.3% |
6. Revenues and Cost of Services
(a) Revenue and Gross profit description
dLocal derives revenue from processing payments for international merchants to enable them to operate in selected emerging markets.
The breakdown of revenue from contracts with customers per type of service is as follows:
|
|
March 31, 2022 |
|
March 31, 2021 |
Transaction revenues (i) |
|
84,736 |
|
38,519 |
Other revenues (ii) |
|
2,717 |
|
1,737 |
Revenues from payment processing (iii) |
|
87,453 |
|
40,256 |
Cost of services |
|
(43,899) |
|
(16,989) |
Gross profit |
|
43,554 |
|
23,267 |
(b) Revenue recognized at a point in time and over time
Transaction revenues are recognized at a point in time when the payment transaction is processed. Other revenues are recognized as revenue at a point in time when the respective performance obligation is satisfied. The Group did not recognize revenues over time for the three-month periods ended March 31, 2022 and 2021.
(c) Cost of services
Cost of services are composed of the following:
|
|
March 31, 2022 |
|
March 31, 2021 |
Processing costs (i) (1) |
|
41,793 |
|
15,966 |
Hosting expenses (ii) |
|
927 |
|
474 |
Salaries and wages (iii) |
|
281 |
|
122 |
Amortization of intangible assets (iv) |
|
898 |
|
427 |
Cost of services |
|
43,899 |
|
16,989 |
7. Technology and development expenses
Technology and development expenses are composed of the following:
|
|
March 31, 2022 |
|
March 31, 2021 |
Salaries and wages (i) |
|
824 |
|
191 |
Software licenses (ii) |
|
158 |
|
87 |
Infrastructure expenses (iii) |
|
308 |
|
141 |
Information and technology security expenses (iv) |
|
37 |
|
32 |
Other technology expenses |
|
79 |
|
69 |
Total Technology and development expenses |
|
1,406 |
|
520 |
8. Sales and marketing expenses and General and administrative expenses
Sales and marketing expenses and General and administrative expenses are composed of the following:
Sales and marketing expenses |
|
March 31, 2022 |
|
March 31, 2021 |
Salaries and wages (i) |
|
2,262 |
|
932 |
Marketing expenses (ii) |
|
582 |
|
110 |
Total Sales and marketing expenses |
|
2,844 |
|
1,042 |
|
|
|
|
|
General and administrative expenses |
|
March 31, 2022 |
|
March 31, 2021 |
Salaries and wages (iii) |
|
5,580 |
|
3,556 |
Third-party services (iv) |
|
2,180 |
|
1,391 |
Office expenses (v) |
|
666 |
|
288 |
Travel and other operating expenses |
|
1,043 |
|
439 |
Amortization and depreciation (vi) |
|
825 |
|
88 |
Total General and administrative expenses |
|
10,294 |
|
5,762 |
9. Employee Benefits
As of March 31, 2022, the Group’s FTEs were 562 (365 as of March 31, 2021) where 42% corresponded to information technology and product engineers and related roles (45% for the three-month period ended March 31, 2021).
Employee benefits is composed of the following:
|
|
March 31, 2022 |
|
March 31, 2021 |
Salaries, wages and contractor fees (i) |
|
9,346 |
|
5,384 |
Share-based payments (ii) |
|
2,034 |
|
565 |
Total employee benefits |
|
11,380 |
|
5,949 |
10. Amortization and Depreciation
Amortization and depreciation expenses are composed of the following:
|
|
March 31, 2022 |
|
March 31, 2021 |
Amortization of intangible assets |
|
1,422 |
|
427 |
Right-of-use asset amortization |
|
113 |
|
37 |
Depreciation of Property, plant & equipment |
|
188 |
|
51 |
Total Amortization and Depreciation |
|
1,723 |
|
515 |
For further information related to amortization of intangible assets refer to Note 16: Intangible Assets.
11. Income Tax
Income tax expense is recognized based on management’s estimate of the weighted average effective annual income tax rate expected for the full financial year. The estimated average income tax rate used for the three-month period ended March 31, 2022 is 4.4%, compared to 7.5% for the three-month period ended March 31, 2021.
The income tax charge recognized in profit and losses is the following:
Current Income Tax |
|
March 31, 2022 |
|
March 31, 2021 |
Current Income Tax on profits for the period |
|
(1,965) |
|
(1,137) |
Total Current Income Tax expense |
|
(1,965) |
|
(1,137) |
|
|
|
|
|
Deferred income tax |
|
March 31, 2022 |
|
March 31, 2021 |
Increase/(decrease) in deferred income tax assets |
|
445 |
|
(79) |
Decrease/(increase) in deferred income tax liabilities |
|
307 |
|
(163) |
Total Deferred income tax benefit/(expense) |
|
752 |
|
(242) |
Income Tax expense |
|
(1,213) |
|
(1,379) |
12. Capital management
(a) Share capital
Authorized shares, as well as issued and fully paid-up shares, are presented below:
|
|
March 31, 2022 |
|
|
March 31, 2021 * |
|
||||||||||||
|
|
Amount |
|
|
USD |
|
|
Amount |
|
|
|
USD |
|
|||||
Authorized Shares of USD 0.002 USD each |
|
|
|
|
|
|
|
|
|
|
|
|
|
|||||
Class A common shares |
|
|
1,000,000,000 |
|
|
|
2,000 |
|
|
|
— |
|
|
— |
|
|
— |
|
Class B common shares |
|
|
250,000,000 |
|
|
|
500 |
|
|
|
— |
|
|
|
|
— |
|
|
Undesignated shares |
|
|
250,000,000 |
|
|
|
500 |
|
|
|
— |
|
|
— |
|
|
— |
|
Authorized Shares of USD 1.1211 USD each ** |
|
|
|
|
|
|
|
|
|
|
|
|
|
|||||
Common shares |
|
|
— |
|
|
|
— |
|
|
|
618,363 |
|
|
|
|
693 |
|
|
|
|
|
1,500,000,000 |
|
|
|
3,000 |
|
|
|
618,363 |
|
|
|
|
693 |
|
|
Issued and Fully Paid Up Shares of USD 0.002 each * |
|
|
|
|
|
|
|
|
|
|
|
|
|
|||||
Class A Common Shares |
|
|
134,167,192 |
|
|
|
268 |
|
|
|
268,598,000 |
|
|
|
|
602 |
|
|
Class B Common Shares |
|
|
160,974,249 |
|
|
|
322 |
|
|
|
— |
|
|
|
|
— |
|
|
|
|
|
295,141,441 |
|
|
|
590 |
|
|
|
268,598,000 |
|
|
|
|
602 |
|
|
Share Capital evolution |
|
|
|
|
|
|
|
|
|
|
|
|
|
|||||
Share Capital as at January 1 |
|
|
295,028,441 |
|
|
|
590 |
|
|
|
268,598,000 |
|
|
|
|
602 |
|
|
i) Issue of common shares at USD 0.002 |
|
|
113,000 |
|
|
|
— |
|
*** |
|
— |
|
|
|
|
— |
|
|
Share capital as of March 31 |
|
|
295,141,441 |
|
|
|
590 |
|
|
|
268,598,000 |
|
|
|
|
602 |
|
|
* Retroactively adjusted to reflect the effect of the stock split (Note 1 to the Annual Consolidated Financial Statements for the year ended December 31, 2021).
** Amounts do not reflect the effect of the stock split explained in Note 1 to the Annual Consolidated Financial Statements for the year ended December 31, 2021.
*** Amount is rounded to the nearest thousand and should not be interpreted as zero.
The rights of the holders of Class A Common Shares and Class B Common Shares are identical, except with respect to voting, conversion and transfer restrictions applicable to the Class B Common Shares. Each Class A Common Share is entitled to one vote while Class B Common Shares are entitled to five votes each. Each Class B Common Share is convertible into one Class A Common Share automatically upon transfer, subject to certain exceptions. Holders of Class A Common Shares and Class B Common Shares vote together as a single class on all matters unless otherwise required by law.
(b) Capital reserve
The Capital reserve corresponds to reserves related to the share-based plans, as described in Note 2.11: Share-based payments and warrants. Accordingly, this reserve is related to share-based payment compensation plans of the Group.
The following table shows a breakdown of the consolidated condensed interim statement of financial position line item ‘Capital Reserves’ and the movements in these reserves during the periods.
|
|
2022 |
|
2021 |
Balances as of January 1 |
|
12,741 |
|
12,582 |
Share-options exercise (i) |
|
(241) |
|
(3,221) |
Share-based payments charges |
|
2,107 |
|
565 |
Forfeitures |
|
(73) |
|
— |
Balance as at March 31 |
|
14,534 |
|
9,926 |
(c) Other Reserves
The reserves for the Group relate to cumulative translation adjustment representing differences on conversion of assets and liabilities at the reporting date.
The following table shows a breakdown of the consolidated statement of financial position line item ‘Other Reserves’ and the movements in these reserves during the periods.
|
|
2022 |
|
2021 |
|
|
Cumulative Translation Adjustment |
|
Cumulative Translation Adjustment |
Balances as of January 1 |
|
(30) |
|
119 |
Movement of other reserves |
|
1,496 |
|
160 |
Balance as at March 31 |
|
1,466 |
|
279 |
(d) Retained Earnings
Movements in retained earnings were as follows:
|
|
2022 |
|
2021 |
Balance as at January 1 |
|
109,867 |
|
31,749 |
Comprehensive income for the period |
|
25,958 |
|
16,963 |
Balance as at March 31 |
|
135,825 |
|
48,712 |
(e) Earnings per share
dLocal calculates basic earnings per share by dividing the profit attributable to equity holders by the weighted average number of common shares issued and outstanding during the three-months periods ended March 31, 2022 and 2021.
For diluted earnings per share is calculated by dividing the profit attributable to equity holders of dLocal by the weighted average number of common shares outstanding during the period plus the weighted average number of common shares that would be issued on conversion of all dilutive potential common shares into common shares.
The next table presents the information used as base for such calculation:
|
|
March 31, 2022 |
|
March 31, 2021 * |
Profit attributable to common shareholders (U.S. Dollars) |
|
26,291,715 |
|
16,919,575 |
Weighted average number of common shares |
|
295,044,763 |
|
271,140,500 |
Adjustments for calculation of diluted earnings per share(1) |
|
18,144,357 |
|
22,954,000 |
Weighted average number of common shares for calculating diluted earnings per share |
|
313,189,120 |
|
294,094,500 |
Basic earnings per share |
|
0.09 |
|
0.06 |
Diluted earnings per share |
|
0.08 |
|
0.06 |
* Retroactively adjusted to reflect the effect of the stock split (Note 1 to the Annual Consolidated Financial Statements for the year ended December 31, 2021)
1 For the three-month period ended March 31, 2022, the adjustment corresponds to the dilutive effect of i) 14,924,873 average shares related to share-based payment warrants; and ii) 3,219,484 average shares related to share-based payment plans with employees (15,676,000 and 7,278,000 respectively for the three-month period ended March 31, 2021).
13. Cash and cash equivalents
Cash and cash equivalents breakdown is presented below:
|
|
March 31, 2022 |
|
December 31, 2021 |
Own Balances |
|
251,844 |
|
227,913 |
Merchant Clients Funds |
|
158,220 |
|
108,284 |
|
|
410,064 |
|
336,197 |
As of March 31, 2022, USD 410,064 (USD 336,197 on December 31, 2021) represents cash on hand, demand deposits with financial institutions and other short-term liquid financial instruments.
Own Balances correspond to cash and cash equivalents of the Group while Merchant Clients Funds correspond to freely available funds collected from the merchants’ customers, that can be invested in secure, liquid low-risk assets until they are transferred to the merchants in accordance with the agreed conditions with them or transferred to Own Funds accounts for the portion that corresponds to the Group fees.
14. Trade and other receivables
Trade and Other Receivables of the Group are composed of the following:
|
|
March 31, 2022 |
|
December 31, 2021 |
Trade receivables |
|
197,095 |
|
179,199 |
Loss allowance |
|
(247) |
|
(322) |
Trade receivables net |
|
196,848 |
|
178,877 |
Advances and other receivables |
|
20,343 |
|
12,089 |
|
|
217,191 |
|
190,966 |
Trade Receivables correspond to uncollateralized gross amounts due from acquirers, processors, merchants and preferred suppliers for services performed that will be collected in less than one year, so they are classified as current. No financial assets are past-due and all Trade and other receivables are categorized as within “normal” credit risk rating.
Loss allowance and impairment losses
The following table presents the evolution of the loss allowance:
|
|
2022 |
|
2021 |
Opening book value as at January 1 |
|
(322) |
|
(341) |
Decrease/(increase) in loss allowance for trade receivables |
|
75 |
|
(54) |
Total as at March 31 |
|
(247) |
|
(395) |
Net impairment gain/(loss) on financial assets |
|
75 |
|
(54) |
Initial recognition and subsequent measurement the Group applies the simplified approach to determine expected credit losses on trade receivables.
To measure the expected credit losses, trade and other receivables have been grouped based on shared credit risk characteristics and the days past due (only 0-30 past due bucket as of March 31, 2022 and December 31, 2021 because there are no other material buckets of the outstanding receivables).
The expected loss rates are based on the payment profiles of debtors over a period of 36 months before year end and the corresponding historical credit losses experienced within this period. The historical loss rate is adjusted to reflect current and forward-looking information on credit risk ratings of the countries in which the Group sells its services which affects the ability of the debtors to settle the receivables. On that basis, the average expected credit loss rate of the 0-30 past due bucket was determined at 0.3% for the three-month period ended March 31, 2022 (0.5% in the three-month period ended March 31, 2021).
15. Other Assets
Other assets are composed of the following:
Current |
|
March 31, 2022 |
|
December 31, 2021 |
Money held in escrow for: (i) |
|
221 |
|
211 |
-Requirements for other processors |
|
90 |
|
80 |
-Credit card requirements |
|
131 |
|
131 |
Rental guarantees |
|
560 |
|
561 |
Prepaid assets (ii) |
|
407 |
|
567 |
Total current Other Assets |
|
1,188 |
|
1,339 |
16. Intangible Assets
Intangible assets of the Group correspond to acquired software as well as to capitalized expenses related to internally generated software and are stated at cost less accumulated amortization.
|
|
2022 |
|
2021 |
||||
At January 1, 2020 |
|
Internally generated software |
|
Acquired intangible assets (ii) |
|
Total |
|
Internally generated software |
Cost |
|
12,387 |
|
39,335 |
|
51,722 |
|
4,989 |
Accumulated amortization |
|
(3,179) |
|
(1,574) |
|
(4,753) |
|
(836) |
Opening book value as at January 1 |
|
9,208 |
|
37,761 |
|
46,969 |
|
4,153 |
Additions (i) |
|
2,509 |
|
— |
|
2,509 |
|
1,215 |
Amortization of the period |
|
(898) |
|
(524) |
|
(1,422) |
|
(427) |
Total as at March 31 |
|
10,819 |
|
37,237 |
|
48,056 |
|
4,941 |
Cost |
|
14,896 |
|
39,335 |
|
54,231 |
|
6,204 |
Accumulated amortization |
|
(4,077) |
|
(2,098) |
|
(6,175) |
|
(1,263) |
(i) The additions of the three-month period ended March 31, 2022 include USD 2,433 related to capitalized salaries and wages (USD 1,148 as of March 31, 2021).
|
|
As of March 31, 2022 |
|
As of December 31, 2021 |
Cost |
|
54,231 |
|
51,722 |
Accumulated amortization |
|
(6,175) |
|
(4,753) |
Net book amount |
|
48,056 |
|
46,969 |
As of March 31, 2022 , and December 31, 2021 no indicator of impairment related to intangible assets existed, so the Group did not perform an impairment test.
17. Trade and other payables
Trade and Other Payables are composed of the following:
|
|
March 31, 2022 |
|
December 31, 2021 |
Trade Payables |
|
334,621 |
|
269,227 |
Accrued Liabilities |
|
3,958 |
|
3,173 |
Other Payables |
|
8,197 |
|
4,760 |
Total Trade and other payables |
|
346,776 |
|
277,160 |
These payables are classified as current liabilities as the payment is due within one year or less. Moreover, the carrying amounts are considered to be the same as fair values, due to their short – term nature.
Trade Payables correspond to liabilities with Merchants, either related to payin transactions processed or payout transactions to be processed at their request. Accrued Liabilities mainly correspond to obligations with legal and tax advisors, and auditors. Other Payables mainly correspond to obligations related to processors´ costs and the acquisitions of office goods and services necessary for the ordinary course of the business.
18. Tax Liabilities
The tax liabilities breakdown is as follows:
|
|
March 31, 2022 |
|
December 31, 2021 |
Income tax payable |
|
2,582 |
|
1,940 |
Other tax liabilities |
|
10,986 |
|
11,186 |
Income tax perception (RG 4815) (1) |
|
7,920 |
|
7,490 |
Digital services withholding VAT |
|
2,051 |
|
2,796 |
Other Taxes |
|
1,015 |
|
900 |
Total Tax Liabilities |
|
13,568 |
|
13,126 |
19. Derivative financial instruments
Other derivative financial instruments
During the three-month period ended March 31, 2022 and the year-ended December 31, 2021, dLocal entered into short-term derivative contracts (delivery and non-delivery forwards) with different counterparties in different countries in which the Group operates, according to the following detail:
Transaction |
|
Type of Forward Transaction |
|
Local currency |
|
Outstanding notional amount in USD as of March 31, 2022 |
|
Outstanding balance as of March 31, 2022 - Derivative financial liabilities |
|
Outstanding notional amount in USD as of December 31, 2021 |
|
Outstanding balance as of December 31, 2021 - Derivative financial liabilities |
Non-delivery forwards (1) |
|
Buy USD |
|
Brazilian Reais |
|
15,185,610 |
|
(573) |
|
5,500,000 |
|
(152) |
Non-delivery forwards (1) |
|
Sell USD |
|
Brazilian Reais |
|
5,400,000 |
|
(15) |
|
— |
|
— |
Non-delivery forwards (1) |
|
Buy USD |
|
Argentine Peso |
|
5,000,000 |
|
— |
|
2,500,000 |
|
— |
Delivery forwards (1)(2) |
|
Buy USD |
|
Chilean Peso |
|
12,920,450 |
|
— |
|
12,391,928 |
|
(8) |
Delivery forwards (1) |
|
Buy USD |
|
Uruguayan Peso |
|
1,963,678 |
|
(90) |
|
— |
|
— |
Non-delivery forwards |
|
Buy USD |
|
Egyptian Pound |
|
2,258,749 |
|
(36) |
|
— |
|
— |
Non-delivery forwards |
|
Buy EUR |
|
Moroccan Dirham |
|
3,700,159 |
|
(19) |
|
— |
|
— |
Non-delivery forwards |
|
Buy USD |
|
Nigerian naira |
|
16,021,270 |
|
(108) |
|
— |
|
— |
Non-delivery forwards |
|
Buy USD |
|
Indian Rupee |
|
4,000,000 |
|
(36) |
|
1,000,000 |
|
(14) |
Non-delivery forwards (1) |
|
Buy USD |
|
South African Rand |
|
8,921,781 |
|
(244) |
|
4,000,000 |
|
(47) |
Total |
|
|
|
|
|
|
|
(1,121) |
|
|
|
(221) |
(1) During the three-month period ended March 31, 2022, dLocal entered into hedge operations of trade and other receivables in Brazilian Reais, Argentine Peso, Chilean Peso, Uruguayan Peso and South African Rand subject to foreign exchange exposure using delivery and non-delivery forward contracts. The transactions have been elected for hedge accounting and classified as fair value hedge in accordance with IFRS 9. The Group has elected to designate only the spot element of these forward contracts as the hedging instrument. During the three months ended March 31, 2022, dLocal recognized a net loss of USD 2,567 included in the line item "Costs of services" and a net loss of USD 1,166 included in the line item "Finance costs".
(2) During the last quarter of the year-ended December 31, 2021, dLocal entered into hedge operations of trade and other receivables in Chilean Peso subject to foreign exchange exposure using the delivery forward contracts. The transactions have been elected for hedge accounting and classified as fair value hedge in accordance with IFRS 9.
Option to purchase common shares
As of the beginning of the three-month period ended March 31, 2021, DLocal Limited had an option agreement in place with one shareholder (“Investor”), pursuant to which the Investor had outstanding options to purchase up to 18,068,000 common shares from certain existing shareholders, or by direct issuance of Company shares, which could be exercised by the Investor on or before December 16, 2021.
On March 3, 2021, the investor exercised the right to purchase 18,068,000 Class A Ordinary shares in DLocal Group Limited, by acquiring them from other existing shareholders, without being required the issuance of new shares by dLocal. In this sense, as of March 3, 2021 the obligations of dLocal under this agreement have ceased.
Considering that as of December 31, 2020 the derivative financial instrument represented a liability for dLocal of USD 2,896, a gain for the same amount was recognized within Operating profit in the line item “Other operating gain/(loss)” in the Consolidated Condensed Interim Statements of Comprehensive Income for the three-month period ended March 31, 2021.
20. Provisions
(a) Current or potential proceedings
Provisions for the period are related to current or potential proceedings where the management understands, based on the Group’s legal advisors’ assessment, that it is more likely than not that an outflow of resources will be required to settle the obligation and a reliable estimate can be made of the amount of the obligation.
(b) Movements in current or potential proceedings
Movements in current or potential proceedings are set out below:
|
|
2022 |
|
2021 |
Carrying amount as at January 1 |
|
1,710 |
|
1,393 |
Increase/(reversal) to labor provision |
|
49 |
|
(33) |
Carrying amount as at March 31 |
|
1,759 |
|
1,360 |
21. Related parties
(a) Related Party Transactions
Related party transactions are linked to the options agreement that is reflected presented in Note 19 of these financial statement.
(b) Key Management compensation
The compensation of the Executive Team during the period can be analysed as follows:
|
|
March 31, 2022 |
|
March 31, 2021 |
Short-term employee benefits – Salaries and wages |
|
436 |
|
522 |
Long-term employee benefits – Share-based payment |
|
2,034 |
|
565 |
|
|
2,470 |
|
1,087 |
(c) Transactions with other related parties
The following transactions occurred with related parties:
|
|
March 31, 2022 |
|
March 31, 2021 |
Transactions with merchants – Revenues |
|
311 |
|
382 |
Transactions with preferred suppliers (Collection agents) – Costs |
|
(251) |
|
(116) |
(d) Outstanding balances arising from transactions with other related parties
The following balances are outstanding at the end of the reporting period in relation to transactions with related parties:
|
|
March 31, 2022 |
|
December 31, 2021 |
Transactions with merchants – accounts payable |
|
(1,393) |
|
(622) |
Transactions with preferred suppliers (Collection agents) – accounts payable |
|
(149) |
|
(125) |
Transactions with preferred suppliers (Collection agents) – accounts receivable |
|
8,493 |
|
6,058 |
All transactions with related parties were made on normal commercial terms and conditions and at market rates. Outstanding balances are unsecured and are repayable in cash.
22. Fair value hierarchy
The following tables show financial instruments recognized at fair value for the period ended March 31, 2022 and December 31, 2021, analyzed between those whose fair value is based on:
• Level 1: quoted (unadjusted) prices in active markets for identical assets or liabilities.
• Level 2: other techniques for which all inputs which have a significant effect on the recorded fair value are observable, either directly or indirectly.
• Level 3: techniques which use inputs which have a significant effect on the recorded fair value that are not based upon observable market data.
The table also includes financial instruments measured at amortized cost. The Group understands that the book value of such instruments approximates their fair value.
March 31, 2022 |
|
FVPL |
|
Amortized |
|
Total |
|
Level 1 |
|
Level 2 |
|
Level 3 |
Assets |
|
|
|
|
|
|
|
|
|
|
|
|
Financial Assets at Fair Value through Profit or Loss |
|
1,286 |
|
— |
|
1,286 |
|
1,286 |
|
— |
|
— |
Other Assets |
|
— |
|
1,188 |
|
1,188 |
|
— |
|
— |
|
— |
Trade and Other Receivables |
|
— |
|
217,191 |
|
217,191 |
|
— |
|
— |
|
— |
Cash and Cash Equivalents |
|
— |
|
410,064 |
|
410,064 |
|
— |
|
— |
|
— |
|
|
1,286 |
|
628,443 |
|
629,729 |
|
1,286 |
|
— |
|
— |
December 31, 2021 |
|
FVPL |
|
Amortized |
|
Total |
|
Level 1 |
|
Level 2 |
|
Level 3 |
Assets |
|
|
|
|
|
|
|
|
|
|
|
|
Financial Assets at Fair Value through Profit or Loss |
|
1,004 |
|
— |
|
1,004 |
|
1,004 |
|
— |
|
— |
Other Assets |
|
— |
|
1,339 |
|
1,339 |
|
— |
|
— |
|
— |
Trade and Other Receivables |
|
— |
|
190,966 |
|
190,966 |
|
— |
|
— |
|
— |
Cash and Cash Equivalents |
|
— |
|
336,197 |
|
336,197 |
|
— |
|
— |
|
— |
|
|
1,004 |
|
528,502 |
|
529,506 |
|
1,004 |
|
— |
|
— |
March 31, 2022 |
|
FVPL |
|
Amortized |
|
Total |
|
Level 1 |
|
Level 2 |
|
Level 3 |
Liabilities |
|
|
|
|
|
|
|
|
|
|
|
|
Trade and Other Payables |
|
— |
|
(346,776) |
|
(346,776) |
|
— |
|
— |
|
— |
Financial liabilities |
|
— |
|
(6,077) |
|
(6,077) |
|
— |
|
— |
|
— |
Derivative financial instruments |
|
(1,121) |
|
— |
|
(1,121) |
|
— |
|
(1,121) |
|
— |
Contingent consideration liability |
|
(665) |
|
— |
|
(665) |
|
— |
|
— |
|
(665) |
|
|
(1,786) |
|
(352,853) |
|
(354,639) |
|
— |
|
(1,121) |
|
(665) |
December 31, 2021 |
|
FVPL |
|
Amortized |
|
Total |
|
Level 1 |
|
Level 2 |
|
Level 3 |
Liabilities |
|
|
|
|
|
|
|
|
|
|
|
|
Trade and Other Payables |
|
— |
|
(277,160) |
|
(277,160) |
|
— |
|
— |
|
— |
Financial liabilities |
|
— |
|
(5,014) |
|
(5,014) |
|
— |
|
— |
|
— |
Derivative financial instruments |
|
(221) |
|
— |
|
(221) |
|
— |
|
(221) |
|
— |
Contingent consideration liability |
|
(665) |
|
— |
|
(665) |
|
— |
|
— |
|
(665) |
|
|
(886) |
|
(282,174) |
|
(283,060) |
|
— |
|
(221) |
|
(665) |
Level 3 Financial Instruments
As of March 31, 2022 and December 31, 2021., the Group has recognized a contingent consideration liability amounting to USD 665, classified in Level 3. The amount of the Level 3 contingent consideration was calculated by the finance team of the Group, using a discounted cash flow analysis, considering the expected cash flows based on terms of the contract, the entity’s knowledge of the business and how the current conditions are likely to impact it. As described in note 1.3.e to the Annual Consolidated Financial Statements, such contingent liability is capped in USD 665 thousands, and is expected to be paid conditioned to finalizing the migration process estimated during 2022.
There were no changes in level 3 items for the periods ended March 31, 2022 and December 31, 2021. Also, there were no transfer of items between level 2 and level 3, acquisitions, disposals nor gains or losses recognized in profit for the period related to level 3 instruments.
23. Subsequent events
During April 2022, dLocal repaid the borrowings that were received during 2021 from a financial institution in Brazilian Reais (BRZ) amounting to USD 5,000 (BRZ 27 million).
On April 19, 2022, dLocal has received borrowings from a financial institution in Brazilian Reais (BRZ) amounting to USD 15.8 million (BRZ 75 million) for working capital, with expiration date on January 16, 2023 and accruing interest at an annual fixed interest rate of 1.70%.

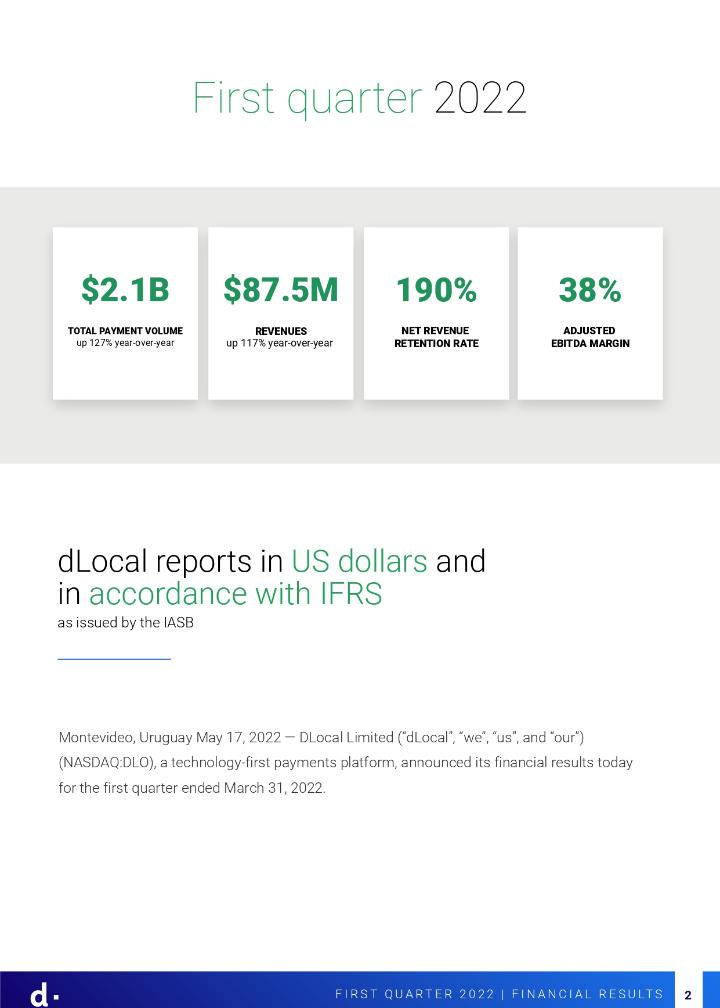


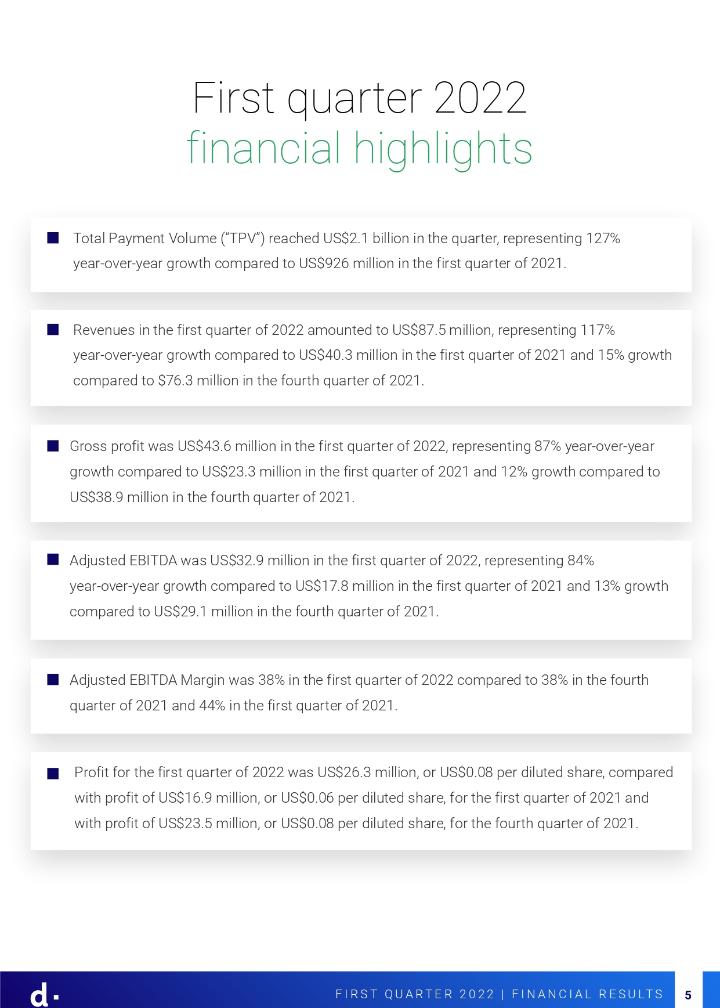
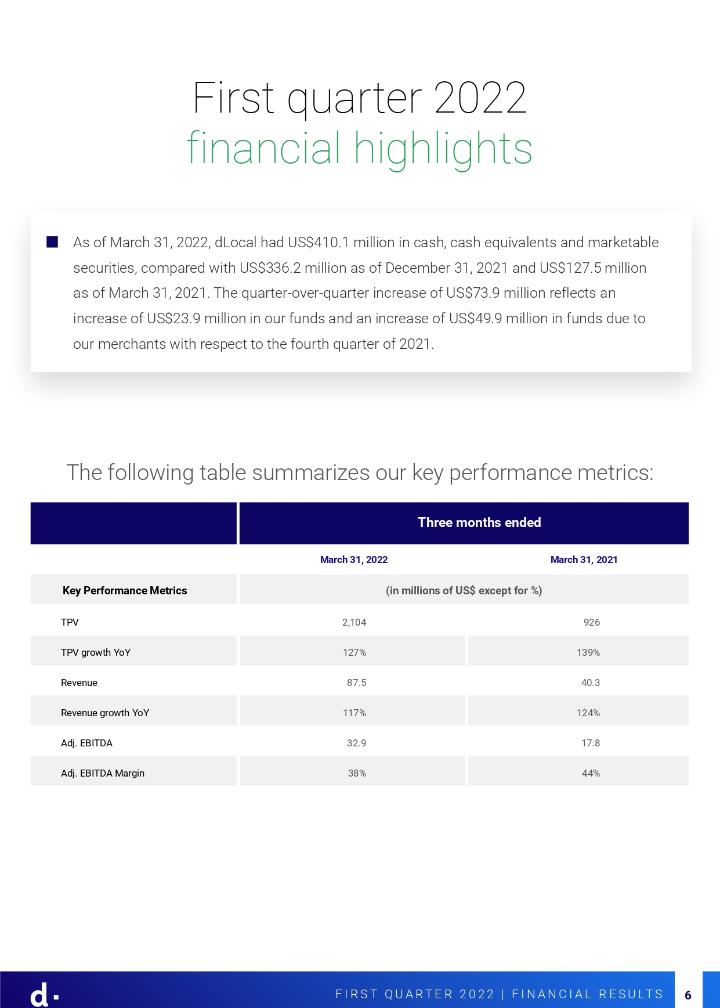
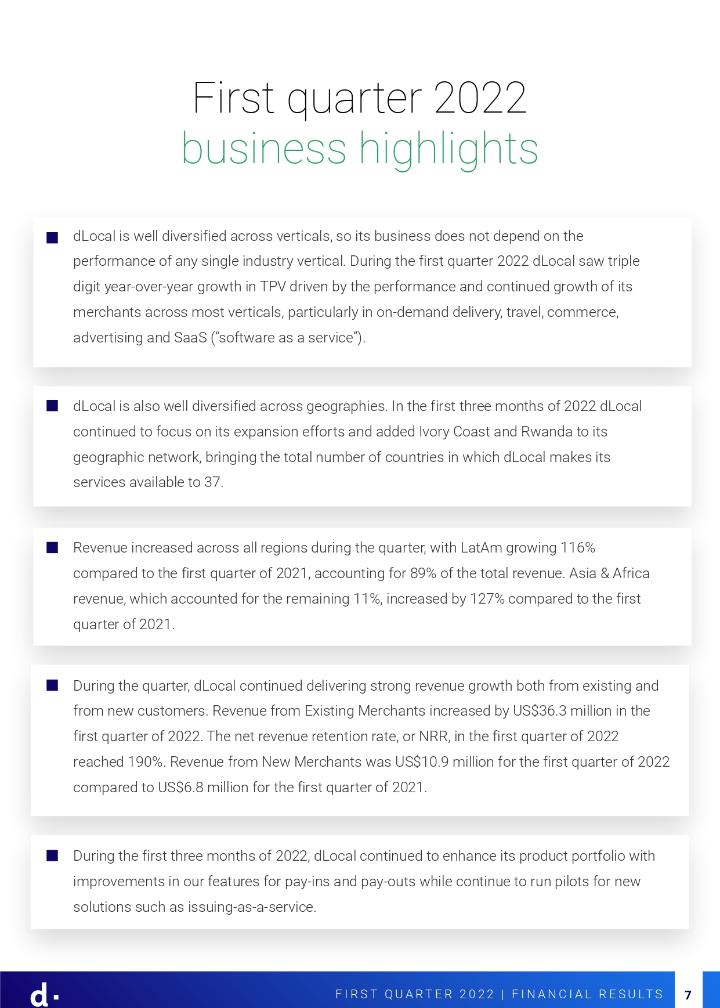
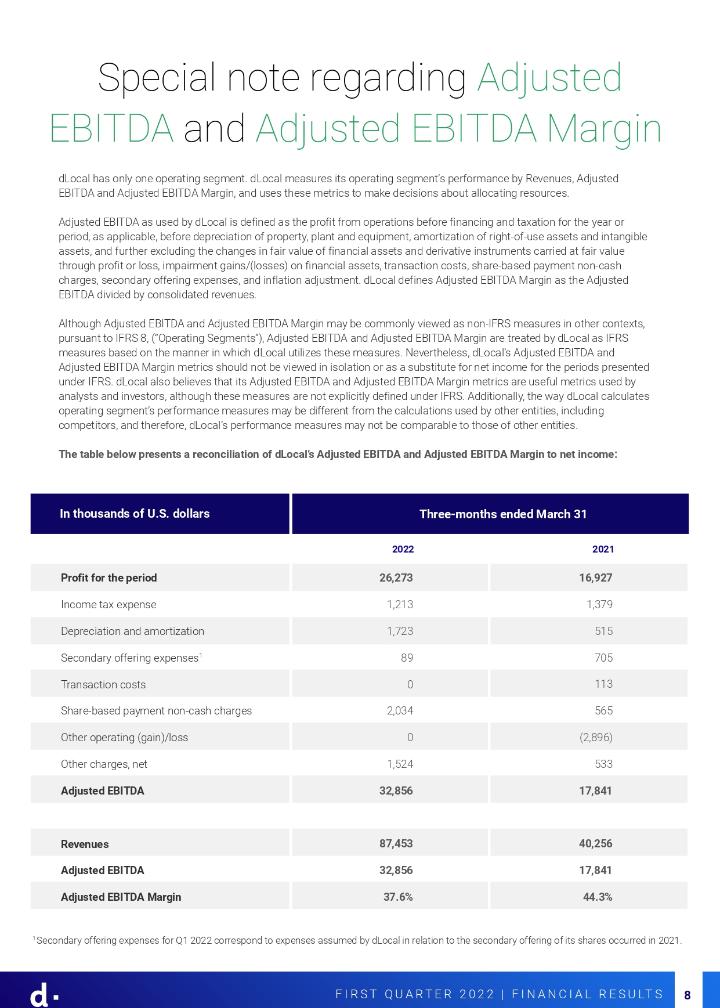
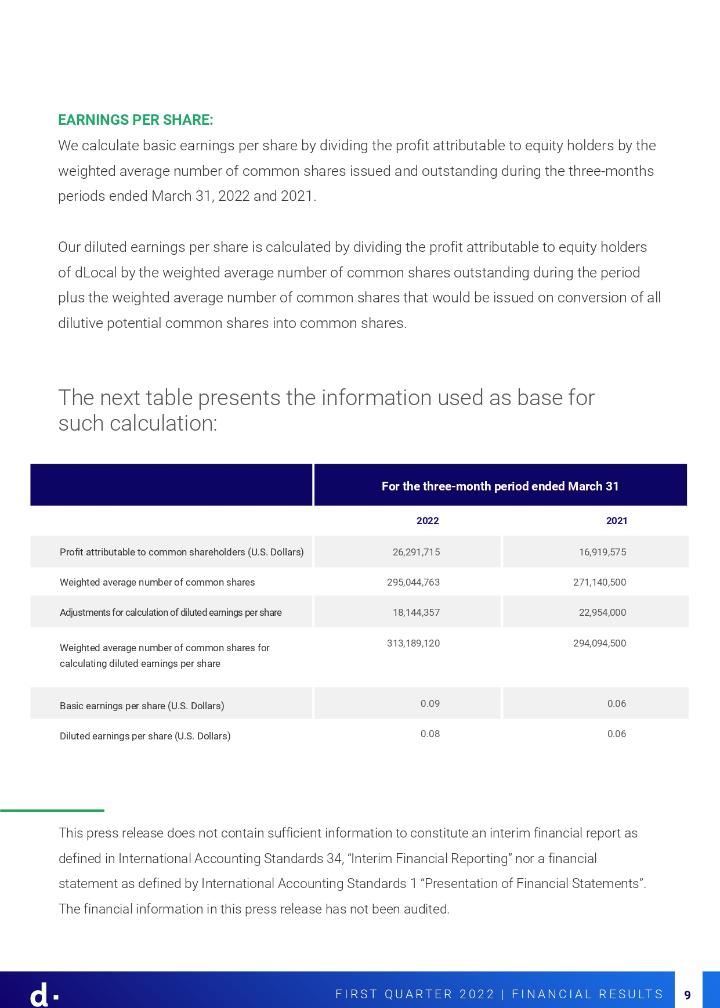
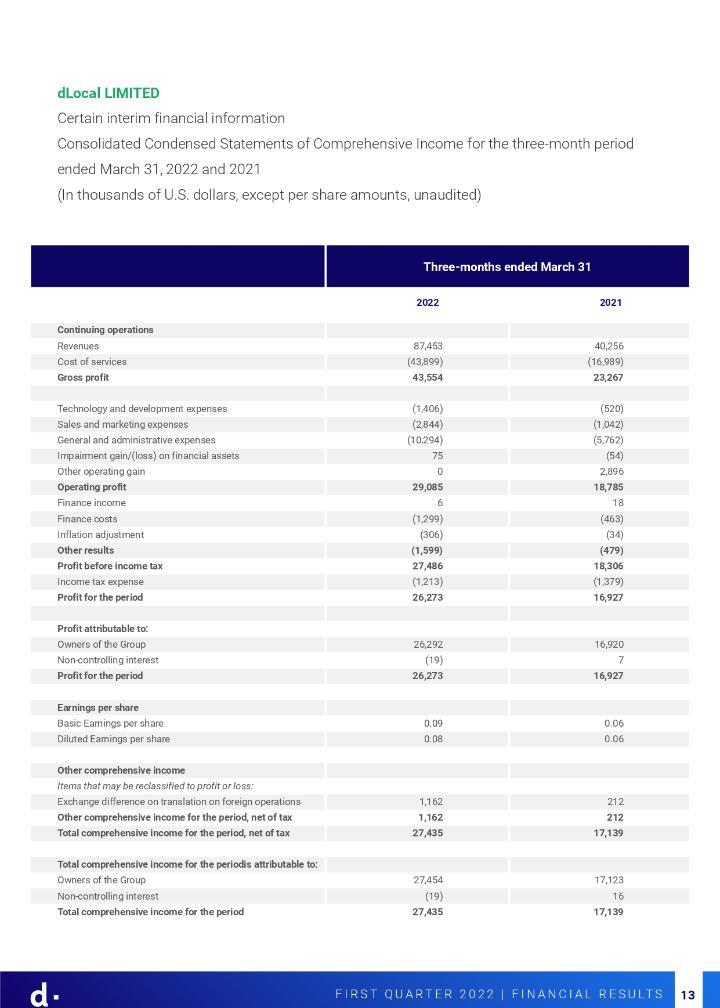
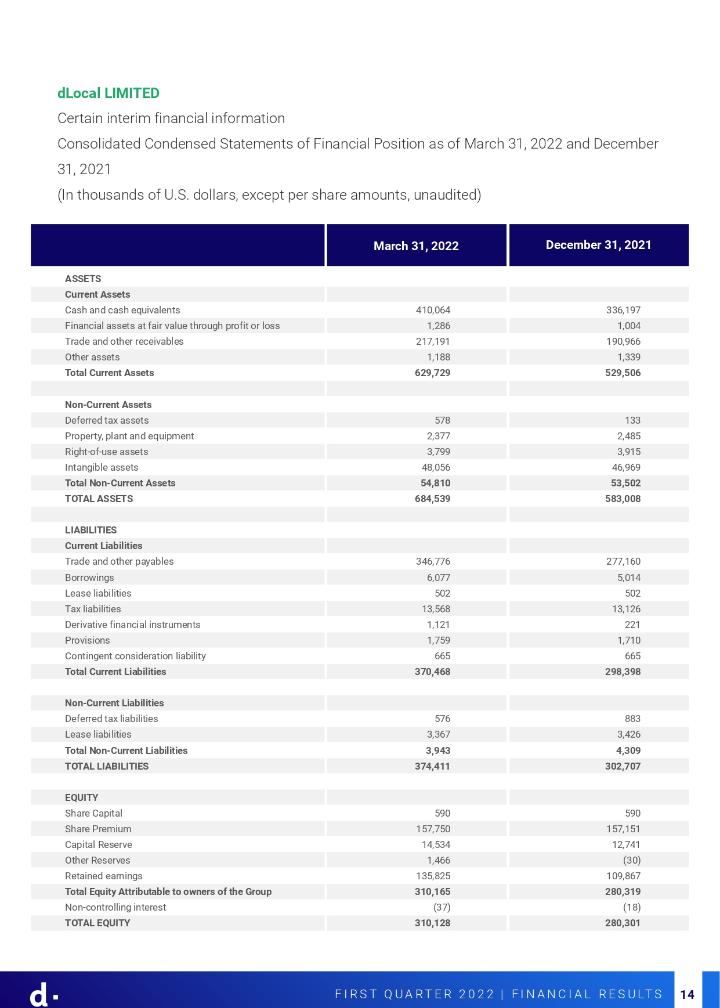


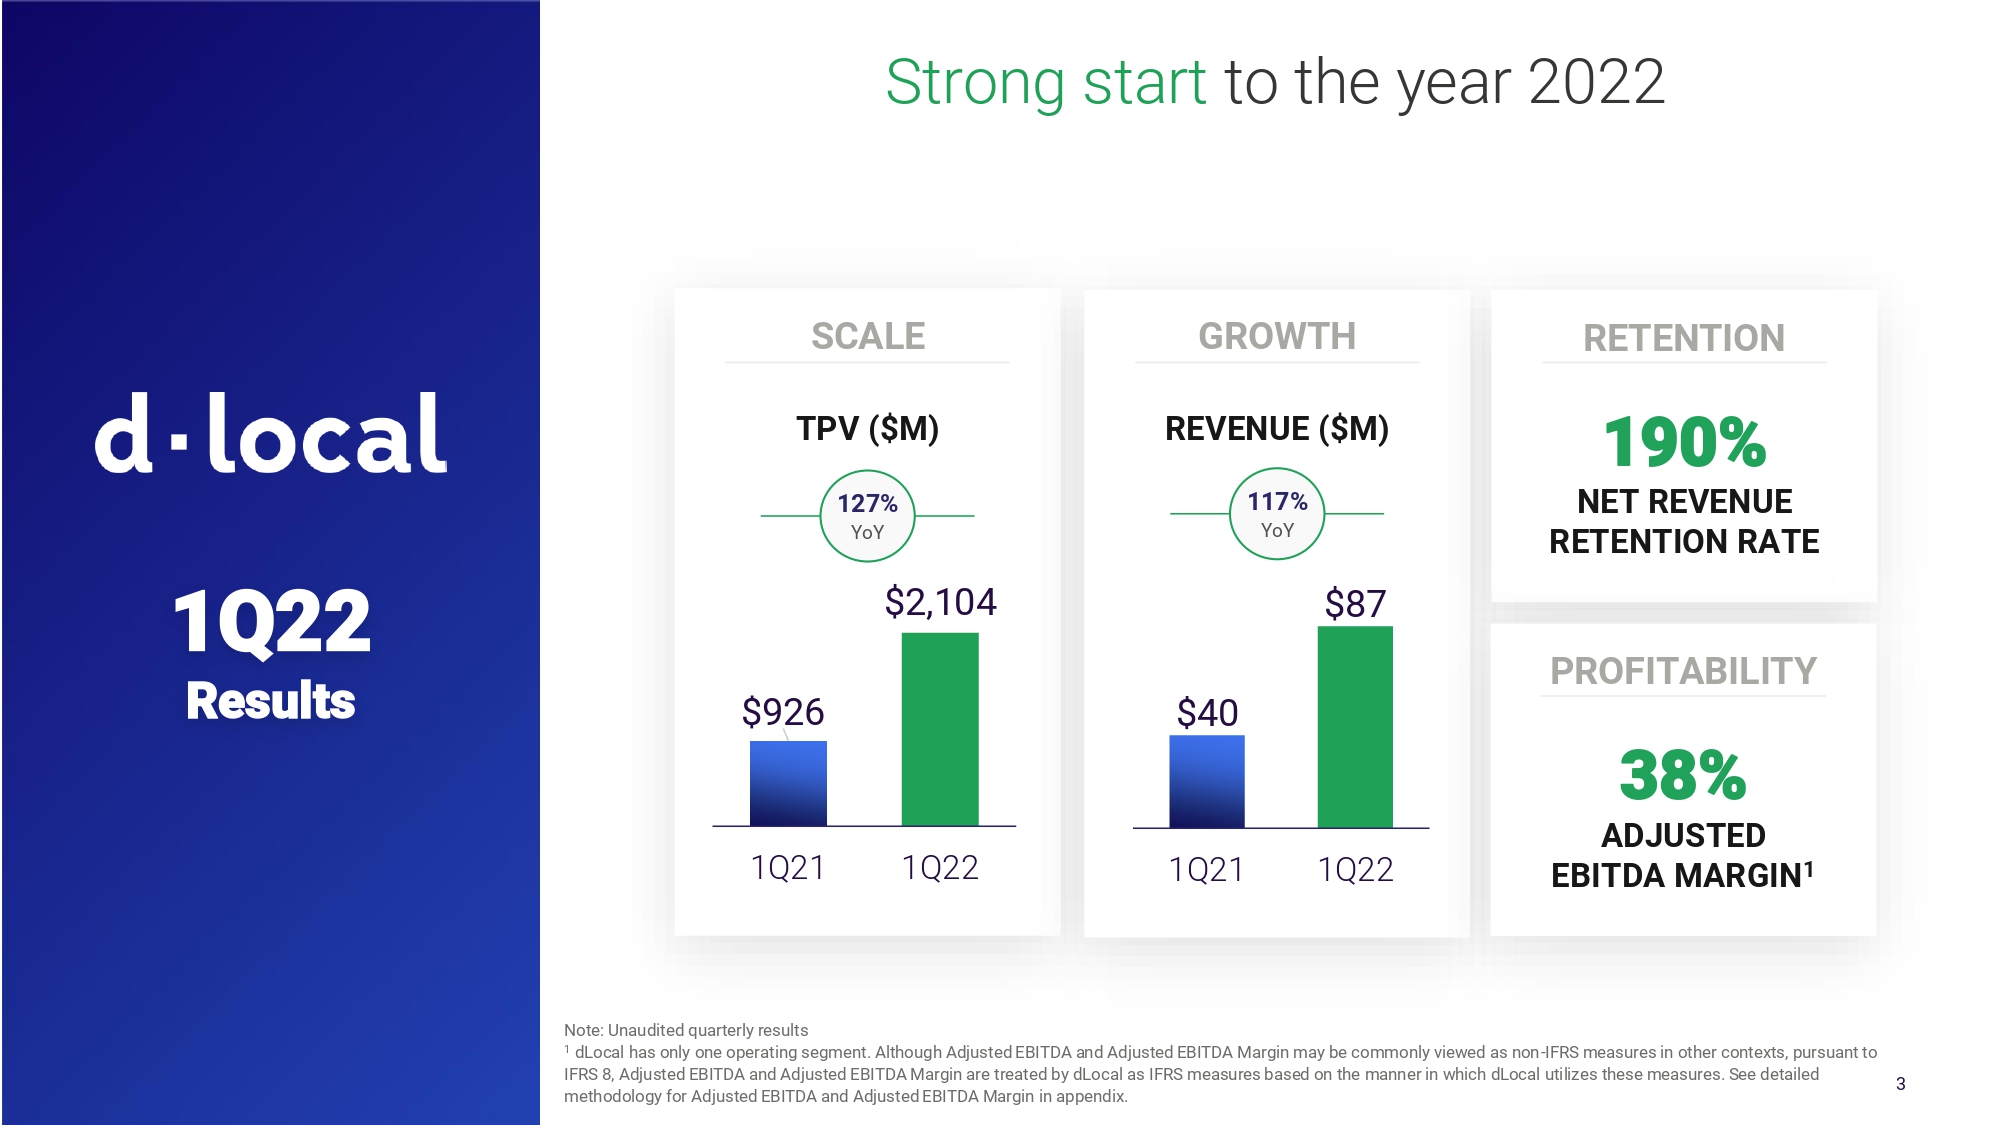
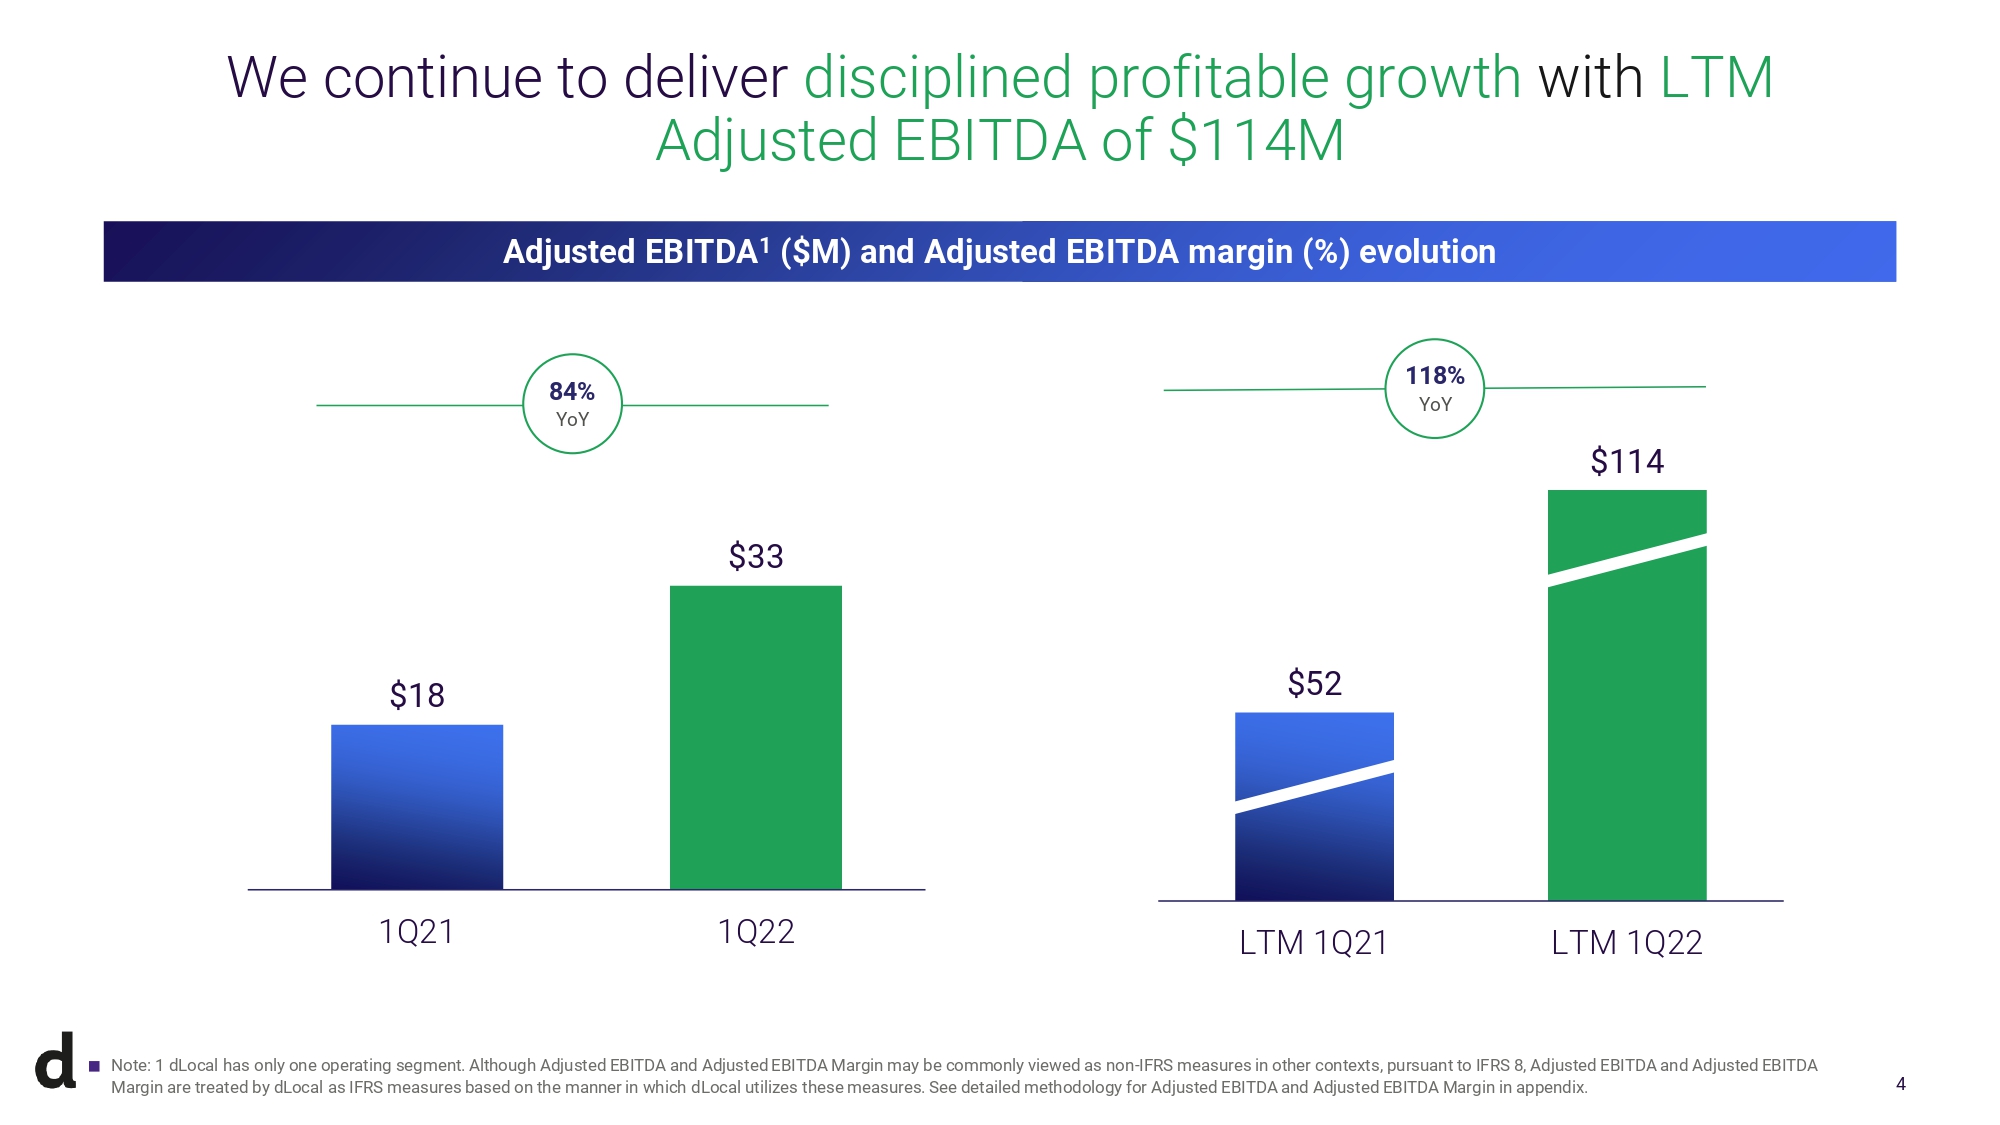
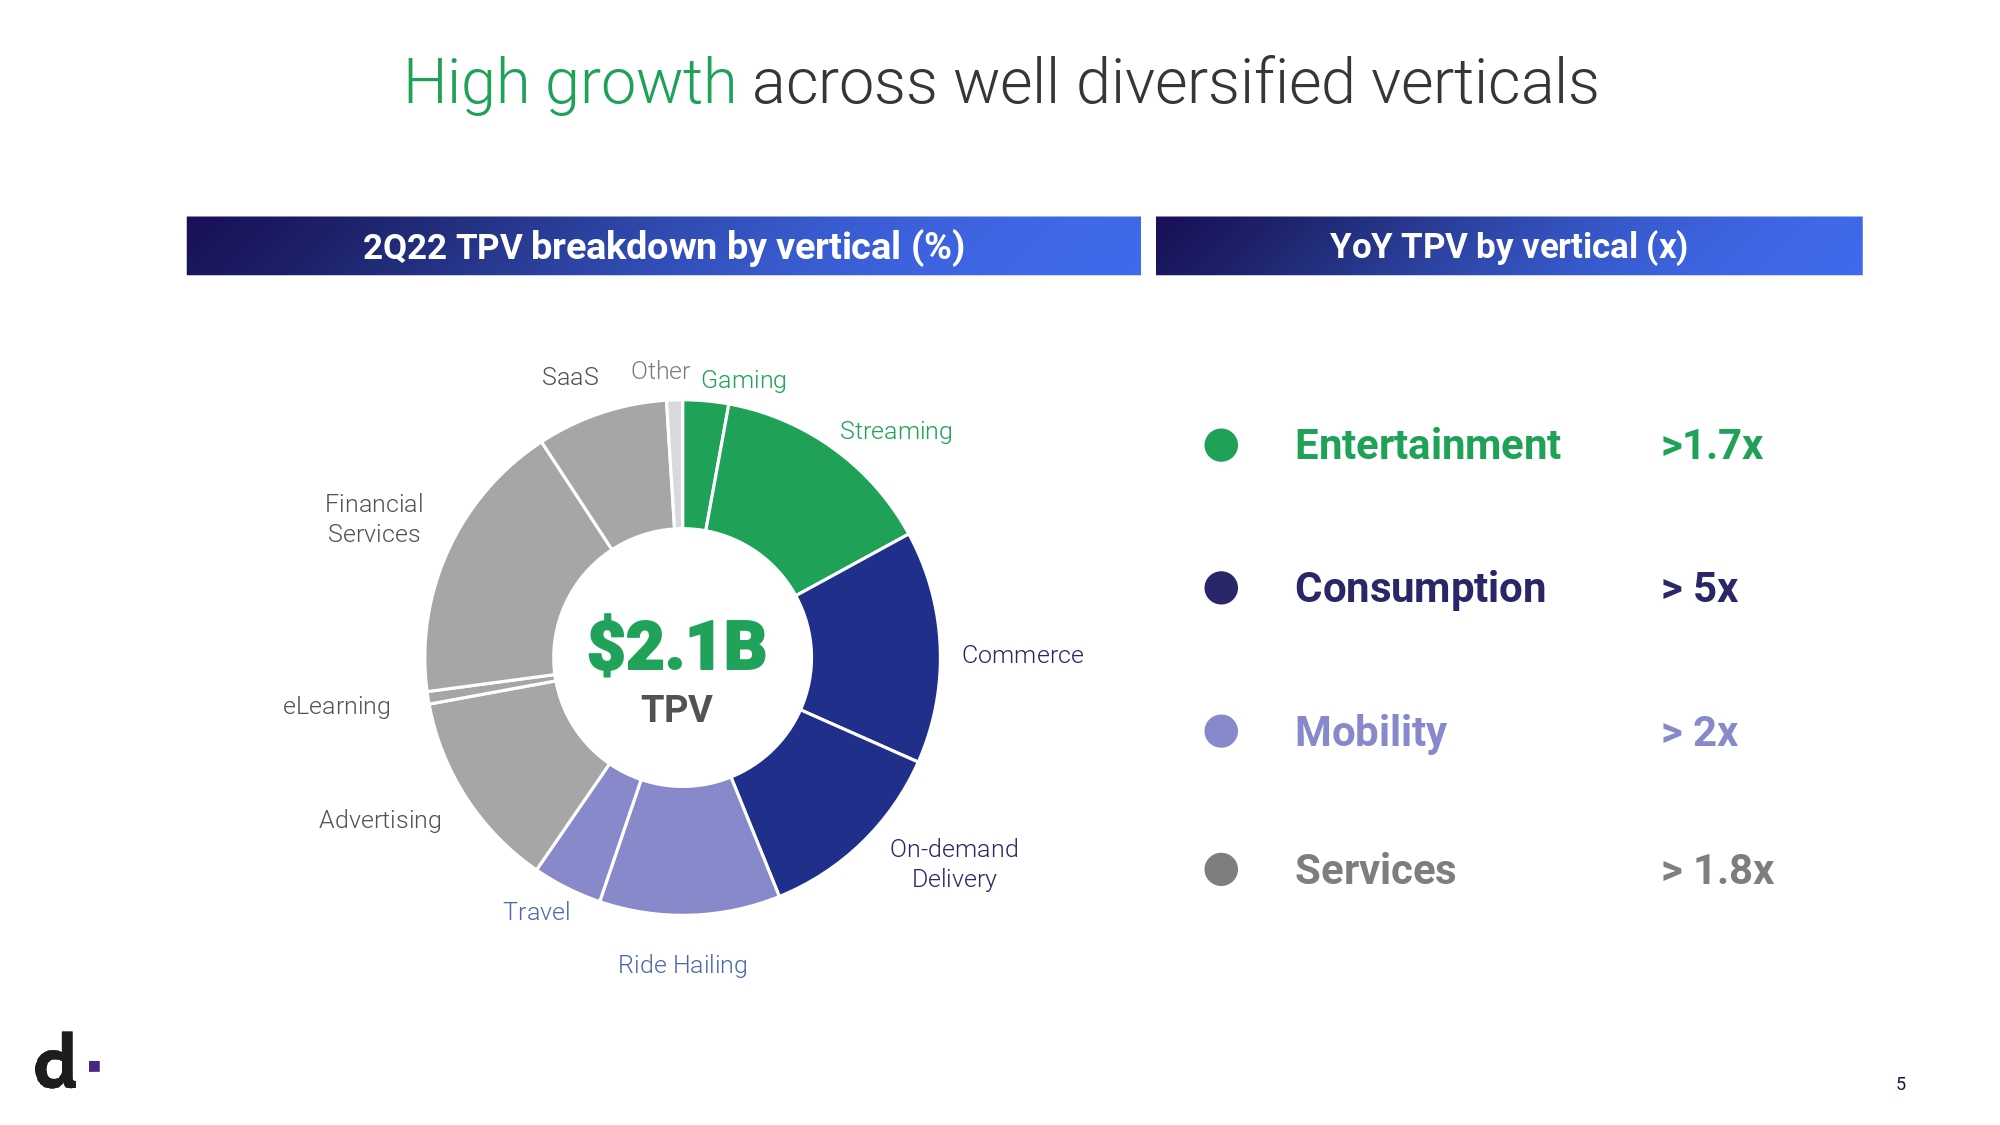
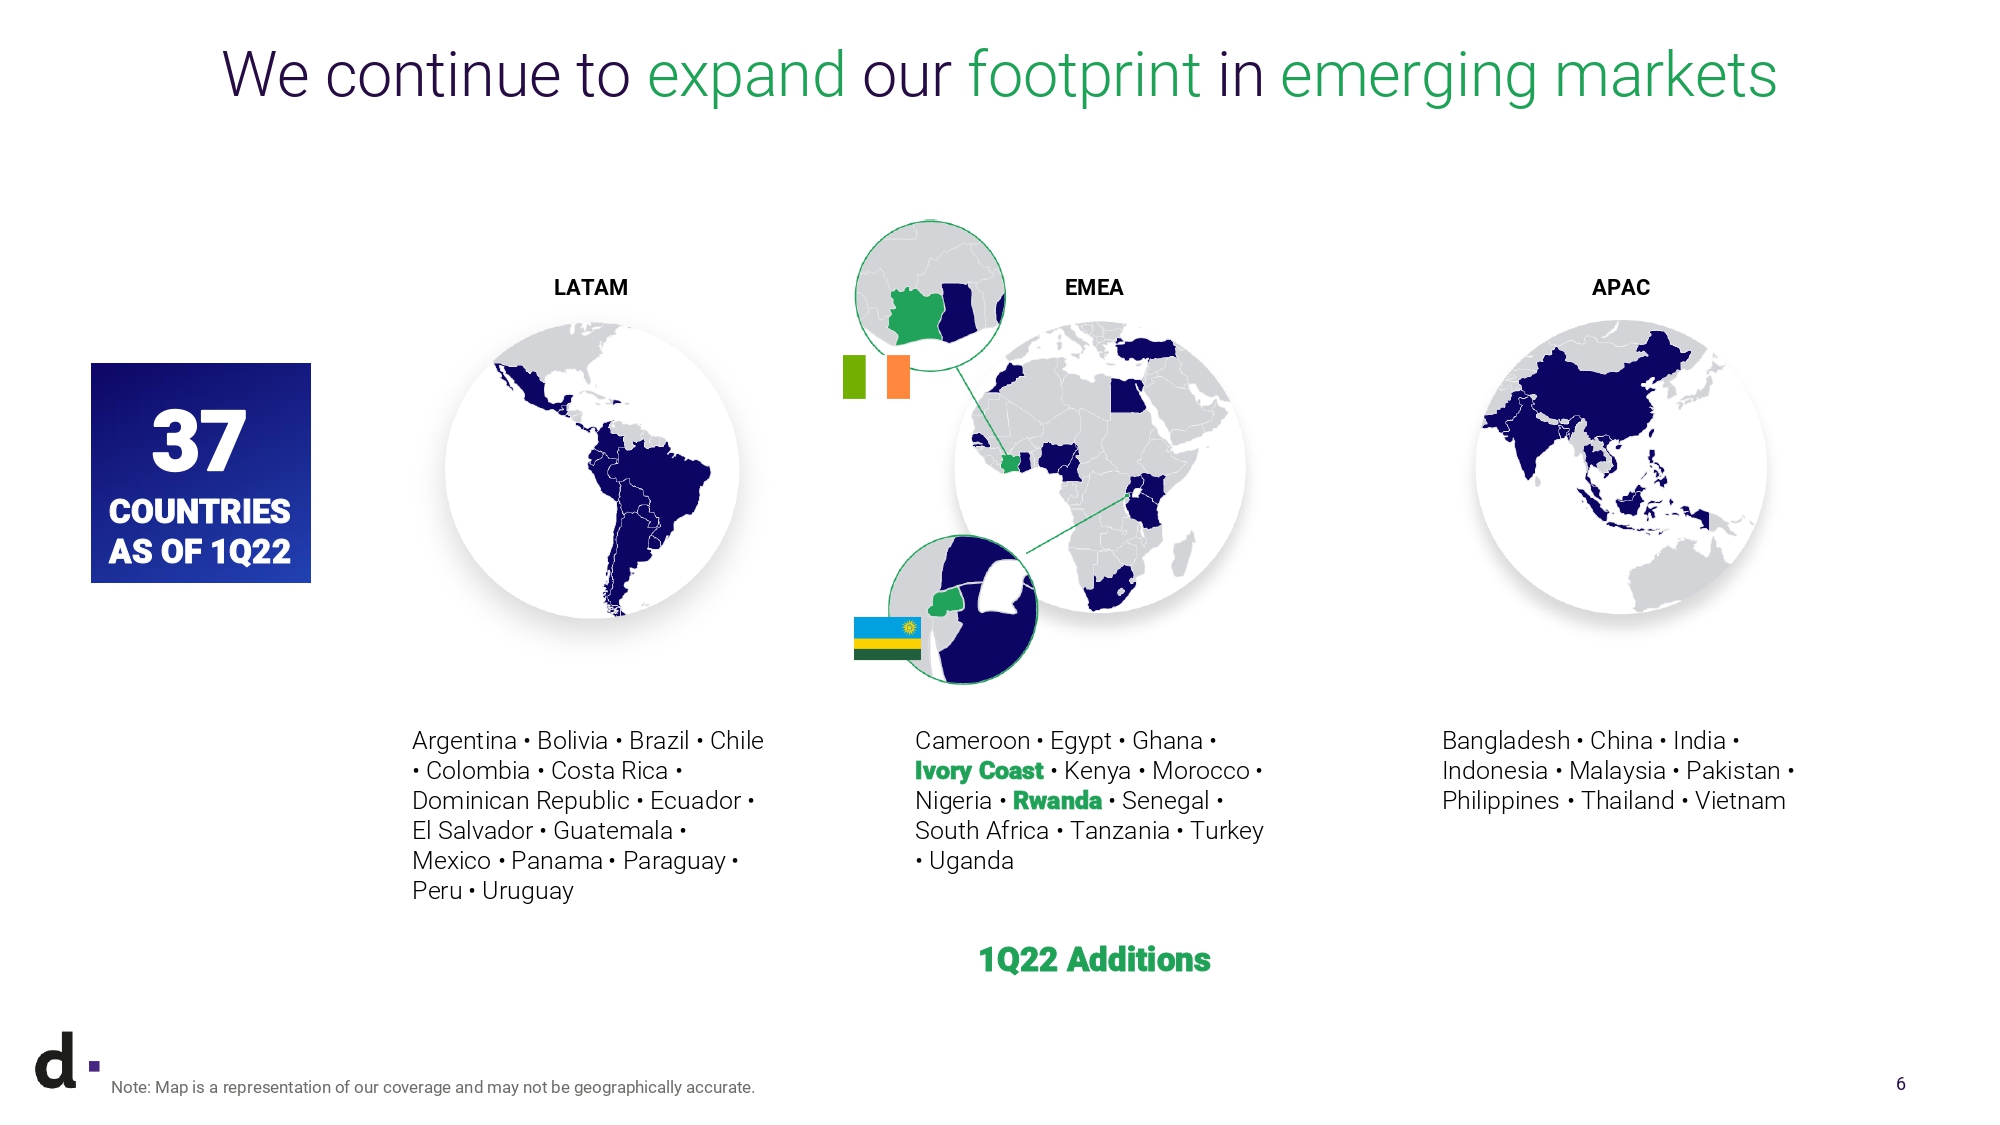
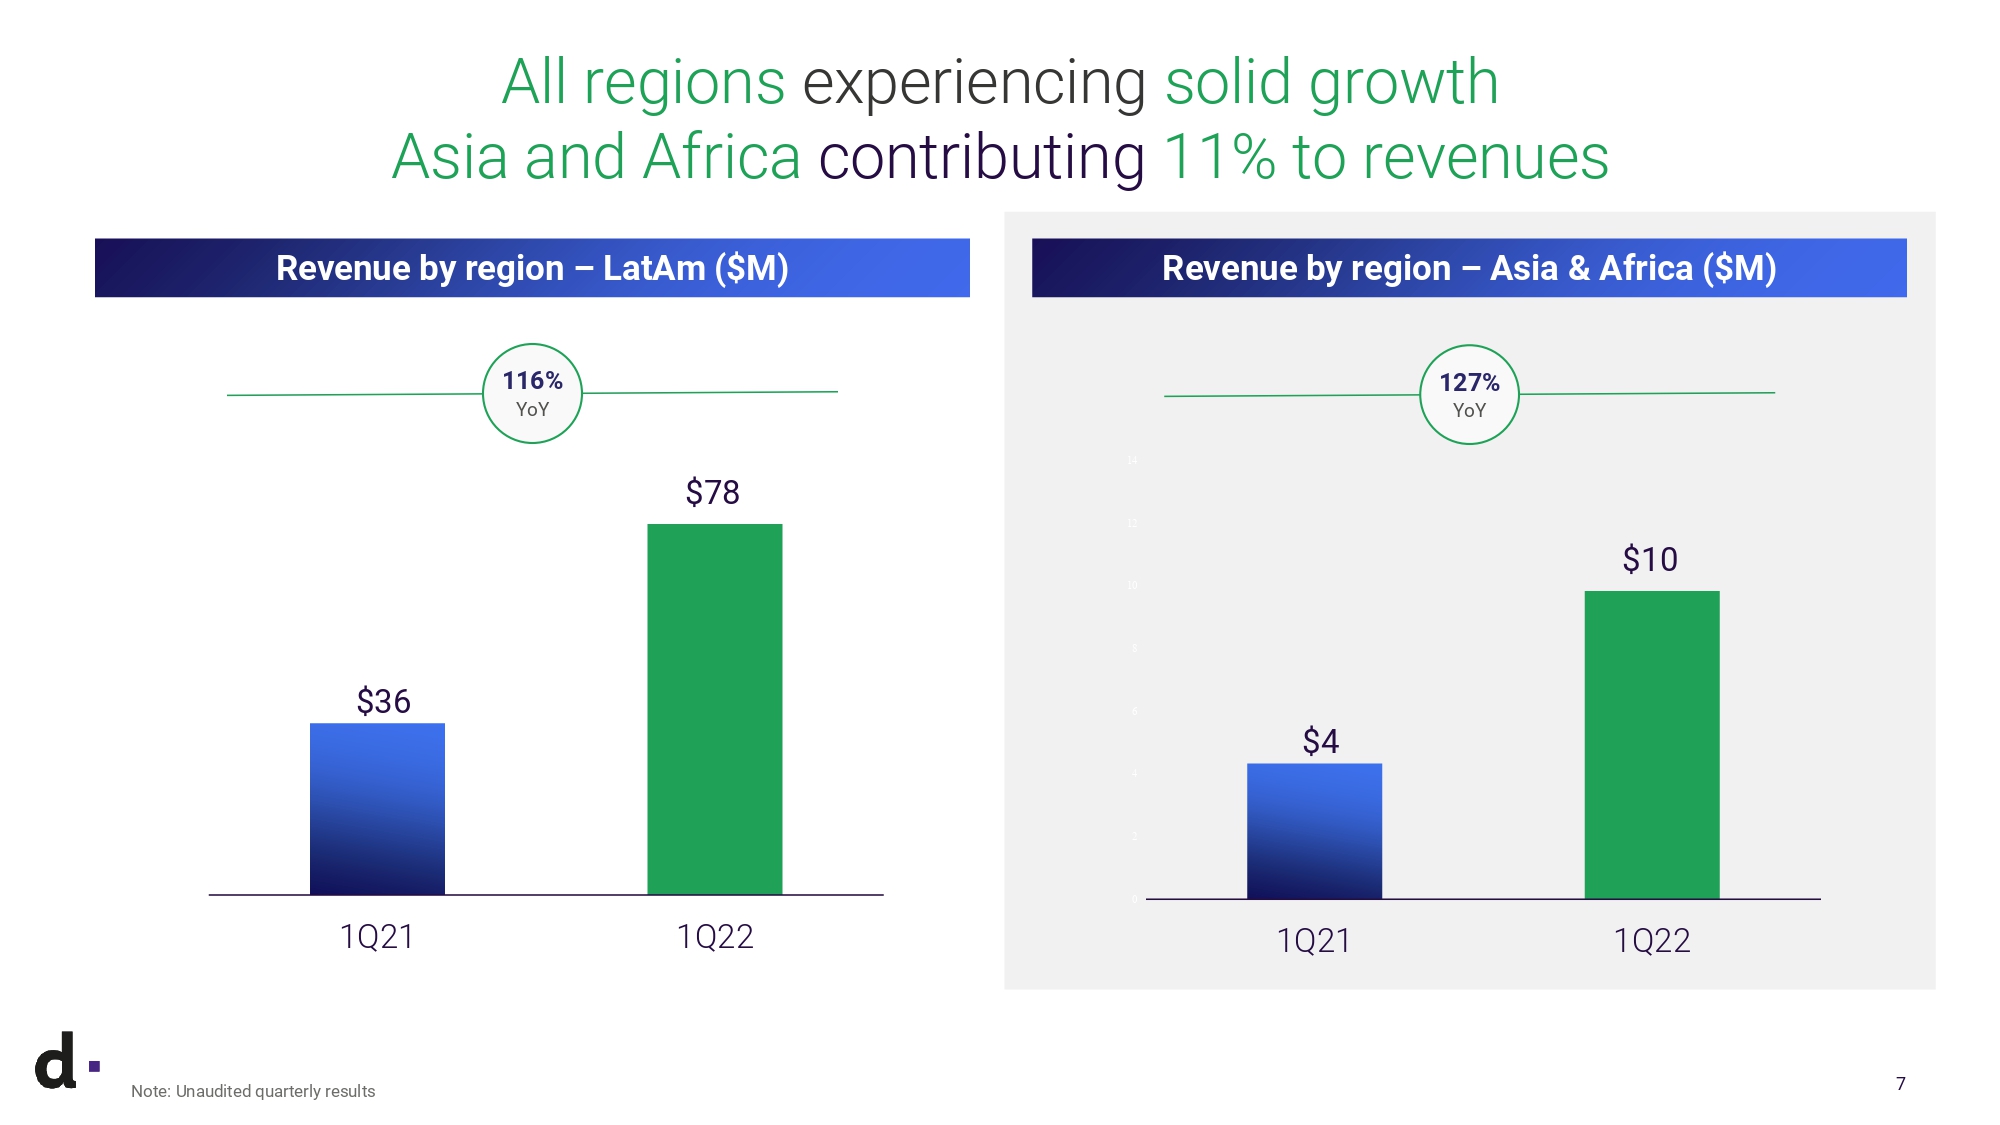
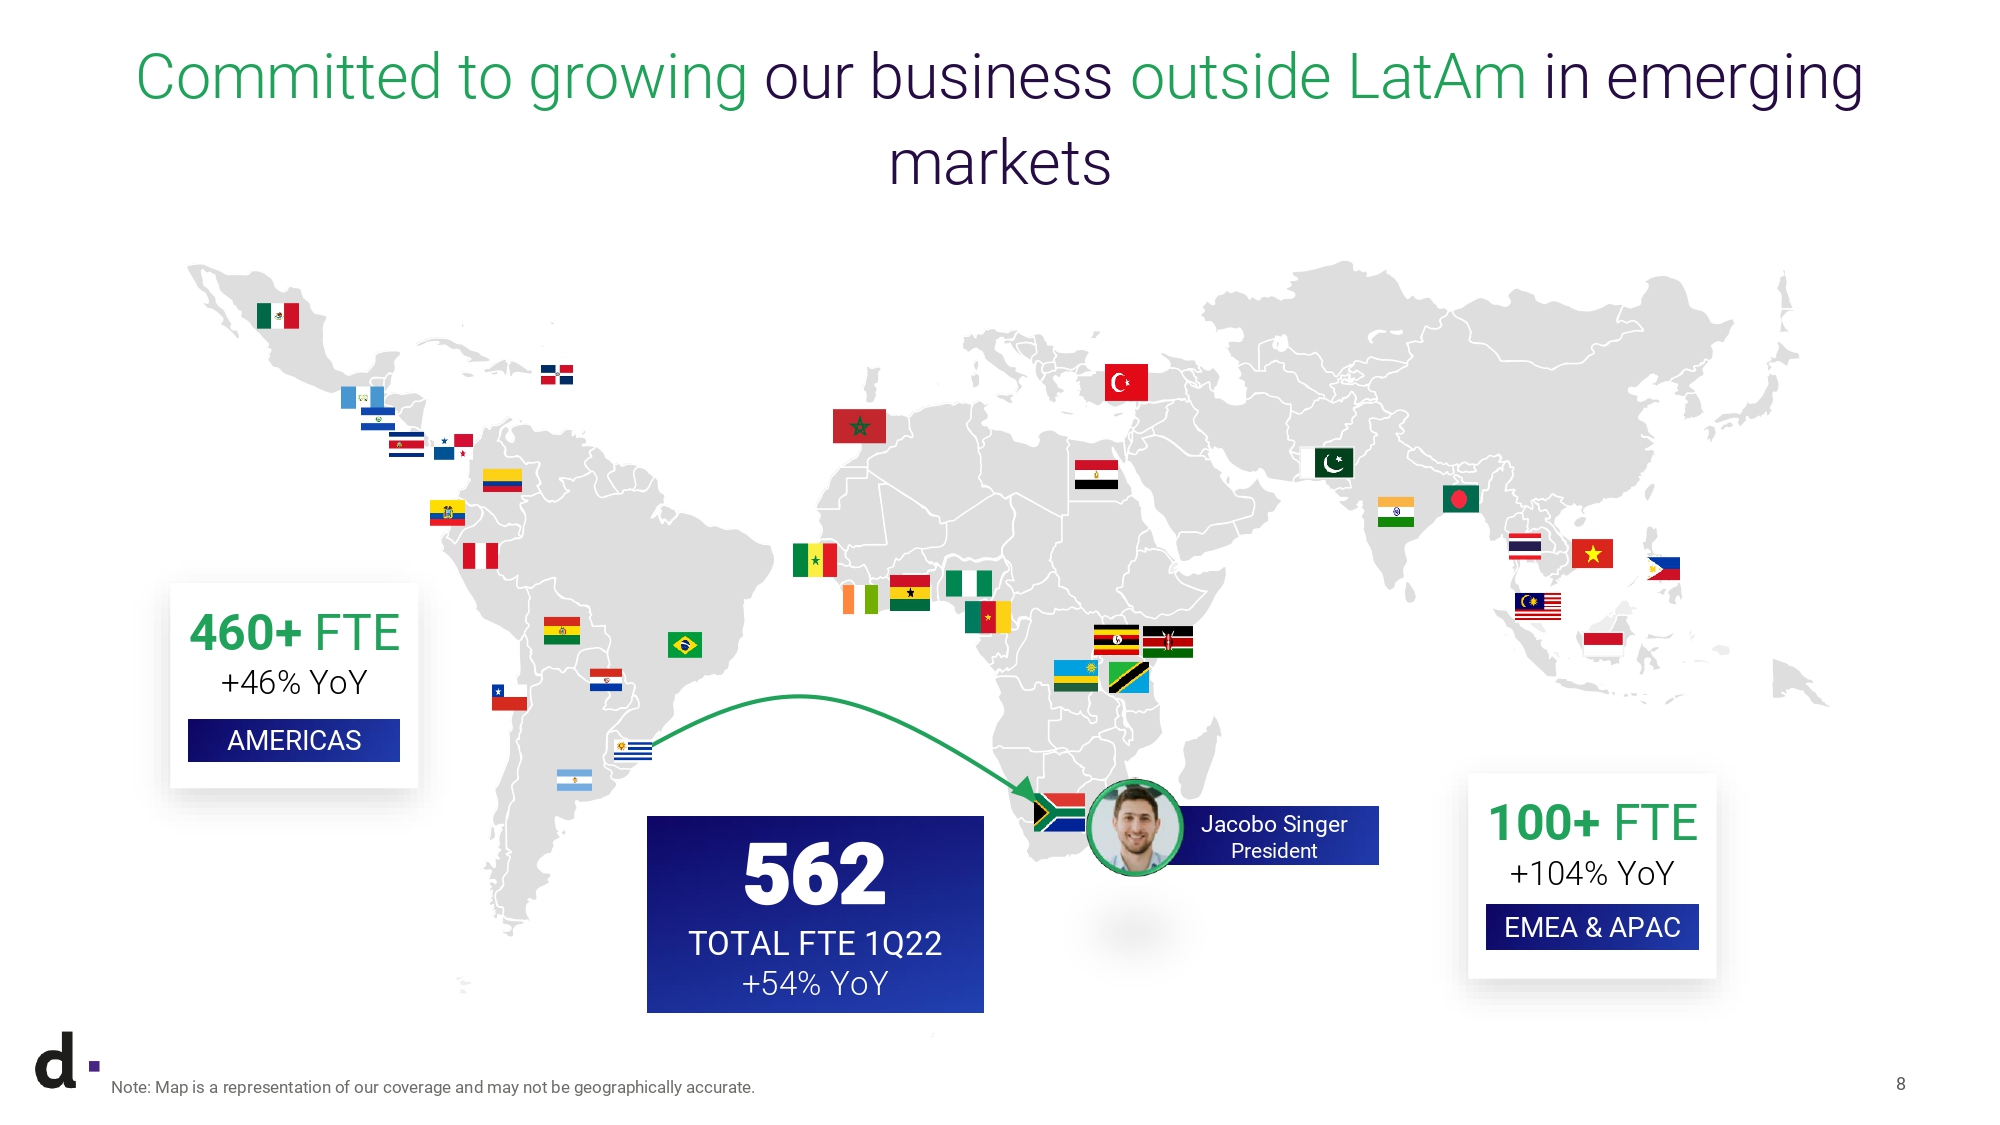
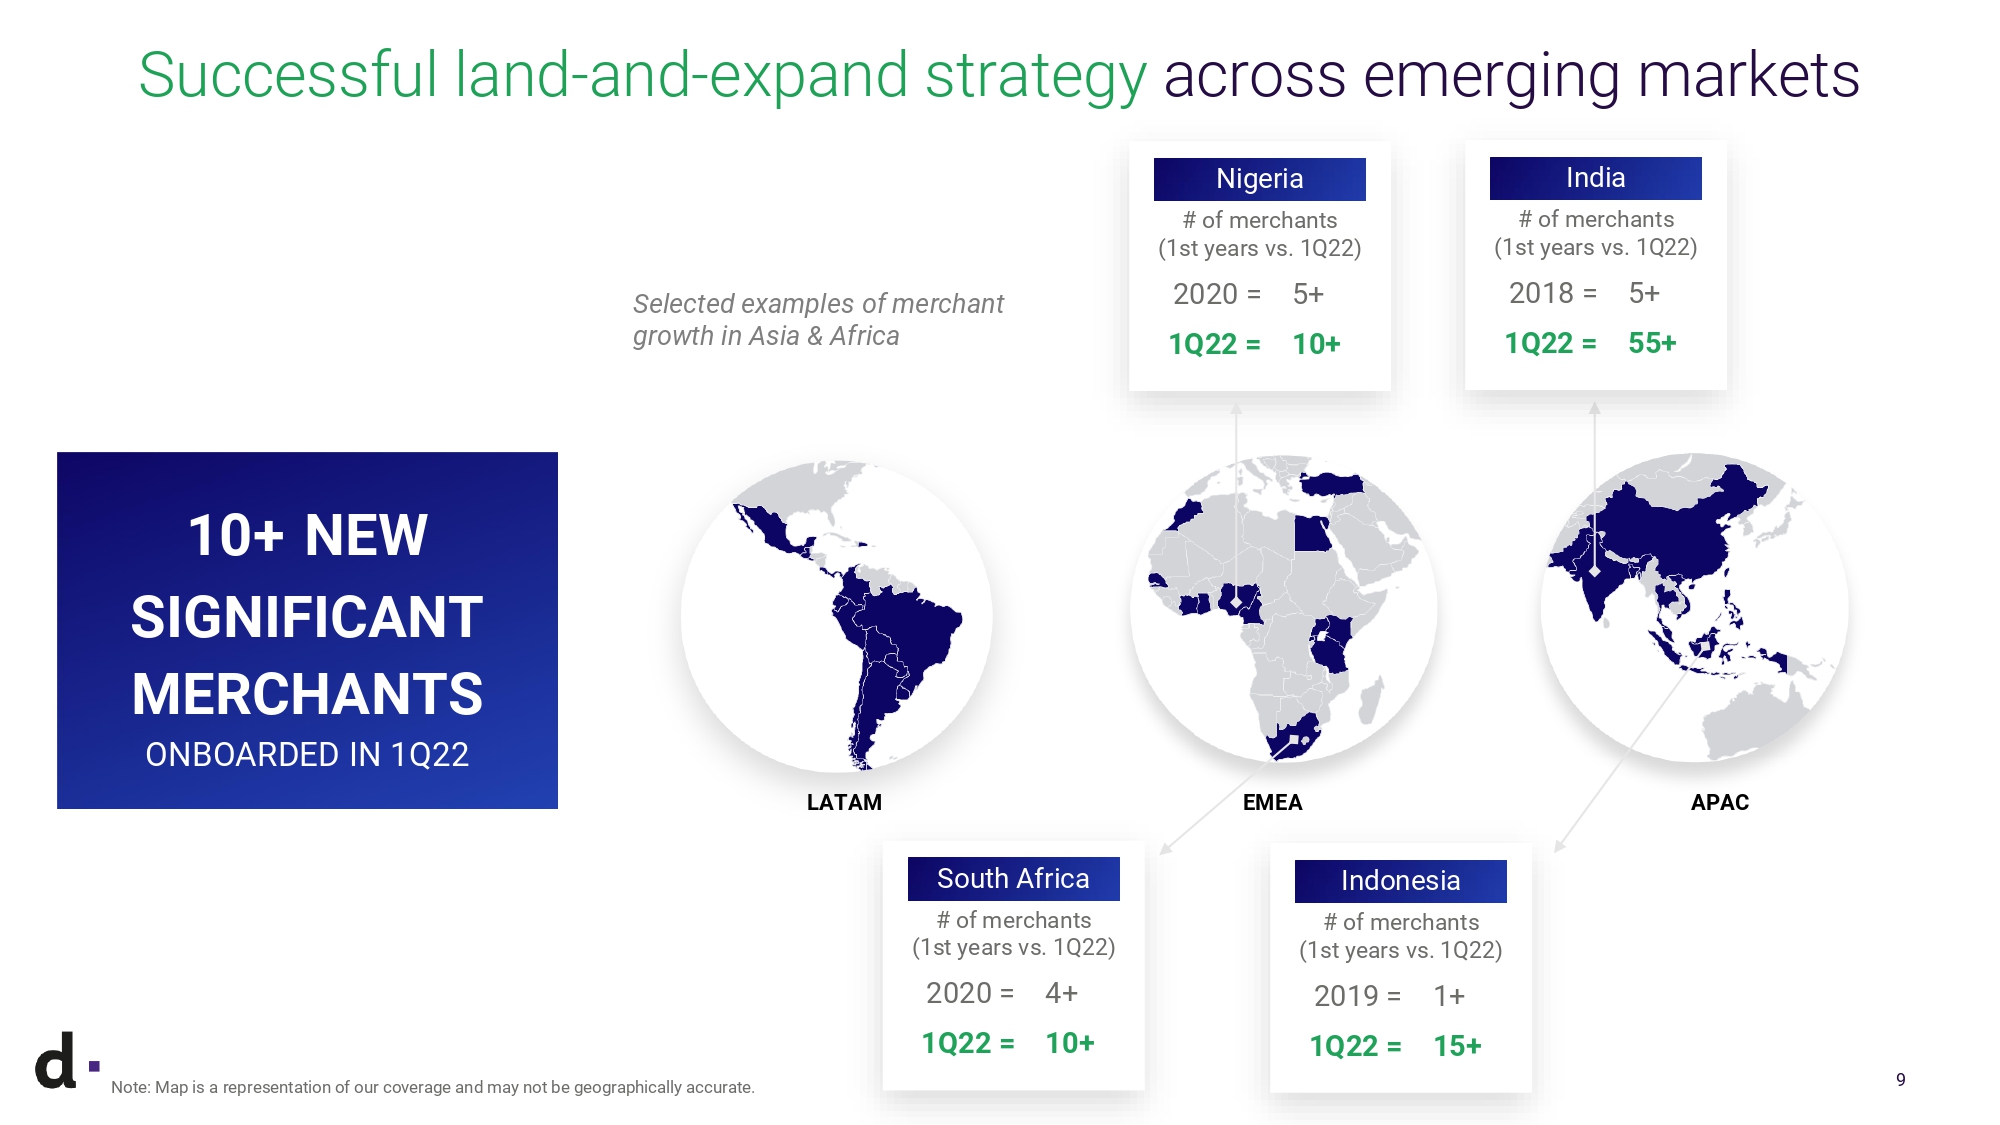

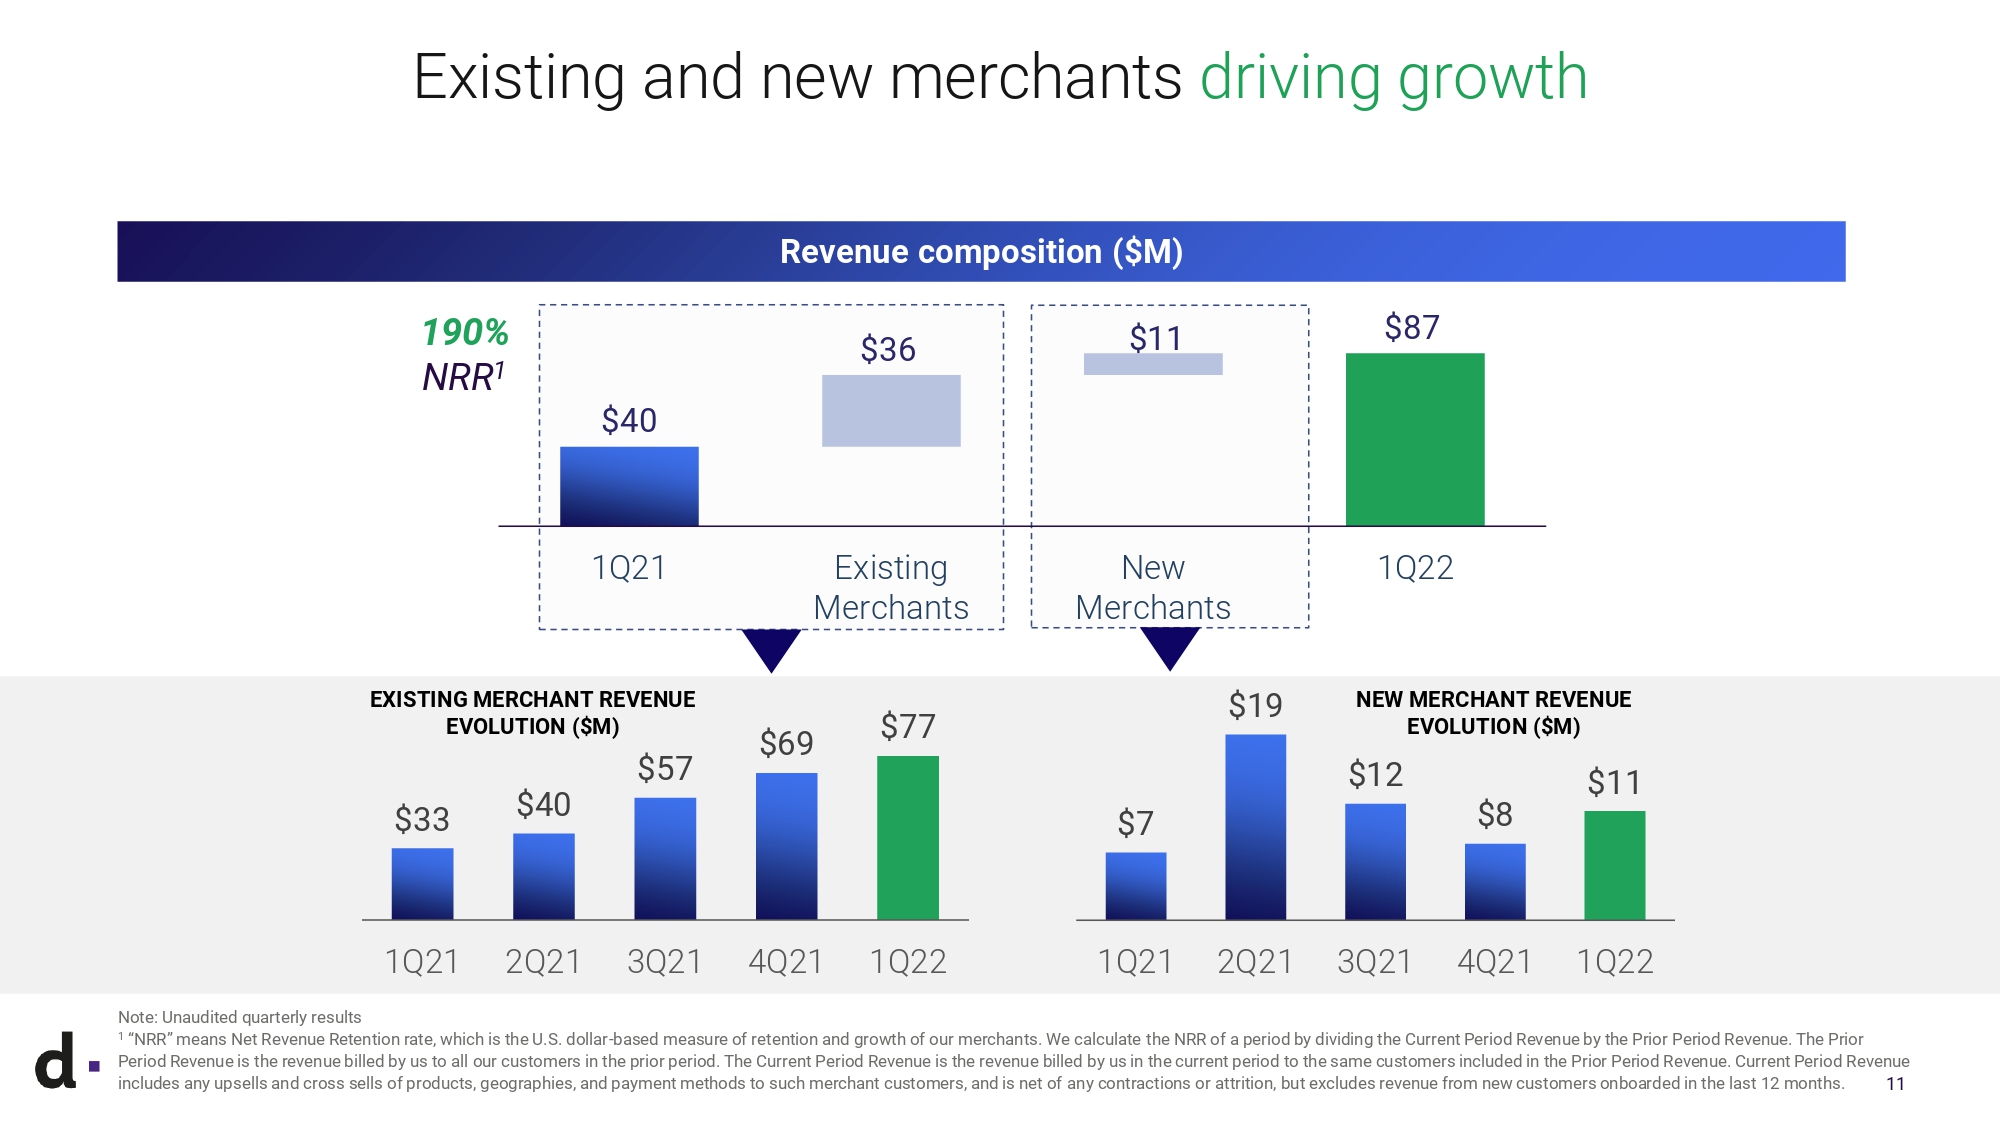
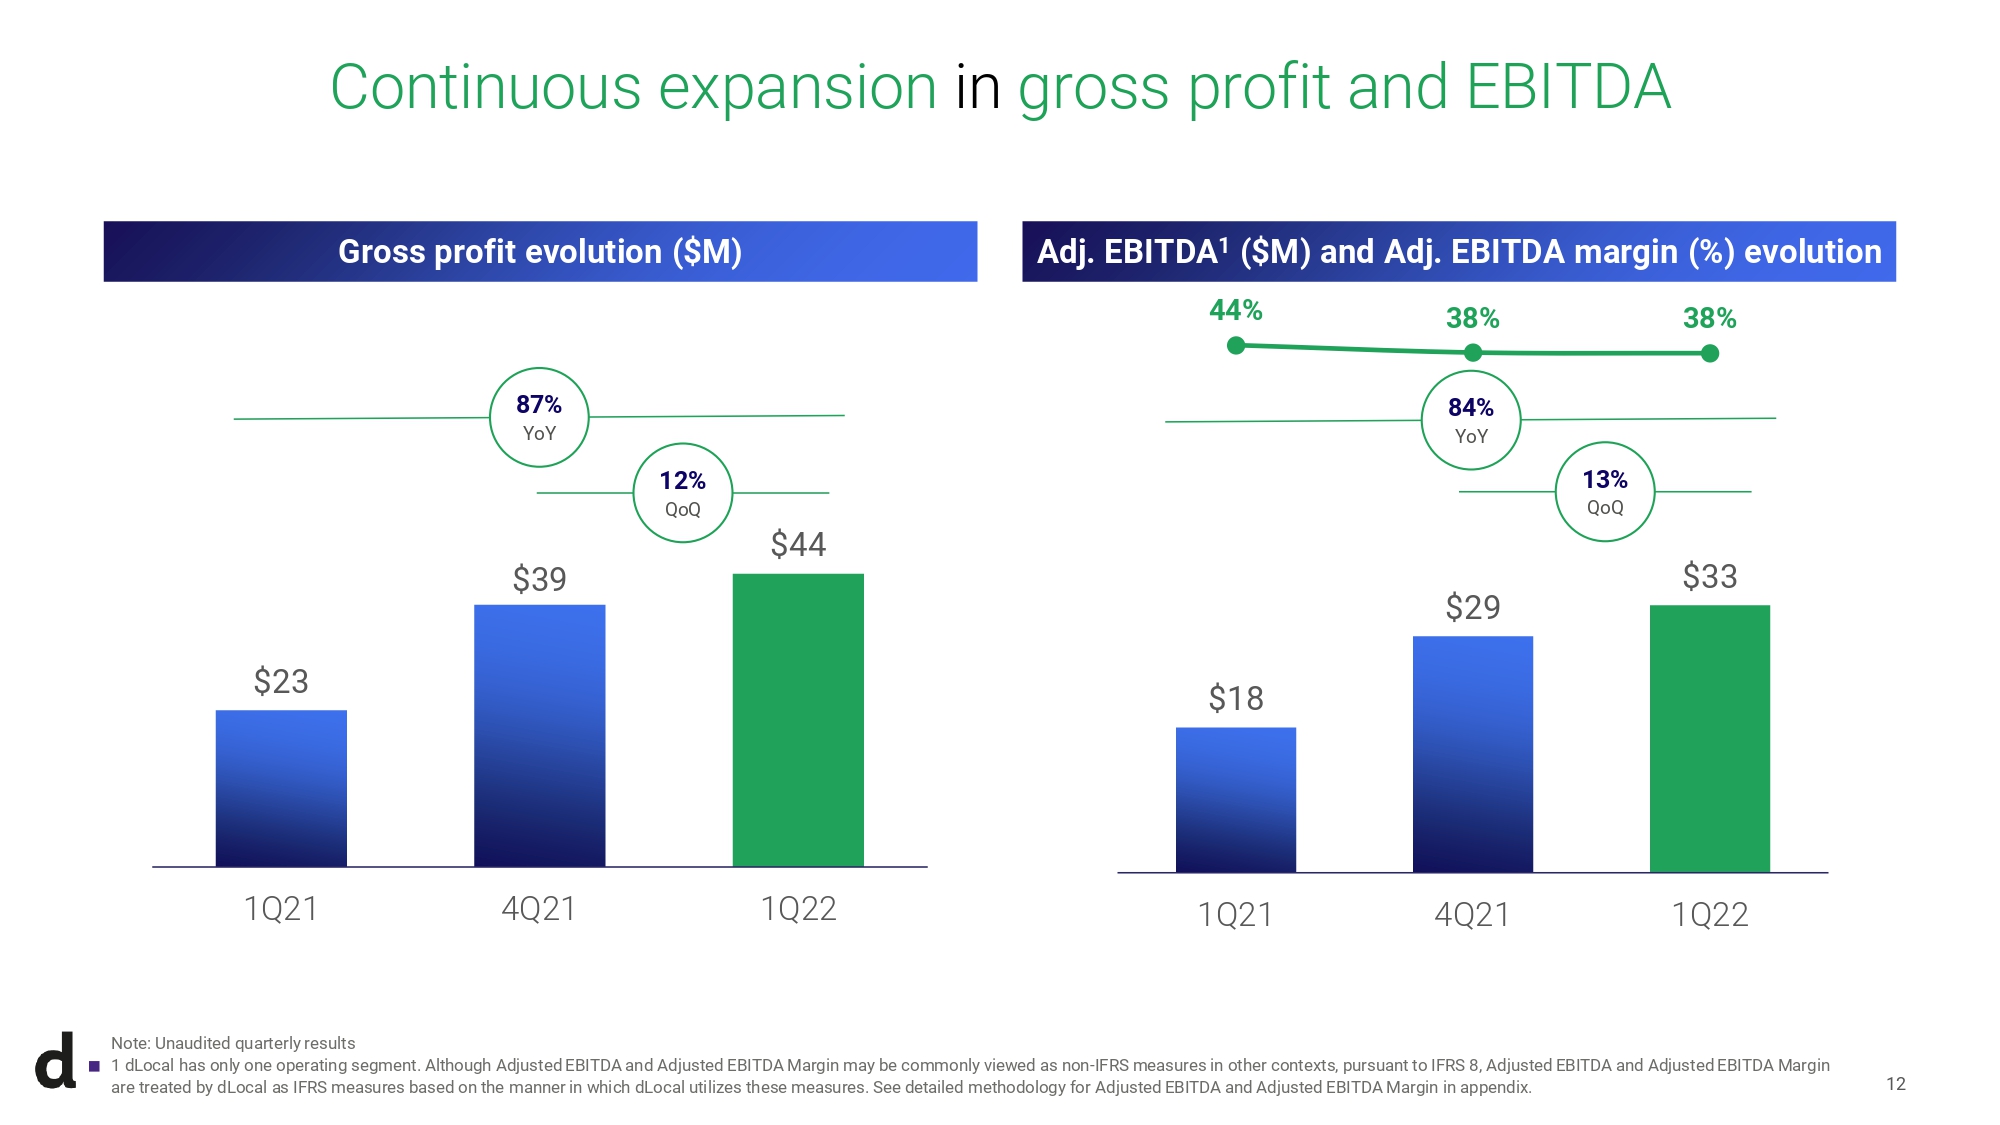
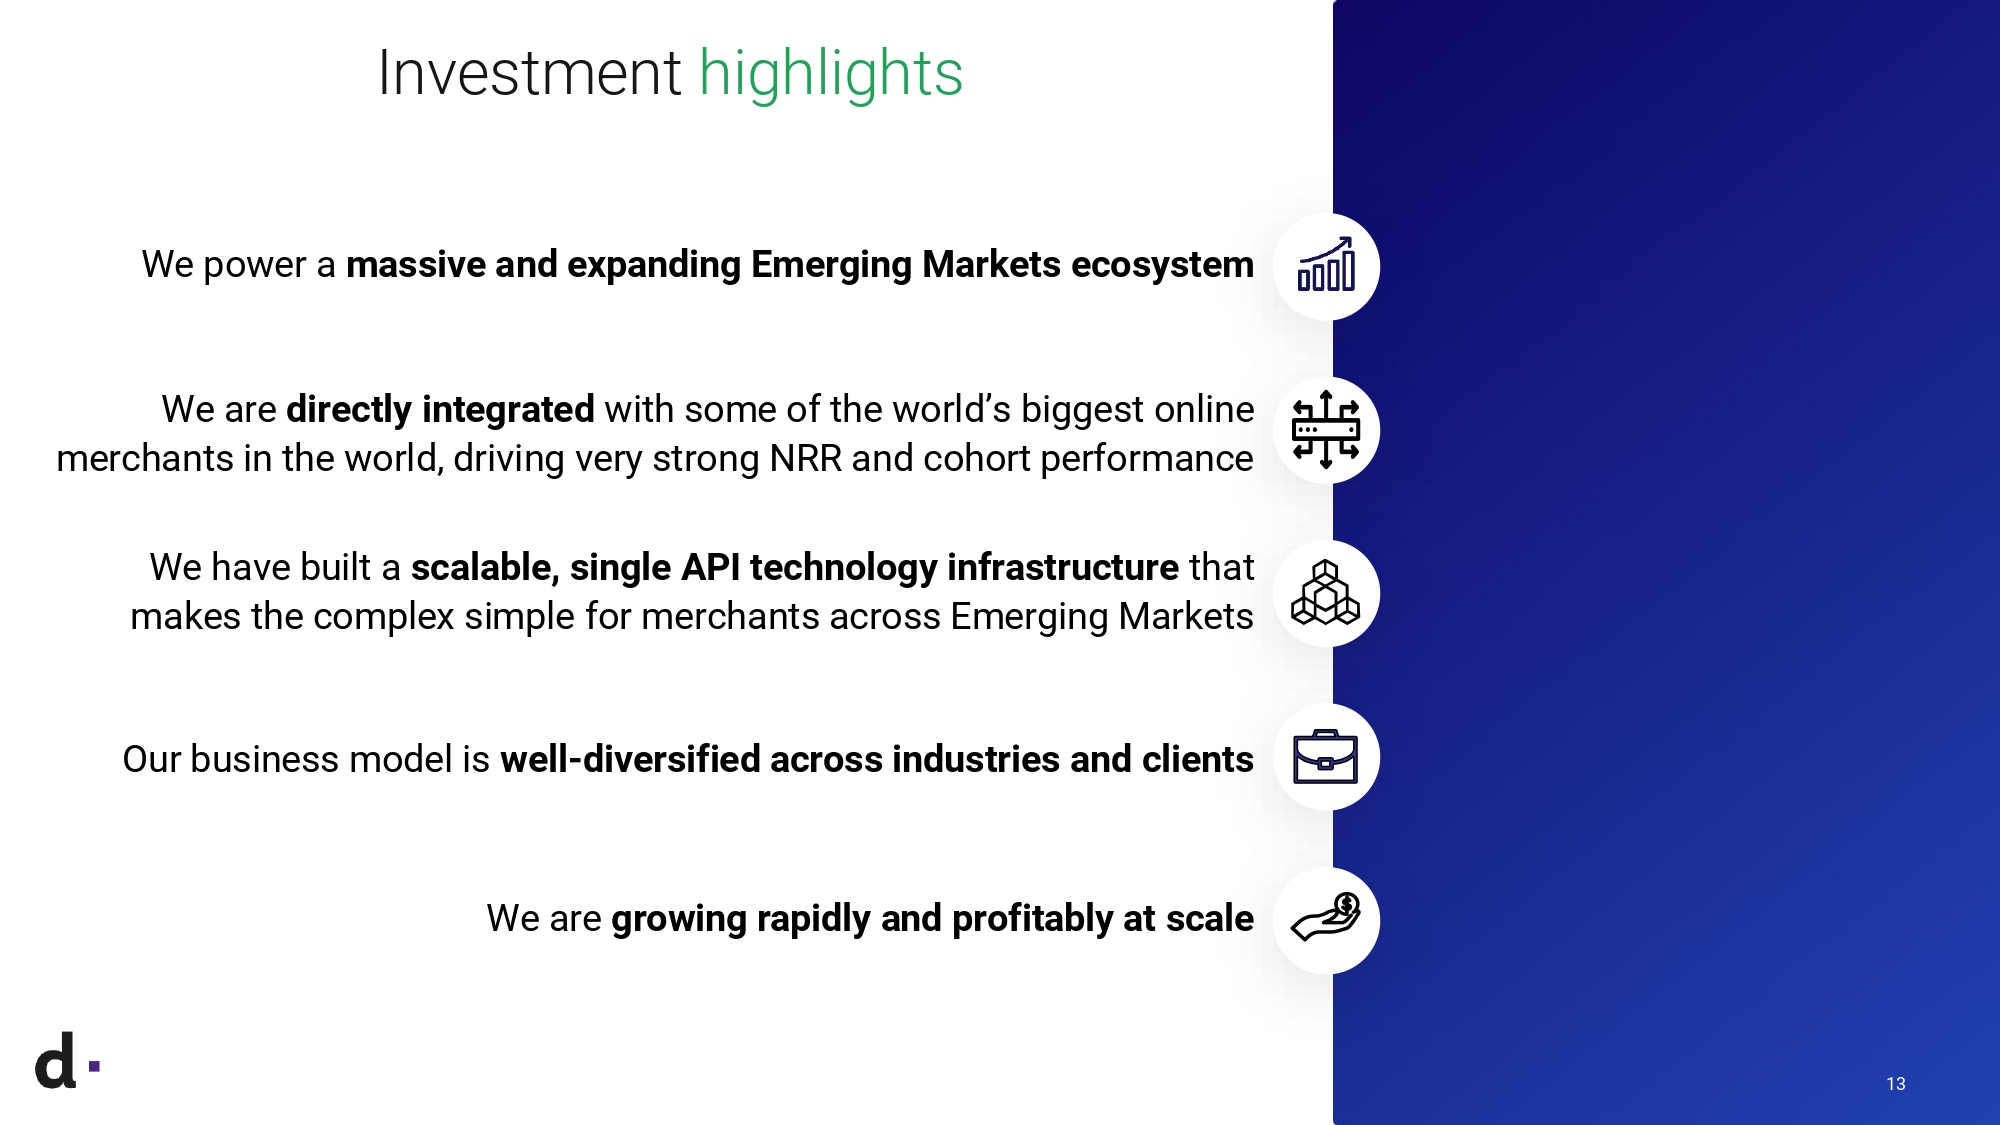


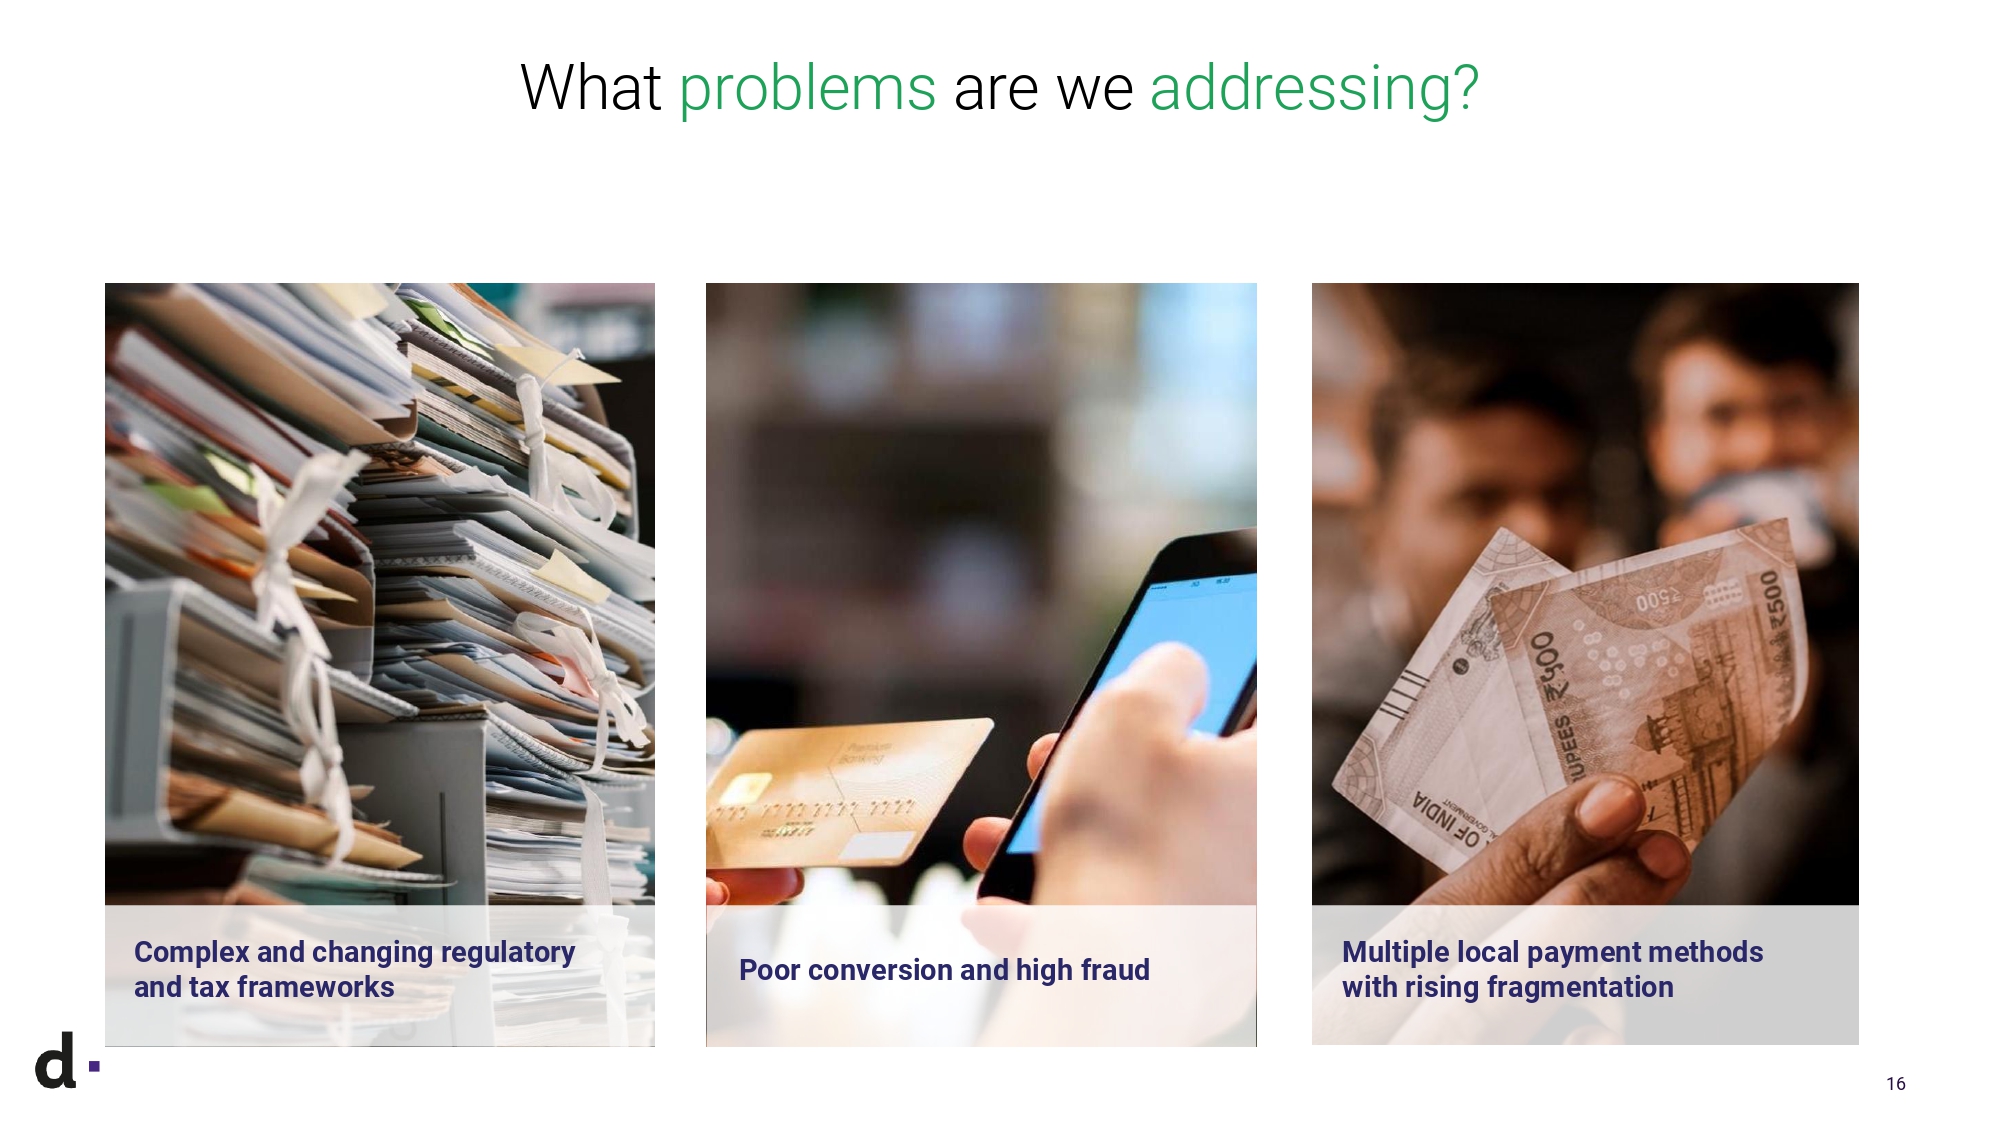
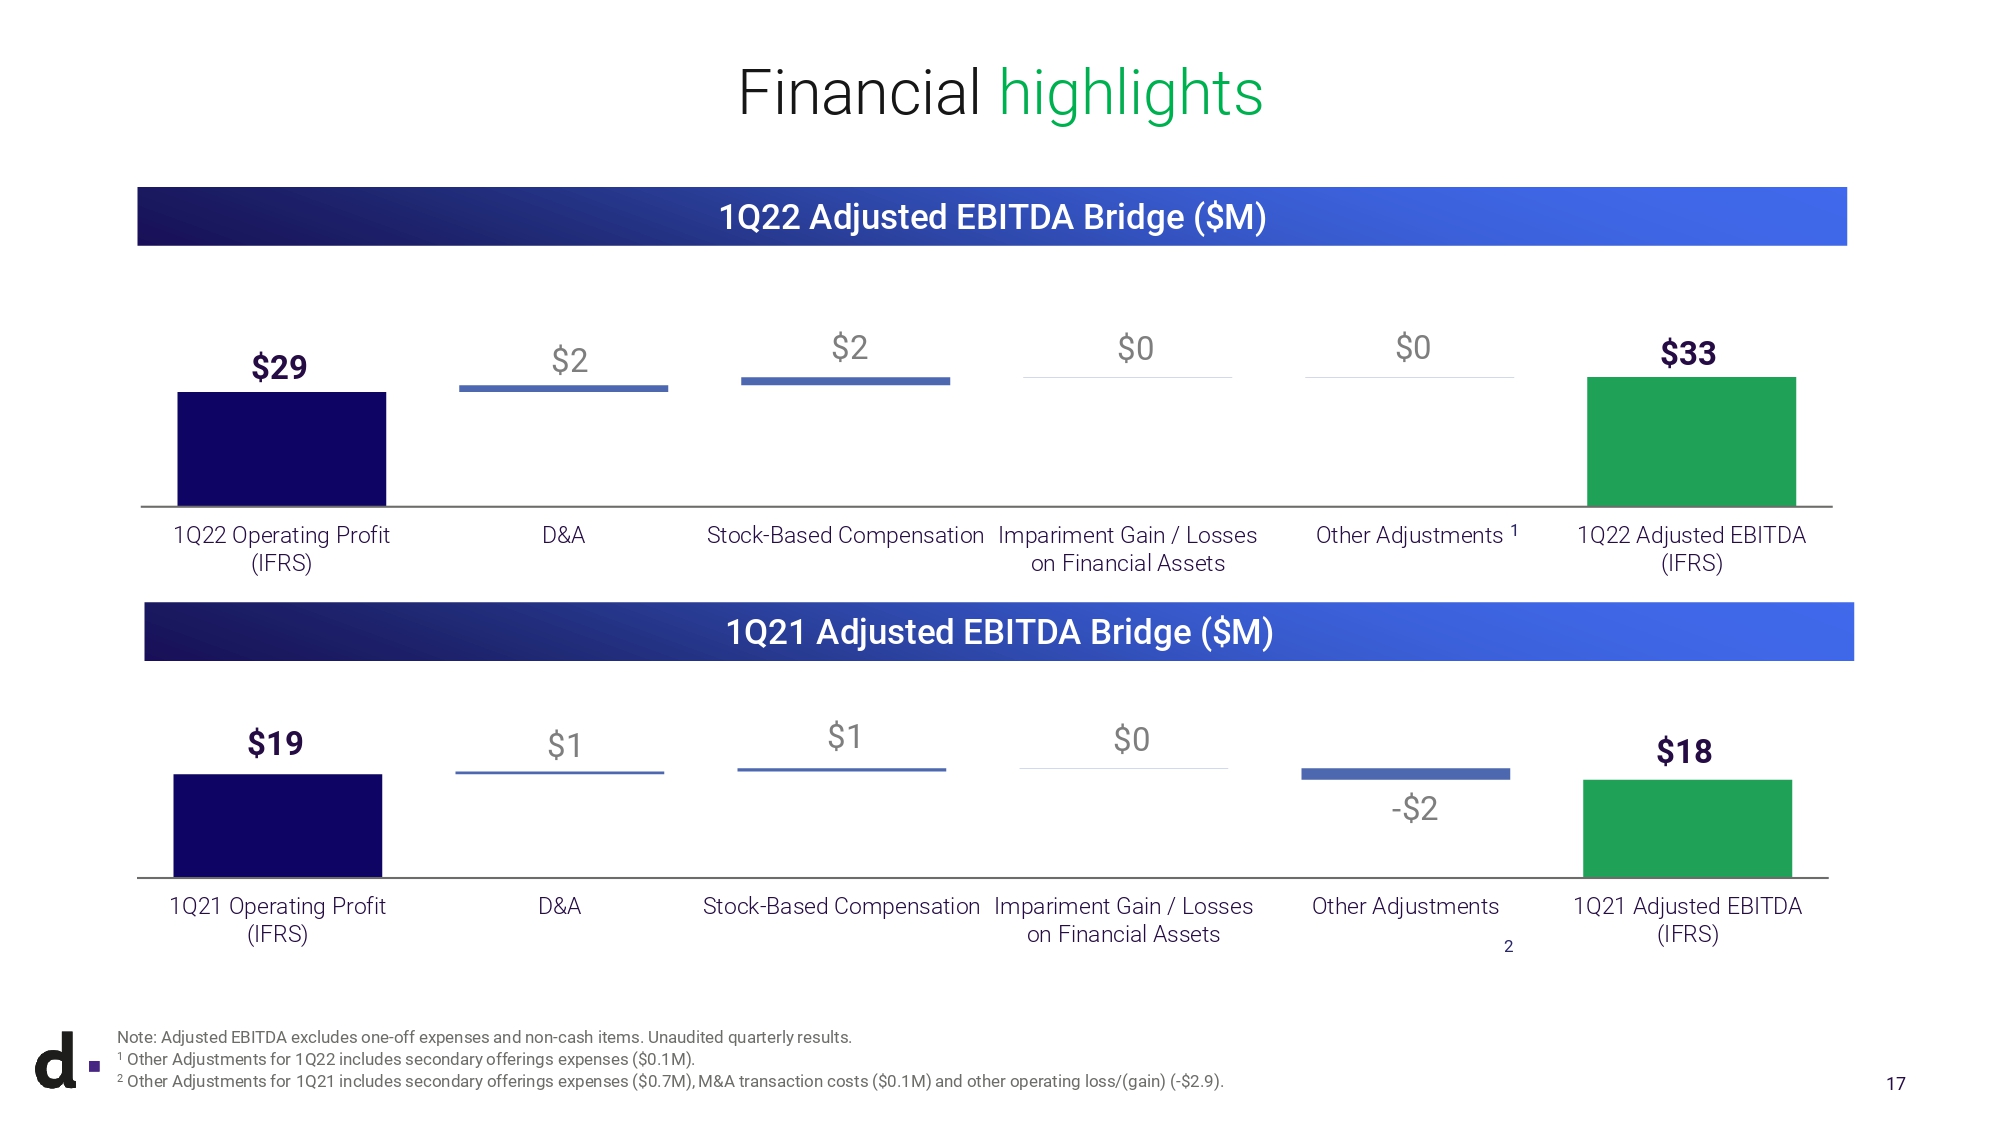
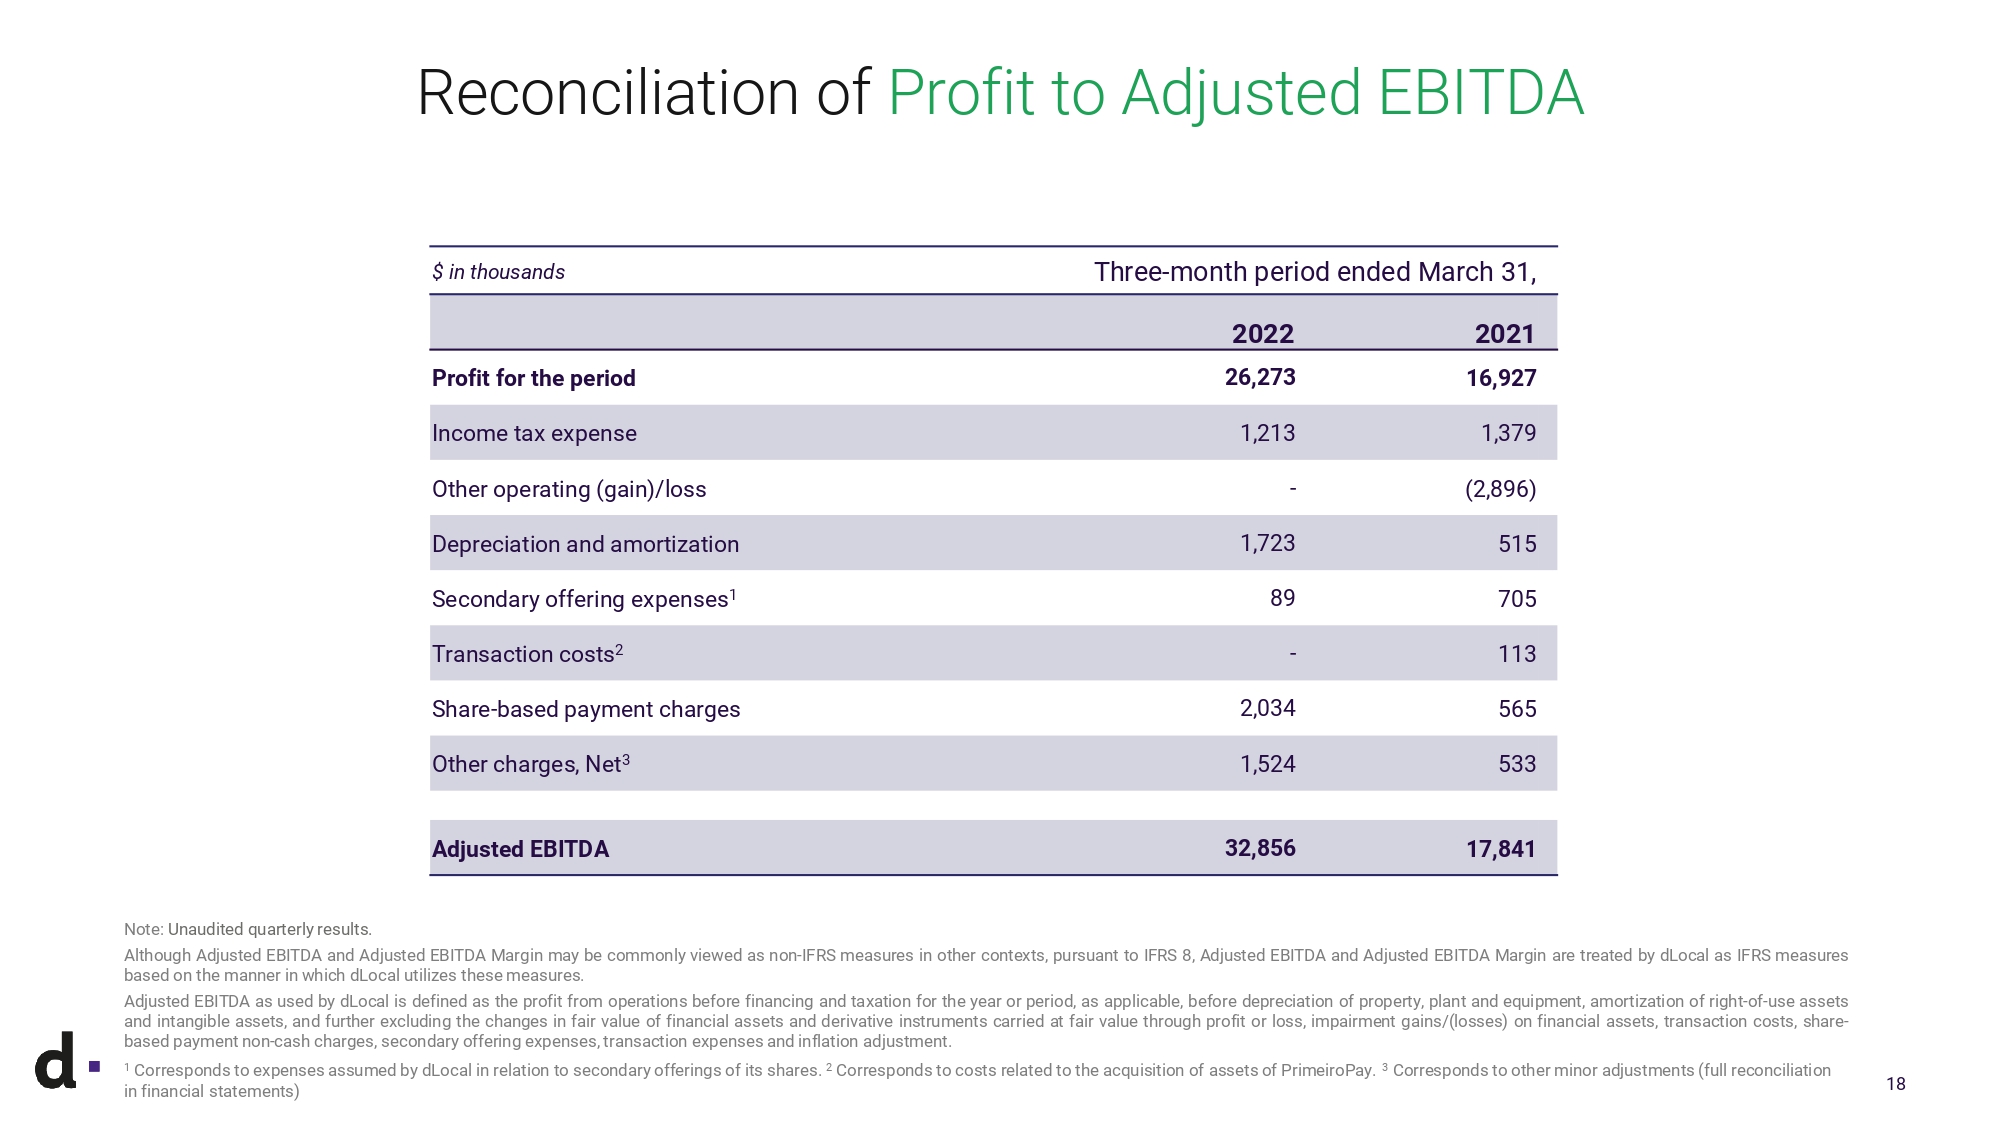
Serious News for Serious Traders! Try StreetInsider.com Premium Free!
You May Also Be Interested In
- Citi Starts DLocal Limited (DLO) at Neutral
- Black Construction Awarded Three Projects in Diego Garcia Totaling $54.5 Million
- Loar Announces Pricing of Initial Public Offering
Create E-mail Alert Related Categories
SEC FilingsSign up for StreetInsider Free!
Receive full access to all new and archived articles, unlimited portfolio tracking, e-mail alerts, custom newswires and RSS feeds - and more!
