

Form 6-K WESTPAC BANKING CORP For: Aug 15
 Tweet
Tweet Share
Share
UNITED STATES
SECURITIES AND EXCHANGE COMMISSION
Washington, DC 20549
FORM 6-K
REPORT OF FOREIGN PRIVATE ISSUER PURSUANT TO RULE 13a-16 OR 15d-16 UNDER THE SECURITIES EXCHANGE ACT OF 1934
August 15, 2022
Commission File Number 1-10167
WESTPAC BANKING CORPORATION
(Translation of registrant’s name into English)
275 KENT STREET, SYDNEY, NEW SOUTH WALES 2000, AUSTRALIA
(Address of principal executive office)
Indicate by check mark whether the registrant files or will file annual reports
under cover of Form 20-F or Form 40-F.
Form 20-F x Form 40-F ¨
Indicate by check mark if the registrant is submitting the Form 6-K in paper as permitted by Regulation S-T Rule 101(b)(1): ¨
Indicate by check mark if the registrant is submitting the Form 6-K in paper as permitted by Regulation S-T Rule 101(b)(7): ¨
Index to Exhibits
| Exhibit | ||
| No. | Description | |
| 1 | ASX Release – 3Q22 Capital, Credit Quality and Funding Update |
SIGNATURES
Pursuant to the requirements of the Securities Exchange Act of 1934, the registrant has duly caused this report to be signed on its behalf by the undersigned, thereunto duly authorized.
| WESTPAC BANKING CORPORATION | ||
| (Registrant) | ||
| Date: August 15, 2022 | By: | /s/ Yvette Adiguzel |
| Yvette Adiguzel | ||
| Tier One Attorney | ||
Exhibit 1
| ASX Release 15 AUGUST 2022 WESTPAC 3Q22 CAPITAL, CREDIT QUALITY AND FUNDING UPDATE Following is Westpac’s 3Q22 slides covering capital, credit quality and funding for the three months ended June 2022. For further information: Hayden Cooper Andrew Bowden Group Head of Media Relations General Manager Investor Relations 0402 393 619 0438 284 863 This document has been authorised for release by Tim Hartin, Company Secretary. Level 18, 275 Kent Street Sydney, NSW, 2000 |
| FOR THE 3 MONTHS ENDED 30 JUNE 2022 WESTPAC BANKING CORPORATION ABN 33 007 457 141 This document should be read in conjunction with Westpac’s June 2022 Pillar 3 Report. Contents principally covers and compares the 3Q22 and 1H22 quarterly average periods unless otherwise stated. All amounts are in Australian dollars. 3Q22 Capital, Credit Quality and Funding Update |
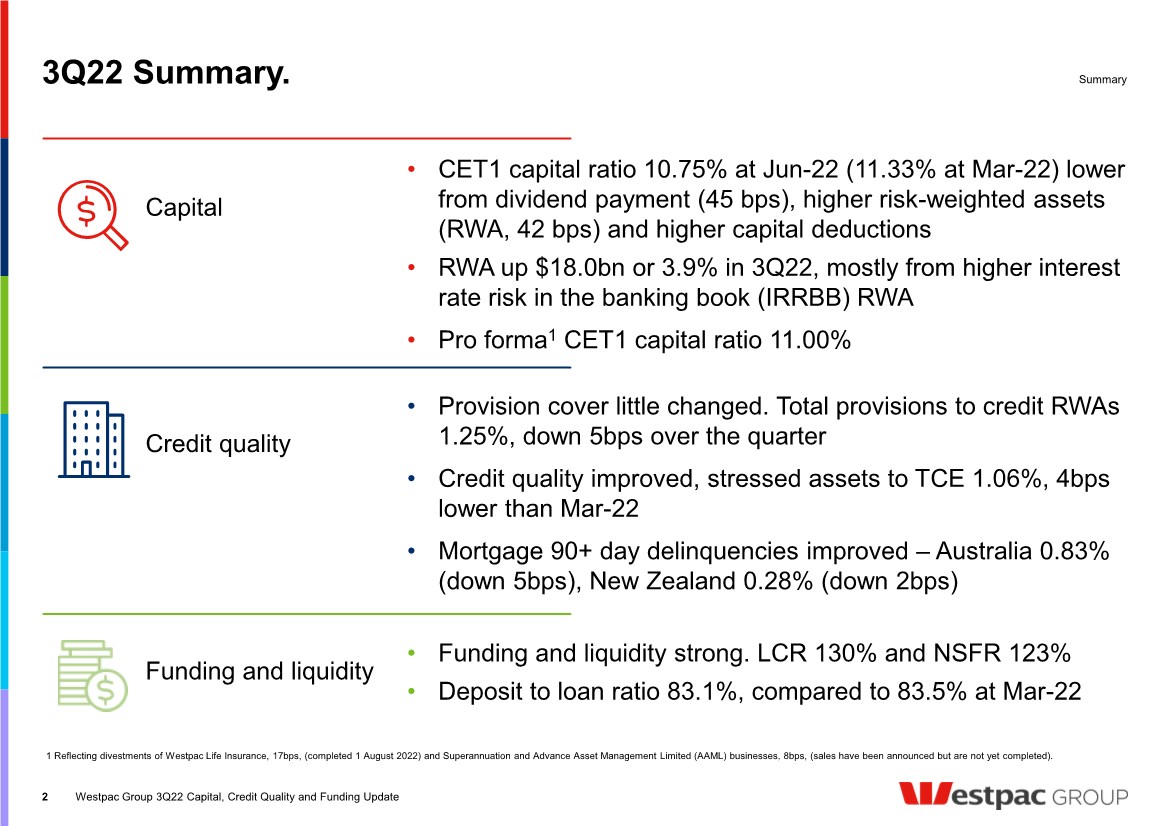
| 3Q22 Summary. Summary • Provision cover little changed. Total provisions to credit RWAs 1.25%, down 5bps over the quarter • Credit quality improved, stressed assets to TCE 1.06%, 4bps lower than Mar-22 • Mortgage 90+ day delinquencies improved – Australia 0.83% (down 5bps), New Zealand 0.28% (down 2bps) Funding and liquidity Capital Credit quality • CET1 capital ratio 10.75% at Jun-22 (11.33% at Mar-22) lower from dividend payment (45 bps), higher risk-weighted assets (RWA, 42 bps) and higher capital deductions • RWA up $18.0bn or 3.9% in 3Q22, mostly from higher interest rate risk in the banking book (IRRBB) RWA • Pro forma1 CET1 capital ratio 11.00% • Funding and liquidity strong. LCR 130% and NSFR 123% • Deposit to loan ratio 83.1%, compared to 83.5% at Mar-22 2 Westpac Group 3Q22 Capital, Credit Quality and Funding Update 1 Reflecting divestments of Westpac Life Insurance, 17bps, (completed 1 August 2022) and Superannuation and Advance Asset Management Limited (AAML) businesses, 8bps, (sales have been announced but are not yet completed). |
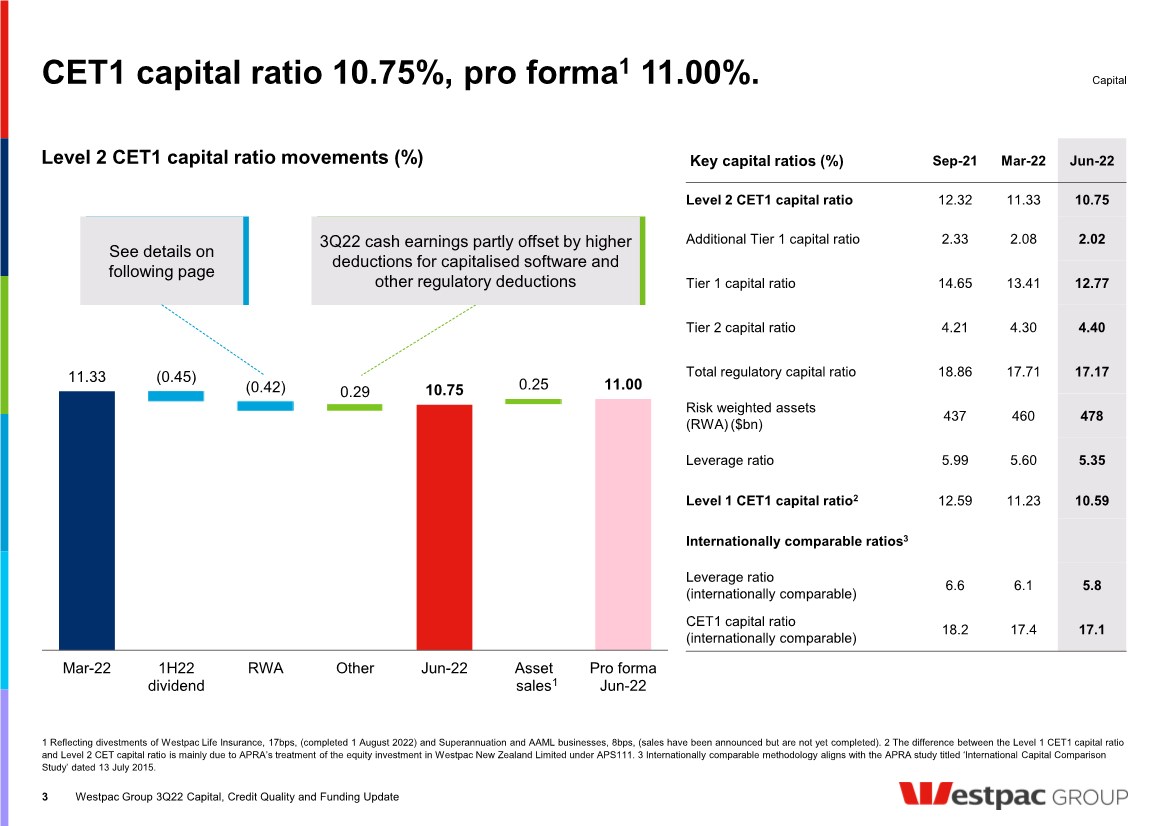
| 11.33 0.29 10.75 0.25 11.00 (0.45) (0.42) Mar-22 1H22 dividend RWA Other Jun-22 Asset sales Pro forma Jun-22 See details on following page CET1 capital ratio 10.75%, pro forma1 11.00%. 3 Capital Westpac Group 3Q22 Capital, Credit Quality and Funding Update Level 2 CET1 capital ratio movements (%) 3Q22 cash earnings partly offset by higher deductions for capitalised software and other regulatory deductions 1 Reflecting divestments of Westpac Life Insurance, 17bps, (completed 1 August 2022) and Superannuation and AAML businesses, 8bps, (sales have been announced but are not yet completed). 2 The difference between the Level 1 CET1 capital ratio and Level 2 CET capital ratio is mainly due to APRA’s treatment of the equity investment in Westpac New Zealand Limited under APS111. 3 Internationally comparable methodology aligns with the APRA study titled ‘International Capital Comparison Study’ dated 13 July 2015. Key capital ratios (%) Sep-21 Mar-22 Jun-22 Level 2 CET1 capital ratio 12.32 11.33 10.75 Additional Tier 1 capital ratio 2.33 2.08 2.02 Tier 1 capital ratio 14.65 13.41 12.77 Tier 2 capital ratio 4.21 4.30 4.40 Total regulatory capital ratio 18.86 17.71 17.17 Risk weighted assets (RWA) ($bn) 437 460 478 Leverage ratio 5.99 5.60 5.35 Level 1 CET1 capital ratio2 12.59 11.23 10.59 Internationally comparable ratios3 Leverage ratio (internationally comparable) 6.6 6.1 5.8 CET1 capital ratio (internationally comparable) 18.2 17.4 17.1 1 |
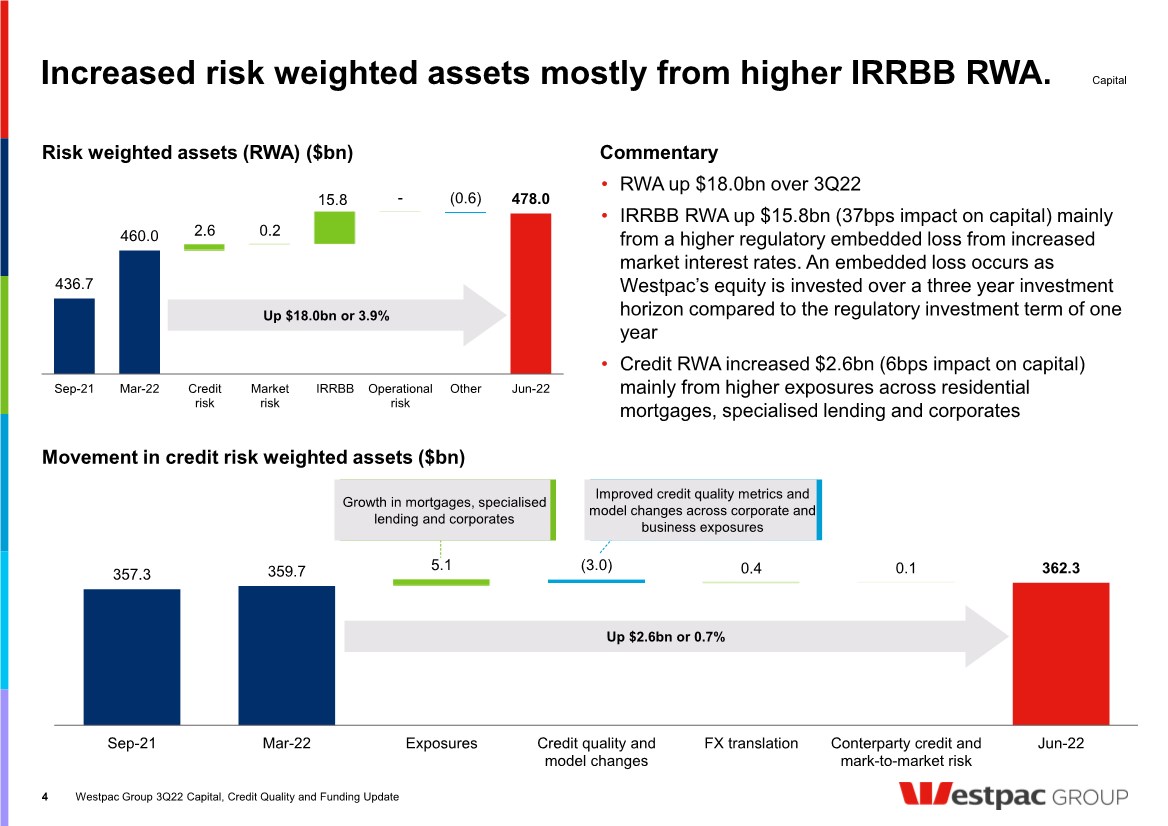
| 357.3 359.7 5.1 0.4 0.1 362.3 (3.0) Sep-21 Mar-22 Exposures Credit quality and model changes FX translation Conterparty credit and mark-to-market risk Jun-22 0.2 15.8 436.7 460.0 2.6 - 478.0 (0.6) Sep-21 Mar-22 Credit risk Market risk IRRBB Operational risk Other Jun-22 Increased risk weighted assets mostly from higher IRRBB RWA. 4 Risk weighted assets (RWA) ($bn) Movement in credit risk weighted assets ($bn) Commentary Capital Westpac Group 3Q22 Capital, Credit Quality and Funding Update Up $2.6bn or 0.7% Up $18.0bn or 3.9% • RWA up $18.0bn over 3Q22 • IRRBB RWA up $15.8bn (37bps impact on capital) mainly from a higher regulatory embedded loss from increased market interest rates. An embedded loss occurs as Westpac’s equity is invested over a three year investment horizon compared to the regulatory investment term of one year • Credit RWA increased $2.6bn (6bps impact on capital) mainly from higher exposures across residential mortgages, specialised lending and corporates Growth in mortgages, specialised lending and corporates Improved credit quality metrics and model changes across corporate and business exposures |
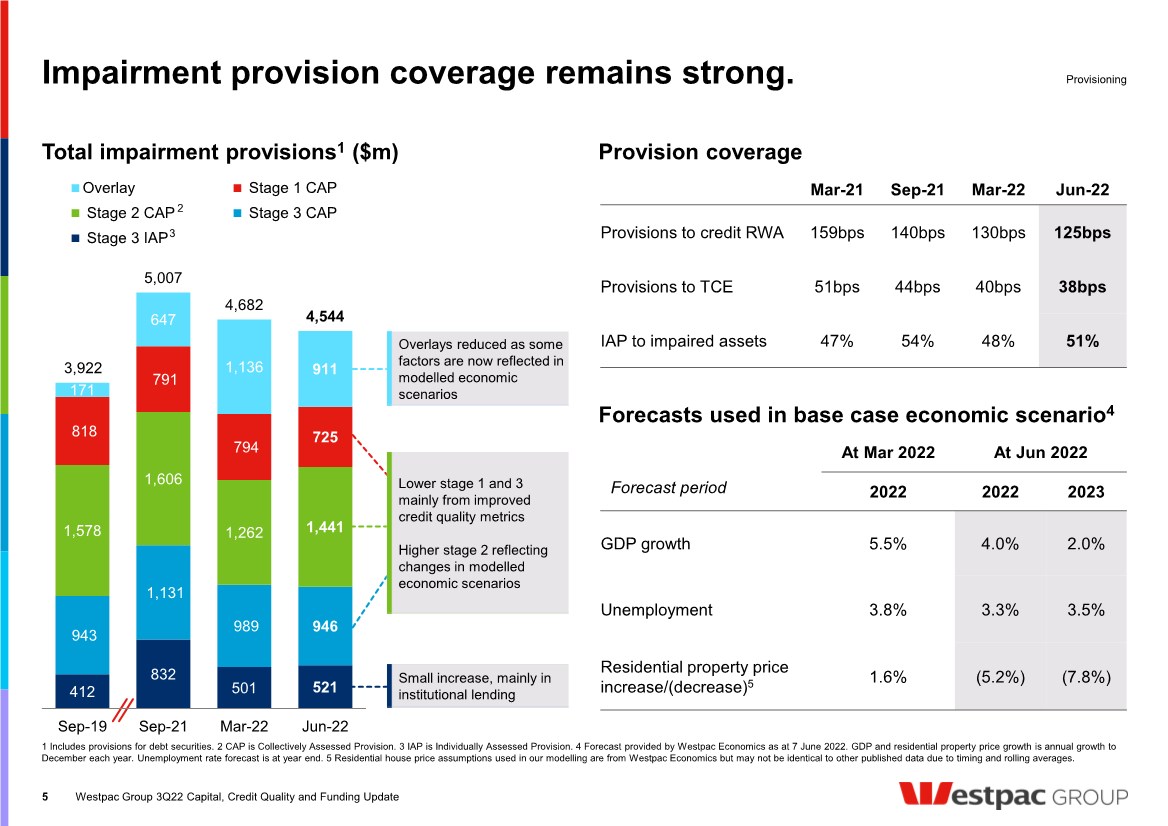
| Impairment provision coverage remains strong. At Mar 2022 At Jun 2022 Forecast period 2022 2022 2023 GDP growth 5.5% 4.0% 2.0% Unemployment 3.8% 3.3% 3.5% Residential property price increase/(decrease)5 1.6% (5.2%) (7.8%) Forecasts used in base case economic scenario4 Provisioning Total impairment provisions1 ($m) Provision coverage Mar-21 Sep-21 Mar-22 Jun-22 Provisions to credit RWA 159bps 140bps 130bps 125bps Provisions to TCE 51bps 44bps 40bps 38bps IAP to impaired assets 47% 54% 48% 51% 5 Westpac Group 3Q22 Capital, Credit Quality and Funding Update 412 832 501 521 943 1,131 989 946 1,578 1,606 1,262 1,441 818 791 794 725 171 647 1,136 911 3,922 5,007 4,682 4,544 Sep-19 Sep-21 Mar-22 Jun-22 Overlay Stage 1 CAP Stage 2 CAP Stage 3 CAP Stage 3 IAP 1 Includes provisions for debt securities. 2 CAP is Collectively Assessed Provision. 3 IAP is Individually Assessed Provision. 4 Forecast provided by Westpac Economics as at 7 June 2022. GDP and residential property price growth is annual growth to December each year. Unemployment rate forecast is at year end. 5 Residential house price assumptions used in our modelling are from Westpac Economics but may not be identical to other published data due to timing and rolling averages. Lower stage 1 and 3 mainly from improved credit quality metrics Higher stage 2 reflecting changes in modelled economic scenarios Overlays reduced as some factors are now reflected in modelled economic scenarios Small increase, mainly in institutional lending 2 3 |
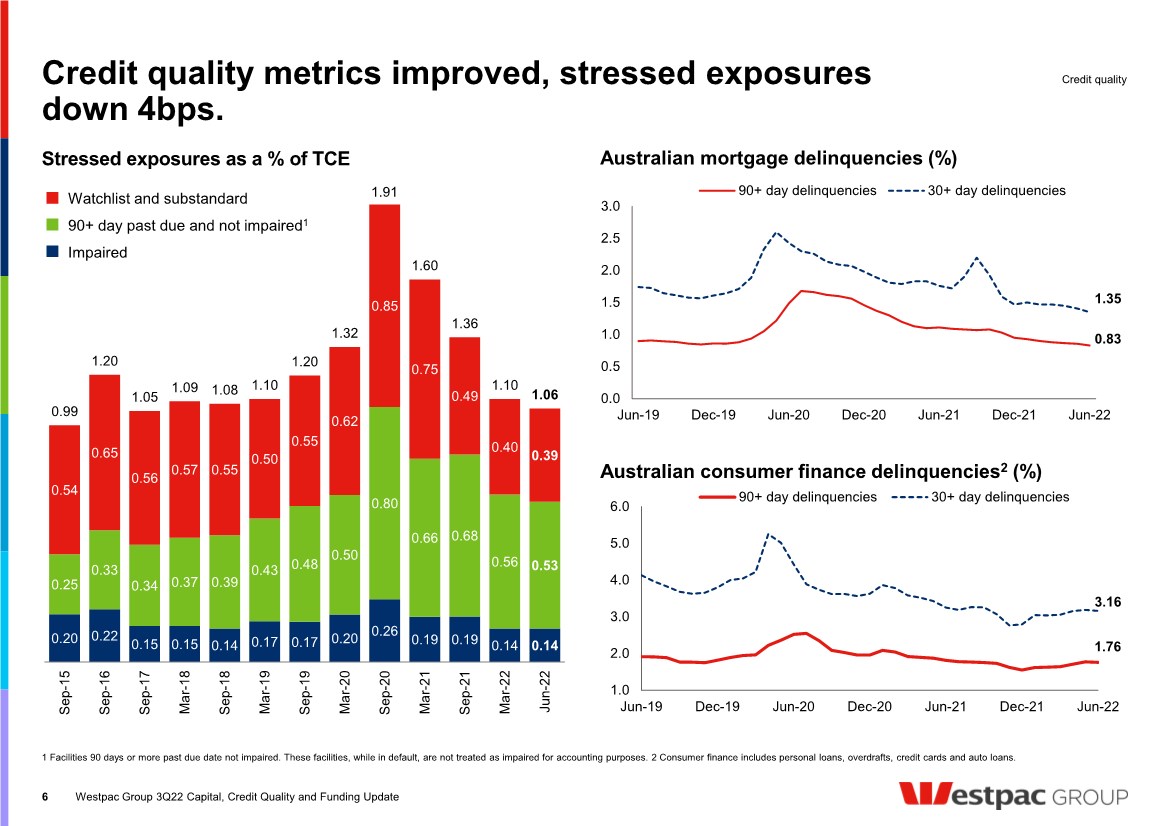
| Credit quality metrics improved, stressed exposures down 4bps. 6 1 Facilities 90 days or more past due date not impaired. These facilities, while in default, are not treated as impaired for accounting purposes. 2 Consumer finance includes personal loans, overdrafts, credit cards and auto loans. Credit quality Australian consumer finance delinquencies2 (%) Westpac Group 3Q22 Capital, Credit Quality and Funding Update Stressed exposures as a % of TCE Australian mortgage delinquencies (%) 0.20 0.22 0.15 0.15 0.14 0.17 0.17 0.20 0.26 0.19 0.19 0.14 0.14 0.25 0.33 0.34 0.37 0.39 0.43 0.48 0.50 0.80 0.66 0.68 0.56 0.53 0.54 0.65 0.56 0.57 0.55 0.50 0.55 0.62 0.85 0.75 0.49 0.40 0.39 0.99 1.20 1.05 1.09 1.08 1.10 1.20 1.32 1.91 1.60 1.36 1.10 1.06 Sep-15 Sep-16 Sep-17 Mar-18 Sep-18 Mar-19 Sep-19 Mar-20 Sep-20 Mar-21 Sep-21 Mar-22 Jun-22 Watchlist and substandard 90+ day past due and not impaired1 Impaired 0.83 1.35 0.0 0.5 1.0 1.5 2.0 2.5 3.0 Jun-19 Dec-19 Jun-20 Dec-20 Jun-21 Dec-21 Jun-22 90+ day delinquencies 30+ day delinquencies 1.76 3.16 1.0 2.0 3.0 4.0 5.0 6.0 Jun-19 Dec-19 Jun-20 Dec-20 Jun-21 Dec-21 Jun-22 90+ day delinquencies 30+ day delinquencies |
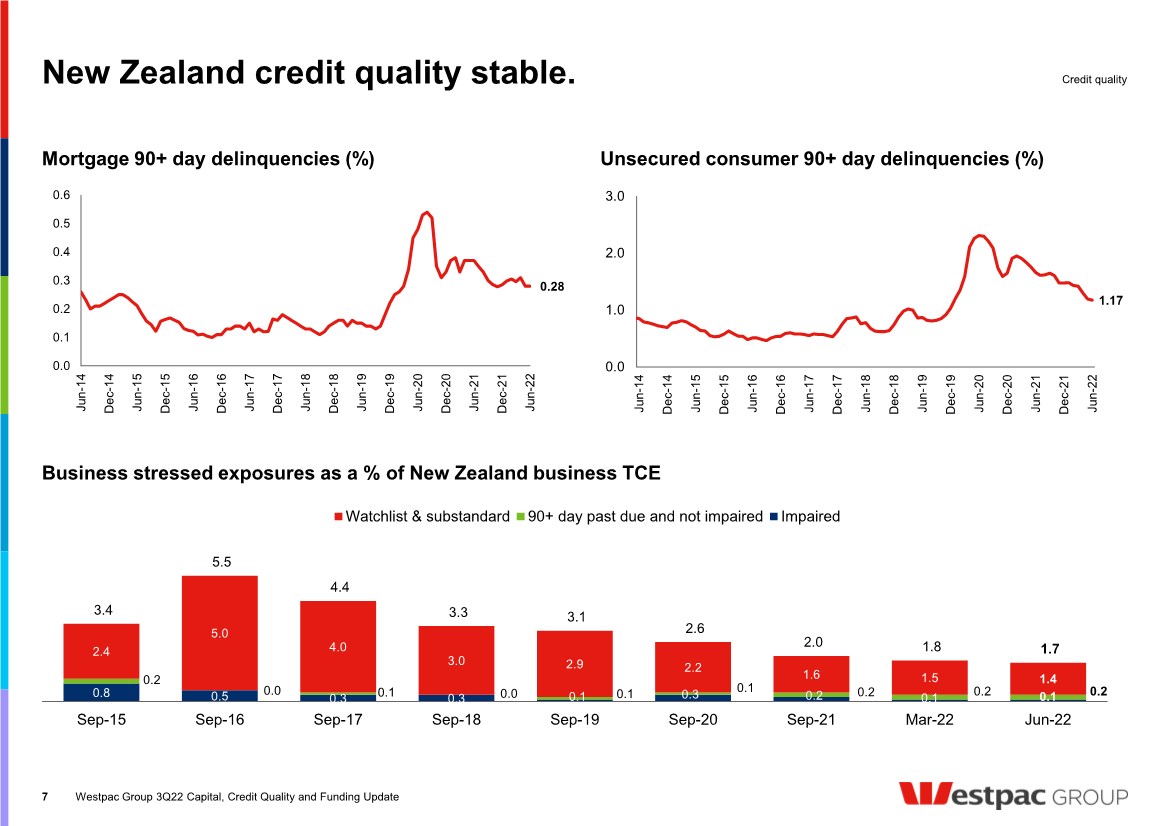
| New Zealand credit quality stable. Business stressed exposures as a % of New Zealand business TCE 7 Credit quality Westpac Group 3Q22 Capital, Credit Quality and Funding Update 0.28 0.0 0.1 0.2 0.3 0.4 0.5 0.6 Jun-14 Dec-14 Jun-15 Dec-15 Jun-16 Dec-16 Jun-17 Dec-17 Jun-18 Dec-18 Jun-19 Dec-19 Jun-20 Dec-20 Jun-21 Dec-21 Jun-22 Mortgage 90+ day delinquencies (%) Unsecured consumer 90+ day delinquencies (%) 1.17 0.0 1.0 2.0 3.0 Jun-14 Dec-14 Jun-15 Dec-15 Jun-16 Dec-16 Jun-17 Dec-17 Jun-18 Dec-18 Jun-19 Dec-19 Jun-20 Dec-20 Jun-21 Dec-21 Jun-22 0.8 0.5 0.3 0.3 0.1 0.3 0.2 0.1 0.1 0.2 0.0 0.1 0.0 0.1 0.1 0.2 0.2 0.2 2.4 5.0 4.0 3.0 2.9 2.2 1.6 1.5 1.4 3.4 5.5 4.4 3.3 3.1 2.6 2.0 1.8 1.7 Sep-15 Sep-16 Sep-17 Sep-18 Sep-19 Sep-20 Sep-21 Mar-22 Jun-22 Watchlist & substandard 90+ day past due and not impaired Impaired |
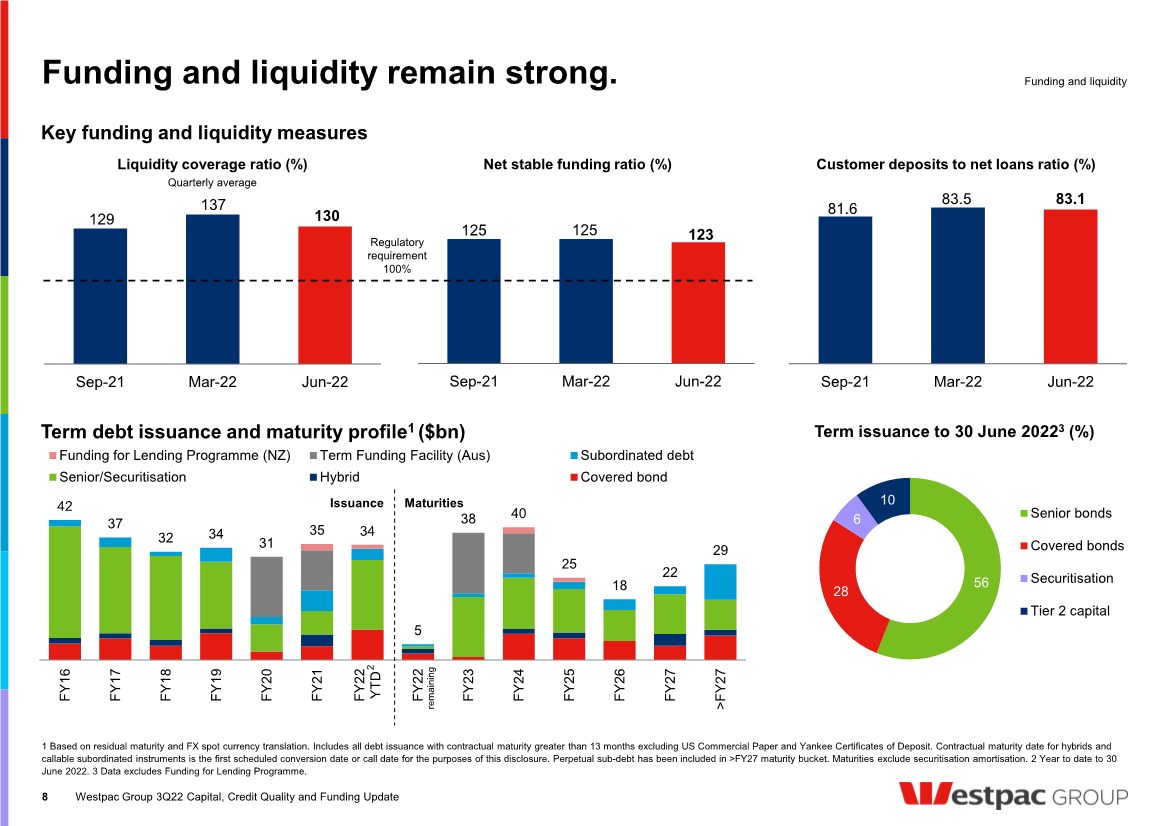
| 42 37 32 34 31 35 34 5 38 40 25 18 22 29 FY16 FY17 FY18 FY19 FY20 FY21 FY22 YTD FY22 FY23 FY24 FY25 FY26 FY27 >FY27 Funding for Lending Programme (NZ) Term Funding Facility (Aus) Subordinated debt Senior/Securitisation Hybrid Covered bond Funding and liquidity remain strong. Funding and liquidity 8 1 Based on residual maturity and FX spot currency translation. Includes all debt issuance with contractual maturity greater than 13 months excluding US Commercial Paper and Yankee Certificates of Deposit. Contractual maturity date for hybrids and callable subordinated instruments is the first scheduled conversion date or call date for the purposes of this disclosure. Perpetual sub-debt has been included in >FY27 maturity bucket. Maturities exclude securitisation amortisation. 2 Year to date to 30 June 2022. 3 Data excludes Funding for Lending Programme. Key funding and liquidity measures Westpac Group 3Q22 Capital, Credit Quality and Funding Update Term debt issuance and maturity profile1 ($bn) Issuance Maturities Term issuance to 30 June 20223 (%) remaining 129 137 130 Sep-21 Mar-22 Jun-22 81.6 83.5 83.1 Sep-21 Mar-22 Jun-22 Customer deposits to net loans ratio (%) Quarterly average 125 125 123 Sep-21 Mar-22 Jun-22 Net stable funding ratio (%) Liquidity coverage ratio (%) Regulatory requirement 100% 56 28 6 10 Senior bonds Covered bonds Securitisation Tier 2 capital 2 |
| For all shareholding enquiries relating to: • Address details and communication preferences • Updating bank account details, and participation in the dividend reinvestment plan Investor Relations Contact Share Registry Contact For all matters relating to Westpac’s strategy, performance and results 9 Contact us. Andrew Bowden General Manager Investor Relations Louise Coughlan Head of Ratings Agencies and Analysis Arthur Petratos Manager, Shareholder Services Rebecca Plackett Director, Corporate Reporting and ESG Andrea Jaehne Director, Ratings Agencies and Analysis Jacqueline Boddy Head of Debt Investor Relations Contact us [email protected] investorcentre.linkmarketservices.com.au 1800 804 255 [email protected] westpac.com.au/investorcentre +61 2 8253 3143 Investor Relations Team. James Wibberley Senior Analyst Investor Relations Westpac Group 3Q22 Capital, Credit Quality and Funding Update |

| Disclaimer. The material contained in this presentation is intended to be general background information on Westpac Banking Corporation (Westpac) and its activities. The information is supplied in summary form and is therefore not necessarily complete. It is not intended that it be relied upon as advice to investors or potential investors, who should consider seeking independent professional advice depending upon their specific investment objectives, financial situation or particular needs. The material contained in this presentation may include information derived from publicly available sources that have not been independently verified. No representation or warranty is made as to the accuracy, completeness or reliability of the information. All amounts are in Australian dollars unless otherwise indicated. Unless otherwise noted, financial information in this presentation is presented on a cash earnings basis. Cash earnings is a non-GAAP measure. Refer to Westpac’s 2022 Interim Financial Results (incorporating the requirements of Appendix 4D) for the six months ended 31 March 2022 available at www.westpac.com.au for details of the basis of preparation of cash earnings. Refer to Westpac’s 2022 Interim Financial Results Presentation and Investor Discussion Pack for an explanation of cash earnings and a reconciliation of reported net profit to cash earnings. This presentation contains statements that constitute “forward-looking statements” within the meaning of Section 21E of the US Securities Exchange Act of 1934. Forward-looking statements are statements about matters that are not historical facts. Forward-looking statements appear in a number of places in this presentation and include statements regarding our intent, belief or current expectations with respect to our business and operations, macro and micro economic and market conditions, results of operations and financial condition, including, without limitation, future loan loss provisions, financial support to certain borrowers, indicative drivers, forecasted economic indicators and performance metric outcomes. We use words such as ‘will’, ‘may’, ‘expect’, ‘indicative’, ‘intend’, ‘seek’, ‘would’, ‘should’, ‘could’, ‘continue’, ‘plan’, ‘estimate’, ‘anticipate’, ‘believe’, ‘probability’, ‘risk’, ‘aim’, ‘outlook’, ‘forecast’ or other similar words to identify forward-looking statements. These forward-looking statements reflect our current views with respect to future events and are subject to change, certain risks, uncertainties and assumptions which are, in many instances, beyond our control, and have been made based upon management’s expectations and beliefs concerning future developments and their potential effect upon us. There can be no assurance that future developments will be in accordance with our expectations or that the effect of future developments on us will be those anticipated. Actual results could differ materially from those which we expect, depending on the outcome of various factors. Factors that may impact on the forward-looking statements made include, but are not limited to, those described in the section titled ‘Risk factors' in Westpac’s 2022 Interim Financial Results (incorporating the requirements of Appendix 4D) for the six months ended 31 March 2022 available at www.westpac.com.au. When relying on forward-looking statements to make decisions with respect to us, investors and others should carefully consider such factors and other uncertainties and events. Except as required by law, we assume no obligation to update any forward-looking statements contained in this presentation, whether as a result of new information, future events or otherwise, after the date of this presentation. Disclaimer 10 Westpac Group 3Q22 Capital, Credit Quality and Funding Update |
Serious News for Serious Traders! Try StreetInsider.com Premium Free!
You May Also Be Interested In
- Phoenix Motor Strengthens Capital Structure by Negotiating Key Waiver with Note Holder
- Correction: DOVRE GROUP TRADING STATEMENT JANUARY 1 – MARCH 31, 2024
- PEP-Therapy and Institut Curie Announce First Patients Dosed in Phase Ib Clinical Trial Evaluating PEP-010 in Ovarian and Pancreatic Cancers
Create E-mail Alert Related Categories
SEC FilingsSign up for StreetInsider Free!
Receive full access to all new and archived articles, unlimited portfolio tracking, e-mail alerts, custom newswires and RSS feeds - and more!
