

Form 6-K SUMITOMO MITSUI FINANCIA For: May 14
 Tweet
Tweet Share
ShareTable of Contents
UNITED STATES SECURITIES AND EXCHANGE COMMISSION
Washington, D.C. 20549
FORM 6-K
REPORT OF FOREIGN PRIVATE ISSUER
PURSUANT TO RULE 13a-16 OR 15d-16 OF THE
SECURITIES EXCHANGE ACT OF 1934
For the month of May 2021
Commission File Number 001-34919
SUMITOMO MITSUI FINANCIAL GROUP, INC.
(Translation of registrant’s name into English)
1-2, Marunouchi 1-chome, Chiyoda-ku, Tokyo 100-0005, Japan
(Address of principal executive offices)
| Indicate by check mark whether the registrant files or will file annual reports under cover of Form 20-F or Form 40-F:
|
Form 20-F ☒ | Form 40-F ☐ | ||
| Indicate by check mark if the registrant is submitting the Form 6-K in paper as permitted by Regulation S-T Rule 101(b)(1): |
☐ |
| ||
| Indicate by check mark if the registrant is submitting the Form 6-K in paper as permitted by Regulation S-T Rule 101(b)(7): |
☐ |
| ||
| Indicate by check mark whether by furnishing the information contained in this Form, the registrant is also thereby furnishing the information to the Commission pursuant to Rule 12g3-2(b) under the Securities Exchange Act of 1934. |
Yes ☐ | No ☒ | ||
| *If ‘‘Yes’’ is marked, indicate below the file number assigned to the registrant in connection with Rule 12g3-2(b): |
82-________ |
| ||
Table of Contents
SIGNATURES
Pursuant to the requirements of the Securities Exchange Act of 1934, the registrant has duly caused this report to be signed on its behalf by the undersigned, thereunto duly authorized.
| Sumitomo Mitsui Financial Group, Inc. |
||||||
| By: |
/s/ Jun Okahashi |
|||||
| Name: Jun Okahashi |
||||||
| Title: General Manager, Financial Accounting Dept. |
||||||
Date: May 14, 2021
Table of Contents
Financial Results
Fiscal Year 3/2021
- Supplementary Information -
Sumitomo Mitsui Financial Group, Inc.
Table of Contents
Page
| Notes | 1. | Consolidated: Consolidated figures of Sumitomo Mitsui Financial Group, Inc. | ||||
| 2. | Non-consolidated: Non-consolidated figures of Sumitomo Mitsui Banking Corporation (“SMBC”) | |||||
This document contains “forward-looking statements” (as defined in the U.S. Private Securities Litigation Reform Act of 1995), regarding the intent, belief or current expectations of us and our managements with respect to our future financial condition and results of operations. In many cases but not all, these statements contain words such as “anticipate,” “believe,” “estimate,” “expect,” “intend,” “may,” “plan,” “probability,” “risk,” “project,” “should,” “seek,” “target,” “will” and similar expressions. Such forward-looking statements are not guarantees of future performance and involve risks and uncertainties, and actual results may differ from those expressed in or implied by such forward-looking statements contained or deemed to be contained herein. The risks and uncertainties which may affect future performance include: deterioration of Japanese and global economic conditions and financial markets; declines in the value of our securities portfolio; our ability to successfully implement our business strategy through our subsidiaries, affiliates and alliance partners; exposure to new risks as we expand the scope of our business; and incurrence of significant credit-related costs. Given these and other risks and uncertainties, you should not place undue reliance on forward-looking statements, which speak only as of the date of this document. We undertake no obligation to update or revise any forward-looking statements.
Please refer to our most recent disclosure documents such as our annual report on Form 20-F and other documents submitted to the U.S. Securities and Exchange Commission, as well as our earnings press releases, for a more detailed description of the risks and uncertainties that may affect our financial conditions and our operating results, and investors’ decisions.
Table of Contents
Sumitomo Mitsui Financial Group
| Consolidated | (Millions of yen) | |||||||||||
| FY3/2021 | FY3/2020 | |||||||||||
|
Change
| ||||||||||||
|
Consolidated gross profit |
1 | 2,806,187 | 37,600 | 2,768,587 | ||||||||
| Net interest income |
2 | 1,335,216 | 28,288 | 1,306,928 | ||||||||
| Trust fees |
3 | 4,895 | 194 | 4,701 | ||||||||
| Net fees and commissions |
4 | 1,094,021 | 10,671 | 1,083,350 | ||||||||
| Net trading income |
5 | 199,647 | (63,179) | 262,826 | ||||||||
| Net other operating income |
6 | 172,406 | 61,627 | 110,779 | ||||||||
| General and administrative expenses | 7 | (1,747,144) | (7,541) | (1,739,603) | ||||||||
| Equity in gains (losses) of affiliates | 8 | 24,972 | (31,079) | 56,051 | ||||||||
| Consolidated net business profit | 9 | 1,084,015 | (1,019) | 1,085,034 | ||||||||
| Total credit cost | 10 | (360,520) | (189,871) | (170,649) | ||||||||
| Credit costs |
11 | (373,371) | (190,307) | (183,064) | ||||||||
|
|
Write-off of loans |
12 | (117,415) | (12,108) | (105,307) | |||||||
| Provision for reserve for possible loan losses |
13 | (233,875) | (163,304) | (70,571) | ||||||||
| Others |
14 | (22,080) | (14,894) | (7,186) | ||||||||
| Recoveries of written-off claims |
15 | 12,850 | 436 | 12,414 | ||||||||
| Gains (losses) on stocks | 16 | 92,556 | 12,072 | 80,484 | ||||||||
| Other income (expenses) | 17 | (105,032) | (42,228) | (62,804) | ||||||||
| Ordinary profit | 18 | 711,018 | (221,046) | 932,064 | ||||||||
| Extraordinary gains (losses) | 19 | (38,781) | 4,637 | (43,418) | ||||||||
| Gains (losses) on disposal of fixed assets |
20 | 4,096 | 4,150 | (54) | ||||||||
| Losses on impairment of fixed assets |
21 | (42,525) | 22,581 | (65,106) | ||||||||
| Gains on step acquisitions |
22 | 404 | (21,636) | 22,040 | ||||||||
| Income before income taxes | 23 | 672,237 | (216,409) | 888,646 | ||||||||
| Income taxes - current | 24 | (225,523) | (11,997) | (213,526) | ||||||||
| Income taxes - deferred | 25 | 69,177 | 23,335 | 45,842 | ||||||||
| Profit | 26 | 515,890 | (205,072) | 720,962 | ||||||||
| Profit attributable to non-controlling interests | 27 | (3,077) | 14,001 | (17,078) | ||||||||
| Profit attributable to owners of parent | 28 | 512,812 | (191,071) | 703,883 | ||||||||
| Notes: | 1. Amounts less than 1 million yen are rounded down. Figures in parenthesis indicate the amount of loss or decrease. | |||||||||||
| 2. Consolidated gross profit = (Interest income - Interest expenses) + Trust fees + (Fees and commissions - Fees and commissions payments) + (Trading income - Trading losses) + (Other operating income - Other operating expenses) | ||||||||||||
| 3. The Company changed the recognition of installment-sales-related income and installment-sales-related expenses from the fiscal year ended March 31, 2021 and the change in accounting policies is applied retroactively for the year ended March 31, 2020. As a result, comparing before and after the retroactive application, Net interest income increased by 30,335 million yen, and Net other operating income decreased by 30,335 million yen. | ||||||||||||
| Number of consolidated subsidiaries and affiliates |
||||||||||||
| Mar. 31, 2021 | Mar. 31, 2020 | |||||||||||
|
Change
| ||||||||||||
| Consolidated subsidiaries |
29 | 177 | 3 | 174 | ||||||||
| Equity method affiliates |
30 | 98 | (3) | 101 | ||||||||
- 1 -
Table of Contents
Sumitomo Mitsui Financial Group
| SMBC non-consolidated | (Millions of yen) | |||||||||||
| FY3/2021 | FY3/2020 | |||||||||||
|
Change
| ||||||||||||
| Gross banking profit | 1 | 1,481,662 | 69,655 | 1,412,007 | ||||||||
| Gross domestic profit |
2 | 766,195 | 3,502 | 762,693 | ||||||||
| Net interest income |
3 | 583,507 | 21,829 | 561,678 | ||||||||
| Trust fees |
4 | 2,022 | (19) | 2,041 | ||||||||
| Net fees and commissions |
5 | 176,183 | (6,226) | 182,409 | ||||||||
| Net trading income |
6 | (352) | (1,466) | 1,114 | ||||||||
| Net other operating income |
7 | 4,835 | (10,614) | 15,449 | ||||||||
| Gains (losses) on bonds |
8 | 3,044 | 5,474 | (2,430) | ||||||||
| Gross international profit |
9 | 715,466 | 66,152 | 649,314 | ||||||||
| Net interest income |
10 | 352,855 | 36,442 | 316,413 | ||||||||
| Net fees and commissions |
11 | 154,555 | 13,638 | 140,917 | ||||||||
| Net trading income |
12 | 17,136 | (93,404) | 110,540 | ||||||||
| Net other operating income |
13 | 190,919 | 109,477 | 81,442 | ||||||||
| Gains (losses) on bonds |
14 | 76,938 | 304 | 76,634 | ||||||||
| Expenses (excluding non-recurring losses) | 15 | (816,488) | (8,436) | (808,052) | ||||||||
| Overhead ratio |
16 | 55.1% | (2.1%) | 57.2% | ||||||||
| Personnel expenses | 17 | (326,773) | (7,218) | (319,555) | ||||||||
| Non-personnel expenses | 18 | (439,914) | (1,632) | (438,282) | ||||||||
| Taxes | 19 | (49,801) | 413 | (50,214) | ||||||||
| Banking profit (before provision for general reserve for possible loan losses) |
20 | 665,173 | 61,218 | 603,955 | ||||||||
| Gains (losses) on bonds |
21 | 79,983 | 5,780 | 74,203 | ||||||||
| Core Banking Profit (20-21) |
22 | 585,189 | 55,437 | 529,752 | ||||||||
| excluding gains (losses) on cancellation of investment trusts |
23 | 551,401 | 45,616 | 505,785 | ||||||||
| Provision for general reserve for possible loan losses | 24 | (162,493) | (145,279) | (17,214) | ||||||||
| Banking profit | 25 | 502,679 | (84,062) | 586,741 | ||||||||
| Non-recurring gains (losses) | 26 | (66,617) | 36,179 | (102,796) | ||||||||
| Credit costs | 27 | (80,259) | (47,807) | (32,452) | ||||||||
| Gains on reversal of reserve for possible loan losses | 28 | - | - | - | ||||||||
| Recoveries of written-off claims | 29 | 21 | (1) | 22 | ||||||||
| Gains (losses) on stocks | 30 | 63,532 | 11,668 | 51,864 | ||||||||
| Other non-recurring gains (losses) | 31 | (49,911) | 72,320 | (122,231) | ||||||||
| Ordinary profit | 32 | 436,062 | (47,882) | 483,944 | ||||||||
| Extraordinary gains (losses) | 33 | (667) | 2,299 | (2,966) | ||||||||
|
|
Gains (losses) on disposal of fixed assets | 34 | 4,743 | 4,733 | 10 | |||||||
| Losses on impairment of fixed assets | 35 | (5,410) | (2,433) | (2,977) | ||||||||
| Income before income taxes | 36 | 435,394 | (45,583) | 480,977 | ||||||||
| Income taxes - current | 37 | (156,024) | 258 | (156,282) | ||||||||
| Income taxes - deferred | 38 | 58,666 | 65,979 | (7,313) | ||||||||
| Net income | 39 | 338,036 | 20,655 | 317,381 | ||||||||
| Total credit cost (24+27+28+29) | 40 | (242,731) | (193,088) | (49,643) | ||||||||
| Provision for general reserve for possible loan losses | 41 | (162,493) | (145,279) | (17,214) | ||||||||
| Write-off of loans | 42 | (21,424) | (1,625) | (19,799) | ||||||||
| Provision for specific reserve for possible loan losses | 43 | (44,551) | (36,834) | (7,717) | ||||||||
| Losses on sales of delinquent loans | 44 | (14,030) | (9,096) | (4,934) | ||||||||
| Provision for loan loss reserve for specific overseas countries | 45 | (253) | (253) | (0) | ||||||||
| Recoveries of written-off claims | 46 | 21 | (1) | 22 | ||||||||
Note: Amounts less than 1 million yen are rounded down. Figures in parenthesis indicate the amount of loss or decrease.
- 2 -
Table of Contents
Sumitomo Mitsui Financial Group
| SMBC non-consolidated | (%) | |||||||||||||
| FY3/2021 | Six months ended Sep. 30, 2020 |
Six months ended Mar. 31, 2021 |
FY3/2020 | |||||||||||
| Yield on interest earning assets (A) | 0.77 | 0.73 | 0.81 | 0.83 | ||||||||||
| Interest earned on loans and bills discounted (C) |
0.84 | 0.83 | 0.84 | 0.91 | ||||||||||
| Interest earned on securities |
0.74 | 0.60 | 0.85 | 0.91 | ||||||||||
| Total cost of funding (including expenses) (B) | 0.49 | 0.50 | 0.48 | 0.55 | ||||||||||
| Cost of interest bearing liabilities |
0.02 | 0.02 | 0.02 | 0.03 | ||||||||||
| Interest paid on deposits, etc. (D) |
0.00 | 0.00 | 0.00 | 0.00 | ||||||||||
| Interest paid on other liabilities |
0.13 | 0.15 | 0.11 | 0.19 | ||||||||||
| Expense ratio |
0.47 | 0.48 | 0.46 | 0.52 | ||||||||||
| Overall interest spread (A) - (B) | 0.28 | 0.23 | 0.33 | 0.28 | ||||||||||
| Interest spread (C) - (D) |
0.84 | 0.83 | 0.84 | 0.91 | ||||||||||
| Reference: After deducting loans to the Japanese government, etc. | ||||||||||||||
| Interest earned on loans and bills discounted (E) |
0.86 | 0.86 | 0.86 | 0.93 | ||||||||||
| Interest spread (E) - (D) |
0.86 | 0.86 | 0.86 | 0.93 | ||||||||||
3. Gains (losses) on securities
| SMBC non-consolidated | (Millions of yen) | |||||||
| FY3/2021 | FY3/2020 | |||||||
|
Change
| ||||||||
| Gains (losses) on bonds | 79,983 | 5,780 | 74,203 | |||||
| Gains on sales |
129,627 | 11,138 | 118,489 | |||||
| Losses on sales |
(49,427) | (29,687) | (19,740) | |||||
| Gains on redemption |
0 | 0 | 0 | |||||
| Losses on redemption |
(217) | 24,328 | (24,545) | |||||
| Losses on devaluation |
- | - | - | |||||
| Gains (losses) on stocks | 63,532 | 11,668 | 51,864 | |||||
| Gains on sales |
92,499 | (59,939) | 152,438 | |||||
| Losses on sales |
(6,693) | 21,903 | (28,596) | |||||
| Losses on devaluation |
(22,273) | 49,705 | (71,978) | |||||
- 3 -
Table of Contents
Sumitomo Mitsui Financial Group
4. Unrealized gains (losses) on securities
| Consolidated | (Millions of yen) | |||||||||||||||||||||||||
| Mar. 31, 2021 | Mar. 31, 2020 | |||||||||||||||||||||||||
| Balance sheet amount |
Net unrealized gains (losses)
|
Balance sheet amount |
Net unrealized gains (losses) (b) | |||||||||||||||||||||||
| (a) | (a) - (b) | Gains | Losses | |||||||||||||||||||||||
| Held-to-maturity securities |
1 | 22,300 | (60) | (200) | 1 | 61 | 282,379 | 140 | ||||||||||||||||||
| Other securities |
2 | 36,411,230 | 2,931,830 | 1,039,501 | 3,110,073 | 178,243 | 26,649,206 | 1,892,329 | ||||||||||||||||||
| Stocks |
3 | 3,693,283 | 2,255,637 | 986,074 | 2,282,673 | 27,035 | 2,736,807 | 1,269,563 | ||||||||||||||||||
| Bonds |
4 | 17,655,237 | 8,032 | (13,485) | 29,657 | 21,624 | 10,067,396 | 21,517 | ||||||||||||||||||
| Japanese government bonds | 5 | 14,293,610 | (14,074) | (6,946) | 2,132 | 16,206 | 7,087,934 | (7,128) | ||||||||||||||||||
| Others |
6 | 15,062,708 | 668,159 | 66,911 | 797,741 | 129,582 | 13,845,002 | 601,248 | ||||||||||||||||||
| Foreign bonds | 7 | 12,110,092 | 1,342 | (254,340) | 122,199 | 120,856 | 11,649,523 | 255,682 | ||||||||||||||||||
| Other money held in trust |
8 | 309 | - | - | - | - | 353 | - | ||||||||||||||||||
| Total |
9 | 36,433,840 | 2,931,769 | 1,039,300 | 3,110,074 | 178,304 | 26,931,938 | 1,892,469 | ||||||||||||||||||
| Stocks |
10 | 3,693,283 | 2,255,637 | 986,074 | 2,282,673 | 27,035 | 2,736,807 | 1,269,563 | ||||||||||||||||||
| Bonds |
11 | 17,677,537 | 7,972 | (13,685) | 29,659 | 21,686 | 10,349,775 | 21,657 | ||||||||||||||||||
| Others |
12 | 15,063,018 | 668,159 | 66,911 | 797,741 | 129,582 | 13,845,355 | 601,248 | ||||||||||||||||||
| SMBC non-consolidated | (Millions of yen) | |||||||||||||||||||||||||
| Mar. 31, 2021 | Mar. 31, 2020 | |||||||||||||||||||||||||
| Balance sheet amount |
Net unrealized gains (losses)
|
Balance sheet amount |
Net unrealized gains (losses) (b) | |||||||||||||||||||||||
| (a) | (a) - (b) | Gains | Losses | |||||||||||||||||||||||
| Held-to-maturity securities |
13 | 22,300 | (60) | 6 | 1 | 61 | 22,300 | (66) | ||||||||||||||||||
| Stocks of subsidiaries and affiliates |
14 | 4,239,133 | (120,169) | 6,671 | 761 | 120,930 | 4,182,047 | (126,840) | ||||||||||||||||||
| Other securities |
15 | 33,009,866 | 2,393,102 | 936,951 | 2,562,302 | 169,199 | 23,541,406 | 1,456,151 | ||||||||||||||||||
| Stocks |
16 | 3,509,647 | 2,174,744 | 964,002 | 2,200,430 | 25,685 | 2,576,557 | 1,210,742 | ||||||||||||||||||
| Bonds |
17 | 17,571,190 | 7,915 | (13,530) | 29,531 | 21,615 | 9,978,420 | 21,445 | ||||||||||||||||||
| Japanese government bonds | 18 | 14,288,609 | (14,074) | (6,947) | 2,132 | 16,206 | 7,083,933 | (7,127) | ||||||||||||||||||
| Others |
19 | 11,929,029 | 210,442 | (13,522) | 332,341 | 121,898 | 10,986,427 | 223,964 | ||||||||||||||||||
| Foreign bonds | 20 | 9,516,268 | (40,681) | (224,034) | 72,768 | 113,449 | 9,253,087 | 183,353 | ||||||||||||||||||
| Total |
21 | 37,271,300 | 2,272,873 | 943,628 | 2,563,065 | 290,192 | 27,745,753 | 1,329,245 | ||||||||||||||||||
| Stocks |
22 | 3,972,906 | 2,175,506 | 964,347 | 2,201,191 | 25,685 | 3,057,077 | 1,211,159 | ||||||||||||||||||
| Bonds |
23 | 17,593,490 | 7,855 | (13,523) | 29,532 | 21,677 | 10,000,720 | 21,378 | ||||||||||||||||||
| Others |
24 | 15,704,903 | 89,512 | (7,195) | 332,341 | 242,828 | 14,687,955 | 96,707 | ||||||||||||||||||
| Notes | 1. | The figures above include negotiable certificates of deposit in “Cash and due from banks” and beneficiary claims on loan trust in “Monetary claims bought.” | ||
| 2. | “Accounting Standard for Fair Value Measurement” (ASBJ Statement No.30) and “Implementation Guidance on Accounting Standard for Fair Value Measurement” (ASBJ Guidance No.31) are applied from the fiscal year ending March 31, 2021. | |||
| Due to the application, the net unrealized gains (losses) for the year ended March 31, 2021 are measured based on market prices of the securities as of the balance sheet date. For the year ended March 31,2020, stocks within Other securities and foreign stocks within Others of Other securities are measured at the average market price during the final month of the period. The rest of the securities are measured at market prices as of the balance sheet date. | ||||
| 3. | Other securities and Other money held in trust are measured at market prices. Unrealized gains (losses) indicate the difference between the acquisition costs (or amortized costs) and the balance sheet amounts. | |||
| Net unrealized gains (losses) on Other securities include gains (losses) which are recognized in the statements of income by applying fair value hedge accounting and accordingly not recorded directly to Net assets. Gains of 399 million yen and losses of 26,403 million yen were recognized in the statements of income for the year ended March 31, 2021 and for the year ended March 31, 2020, respectively. | ||||
- 4 -
Table of Contents
Sumitomo Mitsui Financial Group
5. Balance of securities, classified by maturity
Balance of other securities with maturities and bonds of held-to-maturity
| SMBC non-consolidated
|
|
|
(Billions of yen)
| |||||||||||||||||||||||||||||||||||||
| Mar. 31, 2021 | Mar. 31, 2020 | |||||||||||||||||||||||||||||||||||||||
| 1 year or less |
More than 1 year to 5 years |
More than 5 years to 10 years |
More than 10 years |
Total | 1 year or less |
More than 1 year to 5 years |
More than 5 years to 10 years |
More than 10 years |
Total | |||||||||||||||||||||||||||||||
| Bonds | 6,078.0 | 8,260.0 | 2,411.8 | 843.6 | 17,593.5 | 3,550.4 | 4,044.1 | 1,411.0 | 995.2 | 10,000.7 | ||||||||||||||||||||||||||||||
| Japanese government bonds |
5,896.8 | 6,671.5 | 1,418.5 | 301.8 | 14,288.6 | 3,387.3 | 2,790.5 | 454.7 | 451.4 | 7,083.9 | ||||||||||||||||||||||||||||||
| Japanese local government bonds |
7.2 | 206.7 | 528.9 | 12.2 | 754.9 | 2.9 | 45.0 | 202.0 | 12.8 | 262.7 | ||||||||||||||||||||||||||||||
| Japanese corporate bonds |
174.1 | 1,381.9 | 464.4 | 529.6 | 2,550.0 | 160.2 | 1,208.6 | 754.3 | 531.1 | 2,654.1 | ||||||||||||||||||||||||||||||
| Others | 2,128.4 | 3,818.5 | 1,863.0 | 2,363.2 | 10,173.1 | 2,209.7 | 2,259.6 | 1,814.0 | 3,395.6 | 9,678.9 | ||||||||||||||||||||||||||||||
| Total | 8,206.4 | 12,078.5 | 4,274.8 | 3,206.8 | 27,766.6 | 5,760.1 | 6,303.7 | 3,225.0 | 4,390.8 | 19,679.6 | ||||||||||||||||||||||||||||||
6. Notional amount of interest rate swaps (under deferred hedge accounting), classified by remaining maturity
| SMBC non-consolidated
|
(Billions of yen)
| |||||||||||||||||
| Mar. 31, 2021 | Mar. 31, 2020 | |||||||||||||||||
| 1 year or less |
More than 1 year to 5 years |
More than 5 years |
Total | 1 year or less |
More than 1 year to 5 years |
More than 5 years |
Total | |||||||||||
| Receivable fixed rate / payable floating rate |
6,047.3 | 17,230.0 | 8,448.7 | 31,726.0 | 7,637.8 | 17,653.2 | 11,127.3 | 36,418.4 | ||||||||||
| Receivable floating rate / payable fixed rate |
959.1 | 4,338.3 | 6,305.1 | 11,602.5 | 1,074.1 | 5,445.7 | 8,028.4 | 14,548.1 | ||||||||||
|
Total |
7,006.3 | 21,568.3 | 14,753.8 | 43,328.5 | 8,711.9 | 23,098.9 | 19,155.7 | 50,966.5 | ||||||||||
- 5 -
Table of Contents
Sumitomo Mitsui Financial Group
7. Employee retirement benefits
Consolidated
(1) Projected benefit obligation
| (Millions of yen) | ||||||||||
| Mar. 31, 2021 | Mar. 31, 2020 | |||||||||
|
Change
| ||||||||||
| Fair value of plan assets | (A) | 1,627,741 | 308,966 | 1,318,775 | ||||||
| Projected benefit obligation | (B) | 1,097,541 | (26,438) | 1,123,979 | ||||||
| Net surplus (deficit) | (A-B) | 530,200 | 335,405 | 194,795 | ||||||
| Net defined benefit asset |
565,534 | 334,961 | 230,573 | |||||||
| Net defined benefit liability |
35,334 | (443) | 35,777 | |||||||
| Measurements of defined benefit plans (before tax effect deduction) | (185,025) | (313,110) | 128,085 | |||||||
| Unrecognized prior service cost (deductible from the obligation) |
(21,653) | (21,494) | (159) | |||||||
| Unrecognized net actuarial gain (loss) |
(163,372) | (291,617) | 128,245 | |||||||
|
(2) Retirement benefit expenses
| ||||||||||
| (Millions of yen) | ||||||||||
| FY3/2021 | FY3/2020 | |||||||||
|
Change
| ||||||||||
| Retirement benefit expenses | 18,237 | (4,747) | 22,984 | |||||||
|
SMBC non-consolidated
| ||||||||||
| (1) Projected benefit obligation | ||||||||||
| (Millions of yen) | ||||||||||
| Mar. 31, 2021 | Mar. 31, 2020 | |||||||||
|
Change
| ||||||||||
| Projected benefit obligation | (A) | 949,274 | (35,825) | 985,099 | ||||||
| <Discount rate> | <0.42%> | <0.14%> | <0.28%> | |||||||
| Fair value of plan assets |
(B) | 1,504,648 | 299,342 | 1,205,306 | ||||||
| Reserve for employee retirement benefits |
(C) | - | - | - | ||||||
| Prepaid pension cost |
(D) | 366,298 | 21,817 | 344,481 | ||||||
| Unrecognized prior service cost (deductible from the obligation) | (E) | (21,652) | (21,652) | - | ||||||
| Unrecognized net actuarial gain (loss) |
(A-B-C+D-E) | (167,423) | (291,696) | 124,273 | ||||||
|
(2) Retirement benefit expenses
| ||||||||||
| (Millions of yen) | ||||||||||
| FY3/2021 | FY3/2020 | |||||||||
|
Change
| ||||||||||
| Retirement benefit expenses | 2,303 | (1,944) | 4,247 | |||||||
| Service cost |
23,147 | (5,744) | 28,891 | |||||||
| Interest cost on projected benefit obligation |
3,011 | 250 | 2,761 | |||||||
| Expected returns on plan assets |
(37,022) | 2,922 | (39,944) | |||||||
| Amortization of unrecognized prior service cost |
(2,209) | (2,209) | - | |||||||
| Amortization of unrecognized net actuarial gain (loss) |
8,552 | 4,777 | 3,775 | |||||||
| Others |
6,824 | (1,940) | 8,764 | |||||||
- 6 -
Table of Contents
Sumitomo Mitsui Financial Group
8. Classification based on self-assessment and the Financial Reconstruction Act,
and write-offs / reserves
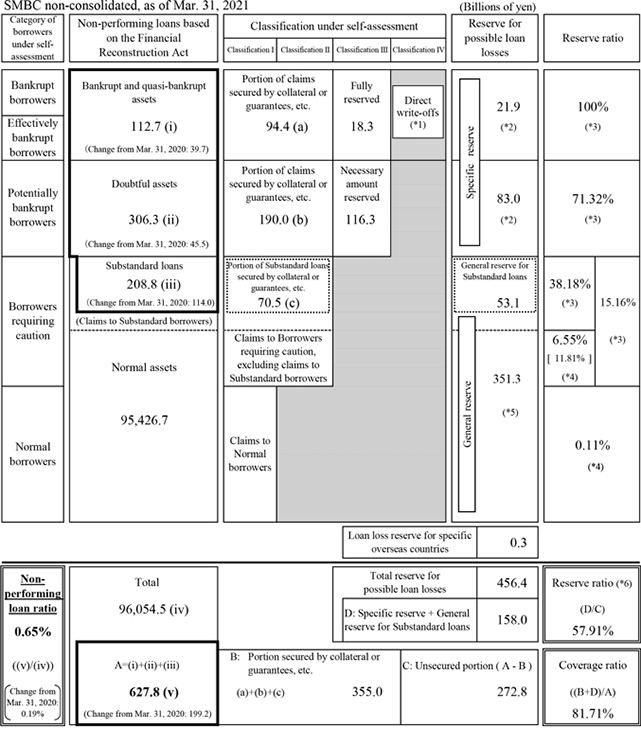
| *1 | Includes direct reduction of 115.3 billion yen. | |
| *2 | Includes reserve for assets that are not subject to disclosure based on the Financial Reconstruction Act standards. (Bankrupt/Effectively bankrupt borrowers: 3.6 billion yen, Potentially bankrupt borrowers: 2.5 billion yen) | |
| *3 | Reserve ratios for claims on Bankrupt borrowers, Effectively bankrupt borrowers, Potentially bankrupt borrowers, Substandard borrowers and Borrowers requiring caution including Substandard borrowers are the proportion of the reserve for possible loan losses to each category’s total claims, excluding the portion secured by collateral or guarantees, etc. | |
| *4 | Reserve ratios for claims on Normal borrowers and Borrowers requiring caution (excluding claims to Substandard borrowers) are the proportion of the reserve for possible loan losses to the respective claims of each category. | |
| The reserve ratio for unsecured claims on Borrowers requiring caution (excluding claims to Substandard borrowers) is shown in [ ]. | ||
| *5 | Includes Specific reserve for Borrowers requiring caution totaling 0.2 billion yen. | |
| *6 | The proportion of the reserve to the claims, excluding the portion secured by collateral or guarantees, etc. |
- 7 -
Table of Contents
Sumitomo Mitsui Financial Group
| SMBC non-consolidated | (Millions of yen, %) | |||||||||||
| Mar. 31, 2021 | Mar. 31, 2020 | |||||||||||
| (a) | Reserve Ratio (b) |
(a) - (c) | (c) |
Reserve Ratio (d) | ||||||||
| Reserve for possible loan losses | 456,405 | 74.70 | 176,703 | 279,702 | 67.66 | |||||||
| General reserve |
351,065 | 162,493 | 188,572 | |||||||||
| Specific reserve |
105,084 | 13,956 | 91,128 | |||||||||
| Loan loss reserve for specific overseas countries | 254 | 254 | 0 | |||||||||
| Amount of direct reduction | 115,282 | 19,872 | 95,410 | |||||||||
Note: Reserve ratio: Reserve for possible loan losses / Risk-monitored loans. After direct reduction.
- 8 -
Table of Contents
Sumitomo Mitsui Financial Group
11. Non-performing loans (NPLs) based on the Financial Reconstruction Act and coverage
| Consolidated | (Millions of yen, %) | |||||||
| Mar. 31, 2021 (a) |
Mar. 31, 2020 (b) | |||||||
| (a) - (b) | ||||||||
| Bankrupt and quasi-bankrupt assets |
128,112 | 40,255 | 87,857 | |||||
| Doubtful assets |
392,161 | 65,278 | 326,883 | |||||
| Substandard loans |
446,246 | 210,707 | 235,539 | |||||
| Total (A) | 966,520 | 316,240 | 650,280 | |||||
| Normal assets |
98,159,165 | 2,885,970 | 95,273,195 | |||||
| Grand total (B) |
99,125,686 | 3,202,210 | 95,923,476 | |||||
| NPL ratio (A/B) | 0.98 | 0.30 | 0.68 | |||||
| (Millions of yen) | ||||||||
| Mar. 31, 2021 (a) |
Mar. 31, 2020 (b) | |||||||
| (a) - (b) | ||||||||
|
Total coverage (C) |
640,380 | 173,895 | 466,485 | |||||
| Reserve for possible loan losses (D) |
212,588 | 59,586 | 153,002 | |||||
| Amount recoverable by guarantees, collateral and others (E) |
427,791 | 114,308 | 313,483 | |||||
| (%) | ||||||||
| Coverage ratio (C) / (A) | 66.26 | (5.48) | 71.74 | |||||
| Coverage ratio calculated with total reserve for possible loan losses included in the numerator |
112.45 | (9.45) | 121.90 | |||||
| (%) | ||||||||
| Reserve ratio to unsecured assets (D) / (A - E) | 39.46 | (5.97) | 45.43 | |||||
| Reserve ratio calculated with total reserve for possible loan losses included in the numerator |
122.33 | (19.95) | 142.28 | |||||
| SMBC non-consolidated | (Millions of yen, %) | |||||||
| Mar. 31, 2021 (a) |
Mar. 31, 2020 (b) | |||||||
| (a) - (b) | ||||||||
| Bankrupt and quasi-bankrupt assets |
112,697 | 39,721 | 72,976 | |||||
| Doubtful assets |
306,336 | 45,503 | 260,833 | |||||
| Substandard loans |
208,761 | 113,954 | 94,807 | |||||
|
Total (A) |
627,795 | 199,178 | 428,617 | |||||
| Normal assets |
95,426,746 | 2,629,356 | 92,797,390 | |||||
| Grand total (B) |
96,054,542 | 2,828,535 | 93,226,007 | |||||
|
NPL ratio (A/B) |
0.65 | 0.19 | 0.46 | |||||
| Note: NPLs based on the Financial Reconstruction Act include loans, acceptances and guarantees, suspense payments, and other credit-type assets. | ||||||||
| (Millions of yen) | ||||||||
| Mar. 31, 2021 (a) |
Mar. 31, 2020 (b) | |||||||
| (a) - (b) | ||||||||
| Total coverage (C) | 512,960 | 140,075 | 372,885 | |||||
| Reserve for possible loan losses* (D) |
157,991 | 45,787 | 112,204 | |||||
| Amount recoverable by guarantees, collateral and others (E) |
354,969 | 94,288 | 260,681 | |||||
| * Sum of general reserve for substandard loans and specific reserve | ||||||||
| (%) | ||||||||
| Coverage ratio (C) / (A) | 81.71 | (5.29) | 87.00 | |||||
| Coverage ratio calculated with total reserve for possible loan losses included in the numerator |
129.24 | 3.16 | 126.08 | |||||
| (%) | ||||||||
| Reserve ratio to unsecured assets (D) / (A - E) | 57.91 | (8.90) | 66.81 | |||||
| Reserve ratio calculated with total reserve for possible loan losses included in the numerator |
167.29 | 0.74 | 166.55 | |||||
- 9 -
Table of Contents
Sumitomo Mitsui Financial Group
12. Results of off-balancing of NPLs
SMBC non-consolidated
(Billions of yen)
|
Mar. 31, 2021 (a) |
Mar. 31, 2020 (b) | |||||||||||||||||
|
(a) - (b) |
NPLs newly classified during FY3/2021 |
Amount of off-balancing | ||||||||||||||||
|
|
Bankrupt and quasi-bankrupt assets
|
|
112.7 | 39.7 | 66.6 | (26.9) | 73.0 | |||||||||||
|
Doubtful assets
|
|
306.3 | 45.5 | 186.7 | (141.2) | 260.8 | ||||||||||||
|
Total
|
419.0 | 85.2 | (*1) 253.3 | (*1) (168.0) | 333.8 | |||||||||||||
| Result of measures connected to off-balancing (*2) | 96.5 | 38.5 | ||||||||||||||||
| |
Breakdown of off-balancing by factor (*3) |
|
Disposition by borrowers’ liquidation
|
(2.2)
|
||||||||||||||
|
Reconstructive disposition
|
(1.1)
|
|||||||||||||||||
| Improvement in debtors’ performance due to reconstructive disposition |
— |
|||||||||||||||||
|
Loan sales to market
|
(45.1)
|
|||||||||||||||||
|
Direct write-offs
|
(3.4)
|
|||||||||||||||||
|
Others
|
(116.2)
|
|||||||||||||||||
|
Collection / repayment, etc. |
(93.0)
|
|||||||||||||||||
| Improvement in debtors’ performance | (23.2) | |||||||||||||||||
|
Total
|
(168.0)
|
|||||||||||||||||
| *1 |
The amount of NPLs newly classified during the six months ended Sep. 30, 2020 and off-balanced in the six months ended Mar. 31, 2021 was 29.8 billion yen. | |||
| *2 |
The measures connected to off-balancing are legal reorganizations and other similar measures, corporate splits to good companies and bad companies, partial direct write-offs of retail exposure to individuals and small- and medium-sized enterprises, and trusts to RCC for the purpose of revitalization which is scheduled to be off-balanced before the maturity. | |||
| *3 |
1. | “Disposition by borrowers’ liquidation” refers to abandonment or write-off of loans involved in bankruptcy liquidation proceedings (bankruptcy or special liquidations). | ||
| 2. | “Reconstructive disposition” refers to abandonment of loans involved in reconstructive bankruptcy proceedings (corporate reorganization and civil rehabilitation), debt forgiveness involved in special mediation or other types of civil mediation, or debt forgiveness for restructuring involved in private reorganization. | |||
- 10 -
Table of Contents
Sumitomo Mitsui Financial Group
13. Loan portfolio, classified by industry
SMBC non-consolidated
| (1) Loans and bills discounted, classified by industry | (Millions of yen, %) |
| Mar. 31, 2021
|
Mar. 31, 2020
|
|||||||||||||||
| (a) | Ratio | (a) - (b) | (b) | Ratio | ||||||||||||
| Domestic offices (excluding Japan offshore banking accounts) |
56,909,430 | 100.0 | 2,296,102 | 54,613,328 | 100.0 | |||||||||||
| Manufacturing | 8,523,121 | 15.0 | 1,330,035 | 7,193,086 | 13.2 | |||||||||||
| Agriculture, forestry, fisheries and mining | 262,451 | 0.5 | 4,960 | 257,491 | 0.5 | |||||||||||
| Construction | 735,840 | 1.3 | (17,376) | 753,216 | 1.4 | |||||||||||
| Transportation, communications and public enterprises | 5,297,336 | 9.3 | 169,155 | 5,128,181 | 9.4 | |||||||||||
| Wholesale and retail | 5,061,401 | 8.9 | 676,103 | 4,385,298 | 8.0 | |||||||||||
| Finance and insurance | 6,613,461 | 11.6 | (516,815) | 7,130,276 | 13.1 | |||||||||||
| Real estate | 8,026,779 | 14.1 | 405,664 | 7,621,115 | 13.9 | |||||||||||
| Goods rental and leasing | 2,302,189 | 4.0 | 721,480 | 1,580,709 | 2.9 | |||||||||||
| Various services | 4,795,440 | 8.4 | 516,319 | 4,279,121 | 7.8 | |||||||||||
| Municipalities | 546,849 | 1.0 | (237,424) | 784,273 | 1.4 | |||||||||||
| Others | 14,744,557 | 25.9 | (756,000) | 15,500,557 | 28.4 | |||||||||||
| Overseas offices and Japan offshore banking accounts | 25,028,295 | 100.0 | (545,759) | 25,574,054 | 100.0 | |||||||||||
| Public sector | 132,216 | 0.5 | (42,081) | 174,297 | 0.7 | |||||||||||
| Financial institutions | 1,997,239 | 8.0 | 67,675 | 1,929,564 | 7.5 | |||||||||||
| Commerce and industry | 20,938,451 | 83.7 | (547,224) | 21,485,675 | 84.0 | |||||||||||
| Others | 1,960,387 | 7.8 | (24,130) | 1,984,517 | 7.8 | |||||||||||
|
Total |
81,937,725 | - | 1,750,343 | 80,187,382 | - | |||||||||||
| Risk-monitored loans | (Millions of yen, %) | |||||||||||||||
| Mar. 31, 2021
|
Mar. 31, 2020
|
|||||||||||||||
| (a) | Ratio | (a) - (b) | (b) | Ratio | ||||||||||||
| Domestic offices (excluding Japan offshore banking accounts) |
380,614 | 100.0 | 79,406 | 301,208 | 100.0 | |||||||||||
| Manufacturing | 62,502 | 16.4 | 16,801 | 45,701 | 15.2 | |||||||||||
| Agriculture, forestry, fisheries and mining | 1,739 | 0.5 | 107 | 1,632 | 0.5 | |||||||||||
| Construction | 8,066 | 2.1 | (1,896) | 9,962 | 3.3 | |||||||||||
| Transportation, communications and public enterprises | 22,646 | 6.0 | (16,662) | 39,308 | 13.1 | |||||||||||
| Wholesale and retail | 70,405 | 18.5 | 5,168 | 65,237 | 21.7 | |||||||||||
| Finance and insurance | 6,547 | 1.7 | 1,289 | 5,258 | 1.7 | |||||||||||
| Real estate | 38,936 | 10.2 | 5,641 | 33,295 | 11.1 | |||||||||||
| Goods rental and leasing | 849 | 0.2 | 548 | 301 | 0.1 | |||||||||||
| Various services | 124,679 | 32.8 | 69,801 | 54,878 | 18.2 | |||||||||||
| Municipalities | - | - | - | - | - | |||||||||||
| Others | 44,239 | 11.6 | (1,392) | 45,631 | 15.1 | |||||||||||
| Overseas offices and Japan offshore banking accounts | 230,337 | 100.0 | 118,173 | 112,164 | 100.0 | |||||||||||
| Public sector | - | - | - | - | - | |||||||||||
| Financial institutions | - | - | - | - | - | |||||||||||
| Commerce and industry | 207,274 | 90.0 | 149,330 | 57,944 | 51.7 | |||||||||||
| Others | 23,062 | 10.0 | (31,158) | 54,220 | 48.3 | |||||||||||
| Total |
610,952 | - | 197,580 | 413,372 | - | |||||||||||
- 11 -
Table of Contents
Sumitomo Mitsui Financial Group
(2) NPLs based on the Financial Reconstruction Act classified by industry, and reserve ratio
| (Millions of yen, %) | ||||||||||
| Mar. 31, 2021 | Mar. 31, 2020 | |||||||||
|
(a)
|
Reserve ratio |
(a) - (b)
|
(b)
| |||||||
| Domestic offices |
390,325 | 65.0 | 82,852 | 307,473 | ||||||
| Manufacturing |
66,150 | 72.1 | 18,073 | 48,077 | ||||||
|
|
Agriculture, forestry, fisheries and mining |
3,720 | 59.2 | 1,387 | 2,333 | |||||
| Construction |
8,245 | 56.4 | (1,940) | 10,185 | ||||||
| Transportation, communications and public enterprises |
23,297 | 76.4 | (16,169) | 39,466 | ||||||
| Wholesale and retail |
71,373 | 64.6 | 5,461 | 65,912 | ||||||
| Finance and insurance |
6,640 | 62.3 | 1,268 | 5,372 | ||||||
| Real estate |
40,501 | 62.6 | 5,757 | 34,744 | ||||||
| Goods rental and leasing |
849 | 59.2 | 548 | 301 | ||||||
| Various services |
125,182 | 51.8 | 69,931 | 55,251 | ||||||
| Municipalities |
- | - | - | - | ||||||
| Others |
44,362 | 100.0 | (1,466) | 45,828 | ||||||
| Overseas offices and Japan offshore banking accounts |
237,470 | 50.1 | 116,326 | 121,144 | ||||||
| Public sector |
- | - | - | - | ||||||
| Financial institutions |
- | - | - | - | ||||||
| Commerce and industry |
214,092 | 50.4 | 147,954 | 66,138 | ||||||
| Others |
23,378 | 42.6 | (31,627) | 55,005 | ||||||
|
Total
|
627,795
|
57.9
|
199,178
|
428,617
| ||||||
| Notes | 1. | NPLs based on the Financial Reconstruction Act include loans, acceptances and guarantees, suspense payments, and other credit-type assets. | ||
| 2. | Reserve ratio = (Reserve for possible loan losses) / (Assets excluding amounts recoverable due to guarantees, collateral and others) X 100
Reserve for possible loan losses is sum of general reserve for substandard loans and specific reserve. | |||
(3) Consumer loans outstanding
| (Millions of yen) | ||||||||||
| Mar. 31, 2021 | Mar. 31, 2020 | |||||||||
|
(a)
|
(a) - (b)
|
(b)
| ||||||||
| Consumer loans | 12,002,500 | (424,501) | 12,427,001 | |||||||
|
|
Housing loans |
11,239,293 | (344,537) | 11,583,830 | ||||||
|
|
Self-residential purpose |
9,081,691 | (185,787) | 9,267,478 | ||||||
|
|
Other consumer loans |
763,207 | (79,964) | 843,171 | ||||||
(4) Loans to small- and medium-sized enterprises, etc.
| (Millions of yen, %) | ||||||||||
| Mar. 31, 2021 | Mar. 31, 2020 | |||||||||
|
(a)
|
(a) - (b)
|
(b)
| ||||||||
| Outstanding balance | 33,528,406 | 433,373 | 33,095,033 | |||||||
| Ratio to total loans | 58.9 | (1.7) | 60.6 | |||||||
Note: Outstanding balance includes loans to individuals.
- 12 -
Table of Contents
Sumitomo Mitsui Financial Group
14. Loan portfolio, classified by country
SMBC non-consolidated
(1) Loans outstanding, classified by major domicile
(Millions of yen, %)
|
|
Mar. 31, 2021
|
|
|
Mar. 31, 2020
|
|
|||||||||||||
|
|
(a)
|
|
Ratio
|
|
(a) - (b)
|
|
|
(b)
|
|
Ratio
| ||||||||
| Asia | 7,104,536 | 29.2 | 352,697 | 6,751,839 | 26.9 | |||||||||||||
| Indonesia | 316,263 | 1.3 | (13,657) | 329,920 | 1.3 | |||||||||||||
| Thailand | 817,780 | 3.4 | 100 | 817,680 | 3.2 | |||||||||||||
| Korea | 302,624 | 1.2 | 20,872 | 281,752 | 1.1 | |||||||||||||
| Hong Kong | 1,886,776 | 7.8 | 164,317 | 1,722,459 | 6.9 | |||||||||||||
| China | 256,567 | 1.1 | (54,443) | 311,010 | 1.2 | |||||||||||||
| Taiwan | 518,927 | 2.1 | 49,316 | 469,611 | 1.9 | |||||||||||||
| Singapore | 1,629,658 | 6.7 | 109,190 | 1,520,468 | 6.1 | |||||||||||||
| India | 618,613 | 2.5 | 39,963 | 578,650 | 2.3 | |||||||||||||
| Others | 757,328 | 3.1 | 37,039 | 720,289 | 2.9 | |||||||||||||
| Oceania | 1,924,056 | 7.9 | 102,234 | 1,821,822 | 7.3 | |||||||||||||
| Australia | 1,821,988 | 7.5 | 118,957 | 1,703,031 | 6.8 | |||||||||||||
| Others | 102,068 | 0.4 | (16,723) | 118,791 | 0.5 | |||||||||||||
| North America | 7,791,070 | 32.0 | (1,378,313) | 9,169,383 | 36.5 | |||||||||||||
| United States | 6,125,010 | 25.2 | (1,391,341) | 7,516,351 | 29.9 | |||||||||||||
| Others | 1,666,060 | 6.8 | 13,028 | 1,653,032 | 6.6 | |||||||||||||
| Central and South America | 1,477,151 | 6.1 | (186,227) | 1,663,378 | 6.6 | |||||||||||||
| Brazil | 260,764 | 1.1 | 2,306 | 258,458 | 1.0 | |||||||||||||
| Panama | 401,813 | 1.7 | (17,961) | 419,774 | 1.7 | |||||||||||||
| Others | 814,574 | 3.3 | (170,572) | 985,146 | 3.9 | |||||||||||||
| Western Europe | 3,894,594 | 16.0 | 205,203 | 3,689,391 | 14.7 | |||||||||||||
| United Kingdom | 1,257,442 | 5.2 | 229,438 | 1,028,004 | 4.1 | |||||||||||||
| Ireland | 421,270 | 1.7 | 108,635 | 312,635 | 1.2 | |||||||||||||
| Netherlands | 682,160 | 2.8 | (32,290) | 714,450 | 2.9 | |||||||||||||
| Others | 1,533,722 | 6.3 | (100,580) | 1,634,302 | 6.5 | |||||||||||||
| Eastern Europe | 181,446 | 0.7 | (39,651) | 221,097 | 0.9 | |||||||||||||
| Russia | 125,272 | 0.5 | 12,276 | 112,996 | 0.5 | |||||||||||||
| Others | 56,174 | 0.2 | (51,927) | 108,101 | 0.4 | |||||||||||||
| Others | 1,966,064 | 8.1 | 190,861 | 1,775,203 | 7.1 | |||||||||||||
| Total | 24,338,917 | 100.0 | (753,196) | 25,092,113 | 100.0 | |||||||||||||
Note: Classified by domicile of debtors.
(2) NPLs based on the Financial Reconstruction Act, classified by domicile
(Millions of yen, %)
| Mar. 31, 2021 | Mar. 31, 2020 | |||||||||||||||||
| (a) | |
Reserve Ratio |
|
(a) - (b) | (b) | |||||||||||||
| Overseas Offices and Japan offshore banking accounts |
237,470 | 50.1 | 116,326 | 121,144 | ||||||||||||||
|
|
Asia |
60,806 | 45.2 | 30,923 | 29,883 | |||||||||||||
| Oceania |
1,126 | 25.3 | 242 | 884 | ||||||||||||||
| North America |
88,672 | 47.9 | 36,839 | 51,833 | ||||||||||||||
| Central and South America |
45,094 | 76.6 | 32,494 | 12,600 | ||||||||||||||
| Western Europe |
25,205 | 53.8 | 11,162 | 14,043 | ||||||||||||||
| Eastern Europe |
- | - | (853) | 853 | ||||||||||||||
| Others |
16,565 | 36.0 | 5,520 | 11,045 | ||||||||||||||
| Notes | 1. | NPLs based on the Financial Reconstruction Act include loans, acceptances and guarantees, suspense payments, and other credit-type assets. | ||||
| 2. | Reserve ratio | |||||
| = (Reserve for possible loan losses)/(Assets excluding amounts recoverable due to gurarantees, collateral and others) X 100 Reserve for possible loan losses is sum of general reserve for substandard loans and specific reserve. | ||||||
| 3. | Classified by domicile of debtors. |
- 13 -
Table of Contents
Sumitomo Mitsui Financial Group
15. Balance of deposits and loans
SMBC non-consolidated
(1) Average balance of deposits and loans
| (Millions of yen) | ||||||||||
|
FY3/2021 (a)
|
FY3/2020 (b)
| |||||||||
|
(a) - (b)
| ||||||||||
| Deposits
|
129,978,122 | 14,261,780 | 115,716,342 | |||||||
|
|
Domestic units
|
104,819,023 | 10,489,495 | 94,329,528 | ||||||
| ||||||||||
| Loans
|
83,424,385 | 6,968,781 | 76,455,604 | |||||||
| Domestic units
|
53,771,421 | 4,571,390 | 49,200,031 | |||||||
| Note: Deposits do not include negotiable certificates of deposit.
(2) Balance of deposits and loans, classified by type of depositor
| ||||||||||
| (Millions of yen) | ||||||||||
|
Mar. 31,
2021
|
Mar. 31, 2020 | |||||||||
| (a)
|
(a) - (b)
|
(b)
| ||||||||
| Deposits
|
134,685,582 | 14,712,258 | 119,973,324 | |||||||
|
|
Domestic deposits (excluding Japan offshore banking accounts) |
112,672,262 | 10,488,265 | 102,183,997 | ||||||
| Individuals
|
53,411,606 | 4,358,636 | 49,052,970 | |||||||
| Corporates
|
59,260,656 | 6,129,629 | 53,131,027 | |||||||
| ||||||||||
| Loans
|
81,937,725 | 1,750,343 | 80,187,382 | |||||||
| Domestic offices (excluding Japan offshore banking accounts) |
56,909,430 | 2,296,102 | 54,613,328 | |||||||
| Overseas offices and Japan offshore banking accounts | 25,028,295 | (545,759) | 25,574,054 | |||||||
| Note: Deposits do not include negotiable certificates of deposit.
Reference:
| ||||||||||
| (Billions of yen) | ||||||||||
| Mar. 31, 2021 |
Mar. 31, 2020 (b)
| |||||||||
|
|
(a) | (a) - (b)
| ||||||||
| Balance of investment trusts
|
2,619.1 | 646.0 | 1,973.1 | |||||||
|
|
Balance to individuals
|
2,102.2 | 508.8 | 1,593.4 | ||||||
| Note: Balance of investment trusts is recognized on a contract basis and measured according to each fund’s net asset balance at the period-end.
| ||||||||||
| (Billions of yen) | ||||||||||
| FY3/2021 |
FY3/2020 (b) | |||||||||
| (a) | (a) - (b)
| |||||||||
|
Sales of investment trusts to individuals
|
704.4 | 303.6 | 400.8 | |||||||
| Sales of pension-type insurance to individuals | 42.1 | (75.1) | 117.2 | |||||||
- 14 -
Table of Contents
Sumitomo Mitsui Financial Group
16. Deferred tax assets and liabilities
| (Billions of yen) | ||||||||||||||
| SMBC non-consolidated
|
Mar. 31, 2021
|
Change from Mar. 31, 2020
|
Mar. 31, 2020
| |||||||||||
|
(a)
|
Total deferred tax assets
|
(b-c)
|
1
|
247.5
|
67.7
|
179.8
| ||||||||
|
(b)
|
Subtotal of deferred tax assets
|
2
|
497.0
|
37.4
|
459.6
| |||||||||
|
Reserve for possible loan losses and write-off of loans
|
3
|
177.6
|
60.2
|
117.4
| ||||||||||
|
Taxable write-off of securities
|
4
|
209.0
|
(15.9)
|
224.9
| ||||||||||
|
Others
|
5
|
110.4
|
(6.9)
|
117.3
| ||||||||||
|
(c) Valuation allowance
|
6
|
249.5
|
(30.3)
|
279.8
| ||||||||||
|
(d) Total deferred tax liabilities
|
7
|
735.5
|
225.0
|
510.5
| ||||||||||
|
Net unrealized gains on other securities
|
8
|
667.6
|
258.9
|
408.7
| ||||||||||
|
Others
|
9
|
67.9
|
(33.9)
|
101.8
| ||||||||||
|
Net deferred tax assets
|
(a-d)
|
10
|
(488.0)
|
(157.3)
|
(330.7)
| |||||||||
|
Amount corresponding to net deferred losses on hedges included in line 5 and net unrealized gains on other securities included in line 8 |
11
|
(686.2)
|
(223.3)
|
(462.9)
| ||||||||||
|
Others
|
12
|
198.2
|
66.0
|
132.2
| ||||||||||
| SMBC recognized deferred tax assets pursuant to paragraph 19 (classification 2) of the “Implementation Guidance on Recoverability of Deferred Tax Assets” (ASBJ Guidance No.26). This is due to the fact that SMBC has generated steady taxable income, excluding amounts arising from extraordinary factors, in all of the current and past three fiscal years. |
Reference: Income of final tax return before deducting operating loss carryforwards for the last 3 years
| (Billions of yen)
|
||||||||||
| FY3/2019
|
FY3/2020
|
FY3/2021
|
||||||||
| Income of final tax return before deducting operating loss carryforwards |
497.2 | 540.5 | 552.7 | |||||||
| Note: The figure for FY3/2021 was estimated at fiscal year closing. | ||||||||||
- 15 -
Table of Contents
Sumitomo Mitsui Financial Group
17. Capital ratio (BIS guidelines)
(Basel III basis)
| Consolidated | (Billions of yen, %) | |||||
| Mar. 31, 2021 [Preliminary] | Mar. 31, 2020 | |||||
| (a) | (a) - (b) | (b) | ||||
| (1) Total capital ratio (4) / (7) | 18.61 | (0.14) | 18.75 | |||
| (2) Tier 1 capital ratio (5) / (7) | 16.96 | 0.33 | 16.63 | |||
| (3) Common equity Tier 1 capital ratio (6) / (7) | 16.00 | 0.45 | 15.55 | |||
| (4) Total capital | 12,289.3 | 737.3 | 11,552.0 | |||
| (5) Tier 1 capital | 11,199.3 | 949.4 | 10,249.9 | |||
| (6) Common equity Tier 1 capital | 10,562.8 | 981.5 | 9,581.3 | |||
| (7) Risk weighted assets | 66,008.0 | 4,408.9 | 61,599.1 | |||
| (8) Required capital (7) X 8% | 5,280.6 | 352.7 | 4,927.9 | |||
| (9) Leverage Ratio | 5.65 | 1.34 | 4.31 | |||
| SMBC consolidated | ||||||
| (1) Total capital ratio | 17.72 | (0.34) | 18.06 | |||
| (2) Tier 1 capital ratio | 15.89 | 0.09 | 15.80 | |||
| (3) Common equity Tier 1 capital ratio | 13.98 | 0.28 | 13.70 | |||
| (4) Leverage Ratio | 5.21 | 1.24 | 3.97 | |||
| SMBC non-consolidated | ||||||
| (1) Total capital ratio | 16.96 | (0.65) | 17.61 | |||
| (2) Tier 1 capital ratio | 15.08 | (0.15) | 15.23 | |||
| (3) Common equity Tier 1 capital ratio | 13.09 | 0.08 | 13.01 | |||
| (4) Leverage Ratio | 5.05 | 1.20 | 3.85 | |||
|
|
||||||
| Consolidated | (%) | |||||
|
FY3/2021
|
FY3/2020
| |||||
| (a) | (a) - (b) | (b) | ||||
| ROE (denominator: Total stockholders’ equity) | 5.4 | (2.2) | 7.6 | |||
Note:
| ROE (denominator: Total stockholders’ equity) | = |
Profit attributable to owners of parent |
X 100 | |||
| {(Total stockholders’ equity at the beginning of the period) + (Total stockholders’ equity at the end of the period)} / 2 |
- 16 -
Table of Contents
Sumitomo Mitsui Financial Group
- 17 -
Table of Contents
Sumitomo Mitsui Financial Group
Reference: Financial Statements of SMBC
1. Condensed balance sheet
| SMBC non-consolidated (Millions of yen) |
| Mar. 31, 2021 |
Mar. 31, 2020 |
|||||||||||
| (a) | (a) - (b) | (b) | ||||||||||
| Assets |
||||||||||||
| Cash and due from banks |
68,872,236 | 10,900,943 | 57,971,293 | |||||||||
| Call loans |
2,483,453 | 1,837,486 | 645,967 | |||||||||
| Receivables under resale agreements |
2,564,708 | (3,398,669 | ) | 5,963,377 | ||||||||
| Receivables under securities borrowing transactions |
1,587,813 | 643,873 | 943,940 | |||||||||
| Monetary claims bought |
1,765,424 | 203,341 | 1,562,083 | |||||||||
| Trading assets |
2,448,415 | (741,565 | ) | 3,189,980 | ||||||||
| Securities |
36,487,225 | 9,428,592 | 27,058,633 | |||||||||
| Loans and bills discounted |
81,937,725 | 1,750,343 | 80,187,382 | |||||||||
| Foreign exchanges |
2,048,571 | 152,414 | 1,896,157 | |||||||||
| Other assets |
4,291,338 | 113,075 | 4,178,263 | |||||||||
| Tangible fixed assets |
780,803 | (14,154 | ) | 794,957 | ||||||||
| Intangible fixed assets |
258,523 | 23,816 | 234,707 | |||||||||
| Prepaid pension cost |
366,298 | 21,817 | 344,481 | |||||||||
| Customers’ liabilities for acceptances and guarantees |
10,526,389 | 1,126,865 | 9,399,524 | |||||||||
| Reserve for possible loan losses |
(456,405 | ) | (176,703 | ) | (279,702 | ) | ||||||
| Reserve for possible losses on investments |
|
(115,791
|
)
|
|
11,465
|
|
|
(127,256
|
)
| |||
| Total assets |
|
215,846,732
|
|
|
21,882,941
|
|
|
193,963,791
|
| |||
Note: Amounts less than 1 million yen are rounded down.
- 18 -
Table of Contents
Sumitomo Mitsui Financial Group
(Millions of yen)
|
Mar. 31, 2021
|
Mar. 31, 2020 |
|||||||||||
| (a)
|
(a) - (b)
|
(b)
|
||||||||||
| Liabilities |
||||||||||||
| Deposits |
134,685,582 | 14,712,258 | 119,973,324 | |||||||||
| Negotiable certificates of deposit |
12,703,900 | 2,123,639 | 10,580,261 | |||||||||
| Call money |
671,522 | (2,397,204 | ) | 3,068,726 | ||||||||
| Payables under repurchase agreements |
11,879,494 | 3,150,972 | 8,728,522 | |||||||||
| Payables under securities lending transactions |
551,377 | (19,718 | ) | 571,095 | ||||||||
| Commercial paper |
978,109 | 335,662 | 642,447 | |||||||||
| Trading liabilities |
2,348,232 | (611,381 | ) | 2,959,613 | ||||||||
| Borrowed money |
24,825,882 | 3,264,705 | 21,561,177 | |||||||||
| Foreign exchanges |
1,193,427 | (326,350 | ) | 1,519,777 | ||||||||
| Bonds |
1,084,913 | (809,456 | ) | 1,894,369 | ||||||||
| Due to trust account |
2,218,601 | 482,712 | 1,735,889 | |||||||||
| Other liabilities |
3,571,515 | 118,507 | 3,453,008 | |||||||||
| Reserve for employee bonuses |
13,345 | (449 | ) | 13,794 | ||||||||
| Reserve for executive bonuses |
1,154 | 215 | 939 | |||||||||
| Reserve for point service program |
603 | 215 | 388 | |||||||||
| Reserve for reimbursement of deposits |
9,245 | 5,345 | 3,900 | |||||||||
| Deferred tax liabilities |
487,964 | 157,265 | 330,699 | |||||||||
| Deferred tax liabilities for land revaluation |
29,603 | (508 | ) | 30,111 | ||||||||
| Acceptances and guarantees
|
|
10,526,389
|
|
|
1,126,865
|
|
|
9,399,524
|
| |||
| Total liabilities
|
|
207,780,865
|
|
|
21,313,293
|
|
|
186,467,572
|
| |||
| Net assets |
||||||||||||
| Capital stock |
1,770,996 | - | 1,770,996 | |||||||||
| Capital surplus |
1,774,554 | - | 1,774,554 | |||||||||
| Capital reserve |
1,771,043 | - | 1,771,043 | |||||||||
| Other capital surplus |
3,510 | - | 3,510 | |||||||||
| Retained earnings |
2,910,394 | 34,647 | 2,875,747 | |||||||||
| Other retained earnings |
2,910,394 | 34,647 | 2,875,747 | |||||||||
|
Voluntary reserve for retirement allowances |
1,656 | - | 1,656 | |||||||||
|
Voluntary reserve |
219,845 | - | 219,845 | |||||||||
|
Retained earnings brought forward |
2,688,892 | 34,646 | 2,654,246 | |||||||||
| Treasury stock |
(210,003 | ) | - | (210,003 | ) | |||||||
| Total stockholders’ equity |
6,245,942 | 34,647 | 6,211,295 | |||||||||
| Net unrealized gains (losses) on other securities |
1,719,291 | 645,496 | 1,073,795 | |||||||||
| Net deferred gains (losses) on hedges |
75,141 | (110,022 | ) | 185,163 | ||||||||
| Land revaluation excess |
25,492 | (472 | ) | 25,964 | ||||||||
| Total valuation and translation adjustments
|
|
1,819,924
|
|
|
535,001
|
|
|
1,284,923
|
| |||
| Total net assets
|
|
8,065,866
|
|
|
569,647
|
|
|
7,496,219
|
| |||
| Total liabilities and net assets
|
|
215,846,732
|
|
|
21,882,941
|
|
|
193,963,791
|
| |||
Note: Amounts less than 1 million yen are rounded down.
- 19 -
Table of Contents
Sumitomo Mitsui Financial Group
2. Condensed income statement
| SMBC non-consolidated | ||||||||||||||
| (Millions of yen) | ||||||
| |
FY3/2021 (a) |
|
FY3/2020 (b) |
|||||||||
| (a) - (b) | ||||||||||||
|
Ordinary income
|
|
2,283,356
|
|
|
(567,806)
|
|
|
2,851,162
|
| |||
| Interest income | 1,369,776 | (530,331) | 1,900,107 | |||||||||
| Interest on loans and discounts | 958,835 | (295,297) | 1,254,132 | |||||||||
| Interest and dividends on securities | 291,358 | (37,794) | 329,152 | |||||||||
| Trust fees | 2,076 | (34) | 2,110 | |||||||||
| Fees and commissions | 532,550 | 11,100 | 521,450 | |||||||||
| Trading income | 17,235 | (94,420) | 111,655 | |||||||||
| Other operating income | 248,584 | 105,730 | 142,854 | |||||||||
| Other income
|
|
113,133
|
|
|
(59,850)
|
|
|
172,983
|
| |||
|
Ordinary expenses
|
|
1,847,294
|
|
|
(519,924)
|
|
|
2,367,218
|
| |||
| Interest expenses | 433,414 | (588,601) | 1,022,015 | |||||||||
| Interest on deposits | 91,518 | (256,218) | 347,736 | |||||||||
| Fees and commissions payments | 201,865 | 3,673 | 198,192 | |||||||||
| Trading losses | 450 | 450 | - | |||||||||
| Other operating expenses | 52,829 | 6,867 | 45,962 | |||||||||
| General and administrative expenses | 828,186 | 8,763 | 819,423 | |||||||||
| Other expenses
|
|
330,546
|
|
|
48,922
|
|
|
281,624
|
| |||
| Ordinary profit
|
|
436,062
|
|
|
(47,882)
|
|
|
483,944
|
| |||
| Extraordinary gains | 8,987 | 7,763 | 1,224 | |||||||||
| Extraordinary losses
|
|
9,654
|
|
|
5,463
|
|
|
4,191
|
| |||
| Income before income taxes
|
|
435,394
|
|
|
(45,583)
|
|
|
480,977
|
| |||
| Income taxes - current | 156,024 | (258) | 156,282 | |||||||||
| Income taxes - deferred
|
|
(58,666)
|
|
|
(65,979)
|
|
|
7,313
|
| |||
| Total income taxes
|
|
97,358
|
|
|
(66,237)
|
|
|
163,595
|
| |||
| Net income
|
|
338,036
|
|
|
20,655
|
|
|
317,381
|
| |||
Note: Amounts less than 1 million yen are rounded down.
- 20 -
Table of Contents
Sumitomo Mitsui Financial Group
3. Statement of changes in net assets
SMBC non-consolidated
| Year ended March 31, 2021 | (Millions of yen) | |||||||||||||||||||||||||||||
| Capital surplus | Retained earnings | |||||||||||||||||||||||||||||
| Other retained earnings | ||||||||||||||||||||||||||||||
|
Capital |
Capital |
Other capital |
Voluntary reserve for retirement allowances |
Voluntary reserve |
Retained earnings brought forward |
Treasury stock |
Total equity | |||||||||||||||||||||||
| Balance at the beginning of the period |
1,770,996 | 1,771,043 | 3,510 | 1,656 | 219,845 | 2,654,246 | (210,003 | ) | 6,211,295 | |||||||||||||||||||||
|
Cumulative effects of changes in accounting policies |
(30,910 | ) | (30,910) | |||||||||||||||||||||||||||
|
Restated balance
|
|
1,770,996
|
|
|
1,771,043
|
|
|
3,510
|
|
|
1,656
|
|
|
219,845
|
|
|
2,623,335
|
|
|
(210,003
|
)
|
6,180,384
| ||||||||
|
Changes in the period
|
||||||||||||||||||||||||||||||
|
Cash dividends
|
|
(272,952
|
)
|
(272,952)
| ||||||||||||||||||||||||||
|
Net income
|
|
338,036
|
|
338,036
| ||||||||||||||||||||||||||
| Reversal of land revaluation excess |
472 | 472 | ||||||||||||||||||||||||||||
| Net changes in items other than stockholders’ equity in the period |
||||||||||||||||||||||||||||||
|
Net changes in the period
|
|
-
|
|
|
-
|
|
|
-
|
|
|
-
|
|
|
-
|
|
|
65,557
|
|
|
-
|
|
65,557
| ||||||||
|
Balance at the end of the period |
1,770,996 | 1,771,043 | 3,510 | 1,656 | 219,845 | 2,688,892 | (210,003 | ) | 6,245,942 | |||||||||||||||||||||
| (Millions of yen | ) | |||||||||||||||||||||||||||||
| Valuation and translation adjustments | ||||||||||||||||||||||||||||||
| Net unrealized gains on other securities |
Net deferred gains (losses) on hedges |
Land revaluation excess |
Total valuation and translation adjustments |
Total net |
||||||||||||||||||||||||||
| Balance at the beginning of the period |
1,073,795 | 185,163 | 25,964 | 1,284,923 | 7,496,219 | |||||||||||||||||||||||||
| Cumulative effects of changes in accounting policies |
(30,910 | ) | ||||||||||||||||||||||||||||
|
Restated balance
|
|
1,073,795
|
|
|
185,163
|
|
|
25,964
|
|
|
1,284,923
|
|
|
7,465,308
|
|
|||||||||||||||
| Changes in the period
|
||||||||||||||||||||||||||||||
|
Cash dividends
|
|
(272,952
|
)
|
|||||||||||||||||||||||||||
|
Net income
|
|
338,036
|
|
|||||||||||||||||||||||||||
| Reversal of land revaluation excess |
472 | |||||||||||||||||||||||||||||
| Net changes in items other than stockholders’ equity in the period |
645,495 | (110,022 | ) | (472 | ) | 535,001 | 535,001 | |||||||||||||||||||||||
| Net changes in the period
|
|
645,495
|
|
|
(110,022
|
)
|
|
(472
|
)
|
|
535,001
|
|
|
600,558
|
|
|||||||||||||||
| Balance at the end of the period |
1,719,291 | 75,141 | 25,492 | 1,819,924 | 8,065,866 | |||||||||||||||||||||||||
Note: Amounts less than 1 million yen are rounded down.
- 21 -
Serious News for Serious Traders! Try StreetInsider.com Premium Free!
You May Also Be Interested In
- Soft Space Launches the First and Only JCB Payment Gateway in Malaysia
- U-Haul Now Operating at Former Life Storage Facility in Webster
- Dynamo Software Unveils Agenda & Key Topics for Its Annual User Conference: A Deep Dive Into the Future of the ALTS FinTech Ecosystem
Create E-mail Alert Related Categories
SEC FilingsSign up for StreetInsider Free!
Receive full access to all new and archived articles, unlimited portfolio tracking, e-mail alerts, custom newswires and RSS feeds - and more!
