

Form 6-K SAP SE For: Apr 25
 Tweet
Tweet Share
Share
UNITED STATES
SECURITIES AND EXCHANGE COMMISSION
Washington, D.C. 20549
FORM 6-K
REPORT OF FOREIGN PRIVATE ISSUER
PURSUANT TO RULE 13a-16 OR 15d-16 OF
THE SECURITIES EXCHANGE ACT OF 1934
April 25, 2022
Commission file number:
1-14251
SAP SE
(Exact name of registrant as specified in its charter)
SAP EUROPEAN COMPANY
(Translation of registrant's name into English)
Dietmar-Hopp-Allee 16
69190 Walldorf
Federal Republic of Germany
(Address of principal executive offices)
Indicate by check mark whether the registrant files or will file annual reports under cover of Form 20-F or Form 40-F.
| Form 20-F | [X] | Form 40-F | [ ] |
Indicate by check mark whether the registrant by furnishing the information contained in this Form is also thereby furnishing the information to the Commission pursuant to Rule 12g3-2(b) under the Securities Exchange Act of 1934.
| Yes | [ ] | No | [X] |
If "Yes" is marked, indicate below the file number assigned to the registrant in connection with Rule 12g3-2(b): 82-_______.
SAP SE
FORM 6-K
On April 25, 2022, SAP SE, (“SAP"), filed a quarterly statement with Deutsche Boerse AG for the first quarter ended March 31, 2022 (the “Quarterly Statement”). The Quarterly Statement is attached as Exhibit 99.1 hereto and incorporated by reference herein.
This Quarterly Statement discloses certain non-IFRS measures. These measures are not prepared in accordance with IFRS and are therefore considered non-IFRS financial measures. The non-IFRS financial measures that we report should be considered in addition to, and not as substitutes for or superior to, revenue, operating income, cash flows, or other measures of financial performance prepared in accordance with IFRS.
Please refer to Explanations of Non-IFRS Measures online (www.sap.com/about/investor/index.epx) for further information regarding the non-IFRS measures.
Any statements contained in this document that are not historical facts are forward-looking statements as defined in the U.S. Private Securities Litigation Reform Act of 1995. Words such as "anticipate," "believe," "estimate," "expect," "forecast," "intend," "may," "plan," "project," "predict," "should" and "will" and similar expressions as they relate to SAP are intended to identify such forward-looking statements. SAP undertakes no obligation to publicly update or revise any forward-looking statements. All forward-looking statements are subject to various risks and uncertainties that could cause actual results to differ materially from expectations. The factors that could affect SAP's future financial results are discussed more fully in SAP's filings with the U.S. Securities and Exchange Commission (the "SEC"), including SAP's most recent Annual Report on Form 20-F filed with the SEC. Readers are cautioned not to place undue reliance on these forward-looking statements, which speak only as of their dates.
2
EXHIBITS
| Exhibit No. | Exhibit |
| 99.1 | Quarterly Statement dated April 22, 2022 |
3
SIGNATURES
Pursuant to the requirements of the Securities Exchange Act of 1934, the registrant has duly caused this report to be signed on its behalf by the undersigned, thereunto duly authorized.
| SAP SE | |||
| (Registrant) | |||
| By: | /s/ Christopher Sessar | ||
| Name: | Dr. Christopher Sessar | |
| Title: | Chief Accounting Officer |
| By: | /s/ Christian Kastler |
| Name: | Christian Kastler | |
| Title: | Co-Head of Corporate Accounting and Reporting |
Date: April 25, 2022
4
EXHIBIT INDEX
| Exhibit No. | Exhibit |
| 99.1 | Quarterly Statement dated April 22, 2022 |
5
Exhibit 99.1

SAP Announces Q1 2022 Results With Continued Cloud Momentum
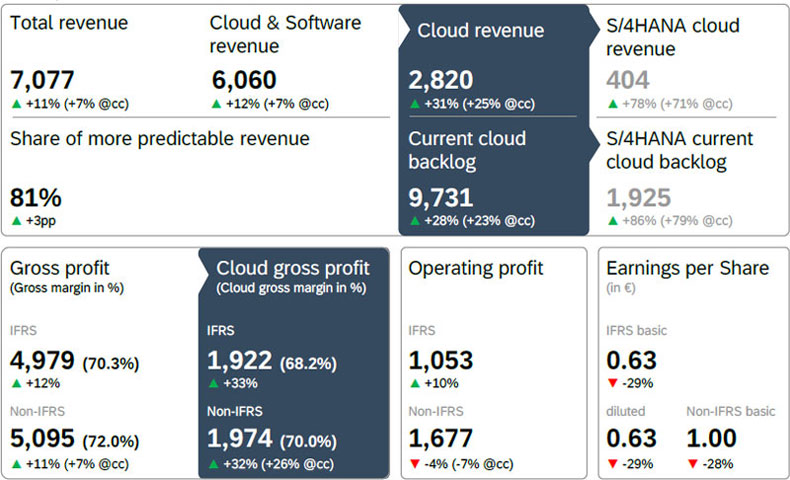
| ● | Cloud revenue growth further accelerates, up 31% and up 25% at constant currencies |
| ● | Current cloud backlog approaches €10bn, up 28% and up 23% at constant currencies |
| ● | SAP S/4HANA cloud revenue significantly increases, up 78% and up 71% at constant currencies. SAP S/4HANA current cloud backlog expands even faster, up 86% and up 79% at constant currencies |
| ● | SAP reaffirms 2022 outlook for revenue, non-IFRS operating profit and free cash flow |
in € millions, unless otherwise stated
 |
Christian Klein, CEO: “Customers powered |
 |
Luka Mucic, CFO: “We are off to a solid start to | |
another quarter of strong cloud growth as they turned to us for solutions to make their businesses more sustainable, their supply chains more resilient, and their enterprises more future-proof. Our signature ERP offering SAP S/4HANA grew at record levels demonstrating the confidence customers place in us to support their business transformations.”
|
the year and our outlook remains strong. Despite the current macroeconomic environment, cloud revenue growth accelerated further, fueling total revenue growth. Current cloud backlog grew at a healthy rate and continues to support our confidence in our long-term plans and outlook for the year.” | |||
Walldorf, Germany – April 22, 2022. SAP SE (NYSE: SAP) today announced its financial results for the first quarter ended March 31, 2022.
 | Financial Performance |
| Group results at a glance – First Quarter 2022 |
| IFRS | Non-IFRS1 | ||||||
| € million, unless otherwise stated | Q1 2022 | Q1 2021 | ∆ in % | Q1 2022 | Q1 2021 | ∆ in % | ∆ in % const. curr. |
| Cloud revenue | 2,820 | 2,145 | 31 | 2,820 | 2,145 | 31 | 25 |
| Software licenses | 317 | 483 | –34 | 317 | 483 | –34 | –36 |
| Software support | 2,923 | 2,801 | 4 | 2,923 | 2,801 | 4 | 1 |
| Software licenses and support revenue | 3,240 | 3,283 | –1 | 3,240 | 3,283 | –1 | –4 |
| Cloud and software revenue | 6,060 | 5,428 | 12 | 6,060 | 5,428 | 12 | 7 |
| Total revenue | 7,077 | 6,348 | 11 | 7,077 | 6,348 | 11 | 7 |
| Share of more predictable revenue (in %) | 81 | 78 | 3pp | 81 | 78 | 3pp | |
| Operating profit (loss) | 1,053 | 960 | 10 | 1,677 | 1,738 | –4 | –7 |
| Profit (loss) after tax | 632 | 1,070 | –41 | 1,166 | 1,720 | –32 | |
| Earnings per share - Basic (in €) | 0.63 | 0.88 | –29 | 1.00 | 1.40 | –28 | |
| Earnings per share - Diluted (in €) | 0.63 | 0.88 | –29 | ||||
| Net cash flows from operating activities | 2,482 | 3,085 | –20 | ||||
| Free cash flow | 2,165 | 2,848 | –24 | ||||
| Number of employees (FTE, March 31) | 109,798 | 103,142 | 6 | ||||
1 For a breakdown of the individual adjustments see table “Non-IFRS Adjustments by Functional Areas” in this Quarterly Statement.
Due to rounding, numbers may not add up precisely
| Cloud Performance |
| IFRS | Non-IFRS1 | ||||
| € millions, unless otherwise stated | Q1 2022 | ∆ in % | Q1 2022 | ∆ in % | ∆ in % constant currency |
| Current Cloud Backlog | |||||
| SAP S/4HANA2 | 1,925 | 86 | 79 | ||
| Total2 | 9,731 | 28 | 23 | ||
| Cloud Revenue | |||||
| SaaS/PaaS | 2,585 | 34 | 2,585 | 34 | 28 |
| SaaS/PaaS - Intelligent Spend | 808 | 23 | 808 | 23 | 16 |
| SaaS/PaaS - Other | 1,776 | 40 | 1,776 | 40 | 34 |
| IaaS | 235 | 10 | 235 | 10 | 5 |
| Total | 2,820 | 31 | 2,820 | 31 | 25 |
| thereof SAP S/4HANA | 404 | 78 | 404 | 78 | 71 |
| thereof Qualtrics | 269 | 69 | 269 | 69 | 58 |
| Cloud gross profit | |||||
| SaaS/PaaS | 1,858 | 36 | 1,909 | 34 | 28 |
| SaaS/PaaS - Intelligent Spend | 652 | 27 | 653 | 27 | 20 |
| SaaS/PaaS - Other | 1,206 | 41 | 1,257 | 39 | 33 |
| IaaS | 63 | –9 | 65 | –9 | –7 |
| Total | 1,922 | 33 | 1,974 | 32 | 26 |
| thereof Qualtrics | 207 | 70 | 241 | 64 | 53 |
| Cloud gross margin (in %) | |||||
| SaaS/PaaS (in %) | 71.9 | 0.9pp | 73.9 | 0.3pp | 0.2pp |
| SaaS/PaaS - Intelligent Spend | 80.7 | 2.5pp | 80.7 | 2.4pp | 2.2pp |
2/23
| SaaS/PaaS - Other | 67.9 | 0.6pp | 70.7 | –0.3pp | –0.4pp |
| IaaS (in %) | 26.9 | –5.6pp | 27.6 | –5.7pp | –3.8pp |
| Total | 68.2 | 1.0pp | 70.0 | 0.5pp | 0.5pp |
| thereof Qualtrics | 76.9 | 0.4pp | 89.6 | –2.6pp | –2.7pp |
1 For a breakdown of the individual adjustments see table “Non-IFRS Adjustments by Functional Areas” in this Quarterly Statement.
2 As this is an order entry metric, there is no IFRS equivalent.
Due to rounding, numbers may not add up precisely
The Q1 2022 results were also impacted by other effects. For details, please refer to the disclosures on page 22 of this document.
Impact of War in Ukraine
In the first quarter, SAP’s business was impacted by the war in Ukraine. At the beginning of March, SAP stopped all new sales in Russia and Belarus. In addition, SAP started to shut down its cloud operations and intends to stop the support and maintenance of its on-premise products in Russia. Current cloud backlog was lowered by approximately €60 million due to the termination of existing cloud engagements, and operating profit by approximately €70 million due to reduced on-premise revenues, accelerated depreciation of data center assets and capitalized sales commissions.
For the fiscal year, we expect a total negative revenue impact of approximately €300 million from lack of new business and discontinuation of existing business, in particular software and support and services. For non-IFRS operating profit we expect an impact of approximately €350 million from the revenue gaps mentioned above and other expense items.
In addition to the above, the company expects to incur restructuring expenses of approximately €80-100 million for the fiscal year which will not affect non-IFRS results.
Despite these headwinds, the cloud performance allows SAP to reaffirm its cloud revenue, cloud and software revenue as well as non-IFRS operating profit and free cash flow outlook. The reiteration of the non-IFRS operating profit outlook reflects the benefits of a continued strong cloud revenue growth, operational discipline and portfolio streamlining measures.
Other impacts due to this rapidly evolving situation are currently unknown and could potentially subject our business to materially adverse consequences should the situation escalate beyond its current scope.
Financial Highlights
Current cloud backlog was up 28% to €9.73 billion and up 23% at constant currencies. The war in Ukraine reduced current cloud backlog growth at constant currencies by 0.8 percentage points.
Supported by double-digit growth across the solution portfolio, cloud revenue growth continued to accelerate for the fourth consecutive quarter and was up 31% to €2.82 billion, up 25% at constant currencies.
Amidst continuing investments into our next generation cloud delivery program our cloud gross margin was up 1.0 percentage points year over year to 68.2% (IFRS) and up 0.5 percentage points year over year to 70.0% (non-IFRS). Revenue growth, alongside cloud gross margin expansion, drove strong cloud gross profit growth of 33% (IFRS), 32% (non-IFRS) and 26% (non-IFRS at constant currencies).
IFRS operating profit increased 10% to €1.05 billion, primarily driven by lower restructuring expenses. Non-IFRS operating profit decreased 4% to €1.68 billion and decreased 7% at constant currencies. This decrease against a very strong prior year comparable was mainly driven by expenses related to the war in Ukraine, as well as accelerated investments into research & development and sales & marketing to capture current and future growth opportunities.
IFRS earnings per share (basic and diluted) decreased 29% to €0.63 and non-IFRS earnings per share (basic) decreased 28% to €1.00. The year over year decline of earnings per share reflects a contribution to financial income by Sapphire Ventures that was lower than over the same period last year based on current market conditions.
Free cash flow was down 24% to €2.16 billion, mainly attributable to the development of profitability in the quarter and impacts from working capital due to SAP’s continuous move to the cloud, and lower software licenses sales in the fourth quarter 2021. The ongoing business transformation provides more balance of cash inflows throughout the year, and we are reiterating our full year free cash flow outlook.
3/23
On January 13, SAP announced a new share repurchase program to support the transition of SAP’s share-based compensation programs to equity settlement. By March 31, SAP had repurchased 5,680,250 shares at an average price of €102.26 with a purchased value of approximately €581 million.
 | Business Highlights |
| More
than 500 customers chose SAP S/4HANA in the quarter, taking total adoption to more than 19,300 customers, up 18% year over year,
of which more than 13,900 are live. In the first quarter, more than 60% of the additional SAP S/4HANA customers were net new.
In the first quarter, customers around the globe chose “RISE with SAP” including Accenture, Canon Production Printing, Citizen Watch Company, Daimler Truck AG, Grupo Estrella Blanca, Exide Industries Limited, NEC Corporation, Ooredoo Group, Qinqin Food, Rising Auto, TELUS, Tramontina, and Wipro Limited. Key customer wins across SAP’s solution portfolio included: Air France-KLM, FEMSA, Heineken, L’Oréal, Merck KGaA, MLP, Nippon Telephone and Telegraph Corporation, NHS Shared Business Services, PetSmart, Pick n Pay, Salling Group, Schaeffler, and Swellfun. Further, PT United Tractors, Schwarz Produktion and Vodafone New Zealand all went live on SAP solutions in the first quarter.
Microsoft announced it would become the first public cloud provider to adopt “RISE with SAP” and SAP S/4HANA to transform its own SAP ERP deployment. Adopting these solutions will enable Microsoft to deploy new technologies faster and establish best practices that benefit our joint customers.
SAP’s cloud revenue performance for the quarter was excellent across all regions. The United States and Germany had an outstanding cloud revenue performance while Japan, China, Brazil, Canada, Switzerland, France, and the UK were particularly strong.
SAP proposed a dividend of €2.45 per share for fiscal year 2021 representing a year-over-year increase of approximately 32%. This amount includes a special dividend of €0.50 to celebrate SAP’s 50th anniversary. The dividend is subject to shareholder approval at the upcoming AGM scheduled for May 18, 2022.
On March 9, SAP announced that it had completed the acquisition of a majority stake of Taulia, a leading provider of working capital management solutions. Taulia further expands SAP’s Business Network and strengthens SAP’s solutions for the CFO office by providing working capital management cloud solutions.
On March 22, SAP and global strategic consultancy BCG announced a partnership to help companies transform their business models, become sustainable enterprises, and gain the data transparency they need to embed sustainability into their core business. The partnership combines SAP’s strength as the leading enterprise software company with BCG’s proven expertise in advising clients on their sustainability transformation strategies. The SAP and BCG sustainability transformation offering is in pilot phase, with an expected broader launch in the third quarter of 2022.
On March 28, SAP announced that the SAP Signavio brand will represent our portfolio of Business Process Management solutions. SAP also announced general availability of the SAP Signavio Journey to Process Analytics. The new offering correlates experience data from Qualtrics user surveys with operational data from underlying IT systems, giving companies the ability to understand how best to optimize their end-to-end business processes for both operational excellence and customer experience. |
Segment Results at a Glance
At the beginning of 2022, the Services segment was integrated into the former Applications, Technology & Support segment which was re-named to Applications, Technology & Services.
Therefore, SAP now has two reportable segments: the Applications, Technology & Services segment and the Qualtrics segment.
4/23
| Segment Performance First Quarter 2022 |
€ million, unless otherwise stated (Non-IFRS) |
Applications, Technology & Services1 | Qualtrics | ||||
Actual Currency |
∆ in % | ∆ in % const. curr. |
Actual Currency |
∆ in % | ∆ in % const. curr. | |
| Cloud revenue | 2,495 | 28 | 22 | 269 | 69 | 58 |
| Segment revenue | 6,695 | 10 | 6 | 320 | 58 | 48 |
| Segment profit (loss) | 2,168 | –4 | –7 | 10 | –22 | –12 |
| Cloud gross margin (in %) | 67.8 | 0.1pp | 0.2pp | 89.6 | –2.6pp | –2.7pp |
| Segment margin (in %) | 32.4 | –4.5pp | –4.6pp | 3.1 | –3.2pp | –2.5pp |
1 Segment information for comparative prior periods were restated to conform with the new segment composition.
SAP’s two reportable segments showed the following performance:
Applications, Technology & Services (AT&S)
Segment revenue in AT&S was up 10% to €6.70 billion year over year, up 6% at constant currencies. Segment performance was driven by strong double-digit cloud revenue growth in SAP S/4HANA as well as Business Technology Platform. Software licenses revenue decreased due to the shift to the cloud as more customers are adopting our ‘RISE with SAP’ offering. Segment support revenue was up 4% to €2.92 billion year over year and up 1% at constant currencies.
Qualtrics
Qualtrics segment revenue was up 58% to €320 million year over year, up 48% at constant currencies. The continued strong growth was driven by robust renewal rates and expansions. Australian Taxation Office, Chipotle, EY, Google Cloud, Grubhub, Hyundai Motor Asia Pacific, Kroger, Microsoft, National Australia Bank, Royal Mail Group, and Shiseido Company, among others, selected Qualtrics Experience Management Solutions.
 | Business Outlook 2022 |
SAP is executing on its cloud-led strategy, which is driving accelerating cloud growth through both new business and cloud adoption by existing customers. The pace and scale of SAP’s cloud momentum places the Company well on track towards its mid-term ambition.
For 2022, SAP now expects:
| ■ | €11.55 – 11.85 billion cloud revenue at constant currencies (2021: €9.42 billion), up 23% to 26% at constant currencies. |
| ■ | €25.0 – 25.5 billion cloud and software revenue at constant currencies (2021: €24.08 billion), up 4% to 6% at constant currencies. |
| ■ | €7.8 – 8.25 billion non-IFRS operating profit at constant currencies (2021: €8.23 billion), flat to down 5% at constant currencies. |
| ■ | The share of more predictable revenue (defined as the total of cloud revenue and software support revenue) is expected to reach approximately 78% (2021: 75%). |
| ■ | Free cash flow above €4.5 billion (2021: €5.01 billion). |
| ■ | SAP now expects a full-year 2022 effective tax rate (IFRS) of 28.0% to 32.0% (previously: 25.0% to 28.0%) and an effective tax rate (non-IFRS) of 23.0% to 27.0% (previously: 22.0% to 25.0%). The increase of the effective tax rate outlook mainly reflects an updated projection of the 2022 financial income contribution of Sapphire Ventures in light of current market conditions. |
While SAP’s full-year 2022 business outlook is at constant currencies, actual currency reported figures are expected to be impacted by currency exchange rate fluctuations as the Company progresses through the year. See the table below for the Q2 and FY 2022 expected currency impacts.
5/23
| Expected Currency Impact Assuming March 2022 Rates Apply for the Rest of the Year |
| In percentage points | Q2 2022 | FY 2022 |
| Cloud revenue growth | +7pp to +9pp | +5pp to +7pp |
| Cloud and software revenue growth | +4pp to +6pp | +3pp to +5pp |
| Operating profit growth (non-IFRS) | +4pp to +6pp | +3pp to +5pp |
Ambition for Non-Financial Performance
In 2022, SAP continues to expect:
| ■ | a Customer Net Promoter Score of 11 to 15 (2021: 10) |
| ■ | an Employee Engagement Index in a range of 84% to 86% (2021: 83%) |
| ■ | Net carbon emissions of 70 kt (2021: 110 kt) |
Ambition 2025
SAP confidently reiterates its mid-term ambition published in its Q3 2020 Quarterly Statement.
6/23
 | Additional Information |
This press release and all information therein is preliminary and unaudited.
SAP Performance Measures
For more information about our key growth metrics and performance measures, their calculation, their usefulness, and their limitation, please refer to the following document on our Investor Relations website: SAP Performance Measures.
Webcast
SAP senior management will host a financial analyst conference call on Friday, April 22nd at 2:00 PM (CET) / 1:00 PM (GMT) / 8:00 AM (Eastern) / 5:00 AM (Pacific). The conference will be webcast live on the Company’s website at www.sap.com/investor and will be available for replay. Supplementary financial information pertaining to the first quarter can be found at www.sap.com/investor.
Financial Analyst and Investor Conference
SAP will hold a financial analyst event on Wednesday, May 11th, in conjunction with its annual SAP Sapphire conference kicking off on May 10th.
About SAP
SAP’s strategy is to help every business run as an intelligent enterprise. As a market leader in enterprise application software, we help companies of all sizes and in all industries run at their best: SAP customers generate 87% of total global commerce. Our machine learning, Internet of Things (IoT), and advanced analytics technologies help turn customers’ businesses into intelligent enterprises. SAP helps give people and organizations deep business insight and fosters collaboration that helps them stay ahead of their competition. We simplify technology for companies so they can consume our software the way they want – without disruption. Our end-to-end suite of applications and services enables business and public customers across 25 industries globally to operate profitably, adapt continuously, and make a difference. With a global network of customers, partners, employees, and thought leaders, SAP helps the world run better and improve people’s lives. For more information, visit www.sap.com.
For more information, financial community only:
| Anthony Coletta | +49 (6227) 7-60437 | [email protected], CET |
Follow SAP Investor Relations on Twitter at @sapinvestor.
For more information, press only:
| Joellen Perry | +1 (650) 445-6780 | [email protected], PT |
| Daniel Reinhardt | +49 (6227) 7-40201 | [email protected], CET |
For customers interested in learning more about SAP products:
| Global Customer Center: | +49 180 534-34-24 |
| United States Only: | +1 (800) 872-1SAP (+1-800-872-1727) |
Note to editors:
To preview and download broadcast-standard stock footage and press photos digitally, please visit www.sap.com/photos. On this platform, you can find high resolution material for your media channels. To view video stories on diverse topics, visit www.sap-tv.com. From this site, you can embed videos into your own Web pages, share video via email links, and subscribe to RSS feeds from SAP TV.
This document contains forward-looking statements, which are predictions, projections, or other statements about future events. These statements are based on current expectations, forecasts, and assumptions that are subject to risks and uncertainties that could cause actual results and outcomes to materially differ. Additional information regarding these risks and uncertainties may be found in our filings with the Securities and Exchange Commission, including but not limited to the risk factors section of SAP’s 2021 Annual Report on Form 20-F.
© 2022 SAP SE. All rights reserved.
SAP and other SAP products and services mentioned herein as well as their respective logos are trademarks or registered trademarks of SAP SE in Germany and other countries. Please see https://www.sap.com/copyright for additional information.
7/23
Contents
8/23
Financial and Non-Financial Key Facts (IFRS and Non-IFRS)
| € millions, unless otherwise stated | Q1 2021 |
Q2 2021 |
Q3 2021 |
Q4 2021 |
TY 2021 |
Q1 2022 |
||
| Revenues | ||||||||
| Cloud | 2,145 | 2,276 | 2,386 | 2,611 | 9,418 | 2,820 | ||
| % change – yoy | 7 | 11 | 20 | 28 | 17 | 31 | ||
| % change constant currency – yoy | 13 | 17 | 20 | 24 | 19 | 25 | ||
| SAP S/4HANA Cloud | 227 | 257 | 276 | 329 | 1,090 | 404 | ||
| % change – yoy | 36 | 33 | 46 | 65 | 46 | 78 | ||
| % change constant currency – yoy | 43 | 39 | 46 | 61 | 47 | 71 | ||
| Software licenses | 483 | 650 | 657 | 1,458 | 3,248 | 317 | ||
| % change – yoy | 7 | –16 | –8 | –14 | –11 | –34 | ||
| % change constant currency – yoy | 11 | –13 | –8 | –17 | –11 | –36 | ||
| Software support | 2,801 | 2,823 | 2,867 | 2,920 | 11,412 | 2,923 | ||
| % change – yoy | –5 | –2 | 1 | 3 | –1 | 4 | ||
| % change constant currency – yoy | 0 | 1 | 1 | 1 | 1 | 1 | ||
| Software licenses and support | 3,283 | 3,474 | 3,524 | 4,379 | 14,660 | 3,240 | ||
| % change – yoy | –3 | –5 | –1 | –4 | –3 | –1 | ||
| % change constant currency – yoy | 1 | –2 | –1 | –6 | –2 | –4 | ||
| Cloud and software | 5,428 | 5,750 | 5,910 | 6,990 | 24,078 | 6,060 | ||
| % change – yoy | 1 | 1 | 7 | 6 | 4 | 12 | ||
| % change constant currency – yoy | 6 | 5 | 6 | 3 | 5 | 7 | ||
| Total revenue | 6,348 | 6,669 | 6,845 | 7,981 | 27,842 | 7,077 | ||
| % change – yoy | –3 | –1 | 5 | 6 | 2 | 11 | ||
| % change constant currency – yoy | 2 | 3 | 5 | 3 | 3 | 7 | ||
| Share of more predictable revenue (in %) | 78 | 76 | 77 | 69 | 75 | 81 | ||
| Profits | ||||||||
| Operating profit (loss) (IFRS) | 960 | 984 | 1,249 | 1,463 | 4,656 | 1,053 | ||
| Operating profit (loss) (non-IFRS) | 1,738 | 1,922 | 2,102 | 2,468 | 8,230 | 1,677 | ||
| % change | 17 | –2 | 2 | –11 | –1 | –4 | ||
| % change constant currency | 24 | 3 | 2 | –12 | 1 | –7 | ||
| Profit (loss) after tax (IFRS) | 1,070 | 1,449 | 1,418 | 1,440 | 5,376 | 632 | ||
| Profit (loss) after tax (non-IFRS) | 1,720 | 2,214 | 2,129 | 2,274 | 8,337 | 1,166 | ||
| % change | 70 | 59 | 1 | 12 | 28 | –32 | ||
| Margins | ||||||||
| Cloud gross margin (IFRS, in %) | 67.2 | 67.5 | 67.0 | 66.6 | 67.0 | 68.2 | ||
| Cloud gross margin (non-IFRS, in %) | 69.5 | 70.0 | 69.4 | 69.0 | 69.5 | 70.0 | ||
| Software license and support gross margin (IFRS, in %) | 85.7 | 86.5 | 87.1 | 87.9 | 86.9 | 87.0 | ||
| Software license and support gross margin (non-IFRS, in %) | 86.3 | 87.3 | 87.8 | 88.5 | 87.6 | 87.5 | ||
| Cloud and software gross margin (IFRS, in %) | 78.4 | 79.0 | 79.0 | 79.9 | 79.1 | 78.2 | ||
| Cloud and software gross margin (non-IFRS, in %) | 79.7 | 80.5 | 80.4 | 81.2 | 80.5 | 79.4 | ||
| Gross margin (IFRS, in %) | 70.3 | 70.8 | 71.4 | 73.0 | 71.5 | 70.3 | ||
| Gross margin (non-IFRS, in %) | 72.3 | 73.4 | 73.6 | 75.1 | 73.7 | 72.0 | ||
| Operating margin (IFRS, in %) | 15.1 | 14.8 | 18.2 | 18.3 | 16.7 | 14.9 | ||
| Operating margin (non-IFRS, in %) | 27.4 | 28.8 | 30.7 | 30.9 | 29.6 | 23.7 | ||
| ATS segment – Cloud gross margin (in %) | 67.7 | 68.2 | 67.6 | 66.8 | 67.6 | 67.8 | ||
| ATS segment – Gross margin (in %) | 72.8 | 73.9 | 74.4 | 74.8 | 74.0 | 71.8 | ||
| ATS segment – Segment margin in % | 36.9 | 38.5 | 39.7 | 38.9 | 38.5 | 32.4 | ||
| Qualtrics segment – Cloud gross margin (in %) | 92.2 | 92.4 | 91.6 | 90.2 | 91.5 | 89.6 | ||
| Qualtrics segment – Segment gross margin (in %) | 79.5 | 80.3 | 80.7 | 78.1 | 79.6 | 78.9 | ||
| Qualtrics segment – Segment margin (in %) | 6.2 | 6.3 | 5.9 | 1.6 | 4.7 | 3.1 |
9/23
| Key Profit Ratios | ||||||||
| Effective tax rate (IFRS, in %) | 20.0 | 19.7 | 18.9 | 26.4 | 21.5 | 33.1 | ||
| Effective tax rate (non-IFRS, in %) | 18.7 | 19.2 | 18.2 | 23.2 | 20.0 | 25.7 | ||
| Earnings per share, basic (IFRS, in €) | 0.88 | 1.15 | 1.19 | 1.23 | 4.46 | 0.63 | ||
| Earnings per share, basic (non-IFRS, in €) | 1.40 | 1.75 | 1.74 | 1.85 | 6.73 | 1.00 | ||
| Order Entry and current cloud backlog | ||||||||
| Current cloud backlog | 7,628 | 7,766 | 8,171 | 9,447 | 9,447 | 9,731 | ||
| % change – yoy | 15 | 17 | 24 | 32 | 32 | 28 | ||
| % change constant currency – yoy | 19 | 20 | 22 | 26 | 26 | 23 | ||
| SAP S/4HANA Current cloud backlog | 1,036 | 1,130 | 1,283 | 1,707 | 1,707 | 1,925 | ||
| % change – yoy | 39 | 45 | 60 | 84 | 84 | 86 | ||
| % change constant currency – yoy | 43 | 48 | 58 | 76 | 76 | 79 | ||
| Share of cloud orders greater than €5 million based on total cloud order entry volume (in %) | 27 | 34 | 40 | 49 | 41 | 45 | ||
| Share of cloud orders smaller than €1 million based on total cloud order entry volume (in %) | 39 | 32 | 31 | 22 | 28 | 26 | ||
| Share of orders greater than €5 million based on total software order entry volume (in %) | 23 | 22 | 31 | 24 | 25 | 40 | ||
| Share of orders smaller than €1 million based on total software order entry volume (in %) | 42 | 43 | 41 | 36 | 39 | 33 | ||
| Liquidity and Cash Flow | ||||||||
| Net cash flows from operating activities | 3,085 | 686 | 1,183 | 1,269 | 6,223 | 2,482 | ||
| Capital expenditure | –153 | –191 | –202 | –255 | –800 | –221 | ||
| Payments of lease liabilities | –84 | –92 | –99 | –98 | –374 | –95 | ||
| Free cash flow | 2,848 | 403 | 881 | 916 | 5,049 | 2,165 | ||
| % of total revenue | 45 | 6 | 13 | 11 | 18 | 31 | ||
| % of profit after tax (IFRS) | 266 | 28 | 62 | 64 | 94 | 343 | ||
| Group liquidity | 11,573 | 8,548 | 9,375 | 11,530 | 11,530 | 11,283 | ||
| Financial debt (–) | –14,230 | –13,116 | –12,994 | –13,094 | –13,094 | –12,171 | ||
| Net debt (–) | –2,658 | –4,568 | –3,619 | –1,563 | –1,563 | –888 | ||
| Financial Position | ||||||||
| Cash and cash equivalents | 10,332 | 7,764 | 7,943 | 8,898 | 8,898 | 8,942 | ||
| Goodwill | 29,328 | 29,020 | 29,600 | 31,090 | 31,090 | 32,159 | ||
| Total assets | 66,477 | 63,075 | 65,029 | 71,169 | 71,169 | 76,374 | ||
| Contract liabilities (current) | 6,568 | 5,958 | 4,627 | 4,431 | 4,431 | 7,630 | ||
| Equity ratio (total equity in % of total assets) | 52 | 54 | 57 | 58 | 58 | 56 | ||
| Non-Financials | ||||||||
| Number of employees (quarter end)1 | 103,142 | 103,876 | 105,015 | 107,415 | 107,415 | 109,798 | ||
| Employee retention (in %, rolling 12 months) | 95.4 | 94.8 | 93.7 | 92.8 | 92.8 | 92.1 | ||
| Women in management (in %, quarter end) | 27.6 | 27.9 | 28.2 | 28.3 | 28.3 | 28.6 | ||
| Net carbon emissions2 (in kilotons) | 30 | 20 | 25 | 35 | 110 | 20 |
1 In full-time equivalents.
2 In CO2 equivalents
Due to rounding, numbers may not add up precisely.
10/23
Primary Financial Statements of SAP Group (IFRS)
| (A) | Consolidated Income Statements |
| (A.1) | Consolidated Income Statements – Quarter |
| € millions, unless otherwise stated | Q1 2022 | Q1 2021 | ∆ in % | ||
| Cloud | 2,820 | 2,145 | 31 | ||
| Software licenses | 317 | 483 | –34 | ||
| Software support | 2,923 | 2,801 | 4 | ||
| Software licenses and support | 3,240 | 3,283 | –1 | ||
| Cloud and software | 6,060 | 5,428 | 12 | ||
| Services | 1,017 | 919 | 11 | ||
| Total revenue | 7,077 | 6,348 | 11 | ||
| Cost of cloud | –898 | –704 | 28 | ||
| Cost of software licenses and support | –422 | –471 | –10 | ||
| Cost of cloud and software | –1,320 | –1,175 | 12 | ||
| Cost of services | –779 | –709 | 10 | ||
| Total cost of revenue | –2,099 | –1,884 | 11 | ||
| Gross profit | 4,979 | 4,464 | 12 | ||
| Research and development | –1,425 | –1,171 | 22 | ||
| Sales and marketing | –1,987 | –1,663 | 20 | ||
| General and administration | –504 | –505 | 0 | ||
| Restructuring | 10 | –157 | <-100 | ||
| Other operating income/expense, net | –20 | –7 | >100 | ||
| Total operating expenses | –6,024 | –5,387 | 12 | ||
| Operating profit (loss) | 1,053 | 960 | 10 | ||
| Other non-operating income/expense, net | –52 | 62 | <-100 | ||
| Finance income | 342 | 547 | –37 | ||
| Finance costs | –398 | –232 | 72 | ||
| Financial income, net | –56 | 315 | <-100 | ||
| Profit (loss) before tax | 945 | 1,337 | –29 | ||
| Income tax expense | –313 | –267 | 17 | ||
| Profit (loss) after tax | 632 | 1,070 | –41 | ||
| Attributable to owners of parent | 740 | 1,040 | –29 | ||
| Attributable to non-controlling interests | –108 | 30 | <-100 | ||
| Earnings per share, basic (in €)1 | 0.63 | 0.88 | –29 | ||
| Earnings per share, diluted (in €)1 | 0.63 | 0.88 | –29 |
1 For the three months ended March 31, 2022 and 2021, the weighted average number of shares was 1,177 million (diluted 1,178 million) and 1,180 million (diluted: 1,180 million), respectively (treasury stock excluded).
Due to rounding, numbers may not add up precisely.
11/23
| (B) | Consolidated Statements of Financial Position |
| as at 03/31/2022 and 12/31/2021 | |||||
| € millions | 2022 | 2021 | |||
| Cash and cash equivalents | 8,942 | 8,898 | |||
| Other financial assets | 2,544 | 2,758 | |||
| Trade and other receivables | 9,456 | 6,352 | |||
| Other non-financial assets | 1,888 | 1,633 | |||
| Tax assets | 537 | 403 | |||
| Total current assets | 23,367 | 20,044 | |||
| Goodwill | 32,159 | 31,090 | |||
| Intangible assets | 4,032 | 3,965 | |||
| Property, plant, and equipment | 4,991 | 4,977 | |||
| Other financial assets | 6,597 | 6,275 | |||
| Trade and other receivables | 118 | 147 | |||
| Other non-financial assets | 2,765 | 2,628 | |||
| Tax assets | 281 | 263 | |||
| Deferred tax assets | 2,065 | 1,779 | |||
| Total non-current assets | 53,007 | 51,125 | |||
| Total assets | 76,374 | 71,169 | |||
| € millions | 2022 | 2021 | |||
| Trade and other payables | 1,693 | 1,580 | |||
| Tax liabilities | 632 | 304 | |||
| Financial liabilities | 7,143 | 4,528 | |||
| Other non-financial liabilities | 3,838 | 5,203 | |||
| Provisions | 91 | 89 | |||
| Contract liabilities | 7,630 | 4,431 | |||
| Total current liabilities | 21,027 | 16,136 | |||
| Trade and other payables | 114 | 122 | |||
| Tax liabilities | 881 | 827 | |||
| Financial liabilities | 10,070 | 11,042 | |||
| Other non-financial liabilities | 1,053 | 860 | |||
| Provisions | 365 | 355 | |||
| Deferred tax liabilities | 290 | 291 | |||
| Contract liabilities | –44 | 13 | |||
| Total non-current liabilities | 12,729 | 13,510 | |||
| Total liabilities | 33,757 | 29,645 | |||
| Issued capital | 1,229 | 1,229 | |||
| Share premium | 2,088 | 1,918 | |||
| Retained earnings | 37,661 | 37,022 | |||
| Other components of equity | 2,524 | 1,756 | |||
| Treasury shares | –3,653 | –3,072 | |||
| Equity attributable to owners of parent | 39,850 | 38,852 | |||
| Non-controlling interests | 2,768 | 2,670 | |||
| Total equity | 42,618 | 41,523 | |||
| Total equity and liabilities | 76,374 | 71,169 | |||
Due to rounding, numbers may not add up precisely.
12/23
| (C) | Consolidated Statements of Cash Flows |
| € millions | Q1 2022 | Q1 2021 | |||
| Profit (loss) after tax | 632 | 1,070 | |||
| Adjustments to reconcile profit (loss) after tax to net cash flows from operating activities: | |||||
| Depreciation and amortization | 460 | 436 | |||
| Share-based payment expense | 471 | 472 | |||
| Income tax expense | 313 | 267 | |||
| Financial income, net | 56 | –315 | |||
| Decrease/increase in allowances on trade receivables | 17 | 0 | |||
| Other adjustments for non-cash items | –20 | 119 | |||
| Decrease/increase in trade and other receivables | –361 | 185 | |||
| Decrease/increase in other assets | –356 | –108 | |||
| Increase/decrease in trade payables, provisions, and other liabilities | –1,144 | –936 | |||
| Increase/decrease in contract liabilities | 3,036 | 2,503 | |||
| Share-based payments | –139 | –106 | |||
| Interest paid | –85 | –83 | |||
| Interest received | 22 | 8 | |||
| Income taxes paid, net of refunds | –421 | –425 | |||
| Net cash flows from operating activities | 2,482 | 3,085 | |||
| Business combinations, net of cash and cash equivalents acquired | –612 | –930 | |||
| Purchase of intangible assets or property, plant, and equipment | –221 | –153 | |||
| Proceeds from sales of intangible assets or property, plant, and equipment | 27 | 21 | |||
| Purchase of equity or debt instruments of other entities | –1,521 | –228 | |||
| Proceeds from sales of equity or debt instruments of other entities | 1,658 | 322 | |||
| Cash flows from advances (supply chain financing) | –1,093 | 0 | |||
| Net cash flows from investing activities | –1,762 | –967 | |||
| Dividends paid on non-controlling interests | –2 | –2 | |||
| Purchase of treasury shares | –581 | 0 | |||
| Proceeds from changes in ownership interests in subsidiaries that do not result in the loss of control | 20 | 1,847 | |||
| Payments for taxes related to net share settlement of equity awards | –190 | 0 | |||
| Proceeds from borrowings | 0 | 1,450 | |||
| Repayments of borrowings | –944 | –550 | |||
| Payments of lease liabilities | –95 | –84 | |||
| Cash flows with funders (supply chain financing) | 1,066 | 0 | |||
| Net cash flows from financing activities | –725 | 2,661 | |||
| Effect of foreign currency rates on cash and cash equivalents | 50 | 243 | |||
| Net decrease/increase in cash and cash equivalents | 44 | 5,022 | |||
| Cash and cash equivalents at the beginning of the period | 8,898 | 5,311 | |||
| Cash and cash equivalents at the end of the period | 8,942 | 10,332 |
Due to rounding, numbers may not add up precisely.
13/23
| (D) | Basis of Non-IFRS Presentation |
We disclose certain financial measures such as revenue (non-IFRS), expense (non-IFRS), and profit measures (non-IFRS) that are not prepared in accordance with IFRS and are therefore considered non-IFRS financial measures.
For a more detailed description of all of SAP’s non-IFRS measures and their limitations as well as our constant currency and free cash flow figures, see Explanation of Non-IFRS Measures online.
14/23
| (E) | Reconciliation from Non-IFRS Numbers to IFRS Numbers |
| (E.1) | Reconciliation from Non-IFRS Numbers to IFRS Numbers – Quarter |
| Q1 2022 | Q1 2021 | ∆ in % | |||||||||||
| € millions, unless otherwise stated | IFRS | Adj. | Non- IFRS |
Currency Impact |
Non-IFRS Constant Currency |
IFRS | Adj. | Non- IFRS |
IFRS | Non- IFRS |
Non-IFRS Constant Currency1 |
||
| Revenue Numbers | |||||||||||||
| Cloud | 2,820 | 2,820 | –129 | 2,691 | 2,145 | 2,145 | 31 | 31 | 25 | ||||
| Software licenses | 317 | 317 | –10 | 307 | 483 | 483 | –34 | –34 | –36 | ||||
| Software support | 2,923 | 2,923 | –94 | 2,830 | 2,801 | 2,801 | 4 | 4 | 1 | ||||
| Software licenses and support | 3,240 | 3,240 | –104 | 3,136 | 3,283 | 3,283 | –1 | –1 | –4 | ||||
| Cloud and software | 6,060 | 6,060 | –233 | 5,827 | 5,428 | 5,428 | 12 | 12 | 7 | ||||
| Services | 1,017 | 1,017 | –38 | 979 | 919 | 919 | 11 | 11 | 7 | ||||
| Total revenue | 7,077 | 7,077 | –271 | 6,806 | 6,348 | 6,348 | 11 | 11 | 7 | ||||
| Operating Expense Numbers | |||||||||||||
| Cost of cloud | –898 | 53 | –845 | –704 | 51 | –654 | 28 | 29 | |||||
| Cost of software licenses and support | –422 | 17 | –405 | –471 | 21 | –450 | –10 | –10 | |||||
| Cost of cloud and software | –1,320 | 70 | –1,250 | –1,175 | 71 | –1,103 | 12 | 13 | |||||
| Cost of services | –779 | 46 | –733 | –709 | 52 | –657 | 10 | 12 | |||||
| Total cost of revenue | –2,099 | 116 | –1,983 | –1,884 | 123 | –1,760 | 11 | 13 | |||||
| Gross profit | 4,979 | 116 | 5,095 | 4,464 | 123 | 4,587 | 12 | 11 | |||||
| Research and development | –1,425 | 102 | –1,323 | –1,171 | 94 | –1,077 | 22 | 23 | |||||
| Sales and marketing | –1,987 | 205 | –1,782 | –1,663 | 188 | –1,475 | 20 | 21 | |||||
| General and administration | –504 | 212 | –293 | –505 | 215 | –290 | 0 | 1 | |||||
| Restructuring | 10 | –10 | 0 | –157 | 157 | 0 | <-100 | NA | |||||
| Other operating income/expense, net | –20 | 0 | –20 | –7 | 0 | –7 | >100 | >100 | |||||
| Total operating expenses | –6,024 | 624 | –5,400 | 209 | –5,191 | –5,387 | 778 | –4,609 | 12 | 17 | 13 | ||
| Profit Numbers | |||||||||||||
| Operating profit (loss) | 1,053 | 624 | 1,677 | –62 | 1,615 | 960 | 778 | 1,738 | 10 | –4 | –7 | ||
| Other non-operating income/expense, net | –52 | 0 | –52 | 62 | 0 | 62 | <-100 | <-100 | |||||
| Finance income | 342 | 0 | 342 | 547 | 0 | 547 | –37 | –37 | |||||
| Finance costs | –398 | 0 | –398 | –232 | 0 | –232 | 72 | 72 | |||||
| Financial income, net | –56 | 0 | –56 | 315 | 0 | 315 | <-100 | <-100 | |||||
| Profit (loss) before tax | 945 | 624 | 1,569 | 1,337 | 778 | 2,115 | –29 | –26 | |||||
| Income tax expense | –313 | –90 | –403 | –267 | –127 | –395 | 17 | 2 | |||||
| Profit (loss) after tax | 632 | 534 | 1,166 | 1,070 | 650 | 1,720 | –41 | –32 | |||||
| Attributable to owners of parent | 740 | 438 | 1,178 | 1,040 | 606 | 1,646 | –29 | –28 | |||||
| Attributable to non-controlling interests | –108 | 96 | –12 | 30 | 45 | 74 | <-100 | <-100 | |||||
| Key Ratios | |||||||||||||
| Operating margin (in %) | 14.9 | 23.7 | 23.7 | 15.1 | 27.4 | –0.2pp | –3.7pp | –3.6pp | |||||
| Effective tax rate (in %)2 | 33.1 | 25.7 | 20.0 | 18.7 | 13.1pp | 7.0pp | |||||||
| Earnings per share, basic (in €) | 0.63 | 1.00 | 0.88 | 1.40 | –29 | –28 |
1 Constant currency period-over-period changes are calculated by comparing the current year’s non-IFRS constant currency numbers with the non-IFRS numbers of the previous year’s respective period.
2 The difference between our effective tax rate (IFRS) and effective tax rate (non-IFRS) in Q1 2022 mainly resulted from tax effects of share-based payment expenses and acquisition-related charges. The difference between our effective tax rate (IFRS) and effective tax rate (non-IFRS) in Q1 2021 mainly resulted from tax effects of share-based payment expenses, acquisition-related charges and restructuring expenses.
Due to rounding, numbers may not add up precisely.
15/23
| (F) | Non-IFRS Adjustments – Actuals and Estimates |
| € millions | Estimated Amounts for Full Year 2022 |
Q1 2022 | Q1 2021 | ||
| Operating profit (loss) (IFRS) | 1,053 | 960 | |||
| Adjustment for acquisition-related charges | 580–680 | 164 | 149 | ||
| Adjustment for share-based payment expenses | 2,500–2,800 | 471 | 472 | ||
| Adjustment for restructuring | 80–100 | –10 | 157 | ||
| Operating expense adjustments | 624 | 778 | |||
| Operating profit (loss) (non-IFRS) | 1,677 | 1,738 |
Due to rounding, numbers may not add up precisely.
| (G) | Non-IFRS Adjustments by Functional Areas |
| Q1 2022 | Q1 2021 | |||||||||||
| € millions | IFRS | Acquisition- Related |
SBP1 | Restruc- turing |
Non-IFRS | IFRS | Acquisition- Related |
SBP1 | Restruc- turing |
Non-IFRS | ||
| Cost of cloud | –898 | 42 | 11 | 0 | –845 | –704 | 39 | 11 | 0 | –654 | ||
| Cost of software licenses and support | –422 | 8 | 9 | 0 | –405 | –471 | 8 | 13 | 0 | –450 | ||
| Cost of services | –779 | 5 | 41 | 0 | –733 | –709 | 5 | 47 | 0 | –657 | ||
| Research and development | –1,425 | 2 | 100 | 0 | –1,323 | –1,171 | 2 | 92 | 0 | –1,077 | ||
| Sales and marketing | –1,987 | 101 | 103 | 0 | –1,782 | –1,663 | 90 | 98 | 0 | –1,475 | ||
| General and administration | –504 | 6 | 206 | 0 | –293 | –505 | 5 | 210 | 0 | –290 | ||
| Restructuring | 10 | 0 | 0 | –10 | 0 | –157 | 0 | 0 | 157 | 0 | ||
| Other operating income/expense, net | –20 | 0 | 0 | 0 | –20 | –7 | 0 | 0 | 0 | –7 | ||
| Total operating expenses | –6,024 | 164 | 471 | –10 | –5,400 | –5,387 | 149 | 472 | 157 | –4,609 |
1 Share-based Payments
Due to rounding, numbers may not add up precisely.
If not presented in a separate line item in our income statement, the restructuring expenses would break down as follows:
| € millions | Q1 2022 | Q1 2021 | |||
| Cost of cloud | 17 | –130 | |||
| Cost of software licenses and support | –1 | –3 | |||
| Cost of services | –2 | –14 | |||
| Research and development | –3 | –9 | |||
| Sales and marketing | –1 | –2 | |||
| General and administration | 0 | –1 | |||
| Restructuring expenses | 10 | –157 |
Due to rounding, numbers may not add up precisely.
16/23
| (H) | Segment Reporting |
| (H.1) | Segment Policies and Segment Changes |
SAP has two reportable segments: the Applications, Technology & Services segment and the Qualtrics segment.
In the first quarter 2022, the following changes to the composition of our operating segments occurred:
– SAP acquired Taulia, a leading provider of working capital management solutions. This acquisition led to a new operating segment, however due to its size Taulia is not a reportable segment.
– In the beginning of 2022, the Services segment was dissolved and integrated into the former Applications, Technology & Support segment which was therefore re-named to Applications, Technology & Services. The segment information for comparative prior periods were restated to conform with the new segment composition.
Our non-reportable Business Process Intelligence segment was renamed into SAP Signavio segment in the first quarter of 2022. There were no changes to the composition of this segment.
For a more detailed description of SAP’s segment reporting, see Note (C.1) “Results of Segments” of our Integrated Report 2021.
| (H.2) | Segment Reporting – Quarter |
Applications, Technology & Services
| € millions, unless otherwise stated | Q1 2022 | Q1 2021 | ∆ in % | ∆ in % | |
| (non-IFRS) | Actual Currency |
Constant Currency |
Actual Currency |
Actual Currency |
Constant Currency |
| Cloud | 2,495 | 2,385 | 1,952 | 28 | 22 |
| Software licenses | 315 | 305 | 482 | –35 | –37 |
| Software support | 2,923 | 2,829 | 2,800 | 4 | 1 |
| Software licenses and support | 3,238 | 3,134 | 3,283 | –1 | –5 |
| Cloud and software | 5,732 | 5,519 | 5,234 | 10 | 5 |
| Services | 963 | 928 | 872 | 10 | 6 |
| Total segment revenue | 6,695 | 6,447 | 6,106 | 10 | 6 |
| Cost of cloud | –804 | –765 | –630 | 28 | 21 |
| Cost of software licenses and support | –407 | –392 | –422 | –3 | –7 |
| Cost of cloud and software | –1,211 | –1,158 | –1,052 | 15 | 10 |
| Cost of services | –678 | –656 | –606 | 12 | 8 |
| Total cost of revenue | –1,889 | –1,814 | –1,658 | 14 | 9 |
| Segment gross profit | 4,806 | 4,633 | 4,448 | 8 | 4 |
| Other segment expenses | –2,638 | –2,550 | –2,197 | 20 | 16 |
| Segment profit (loss) | 2,168 | 2,083 | 2,251 | –4 | –7 |
| Margins | |||||
| Cloud gross margin (in %) | 67.8 | 67.9 | 67.7 | 0.1pp | 0.2pp |
| Segment gross margin (in %) | 71.8 | 71.9 | 72.8 | –1.1pp | –1.0pp |
| Segment margin (in %) | 32.4 | 32.3 | 36.9 | –4.5pp | –4.6pp |
Due to rounding, numbers may not add up precisely.
17/23
Qualtrics
| € millions, unless otherwise stated | Q1 2022 | Q1 2021 | ∆ in % | ∆ in % | |
| (non-IFRS) | Actual Currency |
Constant Currency |
Actual Currency |
Actual Currency |
Constant Currency |
| Cloud | 269 | 252 | 159 | 69 | 58 |
| Cloud and software | 269 | 252 | 159 | 69 | 58 |
| Services | 50 | 47 | 43 | 18 | 10 |
| Total segment revenue | 320 | 299 | 202 | 58 | 48 |
| Cost of cloud | –28 | –26 | –12 | >100 | >100 |
| Cost of cloud and software | –28 | –26 | –12 | >100 | >100 |
| Cost of services | –40 | –37 | –29 | 37 | 29 |
| Total cost of revenue | –68 | –64 | –41 | 64 | 54 |
| Segment gross profit | 252 | 235 | 161 | 57 | 46 |
| Other segment expenses | –242 | –224 | –148 | 64 | 51 |
| Segment profit (loss) | 10 | 11 | 13 | –22 | –12 |
| Margins | |||||
| Cloud gross margin (in %) | 89.6 | 89.5 | 92.2 | –2.6pp | –2.7pp |
| Segment gross margin (in %) | 78.9 | 78.7 | 79.5 | –0.7pp | –0.9pp |
| Segment margin (in %) | 3.1 | 3.7 | 6.2 | –3.2pp | –2.5pp |
Due to rounding, numbers may not add up precisely.
18/23
| (I) | Reconciliation of Cloud Revenues and Margins |
| (I.1) | Reconciliation of Cloud Revenues and Margins – Quarter |
| Q1 2022 | Q1 2021 | ∆ in % | ||||||||
| € millions, unless otherwise stated | IFRS | Non- IFRS |
Currency Impact |
Non-IFRS Constant Currency |
IFRS | Non- IFRS |
IFRS | Non- IFRS |
Non-IFRS Constant Currency3 |
|
| Cloud revenue – SaaS/PaaS1 | Intelligent Spend | 808 | 808 | –43 | 765 | 658 | 658 | 23 | 23 | 16 |
| Other | 1,776 | 1,776 | –76 | 1,700 | 1,273 | 1,273 | 40 | 40 | 34 | |
| Total | 2,585 | 2,585 | –120 | 2,465 | 1,931 | 1,931 | 34 | 34 | 28 | |
| Cloud revenue – IaaS2 | 235 | 235 | –9 | 226 | 214 | 214 | 10 | 10 | 5 | |
| Cloud revenue | 2,820 | 2,820 | –129 | 2,691 | 2,145 | 2,145 | 31 | 31 | 25 | |
| Cloud
gross margin – SaaS/PaaS1 (in %) |
Intelligent Spend | 80.7 | 80.7 | 80.6 | 78.1 | 78.3 | 2.5pp | 2.4pp | 2.2pp | |
| Other | 67.9 | 70.7 | 70.6 | 67.3 | 71.0 | 0.6pp | –0.3pp | –0.4pp | ||
| Total | 71.9 | 73.9 | 73.7 | 71.0 | 73.5 | 0.9pp | 0.3pp | 0.2pp | ||
| Cloud gross margin – IaaS2 (in %) |
26.9 | 27.6 | 29.6 | 32.5 | 33.3 | –5.6pp | –5.7pp | –3.8pp | ||
| Cloud gross margin (in %) | 68.2 | 70.0 | 70.0 | 67.2 | 69.5 | 1.0pp | 0.5pp | 0.5pp | ||
1 Software as a Service/Platform as a Service
2 Infrastructure as a Service
3 Constant currency period-over-period changes are calculated by comparing the current year’s non-IFRS constant currency numbers with the non-IFRS numbers of the previous year’s respective period.
As of Q1 2022, the allocation of cloud revenues and -expenses to cloud service models has been aligned to internal reporting structures. Presented 2021 comparable periods have been updated accordingly.
Due to rounding, numbers may not add up precisely.
19/23
| (J) | Revenue by Region (IFRS and Non-IFRS) |
| (J.1) | Revenue by Region (IFRS and Non-IFRS) – Quarter |
| Q1 2022 | Q1 2021 | ∆ in % | |||||||
| € millions | IFRS | Non-IFRS | Currency Impact |
Non-IFRS Constant Currency |
IFRS | Non-IFRS | IFRS | Non-IFRS | Non-IFRS Constant Currency1 |
| Cloud Revenue by Region | |||||||||
| EMEA | 982 | 982 | –22 | 960 | 745 | 745 | 32 | 32 | 29 |
| Americas | 1,480 | 1,480 | –100 | 1,380 | 1,114 | 1,114 | 33 | 33 | 24 |
| APJ | 358 | 358 | –7 | 351 | 286 | 286 | 25 | 25 | 23 |
| Cloud revenue | 2,820 | 2,820 | –129 | 2,691 | 2,145 | 2,145 | 31 | 31 | 25 |
| Cloud and Software Revenue by Region | |||||||||
| EMEA | 2,627 | 2,627 | –38 | 2,589 | 2,433 | 2,433 | 8 | 8 | 6 |
| Americas | 2,511 | 2,511 | –174 | 2,338 | 2,118 | 2,118 | 19 | 19 | 10 |
| APJ | 922 | 922 | –21 | 900 | 877 | 877 | 5 | 5 | 3 |
| Cloud and software revenue | 6,060 | 6,060 | –233 | 5,827 | 5,428 | 5,428 | 12 | 12 | 7 |
| Total Revenue by Region | |||||||||
| Germany | 1,061 | 1,061 | –1 | 1,059 | 951 | 951 | 12 | 12 | 11 |
| Rest of EMEA | 2,004 | 2,004 | –42 | 1,962 | 1,884 | 1,884 | 6 | 6 | 4 |
| Total EMEA | 3,065 | 3,065 | –43 | 3,022 | 2,835 | 2,835 | 8 | 8 | 7 |
| United States | 2,409 | 2,409 | –161 | 2,248 | 2,035 | 2,035 | 18 | 18 | 10 |
| Rest of Americas | 550 | 550 | –43 | 507 | 486 | 486 | 13 | 13 | 4 |
| Total Americas | 2,959 | 2,959 | –204 | 2,755 | 2,521 | 2,521 | 17 | 17 | 9 |
| Japan | 311 | 311 | 6 | 317 | 322 | 322 | –3 | –3 | –1 |
| Rest of APJ | 743 | 743 | –30 | 713 | 670 | 670 | 11 | 11 | 6 |
| Total APJ | 1,053 | 1,053 | –24 | 1,029 | 992 | 992 | 6 | 6 | 4 |
| Total revenue | 7,077 | 7,077 | –271 | 6,806 | 6,348 | 6,348 | 11 | 11 | 7 |
1) Constant currency period-over-period changes are calculated by comparing the current year’s non-IFRS constant currency numbers with the non-IFRS numbers of the previous year’s respective period.
Due to rounding, numbers may not add up precisely.
20/23
| (K) | Employees by Region and Functional Areas |
| Full-time equivalents | 3/31/2022 | 3/31/2021 | ||||||
| EMEA | Americas | APJ | Total | EMEA | Americas | APJ | Total | |
| Cloud and software | 6,029 | 4,634 | 5,172 | 15,835 | 5,896 | 4,486 | 5,089 | 15,471 |
| Services | 8,369 | 5,710 | 5,948 | 20,027 | 8,468 | 5,863 | 6,079 | 20,410 |
| Research and development | 15,693 | 6,534 | 10,651 | 32,878 | 14,073 | 6,103 | 9,944 | 30,120 |
| Sales and marketing | 11,665 | 11,968 | 5,621 | 29,254 | 10,404 | 10,450 | 4,924 | 25,779 |
| General and administration | 3,386 | 2,206 | 1,246 | 6,837 | 3,407 | 2,188 | 1,243 | 6,838 |
| Infrastructure | 2,706 | 1,401 | 860 | 4,966 | 2,501 | 1,258 | 766 | 4,524 |
| SAP Group (12/31) | 47,848 | 32,453 | 29,497 | 109,798 | 44,749 | 30,348 | 28,045 | 103,142 |
| Thereof acquisitions1 | 173 | 214 | 8 | 395 | 359 | 41 | 26 | 426 |
| SAP Group (three months’ end average) | 47,389 | 32,152 | 29,324 | 108,864 | 44,389 | 30,295 | 28,007 | 102,691 |
1 Acquisitions closed between January 1 and March 31 of the respective year
21/23
| (L) | Financial Income, Net |
In the first quarter of 2022, finance income mainly consisted of gains from disposals and fair value adjustments of equity securities totaling €317 million (Q1/2021: €530 million).
In the first quarter of 2022, finance costs were primarily impacted by losses from disposals and fair value adjustments of equity securities amounting to €318 million (Q1/2021: €161 million).
| (M) | Business Combinations |
Taulia
On January 27, 2022, SAP announced its intent to acquire a majority stake of Taulia, a leading provider of working capital management solutions. The acquisition closed in March 2022, following satisfaction of customary closing conditions and regulatory approvals. The acquisition is expected to further expand SAP’s business network capabilities and strengthen SAP’s solutions for the CFO office. Consideration transferred amounted to approx. €0.7 billion. As a result of the preliminary purchase price allocation, mainly goodwill of approximately €0.5 billion and intangible assets of €0.2 billion have been recorded.
As the Taulia acquisition closed only shortly before March 31, 2022, we are still in the process of identifying and measuring the Taulia opening balance sheet assets and liabilities. Thus, the accounting for the Taulia acquisition is incomplete. This relates primarily to intangible assets and tax assets and liabilities but also to the accounting for the supply chain financing transactions offered by Taulia. The supply chain financing related assets and liabilities are included in SAP’s consolidated “Trade and other receivables” as well as current “Financial liabilities” (March 31, 2022: approximately €2.6 billion each). In general, the funds received by Taulia from the banks participating in the financing transactions as investors are classified as “financing cash flow,” and the cash routed through Taulia upon settlement of the receivables subject to supply chain financing on the maturity date are classified as “investing cash flow”.
| (N) | Share Buyback |
In the first three months of 2022, we acquired 5.7 million treasury shares totaling €581 million. We intend to complete the share buyback program of up to €1.0 billion in 2022.
| (O) | Share Based Payments |
Starting in 2022, most of the granted share units under the Move SAP plan will vest after a waiting period of six months and ratably thereafter for ten quarters. Under our previous policy, we serviced obligations arising from the plan with cash payments, but we have since decided to settle future share units predominantly in shares.
In the first three months of 2022, we granted 14.8 million (Q1/2021: 9.6 million) share units. This includes 13.9 million (Q1/2021: 0) share units which we intend to settle in shares. The dilutive effect of outstanding equity-settled share units is reflected in the calculation of earnings per share, diluted.
Obligations from outstanding share units granted before 2022 under the Move SAP plan will continue to be settled in cash and the settlement methods of SAP’s other plans remain unchanged.
Under the Own SAP plan, employees can purchase, on a monthly basis, SAP shares without any required holding period. As part of SAP’s 50th anniversary celebration SAP’s contribution was doubled from 40% to 80% from January to March 2022. The number of shares purchased by our employees under this plan was 2.2 million in the first three months of 2022 (Q1/2021: 1.5 million).
| (P) | Income Tax Related Litigation |
We are subject to ongoing tax audits by domestic and foreign tax authorities. Currently, we are in dispute mainly with the German and only a few foreign tax authorities. The German dispute is in respect of certain secured capital investments, while the few foreign disputes are in respect of the deductibility of intercompany royalty payments and intercompany
22/23
services. In all cases, we expect that a favorable outcome can only be achieved through litigation. For all these matters, we have not recorded a provision as we believe that the tax authorities’ claims have no merit and that no adjustment is warranted. If, contrary to our view, the tax authorities were to prevail in their arguments before court, we would expect to have an additional expense of approximately €1,505 million (2021: €1,283 million) in total (including related interest expenses and penalties of approximately €811 million (2021: €677 million)). The contingent liabilities increased in 2022 mainly due to foreign currency exchange rate fluctuations.
23/23
Serious News for Serious Traders! Try StreetInsider.com Premium Free!
You May Also Be Interested In
- SAP AG (SAP) PT Raised to $220 at JMP Securities
- SAP Q1 results fall short of Wall Street estimates as transformation kicks off
- Hanmi Enters into Clinical Trial Collaboration and Supply Agreement with MSD to Evaluate BH3120 in Combination with KEYTRUDA® (pembrolizumab)
Create E-mail Alert Related Categories
SEC FilingsSign up for StreetInsider Free!
Receive full access to all new and archived articles, unlimited portfolio tracking, e-mail alerts, custom newswires and RSS feeds - and more!
