

Form 6-K Pampa Energy Inc. For: Mar 31
 Tweet
Tweet Share
Share
UNITED STATES
SECURITIES AND EXCHANGE COMMISSION
Washington, D.C. 20549
FORM 6-K
REPORT OF FOREIGN
ISSUER
PURSUANT TO RULE 13a-16 OR 15d-16 UNDER
SECURITIES EXCHANGE ACT OF 1934
For the month of May, 2021
(Commission File No. 001-34429),
PAMPA ENERGIA S.A.
(PAMPA ENERGY INC.)
Argentina
(Jurisdiction of incorporation or organization)
Maipú 1
C1084ABA
City of Buenos Aires
Argentina
(Address of principal executive offices)
(Indicate by check
mark whether the registrant files or will file annual reports under cover of Form 20-F or Form 40-F.)
Form 20-F ___X___ Form 40-F ______
(Indicate
by check mark whether the registrant by furnishing the
information contained in this form is also thereby furnishing the
information to the Commission pursuant to Rule 12g3-2(b) under
the Securities Exchange Act of 1934.)
Yes ______ No ___X___
(If "Yes"
is marked, indicate below the file number assigned to the
registrant in connection with Rule 12g3-2(b): 82- .)
This Form 6-K for Pampa Energía S.A. (“Pampa” or the “Company”) contains:
Exhibit 1: Earning Release
SIGNATURE
Pursuant to the requirements of the Securities Exchange Act of 1934, the registrant has duly caused this report to be signed on its behalf by the undersigned, thereunto duly authorized.
Date: May 11, 2021
| Pampa Energía S.A. | ||
| By: |
/s/ Gustavo Mariani |
|
|
Name: Gustavo Mariani Title: Chief Executive Officer |
||
FORWARD-LOOKING STATEMENTS
This press release may contain forward-looking statements. These statements are statements that are not historical facts, and are based on management's current view and estimates offuture economic circumstances, industry conditions, company performance and financial results. The words "anticipates", "believes", "estimates", "expects", "plans" and similar expressions, as they relate to the company, are intended to identify forward-looking statements. Statements regarding the declaration or payment of dividends, the implementation of principal operating and financing strategies and capital expenditure plans, the direction of future operations and the factors or trends affecting financial condition, liquidity or results of operations are examples of forward-looking statements. Such statements reflect the current views of management and are subject to a number of risks and uncertainties. There is no guarantee that the expected events, trends or results will a ctually occur. The statements are based on many assumptions and factors, including general economic and market conditions, industry conditions, and operating factors. Any changes in such assumptions or factors could cause actual results to differ materially from current expectations.

|
Pampa Energía, the largest independent energy integrated company in Argentina, with active participation in the country’s electricity and gas value chain, announces the results for the quarter ended on March 31, 2021. |
|
Buenos Aires, May 12, 2021 |
Stock information Buenos Aires Stock Exchange Ticker: PAMP
New York Stock Exchange Ticker: PAM 1 ADS = 25 common shares
Share capital net of repurchases and reductions, Market capitalization: For more information, contact: Gustavo Mariani CEO Gabriel Cohen CFO Lida Wang Investor relations and sustainability officer The Pampa Energía
Building Tel: +54 (11) 4344-6000 ri.pampaenergia.com/en |
Basis of presentation As of January 1, 2019, the Company adopted US$ as functional currency for the reporting of its financial information. The presentation of this information in AR$ is converted at transactional FX. However, Edenor (electricity distribution), Transener, TGS and Refinor (holding and others) record their operations in local currency. Thus, the Q1 21 figures are adjusted by inflation as of March 31, 2021 (6.1%), translated to US$ at closing FX of 92.00. Moreover, the Q1 20 figures are adjusted by inflation as of March 31, 2020 (3.8%), translated to US$ at closing FX of 64.47[1]. On December 28, 2020, it was announced the sale of the controlling stake in Edenor. Therefore, the electricity distribution segment is shown as a discontinued operation for the current and comparative periods. Its analysis is detailed in the Appendix. Main results from the Q1 21[2] Consolidated revenues from continuing operations for US$321 million[3], 11% higher than the US$290 million recorded in Q1 20, explained by the new CCGT at CTGEBA, thus higher own gas sales to cover said PPA, higher sale volumes and prices in petrochemicals and the recovery of oil and gas prices, partially offset by lower spot energy revenue and hydrocarbons volume sold. ðPower generation of 4,442 GWh from 15 power plants[4] ðProduction of 43.7 thousand boe per day of hydrocarbons ðSales of 98 thousand tons of petrochemical products Consolidated adjusted EBITDA[5] from continuing operations of US$204 million, 16% higher than the US$175 million in Q1 20, mainly from petrochemicals, and to a lesser extent, from oil and gas, holding and others, and power generation. |
1 For further information, see section 3 of Pampa’s FS.
2 The financial information presented in this document is based on FS prepared according to IFRS in force in Argentina.
3 It does not include sales from discontinued operations for US$229 million and from the affiliates Greenwind, OldelVal, Refinor, CTBSA, Transener and TGS, which at our ownership account for US$97 million. Under IFRS they are not consolidated in Pampa, thus shown as ‘Results from discontinued operations’ and the equity income as ‘Results for participation in joint businesses and associates’.
4 It includes 100% of CTEB and PEMC, assets operated by Pampa but co-controlled by Pampa, with 50% of equity stake.
5 Consolidated adjusted EBITDA represents the results before financial results, income tax, depreciations and amortizations, extraordinary and non-cash income and expense, equity income and other adjustments from the IFRS implementation, and includes affiliates’ EBITDA at our ownership. For further information, see section 3 of this Earnings Release.
| Pampa Energía ● Q1 21 Earning Release ● 1 |
 |
Consolidated gain attributable to the owners of the Company of US$33 million, US$19 million higher than Q1 20, mainly due to better operating margin and assets’ impairment loss in Q1 20 (US$67 million), partially offset by higher losses from the holding of financial instruments and an income tax charge in Q1 21.
Information about the Videoconference
There will be a videoconference to discuss Pampa’s Q1 21 results on Thursday, May 13, 2021, at 10:00 a.m. Eastern Standard Time/11:00 a.m. Buenos Aires Time. The hosts will be Gustavo Mariani, CEO; Gabriel Cohen, CFO and Lida Wang, investor relations and sustainability officer at Pampa.
For those interested in participation, register at bit.ly/Pampa1Q21VideoCall. The videoconference will also be simultaneously webcasted at Pampa’s website ri.pampaenergia.com/en.
You may find additional information on the Company at:
|
ü ri.pampaenergia.com/en ü www.cnv.gov.ar |
ü www.sec.gov ü www.bolsar.com |
| Pampa Energía ● Q1 21 Earning Release ● 2 |
| |
Table of contents
| Pampa Energía ● Q1 21 Earning Release ● 3 |
| |
| 1. | Relevant events |
| 1.1 | Oil and gas segment |
New procedure for gas export
On April 27, 2021, the new procedure for the authorization of natural gas exports was implemented (SE Res. No. 360/21), abolishing all the previous authorizations. New permissions contemplate exports on a firm and preferential basis for Plan Gas.Ar’s awardees and set a minimum sale price equivalent to the off-peak price awarded in round 1.
Natural gas for power generation
On March 25 and April 22, 2021, CAMMESA tendered gas for April and May 2021, respectively. The resulting average price at wellhead for the Neuquina Basin was US$2.30/MBTU and US$3.50/MBTU, respectively. For awardees of the Plan Gas.Ar, including Pampa, the tender was on an interruptible basis, whereas the rest was 30% DoP. Pampa participated in these tenders.
| 1.2 | Edenor |
Tariff increase
Through ENRE Res. No. 107/21 published on April 30, 2021, a 9% increase in Edenor’s final tariff schemes was approved, effective from May 1, 2021. Therefore, the resulting annual CPD update amounts to 20.9%.
Moreover, SE Res. No. 204/21 established that the reference peak energy price for the GUDI segment (except for public health and education entities), AR$3,042/MWh as of August 2019, increased to AR$5,748/MWh as of April 2021.
Hence, the non-residential tariff schedules set on May 2019, which were not updated accordingly with the cost of electricity as of August 2019, were finally updated with the latest cost of electricity as of April 2021.
Debt regularization with CAMMESA
Regarding the electricity purchase payables that distributors owe CAMMESA as of September 2020, on April 28, 2021, the SE published Res. No. 371/21, setting the applicable criteria regulating the Special Liabilities Regularization Scheme (SE Res. No 40/21).
| 1.3 | Appointment of Board members |
On April 29, 2021, Pampa’s Ordinary and Extraordinary Shareholders’ Meeting approved the renewal of the terms of office of Marcelo Mindlin, Damián Mindlin and Carolina Sigwald as non-independent directors, and Brian Henderson, Gerardo Paz and Mauricio Penta as non-independent alternate directors. Moreover, the Board’s meeting renewed Marcelo Mindlin’s appointment as Chairman on the same date, and accepted the resignation of Haroldo Montagu as independent alternate director on May 11, 2021.
| Pampa Energía ● Q1 21 Earning Release ● 4 |
| |
| 2. | Financial highlights |
| 2.1 | Consolidated balance sheet |
| Figures in million | As of 3.31.2021 | As of 12.31.2020 | ||||
| AR$ | US$ FX 92 | AR$ | US$ FX 84.15 | |||
| ASSETS | ||||||
| Property, plant and equipment | 147,018 | 1,598 | 135,445 | 1,610 | ||
| Intangible assets | 3,754 | 41 | 3,455 | 41 | ||
| Right-of-use assets | 926 | 10 | 867 | 10 | ||
| Deferred tax assets | 9,230 | 100 | 9,082 | 108 | ||
| Investments in joint ventures and associates | 56,571 | 615 | 46,229 | 549 | ||
| Financial assets at amortized cost | 9,222 | 100 | 8,428 | 100 | ||
| Financial assets at fair value through profit and loss | 1,030 | 11 | 942 | 11 | ||
| Other assets | 60 | 1 | 57 | 1 | ||
| Trade and other receivables | 3,302 | 36 | 3,631 | 43 | ||
| Total non-current assets | 231,113 | 2,512 | 208,136 | 2,473 | ||
| Inventories | 12,471 | 136 | 9,766 | 116 | ||
| Financial assets at amortized cost | 1,144 | 12 | 2,062 | 25 | ||
| Financial assets at fair value through profit and loss | 28,340 | 308 | 27,382 | 325 | ||
| Derivative financial instruments | 8 | 0 | 1 | - | ||
| Trade and other receivables | 31,622 | 344 | 28,678 | 341 | ||
| Cash and cash equivalents | 9,254 | 101 | 11,900 | 141 | ||
| Total current assets | 82,839 | 900 | 79,789 | 948 | ||
| Assets classified as held for sale | 141,419 | 1,537 | 123,603 | 1,469 | ||
| Total assets | 455,371 | 4,950 | 411,528 | 4,890 | ||
| EQUITY | ||||||
| Equity attributable to owners of the company | 133,502 | 1,451 | 120,247 | 1,428 | ||
| Non-controlling interest | 32,864 | 357 | 28,631 | 341 | ||
| Total equity | 166,366 | 1,808 | 148,878 | 1,769 | ||
| LIABILITIES | ||||||
| Investments in joint ventures and associates | 168 | 2 | 161 | 2 | ||
| Provisions | 12,805 | 139 | 9,326 | 111 | ||
| Income tax liabilities | 11,540 | 125 | 11,004 | 131 | ||
| Taxes payables | 128 | 1 | 128 | 2 | ||
| Deferred tax liabilities | - | - | 93 | 1 | ||
| Defined benefit plans | 1,710 | 19 | 1,460 | 17 | ||
| Borrowings | 126,169 | 1,371 | 115,428 | 1,372 | ||
| Trade and other payables | 1,542 | 17 | 1,418 | 16 | ||
| Total non-current liabilities | 154,062 | 1,675 | 139,018 | 1,652 | ||
| Provisions | 1,502 | 16 | 1,379 | 16 | ||
| Income tax liabilities | 556 | 6 | 897 | 11 | ||
| Taxes payables | 3,751 | 41 | 3,030 | 36 | ||
| Defined benefit plans | 289 | 3 | 298 | 4 | ||
| Salaries and social security payable | 1,316 | 14 | 1,935 | 23 | ||
| Derivative financial instruments | 5 | 0 | 40 | - | ||
| Borrowings | 17,577 | 191 | 20,377 | 242 | ||
| Trade and other payables | 11,074 | 120 | 9,778 | 116 | ||
| Total current liabilities | 36,070 | 392 | 37,734 | 448 | ||
| Liabilities associated to assets classified as held for sale | 98,873 | 1,075 | 85,898 | 1,021 | ||
| Total liabilities | 289,005 | 3,141 | 262,650 | 3,121 | ||
| Total liabilities and equity | 455,371 | 4,950 | 411,528 | 4,890 | ||
| Pampa Energía ● Q1 21 Earning Release ● 5 |
| |
| 2.2 | Consolidated income statement |
| First quarter | ||||||
| Figures in million | 2021 | 2020 | ||||
| AR$ | US$ | AR$ | US$ | |||
| Sales revenue | 28,635 | 321 | 18,036 | 290 | ||
| Cost of sales | (16,353) | (185) | (11,161) | (182) | ||
| Gross profit | 12,282 | 136 | 6,875 | 108 | ||
| Selling expenses | (542) | (7) | (599) | (10) | ||
| Administrative expenses | (2,016) | (23) | (1,536) | (25) | ||
| Exploration expenses | (7) | - | (4) | - | ||
| Other operating income | 976 | 11 | 709 | 11 | ||
| Other operating expenses | (3,050) | (33) | (458) | (8) | ||
| Results for part. in joint businesses and associates | 2,226 | 26 | 2,069 | 32 | ||
| Impairment of PPE, intangible assets and inventories | - | - | (4,316) | (67) | ||
| Impairment of financial assets | (103) | (1) | (69) | (1) | ||
| Operating income | 9,766 | 109 | 2,671 | 40 | ||
| Financial income | 165 | 2 | 142 | 3 | ||
| Financial costs | (3,986) | (45) | (2,643) | (43) | ||
| Other financial results | (2,061) | (24) | (409) | (4) | ||
| Financial results, net | (5,882) | (67) | (2,910) | (44) | ||
| Profit before tax | 3,884 | 42 | (239) | (4) | ||
| Income tax | (715) | (8) | 439 | 8 | ||
| Net income for continuing operations | 3,169 | 34 | 200 | 4 | ||
| Net income (loss) from discontinued operations | 525 | 5 | 743 | 12 | ||
| Net income (loss) for the period | 3,694 | 39 | 943 | 16 | ||
| Attributable to the owners of the Company | 3,152 | 33 | 775 | 14 | ||
| Continuing operations | 3,150 | 33 | 360 | 7 | ||
| Discontinued operations | 2 | 0 | 415 | 7 | ||
| Attributable to the non-controlling interests | 542 | 6 | 168 | 2 | ||
| Net income (loss) per share attributable to shareholders | 2.21 | 0.02 | 0.47 | 0.01 | ||
| From continuing operations | 2.21 | 0.02 | 0.22 | 0.00 | ||
| From discontinued operations | 0.00 | - | 0.25 | 0.00 | ||
| Net income (loss) per ADR attributable to shareholders | 55.29 | 0.58 | 11.87 | 0.22 | ||
| From continuing operations | 55.25 | 0.58 | 5.51 | 0.11 | ||
| From discontinued operations | 0.04 | - | 6.36 | 0.11 | ||
| Average outstanding common shares | 1,425.3 | 1,425.3 | 1,632.4 | 1,632.4 | ||
| Outstanding common shares by the end of period | 1,410.5 | 1,410.5 | 1,596.3 | 1,596.3 | ||
| Pampa Energía ● Q1 21 Earning Release ● 6 |
| |
| 2.3 | Cash and financial borrowings |
| As of March 31, 2021, in US$ million |
Cash1 | Financial debt | Net debt | ||||||||
| Consolidated in FS |
Ownership adjusted | Consolidated in FS |
Ownership adjusted | Consolidated in FS |
Ownership adjusted | ||||||
| Power generation | 176 | 171 | 437 | 437 | 261 | 266 | |||||
| Petrochemicals | - | - | - | - | - | - | |||||
| Holding and others | 21 | 21 | - | - | (21) | (21) | |||||
| Oil and gas | 212 | 212 | 1,126 | 1,126 | 913 | 913 | |||||
| Total under IFRS/Restricted Group | 409 | 404 | 1,562 | 1,562 | 1,154 | 1,159 | |||||
| Affiliates at O/S2 | 149 | 149 | 357 | 357 | 208 | 208 | |||||
| Total with affiliates | 557 | 553 | 1,920 | 1,920 | 1,362 | 1,367 | |||||
Note: It does not include discontinued operations. Financial debt includes accrued interests. 1 It includes cash and cash equivalents, financial assets at fair value with changing results and investments at amortized cost; it excludes Plan Gas’ bonds pending collection. 2 Under IFRS, the affiliates Greenwind, OldelVal, Refinor, CTBSA, Transener and TGS are not consolidated in Pampa.
Debt transactions
As of March 31, 2021, Pampa’s financial debt at the consolidated level under IFRS amounted to US$1,562 million[6]. The average interest rate for US$-bearing indebtedness was 7.4%, currency in which 91% of the Company’s gross debt is denominated, mostly at a fixed rate. AR$ indebtedness’s average interest rate was 38.8%. The life of Pampa’s consolidated financial debt averaged approximately 4.6 years.
The following chart shows the debt principal maturity profile, net of repurchases, expressed in million US$ by the end of Q1 21:
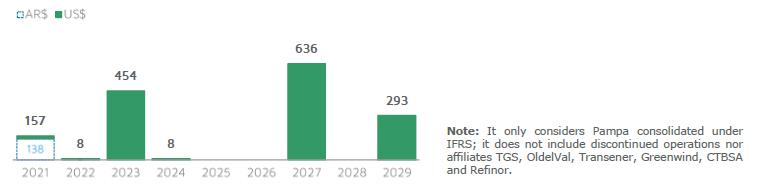
During Q1 21, Pampa executed short-term bank loans for AR$200 million and paid financings for AR$3,200 million at maturity. After the end of the quarter, the Company paid at maturity bank loans for AR$1,500 million.
Regarding our affiliates, after the closing of the quarter, CTBSA executed the ninth amendment to the CTEB Trust, modifying the VRDs’ payment schedule to 25 principal monthly installments from July 25, 2023, instead of 60 installments as from August 25, 2021. Currently, the outstanding VRDs’ principal amounts to US$94 million.
As of this Earnings Release issuance, the Company complies with the covenants established in its debt agreements.
6 It does not consider Edenor, which is classified as discontinued operation in the FS. Thus, Pampa’s consolidated level under IFRS is equivalent to the Restricted Group.
| Pampa Energía ● Q1 21 Earning Release ● 7 |
| |
Summary of debt securities
| Company In million |
Security | Maturity | Amount issued | Amount outstanding | Coupon |
| In US$ | |||||
| Transener1 | CB Series 2 | 2021 | 101 | 86 | 9.75% |
| TGS1 | CB at discount at fixed rate | 2025 | 500 | 482 | 6.75% |
| Pampa | CB Series T at discount & fixed rate | 2023 | 500 | 390 | 7.375% |
| CB Series I at discount & fixed rate | 2027 | 750 | 636 | 7.5% | |
| CB Series III at discount & fixed rate | 2029 | 300 | 293 | 9.125% | |
| In AR$ | |||||
| Pampa | CB Series VI | 2021 | 6,355 | 6,355 | Badlar Privada + 2.5% |
Note: 1 Affiliates are not consolidated in Pampa’s FS, according to IFRS.
Credit rating
| Company | Agency | Rating | |
| Global | Local | ||
| Pampa | S&P | CCC+ | na |
| Moody's | Caa3 | na | |
| FitchRatings | CCC | AA- (long-term) A1+ (short-term) | |
| TGS | S&P | CCC+ | na |
| Moody's | Caa3 | na | |
| Transener | S&P | CCC- | raCCC |
| 2.4 | Buyback of own financial securities[7] |
Pampa
The following table shows the current share buyback program:
| Repurchase program IX | |
| Maximum amount to buyback | US$30 million |
| Maximum price | AR$92.16/common share or US$16/ADR |
| Period in force | 120 days as from March 4, 2021 |
| Status | In process |
In Q1 21, the Company indirectly acquired 1.7 million ADR at an average price of US$13.7/ADR. After the closing of the quarter, the Company indirectly bought 0.7 million ADR at an average price of US$14.0/ADR.
Moreover, Pampa’s Annual Shareholders’ Meeting held on April 29, 2021, approved the capital stock reduction by canceling 56.6 million treasury shares (or 2.3 million ADR). Said reduction is in the process of registration before the Public Registry of Organizations (IGJ).
7 Deemed to be effected transactions. It does not include Edenor, classified as a discontinued operation in the FS.
| Pampa Energía ● Q1 21 Earning Release ● 8 |
| |
On the other hand, between March and April, shares were granted to employees benefited by the Company’s key personnel stock compensation plan. The Company’s Board approved said program on February 10, 2017. The Company currently holds 3.9 million treasury common shares allocated to fund such plan.
As of May 11, 2021, Pampa’s outstanding capital stock amounts to 1,392.1 million common shares (equivalent to 55.7 million ADR).
TGS
The following table shows the details about the share buyback program, terminated on March 22, 2021:
| Repurchase program VII | |
| Maximum amount to buyback | AR$3 billion |
| Maximum price | AR$250/common share or US$8.5/ADR |
| Period in force | 210 days as from August 25, 2020 |
| Status | Completed |
As of May 11, 2021, TGS’s outstanding capital stock amounts to 752.8 million common shares (equivalent to 150.6 million ADR).
On the other hand, in Q1 21, Pampa indirectly acquired 1.5 million TGS’s ADR at an average acquisition cost of US$5.0/ADR. After Q1 21, Pampa indirectly acquired TGS’s 0.4 million ADR at an average cost of US$4.5/ADR. As of May 11, 2021, the Company’s direct and indirect ownership of TGS amounted to 29.0% of its issued capital stock.
| Pampa Energía ● Q1 21 Earning Release ● 9 |
| |
| 3. | Analysis of the Q1 21 results |
| In US$m | Q1 21 | Q1 20 | Variation | ||||||
| Segment | Sales | Adjusted EBITDA | Net Income1 | Sales | Adjusted EBITDA | Net Income1 | Sales | Adjusted EBITDA | Net Income1 |
| Power generation | 161 | 115 | 47 | 134 | 113 | 16 | +20% | +2% | +194% |
| Oil and Gas | 79 | 33 | (33) | 87 | 29 | (26) | -9% | +13% | +27% |
| Petrochemicals | 103 | 18 | 11 | 73 | (2) | (7) | +41% | NA | NA |
| Holding and Others | 6 | 37 | 9 | 6 | 35 | 24 | - | +7% | -63% |
| Eliminations | (28) | - | - | (10) | - | - | +180% | NA | NA |
| Subtotal continuing operations | 321 | 204 | 34 | 290 | 175 | 7 | +11% | +16% | NA |
| Electricity distribution (discont.) | - | 10 | (1) | - | 45 | 7 | NA | -78% | NA |
| Total | 321 | 214 | 33 | 290 | 221 | 14 | +11% | -3% | +136% |
Note: 1 Attributable to the owners of the company.
| Reconciliation of consolidated adjusted EBITDA, in US$ million |
First quarter | ||
| 2021 | 2020 | ||
| Consolidated operating income | 109 | 40 | |
| Consolidated depreciations and amortizations | 43 | 50 | |
| EBITDA | 152 | 90 | |
| Adjustments from generation segment | 2 | 61 | |
| Deletion of equity income | (11) | (10) | |
| Deletion of results for PPE's impairment | - | 56 | |
| Deletion of gain from commercial interests | (6) | (7) | |
| Greenwind's EBITDA adjusted by ownership | 3 | 3 | |
| CTBSA's EBITDA adjusted by ownership | 17 | 20 | |
| Adjustments from oil and gas segment | 11 | (2) | |
| Deletion of equity income | (2) | (2) | |
| Deletion of provision for wells' plugging | 14 | - | |
| Deletion of gain from commercial interests | (1) | (0) | |
| OldelVal's EBITDA adjusted by ownership | 0 | 0 | |
| Adjustments from petrochemicals segment | - | 11 | |
| Deletion of results for inventory impairment | - | 11 | |
| Deletion of gain from commercial interests | - | (0) | |
| Adjustments from holding and others segment | 38 | 15 | |
| Deletion of equity income | (13) | (20) | |
| Deletion of gain from commercial interests | 0 | (1) | |
| Deletion of contigencies provision | 13 | - | |
| TGS's EBITDA adjusted by ownership | 32 | 27 | |
| Transener's EBITDA adjusted by ownership | 4 | 8 | |
| Refinor's EBITDA adjusted by ownership | 2 | 1 | |
| Consolidated adjusted EBITDA, continuing op. | 204 | 175 | |
| At our ownership | 203 | 173 | |
| + Discontinued op. EBITDA: Edenor | 10 | 45 | |
| Consolidated adjusted EBITDA, cont. and discont. op. | 214 | 221 | |
| At our ownership | 208 | 198 | |
| Pampa Energía ● Q1 21 Earning Release ● 10 |
| |
| 3.1 | Analysis of the power generation segment |
| Power generation segment, consolidated Figures in US$ million |
First quarter | |||
| 2021 | 2020 | ∆% | ||
| Sales revenue | 161 | 134 | +20% | |
| Cost of sales | (79) | (56) | +41% | |
| Gross profit | 82 | 78 | +5% | |
| Selling expenses | - | (1) | -100% | |
| Administrative expenses | (7) | (8) | -13% | |
| Other operating income | 6 | 8 | -25% | |
| Other operating expenses | (1) | (2) | -50% | |
| Results for participation in joint businesses | 11 | 10 | +10% | |
| Impairment of PPE and intangible assets | - | (56) | -100% | |
| Operating income | 91 | 29 | +214% | |
| Finance income | 1 | 1 | - | |
| Finance costs | (12) | (15) | -20% | |
| Other financial results | (17) | (1) | NA | |
| Profit (loss) before tax | 63 | 14 | NA | |
| Income tax | (16) | (1) | NA | |
| Net income (loss) for the period | 47 | 13 | +262% | |
| Attributable to owners of the Company | 47 | 16 | +194% | |
| Attributable to non-controlling interests | - | (3) | -100% | |
| Adjusted EBITDA | 115 | 113 | +2% | |
| Adjusted EBITDA at our share ownership | 114 | 111 | +3% | |
| Increases in PPE, intangible and right-of-use assets | 1 | 22 | -95% | |
| Depreciation and amortization | 22 | 23 | -4% | |
In Q1 21, the higher sales accrual for US$27 million is mainly explained by the commissioning of the second CCGT at CTGEBA in July 2020, priced under PPA (SEE Res. No. 287/17 and Energía Plus). Consequently, revenue from the own fuel recognition in the Variable Production Cost (CVP) increased by US$21 million compared to Q1 20. Likewise, the cost of sales increased due to higher gas purchases to our E&P. It is worth highlighting that the fuel trading accrues a minor margin contribution to the segment, and as of Q1 21, fuel management was assigned to CAMMESA within Plan Gas.Ar framework. Moreover, to a lesser extent, sales increase is explained by higher volume demanded in Energía Plus and MAT ER, offset by lower prices in Energía Plus.
These effects were partially offset by the lack of inflation adjustment and AR$ depreciation over spot or legacy energy remuneration as of March 2020. Even though spot energy comprises 59% of the 4,955 MW operated by Pampa[8], in Q1 21 it represented 22% of the segment’s sales. In Q1 21, our spot thermal units priced a 36% lower power capacity compared to Q1 20, billing an average price of US$3.0 thousand per MW-month. Hydroelectric units decreased by 49% compared to Q1 20, accruing an average price of US$1.5 thousand per MW-month.
The power generation operated by Pampa slightly decreased by 4% compared to Q1 20, mainly due to lower thermal dispatch as a result of higher renewable supply at the grid (-597 GWh), in addition to lower gas availability from Bolivia and mandatory dispatch for safety at CTG and CTP (-180 GWh), lower water input at HPPL (-62 GWh), programmed maintenance and outage at CTEB (-18 GWh) and lower wind resource at PEMC (-14 GWh). These effects were partially offset by a higher dispatch at CTGEBA’s second CCGT (+610 GWh), in addition to higher liquid fuel-fired generation at CTPP and CTIW to supply the SADI’s exports (+69 GWh), higher water flows at HIDISA and HINISA (+20 GWh), and higher wind generation at PEPE II and III because in Q1 20 certain windmills were under repair (+5 GWh).
8 Under IFRS, CTEB (567 MW) and PEMC (100 MW) are affiliates; their results are not consolidated in the FS, but they are operated by Pampa and their EBITDA at our equity stake are included in Pampa’s adjusted EBITDA.
| Pampa Energía ● Q1 21 Earning Release ● 11 |
| |
In Q1 21, all power generation units operated by Pampa reached an average availability rate of 94.9%, 170 basis points lower than the 96.6% recorded in Q1 20, mainly due to programmed maintenance at GT02 unit and GT01 unit forced outage at CTEB. Especially, thermal units recorded an availability of 93.5%, 210 basis points lower than the 95.6% availability recorded in Q1 20.
| Power generation's key performance indicators | 2021 | 2020 | Variation | ||||||||||||
| Hydro | Wind | Thermal | Total | Hydro | Wind | Thermal | Total | Hydro | Wind | Thermal | Total | ||||
| Installed capacity as of March (MW) | 938 | 206 | 3,811 | 4,955 | 938 | 206 | 3,607 | 4,751 | - | - | +6% | +4% | |||
| New capacity (%) | - | 100% | 48% | 41% | - | 100% | 40% | 35% | - | - | +8% | +6% | |||
| Market share (%) | 2% | 0% | 9% | 12% | 2% | 1% | 9% | 12% | -0% | -0% | +0% | -0% | |||
| First quarter | |||||||||||||||
| Net generation (GWh) | 382 | 203 | 3,856 | 4,442 | 424 | 212 | 3,972 | 4,608 | -10% | -4% | -3% | -4% | |||
| Volume sold (GWh) | 381 | 214 | 4,070 | 4,665 | 420 | 212 | 4,010 | 4,642 | -9% | +1% | +1% | +1% | |||
| Average price (US$/MWh) | 17 | 71 | 45 | 44 | 27 | 69 | 40 | 40 | -35% | +2% | +11% | +8% | |||
| Average gross margin (US$/MWh) | 7 | 58 | 31 | 30 | 16 | 60 | 32 | 32 | -56% | -4% | -5% | -6% | |||
Note: Gross margin before amortization and depreciation. It includes CTEB and PEMC, operated by Pampa (50% of equity stake).
Q1 21 net operating costs, excluding depreciation and amortizations, increased 64% compared to Q1 20, mainly explained by higher gas purchases due to the commissioning of CTGEBA’s second CCGT. Gas captured 44% of the segment’s operating costs and 31% of the gas-fired at our thermal power plants in Q1 21, whereas in Q1 20 represented 21% of the segment’s operating costs and 7% of our thermal power plants’ consumption. Moreover, the increase in operating expenses is also explained by the higher volume of energy purchase to cover Plus contracts and higher maintenance costs from new units, partially offset by lower cost of energy purchases and AR$-nominated expenses due to devaluation.
The Q1 21 financial results amounted to a net loss of US$28 million, US$13 million more than Q1 20, explained by higher FX losses from AR$-receivables and losses from the holding of financial instruments, partially offset by lower financial interests due to a lesser debt position allocated to the segment.
In Q1 21, our power generation’s adjusted EBITDA increased by 2% to US$115 million, mainly due to the commissioning of the second CCGT at CTGEBA, higher sales in Energía Plus and MAT ER, in addition to dilution of AR$-nominated costs due to devaluation effect. These effects were partially offset by lower remuneration for spot energy, higher volume of energy purchases, CTEB’s outages and lower sale prices at Energía Plus. The adjusted EBITDA considers our proportional 50% stake of CTEB (CTBSA), contributing US$17 million in Q1 21 and US$20 million in Q1 20, and a 50% stake of PEMC (Greenwind) EBITDA, adding US$3 million in both Q1 21 and Q1 20. Moreover, the adjusted EBITDA excludes the recognition of commercial interests from delayed receivables, mostly from CAMMESA, for US$6 million in Q1 21 and US$7 million in Q1 20.
Finally, capital expenditures in Q1 21 decreased by 95% compared to the same period in 2020, mainly explained by the completion of CTGEBA’s CCGT.
Regarding our expansion projects, the following table shows the status summary:
| Project | MW | Marketing | Currency | Awarded price | Estimated capex in US$ million1 |
Date of commissioning | ||||
| Capacity per MW-month |
Variable per MWh |
Total per MWh |
Budget | % Executed @3/31/21 | ||||||
| Loma de la Lata | 15 | SE Res. No. 31/20 | AR$ | 162,000 - 427,500(2) | 324 | 728 | 20 | 97% | TBD(3) | |
| Closing to CCGT Genelba Plus | 400 | PPA for 15 years | US$ | 20,500 | 6 | 34 | 350 | 90% | OC: June 12, 2019(4) CC: July 2, 2020 | |
| Closing to CCGT Ensenada | 280 | PPA for 10 years | US$ | 23,962 | 10.5 | 43 | 200 | 33% | Q2 2022 (est.) | |
Note: 1 Amount without value-added tax. 2 It considers the range of load factor coefficient and the HMRT additional remuneration. 3 Subject to external circumstances. 4 201 MW were remunerated under spot energy until July 1, 2020.
| Pampa Energía ● Q1 21 Earning Release ● 12 |
| |
| 3.2 | Analysis of the oil and gas segment |
| Oil & gas segment, consolidated Figures in US$ million |
First quarter | |||
| 2021 | 2020 | ∆% | ||
| Sales revenue | 79 | 87 | -9% | |
| Cost of sales | (52) | (65) | -20% | |
| Gross profit | 27 | 22 | +23% | |
| Selling expenses | (4) | (7) | -43% | |
| Administrative expenses | (10) | (11) | -9% | |
| Other operating income | 4 | - | NA | |
| Other operating expenses | (16) | (2) | NA | |
| Impairment of financial assets | (1) | - | NA | |
| Results for participation in joint businesses | 2 | 2 | - | |
| Operating income (loss) | 2 | 4 | -50% | |
| Finance income | 1 | 2 | -50% | |
| Finance costs | (32) | (27) | +19% | |
| Other financial results | (21) | (11) | +91% | |
| Profit (loss) before tax | (50) | (32) | +56% | |
| Income tax | 17 | 6 | +183% | |
| Net income (loss) for the period | (33) | (26) | +27% | |
| Adjusted EBITDA | 33 | 29 | +13% | |
| Increases in PPE and intangible assets | 29 | 19 | +54% | |
| Depreciation and amortization | 20 | 27 | -26% | |
In Q1 21, our oil and gas sales decreased by 9% compared to Q1 20, mainly explained by the lower hydrocarbons production, gas exports and gas trading with third parties (US$18 million impact). These effects were partially offset by higher gas and oil prices charged to the demand (US$10 million impact).
Our accrued gas average sale price was US$2.8/MBTU in Q1 21, 21% higher than the US$2.3/MBTU recorded in Q1 20, mainly explained by the Plan Gas.Ar effect, effective as from January 1, 2021, until and including the year 2024, which sets prices for the committed production volumes destined to power plants and the retail segment. The agreed price during the off-peak months is US$3.0/MBTU, whereas for the winter period (May – September) reaches US$4.5/MBTU. On the spot/industries segment, where CAMMESA tenders gas uncovered by Plan Gas.Ar, the price increase was driven as a result of Plan Gas.Ar, but without reaching levels of the said scheme.
Moreover, in Q1 21, 44% of our gas was fired at our thermal power plants[9] and consumed as raw material for our petrochemical plants, 25% was delivered to CAMMESA, 16% to the retail segment, and the balance to the spot/industrial market and exports. Compared with Q1 20, the higher volume destined to our thermal power plants is explained by CTGEBA’s CCGT, while retail’s increase is under the Plan Gas.Ar, offset by lower volumes to CAMMESA and exports.
Our oil and gas segment production registered 43.7 kboe/day in operating terms, 5% lower than Q1 20 and similar to Q4 20. Gas production reached 237 mcf/day, 1% higher than Q4 20 due to Plan Gas.Ar, but 3% lower than Q1 20 due to the domestic demand contraction since lockdown and exports suspension from March 2021. In particular, Rincón del Mangrullo and Río Neuquén reduced their production due to lesser drilling and natural decline (-17 mcf/day year-on-year and -2 mcf/day quarter-on-quarter), in addition to a slight decrease at Sierra Chata (-2 mcf/day year-on-year and -0.4 mcf/day quarter-on-quarter). The lower production was partially offset by a rise at El Mangrullo (+14 mcf/day year-on-year and +5 mcf/day quarter-on-quarter). In said block, evacuation infrastructure was expanded in line with its productivity and upside potential, recording 166 mcf/day in Q1 21 and comprising 69% of our total gas production.
9 Energía Plus and SEE Res. No. 287/17.
| Pampa Energía ● Q1 21 Earning Release ● 13 |
| |
Oil production reached 4.2 kbbl/day in Q1 21, 22% lower than Q1 20, mainly explained by the demand drop since lockdown, affecting production at El Tordillo, Rincón de Aranda and Los Blancos (-1.0 kbbl/day), in addition to a slight decrease of associated oil from Río Neuquén and Rincón del Mangrullo (-0.1 kbbl/day). In Q1 21, 100% of the production was destined to the domestic market, resuming exports in April 2021. Compared to Q4 20, production decreased 4% (-0.2 kbbl/day) due to a decrease in refineries demand, mainly in the Noroeste Basin.
Our accrued oil average sale price in Q1 21 was US$55.4/barrel, 11% higher than Q1 20, explained by the recovery in international prices to pre-pandemic levels, which collapsed in March-May 2020 due to the COVID-19 pandemic. Currently, the traded price is similar to the export parity.
As of March 31, 2021, we accounted for 876 productive wells compared to 858 as of December 31, 2020.
| Oil and gas' key performance indicators |
2021 | 2020 | Variation | |||||||||
| Oil | Gas | Total | Oil | Gas | Total | Oil | Gas | Total | ||||
| First quarter | ||||||||||||
| Volume | ||||||||||||
| Production | ||||||||||||
| In thousand m3/day | 0.7 | 6,721 | 0.8 | 6,914 | -22% | -3% | -5% | |||||
| In million cubic feet/day | 237 | 244 | ||||||||||
| In thousand boe/day | 4.2 | 39.6 | 43.7 | 5.3 | 40.7 | 46.0 | ||||||
| Sales | ||||||||||||
| In thousand m3/day | 0.5 | 6,825 | 0.8 | 7,343 | -39% | -7% | -11% | |||||
| In million cubic feet/day | 241 | 259 | ||||||||||
| In thousand boe/day | 3.2 | 40.2 | 43.4 | 5.3 | 43.2 | 48.5 | ||||||
| Average Price | ||||||||||||
| In US$/bbl | 55.4 | 49.7 | +11% | +21% | ||||||||
| In US$/MBTU | 2.8 | 2.3 | ||||||||||
Note: Net production in Argentina. Gas volume standardized at 9,300 kilocalories (kCal).
Net operating costs in Q1 21, excluding depreciation and amortizations, didn’t register variations compared to Q1 20. Lower expenses are related to lesser hydrocarbon demand (lower contractor fees and increase of oil stock, lower gas purchases to third-parties for trading), also affected by lower gas exports, better productivity at El Mangrullo and dilution of AR$-nominated costs resulting from devaluation. However, these effects are partially offset by higher royalties and taxes due to better prices and higher gas transportation costs resulting from higher production at El Mangrullo. Moreover, in Q1 21, other net operating expenses were recorded due to the provision of wells’ plugging, partially offset by the contribution of retail’s Plan Gas.Ar. Quarter-on-quarter, net operating expenses increased 21%, mainly because of the provision mentioned above, higher royalties and taxes due to better prices, and more gas exports, partially offset by lower costs related to lower oil demand. In particular, in Q1 21, the lifting cost[10] reached US$5.8 per produced boe, 19% lower than the US$7.2 per boe recorded in Q1 20 and 2% lower quarter-on-quarter.
In Q1 21, financial results registered a net loss of US$52 million, US$16 million higher than Q1 20, mainly because of the gain from the repurchase of own CBs recorded in Q1 20, in addition to an increase in financial interests as a result of higher debt stock allocated to the segment.
Our oil and gas’ adjusted EBITDA amounted to US$33 million in Q1 21, 13% higher than Q1 20, mainly due to better sale prices, partially offset by a decrease in production due to lower demand, especially oil’s, lower gas exports and higher royalties and taxes due to better prices. The adjusted EBITDA in Q1 21 excludes the wells’ plugging provision for US$14 million and the recognition of commercial interests due to collection delays, mostly charged to CAMMESA, for US$1 million.
Finally, the segment’s capital expenditures increased by 54% vs. Q1 20, explained by the commitments under Plan Gas.Ar, therefore drilling and completion activities at gas fields reactivated.
10 Metric equivalent to cost of sales excluding purchase and inventory, royalties, direct taxes and depreciations and amortizations.
| Pampa Energía ● Q1 21 Earning Release ● 14 |
| |
| 3.3 | Analysis of the petrochemicals segment |
| Petrochemicals segment, consolidated Figures in US$ million |
First quarter | |||
| 2021 | 2020 | ∆% | ||
| Sales revenue | 103 | 73 | +41% | |
| Cost of sales | (82) | (71) | +15% | |
| Gross profit | 21 | 2 | NA | |
| Selling expenses | (3) | (2) | +50% | |
| Administrative expenses | (1) | (1) | - | |
| Other operating expenses | - | (1) | -100% | |
| Impairment of inventories | - | (11) | -100% | |
| Operating income (loss) | 17 | (13) | NA | |
| Finance costs | (1) | (1) | - | |
| Other financial results | (1) | 3 | NA | |
| Profit (loss) before tax | 15 | (11) | NA | |
| Income tax | (4) | 4 | NA | |
| Net income (loss) for the period | 11 | (7) | NA | |
| Adjusted EBITDA | 18 | (2) | NA | |
| Increases in PPE and intangible assets | 1 | - | NA | |
| Depreciation and amortization | 1 | - | NA | |
The adjusted EBITDA of the petrochemicals segment amounted to a US$18 million gain in Q1 21, whereas a US$2 million loss was registered in Q1 20, mainly explained by better sale prices due to higher international spread of styrene and polystyrene, higher sales volume, lower costs of virgin naphtha as raw material due to the higher availability in the domestic market, and to a lesser extent, the dilution of AR$-nominated operating expenses due to devaluation.
Total volume sold increased by 13% compared to Q1 20, explained by higher polystyrene and styrene volume sold in the domestic market, related to higher demand from construction, polyester resin, refrigeration and packaging industries, and higher exports of reforming products, SBR and polystyrene. These effects were partially offset by a lower volume of octane bases in the domestic market, explained by lesser gasoline consumption since lockdown. The amounts corresponding to Pampa are shown below:
| Petrochemicals' key performance indicators |
Products | Total | ||||
| Styrene & polystyrene1 | SBR | Others | ||||
| First quarter | ||||||
| Volume sold Q1 21 (thousand ton) | 29 | 12 | 57 | 98 | ||
| Volume sold Q1 20 (thousand ton) | 24 | 9 | 54 | 87 | ||
| Variation Q1 21 vs. Q1 20 | +22% | +28% | +6% | +13% | ||
| Average price Q1 21 (US$/ton) | 1,596 | 1,580 | 666 | 1,052 | ||
| Average price Q1 20 (US$/ton) | 1,220 | 1,434 | 568 | 840 | ||
| Variation Q1 21 vs. Q1 20 | +31% | +10% | +17% | +25% | ||
Note: 1 It includes Propylene.
The financial results registered a US$2 million net loss in Q1 21, whereas in Q1 20, a US$2 million net gain was recorded, mainly due to losses from the holding of financial instruments.
The capital expenditures in the segment corresponding to plants’ maintenance reached US$1 million in Q1 21, whereas in Q1 20, no investments were registered.
| Pampa Energía ● Q1 21 Earning Release ● 15 |
| |
| 3.4 | Analysis of the holding and others segment |
| Holding and others segment, consolidated Figures in US$ million |
First quarter | |||
| 2021 | 2020 | ∆% | ||
| Sales revenue | 6 | 6 | - | |
| Gross profit | 6 | 6 | - | |
| Administrative expenses | (5) | (5) | - | |
| Other operating income | 1 | 3 | -67% | |
| Other operating expenses | (16) | (3) | NA | |
| Impairment of financial assets | - | (1) | -100% | |
| Results for participation in joint businesses | 13 | 20 | -35% | |
| Operating income (loss) | (1) | 20 | NA | |
| Other financial results | 15 | 5 | +200% | |
| Profit (loss) before tax | 14 | 25 | -44% | |
| Income tax | (5) | (1) | NA | |
| Net income for the period | 9 | 24 | -63% | |
| Adjusted EBITDA | 37 | 35 | +7% | |
| Increases in PPE and intangible assets | 0 | - | NA | |
| Depreciation and amortization | - | - | NA | |
In the holding and others segment, without considering the equity income from affiliates (Transener, TGS and Refinor), we registered a US$14 million operating loss, while in Q1 20 was breakeven, mainly explained by higher provision for contingencies.
During Q1 21, a US$10 million improvement was recorded in the financial results compared to Q1 20, reaching a net gain of US$15 million, mainly due to higher profit from FX difference over AR$-nominated fiscal liabilities, partially offset by losses from the holding of financial instruments in Q1 21.
The adjusted EBITDA of our holding and others segment was 7% higher than Q1 20, reaching US$37 million in Q1 21. The adjusted EBITDA excludes provision for contingencies and the equity income from our participation in TGS, Transener and Refinor. In turn, it adds the EBITDA adjusted by equity ownership in these businesses. Moreover, adjusted EBITDA excludes commercial interests.
The EBITDA adjusted by our direct and indirect ownership of 28.7% and 27.6% in TGS were US$32 million (US$113 million at 100%) in Q1 21 and US$27 million (US$96 million at 100%) in Q1 20, respectively. The increase of total adjusted EBITDA was mainly due to the substantial recovery of liquids international prices in Q1 21 as from the beginning of the lockdown, higher exports of liquified petroleum gas (LPG) and natural gasoline, lower costs of natural gas due to contracts entered into before the Plan Gas.Ar, in addition to the increase of midstream revenues (natural gas transportation and conditioning service in Vaca Muerta). These effects partially offset by lower regulated revenues due to the tariff inflation-lagged, as from April 2019. Moreover, the FX depreciation affected over AR$-nominated regulated revenues (compensated by lower AR$-nominated expenses), lower ethane sales due to a price decrease (related to lower cost of gas) and lower volume dispatched to the domestic market as a result of the programmed maintenance in PBB Polisur.
In Transener, the EBITDA adjusted by our indirect stake ownership of 26.3% in Q1 21 amounted to US$4 million (US$17 million at 100%) and US$8 million (US$29 million at 100%) in Q1 20, mainly due to the tariff freeze as from February 2020 which, in an inflationary scenario, harms Transener’s AR$-nominated regulated revenues. The lack of tariffs is worsened by the AR$ devaluation over revenues, though offset by lower AR$-nominated expenses.
In Refinor, the
EBITDA adjusted by our stake ownership of 28.5% in Q1 21 recorded a gain of US$2 million (US$6 million at 100%), and US$1 million (US$5
million at 100%) was recorded in Q1 20, mainly explained by better-traded prices, partially offset by the lockdown effect on the gasoline
demand.
| Pampa Energía ● Q1 21 Earning Release ● 16 |
| |
| 3.5 | Analysis of the quarter, by subsidiary and segment |
| Subsidiary In US$ million |
Q1 21 | Q1 20 | |||||||
| % Pampa | Adjusted EBITDA | Net debt2 | Net income3 | % Pampa | Adjusted EBITDA | Net debt2 | Net income3 | ||
| Power generation segment | |||||||||
| Diamante | 61.0% | 1 | (2) | 1 | 61.0% | 2 | (26) | 0 | |
| Los Nihuiles | 52.0% | 1 | (9) | 0 | 52.0% | 2 | (31) | (5) | |
| Greenwind | 5 | 86 | 0 | 6 | 103 | (0) | |||
| Non-controlling stake adjustment | (3) | (43) | (0) | (3) | (51) | 0 | |||
| Subtotal Greenwind adjusted by ownership | 50.0% | 3 | 43 | 0 | 50.0% | 3 | 51 | (0) | |
| CTBSA | 33 | 203 | 21 | 39 | 272 | 19 | |||
| Non-controlling stake adjustment | (17) | (101) | (11) | (20) | (136) | (9) | |||
| Subtotal CTBSA adjusted by ownership | 50.0% | 17 | 101 | 11 | 50.0% | 20 | 136 | 9 | |
| Pampa stand-alone, other companies, adjs. & deletions1 | 100.0% | 94 | 271 | 36 | 100% | 86 | 407 | 12 | |
| Subtotal power generation | 115 | 406 | 47 | 113 | 537 | 16 | |||
| Oil & gas segment | |||||||||
| OldelVal | 15 | (15) | 10 | 14 | (8) | 11 | |||
| Non-controlling stake adjustment | (14) | 15 | (10) | (14) | 8 | (11) | |||
| Subtotal OldelVal adjusted by ownership | 2.1% | 0 | (0) | 0 | 2.1% | 0 | (0) | 0 | |
| Pampa stand-alone, other companies, adjs. & deletions1 | 100.0% | 33 | 913 | (33) | 100% | 29 | 938 | (26) | |
| Subtotal oil & gas | 33 | 913 | (33) | 29 | 938 | (26) | |||
| Petrochemicals segment | |||||||||
| Pampa Energía | 100.0% | 18 | - | 11 | 100.0% | (2) | - | (7) | |
| Subtotal petrochemicals | 18 | - | 11 | (2) | - | (7) | |||
| Holding & others segment | |||||||||
| Transener | 17 | 1 | 5 | 29 | 22 | 16 | |||
| Non-controlling stake adjustment | (13) | (1) | (4) | (21) | (16) | (12) | |||
| Subtotal Transener adjusted by ownership | 26.3% | 4 | 0 | 1 | 26.3% | 8 | 6 | 4 | |
| TGS | 113 | 199 | 42 | 96 | 332 | 53 | |||
| Non-controlling stake adjustment | (80) | (142) | (30) | (70) | (241) | (38) | |||
| Subtotal TGS adjusted by ownership | 28.7% | 32 | 57 | 12 | 27.6% | 27 | 92 | 15 | |
| Refinor | 6 | 24 | 1 | 5 | 14 | 8 | |||
| Non-controlling stake adjustment | (4) | (17) | (1) | (4) | (10) | (6) | |||
| Subtotal Refinor adjusted by ownership | 28.5% | 2 | 7 | 0 | 28.5% | 1 | 4 | 2 | |
| Pampa stand-alone, other companies, adjs. & deletions1 | 100% | (1) | (21) | (5) | 100% | (1) | (48) | 3 | |
| Subtotal holding & others | 37 | 44 | 9 | 35 | 53 | 24 | |||
| Deletions | 100% | - | (208) | - | 100% | - | (289) | - | |
| Total consolidated, continuing operations | 204 | 1,154 | 34 | 175 | 1,240 | 7 | |||
| At our share ownership | 203 | 1,367 | 34 | 173 | 1,554 | 7 | |||
| Discontinued operations | |||||||||
| Edenor | 55.1% | 10 | (2) | (7) | 55.1% | 45 | 99 | 11 | |
| Adjustments & deletions1 | 100% | (0) | 2 | 6 | 100% | (0) | 0 | (4) | |
| Subtotal electricity distribution | 10 | - | (1) | 45 | 99 | 7 | |||
| Total consolidated, continuing and discontinued operations | 214 | 1,154 | 33 | 220 | 1,339 | 14 | |||
| At our share ownership | 208 | 1,367 | 33 | 198 | 1,608 | 14 | |||
Note: 1 Absorbed by Pampa from January 1, 2020. 2 The deletions correspond to other companies or inter-companies or debt repurchases. 3 Figures in nominal terms. Net debt includes holding companies. 4 Attributable to the owners of the company.
| Pampa Energía ● Q1 21 Earning Release ● 17 |
| |
| 4. | Appendix |
| 4.1 | Power generation, by power plant |
| Power generation's key performance indicators |
Hydroelectric | Wind | Subtotal hydro +wind |
Thermal | Total | |||||||||||||||||
| HINISA | HIDISA | HPPL | PEMC1 | PEPE2 | PEPE3 | CTLL | CTG | CTP | CPB | CTPP | CTIW | CTGEBA2 | Eco- Energía |
CTEB1 | Subtotal | |||||||
| Installed capacity (MW) | 265 | 388 | 285 | 100 | 53 | 53 | 1,144 | 765 | 361 | 30 | 620 | 100 | 100 | 1,253 | 14 | 567 | 3,811 | 4,955 | ||||
| New capacity (MW) | - | - | - | 100 | 53 | 53 | 206 | 364 | 100 | 30 | - | 100 | 100 | 565 | 14 | 567 | 1,841 | 2,048 | ||||
| Market share | 0.6% | 0.9% | 0.7% | 0.2% | 0.1% | 0.1% | 2.7% | 1.8% | 0.9% | 0.1% | 1.5% | 0.2% | 0.2% | 3.0% | 0.03% | 1.3% | 9.0% | 11.7% | ||||
| First quarter | ||||||||||||||||||||||
| Net generation Q1 21 (GWh) | 155 | 99 | 128 | 89 | 52 | 62 | 585 | 1,144 | 124 | 17 | 18 | 65 | 70 | 2,288 | 19 | 111 | 3,856 | 4,442 | ||||
| Market share | 0.4% | 0.3% | 0.4% | 0.3% | 0.1% | 0.2% | 1.7% | 3.2% | 0.4% | 0.0% | 0.1% | 0.2% | 0.2% | 6.5% | 0.1% | 0.3% | 10.9% | 12.6% | ||||
| Sales Q1 21 (GWh) | 155 | 98 | 128 | 89 | 63 | 62 | 595 | 1,140 | 190 | 17 | 19 | 65 | 70 | 2,412 | 47 | 111 | 4,070 | 4,665 | ||||
| Net generation Q1 20 (GWh) | 147 | 87 | 190 | 103 | 49 | 60 | 636 | 1,286 | 294 | 26 | 474 | 19 | 47 | 1,678 | 19 | 129 | 3,972 | 4,608 | ||||
| Variation Q1 21 vs. Q1 20 | +6% | +14% | -33% | -14% | +7% | +3% | -8% | -11% | -58% | -38% | -96% | na | +49% | +36% | -3% | -14% | -3% | -4% | ||||
| Sales Q1 20 (GWh) | 147 | 87 | 186 | 103 | 45 | 63 | 632 | 1,286 | 295 | 26 | 472 | 19 | 47 | 1,714 | 22 | 129 | 4,010 | 4,642 | ||||
| Avg. price Q1 21 (US$/MWh) | 14 | 25 | 16 | 70 | 74 | 67 | 37 | 33 | 33 | 101 | na | 141 | 105 | 32 | 30 | na | 45 | 44 | ||||
| Avg. price Q1 20 (US$/MWh) | 25 | 45 | 19 | 70 | 70 | 67 | 41 | 33 | 22 | 67 | 20 | na | 148 | 23 | 66 | na | 40 | 40 | ||||
| Avg. gross margin Q1 21 (US$/MWh) | 5 | 12 | 7 | 60 | 54 | 58 | 25 | 29 | 10 | 66 | 2 | 117 | 86 | 17 | 11 | na | 31 | 30 | ||||
| Avg. gross margin Q1 20 (US$/MWh) | 16 | 32 | 9 | 61 | 57 | 60 | 31 | 30 | 12 | 44 | 15 | na | 119 | 14 | 32 | na | 32 | 32 | ||||
Note: Gross margin before amortization and depreciation. 1 Operated by Pampa (50% of equity stake). 2 Commissioning of ST02 as of July 2, 2020.
| Pampa Energía ● Q1 21 Earning Release ● 18 |
| |
| 4.2 | Oil and gas production, by area |
| Main areas' production | First quarter | |||
| 2021 | 2020 | Variation | ||
| Gas (k boe/day) | ||||
| El Mangrullo | 27.4 | 25.1 | +9% | |
| Río Neuquén | 4.7 | 5.7 | -17% | |
| Sierra Chata | 2.7 | 3.0 | -11% | |
| Rincón del Mangrullo1 | 3.5 | 5.3 | -34% | |
| Others | 1.2 | 1.5 | -21% | |
| Total gas at O/S | 39.6 | 40.7 | -3% | |
| Oil (k boe/day) | ||||
| El Tordillo2 | 2.3 | 2.9 | -20% | |
| Gobernador Ayala | 0.9 | 0.9 | -1% | |
| Associated oil3 | 0.8 | 0.9 | -17% | |
| Others | 0.2 | 0.6 | -71% | |
| Total oil at O/S | 4.2 | 5.3 | -22% | |
| Total at O/S (kboe/day) | 43.7 | 46.0 | -5% | |
Note: Production in Argentina. 1 It doesn’t include shale formation. 2 It includes La Tapera - Puesto Quiroga field. 3 From gas fields.
| 4.3 | Analysis of the electricity distribution segment |
On December 28, 2020, we agreed to sell our controlling stake in Edenor. Consequently, under IFRS, the electricity distribution segment is deconsolidated from Pampa’s FS and shown as discontinued operations for the current and comparative periods.
| Electricity distribution segment, discontinued Figures in US$ million |
First quarter | |||
| 2021 | 2020 | ∆% | ||
| Sales revenue | 229 | 318 | -28% | |
| Cost of sales | (180) | (255) | -29% | |
| Gross profit | 48 | 63 | -24% | |
| Selling expenses | (17) | (20) | -16% | |
| Administrative expenses | (12) | (13) | -8% | |
| Other operating income | 6 | 5 | +15% | |
| Other operating expenses | (8) | (5) | +63% | |
| Impairment of financial assets | (7) | (6) | +12% | |
| Impairment of PPE | (9) | - | NA | |
| Operating income (loss) | 2 | 24 | -94% | |
| RECPAM | 59 | 26 | +126% | |
| Finance income | 0 | 4 | -96% | |
| Finance costs | (48) | (19) | +155% | |
| Other financial results | 1 | (11) | NA | |
| Profit (loss) before tax | 14 | 25 | -44% | |
| Income tax | (9) | (13) | -30% | |
| Net income (loss) for the period | 5 | 12 | -59% | |
| Attributable to owners of the Company | (1) | 7 | NA | |
| Attributable to non-controlling interests | 6 | 5 | +26% | |
| Adjusted EBITDA, discontinued | 10 | 45 | -78% | |
| Adjusted EBITDA at our share ownership | 6 | 25 | -77% | |
| Increases in PPE, intangible and right-of-use assets | 27 | 22 | +25% | |
| Depreciation and amortization | - | 20 | -100% | |
| Pampa Energía ● Q1 21 Earning Release ● 19 |
| |
The distribution segment’s adjusted EBITDA posted a US$10 million gain in Q1 21, US$35 lower than Q1 20, mainly due to the lack of inflation adjustment on the Distribution Added Value (VAD) from March 2019, lower non-residential electricity consumption and higher penalties. Moreover, as of Q1 21, seasonal prices for electricity purchases destined to non-residential users, effective as of August 2019, were not reflected in the tariff schemes. The latter issue was solved with the new tariff schedules as of April 2021[11]. These effects were partially offset by the higher electricity demand of residential clients and lower costs related to energy losses.
The operating performance of Edenor is shown below:
| Edenor's key performance indicators |
2021 | 2020 | Variation | ||||||||
| In GWh | Part. % | Clients | In GWh | Part. % | Clients | % GWh | % Clients | ||||
| First quarter | |||||||||||
| Residential1 | 2,266 | 43% | 2,800,452 | 2,194 | 42% | 2,762,301 | +3% | +1% | |||
| Commercial | 829 | 16% | 359,923 | 875 | 17% | 353,311 | -5% | +2% | |||
| Industrial | 880 | 17% | 6,863 | 922 | 18% | 6,847 | -5% | +0% | |||
| Wheeling system | 950 | 18% | 686 | 920 | 18% | 692 | +3% | -1% | |||
| Others | |||||||||||
| Public lighting | 150 | 3% | 21 | 155 | 3% | 21 | -3% | - | |||
| Shantytowns and others | 136 | 3% | 480 | 137 | 3% | 473 | -1% | +1% | |||
| Total | 5,212 | 100% | 3,168,425 | 5,203 | 100% | 3,123,645 | +0% | +1% | |||
Note: 1 It includes 542,379 and 566,690 clients categorized under Social Tariff as of March 31, 2021 and 2020, respectively.
11 For more information, see section 1.2 of this Earnings Release.
| Pampa Energía ● Q1 21 Earning Release ● 20 |
| |
| 5. | Glossary of terms |
| Term | Definition |
| Q4 20/Q4 19 | Fourth quarter of 2020/Fourth quarter of 2019 |
| Q1 21/Q1 20 | First quarter of 2021/First quarter of 2020 |
| ADRs/ADSs | American Depositary Receipts |
| AR$ | Argentine Pesos |
| Bbl | Barrel |
| Boe | Barrels of oil equivalent |
| CAMMESA | Compañía Administradora del Mercado Mayorista Eléctrico S.A. (Argentine Wholesale Electricity Market Clearing Company) |
| CB | Corporate Bonds |
| 2023 CB | Series T CB issued in 2016 for US$500 million, due 2023 and accrue interest rate of 7.375% |
| 2027 CB | Series I CB issued in 2017 for US$750 million, due 2027 and accrue interest rate of 7.5% |
| 2029 CB | Series III CB issued in 2019 for US$300 million, due 2029 and accrue interest rate of 9.125% |
| CCGT | Combined cycle gas turbine |
| CDP | Costo Propio de Distribución (Own Distribution Cost) |
| CEO | Chief Executive Officer |
| CFO | Chief Financial Officer |
| COVID-19 | Coronavirus disease |
| CPB | Piedra Buena Thermal Power Plant |
| CTBSA | CT Barragán S.A. |
| CTEB | Ensenada Barragán Thermal Power Plant |
| CTEB Trust | A supplementary agreement under the global administration and financial trusts program for the execution of energy infrastructure works -Series 1- ENARSA (Barragán) |
| CTG | Güemes Thermal Power Plant |
| CTGEBA | Genelba Thermal Power Plant |
| CTIW | Ingeniero White Thermal Power Plant |
| CTLL | Loma De La Lata Thermal Power Plant |
| CTP | Piquirenda Thermal Power Plant |
| CTPP | Parque Pilar Thermal Power Plant |
| DNU | Decreto de Necesidad y Urgencia (Executive Decree) |
| DoP | Deliver or Pay |
| E&P | Exploration and Production |
| EBITDA | Earnings before interest, tax, depreciation and amortization |
| EcoEnergía | EcoEnergía Co-Generation Power Plant |
| Edenor | Empresa Distribuidora y Comercializadora Norte S.A. |
| Energía Plus | Energía Plus Program, SE Res. No. 1,281/06 |
| ENRE | Ente Nacional Regulador de la Electricidad (National Electricity Regulatory Entity) |
| Est. | Estimated |
| Federal Government | Federal Government of the Republic of Argentina |
| FS | Financial Statements |
| FX | Nominal exchange rate |
| Greenwind | Greenwind S.A. |
| GUDI | Grandes Usuarios Distribuidoras (Large Distribution Company Users) |
| GWh | Gigawatt-hour |
| HIDISA | Diamante Hydroelectric Power Plant |
| HINISA | Los Nihuiles Hydroelectric Power Plant |
| Pampa Energía ● Q1 21 Earning Release ● 21 |
| |
| HMRT | Horas de Alto Requerimiento Térmico del Mes (Hours of the month with a high thermal demand) |
| HPPL | Pichi Picún Leufú Hydroelectric Power Plant |
| IFRS | International Financial Reporting Standards |
| Kbbl/kboe | Thousands of barrels/thousands of barrels of oil equivalent |
| M3 | Cubic meter |
| Mcf | Million cubic feet |
| MAT ER | Term Market from Renewable Energy Sources |
| MBTU | Million British Thermal Unit |
| MW/MWh | Megawatt/Megawatt-hour |
| N.a. | Not applicable |
| O/S | At equity ownership |
| OldelVal | Oleoductos del Valle S.A. |
| Pampa / the Company | Pampa Energía S.A. |
| Pampa Group | Pampa Energía S.A. and its subsidiaries |
| PEMC | Ingeniero Mario Cebreiro Wind Farm |
| PEPE | Pampa Energía Wind Farm |
| Plan Gas.Ar | Argentine Natural Gas Production Promotion Program – 2020 – 2024 Supply and Demand Scheme (DNU No. 892/20 and supplementary regulations) |
| PPA | Power Purchase Agreement |
| PPE | Property, Plant and Equipment |
| RECPAM | Results from a net monetary position |
| Refinor | Refinería del Norte S.A. |
| Res. | Resolution/Resolutions |
| SADI | Sistema Argentino de Interconexión (Argentine Electricity Grid) |
| SBR | Styrene-Butadiene Rubber |
| SE | Secretariat of Energy |
| SEE | Under Secretariat of Electric Energy (former Secretariat of Electric Energy) |
| TBD | To be delivered |
| TGS | Transportadora de Gas del Sur S.A. |
| Ton | Metric Ton |
| ToP | Take or Pay |
| Transener | Compañía de Transporte de Energía Eléctrica en Alta Tensión Transener S.A. |
| US$ | U.S. Dollars |
| VRDs | Debt Securities |
| Pampa Energía ● Q1 21 Earning Release ● 22 |
Serious News for Serious Traders! Try StreetInsider.com Premium Free!
You May Also Be Interested In
- Edenor Informs the Market that on April 24th, 2024, it has Filed its Annual Report on Form 20-F for the Fiscal Year Ended December 31, 2023.
- Perk Labs Announces Closing of Non-Brokered Private Placements
- NorthWestern Reports First Quarter 2024 Financial Results
Create E-mail Alert Related Categories
SEC FilingsSign up for StreetInsider Free!
Receive full access to all new and archived articles, unlimited portfolio tracking, e-mail alerts, custom newswires and RSS feeds - and more!
