Form 6-K POSCO HOLDINGS INC. For: Apr 25
UNITED STATES
SECURITIES AND EXCHANGE COMMISSION
Washington, D.C. 20549
Form 6-K
REPORT OF FOREIGN PRIVATE ISSUER
PURSUANT TO RULE 13a-16 OR 15D-16 UNDER
THE SECURITIES EXCHANGE ACT OF 1934
For the month of April, 2022
Commission File Number: 1-13368
POSCO HOLDINGS INC.
(Translation of registrant’s name into English)
POSCO Center, 440 Teheran-ro, Gangnam-gu, Seoul, Korea, 06194
Indicate by check mark whether the registrant files or will file annual reports under cover of Form 20-F or
Form 40-F.
Form 20-F ☒ Form 40-F ☐
Indicate by check mark if the registrant is submitting the Form 6-K in paper as permitted by Regulation S-T Rule 101(b)(1): ☐
Note: Regulation S-T Rule 101(b)(1) only permits the submission in paper of a Form 6-K if submitted solely to provide an attached annual report to security holders.
Indicate by check mark if the registrant is submitting the Form 6-K in paper as permitted by Regulation S-T Rule 101(b)(7): ☐
Note: Regulation S-T Rule 101(b)(7) only permits the submission in paper of a Form 6-K if submitted to furnish a report or other document that the registrant foreign private issuer must furnish and make public under the laws of the jurisdiction in which the registrant is incorporated, domiciled or legally organized (the registrant’s “home country”), or under the rules of the home country exchange on which the registrant’s securities are traded, as long as the report or other document is not a press release, is not required to be and has not been distributed to the registrant’s security holders, and, if discussing a material event, has already been the subject of a Form 6-K submission or other Commission filing on EDGAR.
Provisional Earnings in Consolidated Financial Statements Base
| Q1 2022 | Q4 2021 | Changes over Q4 2021(%) |
Q1 2021 | Changes over Q1 2021(%) | ||||||||
| Revenue |
Amount | 21.3 | 21.4 | -0.1% | 16.1 | 32.8% | ||||||
| Yearly Amount |
21.3 | 76.4 | — | 16.1 | 32.8% | |||||||
| Operating Profit |
Amount | 2.3 | 2.4 | -5.8% | 1.6 | 43.9% | ||||||
| Yearly Amount |
2.3 | 9.3 | — | 1.6 | 43.9% | |||||||
| Profit before Income Tax |
Amount | 2.5 | 2.1 | 17.1% | 1.6 | 57.7% | ||||||
| Yearly Amount |
2.5 | 9.4 | — | 1.6 | 57.7% | |||||||
| Profit |
Amount | 1.9 | 1.6 | 17.9% | 1.1 | 67.5% | ||||||
| Yearly Amount |
1.9 | 7.2 | — | 1.1 | 67.5% | |||||||
| Profit Attributable to Owners of the Controlling Company |
Amount | 1.7 | 1.5 | 14.0% | 1.0 | 66.0% | ||||||
| Yearly Amount |
1.7 | 6.6 | — | 1.0 | 66.0% | |||||||
| • | This disclosure is the addition of the previous filing regarding the provisional earnings of 1st quarter 2022 which was disclosed on April 15, 2022. |
| • | The above earnings information is composed based on K-IFRS (Korean International Financial ReportingStandards) and the independent auditors’ review is not finished. Therefore, the earnings information may change in the review process. |
| • | Due to the conversion to a holding company, dividend income was included in business performance and dividend income was reclassified from non-operating income to operating profit for comparative display. |
SIGNATURES
Pursuant to the requirements of the Securities Exchange Act of 1934, the registrant has duly caused this report to be signed on its behalf by the undersigned, thereunto duly authorized.
| POSCO HOLDINGS INC. | ||||||
| (Registrant) | ||||||
| Date: April 25, 2022 | By | /s/ Chung, Kyung-Jin | ||||
| (Signature) | ||||||
| Name: Chung, Kyung-Jin | ||||||
| Title: Executive Vice President | ||||||
April 25, 2022 1Q 2022 Earnings Release Exhibit 99.1
Disclaimer This presentation was prepared and circulated to release the informations regarding the company’s business performance to shareholders and investors prior to the completion of auditing for the period of the first quarter 2022. As figures in this presentation are based on unaudited financial statements, certain contents may be subject to modification in the course of auditing process. This presentation contains certain forward-looking statements relating to the business, financial performance and results of the company and/or the industry in which it operates. The forward-looking statements set forth herein concern future circumstances and results and other statements that not historical facts, and are solely opinions and forecasts which are uncertain and subject to risks. Therefore, the recipients of this presentation shall be aware of that the forward-looking statements set forth herein may not correspond to the actual business performance of the company due to changes and risks in business environments and conditions. The sole purpose of this presentation is to assist persons in deciding whether they wish to proceed with certain investments to the company. The company does not make any representation or warranty, expressly or impliedly, as to the accuracy and completeness of this presentation or of the information contained herein and shall not have any liability for the informations contained in this presentation.

Consolidated Business Performance Business Performance of Major Subsidiaries Appendix Contents 2022 Business Outlook Business Performance of Key 7 Businesses
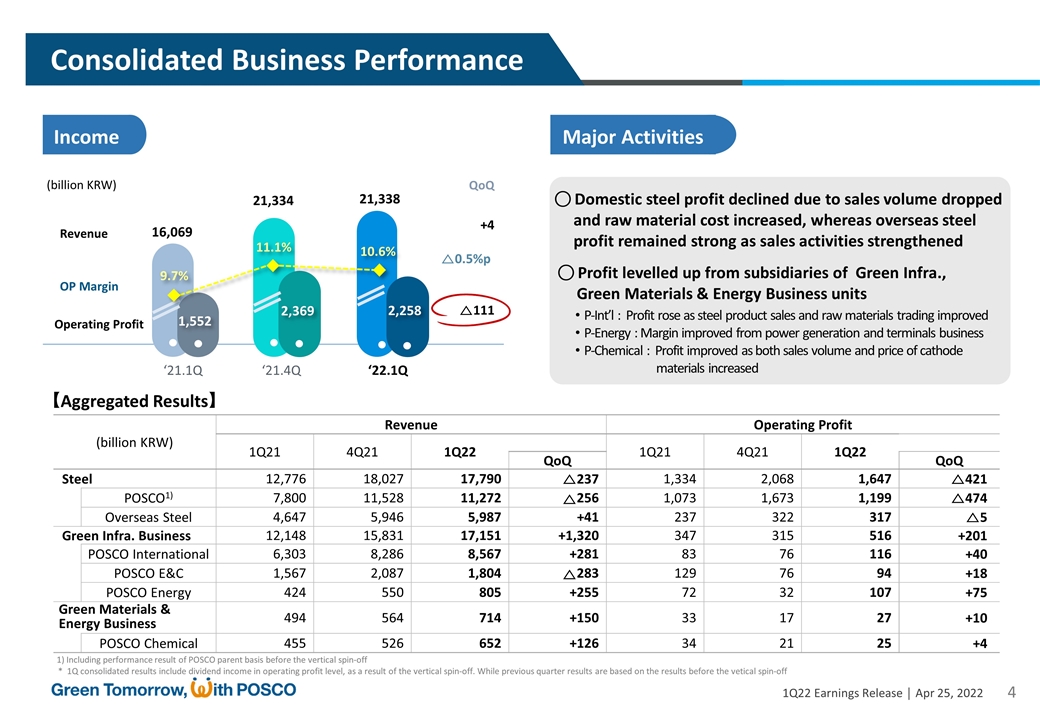
Consolidated Business Performance Income Major Activities 1) Including performance result of POSCO parent basis before the vertical spin-off ○ Profit levelled up from subsidiaries of Green Infra., Green Materials & Energy Business units P-Int’l : Profit rose as steel product sales and raw materials trading improved P-Energy : Margin improved from power generation and terminals business P-Chemical : Profit improved as both sales volume and price of cathode materials increased Revenue Operating Profit +4 OP Margin △111 △0.5%p (billion KRW) QoQ 16,069 21,334 21,338 9,238 ‘21.1Q ‘21.4Q ‘22.1Q (billion KRW) Revenue Operating Profit 1Q21 4Q21 1Q22 1Q21 4Q21 1Q22 QoQ QoQ Steel 12,776 18,027 17,790 △237 1,334 2,068 1,647 △421 POSCO1) 7,800 11,528 11,272 △256 1,073 1,673 1,199 △474 Overseas Steel 4,647 5,946 5,987 +41 237 322 317 △5 Green Infra. Business 12,148 15,831 17,151 +1,320 347 315 516 +201 POSCO International 6,303 8,286 8,567 +281 83 76 116 +40 POSCO E&C 1,567 2,087 1,804 △283 129 76 94 +18 POSCO Energy 424 550 805 +255 72 32 107 +75 Green Materials & Energy Business 494 564 714 +150 33 17 27 +10 POSCO Chemical 455 526 652 +126 34 21 25 +4 9.7% 1,552 2,369 2,258 10.6% 11.1% 【Aggregated Results】 ○ Domestic steel profit declined due to sales volume dropped and raw material cost increased, whereas overseas steel profit remained strong as sales activities strengthened * 1Q consolidated results include dividend income in operating profit level, as a result of the vertical spin-off. While previous quarter results are based on the results before the vetical spin-off
Steel Business Unit Green Infrastructure Business Unit Green Materials & Energy Business Unit Business Performance of Major Subsidiaries POSCO Overseas Steel POSCO International POSCO E&C POSCO Energy POSCO Chemical
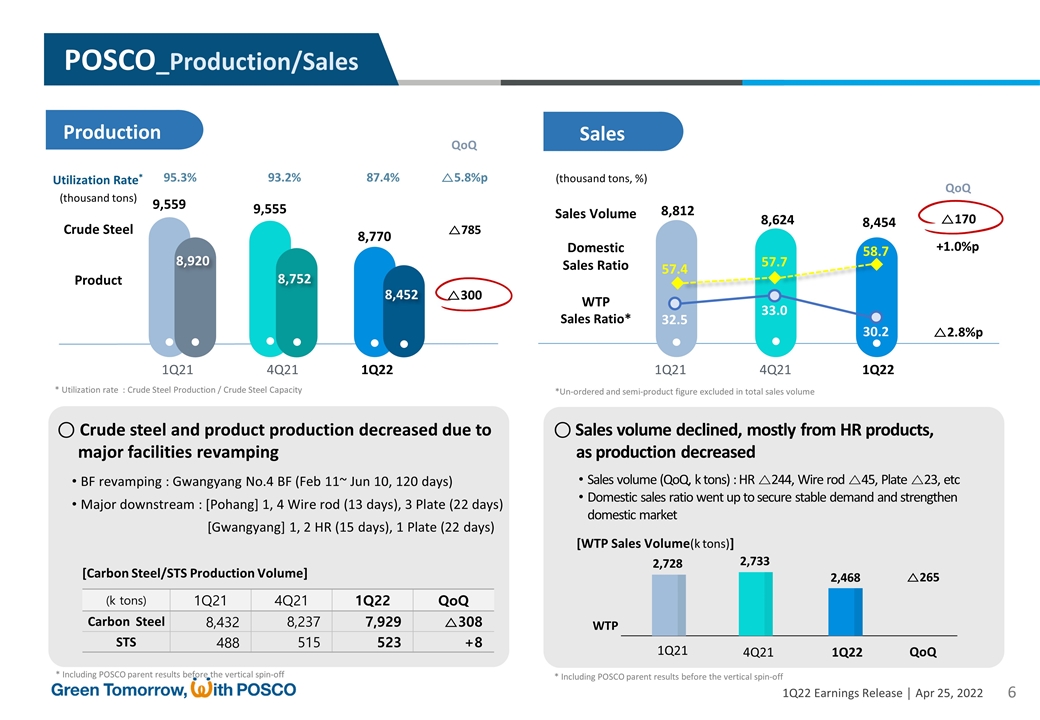
POSCO_Production/Sales △785 △300 QoQ Production △5.8%p 95.3% 93.2% 87.4% 1Q21 4Q21 1Q22 ○ Crude steel and product production decreased due to major facilities revamping BF revamping : Gwangyang No.4 BF (Feb 11~ Jun 10, 120 days) Major downstream : [Pohang] 1, 4 Wire rod (13 days), 3 Plate (22 days) [Gwangyang] 1, 2 HR (15 days), 1 Plate (22 days) (k tons) 1Q21 4Q21 1Q22 QoQ Carbon Steel 8,432 8,237 7,929 △308 STS 488 515 523 +8 Sales 8,812 8,624 57.4 57.7 8,454 58.7 QoQ △170 +1.0%p 1Q21 4Q21 1Q22 32.5 33.0 30.2 △2.8%p ○ Sales volume declined, mostly from HR products, as production decreased Sales volume (QoQ, k tons) : HR △244, Wire rod △45, Plate △23, etc Domestic sales ratio went up to secure stable demand and strengthen domestic market WTP 1Q21 4Q21 1Q22 QoQ △265 9,559 9,555 8,770 8,920 8,752 8,452 2,728 2,733 2,468 * Including POSCO parent results before the vertical spin-off Crude Steel Product (thousand tons) Utilization Rate* * Utilization rate : Crude Steel Production / Crude Steel Capacity *Un-ordered and semi-product figure excluded in total sales volume Sales Volume Domestic Sales Ratio (thousand tons, %) WTP Sales Ratio* [Carbon Steel/STS Production Volume] * Including POSCO parent results before the vertical spin-off [WTP Sales Volume(k tons)]

POSCO_Income/Financial Structure +100 Financial Structure Income 1Q21 4Q21 1Q22 ○ Profit lowered as sales volume dropped and coking coal price jumped 【Operating Profit (billion KRW)】 STS price increase, etc. 4Q21 △413 Raw materials cost Increase, etc. 1Q22 Production·sales decline △161 QoQ (billion KRW) △256 OP Margin △474 △3.9%p (trillion KRW) Before the spin-off After the spin-off ‘22.3/E Cash balance 11.8 5.5 6.4 Equity-based securities 16.3 0.2 0.2 Debt 8.5 7.1 7.2 ○ Net asset declined as cash-in-hand and investment securities decreased due to the vertical spin-off 7,800 11,528 11,272 1,073 1,199 13.8% 14.5% 10.6% 1,673 1,673 1,199 as of March 1, 2022 ’22.3/E Before spin-off After spin-off Assets 64,769 42,645 43,702 Current Assets 26,213 19,836 20,922 Non-current Assets 38,556 22,809 22,780 Liabilities 15,063 10,759 11,599 Equity 49,706 31,887 32,102 (billion KRW) Transferred Cash balance (6.3 trillion KRW) and equity-based securities (16.1 trillion KRW) to POSCO Holdings Debt : Transferred exchangeable bond (1.4 trillion KRW) to POSCO Holdings Revenue Operating Profit Sales price (carbon steel, thousand won/t) : 4Q21) 1,143 → 1Q22) 1,136 (△7) 1Q Raw material applied cost (2Q21 price =100 ): Iron ore 92, coking coal 125 * Including POSCO parent results before the vertical spin-off
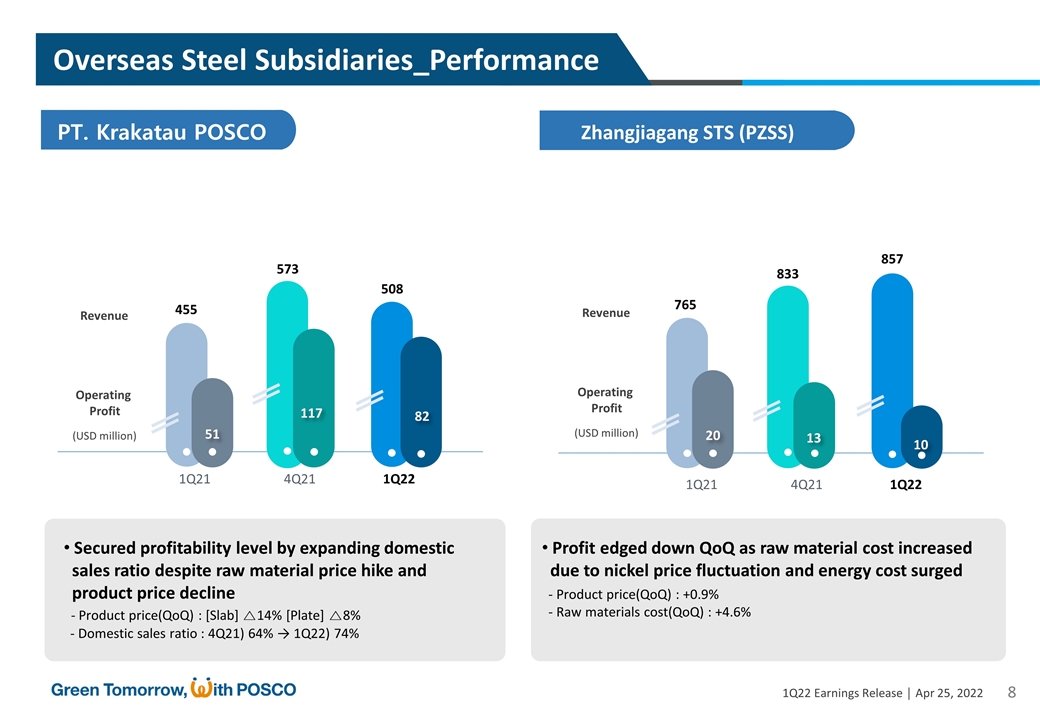
PT. Krakatau POSCO 1Q21 4Q21 1Q22 455 573 508 51 117 82 765 833 857 20 13 10 Overseas Steel Subsidiaries_Performance Zhangjiagang STS (PZSS) Revenue Operating Profit (USD million) Revenue Operating Profit (USD million) 1Q21 4Q21 1Q22 Secured profitability level by expanding domestic sales ratio despite raw material price hike and product price decline - Product price(QoQ) : [Slab] △14% [Plate] △8% - Domestic sales ratio : 4Q21) 64% → 1Q22) 74% Profit edged down QoQ as raw material cost increased due to nickel price fluctuation and energy cost surged - Product price(QoQ) : +0.9% - Raw materials cost(QoQ) : +4.6%
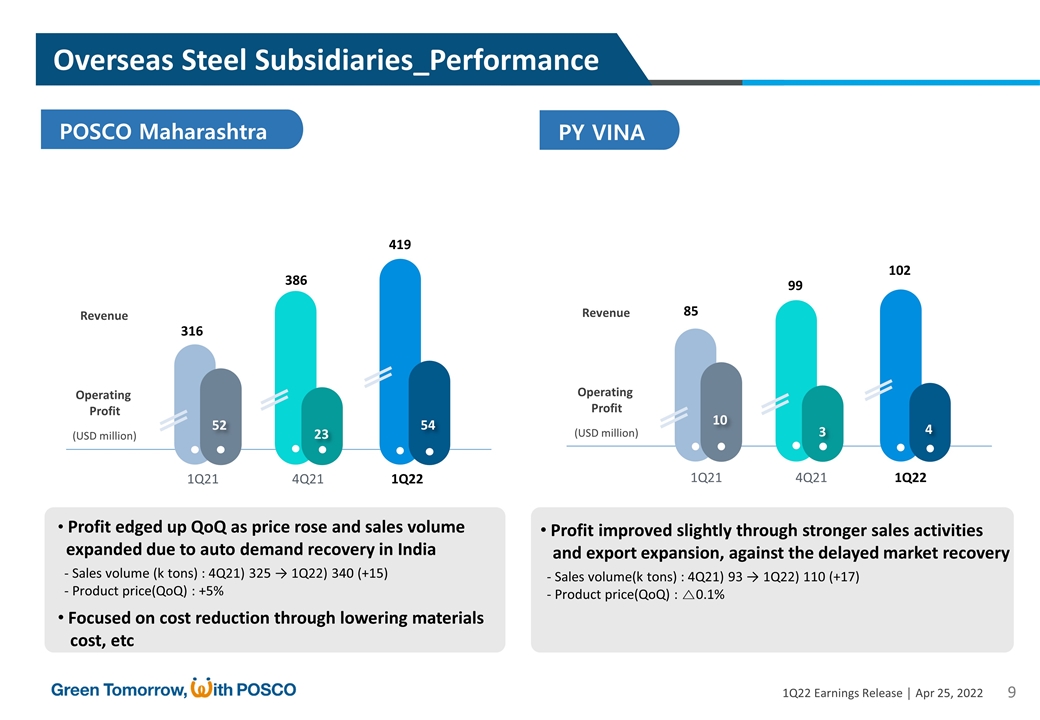
PY VINA POSCO Maharashtra 316 386 419 52 23 54 85 99 102 10 3 4 Overseas Steel Subsidiaries_Performance Profit improved slightly through stronger sales activities and export expansion, against the delayed market recovery - Sales volume(k tons) : 4Q21) 93 → 1Q22) 110 (+17) - Product price(QoQ) : △0.1% Profit edged up QoQ as price rose and sales volume expanded due to auto demand recovery in India - Sales volume (k tons) : 4Q21) 325 → 1Q22) 340 (+15) - Product price(QoQ) : +5% 1Q21 4Q21 1Q22 Revenue Operating Profit (USD million) Revenue Operating Profit (USD million) 1Q21 4Q21 1Q22 Focused on cost reduction through lowering materials cost, etc
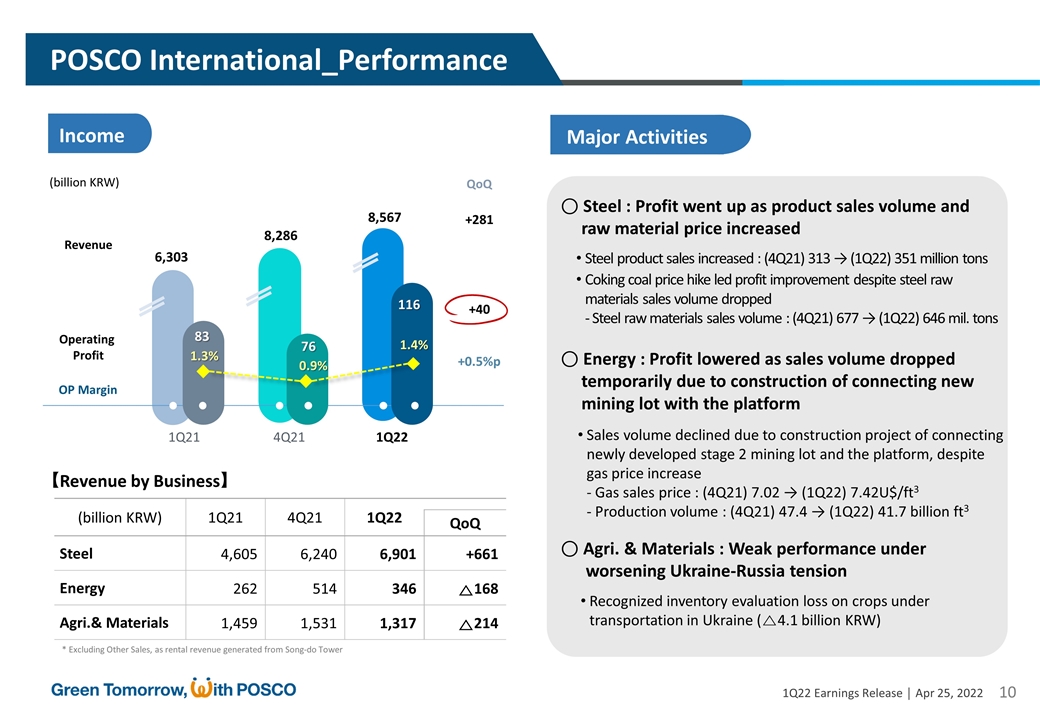
POSCO International_Performance Major Activities Income (billion KRW) 1Q21 4Q21 1Q22 QoQ Steel 4,605 6,240 6,901 +661 Energy 262 514 346 △168 Agri.& Materials 1,459 1,531 1,317 △214 【Revenue by Business】 1Q21 4Q21 1Q22 Revenue Operating Profit QoQ (billion KRW) +281 OP Margin 6,303 8,286 8,567 +40 +0.5%p 83 1.3% 0.9% 76 1.4% 116 ○ Steel : Profit went up as product sales volume and raw material price increased Steel product sales increased : (4Q21) 313 → (1Q22) 351 million tons Coking coal price hike led profit improvement despite steel raw materials sales volume dropped - Steel raw materials sales volume : (4Q21) 677 → (1Q22) 646 mil. tons ○ Energy : Profit lowered as sales volume dropped temporarily due to construction of connecting new mining lot with the platform Sales volume declined due to construction project of connecting newly developed stage 2 mining lot and the platform, despite gas price increase - Gas sales price : (4Q21) 7.02 → (1Q22) 7.42U$/ft3 - Production volume : (4Q21) 47.4 → (1Q22) 41.7 billion ft3 ○ Agri. & Materials : Weak performance under worsening Ukraine-Russia tension Recognized inventory evaluation loss on crops under transportation in Ukraine (△4.1 billion KRW) * Excluding Other Sales, as rental revenue generated from Song-do Tower

(billion KRW) 1Q21 4Q21 1Q22 QoQ Plant 378 617 562 △55 Infrastructure 155 264 223 △41 Building 1,034 1,207 1,019 △188 △283 1,567 2,087 1,804 +18 +1.5%p 129 8.2% 3.7% 76 5.2% 94 ○ Increased new orders, mostly from building projects (+0.2 tril. KRW, QoQ) Plant : Pohang No.4 Cokes, Gwangyang electrical steel line for eco-friendly vehicles, etc Building : Song-do G5 Bloc, Communal housing in Ma-dong, Gwangyang ○ Profit improved, led by infrastructure and building businesses Plant : Profit slightly dropped due to materials cost hike (4.9 bil. KRW, QoQ) Infra. : Profit improved despite revenue decline, due to cost decrease from winning lawsuits, lower bad debt expense, etc (QoQ 9 billion KRW) Building : Profit increased as cash recognized from completed projects, despite revenue decline due to seasonal effect (QoQ +13.4 billion KRW) Major Activities Income Revenue Operating Profit (billion KRW) OP Margin POSCO E&C_Performance 【Revenue by Business】 1Q21 4Q21 1Q22 QoQ

○ Power Generation : Profit improved as entering into peak power season and rise in sales prices Profit of power generation sector improved due rise in winter season electricity demand and rise in sales price(SMP) due to surge in fuel costs ○ Terminal : Profit increased due to stable rental earnings, Domestic/overseas ship commissioning through utilizing existing infrastructure, and overseas sales of LNG Stable rental earnings of terminal to customers as SK, S-Oil, etc. Expanded commissioning to LNG ship-owners and shipbuilders * Market share of domestic LNG ship commissioning : 71% (5 out of 7 ships performed) Sold LNG inventory for sale to overseas, in response towards LNG supply shortage (12k tons) Proceed building Gwangyang No.6 LNG Tank (target to complete by May 2024) 1Q21 4Q21 1Q22 QoQ Power demand (GW) 77.2 75.3 81.1 +5.8 SMP (won/kWh) 76.5 125.6 181.0 +55.4 【Market Index】 (billion KRW) 1Q21 4Q21 1Q22 QoQ Power generation 382 512 723 +211 Terminal 36 35 78 +43 Fuel cell, etc 6 3 4 +1 +255 424 550 805 +75 +7.4%p 72 16.9% 5.9% 32 13.3% 107 Major Activities Income Revenue Operating Profit (billion KRW) OP Margin POSCO Energy_Performance 【Revenue by Business】 1Q21 4Q21 1Q22 QoQ
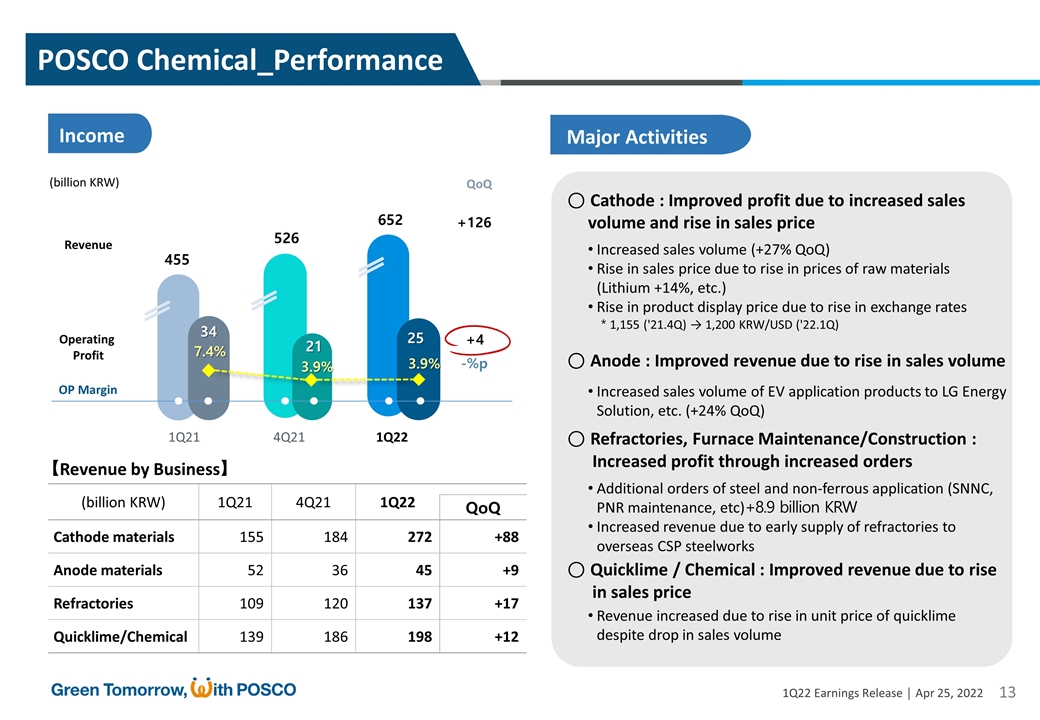
○ Cathode : Improved profit due to increased sales volume and rise in sales price Increased sales volume (+27% QoQ) Rise in sales price due to rise in prices of raw materials (Lithium +14%, etc.) Rise in product display price due to rise in exchange rates * 1,155 ('21.4Q) → 1,200 KRW/USD ('22.1Q) ○ Anode : Improved revenue due to rise in sales volume ○ Refractories, Furnace Maintenance/Construction : Increased profit through increased orders ○ Quicklime / Chemical : Improved revenue due to rise in sales price Additional orders of steel and non-ferrous application (SNNC, PNR maintenance, etc)+8.9 billion KRW Increased revenue due to early supply of refractories to overseas CSP steelworks Revenue increased due to rise in unit price of quicklime despite drop in sales volume Increased sales volume of EV application products to LG Energy Solution, etc. (+24% QoQ) (billion KRW) 1Q21 4Q21 1Q22 QoQ Cathode materials 155 184 272 +88 Anode materials 52 36 45 +9 Refractories 109 120 137 +17 Quicklime/Chemical 139 186 198 +12 +126 455 526 652 +4 -%p 34 7.4% 3.9% 21 3.9% 25 Major Activities Income Revenue Operating Profit (billion KRW) OP Margin POSCO Chemical_Performance 【Revenue by Business】 1Q21 4Q21 1Q22 QoQ
Performance of Key 7 Businesses Business Performance of Key 7 Businesses Steel Cathode/Anode Lithium·Nickel Hydrogen Renewable Energy Construction Agriculture
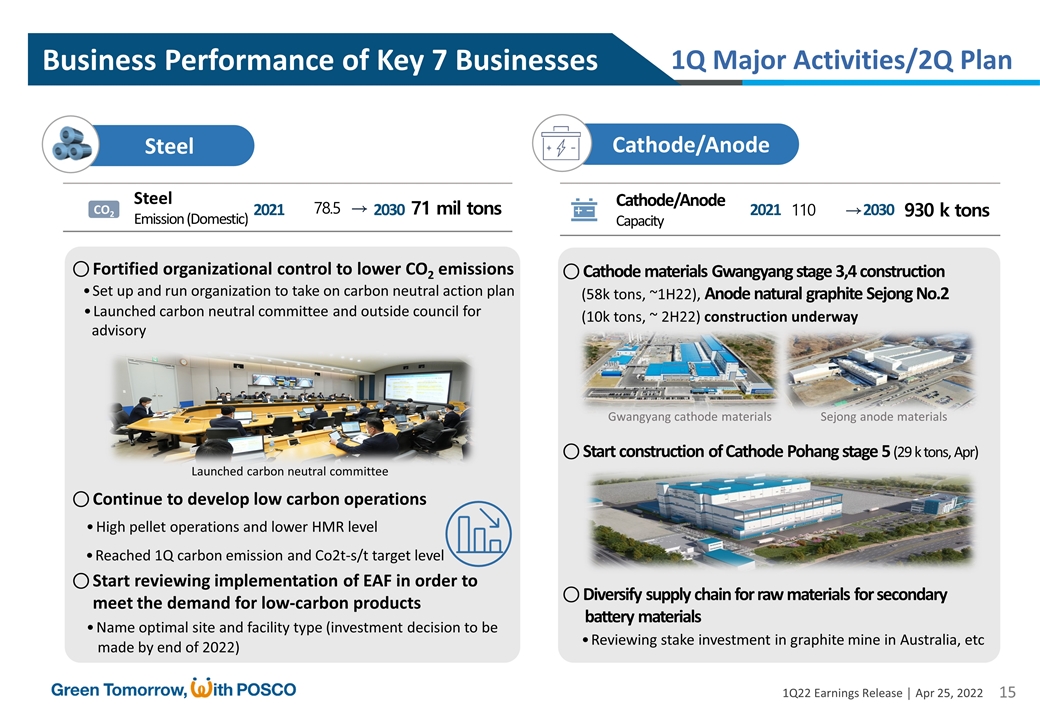
Steel Steel Emission (Domestic) 78.5 → 71 mil tons CO2 ○ Fortified organizational control to lower CO2 emissions • Set up and run organization to take on carbon neutral action plan • Launched carbon neutral committee and outside council for advisory Cathode/Anode Cathode/Anode Capacity 110 → 930 k tons ○ Cathode materials Gwangyang stage 3,4 construction (58k tons, ~1H22), Anode natural graphite Sejong No.2 (10k tons, ~ 2H22) construction underway 1Q Major Activities/2Q Plan ○ Continue to develop low carbon operations • High pellet operations and lower HMR level • Reached 1Q carbon emission and Co2t-s/t target level ○ Start reviewing implementation of EAF in order to meet the demand for low-carbon products • Name optimal site and facility type (investment decision to be made by end of 2022) ○ Start construction of Cathode Pohang stage 5 (29 k tons, Apr) ○ Diversify supply chain for raw materials for secondary battery materials • Reviewing stake investment in graphite mine in Australia, etc Launched carbon neutral committee Gwangyang cathode materials Sejong anode materials Business Performance of Key 7 Businesses 2030 2021 2030 2021
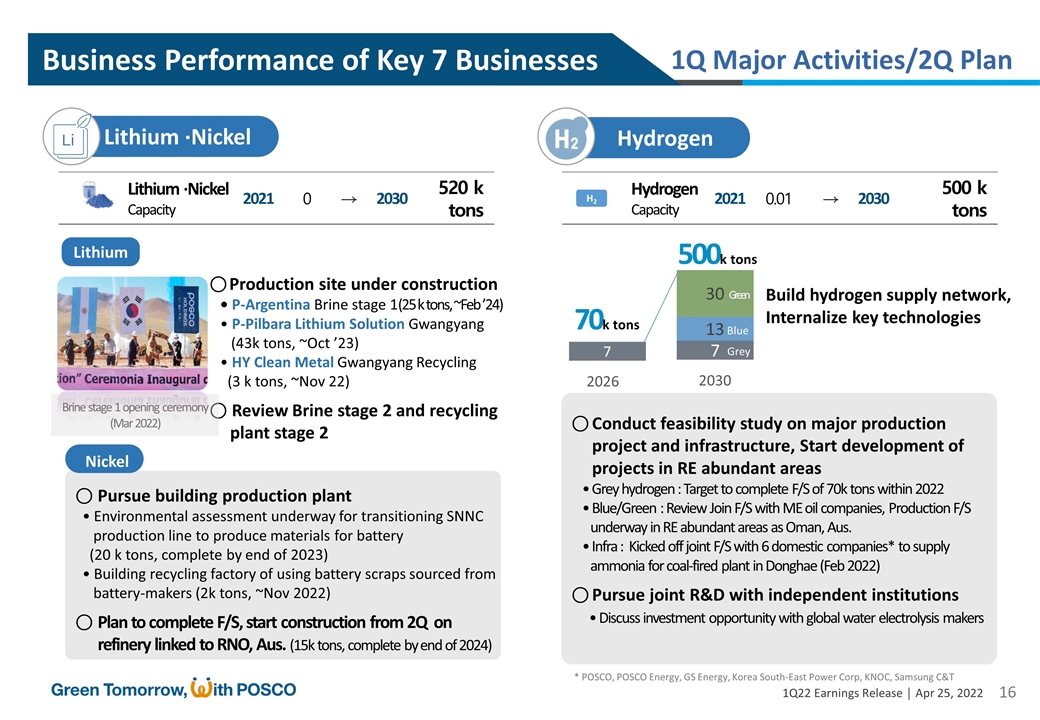
Lithium ·Nickel 2030 Lithium ·Nickel Capacity 0 → 520 k tons 2021 Lithium Nickel ○ Conduct feasibility study on major production project and infrastructure, Start development of projects in RE abundant areas • Grey hydrogen : Target to complete F/S of 70k tons within 2022 • Blue/Green : Review Join F/S with ME oil companies, Production F/S underway in RE abundant areas as Oman, Aus. • Infra : Kicked off joint F/S with 6 domestic companies* to supply ammonia for coal-fired plant in Donghae (Feb 2022) ○ Pursue joint R&D with independent institutions • Discuss investment opportunity with global water electrolysis makers 2030 Hydrogen Hydrogen Capacity 0.01 → 500 k tons 2021 H2 2026 2030 70k tons 7 7 13 30 Grey Blue Green 500k tons 1Q Major Activities/2Q Plan Business Performance of Key 7 Businesses ○ Production site under construction • P-Argentina Brine stage 1(25 k tons, ~Feb ’24) • P-Pilbara Lithium Solution Gwangyang (43k tons, ~Oct ’23) • HY Clean Metal Gwangyang Recycling (3 k tons, ~Nov 22) ○ Review Brine stage 2 and recycling plant stage 2 Brine stage 1 opening ceremony (Mar 2022) ○ Pursue building production plant • Environmental assessment underway for transitioning SNNC production line to produce materials for battery (20 k tons, complete by end of 2023) • Building recycling factory of using battery scraps sourced from battery-makers (2k tons, ~Nov 2022) ○ Plan to complete F/S, start construction from 2Q on refinery linked to RNO, Aus. (15k tons, complete by end of 2024) Build hydrogen supply network, Internalize key technologies * POSCO, POSCO Energy, GS Energy, Korea South-East Power Corp, KNOC, Samsung C&T
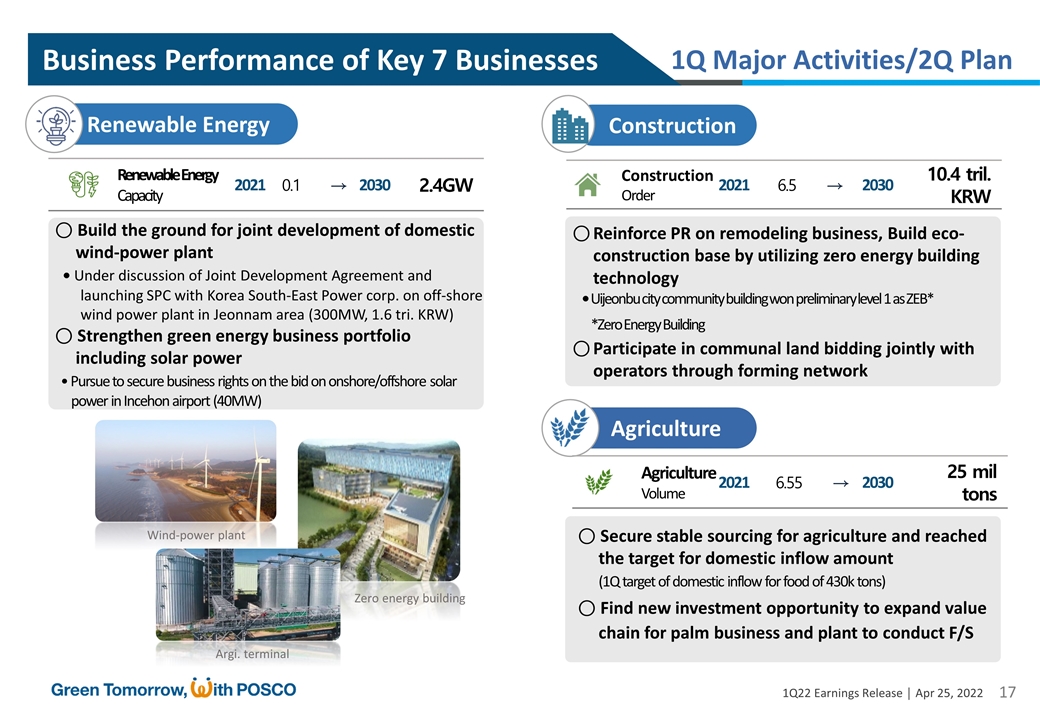
○ Build the ground for joint development of domestic wind-power plant • Under discussion of Joint Development Agreement and launching SPC with Korea South-East Power corp. on off-shore wind power plant in Jeonnam area (300MW, 1.6 tri. KRW) ○ Strengthen green energy business portfolio including solar power • Pursue to secure business rights on the bid on onshore/offshore solar power in Incehon airport (40MW) Renewable Energy 2030 Renewable Energy Capacity 0.1 → 2.4GW 2021 2030 Construction Construction Order 6.5 → 10.4 tril. KRW 2021 ○ Reinforce PR on remodeling business, Build eco- construction base by utilizing zero energy building technology • Uijeonbu city community building won preliminary level 1 as ZEB* *Zero Energy Building ○ Participate in communal land bidding jointly with operators through forming network Agriculture 2030 Agriculture Volume 6.55 → 25 mil tons 2021 ○ Secure stable sourcing for agriculture and reached the target for domestic inflow amount (1Q target of domestic inflow for food of 430k tons) ○ Find new investment opportunity to expand value chain for palm business and plant to conduct F/S 1Q Major Activities/2Q Plan Business Performance of Key 7 Businesses Zero energy building Wind-power plant Argi. terminal
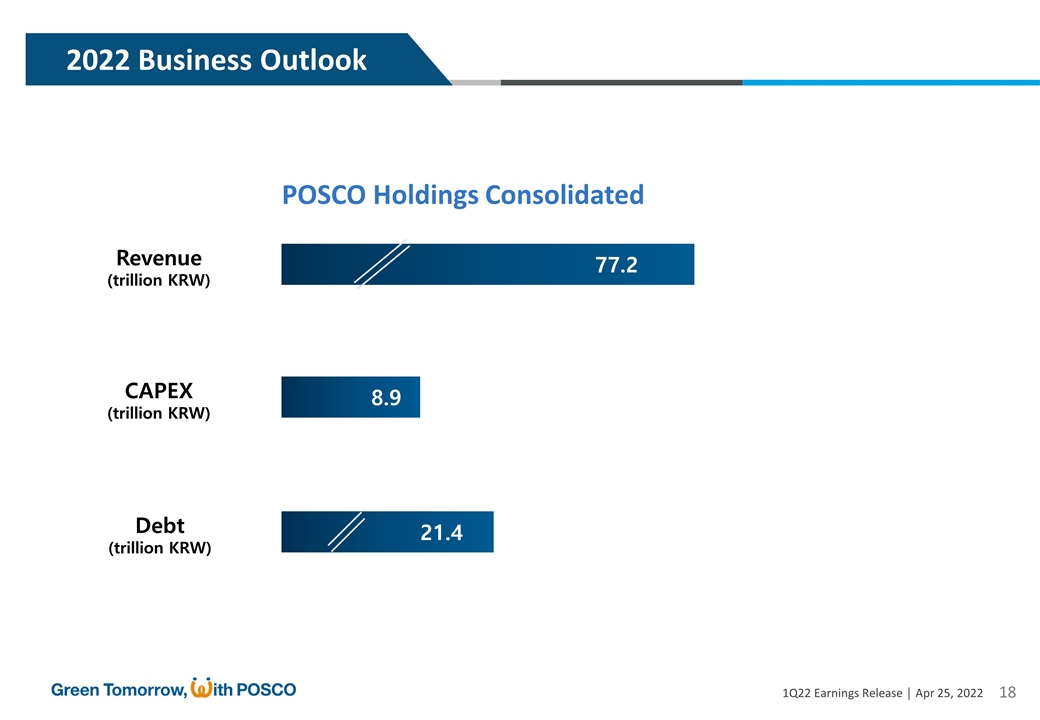
2022 Business Outlook POSCO Holdings Consolidated 8.9 21.4 77.2 CAPEX (trillion KRW) Revenue (trillion KRW) Debt (trillion KRW)
Summarized Income Statement Appendix Summarized Balance Sheet
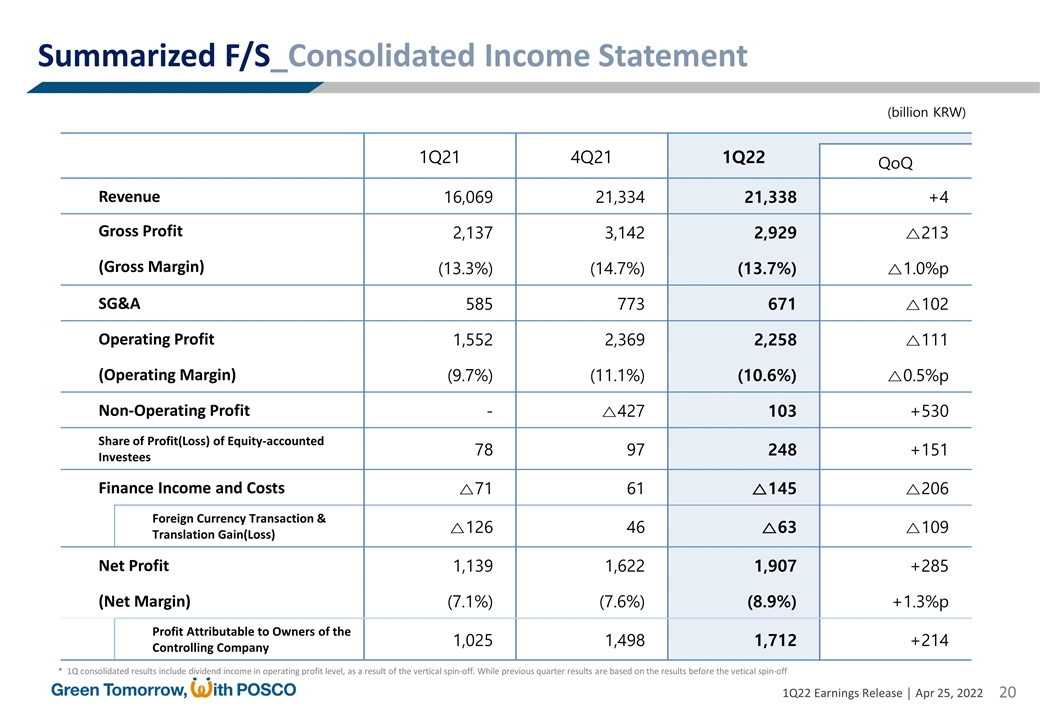
1Q21 4Q21 1Q22 QoQ Revenue 16,069 21,334 21,338 +4 Gross Profit 2,137 3,142 2,929 △213 (Gross Margin) (13.3%) (14.7%) (13.7%) △1.0%p SG&A 585 773 671 △102 Operating Profit 1,552 2,369 2,258 △111 (Operating Margin) (9.7%) (11.1%) (10.6%) △0.5%p Non-Operating Profit - △427 103 +530 Share of Profit(Loss) of Equity-accounted Investees 78 97 248 +151 Finance Income and Costs △71 61 △145 △206 Foreign Currency Transaction & Translation Gain(Loss) △126 46 △63 △109 Net Profit 1,139 1,622 1,907 +285 (Net Margin) (7.1%) (7.6%) (8.9%) +1.3%p Profit Attributable to Owners of the Controlling Company 1,025 1,498 1,712 +214 Summarized F/S_Consolidated Income Statement (billion KRW) * 1Q consolidated results include dividend income in operating profit level, as a result of the vertical spin-off. While previous quarter results are based on the results before the vetical spin-off
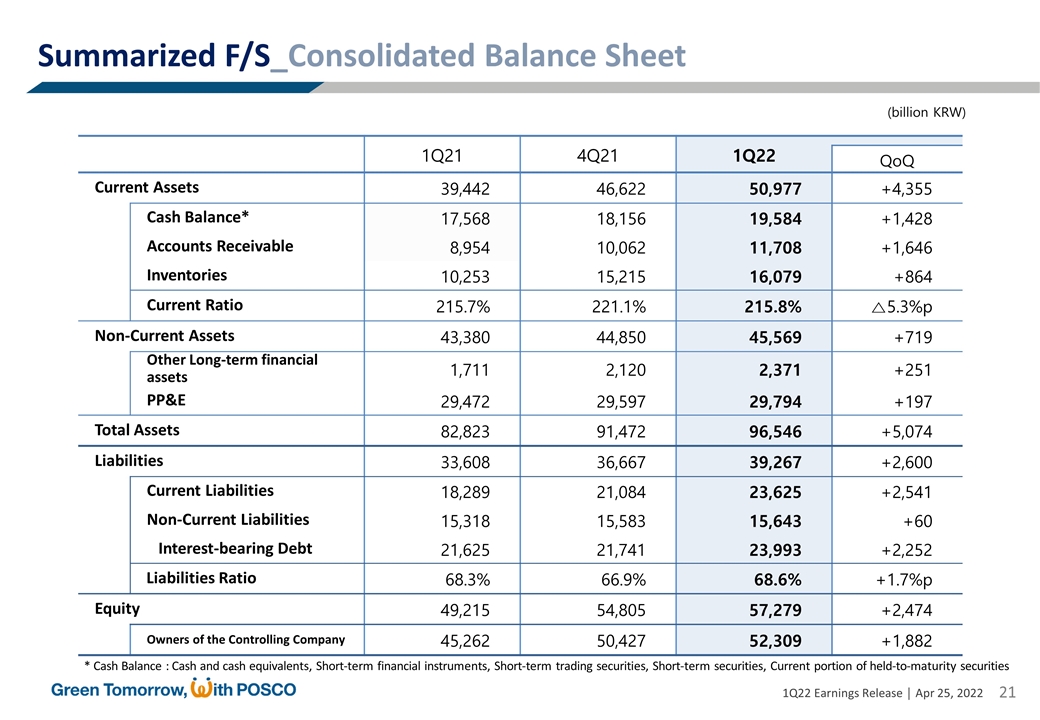
1Q21 4Q21 1Q22 QoQ Current Assets 39,442 46,622 50,977 +4,355 Cash Balance* 17,568 18,156 19,584 +1,428 Accounts Receivable 8,954 10,062 11,708 +1,646 Inventories 10,253 15,215 16,079 +864 Current Ratio 215.7% 221.1% 215.8% △5.3%p Non-Current Assets 43,380 44,850 45,569 +719 Other Long-term financial assets 1,711 2,120 2,371 +251 PP&E 29,472 29,597 29,794 +197 Total Assets 82,823 91,472 96,546 +5,074 Liabilities 33,608 36,667 39,267 +2,600 Current Liabilities 18,289 21,084 23,625 +2,541 Non-Current Liabilities 15,318 15,583 15,643 +60 Interest-bearing Debt 21,625 21,741 23,993 +2,252 Liabilities Ratio 68.3% 66.9% 68.6% +1.7%p Equity 49,215 54,805 57,279 +2,474 Owners of the Controlling Company 45,262 50,427 52,309 +1,882 Summarized F/S_Consolidated Balance Sheet (billion KRW) * Cash Balance : Cash and cash equivalents, Short-term financial instruments, Short-term trading securities, Short-term securities, Current portion of held-to-maturity securities
Serious News for Serious Traders! Try StreetInsider.com Premium Free!
You May Also Be Interested In
- International Truck Integrates Allison Fully Automatic Transmissions with S13 Engine
- Rogers Communications Announces Voting Results from Annual and Special Meeting of Shareholders
- FLYHT Reports Fourth Quarter and Full Year 2023 Results
Create E-mail Alert Related Categories
SEC FilingsSign up for StreetInsider Free!
Receive full access to all new and archived articles, unlimited portfolio tracking, e-mail alerts, custom newswires and RSS feeds - and more!


 Tweet
Tweet Share
Share