

Form 6-K IAMGOLD CORP For: Jun 30
 Tweet
Tweet Share
ShareFORM 6-K
UNITED STATES
SECURITIES AND EXCHANGE COMMISSION
Washington, D.C. 20549
Report of Foreign Private Issuer
Pursuant to Rule 13a-16 or 15d-16 of the
Securities Exchange Act of 1934
Date: August 3, 2022
Commission File Number 001-31528
IAMGOLD Corporation
(Translation of registrant’s name into English)
401 Bay Street Suite 3200, PO Box 153
Toronto, Ontario, Canada M5H 2Y4
Tel: (416) 360-4710
(Address of principal executive offices)
Indicate by check mark whether the registrant files or will file annual reports under cover Form 20-F or Form 40-F.
Form 20-F ¨ Form 40-F ý
Indicate by check mark if the registrant is submitting the Form 6-K in paper as permitted by Regulation S-T Rule 101(b)(1): ¨
Note: Regulation S-T Rule 101(b)(1) only permits the submission in paper of a Form 6-K if submitted solely to provide an attached annual report to security holders.
Indicate by check mark if the registrant is submitting the Form 6-K in paper as permitted by Regulation S-T Rule 101(b)(7): ¨
Note: Regulation S-T Rule 101(b)(7) only permits the submission in paper of a Form 6-K if submitted to furnish a report or other document that the registrant foreign private issuer must furnish and make public under the laws of the jurisdiction in which the registrant is incorporated, domiciled or legally organized (the registrant’s “home country”), or under the rules of the home country exchange on which the registrant’s securities are traded, as long as the report or other document is not a press release, is not required to be and has not been distributed to the registrant’s security holders, and, if discussing a material event, has already been the subject of a Form 6-K submission or other Commission filing on EDGAR.
Description of Exhibit
| Exhibit | Description of Exhibit | |||||||
-2-
Signatures
Pursuant to the requirements of the Securities Exchange Act of 1934, the registrant has duly caused this report to be signed on its behalf by the undersigned, thereunto duly authorized.
| IAMGOLD CORPORATION | |||||||||||
| Date: August 3, 2022 | By: | /s/ Tim Bradburn | |||||||||
| Senior Vice President, General Counsel and Corporate Secretary | |||||||||||

MANAGEMENT'S DISCUSSION AND ANALYSIS
OF FINANCIAL POSITION AND RESULTS OF OPERATIONS
Second Quarter Ended June 30, 2022
INDEX
| Introduction | |||||
About IAMGOLD | |||||
| Highlights — Second Quarter 2022 | |||||
| Operating and Financial Results | |||||
| Outlook | |||||
| Environmental, Social and Governance | |||||
| Quarterly Updates | |||||
| Operating and Financial Performance | |||||
| West Africa | |||||
| North America | |||||
| South America | |||||
| Exploration | |||||
| Financial Condition | |||||
| Liquidity and Capital Resources | |||||
| Cash Flow | |||||
| Market Trends | |||||
| Market Risk | |||||
| Shareholders’ Equity | |||||
| Quarterly Financial Review | |||||
| Disclosure Controls and Procedures and Internal Control over Financial Reporting | |||||
| Critical Judgments, Estimates and Assumptions | |||||
| New Accounting Standards | |||||
| Risks and Uncertainties | |||||
| Non-GAAP Financial Measures | |||||
| Cautionary Statement on Forward-Looking Information | |||||
IAMGOLD CORPORATION Second Quarter 2022 Management’s Discussion and Analysis | 1 | ||||
INTRODUCTION
The following Management’s Discussion and Analysis (“MD&A”) of IAMGOLD Corporation (“IAMGOLD” or the “Company”), dated August 3, 2022, is intended to supplement and complement the unaudited condensed consolidated interim financial statements and notes thereto as at and for the three and six months ended June 30, 2022 ("consolidated interim financial statements"). This MD&A should be read in conjunction with IAMGOLD's audited annual consolidated financial statements and related notes as at and for the fiscal year ended December 31, 2021 and the related MD&A included in the 2021 annual report. All figures in this MD&A are in U.S. dollars and tabular dollar amounts are in millions, unless stated otherwise. Additional information on IAMGOLD can be found at www.iamgold.com. However, the information on the website is not in any way incorporated in or made a part of this MD&A.
ABOUT IAMGOLD
IAMGOLD is a mid-tier gold mining company operating in North America, South America and West Africa. The Company has three operating mines: Essakane (Burkina Faso), Rosebel (Suriname) and Westwood (Canada) and is building the large-scale, long life Côté Gold project (“Côté Gold”) (Canada) which is expected to start production in the beginning of 2024. In addition, the Company has a robust development and exploration portfolio within high potential mining districts in the Americas and West Africa.
IAMGOLD employs approximately 5,000 people and is committed to maintaining its culture of accountable mining through high standards of Environmental, Social and Governance ("ESG") practices, including its commitment to Zero Harm®, in every aspect of its business. IAMGOLD is listed on the New York Stock Exchange (NYSE:IAG) and the Toronto Stock Exchange (TSX:IMG) and is one of the companies on the JSI index1.
HIGHLIGHTS - SECOND QUARTER 2022
•Attributable gold production of 170,000 ounces in the second quarter and 344,000 ounces year-to-date (“YTD”) on continued strong performance from Essakane and improvements at Rosebel; annual production is expected to be in the upper end of the guidance range of 570,000 to 640,000 ounces.
•Gold revenues of $334.0 million in the second quarter from sales of 185,000 ounces (170,000 ounces on an attributable basis) at an average realized gold price of $1,799 per ounce and $690.6 million YTD from sales of 381,000 ounces (351,000 ounces on an attributable basis) at an average realized gold price of $1,806 per ounce.
•Cost of sales per ounce sold of $1,130 ($1,081 YTD), cash cost2 per ounce sold of $1,119 ($1,066 YTD) and all-in sustaining costs2 ("AISC") per ounce sold of $1,604 ($1,545 YTD); costs guidance for 2022 is unchanged with cash costs2 expected to be between $1,100 and $1,150 per ounce sold and AISC2 expected to be between $1,650 and $1,690 per ounce sold.
•Mine-site free cash flow2 of $42.8 million ($130.3 million YTD).
•Net earnings (loss) and adjusted net earnings (loss) per share attributable to equity holders2 of $(0.02) and $(0.01), respectively; YTD net earnings and adjusted net earnings per share attributable to equity holders2 of $0.03 and $0.04, respectively.
•Earnings before interest, income taxes, depreciation and amortization (“EBITDA”)2 of $101.4 million ($236.3 million YTD) and adjusted EBITDA2 of $110.0 million ($247.5 million YTD).
•Cash, cash equivalents and short-term investments of $452.9 million and liquidity2 of $801.6 million at June 30, 2022.
•The Company announced the updated costs to complete, an updated life-of-mine (“LOM”) plan and project economics for the Côté Gold project to be included in a new NI 43-101 technical report (see news release dated August 3, 2022). The Company's share of remaining project spend to bring Côté Gold into production is estimated to be between $1.2 and $1.3 billion from July 1, 2022, net of leases and working capital.
•The Company is actively pursuing various alternatives to increase its liquidity and capital resources to advance and complete construction of the Côté Gold project on the updated schedule. See “Liquidity and Capital Resources - Liquidity Outlook”. In the second quarter 2022, the Company advanced a strategic review process to evaluate options for its Rosebel/Saramacca mining complex which could include the sale of this complex. In addition, the Company is evaluating strategic alternatives with respect to certain of its development and exploration assets, including those located in South America and West Africa (excluding Essakane), that may include the disposition of all or an interest in one or more of such assets.
______________________________
1.Jantzi Social Index (“JSI”). The JSI is a socially screened market capitalization-weighted common stock index modeled on the S&P/TSX 60. It consists of companies which meet a set of broadly based environmental, social and governance rating criteria.
2.This is a non-GAAP financial measure. See "Non-GAAP Financial Measures".
IAMGOLD CORPORATION Second Quarter 2022 Management’s Discussion and Analysis | 2 | ||||
OPERATING AND FINANCIAL RESULTS
For more details and the Company's overall outlook for 2022, see "Outlook", and for individual mines and projects performance, see "Quarterly Updates". The following table summarizes certain operating and financial results for the three months ended June 30, 2022 (Q2 2022), March 31, 2022 (Q1 2022) and June 30, 2021 (Q2 2021) and the six months ended June 30 (or YTD), 2022 and 2021 and certain measures of the Company's financial position as at June 30, 2022, March 31, 2022 and December 31, 2021.
| Q2 2022 | Q1 2022 | Q2 2021 | YTD 2022 | YTD 2021 | |||||||||||||
| Key Operating Statistics | |||||||||||||||||
| Gold production – attributable (000s oz) | 170 | 174 | 139 | 344 | 295 | ||||||||||||
| Gold sales – attributable (000s oz) | 170 | 181 | 135 | 351 | 288 | ||||||||||||
Average realized gold price1 ($/oz) | $ | 1,799 | $ | 1,813 | $ | 1,800 | $ | 1,806 | $ | 1,788 | |||||||
Cost of sales2 ($/oz sold) – attributable | $ | 1,130 | $ | 1,035 | $ | 1,150 | $ | 1,081 | $ | 1,110 | |||||||
Cash costs1 ($/oz sold) – attributable | $ | 1,119 | $ | 1,017 | $ | 1,149 | $ | 1,066 | $ | 1,108 | |||||||
AISC1 ($/oz sold) – attributable | $ | 1,604 | $ | 1,490 | $ | 1,422 | $ | 1,545 | $ | 1,324 | |||||||
Financial Results ($ millions, except where noted) | |||||||||||||||||
| Revenues | $ | 334.0 | $ | 356.6 | $ | 265.6 | $ | 690.6 | $ | 563.0 | |||||||
| Gross profit | $ | 49.4 | $ | 81.0 | $ | 27.9 | $ | 130.4 | $ | 72.1 | |||||||
EBITDA1 | $ | 101.4 | $ | 134.9 | $ | 87.0 | $ | 236.3 | $ | 200.8 | |||||||
Adjusted EBITDA1 | $ | 110.0 | $ | 137.5 | $ | 84.8 | $ | 247.5 | $ | 184.9 | |||||||
| Net earnings (loss) attributable to equity holders | $ | (9.6) | $ | 23.8 | $ | (4.5) | $ | 14.2 | $ | 15.0 | |||||||
Adjusted net earnings (loss) attributable to equity holders1 | $ | (6.3) | $ | 26.1 | $ | (3.6) | $ | 19.8 | $ | 2.6 | |||||||
| Net earnings (loss) per share attributable to equity holders | $ | (0.02) | $ | 0.05 | $ | (0.01) | $ | 0.03 | $ | 0.03 | |||||||
Adjusted net earnings (loss) per share attributable to equity holders1 | $ | (0.01) | $ | 0.05 | $ | (0.01) | $ | 0.04 | $ | 0.01 | |||||||
Net cash from operating activities before changes in working capital1 | $ | 93.9 | $ | 133.9 | $ | 54.9 | $ | 227.8 | $ | 137.4 | |||||||
| Net cash from operating activities | $ | 81.9 | $ | 142.3 | $ | 37.3 | $ | 224.2 | $ | 139.0 | |||||||
Mine-site free cash flow1 | $ | 42.8 | $ | 87.5 | $ | 1.9 | $ | 130.3 | $ | 91.4 | |||||||
Capital expenditures1,3,4 – sustaining | $ | 67.1 | $ | 76.6 | $ | 23.9 | $ | 143.7 | $ | 37.6 | |||||||
Capital expenditures1,3,4 – expansion | $ | 189.0 | $ | 92.1 | $ | 128.4 | $ | 281.1 | $ | 217.2 | |||||||
| June 30 | March 31 | December 31 | June 30 | December 31 | |||||||||||||
| 2022 | 2022 | 2021 | 2022 | 2021 | |||||||||||||
| Financial Position ($ millions) | |||||||||||||||||
| Cash, cash equivalents and short-term investments | $ | 452.9 | $ | 524.4 | $ | 552.5 | $ | 452.9 | $ | 552.5 | |||||||
| Long-term debt | $ | 612.0 | $ | 463.5 | $ | 464.4 | $ | 612.0 | $ | 464.4 | |||||||
Net cash (debt)1 | $ | (225.1) | $ | (6.5) | $ | 16.3 | $ | (225.1) | $ | 16.3 | |||||||
| Available credit facility | $ | 348.7 | $ | 498.2 | $ | 498.3 | $ | 348.7 | $ | 498.3 | |||||||
1.Throughout this MD&A, the Company uses the terms average realized gold price per ounce sold, cash costs, cash costs per ounce sold, AISC, AISC per ounce sold, net cash from operating activities before changes in working capital, mine-site free cash flow, liquidity, net cash (debt), EBITDA, adjusted EBITDA, adjusted net earnings (loss) attributable to equity holders and adjusted net earnings (loss) per share attributable to equity holders, sustaining capital expenditures and expansion capital expenditures all of which are non-GAAP financial measures with no standard meaning under International Financial Reporting Standards ("IFRS") and are further discussed in the "Non-GAAP Financial Measures" section. The average realized gold price in the first and second quarter 2022 excluding the impact of the 2019 Prepay Arrangement (as defined below) were $1,884 and $1,873 per ounce sold, respectively.
2.Throughout this MD&A, cost of sales, excluding depreciation, is disclosed in the cost of sales note in the consolidated interim financial statements.
3.Throughout this MD&A, capital expenditures represent cash expenditures for property, plant and equipment and exploration and evaluation assets.
4.Starting in 2022, a higher portion of stripping costs are categorized as sustaining capital versus expansion capital, due to the particular areas that are scheduled to be mined and the stage of the life of mine aligning with World Gold Council guidelines. See "Non-GAAP Financial Measures" section.
_____________________________
1.This is a non-GAAP financial measure. See "Non-GAAP Financial Measures".
IAMGOLD CORPORATION Second Quarter 2022 Management’s Discussion and Analysis | 3 | ||||
Summary of Financial and Operating Results
| Contributors to Change | Q2 2022 vs. Q1 2022 | |||||||
| Financial | ||||||||
| Revenues | s | $334.0 million, down $22.6 million or 6%, primarily due to lower sales volumes at Essakane and Westwood as a result of lower production ($29.0 million and $3.4 million, respectively) and a lower average realized gold price ($1.8 million or $14 per ounce sold), partially offset by higher sales volume at Rosebel as a result of higher production and timing of sales ($11.8 million). Included in the quarter is the impact of the lower revenues recognized from the 2019 Prepay Arrangement noted below, with a $1,500 per ounce collar ($13.8 million or $74 per ounce sold). | ||||||
| Cost of sales | r | $284.6 million, up $9.0 million or 3%. Excluding the non-cash net realizable value (“NRV”) write-down of ore stockpile and finished goods inventories, cost of sales is higher primarily due to higher operating costs, as a result of increased cost pressures during the quarter and higher depreciation (see below). The NRV write-down this quarter was $5.2 million (first quarter 2022 - $5.3 million). The NRV write-down is associated with Westwood, primarily due to higher costs from increased rehabilitation associated with underground development in zones previously impacted by seismic events. | ||||||
Depreciation expense (included in cost of sales) | r | $78.1 million, up $3.1 million or 4%, primarily due to higher depreciation at Essakane ($4.5 million) and Westwood ($0.9 million), partially offset by lower depreciation at Rosebel ($2.3 million). | ||||||
| General and administrative expenses | r | $17.2 million, up $2.1 million or 14%, primarily due to higher severance costs ($1.9 million) and costs associated with activities related to the changes in the Company's board of directors ($1.8 million), partially offset by lower share-based payments ($1.3 million) and directors’ fees ($0.2 million). The Company incurred severance costs of $3.5 million and cost associated with changes in the Company’s board of directors of $2.4 million for the first half of 2022. | ||||||
| Exploration expenses | r | $9.3 million, up $1.1 million primarily due to an increase in drilling costs from inflationary cost pressures. | ||||||
| Other expenses | s | $1.4 million, down $5.5 million. | ||||||
| Income tax expense | s | $25.1 million, down $1.5 million, comprised of current income tax expense of $27.7 million (first quarter 2022 - $28.9 million) and deferred income tax recovery of $2.6 million (first quarter 2022 - $2.3 million). The income tax expense for the second quarter 2022 included withholding taxes on the repatriation of funds. | ||||||
| Net cash from operating activities before changes in working capital | s | $93.9 million, down $40.0 million, primarily due to the factors noted below. | ||||||
| Net cash from operating activities | s | $81.9 million, down $60.4 million, primarily due to lower net cash earnings ($19.9 million), higher income taxes paid resulting from withholding taxes on repatriation of funds ($26.9 million) and a net outflow in non-cash working capital movements ($20.4 million), partially offset by an increase in cash inflows from the settlement of derivatives ($6.3 million). | ||||||
| Mine-site free cash flow | s | $42.8 million, down $44.7 million, from the prior quarter, primarily due to lower operating cash flow at Essakane ($54.6 million) and Westwood ($11.1 million), mainly due to higher operating costs, lower sales volume and a lower average realized gold price, and higher capital expenditures at Rosebel ($16.0 million), partially offset by higher operating cash flow from Rosebel ($21.5 million) and lower capital expenditures at Essakane ($17.1 million). | ||||||
| Financial Position | ||||||||
| Cash, cash equivalents, short-term investments and restricted cash | s | $491.8 million comprised of cash and cash equivalents of $451.1 million, short-term investments of $1.8 million and restricted cash of $38.9 million, down $73.8 million from March 31, 2022 and $102.9 million from December 31, 2021. | ||||||
| Operating | ||||||||
| Attributable gold production | s | 170,000 ounces, down 4,000 ounces or 2%, due to lower production at Essakane (5,000 ounces) as a result of lower throughput, partially offset by higher grade, and lower production at Westwood (2,000 ounces) due to lower grade, partially offset by higher production at Rosebel (3,000 ounces) due to higher grade. | ||||||
| Attributable gold sales | s | 170,000 ounces, down 11,000 ounces or 6%, due to lower production and timing of sales at Essakane (15,000 ounces) and lower production at Westwood (2,000 ounces), partially offset by higher production and timing of sales at Rosebel (6,000 ounces). | ||||||
IAMGOLD CORPORATION Second Quarter 2022 Management’s Discussion and Analysis | 4 | ||||
| Contributors to Change | Q2 2022 vs. Q1 2022 | |||||||
| Operating | ||||||||
Capital expenditures – capitalized stripping (included in capital expenditures – sustaining and expansion) | s | $35.8 million, down $10.1 million or 22%, due to lower capitalized stripping activities at Essakane ($12.7 million), partially offset by higher capitalized stripping activities at Rosebel ($2.6 million). In the second quarter 2022, $24.5 million of capitalized stripping activities were categorized as sustaining capital (first quarter 2022 - $42.4 million) and $11.3 million were categorized as expansion capital (first quarter 2022 - $3.5 million). | ||||||
| Capital expenditures – sustaining | s | $67.1 million, down $9.5 million or 12%. Excluding the impact of capitalized stripping activities noted above, sustaining capital expenditures were higher by $8.4 million, primarily due to higher spending at Rosebel ($12.4 million) related to timing of capital projects, partially offset by lower spending at Essakane ($3.9 million). | ||||||
| Capital expenditures – expansion | r | $189.0 million, up $96.9 million or 105%. Excluding the impact of capitalized stripping activities noted above, expansion capital expenditures were higher by $89.1 million, primarily due to higher expenditures at Côté Gold ($91.1 million), in line with an increase in construction activities compared with the first quarter 2022 which was negatively impacted by COVID-19 and the batch plant fire. | ||||||
Cost of sales (excluding depreciation) per ounce sold | r | $1,130, up $95 or 9%, from $1,035 per ounce sold. Excluding depreciation, cost of sales per ounce sold was higher due to higher production costs and lower production volume. Included was a non-cash NRV write-down of ore stockpile and finished goods inventories of $26 per ounce sold (first quarter 2022 - $23 per ounce sold), comprised of $19 per ounce included in cash costs and AISC per ounce sold as short-term and $6 per ounce excluded as long-term. Additionally, included was the positive impact of realized derivative gains of $64 per ounce sold (first quarter 2022 - gains of $44 per ounce sold). | ||||||
| Cash costs per ounce sold | r | $1,119, up $102 or 10% from $1,017 per ounce sold. Cash costs per ounce sold was higher due to higher production costs and lower production volume. Included was a non-cash NRV write-down of short-term ore stockpile and finished goods inventories of $19 per ounce sold (first quarter 2022 - $9 per ounce sold). | ||||||
| AISC per ounce sold | r | $1,604, up $114 or 8%, from $1,490 per ounce sold, primarily due to the increase in cash costs per ounce sold noted above. | ||||||
| Contributors to change | Q2 2022 vs. Q2 2021 | |||||||
| Financial | ||||||||
| Revenues | r | $334.0 million, up $68.4 million or 26%, primarily due to higher sales volume at Rosebel ($53.0 million), Westwood ($13.8 million) and Essakane ($1.1 million) as a result of higher production. Included in the second quarter 2022 is the impact of lower revenues recognized as a result of the 2019 Prepay as noted above. | ||||||
| Cost of sales | r | $284.6 million, up $46.9 million or 20%. Excluding the non-cash NRV write-down of ore stockpiles and finished goods inventories, cost of sales is higher primarily due to higher operating costs in addition to higher depreciation (see below). The NRV write-down this quarter was $5.2 million noted above (second quarter 2021 - $11.2 million). | ||||||
Depreciation expense (included in cost of sales) | r | $78.1 million, up $8.4 million or 12%, primarily due to higher depreciation of capitalized stripping assets at Essakane ($4.4 million), and higher depreciation at Westwood as underground operations were under care and maintenance for the majority of the second quarter 2021 ($4.4 million), partially offset by lower depreciation at Rosebel ($0.3 million). | ||||||
| General and administrative expenses | r | $17.2 million, up $5.4 million or 46%, primarily due to higher severance costs ($2.5 million), costs associate with activities related to the changes in the Company's board of directors ($2.1 million), salaries and bonus accruals ($1.4 million) and a reduced impact of realized derivative gains ($0.7 million), partially offset by lower share-based payments ($0.9 million), depreciation ($0.2 million), and other administration costs ($0.2 million). | ||||||
| Exploration expenses | s | $9.3 million, down $2.7 million due to a reduction in planned exploration expenditures during 2022. | ||||||
| Other expenses | s | $1.4 million, down $20.7 million, primarily due to a decrease in care and maintenance costs ($11.4 million) and COVID-19 related costs being included in cost of sales starting in 2022 ($4.9 million). | ||||||
IAMGOLD CORPORATION Second Quarter 2022 Management’s Discussion and Analysis | 5 | ||||
| Contributors to change | Q2 2022 vs. Q2 2021 | |||||||
| Financial | ||||||||
| Income tax expense | r | $25.1 million, up $13.9 million, comprised of current income tax expense of $27.7 million (second quarter 2021 - $13.3 million) and deferred income tax recovery of $2.6 million (second quarter 2021 - recovery of $2.1 million). The increase in income tax expense was primarily due to higher taxable income from Essakane and withholding taxes on the repatriation of funds. | ||||||
| Net cash from operating activities before changes in working capital | r | $93.9 million, up $39.0 million, primarily due to the factors noted below. | ||||||
| Net cash from operating activities | r | $81.9 million, up $44.6 million, primarily due higher net cash earnings ($36.0 million), net proceeds from gold prepay arrangements ($10.3 million) and an increase in cash inflows from the settlement of derivatives ($9.8 million), partially offset by an increase in income tax paid ($15.2 million). | ||||||
| Mine-site free cash flow | r | $42.8 million, up $40.9 million, primarily due to higher operating cash flow at Rosebel ($71.3 million) mainly due to higher sales volume and higher average realized gold price, partially offset by higher capital expenditures at Rosebel ($16.4 million) and Westwood ($5.9 million) as production activities continue to ramp up. | ||||||
| Operating | ||||||||
| Attributable gold production | r | 170,000 ounces, up 31,000 ounces or 22%, due to higher production at Rosebel (24,000 ounces) resulting from higher head grade and recoveries, Westwood (6,000 ounces) as the underground operations were on care and maintenance for most of the second quarter 2021, and Essakane (1,000 ounces) due to higher grade. | ||||||
| Attributable gold sales | r | 170,000 ounces, up 35,000 ounces or 26%, due to higher production and timing of sales at Rosebel (28,000 ounces) and higher production at Westwood (7,000 ounces). | ||||||
Capital expenditures – capitalized stripping (included in capital expenditures – sustaining and expansion) | r | $35.8 million, up $15.3 million or 75%, due to higher capitalized stripping activities at Rosebel ($11.0 million) and Essakane ($4.3 million) to support future production plans. In the second quarter 2022, $24.5 million of capitalized stripping activities were categorized as sustaining capital (second quarter 2021 - $nil) and $11.3 million were categorized as expansion capital (second quarter 2021 - $20.5 million). | ||||||
| Capital expenditures – sustaining | r | $67.1 million, up $43.2 million or 181%. Excluding the impact of capitalized stripping activities noted above, sustaining capital expenditures were higher by $18.7 million, primarily due to higher spending at Rosebel ($9.9 million) related to timing of capital projects and Westwood ($6.7 million) as underground operations were on care and maintenance for the majority of the second quarter 2021. | ||||||
| Capital expenditures – expansion | r | $189.0 million, up $60.6 million or 47%. Excluding the impact of capitalized stripping activities noted above, expansion capital expenditures were higher by $69.8 million, primarily due to higher spending at Côté Gold resulting from an increase in construction activities ($84.9 million), partially offset by lower spending at Essakane ($5.2 million), Boto Gold ($4.7 million), and Rosebel ($4.7 million). | ||||||
Cost of sales (excluding depreciation) per ounce sold | s | $1,130, down $20 or 2%, from $1,150 per ounce sold. Excluding depreciation, cost of sales per ounce sold was lower by $255 per ounce primarily due to higher sales volume at Rosebel and Westwood and a lower NRV write down of $39 per ounce sold, partially offset by higher production costs of $273 per ounce. Included was a non-cash NRV write-down of ore stockpile and finished goods inventories of $26 per ounce sold (second quarter 2021 - $15 per ounce sold), in addition to the positive impact of realized derivative gains of $64 per ounce sold (second quarter 2021 - gains of $15 per ounce sold). | ||||||
| Cash costs per ounce sold | s | $1,119, down $30 or 3%, from $1,149 per ounce sold. Cash costs per ounce sold was lower by $252 per ounce primarily due to higher sales volume noted above and a lower NRV adjustment of $39 per ounce sold, partially offset by higher production costs and by-product credits of $270 per ounce sold. Included was a non-cash NRV write-down of short-term ore stockpile and finished goods inventories noted above. | ||||||
| AISC per ounce sold | r | $1,604, up $182 or 13%, from $1,422, primarily due to higher sustaining capital expenditures of $202 per ounce sold, partially offset by lower cash costs per ounce sold noted above. | ||||||
IAMGOLD CORPORATION Second Quarter 2022 Management’s Discussion and Analysis | 6 | ||||
Global COVID-19 Pandemic
The global COVID-19 pandemic continues to evolve and the management thereof remains a focus for the business. See "Operational Updates" for more information on each site. The Company continues to closely monitor developments and is taking necessary measures to manage the impact of the COVID-19 pandemic on its personnel, operations, construction and development projects and exploration activities. COVID-19 detection and mitigation protocols at our sites are reviewed on an ongoing basis to adapt to the evolving situation.
OUTLOOK
Operating Performance
| Actual YTD 2022 | Full Year Guidance 20221 | |||||||
| Essakane (000s oz) | 219 | 360 – 385 | ||||||
| Rosebel (000s oz) | 95 | 155 – 180 | ||||||
| Westwood (000s oz) | 30 | 55 – 75 | ||||||
Total attributable production (000s oz)2 | 344 | 570 – 640 | ||||||
Cost of sales2 ($/oz sold) | $ | 1,081 | $1,100 – $1,150 | |||||
Cash costs2,3 ($/oz sold) | $ | 1,066 | $1,100 – $1,150 | |||||
AISC2,3 ($/oz sold) | $ | 1,545 | $1,650 – $1,690 | |||||
| Depreciation expense ($ millions) | $ | 153.8 | $280 – $290 | |||||
| Income taxes paid | $ | 45.3 | $69 – $79 | |||||
1.The full year guidance is based on the following 2022 full year assumptions: average realized gold price of $1,700 per ounce, USDCAD exchange rate of 1.25, EURUSD exchange rate of 1.20 and average crude oil price of $70 per barrel.
2.Consists of Essakane, Rosebel and Westwood on an attributable basis of 90%, 95% and 100%, respectively.
3.This is a non-GAAP financial measure. See "Non-GAAP Financial Measures".
Production Outlook
Attributable gold production guidance for 2022 is unchanged and is expected to be in the upper end of the range of 570,000 to 640,000 ounces.
Costs Outlook
Costs guidance for 2022 is unchanged with cash costs expected to be between $1,100 and $1,150 per ounce sold and AISC expected to be between $1,650 and $1,690 per ounce sold. These estimates, issued in January 2022, included an inflation assumption of 5% to 7% on key consumables, translating to an increase of 1% to 2% in cash costs and AISC (reflected in the guidance figures). Additional cost pressures continue from systemic inflation, constrained global supply chains and the sanctions on trade with Russia, increasing the average cost of key consumables such as oil, ammonium nitrate, grinding media, lime and cyanide. The Company continues to work with its supply chain and seek alternatives to mitigate ongoing costs pressures, including the sourcing of appropriate alternatives as well as progressing productivity initiatives at its operations through the IAMALLIN operational improvement program. Increases in oil prices have been partially mitigated by the existing oil hedge program, see “Market Risk”. For reference, excluding the impact of the Company’s hedging program, a $10/bbl increase in the oil price would translate to a $15 per ounce increase in cash costs; however with current hedges in place, the same movement would equate to a $6 per ounce increase in cash costs. The Company notes that continued external cost pressures may result in an increase to costs and capital expenditures.
Income Taxes Paid
Income taxes paid guidance has been updated to be between $69 and $79 million ($55 – $65 million previously) to primarily account for withholding taxes on the repatriation of funds from Essakane.
IAMGOLD CORPORATION Second Quarter 2022 Management’s Discussion and Analysis | 7 | ||||
Capital Expenditures1
| Actual YTD 2022 | Full Year Guidance 2022 | |||||||||||||||||||
| ($ millions) | Sustaining2 | Expansion3 | Total | Sustaining2 | Expansion3 | Total | ||||||||||||||
| Essakane | $ | 78.8 | $ | 1.5 | $ | 80.3 | $ | 165 | $ | 5 | $ | 170 | ||||||||
Rosebel4 | 48.2 | 20.7 | 68.9 | 105 | 35 | 140 | ||||||||||||||
| Westwood | 16.1 | 1.2 | 17.3 | 40 | 10 | 50 | ||||||||||||||
| 143.1 | 23.4 | 166.5 | 310 | 50 | 360 | |||||||||||||||
| Boto Gold | — | 9.6 | 9.6 | — | 20 | 20 | ||||||||||||||
| Corporate | 0.6 | — | 0.6 | — | — | — | ||||||||||||||
Total5,6,7,8 (±5%) | $ | 143.7 | $ | 33.0 | $ | 176.7 | $ | 310 | $ | 70 | $ | 380 | ||||||||
1.100% basis, unless otherwise stated. For an update related to Cóté Gold capital expenditures, see "New Côté Gold Technical Report".
2.Sustaining capital includes capitalized stripping of (i) $17.2 million for Essakane and $7.3 million for Rosebel in Q2 2022 (ii) $47.1 million for Essakane and $19.8 million for Rosebel YTD 2022 and (iii) $110 million for Essakane and $45 million for Rosebel for the full year guidance. See "Outlook" sections below.
3.Expansion capital includes capitalized stripping of (i) $nil million for Essakane and $11.3 million for Rosebel in Q2 2022 (ii) $nil for Essakane and $14.8 million for Rosebel YTD 2022 and (iii) $nil for Essakane and $20 million for Rosebel for the full year 2022 guidance. See "Outlook" sections below.
4.Rosebel includes Saramacca at 70%.
5.Includes $10 million of capitalized exploration and evaluation expenditures also included in the Exploration Outlook guidance table.
6.Capitalized borrowing costs are not included.
7.In addition to the above capital expenditures, $24 million in total principal lease payments are expected.
8.See "Costs Outlook" section above.
Exploration
| Actual YTD 2022 | Full Year Guidance 2022 | |||||||||||||||||||
| ($ millions) | Capitalized | Expensed | Total | Capitalized | Expensed | Total | ||||||||||||||
| Exploration projects – greenfield | $ | — | $ | 14.7 | $ | 14.7 | $ | — | $ | 21 | $ | 21 | ||||||||
Exploration projects – brownfield1 | 3.9 | 2.6 | 6.5 | 10 | 4 | 14 | ||||||||||||||
| $ | 3.9 | $ | 17.3 | $ | 21.2 | $ | 10 | $ | 25 | $ | 35 | |||||||||
1.Exploration projects - brownfield includes planned near-mine exploration and resource development of (i) $3.9 million YTD 2022, and (ii) $10 million for the full
year 2022 guidance.
ENVIRONMENTAL, SOCIAL AND GOVERNANCE
The Company is committed to:
•Maintaining its culture of accountable mining through high standards of ESG practices; and
•The principle of Zero Harm®, in every aspect of its business, with particular emphasis on respecting the natural environment, building strong community partnerships and putting the health and safety of the Company's employees first.
The Company has implemented the Mining Association of Canada's Toward Sustainable Mining framework at all its operations and is working towards the implementation of the World Gold Council’s Responsible Gold Mining Principles with the year two annual report relating to this implementation released by the Company. ESG policies, systems and practices are embedded throughout the business and the Company reports annually on its ESG performance via its Global Reporting Initiative compliant Health, Safety and Sustainability Report. As part of its accountability and reporting framework, the Company has also committed to report in accordance with the Task Force on Climate-Related Financial Disclosures ("TCFD") guidelines, and expects to release its initial TCFD report by the end of 2022.
Environmental
The Company recognizes that mining activities are energy intensive and generate significant greenhouse gas emissions (“GHG”). In September 2021, the Company announced that it had set a global target of reaching net negative GHG emissions by no later than 2050. The Company also announced a target of achieving net positive biodiversity. Medium term targets will be set as part of the Company’s roadmap to achieve these global targets and will be issued by the end of 2022. An external review of the Company’s GHG emissions profile across all sites is in progress. The external review will inform the development of an action plan for the Company’s global commitments.
Social
Health and Safety
Health and safety is core to the Company’s relentless pursuit of its Zero Harm® vision. Through various programs, the Company continuously promotes a safe work environment and a wellness program at all sites. The DARTFR (days away, restricted, transferred duty frequency rate) was 0.31 for the first half of 2022, tracking below the global annual target of 0.42. The TRIFR (total recordable injuries frequency rate) was 0.85 for the first half of 2022, tracking above the global annual target of 0.73. Côté Gold has surpassed over 5.7 million hours with no lost time injuries to date. The operations have been increasing focus on situational awareness and preventative activities related to work tasks.
_____________________________
1.This is a non-GAAP financial measure. See "Non-GAAP Financial Measures".
IAMGOLD CORPORATION Second Quarter 2022 Management’s Discussion and Analysis | 8 | ||||
Social and Economic Development
The Company is continuously exploring opportunities for investing and partnering with communities impacted by its operations. At both Essakane and Rosebel, the Company has committed to establishing and seeding community funds. The bulk of the Company’s funding for community investment initiatives at these sites will flow through these dedicated community funds to ensure consistent funding on a year-to-year basis.
At Rosebel, the Company has committed to making an annual contribution of 0.25% of annual revenues to the Rosebel Community Fund, in addition to its existing in-kind royalty of 0.25% of gold and silver monthly production it contributes to the Suriname Environmental & Mining Foundation. In 2021, Rosebel contributed $0.9 million to the Rosebel Community Fund complementing the initial endowment of $2.5 million made by the Company in 2020. Current supported projects extend across the fields of water and sanitation, clean energy, community health and sustainable communities. The new local procurement strategy developed to support economic development in the surrounding communities through the implementation of local content strategies to generate employment and procurement opportunities at local level started to be rolled-out.
At Essakane, the Company continued its participation in the Mining Fund for Local Development in Burkina Faso, a program established by the government, pursuant to which the Company committed to contribute 1% of its annual revenues. The contribution for the second quarter 2022 is estimated at $1.1 million and $0.9 million for the first quarter 2022. In parallel, Essakane continued its direct community investment initiatives, focusing on agricultural programs as well as the fight against malaria, tuberculosis and malnutrition, income generating activities supported through the mine’s Iron Fund and small business support through the mine’s local content strategy. The United Nations Development Program of Burkina Faso and the Company, signed a two-year financing agreement for the implementation of a local development initiative in favor of the communities of Falagountou, Markoye, Gorom-Gorom and Dori, fostering youth employment, reducing poverty, strengthening local infrastructure and supporting capacity building in local governance.
The Company has continued to advance work on its previously announced partnership with Giants of Africa, a non-governmental organization founded by Masai Ujiri, President of the Toronto Raptors. After the first phase in 2021, two additional courts are being constructed by Giants of Africa in Burkina Faso and Senegal, which are expected to be completed by the end of 2022.
At Boto Gold, the construction of new houses for the resettlement of the Kouliminde village has started. The Company also continued with its community development projects, focusing on health with the fight against malaria, access to water and income generating activities through agriculture and vegetable production.
Diversity, Equity and Inclusion
The Company unequivocally condemns inequity, discrimination and hatred in all its forms. One of the Company's values is to conduct itself with respect and embrace diversity. The Company has established a Diversity, Equity and Inclusion ("DEI") Steering Committee and Employee Council groups to further enhance the Company's strong commitment to these important values through data collection, education, awareness and action planning at the enterprise level. The Company completed a diagnostic evaluation of its DEI status and the resulting findings and recommendations (global and site specific) are being rolled out across the Company to develop action plans. The Company is a sponsor of the Artemis Project, which aims to promote female business owners and entrepreneurs in the mining sector. Artemis members include innovative and award-winning social and natural scientists with over 500 years of combined practical and global sector experience, 75% of whom are engineers.
Governance
The Board of Directors of IAMGOLD (the “Board”) adopted new diversity and renewal guidelines in 2021, reflecting governance best practices. In terms of diversity, the Board agreed that its membership should comprise, at a minimum, the greater of (i) two and (ii) 30%, female directors. With respect to board membership renewal, it was decided that the average tenure of the Board should not exceed ten years and that no director should serve as the chair of the Board or the chair of any committee for more than ten consecutive years. Currently, women represent approximately 50% of the directors and the average tenure of the Board is less than one year.
Recent Acknowledgments
•Corporate Knights released its Best 50 list on June 29, 2022, which identifies the top 50 Canadian corporate citizens across all sectors evaluated based on ESG and economic key performance indicators. From a pool of 332 firms, the Company placed in 37th place, an improvement of seven places over last year.
•The Company obtained the ECOLOGO® certification for its mineral exploration activities carried out in Quebec and is the first producing mining company to achieve such certification.
IAMGOLD CORPORATION Second Quarter 2022 Management’s Discussion and Analysis | 9 | ||||
QUARTERLY UPDATES
West Africa
Essakane District, Burkina Faso
The Essakane District is located in north-eastern Burkina Faso, West Africa approximately 330 km northeast of the capital, Ouagadougou. The Essakane District includes the Essakane Mine and the surrounding mining lease and exploration concessions totaling approximately 1,000 square kilometres. The Company owns a 90% interest in the Essakane mine with the remaining 10% held by the government of Burkina Faso.
Essakane Mine (IAMGOLD interest – 90%)1
| Q2 2022 | Q1 2022 | Q2 2021 | YTD 2022 | YTD 2021 | |||||||||||||
| Key Operating Statistics | |||||||||||||||||
| Ore mined (000s t) | 3,803 | 3,832 | 3,559 | 7,635 | 7,994 | ||||||||||||
| Waste mined (000s t) | 7,602 | 11,346 | 11,730 | 18,948 | 22,167 | ||||||||||||
| Material mined (000s t) – total | 11,405 | 15,178 | 15,289 | 26,583 | 30,161 | ||||||||||||
Strip ratio2 | 2.0 | 3.0 | 3.3 | 2.5 | 2.8 | ||||||||||||
| Ore milled (000s t) | 2,704 | 3,162 | 3,169 | 5,866 | 6,358 | ||||||||||||
| Head grade (g/t) | 1.52 | 1.39 | 1.44 | 1.45 | 1.40 | ||||||||||||
| Recovery (%) | 90 | 88 | 81 | 89 | 81 | ||||||||||||
| Gold production (000s oz) – 100% | 119 | 124 | 118 | 243 | 231 | ||||||||||||
| Gold production (000s oz) – attributable 90% | 107 | 112 | 106 | 219 | 208 | ||||||||||||
| Gold sales (000s oz) – 100% | 117 | 131 | 115 | 248 | 229 | ||||||||||||
Average realized gold price3 ($/oz) | $ | 1,882 | $ | 1,885 | $ | 1,801 | $ | 1,883 | $ | 1,795 | |||||||
Financial Results ($ millions)1 | |||||||||||||||||
Revenues4 | $ | 218.8 | $ | 248.2 | $ | 208.2 | $ | 467.0 | $ | 412.3 | |||||||
| Operating costs | (86.4) | (90.4) | (98.8) | (176.8) | (202.2) | ||||||||||||
| Royalties | (10.6) | (12.3) | (10.5) | (22.9) | (20.6) | ||||||||||||
Cash costs3 | $ | (97.0) | $ | (102.7) | $ | (109.3) | $ | (199.7) | $ | (222.8) | |||||||
Other mine costs5 | (0.3) | (0.4) | (0.1) | (0.7) | (0.4) | ||||||||||||
Cost of sales4 | $ | (97.3) | $ | (103.1) | $ | (109.4) | $ | (200.4) | $ | (223.2) | |||||||
Sustaining capital expenditures3,6 | (31.1) | (47.7) | (11.3) | (78.8) | (16.7) | ||||||||||||
Other costs and adjustments7 | (2.0) | 1.7 | (1.7) | (0.3) | (3.4) | ||||||||||||
AISC3 | $ | (130.4) | $ | (149.1) | $ | (122.4) | $ | (279.5) | $ | (243.3) | |||||||
Expansion capital expenditures3,8 | $ | (0.5) | $ | (1.0) | $ | (18.6) | $ | (1.5) | $ | (33.1) | |||||||
Performance Measures9 | |||||||||||||||||
| Cost of sales excluding depreciation ($/oz sold) | $ | 838 | $ | 784 | $ | 947 | $ | 810 | $ | 973 | |||||||
Cash costs3 ($/oz sold) | $ | 836 | $ | 781 | $ | 946 | $ | 807 | $ | 971 | |||||||
AISC3 ($/oz sold) | $ | 1,124 | $ | 1,134 | $ | 1,060 | $ | 1,129 | $ | 1,061 | |||||||
1.100% basis, unless otherwise stated.
2.Strip ratio is calculated as waste mined divided by ore mined.
3.This is a non-GAAP financial measure. See "Non-GAAP Financial Measures".
4.As per note 27 of the consolidated interim financial statements for revenues and cost of sales. Cost of sales is net of depreciation expense.
5.Other mine costs exclude by-product credits.
6.Includes sustaining capitalized stripping for the second quarter 2022 of $17.2 million (first quarter 2022 - $29.9 million; second quarter 2021 - $nil) and YTD 2022 of $47.1 million (YTD 2021 - $nil).
7.Other costs and adjustments include sustaining lease principal payments, environmental rehabilitation accretion and depletion and prior period operating costs, partially offset by by-product credits.
8.Includes expansion capitalized stripping for the second quarter 2022 of $nil (first quarter 2022 - $nil; second quarter 2021 - $12.9 million) and YTD 2022 of $nil (YTD 2021 - $22.1 million).
9.Cost of sales, cash costs and AISC per ounce sold may not be calculated based on amounts presented in this table due to rounding.
Operational Insights
•Essakane continued to deliver strong results and achieved attributable gold production of 107,000 ounces in the second quarter, lower by 5,000 ounces compared to the prior quarter and higher by 1,000 ounces compared to the same prior year period. Lower production compared with the prior quarter is attributed to planned maintenance and supply chain challenges (described below), partially offset by higher grades than the reserve block model and continued improvements in recoveries.
IAMGOLD CORPORATION Second Quarter 2022 Management’s Discussion and Analysis | 10 | ||||
•Mining activity of 11.4 million tonnes in the second quarter was lower than the prior quarter, primarily due to lower waste stripping activities due to constraints in consumables from supply chain challenges in country and abroad, and the prioritization of ore mining. The reduction in stripping activities is not expected to materially impact production in 2022 and 2023.
•Mill throughput of 2.7 million tonnes, at an average head grade of 1.52 g/t Au and plant availability of 86%, was lower by 14% compared to the prior quarter. While the head grades were higher than the prior quarter, the feed rate and mill availability were lower due to the mill feed consisting of higher hard rock volumes, annual planned maintenance and supply chain challenges. Mill recovery of 90% in the second quarter was 2% higher than the prior quarter due to lower graphitic and sulfur content, combined with increased recovery from the gravity circuit that was optimized in 2021.
•The security situation in Burkina Faso has further deteriorated during the second quarter and impacted the in-land supply chain resulting in delays in the delivery of consumables. The Company continues to take proactive measures to ensure the safety and security of in-country personnel and managed to limit the impact on production in the second quarter. The Company continues to adjust its protocols and the activity levels at the site according to the security environment. The Company is furthering certain additional investments in security infrastructure in the region and at the mine site, with the support of the government.
•The COVID-19 situation remained stable during the second quarter with a few isolated cases recorded. Certain COVID-19 measures have been lifted across the country and site, while there remains continued emphasis on sanitization as well as vaccinations.
•The IAMALLIN improvement project has continued with the execution phase in the second quarter, with the focus on mine equipment availabilities, mill feed optimization and supplies inventory management.
Financial Performance - Q2 2022 Compared to Q1 2022 and Q2 2021
•Cost of sales, excluding depreciation, of $97.3 million was (i) lower by $5.8 million or 6% compared with the prior quarter, primarily due to timing of sales and lower operating costs due to lower tonnes mined and milled offset by costs inflation, and (ii) lower by $12.1 million or 11% compared to the same prior year period, primarily due to higher capitalized waste stripping costs and higher realized derivative gains.
•Compared to the first quarter 2022, cost of sales, excluding depreciation, and cash costs per ounce sold of $838 and $836 were higher by 7%, primarily due to higher production costs and lower production volume, of $54 per ounce. AISC per ounce sold of $1,124 was in line and included lower sustaining capital expenditures of $94 per ounce.
•Compared to the second quarter 2021, cost of sales, excluding depreciation, and cash costs per ounce sold, were lower by 12%, primarily due to lower operating costs of $110 per ounce resulting from higher capitalized waste stripping costs and higher realized derivative gains. AISC per ounce sold was higher by $64 or 6%, compared with the same prior year period and included higher sustaining capital expenditures of $171 per ounce.
•Capitalized stripping in the second quarter of $17.2 million was lower by $12.7 million or 42% and higher by $4.3 million or 33% compared to the prior quarter and same prior year period, respectively. Capitalized stripping was lower compared with the prior quarter due to lower activity levels, while higher than the same prior year period as the site remained focused on accessing future production phases.
•Sustaining capital expenditures, excluding capitalized stripping, of $13.9 million included capital spares of $4.5 million, tailings management of $2.3 million, mobile and mill equipment of $2.0 million, airstrip extension of $1.6 million and other sustaining projects of $3.5 million. Expansion capital expenditures, excluding capitalized stripping, of $0.5 million primarily included capital projects associated with the community village resettlement project.
Financial Performance – YTD 2022 Compared to YTD 2021
•Cost of sales, excluding depreciation, of $200.4 million for YTD 2022, was lower by $22.8 million or 10% compared with the same prior year period, primarily due to higher capitalized stripping costs and the positive impact of realized derivative gains, partially offset by higher milling costs as a result of costs inflation and lower tonnes mined.
•Cost of sales, excluding depreciation, per ounce sold of $810 for YTD 2022 was lower by $163 or 17% compared to the same prior year period, primarily due to lower operating costs of $153 per ounce resulting from higher grade and higher recovery.
•Cash costs and AISC per ounce sold of $807 and $1,129 for YTD 2022 were lower by $164 or 17% and higher by $68 or 6%, compared to the same prior year period, respectively, primarily due to lower operating costs of $153 per ounce and higher sustaining capital expenditures of $246 per ounce sold when compared to the same prior year period.
•Sustaining capital expenditures, excluding capitalized stripping, of $31.7 million for YTD 2022 included capital spares of $10.0 million, mobile and mill equipment of $8.8 million, tailings management of $4.2 million, airstrip extension of $2.8 million, and other sustaining projects of $5.9 million. Expansion capital expenditures, excluding capitalized stripping, of $1.5 million for YTD 2022 included capital projects associated with tailings management, tailings management plant upgrade, community village resettlement and other expansion projects.
IAMGOLD CORPORATION Second Quarter 2022 Management’s Discussion and Analysis | 11 | ||||
Outlook
Attributable gold production at Essakane in 2022 is expected to approximate the top-end of the guidance range of 360,000 to 385,000 ounces. The Company is investigating whether the updated block model may be underestimating grade as the complexity of mineralization has increased in the lower portions of the pit with higher amounts of coarse gold. The operation continues to execute on targeted operational improvements including improving mill throughput through optimizing blast fragmentation and further optimizing the gravity circuit through the planned addition of a double deck screen.
Cash costs continue to be under pressure due to systemic inflation and constrained global supply chains. The Company continues to actively work with authorities and suppliers to mitigate potential impacts and manage continuity of supply due to the security situation noted above while also investing in additional security infrastructure. Certain input costs at Essakane, including labour, are expected to be lower due to a weakened EURUSD exchange rate.
Brownfield Exploration
During the second quarter 2022, approximately 9,000 metres of diamond drilling were completed as part of a planned 10,000-metre infill program in 2022 to improve resource confidence within selected areas of EMZ and the Lao satellite deposit. Exploration activities on concessions surrounding the mine lease continue to be suspended due to the impacts of regional security constraints.
Bambouk District
The Bambouk District includes the Boto Gold project and the Karita Gold project and the Diakha-Siribaya Gold project located within 15 kilometres of the Boto Gold project in adjacent countries. The Company is undertaking a delineation drilling program to support an initial resource estimate at the Karita discovery in Guinea and the completion of an updated mineral resource estimate aiming to convert mineral resources to a higher confidence level at the Diakha deposit in Mali. The Company is undertaking an evaluation of strategic alternatives with respect to these development and exploration assets in West Africa that may include the disposition of all or an interest in one or more of such assets. See “Liquidity and Capital Resources - Liquidity Outlook”.
Boto Gold Project, Senegal
The Boto Gold project is a shovel ready development project located in southeastern Senegal along the border with Mali. The project is owned 90% by the Company, with the Republic of Senegal owning a 10% free carried interest. The project is located on an exploitation permit granted in late 2019 for an initial 20-year period and is currently undergoing various de-risking activities.
The 2022 scope includes the completion of preliminary works started in 2021. During the second quarter 2022, geotechnical drilling to further de-risk the Malikoundi pit design was competed. In addition, testing to further understand water flow at site will be completed in the third quarter 2022 and the Company is progressing with the work related to the Kouliminde village resettlement action plan. The Company also continues to evaluate the scope of the overall project, associated capital expenditures and timing, as well as potential alternatives to enhance the value of the project in general. Capital expenditures totaled $9.6 million for the first half of 2022.
Karita Gold Project, Guinea
The Karita Gold project is wholly-owned by the Company and was acquired in 2017 as a granted exploration permit that covers approximately 100 square kilometres located in Guinea between the Company's Boto Gold project in Senegal to the north and its Diakha-Siribaya Gold project in Mali to the south. During 2019, a first pass RC drilling program confirmed the discovery of mineralization along this portion of the Senegal-Mali Shear Zone.
In 2022, the Company is completing a 24,000 metres drilling program to support a future initial mineral resource estimate, of which approximately 18,300 metres were completed in the first half of 2022. Subsequent to quarter-end, the Company reported initial assay results with highlights including: 34.0 metres grading 5.81 g/t Au, 25.0 metres grading 5.32 g/t Au and 12.0 metres grading 9.49 g/t Au (see news release dated July 6, 2022).
Diakha-Siribaya Gold Project, Mali
The Diakha-Siribaya project is wholly-owned by the Company and consists of eight contiguous exploration permits which cover a total area of approximately 600 square kilometres, located approximately 10 kilometres south of the Boto Gold project, in the Kédougou-Kéniéba inlier of the West African Craton region of western Mali along the borders with Senegal and Guinea. A revised mineral resource estimate incorporating the drill results from the 2021 drilling program completed at the Diakha deposit is in progress and expected to be completed in the second half of 2022.
IAMGOLD CORPORATION Second Quarter 2022 Management’s Discussion and Analysis | 12 | ||||
North America
Abitibi District, Canada
The Company is developing a “hub-and-spoke" model in the Abitibi District to exploit the available mill capacity at the Westwood complex, located 35 kilometres northeast of Rouyn-Noranda and 80 kilometres west of Val d'Or in southwestern Québec, Canada. In addition to feed from the Westwood underground mine and the Grand Duc open pit mine, the Company is evaluating potential future supplemental feed from assets such as the Fayolle exploration property and the optioned Rouyn Gold project.
Westwood Mine (IAMGOLD interest – 100%)
| Q2 2022 | Q1 2022 | Q2 2021 | YTD 2022 | YTD 2021 | |||||||||||||
| Key Operating Statistics | |||||||||||||||||
| Underground lateral development (metres) | 1,207 | 848 | 148 | 2,055 | 148 | ||||||||||||
| Ore mined (000s t) – underground | 53 | 63 | 14 | 116 | 14 | ||||||||||||
| Ore mined (000s t) – other sources | 218 | 159 | 273 | 377 | 519 | ||||||||||||
| Ore mined (000s t) – total | 271 | 222 | 287 | 493 | 533 | ||||||||||||
| Ore milled (000s t) | 284 | 250 | 264 | 534 | 491 | ||||||||||||
| Head grade (g/t) – underground | 4.01 | 6.05 | 4.50 | 5.06 | 4.50 | ||||||||||||
| Head grade (g/t) – other sources | 1.04 | 0.97 | 0.74 | 1.00 | 0.91 | ||||||||||||
| Head grade (g/t) – total | 1.62 | 2.18 | 0.92 | 1.88 | 1.00 | ||||||||||||
| Recovery (%) | 93 | 91 | 93 | 92 | 93 | ||||||||||||
| Gold production (000s oz) – 100% | 14 | 16 | 8 | 30 | 15 | ||||||||||||
| Gold sales (000s oz) – 100% | 14 | 16 | 7 | 30 | 15 | ||||||||||||
Average realized gold price1 ($/oz) | $ | 1,854 | $ | 1,872 | $ | 1,810 | $ | 1,864 | $ | 1,795 | |||||||
| Financial Results ($ millions) | |||||||||||||||||
Revenues2 | $ | 27.1 | $ | 30.8 | $ | 12.2 | $ | 57.9 | $ | 26.7 | |||||||
Cash costs1 | $ | (34.8) | $ | (30.5) | $ | (13.9) | $ | (65.3) | $ | (23.1) | |||||||
Other mine costs3 | (0.6) | (0.5) | (0.2) | (1.1) | (0.3) | ||||||||||||
Cost of sales2 | $ | (35.4) | $ | (31.0) | $ | (14.1) | $ | (66.4) | $ | (23.4) | |||||||
Sustaining capital expenditures1 | (8.8) | (7.3) | (2.1) | (16.1) | (2.5) | ||||||||||||
Other costs and adjustments4 | (0.9) | (0.1) | 0.1 | (1.0) | 0.2 | ||||||||||||
AISC1 | $ | (45.1) | $ | (38.4) | $ | (16.1) | $ | (83.5) | $ | (25.7) | |||||||
Expansion capital expenditures1 | $ | (0.7) | $ | (0.5) | $ | (1.2) | $ | (1.2) | $ | (1.8) | |||||||
Performance Measures5 | |||||||||||||||||
Cost of sales excluding depreciation6 ($/oz sold) | $ | 2,463 | $ | 1,922 | $ | 2,100 | $ | 2,176 | $ | 1,580 | |||||||
Cash costs1 ($/oz sold) | $ | 2,427 | $ | 1,886 | $ | 2,085 | $ | 2,141 | $ | 1,566 | |||||||
AISC1 ($/oz sold) | $ | 3,147 | $ | 2,376 | $ | 2,412 | $ | 2,738 | $ | 1,743 | |||||||
1.This is a non-GAAP financial measure. See "Non-GAAP Financial Measures".
2.As per note 27 of the consolidated interim financial statements for revenues and cost of sales. Cost of sales is net of depreciation expense.
3.Other mine costs exclude by-product credits.
4.Other costs and adjustments include sustaining lease principal payments and environmental rehabilitation accretion and depletion, partially offset by by-product credits.
5.Cost of sales, cash costs and AISC per ounce sold may not be calculated based on amounts presented in this table due to rounding.
6.Includes non-cash ore stockpile and finished goods inventories NRV write-down of $3.3 million for the second quarter 2022 (first quarter 2022 - $1.7 million; second quarter 2021 - $3.0 million) and $5.0 million for YTD 2022 (YTD 2021 - $3.0 million), which had an impact on cost of sales, excluding depreciation, per ounce sold of $232 for second quarter 2022 (first quarter 2022 - $106; second quarter 2021 - $88) and $165 for YTD 2022 (YTD 2021 - $88).
Operational Insights
•Westwood achieved gold production of 14,000 ounces in the second quarter, 13% lower than the prior quarter, as a result of lower head grade from the underground mine, partially offset by higher throughput and mill recovery. Underground production was on care and maintenance for the majority of the first half of 2021.
•Mining activities totaled 271,000 tonnes in the second quarter, with underground mining activities contributing 53,000 tonnes and the open pit mining at Grand Duc contributing 218,000 tonnes. Mining volumes were 22% higher than the prior quarter due to reduced absenteeism resulting from COVID-19 and supplemental tonnes from Grand Duc.
IAMGOLD CORPORATION Second Quarter 2022 Management’s Discussion and Analysis | 13 | ||||
•Underground development continued to improve significantly in the second quarter, with more than 1,200 metres of lateral development completed, over 350 meters higher than in the previous quarter, however, development of raises and bolting productivity continued to be adversely impacted by increasing underground rehabilitation requirements, challenging ground conditions and global supply chain challenges. Mining activities in western and central underground zones recommenced in June 2022. Break-through to the main ramp is completed, connecting the surface with the lower part of the mine, enabling development of some higher grade zones. These new accessible zones are located below the existing production areas and will create additional flexibility in the mining sequence and access to new stopes for exploitation.
•Mill throughput was 284,000 tonnes in the second quarter at a head grade of 1.62 g/t Au with average recovery of 93% and plant availability of 92%. Mill throughput was 14% higher than the prior quarter as a result of successfully executing mill maintenance strategies for improved availability as well as reduction in unplanned shutdowns during the quarter.
•The COVID-19 situation at site and in the Abitibi District remained stable in the second quarter.
Financial Performance - Q2 2022 Compared to Q1 2022 and Q2 2021
•Cost of sales, excluding depreciation, of $35.4 million was (i) higher by $4.4 million or 14% compared with the prior quarter, primarily due to increased rehabilitation costs associated with resuming operations in the western and central underground zones and costs inflation, and (ii) higher by $21.3 million or 151% compared to the same prior year period as underground mining was suspended until June 2021.
•Compared to the first quarter 2022, cost of sales, excluding depreciation, cash costs and AISC per ounce sold of $2,463, $2,427, and $3,147, were higher by 28%, 29%, and 32%, respectively, primarily due to higher production costs and lower production volume of $541 per ounce. AISC per ounce sold included higher sustaining capital expenditures of $167 per ounce sold.
•Compared to the second quarter 2021, cost of sales, excluding depreciation, cash costs and AISC per ounce sold were higher by 17%, 16% and 30%, respectively, as underground mining was suspended until June 2021. AISC per ounce sold included higher sustaining capital expenditures of $303 per ounce.
•Sustaining capital expenditures in the second quarter of $8.8 million included underground development and diamond drilling of $7.6 million and other sustaining projects of $1.2 million. Expansion capital expenditures of $0.7 million primarily related to advancing detailed engineering and permitting for the Fayolle property.
•An increase in the estimated long-term price of gold was considered by the Company to be an indicator of impairment reversal for the Doyon cash generating unit. As a result, an impairment test was performed. The carrying value increased by $38.4 million due to a reduction in the asset retirement obligation relating to the closed site within the Doyon CGU and resulted in the carrying amount exceeding the recoverable amount. An impairment charge of the same amount was recognized against the change in asset retirement obligations at closed sites in the consolidated statements of earnings (loss).
Financial Performance – YTD 2022 Compared to YTD 2021
•Cost of sales, excluding depreciation, of $66.4 million for YTD 2022, was higher by $43.0 million or 184% compared with the same prior year period, as a result of the operations being in care and maintenance until June 2021.
•Cost of sales, excluding depreciation, cash costs and AISC per ounce sold of $2,176, $2,141, and $2,738, for YTD 2022, were higher by 38%, 37% and 57%, respectively, compared to the same prior year period, as a result of the operations being in care and maintenance until June 2021.
•Sustaining capital expenditures of $16.1 million for YTD 2022 included underground development and diamond drilling of $14.4 million and other sustaining projects of $1.7 million. Expansion capital expenditures of $1.2 million for YTD 2022 primarily related to advancing Fayolle property activities.
Outlook
Gold production at the Westwood complex in 2022 is expected to be in the range of 55,000 to 75,000 ounces. Production levels are expected to continue to increase each quarter based on the planned ramp-up of the underground mine delivering higher grade ore in the second half of the year, in addition to higher grade ore sourced from the Grand Duc open pit. Development rates are required to continue to increase month-over-month to achieve production guidance.
During the first half of 2022, additional cost pressures emerged as discussed under “Outlook”. Despite these impacts, cash costs per ounce sold are expected to decrease in the second half of 2022 with anticipated increases in production and sales. The current collective bargaining agreement with the Westwood union ends in November, with negotiations scheduled to start in the third quarter.
Brownfield Exploration - Westwood Area
Approximately 34,000 metres of underground and surface diamond drilling are planned in 2022. Surface drilling will focus on evaluating the resource potential between and adjacent to the Grand Duc and Doyon pits, while underground infill drilling will focus on supporting the continued ramp up of underground mining operations. Approximately 16,800 metres were completed in the first half of 2022 including approximately 2,700 metres in geotechnical drilling.
Fayolle Property
The Company is evaluating the potential development of the Fayolle deposit located 29 kilometres northwest of the Westwood complex. Detailed engineering, permitting, and environmental studies are ongoing.
IAMGOLD CORPORATION Second Quarter 2022 Management’s Discussion and Analysis | 14 | ||||
Rouyn Gold Project
The Company holds a purchase option with Yorbeau Resources Inc. (“Yorbeau”) for the Rouyn Gold project, located near Rouyn-Noranda. Approximately 5,700 metres of diamond drilling were completed in the first half of 2022 to further delineate the Lac Gamble zone extensions and other selected targets to evaluate their resource potential and to support a future initial mineral resource estimate.
Côté District, Canada
The Côté District, located 125 kilometres southwest of Timmins and 175 kilometres north of Sudbury, Ontario, Canada includes the Côté Gold construction project and the adjacent Gosselin deposit. The project is being developed by a 70:30 joint venture (the "Côté Gold UJV") between IAMGOLD, as the operator, and Sumitomo Metal Mining Co. Ltd. (“SMM”) with the Company effectively owning a 64.75% interest in the associated land package. In July, 2020, the Company, together with SMM, announced the decision to proceed with the construction of the project.
Updated Technical Report
On August 3, 2022, the Company announced the updated costs to complete, project economics and LOM plan to be included in a new technical report for the Côté Gold project. The update represents the conclusion of the Côté Gold cost, schedule, execution strategy and risk review initiated earlier this year. The updated information will be incorporated in a new technical report titled “Technical Report on the Côté Gold Project, Ontario, Canada” (the “2022 Technical Report”) prepared by SLR Consulting (Canada) Ltd. in accordance with National Instrument 43-101 – Standards of Disclosure for Mineral Projects (“NI 43-101”). The 2022 Technical Report supersedes the 2021 Technical Report dated November 26, 2021. The 2022 Technical Report will be filed on SEDAR on or before September 17, 2022 and readers are encouraged to read the 2022 Technical Report in its entirety. Highlights of the updated Côté Gold information include:
•After-tax net present value at a 5% discount rate of $1,109 million on a 100% basis and an internal rate of return of 13.5% from May 1, 2022 at a gold price assumption of $1,700 in 2024 and 2025 and $1,600 thereafter and USDCAD exchange rate of 1.25;
•Estimated remaining project costs to complete construction and bring Côté Gold into production of $1,908 million ($1,335 million attributable to the Company) including escalation and contingency as of May 1, 2022;
•Mine life of 18 years with initial production expected in early 2024;
•Average annual production of 495,000 ounces (320,500 ounces attributable) during the first six years following commercial production and 365,000 ounces (236,000 ounces attributable) over the LOM;
•LOM average cash costs of $693 per ounce gold sold and AISC of $854 per ounce gold sold;
•Cumulative net operating cash flow of $6,086 million and after-tax free cash flow of $1,699 million;
•Côté Gold LOM based on Mineral Reserves of 7.2 million ounces in the Côté deposit;
•Côté deposit Measured & Indicated Mineral Resources (inclusive of Mineral Reserves) estimate of 10.2 million ounces; Gosselin deposit Measured & Indicated Resources estimate of 3.35 million ounces; and
•District scale potential with demonstrated exploration upside in one of the world’s leading mining jurisdictions.
In accordance with the terms of Côté Gold UJV, the updated project costs, schedule and LOM plan will be independently reviewed by SMM.
Supertrend Project Review
The update represented the conclusion of the Côté Gold cost, schedule, execution strategy and risk review (“project review and risk analysis”) initiated earlier this year. The Côté Gold project is being developed with the background of COVID-19, inflation and other global events and their impact including on the global supply chain, labour availability, productivity and rates, costs of materials, commodities and consumables. The estimated remaining attributable spend to completion, excluding contingencies, resulted from additional costs and schedule impacts in the general project cost categories noted below (with percentage cost impact in parentheses) and include the estimated impacts and related delays due to COVID-19, recent labour action in Ontario and inflation:
•Earthworks (19%): associated with scope gaps, lower than expected productivity as a result of an overestimation of earth moving equipment efficiencies of overburden based on geotechnical data and scope gaps in dewatering infrastructure;
•Processing plant (12%): associated with scope gaps relating to the processing plant, underestimation of winter concrete and steel costs, and bid reconciliation for the SMPEI packages;
•Infrastructure (7%): associated with impacts on the underground utility construction and expanded camp capacity;
•Indirects (38%): associated with impacts from increased project costs and schedule extension of first gold target date to early 2024, increased labour incentives and wage increases, extension and enlargement of the site support, owner’s team, EPCM and increased site oversight and coordination requirements, and increased operations readiness costs;
•Procurement (6%): associated with the escalation of prices on materials, including piping, cables and steel;
•Escalation (7%): associated with expected future material escalation including provisions for price increases in certain consumables; and
•Contingency (11%).
IAMGOLD CORPORATION Second Quarter 2022 Management’s Discussion and Analysis | 15 | ||||
Estimate of Impact of COVID-19 on Project
As part of the project review and risk analysis, a study by an independent capital project management service company was commissioned to estimate the “order of magnitude” direct and indirect impacts attributable to the ongoing COVID-19 pandemic on cost and schedule of the Côté Gold project. The study estimated total impact to date, including expected future COVID-19 impacts, attributable to the Company to be in the range of approximately $200 to $400 million (on a 70% basis at USDCAD of 1.30) in the areas of procurement, construction contracts, service and camp contracts, EPCM impacts, and total owners costs (including operational readiness).
Project Review
In the last number of months, the Côté Gold project has seen significant changes in leadership and oversight, both at the project level and corporate level. Since the appointment of a new Executive Project Director at the end of 2021, teams have been strengthened while leveraging knowledge, experience, and team integration between the owners team, EPCM contractor, and the various other project contractors.
The Board retained an independent technical consultant to assist with its review of the results of the project review and risk analysis. This independent review supported the updated estimates presented herein. The Company cautions that potential further disruptions, including, without limitation caused by COVID-19, the Ukraine war, inflation, other global supply chain disturbances, weather, labour disputes and the tight labour market could continue to impact the timing of activities, availability of workforce, productivity and supply chain and logistics and, consequently, could further impact the timing of actual commercial production and, consequently, project costs.
Upcoming Milestones and Schedule Summary
Côté Gold is expected to commence production in early 2024. Construction of the project commenced in the third quarter 2020 and major earthworks commenced in the first quarter 2021. Remaining milestones of note are as follows:
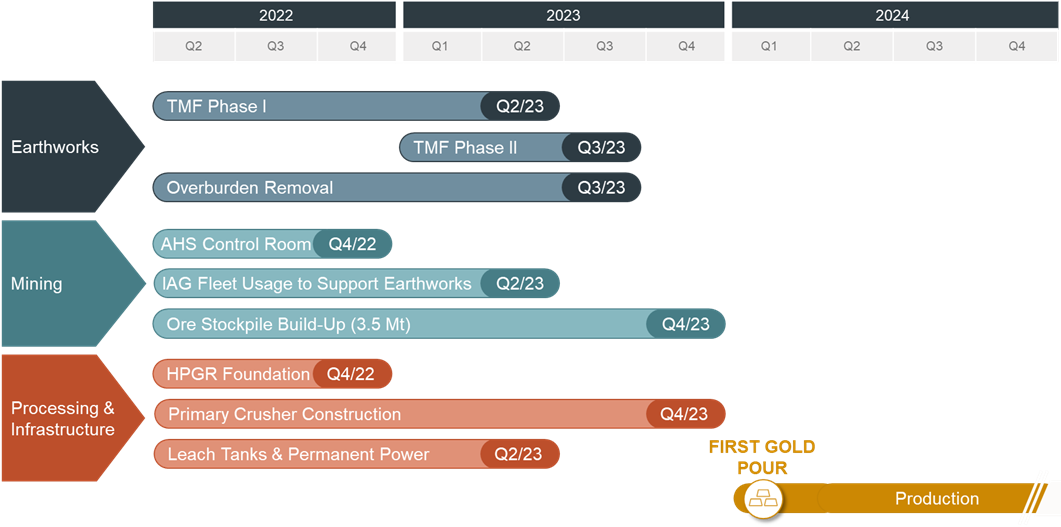
Second Quarter Activities Update
As of June 30, 2022, overall the project was approximately 57% complete, with detailed engineering nearly complete at approximately 99%. The following provides an update on project activities:
| Project Activity | Update | ||||
Health and safety | The project has surpassed 5.7 million hours of no lost time injuries. Earlier in the year COVID-19 impacted the project significantly. Since this outbreak, COVID-19 impacts continue to affect the project however to a lesser degree. The Company’s monitoring programs have transitioned to a self-monitoring approach all the while having the capacity to revert to full monitoring should it be required. Sewage detection system remains in place. Vaccination on site remains mandatory while PCR/Antigen testing is only required if symptoms are observed. | ||||
IAMGOLD CORPORATION Second Quarter 2022 Management’s Discussion and Analysis | 16 | ||||
Labour and workforce | Certain of the Ontario unions with project workforce membership were on strike throughout most of May resulting in the reduction of the site headcount by approximately 250 people. The absence of these trades during this period adversely impacted construction progress, particularly in the processing and infrastructure areas. New collective bargaining agreements were ratified with the province at the end of May and trades returned to site during June. The labour strikes impacted the project by approximately 8 weeks including longer durations for certain activities due to the shifting of some works to the 2023 winter season. A temporary camp is being added to provide an additional 220 rooms to meet current projected peak camp load. Current manpower on site is approximately 1,200 workers and continues to ramp up. | ||||
Earthworks activities | Earthworks activities continue with several work fronts providing significant progress including haul roads construction, water realignment channels work and dam construction. •New Lake South Dam, New Lake North Dam, North Sedimentation Pond Dam are complete and work on Polishing Pond dam is well advanced. •The 2022 fish relocation program is set to begin to fish out Polishing Pond this summer. •Challenges were encountered this spring with higher amounts of freshet than anticipated. Water treatment systems were installed. This impeded the advancement of overburden material removal from the pit and limited fresh rock access. At the end of June, the water level in the pit has been reduced to pre-freshet levels and access to overburden is no longer limited. •TMF water management infrastructure including coffer dams and pumping stations worked well during freshet aided by the water treatment plant. Starter dam foundation excavations and filling are well underway. | ||||
Procurement | Heavy mobile equipment is arriving on site with a CAT 994 loader being erected and the first 793 haul truck already on site and in the process of erection. The autonomous technology agreements with CAT, Toromont and Epiroc have been executed. Equipment delivery is ongoing with inventory being held on site laydown and off-site at warehouses. Some equipment is being held at North American based suppliers to reduce load onsite and off-site storage facilities. At present there is no material impact on schedule related to supply chain or logistics. | ||||
Processing plant | Processing plant civil works have progressed with the continued placement of pre-cast and cast-in-place concrete. Structural steel for the processing plant building is currently erected and architectural elements for the most part complete. At the end of June, the SMPEI contractor had begun erecting the structure around the base of the ball mill foundation. Steel is being sorted off site and delivered as per erection sequence. | ||||
Infrastructure | The overhead power line has progressed significantly over the winter months and at end of June all power poles were installed and stringing of power lines was at 86% complete. The 13.8 kV network has advanced to provide power on site for autonomous systems, contractors and other facilities. Hydro One electrical upgrade work continues with the current plan to have the system ready for the fourth quarter 2022. The truck wash building end walls steel and exterior fabric were installed and interior insulation work is well underway. Installation of containers for the hot/cold storage warehouses and the construction of the project material laydown warehouse building have commenced. Work also commenced for the buried utilities. The administration building control room and offices are on site and being erected. | ||||
Permitting and sustainability | Permitting and sustainability work is ongoing with all remaining non-critical path permitting activities expected to be received during the remainder of the project construction. Community consultations and ongoing implementation of the impact benefit agreements signed with indigenous partners continue. Health, safety and environmental programs and their respective emergency response plans are in development. | ||||
Operational readiness | Operational readiness advanced in multiple areas with a continued focus on organizational design and hiring strategy, technology selection, standardization of mine, mill and site maintenance processes and systems, identification and purchase of spare parts for equipment and advancement in contracts for key consumables and training documentation for autonomous haul trucks. Contractors have been selected for the onsite assay laboratory, explosives supply and blasting services as well as for the mobile fleet tire supply and tire maintenance services. An updated LOM plan to be included in the 2022 Technical Report was completed. | ||||
IAMGOLD CORPORATION Second Quarter 2022 Management’s Discussion and Analysis | 17 | ||||
Project Expenditures
The Company had incurred and expended costs of $148.9 million and $172.4 million, respectively, (at an average recorded USDCAD exchange rate of 1.26) in the second quarter 2022 and $765.7 million and $666.5 million, respectively, (at an average recorded USDCAD exchange rate of 1.26) since July 1, 2020, including capital expenditures and non-capital project costs summarized in the table below. The Company's attributable remaining project spend to complete construction and bring Côté Gold into production is $1.2 to $1.3 billion from July 1, 2022, net of leases and working capital.
| Q2 2022 | Q1 2022 | Q2 20211 | YTD 2022 | YTD 2021 | Expenditures to date | |||||||||||||||
Capital expenditures1,2 ($ millions) | $ | 169.6 | $ | 78.5 | $ | 84.7 | $ | 248.1 | $ | 133.1 | $ | 643.5 | ||||||||
Non-capital costs3 | 2.8 | 3.8 | 5.0 | 6.6 | 6.1 | 23.0 | ||||||||||||||
| Expended costs | 172.4 | 82.3 | 89.7 | 254.7 | 139.2 | 666.5 | ||||||||||||||
Working capital adjustment4 | (23.5) | 47.7 | 12.8 | 24.2 | 30.4 | 99.2 | ||||||||||||||
| Incurred costs | $ | 148.9 | $ | 130.0 | $ | 102.5 | $ | 278.9 | $ | 169.6 | $ | 765.7 | ||||||||
1.Capital expenditures prior to July 1, 2020 are not included in the Company’s portion of reported total project costs.
2.Capital expenditures include certain offsets including realized derivative gains of $4.2 million in the second quarter 2022. Capital expenditures exclude the realized gain of $1.5 million on the Target Accrual Redemption Forward ("TARF") and the forward contract with an extendible feature (see “Market Risks – Summary of Hedge Portfolio”).
3.Non-capital costs include ore mined costs recorded as stockpiles which totaled $0.3 million in the second quarter 2022.
4.Working capital adjustment mainly consists of work performed not yet invoiced combined with an increase in the accounts payable balance, offset by an increase in sales taxes receivable.
Gosselin Zone
The Gosselin zone is located immediately to the northeast of the Côté Gold deposit. Approximately 16,000 metres of diamond drilling is planned in 2022 to further delineate and expand the Gosselin mineral resources and test selected targets along an interpreted favourable deposit corridor. Approximately 10,500 metres were completed in the first half of 2022.
During the first quarter 2022, the Company announced remaining assay results from its 2021 delineation diamond drilling program at the Gosselin zone confirming expected grades within the modelled resource, and in some cases, the extension of the mineralization zone outside the resources boundaries of the mineralization model (see news release dated January 27, 2022).
Additional technical studies are planned which will include a sampling program to advance future metallurgical test work and mining and infrastructure studies to review alternatives to optimize the inclusion of the Gosselin deposit resources into a future Côté Gold LOM plan.
Chibougamau District, Canada
The Chibougamau District includes the Nelligan Gold project and the Monster Lake project.
Nelligan Gold Project
The Nelligan Gold project is located approximately 40 kilometres south of the Chapais – Chibougamau area in Québec and is operating as a 75:25 earn-in option to joint venture with Vanstar Mining Resources Inc (“Vanstar”). The Company holds an option to earn an additional 5% interest, for an 80% total interest, by completing a feasibility study on the project. Approximately 4,700 metres of diamond drilling was completed in the first half of 2022 to support the completion of an updated resource estimate expected by the end of 2022.
Subsequent to quarter-end, Vanstar reported assay results from the 2022 drilling program which intersected multiple wide intercepts of gold mineralization, including the following highlights: 69.0 metres grading 2.24 g/t Au, 52.3 metres grading 1.60 g/t Au and 23.8 metres grading 3.21 g/t Au (see Vanstar news release dated July 6, 2022).
IAMGOLD CORPORATION Second Quarter 2022 Management’s Discussion and Analysis | 18 | ||||
South America
Rosebel District, Suriname
The Rosebel District includes the Rosebel open pit mine located 85 kilometres south of the capital city of Paramaribo, Suriname and the Saramacca open pit satellite mine, a higher grade deposit located 25 kilometres from the Rosebel operations. The Company owns 95% of the gross Rosebel mining concession. Rosebel owns 70% of certain specified concession areas including Saramacca.
Rosebel Mine (IAMGOLD interest – 95%)1
| Q2 2022 | Q1 2022 | Q2 2021 | YTD 2022 | YTD 2021 | |||||||||||||
| Key Operating Statistics | |||||||||||||||||
Ore mined2 (000s t) | 1,500 | 1,588 | 1,102 | 3,088 | 2,349 | ||||||||||||
Waste mined2 (000s t) | 13,965 | 11,128 | 6,956 | 25,093 | 15,866 | ||||||||||||
Material mined2 (000s t) – total | 15,465 | 12,716 | 8,058 | 28,181 | 18,215 | ||||||||||||
Strip ratio2,3 | 9.3 | 7.0 | 6.3 | 8.1 | 6.8 | ||||||||||||
| Ore milled (000s t) – Rosebel | 1,572 | 1,555 | 1,412 | 3,127 | 3,052 | ||||||||||||
Ore milled2 (000s t) – Saramacca | 629 | 757 | 803 | 1,386 | 1,711 | ||||||||||||
Ore milled2 (000s t) – total | 2,203 | 2,312 | 2,215 | 4,515 | 4,763 | ||||||||||||
Head grade2,4 (g/t) | 0.88 | 0.81 | 0.52 | 0.84 | 0.68 | ||||||||||||
Recovery2 (%) | 92 | 91 | 83 | 91 | 86 | ||||||||||||
Gold production2 (000s oz) – 100% | 57 | 55 | 31 | 112 | 88 | ||||||||||||
Gold production1 (000s oz) – owner operator | 51 | 49 | 27 | 100 | 76 | ||||||||||||
| Gold production (000s oz) – attributable 95% | 49 | 46 | 25 | 95 | 72 | ||||||||||||
Gold sales1 (000s oz) – owner operator | 54 | 49 | 25 | 103 | 70 | ||||||||||||
Average realized gold price5 ($/oz) | $ | 1,861 | $ | 1,886 | $ | 1,793 | $ | 1,873 | $ | 1,765 | |||||||
Financial Results ($ millions)1 | |||||||||||||||||
Revenues8 | $ | 101.9 | $ | 91.6 | $ | 45.2 | $ | 193.5 | $ | 124.0 | |||||||
| Operating costs | (65.9) | (58.0) | (40.7) | (123.9) | (91.2) | ||||||||||||
| Royalties | (6.8) | (5.8) | (3.9) | (12.6) | (9.4) | ||||||||||||
Cash costs5,6 | $ | (72.7) | $ | (63.8) | $ | (44.6) | $ | (136.5) | $ | (100.6) | |||||||
Other mine costs7 | (1.1) | (2.7) | 0.1 | (3.8) | — | ||||||||||||
Cost of sales8 | $ | (73.8) | $ | (66.5) | $ | (44.5) | $ | (140.3) | $ | (100.6) | |||||||
Sustaining capital expenditures5,9 | (27.7) | (20.5) | (10.5) | (48.2) | (18.1) | ||||||||||||
Other costs and adjustments10 | (1.1) | 0.4 | (1.4) | (0.7) | (3.0) | ||||||||||||
AISC5 | $ | (102.6) | $ | (86.6) | $ | (56.4) | $ | (189.2) | $ | (121.7) | |||||||
Expansion capital expenditures5,11 | $ | (14.7) | $ | (6.0) | $ | (15.7) | $ | (20.7) | $ | (26.5) | |||||||
Performance Measures12 | |||||||||||||||||
Cost of sales excluding depreciation13 ($/oz sold) | $ | 1,349 | $ | 1,369 | $ | 1,767 | $ | 1,359 | $ | 1,432 | |||||||
Cash costs5 ($/oz sold) | $ | 1,327 | $ | 1,315 | $ | 1,766 | $ | 1,321 | $ | 1,431 | |||||||
AISC5 ($/oz sold) | $ | 1,874 | $ | 1,784 | $ | 2,237 | $ | 1,832 | $ | 1,732 | |||||||
1.Rosebel at 100% and Saramacca at 70%, as included in the consolidated interim financial statements, unless otherwise stated.
2.Includes Saramacca at 100%.
3.Strip ratio is calculated as waste mined divided by ore mined.
4.Includes head grade / tonne for the second quarter 2022 related to the Rosebel concession of 0.85 g/t and the Saramacca concession of 0.94 g/t (first quarter 2022 - 0.78 g/t and 0.86 g/t respectively; second quarter 2021 – 0.48 g/t and 0.58 g/t respectively).
5.This is a non-GAAP financial measure. See "Non-GAAP Financial Measures".
6.Cash costs includes by-product credits.
7.Other mine costs include the add-back of non-cash long-term portion of stockpile inventory NRV write-downs for the second quarter 2022 of $1.1 million (first quarter 2022 - $2.6 million; second quarter 2021 - $nil) and the exclusion of by-product credits.
8.As per note 27 of the consolidated interim financial statements for revenues and cost of sales. Cost of sales is net of depreciation expense.
9.Includes sustaining capitalized stripping for the second quarter 2022 of $7.3 million (first quarter 2022 - $12.5 million; second quarter 2021 - $nil) and YTD 2022 of $19.8 million (YTD 2021 - $nil).
10. Other costs and adjustments include sustaining lease principal payments and environmental rehabilitation accretion and depletion, partially offset by by-product credits.
11. Includes expansion capitalized stripping for the second quarter 2022 of $11.3 million (first quarter 2022 - $3.5 million; second quarter 2021 - $7.6 million) and YTD 2022 of $14.8 million (YTD 2021 - $14.9 million).
12. Cost of sales, cash costs and AISC per ounce sold may not be calculated based on amounts presented in this table due to rounding.
13. Includes non-cash ore stockpile and finished goods inventories NRV write-down of $1.1 million for the second quarter 2022 (first quarter 2022 - $2.6 million; second quarter 2021 - $6.4 million) and $3.7 million for YTD 2022 (YTD 2021 - $6.4 million), which had an impact on cost of sales per ounce sold for second quarter 2022 of $21 (first quarter 2022 - $53 per ounce sold; second quarter 2021 - $41 per ounce sold) and $36 per ounce sold for YTD 2022 (YTD 2021 - $41 per ounce sold).
IAMGOLD CORPORATION Second Quarter 2022 Management’s Discussion and Analysis | 19 | ||||
Operational Insights
•Rosebel achieved attributable gold production in the second quarter of 49,000 ounces, 7% higher than the prior quarter and 96% higher than the same prior year period, continuing to benefit from improved recovery and higher head grades when compared to both prior quarter and the same prior year period, partially offset by lower throughput compared to the prior quarter while throughput was in line when compared to the same prior year period.
•Mining activities in the second quarter have returned to pre-pandemic levels with material mined of 15.5 million tonnes being 22% higher compared with the prior quarter and 92% higher compared to the same prior year period. The site focused on advancing waste stripping activities in line with future production plans. The grade mined at Saramacca is improving reflecting the increased mining activity benefitting from an increase in the fleet allocation and upgrades to the haul road to access higher grade phases and improve ore transport to the mill.
•Mill throughput was 2.2 million tonnes, 5% lower than the prior quarter at an average head grade of 0.88 g/t. Throughput was impacted by maintenance work required on the SAG feed chute and refurbishment of the apron feeders. In terms of mill feed, Rosebel provided 45% at an average head grade of 0.90 g/t, Saramacca provided 23% at an average head grade of 0.93 g/t and the remaining 32% was sourced from lower grade ore stockpiles with an average head grade of 0.60 g/t.
•Mill recovery of 92% for the second quarter was in line with the prior quarter, continuing to benefit from improvements to the carbon adsorption/desorption circuit completed at the end of 2021.
•The COVID-19 situation at the site and in Suriname has remained stable during the second quarter. The majority of the COVID-19 measures have been lifted in Suriname while Rosebel continues to require face masks indoor with additional mitigating measures to continue in an effort to minimize the impact of COVID-19 at site.
•The impact of illegal miners disrupting the operations, noted during the first quarter 2022, was reduced during the second quarter. The Company is continuing its collaboration efforts with the government task force assigned to manage the security situation at the site as well as with village communities and other stakeholders around the mine site.
•The dewatering wells and other earthworks activities, including slope remediation and the East bypass road at Saramacca are now expected to be completed in the third quarter 2022. All permits have been obtained.
Financial Performance - Q2 2022 Compared to Q1 2022 and Q2 2021
•Cost of sales, excluding depreciation, of $73.8 million was (i) higher by $7.3 million or 11% compared with the prior quarter, primarily due to higher mining activity, a higher stripping ratio and costs inflation, and (ii) higher by $29.3 million or 66% compared with the same prior year period, as a result of higher production costs and the significant increase in mining activities.
•Cost of sales, excluding depreciation, cash costs and AISC per ounce sold in the second quarter of $1,349, $1,327 and $1,874, were in line, in line, and higher by 5%, respectively, compared with the prior quarter, as higher production costs of $93 per ounce partially offset by higher production volume of $81 per ounce. AISC per ounce sold included higher sustaining capital expenditures of $82 per ounce sold compared to the prior quarter.
•Compared to the second quarter 2021, cost of sales, excluding depreciation, cash costs and AISC per ounce sold were lower by 24%, 25% and 16%, respectively, primarily due to higher production volume of $1,248 per ounce, partially offset by higher production costs of $809 per ounce. AISC per ounce sold included higher sustaining capital expenditures of $90 per ounce.
•Capitalized stripping in the second quarter of $18.6 million was higher by $2.6 million or 16% and $11.0 million or 145%, compared to the prior quarter and the same prior year period, respectively, resulting from higher activity levels to access future production phases.
•Sustaining capital expenditures in the second quarter, excluding capitalized stripping, of $20.4 million included capital spares of $10.6 million, mobile equipment of $2.9 million, mill equipment of $2.1 million, tailings management of $2.0 million, and other sustaining projects of $2.8 million. Expansion capital expenditures, excluding capitalized stripping, of $3.4 million included the Saramacca project and other expansion projects.
Financial Performance – YTD 2022 Compared to YTD 2021
•Cost of sales, excluding depreciation, of $140.3 million for YTD 2022, was higher by $39.7 million or 39% compared with the same prior year period, primarily as a result of higher production costs and increased mining activities.
•Cost of sales, excluding depreciation, cash costs and AISC per ounce sold of $1,359, $1,321, and $1,832, for YTD 2022, were lower by $73 or 5%, lower by $110 or 8%, and higher by $100 or 6%, respectively, compared to the same prior year period, primarily due to higher production volume of $355 per ounce, partially offset by higher production costs of $282 per ounce. AISC per ounce sold included higher sustaining capital expenditures of $209 per ounce sold.
•Capitalized stripping of $34.6 million for YTD 2022 was higher by $19.7 million or 132% due to activity levels being adversely impacted by COVID-19 during YTD 2021.
•Sustaining capital expenditures, excluding capitalized stripping, of $28.4 million for YTD 2022 included capital spares of $13.6 million, mill equipment of $4.0 million, mobile equipment of $3.2 million, tailings management of $2.9 million, and other sustaining projects of $4.7 million. Expansion capital expenditures, excluding capitalized stripping, of $5.9 million for YTD 2022 primarily included the Saramacca development project.
IAMGOLD CORPORATION Second Quarter 2022 Management’s Discussion and Analysis | 20 | ||||
Outlook
Attributable gold production at Rosebel in 2022 is expected to be in the range of 155,000 to 180,000 ounces. In the first half of the year, additional cost pressures emerged as discussed under “Outlook”. Rising oil prices continue to be partially mitigated by the existing hedge program. The Company also expects higher power costs, compared to 2021, which have links to the price of gold and oil. The collective labour agreement expires in August 2022 and negotiations for a new agreement have commenced in the third quarter, which have, in the past, been prolonged and, at times, disruptive to the operations.
The Government of Suriname continues to be under pressure to resolve its economic situation and has proposed certain measures which may negatively impact the financial condition of the Company. The Company is following the development of these measures and is engaging with the authorities as necessary in respect of such proposed measures.
In the second quarter 2022, the Company advanced a strategic review process to evaluate options for its Rosebel/Saramacca mining complex which could include the sale of this complex. See “Liquidity and Capital Resources - Liquidity Outlook”.
Brownfield Exploration
Approximately 25,000 metres of diamond and RC drilling is planned in 2022 to improve resource confidence, target resource expansions and continue to explore high priority exploration targets on the mining lease and surrounding exploration concessions, of which approximately 8,200 metres was completed in the first half of 2022.
Exploration
In the second quarter 2022, expenditures for exploration and project studies totaled $11.2 million compared with $10.0 million in the prior quarter and $13.7 million in the same prior year period, of which $9.3 million was expensed and $1.9 million was capitalized. During the first half of 2022, drilling activities on active projects and mine sites totaled approximately 83,000 metres. For additional information regarding the brownfield and greenfield exploration projects, see "Quarterly Updates". The Company's exploration expenditures guidance for 2022 is $35 million.
| ($ millions) | Q2 2022 | Q1 2022 | Q2 2021 | YTD 2022 | YTD 2021 | ||||||||||||
| Exploration projects – greenfield | $ | 7.8 | $ | 6.9 | $ | 9.3 | $ | 14.7 | $ | 14.8 | |||||||
Exploration projects – brownfield1 | 3.4 | 3.1 | 4.4 | 6.5 | 9.3 | ||||||||||||
| $ | 11.2 | $ | 10.0 | $ | 13.7 | $ | 21.2 | $ | 24.1 | ||||||||
1.Exploration projects - brownfield for the second quarter 2022 included near-mine exploration and resource development of $1.9 million (first quarter 2022 - $1.8 million, second quarter 2021 - $2.2 million, YTD 2022 - $3.9 - million, YTD 2021 $5.3 million).
FINANCIAL CONDITION
Liquidity and Capital Resources
As at June 30, 2022, the Company had $451.1 million in cash and cash equivalents, $1.8 million in short-term investments and net debt1 of $225.1 million. Approximately $348.7 million was available under the Company’s secured revolving credit facility (“Credit Facility”) resulting in liquidity1 at June 30, 2022 of approximately $802 million. The Côté Gold UJV required its joint venture partners to fund, in advance, three months of future expenditures. Subsequent to quarter end, the Côté UJV amended this requirement to two months. The Company has funded its portion of the Côté UJV funding cash generated from its operations and the Credit Facility. The Company uses dividends and intercompany loans to repatriate funds from its operations and the timing of dividends may impact the timing and amount of required financing, including the Company's drawdowns under the Credit Facility.
Restricted cash in support of environmental closure costs obligations related to Essakane totaled $38.9 million. The following sets out the changes in cash balance from March 31, 2022 to June 30, 2022 and December 31, 2021 to June 30, 2022:
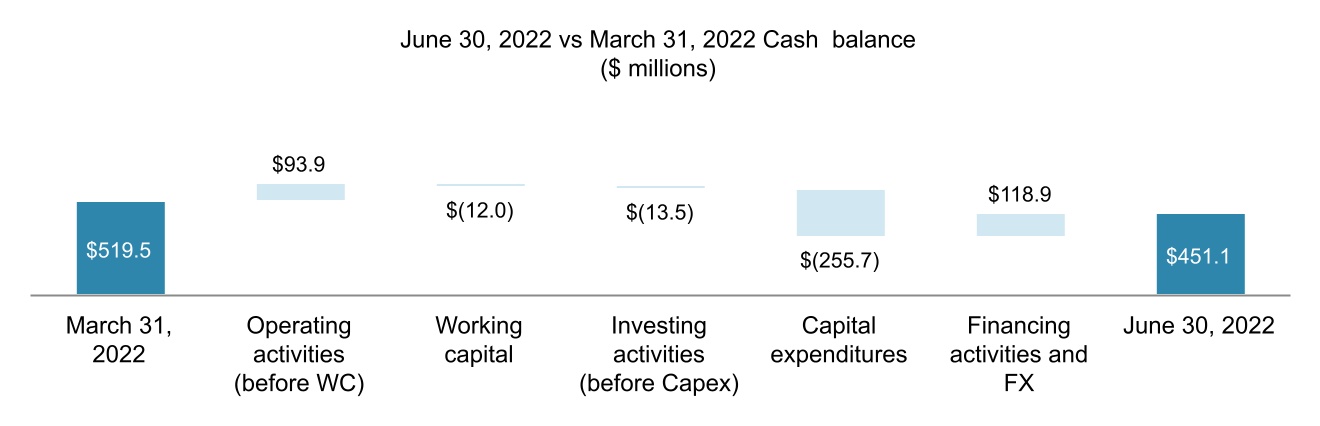
_____________________________
1.This is a non-GAAP financial measure. See "Non-GAAP Financial Measures".
IAMGOLD CORPORATION Second Quarter 2022 Management’s Discussion and Analysis | 21 | ||||
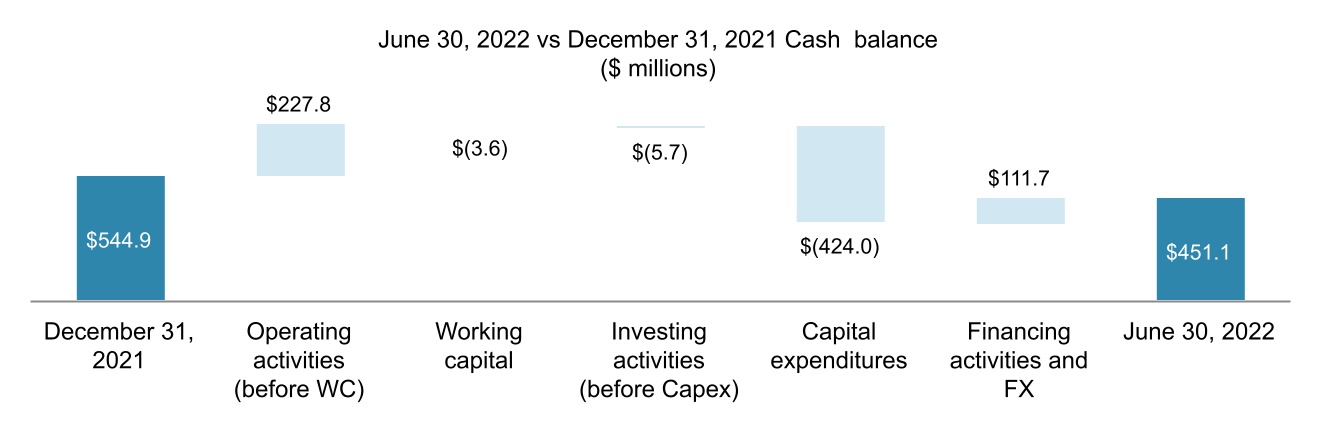
Current assets as at June 30, 2022 were $923.2 million, down $27.9 million compared with December 31, 2021. The decrease was due to lower cash and cash equivalents ($93.8 million), inventories ($32.5 million) and short term investments ($5.8 million), offset by higher receivables and other current assets ($39.2 million). Current liabilities as at June 30, 2022 were $522.4 million, down $59.3 million compared with December 31, 2021. The decrease was due to a decrease in the current portion of deferred revenue ($93.7 million) in connection with the Company’s 2019 gold sale prepayment arrangement (the “2019 Prepay Arrangement”) being recognized in revenue as it settles in equal monthly physical gold deliveries of 12,500 ounces in 2022, partially offset by an increases in accounts payable and accrued liabilities ($19.6 million) primarily related to Côté Gold and income taxes payable ($11.0 million).
The following table summarizes the Company's long-term debt:
| June 30 | March 31 | December 31 | |||||||||
($ millions)1 | 2022 | 2022 | 2021 | ||||||||
| Credit Facility | $ | 150.0 | $ | — | $ | — | |||||
| 5.75% senior notes | 447.4 | 447.0 | 445.7 | ||||||||
| Equipment loans | 14.6 | 16.5 | 18.7 | ||||||||
| $ | 612.0 | $ | 463.5 | $ | 464.4 | ||||||
1.Long-term debt does not include leases of $62.0 million as at June 30, 2022 (March 31, 2022 - $62.5 million; December 31, 2021 - $65.6 million).
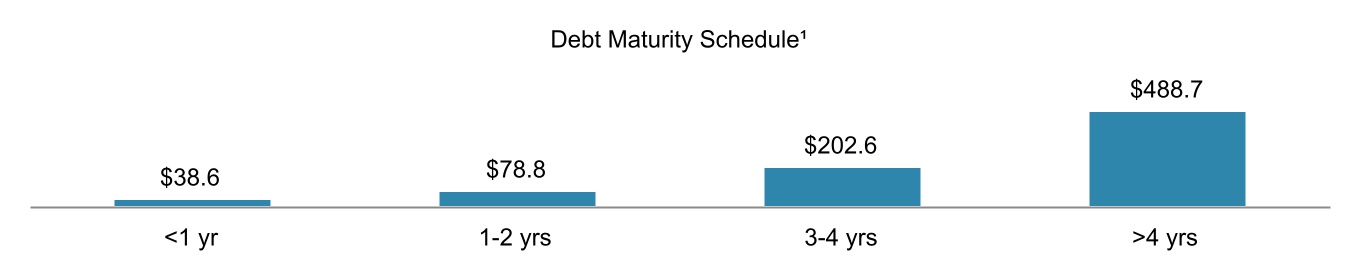
1.Includes principal and interest payments for the 5.75% senior notes and equipment loans and does not include the repayment of the 2019 Prepay Arrangement and the 2022 Prepay Arrangements (defined below) which will be physically settled in 2022 and 2024, respectively, and leases.
Credit Facility
The Company has a $500 million Credit Facility, which was entered into in December 2017 and amended including in February 2021, to primarily extend the maturity date from January 31, 2023 to January 31, 2025 for $490 million of the available credit. On April 29, 2022 and June 29, 2022, the Company drew down $100 million and $50 million, respectively, on the Credit Facility. As at June 30, 2022, the Company had letters of credit in the amount of $1.3 million issued under the Credit Facility to guarantee certain environmental indemnities and $348.7 million was available under the Credit Facility. Subsequent to the end of the quarter, the Company drew down $80.0 million to manage the timing of the receipt of a dividend from Essakane and for certain cash collateral posted for surety bonds and issued a letter of credit for $19.3 million as collateral for surety bonds.
The Credit Facility provides for an interest rate margin above London Interbank Offered Rate, banker’s acceptance prime rate and base rate advances which vary, together with fees related thereto, according to the total Net Debt to Earnings Before Interest, Tax, Depreciation and Amortization ("EBITDA") ratio of the Company. The Credit Facility is secured by certain of the Company's real assets, guarantees by certain of the Company’s subsidiaries and pledges of shares of certain of the Company's subsidiaries. The key terms of the Credit Facility include certain limitations on incremental debt, certain restrictions on distributions and financial covenants including Net Debt to EBITDA and Interest Coverage.
IAMGOLD CORPORATION Second Quarter 2022 Management’s Discussion and Analysis | 22 | ||||
Senior notes
In September 2020, the Company completed the issuance of $450 million of senior notes at face value with an interest rate of 5.75% per annum (the "Notes"). The Notes are denominated in U.S. dollars and mature on October 15, 2028. Interest is payable in arrears in equal semi-annual installments on April 15 and October 15 of each year, beginning on April 15, 2021, in the amount of approximately $12.9 million for each payment. The Notes are guaranteed by certain of the Company's subsidiaries. The Company incurred transaction costs of $7.5 million which have been capitalized and offset against the carrying amount of the Notes within long-term debt in the consolidated balance sheets and are being amortized using the effective interest rate method.
Leases
At June 30, 2022, the Company had lease obligations of $62.0 million at a weighted average borrowing rate of 5.08%.
On April 29, 2022, the Company, on behalf of the Côté Gold UJV, entered into a master lease agreement with Caterpillar Financial Services Limited to lease certain mobile equipment, expected to be delivered over the course of 2022 and 2023, with a value of approximately $125 million. In connection therewith, SMM entered into a guarantee of 30% of the obligations under such agreement, reflecting its pro rata interest in the Côté Gold UJV.
Equipment loans
At June 30, 2022, the Company had equipment loans with a carrying value of $14.6 million secured by certain mobile equipment, with interest rates between 5.23% and 5.95% which mature in 2024. The equipment loans are carried at amortized cost on the consolidated balance sheets. On March 31, 2022, the Company entered into an amendment to increase the equipment loan facility by $6.2 million on similar terms. The equipment loan facility has an availability period of six months and $0.7 million has been drawn as at June 30, 2022.
Prepay arrangements
During 2019, the Company entered into the 2019 Prepay Arrangement with a collar range of $1,300 to $1,500 per ounce at a cost of 5.38% per annum. Pursuant to the 2019 Prepay Arrangement, the Company received a cash prepayment of $169.8 million in December 2019 in exchange for delivering 150,000 gold ounces in 2022. During the six months ended June 30, 2022, 75,000 ounces were delivered into the 2019 Prepay Arrangement and the Company received $15.0 million in cash in relation to the collar.
During 2021, the Company entered into gold sale prepayment arrangements (the "2022 Prepay Arrangements") at a weighted average cost of 4.45% per annum in respect of 150,000 gold ounces. These arrangements have an average forward contract price of $1,753 per ounce on 50,000 gold ounces and a collar range of $1,700 to $2,100 per ounce on 100,000 gold ounces. This will result in a total prepayment to the Company of $236 million over the course of 2022 and the requirement on the part of the Company to physically deliver such ounces over the course of 2024. The 2022 Prepayment Arrangements have the effect of rolling the 2019 Prepay Arrangement from 2022 to 2024 after the completion of the construction of Côté Gold. The Company received $118.0 million during the six months ended June 30, 2022 pursuant to the 2022 Prepay Arrangements.
Surety bonds and performance bonds
As at June 30, 2022, the Company had (i) C$215.8 million ($167.7 million) of uncollateralized surety bonds, issued pursuant to arrangements with insurance companies, in support of environmental closure costs obligations related to the Doyon division and Côté Gold and (ii) C$39.1 million ($31.3 million) of uncollateralized performance bonds in support of certain obligations related to the construction of Côté Gold. The Company expects that the uncollateralized surety bonds in support of the Doyon division will have to be increased to support the updated environmental closure cost obligations in the updated closure plan once such closure plan has been approved by the applicable regulatory authorities. Subsequent to the end of the quarter, the Company posted $30.2 million of security for certain of the surety bonds. $10.9 million was posted as cash collateral and $19.3 million was posted through the issuance of a letter of credit under the Credit Facility.
Derivative contracts
In addition to the gold sale prepayment arrangements noted above, and in order to mitigate volatility during the construction of Côté Gold, the Company entered into certain derivative contracts in respect of certain of its future gold sales and exchange rates. In addition, the Company manages certain other commodities exposure such as oil through derivatives. See "Market Risk – Summary of Hedge Portfolio" for information relating to the Company’s outstanding derivative contracts including the derivative contracts associated with Côté Gold.
Liquidity Outlook
The remaining attributable spend to complete the construction of the Côté Gold project are estimated to be between $1.2 and $1.3 billion from July 1, 2022, net of leases and working capital (see “Côté Gold Project”). The Côté Gold UJV requires its joint venture partners to fund, in advance, previously three and now two months of future expenditures. The Company uses dividends and intercompany loans to repatriate funds from its operations and the timing of dividends may impact the timing and amount of required financing, including the Company's drawdowns under the Credit Facility. Primarily due to the timing of a dividend payment from Essakane, the Company drew down an additional $80 million at the end of July 2022 and issued a $19 million letter of credit under the Credit Facility.
IAMGOLD CORPORATION Second Quarter 2022 Management’s Discussion and Analysis | 23 | ||||
Based on the recently updated cost estimate and schedule of construction of the Côté Gold project, information currently available and prevailing market prices, which impact operating cash flows, the Company will require additional liquidity to complete construction of the project and continues to seek to implement a fully funded financing plan by the end of the year and prior to the necessity to make any potential adjustments to the timing of the advancement of the project based on the updated schedule.
As such, the Company is actively pursuing various alternatives to increase its liquidity and capital resources including disposition of one or more of the Company’s assets and/or an interest therein and/or joint-venture partnerships, additional secured debt which could be provided by banks, private capital providers and/or institutional investors, additional unsecured debt including unsecured and/or convertible notes, sales of common shares, the extension of the 2022 Prepay Arrangements.
In January 2022, the Company announced that it was commencing a strategic review process to evaluate options for its Rosebel/Saramacca mining complex, including a potential sale of this complex. The Company advanced this process in the second quarter 2022. In addition, the Company is evaluating strategic alternatives with respect to certain of its development and exploration assets in South America and West Africa (excluding Essakane), that may include the disposition of all or an interest in one or more of such assets.
However, there can be no assurance that the Company will be successful in achieving financing solutions in time and/or on terms acceptable to the Company or that the strategic evaluations discussed above will result in a transaction. In this case and in order to execute its plans for the foreseeable future, including financing alternatives, the Company has developed certain potential alternatives to defer or reduce its capital spending and various other expenditures. These alternatives may impact future operating and financial performance and/or could extend the Côté Gold project construction timeline and significantly increase project costs, and/or dilute the Company's interest in the Côté Gold project. Reductions in capital expenditures at the Côté Gold project requires approval from the Côté UJV oversight committee.
The Company’s financial results are highly dependent on the price of gold and future changes in the price of gold will, therefore, impact performance. The Company will be dependent on the cash flows generated from the Côté Gold project to eventually repay its existing and any additional indebtedness that it may incur to fund the remaining construction costs of the Côté Gold project. Readers are encouraged to read the “Caution Regarding Forward Looking Statements” and the “Risk Factors” sections contained in the Company’s 2021 Annual Information Form, which is available on SEDAR at www.sedar.com and the “Caution Regarding Forward Looking Statements” and the “Risk and Uncertainties” sections of the MD&A.
Contractual Obligations
As at June 30, 2022, contractual obligations with various maturities were approximately $1.7 billion, primarily comprising expected future contractual payments of long-term debt including principal and interest, purchase obligations, capital expenditures obligations and lease obligations. Management believes these obligations will be met through available cash resources and net cash from operating activities. The Company entered into derivative contracts for risk management purposes. These derivative contracts are not included in the contractual obligations. Details of these contracts are included in "Market Risk - Summary of Hedge Portfolio".
Cash Flow
| ($ millions) | Q2 2022 | Q1 2022 | Q2 2021 | YTD 2022 | YTD 2021 | ||||||||||||
| Net cash from (used in) per consolidated interim financial statements: | |||||||||||||||||
| Operating activities | $ | 81.9 | $ | 142.3 | $ | 37.3 | $ | 224.2 | $ | 139.0 | |||||||
| Investing activities | (269.2) | (160.5) | (161.7) | (429.7) | (225.0) | ||||||||||||
| Financing activities | 129.9 | (7.5) | (16.0) | 122.4 | (30.2) | ||||||||||||
| Effects of exchange rate fluctuation on cash and cash equivalents | (11.0) | 0.3 | 2.3 | (10.7) | (0.4) | ||||||||||||
| Decrease in cash and cash equivalents | (68.4) | (25.4) | (138.1) | (93.8) | (116.6) | ||||||||||||
| Cash and cash equivalents, beginning of the period | 519.5 | 544.9 | 963.0 | 544.9 | 941.5 | ||||||||||||
| Cash and cash equivalents, end of the period | $ | 451.1 | $ | 519.5 | $ | 824.9 | $ | 451.1 | $ | 824.9 | |||||||
Operating Activities
Net cash from operating activities for the second quarter 2022 was $81.9 million, a decrease of $60.4 million from the prior quarter, primarily due to lower net cash earnings ($19.9 million), higher income taxes paid resulting from withholding taxes on repatriation of funds ($26.9 million) and a net outflow in non-cash working capital movements ($20.4 million), partially offset by an increase in cash inflows from the settlement of derivatives ($6.3 million).
The second quarter 2022 movements in non-cash working capital items and non-current stockpiles resulted in an outflow of $12.0 million and included:
•An increase in inventories and non-current ore stockpiles balance ($17.7 million), primarily due to higher cost of production due to cost increases;
•An increase in receivables and other current assets ($8.8 million), primarily due to new claims for value added taxes; and
•An increase in accounts payable and accrued liabilities balance ($14.6 million), primarily due to timing of payment of suppliers.
IAMGOLD CORPORATION Second Quarter 2022 Management’s Discussion and Analysis | 24 | ||||
Compared with the second quarter 2021, the increase of $44.6 million in net cash from operating activities was primarily due to higher net cash earnings ($36.0 million), proceeds from the 2022 Prepay Arrangements ($59.0 million) and an increase in cash inflows from the settlement of derivatives ($9.8 million), partially offset by deferred revenue recognized on the 2019 Prepay Arrangement ($48.7 million) and an increase in income taxes paid ($15.2 million).
Net cash from operating activities for YTD 2022 was $224.2 million, an increase of $85.2 million from the same prior year period, primarily due to higher net cash earnings ($73.3 million), proceeds from 2022 Prepay Arrangements ($118.0 million) and an increase of cash inflows from the settlement of derivatives ($15.0 million), partially offset by deferred revenue recognized on the 2019 Prepay Arrangement ($97.5 million) and an increase in income taxes paid ($16.9 million).
Investing Activities
Net cash used in investing activities for the second quarter 2022 was $269.2 million, an increase of $108.7 million from the prior quarter, primarily due to an increase in capital expenditures for property, plant and equipment ($87.4 million) mainly related to the Cóté Gold construction and timing of financing costs paid and capitalized as borrowing costs ($13.1 million).
Compared with the second quarter 2021, net cash used in investing activities increased by $107.5 million, primarily due to an increase in capital expenditures for property, plant and equipment ($103.8 million) mainly related to the Cóté Gold construction and borrowing costs paid ($4.7 million), partially offset by proceeds from the disposal of investments ($2.1 million).
Net cash used in investing activities for YTD 2022 was $429.7 million, an increase of $204.7 million from the same prior year period, primarily due to an increase in capital expenditures for property, plant and equipment ($170.2 million) mainly related to the Cóté Gold construction, partially offset by proceeds from disposal of marketable securities ($9.9 million). The Company also received proceeds from the sale of non-core royalties ($45.9 million) during the same prior year period.
Financing Activities
Net cash from financing activities in the second quarter 2022 was $129.9 million, an increase of $137.4 million from the prior quarter, primarily due to proceeds from the Credit Facility drawdowns ($150.0 million), partially offset by an increase in dividends paid to non-controlling interest ($11.6 million) on the declaration of dividends from subsidiaries.
Compared with the second quarter 2021, net cash from financing activities increased by $145.9 million, primarily due to proceeds from the Credit Facility drawdowns ($150.0 million), partially offset by an increase in dividends paid to the non-controlling interest ($9.7 million).
Net cash from financing activities for YTD 2022 was $122.4 million, an increase of $152.6 million from the same prior year period, primarily due to proceeds from the Credit Facility drawdowns ($150.0 million).
Mine-Site Free Cash Flow1
Second quarter 2022 mine site free cash flow was $42.8 million, down $ $44.7 million from the prior quarter, primarily due to lower operating cash flow at Essakane ($54.6 million) and Westwood ($11.1 million), mainly due to higher operating costs, lower sales volume and a lower average realized gold price, and higher capital expenditures at Rosebel ($16.0 million), partially offset by higher operating cash flow from Rosebel ($21.5 million) and lower capital expenditures at Essakane ($17.1 million).
Second quarter 2022 mine site free cash flow was up $40.9 million from the same prior year period, primarily due to higher operating cash flow at Rosebel ($71.3 million) mainly due to higher sales volume and higher average realized gold price, partially offset by higher capital expenditures at Rosebel ($16.4 million) and Westwood ($5.9 million) due to the continued ramp up in production activities.
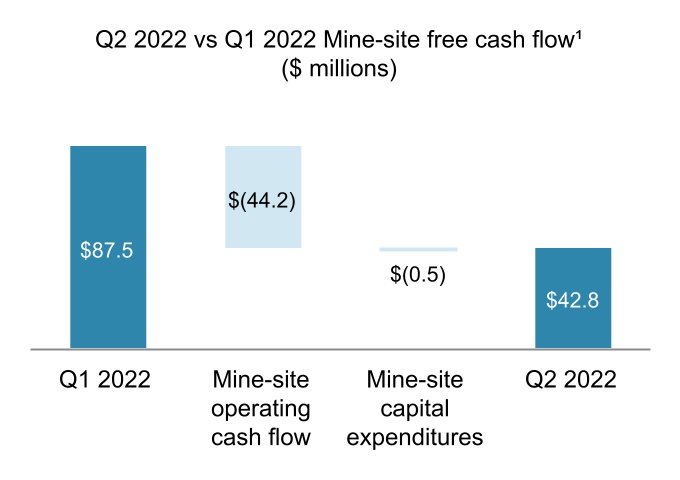
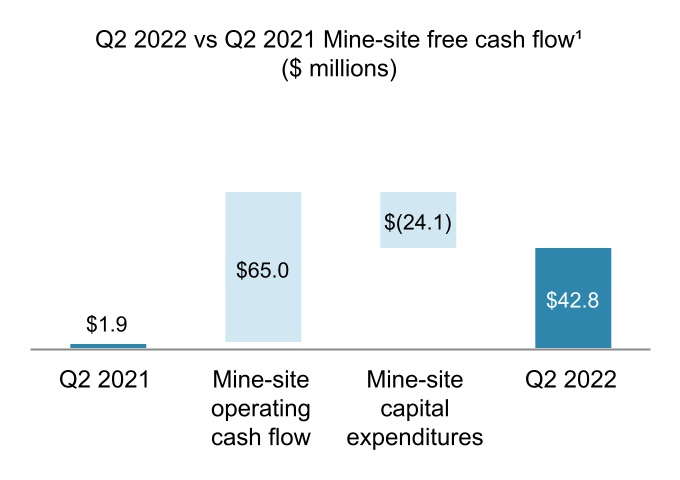
IAMGOLD CORPORATION Second Quarter 2022 Management’s Discussion and Analysis | 25 | ||||
Market Trends
Global Financial Market Conditions and Gold Price
The spot price of gold at the end of the second quarter 2022 was $1,817 per ounce and gold traded in a range of $1,807 to $1,979 per ounce during the second quarter 2022. The spot price of gold declined after the end of the second quarter 2022, following the strengthening of the U.S. dollar among a global increase in inflation.
The price of gold is a key driver of the Company’s profitability. The average and closing spot gold price and the Company’s average realized gold price in the second quarter 2022, prior quarter and the same prior year period are set out below. The Company’s hedging strategy is designed to mitigate gold price risk during the Côté Gold construction period. See "Market Risk" for more information.
| Q2 2022 | Q1 2022 | Q2 2021 | YTD 2022 | YTD 2021 | |||||||||||||
| Average market gold price ($/oz) | $ | 1,871 | $ | 1,877 | $ | 1,816 | $ | 1,874 | $ | 1,805 | |||||||
Average realized gold price1,2 ($/oz) | $ | 1,799 | $ | 1,813 | $ | 1,800 | $ | 1,806 | $ | 1,788 | |||||||
| Closing market gold price ($/oz) | $ | 1,817 | $ | 1,942 | $ | 1,763 | $ | 1,817 | $ | 1,763 | |||||||
1.This is a non-GAAP financial measure. See "Non-GAAP Financial Measures".
2.Excluding the impact of the 2019 Prepay Arrangement the average realized gold price was $1,873 for the second quarter 2022, $1,884 for the first quarter 2022 and $1,879 for YTD 2022.
Inflation
Inflationary pressures continue to emerge reflecting continued supply-demand imbalances and the impact of rising energy prices across supply chains. The Canadian Consumer Price Index increased 8.1% in June, year-over-year, which is well above the historically targeted inflation rate of 2%. In June, U.S. CPI jumped by 9.1% year-over year. The Canadian CPI is nearing a forty year high, while the U.S. CPI is at the forty-one year high.
In order to combat inflation, central banks and governments have taken and are likely to take more drastic measures in relation to interest rates. On July 13, the Bank of Canada raised the benchmark interest rate by one percentage point to 2.5%. This is the highest one time rate hike in Canada since 1998. In the U.S., the Fed hiked the funds rate by 75 bps during each of its June and July meetings. Other central banks are making similar large rate hikes. These rate hikes are expected to continue and there are market concerns that such increases may bring on a recession.
Currency and Oil Prices
The U.S. dollar is the Company’s functional currency. The Company's revenues are primarily denominated in U.S. dollars. The Company’s main exposures are to the Canadian dollar and oil prices.
The Company's Canadian dollar exposures relate to operational and capital expenditures in Canada. The Company’s hedging strategy was designed to mitigate the risk of exposure to exchange rate volatility of the Canadian dollar. See "Market Risk".
The Company has minimal residual exposure to euro denominated operational and capital expenditures in West Africa as it sells a portion of its gold in euros.
The Company's oil exposures relate primarily to its mining operations in West Africa and South America. The Company’s hedging strategy was designed to mitigate the risk of oil price appreciation given it is a significant input cost in the production of gold. See "Market Risk".
| Q2 2022 | Q1 2022 | Q2 2021 | YTD 2022 | YTD 2021 | |||||||||||||
| Average rates | |||||||||||||||||
| USDCAD | 1.2767 | 1.2663 | 1.2288 | 1.2717 | 1.2471 | ||||||||||||
| EURUSD | 1.0647 | 1.1217 | 1.2047 | 1.0930 | 1.2051 | ||||||||||||
| Closing rates | |||||||||||||||||
| USDCAD | 1.2871 | 1.2483 | 1.2405 | 1.2871 | 1.2405 | ||||||||||||
| EURUSD | 1.0468 | 1.1096 | 1.1851 | 1.0468 | 1.1851 | ||||||||||||
| Average Brent price ($/barrel) | $ | 105 | $ | 98 | $ | 69 | $ | 105 | $ | 65 | |||||||
| Closing Brent price ($/barrel) | $ | 115 | $ | 108 | $ | 75 | $ | 115 | $ | 75 | |||||||
| Average WTI price ($/barrel) | $ | 109 | $ | 95 | $ | 66 | $ | 102 | $ | 62 | |||||||
| Closing WTI price ($/barrel) | $ | 106 | $ | 100 | $ | 73 | $ | 106 | $ | 73 | |||||||
IAMGOLD CORPORATION Second Quarter 2022 Management’s Discussion and Analysis | 26 | ||||
Sensitivity Impact
The following table provides estimated cost per ounce sensitivities around certain inputs, excluding the impact of the Company’s hedging program which can affect the Company’s operating results, assuming guided 2022 production and costs levels:
| Change of | Annualized impact on Cost of Sales $/oz | Annualized impact on Cash Costs1 $/oz | Annualized impact on AISC1 $/oz | |||||||||||
Gold price2 | $100/oz | $6 | $6 | $6 | ||||||||||
| Oil price | $10/barrel | $15 | $15 | $18 | ||||||||||
| USDCAD | $0.10 | $20 | $20 | $30 | ||||||||||
| EURUSD | $0.10 | $15 | $15 | $23 | ||||||||||
1.This is a non-GAAP financial measure. See "Non-GAAP Financial Measures". Cash costs and AISC per ounce of gold sold consist of Essakane, Rosebel and Westwood on an attributable basis of 90%, 95% and 100%, respectively.
2.Gold price sensitivities include royalties and additional costs with a gold price link, which are included in total cost of sales, cash costs and AISC.
Market Risk
Market risk is the risk that the fair value or future cash flows of a financial instrument will fluctuate because of changes in market prices. For hedging activities, it is the risk that the fair value of a derivative might be adversely affected by a change in underlying commodity prices or currency exchange rates and that this in turn affects the Company’s financial condition. The Company establishes trading agreements with counterparties under which there is no requirement to post any collateral or make any margin calls on derivatives. Counterparties cannot require settlement solely because of an adverse change in the fair value of a derivative.
Currency Exchange Rate Risk
The Company’s functional currency is the U.S. dollar which creates currency exchange risk exposure primarily associated with its expenditures denominated in Canadian dollars and euros. To manage this risk, the Company uses various hedging strategies, including holding some of its cash and cash equivalents in Canadian dollar or euro denominated bank accounts creating a natural off-set to the exposure and derivative contracts such as forwards or options. Option contracts can be combined through the use of put option contracts and call option contracts (collar structure), within a range of expiry dates and strike prices.
Oil Contracts and Fuel Market Price Risk
Brent and West Texas Intermediate (“WTI”) are components of diesel and fuel oil which are among the key inputs impacting the Company’s costs. To manage the risk associated with the fluctuation in the costs of these commodities, the Company uses various hedging strategies, such as the use of options. Option contracts can be combined through the use of put option contracts and call option contracts (collar structure), within a range of expiry dates and strike prices.
Gold Contracts and Market Price Risk
The Company’s primary source of revenue is gold. The Company’s hedging strategy is designed to mitigate gold price risk during the Côté Gold construction period. To manage such risk, the Company uses various hedging strategies, such as the use of call option contracts. Option contracts can also include put option contracts and call option contracts (collar structure), within a range of expiry dates and strike prices.
Summary of Hedge Portfolio
At June 30, 2022, the Company’s outstanding foreign currency and oil derivative contracts were as follows:
| 2022 | 2023 | 2024 | |||||||||
Foreign Currency1 | |||||||||||
Canadian dollar contracts2 (millions of C$) | 306 | 188 | 120 | ||||||||
| Rate range (USDCAD) | 1.28 — 1.48 | 1.30 — 1.46 | 1.32 | ||||||||
Hedge ratio3 | 38% | 13% | 14% | ||||||||
Commodities4 | |||||||||||
| Brent oil contracts (thousands of barrels) | 260 | 428 | 270 | ||||||||
| Contract price range ($/barrel of crude oil) | 50 — 65 | 41 — 65 | 41 — 55 | ||||||||
Hedge ratio3 | 71% | 56% | 36% | ||||||||
| WTI oil contracts (thousands of barrels) | 290 | 473 | 270 | ||||||||
| Contract price range ($/barrel of crude oil) | 38 — 62 | 36 — 60 | 38 — 50 | ||||||||
Hedge ratio3 | 80% | 64% | 39% | ||||||||
1.2022 Canadian dollar hedges excludes Canadian dollars on hand which functions as a natural hedge for the Company’s 2022 Canadian dollar expenditures.
2.The Company previously executed Canadian dollar collar options, which consist of Canadian dollar call and put options within the given range in 2022 through 2024. The Company will recognize a gain from the difference between a lower market price and the Canadian dollar call strike price. The Company will incur a loss from the difference between a higher market price and the Canadian dollar put strike price. 2022 includes the TARF and forwards with an extension feature discussed below. Includes hedged exposure at Côté Gold in 2022, 2023 and 2024, with a hedge ratio of47%, 16% and 24%, respectively.
3.The Company calculates hedge ratios based on future estimates of operating and capital expenditures (such as its Canadian dollar operating and capital expenditures at Westwood and its corporate office, and Canadian dollar capital expenditures at Côté Gold during the construction period, future estimated uses of commodities and future estimated production. Outstanding derivative contracts are allocated based on a specified allocation methodology.
4. The Company previously executed Brent and WTI collar options, which consist of Brent and WTI put and call options with strike prices within the given range in 2022 through 2024. The Company will incur a loss from the difference between a lower market price and the put strike price. The Company will recognize a gain from the difference between a higher market price and the call strike price. Includes hedged exposure for WTI at Côté Gold in 2022 and 2023, with a hedge ratio of 68% and 30%, respectively
IAMGOLD CORPORATION Second Quarter 2022 Management’s Discussion and Analysis | 27 | ||||
In connection with the construction of Côté Gold, the Company entered into a TARF structure as part of its strategy to manage exposure to the Canadian dollar. The Company has not designated the TARF financial derivative contract as a hedge for accounting purposes, although the Company does consider this arrangement to be an effective economic hedge. The derivative structure includes a termination feature as well as a leverage component. Contractual terms of the TARF include the following:
•There are four underlying contracts with strike prices ranging from 1.300 to 1.3100 and averaging 1.30675.
•On any monthly option fixing date, if the USDCAD exchange rate is below the strike price, the Company expects to exercise its option and deliver $7.7 million and receive CAD$10 million.
•On any monthly option fixing date, if the USDCAD exchange rate is above the strike price, the Company expects that the counterparty will exercise its option in which case the Company will deliver $15.3 million and receive CAD$20 million.
•The term of the arrangement is 30 months from January 2022 to June 2024. If the contract is exercised for a total of 12 times when the USDCAD is below the strike price, the arrangement will terminate. Each of the four contracts were exercised in January, February, March, April, May and July while the USDCAD was below the strike price. Three of the four contracts were exercised in June resulting in three contracts having five knockouts remaining and one contract having six knockouts remaining.
•The Company realized a gain for the three and six months ended June 30, 2022 of $0.6 million and $1.6 million, respectively, on the TARF which is included in interest income, derivatives and other investment gains (losses) in the consolidated statements of earnings (loss).
In connection with the construction of Côté Gold, the Company entered into a forward contract with an extendable feature to purchase CAD$10 million per month during 2022 for a total of $120 million at a forward exchange rate of 1.32 USDCAD. The counterparty has an option, at its sole discretion, to extend the contract for twelve months, which would require the Company to purchase CAD$10 million per month during 2024 at the forward exchange rate. The option expires in November 2023. The Company realized a gain for the three and six months ended June 30, 2022 of $0.9 million and $2.1 million, respectively, on this contract which is included in interest income, derivatives and other investment gains (losses) in the consolidated statements of earnings (loss).
At June 30, 2022, the Company’s outstanding gold bullion contracts and gold sale prepayment arrangements were as follows:
| Put | Call | 2022 | 2023 | 2024 | |||||||||||||
| Weighted average $/ounce | Thousands of ounces | ||||||||||||||||
| Zero cost collars | 1,708 | 2,335 | 19 | 93 | — | ||||||||||||
| Zero cost collars | 1,850 | 1,990 | — | 75 | — | ||||||||||||
| Zero cost collars | 1,850 | 2,175 | — | 15 | — | ||||||||||||
| Zero cost collars | 1,850 | 2,191 | — | 15 | — | ||||||||||||
| Subtotal gold bullion contracts | |||||||||||||||||
| 2019 Prepay Arrangement | 1,300 | 1,500 | 75 | — | — | ||||||||||||
| 2022 Prepay Arrangements – collar | 1,700 | 2,100 | — | — | 100 | ||||||||||||
| 2022 Prepay Arrangements – forward | 1,753 | — | — | — | 50 | ||||||||||||
| Subtotal gold sale prepay arrangements | — | — | 75 | — | 150 | ||||||||||||
Total1 | — | — | 94 | 198 | 150 | ||||||||||||
1.The Company executed gold collar options, which consist of gold put and call options with strike prices within the given range in 2022 and 2023. The Company will incur a loss from the difference between a higher market price and the call strike price. The Company will recognize a gain from the difference between a lower market price and the put strike price. In the first quarter, the Company executed gold collar options with an average price range of $1,850 to $1,990 for 75,000 ounces. The Company executed additional gold collar options in the second quarter with an average price range of $1,850 to $2,183 for 30,000 ounces.
The Company’s cost metrics were impacted as follows by realized derivative gains and losses:
| Q2 2022 | Q1 2022 | Q2 2021 | YTD 2022 | YTD 2021 | |||||||||||||
| Cost of sales per ounce sold before hedging | $ | 1,194 | $ | 1,080 | $ | 1,165 | $ | 1,136 | $ | 1,120 | |||||||
| Realized derivative gains per ounce sold | 64 | 44 | 15 | 54 | 10 | ||||||||||||
| Cost of sales per ounce sold | $ | 1,130 | $ | 1,035 | $ | 1,150 | $ | 1,081 | $ | 1,110 | |||||||
| Cash cost per ounce sold before hedging | $ | 1,183 | $ | 1,061 | $ | 1,163 | $ | 1,120 | $ | 1,118 | |||||||
| Realized derivative gains per ounce sold | 64 | 44 | 15 | 54 | 10 | ||||||||||||
| Cash cost per ounce sold | $ | 1,119 | $ | 1,017 | $ | 1,149 | $ | 1,066 | $ | 1,108 | |||||||
| $ | — | ||||||||||||||||
| AISC per ounce sold before hedging | $ | 1,670 | $ | 1,537 | $ | 1,444 | $ | 1,601 | $ | 1,340 | |||||||
| Realized derivative gains per ounce sold | 66 | 47 | 22 | 56 | 16 | ||||||||||||
| AISC per ounce sold | $ | 1,604 | $ | 1,490 | $ | 1,422 | $ | 1,545 | $ | 1,324 | |||||||
Figures may not be calculated based on amounts presented in this table due to rounding.
IAMGOLD CORPORATION Second Quarter 2022 Management’s Discussion and Analysis | 28 | ||||
Shareholders' Equity
| Number issued and outstanding (millions) | June 30, 2022 | August 3, 2022 | ||||||
| Common shares | 479.0 | 479.0 | ||||||
Options1 | 5.3 | 5.2 | ||||||
1.Refer to note 26 of the consolidated interim financial statements for all outstanding equity awards.
QUARTERLY FINANCIAL REVIEW
| 2022 | 2021 | 2020 | ||||||||||||||||||||||||
| ($ millions, except where noted) | Q2 | Q1 | Q4 | Q3 | Q2 | Q1 | Q4 | Q3 | ||||||||||||||||||
| Revenues | $ | 334.0 | $ | 356.6 | $ | 294.6 | $ | 294.1 | $ | 265.6 | $ | 297.4 | $ | 347.5 | $ | 335.1 | ||||||||||
Net earnings (loss) from continuing operations1 | $ | (3.5) | $ | 31.8 | $ | (204.0) | $ | (72.5) | $ | (0.3) | $ | 21.7 | $ | 68.0 | $ | (7.7) | ||||||||||
| Net earnings from discontinued operations | $ | — | $ | — | $ | — | $ | — | $ | — | $ | — | $ | 4.1 | $ | — | ||||||||||
| Net earnings (loss) attributable to equity holders | $ | (9.6) | $ | 23.8 | $ | (194.1) | $ | (75.3) | $ | (4.5) | $ | 19.5 | $ | 63.1 | $ | (11.6) | ||||||||||
| Basic and diluted earnings (loss) per share attributable to equity holders | $ | (0.02) | $ | 0.05 | $ | (0.41) | $ | (0.16) | $ | (0.01) | $ | 0.04 | $ | 0.13 | $ | (0.02) | ||||||||||
1.In the fourth quarter 2021, net loss from continuing operations was higher primarily due to an impairment charge recorded in respect of Rosebel.
DISCLOSURE CONTROLS AND PROCEDURES AND INTERNAL CONTROL OVER FINANCIAL REPORTING
Disclosure Controls and Procedures
The Company’s disclosure controls and procedures are designed to provide reasonable assurance that all relevant information is communicated to senior management to allow timely decisions regarding required disclosure. An evaluation of the effectiveness of the Company’s disclosure controls and procedures, as defined under the rules of the Canadian Securities Administration, was conducted as at December 31, 2021 under the supervision of the Company’s Disclosure Committee and with the participation of management. Based on the results of that evaluation, the Interim CEO and the CFO concluded that the Company’s disclosure controls and procedures were effective as at December 31, 2021 providing reasonable assurance that the information required to be disclosed in the Company’s annual filings, interim filings or other reports filed or submitted by it under securities legislation is recorded, processed, summarized and reported in accordance with securities legislation.
Since the December 31, 2021 evaluation, there have been no material changes to the Company's disclosure controls and procedures and their design remains effective.
Internal Control over Financial Reporting
Internal control over financial reporting is designed to provide reasonable assurance regarding the reliability of the Company’s financial reporting and the preparation of consolidated interim financial statements in compliance with IFRS as issued by the International Accounting Standards Board ("IASB"). The Company’s internal control over financial reporting includes policies and procedures that:
•pertain to the maintenance of records that accurately and fairly reflect the transactions of the Company;
•provide reasonable assurance that transactions are recorded as necessary to permit preparation of consolidated interim financial statements in accordance with IFRS as issued by the IASB;
•ensure the Company’s receipts and expenditures are made only in accordance with authorization of management and the Company’s directors; and
•provide reasonable assurance regarding prevention or timely detection of unauthorized transactions that could have a material effect on the consolidated interim financial statements.
An evaluation of the effectiveness of the Company’s internal control over financial reporting, including an evaluation of material changes that may have materially affected or are reasonably likely to have materially affected the internal controls over financial reporting based on the criteria established in Internal Control - Integrated Framework (2013) issued by the Committee of Sponsoring Organizations of the Treadway Commission, was conducted as of December 31, 2021 by the Company’s management, including the Interim CEO and the CFO. Based on this evaluation, management, including the Interim CEO and the CFO, has concluded that the Company’s internal control over financial reporting was effective as of December 31, 2021.
There have been no material changes in the Company's internal control over financial reporting or in other factors that could affect internal controls during the first half of 2022 and their design remains effective.
Limitations of Control and Procedures
The Company’s management, including the Interim CEO and the CFO, believe that any disclosure controls and procedures and internal controls over financial reporting, no matter how well designed, can have inherent limitations. Therefore, even those systems determined to be effective can provide only reasonable assurance that the objectives of the control system are met.
IAMGOLD CORPORATION Second Quarter 2022 Management’s Discussion and Analysis | 29 | ||||
CRITICAL JUDGMENTS, ESTIMATES AND ASSUMPTIONS
The Company’s management makes judgments in its process of applying the Company’s accounting policies in the preparation of its consolidated interim financial statements. In addition, the preparation of financial data requires that the Company’s management make assumptions and estimates of effects of uncertain future events on the carrying amounts of the Company’s assets and liabilities at the end of the reporting period and the reported amounts of revenues and expenses during the reporting period. Actual results may differ from those estimates as the estimation process is inherently uncertain. Estimates are reviewed on an ongoing basis based on historical experience and other factors that are considered to be relevant under the circumstances. Revisions to estimates and the resulting effects on the carrying amounts of the Company’s assets and liabilities are accounted for prospectively.
The Company’s financing plans and certain other potential alternative plans to defer or reduce its capital spending and various other expenditures, in the event it does not achieve its financing plans, and the ability of the Company to execute them involve certain assumptions that represent significant judgment by the Company (see “Liquidity and Capital Resources - Liquidity Outlook”).
The critical judgments, estimates and assumptions applied in the preparation of the Company's consolidated interim financial statements are reflected in note 3 of the Company's audited annual consolidated financial statements for the year ended December 31, 2021.
Qualified Person and Technical Information
The technical and scientific information relating to exploration activities disclosed in this document was prepared under the supervision of and verified and reviewed by Craig MacDougall, P.Geo., Executive Vice President, Growth, IAMGOLD. Mr. MacDougall is a “qualified person” as defined by NI 43-101.
Data verification involves data input and review by senior project geologists at site, scheduled weekly and monthly reporting to senior exploration management and the completion of project site visits by senior exploration management to review the status of ongoing project activities and data underlying reported results. All drilling results for exploration projects or supporting resource and reserve estimates referenced in this MD&A have been previously reported in news release disclosures either by the Company or the project operator as the case may be (see referenced news releases) and have been prepared in accordance with NI 43-101. The sampling and assay data from drilling programs are monitored through the implementation of a quality assurance - quality control (QA-QC) program designed to follow industry best practice. Drill core (HQ and NQ size) samples are selected by the project geologists and sawn in half with a diamond saw at the project site. Half of the core is typically retained at the site for reference purposes. Generally, sample intervals are 1.0 to 1.5 metres in length and reverse circulation holes are sampled at 1.0 metre intervals at the drill rig. Samples are prepared and analyzed at site for the Company's producing mines and at accredited regional laboratories for the Company's exploration projects, using analysis techniques such as standard fire assay with a 50 gram charge; fire assay with gravimetric finish, or LeachWELL rapid cyanide leach with fire assay with a 50 gram charge.
NEW ACCOUNTING STANDARDS
For a discussion of new accounting standards adopted and new accounting standards issued but not yet effective that may impact the Company, refer to note 3 of the Company’s consolidated interim financial statements.
RISKS AND UNCERTAINTIES
Readers of this MD&A should consider the information included or incorporated by reference in this document and the Company’s consolidated interim financial statements and related notes for the three and six months ended June 30, 2022. The nature of the Company’s activities and the locations in which it operates mean that the Company’s business generally is exposed to significant risk factors, known and unknown, many of which are beyond its control. Managing these risks is a key component of the Company’s business strategy and is supported by a risk management culture and an effective enterprise risk management (“ERM”) system. The Company’s view of risks is not static. An important component of the ERM approach is to ensure key risks which are evolving or emerging are appropriately identified, managed and incorporated into existing ERM assessment, measurement, monitoring and reporting processes.
The principal risks and uncertainties to the Company’s business, financial condition, and results of operations that were identified by management as new or elevated in the second quarter 2022 are described above under "Market Risk" and below. Readers are cautioned that no ERM framework or system can ensure that all risks to the Company, at any point in time, are accurately identified, assessed, managed or effectively controlled and mitigated. As such, there may be additional new or elevated risks to the Company in the second quarter 2022 that are not described above under “Market Risk” or below.
IAMGOLD CORPORATION Second Quarter 2022 Management’s Discussion and Analysis | 30 | ||||
For a comprehensive discussion of the risk factors that may affect the Company, its business operations and financial performance, refer to the risk disclosure contained in each of the Company’s annual information form dated February 23, 2022 ("AIF") and supplemented by the consolidated financial statements and the MD&A for the quarter-ended March 31, 2022, as filed with Canadian securities regulatory authorities at www.sedar.com and filed under Form 40-F with the United States Securities Exchange Commission at www.sec.gov, which is hereby incorporated by reference herein.
Security
Based on recent militant activity, the security environment remains volatile in the Sahel region of Burkina Faso, particularly where the Company’s Essakane mine is located. As a result, the Company believes there is an elevated risk to its operations, assets and personnel in the region for the foreseeable future. Supply chains and transit routes on national roads leading to and from the mine site remain particularly exposed to elevated risks of militant attacks. The Company continues to adjust its operating activities in response to the prevailing security situation as the safety and security of the Company’s personnel and physical assets are of paramount concern. An actual, potential or threatened terrorist attack on the Essakane mine and/or personnel and/or supplies on travel routes could have a material adverse effect on the Company’s business, operations, and financial condition.
Liquidity
The Company’s share of remaining costs to complete construction and bring Côté Gold into production increased and will result in the Company requiring additional financing, in addition to its existing Credit Facility to complete the construction of Côté Gold. The availability of capital to the Company and the cost of capital are subject to general economic conditions and lender and investor interest in the Company and its projects. The cost of capital has increased in recent months due to the ongoing conflict in Ukraine and related inflationary and market pressures. There can be no certainty that the Company will be successful in obtaining additional financing arrangements or any extension of or amendments to its current financing arrangements on terms and/or conditions that are favourable to the Company, or at all. Failure to obtain the financing necessary to execute the Company’s capital expenditure plans may result in a delay or indefinite postponement of exploration, development or production at any or all of the Company’s properties including the development of Côté Gold. A significant increase in the level of indebtedness of the Company could potentially have adverse consequences, including on the Company’s ability to repay its obligations and there can be no assurance that it will be able to continue to do so. If an event of default under the Credit Facility occurs, the Company would be unable to draw down further on the Credit Facility and the lenders could elect to declare all principal amounts outstanding thereunder at such time, together with accrued interest, to be immediately due. An event of default under the Credit Facility may also give rise to an event of default under existing and future debt/financing agreements and, in such event, the Company may not have sufficient funds to repay amounts owing under such agreements. The inability of the Company to increase its liquidity and capital resources could have a material adverse effect on its business, financial condition and results of operations.
Asset Valuations
At the end of each reporting period, in accordance with IFRS, the Company reviews the carrying amount of its property, plant and equipment, exploration and evaluation assets and cash generating units ("CGUs") to determine whether there is any indication of impairment or reversal of previously recognized impairment. When an indicator is identified, the Company will perform an impairment test. An impairment test requires the Company to determine the recoverable amount of the CGU. The recoverable amount is determined as the higher of the CGU’s fair value less costs of disposal and value-in-use. If the carrying amount of the CGU exceeds its recoverable amount, an impairment charge is recorded against long-lived assets in the CGU.
Should the Company execute some or all of the potential alternatives to defer or reduce its capital spending and various other expenditures as part of its financing plans (see “Liquidity and Capital resources - Liquidity Outlook”), the Company will have to perform a further assessment to determine if there is an indicator of impairment resulting from these plant.
Management uses various assumptions and estimates to determine the recoverable amount of a CGU which are subject to risks and uncertainties, particularly in market conditions where higher volatility exists, and may be partially or totally outside of the Company’s control. Therefore, it is reasonably possible that changes could occur with evolving economic and market conditions, which may affect the fair value of the Company’s property, plant and equipment, exploration and evaluation assets and CGUs resulting in either an impairment charge or reversal of previously recognized impairment. Certain of management’s assumptions and estimates may be subjective and it is possible that actual future cash flows could be significantly different than those estimated
NON-GAAP1 FINANCIAL MEASURES
The Company uses certain non-GAAP financial measures in its MD&A which are described in the following section. The Company believes that, in addition to conventional financial measures prepared in accordance with IFRS, certain investors use these non-GAAP financial measures to assess the performance of the Company. These non-GAAP financial measures do not have any standardized meaning prescribed by IFRS, may not be comparable to similar measures presented by other companies and should not be considered in isolation or as a substitute for measures of performance prepared in accordance with IFRS. The definitions of these measures, the reconciliation to the amounts presented in the interim consolidated interim financial statements, and the reasons for the presentation of these measures are included below. The non-GAAP financial measures are consistent with those presented previously and there have been no changes to the basis of calculation, except for the change to the presentation of cash cost per ounce sold described in more detail below.
__________________________
1.GAAP - Generally accepted accounting principles.
IAMGOLD CORPORATION Second Quarter 2022 Management’s Discussion and Analysis | 31 | ||||
Average Realized Gold Price per Ounce Sold
Average realized gold price per ounce sold is intended to enable management to understand the average realized price of gold sold in each reporting period after removing the impact of non-gold revenues and by-product credits, which, in the Company's case, are not significant and to enable investors to understand the Company’s financial performance based on the average realized proceeds of selling gold production in the reporting period.
| ($ millions, except where noted) | Q2 2022 | Q1 2022 | Q2 2021 | YTD 2022 | YTD 2021 | ||||||||||||
| Revenues | $ | 334.0 | $ | 356.6 | $ | 265.6 | $ | 690.6 | $ | 563.0 | |||||||
| By-product credits and other revenues | (0.9) | (1.0) | (0.2) | (1.9) | (0.6) | ||||||||||||
| Revenues | $ | 333.1 | $ | 355.6 | $ | 265.4 | $ | 688.7 | $ | 562.4 | |||||||
| Sales (000s oz) – 100% | 185 | 196 | 147 | 381 | 314 | ||||||||||||
Average realized gold price per ounce1,2,3 ($/oz) | $ | 1,799 | $ | 1,813 | $ | 1,800 | $ | 1,806 | $ | 1,788 | |||||||
1.Average realized gold price per ounce sold may not be calculated based on amounts presented in this table due to rounding.
2.Average realized gold price per ounce sold is calculated based on sales from the Company's Westwood, Rosebel and Essakane mines.
3.Average realized gold price per ounce sold includes 37,500 ounces at $1,500 per ounce as delivered in accordance with the 2019 Prepay Arrangement.
Cash Costs, Cash Costs per Ounce Sold, AISC and AISC per Ounce Sold
The Company reports cash costs, cash costs per ounce sold, AISC and AISC per ounce sold in order to provide investors with information about key measures used by management to monitor performance of mine sites in commercial production and its ability to generate positive cash flow.
Cash costs include mine site operating costs such as mining, processing, administration, royalties, production taxes and realized derivative gains or losses, exclusive of depreciation, reclamation, capital expenditures and exploration and evaluation costs. AISC include cost of sales exclusive of depreciation expense, sustaining capital expenditures, which are required to maintain existing operations, capitalized exploration, sustaining lease principal payments, environmental rehabilitation accretion and depreciation, by-product credits and corporate general and administrative costs. These costs are then divided by the Company’s attributable gold ounces sold by mine sites in commercial production in the period to arrive at the cash costs per ounce sold and the AISC per ounce sold. The Company reports the AISC measure with and without a deduction for by-product credits and reports the measure for the Essakane, Rosebel and Westwood mines.
Prior to the first quarter 2022, for cash costs, the Company excluded costs related to certain taxes and permits, provisions, prior period operating costs and community development. Commencing with the first quarter 2022, these costs are no longer excluded. These changes have been completed in order to better align with peer companies. All comparative periods have been restated and updated accordingly.
The following table provides a reconciliation of cash costs and cash costs per ounce sold on an attributable basis to cost of sales as per the consolidated interim financial statements.
| ($ millions, except where noted) | Q2 2022 | Q1 2022 | Q2 2021 | YTD 2022 | YTD 2021 | ||||||||||||
Cost of sales1 | $ | 284.6 | $ | 275.6 | $ | 237.7 | $ | 560.2 | $ | 490.9 | |||||||
Depreciation expense1 | (78.1) | (75.0) | (69.7) | (153.1) | (143.7) | ||||||||||||
Cost of sales1, excluding depreciation expense | $ | 206.5 | $ | 200.6 | $ | 168.0 | $ | 407.1 | $ | 347.2 | |||||||
| Adjust for: | |||||||||||||||||
Stockpiles and finished goods adjustment | (1.1) | (2.6) | — | (3.7) | — | ||||||||||||
Other mining costs2 | (0.9) | (1.0) | (0.3) | (1.9) | (0.7) | ||||||||||||
Cost attributed to non-controlling interests2 | (13.4) | (13.4) | (13.1) | (26.8) | (27.3) | ||||||||||||
| Cash costs – attributable | $ | 191.1 | $ | 183.6 | $ | 154.6 | $ | 374.7 | $ | 319.2 | |||||||
Total gold sales3 (000 oz) – attributable | 170 | 181 | 135 | 351 | 288 | ||||||||||||
Cash costs4 ($/oz sold) – attributable | $ | 1,119 | $ | 1,017 | $ | 1,149 | $ | 1,066 | $ | 1,108 | |||||||
1.As per note 27 of the consolidated interim financial statements for cost of sales and depreciation expense.
2.Adjustments for the consolidation of Essakane (90%) and Rosebel (95%) to their attributable portion of cost of sales.
3.Consists of Essakane, Rosebel and Westwood on an attributable basis of 90%, 95% and 100%, respectively.
4.Cash costs per ounce sold may not be calculated based on amounts presented in this table due to rounding.
IAMGOLD CORPORATION Second Quarter 2022 Management’s Discussion and Analysis | 32 | ||||
The following table provides a reconciliation of AISC and AISC per ounce sold on an attributable basis to cost of sales as per the consolidated interim financial statements.
| ($ millions, attributable, except where noted) | Q2 2022 | Q1 2022 | Q2 2021 | YTD 2022 | YTD 2021 | ||||||||||||
Cost of sales1 | $ | 284.6 | $ | 275.6 | $ | 237.7 | $ | 560.2 | $ | 490.9 | |||||||
Depreciation expense1 | (78.1) | (75.0) | (69.7) | (153.1) | (143.7) | ||||||||||||
Cost of sales1, excluding depreciation expense | $ | 206.5 | $ | 200.6 | $ | 168.0 | $ | 407.1 | $ | 347.2 | |||||||
| Adjust for: | |||||||||||||||||
Sustaining capital expenditures1 | 67.1 | 76.6 | 23.9 | 143.7 | 37.6 | ||||||||||||
Corporate general and administrative costs2 | 14.4 | 12.9 | 11.3 | 27.3 | 20.2 | ||||||||||||
| Stockpiles and finished goods adjustment | (1.1) | (2.6) | — | (3.7) | — | ||||||||||||
Other costs3 | 5.3 | 0.7 | 3.3 | 6.0 | 6.7 | ||||||||||||
Cost attributable to non-controlling interests4 | (18.2) | (19.2) | (15.1) | (37.4) | (30.4) | ||||||||||||
| AISC – attributable | $ | 274.0 | $ | 269.0 | $ | 191.4 | $ | 543.0 | $ | 381.3 | |||||||
Total gold sales5 (000s oz) – attributable | 170 | 181 | 135 | 351 | 288 | ||||||||||||
AISC6 ($/oz sold) – attributable | $ | 1,604 | $ | 1,490 | $ | 1,422 | $ | 1,545 | $ | 1,324 | |||||||
AISC excluding by-product credits6 ($/oz sold) – attributable | $ | 1,609 | $ | 1,495 | $ | 1,424 | $ | 1,550 | $ | 1,326 | |||||||
1.As per note 27 of the consolidated interim financial statements for cost of sales and depreciation expense.
2.Corporate general and administrative costs exclude depreciation expense.
3.Other costs include sustaining lease principal payments, environmental rehabilitation accretion and depletion, prior period operating costs, partially offset by by-product credits.
4.Adjustments for the consolidation of Essakane (90%) and Rosebel (95%) to their attributable portion of cost of sales.
5.Consists of Essakane, Rosebel and Westwood on an attributable basis of 90%, 95% and 100%, respectively.
6.AISC per ounce sold may not be calculated based on amounts presented in this table due to rounding.
The Company presents its sustaining capital expenditures in its AISC to reflect the capital related to producing and selling gold from its mine operations. The distinctions between sustaining and expansion capital used by the Company align with the guidelines set out by the World Gold Council. Expansion capital is capital expenditures incurred at new projects and capital expenditures related to major projects or expansion at existing operations where these projects will materially benefit the operations. Starting in 2022, a higher portion of stripping costs are categorized as sustaining capital versus expansion capital, due to the particular areas that are scheduled to be mined and the stage of the life of mine aligning with Word Gold Council guidelines. This non-GAAP financial measure provides investors with transparency regarding the capital expenditures required to support the ongoing operations at its mines, relative to its total capital expenditures.
| ($ millions, except where noted) | Q2 2022 | Q1 2022 | Q2 2021 | YTD 2022 | YTD 2021 | ||||||||||||
| Capital expenditures for property, plant and equipment | $ | 255.7 | $ | 168.3 | $ | 151.9 | $ | 424.0 | $ | 253.8 | |||||||
| Capital expenditures for exploration and evaluation assets | 0.4 | 0.4 | 0.4 | 0.8 | 1.0 | ||||||||||||
| $ | 256.1 | $ | 168.7 | $ | 152.3 | $ | 424.8 | $ | 254.8 | ||||||||
Capital expenditures – sustaining | 67.1 | 76.6 | 23.9 | 143.7 | 37.6 | ||||||||||||
Capital expenditures – expansion | $ | 189.0 | $ | 92.1 | $ | 128.4 | $ | 281.1 | $ | 217.2 | |||||||
| ($ millions, except where noted) | Q2 2022 | Q1 2022 | Q2 2021 | YTD 2022 | YTD 2021 | ||||||||||||
| Essakane | $ | 31.1 | $ | 47.7 | $ | 11.3 | $ | 78.8 | $ | 16.7 | |||||||
| Rosebel | 27.7 | 20.5 | 10.5 | 48.2 | 18.1 | ||||||||||||
| Westwood | 8.8 | 7.3 | 2.1 | 16.1 | 2.5 | ||||||||||||
| $ | 67.6 | $ | 75.5 | $ | 23.9 | $ | 143.1 | $ | 37.3 | ||||||||
| Corporate | (0.5) | 1.1 | — | 0.6 | 0.3 | ||||||||||||
Capital expenditures – sustaining | $ | 67.1 | $ | 76.6 | $ | 23.9 | $ | 143.7 | $ | 37.6 | |||||||
IAMGOLD CORPORATION Second Quarter 2022 Management’s Discussion and Analysis | 33 | ||||
| ($ millions, except where noted) | Q2 2022 | Q1 2022 | Q2 2021 | YTD 2022 | YTD 2021 | ||||||||||||
| Essakane | $ | 0.5 | $ | 1.0 | $ | 18.6 | $ | 1.5 | $ | 33.1 | |||||||
| Rosebel | 14.7 | 6.0 | 15.7 | 20.7 | 26.5 | ||||||||||||
| Westwood | 0.7 | 0.5 | 1.2 | 1.2 | 1.8 | ||||||||||||
| $ | 15.9 | $ | 7.5 | $ | 35.5 | $ | 23.4 | $ | 61.4 | ||||||||
Côté Gold (70%) | 169.6 | 78.5 | 84.7 | 248.1 | 133.1 | ||||||||||||
| Boto Gold | 3.5 | 6.1 | 8.2 | 9.6 | 22.7 | ||||||||||||
Capital expenditures – expansion | $ | 189.0 | $ | 92.1 | $ | 128.4 | $ | 281.1 | $ | 217.2 | |||||||
EBITDA and Adjusted EBITDA
EBITDA (earnings before income taxes, depreciation and amortization of finance costs), is an indicator of the Company’s ability to produce operating cash flow to fund working capital needs, service debt obligations and fund capital expenditures.
Adjusted EBITDA represents EBITDA excluding certain impacts such as changes in estimates of asset retirement obligations at closed sites, unrealized (gain) loss on non-hedge derivatives, impairment charges and reversal of impairment charges, write-down of assets and foreign exchange (gain) loss which are non-cash items and certain cash items that are non-recurring or temporary in nature as such items are not indicative of recurring operating performance. Management believes this additional information is useful to investors in understanding the Company’s ability to generate operating cash flow by excluding from the calculation these non-cash amounts and cash amounts that are not indicative of the recurring performance of the underlying operations for the periods presented.
The following table provides a reconciliation of EBITDA and Adjusted EBITDA to the consolidated interim financial statements:
| ($ millions, except where noted) | Q2 2022 | Q1 2022 | Q2 2021 | YTD 2022 | YTD 2021 | ||||||||||||
| Earnings before income taxes | $ | 21.6 | $ | 58.4 | $ | 10.9 | $ | 80.0 | $ | 43.1 | |||||||
| Add: | |||||||||||||||||
| Depreciation | 78.5 | 75.3 | 70.2 | 153.8 | 144.6 | ||||||||||||
| Finance costs | 1.3 | 1.2 | 5.9 | 2.5 | 13.1 | ||||||||||||
| EBITDA | $ | 101.4 | $ | 134.9 | $ | 87.0 | $ | 236.3 | $ | 200.8 | |||||||
| Adjusting items: | |||||||||||||||||
| Unrealized (gain) loss on non-hedge derivatives | 3.4 | (4.9) | (7.1) | (1.5) | (6.7) | ||||||||||||
| Insurance recoveries | — | (1.2) | (10.2) | (1.2) | (10.2) | ||||||||||||
| Write-down of assets | 0.7 | 1.4 | 0.8 | 2.1 | 1.5 | ||||||||||||
| NRV write-down of stockpiles/finished goods | 4.5 | 4.3 | 11.2 | 8.8 | 11.2 | ||||||||||||
| Foreign exchange (gain) loss | 1.4 | 3.4 | (4.0) | 4.8 | (0.7) | ||||||||||||
| Gain on sale of royalties | — | — | (10.2) | — | (45.9) | ||||||||||||
| Restructuring costs | — | — | 1.0 | — | 1.0 | ||||||||||||
| Covid-19 expenses, net of subsidy | — | — | 4.9 | — | 9.4 | ||||||||||||
| Care and maintenance costs at Westwood | — | — | 11.4 | — | 24.5 | ||||||||||||
| Fair value of deferred consideration from sale of Sadiola | (0.4) | (0.4) | — | (0.8) | — | ||||||||||||
| Other | (1.0) | — | — | (1.0) | — | ||||||||||||
| Adjusted EBITDA | $ | 110.0 | $ | 137.5 | $ | 84.8 | $ | 247.5 | $ | 184.9 | |||||||
1.COVID-19 expenses included in operating costs for 2022 financial year.
IAMGOLD CORPORATION Second Quarter 2022 Management’s Discussion and Analysis | 34 | ||||
Adjusted Net Earnings (Loss) Attributable to Equity Holders
Adjusted net earnings attributable to equity holders represents net earnings (loss) attributable to equity holders excluding certain impacts, net of taxes, such as changes in estimates of asset retirement obligations at closed sites, unrealized (gain) loss on non-hedge derivatives and warrants, impairment charges and reversal of impairment charges, write-down of assets and foreign exchange (gain) loss which are non-cash items and certain cash items that are non-recurring or temporary in nature as such items are not indicative of recurring operating performance. This measure is not necessarily indicative of net earnings (loss) or cash flows as determined under IFRS. Management believes this measure better reflects the Company’s performance for the current period and is a better indication of its expected performance in future periods. As such, the Company believes that this measure is useful to investors in assessing the Company’s underlying performance. The following table provides a reconciliation of earnings before income taxes and non-controlling interests as per the consolidated statements of earnings (loss) of $21.6 million, to adjusted net earnings (loss) attributable to equity holders of the Company of $(6.3) million in the second quarter 2022.
| ($ millions, except where noted) | Q2 2022 | Q1 2022 | Q2 2021 | YTD 2022 | YTD 2021 | ||||||||||||
| Earnings (loss) before income taxes and non-controlling interests | $ | 21.6 | $ | 58.4 | $ | 10.9 | $ | 80.0 | $ | 43.1 | |||||||
| Adjusting items: | |||||||||||||||||
| Unrealized (gain) loss on non-hedge derivatives | 3.4 | (4.9) | (7.1) | (1.5) | (6.7) | ||||||||||||
| Insurance recoveries | — | (1.2) | (10.2) | (1.2) | (10.2) | ||||||||||||
| Write-down of assets | 0.7 | 1.4 | 0.8 | 2.1 | 1.5 | ||||||||||||
| NRV write-down of stockpiles/finished goods | 5.2 | 5.3 | 11.2 | 10.5 | 11.2 | ||||||||||||
| Foreign exchange (gain) loss | 1.4 | 3.4 | (4.0) | 4.8 | (0.7) | ||||||||||||
| Gain on sale of royalties | — | — | (10.2) | — | (45.9) | ||||||||||||
| Restructuring costs | — | — | 1.0 | — | 1.0 | ||||||||||||
| Covid-19 expenses, net of subsidy | — | — | 4.9 | — | 9.4 | ||||||||||||
| Care and maintenance costs at Westwood | — | — | 11.4 | — | 24.5 | ||||||||||||
| Fair value of deferred consideration from sale of Sadiola | (0.4) | (0.4) | — | (0.8) | — | ||||||||||||
| Other | (1.0) | — | — | (1.0) | — | ||||||||||||
| Adjusted earnings before income taxes and non-controlling interests | $ | 30.9 | $ | 62.0 | $ | 8.7 | $ | 92.9 | $ | 27.2 | |||||||
| Income taxes | (25.1) | (26.6) | (11.2) | (51.7) | (21.7) | ||||||||||||
| Tax on foreign exchange translation of deferred income tax balances | (6.4) | (0.4) | (1.5) | (6.8) | (2.0) | ||||||||||||
| Tax impact of adjusting items | 0.4 | (0.9) | 4.6 | (0.5) | 5.5 | ||||||||||||
| Non-controlling interests | (6.1) | (8.0) | (4.2) | (14.1) | (6.4) | ||||||||||||
| Adjusted net earnings (loss) attributable to equity holders | $ | (6.3) | $ | 26.1 | $ | (3.6) | $ | 19.8 | $ | 2.6 | |||||||
| Adjusted net earnings (loss) per share attributable to equity holders | $ | (0.01) | $ | 0.05 | $ | (0.01) | $ | 0.04 | $ | 0.01 | |||||||
| Basic weighted average number of common shares outstanding (millions) | 478.9 | 477.6 | 476.6 | 478.3 | 476.2 | ||||||||||||
1.COVID-19 expenses included in operating costs for 2022 financial year.
IAMGOLD CORPORATION Second Quarter 2022 Management’s Discussion and Analysis | 35 | ||||
Net Cash from Operating Activities before Changes in Working Capital
The Company makes reference to net cash from operating activities before changes in working capital which is calculated as net cash from operating activities less non-cash working capital items and non-current ore stockpiles. Working capital can be volatile due to numerous factors, including a build-up or reduction of inventories. Management believes that this non-GAAP measure, which excludes these non-cash items, provides investors with the ability to better evaluate the operating cash flow performance of the Company.
The following table provides a reconciliation of net cash from operating activities before changes in working capital to net cash from operating activities:
| ($ millions, except where noted) | Q2 2022 | Q1 2022 | Q2 2021 | YTD 2022 | YTD 2021 | ||||||||||||
| Net cash from operating activities | $ | 81.9 | $ | 142.3 | $ | 37.3 | $ | 224.2 | $ | 139.0 | |||||||
| Adjusting items from non-cash working capital items and non-current ore stockpiles | |||||||||||||||||
| Receivables and other current assets | 8.9 | (1.7) | 6.0 | 7.2 | (25.7) | ||||||||||||
| Inventories and non-current ore stockpiles | 17.7 | (17.6) | 23.3 | 0.1 | 22.9 | ||||||||||||
| Accounts payable and accrued liabilities | (14.6) | 10.9 | (11.7) | (3.7) | 1.2 | ||||||||||||
| Net cash from operating activities before changes in working capital | $ | 93.9 | $ | 133.9 | $ | 54.9 | $ | 227.8 | $ | 137.4 | |||||||
Mine-Site Free Cash Flow
Mine-site free cash flow is calculated as cash flow from mine-site operating activities less mine-site related property, plant and equipment expenditures. The Company believes this measure is useful to investors in assessing the Company's ability to operate its mine sites without reliance on additional borrowing or usage of existing cash.
| ($ millions, except where noted) | Q2 2022 | Q1 2022 | Q2 2021 | YTD 2022 | YTD 2021 | ||||||||||||
| Net cash from operating activities | $ | 81.9 | $ | 142.3 | $ | 37.3 | $ | 224.2 | $ | 139.0 | |||||||
| Add: | |||||||||||||||||
| Operating cash flow used by non-mine site activities | 44.4 | 28.2 | 24.0 | 72.6 | 51.1 | ||||||||||||
| Cash flow from operating mine-sites | $ | 126.3 | $ | 170.5 | $ | 61.3 | $ | 296.8 | $ | 190.1 | |||||||
| Capital expenditures | $ | 256.1 | $ | 168.7 | $ | 152.3 | $ | 424.8 | $ | 254.8 | |||||||
| Less: | |||||||||||||||||
| Capital expenditures from construction and development projects and corporate | (172.6) | (85.7) | (92.9) | (258.3) | (156.1) | ||||||||||||
| Capital expenditures from operating mine-sites | $ | 83.5 | $ | 83.0 | $ | 59.4 | $ | 166.5 | $ | 98.7 | |||||||
| Mine-site free cash flow | $ | 42.8 | $ | 87.5 | $ | 1.9 | $ | 130.3 | $ | 91.4 | |||||||
Liquidity and Net Cash (Debt)
Liquidity is defined as cash and cash equivalents, short-term investments and the credit available under the Credit Facility. Net cash (debt) is calculated as cash, cash equivalents and short-term investments less long-term debt, lease liabilities and the drawn portion of the Credit Facility. The Company believes this measure provides investors with additional information regarding the liquidity position of the Company.
| June 30 | March 31 | December 31 | |||||||||
| ($ millions, except where noted) | 2022 | 2022 | 2021 | ||||||||
| Cash and cash equivalents | $ | 451.1 | $ | 519.5 | $ | 544.9 | |||||
| Short-term investments | 1.8 | 4.9 | 7.6 | ||||||||
| Available Credit Facility | 348.7 | 498.2 | 498.3 | ||||||||
| Liquidity | $ | 801.6 | $ | 1,022.6 | $ | 1,050.8 | |||||
| June 30 | March 31 | December 31 | |||||||||
| ($ millions, except where noted) | 2022 | 2022 | 2021 | ||||||||
| Cash and cash equivalents | $ | 451.1 | $ | 519.5 | $ | 544.9 | |||||
| Short-term investments | 1.8 | 4.9 | 7.6 | ||||||||
| Lease liabilities | (62.0) | (62.5) | (65.6) | ||||||||
Long-term debt1 | (614.7) | (466.6) | (468.9) | ||||||||
| Drawn letters of credit issued under Credit Facility | (1.3) | (1.8) | (1.7) | ||||||||
| Net cash (debt) | $ | (225.1) | $ | (6.5) | $ | 16.3 | |||||
1.Includes principal amount of the Notes of $450.0 million, Credit Facility of $150.0 million and equipment loans of $14.7 million (March 31, 2022 - $450 million, $nil and $16.6 million, respectively and December 31, 2021 - $450 million, $nil and $18.9 million, respectively). Excludes deferred transaction costs and embedded derivative on the Notes.
IAMGOLD CORPORATION Second Quarter 2022 Management’s Discussion and Analysis | 36 | ||||
CAUTIONARY STATEMENT ON FORWARD-LOOKING INFORMATION
All information included in this MD&A, including any information as to the Company’s future financial or operating performance and other statements that express management’s expectations or estimates of future performance, including statements in respect of the prospects and/or development of the Company’s projects, other than statements of historical fact, constitutes forward-looking information or forward-looking statements within the meaning of applicable securities laws (collectively referred to herein as “forward-looking statements”) and such forward-looking statements are based on expectations, estimates and projections as of the date of this MD&A. For example, forward-looking statements in this MD&A include, without limitation, those under the headings “Outlook”, “Quarterly Updates”, "Exploration", “Liquidity and Capital Resources” and "Market Trends" and include, but are not limited to, statements with respect to: the estimation of mineral reserves and mineral resources and the realization of such estimates; operational and financial performance including the Company’s guidance for and actual results of production, costs and capital and other expenditures such as exploration and including depreciation expense and effective tax rate; the updated costs and schedule to complete construction of the Côté Gold project; the updated LOM plan, ramp up assumptions and other project metrics including operating costs in the 2022 Technical Report; expected benefits from the operational improvements and de-risking strategies implemented or to be implemented by the Company; mine development activities; the Company's capital allocation; the composition of the Company’s portfolio of assets including its operating mines, development and exploration projects; requirements for additional capital and the ability to achieve the successful completion of one or more financing alternatives; the implementation of a fully funded financing plan to facilitate the completion of the construction of the Côté Gold project on the updated schedule and costs estimates; the conclusion of one or more of the ongoing strategic evaluation processes; the completion of sales of one or more of the Company’s assets or an interest therein; permitting timelines and the expected receipt of permits; the impacts of COVID-19; the impacts of the war in Ukraine; inflation; global supply chain constraints; the ability to secure alternative sources of consumables of comparable quality and on reasonable terms; workforce and contractor availability, labour costs and other labour impacts including arising from expected collective bargaining processes and arrangements; the impacts of weather; the future price of gold and other commodities; foreign exchange rates and currency fluctuations; impairment assessments and assets carrying values estimates; safety and security concerns in the jurisdictions in which the Company operates and the impact thereof on the Company’s operational and financial performance and financial condition; and government regulation of mining operations. Forward-looking statements are generally identifiable by the use of words such as “may”, “will”, “should”, “continue”, “expect”, "budget", "forecast", “anticipate”, “estimate”, “believe”, “intend”, “plan”, "schedule", “guidance”, “outlook”, “potential”, "transformational", "best-in-class", "top-tier", “seek”, “targets”, "suspended", "superior return(s)", "superior shareholder return(s)", "cover", “strategy”, "superior" or “project” or the negative of these words or other variations on these words or comparable terminology.
The Company cautions the reader that forward-looking statements are necessarily based upon a number of estimates and assumptions that, while considered reasonable by management, are inherently subject to significant business, financial, operational and other risks, uncertainties, contingencies and other factors, including those described below, which could cause actual results, performance or achievements of the Company to be materially different from results, performance or achievements expressed or implied by such forward-looking statements and, as such, undue reliance must not be placed on them. Forward-looking statements are also based on numerous material factors and assumptions, including as described in this MD&A, including with respect to: the Company's present and future business strategies; operations performance within expected ranges; anticipated future production and cash flows; local and global economic conditions and the environment in which the Company will operate in the future; the price of gold, copper, silver and other key commodities; projected mineral grades; international exchanges rates; anticipated capital and operating costs; the availability and timing of required governmental and other approvals for the construction of the Company's projects.
Risks, uncertainties, contingencies and other factors that could cause actual results, performance or achievements of the Company to be materially different from results, performance or achievements expressed or implied by such forward-looking statements include, without limitation: the Company's business strategies; political and legal risks; the ongoing impacts of COVID-19 (and its variants) and the war in Ukraine on the Company and its workforce, the availability of labour and contractors, key inputs for the Company and global supply chains; the volatility of the Company's securities; litigation; contests over title to properties, particularly title to undeveloped properties; mine closure and rehabilitation risks; management of certain of the Company's assets by other companies or joint venture partners; the lack of availability of insurance covering all of the risks associated with a mining company's operations; business risks, including pandemics, adverse environmental conditions and hazards; unexpected geological conditions; potential shareholder dilution; potential activist engagements; increasing competition in the mining sector; ability to successfully integrate acquired assets; the profitability of the Company being highly dependent on the condition and results of the mining industry as a whole, and the gold mining industry in particular; changes in the global prices for gold, copper, silver or certain other commodities (such as diesel and electricity); consolidation in the gold mining industry; legal, litigation, legislative, political or economic risks and new developments in the jurisdictions in which the Company carries on business; government actions taken in response to COVID-19, including new variants of COVID-19, and any worsening thereof; changes in taxes, including mining tax regimes; the failure to obtain in a timely manner from authorities key permits, authorizations or approvals necessary for exploration, development or operation, operating or technical difficulties in connection with mining or development activities, including geotechnical difficulties and major equipment failure, such as a conveyor belt breakdown; seismicity, such as the seismic event that occurred at Westwood mine on October 30, 2020; the inability to participate in any gold price increase above the cap in any collar transaction entered into in conjunction with a gold sale prepayment arrangement; the availability of capital; the level of liquidity and capital resources; access to capital markets and financing; the Company's level of indebtedness; the Company's ability to satisfy covenants under its credit facilities; movements in interest rates; adverse changes in the Company’s credit rating; the Company's choices in capital allocation; effectiveness of the Company's ongoing cost containment efforts; the ability to execute on the Company's de-risking activities and measures to
IAMGOLD CORPORATION Second Quarter 2022 Management’s Discussion and Analysis | 37 | ||||
improve operations; risks related to third-party contractors, including reduced control over aspects of the Company's operations and/or the failure and/or the effectiveness of contractors to perform; risks arising from holding derivative instruments; changes in U.S. dollar and other currency exchange rates, interest rates or gold lease rates; capital and currency controls in foreign jurisdictions; assessment of carrying values for the Company’s assets, including the ongoing potential for material impairment and/or write-downs of such assets; the speculative nature of exploration and development, including the risks of diminishing quantities or grades of reserves; the fact that reserves and resources, expected metallurgical recoveries, capital and operating costs are estimates which may require revision; the presence of unfavourable content in ore deposits, including clay and coarse gold; inaccuracies in life of mine plans; failure to meet operational targets; equipment malfunctions; security risks, including civil unrest, war or terrorism and disruptions to the Company’s supply chain as a result of such security risks; information systems security threats and cybersecurity; laws and regulations governing the protection of the environment; employee relations and labour disputes; the maintenance of tailings storage facilities and the potential for a major spill or failure of the tailings facilities due to uncontrollable events, such as extreme weather or seismic events; potential for failure of the hydrostatic plug at the Westwood mine; lack of reliable infrastructure, including access to roads, bridges, power sources and water supplies; physical and regulatory risks related to climate change; unpredictable weather patterns and challenging weather at mine sites, such as the unusual levels of rain at the Rosebel mine in 2021 and 2022; attraction and retention of key employees and other qualified personnel; availability and increasing costs associated with mining inputs and labour, negotiations with respect to new, reasonable collective labour agreements may not be agreed to; the availability of qualified contractors and the ability of contractors to timely complete projects on acceptable terms; the relationship with the communities surrounding the Company's operations and projects; indigenous rights or claims; illegal mining; the potential direct or indirect operational impacts resulting from external factors, including infectious diseases or pandemics, such as the COVID-19 outbreak, or adverse weather conditions; and the inherent risks involved in the exploration, development and mining business generally. Please see the Company’s AIF or Form 40-F available on www.sedar.com or www.sec.gov/edgar.shtml for a comprehensive discussion of the risks faced by the Company and which may cause actual results, performance or achievements of the Company to be materially different from results, performance or achievements expressed or implied by forward-looking statements.
Although the Company has attempted to identify important factors that could cause actual results to differ materially from those contained in forward-looking statements, there may be other factors that cause results not to be as anticipated, estimated or intended. The Company disclaims any intention or obligation to update or revise any forward-looking statements whether as a result of new information, future events or otherwise except as required by applicable law.
IAMGOLD CORPORATION Second Quarter 2022 Management’s Discussion and Analysis | 38 | ||||
UNAUDITED CONDENSED CONSOLIDATED
INTERIM FINANCIAL STATEMENTS
As at and for the Three and Six Months Ended June 30, 2022
| INDEX | |||||
| Consolidated statements of earnings (loss) | |||||
| Consolidated statements of comprehensive income (loss) | |||||
| Consolidated statements of cash flows | |||||
| Consolidated balance sheets | |||||
| Consolidated statements of changes in equity | |||||
| Notes to condensed consolidated interim financial statements | 45 to 64 | ||||
IAMGOLD CORPORATION Unaudited Condensed Consolidated Interim Financial Statements – June 30, 2022 | 39 | ||||
| CONSOLIDATED STATEMENTS OF EARNINGS (LOSS) | |||||||||||||||||
| (Unaudited) | Three months ended June 30 | Six months ended June 30 | |||||||||||||||
| (In millions of U.S. dollars, except per share amounts) | Notes | 2022 | 2021 | 2022 | 2021 | ||||||||||||
| Revenues | $ | 334.0 | $ | 265.6 | $ | 690.6 | $ | 563.0 | |||||||||
| Cost of sales | 4 | 284.6 | 237.7 | 560.2 | 490.9 | ||||||||||||
| Gross profit | 49.4 | 27.9 | 130.4 | 72.1 | |||||||||||||
| General and administrative expenses | (17.2) | (11.8) | (32.3) | (21.2) | |||||||||||||
| Exploration expenses | (9.3) | (12.0) | (17.5) | (19.6) | |||||||||||||
| Other income (expenses) | 5 | 1.4 | (19.3) | (2.7) | (39.5) | ||||||||||||
| Earnings (loss) from operations | 24.3 | (15.2) | 77.9 | (8.2) | |||||||||||||
| Finance costs | 6 | (1.3) | (5.9) | (2.5) | (13.1) | ||||||||||||
| Foreign exchange gain (loss) | (1.4) | 4.0 | (4.8) | 0.7 | |||||||||||||
| Interest income, derivatives and other investment gains (losses) | 7 | — | 28.0 | 9.4 | 63.7 | ||||||||||||
| Earnings before income taxes | 21.6 | 10.9 | 80.0 | 43.1 | |||||||||||||
| Income taxes | 8 | (25.1) | (11.2) | (51.7) | (21.7) | ||||||||||||
| Net earnings (loss) | $ | (3.5) | $ | (0.3) | $ | 28.3 | $ | 21.4 | |||||||||
| Net earnings (loss) attributable to | |||||||||||||||||
| Equity holders | $ | (9.6) | $ | (4.5) | $ | 14.2 | $ | 15.0 | |||||||||
| Non-controlling interests | 6.1 | 4.2 | 14.1 | 6.4 | |||||||||||||
| Net earnings (loss) | $ | (3.5) | $ | (0.3) | $ | 28.3 | $ | 21.4 | |||||||||
| Attributable to equity holders | |||||||||||||||||
| Weighted average number of common shares outstanding (in millions) | |||||||||||||||||
| Basic | 9 | 478.9 | 476.6 | 478.3 | 476.2 | ||||||||||||
| Diluted | 9 | 478.9 | 476.6 | 482.5 | 481.2 | ||||||||||||
| Basic and diluted earnings (loss) per share | 9 | $ | (0.02) | $ | (0.01) | $ | 0.03 | $ | 0.03 | ||||||||
The accompanying notes are an integral part of these unaudited condensed consolidated interim financial statements.
IAMGOLD CORPORATION Unaudited Condensed Consolidated Interim Financial Statements – June 30, 2022 | 40 | ||||
| CONSOLIDATED STATEMENTS OF COMPREHENSIVE INCOME (LOSS) | |||||||||||||||||
| (Unaudited) | Three months ended June 30 | Six months ended June 30 | |||||||||||||||
| (In millions of U.S. dollars) | Notes | 2022 | 2021 | 2022 | 2021 | ||||||||||||
| Net earnings (loss) | $ | (3.5) | $ | (0.3) | $ | 28.3 | $ | 21.4 | |||||||||
| Other comprehensive income (loss), net of income taxes | |||||||||||||||||
| Items that will not be reclassified to the statements of earnings (loss) | |||||||||||||||||
| Movement in marketable securities fair value reserve | |||||||||||||||||
| Net unrealized change in fair value of marketable securities | (7.2) | (0.5) | (6.3) | (3.3) | |||||||||||||
| Net realized change in fair value of marketable securities | 0.1 | 0.2 | 0.4 | 0.2 | |||||||||||||
| Tax impact | 0.1 | 0.1 | 0.1 | 0.4 | |||||||||||||
| (7.0) | (0.2) | (5.8) | (2.7) | ||||||||||||||
| Items that may be reclassified to the statements of earnings (loss) | |||||||||||||||||
| Movement in cash flow hedge fair value reserve | |||||||||||||||||
| Effective portion of changes in fair value of cash flow hedges | 23(b)(i) | 14.3 | 8.8 | 60.5 | 46.6 | ||||||||||||
| Time value of options contracts excluded from hedge relationship | 23(b)(i) | 8.8 | 9.4 | (9.2) | 8.1 | ||||||||||||
| Net change in fair value of cash flow hedges reclassified to the statements of earnings (loss) | 23(b)(ii) | (11.5) | (2.5) | (20.2) | (3.8) | ||||||||||||
| Unrealized gain reclassified or adjusted from cash flow hedge reserve due to hedge de-designation | 23(b)(i) | — | — | (1.9) | — | ||||||||||||
| Tax impact | 0.6 | (1.2) | (1.2) | (2.3) | |||||||||||||
| 12.2 | 14.5 | 28.0 | 48.6 | ||||||||||||||
| Currency translation adjustment | — | — | — | (0.7) | |||||||||||||
| 12.2 | 14.5 | 28.0 | 47.9 | ||||||||||||||
| Total other comprehensive income | 5.2 | 14.3 | 22.2 | 45.2 | |||||||||||||
| Comprehensive income | $ | 1.7 | $ | 14.0 | $ | 50.5 | $ | 66.6 | |||||||||
| Comprehensive income attributable to: | |||||||||||||||||
| Equity holders | $ | (4.4) | $ | 9.8 | $ | 36.4 | $ | 60.2 | |||||||||
| Non-controlling interests | 6.1 | 4.2 | 14.1 | 6.4 | |||||||||||||
| Comprehensive income | $ | 1.7 | $ | 14.0 | $ | 50.5 | $ | 66.6 | |||||||||
The accompanying notes are an integral part of these unaudited condensed consolidated interim financial statements.
IAMGOLD CORPORATION Unaudited Condensed Consolidated Interim Financial Statements – June 30, 2022 | 41 | ||||
| CONSOLIDATED STATEMENTS OF CASH FLOWS | |||||||||||||||||
| (Unaudited) | Three months ended June 30 | Six months ended June 30 | |||||||||||||||
| (In millions of U.S. dollars) | Notes | 2022 | 2021 | 2022 | 2021 | ||||||||||||
| Operating activities | |||||||||||||||||
| Net earnings (loss) | $ | (3.5) | $ | (0.3) | $ | 28.3 | $ | 21.4 | |||||||||
| Adjustments for non-cash items: | |||||||||||||||||
| Depreciation expense | 78.5 | 73.3 | 153.8 | 152.3 | |||||||||||||
| Deferred revenue recognized | 22 | (48.7) | — | (97.5) | — | ||||||||||||
| Income taxes | 8 | 25.1 | 11.2 | 51.7 | 21.7 | ||||||||||||
| Derivative loss | 23(b), 23(c) | (9.8) | (9.6) | (25.6) | (10.5) | ||||||||||||
| Gain on sale of royalties | 7 | — | (10.2) | — | (45.9) | ||||||||||||
| Insurance recoveries | — | (10.2) | — | (10.2) | |||||||||||||
| Other non-cash items | 10(a) | 16.2 | 16.3 | 24.8 | 30.9 | ||||||||||||
| Adjustments for cash items: | |||||||||||||||||
| Proceeds from gold prepayment | 22 | 59.0 | — | 118.0 | — | ||||||||||||
| Proceeds from insurance claim | 0.7 | 2.5 | 0.7 | 2.5 | |||||||||||||
| Settlement of derivatives | 13.1 | 3.3 | 19.9 | 4.9 | |||||||||||||
| Disbursements related to asset retirement obligations | (0.6) | (0.5) | (1.0) | (1.3) | |||||||||||||
| Movements in non-cash working capital items and non-current ore stockpiles | 10(b) | (12.0) | (17.6) | (3.6) | 1.6 | ||||||||||||
| Cash from operating activities, before income taxes paid | 118.0 | 58.2 | 269.5 | 167.4 | |||||||||||||
| Income taxes paid | (36.1) | (20.9) | (45.3) | (28.4) | |||||||||||||
| Net cash from operating activities | 81.9 | 37.3 | 224.2 | 139.0 | |||||||||||||
| Investing activities | |||||||||||||||||
| Capital expenditures for property, plant and equipment | (255.7) | (151.9) | (424.0) | (253.8) | |||||||||||||
| Capitalized borrowing costs | 6 | (13.9) | (9.2) | (14.7) | (9.6) | ||||||||||||
| Disposal of marketable securities (net) | 2.1 | — | 9.9 | — | |||||||||||||
| Proceeds from sale of royalties | 7 | — | 10.2 | — | 45.9 | ||||||||||||
| Other investing activities | 10(c) | (1.7) | (10.8) | (0.9) | (7.5) | ||||||||||||
| Net cash used in investing activities | (269.2) | (161.7) | (429.7) | (225.0) | |||||||||||||
| Financing activities | |||||||||||||||||
| Proceeds from credit facility | 10(d) | 150.0 | — | 150.0 | — | ||||||||||||
| Interest paid | 6 | — | (6.4) | — | (7.1) | ||||||||||||
| Payment of lease obligations | (5.5) | (4.7) | (10.6) | (9.2) | |||||||||||||
| Dividends paid to non-controlling interests | (11.6) | (1.9) | (11.6) | (6.2) | |||||||||||||
| Proceeds from equipment loan | 10(d) | 0.7 | — | 0.7 | — | ||||||||||||
| Repayment of equipment loans | 10(d) | (1.7) | (2.0) | (3.5) | (3.9) | ||||||||||||
| Common shares issued for cash on exercise of stock options | — | — | 1.0 | — | |||||||||||||
| Other financing activities | (2.0) | (1.0) | (3.6) | (3.8) | |||||||||||||
| Net cash from (used in) financing activities | 129.9 | (16.0) | 122.4 | (30.2) | |||||||||||||
| Effects of exchange rate fluctuation on cash and cash equivalents | (11.0) | 2.3 | (10.7) | (0.4) | |||||||||||||
| Decrease in cash and cash equivalents | (68.4) | (138.1) | (93.8) | (116.6) | |||||||||||||
| Cash and cash equivalents, beginning of the period | 519.5 | 963.0 | 544.9 | 941.5 | |||||||||||||
| Cash and cash equivalents, end of the period | $ | 451.1 | $ | 824.9 | $ | 451.1 | $ | 824.9 | |||||||||
The accompanying notes are an integral part of these unaudited condensed consolidated interim financial statements.
IAMGOLD CORPORATION Unaudited Condensed Consolidated Interim Financial Statements – June 30, 2022 | 42 | ||||
| CONSOLIDATED BALANCE SHEETS | |||||||||||
| (Unaudited) | June 30 | December 31 | |||||||||
(In millions of U.S. dollars) | Notes | 2022 | 2021 | ||||||||
| Assets | |||||||||||
| Current assets | |||||||||||
| Cash and cash equivalents | 11 | $ | 451.1 | $ | 544.9 | ||||||
| Short-term investments | 1.8 | 7.6 | |||||||||
| Receivables and other current assets | 13 | 135.7 | 96.5 | ||||||||
| Inventories | 14 | 334.6 | 302.1 | ||||||||
| 923.2 | 951.1 | ||||||||||
| Non-current assets | |||||||||||
| Property, plant and equipment | 15 | 2,795.4 | 2,587.9 | ||||||||
| Exploration and evaluation assets | 16 | 62.5 | 61.7 | ||||||||
| Restricted cash | 12 | 38.9 | 42.2 | ||||||||
| Inventories | 14 | 89.0 | 124.1 | ||||||||
| Other assets | 17 | 217.0 | 204.6 | ||||||||
| 3,202.8 | 3,020.5 | ||||||||||
| $ | 4,126.0 | $ | 3,971.6 | ||||||||
| Liabilities and Equity | |||||||||||
| Current liabilities | |||||||||||
| Accounts payable and accrued liabilities | $ | 324.0 | $ | 304.4 | |||||||
| Income taxes payable | 40.5 | 29.5 | |||||||||
| Other current liabilities | 18 | 130.3 | 218.9 | ||||||||
| Current portion of lease liabilities | 20.6 | 21.4 | |||||||||
| Current portion of long-term debt | 21 | 7.0 | 7.5 | ||||||||
| 522.4 | 581.7 | ||||||||||
| Non-current liabilities | |||||||||||
| Deferred income tax liabilities | 57.4 | 61.2 | |||||||||
| Provisions | 19 | 387.3 | 470.2 | ||||||||
| Lease liabilities | 41.4 | 44.2 | |||||||||
| Long-term debt | 21 | 605.0 | 456.9 | ||||||||
| Deferred revenue | 22 | 119.1 | — | ||||||||
| Other liabilities | 20 | 43.2 | 40.3 | ||||||||
| 1,253.4 | 1,072.8 | ||||||||||
| 1,775.8 | 1,654.5 | ||||||||||
| Equity | |||||||||||
| Attributable to equity holders | |||||||||||
| Common shares | 25 | 2,726.3 | 2,719.1 | ||||||||
| Contributed surplus | 55.5 | 59.1 | |||||||||
| Accumulated deficit | (548.5) | (562.2) | |||||||||
| Accumulated other comprehensive income | 37.3 | 23.8 | |||||||||
| 2,270.6 | 2,239.8 | ||||||||||
| Non-controlling interests | 79.6 | 77.3 | |||||||||
| 2,350.2 | 2,317.1 | ||||||||||
| Contingencies and commitments | 19(b), 28 | ||||||||||
| $ | 4,126.0 | $ | 3,971.6 | ||||||||
The accompanying notes are an integral part of these unaudited condensed consolidated interim financial statements.
IAMGOLD CORPORATION Unaudited Condensed Consolidated Interim Financial Statements – June 30, 2022 | 43 | ||||
| CONSOLIDATED STATEMENTS OF CHANGES IN EQUITY | |||||||||||
| (Unaudited) | Six months ended June 30 | ||||||||||
| (In millions of U.S. dollars) | Notes | 2022 | 2021 | ||||||||
| Common shares | |||||||||||
| Balance, beginning of the period | $ | 2,719.1 | $ | 2,710.8 | |||||||
| Issuance of common shares for share-based compensation | 25 | 7.2 | 7.0 | ||||||||
| Balance, end of the period | 2,726.3 | 2,717.8 | |||||||||
| Contributed surplus | |||||||||||
| Balance, beginning of the period | 59.1 | 60.6 | |||||||||
| Issuance of common shares for share-based compensation | (7.1) | (7.0) | |||||||||
| Share-based compensation | 3.1 | 3.9 | |||||||||
| Other | 0.4 | (0.5) | |||||||||
| Balance, end of the period | 55.5 | 57.0 | |||||||||
| Accumulated deficit | |||||||||||
| Balance, beginning of the period | (562.2) | (307.9) | |||||||||
| Net earnings attributable to equity holders | 14.2 | 15.0 | |||||||||
| Acquisition of non-controlling interests | (0.5) | — | |||||||||
| Balance, end of the period | (548.5) | (292.9) | |||||||||
| Accumulated other comprehensive income | |||||||||||
| Marketable securities fair value reserve | |||||||||||
| Balance, beginning of the period | (36.0) | (32.2) | |||||||||
| Net change in fair value of marketable securities, net of income taxes | (5.8) | (2.7) | |||||||||
| Balance, end of the period | (41.8) | (34.9) | |||||||||
| Cash flow hedge fair value reserve | |||||||||||
| Balance, beginning of the period | 59.8 | 29.4 | |||||||||
| Net change in fair value and time value of cash flow hedges recognized in property, plant and equipment | 23(b)(ii) | (8.7) | (7.3) | ||||||||
| Net change in fair value of cash flow hedges recognized in other comprehensive income, net of income taxes | 28.0 | 48.6 | |||||||||
| Balance, end of the period | 79.1 | 70.7 | |||||||||
| Currency translation adjustment | |||||||||||
| Balance, beginning of the period | — | (2.5) | |||||||||
| Change for the period | — | (0.7) | |||||||||
| Balance, end of the period | — | (3.2) | |||||||||
| Total accumulated other comprehensive income | 37.3 | 32.6 | |||||||||
| Equity attributable to equity holders | 2,270.6 | 2,514.5 | |||||||||
| Non-controlling interests | |||||||||||
| Balance, beginning of the period | 77.3 | 87.3 | |||||||||
| Acquisition of non-controlling interests | (0.2) | — | |||||||||
| Net earnings attributable to non-controlling interests | 14.1 | 6.4 | |||||||||
| Dividends to non-controlling interests | (11.6) | (9.3) | |||||||||
| Balance, end of the period | 79.6 | 84.4 | |||||||||
| $ | 2,350.2 | $ | 2,598.9 | ||||||||
The accompanying notes are an integral part of these unaudited condensed consolidated interim financial statements.
IAMGOLD CORPORATION Unaudited Condensed Consolidated Interim Financial Statements – June 30, 2022 | 44 | ||||
| NOTES TO CONDENSED CONSOLIDATED INTERIM FINANCIAL STATEMENTS | ||
As at and for the Three and Six Months Ended June 30, 2022 and 2021 | ||
| (Amounts in notes and in tables are in millions of U.S. dollars, except where otherwise indicated) (Unaudited) | ||
1. Corporate Information, Nature of Operations and Liquidity
IAMGOLD Corporation (“IAMGOLD” or the "Company”) is a corporation governed by the Canada Business Corporations Act whose shares are publicly traded on the New York Stock Exchange (NYSE:IAG) and the Toronto Stock Exchange (TSX:IMG). The address of the Company’s registered office is 401 Bay Street, Suite 3200, Toronto, Ontario, Canada, M5H 2Y4.
The Company has three operating mines: Essakane (Burkina Faso), Rosebel (Suriname) and Westwood (Canada), and is building the large-scale, long life Côté Gold project (Canada) which is expected to commence production in early 2024. In addition, the Company has a robust development and exploration portfolio within high potential mining districts in the Americas and West Africa.
The Company is currently incurring significant cash expenditures in developing the Côté Gold project in which it has a 70% interest. The remaining expenditures attributable to the Company to complete the project construction are estimated to be between approximately $1.2 and $1.3 billion from July 1, 2022, net of leases and working capital. Based on the recently updated cost estimate and schedule of construction of the Côté Gold project, information currently available and prevailing market prices, which impact operating cash flows, the Company will require additional liquidity to complete construction of the project and continues to seek to implement a fully funded financing plan by the end of the year and prior to the necessity to make any potential adjustments to the timing of the advancement of the project based on the updated schedule.
The Company is actively pursuing various alternatives to increase its liquidity and capital resources including disposition of one or more of the Company’s assets and/or an interest therein and/or joint-venture partnerships, additional secured debt which could be provided by banks, private capital providers and/or institutional investors, additional unsecured debt including unsecured and/or convertible notes, sales of common shares, the extension of the Company’s 2022 prepay arrangements. In the second quarter 2022, the Company advanced a strategic review process to evaluate options for its Rosebel/Saramacca mining complex, including a potential sale of this complex. In addition, the Company is evaluating strategic alternatives with respect to certain of its development and exploration assets in South America and West Africa (excluding Essakane), that may include the disposition of all or an interest in one or more of such assets.
However, there can be no assurance that the Company will be successful in achieving financing solutions in time and/or on terms acceptable to the Company or that the strategic evaluations discussed above will result in a transaction. In this case and in order to execute its plans for the foreseeable future, including financing alternatives, the Company has developed certain potential alternatives to defer or reduce its capital spending and various other expenditures. These alternatives may impact future operating and financial performance and/or could extend the Côté Gold project construction timeline and significantly increase project costs and/or dilute the Company’s interest in the Côté Gold project. Reductions in capital expenditures at the Côté Gold project requires approval from the Côté unincorporated joint venture (the "Côté UJV") oversight committee.
2. Basis of Preparation
(a) Statement of compliance
These unaudited condensed consolidated interim financial statements ("consolidated interim financial statements") of IAMGOLD and all of its subsidiaries and joint venture as at and for the three and six months ended June 30, 2022, have been prepared in accordance with International Accounting Standards ("IAS") 34, Interim Financial Reporting, and do not include all of the information required for annual consolidated financial statements. Accordingly, certain information and disclosures normally included in annual financial statements prepared in accordance with International Financial Reporting Standards ("IFRS") have been omitted or condensed.
These consolidated interim financial statements should be read in conjunction with IAMGOLD's audited annual consolidated financial statements and related notes as at and for the year ended December 31, 2021.
These consolidated interim financial statements of IAMGOLD were authorized for issue in accordance with a resolution of the board of directors of the Company approved on August 3, 2022.
(b) Basis of measurement
The consolidated interim financial statements have been prepared on a historical cost basis, except for items measured at fair value as discussed in note 24.
(c) Basis of consolidation
The Company's subsidiaries and divisions related to significant properties are consistent with the audited annual consolidated financial statements for the year ended December 31, 2021.
IAMGOLD CORPORATION Unaudited Condensed Consolidated Interim Financial Statements – June 30, 2022 | 45 | ||||
(d) Significant accounting judgments, estimates and assumptions
The preparation of consolidated interim financial statements requires management to make judgments, estimates and assumptions that affect the reported amounts of assets, liabilities and contingent liabilities as at the date of the consolidated interim financial statements and reported amounts of revenues and expenses during the three and six months ended June 30, 2022. The Company’s financing plans and certain other potential alternatives, in the event it does not achieve its financing plans, discussed in Note 1 above and the ability of the Company to execute them involve certain assumptions that represent significant judgement by the Company. Estimates and assumptions are continuously evaluated and are based on management's experience and other factors, including expectations of future events which are believed to be reasonable under the circumstances. Actual results may differ from these estimates.
3. Adoption of New Accounting Standards
IAS 16, Property, Plant and Equipment
The International Accounting Standards Board issued an amendment to IAS 16, Property, Plant and Equipment to prohibit deducting from property, plant and equipment amounts received from selling items produced while preparing an asset for its intended use. Instead, sales proceeds and related costs must be recognized in profit or loss. The amendment requires companies to distinguish between costs associated with producing and selling items before the item of property, plant and equipment is available for use and costs associated with making the item of property, plant and equipment available for its intended use. The Company adopted the amendment effective January 1, 2022 and will recognize any sales proceeds and related costs of producing and selling incidental ounces for the Côté Gold project in the consolidated statements of earnings (loss).
4. Cost of Sales
| Three months ended June 30 | Six months ended June 30 | |||||||||||||
| 2022 | 2021 | 2022 | 2021 | |||||||||||
Operating costs1 | $ | 189.1 | $ | 153.6 | $ | 371.6 | $ | 317.2 | ||||||
| Royalties | 17.4 | 14.4 | 35.5 | 30.0 | ||||||||||
Depreciation expense2 | 78.1 | 69.7 | 153.1 | 143.7 | ||||||||||
| $ | 284.6 | $ | 237.7 | $ | 560.2 | $ | 490.9 | |||||||
1.Operating costs include mine production, transport and smelter costs, and site administrative expenses.
2.Depreciation expense excludes depreciation related to corporate office assets, which is included in general and administrative expenses.
5. Other (Income) Expenses
| Three months ended June 30 | Six months ended June 30 | |||||||||||||
| 2022 | 2021 | 2022 | 2021 | |||||||||||
COVID-19 expenses1 | $ | — | $ | 4.9 | $ | — | $ | 9.4 | ||||||
Care and maintenance costs2 | — | 11.4 | — | 24.5 | ||||||||||
| Write-down of assets | 0.7 | 0.7 | 1.9 | 1.4 | ||||||||||
| Restructuring costs | — | 1.0 | — | 1.0 | ||||||||||
| Other | (2.1) | 1.3 | 0.8 | 3.2 | ||||||||||
| $ | (1.4) | $ | 19.3 | $ | 2.7 | $ | 39.5 | |||||||
1.COVID-19 expenses pertained to incremental costs incurred resulting from the impact of COVID-19 on the operations of the Company, including costs related to incremental labour, transportation, safety and other operational measures and processes implemented to manage the impact of COVID-19. These costs are included in operating costs for the 2022 financial year.
2.Westwood mine was on care and maintenance between October 30, 2020 and June 1, 2021 due to a seismic event.
6. Finance Costs
| Three months ended June 30 | Six months ended June 30 | ||||||||||||||||
| Notes | 2022 | 2021 | 2022 | 2021 | |||||||||||||
Interest expense1 | $ | — | $ | 2.0 | $ | — | $ | 5.5 | |||||||||
| Credit facility fees | 1.3 | 1.4 | 2.5 | 2.7 | |||||||||||||
Accretion expense - gold prepayments1 | 22 | — | 2.5 | — | 4.9 | ||||||||||||
| $ | 1.3 | $ | 5.9 | $ | 2.5 | $ | 13.1 | ||||||||||
1.For the three and six months ended June 30, 2022, interest expense of $8.1 million and $15.6 million and accretion expense for gold prepayments of $2.8 million and $4.9 million, respectively, were capitalized to qualifying assets.
Total interest paid during the three and six months ended June 30, 2022 was $13.9 million and $14.7 million, respectively (three and six months ended June 30, 2021 - $15.6 million and $16.7 million, respectively). Interest paid relates to interest charges on the Company's 5.75% senior notes, credit facility, equipment loans and leases.
IAMGOLD CORPORATION Unaudited Condensed Consolidated Interim Financial Statements – June 30, 2022 | 46 | ||||
7. Interest Income, Derivatives and Other Investment Gains (Losses)
| Three months ended June 30 | Six months ended June 30 | ||||||||||||||||
| Notes | 2022 | 2021 | 2022 | 2021 | |||||||||||||
Gain on sale of royalties1 | $ | — | $ | 10.2 | $ | — | $ | 45.9 | |||||||||
| Interest income | 1.4 | 1.0 | 2.1 | 2.2 | |||||||||||||
| Fair value of deferred consideration from the sale of Sadiola | 0.4 | — | 0.8 | — | |||||||||||||
| Gain (loss) on non-hedge derivatives | 23(c) | (1.6) | 7.1 | 5.5 | 6.7 | ||||||||||||
Insurance recoveries2 | — | 10.2 | 1.2 | 10.2 | |||||||||||||
| Other losses | (0.2) | (0.5) | (0.2) | (1.3) | |||||||||||||
| $ | — | $ | 28.0 | $ | 9.4 | $ | 63.7 | ||||||||||
1.During the first quarter 2021, the Company sold 33 royalties on various non-core exploration and development properties for cash consideration of $35.7 million. The Company recognized a gain of $35.7 million on the sale. During the second quarter 2021, the Company sold 2 royalties for cash consideration of $10.5 million. After transaction costs of $0.3 million, the Company recognized a gain of $10.2 million.
2.During the second quarter 2021, Rosebel Gold Mines received confirmation that a business interruption insurance payment of $10.2 million would be received related to the interruption of its operations in the third quarter 2019. The payment was subsequently received in the third quarter 2021.
8. Income Taxes
The Company estimates the effective tax rates expected to be applied for the full year and uses these rates to determine income tax provisions in interim periods. The impact of changes in judgments and estimates concerning the probable realization of losses, changes in tax rates, and foreign exchange rates are recognized in the interim period in which they occur.
The income tax expense for the three and six months ended June 30, 2022 was $25.1 million and $51.7 million, respectively, (three and six months ended June 30, 2021 - $11.2 million and $21.7 million, respectively) and varied from the income tax expense calculated using the combined Canadian federal and provincial statutory tax rate of 26.5%. The variance was mainly due to fluctuations for the recognition of certain tax benefits and related deferred tax assets and net foreign earnings taxed at different tax rates.
9. Earnings (Loss) Per Share
(a) Basic earnings (loss) per share computation
| Three months ended June 30 | Six months ended June 30 | |||||||||||||
| 2022 | 2021 | 2022 | 2021 | |||||||||||
| Numerator | ||||||||||||||
| Net earnings (loss) attributable to equity holders | $ | (9.6) | $ | (4.5) | $ | 14.2 | $ | 15.0 | ||||||
| Denominator (in millions) | ||||||||||||||
| Weighted average number of common shares (basic) | 478.9 | 476.6 | 478.3 | 476.2 | ||||||||||
| Basic earnings (loss) per share attributable to equity holders | $ | (0.02) | $ | (0.01) | $ | 0.03 | $ | 0.03 | ||||||
(b) Diluted earnings per share computation
| Three months ended June 30 | Six months ended June 30 | |||||||||||||
| 2022 | 2021 | 2022 | 2021 | |||||||||||
| Denominator (in millions) | ||||||||||||||
| Weighted average number of common shares (basic) | 478.9 | 476.6 | 478.3 | 476.2 | ||||||||||
| Dilutive effect of options | — | — | — | 0.2 | ||||||||||
| Dilutive effect of share units | — | — | 4.2 | 4.9 | ||||||||||
| Weighted average number of common shares (diluted) | 478.9 | 476.6 | 482.5 | 481.3 | ||||||||||
| Diluted earnings (loss) per share attributable to equity holders | $ | (0.02) | $ | (0.01) | $ | 0.03 | $ | 0.03 | ||||||
Equity instruments excluded from the computation of diluted earnings per share, which could be dilutive in the future, were as follows:
| Three months ended June 30 | Six months ended June 30 | ||||||||||||||||
| (in millions) | Notes | 2022 | 2021 | 2022 | 2021 | ||||||||||||
| Options | 26(a) | 5.3 | 5.1 | 4.9 | 4.2 | ||||||||||||
| Share units | 26(b) | 6.7 | 7.2 | — | — | ||||||||||||
| 12.0 | 12.3 | 4.9 | 4.2 | ||||||||||||||
IAMGOLD CORPORATION Unaudited Condensed Consolidated Interim Financial Statements – June 30, 2022 | 47 | ||||
10. Cash Flow Items
(a) Adjustments for other non-cash items within operating activities
| Three months ended June 30 | Six months ended June 30 | ||||||||||||||||
| Notes | 2022 | 2021 | 2022 | 2021 | |||||||||||||
| Finance costs | 6 | $ | 1.3 | $ | 5.9 | $ | 2.5 | $ | 13.1 | ||||||||
| Share-based compensation | 0.8 | 1.5 | 3.0 | 3.8 | |||||||||||||
| Write-down of assets | 0.7 | 0.8 | 2.1 | 1.5 | |||||||||||||
| Write-down of inventories | 14 | 5.2 | 10.4 | 10.0 | 12.2 | ||||||||||||
| Insurance recovery | — | — | (1.2) | — | |||||||||||||
| Interest income | 7 | (1.4) | (1.0) | (2.1) | (2.2) | ||||||||||||
| Effects of exchange rate fluctuation on cash and cash equivalents | 11.0 | (2.3) | 10.7 | 0.4 | |||||||||||||
| Effects of exchange rate fluctuation on restricted cash | 2.4 | (0.3) | 3.4 | 1.3 | |||||||||||||
| Fair value of deferred consideration from the sale of Sadiola | (0.4) | — | (0.8) | — | |||||||||||||
| Other | (3.4) | 1.3 | (2.8) | 0.8 | |||||||||||||
| $ | 16.2 | $ | 16.3 | $ | 24.8 | $ | 30.9 | ||||||||||
(b)Movements in non-cash working capital items and non-current ore stockpiles
| Three months ended June 30 | Six months ended June 30 | |||||||||||||
| 2022 | 2021 | 2022 | 2021 | |||||||||||
| Receivables and other current assets | $ | (8.9) | $ | (6.0) | $ | (7.2) | $ | 25.7 | ||||||
| Inventories and non-current ore stockpiles | (17.7) | (23.3) | (0.1) | (22.9) | ||||||||||
| Accounts payable and accrued liabilities | 14.6 | 11.7 | 3.7 | (1.2) | ||||||||||
| $ | (12.0) | $ | (17.6) | $ | (3.6) | $ | 1.6 | |||||||
(c) Other investing activities
| Three months ended June 30 | Six months ended June 30 | |||||||||||||
| 2022 | 2021 | 2022 | 2021 | |||||||||||
| Capital expenditures for exploration and evaluation assets | $ | (0.4) | $ | (0.4) | $ | (0.8) | $ | (1.0) | ||||||
| Advances to Staatsolie | (11.2) | (10.3) | (21.0) | (21.4) | ||||||||||
| Repayments from Staatsolie | 9.6 | 6.3 | 20.2 | 21.3 | ||||||||||
| Interest received | 1.1 | 1.0 | 1.7 | 2.1 | ||||||||||
| Acquisition of exploration and evaluation assets | — | (5.0) | — | (5.0) | ||||||||||
| Other | (0.8) | (2.4) | (1.0) | (3.5) | ||||||||||
| $ | (1.7) | $ | (10.8) | $ | (0.9) | $ | (7.5) | |||||||
IAMGOLD CORPORATION Unaudited Condensed Consolidated Interim Financial Statements – June 30, 2022 | 48 | ||||
(d) Reconciliation of long-term debt arising from financing activities
| Notes | Equipment loans | 5.75% senior notes | Credit facility | Total | |||||||||||||
| Balance, January 1, 2021 | $ | 28.0 | $ | 438.6 | $ | — | $ | 466.6 | |||||||||
| Cash changes: | |||||||||||||||||
| Repayments | (7.7) | — | — | (7.7) | |||||||||||||
| Non-cash changes: | |||||||||||||||||
| Amortization of deferred financing charges | — | 0.9 | — | 0.9 | |||||||||||||
| Foreign currency translation | (1.6) | — | — | (1.6) | |||||||||||||
| Change in fair value of embedded derivative | — | 6.9 | — | 6.9 | |||||||||||||
| Other | — | (0.7) | — | (0.7) | |||||||||||||
| Balance, December 31, 2021 | $ | 18.7 | $ | 445.7 | $ | — | $ | 464.4 | |||||||||
| Cash changes: | |||||||||||||||||
| Proceeds | 0.7 | — | 150.0 | 150.7 | |||||||||||||
| Repayments | (3.5) | — | — | (3.5) | |||||||||||||
| Non-cash changes: | |||||||||||||||||
| Amortization of deferred financing charges | 21(a) | — | 0.4 | — | 0.4 | ||||||||||||
| Foreign currency translation | (1.3) | — | — | (1.3) | |||||||||||||
| Change in fair value of embedded derivative | 21(a) | — | 1.5 | — | 1.5 | ||||||||||||
| Other | — | (0.2) | — | (0.2) | |||||||||||||
Balance, June 30, 2022 | $ | 14.6 | $ | 447.4 | $ | 150.0 | $ | 612.0 | |||||||||
11. Cash and Cash Equivalents
| June 30 | December 31 | |||||||
| 2022 | 2021 | |||||||
| Cash | $ | 451.1 | $ | 429.7 | ||||
| Short-term deposits with initial maturities of three months or less | — | 115.2 | ||||||
| $ | 451.1 | $ | 544.9 | |||||
12. Restricted Cash
The Company had long-term restricted cash of $38.9 million as at June 30, 2022 (December 31, 2021 - $42.2 million) in support of environmental closure costs obligations related to the Essakane mine.
13. Receivables and Other Current Assets
| June 30 | December 31 | ||||||||||
| Notes | 2022 | 2021 | |||||||||
| Income taxes receivables | $ | 0.5 | $ | 0.5 | |||||||
Receivables from governments1 | 52.0 | 40.0 | |||||||||
| Deferred consideration from sale of Sadiola | 1.2 | 1.2 | |||||||||
| Other receivables | 8.4 | 6.7 | |||||||||
| Total receivables | 62.1 | 48.4 | |||||||||
| Prepayment for other assets | — | 0.3 | |||||||||
| Prepaid expenses | 16.9 | 17.1 | |||||||||
| Hedge derivatives | 23(b)(i) | 54.9 | 30.7 | ||||||||
| Non-hedge derivatives | 24 | 1.8 | — | ||||||||
| $ | 135.7 | $ | 96.5 | ||||||||
1.Receivables from governments relate primarily to value added tax.
IAMGOLD CORPORATION Unaudited Condensed Consolidated Interim Financial Statements – June 30, 2022 | 49 | ||||
14. Inventories
| June 30 | December 31 | |||||||
| 2022 | 2021 | |||||||
| Finished goods | $ | 78.3 | $ | 95.2 | ||||
| Ore stockpiles | 82.0 | 33.6 | ||||||
| Mine supplies | 174.3 | 173.3 | ||||||
| 334.6 | 302.1 | |||||||
| Non-current ore stockpiles | 89.0 | 124.1 | ||||||
| $ | 423.6 | $ | 426.2 | |||||
For the three and six months ended June 30, 2022, the Company recognized a net realizable value write-down in finished goods amounting to $3.1 million and $3.6 million, respectively (three and six months ended June 30, 2021 - $10.0 million and $10.0 million, respectively).
For the three and six months ended June 30, 2022, the Company recognized a net realizable value write-down in current ore stockpiles amounting to $0.6 million and $1.8 million, respectively (three and six months ended June 30, 2021 - $1.2 million and $1.2 million, respectively) and non-current ore stockpiles amounting to $1.6 million and $5.1 million, respectively (three and six months ended June 30, 2021 - $nil and $nil, respectively).
For the three and six months ended June 30, 2022, the Company recognized a write-down in mine supplies inventories amounting to $0.7 million and $1.2 million, respectively (three and six months ended June 30, 2021 - $1.0 million and $2.8 million, respectively).
15. Property, Plant and Equipment
| Construction in progress | Mining properties | Plant and equipment | Right-of-use assets1 | Total | |||||||||||||
| Cost | |||||||||||||||||
| Balance, January 1, 2021 | $ | 624.8 | $ | 3,106.6 | $ | 1,966.6 | $ | 92.2 | $ | 5,790.2 | |||||||
Additions2 | 474.8 | 142.3 | 83.2 | 21.4 | 721.7 | ||||||||||||
| Changes in asset retirement obligations | — | 42.0 | — | — | 42.0 | ||||||||||||
| Disposals | — | — | (79.4) | (4.4) | (83.8) | ||||||||||||
| Transfers within property, plant and equipment | (21.0) | 14.1 | 7.5 | (0.6) | — | ||||||||||||
| Balance, December 31, 2021 | $ | 1,078.6 | $ | 3,305.0 | $ | 1,977.9 | $ | 108.6 | $ | 6,470.1 | |||||||
Additions2 | 294.3 | 109.3 | 45.8 | 9.8 | 459.2 | ||||||||||||
| Changes in asset retirement obligations | — | (37.4) | — | — | (37.4) | ||||||||||||
| Disposals | — | — | (16.0) | (2.2) | (18.2) | ||||||||||||
| Transfers within property, plant and equipment | (21.4) | 21.3 | 0.3 | (0.2) | — | ||||||||||||
| Balance, June 30, 2022 | $ | 1,351.5 | $ | 3,398.2 | $ | 2,008.0 | $ | 116.0 | $ | 6,873.7 | |||||||
| Construction in progress | Mining properties | Plant and equipment | Right-of-use assets1 | Total | |||||||||||||
| Accumulated Depreciation and Impairment | |||||||||||||||||
| Balance, January 1, 2021 | $ | — | $ | 2,084.8 | $ | 1,324.0 | $ | 19.4 | $ | 3,428.2 | |||||||
Depreciation expense3 | — | 180.4 | 131.6 | 15.4 | 327.4 | ||||||||||||
| Disposals | — | — | (74.3) | (4.2) | (78.5) | ||||||||||||
| Impairment charge | — | 154.1 | 37.3 | 13.7 | 205.1 | ||||||||||||
| Balance, December 31, 2021 | $ | — | $ | 2,419.3 | $ | 1,418.6 | $ | 44.3 | $ | 3,882.2 | |||||||
Depreciation expense3 | — | 101.1 | 65.5 | 7.1 | 173.7 | ||||||||||||
| Disposals | — | — | (14.1) | (1.9) | (16.0) | ||||||||||||
| Impairment charge | — | 38.4 | — | — | 38.4 | ||||||||||||
| Transfers within Property, plant and equipment | — | — | 0.1 | (0.1) | — | ||||||||||||
| Balance, June 30, 2022 | $ | — | $ | 2,558.8 | $ | 1,470.1 | $ | 49.4 | $ | 4,078.3 | |||||||
| Carrying amount, December 31, 2021 | $ | 1,078.6 | $ | 885.7 | $ | 559.3 | $ | 64.3 | $ | 2,587.9 | |||||||
| Carrying amount, June 30, 2022 | $ | 1,351.5 | $ | 839.4 | $ | 537.9 | $ | 66.6 | $ | 2,795.4 | |||||||
1.Right-of-use assets consist of property, plant and equipment related to assets leased and accounted for under IFRS 16.
2.For the three and six months ended June 30, 2022, borrowing costs attributable to qualifying assets associated with the Essakane, Rosebel and Westwood mines and the Côté Gold and Saramacca projects totaling $10.9 million and $20.5 million, respectively (three and six months ended June 30, 2021 - $5.6 million and $9.8 million, respectively) were capitalized using a weighted average interest rate. The weighted average interest rate was based on the 5.75% senior notes, credit facility, equipment loans, gold prepayments and leases.
3.Excludes depreciation expense related to corporate office assets, included within other non-current assets, which is included in general and administrative expenses.
IAMGOLD CORPORATION Unaudited Condensed Consolidated Interim Financial Statements – June 30, 2022 | 50 | ||||
The Company performs impairment testing for its property, plant and equipment when indicators of potential impairment or reversal of previously recognized impairment are identified.
Côté Gold CGU - June 30, 2022
The updated costs to complete, project economics and life-of-mine plan to be included in a new technical report were considered by the Company to be indicators of impairment for the Côté Gold CGU.
Doyon and Rosebel CGUs – June 30, 2022
An increase in the estimated long-term price of gold was considered by the Company to be an indicator of impairment reversal for the Doyon and Rosebel CGUs.
Impairment test
The recoverable amounts of the CGUs were determined by calculating the Fair Value Less Cost of Disposal ("FVLCD"). The FVLCD was determined by calculating the net present value of the estimated future cash flows (level 3 of the fair value hierarchy). The significant estimates and assumptions used in determining the FVLCD were reserves and resources, the life-of-mine production profile, remaining construction expenditures, future capital and operating expenditures, future gold prices, future foreign exchange rates, discount rate and value of un-modeled mineralization.
The estimate of future cash flows were derived from the most recent life-of-mine plans and technical reports. Management estimated gold prices based on observable market data, including the spot price and industry analysts' forecasted prices. The Company used an estimated gold price of $1,700 per ounce for 2022 to 2025, and $1,600 per ounce thereafter. The future cash flows used to calculate the FVLCD were discounted using a real weighted average cost of capital of 5.5% for the Côté Gold CGU and 8.5% for the Rosebel and Doyon CGUs, which reflected specific market risk factors. Un-modeled measured and indicated resources and a portion of un-modeled inferred resources, where applicable, were valued at $50 per ounce, based on a review of comparable market transactions.
An impairment test was performed for the Côté Gold CGU and it was determined that the estimated recoverable amount of the CGU was more than the carrying amount and no impairment was required.
An impairment test was performed for the Rosebel CGU and it was determined that the estimated recoverable amount of the CGU was in line with the carrying amount and no impairment or impairment reversal was required.
An impairment test was performed for the Doyon CGU. The carrying amount increased by $38.4 million due to a reduction in the asset retirement obligation related to the closed site within the Doyon CGU (note 19(a)) and resulted in the carrying amount exceeding the recoverable amount of $96.0 million. An impairment charge of $38.4 million was recognized against the change in asset retirement obligations at closed sites in the consolidated statements of earnings (loss).
16. Exploration and Evaluation Assets
| Diakha-Siribaya Gold Project | Fayolle Property | Monster Lake Project | Other | Total | |||||||||||||
| Balance, January 1, 2021 | $ | 36.6 | $ | 7.3 | $ | 7.8 | $ | 3.1 | $ | 54.8 | |||||||
| Exploration and evaluation expenditures | — | 1.9 | — | — | 1.9 | ||||||||||||
| Acquired exploration and evaluation assets | — | — | — | 5.0 | 5.0 | ||||||||||||
| Balance, December 31, 2021 | $ | 36.6 | $ | 9.2 | $ | 7.8 | $ | 8.1 | $ | 61.7 | |||||||
| Exploration and evaluation expenditures | — | 0.8 | — | — | 0.8 | ||||||||||||
| Balance, June 30, 2022 | $ | 36.6 | $ | 10.0 | $ | 7.8 | $ | 8.1 | $ | 62.5 | |||||||
17. Other Non-Current Assets
| June 30 | December 31 | ||||||||||
| Notes | 2022 | 2021 | |||||||||
| Marketable securities | 24(a) | $ | 24.6 | $ | 40.4 | ||||||
| Deferred consideration from the sale of Sadiola | 24(a) | 19.7 | 18.9 | ||||||||
Advances for the purchase of capital equipment1 | 68.1 | 44.6 | |||||||||
Receivable from Staatsolie2 | 11.9 | 10.7 | |||||||||
| Income taxes receivables | 27.4 | 27.0 | |||||||||
| Bond fund investments | 24(a) | 10.1 | 4.7 | ||||||||
| Royalty interests | 12.8 | 12.8 | |||||||||
| Long-term prepayment | 3.9 | 4.0 | |||||||||
| Hedge derivatives | 23(b)(i) | 32.7 | 34.0 | ||||||||
| Non-hedge derivatives | 24(a) | 0.6 | 1.8 | ||||||||
| Other | 5.2 | 5.7 | |||||||||
| $ | 217.0 | $ | 204.6 | ||||||||
1.Includes advances related to the Côté Gold project of $52.9 million (December 31, 2021 - $33.0 million).
2.Rosebel Gold Mines N.V. ("Rosebel") entered into an Unincorporated Joint Venture (“Rosebel UJV”) agreement with Staatsolie Maatschappij Suriname N.V. (“Staatsolie”) relating to the concession areas within the Rosebel UJV Area of Interest, which includes Saramacca. Rosebel holds a 70% participating interest and Staatsolie holds a 30% participating interest in the Rosebel UJV. The receivable will be recovered from Staatsolie’s future gold entitlement.
IAMGOLD CORPORATION Unaudited Condensed Consolidated Interim Financial Statements – June 30, 2022 | 51 | ||||
18. Other Current Liabilities
| June 30 | December 31 | ||||||||||
| Notes | 2022 | 2021 | |||||||||
| Current portion of provisions | 19 | $ | 11.8 | $ | 6.5 | ||||||
| Current portion of deferred revenue | 22 | 96.0 | 189.7 | ||||||||
| Current portion of other liabilities | 20 | 22.5 | 22.7 | ||||||||
| $ | 130.3 | $ | 218.9 | ||||||||
19. Provisions
| June 30 | December 31 | ||||||||||
| Notes | 2022 | 2021 | |||||||||
| Asset retirement obligations | (a) | $ | 382.7 | $ | 460.4 | ||||||
| Other | 16.4 | 16.3 | |||||||||
| $ | 399.1 | $ | 476.7 | ||||||||
| Current portion of provisions | $ | 11.8 | $ | 6.5 | |||||||
| Non-current provisions | 387.3 | 470.2 | |||||||||
| $ | 399.1 | $ | 476.7 | ||||||||
(a)Asset retirement obligations
The Company’s activities are subject to various laws and regulations regarding environmental restoration and closure for which the Company estimates future costs and recognizes a provision. These provisions may be revised on the basis of amendments to such laws and regulations and the availability of new information, such as changes in reserves corresponding to a change in the mine life, changes in discount rates, changes in approved closure plans, changes in estimated costs of reclamation activities and acquisition or construction of a new mine. The Company makes a provision based on the best estimate of the future cost of rehabilitating mine sites and related production facilities on a discounted basis.
| June 30 | December 31 | |||||||
| 2022 | 2021 | |||||||
| Balance, beginning of the period | $ | 460.4 | $ | 380.0 | ||||
Revision of estimated cash flows1: | ||||||||
| Capitalized in Property, plant and equipment | (37.4) | 42.0 | ||||||
Changes in asset retirement obligations at closed sites2 | (39.4) | 40.7 | ||||||
| Disbursements | (0.9) | (2.3) | ||||||
| Balance, end of period | $ | 382.7 | $ | 460.4 | ||||
| Current portion of provisions | (11.8) | (6.5) | ||||||
| Non-current provisions | $ | 370.9 | $ | 453.9 | ||||
1.The non-cash decrease in estimated cash flows during the period ended June 30, 2022 is due to the change in the discount rates impacted by the increase in interest rates.
2.$38.4 million of the changes in asset retirement obligations at closed sites related to the closed site within the Doyon CGU. An impairment charge of $38.4 million was recognized against the change in asset retirement obligations at closed sites in the consolidated statements of earnings (loss) (note 15).
(b)Provisions for litigation claims and regulatory assessments
The Company is from time to time involved in legal proceedings and regulatory inquiries, arising in the ordinary course of business. Typically the amount of ultimate liability with respect to these actions will not, in the opinion of management, materially affect the Company’s financial position, results of operations or cash flows.
The Attorney General of Burkina Faso commenced proceedings against Essakane S.A. and certain of its employees generally relating to its practice of exporting carbon fines containing gold and silver from Burkina Faso to a third-party facility in Canada for processing and eventual sale. From the sale of gold and silver extracted from carbon fines, Essakane S.A. has paid (and would pay in respect of the shipment that is currently embargoed) the royalty applicable under the Burkina Faso Mining Code to other gold and silver produced by Essakane. An internal review of the veracity of the allegations was undertaken and, other than in respect of certain notification and other relatively immaterial regulatory violations, the Company is of the view that the proceedings are without merit and is vigorously defending against the allegations. At this time, the Company cannot predict the outcome and any resulting penalties with any certainty, accordingly, no amounts have been recorded for any potential liability arising from the proceedings.
Essakane S.A. received correspondence from the Burkina Faso customs authorities regarding the rate applied to imports during an expansion in 2012. The Company is in talks with the authorities to potentially come to a resolution of the matter in the short-term. The Company accrued an amount for such resolution.
IAMGOLD CORPORATION Unaudited Condensed Consolidated Interim Financial Statements – June 30, 2022 | 52 | ||||
20. Other Liabilities
| June 30 | December 31 | ||||||||||
| Notes | 2022 | 2021 | |||||||||
| Embedded derivative - Rosebel power purchase agreement | (a), 24(a) | $ | 24.1 | $ | 29.2 | ||||||
| Hedge derivatives | 23(b)(i) | 4.0 | 0.7 | ||||||||
| Non-hedge derivatives | 24(a) | 5.2 | 3.0 | ||||||||
| Yatela liability | (b) | 18.5 | 18.5 | ||||||||
| Other liabilities | 13.9 | 11.6 | |||||||||
| $ | 65.7 | $ | 63.0 | ||||||||
| Current portion of other liabilities | $ | 22.5 | $ | 22.7 | |||||||
| Non-current portion of other liabilities | 43.2 | 40.3 | |||||||||
| $ | 65.7 | $ | 63.0 | ||||||||
(a)Embedded derivative - Rosebel power purchase agreement
Rosebel has a power purchase agreement with the Government of Suriname. This agreement specifies both the quantity of power Rosebel is expected to purchase as well as the price per kilowatt hour. An embedded derivative exists in the Rosebel power purchase agreement as increases in electricity prices are linked to the price of gold. This embedded derivative is accounted for separately from the host contract at Fair Value Through Profit or Loss ("FVTPL") as the economic characteristics and risks of the host contract and the embedded derivative are not closely related. The embedded derivative liability at June 30, 2022 was $24.1 million primarily due to the forward price of gold exceeding the minimum price threshold set in the agreement.
(b)Yatela liability
On February 14, 2019, Sadiola Exploration Limited ("SADEX"), a subsidiary jointly held by the Company and AngloGold Ashanti Limited, entered into a share purchase agreement with the Government of Mali, as amended from time to time, whereby SADEX agreed to sell to the Government of Mali its 80% participation in Société d’Exploitation des Mines d’Or de Yatela ("Yatela"), for a consideration of $1. The transaction remains subject to the fulfillment of a number of conditions precedent as specified in the transaction. As part of the transaction, and upon its completion, SADEX will make a one-time payment of approximately $37.0 million to the dedicated state account, corresponding to the estimated costs of completing the rehabilitation and closure of the Yatela mine, and also financing certain outstanding social programs. Upon completion and this payment being made, SADEX and its affiliated companies are expected to be released of all obligations relating to the Yatela mine. The Company will fund approximately $18.5 million of the payment.
21. Long-term Debt
| June 30 | December 31 | ||||||||||
| Notes | 2022 | 2021 | |||||||||
| Credit facility | (a) | $ | 150.0 | $ | — | ||||||
| 5.75% senior notes | (b) | 447.4 | 445.7 | ||||||||
| Equipment loans | (c) | 14.6 | 18.7 | ||||||||
| $ | 612.0 | $ | 464.4 | ||||||||
| Current portion of long-term debt | $ | 7.0 | $ | 7.5 | |||||||
| Non-current portion of long-term debt | 605.0 | 456.9 | |||||||||
| $ | 612.0 | $ | 464.4 | ||||||||
(a)Credit facility
The Company has a $500 million secured revolving credit facility ("Credit Facility"), which was entered into in December 2017 and was amended, from time to time, including in February 2021 to primarily extend the maturity date from January 31, 2023 to January 31, 2025 for $490 million of the available credit.
On April 29, 2022 and June 29, 2022, the Company drew down $100.0 million and $50.0 million, respectively, on the Credit Facility and the amounts remain outstanding as at June 30, 2022. As of June 30, 2022, the Company had $348.7 million available under the Credit Facility and letters of credit worth $1.3 million drawn against the Credit Facility for the guarantee of certain environmental indemnities (December 31, 2021 - $1.7 million). Subsequent to the end of the quarter, the Company drew down $80.0 million to manage the timing of the receipt of a dividend from Essakane and for certain cash collateral posted for surety bonds and issued a letter of credit for $19.3 million as collateral for surety bonds.
The Credit Facility provides for an interest rate margin above London Interbank Offered Rate, banker’s acceptance prime rate and base rate advances which vary, together with fees related thereto, according to the total Net Debt to Earnings Before Interest, Tax, Depreciation and Amortization ("EBITDA") ratio of the Company. The Credit Facility is
IAMGOLD CORPORATION Unaudited Condensed Consolidated Interim Financial Statements – June 30, 2022 | 53 | ||||
secured by certain of the Company's real assets, guarantees by certain of the Company’s subsidiaries and pledges of shares of certain of the Company's subsidiaries. The key terms of the Credit Facility include certain limitations on incremental debt, certain restrictions on distributions and financial covenants including Net Debt to EBITDA and Interest Coverage.
(b)5.75% senior notes ("Notes")
On September 23, 2020, the Company completed the issuance of $450 million aggregate principal amount of Notes with an interest rate of 5.75% per annum. The Notes are denominated in U.S. dollars and mature on October 15, 2028. Interest is payable in arrears in equal semi-annual installments of $12.9 million on April 15 and October 15 of each year, beginning on April 15, 2021. The Notes are guaranteed by certain of the Company's subsidiaries.
The Company incurred transaction costs of $7.5 million which have been capitalized and offset against the carrying amount of the Notes within long-term debt in the consolidated balance sheets and are being amortized using the effective interest rate method.
Prior to October 15, 2023, the Company has the right to redeem some or all of the Notes at a price equal to 100% of the principal amount of the Notes plus a "make-whole" premium, plus accrued and unpaid interest, if any, up to the redemption date.
After October 15, 2023, the Company has the right to redeem the Notes, in whole or in part, at the relevant redemption price (expressed as a percentage of the principal amount of the Notes) plus accrued and unpaid interest, if any, up to the redemption date. The redemption price for the Notes during the 12-month period beginning on October 15 of each of the following years is: 2023 – 104.313%; 2024 – 102.875%; 2025 - 101.438%; 2026 and thereafter - 100%.
Prior to October 15, 2023, using the cash proceeds from an equity offering, the Company has the right to redeem up to 40% of the original aggregate principal amount of the Notes at a redemption price equal to 101% of the aggregate principal amount thereof, plus accrued and unpaid interest, if any, up to the redemption date.
The prepayment options are options that represent an embedded derivative asset to the Company and are presented as an offset to the Notes on the consolidated balance sheets. The debt component was initially recognized at $454.2 million, which represented the difference between the fair value of the financial instrument as a whole and the fair value of the embedded derivative at inception.
Subsequently, the debt component is recognized at amortized cost using the effective interest rate method. The embedded derivative is classified as a financial asset at FVTPL. The fair value of the embedded derivative as at June 30, 2022 was $nil (December 31, 2021 - $1.5 million) (note 24(a)).
The following are the contractual maturities related to the Notes, including interest payments:
| Payments due by period | ||||||||||||||||||||
Notes balance as at | Carrying amount1 | Contractual cash flows | <1 yr | 1-2 yrs | 3-4 yrs | >4 yrs | ||||||||||||||
| June 30, 2022 | $ | 450.0 | $ | 618.2 | $ | 25.9 | $ | 51.8 | $ | 51.8 | $ | 488.7 | ||||||||
| December 31, 2021 | $ | 450.0 | $ | 631.1 | $ | 25.9 | $ | 51.8 | $ | 51.8 | $ | 501.6 | ||||||||
1.The carrying amount of the long-term debt excludes unamortized deferred transaction costs of $5.9 million as at June 30, 2022 (December 31, 2021 – $6.3 million) and the embedded derivative.
(c)Equipment loans
The Company has equipment loans with a carrying value of $14.6 million as at June 30, 2022 (December 31, 2021 - $18.7 million), secured by certain mobile equipment, with interest rates between 5.23% and 5.95% and which mature in 2024. The equipment loans are carried at amortized cost on the consolidated balance sheets. On March 31, 2022, the Company entered into an amendment to increase the equipment loan facility by $6.2 million on similar terms. The equipment loan facility has an availability period of six months and draws of $0.7 million occurred as at June 30, 2022.
The following are the contractual maturities related to the equipment loans, including interest payments:
| Payments due by period | ||||||||||||||||||||
Equipment loans balance as at | Carrying amount1 | Contractual cash flows | <1 yr | 1-2 yrs | 3-4 yrs | >4 yrs | ||||||||||||||
| June 30, 2022 | $ | 14.7 | $ | 15.7 | $ | 7.9 | $ | 7.8 | $ | — | $ | — | ||||||||
| December 31, 2021 | $ | 18.9 | $ | 20.5 | $ | 8.5 | $ | 12.0 | $ | — | $ | — | ||||||||
1.The carrying amount of the long-term debt excludes unamortized deferred transaction costs of $0.1 million as at June 30, 2022 (December 31, 2021 - $0.2 million).
(d)Uncollateralized surety bonds
As at June 30, 2022, the Company had CAD$215.8 million (June 30, 2022 - $167.7 million; December 31, 2021 - CAD$215.3 million, $170.1 million) of uncollateralized surety bonds, issued pursuant to arrangements with insurance companies, in support of environmental closure costs obligations related to the Doyon division and the Côté Gold project. Subsequent to the end of the quarter, the Company posted $30.2 million of security for certain of the surety bonds. $10.9 million was posted as cash collateral and $19.3 million was posted through the issuance of a letter of credit under the Credit Facility.
IAMGOLD CORPORATION Unaudited Condensed Consolidated Interim Financial Statements – June 30, 2022 | 54 | ||||
(e)Uncollateralized performance bonds
As at June 30, 2022, uncollateralized performance bonds of CAD$39.1 million (June 30, 2022 - $30.4 million; December 31, 2021 - CAD$39.1 million, $30.9 million) were outstanding in support of certain obligations related to the construction of the Côté Gold project.
22. Deferred Revenue
During 2019, the Company entered into a gold sale prepayment arrangement (the “2019 Prepay Arrangement”) with a syndicate of banks with a collar range of $1,300 to $1,500 per ounce. Pursuant to the 2019 Prepay Arrangement, the Company received a cash prepayment of $169.8 million in exchange for physically delivering 12,500 ounces of gold per month in 2022 for a total of 150,000 ounces. The cost of the 2019 Prepay Arrangement is 5.38% per annum. 37,500 ounces and 75,000 ounces, respectively, were physically delivered during the three and six months ended June 30, 2022 in relation to the 2019 Prepay Arrangement and the Company received $7.5 million and $15.0 million, respectively, in cash in relation to the collar.
During 2021, the Company entered into further gold sale prepayment arrangements (the “2022 Prepay Arrangements”) at a weighted average cost of 4.45% per annum in respect of 150,000 gold ounces. These arrangements have an average forward contract price of $1,753 per ounce on 50,000 gold ounces and a collar range of $1,700 to $2,100 per ounce on 100,000 gold ounces. This will result in a total prepayment to the Company of $236 million over the course of 2022 and the requirement on the part of the Company to physically deliver such ounces to the counterparties over the course of 2024. The Company received a cash prepayment of $59.0 million and $118.0 million, respectively, during the three and six months ended June 30, 2022 in relation to the 2022 Prepay Arrangements.
These arrangements have been accounted for as contracts in the scope of IFRS 15 Revenue from Contracts with Customers whereby the cash prepayments are recorded as deferred revenue in the consolidated balance sheets when received and revenue is recognized as deliveries are made.
An interest cost, representing the financing component of the cash prepayment, was recognized as part of finance costs.
The following table summarizes the change in deferred revenue:
| Notes | 2019 Prepay Arrangement | 2022 Prepay Arrangements | Total | |||||||||||
| Balance, January 1, 2021 | $ | 179.8 | $ | — | $ | 179.8 | ||||||||
| Finance costs | 9.9 | — | 9.9 | |||||||||||
| Balance, December 31, 2021 | $ | 189.7 | $ | — | $ | 189.7 | ||||||||
| Proceeds from gold prepayment | — | 118.0 | 118.0 | |||||||||||
| Revenue recognized | (97.5) | — | (97.5) | |||||||||||
| Finance costs | 6 | 3.8 | 1.1 | 4.9 | ||||||||||
Balance, June 30, 2022 | $ | 96.0 | $ | 119.1 | $ | 215.1 | ||||||||
| Current portion of deferred revenue | $ | 96.0 | $ | — | $ | 96.0 | ||||||||
| Non-current deferred revenue | — | 119.1 | 119.1 | |||||||||||
| $ | 96.0 | $ | 119.1 | $ | 215.1 | |||||||||
23. Financial Instruments
(a)Risks
Liquidity risk
Liquidity risk is the risk that an entity will encounter difficulty in meeting obligations associated with financial liabilities that are settled by delivering cash or another financial asset.
As at June 30, 2022, the Company’s cash and cash equivalents and short-term investments balance was $452.9 million (December 31, 2021 - $552.5 million) and it had $348.7 million available under the Credit Facility (note 21(b)). As at June 30, 2022, the Company had accounts payable and accrued liabilities of $324.0 million (December 31, 2021 - $304.4 million), total lease liabilities of $62.0 million (December 31, 2021 - $65.6 million), Notes payable of $447.4 million (December 31, 2021 - $445.7 million), Credit Facility payable of $150.0 million (December 31, 2021 - $nil) and equipment loans payable of $14.6 million (December 31, 2021 - $18.7 million).
The Côté UJV requires its joint venture partners to fund, in advance, three months of future expenditures. The Company uses dividends and intercompany loans to repatriate funds from its operations and the timing of dividends may impact the timing and amount of required financing including the Company draw downs under the Credit Facility.
IAMGOLD CORPORATION Unaudited Condensed Consolidated Interim Financial Statements – June 30, 2022 | 55 | ||||
(b)Cash flow hedge fair value reserve
(i)Reconciliation of cash flow hedge assets (liabilities)
| Canadian dollar contracts | Crude oil contracts | Gold price contracts | Total | |||||||||||
| Balance, January 1, 2021 | $ | 35.1 | $ | (8.4) | $ | 8.0 | $ | 34.7 | ||||||
| Unrealized gain (loss) recognized in cash flow hedge reserve | 11.4 | 44.3 | 2.1 | 57.8 | ||||||||||
| Realized (gain) loss reclassified or adjusted from cash flow hedge reserve | (20.6) | (10.9) | (2.1) | (33.6) | ||||||||||
| Premiums paid | — | — | 1.8 | 1.8 | ||||||||||
| Time value excluded from hedge relationship | (1.4) | 13.5 | (8.8) | 3.3 | ||||||||||
| Balance, December 31, 2021 | $ | 24.5 | $ | 38.5 | $ | 1.0 | $ | 64.0 | ||||||
| Unrealized gain (loss) recognized in cash flow hedge reserve | (3.7) | 57.1 | 7.1 | 60.5 | ||||||||||
| Realized (gain) loss reclassified or adjusted from cash flow hedge reserve | (7.4) | (22.4) | — | (29.8) | ||||||||||
| Unrealized (gain) loss reclassified or adjusted from cash flow hedge reserve due to hedge de-designation | — | (1.9) | — | (1.9) | ||||||||||
| Time value excluded from hedge relationship | (0.3) | (3.8) | (5.1) | (9.2) | ||||||||||
Balance, June 30, 2022 | $ | 13.1 | $ | 67.5 | $ | 3.0 | $ | 83.6 | ||||||
| Consisting of: | ||||||||||||||
| Current portion of hedge asset | $ | 12.3 | $ | 37.5 | $ | 5.1 | $ | 54.9 | ||||||
| Non-current portion of hedge asset | 0.8 | 30.0 | 1.9 | 32.7 | ||||||||||
| Current portion of hedge liability | $ | — | $ | — | $ | — | $ | — | ||||||
| Non-current portion of hedge liability | — | — | (4.0) | (4.0) | ||||||||||
| $ | 13.1 | $ | 67.5 | $ | 3.0 | $ | 83.6 | |||||||
Additional information on hedging instruments and hedged forecast transactions related to oil and fuel market price risk as at June 30, 2022 and December 31, 2021 was as follows:
| Canadian dollar contracts | Crude oil contracts | Gold price contracts | Total | |||||||||||
Balance, December 31, 2021 | ||||||||||||||
| Accumulated cash flow hedge fair value reserve (before tax) | $ | 23.4 | $ | 31.3 | $ | — | $ | 54.7 | ||||||
| Hedging instruments | $ | 23.4 | $ | 31.3 | $ | — | $ | 54.7 | ||||||
| Hedged items | $ | (23.4) | $ | (31.3) | $ | — | $ | (54.7) | ||||||
Balance, June 30, 2022 | ||||||||||||||
| Accumulated cash flow hedge fair value reserve (before tax) | $ | 12.3 | $ | 64.2 | $ | 7.0 | $ | 83.5 | ||||||
| Hedging instruments | $ | 12.3 | $ | 64.2 | $ | 7.0 | $ | 83.5 | ||||||
| Hedged items | $ | (12.3) | $ | (64.2) | $ | (7.0) | $ | (83.5) | ||||||
IAMGOLD CORPORATION Unaudited Condensed Consolidated Interim Financial Statements – June 30, 2022 | 56 | ||||
(ii)Allocation of realized hedge (gain) loss reclassified from cash flow hedge reserve
| Three months ended June 30 | Six months ended June 30 | |||||||||||||
| 2022 | 2021 | 2022 | 2021 | |||||||||||
| Consolidated balance sheets | ||||||||||||||
| Property, plant and equipment | $ | (4.3) | $ | (5.0) | $ | (8.7) | $ | (7.3) | ||||||
| Consolidated statements of earnings (loss) | ||||||||||||||
| Revenues | 0.4 | 0.8 | 0.8 | 1.4 | ||||||||||
| Cost of sales | (11.8) | (2.2) | (20.5) | (2.9) | ||||||||||
| General and administrative expenses | (0.1) | (0.8) | (0.5) | (1.7) | ||||||||||
| Other expenses | — | (0.3) | — | (0.6) | ||||||||||
| (11.5) | (2.5) | (20.2) | (3.8) | |||||||||||
| $ | (15.8) | $ | (7.5) | $ | (28.9) | $ | (11.1) | |||||||
Revenues for the three and six months ended June 30, 2022 include $0.4 million and $0.8 million, respectively, (June 30, 2021 - $1.4 million and $2.8 million, respectively) of losses related to premiums previously paid and realized during the year. Crude oil derivative contracts exceeded highly probable future oil consumption and resulted in the de-designation of these contracts. The Company recognized hedge ineffectiveness for the three and six months ended June 30, 2022 of $nil and $1.9 million, respectively, (June 30, 2021 - $nil and $nil, respectively) in gain (loss) on non-hedge derivatives (note 23(c)).
(c)Gain (loss) on non-hedge derivatives
Gains and losses on non-hedge derivatives, including embedded derivatives, are included in interest income, derivatives and other investment gains (losses) (note 7) in the consolidated statements of earnings (loss).
These gains and losses relate to the Company's fair value movements of the embedded derivative related to prepayment options for the Notes (note 21(a)), the embedded derivative related to the Rosebel power purchase agreement (note 20), the Target Accrual Redemption Forward ("TARF") and the extendible forward currency arrangements ("Extendible Forwards").
| Three months ended June 30 | Six months ended June 30 | ||||||||||||||||
| Notes | 2022 | 2021 | 2022 | 2021 | |||||||||||||
| Embedded derivatives - Notes | 21(a) | $ | (0.3) | $ | 8.6 | $ | (1.5) | $ | 5.5 | ||||||||
| Embedded derivatives - Rosebel power purchase agreement | 20 | 3.5 | (0.5) | 5.1 | 2.2 | ||||||||||||
TARF1 | 24(b) | (3.5) | (1.1) | (0.6) | (1.1) | ||||||||||||
Extendible Forwards2 | 24(b) | (1.4) | — | 0.8 | — | ||||||||||||
| Crude oil derivative contracts | 23(b)(i) | 0.2 | — | 2.1 | — | ||||||||||||
| Other | (0.1) | 0.1 | (0.4) | 0.1 | |||||||||||||
| 7 | $ | (1.6) | $ | 7.1 | $ | 5.5 | $ | 6.7 | |||||||||
1.TARF includes $0.6 million and $1.6 million, respectively, of realized gains on forward settlements for the three and six months ended June 30, 2022 (three and six months ended June 30, 2021 - $nil and $nil, respectively).
2.Extendible Forwards include $0.9 million and $2.1 million, respectively, of realized gains on forward settlements for the three and six months ended June 30, 2022 (three and six months ended June 30, 2021 - $nil and $nil, respectively).
IAMGOLD CORPORATION Unaudited Condensed Consolidated Interim Financial Statements – June 30, 2022 | 57 | ||||
24. Fair Value Measurements
The fair value hierarchy categorizes into three levels the inputs to valuation techniques used to measure fair value. The fair value hierarchy gives the highest priority to quoted prices (unadjusted) in active markets for identical assets or liabilities (Level 1 inputs) and the lowest priority to unobservable inputs (Level 3 inputs).
•Level 1 inputs are quoted prices (unadjusted) in active markets for identical assets or liabilities which the entity can access at the measurement date.
•Level 2 inputs are inputs other than quoted prices included within Level 1 which are observable for the asset or liability, either directly or indirectly such as those derived from prices.
•Level 3 inputs are unobservable inputs for the asset or liability.
There have been no changes in the classification of the financial instruments in the fair value hierarchy since December 31, 2021.
(a)Financial assets and liabilities measured at fair value on a recurring basis
The Company’s fair values of financial assets and liabilities were as follows:
| June 30, 2022 | |||||||||||||||||
| Carrying Amount | Level 1 | Level 2 | Level 3 | Total Fair Value | |||||||||||||
| Assets | |||||||||||||||||
| Cash and cash equivalents | $ | 451.1 | $ | 451.1 | $ | — | $ | — | $ | 451.1 | |||||||
| Short-term investments | 1.8 | 1.8 | — | — | 1.8 | ||||||||||||
| Restricted cash | 38.9 | 38.9 | — | — | 38.9 | ||||||||||||
| Marketable securities | 24.6 | 24.2 | — | 0.4 | 24.6 | ||||||||||||
| Bond fund investments | 10.1 | 10.1 | — | — | 10.1 | ||||||||||||
| Deferred consideration from the sale of Sadiola | 19.7 | — | — | 19.7 | 19.7 | ||||||||||||
| Derivatives | |||||||||||||||||
| Currency contracts | 13.1 | — | 13.1 | — | 13.1 | ||||||||||||
Crude oil contracts1 | 69.3 | — | 69.3 | — | 69.3 | ||||||||||||
| Gold bullion contracts | 7.0 | — | 7.0 | — | 7.0 | ||||||||||||
Extendible Forwards2 | 2.0 | — | 2.0 | — | 2.0 | ||||||||||||
| Embedded derivative - prepayment options on Notes | — | — | — | — | — | ||||||||||||
| $ | 637.6 | $ | 526.1 | $ | 91.4 | $ | 20.1 | $ | 637.6 | ||||||||
| Liabilities | |||||||||||||||||
| Derivatives | |||||||||||||||||
| Gold bullion contracts | $ | (4.0) | $ | — | $ | (4.0) | $ | — | $ | (4.0) | |||||||
| TARF | (5.2) | — | (5.2) | — | (5.2) | ||||||||||||
| Embedded derivative - Rosebel power purchase agreement | (24.1) | — | (24.1) | — | (24.1) | ||||||||||||
Long-term debt - Notes3 | (453.3) | (306.7) | — | — | (306.7) | ||||||||||||
Long-term debt - equipment loans4 | (14.7) | — | (14.1) | — | (14.1) | ||||||||||||
| Long-term debt - Credit Facility | (150.0) | — | (150.0) | — | (150.0) | ||||||||||||
| $ | (501.3) | $ | (306.7) | $ | (47.4) | $ | — | $ | (354.1) | ||||||||
1.Includes hedge and non-hedge derivatives.
2.The carrying amount excludes unamortized deferred gains of $1.4 million.
3.The carrying amount excludes unamortized deferred transaction costs of $5.9 million and the embedded derivative.
4.The carrying amount excludes unamortized deferred transaction costs of $0.1 million.
IAMGOLD CORPORATION Unaudited Condensed Consolidated Interim Financial Statements – June 30, 2022 | 58 | ||||
| December 31, 2021 | |||||||||||||||||
| Carrying Amount | Level 1 | Level 2 | Level 3 | Total Fair Value | |||||||||||||
| Assets | |||||||||||||||||
| Cash and cash equivalents | $ | 544.9 | $ | 544.9 | $ | — | $ | — | $ | 544.9 | |||||||
| Short-term investments | 7.6 | 7.6 | — | — | 7.6 | ||||||||||||
| Restricted cash | 42.2 | 42.2 | — | — | 42.2 | ||||||||||||
| Marketable securities | 40.4 | 40.0 | — | 0.4 | 40.4 | ||||||||||||
| Bond fund investments | 4.7 | 4.7 | — | — | 4.7 | ||||||||||||
| Deferred consideration from the sale of Sadiola | 18.9 | — | — | 18.9 | 18.9 | ||||||||||||
| Derivatives | |||||||||||||||||
| Currency contracts | 24.5 | — | 24.5 | — | 24.5 | ||||||||||||
| Crude oil contracts | 38.5 | — | 38.5 | — | 38.5 | ||||||||||||
| Gold bullion contracts | 1.7 | — | 1.7 | — | 1.7 | ||||||||||||
Extendible Forwards1 | 3.7 | — | 3.7 | — | 3.7 | ||||||||||||
| Embedded derivative - prepayment options on Notes | 1.5 | — | 1.5 | — | 1.5 | ||||||||||||
| $ | 728.6 | $ | 639.4 | $ | 69.9 | $ | 19.3 | $ | 728.6 | ||||||||
| Liabilities | |||||||||||||||||
| Derivatives | |||||||||||||||||
| Gold bullion contracts | $ | (0.7) | $ | — | $ | (0.7) | $ | — | $ | (0.7) | |||||||
| TARF | (3.0) | — | (3.0) | — | (3.0) | ||||||||||||
| Embedded derivative - Rosebel power purchase agreement | (29.2) | — | (29.2) | — | (29.2) | ||||||||||||
Long-term debt - Notes2 | (453.5) | (446.0) | — | — | (446.0) | ||||||||||||
Long-term debt - equipment loans3 | (18.9) | — | (19.1) | — | (19.1) | ||||||||||||
| $ | (505.3) | $ | (446.0) | $ | (52.0) | $ | — | $ | (498.0) | ||||||||
1.The carrying amount excludes unamortized deferred gains of $1.9 million.
2.The carrying amount excludes unamortized deferred transaction costs of $6.3 million and the embedded derivative.
3.The carrying amount excludes unamortized deferred transaction costs of $0.2 million.
(b)Valuation techniques
Cash, cash equivalents, short-term investments and restricted cash
Cash, cash equivalents, short-term investments and restricted cash are included in Level 1 due to the short-term maturity of these financial assets.
Marketable securities
The fair value of marketable securities included in Level 1 is determined based on a market approach. The closing price is a quoted market price from the exchange market which is the principal active market for the particular security. The fair value of investments in equity instruments which are not actively traded is determined using valuation techniques which require inputs that are both unobservable and significant, and therefore were categorized as Level 3 in the fair value hierarchy. The Company uses the latest market transaction price for these securities, obtained from the entity, to value these marketable securities.
Bond fund investments
The fair value of bond fund investments included in Level 1 is measured using quoted prices (unadjusted) in active markets.
Deferred consideration from the sale of Sadiola
The significant estimates and assumptions used in determining the fair value of the contingent payments were the production profile and discount rate and therefore classified within Level 3 of the fair value hierarchy.
Derivatives - options and forwards
For derivative contracts, the Company obtains a valuation of the contracts from counterparties of those contracts. The Company assesses the reasonableness of these valuations through internal methods and third-party valuations. The Company then calculates a credit valuation adjustment to reflect the counterparty’s or the Company’s own default risk. Valuations are based on market valuations considering interest rate and volatility, taking into account the credit risk of the financial instrument. Valuations of derivative contracts are therefore classified within Level 2 of the fair value hierarchy.
IAMGOLD CORPORATION Unaudited Condensed Consolidated Interim Financial Statements – June 30, 2022 | 59 | ||||
Derivative - TARF
The fair value of the TARF as at June 30, 2022 was $5.2 million (December 31, 2021 - $3.0 million) and is accounted for at FVTPL. The TARF contractually obligates the Company to future sales of U.S. dollars that are determined by future USDCAD exchange rates in line with notional amounts established by the arrangement. The valuation is based on the discounted estimated cash flows resulting from prevailing USDCAD rates at each future monthly option fixing date. Key inputs used in the valuation include the credit spread, volatility parameter, the risk-free rate curve and future USDCAD exchange rates. Valuation of the TARF is therefore classified within Level 2 of the fair value hierarchy.
Derivative - Extendible forward currency arrangements
The fair value of the Extendible Forwards as at June 30, 2022 was $2.0 million (December 31, 2021 - $3.7 million) and is accounted for at FVTPL. For both forward contracts and the extension option within the arrangements, the Company obtains a valuation of the contracts from the counterparty. The Company assesses the reasonableness of these valuations through internal methods and third-party valuations. The Company calculates a credit valuation adjustment to reflect the default risk of the counterparty or the Company. Valuations are based on market valuations considering interest rate and volatility, taking into account the credit risk of the financial instrument. Valuations of derivative contracts are therefore classified within Level 2 of the fair value hierarchy.
Embedded derivatives - Prepayment options on the Notes
The fair value of the embedded derivatives as at June 30, 2022 was $nil (December 31, 2021 - $1.5 million) and is accounted for at FVTPL. The valuation is based on the discounted cash flows at the risk-free rate to determine the present value of the prepayment option. Key inputs used in the valuation include the credit spread, volatility parameter and the risk-free rate curve. Valuation of the prepayment option is therefore classified within Level 2 of the fair value hierarchy.
Embedded derivative - Rosebel power purchase agreement
The fair value of the embedded derivative on Rosebel's power purchase agreement as at June 30, 2022 was $24.1 million (December 31, 2021 - $29.2 million) and is accounted for at FVTPL. Included in the power purchase agreement is a price escalator which results in increases in electricity prices linked to the price of gold. The valuation is based on the discounted estimated incremental cash flows above the baseline power price at the risk-free rate to determine the present value of the price escalator. Key inputs used in the valuation include the credit spread, volatility parameter, the risk-free rate curve and future gold price estimates. Valuation of the price escalator is therefore classified within Level 2 of the fair value hierarchy.
Notes
The fair value of the Notes as at June 30, 2022 was $306.7 million (December 31, 2021 - $446.0 million) and is determined using quoted prices (unadjusted) in active markets, and is therefore classified within Level 1 of the fair value hierarchy.
Credit Facility
The fair value of the Credit Facility as at June 30, 2022 was $150.0 million (December 31, 2021 - $nil) which is approximately its carrying amount and drawn amount, and is therefore classified within Level 2 of the fair value hierarchy.
Equipment loans
The fair value of the equipment loans as at June 30, 2022 was $14.1 million (December 31, 2021 - $19.1 million) and is determined by applying a discount rate, reflecting the credit spread based on the Company's credit rating to future cash flows and is therefore classified within Level 2 of the fair value hierarchy.
Other financial assets and liabilities
The fair value of all other financial assets and liabilities of the Company approximate their carrying amounts.
25. Share Capital
The Company is authorized to issue an unlimited number of common shares, first preference shares issuable in series and second preference shares issuable in series.
| Six months ended June 30 | |||||||||||
| Number of common shares (in millions) | 2022 | 2021 | |||||||||
| Outstanding, beginning of the period | 477.0 | 475.3 | |||||||||
| Issuance of shares for share-based compensation | 2.0 | 1.4 | |||||||||
| Outstanding, end of the period | 479.0 | 476.7 | |||||||||
IAMGOLD CORPORATION Unaudited Condensed Consolidated Interim Financial Statements – June 30, 2022 | 60 | ||||
26. Share-Based Compensation
(a)Options
(i)Share option plan
A summary of the status of the Company's share option plan and changes during the period is presented below:
| Six months ended June 30, 2022 | Options (in millions) | Weighted average exercise price (CAD/share)1 | ||||||
| Outstanding, beginning of the period | 5.1 | $ | 4.82 | |||||
| Granted | 0.8 | 4.02 | ||||||
| Exercised | (0.4) | 3.12 | ||||||
| Forfeited | (0.2) | 4.41 | ||||||
| Outstanding, end of the period | 5.3 | $ | 4.86 | |||||
| Exercisable, end of the period | 3.1 | $ | 5.21 | |||||
1.Exercise prices are denominated in Canadian dollars. The CADUSD exchange rate at June 30, 2022 was $0.7770.
(ii)Summary of options granted
The following were the weighted average inputs to the Black-Scholes model used in determining the fair value of the options granted during the period. The estimated fair value of the options is expensed over their expected life.
| Six months ended June 30, | 2022 | ||||
| Weighted average risk-free interest rate | 1.8 | % | |||
Weighted average expected volatility1 | 53 | % | |||
| Weighted average dividend yield | 0.0 | % | |||
| Weighted average expected life of options issued (years) | 5.0 | ||||
| Weighted average grant-date fair value (CAD per share) | $ | 1.89 | |||
| Weighted average share price at grant date (CAD per share) | $ | 4.03 | |||
| Weighted average exercise price (CAD per share) | $ | 4.02 | |||
1.Expected volatility is estimated by considering historic average share price volatility based on the average expected life of the options.
(b)Other share-based compensation
(i)Share incentive plan
A summary of the status of the Company’s outstanding share units issued to directors and employees under the Company's share incentive plan and changes during the period is presented below:
| Six months ended June 30, (in millions) | 2022 | ||||
| Outstanding, beginning of the period | 6.9 | ||||
| Granted | 2.2 | ||||
| Issued | (1.6) | ||||
| Forfeited and withheld for tax | (0.9) | ||||
| Outstanding, end of the period | 6.6 | ||||
(ii)Summary of share units granted
Deferred share units
The estimated fair value of the units is expensed over their twelve month vesting period.
| Six months ended June 30, | 2022 | ||||
| Granted during the period (in millions) | 0.1 | ||||
Grant-date fair value (CAD per share)1 | $ | 3.89 | |||
1. The grant-date fair value is equal to the share price on grant date.
IAMGOLD CORPORATION Unaudited Condensed Consolidated Interim Financial Statements – June 30, 2022 | 61 | ||||
Restricted share units
Employee restricted share unit grants vest over twelve to thirty-six months, have no other restrictions upon vesting and are equity settled. The estimated fair value of the units is expensed over their vesting period.
| Six months ended June 30, | 2022 | ||||
| Granted during the period (in millions) | 1.7 | ||||
Grant-date fair value (CAD per share)1 | $ | 4.03 | |||
1. The grant-date fair value is equal to the share price on grant date.
Performance share units
Employee performance share unit grants vest over thirty-six months, are equity settled and vesting is subject to long-term performance measures. The estimated fair value of the units is expensed over their vesting period.
| Six months ended June 30, | 2022 | ||||
| Granted during the period (in millions) | 0.4 | ||||
Grant-date fair value (CAD per share)1 | $ | 4.15 | |||
1. The grant-date fair value was determined using a Monte Carlo model.
27. Segmented Information
The Company’s gold mines are divided into geographic segments as follows:
•Burkina Faso - Essakane mine;
•Suriname - Rosebel mine and Saramacca pit; and
•Canada - Doyon division, including Westwood mine.
The Company’s non-gold mine segments are divided as follows:
•Côté Gold project1;
•Exploration and evaluation and development; and
•Corporate - includes royalty interests and investment in associate, up to sale of investment.
| June 30, 2022 | December 31, 2021 | |||||||||||||||||||
| Total non- current assets | Total assets | Total liabilities | Total non- current assets | Total assets | Total liabilities | |||||||||||||||
| Gold mines | ||||||||||||||||||||
| Burkina Faso | $ | 783.7 | $ | 1,188.7 | $ | 269.4 | $ | 860.0 | $ | 1,153.4 | $ | 275.4 | ||||||||
| Suriname | 597.4 | 741.7 | 290.6 | 579.5 | 730.0 | 315.7 | ||||||||||||||
| Canada | 300.5 | 319.6 | 213.2 | 339.8 | 368.7 | 260.7 | ||||||||||||||
| Total gold mines | 1,681.6 | 2,250.0 | 773.2 | 1,779.3 | 2,252.1 | 851.8 | ||||||||||||||
Côté Gold project | 1,305.3 | 1,395.0 | 124.5 | 1,022.8 | 1,118.1 | 109.0 | ||||||||||||||
| Exploration and evaluation and development | 128.1 | 161.9 | 5.2 | 120.0 | 148.3 | 9.4 | ||||||||||||||
| Corporate | 87.8 | 319.1 | 872.9 | 98.4 | 453.1 | 684.3 | ||||||||||||||
| Total | $ | 3,202.8 | $ | 4,126.0 | $ | 1,775.8 | $ | 3,020.5 | $ | 3,971.6 | $ | 1,654.5 | ||||||||
______________________________
1.The Côté Gold project is considered a separate operating segment following the decision to proceed with construction in July 2020 as the financial information for the project is reviewed regularly by the Company’s Chief Operating Decision Maker to assess the performance of the project and to make resource allocation decisions. The segment includes the financial information of the Côté UJV as well as other financial information for the Côté Gold project outside of the Côté UJV.
IAMGOLD CORPORATION Unaudited Condensed Consolidated Interim Financial Statements – June 30, 2022 | 62 | ||||
Three months ended June 30, 2022
| Consolidated statements of earnings (loss) information | Capital expenditures4 | |||||||||||||||||||||||||
| Revenues | Cost of sales1 | Depreciation expense2 | General and administrative3 | Exploration | Other | Earnings (loss) from operations | ||||||||||||||||||||
| Gold mines | ||||||||||||||||||||||||||
| Burkina Faso | $ | 218.8 | $ | 97.3 | $ | 59.4 | $ | — | $ | 0.1 | $ | — | $ | 62.0 | $ | 31.6 | ||||||||||
| Suriname | 101.9 | 73.9 | 12.8 | — | 0.3 | 0.7 | 14.2 | 42.4 | ||||||||||||||||||
| Canada | 27.1 | 35.3 | 5.8 | — | — | 0.1 | (14.1) | 9.5 | ||||||||||||||||||
| Total gold mines | 347.8 | 206.5 | 78.0 | — | 0.4 | 0.8 | 62.1 | 83.5 | ||||||||||||||||||
Côté Gold project | — | — | — | 0.6 | 0.9 | (0.1) | (1.4) | 169.6 | ||||||||||||||||||
| Exploration and evaluation and development | — | — | — | — | 8.0 | 0.1 | (8.1) | 3.5 | ||||||||||||||||||
Corporate5 | (13.8) | — | 0.1 | 16.6 | — | (2.2) | (28.3) | (0.5) | ||||||||||||||||||
| Total | $ | 334.0 | $ | 206.5 | $ | 78.1 | $ | 17.2 | $ | 9.3 | $ | (1.4) | $ | 24.3 | $ | 256.1 | ||||||||||
1.Excludes depreciation expense.
2.Depreciation expense excludes depreciation related to corporate office assets, which is included in general and administrative expenses.
3.Includes depreciation expense relating to corporate and exploration and evaluation assets.
4.Includes cash expenditures for property, plant and equipment and exploration and evaluation assets.
5.Includes impact on revenues of delivering ounces into 2019 Prepay Arrangement and earnings from royalty interests.
Three months ended June 30, 2021
| Consolidated statements of earnings (loss) information | Capital expenditures4 | |||||||||||||||||||||||||
| Revenues | Cost of sales1 | Depreciation expense2 | General and administrative3 | Exploration | Other | Earnings (loss) from operations | ||||||||||||||||||||
| Gold mines | ||||||||||||||||||||||||||
| Burkina Faso | $ | 208.2 | $ | 109.4 | $ | 55.0 | $ | — | $ | 0.4 | $ | 0.7 | $ | 42.7 | $ | 29.9 | ||||||||||
| Suriname | 45.2 | 44.5 | 13.1 | — | 0.7 | 4.7 | (17.8) | 26.2 | ||||||||||||||||||
| Canada | 12.2 | 14.1 | 1.4 | — | — | 12.9 | (16.2) | 3.3 | ||||||||||||||||||
| Total gold mines | 265.6 | 168.0 | 69.5 | — | 1.1 | 18.3 | 8.7 | 59.4 | ||||||||||||||||||
Côté Gold project | — | — | — | — | 0.9 | — | (0.9) | 84.7 | ||||||||||||||||||
| Exploration and evaluation and development | — | — | — | — | 10.0 | 0.1 | (10.1) | 8.2 | ||||||||||||||||||
Corporate5 | — | — | 0.2 | 11.8 | — | 0.9 | (12.9) | — | ||||||||||||||||||
| Total | $ | 265.6 | $ | 168.0 | $ | 69.7 | $ | 11.8 | $ | 12.0 | $ | 19.3 | $ | (15.2) | $ | 152.3 | ||||||||||
1.Excludes depreciation expense.
2.Depreciation expense excludes depreciation related to corporate office assets, which is included in general and administrative expenses.
3.Includes depreciation expense relating to corporate and exploration and evaluation assets.
4.Includes cash expenditures for property, plant and equipment and exploration and evaluation assets.
5.Includes earnings from royalty interests.
IAMGOLD CORPORATION Unaudited Condensed Consolidated Interim Financial Statements – June 30, 2022 | 63 | ||||
Six months ended June 30, 2022
| Consolidated statements of earnings (loss) information | Capital expenditures4 | |||||||||||||||||||||||||
| Revenues | Cost of sales1 | Depreciation expense2 | General and administrative3 | Exploration | Other | Earnings (loss) from operations | ||||||||||||||||||||
| Gold mines | ||||||||||||||||||||||||||
| Burkina Faso | $ | 467.0 | $ | 200.4 | $ | 114.3 | $ | — | $ | 0.2 | $ | — | $ | 152.1 | $ | 80.3 | ||||||||||
| Suriname | 193.5 | 140.3 | 27.9 | — | 0.5 | 2.0 | 22.8 | 68.9 | ||||||||||||||||||
| Canada | 57.9 | 66.4 | 10.7 | — | — | (0.1) | (19.1) | 17.3 | ||||||||||||||||||
| Total gold mines | 718.4 | 407.1 | 152.9 | — | 0.7 | 1.9 | 155.8 | 166.5 | ||||||||||||||||||
Côté Gold project | — | — | — | 1.0 | 1.7 | (0.1) | (2.6) | 248.1 | ||||||||||||||||||
| Exploration and evaluation and development | — | — | — | — | 15.1 | 0.2 | (15.3) | 9.6 | ||||||||||||||||||
Corporate5 | (27.8) | — | 0.2 | 31.3 | — | 0.7 | (60.0) | 0.6 | ||||||||||||||||||
| Total | $ | 690.6 | $ | 407.1 | $ | 153.1 | $ | 32.3 | $ | 17.5 | $ | 2.7 | $ | 77.9 | $ | 424.8 | ||||||||||
1.Excludes depreciation expense.
2.Depreciation expense excludes depreciation related to corporate office assets, which is included in general and administrative expenses.
3.Includes depreciation expense relating to corporate and exploration and evaluation assets.
4.Includes cash expenditures for property, plant and equipment and exploration and evaluation assets.
5.Includes impact on revenues of delivering ounces into 2019 Prepay Arrangement and earnings from royalty interests.
Six months ended June 30, 2021
| Consolidated statements of earnings (loss) information | Capital expenditures4 | |||||||||||||||||||||||||
| Revenues | Cost of sales1 | Depreciation expense2 | General and administrative3 | Exploration | Other | Earnings (loss) from operations | ||||||||||||||||||||
| Gold mines | ||||||||||||||||||||||||||
| Burkina Faso | $ | 412.3 | $ | 223.2 | $ | 110.8 | $ | — | $ | 0.8 | $ | 2.3 | $ | 75.2 | $ | 49.8 | ||||||||||
| Suriname | 124.0 | 100.6 | 30.5 | — | 1.4 | 7.9 | (16.4) | 44.6 | ||||||||||||||||||
| Canada | 26.7 | 23.4 | 1.8 | — | — | 26.8 | (25.3) | 4.3 | ||||||||||||||||||
| Total gold mines | 563.0 | 347.2 | 143.1 | — | 2.2 | 37.0 | 33.5 | 98.7 | ||||||||||||||||||
Côté Gold project | — | — | — | — | 1.6 | — | (1.6) | 133.1 | ||||||||||||||||||
| Exploration and evaluation and development | — | — | — | — | 15.8 | 0.3 | (16.1) | 22.7 | ||||||||||||||||||
Corporate5 | — | — | 0.6 | 21.2 | — | 2.2 | (24.0) | 0.3 | ||||||||||||||||||
| Total | $ | 563.0 | $ | 347.2 | $ | 143.7 | $ | 21.2 | $ | 19.6 | $ | 39.5 | $ | (8.2) | $ | 254.8 | ||||||||||
1.Excludes depreciation expense.
2.Depreciation expense excludes depreciation related to corporate office assets, which is included in general and administrative expenses.
3.Includes depreciation expense relating to corporate and exploration and evaluation assets.
4.Includes cash expenditures for property, plant and equipment and exploration and evaluation assets.
5.Includes earnings from royalty interests.
28. Commitments
The Company’s commitments were as follows:
| June 30 | December 31 | |||||||
| 2022 | 2021 | |||||||
| Purchase obligations | $ | 369.3 | $ | 99.6 | ||||
| Capital expenditure obligations | 410.0 | 426.2 | ||||||
| Lease obligations | 78.1 | 80.3 | ||||||
| $ | 857.4 | $ | 606.1 | |||||
IAMGOLD CORPORATION Unaudited Condensed Consolidated Interim Financial Statements – June 30, 2022 | 64 | ||||
FORM 52-109F2
CERTIFICATION OF INTERIM FILINGS
FULL CERTIFICATE
I, Maryse Bélanger, Interim President and Chief Executive Officer of IAMGOLD Corporation, certify the following:
1. Review: I have reviewed the interim financial report and interim MD&A (together, the “interim filings”) of IAMGOLD Corporation (the “issuer”) for the interim period ended June 30, 2022.
2. No misrepresentations: Based on my knowledge, having exercised reasonable diligence, the interim filings do not contain any untrue statement of a material fact or omit to state a material fact required to be stated or that is necessary to make a statement not misleading in light of the circumstances under which it was made, with respect to the period covered by the interim filings.
3. Fair presentation: Based on my knowledge, having exercised reasonable diligence, the interim financial report together with the other financial information included in the interim filings fairly present in all material respects the financial condition, financial performance and cash flows of the issuer, as of the date of and for the periods presented in the interim filings.
4. Responsibility: The issuer’s other certifying officer(s) and I are responsible for establishing and maintaining disclosure controls and procedures (DC&P) and internal control over financial reporting (ICFR), as those terms are defined in National Instrument 52-109 Certification of Disclosure in Issuers’ Annual and Interim Filings, for the issuer.
5. Design: Subject to the limitations, if any, described in paragraphs 5.2 and 5.3, the issuer’s other certifying officer(s) and I have, as at the end of the period covered by the interim filings.
A.designed DC&P, or caused it to be designed under our supervision, to provide reasonable assurance that
a.material information relating to the issuer is made known to us by others, particularly during the period in which the interim filings are being prepared; and
b.information required to be disclosed by the issuer in its annual filings, interim filings or other reports filed or submitted by it under securities legislation is recorded, processed, summarized and reported within the time periods specified in securities legislation; and
B.designed ICFR, or caused it to be designed under our supervision, to provide reasonable assurance regarding the reliability of financial reporting and the preparation of financial statements for external purposes in accordance with the issuer’s GAAP.
5.1 Control framework: The control framework the issuer’s other certifying officer(s) and I used to design the issuer’s ICFR is the Internal Control - Integrated Framework (2013 COSO Framework) published by The Committee of Sponsoring Organizations of the Treadway Commission.
5.2 N/A
5.3 N/A
6. Reporting changes in ICFR: The issuer has disclosed in its interim MD&A any change in the issuer’s ICFR that occurred during the period beginning on April 1, 2022 and ended on June 30, 2022 that has materially affected, or is reasonably likely to materially affect, the issuer’s ICFR.
Date: August 3, 2022
/s/ "Maryse Bélanger"
____________________
Maryse Bélanger
Interim President and Chief Executive Officer
FORM 52-109F2
CERTIFICATION OF INTERIM FILINGS
FULL CERTIFICATION
I, Daniella E. Dimitrov, Chief Financial Officer and Executive Vice President, Strategy and Corporate Development of IAMGOLD Corporation, certify the following:
1. Review: I have reviewed the interim financial report and interim MD&A (together, the "interim filings") of IAMGOLD Corporation (the "issuer") for the interim period ended June 30, 2022.
2. No misrepresentations: Based on my knowledge, having exercised reasonable diligence, the interim filings do not contain any untrue statement of a material fact or omit to state a material fact required to be stated or that is necessary to make a statement not misleading in light of the circumstances under which it was made, with respect to the period covered by the interim filings.
3. Fair presentation: Based on my knowledge, having exercised reasonable diligence, the interim financial report together with the other financial information included in the interim filings fairly present in all material respects the financial condition, financial performance and cash flows of the issuer, as of the date of and for the periods presented in the interim filings.
4. Responsibility: The issuer’s other certifying officer(s) and I are responsible for establishing and maintaining disclosure controls and procedures (DC&P) and internal control over financial reporting (ICFR), as those terms are defined in National Instrument 52-109 Certification of Disclosure in Issuers’ Annual and Interim Filings, for the issuer.
5. Design: Subject to the limitations, if any, described in paragraphs 5.2 and 5.3, the issuer’s other certifying officer(s) and I have, as at the end of the period covered by the interim filings
(A) designed DC&P, or caused it to be designed under our supervision, to provide reasonable assurance that
(I) material information relating to the issuer is made known to us by others, particularly during the period in which the interim filings are being prepared; and
(II) information required to be disclosed by the issuer in its annual filings, interim filings or other reports filed or submitted by it under securities legislation is recorded, processed, summarized and reported within the time periods specified in securities legislation; and
(B) designed ICFR, or caused it to be designed under our supervision, to provide reasonable assurance regarding the reliability of financial reporting and the preparation of financial statements for external purposes in accordance with the issuer’s GAAP.
5.1 Control framework: The control framework the issuer’s other certifying officer(s) and I used to design the issuer’s ICFR is the Internal Control-Integrated Framework (2013 COSO Framework) published by The Committee of Sponsoring Organizations of the Treadway Commission.
5.2 N/A
5.3 N/A
6. Reporting changes in ICFR: The issuer has disclosed in its interim MD&A any change in the issuer’s ICFR
that occurred during the period beginning on April 1, 2022 and ended on June 30, 2022 that has materially affected, or is reasonably likely to materially affect, the issuer’s ICFR.
Date: August 3, 2022
/s/ "Daniella E. Dimitrov"
______________________
Daniella E. Dimitrov
Chief Financial Officer and Executive Vice President, Strategy and Corporate Development
Serious News for Serious Traders! Try StreetInsider.com Premium Free!
You May Also Be Interested In
- IAMGOLD (IAG) PT Raised to $3.75 at Scotiabank
- Biophytis Announces Ratio Change Under its American Depositary Receipt (“ADR”) Program
- IAMGOLD (IAG) PT Raised to $4 at CIBC
Create E-mail Alert Related Categories
SEC FilingsSign up for StreetInsider Free!
Receive full access to all new and archived articles, unlimited portfolio tracking, e-mail alerts, custom newswires and RSS feeds - and more!
