

Form 6-K Guardforce AI Co., Ltd. For: May 17
 Tweet
Tweet Share
Share
UNITED STATES
SECURITIES AND EXCHANGE COMMISSION
WASHINGTON, D.C. 20549
FORM 6-K
REPORT OF FOREIGN PRIVATE ISSUER
PURSUANT TO RULE 13a-16 OR 15d-16 OF THE
SECURITIES EXCHANGE ACT OF 1934
For the month of May 2022
Commission File Number 001-40848
GUARDFORCE AI CO., LIMITED
(Translation of registrant’s name into English)
10 Anson Road, #28-01 International Plaza
Singapore 079903
(Address of principal executive offices)
Indicate by check mark whether the registrant files or will file annual reports under cover of Form 20-F or Form 40-F:
Form 20-F ☒ Form 40-F ☐
Indicate by check mark if the registrant is submitting the Form 6-K in paper as permitted by Regulation S-T Rule 101(b)(1): ☐
Indicate by check mark if the registrant is submitting the Form 6-K in paper as permitted by Regulation S-T Rule 101(b)(7): ☐
On May 17, 2022, Guardforce AI Co., Limited (the “Company”) issued a new investor presentation dated May 2022. A copy of that investor presentation is attached as Exhibit 99.1 hereto.
This current report of Form 6-K and the attached Exhibit 99.1 investor presentation are incorporated by reference into (i) the prospectus contained in the Company’s registration statement on Form F-3 (SEC File No. 333-261881) declared effective by the Securities and Exchange Commission on January 5, 2022 and (ii) the prospectus dated February 9, 2022 contained in the Company’s registration statement on Form F-3 (SEC File No. 333-262441) declared effective by the Securities and Exchange Commission on February 9, 2022.
EXHIBIT INDEX
| Exhibit No. | Description | |
| 99.1 | Investor Prtesentation - May 2022 |
1
SIGNATURES
Pursuant to the requirements of the Securities Exchange Act of 1934, the registrant has duly caused this report to be signed on its behalf by the undersigned, thereunto duly authorized.
| Date: May 17, 2022 | Guardforce AI Co., Limited | |
| By: | /s/ Lei Wang | |
| Lei Wang | ||
| Chief Executive Officer | ||
2
Exhibit 99.1
INVESTOR PRESENTATION May 2022 Growth Through Innovation GUARDFORCE AI CO., LTD

This presentation contains forward - looking statements that are based on our management’s beliefs and assumptions and on information currently available to us . All statements other than statements of historical facts are forward - looking . These statements relate to future events or to our future financial performance and involve known and unknown risks, uncertainties and other factors that may cause our actual results, levels of activity, performance or achievements to be materially different from any future results, levels of activity, performance or achievements expressed or implied by these forward - looking statements . Forward - looking statements include, but are not limited to, statements about : our goals and strategies ; our future business development, financial condition and results of operations ; expected changes in our revenue, costs or expenditures ; growth of and competition trends in our industry ; our expectations regarding demand for, and market acceptance of, our products ; our expectations regarding our relationships with investors, institutional funding partners and other parties we collaborate with ; our expectation regarding the use of proceeds from the offering ; fluctuations in general economic and business conditions in the markets in which we operate ; relevant government policies and regulations relating to our industry ; key personnel continuing their employment with us ; and the duration and impact of the COVID - 19 pandemic . In some cases, you can identify forward - looking statements by terms such as “may,” “could,” “will,” “should,” “would,” “expect,” “plan,” “intend,” “anticipate,” “believe,” “estimate,” “predict,” “potential,” “project” or “continue” or the negative of these terms or other comparable terminology . These statements are only predictions . You should not place undue reliance on forward - looking statements because they involve known and unknown risks, uncertainties and other factors, which are, in some cases, beyond our control and which could materially affect results . Factors that may cause actual results to differ materially from current expectations include, among other things, those listed under the heading “Risk Factors” and elsewhere in the registration statement that we have filed with the SEC . If one or more of these risks or uncertainties occur, or if our underlying assumptions prove to be incorrect, actual events or results may vary significantly from those implied or projected by the forward - looking statements . No forward - looking statement is a guarantee of future performance . In addition, statements that “we believe” and similar statements reflect our beliefs and opinions on the relevant subject . These statements are based upon information available to us as of the date on which the statements are made in this presentation, and while we believe such information forms a reasonable basis for such statements, such information may be limited or incomplete, and our statements should not be read to indicate that we have conducted an exhaustive inquiry into, or review of, all potentially available relevant information . These statements are inherently uncertain and investors are cautioned not to unduly rely upon these statements . The forward - looking statements made in this presentation relate only to events or information as of the date on which the statements are made in this presentation . Although we have ongoing disclosure obligations under United States federal securities laws, we do not intend to update or otherwise revise the forward - looking statements in this presentation, whether as a result of new information, future events or otherwise . This presentation also contains estimates and other statistical data made by independent parties and by us relating to market - size and other data about our industry . This data involves a number of assumptions and limitations, and you are cautioned not to give undue weight to such data and estimates . In addition, projections, assumptions and estimates of our future performance and the future performance of the markets in which we operate are necessarily subject to a high degree of uncertainty and risk . Neither we nor our affiliates, advisors or representatives makes any representation as to the accuracy or completeness of that data or undertake to update such data after the date of this presentation . FORWARD LOOKING DISCLOSURES 2

Strong Growth Trajectory & Majority Recurring Revenues FY 2021 Revenues $35.2 million; Estimated FY 2022 Revenues $55 - $60 million Premier Customer base / Expanding Global Presence – Now in 9 Markets Singapore, Thailand, Hong Kong, Malaysia, Macau, China, United States, Dubai & Australia Diversified Business Model : Robots - as - a - Service (RaaS), Platform - as - a - Service (PaaS), Information Security (IS) 4,800 Deployments, Development of Intelligent Cloud Platform (ICP) & Penetration Testing Solid Balance Sheet Cash and Cash Equivalents of approximately $15.9 million as of December 31, 2021 KEY HIGHLIGHTS 3

EXPERIENCED MANAGEMENT TERENCE YAP 4 KEE YUN KWAN “TOMMY” CHUNG CHI NG “CYNTHIA” LEI WANG “OLIVIA” More than 25 years in Security and Telecoms, FHKIOD, FCMI (UK), AICD (AUS) EXECUTIVE CHAIRMAN CEO CFO COO More than 15 years in the Security More than 17 years in Audit and Finance. CPA, FCCA More than 40 years in Security, VP Thailand Security Association BOARD MEMBER BOARD MEMBER

SEASONED INDEPENDENT BOARD JOHN FLETCHER CHAIR - COMPENSATION • Chief Operating Officer at Pluris Capital Group, Inc • Registered broker/dealer and Chief Financial Officer at Rebus Capital Group, LLC • Formerly served as the Managing Director at Maxim Capital Group, LLC • Previously served as a Managing Director and co - head of Brean Capital, LLC DONALD PANGBURN CHAIR - AUDIT • Formerly North America Director at Horwath International and served as executive council • Specialized in providing services to SEC reporting clients in Hong Kong, Taiwan, Mainland China, Singapore and Malaysia • Certified Public Accountant in the United States DAVID VICCARS CHAIR - NOMINATING • Over 20 years of senior - level experience in the security industry within the APAC region • Former Director at Securitas Asia • Formerly served the British Army with the Royal Tank Regiment 5

THE WORLD NEEDS SECURITY Source : 1. https:// www.grandviewresearch.com/blog/global - secure - logistics - market - size - analysis 2. https:// www.mordorintelligence.com/industry - reports/service - robotics - market 3. https:// www.mordorintelligence.com/industry - reports/asia - pacific - cyber - security - market SECURED LOGISTICS 109.25 1 USD billion by 2025 212.62 2 USD billion by 2026 ROBOTS AS A SERVICE (RaaS) 51.42 USD billion by 2026 3 INFORMATION SECURITY 6

CORPORATE OVERVIEW A GLOBAL INTEGRATED SECURITY SOLUTIONS PROVIDER THAT IS FOCUSED ON DEVELOPING ROBOTIC SOLUTIONS AND INFORMATION SECURITY SERVICES THAT COMPLEMENT OUR WELL - ESTABLISHED SECURED LOGISTICS BUSINESS . ˜ 1800 DEDICATED PROFESSIONALS 9 MARKETS 3 BUSINESS FOCUSES 7

OUR JOURNEY UPLISTED ON NASDAQ CM HQ IN SINGAPORE SECURICOR THAILAND ESTABLISHED 1982 G4S CASH SOLUTIONS (THAILAND) 2005 GUARDFORCE CASH SOLUTIONS (THAILAND) 2016 GFAI ESTABLISHED. ACQUIRES GUARDFORCE CASH SOLUTIONS (THAILAND) 2018 LAUNCHED ROBOTICS SOLUTIONS IN ASIA 2020 INFORMATION SECURITY VIA ACQUISTION OF HANDSHAKE 2021 SINGAPORE, HONG KONG, THAILAND, MALAYSIA, MACAU, USA, CHINA, DUBAI, AUSTRALIA 9 MARKETS PRESENT 40 8 YEARS OF PROFESSIONAL SERVICES

1 : SECURED LOGISTICS END TO END CASH SOLUTION Comprehensive end - to - end Cash Management Solution supporting Banks, Government Organizations, Multi - Nationals, Blue Chip Companies and more o Trusted Partner in Thailand o One - Stop - Shop Solution: Processing, Verification and Banking o Proven Capabilities with Extensive Service Record and Experience o 21 Branches in Thailand o > 450 Secured Vehicles 9

2 : ROBOTS AS A SERVICE (RaaS) AUTOMATION AND CONVINENCE TO CLIENTS Fully Outsourced hiring of Robots. Includes maintenance and upgrades. Dedicated intelligent machines capable of performing tasks 24 X 7. Monthly Service Fee or One - Off Purchase. Concierge Robot • Contactless temperature screening • Attendance management • Eye - catching information and advertising display Applications : shopping malls, schools, offices, factories, residential estates, supermarkets, hospitals, etc Delivery Robot • Indoor delivery service • Obstacle avoidance • Autonomous navigation Applications : hotels, hospitals, offices, shopping malls, etc Spray Robot • Effective mist disinfection • Automatic operations • Autonomous navigation • Autonomous charging Applications : hospitals, shopping malls, schools, offices, factories, etc 10

2 : PLATFORM AS A SERVICE (PaaS) INTELLIGENT CLOUD PLATFORM Remote Management of Robots deployed, Collection and Analysis of Results and Performance. Genesis of Artificial Intelligence features. o Dashboard o Highly Scalable to integrate increasing deployments o Open Platform to facilitate different deployments o Creation of Multi - Revenue Machine deployments 11

RaaS In Action 12

3 : INFORMATION SECURITY 13 VULNERABILITY ASSESSMENT OF INFORMATION RISK Premier Information Security Consultants providing Network Security solutions to Multi - National Corporations in Hong Kong and Globally o External & Internal Penetration Test o Wireless Network Test o Web Application Test o PCI Services o Forensic Services o Training o Consultancy
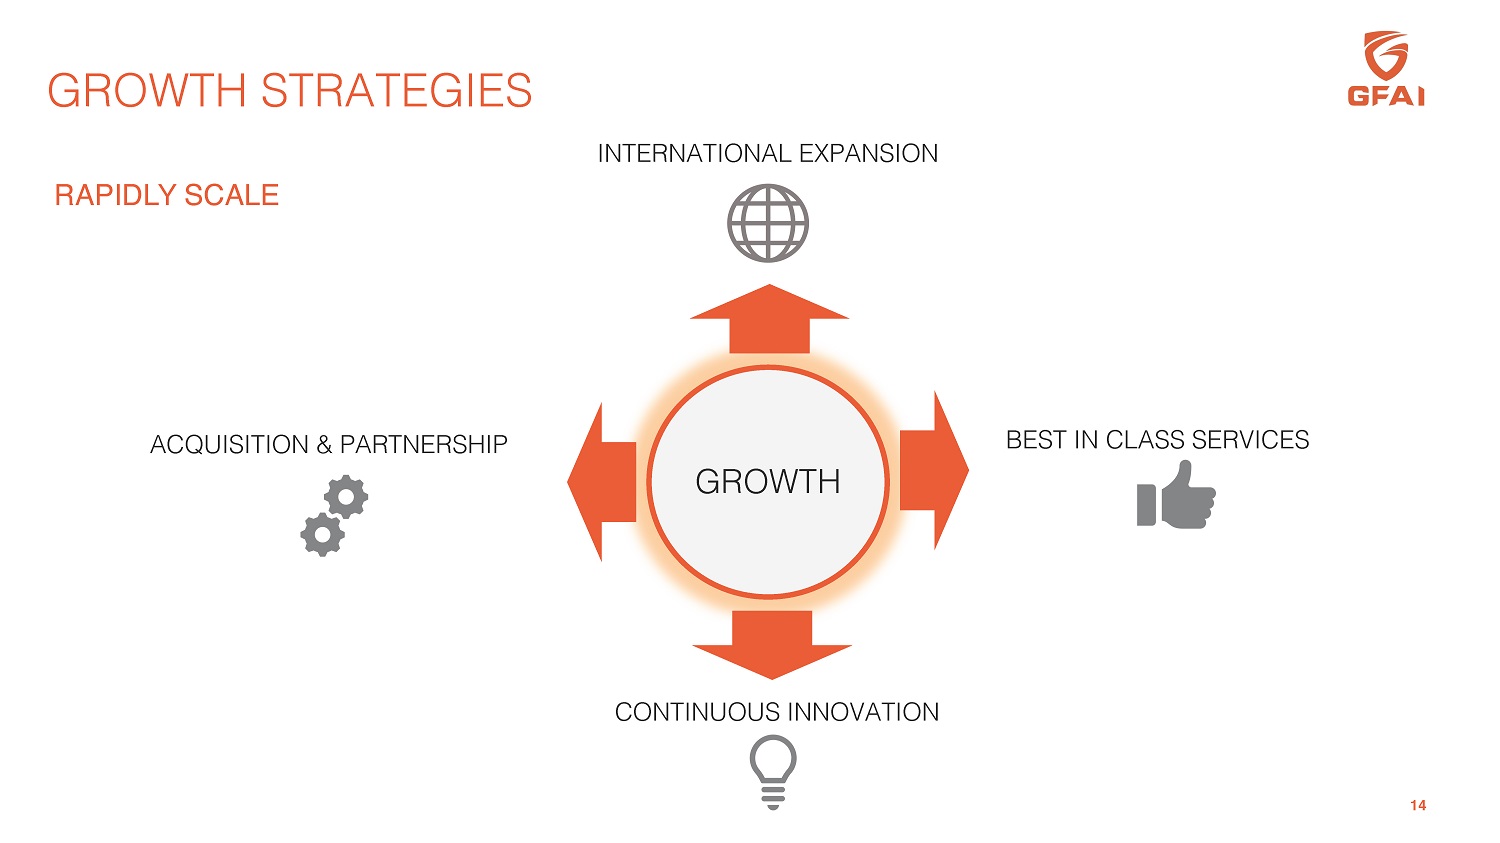
GROWTH STRATEGIES RAPIDLY SCALE BEST IN CLASS SERVICES GROWTH INTERNATIONAL EXPANSION CONTINUOUS INNOVATION ACQUISITION & PARTNERSHIP 14

GROWING MARKET REACH UNITED STATES HONG KONG MACAU DUBAI CHINA AUSTRALIA THAILAND MALAYSIA SINGAPORE o Singapore HQ o 1 to 9 Markets within 24 months o Continuous outreach and expansion 9 15 MARKETS
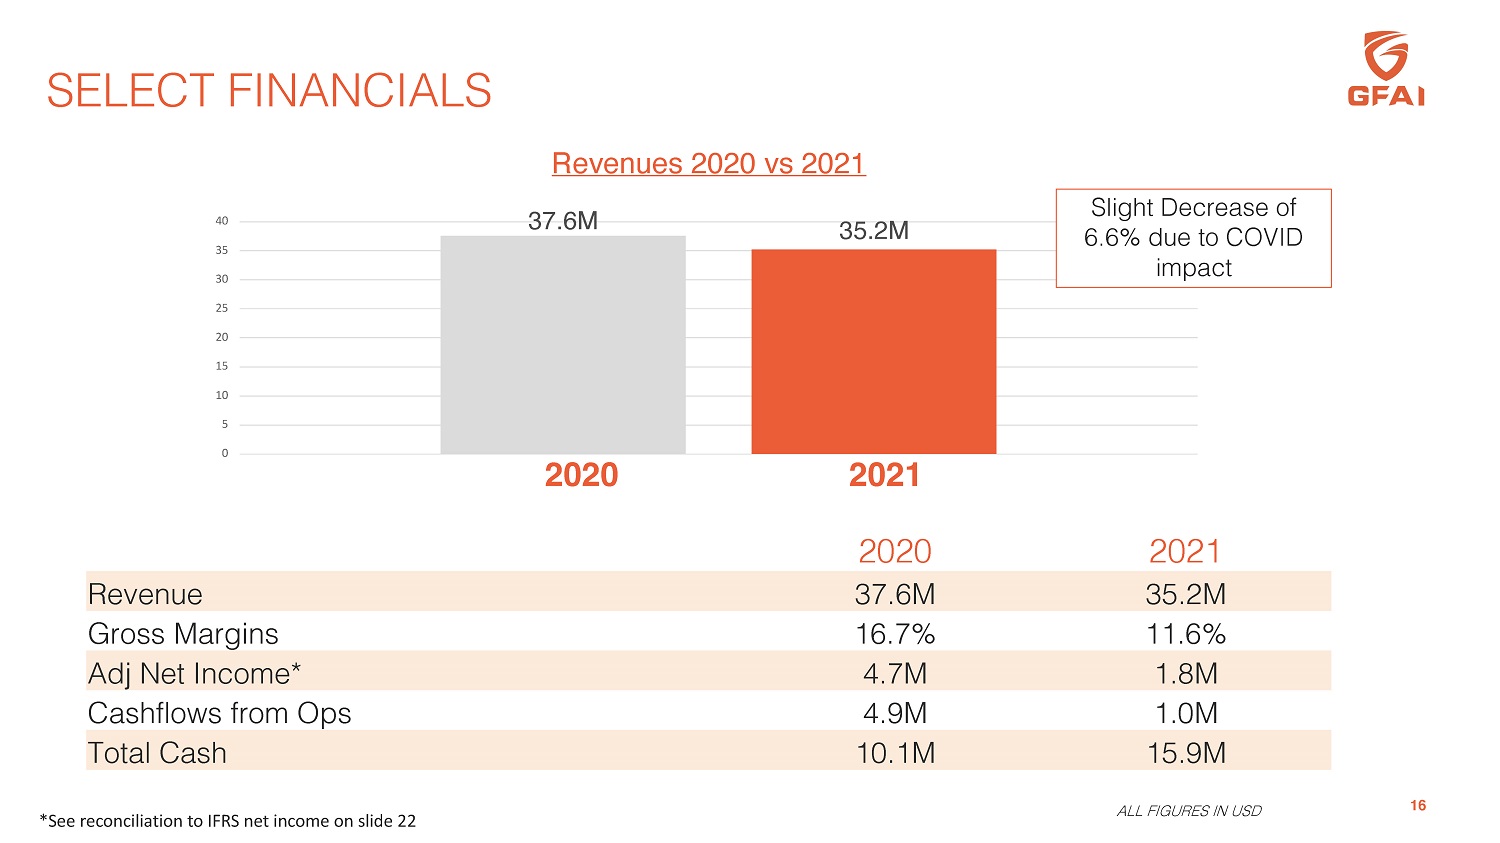
SELECT FINANCIALS 16 2020 2021 Revenue 37.6M 35.2M Gross Margins 16.7% 11.6% Adj Net Income* 4.7M 1.8M Cashflows from Ops 4.9M 1.0M Total Cash 10.1M 15.9M ALL FIGURES IN USD 37.6M 35.2M 0 25 20 15 10 5 30 35 40 Revenues 2020 vs 2021 2020 2021 Slight Decrease of 6.6% due to COVID impact *See reconciliation to IFRS net income on slide 22

2022 : OUTLOOK 0 30 20 10 40 50 60 70 2021 (A) 2022 (F) $35.2 M $55.0 - $60.0 M Significant Revenue Growth 2021 17 2022 Revenue $35.2M $55 - 60M Growth (estimated) - > 66%

TARGET BUSINESS MODEL x Maintain momentum of Revenue Growth trajectory (via Organic & Inorganic) x Continue to Drive shift of Revenue mix towards Technology (i.e., Robotics, Information Security, etc) x Expansion to Key Strategic Markets within Asia Pacific and US x Highly Scalable Business Model to drive Profitability Acquisition Driven Approx.. 66% Organic Approx. 34% Acquire Major Shift in Revenue Mix Approx. 56% Secure Logistics 18 Approx. 44% Technology

KEY STATISTICS 19 Ticker (NASDAQ) GFAI Share Price (05/06/2022) $0.60 Common Shares Outstanding (03/31/2022) 31.5M Market Capitalization 25.0M Cash and Cash Equivalent (12/31/2021) $15.9M Insider & Principal Shareholders 48.7%

◉ 40 Years of Service Excellence ◉ Sector Focus : Security & Facilities Management ◉ Technology Adoption : Robotics & Information Security ◉ Majority Recurring Revenues ◉ Significant Growth Opportunities ◉ Seasoned Management team and Board RIGHT TEAM RIGHT TIME RIGHT PLACE RIGHT FOCUS INVESTMENT HIGHLIGHT 20

Terence Yap Executive Chairman [email protected] Hu Yu Corporate Communications [email protected] 21 GUARDFORCE AI CO., LTD Investor Relations: David K. Waldman/Natalya Rudman Crescendo Communications, LLC Email: INUV@crescendo - ir.com Tel: (212) 671 - 1021

APPENDIX Non - IFRS financial data 22 2021 2020 2019 Net loss – IFRS $ (5,491,654) $ (3,142,255) $ 60,077 Finance costs 984,843 898,748 886,465 Income tax (benefit) expense (732,868) 242,837 88,473 Depreciation and amortization expense 5,032,642 5,034,019 5,246,912 EBITDA (207,037) 3,033,349 6,281,927 Stock - based compensation expense - 100,936 - Provision for withholding tax receivables 190,038 1,012,543 - Written off of withholding tax receivables - 710,219 - Foreign exchange losses (gains), net 1,821,175 (68,294 ) - Adjusted net income (Non - IFRS) $ 1,804,176 $ 4,788,753 $ 6,281,927 Non - IFRS earnings per share Basic and diluted profit for the year attributable to ordinary equity holders of the Company $ 0.10 $ 0.28 $ 0.38 Weighted average number of shares used in computation: Basic and diluted * Giving retroactive effect to the reverse split on August 20, 2021. 17,537,238 17,224,232 * 16,666,663 * To supplement our consolidated financial statements, which are prepared and presented in accordance with IFRS, we use the non - IFRS adjusted EBITDA as financial measures for our consolidated results . We believe that adjusted EBITDA helps identify underlying trends in our business that could otherwise be distorted by the effect of certain income or expenses that we include in loss from operations and net loss . We believe that these non - IFRS measures provide useful information about our core operating results, enhance the overall understanding of our past performance and future prospects and allow for greater visibility with respect to key metrics used by our management in its financial and operational decision - making . We present the non - IFRS financial measures in order to provide more information and greater transparency to investors about our operating results . EBITDA represents net income before (i) finance costs, income taxes and depreciation of fixed assets and amortization of intangible assets, which we do not believe are reflective of our core operating performance during the periods presented . Non - IFRS adjusted net income represents net income before (i) finance costs, foreign exchange losses (gain), income tax (benefit) expense and depreciation of fixed assets and amortization of intangible assets, (ii) certain non - cash expenses, consisting of stock - based compensation expense, provision for and written off of withholding tax receivables. Non - IFRS earnings per share represents non - IFRS net income attributable to ordinary shareholders divided by the weighted average number of shares outstanding during the periods . Non - IFRS diluted earnings per share represents non - IFRS net income attributable to ordinary shareholders divided by the weighted average number of shares outstanding during the periods on a diluted basis . The table below is a reconciliation of our net income to EBITDA and non - IFRS net income for the periods indicated : For the years ended December 31,
Serious News for Serious Traders! Try StreetInsider.com Premium Free!
You May Also Be Interested In
- 2024 United States Mint American Eagle Gold Proof Coins on Sale May 2
- BHP and Carlton Trail College Building Mining Training Pathways in Saskatchewan
- Blink Charging to Host First Quarter 2024 Conference Call on Thursday, May 9, 2024
Create E-mail Alert Related Categories
SEC FilingsSign up for StreetInsider Free!
Receive full access to all new and archived articles, unlimited portfolio tracking, e-mail alerts, custom newswires and RSS feeds - and more!
