

Form 6-K FIRST MAJESTIC SILVER For: May 05
 Tweet
Tweet Share
Share
UNITED STATES
SECURITIES AND EXCHANGE COMMISSION
Washington, D.C. 20549
Form 6-K
REPORT OF FOREIGN PRIVATE ISSUER
PURSUANT TO RULE 13a-16 OR 15d-16
OF THE SECURITIES EXCHANGE ACT OF 1934
For the month of May 2021
Commission File Number: 001-34984
First Majestic Silver Corp.
(Translation of registrant’s name into English)
925 West Georgia Street, Suite 1800
Vancouver, B.C. V6C 3L2
Canada
(Address of principal executive offices)
Indicate by check mark whether the registrant files or will file annual reports under cover of Form 20-F or Form 40-F.
Form 20-F ☐ Form 40-F ☒
Indicate by check mark if the registrant is submitting the Form 6-K in paper as permitted by Regulation S-T Rule 101(b)(1) ☐
Indicate by check mark if the registrant is submitting the Form 6-K in paper as permitted by Regulation S-T Rule 101(b)(7) ☐
DOCUMENTS FILED AS PART OF THIS FORM 6-K
| Exhibit |
Description | |
| 99.1 | Technical Report | |
SIGNATURES
Pursuant to the requirements of the Securities Exchange Act of 1934, the registrant has duly caused this report to be signed on its behalf by the undersigned, thereunto duly authorized.
| FIRST MAJESTIC SILVER CORP. | ||||
| Date: May 5, 2021 | ||||
| By: | /s/ Connie Lillico | |||
| Name: Connie Lillico | ||||
| Title: Corporate Secretary | ||||
Exhibit 99.1

Technical Report on the Jerritt Canyon Gold Mine, Elko County, Nevada, USA
SLR Project No: 233.03396.R0000
Prepared by
SLR Consulting (Canada) Ltd.
55 University Ave., Suite 501
Toronto, ON M5J 2H7
for
First Majestic Silver Corp.
1800 – 925 West Georgia Street
Vancouver, BC
V6C 3L2
Effective Date – December 31, 2020
Signature Date - April 30, 2021
| Prepared by:
Ryan Rodney, C.P.G.
Gordon L. Fellows, P.E.
Chelsea Hamilton, P.Eng.
Andrew P. Hampton, M.Sc., P.Eng.
Jeremy Scott Collyard, MMSA QP
Peer Reviewed by:
Luke Evans, M.Sc., P.Eng.
Jason J. Cox, P.Eng.
Lance Engelbrecht, P.Eng.
Deborah A. McCombe, P.Geo. |
Approved by:
Project Manager
Grant A. Malensek, M.Eng., P.Eng.
Project Director
Richard J. Lambert, P.E., P.Eng. |
FINAL
| Distribution: | 1 copy – First Majestic Silver Corp. |
1 copy – SLR Consulting (Canada) Ltd.

| CONTENTS |
||||||
| 1.0 |
SUMMARY | 1-9 | ||||
| 1.1 |
Executive Summary | 1-9 | ||||
| 1.2 |
Economic Analysis | 1-18 | ||||
| 1.3 |
Technical Summary | 1-25 | ||||
| 2.0 |
INTRODUCTION | 2-1 | ||||
| 2.1 |
Sources of Information | 2-1 | ||||
| 2.2 |
List of Abbreviations | 2-3 | ||||
| 3.0 |
RELIANCE ON OTHER EXPERTS | 3-1 | ||||
| 4.0 |
PROPERTY DESCRIPTION AND LOCATION | 4-2 | ||||
| 4.1 |
Property Description and Location | 4-2 | ||||
| 4.2 |
Land Tenure | 4-5 | ||||
| 5.0 |
ACCESSIBILITY, CLIMATE, LOCAL RESOURCES, INFRASTRUCTURE AND PHYSIOGRAPHY | 5-1 | ||||
| 5.1 |
Accessibility | 5-1 | ||||
| 5.2 |
Physiography | 5-1 | ||||
| 5.3 |
Climate |
5-1 | ||||
| 5.4 |
Local Resources |
5-1 | ||||
| 5.5 |
Infrastructure | 5-2 | ||||
| 6.0 |
HISTORY | 6-1 | ||||
| 6.1 |
Prior Ownership | 6-1 | ||||
| 6.2 |
Production History | 6-1 | ||||
| 6.3 |
Exploration | 6-9 | ||||
| 7.0 |
GEOLOGICAL SETTING AND MINERALIZATION | 7-1 | ||||
| 7.1 |
Regional and Local Geology | 7-1 | ||||
| 7.2 |
Mineralization | 7-5 | ||||
| 8.0 |
DEPOSIT TYPES |
8-1 | ||||
| 9.0 |
EXPLORATION | 9-1 | ||||
| 9.1 |
Exploration Potential | 9-3 | ||||
| 10.0 |
DRILLING | 10-1 | ||||
| 10.1 |
Underground Drilling | 10-1 | ||||
| 10.2 |
Surface Drilling | 10-9 | ||||
| 10.3 |
Drilling After April 29, 2020 | 10-21 | ||||
| 11.0 |
SAMPLE PREPARATION, ANALYSES, AND SECURITY | 11-1 | ||||
| First Majestic Silver Corp. | Jerritt Canyon Gold Mine, SLR Project No: 233.03396.R0000
| ||||
| NI 43-101 Technical Report - April 30, 2021 | i | |||
| 11.1 |
Drill Sample Handling and Logging Procedures | 11-1 | ||||
| 11.2 |
Sampling Method and Approach | 11-1 | ||||
| 11.3 |
Sample Preparation and Analysis | 11-4 | ||||
| 11.4 |
Quality Assurance/Quality Control | 11-6 | ||||
| 12.0 |
DATA VERIFICATION | 12-1 | ||||
| 12.1 |
Historical Database Verifications | 12-1 | ||||
| 12.2 |
Recent Data Verification | 12-1 | ||||
| 13.0 |
MINERAL PROCESSING AND METALLURGICAL TESTING | 13-1 | ||||
| 14.0 |
MINERAL RESOURCE ESTIMATE | 14-1 | ||||
| 14.1 |
Summary | 14-1 | ||||
| 14.2 |
Topography | 14-3 | ||||
| 14.3 |
Description of the Databases | 14-5 | ||||
| 14.4 |
Mineralization Wireframes | 14-7 | ||||
| 14.5 |
Compositing Methods and Grade Capping | 14-13 | ||||
| 14.6 |
Bulk Density | 14-14 | ||||
| 14.7 |
Variography | 14-14 | ||||
| 14.8 |
Block Model Construction | 14-18 | ||||
| 14.9 |
Interpolation Strategy | 14-21 | ||||
| 14.10 |
Block Model Validation | 14-23 | ||||
| 14.11 |
Mineral Resource Classification Criteria | 14-34 | ||||
| 14.12 |
Cut-off Grade | 14-37 | ||||
| 14.13 |
Reasonable Prospects for Eventual Economic Extraction | 14-37 | ||||
| 14.14 |
Mineral Resource Estimate | 14-37 | ||||
| 14.15 |
Factors that May Affect the Mineral Resource Estimate | 14-40 | ||||
| 15.0 |
MINERAL RESERVE ESTIMATE | 15-1 | ||||
| 15.1 |
Summary | 15-1 | ||||
| 15.2 |
Dilution | 15-3 | ||||
| 15.3 |
Extraction | 15-3 | ||||
| 15.4 |
Cut-Off Grade | 15-4 | ||||
| 16.0 |
MINING METHODS | 16-1 | ||||
| 16.1 |
Stoping Methods | 16-4 | ||||
| 16.2 |
Mine Development | 16-4 | ||||
| 16.3 |
Geomechanics, Ground Support | 16-4 | ||||
| 16.4 |
Backfill | 16-4 | ||||
| 16.5 |
Groundwater Control | 16-5 | ||||
| 16.6 |
Mining Equipment | 16-15 | ||||
| 16.7 |
Production Rate | 16-16 | ||||
| 16.8 |
Production Schedule | 16-17 | ||||
| First Majestic Silver Corp. | Jerritt Canyon Gold Mine, SLR Project No: 233.03396.R0000
| ||||
| NI 43-101 Technical Report - April 30, 2021 | ii | |||
| 17.0 |
RECOVERY METHODS |
17-1 | ||||
| 17.1 |
Processing Plant |
17-1 | ||||
| 18.0 |
PROJECT INFRASTRUCTURE |
18-1 | ||||
| 18.1 |
Road Access |
18-1 | ||||
| 18.2 |
Water Sources |
18-1 | ||||
| 18.3 |
Power |
18-1 | ||||
| 18.4 |
Sewage and Waste Disposal |
18-1 | ||||
| 18.5 |
Ore Stockpiles |
18-1 | ||||
| 18.6 |
Tailings Storage Facility |
18-2 | ||||
| 18.7 |
Water Treatment Plants |
18-14 | ||||
| 19.0 |
MARKET STUDIES AND CONTRACTS |
19-1 | ||||
| 19.1 |
Markets |
19-1 | ||||
| 19.2 |
Supply and Services Contracts |
19-1 | ||||
| 20.0 |
ENVIRONMENTAL STUDIES, PERMITTING, AND SOCIAL OR COMMUNITY IMPACT |
20-1 | ||||
| 20.1 |
Environmental Studies |
20-1 | ||||
| 20.2 |
Project Permitting & Current Status |
20-1 | ||||
| 20.3 |
Social or Community Requirements |
20-9 | ||||
| 20.4 |
Mine Closure Requirements |
20-9 | ||||
| 21.0 |
CAPITAL AND OPERATING COSTS |
21-1 | ||||
| 21.1 |
Capital Costs |
21-1 | ||||
| 21.2 |
Operating Costs |
21-1 | ||||
| 22.0 |
ECONOMIC ANALYSIS |
22-1 | ||||
| 22.1 |
Economic Criteria |
22-1 | ||||
| 22.2 |
Cash Flow |
22-2 | ||||
| 22.3 |
Sensitivity Analysis |
22-5 | ||||
| 23.0 |
ADJACENT PROPERTIES |
23-1 | ||||
| 24.0 |
OTHER RELEVANT DATA AND INFORMATION |
24-1 | ||||
| 25.0 |
INTERPRETATION AND CONCLUSIONS |
25-1 | ||||
| 25.1 |
Geology and Mineral Resources |
25-1 | ||||
| 25.2 |
Mining and Mineral Reserves |
25-2 | ||||
| 25.3 |
Mineral Processing and Metallurgical Testing |
25-2 | ||||
| 25.4 |
Infrastructure |
25-3 | ||||
| 25.5 |
Tailings and Water Management Facilities |
25-3 | ||||
| 25.6 |
Environmental Considerations |
25-4 | ||||
| 25.7 |
Safety |
25-5 | ||||
| First Majestic Silver Corp. | Jerritt Canyon Gold Mine, SLR Project No: 233.03396.R0000
| ||||
| NI 43-101 Technical Report - April 30, 2021 | iii | |||
| 26.0 |
RECOMMENDATIONS |
26-1 | ||||
| 26.1 |
Geology and Mineral Resources |
26-1 | ||||
| 26.2 |
Mining and Mineral Reserves |
26-1 | ||||
| 26.3 |
Mineral Processing and Metallurgical Testing |
26-1 | ||||
| 26.4 |
Infrastructure |
26-1 | ||||
| 26.5 |
Tailings and Water Management Facilities |
26-2 | ||||
| 26.6 |
Environmental Considerations |
26-2 | ||||
| 26.7 |
Safety |
26-2 | ||||
| 27.0 |
REFERENCES |
27-1 | ||||
| 28.0 |
DATE AND SIGNATURE PAGE |
28-1 | ||||
| 29.0 |
CERTIFICATE OF QUALIFIED PERSON |
29-1 | ||||
| 29.1 |
Ryan Rodney |
29-1 | ||||
| 29.2 |
Gordon L. Fellows |
29-2 | ||||
| 29.3 |
Chelsea Hamilton |
29-3 | ||||
| 29.4 |
Andrew P. Hampton |
29-4 | ||||
| 29.5 |
Jeremy Scott Collyard |
29-5 | ||||
TABLES
| Table 1-1: |
Summary of Mineral Resources (effective date December 31, 2020, Imperial Units) |
1-9 | ||||
| Table 1-2: |
Summary of Mineral Resources (effective date December 31, 2020, Metric Units) |
1-10 | ||||
| Table 1-3: |
Summary of Mineral Reserves (effective date December 31, 2020, Imperial Units) |
1-10 | ||||
| Table 1-4: |
Summary of Mineral Reserves (effective date December 31, 2020, Metric Units) |
1-11 | ||||
| Table 1-5: |
After-Tax Cash Flow Summary |
1-21 | ||||
| Table 1-6: |
Cash Flow Analysis |
1-23 | ||||
| Table 1-7: |
After-Tax Sensitivity Analysis |
1-24 | ||||
| Table 1-8: |
Sustaining Capital Cost Estimate |
1-31 | ||||
| Table 1-9: |
Operating Cost Estimate |
1-31 | ||||
| Table 4-1: |
Summary of Claims |
4-5 | ||||
| Table 4-2: |
Summary of Claim Payments |
4-5 | ||||
| Table 6-1: |
Mine Production History |
6-2 | ||||
| Table 6-2: |
Production by JCG from 2015 to December 2020 |
6-3 | ||||
| Table 6-3: |
Jerritt Canyon Process Plant Production |
6-6 | ||||
| Table 6-4: |
Summary of Chip Sampling on Jerritt Canyon Property |
6-19 | ||||
| Table 6-5: |
Historical Underground Drilling by Deposit |
6-20 | ||||
| First Majestic Silver Corp. | Jerritt Canyon Gold Mine, SLR Project No: 233.03396.R0000
| ||||
| NI 43-101 Technical Report - April 30, 2021 | iv | |||
| Table 10-1: |
Underground Drilling by JCG |
10-1 | ||||
| Table 10-2: |
Composited Intercepts for Underground Drilling Results (2018-2020) |
10-9 | ||||
| Table 10-3: |
2016-2019 Surface Exploration Drilling Totals |
10-9 | ||||
| Table 10-4: |
2019 North Generator Drilling Results |
10-17 | ||||
| Table 10-5: |
2019 Extension Drilling Results – Coulee and Smith Areas |
10-19 | ||||
| Table 10-6: |
Exploration Drilling Results April 30, 2020 through December 31, 2020 |
10-21 | ||||
| Table 11-1: |
Summary of QA/QC Submittals: 2008 to 2020 |
11-6 | ||||
| Table 11-2: |
2010 to 2020 Certified Reference Material and Statistics |
11-8 | ||||
| Table 12-1: |
Previous Database Audits |
12-1 | ||||
| Table 13-1: |
Annual Mill Production Data 1981 to 2020 |
13-1 | ||||
| Table 13-2: |
Monthly Mill Production Data 2018 to 2020 |
13-4 | ||||
| Table 14-1: |
Summary of Mineral Resources (effective date December 31, 2020, Imperial Units) |
14-2 | ||||
| Table 14-2: |
Summary of Mineral Resources (effective date December 31, 2020, Metric Units) |
14-2 | ||||
| Table 14-3: |
Drill Holes by Deposit |
14-5 | ||||
| Table 14-4: |
Assay Statistics of Jerritt Canyon Deposits |
14-5 | ||||
| Table 14-5: |
Assay Statistics for Mineralized Wireframe Domains |
14-7 | ||||
| Table 14-6: |
Composite Statistics for Mineralized Wireframe Domains |
14-14 | ||||
| Table 14-7: |
Variography Parameters |
14-16 | ||||
| Table 14-8: |
Summary of the Block Model Origins and Block Sizes |
14-19 | ||||
| Table 14-9: |
Search Ellipsoid Radii |
14-21 | ||||
| Table 14-10: |
Block Model Versus Wireframe Volume Comparisons |
14-25 | ||||
| Table 14-11: |
Statistics of Composite Grades Versus Block Grades |
14-31 | ||||
| Table 14-12: |
Statistics of Secondary Estimation Check |
14-32 | ||||
| Table 14-13: |
Summary of the Vulcan Block Model Attributes |
14-33 | ||||
| Table 14-14: |
Summary of Reconciliation, January 2016 to March 2020 |
14-34 | ||||
| Table 14-15: |
Mineral Resource Estimate (effective date December 31, 2020, Imperial Units) |
14-38 | ||||
| Table 14-16: |
Mineral Resource Estimate (effective date December 31, 2020, Metric Units) |
14-39 | ||||
| Table 15-1: |
Summary of Mineral Reserves (effective date December 31, 2020, Imperial Units) |
15-1 | ||||
| Table 15-2: |
Summary of Mineral Reserves (effective date December 31, 2020, Metric Units) |
15-2 | ||||
| Table 15-3: |
Summary of Cut-Off Grade Factors – March 31, 2020 |
15-4 | ||||
| Table 16-1: |
Hydrogeologic Units in the Jerritt Canyon District |
16-6 | ||||
| Table 16-2: |
Smith Mine Dewatering Schedule |
16-11 | ||||
| Table 16-3: |
Contractor Primary Mining Fleet |
16-16 | ||||
| First Majestic Silver Corp. | Jerritt Canyon Gold Mine, SLR Project No: 233.03396.R0000
| ||||
| NI 43-101 Technical Report - April 30, 2021 | v | |||
| Table 16-4: |
Historical Mine Production 2018 to 2020 |
16-16 | ||||
| Table 16-5: |
Reserve Production Schedule |
16-17 | ||||
| Table 18-1: |
Maximum Operating Elevations and Storage for TSF 2 Phases 1 to 4 |
18-6 | ||||
| Table 18-2: |
TSF 2 Phase 3 – Stage, Area, Storage, Time, Rate-of-Rise Characteristics |
18-11 | ||||
| Table 18-3: |
TSF 2 Phases 2, 3, & 4 – Stage, Area, Storage, Time, Rate-of-Rise Characteristics |
18-12 | ||||
| Table 20-1: |
Operating Permits |
20-2 | ||||
| Table 20-2: |
2019 AWP Reclamation Costs |
20-10 | ||||
| Table 20-3: |
Bonds Held as of December 8, 2020 |
20-11 | ||||
| Table 21-1: |
Sustaining Capital Cost Estimate |
21-1 | ||||
| Table 21-2: |
Operating Cost Estimate |
21-1 | ||||
| Table 22-1: |
After-Tax Cash Flow Summary |
22-3 | ||||
| Table 22-2: |
Cash Flow Analysis |
22-5 | ||||
| Table 22-3: |
After-Tax Sensitivity Analysis |
22-6 | ||||
FIGURES
| Figure 1-1: |
After-Tax NPV Sensitivity Graph |
1-25 | ||||
| Figure 4-1: |
Location of the Jerritt Canyon Property |
4-3 | ||||
| Figure 4-2: |
Property Map |
4-4 | ||||
| Figure 4-3: |
Patented Claims |
4-6 | ||||
| Figure 4-4: |
Unpatented Claims |
4-7 | ||||
| Figure 4-5: |
Fee Lands |
4-8 | ||||
| Figure 6-1: |
Location of Historical and Current Mines |
6-4 | ||||
| Figure 6-2: |
Geology of the Jerritt Canyon Property |
6-10 | ||||
| Figure 6-3: |
Index Map of Gradient Array and SP Survey Areas |
6-12 | ||||
| Figure 6-4: |
Survey Lines and Grids |
6-14 | ||||
| Figure 6-5: |
Bouguer Gravity Survey |
6-16 | ||||
| Figure 6-6: |
Location of Airborne Surveys |
6-18 | ||||
| Figure 7-1: |
Location of the Jerritt Canyon Property and Nevada Gold Belts |
7-2 | ||||
| Figure 7-2: |
Tectonostratigraphic Column of the Jerritt Canyon Property |
7-3 | ||||
| Figure 7-3: |
Geology of Jerritt Canyon Property |
7-4 | ||||
| Figure 7-4: |
Location of Mines |
7-6 | ||||
| Figure 7-5: |
SSX and West Mahala Resource Wireframes and Development |
7-8 | ||||
| First Majestic Silver Corp. | Jerritt Canyon Gold Mine, SLR Project No: 233.03396.R0000
| ||||
| NI 43-101 Technical Report - April 30, 2021 | vi | |||
| Figure 7-6: |
Smith Resource Wireframes and Development | 7-10 | ||||
| Figure 7-7: |
Saval 4 Resource Wireframes and Development | 7-12 | ||||
| Figure 9-1: |
Near-Mine Exploration Targeting in the Smith–SSX Lower Plate Window | 9-4 | ||||
| Figure 9-2: |
Jerritt Canyon Exploration Targets | 9-6 | ||||
| Figure 10-1: |
Location of Underground Drilling at SSX Mine January 1, 2018 to December 31, 2018 | 10-3 | ||||
| Figure 10-2: |
Location of Underground Drilling at SSX Mine January 1, 2019 to December 31, 2019 | 10-4 | ||||
| Figure 10-3: |
Location of Underground Drilling at SSX Mine January 1, 2020 to December 31, 2020 | 10-5 | ||||
| Figure 10-4: |
Location of Underground Drilling at Smith Mine January 1, 2018 to December 31, 2018 | 10-6 | ||||
| Figure 10-5: |
Location of Underground Drilling at Smith Mine January 1, 2019 to December 31, 2019 | 10-7 | ||||
| Figure 10-6: |
Location of Underground Drilling at Smith Mine January 1, 2020 to December 31, 2020 | 10-8 | ||||
| Figure 10-7: |
Starvation Extension Drilling | 10-12 | ||||
| Figure 10-8: |
North Generator 2019 Drilling Program |
10-13 | ||||
| Figure 10-9: |
North Generator 2019 Drilling Program |
10-14 | ||||
| Figure 10-10: |
North Generator 2019 Drill Hole Results |
10-15 | ||||
| Figure 10-11: |
North Generator 2019 Drilling A-A’ |
10-16 | ||||
| Figure 10-12: |
2019 Extension Drilling – Coulee and Smith Areas |
10-18 | ||||
| Figure 10-13: |
2019 Varasite Hill Drilling |
10-20 | ||||
| Figure 10-14: |
2020 Exploration Drilling Targets |
10-24 | ||||
| Figure 10-15: |
Murray/West Generator Underground Connection Cross Section |
10-25 | ||||
| Figure 11-1: |
Jerritt Canyon Control Chart of CRM SK52 - Underground Samples | 11-9 | ||||
| Figure 11-2: |
Jerritt Canyon Control Chart of CRM SK78- Underground Samples | 11-9 | ||||
| Figure 11-3: |
Jerritt Canyon Control Chart of In House Standard JCQ05 - Surface Samples | 11-10 | ||||
| Figure 11-4: |
Jerritt Canyon Control Chart of CRM SK78 Surface Samples | 11-10 | ||||
| Figure 11-5: |
Jerritt Canyon Z-Score Chart of Underground CRM Samples | 11-11 | ||||
| Figure 11-6: |
Jerritt Canyon Z-Score Chart of Surface CRM samples | 11-11 | ||||
| Figure 11-7: |
Jerritt Canyon Blank Results for Underground Samples | 11-12 | ||||
| Figure 11-8: |
Jerritt Canyon Blank Results for Surface Samples | 11-13 | ||||
| Figure 11-9: |
ALS Underground Coarse Reject Duplicates | 11-14 | ||||
| Figure 11-10: |
JCG Assay Laboratory Underground Pulp Duplicates |
11-14 | ||||
| Figure 11-11: |
ALS Surface Coarse Reject Duplicates |
11-15 | ||||
| Figure 11-12: |
JCG Assay Laboratory Surface Pulp Duplicates |
11-15 | ||||
| Figure 11-13: |
Scatter Plot of JCG versus ALS Pulp Duplicate Pairs |
11-16 | ||||
| Figure 11-14: |
Q-Q plot of JCG versus ALS Pulp Duplicate Pairs |
11-17 | ||||
| First Majestic Silver Corp. | Jerritt Canyon Gold Mine, SLR Project No: 233.03396.R0000
| ||||
| NI 43-101 Technical Report - April 30, 2021 | vii | |||
| Figure 13-1: |
Historical Gold Feed Grade versus Recovery 1981 to 2020 | 13-3 | ||||
| Figure 13-2: |
Plot of Historical Gold Grade and Recovery from 1981 to 2020 | 13-4 | ||||
| Figure 13-3: |
Monthly Mill Throughput, Feed Grade, and Recovery for 2019 to 2020 | 13-6 | ||||
| Figure 13-4: |
Mill Feed Grade versus Recovery for the Period 2019 to 2020 | 13-6 | ||||
| Figure 14-1: |
Topographic Surface of Jerritt Canyon Deposits | 14-4 | ||||
| Figure 14-2: |
Drill Hole Locations, Jerritt Canyon | 14-6 | ||||
| Figure 14-3: |
SSX Wireframes | 14-8 | ||||
| Figure 14-4: |
Smith Wireframes | 14-9 | ||||
| Figure 14-5: |
Saval 4 Wireframes | 14-10 | ||||
| Figure 14-6: |
USB Wireframes | 14-11 | ||||
| Figure 14-7: |
WGen Wireframes | 14-12 | ||||
| Figure 14-8: |
Jerritt Canyon Assay Log Probability | 14-13 | ||||
| Figure 14-9: |
Variograms in Major, Semi-Major, and Minor Directions for SSX Zone 5 | 14-18 | ||||
| Figure 14-10: |
SSX Zone 2-3 Variable Ellipsoid Orientation |
14-22 | ||||
| Figure 14-11: |
East West (x) Swath Plot SSX 19 |
14-23 | ||||
| Figure 14-12: |
North South (Y) Swath Plot SSX 19 |
14-24 | ||||
| Figure 14-13: |
Vertical (Z) Swath Plot SSX 19 |
14-25 | ||||
| Figure 14-14: |
Cross Section SSX |
14-27 | ||||
| Figure 14-15: |
Cross Section Smith |
14-28 | ||||
| Figure 14-16: |
Cross Section Saval 4 |
14-29 | ||||
| Figure 14-17: |
Mineral Classification SSX Mine |
14-36 | ||||
| Figure 16-1: |
SSX Mine Plan View | 16-2 | ||||
| Figure 16-2: |
Smith Mine Plan View | 16-3 | ||||
| Figure 16-3: |
Jerritt Mine Lithology | 16-6 | ||||
| Figure 16-4: |
Typical Dewatering Well | 16-11 | ||||
| Figure 16-5: |
Smith Mine Zone 2 Dewatering Schedule | 16-12 | ||||
| Figure 16-6: |
Smith Mine Zone 4 Dewatering Schedule | 16-13 | ||||
| Figure 16-7: |
TSF 1 Seepage Control Wells | 16-15 | ||||
| Figure 17-1: |
Process Flow Sheet | 17-5 | ||||
| Figure 18-1: |
General Layout of Jerritt Canyon Tailings and Water Management Facilities | 18-3 | ||||
| Figure 18-2: |
TSF 2 Borehole Location and Geology (SRK, 2015) | 18-7 | ||||
| Figure 18-3: |
Locations of TSF 2 Piezometers and Monitoring Wells | 18-8 | ||||
| Figure 22-1: |
After-Tax NPV Sensitivity Graph | 22-7 | ||||
| First Majestic Silver Corp. | Jerritt Canyon Gold Mine, SLR Project No: 233.03396.R0000
| ||||
| NI 43-101 Technical Report - April 30, 2021 | viii | |||
| 1.0 | SUMMARY |
| 1.1 | Executive Summary |
SLR Consulting Ltd. (SLR) was retained by Jerritt Canyon Gold LLC (JCG) to prepare an independent Technical Report (the Technical Report) on the Jerritt Canyon Gold Mine (Jerritt Canyon or the Mine), located in northeast Nevada, USA. The purpose of this Technical Report is to support the disclosure of Mineral Resource and Mineral Reserve estimates for the underground portion of the Mine. This Technical Report conforms to NI 43-101 Standards of Disclosure for Mineral Projects. SLR qualified persons visited the Mine on April 20, 2021. On April 30, 2021, First Majestic Silver Corp. (First Majestic) acquired all of the issued and outstanding shares of JCG. As such, First Majestic now indirectly owns and operates Jerritt Canyon, through the owner and operator JCG.
First Majestic is a publicly traded company with a portfolio of operating mines and projects. Jerritt Canyon is a long term producer, currently with two mines planning to produce, on average, 2,300 tons per day (stpd) from underground operations primarily using the cut and fill mining method. The two mines include the SSX-Steer Complex (SSX) and Smith. The existing processing plant is operating at a rate of 826,230 tons of ore per annum in 2020 (with capacity for more) and includes primary crushing, drying, secondary and tertiary crushing, dry grinding, roasting and thickening, using a carbon in leach (CIL) for gold recovery and electrowinning for gold refining.
Table 1-1 and Table 1-2 lists the Mineral Resources summary for Jerritt Canyon with an effective date of December 31, 2020, in Imperial and Metric units, respectively. The Mineral Resource and Mineral Reserve estimates conform to Canadian Institute of Mining, Metallurgy and Petroleum (CIM) Definition and Standards for Mineral Resources and Mineral Reserves (CIM (2014) definitions). Mineral Resources are exclusive of Mineral Reserves.
Table 1-1: Summary of Mineral Resources (effective date December 31, 2020, Imperial Units)
Jerritt Canyon
| Category | Tonnage (000 tons) |
Grade (oz/st Au) |
Contained Metal (000 oz Au) | |||
| Measured |
4,811 | 0.159 | 767 | |||
| Indicated |
406 | 0.160 | 65 | |||
| Measured and Indicated | 5,217 | 0.160 | 832 | |||
| Inferred | 1,950 | 0.171 | 334 | |||
Notes:
| 1. | CIM (2014) definitions were followed for Mineral Resources. |
| 2. | Mineral Resources are exclusive of Mineral Reserves. |
| 3. | Mineral Resources are estimated using an average gold price of $1,700/oz Au. |
| 4. | Mineral Resources are constrained using minimum thickness mining shapes reflecting the geometries of cut and fill mining methods. |
| 5. | Mineral Resources are reported at a cut-off grade of 0.11 oz/st Au, accounting for mining costs of $102/st, milling costs of $45/st, general and administrative costs of $18/st, and a metal recovery of 86%. |
| 6. | Mineral Resources that are not Mineral Reserves do not have demonstrated economic viability. |
| 7. | Numbers may not add due to rounding. |
| First Majestic Silver Corp. | Jerritt Canyon Gold Mine, SLR Project No: 233.03396.R0000
| ||||
| NI 43-101 Technical Report - April 30, 2021 | 1-9 | |||
Table 1-2: Summary of Mineral Resources (effective date December 31, 2020, Metric Units)
Jerritt Canyon
| Category | Tonnage (000 t) |
Grade (g/t Au) |
Contained Metal (000 oz Au) | |||
| Measured |
4,365 | 5.47 | 767 | |||
| Indicated |
368 | 5.49 | 65 | |||
| Measured and Indicated | 4,733 | 5.47 | 832 | |||
| Inferred | 1,769 | 5.87 | 334 | |||
Notes:
| 1. | CIM (2014) definitions were followed for Mineral Resources. |
| 2. | Mineral Resources are exclusive of Mineral Reserves. |
| 3. | Mineral Resources are estimated using an average gold price of $1,700/oz Au. |
| 4. | Mineral Resources are constrained using minimum thickness mining shapes reflecting the geometries of cut and fill mining methods. |
| 5. | Mineral Resources are reported at a cut-off grade of 3.77 g/t Au, accounting for mining costs of $102/st, milling costs of $45/st, general and administrative costs of $18/st, and a metal recovery of 86%. |
| 6. | Mineral Resources that are not Mineral Reserves do not have demonstrated economic viability. |
| 7. | Numbers may not add due to rounding. |
The QP is not aware of any other environmental, permitting, legal, title, taxation, socio-economic, marketing, political, or other relevant factors that could materially affect the Mineral Resource estimate aside from those identified in Section 20 of this Technical Report which are being mitigated by further work by JCG.
Table 1-3 and Table 1-4 present the Mineral Reserves summary as of December 31, 2020 in Imperial and Metric units, respectively. Mineral Reserves are reported based on their elevation relative to the natural water table which is found approximately 6,600 feet above sea level (FASL) or 2,012 metres above sea level (MASL).
Table 1-3: Summary of Mineral Reserves (effective date December 31, 2020, Imperial Units)
Jerritt Canyon
| Category | Tonnage (000 tons) |
Grade (oz/st Au) |
Contained Metal (000 oz Au) | |||
| Above 6,600 FASL | ||||||
| Proven |
1,059 | 0.18 | 187 | |||
| Smith |
193 | 0.17 | 33 | |||
| SSX |
866 | 0.18 | 154 | |||
| Probable |
689 | 0.19 | 129 | |||
| Smith |
54 | 0.18 | 10 | |||
| SSX |
635 | 0.19 | 119 | |||
|
Subtotal Proven + Probable |
1,748 | 0.18 | 316 | |||
| First Majestic Silver Corp. | Jerritt Canyon Gold Mine, SLR Project No: 233.03396.R0000
| ||||
| NI 43-101 Technical Report - April 30, 2021 | 1-10 | |||
| Category | Tonnage (000 tons) |
Grade (oz/st Au) |
Contained Metal (000 oz Au) | |||
| Below 6,600 FASL | ||||||
| Proven |
915 | 0.22 | 200 | |||
| Smith |
808 | 0.22 | 180 | |||
| SSX |
107 | 0.19 | 20 | |||
| Probable |
897 | 0.21 | 186 | |||
| Smith |
380 | 0.26 | 101 | |||
| SSX |
516 | 0.17 | 86 | |||
| Subtotal Proven + Probable |
1,811 | 0.21 | 387 | |||
| Total Proven |
1,974 | 0.20 | 388 | |||
| Total Probable |
1,585 | 0.20 | 316 | |||
| Total Proven +Probable | 3,559 | 0.20 | 703 | |||
Notes:
| 1. | CIM (2014) definitions were followed for Mineral Reserves. |
| 2. | Mineral Reserves are estimated at a cut-off grade of 0.128 oz/st Au which assumes $102/st mining cost, $45/st processing cost, $18/st G&A cost and 86% metallurgical recovery. |
| 3. | Mineral Reserves are estimated using an average long term gold price of US$1,500/oz Au. |
| 4. | A minimum mining width of 15 ft was used assuming a cut and fill mining method. |
| 5. | Bulk density is 0.0794 t/ft3. |
| 6. | Numbers may not add due to rounding. |
Table 1-4: Summary of Mineral Reserves (effective date December 31, 2020, Metric Units)
Jerritt Canyon
| Category | Tonnage (000 t) |
Grade (g/t Au) |
Contained Metal (000 oz Au) | |||
| Above 2,012 MASL | ||||||
| Proven |
961 | 6.1 | 187 | |||
| Smith |
175 | 5.9 | 33 | |||
| SSX |
786 | 6.1 | 154 | |||
| Probable |
625 | 6.4 | 129 | |||
| Smith |
49 | 6.2 | 10 | |||
| SSX |
576 | 6.4 | 119 | |||
|
Subtotal Proven + Probable |
1,585 | 6.2 | 316 | |||
| First Majestic Silver Corp. | Jerritt Canyon Gold Mine, SLR Project No: 233.03396.R0000
| ||||
| NI 43-101 Technical Report - April 30, 2021 | 1-11 | |||
| Category | Tonnage (000 t) |
Grade (g/t Au) |
Contained Metal (000 oz Au) | |||
|
Below 2,012 MASL | ||||||
| Proven |
830 | 7.5 | 200 | |||
| Smith |
733 | 7.7 | 180 | |||
| SSX |
97 | 6.4 | 20 | |||
| Probable |
813 | 7.1 | 186 | |||
| Smith |
345 | 9.1 | 101 | |||
| SSX |
468 | 5.7 | 86 | |||
| Subtotal Proven + Probable |
1,643 | 7.3 | 387 | |||
| Total Proven |
1,791 | 6.7 | 388 | |||
| Total Probable |
1,438 | 6.8 | 316 | |||
| Total Proven +Probable |
3,229 | 6.8 | 703 | |||
Notes:
| 1. | CIM (2014) definitions were followed for Mineral Reserves. |
| 2. | Mineral Reserves are estimated at a cut-off grade of 4.39 g/t Au which assumes $112/t mining cost, $50/t processing cost, $20/t G&A cost and 86% metallurgical recovery. |
| 3. | Mineral Reserves are estimated using an average long-term gold price of US$1,500/oz Au. |
| 4. | A minimum mining width of 4.6 m was used assuming a cut and fill mining method. |
| 5. | Bulk density is 2.544 t/m3. |
| 6. | Numbers may not add due to rounding. |
The QP is not aware of any mining, metallurgical, infrastructure, permitting, or other relevant factors that could materially affect the Mineral Reserve estimate, aside from those identified in Section 20 of this Technical Report which are being mitigated by further work by JCG.
| 1.1.1 | Conclusions |
The QPs offer the following conclusions:
| 1.1.1.1 | Geology and Mineral Resources |
| · | JCG geologists have a good understanding of the regional, local, and deposit geology and controls on mineralization. |
| · | Exploration and development sampling and analysis programs involve industry standard practices, providing generally reasonable results. The drill hole database was verified by the QP and is suitable for Mineral Resource estimation work. The resulting data can effectively be used for the estimation of Mineral Resources and Mineral Reserves. |
| · | The methods and procedures utilized to gather geological, assaying, density, and other information are reasonable and meet generally accepted industry standards. |
| First Majestic Silver Corp. | Jerritt Canyon Gold Mine, SLR Project No: 233.03396.R0000
| ||||
| NI 43-101 Technical Report - April 30, 2021 | 1-12 | |||
| · | Sampling and assaying have been carried out using industry standard quality assurance/quality control (QA/QC) practices. These practices include, but are not limited to, sampling, assaying, chain of custody of the samples, secure sample storage, use of third-party laboratories, and use of standards, blanks, and duplicates. |
| · | Since 2015, Jerritt Canyon has made considerable advances in the compilation and interpretation of historical geophysical and geochemical datasets resulting in the identification of 17 high priority target areas. The property holds significant exploration potential, particularly in the southern portion. |
| · | Since January 1, 2015 through December 31, 2020, JCG has drilled a total of 18,533 holes between reverse circulation (RC) and core from underground drilling sites, comprising 2,800,695 ft. This has enabled Jerritt Canyon to increase the size and confidence of the existing resources. |
| · | The geological wireframes are reasonable and plausible interpretations of the drill results. |
| · | The resource model has been prepared using appropriate methodology and assumptions, including: |
| o | Treatment of high grade assays |
| o | Compositing length |
| o | Customized search parameters |
| o | Bulk density |
| o | Cut-off grade |
| o | Classification |
| · | As of December 31, 2020 and at a cut-off grade of 0.11 oz/st Au, the Measured and Indicated Mineral Resources at Jerritt Canyon total 5.217 Mst grading 0.160 oz/st Au containing approximately 832,000 ounces of gold (oz Au). In addition, Inferred Mineral Resources are estimated at 1.950 Mst grading 0.171 oz/st Au containing approximately 334,000 oz Au. |
| · | Mineral Resource estimates have been prepared utilizing acceptable estimation methodologies in accordance with CIM MRMR Best Practice Guidelines. The classification of Measured, Indicated, and Inferred Mineral Resources conforms to CIM (2014) definitions. |
| 1.1.1.2 | Mining and Mineral Reserves |
| · | Mining operations at Jerritt Canyon are well established and carried out by an experienced mining contractor at Smith and SSX using the cut and fill mining method. |
| · | A significant portion of the Mineral Reserves are located below the current water table. There is a dewatering plan in place for the mine below the 6,600 FASL water table, which allows for the inclusion of Mineral Reserves below this elevation. |
| · | Groundwater flows in the Roberts Mountain and Hanson Creek formations (the principle aquifers) are controlled primarily by the openness and continuity of fractures and joints with the primary water bearing strata being the ore zones. Faulting and tectonic displacement of the materials in the Jerritt Canyon District is extensive. |
| · | The main faults trend west northwest - east southeast, and in general are permeable water conduits. Complementary faults and displacement sets at right angles, south southwest – north |
| First Majestic Silver Corp. | Jerritt Canyon Gold Mine, SLR Project No: 233.03396.R0000
| ||||
| NI 43-101 Technical Report - April 30, 2021 | 1-13 | |||
| northeast, are generally highly myolinitized, and tend to form a barrier to groundwater flow and compartmentalize groundwater. |
| · | Dewatering goals of the current operation are to reduce the water level to the pre 2008 level of approximately 6,535 FASL. Currently, pumping is underway to dewater the existing workings. This consists of the operation of two dewatering wells and a barge to dewater Zones 2 and 4. The wells are each pumping at approximately 700 gallons per minute (gpm) while the barge pumps at approximately 400 gpm. Two additional, 500 ft deep underground dewatering wells have been designed. |
| · | It is anticipated that over time Smith will be dewatered at a rate of 2,100 gpm. All pumped groundwater will continue to be conveyed to the water treatment plant (WTP) which has a capacity of 1,400 gpm. Any flows over 1,400 gpm will be routed to Zone 9 prior to treatment. Following treatment, the water is pumped to an underground injection well field consisting of three 1,200 ft deep injection wells located on USFS land. |
| · | Another aspect of Jerritt Canyon mine water/groundwater management is pollution control from Tailings Storage Facility 1 (TSF 1). Initially, TSF 1 was lined with compacted native soils. In addition, there are 90 seepage control wells, 14 freshwater recharge wells receiving water from the tailings WTP, and greater than 80 down gradient monitoring wells (Wanner et al, 2017). |
| · | Production is limited by mine capacity, and production forecasting is based on mining rates of 800 stpd for Smith and 1,200 stpd for SSX. There is potential for increased production from Smith once dewatering is advanced and more headings are available. |
| 1.1.1.3 | Mineral Processing and Metallurgical Testing |
| · | Historical gold grade-recovery relationships for three different time periods, 1) 1981 to 2020, 2)1989 to 2020 and 3) 1997 to 2020 were plotted. The first period is inception to date, the second period begins when the roaster was commissioned, and the third period begins when chlorination was discontinued. The inception to date line and the 1989 to 2020 lines are essentially the same. The 1997 to 2020 line indicates a slightly higher sensitivity of gold recovery to feed grade. The QP notes that the data are scattered and the correlations of the three lines are low suggesting that variables other than head grade, including sulfide sulfur oxidation, total organic carbon (TOC), and roaster performance contribute to changes in gold recovery. |
| · | SLR notes that the process operating data indicate very consistent plant feed and operational performance and, with the low correlation between grade and recovery, the use of near term historical averages would provide a reasonable gold recovery value for planning purposes. The operation is currently using a constant average gold recovery of 86% for the life of mine (LOM) plan and budget. The consistency in recovery could be affected by changes in mineralogical characteristics as new ore-types are encountered in the future. |
| · | The design recovery of the whole ore roaster using oxygen instead of air was 87% to 90%. Pilot plant testing of the oxygen roasted calcine by Dorr Oliver (1987) achieved an average gold recovery of 88%. SLR notes that the process continues to operate consistently in the design range depending primarily on roaster performance, as some of the mineralized materials are reported to have zero gold recovery without oxidation. |
| · | The main deleterious elements are arsenic and mercury. The processing plant is designed with the appropriate gas cleaning systems including mercury scrubbing from the gas streams and mercury collection from the refinery retort condenser. |
| First Majestic Silver Corp. | Jerritt Canyon Gold Mine, SLR Project No: 233.03396.R0000
| ||||
| NI 43-101 Technical Report - April 30, 2021 | 1-14 | |||
| 1.1.1.4 | Infrastructure |
| · | Jerritt Canyon is a mature operation that has been operating for nearly 40 years, and as a result the requisite infrastructure is in place including: |
| o | Access Roads |
| o | Power supply and distribution |
| o | Office buildings |
| o | Warehouse facilities |
| o | Maintenance shops |
| o | Laboratory facilities |
| o | Communication networks |
| o | Onsite security |
| o | TSFs |
| o | Water management systems |
| 1.1.1.5 | Tailings and Water Management Facilities |
| · | TSF 1 is currently inactive and in the process of being closed and reclaimed under a Final Plan for Permanent Closure (FPPC) approved by the State of Nevada regulatory agencies. The TSF 1 FPPC consists of regrading the top impoundment surface to promote runoff and preclude surface water impoundment, placing a working cover impoundment surface on which an high-density polyethylene (HDPE) liner will be installed, installing a three foot thick alluvial growth media cover, and revegetating the final surface with an approved seed mix. As of the date of this Technical Report, the following reclamation and closure activities have been completed on TSF 1: |
| o | Outer embankment slopes have been graded, covered, and revegetated. |
| o | Working cover and HDPE liner have been installed over 70% of the 300 acre impoundment surface. |
| o | Growth media has been installed over approximately 30% of the 300 acre impoundment surface. |
| · | For active tailings management, Jerritt Canyon is currently depositing tailings with a 40:60, solids/water, ratio into TSF 2 Phase 2. TSF 2 is an HDPE lined impoundment with a leak collection and recovery system (LCRS), which is designed and constructed to meet or exceed the most current environmental and engineering standards. As part of the TSF 2 monitoring program, Jerritt Canyon measures pumped flows from the LCRS, hydraulic head development above the TSF 2 secondary HDPE liner, and surrounding groundwater depths, and the presence (or absence) of process solution in the vadose zone underlying TSF 2. |
| · | TSF 2 Phase 3 is currently being constructed as an eight foot raise. Construction and commissioning of TSF 2 Phase 3 is expected in May 2021 and will only provide an additional seven months of tailings storage until December 2021, approximately. |
| · | TSF 2 Phase 4 is planned for construction during 2021 and will allow storage of an additional 1.7 Mst of tailings. Due to the short operational life of Phase 3, TSF 2 Phase 4 must be constructed |
| First Majestic Silver Corp. | Jerritt Canyon Gold Mine, SLR Project No: 233.03396.R0000
| ||||
| NI 43-101 Technical Report - April 30, 2021 | 1-15 | |||
| and commissioned before December 2021. This construction will require approximately 1.5 million cubic yards of compacted fill excavated from approved borrow source over one mile east of TSF 2. Assuming a planned production rate of 2,350 stpd, TSF 2 Phase 4 will be filled to capacity by December 2023. The Jerritt Canyon Water Pollution Control Permit authorizes up to 3.0 Mst of dry tailings to be produced per annum (approximately 8,200 stpd). If the average deposition rate is increased above 2,350 stpd, the timeline for filling TSF 2 Phase 4 to capacity will be shortened proportionally. |
| · | Jerritt Canyon plans to convert the existing WSR to TSF 3 for tailings disposal after TSF 2 is filled to capacity. TSF 3 will store approximately of 2.4 Mst of tailings and provide 2.6 years of tailings storage at an assumed average production rate of 2,350 stpd. Since TSF 3 would be commissioned before January 2024, additional tailings storage (beyond TSF 3) would need to be permitted and constructed before the end of 2025 to ensure a new facility is ready for tailings disposal by the middle of 2026. Likewise, if the average deposition rate is increased above 2,350 stpd, the timeline for filling TSF 3 and needing additional tailings storage beyond TSF 3 will be shortened proportionally. |
| · | The feasibility of converting the WSR into TSF 3 in a timely manner relies on the removal of 372 million gallons (Mgal) of process solution which is currently stored within the WSR by the end of 2022. Within the next two years, this volume will require removal via active and passive evaporation and/or treatment via the process WTP. If this volume cannot be removed by the end of 2022, other locations or methods of tailings disposal will need to be permitted, approved, and constructed. |
| · | Currently, the process WTP only removes approximately 200 gpm of process solution from the site-wide water balance inventory as permeate. Under these conditions, a significant increase in the WTP capacity is needed to eliminate positive water balances during the winter and spring. At this stage, the exact increase is unknown, but may be three to four times the current treatment rate for costing purposes. |
| 1.1.1.6 | Environmental Considerations |
| · | All of the necessary permits and approvals to operate are either in place or in the process of being renewed or modified. |
| · | Jerritt Canyon has multiple violations related to their environmental permits including air quality, water supply, surface water, and Underground Injection Control (UIC). |
| · | Although environmental permitting requirements are being exceeded, JCG is actively mitigating these issues. Persisting exceedances would likely result in corrective actions and/or fines and not result in the revocation of operational permits due to the social and economic considerations of this operation. |
| 1.1.1.7 | Safety |
| · | The large number of Mine Safety and Health Administration (MSHA) citations and extended shutdowns imposed during 2017 have been resolved and JCG continues to adhere to MSHA’s regulations. |
| First Majestic Silver Corp. | Jerritt Canyon Gold Mine, SLR Project No: 233.03396.R0000
| ||||
| NI 43-101 Technical Report - April 30, 2021 | 1-16 | |||
| 1.1.2 | Recommendations |
The QPs offer the following recommendations:
| 1.1.2.1 | Geology and Mineral Resources |
| 1. | Explore the 17 high priority exploration targets. The QP concurs with First Majestic’s plans to carry out a multi-year exploration program that will include a significant amount of surface and underground drilling that will cost approximately US$10 million to US$15 million annually. |
| 2. | Continue drilling to expand Mineral Resources. |
| 3. | Continue to convert Inferred Mineral Resources to Indicated Mineral Resources. |
| 4. | Update the block models on a regular basis. |
| 5. | Improve mineralized material tracking and reconciliation procedures. |
| 1.1.2.2 | Mining and Mineral Reserves |
| 1. | The dewatering system does not have a backup power supply. Any type of long term power loss can cause the operation to flood and damage infrastructure. A backup power system is recommended for site to keep critical infrastructure running and prevent damage. |
| 2. | Consider and assess the viability of surface water wells. This could reduce the risk of flooding underground workings in the event of a site power grid interruption. |
| 3. | Adopt long term planning and Mineral Reserve estimation processes, initiated by a mining method optimization trade-off study, and carry out multiple mining method planning exercises with the intention of reducing operating cut-off grades. |
| 4. | Adjust mobile mining fleet as necessary to achieve reduced mining heights. |
| 5. | Review cut-off grades and modifying factors as part of the planning process and optimize them where appropriate. |
| 6. | Explore and evaluate the old workings of the mines to determine which areas are accessible. Much of the resource of the mine is located in these areas. Determine if new development is required or rehabilitation of old workings is feasible. If areas are not accessible, then the resource/reserves should be adjusted to reflect the update. |
| 1.1.2.3 | Mineral Processing and Metallurgical Testing |
| 1. | Complete metallurgical testing of samples from the various mining sources that represent the current and future feed to the processing plant in order to develop more accurate estimates for future gold recovery and to provide information to support blending of plant feed with respect to sulfide sulfur, TOC concentrations, and other variables that contribute to plant performance. Metallurgical testing of two main ore bodies is currently planned, including characterization and roast-CIL leach testing at various grind sizes. The estimated cost of the program is US$150,000. |
| 1.1.2.4 | Infrastructure |
| 1. | Construction of the additional TSF capacity and increased WTP capacity are critical to operation of the Mine. These projects should be completed as soon as possible, as planned. |
| First Majestic Silver Corp. | Jerritt Canyon Gold Mine, SLR Project No: 233.03396.R0000
| ||||
| NI 43-101 Technical Report - April 30, 2021 | 1-17 | |||
| 1.1.2.5 | Tailings and Water Management Facilities |
| 1. | Accelerate the removal of surplus process water from the system by the process WTP and forced-air (i.e. active) evaporation. The process WTP needs to treat and remove its original design rate of 700 gpm from the water inventory in order to empty the WSR within one year to prepare it for conversion to TSF 3 before the end of 2023 or preferably sooner. |
| 2. | Explore the feasibility of designing a downstream raise of the TSF 2 embankment (Phase 5 Raise). Depending on results of embankment stability analyses, which will dictate the additional raise height, TSF 2 Phase 5 could provide multiple years of additional tailings storage. |
| 3. | Investigate and identify ‘green field’ areas near the existing process facilities and mill site where future TSFs may be permitted, designed, constructed, and operated. Due to the multiple-year lead times for permitting such facilities, investigation and conceptual designs need to be initiated as soon as possible. |
| 4. | Regardless of which option is eventually selected for future tailings storage, Jerritt Canyon should start the permitting process for additional tailings storage in the near future, before TSF 2 Phase 4 is filled to capacity in 2023 and assuming the WSR cannot be emptied within the next year. |
| 1.1.2.6 | Environmental Considerations |
| 1. | JCG should continue to mitigate the environmental regulatory exceedances and challenges related to air and water quality to achieve compliance with all their environmental permits. |
| 2. | To maintain a strong working relationship with regulators, JCG should actively develop a permitting strategy and plan that involves seeking permit approvals and modifications on a regular basis. |
| 1.1.2.7 | Safety |
| 1. | Efforts to alleviate air quality concerns in the processing facilities and provide working areas that can be accessed without wearing respirators should be a top priority and pursued vigorously. |
| 1.2 | Economic Analysis |
This section has been optionally included in this Technical Report although JCG is a producing company, SSX and Smith are currently in production, and there is no planned material expansion.
The economic analysis contained in this Technical Report is based on the Mineral Reserves, economic assumptions provided by JCG for SSX and Smith, and the capital and operating costs as presented in Section 21 of this Technical Report.
| 1.2.1 Physicals |
||
|
· Mine life: |
5 years (between 2021 and 2025): | |
|
· Underground ore tonnes mined: |
3.559 Mst | |
|
· Gold grade: |
0.20 oz/st Au | |
|
· Processed: |
||
| o Total Ore Feed: |
3.559 Mst | |
| o Gold grade: |
0.20 oz/st Au | |
| First Majestic Silver Corp. | Jerritt Canyon Gold Mine, SLR Project No: 233.03396.R0000
| ||||
| NI 43-101 Technical Report - April 30, 2021 | 1-18 | |||
|
· Contained Metal: |
||
| o Gold: |
703,164 oz Au | |
|
· Average LOM Recovery: |
||
| o Gold recovery |
86% | |
|
· Recovered Metal: |
||
| o Gold: |
604,721 oz Au | |
|
· Payable Metal: |
||
| o Gold: |
604,721 oz Au | |
| 1.2.2 | Revenue |
Revenue is estimated based on the following LOM weighted average metal prices:
|
· Gold price: |
US$1,500/oz Au |
| 1.2.3 | Capital Costs |
| · | LOM sustaining capital costs of US$42.8 million, including closure costs. |
| · | Closure costs of US$5.3 million were estimated annually based on US$1.50/st milled. |
| 1.2.4 | Operating Costs |
| · | LOM unit operating cost average of: |
| o Mine Development: |
US$12.99/st mined | |
| o Underground Mining: |
US$88.69/st mined | |
| o Processing: |
US$45.00/st milled | |
| o G&A: |
US$18.00/st milled | |
|
· Total unit operating costs: |
US$164.68/st milled. | |
|
· LOM operating costs: |
US$586.1 million. | |
| 1.2.5 | Taxation and Royalties |
| · | The Corporate Federal income tax rate in Nevada is 21% and State income tax rate is 5% for an average realized effective income tax rate of 24.95%. |
| · | Nevada Select (ELY Gold) royalty rate: 0.5% NSR |
| · | NouHgt Technologies royalty rate: 0.225% NSR (based on mill throughput and realized gold price) |
| · | 3Leaseholder land royalties: average $1.05 million/yr |
| 1.2.6 | Cash Flow |
SLR reviewed the JCG LOM after-tax cash flow model to confirm the economics of the LOM plan. The model is based on JCG’s JCG Model Ver2.0 file, which includes Measured and Indicated material, as well
| First Majestic Silver Corp. | Jerritt Canyon Gold Mine, SLR Project No: 233.03396.R0000
| ||||
| NI 43-101 Technical Report - April 30, 2021 | 1-19 | |||
as material from other areas on the Mine site, and credit for tolling. The JCG model does not take into account the following components:
| · | Financing costs |
| · | Existing working capital |
| · | Insurance |
| · | Overhead cost for a corporate office |
SLR has used JCG’s model as a reference for capital and operating cost rates but has created a standalone cash flow model to represent only the Mineral Reserve material. The cash flow summary is presented in Table 1-5. All costs are in Q4 2020 US dollars with no allowance for inflation.
| First Majestic Silver Corp. | Jerritt Canyon Gold Mine, SLR Project No: 233.03396.R0000
| ||||
| NI 43-101 Technical Report - April 30, 2021 | 1-20 | |||
Table 1-5: After-Tax Cash Flow Summary
Jerritt Canyon Mine
| 2021 | 2022 | 2023 | 2024 | 2025 | 2026 | |||||||||||||||||||||||||||||
| INPUTS | UNITS | TOTAL | Year 1 | Year 2 | Year 3 | Year 4 | Year 5 | Year 6 | ||||||||||||||||||||||||||
|
MINING |
||||||||||||||||||||||||||||||||||
|
Underground |
||||||||||||||||||||||||||||||||||
| Operating Days |
365 | days | 1,770 | 365 | 365 | 365 | 365 | 310 | ||||||||||||||||||||||||||
| Tonnes milled per day |
tons / day | 2,011 | 1,997 | 2,051 | 2,001 | 2,001 | 2,001 | |||||||||||||||||||||||||||
| Smith Production |
tons | 1,434,644 | 291,086 | 292,022 | 291,963 | 291,891 | 267,681 | - | ||||||||||||||||||||||||||
| Au |
oz/t | 0.23 | 0.19 | 0.24 | 0.21 | 0.22 | 0.28 | - | ||||||||||||||||||||||||||
| Waste |
tons | 928,101 | 392,416 | 238,916 | 181,456 | 68,656 | 46,657 | - | ||||||||||||||||||||||||||
| Total Moved |
tons | 2,362,745 | 683,502 | 530,938 | 473,419 | 360,548 | 314,338 | - | ||||||||||||||||||||||||||
| SSX Production |
tons | 2,124,349 | 437,999 | 456,743 | 438,347 | 438,412 | 352,848 | - | ||||||||||||||||||||||||||
| Au |
oz/t | 0.18 | 0.18 | 0.19 | 0.18 | 0.18 | 0.17 | - | ||||||||||||||||||||||||||
| Waste |
tons | 330,794 | 72,906 | 141,591 | 66,892 | 36,296 | 13,109 | - | ||||||||||||||||||||||||||
| Total Moved |
tons | 2,455,143 | 510,905 | 598,334 | 505,240 | 474,708 | 365,957 | - | ||||||||||||||||||||||||||
| Total Production |
tons | 3,558,993 | 729,085 | 748,765 | 730,310 | 730,303 | 620,529 | - | ||||||||||||||||||||||||||
| Au |
oz/t | 0.20 | 0.18 | 0.21 | 0.20 | 0.19 | 0.22 | |||||||||||||||||||||||||||
| Waste |
tons | 1,258,894 | 465,322 | 380,507 | 248,348 | 104,952 | 59,766 | - | ||||||||||||||||||||||||||
|
Total Moved |
tons | 4,817,887 | 1,194,407 | 1,129,271 | 978,658 | 835,255 | 680,295 | - | ||||||||||||||||||||||||||
|
PROCESSING |
||||||||||||||||||||||||||||||||||
| Mill Feed |
tons | 3,558,993 | 729,085 | 748,765 | 730,310 | 730,303 | 620,529 | - | ||||||||||||||||||||||||||
| Au |
oz/t | 0.20 | 0.18 | 0.21 | 0.20 | 0.19 | 0.22 | - | ||||||||||||||||||||||||||
| Contained Au |
oz | 703,164 | 131,514 | 153,894 | 143,550 | 140,759 | 133,447 | - | ||||||||||||||||||||||||||
| Mill Recovery |
||||||||||||||||||||||||||||||||||
| Au |
86% | % | 86 | % | 86 | % | 86 | % | 86 | % | 86 | % | 86 | % | 86 | % | ||||||||||||||||||
| Net Recovery |
||||||||||||||||||||||||||||||||||
| Au |
% | 86 | % | 86 | % | 86 | % | 86 | % | 86 | % | 86 | % | 86 | % | |||||||||||||||||||
| Total Average Recovery |
% | 86 | % | 86 | % | 86 | % | 86 | % | 86 | % | 86 | % | - | ||||||||||||||||||||
| Total Recovered |
||||||||||||||||||||||||||||||||||
|
Au |
oz | 604,721 | 113,102 | 132,349 | 123,453 | 121,053 | 114,764 | - | ||||||||||||||||||||||||||
|
REVENUE |
||||||||||||||||||||||||||||||||||
| Metal Prices |
Input Units | |||||||||||||||||||||||||||||||||
| Au |
US$ | 1500 /oz Au | US$/oz Au | $ | 1,500.00 | $ | 1,500 | $ | 1,500 | $ | 1,500 | $ | 1,500 | $ | 1,500 | $ | 1,500 | |||||||||||||||||
| Au Payable Percentage |
100% | US$ ‘000 | 100 | % | 100 | % | 100 | % | 100 | % | 100 | % | 100 | % | 100 | % | ||||||||||||||||||
| Au Gross Revenue |
US$ ‘000 | $ | 907,081 | $ | 169,653 | $ | 198,523 | $ | 185,180 | $ | 181,580 | $ | 172,146 | $ | - | |||||||||||||||||||
| Total Gross Revenue |
US$ ‘000 | $ | 907,081 | $ | 169,653 | $ | 198,523 | $ | 185,180 | $ | 181,580 | $ | 172,146 | $ | - | |||||||||||||||||||
| Treatment |
$ | 0.40 | US$/oz | $ | 242 | $ | 45 | $ | 53 | $ | 49 | $ | 48 | $ | 46 | $ | - | |||||||||||||||||
| Transport |
$ | 1,500.00 | US$/shipment (12/yr) | $ | 379 | $ | 78 | $ | 78 | $ | 78 | $ | 78 | $ | 66 | $ | - | |||||||||||||||||
| Early Settlement fees |
$ | - | $ | - | $ | - | $ | - | $ | - | $ | - | $ | - | ||||||||||||||||||||
| Total charges |
$ | 621 | $ | 123 | $ | 131 | $ | 128 | $ | 127 | $ | 112 | $ | - | ||||||||||||||||||||
| Gross NSR |
$ | 906,460 | $ | 169,529 | $ | 198,392 | $ | 185,052 | $ | 181,453 | $ | 172,034 | $ | - | ||||||||||||||||||||
|
Royalties |
||||||||||||||||||||||||||||||||||
| Nevada Select Royalty Inc |
0.5% | US$ ‘000 | $ | 4,532 | $ | 848 | $ | 992 | $ | 925 | $ | 907 | $ | 860 | $ | - | ||||||||||||||||||
| NouHgt Technologies, LLC |
0.225 | US$ ‘000 | $ | 801 | $ | 164 | $ | 168 | $ | 164 | $ | 164 | $ | 140 | $ | - | ||||||||||||||||||
| Leaseholder Roylties |
US$ ‘000 | $ | 5,092 | $ | 1,050 | $ | 1,050 | $ | 1,050 | $ | 1,050 | $ | 892 | $ | - | |||||||||||||||||||
| Total Royalties |
US$ ‘000 | $ | 10,425 | $ | 2,062 | $ | 2,210 | $ | 2,140 | $ | 2,122 | $ | 1,892 | $ | - | |||||||||||||||||||
|
Net Smelter Return |
US$ ‘000 | $ | 896,035 | $ | 167,468 | $ | 196,181 | $ | 182,913 | $ | 179,331 | $ | 170,142 | $ | - | |||||||||||||||||||
| First Majestic Silver Corp. | Jerritt Canyon Gold Mine, SLR Project No: 233.03396.R0000
| ||||
| NI 43-101 Technical Report - April 30, 2021 | 1-21 | |||
| INPUTS | UNITS | TOTAL |
|
2021
Year 1 |
|
|
2022
Year 2 |
|
|
2023
Year 3 |
|
|
2024
Year 4 |
|
|
2025
Year 5 |
|
|
2026
Year 6 |
| ||||||||||||||
| OPERATING COST |
||||||||||||||||||||||||||||||||||
| Mining (Underground) |
$ | 101.68 | US$/t milled | $ | 101.68 | $ | 101.68 | $ | 101.68 | $ | 101.68 | $ | 101.68 | $ | 101.68 | $ | 101.68 | |||||||||||||||||
| Processing |
$ | 45.00 | US$/t milled | $ | 45.00 | $ | 45.00 | $ | 45.00 | $ | 45.00 | $ | 45.00 | $ | 45.00 | $ | 45.00 | |||||||||||||||||
| G&A |
$ | 18.00 | US$/t milled | $ | 18.00 | $ | 18.00 | $ | 18.00 | $ | 18.00 | $ | 18.00 | $ | 18.00 | $ | 18.00 | |||||||||||||||||
| Total Unit Operating Cost |
US$/t milled | $ | 164.68 | $ | 164.68 | $ | 164.68 | $ | 164.68 | $ | 164.68 | $ | 164.68 | $ | 164.68 | |||||||||||||||||||
| Mining (Underground) |
US$ ‘000 | $ | 361,867 | $ | 74,131 | $ | 76,132 | $ | 74,256 | $ | 74,255 | $ | 63,094 | $ | - | |||||||||||||||||||
| Processing |
US$ ‘000 | $ | 160,155 | $ | 32,809 | $ | 33,694 | $ | 32,864 | $ | 32,864 | $ | 27,924 | $ | - | |||||||||||||||||||
| G&A |
US$ ‘000 | $ | 64,062 | $ | 13,124 | $ | 13,478 | $ | 13,146 | $ | 13,145 | $ | 11,170 | $ | - | |||||||||||||||||||
| Total Operating Cost |
$969.18/oz Au | US$ ‘000 | $ | 586,084 | $ | 120,063 | $ | 123,304 | $ | 120,265 | $ | 120,264 | $ | 102,187 | $ | - | ||||||||||||||||||
| Operating Cashflow |
US$ ‘000 | $ | 309,950 | $ | 47,404 | $ | 72,877 | $ | 62,647 | $ | 59,067 | $ | 67,955 | $ | - | |||||||||||||||||||
| CAPITAL COST |
||||||||||||||||||||||||||||||||||
| Direct Cost |
||||||||||||||||||||||||||||||||||
| Safety, Health & Environmental |
US$ ‘000 | $ | - | $ | - | $ | - | $ | - | $ | - | $ | - | $ | - | |||||||||||||||||||
| Heavy Mobile Equipment |
US$ ‘000 | $ | - | $ | - | $ | - | $ | - | $ | - | $ | - | $ | - | |||||||||||||||||||
| Expansion |
US$ ‘000 | $ | - | $ | - | $ | - | $ | - | $ | - | $ | - | $ | - | |||||||||||||||||||
| Modernization |
US$ ‘000 | $ | - | $ | - | $ | - | $ | - | $ | - | $ | - | $ | - | |||||||||||||||||||
| Other |
US$ ‘000 | $ | - | $ | - | $ | - | $ | - | $ | - | $ | - | $ | - | |||||||||||||||||||
| Total Direct Cost |
US$ ‘000 | $ | - | $ | - | $ | - | $ | - | $ | - | $ | - | $ | - | |||||||||||||||||||
| Sustaining Cost |
||||||||||||||||||||||||||||||||||
| Mine Capital |
US$ ‘000 | $ | 21,354 | $ | 4,375 | $ | 4,493 | $ | 4,382 | $ | 4,382 | $ | 3,723 | $ | - | |||||||||||||||||||
| Exploration Capital |
US$ ‘000 | $ | - | $ | - | $ | - | $ | - | $ | - | $ | - | $ | - | |||||||||||||||||||
| Tailings Facility |
US$ ‘000 | $ | 9,000 | $ | 9,000 | $ | - | $ | - | $ | - | $ | - | $ | - | |||||||||||||||||||
| Processing Plant |
US$ ‘000 | $ | 3,559 | $ | 729 | $ | 749 | $ | 730 | $ | 730 | $ | 621 | $ | - | |||||||||||||||||||
| Reclamation and closure |
$ | 1.50 | US$ ‘000 | $ | 5,338 | $ | 1,094 | $ | 1,123 | $ | 1,095 | $ | 1,095 | $ | 931 | $ | - | |||||||||||||||||
| Sustaining Exploration Diamond Drilling |
$ | 1.00 | US$ ‘000 | $ | 3,559 | $ | 729 | $ | 749 | $ | 730 | $ | 730 | $ | 621 | $ | - | |||||||||||||||||
| Total Sustaining Cost |
US$ ‘000 | $ | 42,810 | $ | 15,926 | $ | 7,113 | $ | 6,938 | $ | 6,938 | $ | 5,895 | $ | - | |||||||||||||||||||
| Working Capital |
US$ ‘000 | $ | (1,284 | ) | $ | (17,519 | ) | $ | (3,668 | ) | $ | 1,339 | $ | 236 | $ | 403 | $ | 17,925 | ||||||||||||||||
| All in Sustaining Cost |
$1037.85/oz Au | US$ ‘000 | $ | 627,610 | $ | 118,471 | $ | 126,750 | $ | 128,542 | $ | 127,438 | $ | 108,485 | $ | 17,925 | ||||||||||||||||||
| CASH FLOW |
||||||||||||||||||||||||||||||||||
| Net Pre-Tax Cashflow |
US$ ‘000 | $ | 268,424 | $ | 48,996 | $ | 69,431 | $ | 54,371 | $ | 51,894 | $ | 61,657 | $ | (17,925 | ) | ||||||||||||||||||
| Cumulative Pre-Tax Cashflow |
US$ ‘000 | $ | 48,996 | $ | 118,428 | $ | 172,798 | $ | 224,692 | $ | 286,349 | $ | 268,424 | |||||||||||||||||||||
| Depreciation |
US$ ‘000 | $ | 42,810 | $ | 2,979 | $ | 5,401 | $ | 7,422 | $ | 10,839 | $ | 16,171 | $ | - | |||||||||||||||||||
| Taxes |
US$ ‘000 | $ | 65,319 | $ | 10,811 | $ | 16,555 | $ | 13,505 | $ | 11,760 | $ | 12,688 | $ | - | |||||||||||||||||||
| After-Tax Cashflow |
US$ ‘000 | $ | 203,105 | $ | 38,185 | $ | 52,876 | $ | 40,865 | $ | 40,134 | $ | 48,969 | $ | (17,925 | ) | ||||||||||||||||||
| Cumulative After-Tax Cashflow |
US$ ‘000 | $ | 38,185 | $ | 91,061 | $ | 131,926 | $ | 172,061 | $ | 221,029 | $ | 203,105 | |||||||||||||||||||||
|
All-In Sustaining Cost |
US$/oz | $ | 1,041 | $ | 1,203 | $ | 986 | $ | 1,031 | $ | 1,052 | $ | 943 | |||||||||||||||||||||
| PROJECT ECONOMICS |
||||||||||||||||||||||||||||||||||
| Pre-tax NPV at 5% discounting |
5.0 | % | US$ ‘000 | $234,234 | ||||||||||||||||||||||||||||||
| Pre-tax NPV at 7.5% discounting |
7.5 | % | US$ ‘000 | $219,617 | ||||||||||||||||||||||||||||||
| Pre-tax NPV at 10% discounting |
10.0 | % | US$ ‘000 | $206,383 | ||||||||||||||||||||||||||||||
| After-Tax NPV at 5% discounting |
5.0 | % | US$ ‘000 | $177,639 | ||||||||||||||||||||||||||||||
| After-Tax NPV at 7.5% discounting |
7.5 | % | US$ ‘000 | $166,719 | ||||||||||||||||||||||||||||||
| After-tax NPV at 10% discounting |
10.0 | % | US$ ‘000 | $156,816 | ||||||||||||||||||||||||||||||
| First Majestic Silver Corp. | Jerritt Canyon Gold Mine, SLR Project No: 233.03396.R0000
| ||||
| NI 43-101 Technical Report - April 30, 2021 | 1-22 | |||
| 1.2.7 | Cash Flow Analysis |
Mine economics have been evaluated using the discounted cash flow method, using mid-year discounting convention, and taking into account annual processed tonnages and gold grades. The associated process recovery, metal price, operating costs, royalties, and capital expenditures were also considered.
The economic analysis confirmed that the Jerritt Canyon Mineral Reserves are economically viable. The pre-tax net present value (NPV) at a 5% base discount rate is US$234 million and the after-tax NPV at a 5% base discount is US$178 million.
The summary of the results of the cash flow analysis is presented in Table 1-6.
Table 1-6: Cash Flow Analysis
Jerritt Canyon
| Item | Discount Rate | Units | Value | |||
| Pre-tax NPV at 5% discount |
5% | US$ million | 234 | |||
| Pre-tax NPV at 7.5% discount |
7.5% | US$ million | 220 | |||
| Pre-tax NPV at 10% discount |
10% | US$ million | 206 | |||
| After-Tax NPV at 5% discount |
5% | US$ million | 178 | |||
| After-Tax NPV at 7.5% discount |
7.5% | US$ million | 167 | |||
| After-tax NPV at 10% discount |
10% | US$ million | 157 | |||
The undiscounted pre-tax cash flow is US$268 million, and the undiscounted after-tax cash flow is US$203 million. For this cash flow analysis, the internal rate of return (IRR) and payback are not applicable as there is no negative initial cash flow (no initial investment to be recovered).
| 1.2.8 | Sensitivity Analysis |
Project risks can be identified in both economic and non-economic terms. Key economic risks were examined by running cash flow sensitivities on after-tax NPV at a 5% discount rate. The following items were examined:
| · | Metal price |
| · | Head grade |
| · | Metallurgical recovery |
| · | Operating costs |
| · | Capital costs |
After-tax sensitivity over the base case has been calculated for -20% to +20% (for head grade), -10% to +5% (for recoveries), -20% to +20% (for metal prices), and -5% to +15% (operating costs and capital costs) variations to determine the most sensitive parameter of this project. The after-tax NPV is most sensitive to head grade and metal prices, followed by operating costs, and is least sensitive to capital costs.
The sensitivities are presented in Table 1-7 and Figure 1-1.
| First Majestic Silver Corp. | Jerritt Canyon Gold Mine, SLR Project No: 233.03396.R0000
| ||||
| NI 43-101 Technical Report - April 30, 2021 | 1-23 | |||
Table 1-7: After-Tax Sensitivity Analysis
Jerritt Canyon
| Head Grade (oz/st Au) |
NPV at 5% (US$ million) | |||
| 80% |
0.16 | 58.8 | ||
| 90% |
0.18 | 118.2 | ||
| 100% | 0.20 | 177.6 | ||
| 110% |
0.22 | 237.1 | ||
| 120% |
0.24 | 296.5 | ||
| Recovery (% Au) |
NPV at 5% (US$ million) | |||
| 90% |
0.77 | 118.5 | ||
| 98% |
0.82 | 148.1 | ||
| 100% | 0.86 | 177.6 | ||
| 103% |
0.88 | 192.4 | ||
| 105% |
0.90 | 207.2 | ||
| Metal Price (US$/oz Au) |
NPV at 5% (US$ million) | |||
| 80% |
1,200 | 59.3 | ||
| 90% |
1,350 | 118.5 | ||
| 100% | 1,500 | 177.6 | ||
| 110% |
1,650 | 236.8 | ||
| 120% |
1,800 | 295.9 | ||
| Operating Costs (US$ million) |
NPV at 5% (US$ million) | |||
| 95.0% |
528.9 | 221.0 | ||
| 97.5% |
557.1 | 199.6 | ||
| 100.0% | 586.1 | 177.6 | ||
| 107.5% |
677.3 | 107.9 | ||
| 115.0% |
775.1 | 32.4 | ||
| First Majestic Silver Corp. | Jerritt Canyon Gold Mine, SLR Project No: 233.03396.R0000
| ||||
| NI 43-101 Technical Report - April 30, 2021 | 1-24 | |||
| Total Capital Costs (US$ million) |
NPV at 5% (US$ million) | |||
| 95.0% |
40.7 | 179.0 | ||
| 97.5% |
41.7 | 178.3 | ||
| 100.0% | 42.8 | 177.6 | ||
| 107.5% |
46.0 | 175.5 | ||
| 115.0% |
49.2 | 173.5 | ||
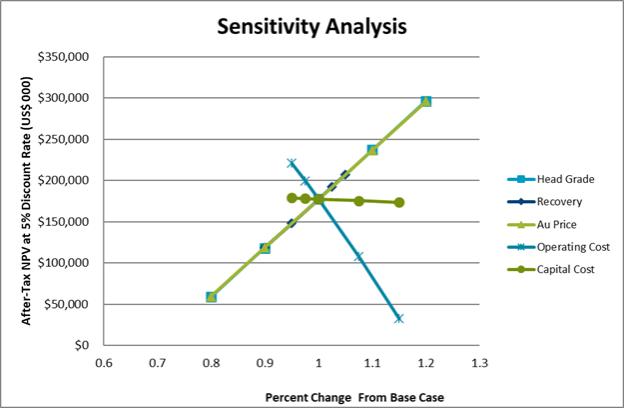
Figure 1-1: After-Tax NPV Sensitivity Graph
| 1.3 | Technical Summary |
| 1.3.1 | Property Description and Location |
The Jerritt Canyon property is located in Elko County, northeastern Nevada. The mill site, shops, and administration and security buildings are located approximately 50 miles north of the town of Elko. The property forms an irregular area that extends approximately 21 miles north-south and 17 miles east-west at its widest and is approximately 76,160 acres. The property is bounded by 116° 10’ west and 115° 78” west longitude and 41° 23’ north and 41° 46’ north latitude. The property boundaries have been surveyed and are located in the field with wooden stakes.
| First Majestic Silver Corp. | Jerritt Canyon Gold Mine, SLR Project No: 233.03396.R0000
| ||||
| NI 43-101 Technical Report - April 30, 2021 | 1-25 | |||
The operations are located on a combination of public and private lands, with the deposits and mining related surface facilities being located primarily on mining claims in United States Forest Service (USFS) land within the Humboldt-Toiyabe National Forest. The process facilities, offices, shops, and tailings dams are located on private land owned by JCG. Additional claims in the southern part of the land package are mostly located on private land with some located on land administered by the United States Bureau of Land Management (BLM).
| 1.3.2 | Land Tenure |
Land tenure on the Jerritt Canyon property includes patented claims, unpatented claims, and fee land. The property covers a large area that extends approximately 21 miles north-south and 17 miles east-west at its widest and is approximately 76,160 acres.
| 1.3.3 | History |
The Jerritt Canyon deposit was discovered by Food Machinery Corporation (FMC) in 1972. In 1976, Meridian Gold LLC (Meridian) and Freeport Minerals Company formed a joint venture to explore and develop the gold deposits in the Jerritt Canyon area and, in 1980, mining commenced with production from the North Generator and Marlboro Canyon open pit mines. The first gold production from the property occurred in July 1981.
Open pit mining was conducted from early 1981 until late 1999, with the mining carried out in the areas of Marlboro Canyon, Alchem, Lower North Generator Hill, Upper North Generator Hill, West Generator, Burns Basin, Mill Creek, Pattani Springs, California Mountains, Dash, Winters Creek, Steer Canyon, and Saval Canyon. The annual production from these areas ranged from approximately 40,000 ounces to 1.4 million ounces.
Underground operations started in 1997 at SSX, and continued until 2008 with production from the Steer, Murray, MCE, Smith, West Generator, and Saval deposits. In 2009, a new mine plan was prepared. Underground mining from the Smith deposit recommenced in late January 2010 and underground mining at SSX recommenced in early October 2010.
From the start of mining in 1980 to the end of December 2020, approximately of 9.7 Moz Au were produced from approximately 49 Mst of ore mined at an average grade of 0.199 oz/st Au.
| 1.3.4 | Geology and Mineralization |
The Jerritt Canyon district is located in the Great Basin, north and northeast of the Carlin Trend of gold deposits. Carlin type gold mineralization at Jerritt Canyon is hosted by silty carbonate or carbonaceous siliciclastic rocks originally deposited as shelf sedimentary rocks during the Paleozoic. The Paleozoic host rocks have been imbricated, faulted, and folded through several orogenic events through the Paleozoic and Mesozoic. An early phase of intrusive igneous activity is represented by west-northwest mafic igneous dikes of Paleozoic age. Carlin type gold deposits were emplaced in the Middle to Late Eocene during an initial phase of extensional tectonics at which time high potassium calc-alkaline magmatic rocks were emplaced. Mafic and intermediate igneous dikes were emplaced during this phase of igneous activity and trend north-northeast.
The occurrence and distribution of gold mineralization at Jerritt Canyon is controlled by both lithology and structure. Deposits at Jerritt Canyon are mostly stratabound or fault hosted. Gold occurs as very fine, micron-size, particles in pyrite and arsenian pyrite.
| First Majestic Silver Corp. | Jerritt Canyon Gold Mine, SLR Project No: 233.03396.R0000
| ||||
| NI 43-101 Technical Report - April 30, 2021 | 1-26 | |||
| 1.3.5 | Exploration Status |
Exploration completed at Jerritt Canyon has included desktop compilation and interpretation of historical datasets, target identification, and RC and core drilling. Jerritt Canyon is primarily drilled from underground drilling sites. From June 23, 2015 through to December 31, 2020, Jerritt Canyon drilled a total of 279,954 ft in 406 core holes and a total of 2,340,646 ft in 16,773 RC holes underground.
| 1.3.6 | Mineral Resources |
The technical work for this report was initiated in March 2020. Wireframe and block modelling for the underground SSX, Smith, WGen, USB, and Saval 4 Deposits were completed by JCG and provided to SLR for verification and audit.
Wireframe and block modelling for Jerritt Canyon were completed by JCG geologists and provided to SLR for verification and audit. A total of five deposits are the focus of this resource update: SSX, Smith, WGen, USB, and Saval 4. Two deposits, Smith and SSX, were broken into separate domains for easier handling in the modelling process. As a result, a total of 17 mineralized wireframe models were built for SSX Zone 1, SSX Zone 2-3, SSX Zone 4, SSX Zone 5, SSX Zone 6, SSX Zone 7, SSX Zone 9, Smith Zone 1, Smith Zone 2-3, Smith Zone 4, Smith Zone 5, Smith Zone 7, Smith Zone 8, Smith Zone 9, Saval 4, USB and WGen. All wireframes are based on approximately a 0.10 oz/st Au cut-off.
Sample information for the diamond drill holes and RC holes was composited into nominal equal lengths of five feet using the run-length compositing algorithm of the Leapfrog Edge modelling software package. Composited assay values were created on an individual zone basis. JCG capped the assays to 1.8 oz/st Au prior to compositing.
A total of 11 different block models were created for each of the different wireframe models. Parent block sizes for all models are 10ft x 10ft x 10ft with sub-block sizes at 2.5ft x 2.5ft x 2.5ft. One interpolation pass was carried out to estimate the grades into the separate block models. Gold grades were estimated into the blocks using Ordinary Kriging interpolation algorithm with Leapfrog Edge.
A 100 ft dilution zone was created around the mineralized wireframe models for all the block models. A single-pass estimation strategy was applied when estimating the grades for the dilution domain in the individual block models.
Block model validation exercises included a comparison of the average grade of the composite samples to the block average grades, visual comparisons of the estimated block grades to the composited gold grades, swath plots, and reconciliation to production statistics.
For reporting of underground Mineral Resources, a 0.11 oz/st Au cut-off grade was estimated using a gold price of US$1,700 per ounce.
| 1.3.7 | Mining and Mineral Reserves |
Jerritt Canyon has been in operation since 1980. Between 1981 and 1999, mining was by open pit. Underground operations began in 1993 with the opening of the Murray Mine and/or West Gen Underground. Underground operations started in 1997 at SSX, and continued until 2008 with production from the Steer, Murray, MCE, Smith, West Generator, and Saval deposits. In 2009, a new mine plan was prepared. Underground mining from the Smith deposit recommenced in late January 2010 and underground mining at SSX recommenced in early October 2010.
| First Majestic Silver Corp. | Jerritt Canyon Gold Mine, SLR Project No: 233.03396.R0000
| ||||
| NI 43-101 Technical Report - April 30, 2021 | 1-27 | |||
Mining is by the cut and fill mining method at Smith and SSX. A significant portion of the Mineral Resources and Mineral Reserves at Smith and SSX are located below the water table and will require dewatering. Dewatering infrastructure, including pumps, dewatering wells, and a water treatment facility, is partially completed.
SLR generated the Jerritt Canyon underground Mineral Reserves by filtering Deswik stope optimizer (DSO) shapes, as provided by JCG, and applying mine designs to the March 31, 2020 as-built survey solids. The design methodology uses both cut-off grade estimation and economic analysis to design and validate the Mineral Reserves.
Stopes and development tasks were classified in the Mineral Resource classification based on the majority of material in the task. For the majority of the orebody the material for each task was one classification type. In areas of mixed classification the Measured or Indicated material accounted for 70% or more of the stope material.
SLR selected stopes to be used in Mineral Reserves first by filtering or identifying stopes based primarily on their proximity to existing historical mine workings, open pits, and infrastructure, and secondly, by identifying large and continuous regions of stopes, until approximately five years of Mineral Reserves were accumulated for each mine. Stopes within 15 ft of historical mine workings were identified and flagged due to a lack of knowledge or confidence in the quality or type of backfill used in those workings. At SSX, a risk factor was applied to these stopes. Measured stopes with a risk factor were classified as Probable, and measured stopes with no risk classified as Proven. At Smith, any material within 15 ft of existing workings was excluded from the Mineral Reserves and material classes were based on block model output.
For reporting of underground Mineral Reserves, a 0.128 oz/st Au cut-off grade was estimated using a gold price of US$1,500 per ounce.
| 1.3.8 | Mineral Processing |
The processing facilities at Jerritt Canyon are designed to operate at a rate of 4,500 stpd with an operating availability of 90% and are permitted to operate at 6,000 stpd. The plant operated at an average rate of 2,265 stpd during 2020. The facilities include:
| · | Primary crushing |
| · | Ore drying |
| · | Secondary crushing |
| · | Tertiary crushing |
| · | Dry grinding |
| · | Roasting |
| · | Thickening |
| · | CIL |
| · | Carbon stripping |
| · | Carbon reactivation |
| · | Electrowinning |
| · | Electrowinning sludge refining |
| · | Oxygen plant |
| First Majestic Silver Corp. | Jerritt Canyon Gold Mine, SLR Project No: 233.03396.R0000
| ||||
| NI 43-101 Technical Report - April 30, 2021 | 1-28 | |||
| · | Cooling pond |
| · | Water evaporation pond |
| · | Tailing Impoundment |
| 1.3.9 | Project Infrastructure |
The Mine has been in commercial production for approximately 39 years and the infrastructure to support a mining and milling operation is established. Surface rights to sustain mining operations on the Mine property are secured through current ownership and claim holder rights. The current infrastructure includes:
| · | Access roads |
| · | Power supply and distribution |
| · | Office buildings |
| · | Warehouse facilities |
| · | Maintenance shops |
| · | Laboratory facilities |
| · | Communication networks |
| · | Onsite security |
| · | TSFs |
| · | Water management systems |
The main access road is approximately seven miles long and is a 22 ft wide paved road between Nevada highway 225 and the mill site. A 100 ft wide haul road provides access between the major mines and the mill site. This road network is approximately 17 miles long.
Power to the Mine is purchased from Nevada Energy through a 125 kV, three-phase transmission line. Monthly power consumption is approximately 8.0 MWh.
Water available on site is sufficient to support all mining and milling operations. All water used at the Mine is from permitted and certificated water rights held by JCG and regulated by the Nevada Division of Water Resources.
| 1.3.9.1 | Tailings and Water Management Facilities |
For the management and disposal of tailings and reduction of surplus process solutions, Jerritt Canyon operates one active tailings storage facility (Tailings Storage Facility-2 (TSF 2)) and two main process water storage facilities which include the WSR and the Evaporation Pond. Jerritt Canyon also operates a process WTP to remove process water contaminates to reduce process water inventories and maintain an overall negative site water balance. Jerritt Canyon is currently in the process of closing and reclaiming TSF 1, which was the first TSF constructed and continuously operated at Jerritt Canyon between 1980 and 2014.
TSF 2 was originally commissioned in 2013 as TSF 2 Phase 1 to store approximately 3.7 Mst of tailings. In 2018, TSF 2 was expanded (Phase 2) to store an additional 1.5 Mst of tailings. Tailings is delivered to the TSF 2 in a slurry consisting of 40%solids to 60%water by weight. At the time of writing this Technical Report, TSF 2 Phase 3 was under construction and has been designed to contain an additional 1.1 Mst of tailings. Because Phase 2 has been filled beyond planned operating capacity, TSF 2 Phase 3’s operational
| First Majestic Silver Corp. | Jerritt Canyon Gold Mine, SLR Project No: 233.03396.R0000
| ||||
| NI 43-101 Technical Report - April 30, 2021 | 1-29 | |||
life has shortened and will be filled to capacity within approximately seven months (i.e. by the end of November 2021).
TSF 2 Phase 4 has been designed and awaits approval from the State of Nevada regulatory agencies. TSF 2 Phase 4 will allow storage of an additional 1.7 Mst of tailings. Even with the shortened operational life of Phase 3, TSF 2 Phase 4 must be constructed in 2021. Assuming a planned production rate of 2,350 stpd, TSF 2 Phase 4 will be filled to capacity by December 2023; however, this date will vary depending on actual mine plan and production rates determined by operations.
After TSF 2 Phase 4 is filled to capacity, Jerritt Canyon plans to dispose of future tailings in the previously designed and approved TSF 3, which is the existing WSR that will be converted to accept tailings disposal. The WSR’s conversion to TSF 3 will allow disposal of approximately of 2.4 Mst of tailings. At an assumed average production rate of 2,350 stpd, TSF 3 would provide approximately 2.6 years tailings storage. If the average deposition rate is increased for the 2021 mine plan and following, the timeline for creation of additional tailings management area will be shortened proportionally.
The process WTP was constructed to eliminate the surplus process water inventory located in the Jerritt Canyon WSR and Evaporation Pond and to create additional storage capacity for future tailings storage. The process WTP’s treated permeate is disposed of in injection wells while its brine concentrate is disposed of in the Evaporation Pond.
| 1.3.10 | Environmental, Permitting and Social Considerations |
Jerritt Canyon has been in operation since 1981. Prior to and during operation, numerous environmental studies and evaluations have been conducted to support permit applications and operations. An Environmental Impact Statement (EIS) was completed and the Record of Decision (ROD) was issued in 1980. Operating permits are in place and current.
The historical operation of Jerritt Canyon resulted in a number of environmental concerns, including seepage from the TSF, limited TSF capacity, lack of water treatment facilities, etc. JCG inherited this legacy and worked diligently to mitigate the concerns when operator. JCG intends to continue to mitigate these concerns.
Jerritt Canyon is located in Elko County, Nevada which is a mining-friendly jurisdiction. Numerous other mining operations are located in the same area and the site has a good relationship with the local community.
Approved closure and reclamation plans are in place for Jerritt Canyon. The total reclamation costs, as updated in 2019, estimated from the 2019 Annual Work Plan (AWP) are approximately $86.6 million.
| 1.3.11 | Capital and Operating Cost Estimates |
Sustaining capital costs were estimated by JCG, with the majority of the costs consisting of mine development and heavy mobile equipment needed to replace the aging fleet. Sustaining capital costs for Jerritt Canyon are summarized in Table 1-8.
| First Majestic Silver Corp. | Jerritt Canyon Gold Mine, SLR Project No: 233.03396.R0000
| ||||
| NI 43-101 Technical Report - April 30, 2021 | 1-30 | |||
Table 1-8: Sustaining Capital Cost Estimate
Jerritt Canyon
| Category |
Sustaining Costs (US$ millions)
|
Sustaining Cost Basis (US$/st milled) | ||
|
Mining |
21.4 | 6.00 | ||
| Tailings Facility |
9.0 | $9M in 2021 | ||
| Processing Plant |
3.6 | 1.00 | ||
| Reclamation and closure |
5.3 | 1.50 | ||
| Sustaining Exploration Diamond Drilling |
3.6 | 1.00 | ||
| Total
|
42.8
|
-
| ||
SLR notes that reclamation costs have not been estimated for the end of mine life, though a progressive annual reclamation cost has been applied based on a rate of $1.50/st milled.
Operating costs estimated by JCG, averaging US$121.5 million/yr or $164.68/st ore were estimated for mining, processing, and G&A. Operating cost inputs such as labour rates, consumables, and supplies were based on JCG operating data. A summary of Jerritt Canyon operating costs is provided in Table 1-9.
Table 1-9: Operating Cost Estimate
Jerritt Canyon
| Parameter | Total LOM (US$ millions)
|
Average Year (US$ millions/yr)
|
LOM Unit Cost (US$/st milled)
| |||
|
Mining |
315.6 | 65.6 | 88.69 | |||
| Labor |
133.5 | 27.5 | 37.50 | |||
| Variable Costs |
93.4 | 19.3 | 26.25 | |||
| Maintenance Cost |
14.9 | 3.1 | 4.20 | |||
| Fixed Costs |
57.1 | 11.8 | 16.05 | |||
| Dewatering Phase 1 |
1.4 | 1.4 in 2021 | 0.38 | |||
| Dewatering Phase 2 |
8.4 | 8.4 in 2021 | 2.36 | |||
| Dewatering Phase 3 |
1.6 | 1.6 in 2022 | 0.45 | |||
| Other costs |
5.3 | 1.1 | 1.50 | |||
| Development | 46.2 | 9.5 | 12.99 | |||
| Labor |
20.6 | 4.3 | 5.80 | |||
| Primary Development, Horizontal |
14.4 | 3.0 | 4.06 | |||
| Maintenance Cost |
2.3 | 0.5 | 0.65 | |||
| Fixed Costs |
8.8 | 1.8 | 2.48 | |||
| Processing
|
160.2
|
33.1
|
45.00
| |||
| First Majestic Silver Corp. | Jerritt Canyon Gold Mine, SLR Project No: 233.03396.R0000
| ||||
| NI 43-101 Technical Report - April 30, 2021 | 1-31 | |||
| Parameter | Total LOM (US$ millions)
|
Average Year (US$ millions/yr)
|
LOM Unit Cost (US$/st milled)
| |||
| Labor |
56.9 | 11.8 | 16.00 | |||
| Variable Costs |
35.6 | 7.3 | 10.00 | |||
| Maintenance Cost |
32.0 | 6.6 | 9.00 | |||
| Fixed Costs |
35.6 | 7.3 | 10.00 | |||
| G&A | 64.1 | 13.2 | 18.00 | |||
| Total | 586.1 | 121.5 | 164.68 | |||
| First Majestic Silver Corp. | Jerritt Canyon Gold Mine, SLR Project No: 233.03396.R0000
| ||||
| NI 43-101 Technical Report - April 30, 2021 | 1-32 | |||
| 2.0 | INTRODUCTION |
SLR was retained by Jerritt Canyon Gold LLC (JCG) to prepare an independent Technical Report on the Jerritt Canyon Gold Mine (Jerritt Canyon or the Mine), located in northeast Nevada, USA. The purpose of this Technical Report is to support the disclosure of Mineral Resource and Mineral Reserve estimates for the underground portion of the Mine. This Technical Report conforms to NI 43-101 Standards of Disclosure for Mineral Projects. On April 30, 2021, First Majestic Silver Corp. (First Majestic) acquired all of the issued and outstanding shares of JCG. As such First Majestic now indirectly owns and operates Jerritt Canyon, through the owner and operator JCG.
First Majestic is a publicly traded mining company with a portfolio of operating mines and projects. Jerritt Canyon is a long term producer, currently with two mines planning to produce, on average, 2,300 tons per day (stpd) from underground operations primarily using the cut and fill mining method; SSX-Steer Complex (SSX) and Smith – which are located 50 miles north of Elko, Nevada.
Since mining began at Jerritt Canyon, more than 9.0 million contained ounces of gold have been produced. Gold was first discovered in 1972, with the first gold poured in 1981. Between 1981 and 1999, mining was by open pit. Underground operations began in 1993 with the opening of the West Gen Underground, followed by the Murray Mine, and MCE Mine.
| 2.1 | Sources of Information |
A site visit was carried out on April 20, 2021 by Ryan Rodney, C.P.G., SLR Associate Geologist, and Jeremy Collyard, MMSA QP, SLR Principal Environmental Specialist.
Discussions were held with the following JCG and Small Mine Development LLC (SMD) personnel:
| · | Kevin Small, President and CEO, JCG |
| · | Gary Nassif, Senior Vice President, JCG |
| · | Gordon L. Fellows, Mining Manager, JCG |
| · | Taylor Vieira, Consulting Mineral Resources Specialist, JCG |
| · | Steve McMillin, Senior Mine Geologist, JCG |
| · | John Braaten, Mill Manager, JCG |
| · | Mirinda Jones, Environmental Manager, JCG |
| · | Shaun Rose, Safety Coordinator, JCG |
| · | Ramon A. Beltran, Underground Operations Engineer, SMD |
| · | John Featherston, Senior Engineer, SMD |
The following JCG employees provided information to SLR for the indicated sections of this Technical Report:
| Name | Title | Section | ||
| Kevin Small |
President and CEO | |||
| Gary Nassif |
Senior Vice President | Sections 4 and 6 | ||
| Gordon L. Fellows |
Mining Manager | Sections 16, 21, and 22 | ||
| Taylor Vieira |
Mineral Resources Specialist | Section 14 | ||
| First Majestic Silver Corp. | Jerritt Canyon Gold Mine, SLR Project No: 233.03396.R0000
| ||||
| NI 43-101 Technical Report - April 30, 2021 | 2-1 | |||
| Name | Title | Section | ||
| Steve McMillin |
Senior Mine Geologist | Sections 6 and 10 | ||
| Jeffrey Phinisey |
Consulting Geologist | Sections 6 and 8 | ||
| Mirinda Jones |
Environmental Manager | Sections 16, 18, and 20 | ||
| Hector Casapia |
Chief Metallurgist | Sections 13, 17, and 20 | ||
Phillip E. Brown, C.P.G., R.P.G, SLR Associate Principal Hydrogeologist, assisted the mining QPs in reviewing the hydrogeologic assumptions and David Wanner, P.Eng., Principal Engineer, SRK Consulting (U.S.), Inc. provided an update on the Tailings Storage Facilities at Jerritt Canyon for this Technical Report. The technical work for this Technical Report was initiated in March 2020. Wireframe and block modelling for the SSX, Smith, Saval 4, USB and West Gen mines was completed by JCG. All resource wireframes and block models were verified and audited by Ryan Rodney, C.P.G., SLR Associate Geologist.
This Technical Report was prepared by the following SLR personnel: Ryan Rodney, C.P.G., Associate Geologist, Chelsea Hamilton, P.Eng., Project Mining Engineer, Andrew P. Hampton, M.Sc., P.Eng., Principal Metallurgist, and Jeremy Scott Collyard, MMSA QP, Principal Environmental Specialist and Gordon L. Fellows, P.E., Jerritt Canyon, Mining Manager. Mr. Rodney is responsible for Sections 2 to 12, 14, 23, and 24. Mr. Fellows is responsible for Sections 15, 16, and 18. Ms. Hamilton is responsible for Sections 19, 21, and 22. Mr. Hampton is responsible for Sections 13, and 17. Mr. Collyard is responsible for Section 20. All authors share responsibility for Sections 1, 25, 26, and 27.
The reviewed documentation and other sources of information are listed at the end of this Technical Report in Section 27 References.
Dates in the Technical Report
| · | Cut-off date for exploration information in Mineral Resources - April 29, 2020 |
| · | Cut-off date for production, costs, and depletion – December 31, 2020 |
| · | Effective date - Mineral Resources and Mineral Reserves – December 31, 2020 |
| · | Signature date – April 30, 2021 |
| First Majestic Silver Corp. | Jerritt Canyon Gold Mine, SLR Project No: 233.03396.R0000
| ||||
| NI 43-101 Technical Report - April 30, 2021 | 2-2 | |||
| 2.2 | List of Abbreviations |
Units of measurement used in this Technical Report conform to the metric system. All currency in this Technical Report is US dollars (US$) unless otherwise noted.
| m | micron | kVA | kilovolt-amperes | |||
| mg | microgram | kW | kilowatt | |||
| a |
annum | kWh | kilowatt-hour | |||
| A |
ampere | L | litre | |||
| bbl |
barrels | lb | pound | |||
| Btu |
British thermal units | L/s | litres per second | |||
| °C |
degree Celsius | m | metre | |||
| C$ |
Canadian dollars | M | mega (million); molar | |||
| cal |
calorie | m2 | square metre | |||
| cfm |
cubic feet per minute | m3 | cubic metre | |||
| cm |
centimetre | MASL | metres above sea level | |||
| cm2 |
square centimetre | m3/h | cubic metres per hour | |||
| d |
day | mi | mile | |||
| dia |
diameter | min | minute | |||
| dmt | dry metric tonne | mm | micrometre | |||
| dwt |
dead-weight ton | mm | millimetre | |||
| °F |
degree Fahrenheit | mph | miles per hour | |||
| ft |
foot | MVA | megavolt-amperes | |||
| ft2 |
square foot | MW | megawatt | |||
| ft3 |
cubic foot | MWh | megawatt-hour | |||
| ft/s |
foot per second | oz | Troy ounce (31.1035g) | |||
| g |
gram | oz/st, opt | ounce per short ton | |||
| G |
giga (billion) | ppb | part per billion | |||
| Gal |
Imperial gallon | ppm | part per million | |||
| g/L |
gram per litre | psia | pound per square inch absolute | |||
| Gpm |
Imperial gallons per minute | psig | pound per square inch gauge | |||
| g/t |
gram per tonne | RL | relative elevation | |||
| gr/ft3 |
grain per cubic foot | s | second | |||
| gr/m3 |
grain per cubic metre | st | short ton | |||
| ha |
hectare | stpa | short ton per annum | |||
| hp |
horsepower | stpd | short ton per day | |||
| First Majestic Silver Corp. | Jerritt Canyon Gold Mine, SLR Project No: 233.03396.R0000
| ||||
| NI 43-101 Technical Report - April 30, 2021 | 2-3 | |||
| Hr | hour | t | metric tonne | |||
| Hz |
hertz | tpa | metric tonne per annum | |||
| in. |
inch | tpd | metric tonne per day | |||
| in2 |
square inch | US$ | United States dollar | |||
| J |
joule | USg | United States gallon | |||
| k |
kilo (thousand) | USgpm | US gallon per minute | |||
| kcal |
kilocalorie | V | volt | |||
| kg |
kilogram | W | watt | |||
| km |
kilometre | wmt | wet metric tonne | |||
| km2 |
square kilometre | wt% | weight percent | |||
| km/h |
kilometre per hour | yd3 | cubic yard | |||
| kPa |
kilopascal | yr | year | |||
| First Majestic Silver Corp. | Jerritt Canyon Gold Mine, SLR Project No: 233.03396.R0000
| ||||
| NI 43-101 Technical Report - April 30, 2021 | 2-4 | |||
| 3.0 | RELIANCE ON OTHER EXPERTS |
This Technical Report has been prepared by SLR for First Majestic. The information, conclusions, opinions, and estimates contained herein are based on:
| • | Information available to SLR at the time of preparation of this Technical Report. |
| • | Assumptions, conditions, and qualifications as set forth in this Technical Report. |
For the purpose of this report, SLR has relied on ownership information provided by JCG. For fee lands, patents, etc., JCG has relied on an opinion by Harris & Thompson (an association of attorneys), entitled “April 2014 Update Title Opinion on Jerritt Canyon Project, Elko County, Nevada” dated April 17, 2014, completed for Veris Gold USA. For unpatented claims, JCG has relied on an opinion by Erwin Thompson Faillers dated April 20, 2021 entitled “2021 Title Opinion Update on Jerritt Canyon Project (Unpatented Claims Only), Elko County, Nevada”. Both these opinions are relied on in Section 4.0 and the Summary of this Technical Report. SLR has not researched property title or mineral rights for Jerritt Canyon and expresses no opinion as to the ownership status of the property.
Except for the purposes legislated under provincial securities laws, any use of this Technical Report by any third party is at that party’s sole risk.
| First Majestic Silver Corp. | Jerritt Canyon Gold Mine, SLR Project No: 233.03396.R0000
| ||||
| NI 43-101 Technical Report - April 30, 2021 | 3-1 | |||
| 4.0 | PROPERTY DESCRIPTION AND LOCATION |
| 4.1 | Property Description and Location |
Jerritt Canyon is located in Elko County, northeastern Nevada (Figure 4-1). The mill site, shops, administration, and security buildings are located approximately 50 miles north of the town of Elko. Jerritt Canyon covers a large area that extends approximately 21 miles north-south and 17 miles east-west at its widest and is approximately 119 square miles (Figure 4-2). The property is bounded by 116°10’ west and 115° 78’W longitude and 41°23’N and 41° 46’ N latitude. The property boundaries have been surveyed and are identified in the field with wooden stakes.
The Jerritt Canyon operations are located on a combination of public and private lands, with the mines and mining-related surface facilities being located primarily on United States Forest Service (USFS) and mining claims within the Humboldt-Toiyabe National Forest (Figure 4-2). The processing facilities, offices, shops, and tailings dams are located on private land owned by JCG. Additional claims in the southern portion of the land package are predominantly located on private land with some located on land administered by the United States Bureau of Land Management (BLM).
| First Majestic Silver Corp. | Jerritt Canyon Gold Mine, SLR Project No: 233.03396.R0000
| ||||
| NI 43-101 Technical Report - April 30, 2021 | 4-2 | |||
Figure 4-1: Location of the Jerritt Canyon Property
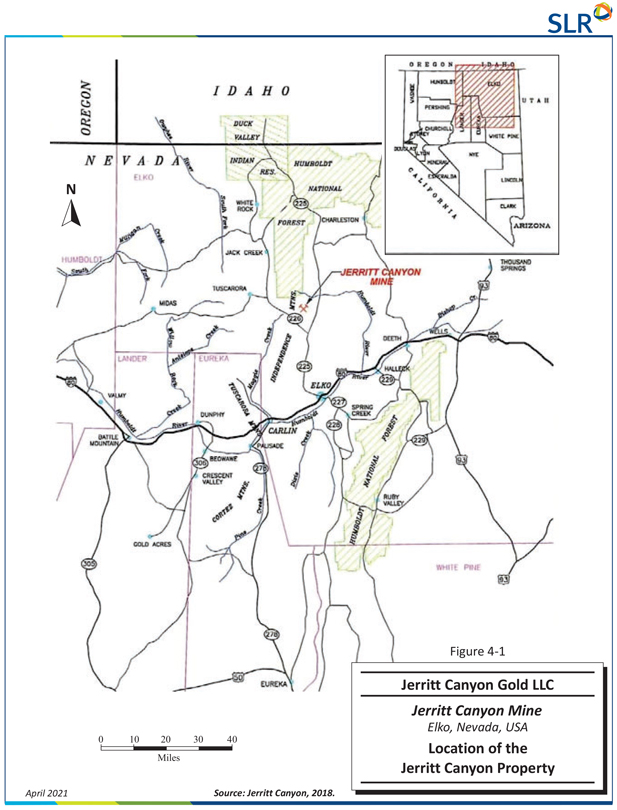
| First Majestic Silver Corp. | Jerritt Canyon Gold Mine, SLR Project No: 233.03396.R0000
| ||||
| NI 43-101 Technical Report - April 30, 2021 | 4-3 | |||
Figure 4-2: Property Map
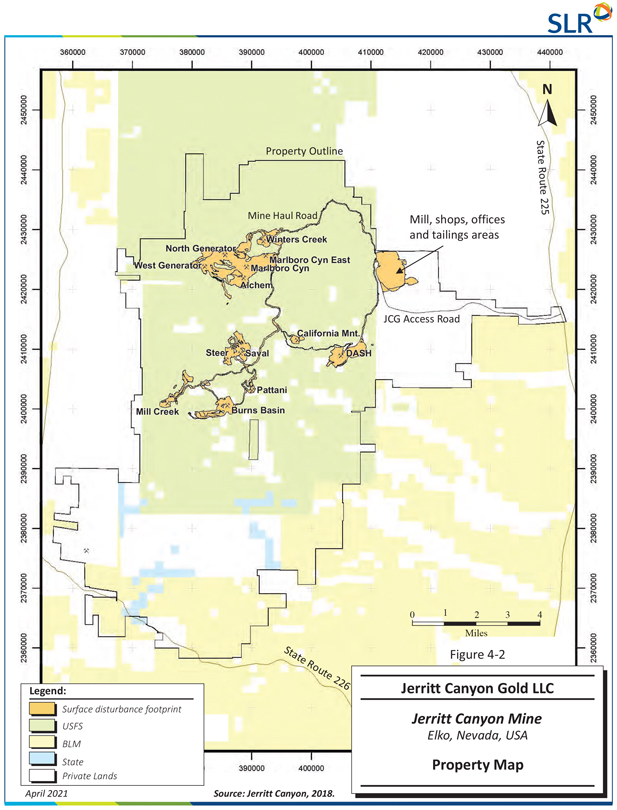
| First Majestic Silver Corp. | Jerritt Canyon Gold Mine, SLR Project No: 233.03396.R0000
| ||||
| NI 43-101 Technical Report - April 30, 2021 | 4-4 | |||
| 4.2 | Land Tenure |
Jerritt Canyon land tenure types include patented claims, unpatented claims, and fee land. Claims and fee land comprising the Jerritt Canyon property are both owned and leased and are summarized in Table 4-1. The total land package for the Jerritt Canyon property totals 76,160 acres.
Table 4-1: Summary of Claims
Jerritt Canyon
| Title Type | No. Claims | |
| Unpatented Owned Claims |
2,910 | |
| Unpatented Leased Claims |
278 | |
| Patented Claims Owned |
54 | |
The distribution of patented claims, unpatented claims, and fee land are illustrated in Figure 4-3 to Figure 4-5, respectively. The rights associated with the fee land include mineral and surface rights and are different for the various land packages (agreements) (Figure 4-5). Yearly fees to maintain the unpatented claims in good standing consist of $165 per claim payable to the BLM and $12 per claim payable to the Elko County Recorder. Each document submitted to the Elko County Recorder also requires a one-time document fee of $12. The claim payments for 2020 to 2021 are summarized in Table 4-2. The annual BLM renewal date is September 30. The payment of fees and filing of documents (indicating the intent to maintain unpatented mining claims and the completion of the BLM maintenance fee payment) with the Elko County Recorder are due annually on November 1.
Table 4-2: Summary of Claim Payments
Jerritt Canyon
| Claim Type and Lease |
No. | BLM Maintenance Fees ($165/claim) |
Elko County Recorder ($12/claim) |
Elko County |
Elko County Total | |||||
| Owned Unpatented Lode Claims - |
2,910 | 480,150 | 34,920 | 12 | 34,932 | |||||
|
Lease NV 10101 - |
141 | 23,265 | 1,692 | 12 | 1,704 | |||||
|
Lease NV 10105 - |
121 | 19,965 | 1,452 | 12 | 1,464 | |||||
| Lease NV 10120 - BIRDS EYE Claims |
10 | 1,650 | 120 | 12 | 132 | |||||
| Lease NV 10125 - |
6 | 990 | 72 | 12 | 84 | |||||
| Leased Claims Total | 278 | 45,870 | 3,336 | 48 | 3,384 | |||||
| First Majestic Silver Corp. | Jerritt Canyon Gold Mine, SLR Project No: 233.03396.R0000
| ||||
| NI 43-101 Technical Report - April 30, 2021 | 4-5 | |||
Figure 4-3: Patented Claims
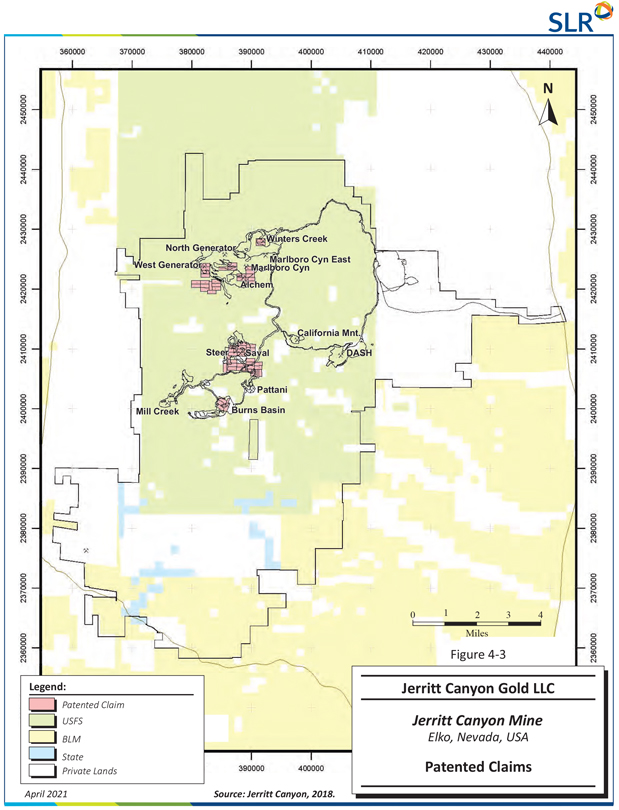
| First Majestic Silver Corp. | Jerritt Canyon Gold Mine, SLR Project No: 233.03396.R0000
| ||||
| NI 43-101 Technical Report - April 30, 2021 | 4-6 | |||
Figure 4-4: Unpatented Claims
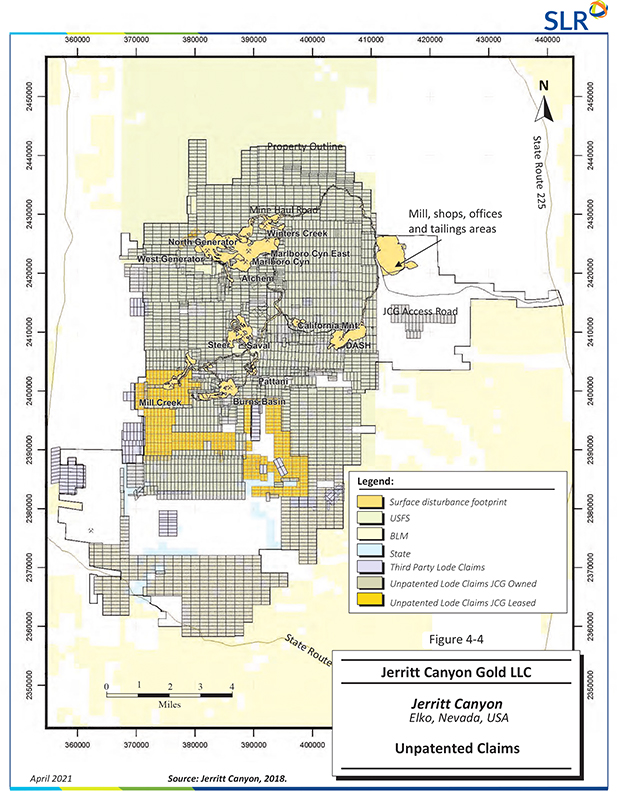
| First Majestic Silver Corp. | Jerritt Canyon Gold Mine, SLR Project No: 233.03396.R0000
| ||||
| NI 43-101 Technical Report - April 30, 2021 | 4-7 | |||
Figure 4-5: Fee Lands
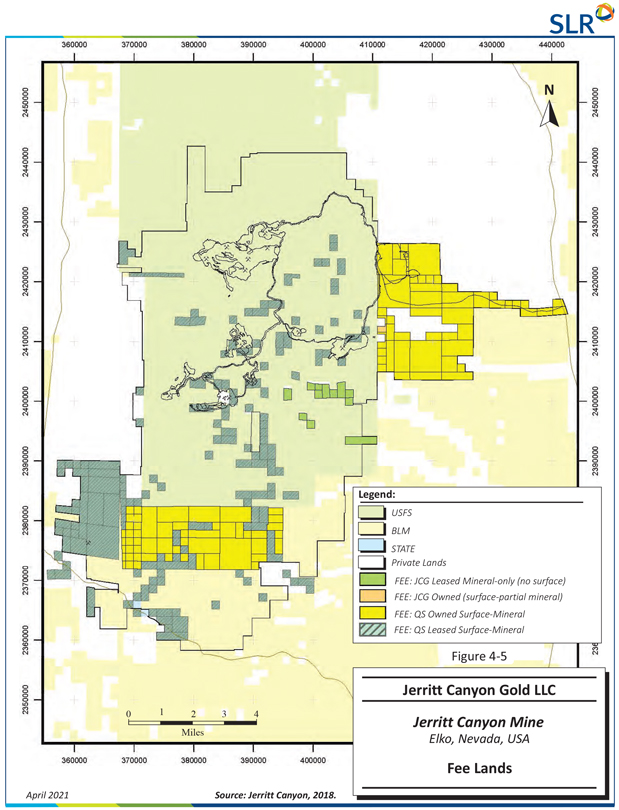
| First Majestic Silver Corp. | Jerritt Canyon Gold Mine, SLR Project No: 233.03396.R0000
| ||||
| NI 43-101 Technical Report - April 30, 2021 | 4-8 | |||
SLR notes that some of the Jerritt Canyon claims and fee lands are subject to a Net Smelter Return (NSR) royalty which varies from 1.5% to 6% depending upon the lease agreements with various property owners. The fee land, which was originally purchased to secure access from State Route 225, is subject to a 33% NSR, however, future gold production from this land is unlikely. The distribution of claims and fee lands subject to royalty payments is illustrated in Figure 4-5.
There are currently three Nevada (NV) lease file agreements (files NV-10106, NV-10110, NV-10113) that cover land that has mine production. As a result, the lease holders of the producing land are entitled to receive production royalty payments that range from 2.5% to 5%.
Other land held by lease holders may be subject to annual or semi-annual land payments that include advance royalties, land use payments, rentals, loss of grazing, and the use of land for a communications tower. The advance royalties are the minimum amounts the lease holders are entitled to annually. On producing land, these advance royalties may be recovered by JCG if certain production royalty thresholds are met or surpassed during the production year. Some of the land payments may be adjusted annually based on consumer/producer price indexes or annual increases.
The QP is not aware of any environmental liabilities on the Jerritt Canyon property other than those identified in Section 20 of this Technical Report. JCG has all required permits to conduct the proposed work on the property. The licences and permits required as well as government authority and description of the application are summarized in Section 20 of this Technical Report.
On September 9, 2019, Ely Gold closed the purchase of 100% of all rights and interests in a Per Ton Royalty Interest (“PTR”) on the Jerritt Canyon Processing Facilities from an arms-length third party (Behre Dolbear, 2020). On May 13, 2020, Ely Gold closed the purchase of a 0.5% net smelter returns royalty on the entire Jerritt Canyon property from Mr. Eric Sprott. Sprott originally acquired the royalty from Veris Gold USA Inc. in 2014, pursuant to an April 9, 2014 agreement (Behre Dolbear, 2020).
SLR is not aware of any other significant factors and risks that may affect access, title, or the right or ability to perform the proposed work program on the property.
| First Majestic Silver Corp. | Jerritt Canyon Gold Mine, SLR Project No: 233.03396.R0000
| ||||
| NI 43-101 Technical Report - April 30, 2021 | 4-9 | |||
| 5.0 | ACCESSIBILITY, CLIMATE, LOCAL RESOURCES, INFRASTRUCTURE AND PHYSIOGRAPHY |
| 5.1 | Accessibility |
The Mine is located in Elko County, Nevada approximately 50 miles north of the town of Elko. Access to the Jerritt Canyon property is via Nevada State Route (SR) 225 and an approximately seven mile mine access road which leads to the main gate where the administrative offices, processing plant, warehouse, maintenance shops, and tailings impoundment areas are located (Figure 4-1 and Figure 4-2). The access road is asphalt and in good condition. The mines are accessed via a main haul road which is maintained on a regular basis (Figure 4-2). Historical mines, active reclamation sites, and exploration sites are accessed through lesser or unmaintained roads and trails.
| 5.2 | Physiography |
The Mine is located in the Independence Mountain Range in the Basin and Range Province of northern Nevada. The mill and associated buildings and facilities are located in the eastern foothills of the range at an elevation of approximately 6,400 ft. All past and present mining operations are located at various elevations within the mountain range. The main haul road reaches a maximum elevation of approximately 8,000 ft. The vegetation is typical of the Basin and Range Province with sagebrush dominant at lower elevations. Small stands of aspen and isolated fir trees grow in canyons and drainages.
| 5.3 | Climate |
The climate is temperate with winter temperatures between 0ºF and 40ºF and summer temperatures between 35ºF and 90ºF. Average annual precipitation at the tailings impoundment is 14 in. and average annual evaporation is 43 in. A significant amount of precipitation falls as snow and increases with elevation towards the mining areas. Mine operations are rarely halted by weather conditions, although ore haulage from the mines may take longer at times. The mill, warehouse, shop, and administrative facilities are at a lower elevation and therefore less exposed to extremes in weather. Snowfall is generally common from December to May.
| 5.4 | Local Resources |
With a population of approximately 20,500, Elko is the closest town to Jerritt Canyon. Elko straddles Interstate 80 and is serviced by daily commercial flights from/to Salt Lake City, Utah, situated approximately 230 miles west of Salt Lake City, Utah and 290 miles east of Reno, Nevada. Most of the Jerritt Canyon workforce reside in Elko and the adjacent town of Spring Creek. Other communities in northern Nevada and Utah provide a labour force to support mining at Jerritt Canyon and other operations in northern Nevada. Elko is a supply centre for the mining industry of northern Nevada, sourcing most equipment, supplies, and services. All supplies and equipment can be transported over Nevada SR 225, the mine access road, and the mine haul road.
| First Majestic Silver Corp. | Jerritt Canyon Gold Mine, SLR Project No: 233.03396.R0000
| ||||
| NI 43-101 Technical Report - April 30, 2021 | 5-1 | |||
| 5.5 | Infrastructure |
Jerritt Canyon has been in commercial production for approximately 39 years and the infrastructure to support a mining and milling operation is well established. Surface rights to sustain mining operations on the Mine property are secured through current ownership and claim holder rights.
Power to the Mine site is purchased from Nevada Energy through a 125 kV, three-phase transmission line. Power is supplied to the property via a station located in the processing plant area and is distributed to the mines and other necessary facilities through a grid of surface lines.
Water available at Jerritt Canyon is sufficient to support all mining and milling operations. Approximately 700 gallons per minute (gpm) of water is required to operate the mill with two primary water sources: (1) a “dirty” water source consisting of the tailings storage facility 1 (TSF 1) seepage collection system that has contributions from 90 small diameter water wells around TSF 1, four seepage collection trenches, and three embankment blanket drains that collectively produce 1,000 gpm, and (2) a cleaner water source from two deep water wells that are each capable of producing 500 gpm. All water used at Jerritt Canyon is from permitted and certificated water rights held by JCG and regulated by the Nevada Division of Water Resources (NDWR).
Surface rights owned by JCG around the existing TSFs provide sufficient space for additional tailings storage and water storage to support future mining.
Additional details on infrastructure are presented in Section 18 of this Technical Report.
| First Majestic Silver Corp. | Jerritt Canyon Gold Mine, SLR Project No: 233.03396.R0000
| ||||
| NI 43-101 Technical Report - April 30, 2021 | 5-2 | |||
| 6.0 | HISTORY |
| 6.1 | Prior Ownership |
In 1972, Food Machinery Corporation (FMC) discovered a disseminated gold deposit at Jerritt Canyon. The subsequent ownership history of the Jerritt Canyon property is summarized as follows:
| · | In 1976, FMC, later Meridian Gold LLC (Meridian) formed a joint venture (JV) with Freeport Minerals Company, later Freeport McMoRan (Freeport), to explore and develop the Jerritt Canyon property. Mining at Jerritt Canyon commenced in 1980. |
| · | In 1990, Freeport sold its interest in the Jerritt Canyon JV to Minorco SA (Minorco). This purchase allowed Minorco (through its wholly-owned subsidiary Independence Mining Company) to attain a 70% ownership of the Jerritt Canyon property and become the operator. Meridian retained its 30% ownership of the Jerritt Canyon property. |
| · | In 1998, Minorco sold its 70% interest in the Jerritt Canyon JV to AngloGold Ltd. (AngloGold). |
| · | In 2003, Queenstake Resources USA Inc. (Queenstake) (a subsidiary of Queenstake Resources Ltd.) purchased a 100% interest in the Jerritt Canyon property from the JV partners Meridian and AngloGold. |
| · | In June 2007, Queenstake became a wholly-owned subsidiary of Yukon-Nevada Gold Corp. (Yukon-Nevada) which was formed by the merger of Queenstake Resources Ltd. and YGC Resources Ltd. |
| · | In October 2012, Yukon-Nevada changed its name to Veris Gold Corp. (Veris). |
| · | In January 2013, Queenstake, now a wholly-owned subsidiary of Veris, changed its name to Veris Gold USA Inc. (VUSA). In 2014, Veris declared bankruptcy. |
| · | In 2015, JCG acquired an 80% interest in the Jerritt Canyon property. The remaining 20% was held by WBOX 2014-1 Ltd. which had an outstanding balance on a loan made to Veris. |
| · | In June 2020, JCG acquired the remaining 20% from WBOX 2014-1 Ltd., acquiring a 100% interest in the Jerritt Canyon property. |
| · | On April 30, 2021, First Majestic acquired all of the issued and outstanding common shares of JCG. |
| 6.2 | Production History |
Gold mineralization discovered in the Jerritt Canyon area in 1972 was found to share similar metallurgical challenges to the mineralization discovered by Newmont Corporation (Newmont) elsewhere in the Carlin Trend. Subsequent advances in processing technologies for gold deposits of the Carlin Trend, however, resulted in this style of mineralization becoming economically viable. In 1976, Meridian and Freeport formed a joint venture to explore and develop the gold deposits in the Jerritt Canyon area and in 1980 mining commenced with production from the North Generator and Marlboro Canyon open pit mines. The first gold production from Jerritt Canyon occurred in July 1981.
From early 1981 until late 1999, open pit mining was conducted in the areas of Marlboro Canyon, Alchem, Lower North Generator Hill, Upper North Generator Hill, West Generator, Burns Basin, Mill Creek, Pattani Springs, California Mountains, Dash, Winters Creek, Steer Canyon, and Saval Canyon. Open pit production from these areas ranged from approximately 40,000 ounces of gold (oz Au) (Pattani Springs) to 1.4 million ounces of gold (Moz Au) (Marlboro Canyon) and totalled 5.2 Moz Au.
| First Majestic Silver Corp. | Jerritt Canyon Gold Mine, SLR Project No: 233.03396.R0000
| ||||
| NI 43-101 Technical Report - April 30, 2021 | 6-1 | |||
In 1993, underground operations commenced at West Gen Underground, and continued until 2008 with production from the Steer, Murray, MCE, Smith, SSX, and Saval deposits. In 2008 the operating company, Queenstake, made the decision to cease mining operations due to increasing costs associated with infrastructure expenditures, in addition to an inability to secure required environmental permits in a timely manner.
In 2009, the Nevada Division of Environmental Protection (NDEP) approved plans for the recommencement of Jerritt Canyon production. Queenstake also completed major modifications to the key components of the roaster, leach circuit, thickener, and other sections of the mill.
In 2009, a new mine plan was prepared, and in 2010 underground mining from the Smith deposit restarted using contract miner Small Mine Development (SMD). Underground mining at SSX recommenced using Queenstake staff.
From the commencement of mining in 1980 to the end of 2020, approximately 9.7 Moz Au were produced from approximately 49 million tons (Mst) of ore mined at an average grade of 0.199 oz/st Au (Table 6-1). Open pit mining at Jerritt Canyon produced a total of approximately 5.2 Moz Au from approximately 29.8 Mst of ore at an average grade of 0.175 oz/st Au. The underground mines produced a total of approximately 4.5 Moz Au from approximately 19.2 Mst of ore at an average grade of 0.237 oz/st Au. Since 2010, the majority of production has come from the SSX and Smith deposits, as detailed in Table 6-1.
From June 2015 to December 2020, JCG mined approximately 5.2 Mst at an average grade of 0.155 oz/st Au containing a total of approximately 0.81 Moz Au (Table 6-2). The locations of the historical (and current) mines are illustrated in Figure 6-1.
Table 6-1: Mine Production History
Jerritt Canyon
| Production Period | Tons Mined |
Grade (oz/st Au) |
Contained Metal (oz Au) | |||||
|
Open Pit Deposits |
||||||||
| Marlboro Canyon |
1981-1990 | 5,798,600 | 0.241 | 1,400,045 | ||||
| Alchem |
1991-1994 | 1,657,600 | 0.098 | 162,621 | ||||
| L. North Gen. Hill |
1980-1993 | 1,226,000 | 0.192 | 235,461 | ||||
| U. North Gen. Hill |
1980-1993 | 7,636,300 | 0.170 | 1,298,308 | ||||
| West Generator |
1986-1993 | 3,979,000 | 0.155 | 616,647 | ||||
| Burns Basin |
1988-1998 | 2,441,800 | 0.169 | 412,328 | ||||
| Mill Creek |
1992-1994 | 895,700 | 0.121 | 108,270 | ||||
| Pattani Springs |
1988-1990 | 387,000 | 0.108 | 41,896 | ||||
| California Mountain |
1993-1994 | 410,300 | 0.162 | 66,341 | ||||
| Dash |
1996-1999 | 1,906,100 | 0.221 | 420,789 | ||||
| Winters Creek |
1992-1995 | 1,243,700 | 0.126 | 156,317 | ||||
| Steer Canyon |
1994-1997 | 477,300 | 0.132 | 63,004 | ||||
| First Majestic Silver Corp. | Jerritt Canyon Gold Mine, SLR Project No: 233.03396.R0000
| ||||
| NI 43-101 Technical Report - April 30, 2021 | 6-2 | |||
| Production Period | Tons Mined |
Grade (oz/st Au) |
Contained Metal (oz Au) | |||||
|
Saval Canyon |
1994-1997 | 1,741,900 | 0.126 | 218,682 | ||||
| Subtotal – Open Pit | 1980-1999 | 29,801,300 | 0.175 | 5,200,709 | ||||
| Underground Deposits |
||||||||
| SSX |
1997-2008; 2011; 2012-2020 | 7,969,243 | 0.229 | 1,825,969 | ||||
| Steer |
2004-2006 | 68,174 | 0.233 | 15,879 | ||||
| MCE (formerly Papillion) |
1997-2004 | 258,295 | 0.369 | 95,359 | ||||
| Murray |
1997-2006 | 3,780,795 | 0.330 | 1,248,777 | ||||
| Smith |
1999-2008; 2010-2020 | 5,525,953 | 0.187 | 1,033,520 | ||||
| West Generator |
1993-1997 | 460,100 | 0.235 | 108,108 | ||||
| Saval |
2004-2006 | 3,500 | 0.495 | 1,730 | ||||
| Saval 4 |
2014-2015; 2017-2019 | 271,420 | 0.147 | 39,856 | ||||
| Starvation |
2013-2016 | 845,490 | 0.198 | 167,819 | ||||
| Subtotal - UG | 1993-2020 | 19,182,970 | 0.237 | 4,537,017 | ||||
| Total - All Mines | 1980-2020 | 48,984,270 | 0.199 | 9,737,726 | ||||
Table 6-2: Production by JCG from 2015 to December 2020
Jerritt Canyon
| Mine | Tons Mined |
Grade (oz/st Au) |
Contained Metal (oz Au) | |||
| Smith |
2,244,973 | 0.152 | 342,207 | |||
| SSX |
2,524,542 | 0.154 | 388,837 | |||
| Starvation |
193,573 | 0.215 | 41,531 | |||
| Saval 4 |
250,149 | 0.148 | 36,946 | |||
| Total | 5,213,237 | 0.155 | 809,521 | |||
| First Majestic Silver Corp. | Jerritt Canyon Gold Mine, SLR Project No: 233.03396.R0000
| ||||
| NI 43-101 Technical Report - April 30, 2021 | 6-3 | |||
Figure 6-1: Location of Historical and Current Mines
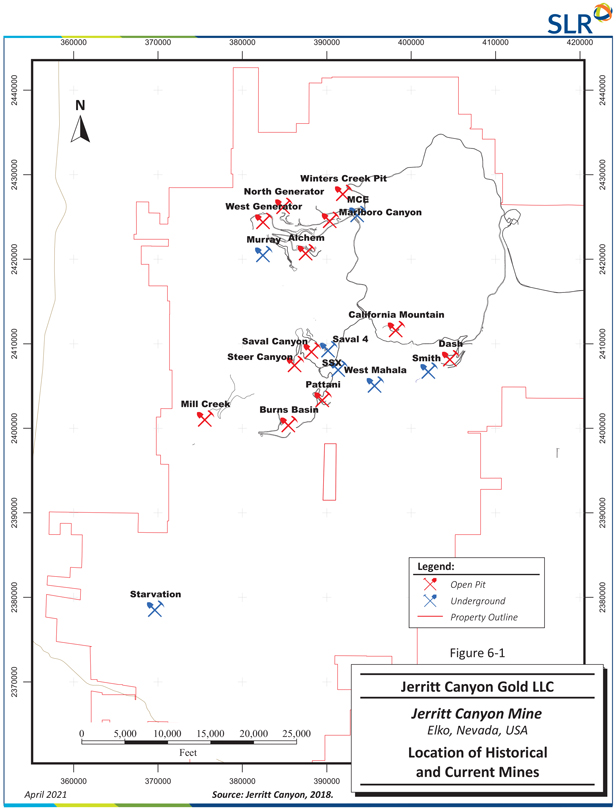
| First Majestic Silver Corp. | Jerritt Canyon Gold Mine, SLR Project No: 233.03396.R0000
| ||||
| NI 43-101 Technical Report - April 30, 2021 | 6-4 | |||
Total mill production for Jerritt Canyon from the start of operations in 1980 to the end of 2020 is approximately 9.1 Moz Au from 57.5 Mst of ore at an average head grade of 0.179 oz/st Au and average recovery of 88.3% (Table 6-3). In addition to mine production, the Jerritt Canyon mill processed ore from the Barrick Cortez mine during the period 2000 to 2002 and stockpiles from Newmont’s Carlin operations during the period from 2006 to 2010. Details of this throughput are not available and detailed reconciliation of mine and mill production during these periods is not possible. The difference between mine production and mill throughput during JCG ownership through to 2017 is also attributable to the processing of stockpiles present at the time of acquisition.
| First Majestic Silver Corp. | Jerritt Canyon Gold Mine, SLR Project No: 233.03396.R0000
| ||||
| NI 43-101 Technical Report - April 30, 2021 | 6-5 | |||
Table 6-3: Jerritt Canyon Process Plant Production
Jerritt Canyon
| Mine Company Owners | Year | Tons Processed (All Sources) |
Daily Tonnage (stpd) |
Mill Head Grade (oz/st Au) |
Calculated
|
Recovery (%) |
Production (oz Au) | |||||||
| 70 Freeport/30FMC |
1980 | 0 | 0 | 0 | 0 | 0 | 0 | |||||||
| 70 Freeport/30FMC |
1981 | 333,768 | 914 | 0.08 | 26,701 | 87 | 23,000 | |||||||
| 70 Freeport/30FMC |
1982 | 1,241,940 | 3,403 | 0.18 | 223,549 | 87 | 196,100 | |||||||
| 70 Freeport/30FMC |
1983 | 1,093,200 | 2,995 | 0.277 | 302,816 | 86.5 | 261,900 | |||||||
| 70 Freeport/30FMC |
1984 | 1,206,600 | 3,297 | 0.22 | 265,452 | 91.2 | 243,100 | |||||||
| 70IMC/30FMC |
1985 | 1,284,500 | 3,519 | 0.22 | 282,590 | 89.2 | 255,400 | |||||||
| 70IMC/30FMC |
1986 | 1,339,200 | 3,669 | 0.227 | 303,998 | 87.4 | 269,600 | |||||||
| 70IMC/30FMC |
1987 | 1,512,400 | 4,140 | 0.215 | 325,166 | 91.8 | 315,900 | |||||||
| 70IMC/30FMC |
1988 | 1,574,500 | 4,300 | 0.212 | 333,794 | 91.5 | 310,100 | |||||||
| 70IMC/30FMC |
1989 | 1,825,800 | 4,983 | 0.178 | 324,992 | 89.8 | 236,700 | |||||||
| 70IMC/30FMC |
1990 | 2,513,500 | 6,982 | 0.148 | 371,998 | 88.0 | 329,800 | |||||||
| 70IMC/30FMC |
1991 | 2,882,200 | 7,897 | 0.147 | 423,683 | 88.7 | 374,400 | |||||||
| 70IMC/30FMC |
1992 | 2,952,120 | 8,088 | 0.132 | 389,680 | 89.3 | 353,300 | |||||||
| 70IMC/30FMC |
1993 | 3,024,390 | 8,286 | 0.126 | 381,073 | 89.6 | 340,200 | |||||||
| 70IMC/30FMC |
1994 | 3,006,870 | 8,238 | 0.122 | 366,838 | 85.6 | 323,400 | |||||||
| 70IMC/30FMC |
1995 | 2,945,915 | 8,071 | 0.129 | 380,023 | 86.1 | 327,900 | |||||||
|
70IMC/30Meridian Gold |
1996 | 2,667,593 | 7,308 | 0.13 | 346,787 | 88 | 310,000 | |||||||
| First Majestic Silver Corp. | Jerritt Canyon Gold Mine, SLR Project No: 233.03396.R0000
| ||||
| NI 43-101 Technical Report - April 30, 2021 | 6-6 | |||
| Mine Company Owners | Year | Tons Processed (All Sources) |
Daily Tonnage (stpd) |
Mill Head Grade (oz/st Au) |
Calculated
|
Recovery (%) |
Production (oz Au) | |||||||
| 70IMC/30Meridian Gold |
1997 | 1,539,561 | 4,218 | 0.22 | 338,703 | 91 | 320,000 | |||||||
| 70 AngloGold/30Meridian Gold |
1998 | 1,484,445 | 4,067 | 0.25 | 371,111 | 91 | 350,000 | |||||||
| 70 AngloGold/30Meridian Gold |
1999 | 1,609,374 | 4,409 | 0.25 | 402,344 | 91 | 363,333 | |||||||
| 70 AngloGold/30Meridian Gold |
2000 | 1,499,143 | 4,107 | 0.24 | 359,794 | 90 | 316,667 | |||||||
| 70 AngloGold/30Meridian Gold |
2001 | 1,469,000 | 4,014 | 0.31 | 455,390 | 89.2 | 403,000 | |||||||
| 70 AngloGold/30Meridian Gold |
2002 | 1,467,000 | 4,076 | 0.26 | 381,420 | 87.9 | 339,000 | |||||||
| Queenstake Resources |
2003 | 1,496,441 | 4,100 | 0.23 | 336,699 | 88.3 | 302,096 | |||||||
| Queenstake Resources |
2004 | 1,305,833 | 3,578 | 0.21 | 274,225 | 86.7 | 243,333 | |||||||
| Queenstake Resources |
2005 | 1,106,937 | 3,033 | 0.22 | 243,526 | 86.6 | 204,091 | |||||||
| Queenstake Resources |
2006 | 973,593 | 2,667 | 0.21 | 204,455 | 86.2 | 169,851 | |||||||
| Yukon-Nevada Gold Corp. |
2007 | 968,130 | 2,652 | 0.206 | 199,435 | 88.2 | 175,646 | |||||||
| Yukon-Nevada Gold Corp. |
2008 | 338,350 | 2,128 | 0.16 | 54,136 | 87.3 | 44,732 | |||||||
| Yukon-Nevada Gold Corp. |
2009 | 0 | - | - | - | 86.3 | 9,770 | |||||||
| Yukon-Nevada Gold Corp. |
2010 | 599,555 | 1,862 | 0.123 | 73,745 | 88.2 | 65,104 | |||||||
| Yukon-Nevada Gold Corp. |
2011 | 628,418 | 1,853 | 0.142 | 89,235 | 85.8 | 67,748 | |||||||
| YNG/Veris Gold Corp. |
2012 | 978,262 | 3,929 | 0.130 | 127,174 | 82.7 | 105,626 | |||||||
| Veris Gold Corp. |
2013 | 1,084,131 | 3,288 | 0.154 | 166,956 | 85.5 | 139,556 | |||||||
| Veris Gold Corp. |
2014 | 1,106,524 | 3,040 | 0.166 | 183,683 | 87.8 | 160,451 | |||||||
| Veris Gold Corp. |
2015 | 573,810 | 3,284 | 0.172 | 98,742 | 84.7 | 83,497 | |||||||
| First Majestic Silver Corp. | Jerritt Canyon Gold Mine, SLR Project No: 233.03396.R0000
| ||||
| NI 43-101 Technical Report - April 30, 2021 | 6-7 | |||
| Mine Company Owners | Year | Tons Processed (All Sources) |
Daily Tonnage (stpd) |
Mill Head Grade (oz/st Au) |
Calculated
|
Recovery (%) |
Production (oz Au) | |||||||
| Jerritt Canyon Gold, LLC |
2015 | 584,775 | 3,074 | 0.174 | 101,307 | 86.3 | 89,094 | |||||||
| Jerritt Canyon Gold, LLC |
2016 | 1,191,674 | 3,765 | 0.144 | 171,333 | 85.4 | 140,989 | |||||||
| Jerritt Canyon Gold, LLC |
2017 | 1,143,530 | 3,585 | 0.135 | 154,187 | 83.9 | 129,335 | |||||||
| Jerritt Canyon Gold, LLC |
2018 | 1,213,609 | 3,325 | 0.137 | 165,670 | 85.7 | 141,963 | |||||||
| Jerritt Canyon Gold, LLC |
2019 | 883,582 | 2,420 | 0.154 | 135,736 | 85.5 | 116,060 | |||||||
| Jerritt Canyon Gold, LLC |
2020 | 826,234 | 2,265 | 0.160 | 131,830 | 85.5 | 112,749 | |||||||
| Total | 1980 - 2020 | 57,476,407 | 4,121 | 0.179 | 10,269,976 | 88.3 | 9,064,491 | |||||||
| First Majestic Silver Corp. | Jerritt Canyon Gold Mine, SLR Project No: 233.03396.R0000
| ||||
| NI 43-101 Technical Report - April 30, 2021 | 6-8 | |||
| 6.3 | Exploration |
Early, major discoveries in the Jerritt Canyon district were made by following predominantly northeast and northwest trending structures, within and bounding the Lower Plate windows found in the area. Exploration activities completed at Jerritt Canyon have included prospecting, geological mapping, various types of geophysical surveys, and geochemistry.
| 6.3.1 | Geology |
As expected for a property with more than 35 years of production, geological maps, sections, and sketches pertaining to the property are abundant and are located in an on-site data archive. In 1984, Freeport established a map system where individual map sheets, referred to as plates, at a scale 1”:500’ and extending 14,000 ft in the east-west direction and 10,000 ft in the north-south direction were formalized and covered the entire Jerritt Canyon property. Since 1984, all geological mapping has been recorded using the plate maps reference system. In 1984, the “Jerritt Gold Study” was undertaken as a collaboration between Freeport and the United States Geological Survey (USGS). Digital compilation of historical geological mapping completed by the Nevada Bureau of Mines and Geology (NBM) was followed by new geological mapping completed by NBM from 2005 to 2007. This resulted in the publication of a comprehensive geological map for Jerritt Canyon (NBM Open File 07-3) (Figure 6-2).
| First Majestic Silver Corp. | Jerritt Canyon Gold Mine, SLR Project No: 233.03396.R0000
| ||||
| NI 43-101 Technical Report - April 30, 2021 | 6-9 | |||
Figure 6-2: Geology of the Jerritt Canyon Property
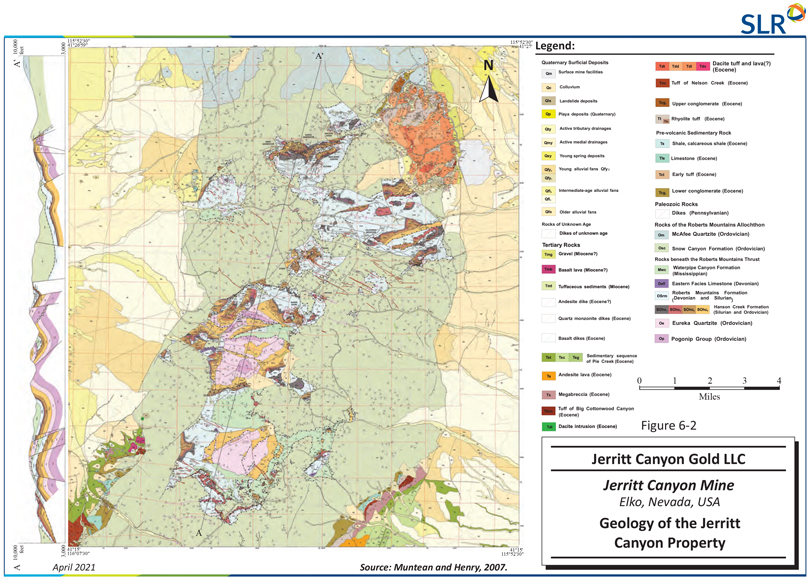
| First Majestic Silver Corp. | Jerritt Canyon Gold Mine, SLR Project No: 233.03396.R0000
| ||||
| NI 43-101 Technical Report - April 30, 2021 | 6-10 | |||
| 6.3.2 | Geophysics |
Considerable geophysical work has been completed throughout the Jerritt Canyon property since the early 1970s by numerous contract geophysical companies. This includes numerous ground surveys utilizing magnetic, electric, and electromagnetic (EM) methods, gravity surveys, and airborne magnetic, radiometric, and EM surveys. During 2015, JCG contracted consulting geophysicist R.B. Ellis to compile and interpret historical geophysical survey data. The description of the historical surveys and some comments on results below have been taken from the report by Ellis (2016). Interpretation and recommendations made by Ellis are described and discussed in Section 9 of this Technical Report.
6.3.2.1 Early Ground Geophysical Surveys (1972 to 1992)
Early ground geophysical surveys were focused on local surveys to understand the physical properties of various lithologies or testing methods to trace intrusive dikes and structures. The focus on characterizing the lithologies was to try to separate Upper and Lower plate rocks. Complex resistivity measurements were made in-situ on nine lines at Mahala, East Mahala, and in the Waterpipe II area by Zonge Engineering. Complex resistivity is an induced polarization (IP) method where data is collected at multiple frequencies to determine whether different polarization species can be differentiated.
IP and resistivity survey results acquired by Zonge Engineering at Saval, Prego, and Pattani Creek confirmed an IP signature associated with mineralization. Similarly, a summary of various geophysical surveys (seismic, Crone electromagnetics (CEM) and very low frequency (VLF or RADEM)) at Jerritt Canyon by Smith (1972 and 1987) alludes to the value of IP and complex resistivity to separate various Jerritt Canyon lithologies. These results support the potential value of conventional IP surveys on the property consistent with the Starvation Canyon result in 2011 (TITAN survey).
Ground magnetics and VLF test lines acquired in the Saval/Prego and Burns Basin areas have been described by Smith (1990).
6.3.2.2 Gradient Array and Self Potential
Gradient array and self-potential (SP) data were collected by Dick Fox between 1994 and 1998. An index map of this survey is presented in Figure 6-3. The data was critically reviewed by the Jerritt Canyon exploration team in 1994 before and after the terrain corrections and no consistent correlation with mineralization was found. Use of the dataset for targeting was discouraging and considered unlikely to be an important exploration tool.
| First Majestic Silver Corp. | Jerritt Canyon Gold Mine, SLR Project No: 233.03396.R0000
| ||||
| NI 43-101 Technical Report - April 30, 2021 | 6-11 | |||
Figure 6-3: Index Map of Gradient Array and SP Survey Areas
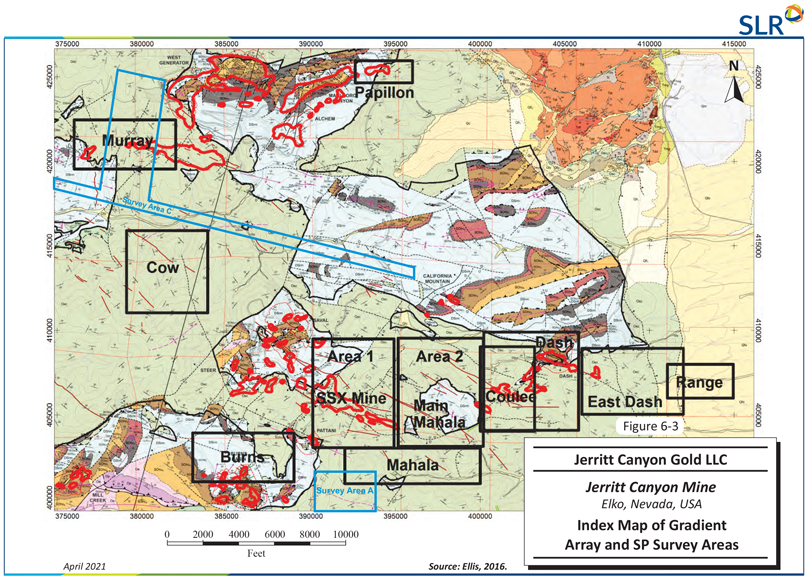
| First Majestic Silver Corp. | Jerritt Canyon Gold Mine, SLR Project No: 233.03396.R0000
| ||||
| NI 43-101 Technical Report - April 30, 2021 | 6-12 | |||
6.3.2.3 ESCAN
ESCAN data was acquired in a grid south of the SSX deposit and southeast of Burns Basin in 1996 by Premier Geophysics Inc. (Figure 6-4). ESCAN is a trade name for a DC resistivity survey utilizing the pole-pole array and a mesh of receiver electrodes (300 ft and 600 ft) where current is transmitted inside and outside the grid to produce a 3D set of data, which is then inverted. The objective of the survey was to “determine the presence of geo-electric signatures related directly or indirectly to ore mineralization”. SLR notes that IP data was apparently collected, however, never processed (Shore, 1999).
6.3.2.4 Audio-frequency Magnetotellurics
Audio-frequency magnetotellurics (AMT) is a DC resistivity-sounding method that measures variations in the
Earth’s natural EM fields to detect electrical resistivity variations at shallow to intermediate depths. The surveys were completed by Zonge Engineering in 1999 and 2007 to estimate the depth to the presumed higher resistivity Hanson Creek
Formation. The locations of survey lines are presented in Figure 6-4 and images of the model section have been recreated. The 1999 survey was Zonge Engineering’s first attempt at collecting AMT data with their
GDP-32 receiver. While it was common to collect controlled source audio-frequency magnetotelluric (CSAMT) data in the high-frequency band to improve the signal to noise ratio of these soundings, this was not
acquired for the 2007 lines. A comparison of 2D inversion lines to drill-controlled surfaces of the Saval discontinuity indicates no consistent change from the low-resistivity Roberts Mountain to the
high-resistivity Hanson Creek Formation.
| First Majestic Silver Corp. | Jerritt Canyon Gold Mine, SLR Project No: 233.03396.R0000
| ||||
| NI 43-101 Technical Report - April 30, 2021 | 6-13 | |||
Figure 6-4: Survey Lines and Grids
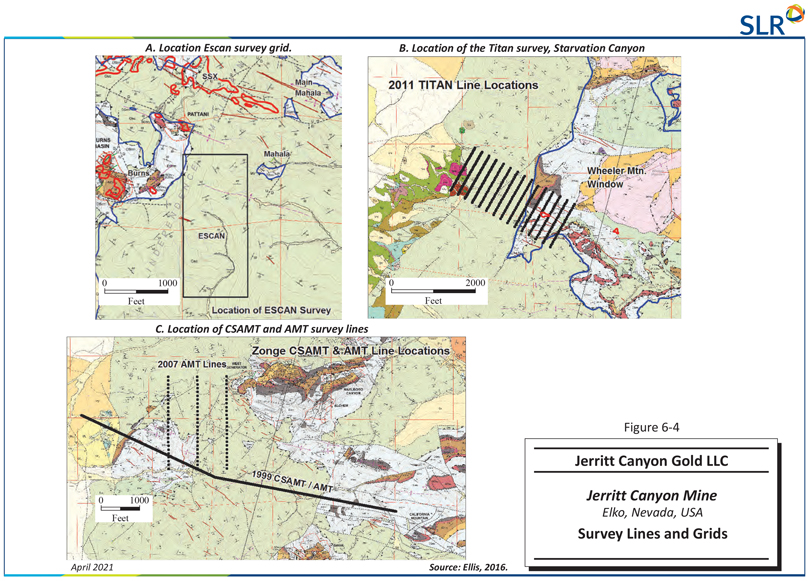
| First Majestic Silver Corp. | Jerritt Canyon Gold Mine, SLR Project No: 233.03396.R0000
| ||||
| NI 43-101 Technical Report - April 30, 2021 | 6-14 | |||
6.3.2.5 Gravity Surveys
Gravity data has been collected at Jerritt Canyon since 1999, with the latest survey completed in 2007. Data has been either collected or purchased for 16 separate survey areas. The objective of the gravity data was to identify the dense carbonate lithologies and identify low density decalcification commonly associated with mineralization. SLR notes that processing and reporting for each survey has been cumulative; as such, the 2007 report by Ellis (Ellis, 2007) is the most comprehensive record of the datasets. Ellis (2007) contains both details of the data reduction and images as well as some comments on the interpretation of the data. All images and products were re-created in the Jerritt Canyon grid. The 3D inversion modelling of the complete Bouguer gravity anomaly for the Jerritt Canyon area is presented in Figure 6-5 along with the station locations. High-precision survey control for the gravity base station elevations was established at 21 points on the Jerritt Canyon property as described by K. E. Schaaf (2000).
The tilt derivative (Figure 6-5) shown adjacent to the complete Bouguer gravity anomaly is a filter operator that enhances the higher frequency signatures in the data and efficiently identifies the horizontal location of the source. A northerly trend of density lows shows correlation with deposit areas and has been attributed to areas of decalcification extending to depth.
| First Majestic Silver Corp. | Jerritt Canyon Gold Mine, SLR Project No: 233.03396.R0000
| ||||
| NI 43-101 Technical Report - April 30, 2021 | 6-15 | |||
Figure 6-5: Bouguer Gravity Survey
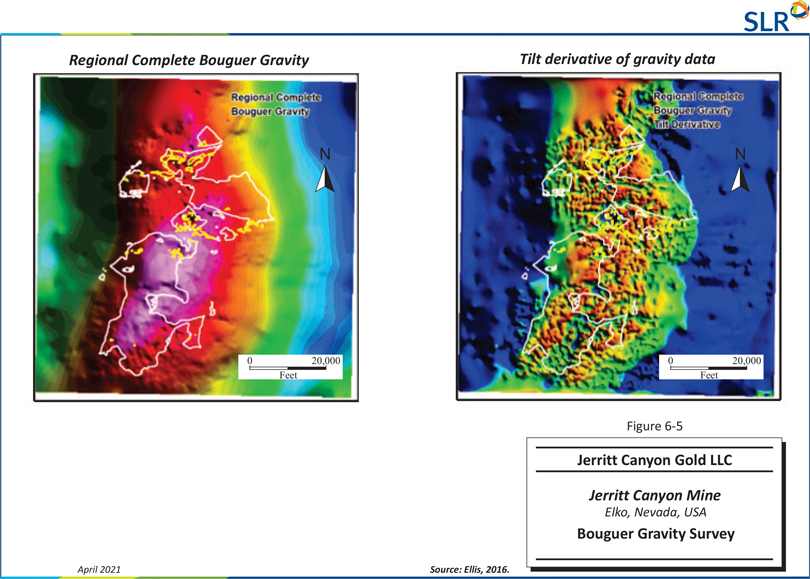
| First Majestic Silver Corp. | Jerritt Canyon Gold Mine, SLR Project No: 233.03396.R0000
| ||||
| NI 43-101 Technical Report - April 30, 2021 | 6-16 | |||
6.3.2.6 Airborne Surveys
Seven airborne surveys have been flown over the Jerritt Canyon property.
Applied Geophysics Inc. flew the earliest magnetic survey in 1976 for Freeport. The 1976 survey was flown on 0.25-mile spaced lines in a north-south direction using a helicopter platform at an average terrain clearance of 500 ft.
A subsequent 1988 Aerodat Ltd. (Aerodat) survey consisted of four regional test lines. The location of three extensive surveys is shown in Figure 6-6. No digital data for the 1988 survey is available and the coverage of this survey has been superseded by other aeromagnetic surveys.
In 1993, Newmont Exploration Inc. flew a 400-m (0.25-mile) spaced magnetic survey along east-west lines. This was a helicopter survey with terrain clearance in the range of 50 m to 400 m above topography.
In August 1995 and October 1996, DIGHEM Surveys Ltd. flew a helicopter-platform magnetic, radiometric, and electromagnetic survey for the Jerritt Canyon Joint Venture. The survey consisted of three survey areas (Figure 6-6). Line spacing was 200 m except for a small area on the east side that had a line-spacing of 100 m, and a sensor height of 50 m. The focus of the 1995/1996 aeromagnetic surveys was to map structure and identify intrusive rocks that appear spatially coincident with mineralization at Jerritt Canyon.
During the fall of 2000, AngloGold initiated a hyperspectral survey over the Independence Range, including coverage of the Jerritt Canyon Joint Venture tenement. No digital data for the 2000 survey is available, however, coverage of this survey has been superseded by the 2019 survey.
In 2019, Wright Geophysics of Elko, Nevada, in conjunction with MWH Geo-Surveys of Reno, Nevada conducted a low level (17 m above ground level) program over a select area of the Jerritt Canyon property (Upper Stump Basin) using a drone with a suspended magnetometer. The primary objective of the 2019 survey was to detect and delineate dikes and intrusive rocks in the mine site environment that would ultimately lead to drill targets. Based on the results of the test program, a high resolution, airborne magnetic survey was completed over two areas from September 24 to December 1, 2019. A total of 1,727 line kilometres of magnetic data were acquired using a GEM Systems GSMP-35U Potassium optically pumped magnetometer. Measurements of the total magnetic intensity were taken in the continuous mode at 0.05-second intervals along lines spaced 10 m apart and oriented north-south. This sample rate yielded a station interval of approximately 0.25 m along the flight lines. A base magnetometer was operated during all periods of data acquisition. A DJI Matrice 600 Pro drone with WAAS-enabled GPS navigation transported the magnetometer.
Figure 6-6 shows the locations of the airborne surveys prior to 2019.
| First Majestic Silver Corp. | Jerritt Canyon Gold Mine, SLR Project No: 233.03396.R0000
| ||||
| NI 43-101 Technical Report - April 30, 2021 | 6-17 | |||
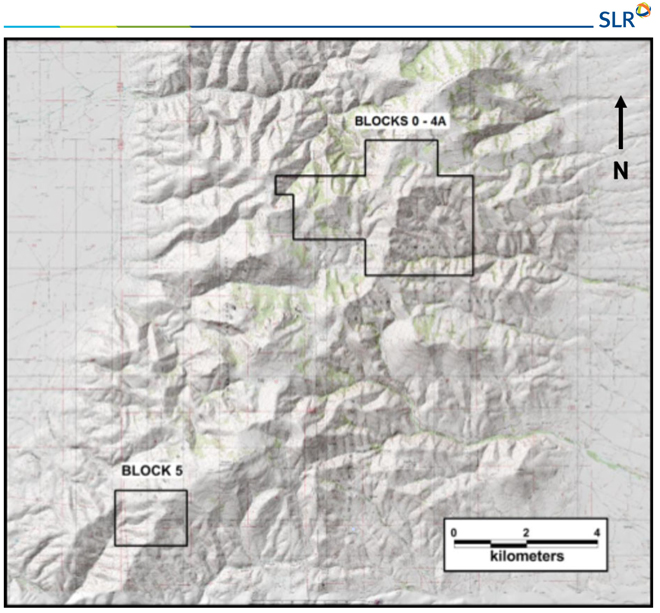
Figure 6-6: Location of Airborne Surveys
In August 2019, SpecTIR completed an airborne shortwave infrared (SWIR) and visible-near infrared (VNIR) hyperspectral survey for 675 km2 over the Jerritt Canyon District. An AisaFENIX sensor was flown at a mean altitude of 1.4 km above ground level with one-metre ground resolution. Specific mineral species under investigation include a suite of clay minerals including kaolinite and montmorillonite, variations in aluminum content of illite, ammonium-bearing minerals including ammonium illite, and variations in silica minerals.
6.3.3 Geochemistry
Geochemical surveys completed at Jerritt Canyon include soil and stream sediment sampling and outcrop, trench, and road cut bedrock sampling. In addition, exploration/research-oriented geochemical studies have been completed on the Saval discontinuity and mafic dikes.
The soil geochemical database for Jerritt Canyon consists of 65,840 samples collected over a span of over 30 years. Most samples (56,761) were collected by Independence Mining Company (Independence
| First Majestic Silver Corp. | Jerritt Canyon Gold Mine, SLR Project No: 233.03396.R0000
| ||||
| NI 43-101 Technical Report - April 30, 2021 | 6-18 | |||
Mining) staff and contractors (and predecessors). Prior to 1997, Independence Mining acquired data for 1,399 samples from another company. Queenstake compiled the soil data in 1999 and subsequently collected 7,283 samples from the northern and southern limits of the Jerritt Canyon land position and acquired data for an additional 407 samples to the north from Vista Gold. A total of 18,691 rock samples have been taken from surface exposures on the Jerritt Canyon property, including outcrop, road cuts, and trenches. Chip sampling of road cuts and exposures was completed over selected target areas. A total of 145 chip sampling traverses have been completed (Table 6-4). The Saval Discontinuity geochemical data set consists of gold assays for 10,170 intercepts of which, 6,441 Saval Discontinuity intercepts also have multi-element analyses by inductively coupled plasma (ICP) methods.
Table 6-4: Summary of Chip Sampling on Jerritt Canyon Property
Jerritt Canyon
| Project (prefix) | Chip Traverses | |
| Bidart (ZBI) |
4 | |
| Burns Basin (ZBB) |
10 | |
| California Mountain (ZCM) |
5 | |
| East Mahala (ZEM) |
17 | |
| Lost Mine (ZLM) |
23 | |
| Mahala (ZMAH) |
21 | |
| Pie Creek (ZPC) |
2 | |
| Sheep (ZSH) |
21 | |
| SSX/Spaghetti (ZSP) |
1 | |
| Stump (ZSM) |
14 | |
| Upper Stump Basin (ZUSB) |
1 | |
| Winters Creek (ZWC) |
8 | |
| Wright Window (ZWW) |
12 | |
| 6.3.4 | Drilling |
Numerous drilling campaigns have been executed at Jerritt Canyon since its discovery in the 1970s. Historical surface drilling and underground drilling are described below.
6.3.4.1 Surface Drilling
Early surface exploration drilling programs typically consisted of vertical reverse circulation (RC) drilling over target areas at approximately 200-ft centres. The spacing was then reduced to approximately 140 ft and further to 100 ft or less to delineate open pit resources. Surface core drilling typically made up approximately five to ten percent of the total drilling.
The Jerritt Canyon surface drilling database contains 15,058 holes for a total of 8,591,902 ft drilled between the start of exploration until December 2011. There was no surface drilling completed between 2011 and the acquisition of the property by JCG in 2015. Surface drilling completed by JCG is described in Section 10 of this Technical Report.
| First Majestic Silver Corp. | Jerritt Canyon Gold Mine, SLR Project No: 233.03396.R0000
| ||||
| NI 43-101 Technical Report - April 30, 2021 | 6-19 | |||
In the 1970s and 1980s, only open pit targets were pursued. Most of the surface drill holes were drilled to a maximum depth of 600 ft below the surface and stopped regardless of the encountered geological rock unit or alteration because this depth was assumed to be the lower limit of economically viable open pit mining.
6.3.4.2 Underground Drilling
In the underground mines up to December 31, 2011, definition drilling included core drilling on 50-ft centres from underground stations, using NQ-sized (1.875-in. diameter) core. In mid-2011, drilling with HQ core (2.5-in. diameter) was used locally. Underground RC drilling (Cubex) was used for resource confirmation and was generally completed on 20-ft to 40-ft centres. Underground RC drill holes were generally less than 150 ft in length but occasionally up to 300 ft. Up to August 2008, underground production sample drilling consisted of Cubex and rotary percussion drilling. In 2010 and 2011, a 5200 DRC Cubex (RC) drill, owned and operated by SMD, was used primarily for underground production sample drilling at the Smith mine. These production drill holes were generally short, less than 60 ft, and were drilled on close centres of 10 ft to 20 ft. Most drill holes, other than the production holes, have been measured for downhole deviation. A used Cubex drill rig was purchased in 2011 by Queenstake to conduct underground production drilling at SSX.
The Jerritt Canyon database contains a total of 42,253 historical underground holes from the period pre-dating June 23, 2015, the effective date of the acquisition of the property by JCG (Table 6-5).
Table 6-5: Historical Underground Drilling by Deposit
Jerritt Canyon
| Deposit | No. Holes | Footage | ||
| Murray |
7,677 | 394,198 | ||
| Saval |
113 | 18,695 | ||
| Smith |
11,281 | 1,231,216 | ||
| Starvation |
562 | 91,347 | ||
| SSX |
22,620 | 2,139,889 | ||
| Total | 42,253 | 3,875,345 | ||
| First Majestic Silver Corp. | Jerritt Canyon Gold Mine, SLR Project No: 233.03396.R0000
| ||||
| NI 43-101 Technical Report - April 30, 2021 | 6-20 | |||
| 7.0 | GEOLOGICAL SETTING AND MINERALIZATION |
| 7.1 | Regional and Local Geology |
The Jerritt Canyon Gold District is located in the Great Basin, north-northeast of the Carlin Trend of gold deposits (Figure 7-1). The Great Basin records a protracted geological history from Proterozoic through to recent. Continental rifting of the Archean-Proterozoic craton resulted in the deposition of rift facies Neoproterozoic and Cambrian clastic sedimentary rocks and the establishment of a passive continental margin on the western edge of North America. A miogeoclinal sequence developed on the passive margin with deposition of Ordovician to Devonian shallow carbonates and shales in the shelf-slope environment (e.g., Hanson Creek, Roberts Mountain, Popovich, and Rodeo Creek Formations) and Cambrian to Ordovician deep siliciclastic sedimentary rocks on the slope floor environment to the west (e.g., Vinini and Snow Canyon Formations). During the Late Devonian to Early Mississippian Antler Orogeny, the deep water siliciclastic sedimentary and minor basaltic rocks were thrust over the shallow shelf slope shallow carbonates and shales.
The regional thrust fault is referred to as the Roberts Mountain Thrust. A foredeep basin formed to the east in front of the thrust belt resulting in deposition of Early Mississippian syn-orogenic and Pennsylvanian post-orogenic sedimentary rocks including conglomerate, siltstone, and limestone (Antler Overlap Sequence). Northeast Nevada was further subject to compressional tectonism in the Pennsylvanian through to the Permian Humboldt and the Early Triassic Sonoma Orogenies. East-dipping subduction was established along the western margin of North America by the Middle Triassic. The main magmatic arc attributed to this subduction is the Sierra Nevada batholith located to the west of northeast Nevada. Related magmatism in northern Nevada includes Middle Jurassic back arc volcanic-plutonic complexes. Early Cretaceous S-type granites to Late Cretaceous I-type granites emplaced in northern Nevada are related to progressive crustal thickening during the Cretaceous Sevier and Laramide Orogenies. Numerous regional extensional basins started to develop in northeastern Nevada and western Utah in the Middle Eocene and a distinctive high potassium calc-alkaline magmatism was emplaced at approximately 42 Ma. Eocene extension is interpreted to have been largely accommodated by the reactivation of earlier structures. Middle Eocene magmatic rocks include the deposition of volcaniclastic rocks, ash-flow tuffs, and flows in newly formed basins, subsequent basin fill volcanic rocks, small flow-dome complexes, and high-level intrusions and dikes. Regionally, Eocene dikes range in composition from porphyritic dacite, basalt-andesite, and rhyolite.
Carlin-type gold mineralization is preferentially hosted by Ordovician to Devonian shallow shelf-slope carbonate shale sequences. These rocks are commonly referred to as “Lower Plate” rocks owing to their position in the footwall of the regional Roberts Mountain Thrust. The deep water siliciclastic dominant rocks forming the hanging wall of the Roberts Mountain Thrust are commonly referred to as “Upper Plate” rocks. This sequence of less reactive and less permeable upper plate rocks, acting as an aquitard over variable to highly permeable lower plate rocks, is regarded as a primary control on the deposition of Carlin-type gold mineralization. The Carlin-type gold deposits in northeastern Nevada formed in the Middle to Late Eocene during the period 42 Ma to 36 Ma. Deposition is regarded as part of a magmatic-hydrothermal event related to regional extension utilizing reactivated, variably oriented pre-Eocene structures.
Figure 7-2 shows the general stratigraphic section of the Jerritt Canyon Gold District and Figure 7-3 shows the local geology.
| First Majestic Silver Corp. | Jerritt Canyon Gold Mine, SLR Project No: 233.03396.R0000
| ||||
| NI 43-101 Technical Report - April 30, 2021 | 7-1 | |||
Figure 7-1: Location of the Jerritt Canyon Property and Nevada Gold Belts
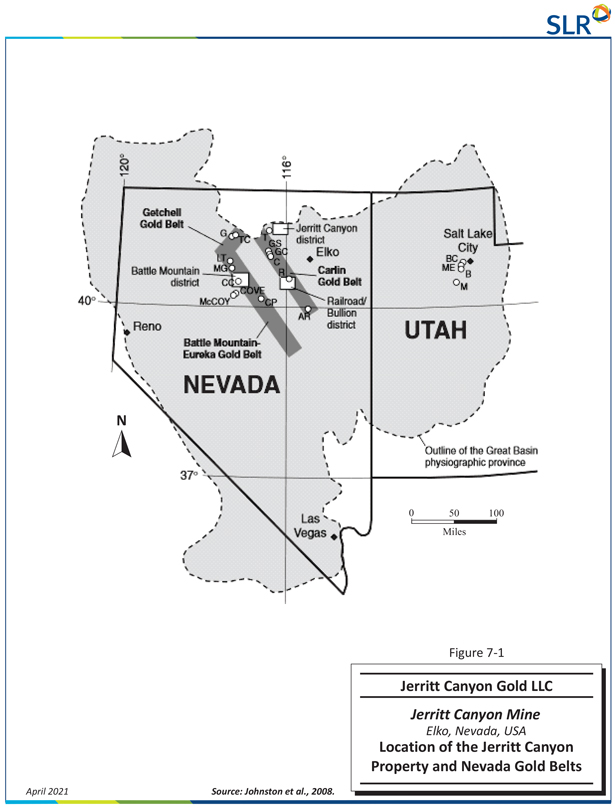
| First Majestic Silver Corp. | Jerritt Canyon Gold Mine, SLR Project No: 233.03396.R0000
| ||||
| NI 43-101 Technical Report - April 30, 2021 | 7-2 | |||
Figure 7-2: Tectonostratigraphic Column of the Jerritt Canyon Property
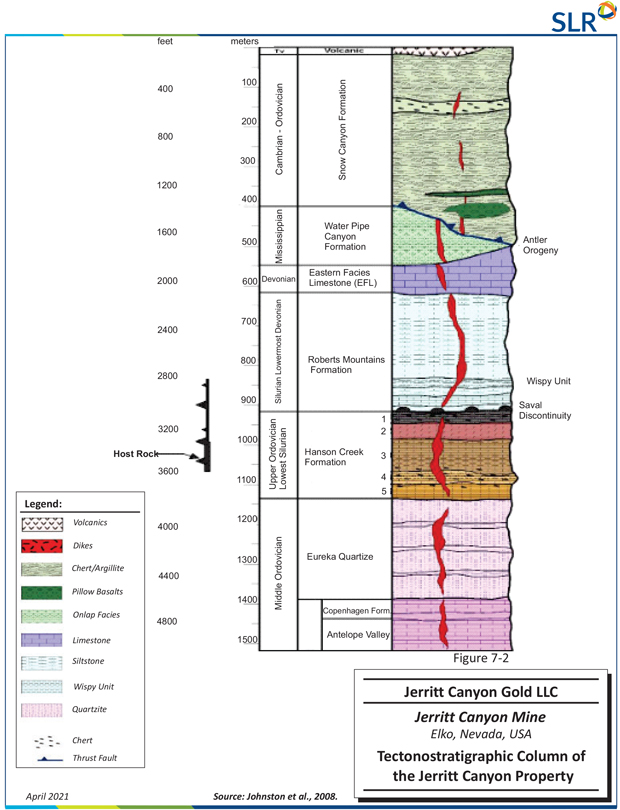
| First Majestic Silver Corp. | Jerritt Canyon Gold Mine, SLR Project No: 233.03396.R0000
| ||||
| NI 43-101 Technical Report - April 30, 2021 | 7-3 | |||
Figure 7-3: Geology of Jerritt Canyon Property
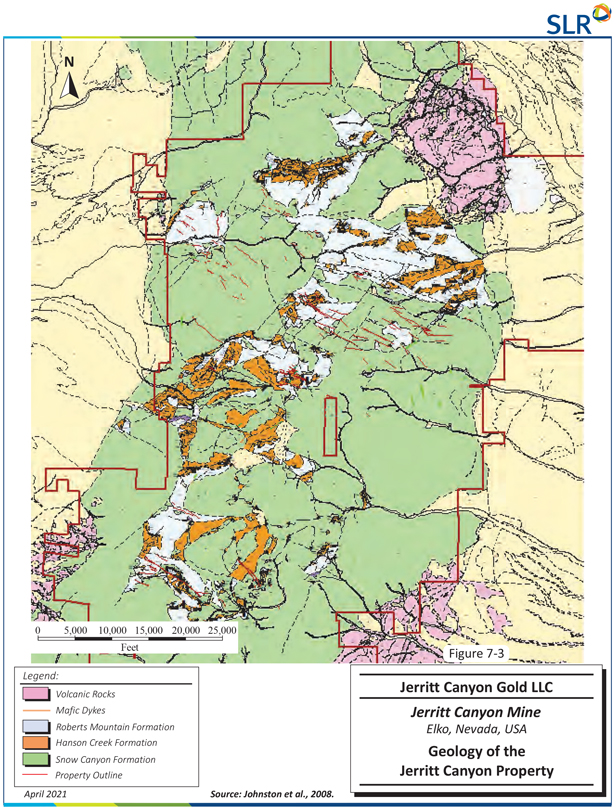
| First Majestic Silver Corp. | Jerritt Canyon Gold Mine, SLR Project No: 233.03396.R0000
| ||||
| NI 43-101 Technical Report - April 30, 2021 | 7-4 | |||
| 7.2 | Mineralization |
The occurrence and distribution of gold mineralization at Jerritt Canyon is controlled both by lithology and structure. Gold mineralization at Jerritt Canyon is hosted by Hanson Creek Formation units I to III (Table 14-3) and the lower part of the Roberts Mountains Formation. The Saval discontinuity, being the contact between the Hanson Creek and the Roberts Mountain Formations, is interpreted as a primary control on gold mineralization at Jerritt Canyon. Gold mineralization is hosted by, or spatially associated, with high angle west-northwest- and north-northeast-trending structures. Much of the more continuous gold mineralization occurs within the favourable stratigraphic intervals along the limbs or hinge zones of large anticlinal folds, and at the intersection of the two sets of high angle structures. The mineralized zones form along well defined structural and mineralization trends as stratigraphically controlled tabular pods that are locally stacked upon one another resulting from the presence of more than one favourable stratigraphic unit and/or local thrust and/or high angled fault intersection controls. The deposits are Carlin type, sediment-hosted gold mineralization within carbonaceous sediments. Gold occurs as very fine-grained micron-sized particles as grain boundaries or inclusions in pyrite, and as free grains in carbonaceous-rich and fine-grained, calcareous, clastic sedimentary rocks.
Alteration in the Jerritt Canyon district includes silicification, dolomitization, remobilization, and reconstitution of organic carbon, decalcification, argillization, and pyritization (typically containing elevated arsenic). The rocks also exhibit hypogene and supergene oxidation and bleaching. The most important alteration types relative to gold deposition are silicification, remobilization, and reconstitution of organic carbon, pyritization, and decalcification.
The locations of past and currently producing open pit and underground mines on the Jerritt Canyon property are illustrated in Figure 7-4.
| First Majestic Silver Corp. | Jerritt Canyon Gold Mine, SLR Project No: 233.03396.R0000
| ||||
| NI 43-101 Technical Report - April 30, 2021 | 7-5 | |||
Figure 7-4: Location of Mines
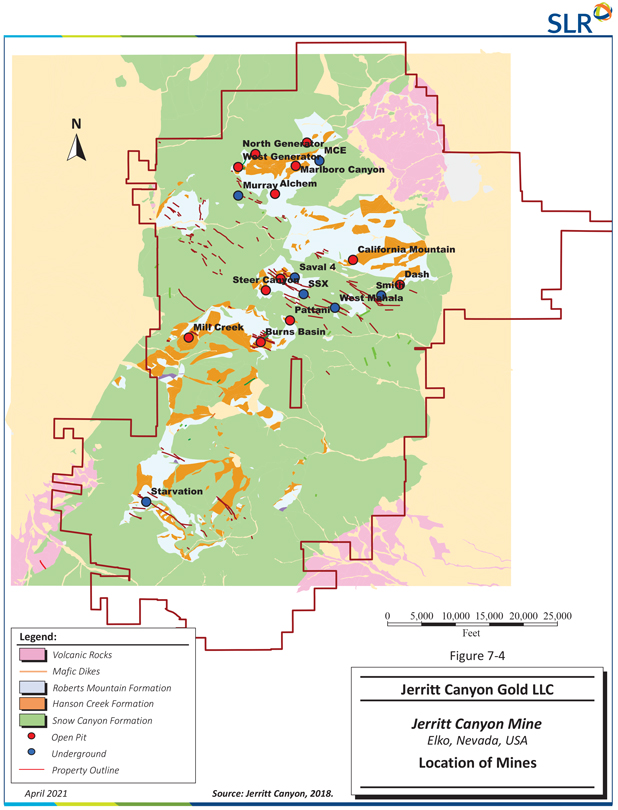
| First Majestic Silver Corp. | Jerritt Canyon Gold Mine, SLR Project No: 233.03396.R0000
| ||||
| NI 43-101 Technical Report - April 30, 2021 | 7-6 | |||
| 7.2.1 | SSX |
The drift connecting the SSX and Steer mines was completed in the latter half of 2005 and the mines have been operated as a single unit referred to in this Technical Report as the SSX mine.
The SSX deposit was discovered in the early 1990s following the northeast structural trends between the Burns Basin and California Mountain deposits and the west-northwest trends from the Steer/Saval deposits. Mining at SSX began in 1997.
While the resource wireframes indicate a distinct northwest trend in the eastern portion of the SSX area, a generally more east-west trend is exhibited in the Steer Domain (Figure 7-5). Additionally, the mineralized zones are more continuous in the SSX area ranging from 200 ft to 2,000 ft in length along the northwest strike and 50 ft to 200 ft in width, with thickness ranging from 10 ft to 100 ft. Mineralization at Steer is less continuous ranging from 50 ft to 500 ft in strike length and 50 ft to 300 ft in width, with thickness ranging from 20 ft up to 100 ft. The depth to mineralization ranges from near surface at the west end of Steer to a depth of approximately 800 ft below the surface for most of the SSX deposit. Most of the mineralization occurs between 600 ft and 1,000 ft below the surface.
SSX mineralization occurs predominantly in the micritic unit III of the Hanson Creek Formation. A smaller portion of the mineralization occurs in calcareous siltstone at the base of the Roberts Mountains Formation or in the upper two cherty and dolomitic members of the Hanson Creek Formation. Mineralized zones are localized in and near west-northwest-trending steeply dipping dikes (e.g., South Boundary Dike); however, dike material is a minor component of the mineralized material at SSX. Mineralization is also localized along cross-cutting northeast-trending faults. Folding of the mineralized horizons is apparent along axes parallel to the west-northwest dike trend and, more prominently, parallel to the northeast fault set. Gold occurs in decarbonatized rock, commonly in association with variable amounts of orpiment and realgar. Silicification with stibnite can also be associated with gold in portions of the upper cherty member of the Hanson Creek Formation.
Gold mineralization in the Steer portion of the SSX complex has been identified in an area stretching approximately 3,000 ft east from the old Steer pit to halfway along the connection drift to SSX Zone 5. Most gold mineralization at Steer is associated with gently dipping structures cutting through Hanson Creek unit III. These structures strike northeast and dip southeast, offsetting strata. Zones of mineralization typically follow the structures and tend to be broad and relatively thin. The mineralized zones are usually at the contact between Hanson Creek Formation units III and IV and occasionally follow the structures up through unit III. Both within the Steer portion and the western side of SSX, several low angle features have been observed. These features are at least partly responsible for the gold mineralization at the contact of Hanson Creek Formation units III and IV.
In the eastern portion of the Steer area, high grade mineralization is associated with the Husky Fault, a major northeast trending normal fault with approximately 300 ft of normal dip-slip displacement to the southeast. Major northwest trending dikes appear to have locally compartmentalized high grade mineralization. The intersection of these dikes with Hanson Creek Formation unit III and the Husky Fault and its related structures offers excellent exploration potential. One of these dikes is interpreted to be the western extension of the South Boundary dike, which is an important ore-controlling structure at SSX to the east.
At Steer and SSX, the structural intersections are the primary targets for resource expansion, as well as the westward extension of the South Boundary dike.
The resource wireframes for the SSX mine are illustrated in Figure 7-5.
| First Majestic Silver Corp. | Jerritt Canyon Gold Mine, SLR Project No: 233.03396.R0000
| ||||
| NI 43-101 Technical Report - April 30, 2021 | 7-7 | |||
Figure 7-5: SSX and West Mahala Resource Wireframes and Development
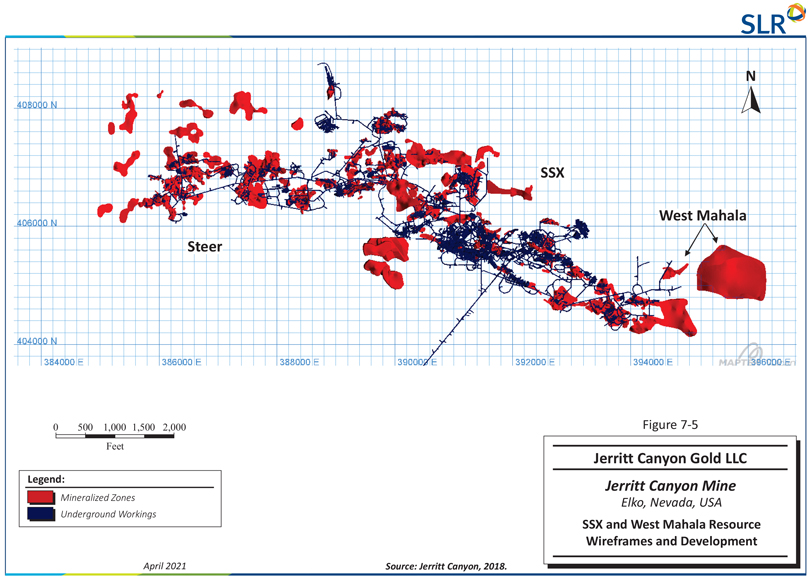
| First Majestic Silver Corp. | Jerritt Canyon Gold Mine, SLR Project No: 233.03396.R0000
| ||||
| NI 43-101 Technical Report - April 30, 2021 | 7-8 | |||
| 7.2.2 | Smith Mine |
The Smith mine, accessed from near the bottom of the Dash open pit, began operations in 1999 as the Dash open pit was being mined out. Gold mineralization in the Smith, Mahala, and West Dash deposits is associated with the northeast-trending Coulee Fault and west-northwest-trending faults and dikes. The mineralization at Smith generally trends northwest with minor northeast trends along minor structures. Mineralization is continuous along the northwest trend ranging from 200 ft to 2,500 ft. The width of the mineralization ranges from 20 ft to 400 ft and the thickness ranges from 10 ft to 100 ft. The depth of the mineralization ranges from near surface at the Dash open pit to 1,200 ft below the surface to the south and east.
In Smith Zone 1, high-grade gold mineralization is hosted in the upper and middle portions of Hanson Creek Formation unit III within a northwest-trending horst block between the South Graben Fault and the 170 fault. Mineralization in Zones 2 and 3 is directly associated with west-northwest-trending dikes. High-grade mineralization occurs within Hanson Creek Formation units II and III along the steeply dipping dikes. Lesser amounts of mineralization exist at higher levels where the dikes intersect favourable beds in the Roberts Mountains Formation. An exception to the tight elevation controls on mineralization is observed at the intersection of the west-northwest-trending dikes and the Coulee Fault. Here, high-grade mineralization blows out into Hanson Creek Formation unit III along the west plunging intersection of the dikes and the fault for a down-dip depth of 600 ft. The resource wireframes for the Smith deposit are illustrated in Figure 7-6.
| First Majestic Silver Corp. | Jerritt Canyon Gold Mine, SLR Project No: 233.03396.R0000
| ||||
| NI 43-101 Technical Report - April 30, 2021 | 7-9 | |||
Figure 7-6: Smith Resource Wireframes and Development
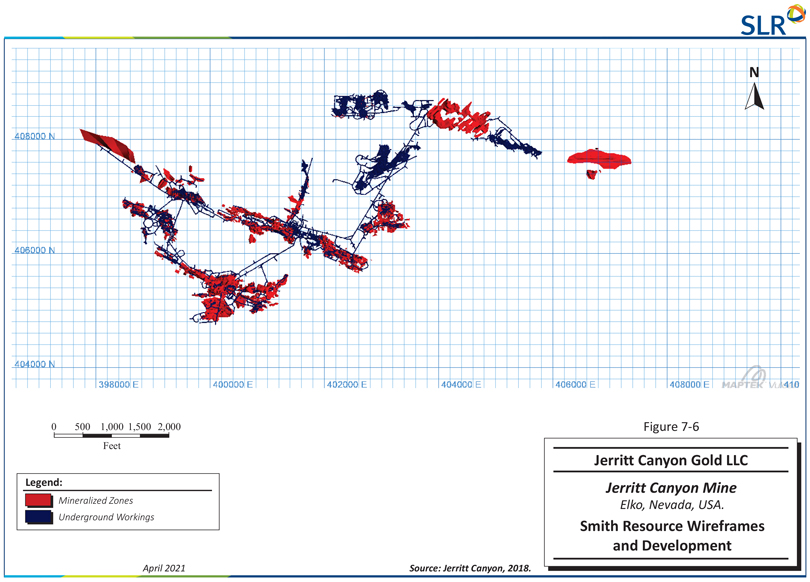
| First Majestic Silver Corp. | Jerritt Canyon Gold Mine, SLR Project No: 233.03396.R0000
| ||||
| NI 43-101 Technical Report - April 30, 2021 | 7-10 | |||
| 7.2.3 | Saval 4 |
Previous mining at Saval has included open pit mining from 1994 to 1997 and small-scale underground mining from 2004 to 2006 in the high wall of the Saval 2 pit. Gold mineralization in the Saval Basin area, located to the west of the SSX mine, is primarily hosted in Hanson Creek Formation unit III where it has been intersected by faults and has locally been compartmentalized by northwest trending dike systems. In this area, a series of west-northwest trending structures have been cut by northeast trending faults. Notable structural features include the west-northwest trending Saval horst and the northeast trending Husky Fault, which cuts across the older Saval horst and down-drops it to the southeast. Mineralization is predominantly hosted in Hanson Creek Formation unit III in the vicinity of structural intersections, often forming relatively steep, narrow, plunging bodies. Dikes, such as the Saval 3 pit dike can be traced for thousands of feet. High grade gold mineralization has been concentrated along the Saval 3 dike in several locations, most prominently in the Saval 3 pit and in the north part of Zone 5 at SSX.
Mineralization at Saval generally trends east-west from 200 ft to 1,000 ft, with width ranging from 50 ft to 200 ft and thickness from 10 ft to 50 ft. The depth of the Saval mineralization is from surface to approximately 400 ft below the surface.
The Saval 4 underground resource (Figure 7-7) is a relatively steep and vertically extensive high grade zone that lies within the Saval horst beneath a splay fault of the Sheep Tank Fault. The intersection of west-northwest trending faults that bound the horst with northeast trending faults are interpreted to have played an important role in formation of this resource.
| First Majestic Silver Corp. | Jerritt Canyon Gold Mine, SLR Project No: 233.03396.R0000
| ||||
| NI 43-101 Technical Report - April 30, 2021 | 7-11 | |||
Figure 7-7: Saval 4 Resource Wireframes and Development
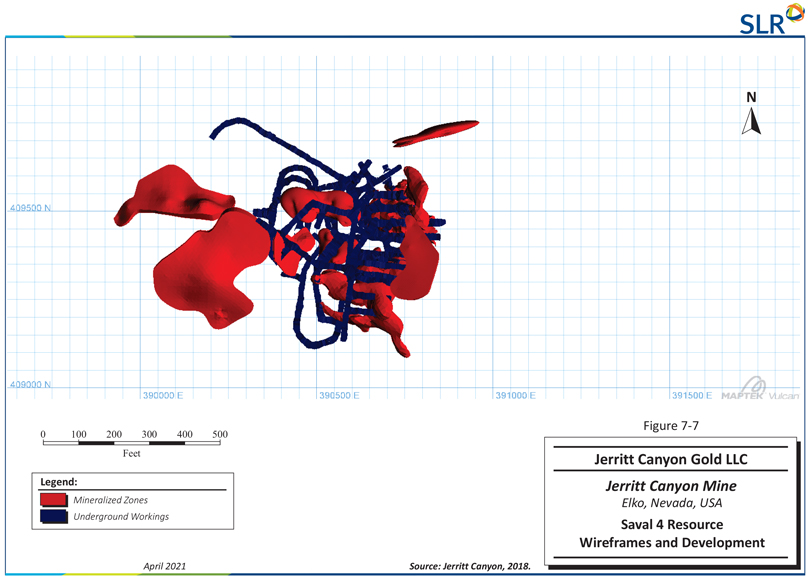
| First Majestic Silver Corp. | Jerritt Canyon Gold Mine, SLR Project No: 233.03396.R0000
| ||||
| NI 43-101 Technical Report - April 30, 2021 | 7-12 | |||
| 8.0 | DEPOSIT TYPES |
Jerritt Canyon is a Carlin-type gold deposit, hydrothermal in origin and usually structurally controlled. Current models attribute the genesis of Carlin-type gold deposits to:
| · | Epizonal plutons that contributed heat and potentially fluids and metals. |
| · | Meteoric fluid circulation resulting from crustal extension and widespread magmatism. |
| · | Metamorphic fluids, possibly with a magmatic contribution, from deep or mid-crustal levels. |
| · | Upper-crustal orogenic-gold processes within an extensional tectonic regime. |
Jerritt Canyon is hosted by silty carbonate or carbonaceous siliciclastic rocks originally deposited as shelf sedimentary rocks during the Paleozoic age. The Paleozoic host rocks have been imbricated, faulted, and folded through several orogenic events in the Paleozoic and Mesozoic. An early phase of intrusive igneous activity is represented by west-northwest mafic igneous dikes of Paleozoic age.
Carlin-type gold deposits were emplaced during the Middle to Late Eocene during an initial phase of extensional tectonics at which time high potassium calc-alkaline magmatic rocks were emplaced. Mafic and intermediate igneous dikes were emplaced during this phase of igneous activity and demarcate north-northeast-oriented structures. The primary controls on the occurrence, distribution, and form of the deposits are:
| · | Favourable host rocks (formation units) |
| · | The reactivation of Paleozoic and Mesozoic structures |
| · | Eocene syn-mineralization normal faults |
In general terms, the intersection of structures with favourable host rocks is the primary control and the form of mineralization ranges from apparently stratabound to fault hosted where the faults can be either highly discordant to bedding or bedding-parallel. Deposits at Jerritt Canyon are mostly stratabound or fault hosted. Gold occurs as very fine, micron sized, particles in pyrite and arsenian pyrite. Other sulfides are orpiment, realgar, and stibnite. Alteration includes decarbonatization, decalcification, and silicification (jasperoid).
| First Majestic Silver Corp. | Jerritt Canyon Gold Mine, SLR Project No: 233.03396.R0000
| ||||
| NI 43-101 Technical Report - April 30, 2021 | 8-1 | |||
| 9.0 | EXPLORATION |
Exploration completed by JCG has included desktop compilation and interpretation of historical datasets, target identification, and RC and core drilling. Drilling completed at Jerritt Canyon by JCG includes two phases of surface drilling and on-going underground drilling and is described in Section 10 of this Technical Report. In the fall of 2015, JCG initiated a comprehensive compilation of all historical geophysical data for Jerritt Canyon (Ellis, 2016) as well as a compilation of past surface geochemistry including soil, stream sediment, and bedrock sampling, completed to 2015. Interpretation of these compilations incorporated geology, gold distribution, and past surface exploration drilling and resulted in the identification of exploration targets and development of a surface RC exploration program, which was executed in the fall of 2016.
Conclusions from the geophysical review taken from Ellis (2016) are as follows:
| · | The SP, gradient array, early AMT survey, and ESCAN surveys are not expected to provide consistently useful targeting information in the future. The SP and gradient array have uncertain depth information making them of little value. The AMT and ESCAN were acquired in specific areas to estimate the depth to more resistive lower plate rocks. If these survey areas undergo further exploration, the datasets are in a format where they can be easily reviewed and may provide value when combined with geochemistry and geological mapping. |
| · | The radiometric and airborne electromagnetic resistivity data collected as part of the DIGHEM survey do not show a consistent signature with known mineralization. These datasets have been reviewed over the years in their present form and there is little probability that some general correlation with mineralization has gone unrecognized. |
| · | There is evidence that elevated IP values (due to increased abundances of sulfide minerals) occur within and proximal to areas of gold mineralization. Additional IP surveying in prospective areas is worth consideration. |
| · | Inversion of the gravity data provides a 3D picture of the distribution of the density of the various rock types located at Jerritt Canyon. High density rocks are seen to flank the Independence Range with a north-south trending lower density core present that may be dominated by less dense intrusive rocks or deeper low density sediments. Locally, a correlation exists between low density anomalies and mineralization trends (e.g. the SSX deposit) that may identify areas of decalcification. This correlation should be examined in well known areas to understand the extent to which decalcification is being identified and can be used for broader targeting. While the use of density contrasts to identify areas of low-density readings that may represent areas of decalcification is complicated by the terrain correction factor, the results have identified areas of density lows that have not been tested by drilling. |
| · | Inversion of the DIGHEM aeromagnetic data shows a good correlation of magnetic susceptibility highs with known intrusive rocks. Intrusive rocks interpreted to be present at Starvation Canyon are shown to extend northeast across the core of the mineralized area at depth. There is an observed correlation of intrusive rocks with mineralization at Starvation Canyon and along the northwest SSX deposit trend. The source of the magnetic susceptibility highs is interpreted to be an infusion of intrusive dikes. These dikes increase the total magnetic susceptibility of the non-magnetic host lithologies that extend to depth into more coherent intrusive stocks. Similar susceptibility signatures to those at SSX, Burns, and Starvation Canyon may identify other areas for more detailed examination by geologic mapping and geochemical methods. |
| First Majestic Silver Corp. | Jerritt Canyon Gold Mine, SLR Project No: 233.03396.R0000
| ||||
| NI 43-101 Technical Report - April 30, 2021 | 9-1 | |||
| · | Based on the new gravity and magnetic inversion modelling, there is strong evidence for the presence of intrusive rocks on the east flank of the Independence Range adjacent to and beneath the Tertiary Mill Creek volcanic rocks and gravel. |
In early 2017, JCG commissioned further detailed evaluation of the historical gravity data, inversion and examination of DIGHEM EM and magnetic data, inversion and examination of the ground magnetic data, and examination of the Titan survey results. This work has been completed by Condor Consulting (Witherly, 2017) and the main observations and conclusions are summarized below.
| · | DIGHEM EM: Over much of the Jerritt Canyon property, there is a good relationship between the high resistivity and Lower Plate rocks. In some areas, however, there is high resistivity and no Lower Plate rocks, and the reason for the high resistivity is unclear. Additionally, in some areas mapped as Lower Plate, the resistivity has moderate values, and it is not clear whether this is due to a soil cover or change in the physical properties of the Lower Plate rocks. |
| · | DIGHEM EM magnetics: The magnetic results show mostly low response which is inconclusive. The major feature is a strong magnetic high wrapping along the eastern margin of the range that appears to be associated with Tertiary volcanics, much of it being located under Quaternary cover. While there are limited exposures of Tertiary volcanics on the western margin of the range, these do not appear to be magnetic. There could be significant structural information contained in the magnetic data which could be defined with suitable processing. |
| · | DIGHEM EM radiometrics: Potassium is relatively low over two major Lower Plate areas, the Burn’s Creek/Charlies Hill and Wheeler Mt. There are a series of lows across the top of the survey area where no significant Lower Plate rocks occur. The apparent resistivity values are high in the same areas, which suggests that there is a specific rock unit that is part of the Upper Plate package being mapped. |
| · | Gravity Survey: The reasons for the gravity pattern described in Ellis (2016) are not well understood. The Lower Plate rocks are expected to be of higher density; however, this is not clear from the images examined. Given the cost of acquisition of the primary data, the survey results should be reviewed in detail and it should be ensured that the most suitable form of terrain correction has been applied. |
| · | IP-Titan Resistivity: The resistivity results show that the Lower Plate rocks (eastern 40% of the survey block) are quite resistive at all depths. The western part of the block over Upper Plate rocks is medium-conductive at a shallow depth, however, a strong conductive zone is noted in the central part of the block at depths of approximately 1,500 ft. |
| · | IP-Titan Chargeability: The chargeability shows a strong response from surface to a depth of 2,500 ft, where the contact between the Upper Plate and Lower Plate rocks is assumed to be located. The chargeability zone can be seen to extend over 4,000 ft (sections are 2,000 ft apart) whereas the resistivity low only goes to depth on one section. Based on resistivity and chargeability data, the contact between the Upper Plate and Lower Plate rocks cannot be defined with certainty. |
| · | IP-Titan MT: The modelled MT results were visually examined and while they appeared to show some strong subvertical features, there was little evidence that any layering between the UP and LP rocks was being mapped. |
In the spring of 2017, JCG commissioned Goldspot Discoveries Inc. (Goldspot) to complete a machine learning (AI) compilation, interpretation, and targeting study. The 2017 Goldspot study incorporated several datasets from Jerritt Canyon including drilling (lithology and assay), surface geology, topography,
| First Majestic Silver Corp. | Jerritt Canyon Gold Mine, SLR Project No: 233.03396.R0000
| ||||
| NI 43-101 Technical Report - April 30, 2021 | 9-2 | |||
soil geochemistry, gravity, DIGHEM EM, magnetic, and radiometric data. Goldspot incorporated hyperspectral data into the compilation and interpretation. Based on the 2017 study, Goldspot generated target areas, planned drill holes, and completed a 3D geological model incorporating structural and lithological information in Leapfrog software.
| 9.1 | Exploration Potential |
The Jerritt Canyon property is believed to hold significant potential for the discovery of additional gold-bearing mineralization. JCG has successfully expanded the Mineral Resources directly associated with the mining operation.
Historically, the primary exploration tool at Jerritt Canyon has been the mapping and projection of north-northeast faults, west-northwest faults, the intersections of these faults, and the intersections of these faults with the favourable host rocks such as the upper Hanson Creek Formation and the lower part of the Roberts Mountain Formation. Eocene mafic dikes demarcate the west-northwest and north-northeast structures and therefore are also considered. This approach is the basis for targeting of on-going underground drilling.
In particular, this strategy has been used to explore along the extension of well established west-northwest and northeast structural trends in the Smith and SSX mines. This has resulted in the delineation of Mineral Resources at Mahala, SSX Zone 5, Smith Zone 8, and Smith Zone 4. JCG geologists have completed a compilation and targeting exercise to target structural intersections in the SSX-Smith-Saval 4 Lower Plate domain (Figure 9-1).
| First Majestic Silver Corp. | Jerritt Canyon Gold Mine, SLR Project No: 233.03396.R0000
| ||||
| NI 43-101 Technical Report - April 30, 2021 | 9-3 | |||
Figure 9-1: Near-Mine Exploration Targeting in the Smith–SSX Lower Plate Window
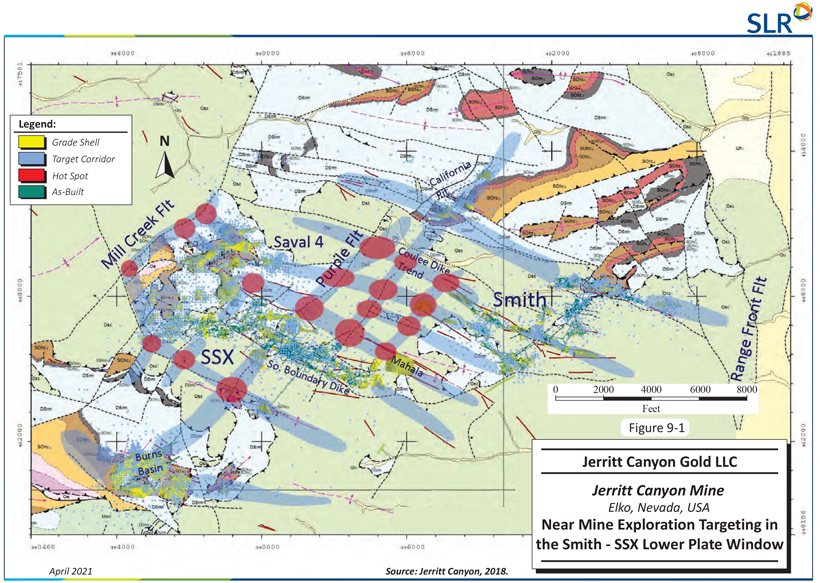
| First Majestic Silver Corp. | Jerritt Canyon Gold Mine, SLR Project No: 233.03396.R0000
| ||||
| NI 43-101 Technical Report - April 30, 2021 | 9-4 | |||
Over the long mining and exploration history at Jerritt Canyon, past operators have generated a considerable amount of geoscience data and information for Jerritt Canyon. Based on the assessment of regional datasets and review of exploration and development history, First Majestic is of the opinion that there is district-scale exploration potential at Jerritt Canyon. Based on work to date, the following targets are considered to be high priority:
| · | Murray to West Generator |
| · | Murray |
| · | Waterpipe II |
| · | Northeast Saval |
| · | Road Canyon |
| · | California Mountain |
| · | Gance Creek |
| · | Wheeler Fault Zone |
| · | Pie Creek |
| · | Waterpipe |
| · | Pie Creek Goldspot |
| · | Snake Goldspot |
| · | Smith Creek |
| · | Happy Camp |
| · | Burns Basin |
| · | Bidart |
| · | Winters Creek |
Figure 9-2 shows the general location of the targets listed above.
The entire property is approximately 119 square miles in size and has approximately 25 known exploration targets in various stages of exploration. Based on past mining and exploration data, JCG and the QP are of the opinion that the Jerritt Canyon District holds significant exploration potential that warrants further exploration work.
The QP recommends exploring the 17 high priority exploration targets. The QP concurs with First Majestic’s plans to carry out a multi-year exploration program that will include a significant amount of surface and underground drilling that will cost approximately US$10 million to US$15 million annually.
| First Majestic Silver Corp. | Jerritt Canyon Gold Mine, SLR Project No: 233.03396.R0000
| ||||
| NI 43-101 Technical Report - April 30, 2021 | 9-5 | |||
Figure 9-2: Jerritt Canyon Exploration Targets
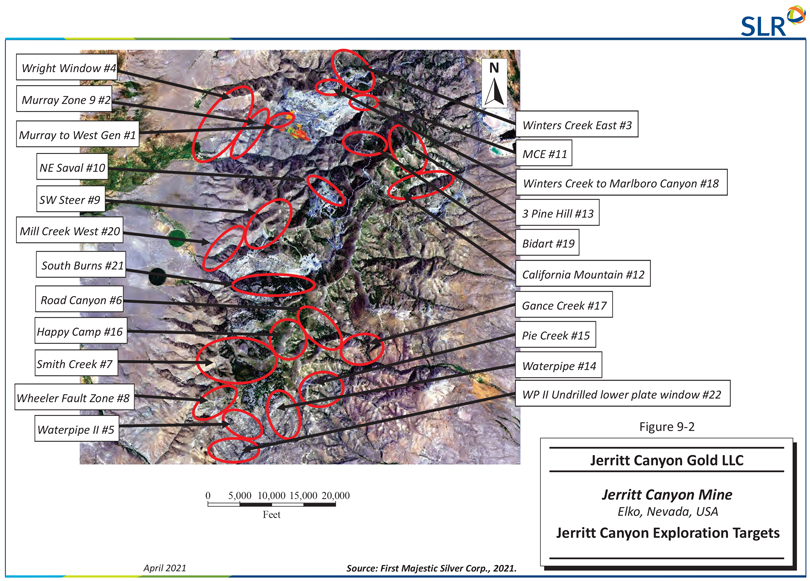
| First Majestic Silver Corp. | Jerritt Canyon Gold Mine, SLR Project No: 233.03396.R0000
| ||||
| NI 43-101 Technical Report - April 30, 2021 | 9-6 | |||
| 10.0 | DRILLING |
This section discusses underground and surface drilling completed from January 2015 through December 2020 at Jerritt Canyon. Drilling completed prior to JCG’s acquisition of Jerritt Canyon is described in Section 6 of this Technical Report.
| 10.1 | Underground Drilling |
Starting January 1, 2015 through December 31, 2020, JCG has drilled a total of 18,533 holes between reverse circulation (RC) and core from underground drilling sites, comprising of 2,800,695 ft of drilling (Table 10-1).
Table 10-1: Underground Drilling by JCG
Jerritt Canyon
| Mine | Type | No. Holes |
Footage (ft)
| |||
| Smith |
Core | 192 | 130,648 | |||
| SSX |
Core | 217 | 14,569 | |||
| Saval 4 |
RC | 299 | 46,335 | |||
| Smith |
RC | 9,388 | 1,170,309 | |||
| SSX |
RC | 8,279 | 1,269,744 | |||
| Starvation |
RC | 158 | 35,090 | |||
| Total
|
Core and RC
|
18,533
|
2,800,695
| |||
Underground core drilling is used for exploration to delineate Inferred Resources defined by surface drilling at a spacing of 100 ft or greater. It is also used to test anomalous areas, or areas of exploration potential, at depth defined by surface hole intercepts; and targets defined by JCG geologists based on the interpretation of stratigraphy, structures and dikes, and the associated distribution of mineralization.
Underground core drill holes have a maximum length of approximately 1,200 ft. Generally underground drilling tests a given target to a depth of 1,000 ft from the drill set-up location. If successfully intersected, the target is delineated with core drilling only to the extent that sufficient confidence exists to complete development to the target. This drilling is generally spaced at 100 ft to 150 ft and results in definition of an Inferred Resource. In some instances, JCG carried out development based on wider drill spacing results, which would be considered as exploration potential.
Cubex holes are drilled for delineation, definition, and extension of resources to support mine planning and near-mine exploration. Cubex holes have a maximum length of approximately 300 ft. Development is completed to a depth where a Cubex drill is set up and the target delineated. Delineation drilling is completed on 25 ft centres along drifts with fans planned to intercept the target at 25 ft centres, depending on the distance and angle from the drift. This will result in resource definition of sufficient detail to support mine planning and development.
The following maps of SSX and Smith (Figure 10-1 through Figure 10-6) show the progression of core and RC drilling in both mines from January1, 2018 to December 31, 2020. Mine as-builts and current wireframes are provided for reference. JCG has been successful in converting resources and extending
| First Majestic Silver Corp. | Jerritt Canyon Gold Mine, SLR Project No: 233.03396.R0000
| ||||
| NI 43-101 Technical Report - April 30, 2021 | 10-1 | |||
active mining areas with RC drilling while targeting farther out from defined mineralization and infrastructure with core drilling.
| First Majestic Silver Corp. | Jerritt Canyon Gold Mine, SLR Project No: 233.03396.R0000
| ||||
| NI 43-101 Technical Report - April 30, 2021 | 10-2 | |||
Figure 10-1: Location of Underground Drilling at SSX Mine January 1, 2018 to December 31, 2018
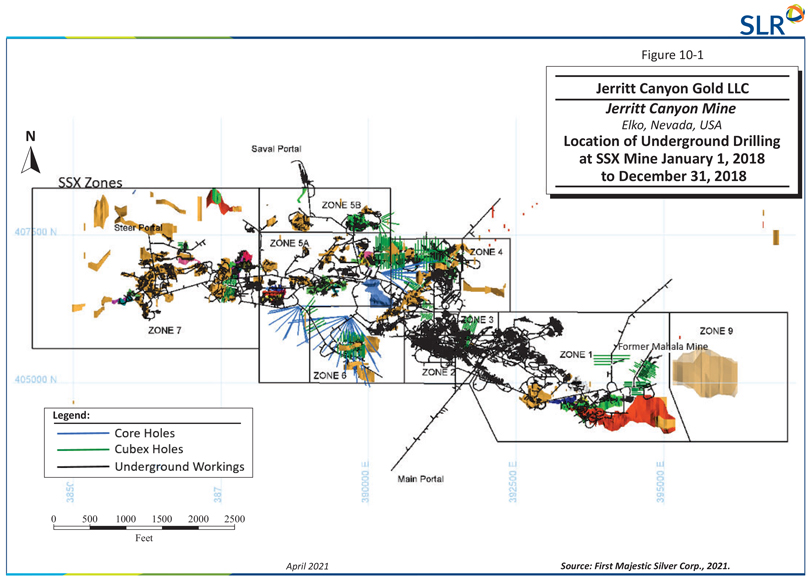
| First Majestic Silver Corp. | Jerritt Canyon Gold Mine, SLR Project No: 233.03396.R0000
| ||||
| NI 43-101 Technical Report - April 30, 2021 | 10-3 | |||
Figure 10-2: Location of Underground Drilling at SSX Mine January 1, 2019 to December 31, 2019
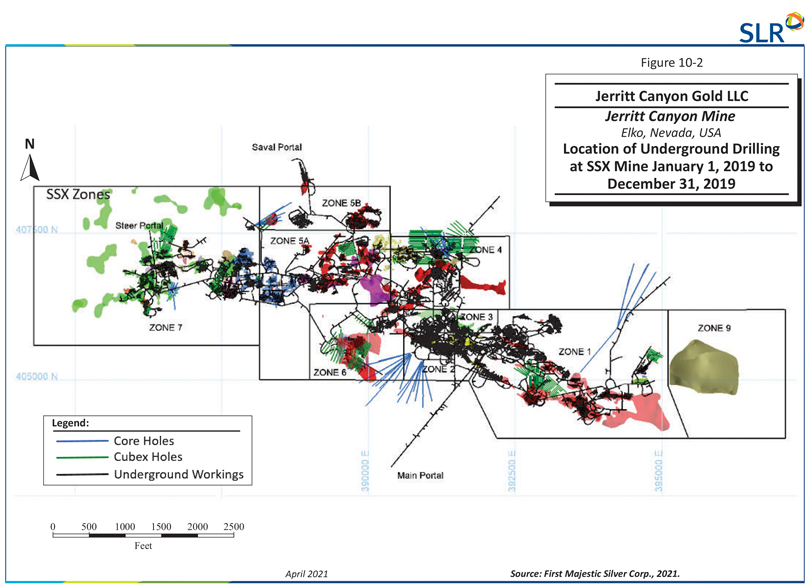
| First Majestic Silver Corp. | Jerritt Canyon Gold Mine, SLR Project No: 233.03396.R0000
| ||||
| NI 43-101 Technical Report - April 30, 2021 | 10-4 | |||
Figure 10-3: Location of Underground Drilling at SSX Mine January 1, 2020 to December 31, 2020
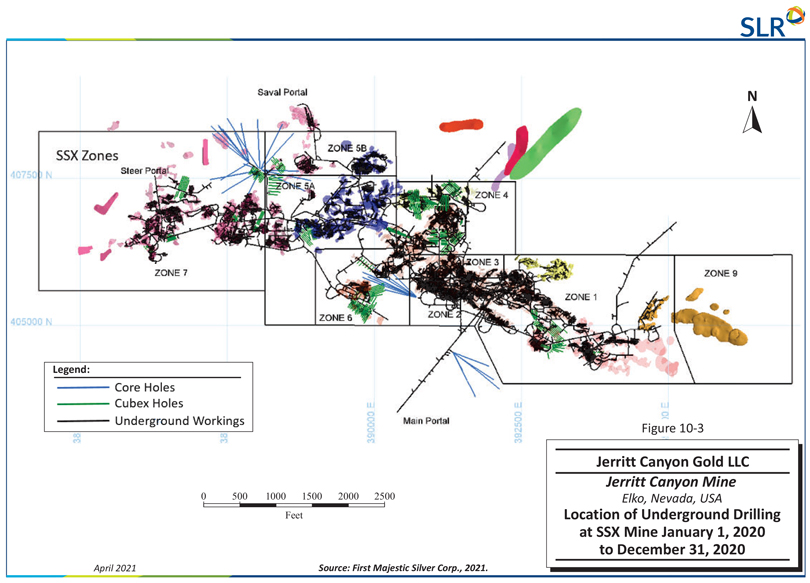
| First Majestic Silver Corp. | Jerritt Canyon Gold Mine, SLR Project No: 233.03396.R0000
| ||||
| NI 43-101 Technical Report - April 30, 2021 | 10-5 | |||
Figure 10-4: Location of Underground Drilling at Smith Mine January 1, 2018 to December 31, 2018
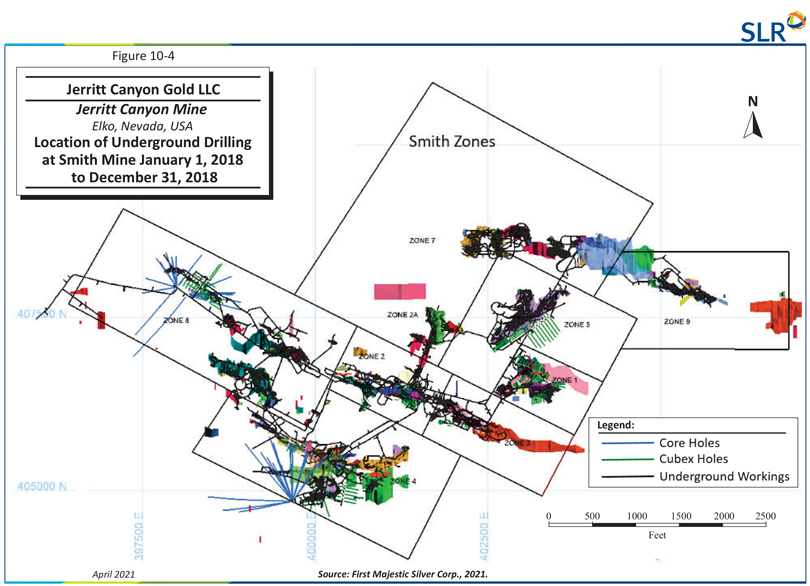
| First Majestic Silver Corp. | Jerritt Canyon Gold Mine, SLR Project No: 233.03396.R0000
| ||||
| NI 43-101 Technical Report - April 30, 2021 | 10-6 | |||
Figure 10-5: Location of Underground Drilling at Smith Mine January 1, 2019 to December 31, 2019
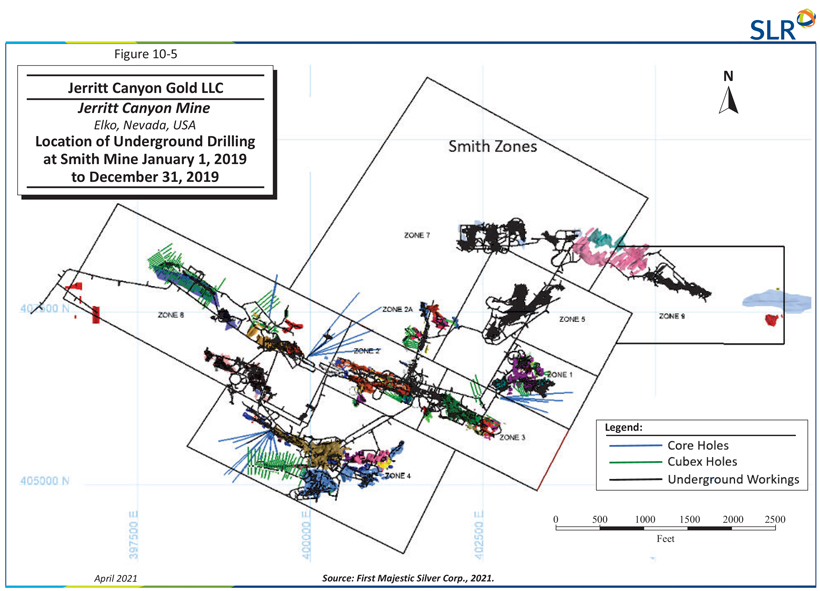
| First Majestic Silver Corp. | Jerritt Canyon Gold Mine, SLR Project No: 233.03396.R0000
| ||||
| NI 43-101 Technical Report - April 30, 2021 | 10-7 | |||
Figure 10-6: Location of Underground Drilling at Smith Mine January 1, 2020 to December 31, 2020
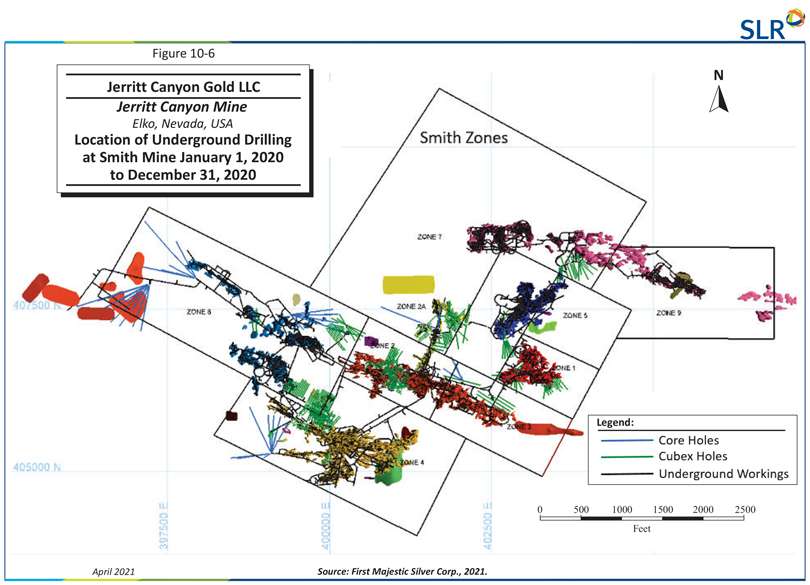
| First Majestic Silver Corp. | Jerritt Canyon Gold Mine, SLR Project No: 233.03396.R0000
| ||||
| NI 43-101 Technical Report - April 30, 2021 | 10-8 | |||
Drilling results were composited on assay intervals and analyzed for grades greater than or equal to 0.12 oz/st and greater than or equal to 15 ft thick. (grade x thickness ³1.8 oz*ft/st). Fifteen feet represents a minimum mining width. Table 10-2 comprises the grade x thickness intercepts by mine and by year showing total positive intercepts and weighted average grades.
Table 10-2: Composited Intercepts for Underground Drilling Results (2018-2020)
Jerritt Canyon
| Year | Mine | Drill Type | Total Footage (ft) |
Composite Intercepts (ft) |
% of Feet total |
Weighted Avg. Grade | ||||||
| 2018 |
SSX | RC | 221,786 | 15,975 | 7.2 | 0.235 | ||||||
| SSX | Core | 45,135 | 1,133 | 2.5 | 0.307 | |||||||
| Smith | RC | 156,330 | 20,065 | 12.8 | 0.216 | |||||||
| Smith | Core | 36,809 | 612 | 1.7 | 0.195 | |||||||
| 2019 |
SSX | RC | 242,730 | 14,150 | 5.8 | 0.238 | ||||||
| SSX | Core | 39,616 | 742 | 1.9 | 0.241 | |||||||
| Smith | RC | 165,625 | 20,810 | 12.6 | 0.248 | |||||||
| Smith | Core | 19,141 | 441 | 2.3 | 0.244 | |||||||
| 2020 |
SSX | RC | 266,018 | 21,640 | 8.1 | 0.251 | ||||||
| SSX | Core | 28,806 | 919 | 3.2 | 0.250 | |||||||
| Smith | RC | 287,849 | 23,486 | 8.2 | 0.197 | |||||||
| Smith | Core | 29,518 | 882 | 3.0 | 0.196 | |||||||
| 10.2 | Surface Drilling |
Starting from January 1, 2016 through December 31, 2020, JCG has drilled a total of 230 RC holes from surface drilling sites, comprising of 178,872 ft of drilling (Table 10-3). No surface drilling was done in 2015.
Table 10-3: 2016-2019 Surface Exploration Drilling Totals
Jerritt Canyon
| Exploration Target | Type | No. Holes | Year |
Footage (ft) | ||||
| Mahala Variscite |
RC | 4 | 2016 | 5,360 | ||||
| SSX Variscite |
RC | 2 | 2016 | 2,300 | ||||
| Smith Variscite |
RC | 6 | 2016 | 7,050 | ||||
| SW Steer |
RC | 2 | 2016 | 2,550 | ||||
| Lost Mine |
RC | 4 | 2016 | 4,735 | ||||
| Bidart Anticline |
RC | 3 | 2016 | 3,640 | ||||
| Marlboro Canyon Projection |
RC | 1 | 2016 | 1,100 | ||||
| First Majestic Silver Corp. | Jerritt Canyon Gold Mine, SLR Project No: 233.03396.R0000
| ||||
| NI 43-101 Technical Report - April 30, 2021 | 10-9 | |||
| Exploration Target | Type | No. Holes | Year |
Footage (ft) | ||||
| Winters Creek |
RC | 3 | 2016 | 1,420 | ||||
| Saval 4 |
RC | 6 | 2016 | 3,685 | ||||
| 2016 Total | RC | 31 | 2016 | 31,840 | ||||
| Winters Creek |
RC | 14 | 2017 | 6,780 | ||||
| Greenstone Draw |
RC | 1 | 2017 | 1,420 | ||||
| 2017 Total | RC | 15 | 2017 | 8,200 | ||||
| Starvation Canyon |
RC | 2 | 2018 | 2,805 | ||||
| Waterpipe II |
RC | 1 | 2018 | 1,035 | ||||
| 2018 Total | RC | 3 | 2018 | 3,840 | ||||
| Upper Stump Basin |
RC | 34 | 2019 | 36,205 | ||||
| Variscite Hill |
RC | 1 | 2019 | 1,475 | ||||
| 2019 Total | RC | 35 | 2019 | 37,680 | ||||
| West Generator |
RC | 26 | 2020 | 1,900 | ||||
| North Generator |
RC | 5 | 2020 | 1050 | ||||
| Murray/West Gen |
RC | 36 | 2020 | 25,090 | ||||
| Northeast Saval |
RC | 8 | 2020 | 6950 | ||||
| Burns Basin |
RC | 9 | 2020 | 7,595 | ||||
| Winters Creek |
RC | 5 | 2020 | 5,490 | ||||
| Starvation Canyon |
RC | 19 | 2020 | 19,790 | ||||
| Wheeler Fault Zone |
RC | 14 | 2020 | 12,515 | ||||
| Waterpipe II |
RC | 17 | 2020 | 13,652 | ||||
| Waterpipe I |
RC | 2 | 2020 | 2,330 | ||||
| Pie Creek |
RC | 5 | 2020 | 1,970 | ||||
| 2020 Total |
RC | 146 | 2020 | 98,332 | ||||
| Total |
RC | 230 | 2015-2020 | 178,872 | ||||
From November 27, 2018 to December 7, 2018, three RC holes targeting possible mineral extensions from Starvation grade shells and previous holes were drilled in the Starvation and Waterpipe 2 areas (TJ-374 (1,500 ft), TJ-375 (1,305 ft), and WT-150 (1,035 ft)). The only significant intercept was in TJ-374: 1,235 ft to 1,240 ft at 0.110 oz/st Au. Figure 10-7 shows the location of these holes.
In March 2019, a 127-hole RC drill program was conducted in the North Generator Pit area where aggregate is mined for use as cement backfill at the Smith and SSX mines. Aggregate is mined on 30-ft benches in a pre-existing pit and blastholes are routinely sampled. In February 2019, sample results suggested there was a possible resource that extended from the dig-face to the east or southeast that could be direct shipped to the mill. Figure 10-8 shows the location of the drill pattern with respect to surrounding previous operations, while Figure 10-9 shows the drill pattern in detail.
| First Majestic Silver Corp. | Jerritt Canyon Gold Mine, SLR Project No: 233.03396.R0000
| ||||
| NI 43-101 Technical Report - April 30, 2021 | 10-10 | |||
Results from this program are shown as colored discs in Figure 10-10. Units are in oz/st Au and feet. Figure 10-11 is a cross section along Section A-A’ (facing northwest) presenting a geologic interpretation of the constraints on mineralization. Table 10-4 lists intercepts in the labeled holes.
| First Majestic Silver Corp. | Jerritt Canyon Gold Mine, SLR Project No: 233.03396.R0000
| ||||
| NI 43-101 Technical Report - April 30, 2021 | 10-11 | |||
Figure 10-7: Starvation Extension Drilling
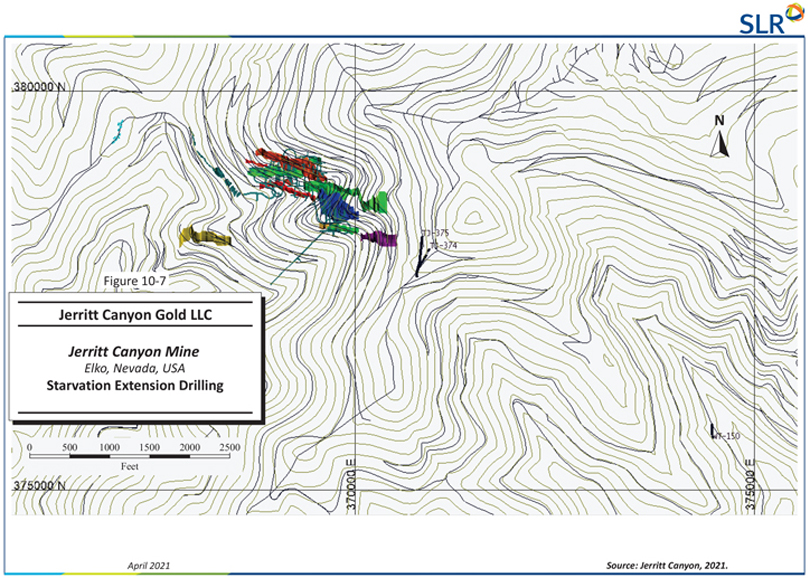
| First Majestic Silver Corp. | Jerritt Canyon Gold Mine, SLR Project No: 233.03396.R0000
| ||||
| NI 43-101 Technical Report - April 30, 2021 | 10-12 | |||
Figure 10-8: North Generator 2019 Drilling Program
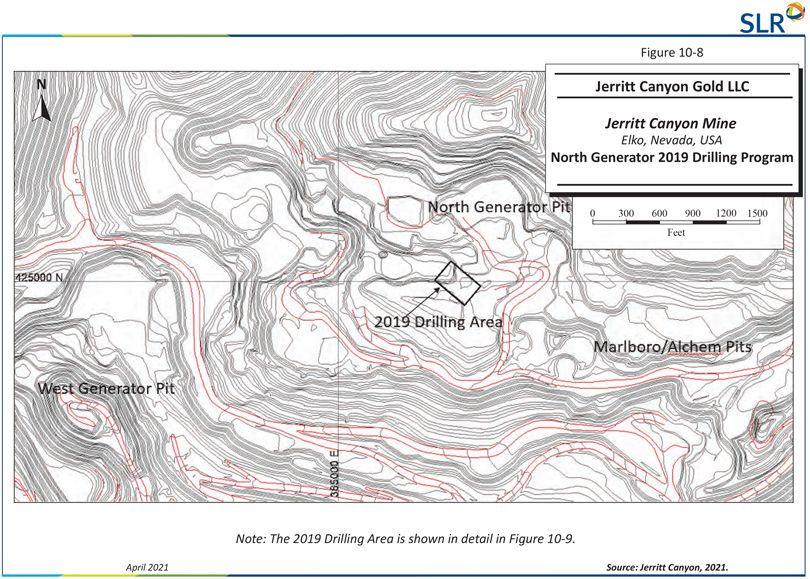
| First Majestic Silver Corp. | Jerritt Canyon Gold Mine, SLR Project No: 233.03396.R0000
| ||||
| NI 43-101 Technical Report - April 30, 2021 | 10-13 | |||
Figure 10-9: North Generator 2019 Drilling Program
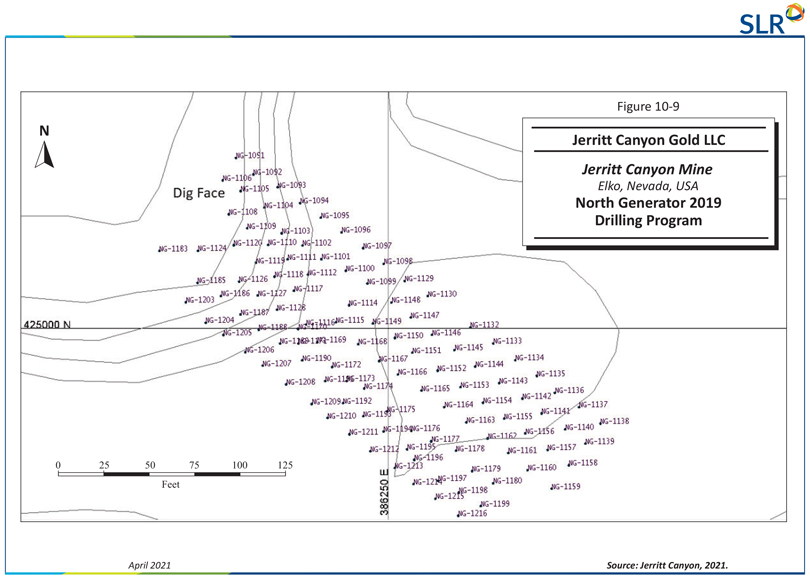
| First Majestic Silver Corp. | Jerritt Canyon Gold Mine, SLR Project No: 233.03396.R0000
| ||||
| NI 43-101 Technical Report - April 30, 2021 | 10-14 | |||
Figure 10-10: North Generator 2019 Drill Hole Results
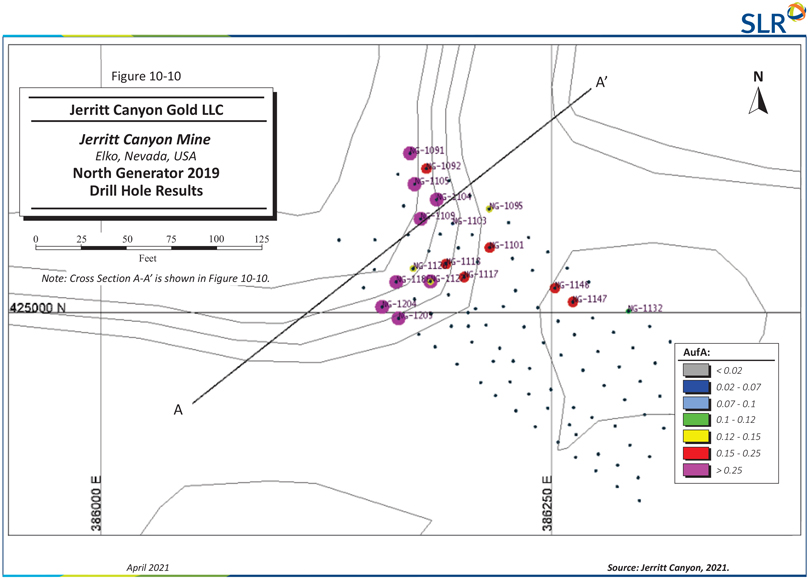
| First Majestic Silver Corp. | Jerritt Canyon Gold Mine, SLR Project No: 233.03396.R0000
| ||||
| NI 43-101 Technical Report - April 30, 2021 | 10-15 | |||
Figure 10-11: North Generator 2019 Drilling A-A’
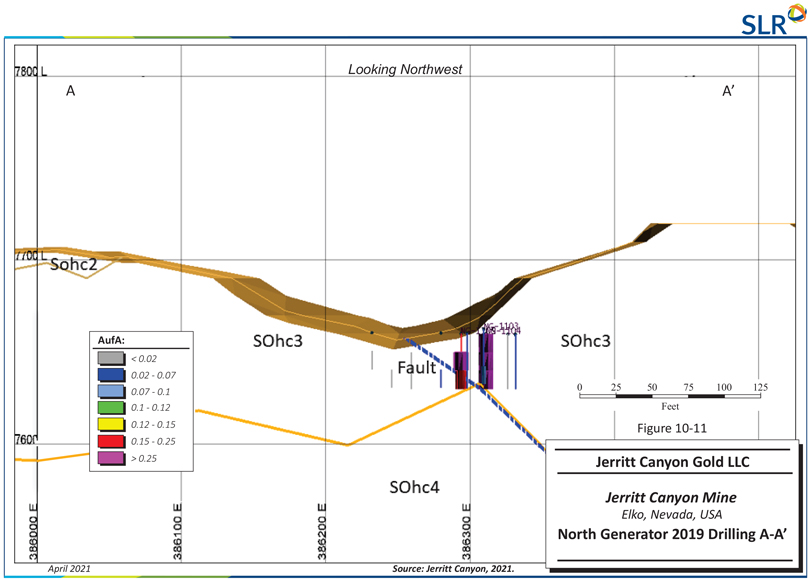
| First Majestic Silver Corp. | Jerritt Canyon Gold Mine, SLR Project No: 233.03396.R0000
| ||||
| NI 43-101 Technical Report - April 30, 2021 | 10-16 | |||
Table 10-4: 2019 North Generator Drilling Results
Jerritt Canyon
| Hole |
From (ft)
|
To (ft)
|
Thickness (ft)
|
Grade (oz/st Au)
| ||||
| NG-1091 |
10 | 30 | 20 | 0.184 | ||||
| NG-1092 |
0 | 30 | 30 | 0.175 | ||||
| NG-1095 |
20 | 30 | 10 | 0.125 | ||||
| NG-1101 |
10 | 30 | 20 | 0.155 | ||||
| NG-1103 |
20 | 30 | 10 | 0.072 | ||||
| NG-1104 |
0 | 30 | 30 | 0.814 | ||||
| NG-1105 |
0 | 30 | 30 | 0.192 | ||||
| NG-1109 |
0 | 30 | 30 | 0.248 | ||||
| NG-1117 |
0 | 10 | 10 | 0.166 | ||||
| NG-1118 |
20 | 30 | 10 | 0.206 | ||||
| NG-1126 |
0 | 30 | 30 | 0.123 | ||||
| NG-1127 |
10 | 30 | 20 | 0.209 | ||||
| NG-1132 |
10 | 30 | 20 | 0.099 | ||||
| NG-1147 |
20 | 30 | 10 | 0.176 | ||||
| NG-1148 |
20 | 30 | 10 | 0.162 | ||||
| NG-1186 |
10 | 30 | 20 | 0.97 | ||||
| NG-1204 |
0 | 20 | 20 | 0.181 | ||||
| NG-1205
|
0
|
30
|
30
|
0.489
| ||||
From September 4, 2019 to November 7, 2019 a 34 hole drilling program was completed to test a northwest extension and some modelled grade-shells of the Coulee dike zone at the Smith mine. A total of 36,205 ft were drilled. Figure 10-12 shows the locations of these holes with respect to the Smith Mine Zone 8, resource shells defined by previous surface drilling, and the Purple Fault and R- Fault which are district-scale mineralizing structures. Significant intercepts from the 2019 extension drilling program are presented in Table 10-5.
| First Majestic Silver Corp. | Jerritt Canyon Gold Mine, SLR Project No: 233.03396.R0000
| ||||
| NI 43-101 Technical Report - April 30, 2021 | 10-17 | |||
Figure 10-12: 2019 Extension Drilling – Coulee and Smith Areas
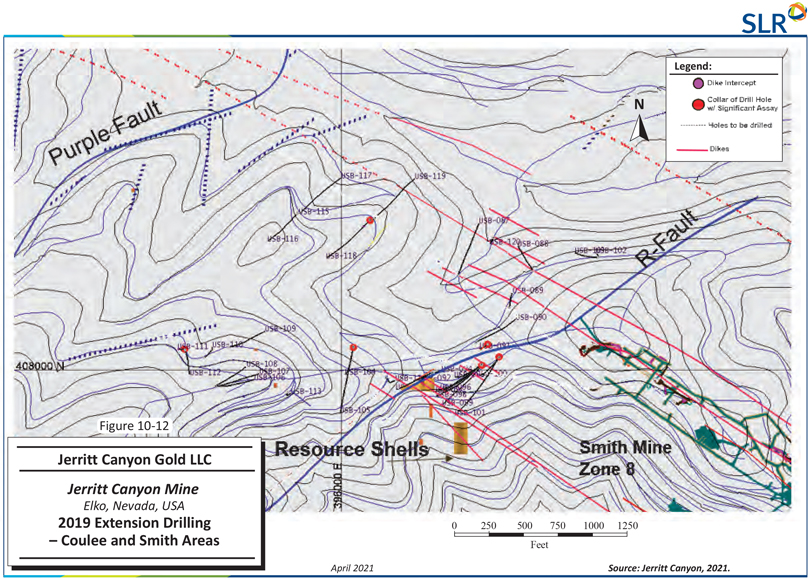
| First Majestic Silver Corp. | Jerritt Canyon Gold Mine, SLR Project No: 233.03396.R0000
| ||||
| NI 43-101 Technical Report - April 30, 2021 | 10-18 | |||
Table 10-5: 2019 Extension Drilling Results – Coulee and Smith Areas
Jerritt Canyon
| Drill Hole ID | TD (ft)
|
Sample Depth (ft)
|
Sample Length (ft)
|
Grade (> 0.08 oz/st Au)
| ||||
|
USB-091 |
975 | 920-965 | 45 | 0.081 | ||||
| including |
925-930 | 5 | 0.101 | |||||
| including |
945-955 | 10 | 0.151 | |||||
| USB-094 |
1100 | 1020-1025 | 5 | 0.091 | ||||
| USB-099 |
1550 | 1165-1180 | 15 | 0.083 | ||||
| including |
1170-1175 | 5 | 0.126 | |||||
| USB-100 |
1250 | 1060-1100 | 40 | 0.083 | ||||
| including |
1080-1095 | 15 | 0.144 | |||||
| USB-105 |
1235 | 1095-1125 | 30 | 0.140 | ||||
| including |
1095-1110 | 15 | 0.252 | |||||
| USB-111 |
940 | 710-715 | 5 | 0.082 | ||||
| 865-885 | 20 | 0.100 | ||||||
| including |
870-880 | 10 | 0.157 | |||||
| USB-118
|
1000
|
765-770
|
5
|
0.077
| ||||
On November 7, 2019, hole VH-001 was drilled at Variscite Hill, located east of the Starvation Mine. While VH-001 was drilled to 1,475 ft, it never penetrated favorable units below the Snow Canyon Formation. The hole was terminated due to budget limitations and weather. The Variscite Hill location is presented in Figure 10-13. SLR notes that no significant intercepts were obtained.
No surface drilling was conducted from January 1 to April 29, 2020.
| First Majestic Silver Corp. | Jerritt Canyon Gold Mine, SLR Project No: 233.03396.R0000
| ||||
| NI 43-101 Technical Report - April 30, 2021 | 10-19 | |||
Figure 10-13: 2019 Varasite Hill Drilling
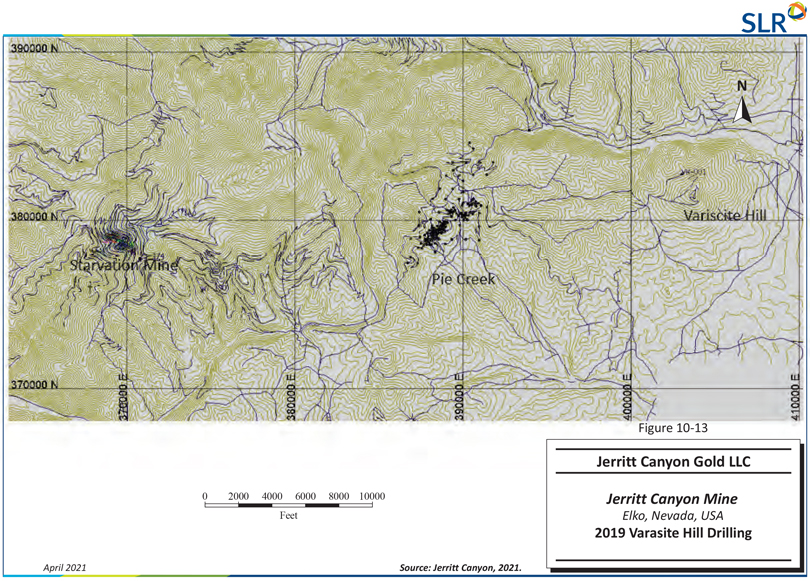
| First Majestic Silver Corp. | Jerritt Canyon Gold Mine, SLR Project No: 233.03396.R0000
| ||||
| NI 43-101 Technical Report - April 30, 2021 | 10-20 | |||
| 10.3 | Drilling After April 29, 2020 |
This subsection discusses drilling programs and results, provided by JCG, which have occurred on the Jerritt Canyon property after the cut-off date for the resource model drilling data (April 29, 2020). A total of 146 RC drill holes were completed from April 30, 2020 through December 31, 2020 totaling 98,332 ft. Figure 10-14 depicts these exploration targets. Figure 10-15 presents a cross section of the Murray Mine/West Generator Connection with significant intercepts. Table 10-6 lists some of the notable intercepts from these drilling programs. None of these holes have been included in the current Resource Estimate.
Table 10-6: Exploration Drilling Results April 30, 2020 through December 31, 2020
Jerritt Canyon
| Area
|
Drill Hole ID
|
Total Depth (ft)
|
Sample Depth (ft)
|
Sample Length (ft)
|
Grade (oz/st Au) | |||||
| West Generator Pit |
GH-1094 | 140 | 85-90 | 5 | 0.078 | |||||
| West Generator Pit |
GH-1106 | 225 | 175-180 | 5 | 0.09 | |||||
| West Generator Pit |
GH-1112 | 260 | 215-245 | 30 | 0.089 | |||||
| Murray Mine/West Generator Connection |
GH-1123 | 650 | 455-585 | 130 | 0.082 | |||||
| Murray Mine/West Generator Connection |
including | 455-490 | 35 | 0.102 | ||||||
| Murray Mine/West Generator Connection |
including | 535-550 | 15 | 0.177 | ||||||
| Murray Mine/West Generator Connection |
including | 560-580 | 20 | 0.113 | ||||||
| Murray Mine/West Generator Connection |
GH-1124 | 650 | 415-440 | 25 | 0.254 | |||||
| Murray Mine/West Generator Connection |
GH-1132 | 800 | 575-585 | 10 | 0.102 | |||||
| Murray Mine/West Generator Connection |
GH-1133 | 600 | 555-560 | 5 | 0.072 | |||||
| Murray Mine/West Generator Connection |
GH-1134 | 1200 | 1,050-1,095 | 45 | 0.073 | |||||
| Murray Mine/West Generator Connection |
Including | 1,055-1,070 | 15 | 0.149 | ||||||
| Murray Mine/West Generator Connection |
GH-1140 | 600 | 490-495 | 5 | 0.106 | |||||
| Murray Mine/West Generator Connection
|
GH-1143
|
700
|
470-485
|
15
|
0.079
| |||||
| First Majestic Silver Corp. | Jerritt Canyon Gold Mine, SLR Project No: 233.03396.R0000
| ||||
| NI 43-101 Technical Report - April 30, 2021 | 10-21 | |||
| Area | Drill Hole ID | Total Depth (ft) |
Sample Depth (ft) |
Sample Length (ft) |
Grade (oz/st Au) | |||||
| Murray Mine/West Generator Connection |
Including | 475-480 | 5 | 0.155 | ||||||
| Murray Mine/West Generator Connection |
GH-1143 | 700 | 495-510 | 15 | 0.078 | |||||
| Murray Mine/West Generator Connection |
GH-1144 | 600 | 315-340 | 25 | 0.126 | |||||
| Murray Mine/West Generator Connection |
Including | 320-330 | 10 | 0.222 | ||||||
| Murray Mine/West Generator Connection |
GH-1152 | 800 | 540-545 | 5 | 0.073 | |||||
| Northeast Saval |
SC-1404 | 700 | 475-555 | 80 | 0.039 | |||||
| Northeast Saval |
including | 700 | 480-495 | 15 | 0.071 | |||||
| Burns Basin |
BB-1510 | 1050 | 240-255 | 15 | 0.055 | |||||
| Burns Basin |
including | 250-255 | 5 | 0.092 | ||||||
| Burns Basin |
BB-1511 | 950 | 335-355 | 20 | 0.021 | |||||
| Burns Basin |
WC-568 | 1250 | 740-840 | 100 | 0.01 | |||||
| Burns Basin |
WC-569 | 1295 | 235-245 | 10 | 0.029 | |||||
| Starvation Canyon |
TJ-393 | 1375 | 720-750 | 30 | 0.059 | |||||
| Starvation Canyon |
including | 725-735 | 10 | 0.11 | ||||||
| Wheeler Fault Zone |
WH-037 | 1140 | 630-690 | 60 | 0.043 | |||||
| Wheeler Fault Zone |
Including | 630-635 | 5 | 0.16 | ||||||
| Wheeler Fault Zone |
Including | 685-690 | 5 | 0.072 | ||||||
| Wheeler Fault Zone |
WH-040 | 1000 | 465-480 | 15 | 0.048 | |||||
| Wheeler Fault Zone |
Including | 470-475 | 5 | 0.082 | ||||||
| Water Pipe II |
WT-163 | 645 | 300-420 | 120 | 0.052 | |||||
| Water Pipe II |
including | 300-310 | 10 | 0.073 | ||||||
| Water Pipe II |
Including | 350-355 | 5 | 0.132 | ||||||
| Water Pipe II |
including | 370-405 | 35 | 0.084 | ||||||
| Water Pipe II |
WT-166 | 495 | 410-415 | 5 | 0.088 | |||||
| Water Pipe II |
WT-167 | 765 | 545-565 | 20 | 0.047 | |||||
| Water Pipe II |
Including | 555-560 | 5 | 0.095 | ||||||
| Water Pipe II |
WT-167 | 765 | 690-715 | 25 | 0.032 | |||||
| Water Pipe II
|
WT-168
|
805
|
765-785
|
20
|
0.033
| |||||
| First Majestic Silver Corp. | Jerritt Canyon Gold Mine, SLR Project No: 233.03396.R0000
| ||||
| NI 43-101 Technical Report - April 30, 2021 | 10-22 | |||
| Area | Drill Hole ID | Total Depth (ft) |
Sample Depth (ft) |
Sample Length (ft) |
Grade (oz/st Au) | |||||
| Water Pipe II |
WT-176 | 1015 | 410-500 | 90 | 0.017 | |||||
| Pie Creek |
PC-166 | 525 | 125-165 | 40 | 0.023 | |||||
| Pie Creek
|
Including
|
160-165
|
5
|
0.088
| ||||||
| First Majestic Silver Corp. | Jerritt Canyon Gold Mine, SLR Project No: 233.03396.R0000
| ||||
| NI 43-101 Technical Report - April 30, 2021 | 10-23 | |||
Figure 10-14: 2020 Exploration Drilling Targets
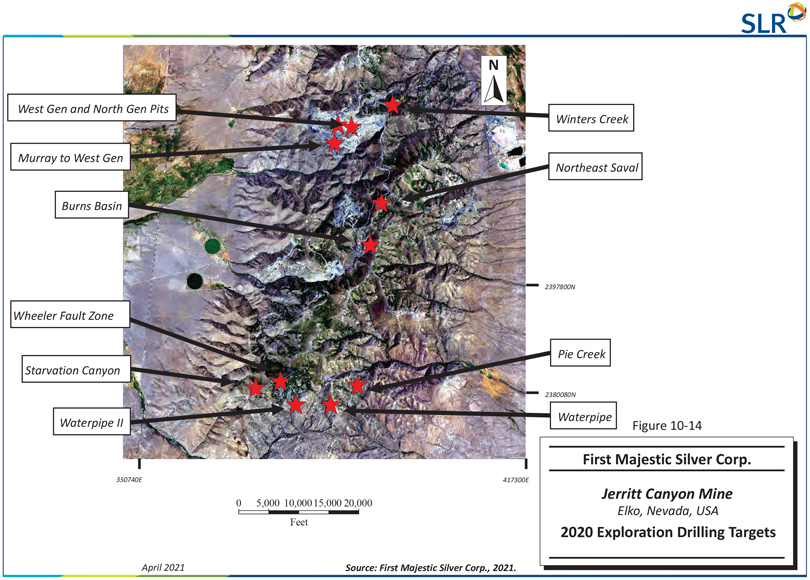
| First Majestic Silver Corp. | Jerritt Canyon Gold Mine, SLR Project No: 233.03396.R0000
| ||||
| NI 43-101 Technical Report - April 30, 2021 | 10-24 | |||
Figure 10-15: Murray/West Generator Underground Connection Cross Section
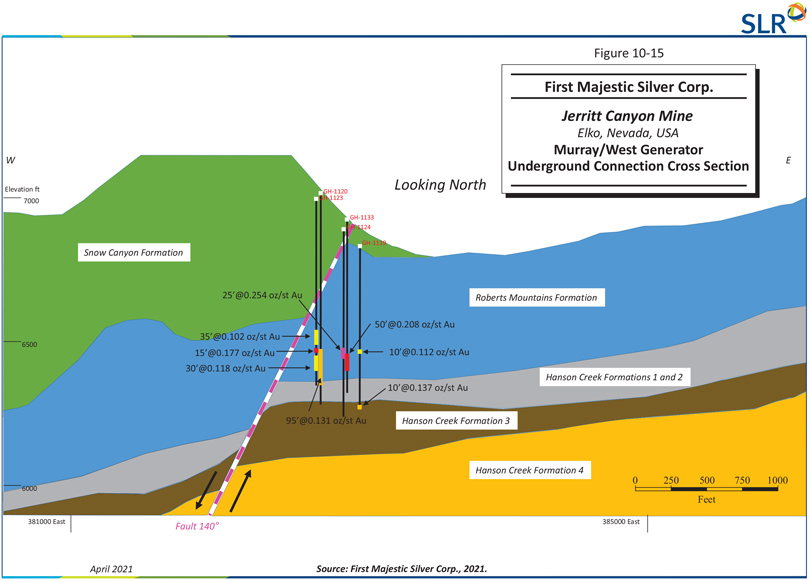
| First Majestic Silver Corp. | Jerritt Canyon Gold Mine, SLR Project No: 233.03396.R0000
| ||||
| NI 43-101 Technical Report - April 30, 2021 | 10-25 | |||
11.0 SAMPLE PREPARATION, ANALYSES, AND SECURITY
Procedures for sample preparation, analysis and security were initiated in 2008 by Queenstake, the previous operator, and continued by JCG upon acquisition. The quality assurance/quality control (QA/QC) data has a cut-off date of April 29, 2020. The QP has not reviewed any of the QA/QC data after the cut-off date. None of the assay data produced after the cut-off date has been used in the Mineral Resource Estimate stated in Section 14 of this Technical Report. Notwithstanding, JCG has a history of following industry standard protocols for analyses and that data produced by its onsite laboratory is of good quality. The QP is of the opinion that these procedures and results will continue to be of good quality.
| 11.1 | Drill Sample Handling and Logging Procedures |
Drill core is placed in core boxes at the drill site by the drillers. Core is then cleaned, core boxes marked with the hole number and length, and core blocks placed in the boxes at the end of each core retrieval run. Core boxes are kept under the control and supervision of the drill site crew until they are transported to the locked and secured core logging facility by JCG geologists or drilling personnel at the end of each drill shift.
At the logging facility, core is placed on the logging tables and reassembled to the extent possible, with the geology logged in detail by JCG geologists. Core recovery is measured and recorded at this time. Geologists mark intervals to be sampled and insert standard reference materials, blanks, and duplicate samples into the sample stream. After logging and control sample insertion, the core is photographed.
Core is logged in a Microsoft (MS) Excel logging template and the relevant data on sample intervals, assays, recovery, and alteration recorded. Assay data is entered directly from spreadsheets provided by the JCG onsite assay laboratory, reducing the potential for data entry errors, and uploaded directly in to an acQuire database.
In 2008, all historic drill logs, assay certificates, geology maps, and other diagrams were moved to the administration building at Jerritt Canyon. The logs are currently stored at the Jerritt Canyon Drill Hole Library while maps and other diagrams are stored in several flat files in the database administrator’s office.
| 11.2 | Sampling Method and Approach |
Sample types used on a routine basis to support both the mine operation and for geological exploration include:
| · | Underground RC (Cubex) drill sampling |
| · | Underground sludge sampling |
| · | Muck (windrow sampling) |
| · | Underground core drilling sampling |
| · | Surface RC drill sampling |
| 11.2.1 | Cubex and Sludge Samples |
Underground Cubex samples are collected in five-foot intervals from the collar. The samples are collected in barcoded sample bags which are placed in a five-gallon plastic bucket installed under the cyclone on the drill. Each bag has the hole ID and sample interval written on it with permanent marker. On
| First Majestic Silver Corp. | Jerritt Canyon Gold Mine, SLR Project No: 233.03396.R0000
| ||||
| NI 43-101 Technical Report - April 30, 2021 | 11-1 | |||
completion of the hole, the driller completes a submittal form which includes hole ID, barcode number, and from-to sample interval for each sample. The samples and the submittal form are dispatched from the underground drill site to the JCG assay laboratory by the site geologists. At the assay laboratory, the samples are unloaded onto trays and JCG technicians check the sample bag hole ID and intervals against the submittal sheet. The collection, recording, and handling of sludge samples are the same as that for the Cubex samples; however, the sludge samples are of higher priority for analysis to support the on-going mining operation. Cubex samples are included in the Mineral Resource database, while sludge samples support daily mine operations and ore control.
| 11.2.2 | Muck Sampling |
Production muck is transported from underground and laid out in windrows in a specified area adjacent to the respective portal. Each round comprises one windrow and consists of several piles hauled by 20 ton haul trucks. JCG has a written procedure for the handling and sampling of windrows. Muck samples are used to support daily mine operations and ore control destinations of windrow piles.
| · | The location of each windrow pile is marked on the map in the field to help track the origin of the muck. |
| · | Each windrow pile is marked in the field with paint with a unique location identification (ID) number. |
| · | A lath with the unique windrow ID number is placed in front of each windrow pile with the zone, heading, cut, date mucked, and the number of samples in the windrow indicated. |
| · | Muck characterization data is documented in a specially designed “Underground Muck Windrow Ore Control Table”, described, which is periodically updated by the JCG Geology Department. |
| · | One sample from two piles (representing approximately 40 tons) is taken according to the Windrow Grade Control Sampling Protocol, described. |
| · | Samples are dispatched to the JCG assay laboratory by a designated person from either JCG or Small Mine Development, LLC. (SMD). |
| · | Once the assays are finalized and received, the ore-waste characterization for each windrow pile is determined and colored flagging is tied to the labelled lath using the following flag coloring designations: red flagging for high grade ore, yellow flagging for low grade ore, and blue flagging for waste. |
| · | Once each windrow has been marked in the field with colored flagging as ore or waste, the JCG surface operations group is notified that hauling to the run of mine (ROM) area may begin. Under certain situations, the JCG Geology Department may allow certain windrow piles to be hauled to the ROM area without having received final assays, which is referred to as “Released Assays Pending” (or RAP). Communication between SMD, the JCG Geology Department, and surface operations must be clear when a RAP situation is approved so appropriate tracking and hauling of the materials is correctly performed. Only a JCG geologist can approve RAP situations. When RAP situations are approved by a JCG geologist, the windrow pile must be marked and identified as such on the Underground Muck Windrow Ore Control Table. |
The Underground Muck Windrow Ore Control Table contains the following statistics relating to each windrow pile:
| · | The date mapped, which is the actual date the windrow is placed on the surface laydown area and the date samples are collected. |
| First Majestic Silver Corp. | Jerritt Canyon Gold Mine, SLR Project No: 233.03396.R0000
| ||||
| NI 43-101 Technical Report - April 30, 2021 | 11-2 | |||
| · | Windrow location number. |
| · | Zone, heading, and cut from which the mined muck material originates. |
| · | Ore or waste designation (high, low, or waste as defined previously). |
| · | Estimated tons mucked determined by the number of piles in the surface laydown area multiplied by the truck ton factor of 18.2 ft3/st. |
| · | The final gold assay grades from the JCG assay laboratory. |
| · | The approximate hauled ounces determined by multiplying the average gold grade by the estimated tons mucked. |
| · | The average moisture content determined by the JCG assay laboratory from the final assay analysis. |
| · | Pile count which is defined by the total number of piles associated with each windrow. |
| · | The number of samples taken which is the actual number of samples collected from each windrow pile. |
| · | The dates mucked, flagged, and hauled. |
The Windrow Grade Control Sampling Protocol includes one sample for every two windrow piles (representing approximately 40 wet tons) as follows:
| · | The sample is collected midway up each pile at equally spaced points around each pile. |
| · | The desired representative sample weight for each bag submitted to the JCG assay laboratory is twelve pounds with approximately one and one-half pounds collected from each sampling point. |
| · | The sampled material from each pile must be placed in a properly labelled sample bag that includes the muck date, the zone and heading from which the sample is taken, and a unique barcode ID number. |
| · | The sampled muck material collected in each sample contains equal amounts of coarse material and fine materials to achieve the targeted final sample weight of 12 lb. Individual rock clasts placed in each muck sample must be less than 4 in. in diameter to minimize sample size bias. |
| · | All the sample bags are placed at the end of the windrow after they have been collected. |
| · | After all the samples from the windrow have been collected, all the sample numbers are marked on the lath. |
On completion, the samples are delivered to the JCG assay laboratory. The Windrow Ore Control Table is submitted to the JCG database administrator.
| 11.2.3 | Underground Core Sampling |
At the end of each 12-hour shift, the drill contractor transports core from the underground rig to the JCG core logging facility. Prior to any logging, core is aligned, and recovery and rock quality designation (RQD) are recorded. Geology is logged in an MS Excel template. Information logged includes rock type, lithology, alteration, and bedding orientations. Sample intervals are based on geology and mineralogy, are typically three feet long, and respect geological contacts. The geologist indicates the sample limits using a grease pencil and by writing the sample number on the core at the start of the sample interval. Where core is geologically and mineralogically uniform over extended lengths, samples are designated by the run length blocks in which case the samples are five feet long. The logging geologist provides the core technician with a sample sheet listing sample numbers and sample intervals. Core is subsequently photographed before being cut in half using a core saw equipped with a diamond blade. Half of the core is placed in a
| First Majestic Silver Corp. | Jerritt Canyon Gold Mine, SLR Project No: 233.03396.R0000
| ||||
| NI 43-101 Technical Report - April 30, 2021 | 11-3 | |||
sample bag, while the remaining half is returned to the core box. As per the underground Cubex drilling procedure, the sample bags have a barcode, in addition to the hole ID and sample interval having been written on them. Daily, usually at the end of day shift, the core samples are delivered to the JCG assay laboratory. The submittal sheet is emailed to the JCG assay laboratory and database administrator. Underground core samples are used to support Mineral Resource estimation.
| 11.2.4 | Surface RC Drilling |
Five-foot samples are collected using a cyclone/splitter apparatus. Samples are placed in barcoded bags with the hole ID and sample interval written on them. Sample bags are labelled and provided to the drill contractor by the supervising geologist. On completion of the hole, the drill contractor delivers the samples to the JCG assay laboratory. The cut sheet containing hole ID, barcode numbers, and sample intervals is provided to the JCG database administrator by the supervising geologist. Surface RC samples are used to support Mineral Resource estimation.
| 11.3 | Sample Preparation and Analysis |
Historically, drill hole samples have been prepared and analyzed at the JCG assay laboratory as well as independent commercial laboratories such as ALS Limited (ALS), Bureau Veritas Mineral Laboratories (BVL), and American Assay Laboratory (AAL). Since acquisition of the Jerritt Canyon property in 2015, JCG has primarily used the JCG assay laboratory, with BVL and AAL used for the analysis of samples from 2016 surface drilling and part of the 2015 to 2016 underground drilling.
All underground Cubex and sludge samples, as well as windrow samples, are analyzed at the JCG assay laboratory. Samples from the 2016 surface RC drill program were dominantly analyzed at BVL with the last two holes analyzed at AAL. Samples from the underground drilling program from October 2015 to December 2016 were analyzed at BVL, AAL, and the JCG assay laboratory. Since the resumption of underground drilling in May 2017, all samples have been analyzed at the JCG assay laboratory.
| 11.3.1 | JCG Laboratory |
The JCG assay laboratory is owned and operated by JCG. It is located adjacent to the mill, engineering office, and administration building at Jerritt Canyon. Geologists from the mine sites are responsible for the transportation of samples to the laboratory. Upon arrival at the laboratory, samples are unloaded by the ore control technician who places them in the appropriate order on loading carts. The sample preparation technician reviews the samples against the sample submittal sheets to ensure that the records match the samples. Once checked, the samples are logged in the Laboratory Information Management System (LIMS). If any additional tests are required, such as moisture determination or LECO analysis, they are added at this stage. Labels and fire assay batch requisition sheets are printed upon entry of the samples into the system.
Once the samples are scanned or logged in the system, they are placed in the Grieve drying oven in the exact order they were logged. Drying time is dependent on water content and can be up to eight hours. Once the samples are dried, they are unloaded onto the sample carts. If a dry weight is needed for moisture determination, it is taken at this stage.
The entire sample is crushed to 50% passing 10 mesh through a Terminator TM Crusher. The entire sample is then split through a Jones Riffle splitter to obtain a 200 g split. The 200 g split is put into the manila envelope with the appropriate sample ID on the tag and then placed in a box within a respective
| First Majestic Silver Corp. | Jerritt Canyon Gold Mine, SLR Project No: 233.03396.R0000
| ||||
| NI 43-101 Technical Report - April 30, 2021 | 11-4 | |||
fire assay batch. The remaining 95% of the sample is returned to its original bag and stored until an acceptable assay is released.
The 200-g split is pulverized to 95% passing 150 mesh using a TM ring and puck pulverizer. Samples are then grouped into 40 samples per batch. Once an entire batch is pulverized, the sample is split using a rotary splitter to obtain a sub-sample of approximately 15 g, which is submitted for assay by aqua regia digestion, and analyzed using atomic absorption spectrometry (AAS).
| 11.3.2 | Bureau Veritas Mineral Laboratories |
BVL, previously Inspectorate America Corporation, is located in Sparks, Nevada. BVL is a commercial laboratory that is independent of JCG, and its preparation and analytical facilities in Sparks are accredited to ISO 9001:2008 for their quality management system and to ISO/IEC 17025:2005 for their competence of laboratory testing of gold samples by fire assay.
Representatives of BVL transport samples from the JCG core shed facility to the BVL laboratory in Sparks, Nevada. The received samples are laid out in order, weighed, dried, and entered into the LIMS. Sample preparation is by the BVL procedure code PRP70-25 which includes crushing to 70% passing less than 2 mm and pulverizing a 250-g split to 85% passing 200 mesh. A 30-g split of the pulverized sample is taken for fire assay and analyzed using an AAS finish (BVL procedure code FA430). Samples that return a gold value greater than 10 g/t Au in procedure FA430 are re-analyzed with a gravimetric finish (procedure code FA530). Samples are barcoded at the crusher stage and tracked through all steps of the analysis. Results are reported to JCG via a CSV data file and hard copy certificate.
| 11.3.3 | American Assay Laboratories Inc. |
The AAL laboratory used by JCG is located in Sparks, Nevada. AAL is a commercial laboratory that is independent of JCG and its preparation and analytical facilities in Sparks are accredited to ISO 9001:2008 for their quality management system, and ISO/IEC 17025:2005 for their competence of laboratory testing of gold samples by fire assay. AAL participates in various testing programs including CANMET, Geostats, SMA, and IOAG.
Representatives of AAL transport samples from the JCG core shed facility to the AAL laboratory in Sparks, Nevada. Samples received by AAL are laid out in order and checked against a cut sheet or laboratory submittal form. Samples are dried and entered into the LIMS. Sample preparation is by AAL procedure code BRPP2KG which uses a two-stage crushing method, the primary crush is by a jaw crusher reducing the sample to less than 6 mesh and the secondary is by roll crusher which reduces the sample to 80% passing 10 mesh. A 300-g split is taken using a riffle splitter and pulverized to 85% passing 150 mesh. Analysis is by AAL procedure code FA-PB30-ICP, which is a 30-g fire assay with ICP determination and by GRAVAu30, which is a 30-g fire assay followed by a gravimetric finish for samples over 10 g/t Au.
Pulps are stored on skids at the JCG assay laboratory within the secure Jerritt Canyon compound. Processed pulps are then stored in locked cargo sea containers on the Jerritt Canyon property. Rejects are stored at Jerritt Canyon in a secure location until the assay results are confirmed and then they are discarded periodically. Core is stored in a secure location at Jerritt Canyon.
In SLR’s opinion, the sample collection, preparation, analysis, transport, and security procedures at Jerritt Canyon are adequate for use in the estimation of Mineral Resources.
| First Majestic Silver Corp. | Jerritt Canyon Gold Mine, SLR Project No: 233.03396.R0000
| ||||
| NI 43-101 Technical Report - April 30, 2021 | 11-5 | |||
| 11.4 | Quality Assurance/Quality Control |
Quality assurance (QA) consists of evidence to demonstrate that the assay data has precision and accuracy within generally accepted limits for the sampling and analytical method(s) used to have confidence in a resource estimate. Quality control (QC) consists of procedures used to ensure that an adequate level of quality is maintained in the process of collecting, preparing, and assaying the exploration drilling samples. In general, QA/QC programs are designed to prevent or detect contamination and allow assaying (analytical), precision (repeatability), and accuracy to be quantified. In addition, a QA/QC program can disclose the overall sampling-assaying variability of the sampling method itself.
| 11.4.1 | QA/QC Protocols |
QA/QC procedures were implemented in 2008 by the previous owners and have been continuously followed by JCG. SLR has relied on raw data provided by JCG for analysis, and a summary of annual QA/QC submittals is presented in Table 11-1. This subsection covers QA/QC protocols for underground core, underground Cubex, and surface RC samples only, as these are the only samples supporting the database used in Mineral Resource estimation.
Drilling samples are grouped into batches of 40. Three standards and three blanks are included in each sample batch. Two to three pulp duplicates are submitted from each batch of samples. Additional QA/QC samples, including laboratory split duplicates and coarse rejects have not been regularly submitted since 2012. Total QA/QC samples comprise over 16% of the sample database.
A QA/QC report is prepared quarterly and annually by the onsite database manager and reviewed by the Project Geologist. Batches of samples identified by QA/QC as anomalous are repeated at the request of the database manager.
Table 11-1: Summary of QA/QC Submittals: 2008 to 2020
Jerritt Canyon
| Year | Counts/Rates | Samples | Blanks | CRMs | Field
|
Lab Split
|
Coarse
|
Pulp
| ||||||||
| 2008 |
Count |
46,516 |
163 |
636 |
20 | |||||||||||
|
Insertion Rate |
0% |
1% |
0% |
0% |
0% |
0% | ||||||||||
| 2010 |
Count |
16,070 |
1,083 |
2,141 |
16 |
627 | ||||||||||
|
Insertion Rate |
7% |
13% |
0% |
0% |
0% |
4% | ||||||||||
| 2011 |
Count |
49,871 |
1,004 |
1,120 |
1 |
44 |
49 |
1,405 | ||||||||
|
Insertion Rate |
2% |
2% |
0% |
0% |
0% |
3% | ||||||||||
| 2012 |
Count |
24,836 |
860 |
1,355 |
383 |
1,231 | ||||||||||
|
Insertion Rate |
3% |
5% |
0% |
2% |
0% |
5% | ||||||||||
| 2013 |
Count |
51,711 |
2,837 |
3,281 |
10 |
125 |
2,817 | |||||||||
|
Insertion Rate |
5% |
6% |
0% |
0% |
0% |
5% | ||||||||||
| 2014 |
Count |
37,995 |
2,486 |
2,508 |
261 |
2,063 | ||||||||||
|
Insertion Rate
|
7%
|
7%
|
0%
|
0%
|
1%
|
5%
| ||||||||||
| First Majestic Silver Corp. | Jerritt Canyon Gold Mine, SLR Project No: 233.03396.R0000
| ||||
| NI 43-101 Technical Report - April 30, 2021 | 11-6 | |||
| Year | Counts/Rates | Samples | Blanks | CRMs | Field
|
Lab Split
|
Coarse
|
Pulp
| ||||||||
|
2015 |
Count |
57,762 |
3,667 |
3,673 |
3,065 | |||||||||||
|
Insertion Rate |
6% |
6% |
0% |
0% |
0% |
5% | ||||||||||
| 2016 |
Count |
93,063 |
5,654 |
6,361 |
60 |
4,897 | ||||||||||
|
Insertion Rate |
6% |
7% |
0% |
0% |
0% |
5% | ||||||||||
| 2017 |
Count |
107,749 |
6,840 |
6,895 |
6,129 | |||||||||||
|
Insertion Rate |
6% |
6% |
0% |
0% |
0% |
6% | ||||||||||
| 2018 |
Count |
94,024 |
6,460 |
6,434 |
4,799 | |||||||||||
|
Insertion Rate |
7% |
7% |
0% |
0% |
0% |
5% | ||||||||||
| 2019 |
Count |
102,406 |
7,168 |
6,977 |
5,652 | |||||||||||
|
Insertion Rate |
7% |
7% |
0% |
0% |
0% |
6% | ||||||||||
| 20201 |
Count |
31,262 |
2,139 |
2,122 |
1,698
| |||||||||||
|
Insertion Rate
|
7%
|
7%
|
0%
|
0%
|
0%
|
5%
| ||||||||||
| 11.4.2 | Certified Reference Material |
Results of the regular submission of Certified Reference Material (CRMs) (standards) are used to identify any issues with specific sample batches, and biases associated with the primary assay laboratory. JCG sources CRMs from Rocklabs, located in New Zealand. Results of the CRMs are plotted in control charts, and failure rates, defined as gold values reporting more than three standard deviations (SD) from the expected value, and warning rates, defined as gold values reporting more than two SD, but less than three SD from the expected values, were tabulated quarterly and annually for review by onsite personnel.
A total of 19 different CRMs and 20 in-house standards were inserted in the Jerritt Canyon sample stream from 2008 to 2020, totaling 43,209 individual samples for an overall insertion rate of 6%. SLR reviewed the Certificates of Analysis of the CRMs, which were in use at Jerritt Canyon from 2010 to 2020 and vary in grade from 0.039 oz/st Au to 0.268 oz/st Au. These grades are representative of the low, medium, and high grades for the Jerritt Canyon deposits. Table 11-2 describes only the 19 commercial standards with the corresponding active years and basic statistics regarding the CRMs. SLR notes that there does seem to be an overall low bias in the CRMs used.
SLR reviewed JCG’s quarterly and annual review documents and control charts and found them to be acceptable with no material issues. SLR selected four CRMs, two from the surface samples and two from the underground samples, which represent higher usage rates and longest span of years for additional review.
Figure 11-1 charts 2,237 samples of CRM SK52 used for underground analysis from 2010 through 2019. The mean value for the sample set is 0.119 oz/st Au and had 12 failures (0.5%).
Figure 11-2 charts 1,972 samples of CRM SK78 used for underground analysis from 2014 through 2020. The mean value for the sample set is 0.120 oz/st Au and had 41 failures (2%).
Figure 11-3 charts 183 samples of in-house standard JCQ-05 used for surface analysis from 2008 through 2009. The mean value for the sample set is 0.149 oz/st Au and had four failures (2%).
| First Majestic Silver Corp. | Jerritt Canyon Gold Mine, SLR Project No: 233.03396.R0000
| ||||
| NI 43-101 Technical Report - April 30, 2021 | 11-7 | |||
Figure 11-4 charts 188 samples of in-house standard SK78 used for surface analysis from 2016 through 2019. The mean value for the sample set is 0.128 oz/st Au and had 13 failures (7%). Eight samples in 2016 returned high values, however, there appears to have been a labeling mix up and these standards are likely to be SN60 or SN75. These samples were identified by the onsite database manager and rerun in accordance with the failure protocols and returned assay values within the expected ranges for the CRM.
Table 11-2: 2010 to 2020 Certified Reference Material and Statistics
Jerritt Canyon
| CRM | Year | Element |
Certified
|
Std Dev (oz/st Au) |
Assay Count |
Mean (oz/st Au) |
Bias | |||||||
| GS-2Q |
2014-2018 | Au | 0.069 | 0.0038 | 1,948 | 0.070 | 1.33% | |||||||
| GS-6D |
2014-2018 | Au | 0.175 | 0.0093 | 2,000 | 0.171 | -2.26% | |||||||
| SH65 |
2017, 2019 | Au | 0.039 | 0.0013 | 826 | 0.039 | 0.17% | |||||||
| SH82 |
2017, 2018 | Au | 0.039 | 0.0020 | 2,026 | 0.039 | 0.96% | |||||||
| SI54 |
2010-2016 | Au | 0.052 | 0.0083 | 2,023 | 0.051 | -0.97% | |||||||
| SI81 |
2018-2020 | Au | 0.052 | 0.0015 | 3,685 | 0.052 | -0.29% | |||||||
| SJ63 |
2013-2016 | Au | 0.077 | 0.0075 | 861 | 0.075 | -2.80% | |||||||
| SJ80 |
2017-2018 | Au | 0.077 | 0.0023 | 2,840 | 0.077 | 0.15% | |||||||
| SK109 |
2019-2020 | Au | 0.12 | 0.0050 | 1,719 | 0.118 | -1.95% | |||||||
| SK52 |
2010-2019 | Au | 0.12 | 0.0090 | 2,239 | 0.118 | -1.40% | |||||||
| SK62 |
2013-2016 | Au | 0.119 | 0.0080 | 865 | 0.117 | -1.65% | |||||||
| SK78 |
2014-2020 | Au | 0.121 | 0.0060 | 2,162 | 0.120 | -1.10% | |||||||
| SK94 |
2018-2019 | Au | 0.114 | 0.0043 | 2,439 | 0.111 | -2.38% | |||||||
| SL46 |
2013-2016 | Au | 0.171 | 0.0128 | 829 | 0.170 | -0.77% | |||||||
| SL76 |
2017-2020 | Au | 0.174 | 0.0085 | 3,038 | 0.171 | -1.75% | |||||||
| SN103 |
2019-2020 | Au | 0.249 | 0.0120 | 1,953 | 0.239 | -4.13% | |||||||
| SN60 |
2013-2016 | Au | 0.251 | 0.0165 | 853 | 0.247 | -1.76% | |||||||
| SN75 |
2014-2018 | Au | 0.253 | 0.0085 | 2,287 | 0.247 | -2.32% | |||||||
| SN91 |
2018-2019 | Au | 0.253 | 0.0100 | 2,221 | 0.240 | -5.09% | |||||||
| First Majestic Silver Corp. | Jerritt Canyon Gold Mine, SLR Project No: 233.03396.R0000
| ||||
| NI 43-101 Technical Report - April 30, 2021 | 11-8 | |||
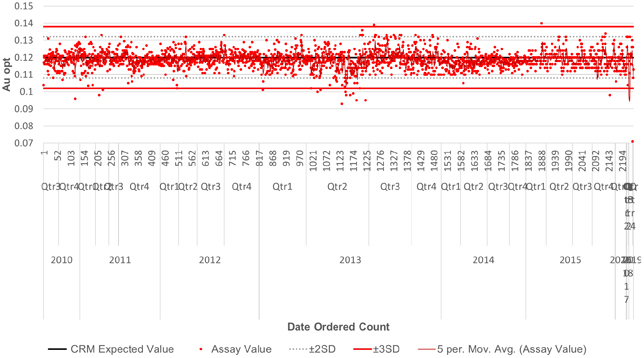
Figure 11-1: Jerritt Canyon Control Chart of CRM SK52 - Underground Samples
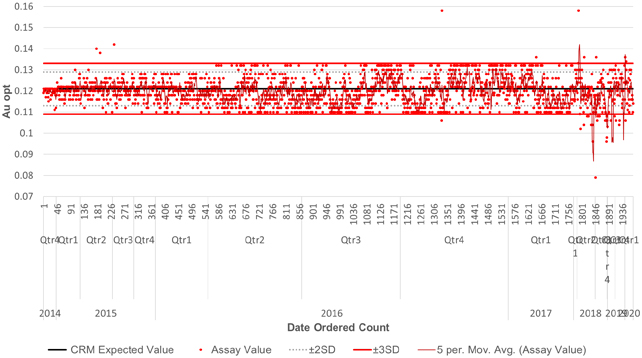
Figure 11-2: Jerritt Canyon Control Chart of CRM SK78- Underground Samples
| First Majestic Silver Corp. | Jerritt Canyon Gold Mine, SLR Project No: 233.03396.R0000
| ||||
| NI 43-101 Technical Report - April 30, 2021 | 11-9 | |||
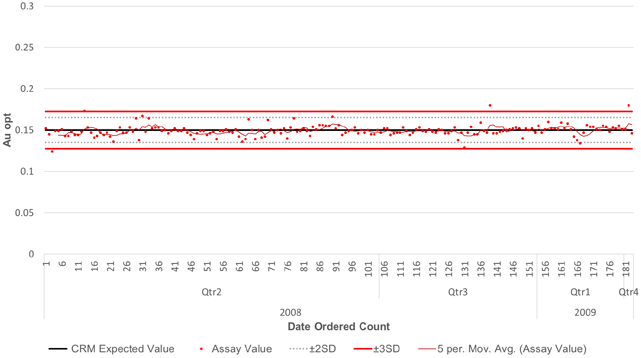
Figure 11-3: Jerritt Canyon Control Chart of In House Standard JCQ05 - Surface Samples
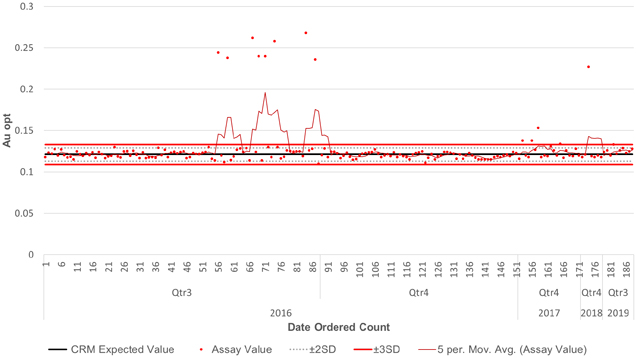
Figure 11-4: Jerritt Canyon Control Chart of CRM SK78 Surface Samples
Z-Score charts (Figure 11-5 and Figure 11-6) plot the performance of 26,022 samples with respect to the standard deviation for underground and surface CRMs, respectively.
| First Majestic Silver Corp. | Jerritt Canyon Gold Mine, SLR Project No: 233.03396.R0000
| ||||
| NI 43-101 Technical Report - April 30, 2021 | 11-10 | |||
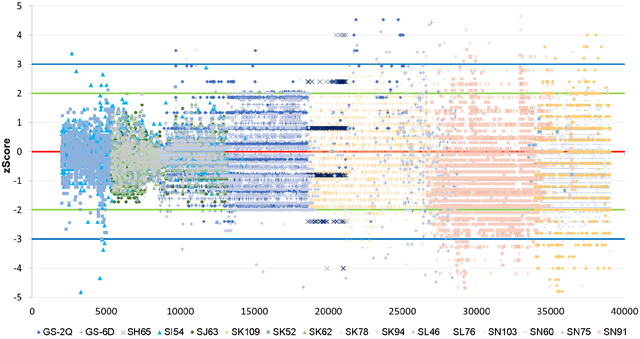
Figure 11-5: Jerritt Canyon Z-Score Chart of Underground CRM Samples
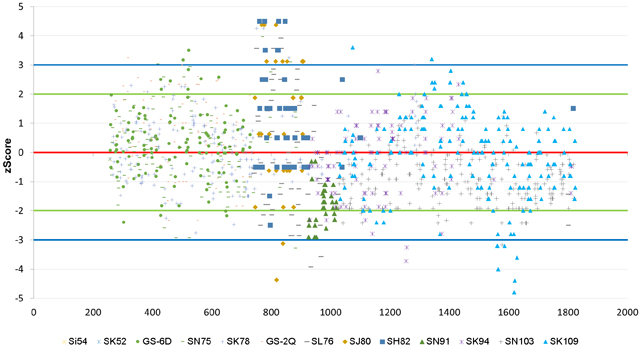
Figure 11-6: Jerritt Canyon Z-Score Chart of Surface CRM samples
Z-Score charts help view the performance of many standards simultaneously. CRMs can look to have poor results due to high or low results in reference to the expected value. The Z-Score charts presented indicate that overall, the CRMs are performing as expected and have a passing rate of 96%.
| First Majestic Silver Corp. | Jerritt Canyon Gold Mine, SLR Project No: 233.03396.R0000
| ||||
| NI 43-101 Technical Report - April 30, 2021 | 11-11 | |||
CRMs can return high or low biases regarding the certified value. The biases calculated for CRMs used are acceptable, except for SN91. SLR recommends investigating SN91 as it is still in circulation for mislabeled samples or if determined necessary, replacing this standard.
JCG properly identified failed standards and according to protocols, had the laboratory rerun the corresponding samples. No major bias trends were identified in the quarterly and annual reports.
While the Z-Score charts indicate some variation in the precision of the CRMs, overall analyses indicate that the standards are performing as expected. The variations observed in the precisions of the CRMs do not adversely affect the overall confidence in the assays.
The QP is of the opinion that the CRMs employed at JCG are appropriate for the type of mineralization and have overall been performing as expected. The QP is of the opinion that the insertion rates for CRMs meet industry standards.
SLR recommends ongoing monitoring of the QA/QC results. The QP is of the opinion that the results of the CRM samples support the use of the assays in the Mineral Resource estimation.
| 11.4.3 | Blank Material |
The regular submission of blank material is used to assess contamination during sample preparation and to identify sample numbering errors. The blank material utilized at Jerritt Canyon is a commercial grade sand. SLR analyzed and prepared charts depicting the performances of the underground and surface blank sample submissions, respectively. The QA/QC protocol accepts results returning up to 10 times the detection limit as a pass. Detection limits for the gold blanks are set at 0.002 oz/st Au.
A total of 40,361 blank samples were sent for analysis. Figure 11-7 and Figure 11-8 show the performances of the blank material. Results indicate a negligible amount of sample contamination and sample numbering errors associated with samples from Jerritt Canyon.
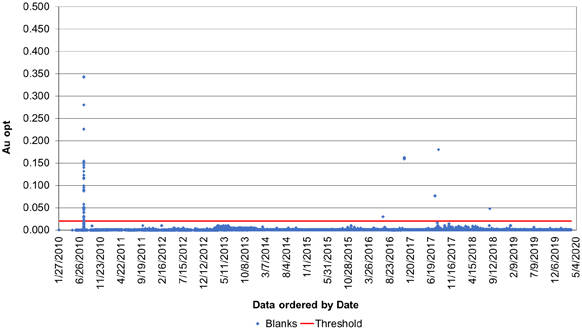
Figure 11-7: Jerritt Canyon Blank Results for Underground Samples
| First Majestic Silver Corp. | Jerritt Canyon Gold Mine, SLR Project No: 233.03396.R0000
| ||||
| NI 43-101 Technical Report - April 30, 2021 | 11-12 | |||
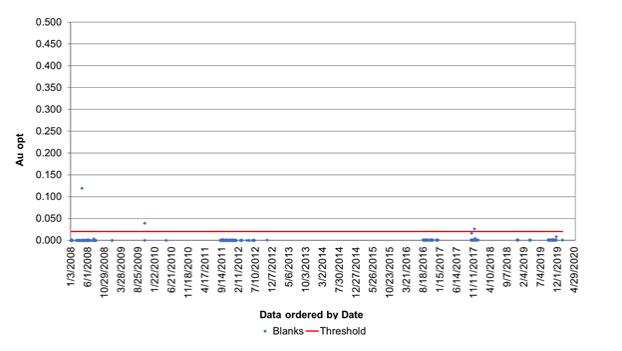
Figure 11-8: Jerritt Canyon Blank Results for Surface Samples
The plotted blank material indicates there are good protocols at the JCG assay laboratory to mitigate any contamination and produce reliable assays. SLR notes that the use of only sand material as a blank can be problematic in ensuring the crusher equipment is also properly cleaned between samples. SLR recommends replacing the blank sand material with a crushed barren rock type of blank material.
In the QP’s opinion, the performances of the blank materials support the use of associated assays for Mineral Resource estimation.
| 11.4.4 | Field, Coarse Reject, and Pulp Duplicates |
Duplicate samples help to monitor preparation and assay precision and grade variability as a function of sample homogeneity and laboratory error. The field duplicates include the natural variability of the original core and RC samples, as well as all levels of error including core and RC splitting, sample size reduction in the preparation laboratory, sub-sampling of the pulverized sample, and the analytical error. Coarse reject and pulp duplicates provide a measure of the sample homogeneity at different stages of the preparation process (crushing and pulverizing).
SLR re-analyzed the duplicate data compiled by JCG using basic statistics, scatter, quantile-quantile, and percent relative difference plots. Results are divided by the assaying facility. A total of 35,352 sample pairs were analyzed between field, coarse and pulp duplicates. Figure 11-9 through Figure 11-12 are selected duplicate results.
| First Majestic Silver Corp. | Jerritt Canyon Gold Mine, SLR Project No: 233.03396.R0000
| ||||
| NI 43-101 Technical Report - April 30, 2021 | 11-13 | |||
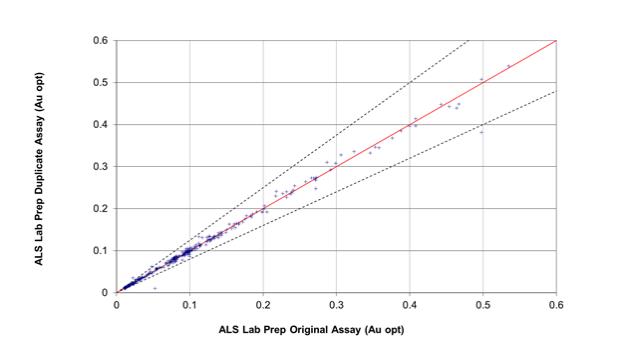
Figure 11-9: ALS Underground Coarse Reject Duplicates
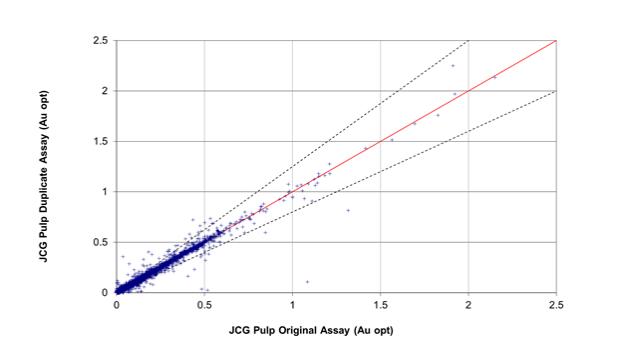
Figure 11-10: JCG Assay Laboratory Underground Pulp Duplicates
| First Majestic Silver Corp. | Jerritt Canyon Gold Mine, SLR Project No: 233.03396.R0000
| ||||
| NI 43-101 Technical Report - April 30, 2021 | 11-14 | |||
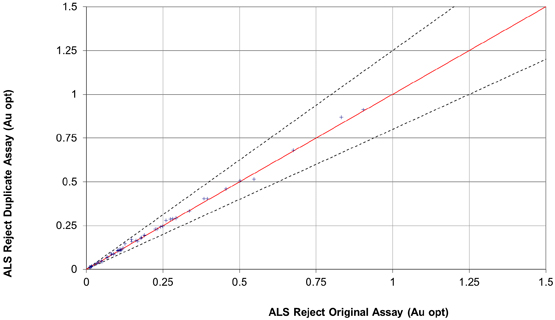
Figure 11-11: ALS Surface Coarse Reject Duplicates
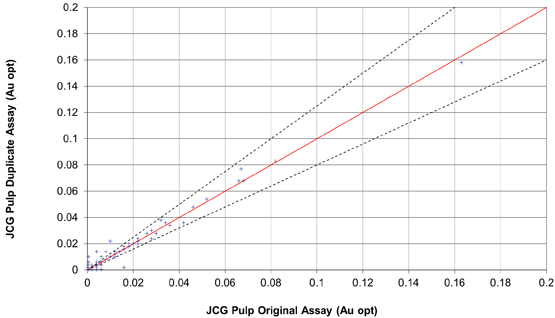
Figure 11-12: JCG Assay Laboratory Surface Pulp Duplicates
Overall, the results of the duplicate samples exhibit good correlation between field, coarse reject, and pulp duplicates for both underground and surface samples. Figure 11-9 graphs pulp duplicates and shows a large number of duplicates outside the 20% range of acceptability. This is due to the density of data
| First Majestic Silver Corp. | Jerritt Canyon Gold Mine, SLR Project No: 233.03396.R0000
| ||||
| NI 43-101 Technical Report - April 30, 2021 | 11-15 | |||
that is charted and does not indicate any systemic issues with the duplicate samples. The overall coefficient of correlation is 0.995.
The QP notes that the pulp duplicate submission rates meet industry standards. No field or coarse reject duplicates have been submitted since 2016.
The lack of field and coarse reject duplicates since 2016 does not adversely affect the accuracy and precision of the assays as Jerritt Canyon is an operating mine and the gold mineralization is generally very fine grained. Additionally, the pulp duplicate and coarse duplicate results show relatively good precision.
| 11.4.5 | External Checks |
As part of the QA/QC program, sample pulps were submitted to a secondary laboratory up until 2016. Check assays consist of submitting pulps that were assayed at the primary laboratory to a secondary laboratory and re-analyzing them using the same analytical procedures. This is done primarily to improve the assessment of bias in addition to the submission of CRMs submitted to the original laboratory.
Figure 11-13 plots 934 pulp sample pairs from the original JCG assay laboratory against the external ALS laboratory. The results show moderate variation in assay values and an overall 3% high bias towards the check assay laboratory.
Figure 11-14 is a Q-Q plot of the same samples pairs and confirms the bias towards the secondary assay laboratory.
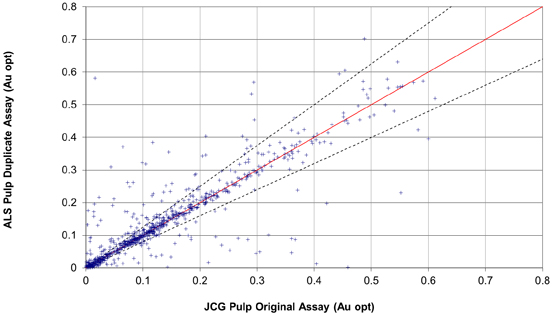
Figure 11-13: Scatter Plot of JCG versus ALS Pulp Duplicate Pairs
| First Majestic Silver Corp. | Jerritt Canyon Gold Mine, SLR Project No: 233.03396.R0000
| ||||
| NI 43-101 Technical Report - April 30, 2021 | 11-16 | |||
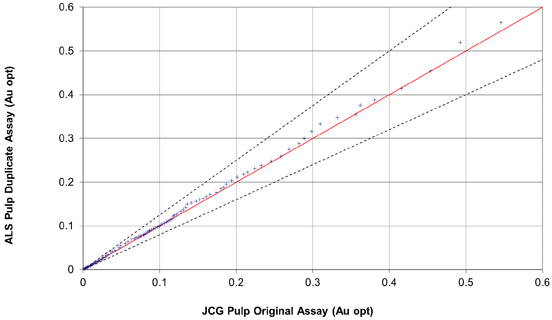
Figure 11-14: Q-Q plot of JCG versus ALS Pulp Duplicate Pairs
Overall, the check assays have moderate correlation with a correlation coefficient 0.86. A Q-Q plot of the pulp duplicates indicates that there is a minor bias towards the secondary lab.
External checks have not occurred at JCG since 2016. SLR recommends reimplementing the external checks for JCG and resuming the monitoring of results.
The QP is of the opinion that the results of the check assays at the external labs supports the use of the assays in the Mineral Resource estimation.
| 11.4.6 | QA/QC Conclusions |
The following conclusions are made from the review and analysis of QA/QC data collected for Jerritt Canyon from 2008 to 2020:
| · | The QA/QC program as designed and implemented is adequate and the assay results within the database are suitable to support Mineral Resource estimation. |
| · | The results of the CRM performances at Jerritt Canyon indicate good precision of samples assayed and a minor low bias of the results. The external check assay results confirm that the JCG assay laboratory may understate gold values by up to a few percent. |
| · | The results of the blank samples confirm that there is a low likelihood of grade smearing and contamination at the preparation laboratory. |
| · | Moderate to high precision is observed in the results of the coarse reject and pulp duplicate programs. |
| First Majestic Silver Corp. | Jerritt Canyon Gold Mine, SLR Project No: 233.03396.R0000
| ||||
| NI 43-101 Technical Report - April 30, 2021 | 11-17 | |||
| 11.4.7 | QA/QC Recommendations |
The following recommendations are made to improve the QA/QC program at Jerritt Canyon:
| · | Decrease the insertion rate of CRM to approximately 1 in 50. |
| · | Reimplement a check assay program to submit pulp samples to a secondary umpire laboratory at a rate of approximately 1 in 100. Insert blank and CRM samples at a rate of 1 in 20 with the check assay samples. |
| First Majestic Silver Corp. | Jerritt Canyon Gold Mine, SLR Project No: 233.03396.R0000
| ||||
| NI 43-101 Technical Report - April 30, 2021 | 11-18 | |||
| 12.0 | DATA VERIFICATION |
| 12.1 | Historical Database Verifications |
As of the data cut-off date, the underground drill hole databases contain 48,330 drill hole entries and the surface databases contain 6,431 entries. The databases represent approximately 39 years of exploration and almost continuous mining. Over the years, a number of evaluations, resource/reserve estimates, and audits have been carried out at Jerritt Canyon. In more recent years, Jerritt Canyon has been the subject of three NI 43-101 Technical Reports (Odell et al., 2012, Johnson et al., 2013 and RPA, 2018). Table 12-1 describes the previous years and companies which carried out the data verification.
None of the assay data produced after the data cut-off date has been used in the Mineral Resource estimate stated in Section 14 of this Technical Report. Notwithstanding, JCG has a history of following industry standard protocols for database management. The QP is of the opinion that these procedures and results will continue to be of good quality.
Table 12-1: Previous Database Audits
Jerritt Canyon
| Year | Company | |
| 1993 |
Behre Dolbear & Company Inc. | |
| 2000 |
Mineral Resources Development Inc. | |
| 2003 |
Pincock Allen & Holt | |
| 2004 |
Pincock Allen & Holt | |
| 2005 |
Pincock Allen & Holt | |
| 2006 |
SRK Consulting | |
| 2007 |
SRK Consulting | |
| 2010 |
SRK Consulting | |
| 2012 |
SRK Consulting | |
| 2013 |
Veris Gold Corp. | |
| 2018 |
RPA Inc. | |
| 12.2 | Recent Data Verification |
| 12.2.1 | Software Validation |
The QP carried out a program of validating the assay tables in the drill hole databases by means of spot checking a selection of drill holes that are used for the current Mineral Resource estimate.
The collar, survey, and assay tables were imported from acQuire into Leapfrog. Collars above the topography, suspect surveys, overlapping intervals and non-numerical assays were checked during importing. In addition, the QP conducted a search of the databases looking for duplicate sample numbers.
| First Majestic Silver Corp. | Jerritt Canyon Gold Mine, SLR Project No: 233.03396.R0000
| ||||
| NI 43-101 Technical Report - April 30, 2021 | 12-1 | |||
The assay table was evaluated for overlap and gaps in the from-to intervals, and seven gaps were identified. The logs for these holes were queried and, in all cases, it was determined that the gaps were consistent with the logs where the gap interval was recorded as “no sample”. There were no overlaps detected.
The from-to sample intervals were evaluated for gaps and overlap, and none were found. A total of 485 sample and assay entries in the database were compared with the original assay certificates and no errors were found.
The QP queried the years in the database for individual drilling campaigns and found that several drill holes did not have years associated with them or had years that are mislabeled. SLR recommends fixing these in the database to allow easy access to drill holes by years.
The QP notes that no other errors were identified.
| 12.2.2 | Database Verification |
The QP compared over 267,000 assays, representing approximately 15% of the database, to the laboratory certificates used for the Mineral Resource estimates. Assay tables of the digital database were checked against the assays presented in the original laboratory certificates. Approximately 80% of the assays checked represent drilling from 2018 to 2020, with the remaining 20% from previous drilling campaigns. Six discrepancies were identified. JCG has addressed the discrepancies appropriately.
| 12.2.3 | Database Conclusions and Recommendations |
The QP recommends updating and correcting the year associated with each drill hole.
The QP is of the opinion that data collection and entry, and database verification procedures for Jerritt Canyon comply with industry standards and the data is adequate for the purposes of Mineral Resource estimation.
| First Majestic Silver Corp. | Jerritt Canyon Gold Mine, SLR Project No: 233.03396.R0000
| ||||
| NI 43-101 Technical Report - April 30, 2021 | 12-2 | |||
| 13.0 | MINERAL PROCESSING AND METALLURGICAL TESTING |
Mining and processing by the Freeport-FMC JV commenced at Jerritt Canyon in 1981. The initial processing facility processed mildly refractory, carbonaceous, preg-robbing mineralized material. Alkaline chlorination was used to passivate the carbonaceous constituents of the mineralized material to reduce preg-robbing and cyanidation to extract the gold. The chlorination facility continued operation until 1997 (Marsden, 2006).
In 1989, operation of a whole ore roaster commenced to treat double refractory mineralized material that contained higher concentrations of sulfide sulfur in addition to organic carbon. Over the life of the Jerritt Canyon operation, numerous metallurgical studies have been completed, however, the current operating practice relies on historical operating data to support recovery estimates and anticipate future operating performance. The current life of mine (LOM) plan estimates an average gold average gold recovery of 86% independent of the changes in the gold feed grade. Table 13-1 presents the historical production, feed grade, ounces produced, and gold recovery for Jerritt Canyon.
Table 13-1: Annual Mill Production Data 1981 to 2020
Jerritt Canyon
| Year | Tons Processed (tons) |
Head Grade (oz/st Au) |
Contained Metal (oz Au) |
Au Recovery (%) |
Production (oz Au) | |||||
| 1981 |
333,768 | 0.080 | 26,701 | 87.0 | 23,000 | |||||
| 1982 |
1,241,940 | 0.180 | 223,549 | 87.0 | 196,100 | |||||
| 1983 |
1,093,200 | 0.277 | 302,816 | 86.5 | 261,900 | |||||
| 1984 |
1,206,600 | 0.220 | 265,452 | 91.2 | 243,100 | |||||
| 1985 |
1,284,500 | 0.220 | 282,590 | 89.2 | 255,400 | |||||
| 1986 |
1,339,200 | 0.227 | 303,998 | 87.4 | 269,600 | |||||
| 1987 |
1,512,400 | 0.215 | 325,166 | 91.8 | 315,900 | |||||
| 1988 |
1,574,500 | 0.212 | 333,794 | 91.5 | 310,100 | |||||
| 1989 |
1,825,800 | 0.178 | 324,992 | 89.8 | 236,700 | |||||
| 1990 |
2,513,500 | 0.148 | 371,998 | 88.0 | 329,800 | |||||
| 1991 |
2,882,200 | 0.147 | 423,683 | 88.7 | 374,400 | |||||
| 1992 |
2,952,120 | 0.132 | 389,680 | 89.3 | 353,300 | |||||
| 1993 |
3,024,390 | 0.126 | 381,073 | 89.6 | 340,200 | |||||
| 1994 |
3,006,870 | 0.122 | 366,838 | 85.6 | 323,400 | |||||
| 1995 |
2,945,915 | 0.129 | 380,023 | 86.1 | 327,900 | |||||
| 1996 |
2,667,593 | 0.130 | 346,787 | 88.0 | 310,000 | |||||
| 1997 |
1,539,561 | 0.220 | 338,703 | 91.0 | 320,000 | |||||
| 1998 |
1,484,445 | 0.250 | 371,111 | 91.0 | 350,000 | |||||
| 1999 |
1,609,374 | 0.250 | 402,344 | 91.0 | 363,333 | |||||
| First Majestic Silver Corp. | Jerritt Canyon Gold Mine, SLR Project No: 233.03396.R0000
| ||||
| NI 43-101 Technical Report - April 30, 2021 | 13-1 | |||
| Year | Tons Processed (tons) |
Head Grade (oz/st Au) |
Contained Metal (oz Au) |
Au Recovery (%) |
Production (oz Au) | |||||
| 2000 |
1,499,143 | 0.240 | 359,794 | 90.0 | 316,667 | |||||
| 2001 |
1,469,000 | 0.310 | 455,390 | 89.2 | 403,000 | |||||
| 2002 |
1,467,000 | 0.260 | 381,420 | 87.9 | 339,000 | |||||
| 2003 |
1,496,441 | 0.225 | 336,699 | 88.3 | 302,096 | |||||
| 2004 |
1,305,833 | 0.210 | 274,225 | 86.7 | 243,333 | |||||
| 2005 |
1,106,937 | 0.220 | 243,526 | 86.6 | 204,091 | |||||
| 2006 |
973,593 | 0.210 | 204,455 | 86.2 | 169,851 | |||||
| 2007 |
968,130 | 0.206 | 199,435 | 88.2 | 175,646 | |||||
| 2008 |
338,350 | 0.160 | 54,136 | 87.3 | 44,732 | |||||
| 2009 |
NP | NP | - | - | - | |||||
| 2010 |
599,555 | 0.123 | 73,745 | 88.2 | 65,104 | |||||
| 2011 |
628,418 | 0.142 | 89,235 | 85.8 | 67,748 | |||||
| 2012 |
978,262 | 0.130 | 127,174 | 82.7 | 105,626 | |||||
| 2013 |
1,084,131 | 0.154 | 166,956 | 85.5 | 139,556 | |||||
| 2014 |
1,106,524 | 0.166 | 183,683 | 87.8 | 160,451 | |||||
| 2015 |
1,158,585 | 0.173 | 200,049 | 85.5 | 172,591 | |||||
| 2016 |
1,191,674 | 0.144 | 171,333 | 85.4 | 140,989 | |||||
| 2017 |
1,143,530 | 0.135 | 154,187 | 83.9 | 129,335 | |||||
| 2018 |
1,214,349 | 0.136 | 165,670 | 85.7 | 141,963 | |||||
| 2019 |
883,582 | 0.154 | 135,736 | 85.5 | 116,060 | |||||
| 2020 |
826,234 | 0.160 | 131,831 | 85.5 | 112,750 | |||||
| Total |
57,477,147 | 0.179 | 10,269,798 | 88.2 | 9,040,661 | |||||
Figure 13-1 presents the historical gold grade-recovery relationship for three different time periods, 1) 1981 to 2020, 2)1989 to 2020 and 3) 1997 to 2020. The first period is inception to date, the second period begins when the roaster was commissioned, and the third period begins when chlorination was discontinued. SLR notes that the 1981 to 2020 and 1989 to 2020 lines are essentially the same. The 1997 to 2020 line indicates a slightly higher sensitivity of gold recovery to feed grade. SLR notes that the data are scattered and the correlations of the three lines are low suggesting that variables other than head grade, including sulfide sulfur, total organic carbon (TOC), and roaster performance contribute to changes in gold recovery.
| First Majestic Silver Corp. | Jerritt Canyon Gold Mine, SLR Project No: 233.03396.R0000
| ||||
| NI 43-101 Technical Report - April 30, 2021 | 13-2 | |||
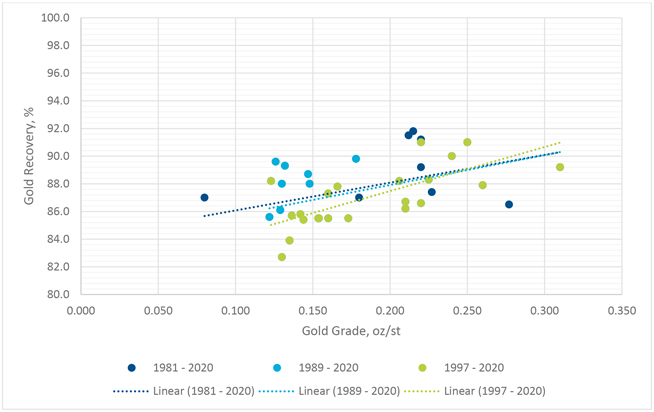
Figure 13-1: Historical Gold Feed Grade versus Recovery 1981 to 2020
Figure 13-2 is a statistical plot of the historical gold grade and recovery from 1981 to 2020. The chart indicates narrow ranges of gold feed grade and recovery. The gold feed grade ranges from a 25th percentile 0.142 oz/st Au to a 75th percentile 0.220 oz/st Au with an average gold grade of 0.183 oz/st Au. Gold recovery ranges from a 25th percentile 85.8% to a 75th percentile 89.3% with a weighted average recovery of 88.2%. SLR notes that the process operating data indicates very consistent plant feed and operational performance and, with the low correlation between grade and recovery, the use of near term historical averages would provide a reasonable gold recovery value for planning purposes. The operation is currently using a constant average gold recovery of 86% for the LOM plan and budget. The consistency in recovery could be affected by changes in mineralogical characteristics as new ore types are encountered in the future. SLR recommends that metallurgical testing be performed on the main ore types to provide more information for predicting plant performance.
| First Majestic Silver Corp. | Jerritt Canyon Gold Mine, SLR Project No: 233.03396.R0000
| ||||
| NI 43-101 Technical Report - April 30, 2021 | 13-3 | |||
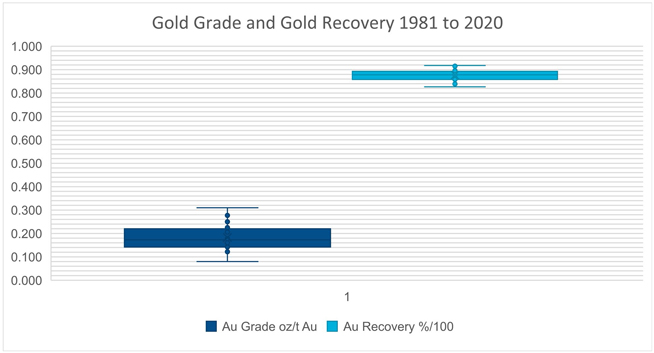
Figure 13-2: Plot of Historical Gold Grade and Recovery from 1981 to 2020
Table 13-2 provides the monthly mill production, gold feed grade and recovery for 2018, 2019, and 2020. Production during the three years varied from 48,849 st/month to 119,903 st/month in early 2018 with an average of 81,227 st/month over the three year period. Gold grade ranged from 0.120 oz/st Au to 0.189 oz/st Au with an average grade of 0.151 oz/st Au and recovery ranged from 82.2% to 87.6% with an average of 85.5% over the three year period.
Table 13-2: Monthly Mill Production Data 2018 to 2020
Jerritt Canyon
| Year | Month | Production (tons) |
Feed Grade (oz/st Au) |
Au Recovery (%) | ||||
| 2018 |
Jan | 119,903 | 0.120 | 83.5 | ||||
| Feb | 105,337 | 0.131 | 84.3 | |||||
| Mar | 95,980 | 0.141 | 85.7 | |||||
| Apr | 93,088 | 0.144 | 86.1 | |||||
| May | 113,239 | 0.141 | 85.8 | |||||
| Jun | 114,049 | 0.144 | 87.0 | |||||
| July | 112,968 | 0.147 | 87.6 | |||||
| Aug | 108,864 | 0.142 | 86.4 | |||||
| Sept | 99,890 | 0.133 | 85.8 | |||||
| Oct | 101,485 | 0.132 | 84.5 | |||||
| Nov | 64,629 | 0.139 | 85.4 | |||||
| First Majestic Silver Corp. | Jerritt Canyon Gold Mine, SLR Project No: 233.03396.R0000
| ||||
| NI 43-101 Technical Report - April 30, 2021 | 13-4 | |||
| Year | Month | Production (tons) |
Feed Grade (oz/st Au) |
Au Recovery (%) | ||||
| Dec | 84,917 | 0.123 | 85.2 | |||||
| Total | 1,214,349 | 0.136 | 85.7 | |||||
| 2019 |
Jan | 94,219 | 0.127 | 84.2 | ||||
| Feb | 69,465 | 0.131 | 84.6 | |||||
| Mar | 82,194 | 0.136 | 83.2 | |||||
| Apr | 82,473 | 0.129 | 85.2 | |||||
| May | 92,388 | 0.144 | 86.5 | |||||
| Jun | 74,916 | 0.163 | 86.8 | |||||
| July | 73,404 | 0.169 | 86.8 | |||||
| Aug | 69,556 | 0.176 | 85.6 | |||||
| Sept | 48,849 | 0.177 | 84.9 | |||||
| Oct | 67,248 | 0.177 | 85.0 | |||||
| Nov | 64,966 | 0.173 | 86.9 | |||||
| Dec | 63,904 | 0.169 | 85.6 | |||||
| Total | 883,582 | 0.154 | 85.5 | |||||
| 2020 |
Jan | 50,020 | 0.173 | 83.9 | ||||
| Feb | 68,827 | 0.178 | 85.4 | |||||
| Mar | 73,090 | 0.174 | 86.6 | |||||
| Apr | 69,135 | 0.189 | 85.4 | |||||
| May | 74,674 | 0.160 | 84.6 | |||||
| Jun | 81,695 | 0.157 | 86.0 | |||||
| July | 71,386 | 0.175 | 87.0 | |||||
| Aug | 73,141 | 0.151 | 86.2 | |||||
| Sept | 53,580 | 0.155 | 86.6 | |||||
| Oct | 68,921 | 0.147 | 86.0 | |||||
| Nov | 69,091 | 0.131 | 82.2 | |||||
| Dec | 72,674 | 0.129 | 85.4 | |||||
| Total | 826,234 | 0.160 | 85.5 | |||||
Figure 13-3 graphically presents the monthly mill throughput, gold feed grade and recovery for 2019 and 2020 illustrating the variance in these key performance indicators over the two year period.
| First Majestic Silver Corp. | Jerritt Canyon Gold Mine, SLR Project No: 233.03396.R0000
| ||||
| NI 43-101 Technical Report - April 30, 2021 | 13-5 | |||
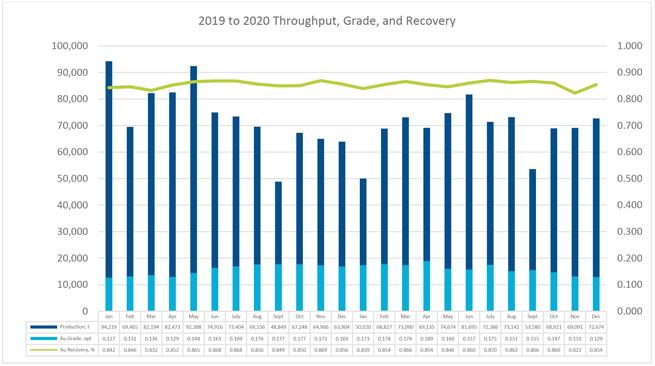
Figure 13-3: Monthly Mill Throughput, Feed Grade, and Recovery for 2019 to 2020
Figure 13-4 is a graph of the mill feed grade versus gold recovery for 2019 and 2020. As exhibited in Figure 13-1, while there is a variance in recovery with the feed grade, the correlation is low.
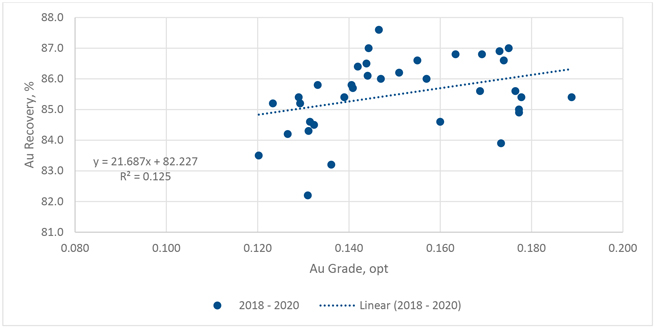
Figure 13-4: Mill Feed Grade versus Recovery for the Period 2019 to 2020
SLR recommends that JCG complete metallurgical testing of samples from the various mining sources that represent the current and future feed to the processing plant in order to develop more accurate estimates
| First Majestic Silver Corp. | Jerritt Canyon Gold Mine, SLR Project No: 233.03396.R0000
| ||||
| NI 43-101 Technical Report - April 30, 2021 | 13-6 | |||
for future gold recovery and to provide information to support the blending of plant feed with respect to sulfide sulfur, TOC concentrations and other variables that contribute to plant performance.
| First Majestic Silver Corp. | Jerritt Canyon Gold Mine, SLR Project No: 233.03396.R0000
| ||||
| NI 43-101 Technical Report - April 30, 2021 | 13-7 | |||
| 14.0 | MINERAL RESOURCE ESTIMATE |
| 14.1 | Summary |
Since the completion of the 2018 Mineral Resource estimate (RPA, 2018), JCG has conducted in-fill drilling programs from the surface and underground. These drilling programs have resulted in a total of 13,345 additional drill holes for a total length of approximately 2,930,162 ft. This new drill hole information has resulted in the creation of additional mineralized wireframe models for the Jerritt Canyon underground mines.
Wireframe and block modelling for the Jerritt Canyon deposits were completed by JCG Geologists and provided to SLR for review. A total of five deposits are the focus of this Mineral Resource estimate: Saval 4, Smith, SSX, USB, and WGen. Two deposits, Smith and SSX, consist of multiple domains. A total of 17 mineralized wireframe models were built for SSX Zone 1, SSX Zone 2-3, SSX Zone 4, SSX Zone 5, SSX Zone 6, SSX Zone 7, SSX Zone 9, Smith Zone 1, Smith Zone 2-3, Smith Zone 4, Smith Zone 5, Smith Zone 7, Smith Zone 8, Smith Zone 9, Saval 4, USB, and WGen. All wireframes are based on approximately a 0.10 oz/st Au threshold.
Visual examination of the assay tables related to the drill hole data revealed the presence of a large number of unsampled intervals within and abutting the boundaries of the interpreted mineralization wireframes. A value of 0.001 oz/st Au was entered for all such intervals with null values prior to the creation of composited assays. The resulting sample information for the drill holes was composited into nominal equal lengths of five feet within the mineralized boundaries using the run-length compositing algorithm in the Leapfrog Edge modelling software package.
JCG capped a number of high grade assays contained within the mineralized wireframe models. The composites for diamond drill holes and RC drill holes were capped to 1.8 oz/st Au during compositing. In total, 656 samples were capped at 1.8 oz/st Au, all of which are contained within the Smith and SSX deposits.
A total of 225,511 composited samples were used for grade interpolation between the five different Jerritt Canyon deposits. Composites with lengths below three feet were ignored, which constituted approximately 10% of total composites.
A total of 11 different block models were created from the 17 wireframe models. Parent block sizes for all models are 10 ft x 10 ft x 10 ft with sub-block sizes at 2.5 ft x 2.5 ft x 2.5 ft. One interpolation pass was carried out to estimate the grades into the separate block models. Gold grades were estimated into the blocks using Ordinary Kriging (OK) interpolation algorithm with Leapfrog Edge. Nearest Neighbor (NN) and Inverse Distance Cubed (ID3) estimations were used for model validation.
A 100 ft dilution zone was created around the mineralized wireframe models for all the block models. A single pass estimation strategy using ID3 was applied when estimating the grades for the dilution domain in the individual block models.
Block model validation exercises included a comparison of the average grade of the composite samples to the block average grades, visual comparisons of the estimated block grades to the composited gold grades, swath plots, and reconciliation to production statistics.
Cut-off grades were developed for reporting of underground Mineral Resources using a gold price of US$1,700/oz Au. The resource cut-off grade was determined to be 0.11 oz/st Au. The current operating cut-off grade is approximately 0.12 oz/st Au.
| First Majestic Silver Corp. | Jerritt Canyon Gold Mine, SLR Project No: 233.03396.R0000
| ||||
| NI 43-101 Technical Report - April 30, 2021 | 14-1 | |||
Summaries of the JCG Mineral Resources in Imperial and Metric units are provided in Table 14-1 and Table 14-2, respectively.
JCG provided underground excavation wireframes as of December 31, 2020. The cut-off date of the data informing the Mineral Resource estimate is April 29, 2020 for all the deposits.
Table 14-1: Summary of Mineral Resources (effective date December 31, 2020, Imperial Units)
Jerritt Canyon
| Category | Tonnage (000 tons) |
Grade (oz/st Au) |
Contained Metal (000 oz Au) | |||
| Measured |
4,811 | 0.159 | 767 | |||
| Indicated |
406 | 0.160 | 65 | |||
| Measured and Indicated |
5,217 | 0.160 | 832 | |||
|
Inferred |
1,950 | 0.171 | 334 | |||
Notes:
| 1. | Canadian Institute of Mining, Metallurgy and Petroleum (CIM) Definition and Standards for Mineral Resources and Mineral Reserves (CIM (2014) definitions) were followed for Mineral Resources. |
| 2. | Mineral Resources are exclusive of Mineral Reserves. |
| 3. | Mineral Resources are estimated using an average gold price of $1,700/oz Au. |
| 4. | Mineral Resources are constrained using minimum thickness mining shapes reflecting the geometries of cut and fill mining methods. |
| 5. | Mineral Resources are reported at a cut-off grade of 0.11 oz/st Au, accounting for mining costs of $102/st, milling costs of $45/st, general and administrative costs of $18/st, and a metal recovery of 86%. |
| 6. | Mineral Resources that are not Mineral Reserves do not have demonstrated economic viability. |
| 7. | Numbers may not add due to rounding. |
Table 14-2: Summary of Mineral Resources (effective date December 31, 2020, Metric Units)
Jerritt Canyon
| Category | Tonnage (000 t) |
Grade (g/t Au) |
Contained Metal (000 oz Au) | |||
| Measured |
4,365 | 5.47 | 767 | |||
| Indicated |
368 | 5.49 | 65 | |||
| Measured and Indicated | 4,733 | 5.47 | 832 | |||
| Inferred | 1,769 | 5.87 | 334 | |||
Notes:
| 1. | CIM (2014) definitions were followed for Mineral Resources. |
| 2. | Mineral Resources are exclusive of Mineral Reserves. |
| 3. | Mineral Resources are estimated using an average gold price of $1,700/oz Au. |
| 4. | Mineral Resources are constrained using minimum thickness mining shapes reflecting the geometries of cut and fill mining methods. |
| 5. | Mineral Resources are reported at a cut-off grade of 3.77 g/t Au, accounting for mining costs of $102/st, milling costs of $45/st, general and administrative costs of $18/st, and a metal recovery of 86%. |
| First Majestic Silver Corp. | Jerritt Canyon Gold Mine, SLR Project No: 233.03396.R0000
| ||||
| NI 43-101 Technical Report - April 30, 2021 | 14-2 | |||
| 6. | Mineral Resources that are not Mineral Reserves do not have demonstrated economic viability. |
| 7. | Numbers may not add due to rounding. |
The classification of Measured, Indicated, and Inferred Resources conforms to the 2014 “CIM Definition Standards for Mineral Resources and Mineral Reserves” using industry best practices as outlined in the 2019 “CIM Estimation of Mineral Resources and Mineral Reserves Best Practice Guidelines”.
The QP is not aware of any environmental, permitting, legal, title, taxation, socio-economic, marketing, political, or other relevant factors that could materially affect the Mineral Resource estimate aside from those identified in Section 20 of this Technical Report which are being mitigated by further work by JCG.
Risk factors that could materially impact the Mineral Resource estimate include:
| · | Metal price and exchange rate assumptions. |
| · | Changes in the interpretations of mineralization geometry and continuity of mineralized zones. |
| · | Changes to geotechnical, mining, and metallurgical recovery assumptions. |
| · | Changes to the assumptions related to the continued ability to access the site, retain mineral and surface right titles, maintain environment and other regulatory permits, and maintain the license to operate. |
| 14.2 | Topography |
Aerial topography mapping of the Jerritt Canyon property was conducted in July 2004 on five foot contour intervals and has been utilized as the base for the current models. Aerial Light Detection and Ranging (LiDAR) mapping of Jerritt Canyon on five foot contour line spacing was conducted by Aero-graphics Geospatial Services from August 29, 2011 to September 2, 2011 on square tiles 1,800 ft by 1,800 ft in size. Finer 0.5 ft LiDAR contour interval definition in the mill and tailings areas was also completed. Figure 14-1 shows the topography of the different Jerritt Canyon deposits.
| First Majestic Silver Corp. | Jerritt Canyon Gold Mine, SLR Project No: 233.03396.R0000
| ||||
| NI 43-101 Technical Report - April 30, 2021 | 14-3 | |||
Figure 14-1: Topographic Surface of Jerritt Canyon Deposits
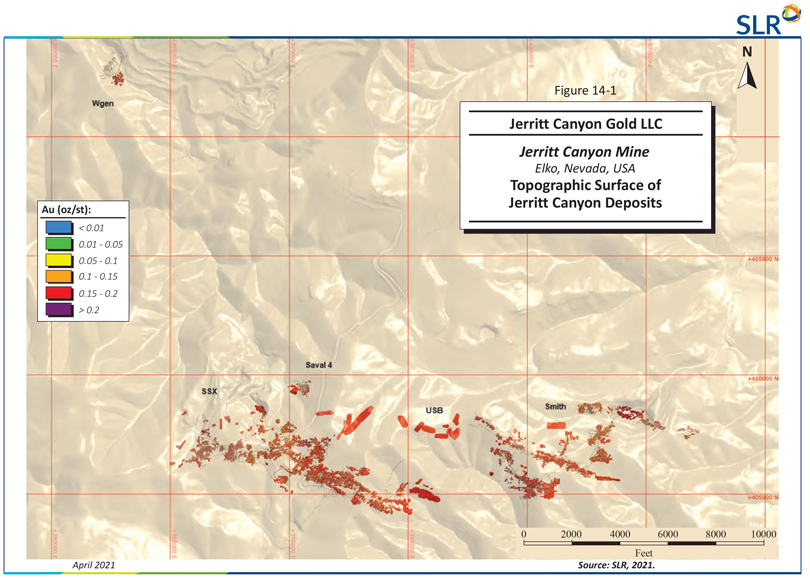
| First Majestic Silver Corp. | Jerritt Canyon Gold Mine, SLR Project No: 233.03396.R0000
| ||||
| NI 43-101 Technical Report - April 30, 2021 | 14-4 | |||
| 14.3 | Description of the Databases |
The drill hole database is stored in acQuire at Jerritt Canyon and consists of two parts: surface drilling, and underground and production drilling. The data cut-off date for the current resource block model was April 29, 2020 for all of the deposits. In total the database contained 54,761 drill holes with a total length of approximately 9,967,671 ft. The locations of the drill holes for the Jerritt Canyon deposits are shown in Figure 14-2. Table 14-3 describes the amount of drilling at each deposit.
Table 14-3: Drill Holes by Deposit
Jerritt Canyon
| Deposit | Holes |
Footage | ||
| Saval 4 |
537 | 159,186 | ||
| Smith |
20,273 | 3,756,920 | ||
| SSX |
31,488 | 4,935,615 | ||
| USB |
141 | 161,910 | ||
| WGen |
2,322 | 954,040 | ||
A summary of the database statistics is described in Table 14-4.
Table 14-4: Assay Statistics of Jerritt Canyon Deposits
Jerritt Canyon
| Deposit | Count | Min (oz/st Au) |
Max (oz/st Au) |
Mean (oz/st Au) |
Variance | StDev (oz/st Au) | ||||||
| SSX |
167,437 | 0.001 | 50.259 | 0.270 | 0.087 | 0.286 | ||||||
| Smith |
127,720 | 0.001 | 135.891 | 0.226 | 0.247 | 0.410 | ||||||
| Saval |
2,627 | 0.001 | 1.636 | 0.209 | 0.036 | 0.190 | ||||||
| USB |
80 | 0.001 | 0.910 | 0.142 | 0.018 | 0.135 | ||||||
| WGen |
582 | 0.001 | 0.910 | 0.197 | 0.020 | 0.142 | ||||||
| Total | 298,446 | 0.001 | 31.401 | 0.251 | 0.155 | 0.338 | ||||||
| First Majestic Silver Corp. | Jerritt Canyon Gold Mine, SLR Project No: 233.03396.R0000
| ||||
| NI 43-101 Technical Report - April 30, 2021 | 14-5 | |||
Figure 14-2: Drill Hole Locations, Jerritt Canyon
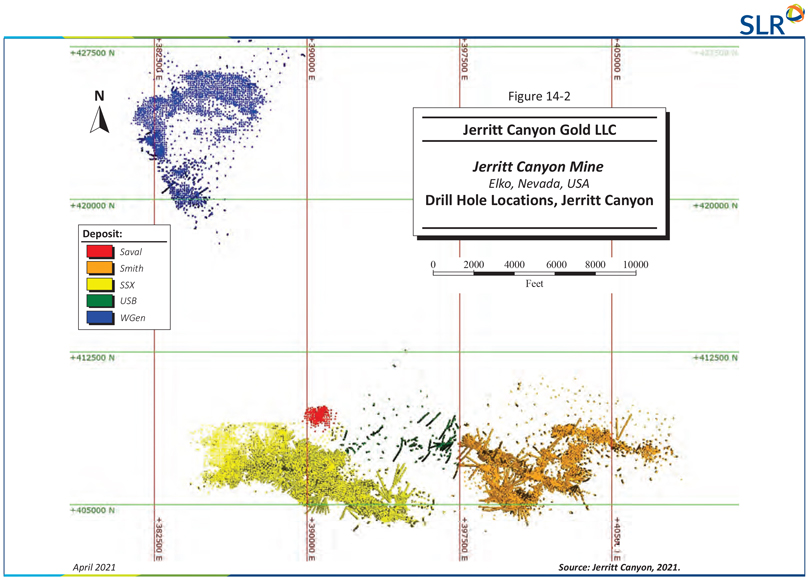
| First Majestic Silver Corp. | Jerritt Canyon Gold Mine, SLR Project No: 233.03396.R0000
| ||||
| NI 43-101 Technical Report - April 30, 2021 | 14-6 | |||
| 14.4 | Mineralization Wireframes |
Grade domains are commonly used in resource modelling to constrain similar grades and prevent grade smearing. JCG used Leapfrog to construct 0.10 oz/st Au mineralized domains for all five deposits. Wireframes were created using three methods: interpolants, veins, and numeric models.
In the interpolant approach, drill hole intersections above a 0.10 oz/st Au cut-off grade were selected to define the mineralized wireframes. This strategy was used to model Saval 4. In the vein method, Leapfrog interpolates hanging wall and footwall surfaces from the zones which have intersections above the 0.10 oz/st Au cut off. USB mineralization and some mineralization at Smith and SSX were developed following the Leapfrog vein construction method due to the wider drill spacing. The remaining mineralization at SSX and Smith, as well as all of WGen were modelled using a numeric indicator interpolant method in Leapfrog Geo creating wireframes with the probability to average higher than the 0.10 oz/st Au cut-off grade following stratigraphy and structural geology features as structural trends. SLR notes that the numeric model wireframes required some post processing adjustments.
Wireframes were grouped into 17 individual mineralized domains. Table 14-5 describes the statistics for the assays within each of the 17 domains used in resource estimation. Figure 14-3 through Figure 14-7 show the wireframes and their locations within the five deposits.
Table 14-5: Assay Statistics for Mineralized Wireframe Domains
Jerritt Canyon
| Domain | Count | Min (oz/st Au) |
Max (oz/st Au) |
Mean (oz/st Au) |
Variance | StDev (oz/st) | ||||||
|
1100-SSX-Zone1 |
14,341 | 0.001 | 5.60 | 0.252 | 0.06 | 0.25 | ||||||
| 1200-SSX-Zone2-3 |
89,577 | 0.001 | 50.26 | 0.307 | 0.12 | 0.35 | ||||||
|
1400-SSX-Zone4 |
7,621 | 0.001 | 1.99 | 0.192 | 0.02 | 0.15 | ||||||
|
1500-SSX-Zone5 |
28,005 | 0.000 | 2.25 | 0.221 | 0.03 | 0.19 | ||||||
|
1600-SSX-Zone6 |
2,120 | 0.001 | 2.34 | 0.250 | 0.07 | 0.26 | ||||||
|
1700-SSX-Zone7 |
25,595 | 0.001 | 7.42 | 0.232 | 0.05 | 0.23 | ||||||
|
1900-SSX-Zone9 |
178 | 0.001 | 1.07 | 0.208 | 0.02 | 0.15 | ||||||
| 2100-Smith-Zone1 |
14,249 | 0.000 | 1.63 | 0.197 | 0.03 | 0.16 | ||||||
| 2200-Smith-Zone2-3 |
39,899 | 0.000 | 7.19 | 0.245 | 0.09 | 0.31 | ||||||
| 2400-Smith-Zone4 |
29,682 | 0.001 | 135.89 | 0.195 | 0.83 | 0.91 | ||||||
| 2500-Smith-Zone5 |
9,775 | 0.001 | 3.12 | 0.176 | 0.02 | 0.13 | ||||||
| 2700-Smith-Zone7 |
13,838 | 0.000 | 3.34 | 0.257 | 0.07 | 0.26 | ||||||
| 2800-Smith-Zone8 |
13,999 | 0.001 | 4.39 | 0.242 | 0.09 | 0.29 | ||||||
| 2900-Smith-Zone9 |
6,278 | 0.001 | 4.64 | 0.287 | 0.08 | 0.28 | ||||||
| 3000-Saval 4 |
2,627 | 0.001 | 1.64 | 0.209 | 0.04 | 0.19 | ||||||
| 4000-USB |
80 | 0.001 | 0.91 | 0.142 | 0.02 | 0.14 | ||||||
|
5000-WGen |
582 | 0.001 | 0.91 | 0.197 | 0.02 | 0.14 | ||||||
| First Majestic Silver Corp. | Jerritt Canyon Gold Mine, SLR Project No: 233.03396.R0000
| ||||
| NI 43-101 Technical Report - April 30, 2021 | 14-7 | |||
Figure 14-3: SSX Wireframes
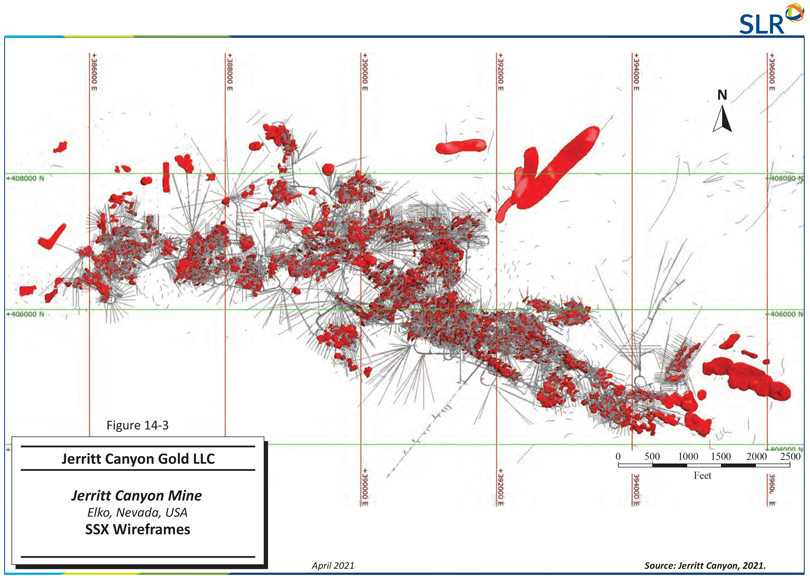
| First Majestic Silver Corp. | Jerritt Canyon Gold Mine, SLR Project No: 233.03396.R0000
| ||||
| NI 43-101 Technical Report - April 30, 2021 | 14-8 | |||
Figure 14-4: Smith Wireframes
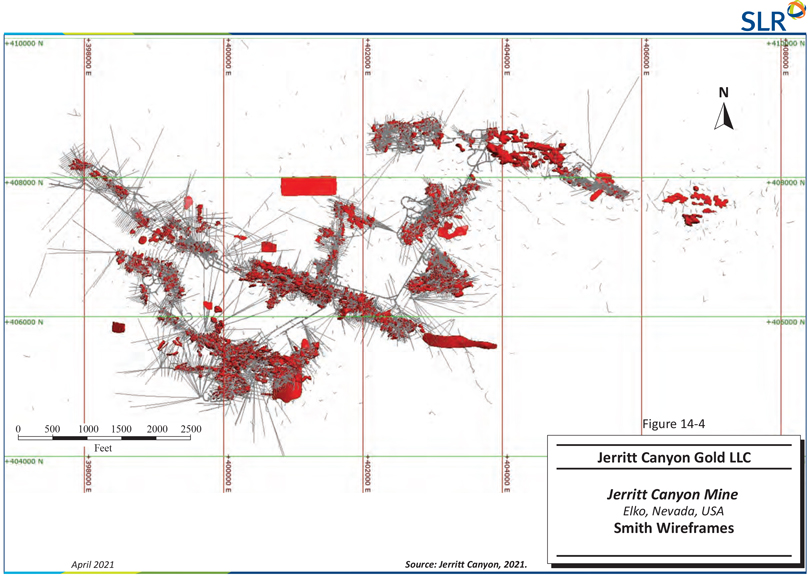
| First Majestic Silver Corp. | Jerritt Canyon Gold Mine, SLR Project No: 233.03396.R0000
| ||||
| NI 43-101 Technical Report - April 30, 2021 | 14-9 | |||
Figure 14-5: Saval 4 Wireframes
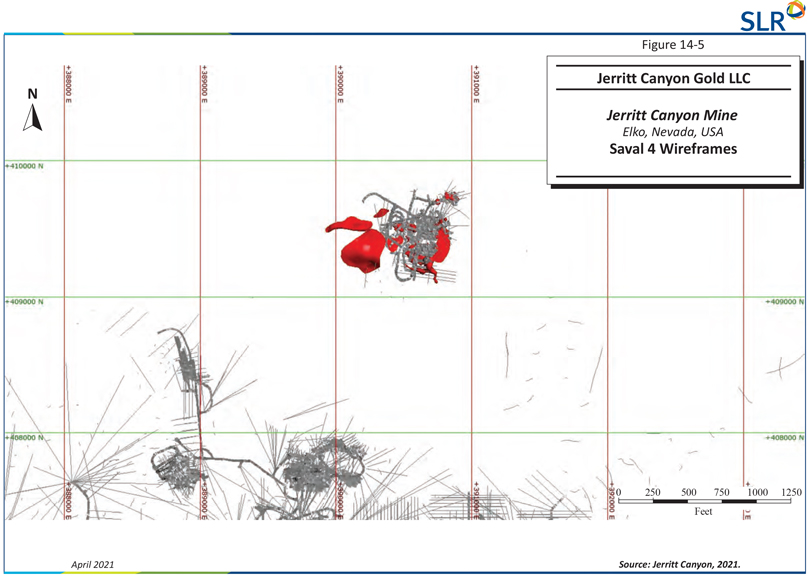
| First Majestic Silver Corp. | Jerritt Canyon Gold Mine, SLR Project No: 233.03396.R0000
| ||||
| NI 43-101 Technical Report - April 30, 2021 | 14-10 | |||
Figure 14-6: USB Wireframes
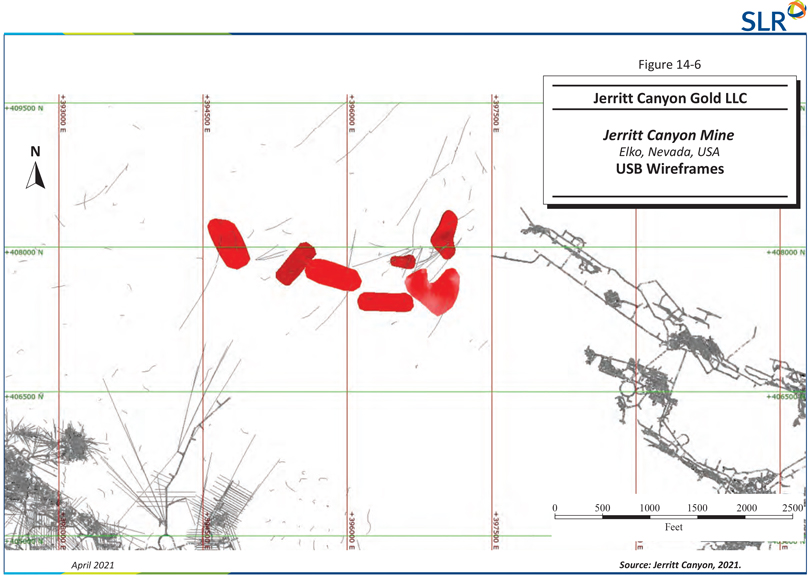
| First Majestic Silver Corp. | Jerritt Canyon Gold Mine, SLR Project No: 233.03396.R0000
| ||||
| NI 43-101 Technical Report - April 30, 2021 | 14-11 | |||
Figure 14-7: WGen Wireframes
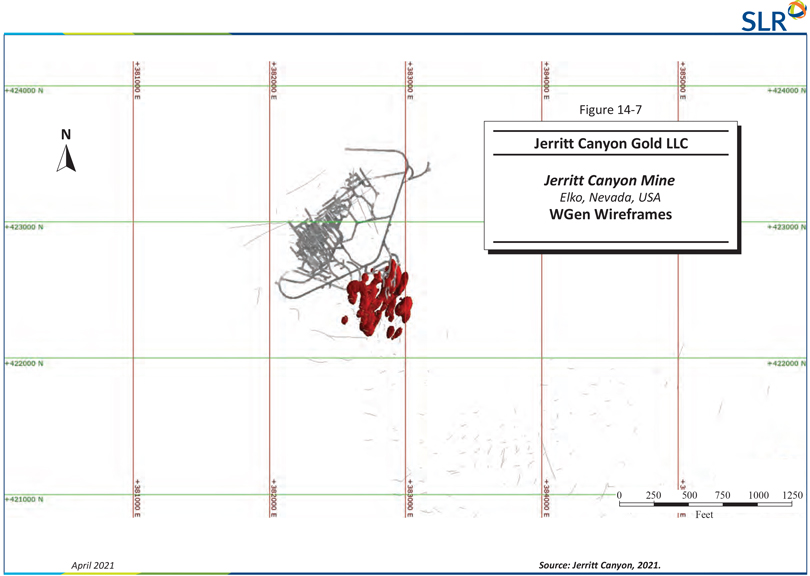
| First Majestic Silver Corp. | Jerritt Canyon Gold Mine, SLR Project No: 233.03396.R0000
| ||||
| NI 43-101 Technical Report - April 30, 2021 | 14-12 | |||
| 14.5 | Compositing Methods and Grade Capping |
Assay values were composited within each mineralized wireframe. Assays were composited into nominal equal lengths of five feet using the compositing algorithm of the Leapfrog Geo modelling software package. Composites less than three feet were discarded. Visual examination of the assay tables related to the diamond drill hole data revealed the presence of unsampled intervals within and adjacent to the interpreted mineralization wireframes. All unsampled intervals with null values were assigned 0.001 oz/st Au values prior to compositing.
Assay data was examined by means of frequency plots to determine an appropriate capping value. Figure 14-8 is an example of the log probability plot for Jerritt Canyon. The upper tail of the frequency plot indicates that high grade samples are not affecting the Jerritt Canyon deposits in a significant manner. Following inspection of log probability plots, JCG capped all high grade assays to 1.8 oz/st Au during compositing. The resulting composite statistics for each of the domains are given in Table 14-6.
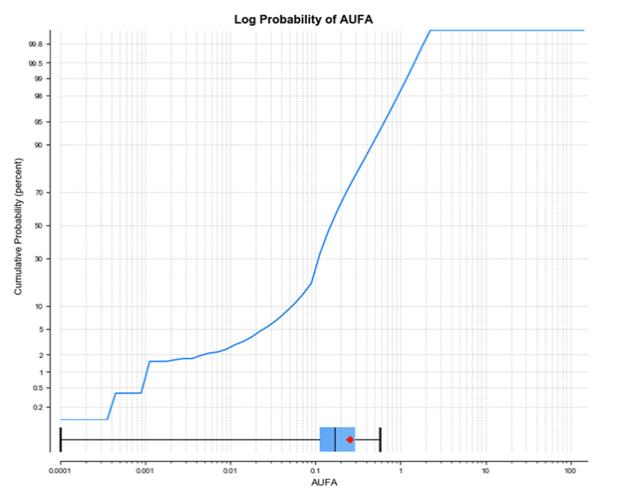
Figure 14-8: Jerritt Canyon Assay Log Probability
| First Majestic Silver Corp. | Jerritt Canyon Gold Mine, SLR Project No: 233.03396.R0000
| ||||
| NI 43-101 Technical Report - April 30, 2021 | 14-13 | |||
Table 14-6: Composite Statistics for Mineralized Wireframe Domains
Jerritt Canyon
| Domain | Count | Min (oz/st Au) |
Max (oz/st Au) |
Mean (oz/st Au) |
Variance | StDev (oz/st Au) | ||||||
|
1100-SSX-Zone1 |
10,127 | 0.001 | 1.800 | 0.263 | 0.023 | 0.232 | ||||||
| 1200-SSX-Zone2-3 |
70,328 | 0.001 | 1.800 | 0.315 | 0.065 | 0.338 | ||||||
|
1400-SSX-Zone4 |
4,998 | 0.001 | 1.573 | 0.199 | 0.031 | 0.135 | ||||||
|
1500-SSX-Zone5 |
19,225 | 0.001 | 1.800 | 0.230 | 0.013 | 0.172 | ||||||
|
1600-SSX-Zone6 |
1,298 | 0.001 | 1.800 | 0.264 | 0.055 | 0.239 | ||||||
|
1700-SSX-Zone7 |
17,597 | 0.001 | 1.800 | 0.241 | 0.061 | 0.216 | ||||||
|
1900-SSX-Zone9 |
125 | 0.043 | 0.763 | 0.216 | 0.060 | 0.139 | ||||||
| 2100-Smith-Zone1 |
10,702 | 0.001 | 1.543 | 0.202 | 0.052 | 0.153 | ||||||
| 2200-Smith-Zone2-3 |
32,871 | 0.001 | 1.800 | 0.246 | 0.074 | 0.294 | ||||||
| 2400-Smith-Zone4 |
22,561 | 0.001 | 1.800 | 0.191 | 0.018 | 0.937 | ||||||
| 2500-Smith-Zone5 |
7,643 | 0.001 | 1.800 | 0.180 | 0.029 | 0.120 | ||||||
| 2700-Smith-Zone7 |
10,250 | 0.001 | 1.800 | 0.264 | 0.054 | 0.241 | ||||||
| 2800-Smith-Zone8 |
10,081 | 0.001 | 1.800 | 0.246 | 0.043 | 0.282 | ||||||
| 2900-Smith-Zone9 |
4,803 | 0.001 | 1.800 | 0.293 | 0.019 | 0.255 | ||||||
| 3000-Saval 4 |
2,428 | 0.001 | 1.636 | 0.210 | 0.034 | 0.184 | ||||||
| 4000-USB |
80 | 0.001 | 0.910 | 0.142 | 0.018 | 0.135 | ||||||
| 5000-WGen |
394 | 0.006 | 0.748 | 0.205 | 0.016 | 0.127 | ||||||
| 14.6 | Bulk Density |
The tonnage factor used for the Jerritt Canyon deposits is 12.6 ft3/st, which is equivalent to the density of 0.0794 st/ft3. SLR notes that density has not been determined for different lithologies.
Tests, carried out in 2000 at the University of Nevada, Reno and ALS Chemex on 67 samples, defined the tonnage factor as 12.616 ft3/st. Zonge Engineering and Research of Tucson, Arizona tested 50 samples from Mahala and five samples from Steer. The testing resulted in average densities of 12.45 ft3/st for Mahala and 13.0 ft3/st for Steer.
In 2005, tests on 22 ore and 24 waste samples from Starvation Canyon resulted in an average tonnage factor of 11.8 ft3/st for ore and 12.2 ft3/st for waste samples.
| 14.7 | Variography |
For the purpose of variography, all samples in the Leapfrog interpolant wireframes were used, which include mined-out areas contained within the mineralized wireframes. Variograms were created for each of the individual domains using only the composites contained within the wireframes.
| First Majestic Silver Corp. | Jerritt Canyon Gold Mine, SLR Project No: 233.03396.R0000
| ||||
| NI 43-101 Technical Report - April 30, 2021 | 14-14 | |||
The variograms indicated relative nugget effects of between approximately 10% and 20% with most major ranges between approximately 50 ft and 80 ft. The variography analysis produced reliable variograms. Based on the results, JCG used OK methods to estimate gold grades into the block model. Table 14-7 presents the results of the experimental variography for each zone. Figure 14-9 shows an example of the major, semi-major, and minor direction variograms for SSX Zone 5.
| First Majestic Silver Corp. | Jerritt Canyon Gold Mine, SLR Project No: 233.03396.R0000
| ||||
| NI 43-101 Technical Report - April 30, 2021 | 14-15 | |||
Table 14-7: Variography Parameters
Jerritt Canyon
|
Deposit / Zones |
Rotation |
NE |
Structure 1 |
Structure 2 | ||||||||||||||||||||||||
| Dip |
Dip
|
Pitch | Model | Sill1 | Major (ft)
|
Semi (ft)
|
Minor (ft)
|
Model | Sill2 | Major (ft)
|
Semi (ft)
|
Minor (ft)
| ||||||||||||||||
| 2100-Smith- |
0 | 50 | 110 | 0.18 | Spherical | 0.54 | 20 | 13 | 10 | Spherical | 0.28 | 50 | 25 | 20 | ||||||||||||||
| 2200-Smith- |
10 | 110 | 90 | 0.15 | Spherical | 0.60 | 20 | 18 | 15 | Spherical | 0.25 | 70 | 40 | 20 | ||||||||||||||
| 2400-Smith- |
15 | 110 | 90 | 0.16 | Spherical | 0.64 | 20 | 18 | 15 | Spherical | 0.20 | 60 | 30 | 20 | ||||||||||||||
| 2500-Smith- |
20 | 140 | 90 | 0.20 | Spherical | 0.75 | 15 | 12 | 7 | Spherical | 0.05 | 35 | 20 | 10 | ||||||||||||||
| 2700-Smith- |
25 | 330 | 150 | 0.20 | Spherical | 0.30 | 20 | 5 | 3 | Spherical | 0.50 | 60 | 35 | 20 | ||||||||||||||
| 2800-Smith- |
0 | 50 | 70 | 0.18 | Spherical | 0.52 | 18 | 12 | 5 | Spherical | 0.30 | 50 | 30 | 15 | ||||||||||||||
| 2900-Smith- |
20 | 110 | 90 | 0.16 | Spherical | 0.46 | 13 | 10 | 5 | Spherical | 0.38 | 60 | 40 | 20 | ||||||||||||||
|
1100-SSX- |
27 | 145 | 50 | 0.20 | Spherical | 0.70 | 13 | 10 | 8 | Spherical | 0.10 | 20 | 15 | 10 | ||||||||||||||
|
1200-SSX- |
0 | 290 | 90 | 0.20 | Spherical | 0.60 | 15 | 10 | 5 | Spherical | 0.20 | 60 | 30 | 15 | ||||||||||||||
|
1400-SSX- |
10 | 110 | 70 | 0.20 | Spherical | 0.65 | 30 | 25 | 8 | Spherical | 0.15 | 70 | 50 | 20 | ||||||||||||||
| 1500-SSX- |
20 | 50 | 120 | 0.20 | Spherical | 0.65 | 17 | 15 | 12 | Spherical | 0.15 | 60 | 40 | 20 | ||||||||||||||
| First Majestic Silver Corp. | Jerritt Canyon Gold Mine, SLR Project No: 233.03396.R0000
| ||||
| NI 43-101 Technical Report - April 30, 2021 | 14-16 | |||
|
Deposit / Zones |
Rotation |
NE |
Structure 1 |
Structure 2 | ||||||||||||||||||||||||
| Dip |
Dip
|
Pitch | Model | Sill1 | Major (ft)
|
Semi (ft)
|
Minor (ft)
|
Model | Sill2 | Major (ft)
|
Semi (ft)
|
Minor (ft)
| ||||||||||||||||
|
1600-SSX- |
25 | 170 | 0 | 0.20 | Spherical | 0.45 | 20 | 15 | 10 | Spherical | 0.35 | 60 | 30 | 20 | ||||||||||||||
|
1700-SSX- |
10 | 110 | 110 | 0.20 | Spherical | 0.65 | 17 | 15 | 10 | Spherical | 0.15 | 60 | 25 | 15 | ||||||||||||||
|
1900-SSX- |
20 | 190 | 10 | 0.20 | Spherical | 0.60 | 15 | 10 | 5 | Spherical | 0.20 | 60 | 30 | 15 | ||||||||||||||
| Saval |
50 | 10 | 120 | 0.18 | Spherical | 0.66 | 6 | 4 | 3 | Spherical | 0.16 | 30 | 20 | 10 | ||||||||||||||
| USB |
0 | 110 | 90 | 0.20 | Spherical | 0.80 | 50 | 30 | 10 | - | - | - | - | - | ||||||||||||||
| WGen |
60 | 290 | 10 | 0.10 | Spherical | 0.70 | 30 | 15 | 5 | Spherical | 0.20 | 80 | 20 | 10 | ||||||||||||||
| First Majestic Silver Corp. | Jerritt Canyon Gold Mine, SLR Project No: 233.03396.R0000
| ||||
| NI 43-101 Technical Report - April 30, 2021 | 14-17 | |||
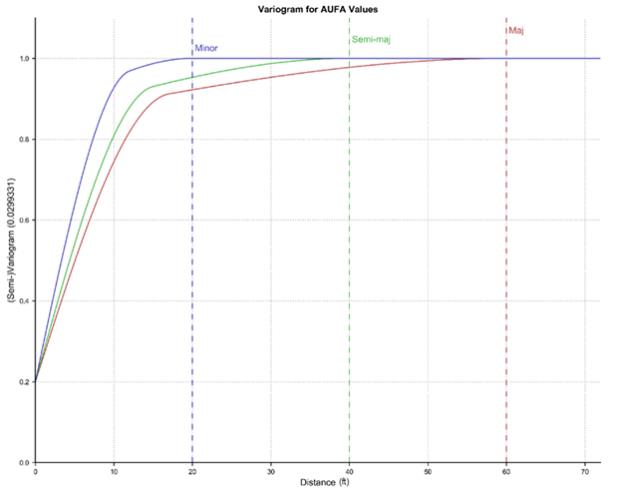
Figure 14-9: Variograms in Major, Semi-Major, and Minor Directions for SSX Zone 5
| 14.8 | Block Model Construction |
The 17 individual wireframe domains were used to create a total of 11 different block models. The models created are named as follows: Saval 4, Smith8, Smith9, Smith57, Smith1234, SSX4, SSX19, SSX57, SSX236, USB, and WGen. All models have parent block sizes of 10 ft x 10 ft x 10 ft and sub-block sizes at 2.5 ft x 2.5 ft x 2.5 ft.
The block models were constructed using the Leapfrog Edge software package and oriented parallel to the local grid coordinate system (i.e. no rotation or tilt). The block model’s origins and dimensions are provided in Table 14-8.
| First Majestic Silver Corp. | Jerritt Canyon Gold Mine, SLR Project No: 233.03396.R0000
| ||||
| NI 43-101 Technical Report - April 30, 2021 | 14-18 | |||
Table 14-8: Summary of the Block Model Origins and Block Sizes
Jerritt Canyon
| Type | X (Easting) | Y (Northing) | Z (Elevation) | |||
|
SSX 19 | ||||||
| Origin |
392,300 | 404,000 | 7,500 | |||
| Boundary Size (ft) |
4,160 | 2,310 | 1,300 | |||
| Min. Block Size (ft) |
2.5 | 2.5 | 2.5 | |||
| Maximum Block Size (ft) |
10 | 10 | 10 | |||
| SSX 236 | ||||||
| Origin |
389,220 | 404,820 | 7,600 | |||
| Boundary Size (ft) |
4,310 | 2,380 | 1,140 | |||
| Min. Block Size (ft) |
2.5 | 2.5 | 2.5 | |||
| Maximum Block Size (ft) |
10 | 10 | 10 | |||
| SSX 4 | ||||||
| Origin |
390,200 | 406,700 | 7,500 | |||
| Boundary Size (ft) |
3,400 | 2,100 | 900 | |||
| Min. Block Size (ft) |
2.5 | 2.5 | 2.5 | |||
| Maximum Block Size (ft) |
10 | 10 | 10 | |||
| SSX57 | ||||||
| Origin |
384,900 | 406,000 | 7,700 | |||
| Boundary Size (ft) |
5,670 | 2,800 | 950 | |||
| Min. Block Size (ft) |
2.5 | 2.5 | 2.5 | |||
| Maximum Block Size (ft) |
10 | 10 | 10 | |||
| Smith 1234 | ||||||
| Origin |
398,300 | 404,650 | 7,200 | |||
| Boundary Size (ft) |
5,700 | 2,550 | 1,200 | |||
| Min. Block Size (ft) |
2.5 | 2.5 | 2.5 | |||
|
Maximum Block Size (ft) |
10 | 10 | 10 | |||
| First Majestic Silver Corp. | Jerritt Canyon Gold Mine, SLR Project No: 233.03396.R0000
| ||||
| NI 43-101 Technical Report - April 30, 2021 | 14-19 | |||
| Type | X (Easting) | Y (Northing) | Z (Elevation) | |||
|
Smith 57 | ||||||
| Origin |
400,700 | 406,500 | 7,200 | |||
| Boundary Size (ft) |
3,100 | 2,400 | 800 | |||
| Min. Block Size (ft) |
2.5 | 2.5 | 2.5 | |||
| Maximum Block Size (ft) |
10 | 10 | 10 | |||
| Smith 8 | ||||||
| Origin |
397,700 | 406,070 | 7,100 | |||
| Boundary Size (ft) |
2,720 | 2,310 | 700 | |||
| Min. Block Size (ft) |
2.5 | 2.5 | 2.5 | |||
| Maximum Block Size (ft) |
10 | 10 | 10 | |||
| Smith 9 | ||||||
| Origin |
403,630 | 407,230 | 7,150 | |||
| Boundary Size (ft) |
3,690 | 1,570 | 1,090 | |||
| Min. Block Size (ft) |
2.5 | 2.5 | 2.5 | |||
| Maximum Block Size (ft) |
10 | 10 | 10 | |||
| Saval 4 | ||||||
| Origin |
389,800 | 409,030 | 7,360 | |||
| Boundary Size (ft) |
1,200 | 800 | 600 | |||
| Min. Block Size (ft) |
2.5 | 2.5 | 2.5 | |||
| Maximum Block Size (ft) |
10 | 10 | 10 | |||
| USB | ||||||
| Origin |
394,400 | 407,200 | 7,250 | |||
| Boundary Size (ft) |
2,900 | 1,300 | 750 | |||
| Min. Block Size (ft) |
2.5 | 2.5 | 2.5 | |||
| Maximum Block Size (ft) |
10 | 10 | 10 | |||
| First Majestic Silver Corp. | Jerritt Canyon Gold Mine, SLR Project No: 233.03396.R0000
| ||||
| NI 43-101 Technical Report - April 30, 2021 | 14-20 | |||
| Type | X(Easting) | Y(Northing) | Z(Elevation) | |||
| WGen | ||||||
| Origin |
382,400 | 422,000 | 6,660 | |||
| Boundary Size |
750 | 800 | 410 | |||
| Min. Block Size (ft) |
2.5 | 2.5 | 2.5 | |||
| Maximum Block Size (ft) |
10 | 10 | 10 | |||
| 14.9 | Interpolation Strategy |
Gold grades were estimated into the block models using the Leapfrog Edge OK interpolation algorithm. One interpolation pass was carried out to estimate the grades for each domain. The search ellipsoid radii are based on the variogram anisotropies and the distances were long enough to ensure gold grades were estimated in most of the blocks located in mineralization wireframes. Domains with sparse drilling required longer search radii, which are shown under the adjusted domain column of Table 14-9. The estimations were organized by domain and each wireframe was estimated with the corresponding composites located within the wireframe. JCG employed Leapfrog Variable Orientation for the ellipsoid orientation. This allows the search ellipse to follow trends seen within the deposits. Figure 14-10 is an example of the Smith Zone 9 variable ellipsoid orientation with respect to the wireframe. The white dashes indicate the orientation for that particular area.
Table 14-9: Search Ellipsoid Radii
Jerritt Canyon
| Domain | Search Ellipse | Adjusted Domains | ||||||||||
| Major (ft) |
Semi-Major (ft) |
Minor (ft) |
Major (ft) |
Semi-Major (ft) |
Minor (ft) | |||||||
| 2100-Smith-Zone1 |
150 | 75 | 60 | - | - | - | ||||||
|
2200-Smith-Zone2-3 |
210 | 120 | 60 | - | - | - | ||||||
| 2400-Smith-Zone4 |
240 | 120 | 80 | - | - | - | ||||||
| 2500-Smith-Zone5 |
140 | 80 | 40 | 350 | 200 | 100 | ||||||
| 2700-Smith-Zone7 |
180 | 105 | 60 | 600 | 350 | 200 | ||||||
| 2800-Smith-Zone8 |
200 | 120 | 60 | - | - | - | ||||||
| 2900-Smith-Zone9 |
240 | 160 | 80 | - | - | - | ||||||
| 1100-SSX-Zone1 |
200 | 150 | 100 | |||||||||
| 1200-SSX-Zone2-3 |
240 | 120 | 60 | - | - | - | ||||||
| 1400-SSX-Zone4 |
280 | 200 | 80 | 700 | 500 | 200 | ||||||
| 1500-SSX-Zone5 |
240 | 160 | 80 | - | - | - | ||||||
| 1600-SSX-Zone6 |
240 | 120 | 80 | - | - | - | ||||||
| 1700-SSX-Zone7 |
240 | 100 | 60 | - | - | - | ||||||
| 1900-SSX-Zone9 |
360 | 180 | 90 | - | - | - | ||||||
| Saval |
120 | 80 | 40 | - | - | - | ||||||
| USB |
500 | 300 | 100 | - | - | - | ||||||
| WGen |
320 | 80 | 40 | - | - | - | ||||||
|
First Majestic Silver Corp. | Jerritt Canyon Gold Mine, SLR Project No: 233.03396.R0000
NI 43-101 Technical Report - April 30, 2021 14-21 |
Figure 14-10: SSX Zone 2-3 Variable Ellipsoid Orientation
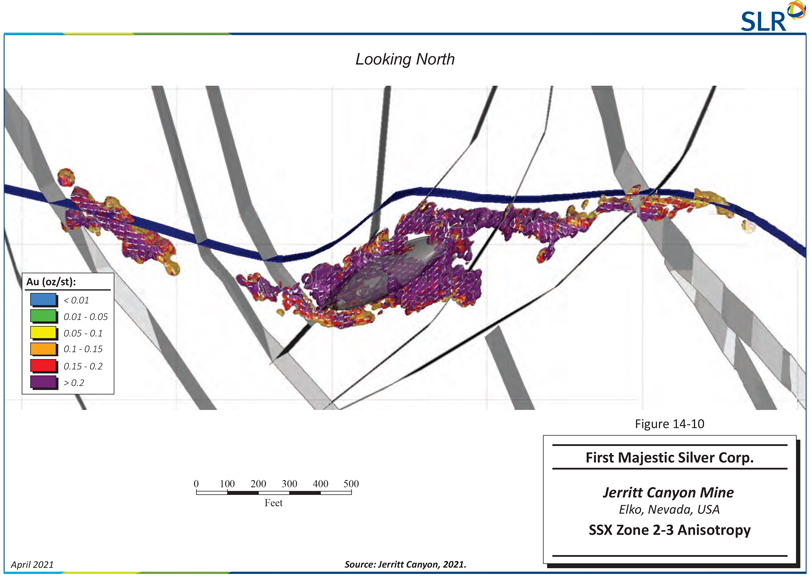
| First Majestic Silver Corp. | Jerritt Canyon Gold Mine, SLR Project No: 233.03396.R0000
| ||||
| NI 43-101 Technical Report - April 30, 2021 | 14-22 | |||
| 14.10 | Block Model Validation |
SLR validated the block model results using the following methods:
| · | Swath plots of composite grades versus block grades in the X, Y, and Z directions. Figure 14-11 to Figure 14-13 are examples of the swath plots for block model SSX 19. |
| · | Volumetric comparison of blocks versus wireframes (Table 14-10). |
| · | Visual inspection of block versus composite grades on plan, vertical, and longitudinal section. Figure 14-14 to Figure 14-16 provide cross sections of the SSX, Smith, and Saval 4 deposits. |
| · | Parallel secondary estimations using ID3 and NN. |
| · | Statistical comparison of block grades with composite grades (Table 14-11). |
The Swath plots support that the block grades were reasonably consistent with local drill hole composite grades.
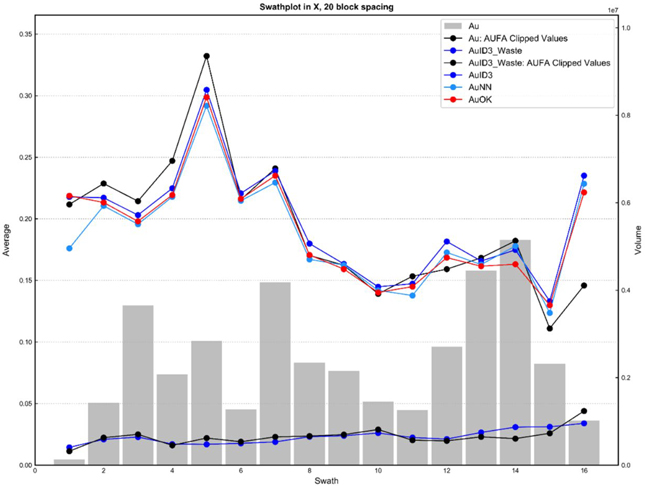
Figure 14-11: East West (x) Swath Plot SSX 19
| First Majestic Silver Corp. | Jerritt Canyon Gold Mine, SLR Project No: 233.03396.R0000
| ||||
| NI 43-101 Technical Report - April 30, 2021 | 14-23 | |||
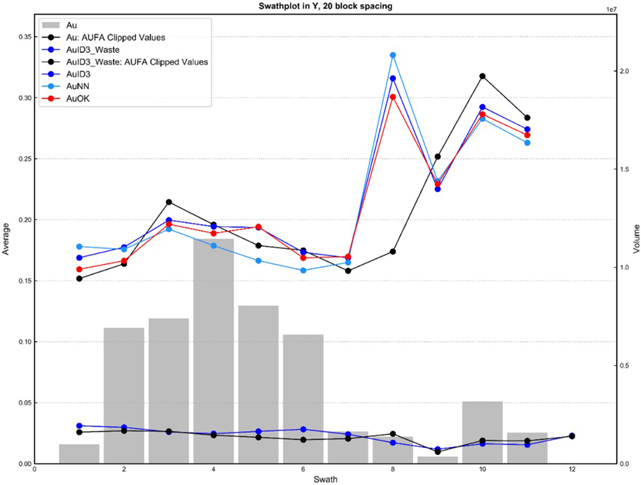
Figure 14-12: North South (Y) Swath Plot SSX 19
| First Majestic Silver Corp. | Jerritt Canyon Gold Mine, SLR Project No: 233.03396.R0000
| ||||
| NI 43-101 Technical Report - April 30, 2021 | 14-24 | |||
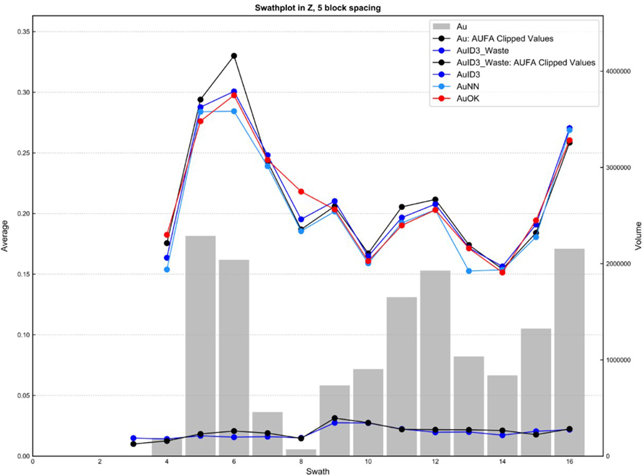
Figure 14-13: Vertical (Z) Swath Plot SSX 19
| 14.10.1 | Volume Comparison |
Wireframe volumes were compared to block volumes for each zone at Jerritt Canyon. This comparison is summarized in Table 14-10 and the results indicate that there is good agreement between the wireframe volumes and block model volumes with the difference being less than 0.1%.
Table 14-10: Block Model Versus Wireframe Volume Comparisons
Jerritt Canyon
| Domain | Wireframe Volume (ft3) |
Block Model Volume (ft3) |
Difference (%) | |||
| 1100-SSX-Zone1 |
35,546,625 | 35,550,450 | -0.01% | |||
| 1200-SSX-Zone2-3 |
107,300,797 | 107,311,857 | -0.01% | |||
| 1400-SSX-Zone4 |
27,509,797 | 27,510,561 | 0.00% | |||
| 1500-SSX-Zone5 |
46,910,469 | 46,919,541 | -0.02% | |||
| 1600-SSX-Zone6 |
4,554,672 | 4,554,460 | 0.00% | |||
| First Majestic Silver Corp. | Jerritt Canyon Gold Mine, SLR Project No: 233.03396.R0000
| ||||
| NI 43-101 Technical Report - April 30, 2021 | 14-25 | |||
| Domain | Wireframe Volume (ft3) |
Block Model Volume (ft3) |
Difference (%) | |||
|
1700-SSX-Zone7 |
36,200,453 | 36,202,681 | -0.01% | |||
|
1900-SSX-Zone9 |
13,965,766 | 13,971,578 | -0.04% | |||
| 2100-Smith-Zone1 |
14,400,531 | 14,404,070 | -0.02% | |||
| 2200-Smith-Zone2-3 |
45,217,656 | 45,221,947 | -0.01% | |||
| 2400-Smith-Zone4 |
52,272,734 | 52,313,333 | -0.08% | |||
| 2500-Smith-Zone5 |
12,115,563 | 12,113,705 | 0.02% | |||
| 2700-Smith-Zone7 |
16,879,703 | 16,878,600 | 0.01% | |||
| 2800-Smith-Zone8 |
19,356,281 | 19,356,216 | 0.00% | |||
| 2900-Smith-Zone9 |
24,557,391 | 24,557,766 | 0.00% | |||
| 3000-Saval 4 |
5,117,313 | 5,119,140 | -0.04% | |||
| 4000-USB |
10,748,422 | 10,746,353 | 0.02% | |||
| 5000-WGen |
6,591,938 | 6,592,722 | -0.01% | |||
| Total |
479,246,109 | 479,324,980 | -0.02% | |||
14.10.2 Visual Comparisons
Block grades were visually compared with drill hole composites on cross-sections, longitudinal sections, and level plan views. SLR notes that the block grades and composite grades correlate very well visually within the individual deposits. Figure 14-14 through Figure 14-16 are cross sections of the SSX, Smith, and Saval 4 deposits, respectively.
|
First Majestic Silver Corp. | Jerritt Canyon Gold Mine, SLR Project No: 233.03396.R0000
NI 43-101 Technical Report - April 30, 2021 14-26 |
Figure 14-14: Cross Section SSX
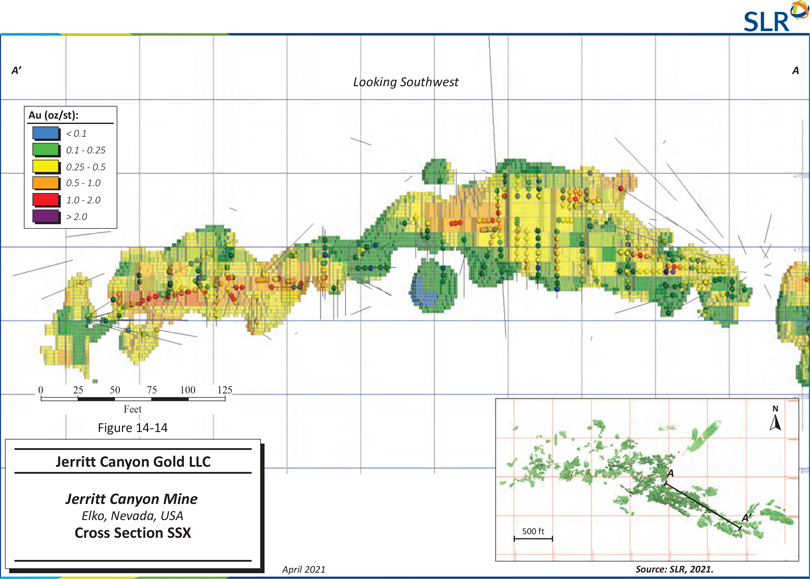
| First Majestic Silver Corp. | Jerritt Canyon Gold Mine, SLR Project No: 233.03396.R0000
| ||||
| NI 43-101 Technical Report - April 30, 2021 | 14-27 | |||
Figure 14-15: Cross Section Smith
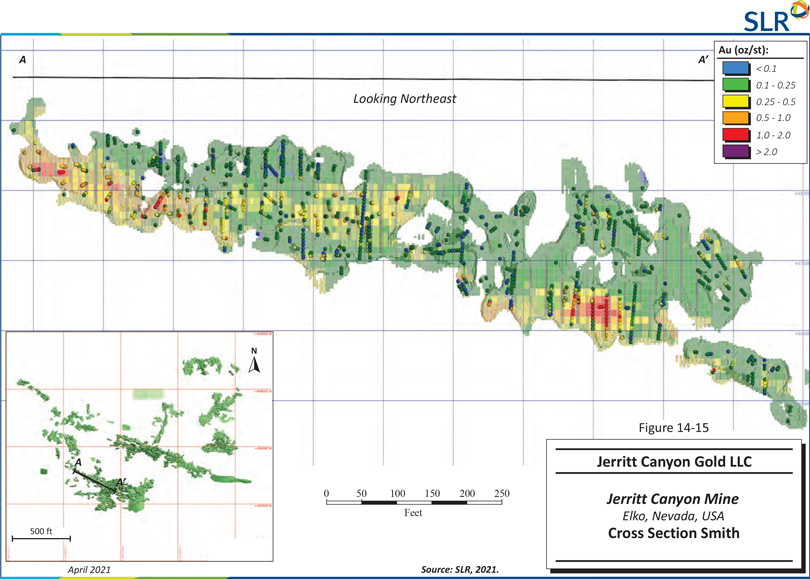
| First Majestic Silver Corp. | Jerritt Canyon Gold Mine, SLR Project No: 233.03396.R0000
| ||||
| NI 43-101 Technical Report - April 30, 2021 | 14-28 | |||
Figure 14-16: Cross Section Saval 4
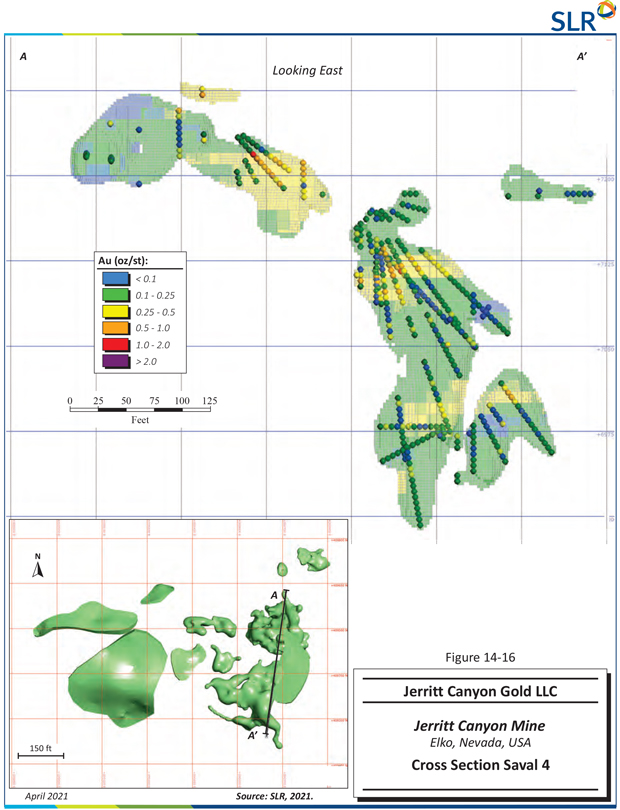
| First Majestic Silver Corp. | Jerritt Canyon Gold Mine, SLR Project No: 233.03396.R0000
| ||||
| NI 43-101 Technical Report - April 30, 2021 | 14-29 | |||
14.10.3 Statistical Comparison of Composites versus Block Model
Statistics of the block grades were compared with statistics of composite grades in Table 14-11 for all blocks and composites within the Jerritt Canyon domains.
| First Majestic Silver Corp. | Jerritt Canyon Gold Mine, SLR Project No: 233.03396.R0000
| ||||
| NI 43-101 Technical Report - April 30, 2021 | 14-30 | |||
Table 14-11: Statistics of Composite Grades Versus Block Grades
Jerritt Canyon
| Domain | Composites (oz/st Au) |
Block Model (oz/st Au) | ||||||||||||||||||||||
| Count | Mean | Minimum | Maximum | Variance | StDev | #Blocks | Mean | Minimum | Maximum | Variance | StDev | |||||||||||||
| SSX-Zone1 |
10,127 | 0.265 | 0.001 | 3.995 | 0.054 | 0.232 | 1,439,611 | 0.192 | 0.025 | 1.185 | 0.009 | 0.093 | ||||||||||||
|
SSX-Zone2-3 |
70,328 | 0.319 | 0.001 | 50.259 | 0.114 | 0.338 | 4,171,545 | 0.259 | 0.022 | 1.505 | 0.019 | 0.139 | ||||||||||||
| SSX-Zone4 |
4,998 | 0.200 | 0.001 | 1.573 | 0.018 | 0.135 | 1,134,285 | 0.129 | 0.012 | 0.865 | 0.005 | 0.069 | ||||||||||||
| SSX-Zone5 |
19,225 | 0.232 | 0.001 | 2.246 | 0.030 | 0.172 | 2,083,492 | 0.215 | 0.013 | 1.220 | 0.008 | 0.089 | ||||||||||||
| SSX-Zone6 |
1,298 | 0.266 | 0.001 | 2.335 | 0.057 | 0.239 | 224,530 | 0.226 | 0.057 | 1.218 | 0.016 | 0.128 | ||||||||||||
| SSX-Zone7 |
17,597 | 0.243 | 0.001 | 5.953 | 0.047 | 0.216 | 1,717,013 | 0.219 | 0.001 | 1.435 | 0.011 | 0.106 | ||||||||||||
| SSX-Zone9 |
125 | 0.216 | 0.043 | 0.763 | 0.019 | 0.139 | 467,678 | 0.205 | 0.007 | 0.612 | 0.008 | 0.088 | ||||||||||||
| Smith-Zone1 |
10,702 | 0.203 | 0.001 | 1.543 | 0.024 | 0.153 | 622,136 | 0.185 | 0.046 | 0.911 | 0.005 | 0.072 | ||||||||||||
| Smith-Zone2-3 |
32,871 | 0.252 | 0.000 | 7.190 | 0.086 | 0.294 | 1,792,568 | 0.215 | 0.002 | 1.625 | 0.020 | 0.143 | ||||||||||||
| Smith-Zone4 |
22,561 | 0.201 | 0.001 | 135.891 | 0.879 | 0.937 | 2,053,145 | 0.180 | 0.001 | 1.740 | 0.011 | 0.105 | ||||||||||||
| Smith-Zone5 |
7,643 | 0.181 | 0.000 | 3.116 | 0.014 | 0.120 | 497,191 | 0.171 | 0.047 | 1.027 | 0.003 | 0.055 | ||||||||||||
| Smith-Zone7 |
10,250 | 0.267 | 0.000 | 3.260 | 0.058 | 0.241 | 792,707 | 0.239 | 0.067 | 1.203 | 0.017 | 0.130 | ||||||||||||
| Smith-Zone8 |
10,081 | 0.252 | 0.001 | 4.393 | 0.079 | 0.282 | 851,480 | 0.228 | 0.035 | 1.475 | 0.014 | 0.116 | ||||||||||||
| Smith-Zone9 |
4,803 | 0.296 | 0.001 | 3.993 | 0.065 | 0.255 | 809,816 | 0.288 | 0.005 | 1.260 | 0.019 | 0.139 | ||||||||||||
| Saval 4 |
2,428 | 0.211 | 0.001 | 1.636 | 0.034 | 0.184 | 205,163 | 0.199 | 0.009 | 0.823 | 0.007 | 0.086 | ||||||||||||
| USB |
80 | 0.142 | 0.001 | 0.910 | 0.018 | 0.135 | 559,633 | 0.122 | 0.050 | 0.513 | 0.003 | 0.056 | ||||||||||||
| WGen |
394 | 0.205 | 0.006 | 0.748 | 0.016 | 0.127 | 247,248 | 0.188 | 0.060 | 0.647 | 0.005 | 0.072 | ||||||||||||
Note:
| 1. | Block counts are represented by subblocks. |
| First Majestic Silver Corp. | Jerritt Canyon Gold Mine, SLR Project No: 233.03396.R0000
| ||||
| NI 43-101 Technical Report - April 30, 2021 | 14-31 | |||
14.10.4 Secondary Estimation Comparison
As a secondary parallel estimation validation, JCG completed NN and ID3 estimates. The secondary estimations are within 2% of the OK estimation. Table 14-12 compares the composite grades with the block grades of the OK, ID3, and NN estimates.
Table 14-12: Statistics of Secondary Estimation Check
Jerritt Canyon
| Composites
|
Block Model
| |||||||||||
| Domain | # Composites | Composite Grade
|
# Blocks | OK (oz/st Au) |
ID3 (oz/st Au) |
NN (oz/st Au) | ||||||
| SSX-Zone1 |
10,127 | 0.263 | 222,912 | 0.192 | 0.199 | 0.193 | ||||||
|
SSX-Zone2-3 |
70,328 | 0.315 | 761,726 | 0.259 | 0.264 | 0.259 | ||||||
| SSX-Zone4 |
4,998 | 0.199 | 127,255 | 0.129 | 0.130 | 0.131 | ||||||
| SSX-Zone5 |
19,225 | 0.230 | 329,037 | 0.215 | 0.221 | 0.217 | ||||||
| SSX-Zone6 |
1,298 | 0.264 | 31,920 | 0.226 | 0.232 | 0.216 | ||||||
| SSX-Zone7 |
17,597 | 0.241 | 274,345 | 0.219 | 0.225 | 0.222 | ||||||
| SSX-Zone9 |
125 | 0.216 | 46,306 | 0.205 | 0.206 | 0.181 | ||||||
| Smith-Zone1 |
10,702 | 0.202 | 101,948 | 0.185 | 0.188 | 0.185 | ||||||
| Smith-Zone2-3 |
32,871 | 0.246 | 301,505 | 0.215 | 0.220 | 0.221 | ||||||
| Smith-Zone4 |
22,561 | 0.191 | 318,447 | 0.180 | 0.183 | 0.178 | ||||||
| Smith-Zone5 |
7,643 | 0.180 | 86,152 | 0.171 | 0.173 | 0.170 | ||||||
| Smith-Zone7 |
10,250 | 0.264 | 118,644 | 0.239 | 0.242 | 0.235 | ||||||
| Smith-Zone8 |
10,081 | 0.246 | 146,454 | 0.228 | 0.233 | 0.227 | ||||||
| Smith-Zone9 |
4,803 | 0.293 | 112,204 | 0.288 | 0.298 | 0.279 | ||||||
| Saval 4 |
2,428 | 0.210 | 32,662 | 0.199 | 0.199 | 0.197 | ||||||
| USB |
80 | 0.142 | 52,544 | 0.122 | 0.125 | 0.117 | ||||||
| WGen |
394 | 0.205 | 36,767 | 0.188 | 0.195 | 0.182 | ||||||
| Total |
225,511 | 0.257 | 3,100,828 | 0.217 | 0.222 | 0.217 | ||||||
14.10.5 Block Model Attributes
Once the block models were validated and finalized, they were transferred to Maptek Vulcan software to use the stope optimizer and reporting tools. Table 14-13 presents the imported block model attributes in the Vulcan block models.
| First Majestic Silver Corp. | Jerritt Canyon Gold Mine, SLR Project No: 233.03396.R0000
| ||||
| NI 43-101 Technical Report - April 30, 2021 | 14-32 | |||
Table 14-13: Summary of the Vulcan Block Model Attributes
Jerritt Canyon
| Variable | Type | Default Value | Description | |||
| ZONE |
Name (Translation Table) | default | Zone Domain - Geological Zone | |||
| SHELL |
Name (Translation Table) | default | Mineralization Wireframe Identifiers (381) | |||
| WT |
Name (Translation Table) | default | Water Table level, coded as above and below elevation 6,600ft | |||
| CLASS |
Name (Translation Table) | default | Resources Categorization (1 Measured, 2 Indicated, 3 Inferred, and Unclassified) | |||
| DENS |
Float (Real * 4) | -99 | Density value coded as 0.0794 ton/ft3 to mineralization and waste | |||
| AUOK |
Float (Real * 4) | -99 | Gold Grade Estimated by OK Methodology | |||
| AUID3 |
Float (Real * 4) | -99 | Gold Grade Estimated by ID3 Methodology | |||
| AUNN |
Float (Real * 4) | -99 | Gold Grade Estimated by NN Methodology | |||
| NSMP |
Float (Real * 4) | -99 | Number of composites used to estimate the block gold grade | |||
| AVD |
Float (Real * 4) | -99 | Average Distance of the composites used to estimate the block gold grade | |||
|
CLOD |
Float (Real * 4) | -99 | Distance to the closest composite used to estimate the block gold grade | |||
| 14.10.6 | Reconciliation to Production Statistics |
| 14.10.6.1 | Production Statistics |
Reconciliation activities conducted compared the quarterly production grades with JCG’s resource block model reported in the month-end excavation shapes. Differences in the masses and grade between plant feed and 3D excavation reflects the ore control activity where not all mined material goes to the plant. SLR notes this has an affect on showing higher tons and less grade.
The reconciliation results by quarter of the JCG production from the mines compared to the mill feed and output is presented in Table 14-14. SLR notes that a few months have higher grade variances that may be due to finding and mining mineralized material that is not in the resource model. JCG will occasionally drill out and mine mineralized material before it can be added to the resource model updates and can have an affect on the overall reconciliation.
Another factor potentially affecting the reconciliation is the presence of mineralized rib material left behind during previous mining operations. This material is not included in resource or reserve classifications due to the uncertainty of extraction but will add to the milled ounces output.
JCG assumes a fixed 5% dilution for all mining activities. Overall, the QP is of the opinion that the reconciliation results are acceptable.
| First Majestic Silver Corp. | Jerritt Canyon Gold Mine, SLR Project No: 233.03396.R0000
| ||||
| NI 43-101 Technical Report - April 30, 2021 | 14-33 | |||
Table 14-14: Summary of Reconciliation, January 2016 to March 2020
Jerritt Canyon
| Quarter | Block Grade (oz/st Au) |
Block Tons | Mill Grade (oz/st Au) |
Mill Tons | Block Ounces (000 oz Au) |
Mill Output (000 oz Au) | ||||||
|
2016-Q1 |
0.132 | 316,800 | 0.164 | 268,420 | 41,671 | 44,186 | ||||||
|
2016-Q2 |
0.117 | 347,004 | 0.140 | 320,189 | 40,586 | 44,943 | ||||||
|
2016-Q3 |
0.119 | 377,578 | 0.134 | 321,147 | 44,970 | 43,020 | ||||||
|
2016-Q4 |
0.109 | 384,253 | 0.139 | 281,918 | 41,785 | 39,185 | ||||||
|
2017-Q1 |
0.107 | 385,929 | 0.136 | 277,736 | 41,353 | 37,728 | ||||||
|
2017-Q2 |
0.100 | 402,013 | 0.127 | 263,363 | 40,301 | 33,419 | ||||||
|
2017-Q3 |
0.115 | 351,832 | 0.133 | 306,737 | 40,296 | 40,639 | ||||||
|
2017-Q4 |
0.110 | 373,343 | 0.143 | 295,694 | 41,043 | 42,248 | ||||||
|
2018-Q1 |
0.111 | 360,863 | 0.130 | 321,220 | 40,042 | 41,665 | ||||||
|
2018-Q2 |
0.130 | 384,941 | 0.143 | 320,376 | 50,186 | 45,792 | ||||||
|
2018-Q3 |
0.109 | 366,883 | 0.141 | 321,722 | 39,850 | 45,314 | ||||||
|
2018-Q4 |
0.121 | 275,180 | 0.131 | 251,031 | 33,178 | 32,899 | ||||||
|
2019-Q1 |
0.113 | 282,838 | 0.131 | 245,878 | 32,013 | 32,251 | ||||||
|
2019-Q2 |
0.132 | 262,935 | 0.145 | 249,777 | 34,589 | 36,194 | ||||||
|
2019-Q3 |
0.119 | 293,709 | 0.174 | 191,809 | 34,950 | 33,348 | ||||||
|
2019-Q4 |
0.112 | 289,534 | 0.173 | 196,118 | 32,427 | 33,941 | ||||||
|
2020-Q1 |
0.113 | 332,598 | 0.175 | 191,937 | 37,544 | 33,618 | ||||||
| Total |
0.115 | 5,788,232 | 0.143 | 4,625,072 | 666,784 | 660,390 | ||||||
| 14.10.7 | Review of Drilling After April 29, 2020 |
The drilling campaigns which occurred after the data cut-off date have been reviewed in 3D space with the current gold wireframes. The drilling has identified new lenses as well as expanded and contracted the sizes of current lenses modeled. Overall, the new drilling does appear to be expanding the current mineralization.
14.11 Mineral Resource Classification Criteria
The definitions for resource categories used in this Technical Report are consistent with the 2014 “CIM Definition Standards for Mineral Resources & Mineral Reserves”. In the CIM definition, a Mineral Resource is defined as “a concentration or occurrence of solid material of economic interest in or on the Earth’s crust in such form, grade or quality and quantity that there are reasonable prospects for eventual economic extraction”. Mineral Resources are classified into Measured, Indicated, and Inferred categories.
| First Majestic Silver Corp. | Jerritt Canyon Gold Mine, SLR Project No: 233.03396.R0000
| ||||
| NI 43-101 Technical Report - April 30, 2021 | 14-34 | |||
The definition of categories in the Mineral Resource estimate is based primarily on a distance function, however, visual and geological interpretation has also been used. The classification methodology is based on the following:
| · | Measured: Based on drill hole spacing up to approximately 30 ft. |
| · | Indicated: Based on drill hole spacing up to approximately 75 ft. |
| · | Inferred: Based on drill hole spacing up to approximately 100 ft. |
Figure 14-17 shows the classification for the SSX mine with the mine development in gray.
| First Majestic Silver Corp. | Jerritt Canyon Gold Mine, SLR Project No: 233.03396.R0000
| ||||
| NI 43-101 Technical Report - April 30, 2021 | 14-35 | |||
Figure 14-17: Mineral Classification SSX Mine
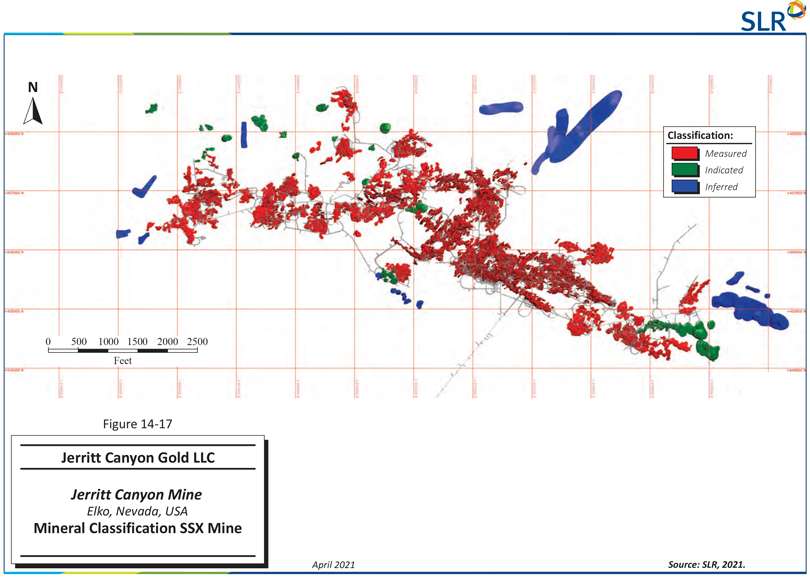
| First Majestic Silver Corp. | Jerritt Canyon Gold Mine, SLR Project No: 233.03396.R0000
| ||||
| NI 43-101 Technical Report - April 30, 2021 | 14-36 | |||
14.12 Cut-off Grade
SLR applied a breakeven cut-off grade of 0.11 oz/st Au to estimate the Mineral Resource. The economic parameters used to calculate the cut-off grade are provided below:
| · | Gold price: US$1,700/oz Au |
| · | Mining cost: US$102/st |
| · | Milling cost: US$45/st |
| · | Metal recovery: 86% |
| · | General and administrative costs: US$18/st |
14.13 Reasonable Prospects for Eventual Economic Extraction
Once the block models were validated and finalized, they were transferred to Maptek Vulcan software to use the stope optimizer and reporting tools to evaluate the mineral resource estimates for reasonable prospects for eventual economic extraction. JCG used the stope optimizer module available through Maptek Vulcan software to produce Mineral Resource stopes from material that is exclusive of the Mineral Reserve stopes used for SSX and Smith. USB, WGen, and Saval 4 do not have material classified as Mineral Reserves and therefore do not have any Mineral Reserve stopes removed from their corresponding Mineral Resources.
The criteria used to produce these stopes was a minimum mining size (15 ft x 15 ft), continuity criteria, and a cut-off value of 0.08 oz/st Au. The dimensions of the minimum mining size were based on the equipment employed by JCG. Once results were available, the final cut-off grade of 0.11 oz/st Au was applied and stopes that were below the cut-off were removed from the resource numbers.
14.14 Mineral Resource Estimate
The Mineral Resource estimate has an effective date of December 31, 2020. A cut-off grade of 0.11 oz/st Au was applied to the underground Mineral Resources. The Mineral Resources have been depleted for production to December 31, 2020 and are exclusive of Mineral Reserves.
In the QP’s opinion, the assumptions, parameters, and methodology used for the Jerritt Canyon Mineral Resource estimates are appropriate for the style of mineralization and mining methods. Mineral Resources located above and below the water table (6,600 FASL) are tabulated in Table 14-15 and Table 14-16 in Imperial and Metric units, respectively.
| First Majestic Silver Corp. | Jerritt Canyon Gold Mine, SLR Project No: 233.03396.R0000
| ||||
| NI 43-101 Technical Report - April 30, 2021 | 14-37 | |||
Table 14-15: Mineral Resource Estimate (effective date December 31, 2020, Imperial Units)
Jerritt Canyon
| Mine/
Deposit
|
Measured | Indicated | Measured and Indicated | Inferred | ||||||||||||||||||||
| Tonnage
(000 tons)
|
Grade
(oz/st Au)
|
Contained
Metal
(000 oz Au)
|
Tonnage
(000 tons)
|
Grade
(oz/st Au)
|
Contained
Metal
(000 oz Au)
|
Tonnage
(000 tons)
|
Grade
(oz/st Au)
|
Contained
Metal
|
Tonnage
(000 tons)
|
Grade
(oz/st Au)
|
Contained
Metal
(000 oz Au) | |||||||||||||
| Above 6,600 FASL | ||||||||||||||||||||||||
| Smith |
1,702 | 0.146 | 248 | 74 | 0.139 | 10 | 1,776 | 0.145 | 258 | 15 | 0.115 | 2 | ||||||||||||
| SSX |
2,338 | 0.164 | 383 | 48 | 0.146 | 7 | 2,386 | 0.163 | 390 | 407 | 0.154 | 63 | ||||||||||||
| Saval 4 |
87 | 0.170 | 15 | 104 | 0.172 | 18 | 191 | 0.171 | 33 | - | - | - | ||||||||||||
| USB |
- | - | - | - | - | - | - | - | - | 294 | 0.143 | 42 | ||||||||||||
| Subtotal |
4,127 | 0.156 | 646 | 226 | 0.156 | 35 | 4,353 | 0.156 | 681 | 716 | 0.149 | 107 | ||||||||||||
| Below 6,600 FASL | ||||||||||||||||||||||||
| Smith |
310 | 0.162 | 50 | 37 | 0.134 | 5 | 347 | 0.159 | 55 | 254 | 0.157 | 40 | ||||||||||||
| SSX |
2 | 0.113 | 0 | 8 | 0.112 | 1 | 9 | 0.113 | 1 | 980 | 0.191 | 187 | ||||||||||||
| WGen |
373 | 0.192 | 72 | 135 | 0.177 | 24 | 508 | 0.188 | 96 | - | - | - | ||||||||||||
| Subtotal |
685 | 0.178 | 122 | 180 | 0.166 | 30 | 864 | 0.176 | 152 | 1,234 | 0.184 | 227 | ||||||||||||
| Total |
4,811 | 0.159 | 767 | 406 | 0.160 | 65 | 5,217 | 0.160 | 832 | 1,950 | 0.171 | 334 | ||||||||||||
Notes:
| 1. | Canadian Institute of Mining, Metallurgy and Petroleum (CIM) Definition and Standards for Mineral Resources and Mineral Reserves (CIM (2014) definitions) were followed for Mineral Resources. |
| 2. | Mineral Resources are exclusive of Mineral Reserves. |
| 3. | Mineral Resources are estimated using an average gold price of $1,700/oz Au. |
| 4. | Mineral Resources are constrained using minimum thickness mining shapes reflecting the geometries of cut and fill mining methods. |
| 5. | Mineral Resources are reported at a cut-off grade of 0.11 oz/st Au, accounting for mining costs of $102/st, milling costs of $45/st, general and administrative costs of $18/st, and a metal recovery of 86%. |
| 6. | Mineral Resources that are not Mineral Reserves do not have demonstrated economic viability. |
| 7. | Numbers may not add due to rounding. |
| First Majestic Silver Corp. | Jerritt Canyon Gold Mine, SLR Project No: 233.03396.R0000
| ||||
| NI 43-101 Technical Report - April 30, 2021 | 14-38 | |||
Table 14-16: Mineral Resource Estimate (effective date December 31, 2020, Metric Units)
Jerritt Canyon
| Mine/
Deposit
|
Measured | Indicated | Measured and Indicated | Inferred | ||||||||||||||||||||
| Tonnage
(000 t)
|
Grade
(g/t Au)
|
Contained
Metal
(000 oz Au)
|
Tonnage
(000 t)
|
Grade
(g/t Au)
|
Contained
Metal
(000 oz Au)
|
Tonnage
(000 t)
|
Grade
(g/t Au)
|
Contained
Metal
(000 oz Au)
|
Tonnage
(000 t)
|
Grade
(g/t Au)
|
Contained
Metal
(000 oz Au) | |||||||||||||
| Above 2,012 MASL | ||||||||||||||||||||||||
| Smith |
1,544 | 4.99 | 248 | 67 | 4.77 | 10 | 1,612 | 4.98 | 258 | 14 | 3.96 | 2 | ||||||||||||
| SSX |
2,121 | 5.61 | 383 | 44 | 5.01 | 7 | 2,165 | 5.60 | 390 | 369 | 5.29 | 63 | ||||||||||||
| Saval 4 |
78 | 5.84 | 15 | 94 | 5.89 | 18 | 173 | 5.87 | 33 | - | - | - | ||||||||||||
| USB |
- | - | - | - | - | - | - | - | - | 267 | 4.90 | 42 | ||||||||||||
| Subtotal |
3,743 | 5.36 | 646 | 205 | 5.34 | 35 | 3,950 | 5.36 | 681 | 650 | 5.10 | 107 | ||||||||||||
| Below 2,012 MASL | ||||||||||||||||||||||||
| Smith |
281 | 5.57 | 50 | 33 | 4.59 | 5 | 315 | 5.46 | 55 | 230 | 5.39 | 40 | ||||||||||||
| SSX |
1 | 3.87 | 0 | 7 | 3.85 | 1 | 8 | 3.86 | 1 | 889 | 6.56 | 187 | ||||||||||||
| WGen |
338 | 6.58 | 72 | 123 | 6.08 | 24 | 461 | 6.45 | 96 | - | - | - | ||||||||||||
| Subtotal |
620 | 6.11 | 122 | 163 | 5.68 | 30 | 784 | 6.02 | 152 | 1,119 | 6.32 | 227 | ||||||||||||
| Total |
4,365 | 5.47 | 767 | 368 | 5.49 | 65 | 4,733 | 5.47 | 832 | 1,769 | 5.87 | 334 | ||||||||||||
Notes:
| 1. | Canadian Institute of Mining, Metallurgy and Petroleum (CIM) Definition and Standards for Mineral Resources and Mineral Reserves (CIM (2014) definitions) were followed for Mineral Resources. |
| 2. | Mineral Resources are exclusive of Mineral Reserves. |
| 3. | Mineral Resources are estimated using an average gold price of $1,700/oz Au. |
| 4. | Mineral Resources are constrained using minimum thickness mining shapes reflecting the geometries of cut and fill mining methods. |
| 5. | Mineral Resources are reported at a cut-off grade of 0.11 oz/st Au, accounting for mining costs of $102/st, milling costs of $45/st, general and administrative costs of $18/st, and a metal recovery of 86%. |
| 6. | Mineral Resources that are not Mineral Reserves do not have demonstrated economic viability. |
| 7. | Numbers may not add due to rounding. |
| First Majestic Silver Corp. | Jerritt Canyon Gold Mine, SLR Project No: 233.03396.R0000
| ||||
| NI 43-101 Technical Report - April 30, 2021 | 14-39 | |||
14.15 Factors that May Affect the Mineral Resource Estimate
Risk factors that could materially impact the Mineral Resource estimate include:
| · | Metal price and exchange rate assumptions. |
| · | Changes in the interpretations of mineralization geometry and continuity of mineralized zones. |
| · | Changes to geotechnical, mining, and metallurgical recovery assumptions. |
| · | Changes to the assumptions related to the continued ability to access the site, retain mineral and surface right titles, maintain environment and other regulatory permits, and maintain the license to operate. |
| First Majestic Silver Corp. | Jerritt Canyon Gold Mine, SLR Project No: 233.03396.R0000
| ||||
| NI 43-101 Technical Report - April 30, 2021 | 14-40 | |||
| 15.0 | MINERAL RESERVE ESTIMATE |
15.1 Summary
Jerritt Canyon Mineral Reserves are based on Proven and Probable material as defined in CIM (2014). A Mineral Reserve is defined as the “economically mineable part of a Measured and/or Indicated Mineral Resource” demonstrated by studies at Pre-Feasibility or Feasibility level as appropriate. Mineral Reserves are classified into Proven and Probable categories.
SLR generated the Jerritt Canyon underground Mineral Reserves by filtering Deswik stope optimizer (DSO) shapes, as provided by JCG, and applying mine designs to the March 31, 2020 as-built survey solids. The design methodology uses both cut-off grade estimation and economic analysis to design and validate the Mineral Reserves.
Stopes and development tasks were classified in the Mineral Resource classification based on the majority of material in the task. For the majority of the orebody the material for each task was one classification type. In areas of mixed classification the Measured or Indicated material accounted for 70% or more of the stope material.
SLR selected stopes to be used in Mineral Reserves first by filtering or identifying stopes based primarily on their proximity to existing historical mine workings, open pits, and infrastructure, and secondly, by identifying large and continuous regions of stopes, until approximately five years of Mineral Reserves were accumulated for each mine. Stopes within 15 ft of historical mine workings were identified and flagged due to a lack of knowledge or confidence in the quality or type of backfill used in those workings. At SSX, a risk factor was applied to these stopes. Measured stopes with a risk factor were classified as Probable, and measured stopes with no risk classified as Proven. At Smith, any material within 15 ft of existing workings was excluded from the Mineral Reserves and material classes were based on block model output.
The natural water table at both SSX and Smith is situated at 6,600 feet above sea level (FASL) or 2,012 m above sea level (masl). Mineral Reserves below the natural water table will require dewatering to rehabilitate old workings or to drive new headings. Scheduling has taken dewatering into account, and no additional costs have been applied to cut-off grades below the natural water table. Further details can be found in Section 16 of this Technical Report.
Table 15-1 presents a summary of the Jerritt Canyon Mineral Reserves above and below the natural water table at 6,600 FASL.
Table 15-1: Summary of Mineral Reserves (effective date December 31, 2020, Imperial Units)
Jerritt Canyon
| Category | Tonnage
|
Grade
|
Contained Metal
| |||
| Above 6,600 FASL | ||||||
| Proven |
1,059 | 0.18 | 187 | |||
| Smith |
193 | 0.17 | 33 | |||
| SSX
|
866
|
0.18
|
154
| |||
| First Majestic Silver Corp. | Jerritt Canyon Gold Mine, SLR Project No: 233.03396.R0000
| ||||
| NI 43-101 Technical Report - April 30, 2021 | 15-1 | |||
| Category
|
Tonnage
|
Grade
|
Contained Metal
| |||
| Probable |
689 | 0.19 | 129 | |||
| Smith |
54 | 0.18 | 10 | |||
| SSX |
635 | 0.19 | 119 | |||
| Subtotal Proven + Probable |
1,748 | 0.18 | 316 | |||
| Below 6,600 FASL | ||||||
| Proven |
915 | 0.22 | 200 | |||
| Smith |
808 | 0.22 | 180 | |||
| SSX |
107 | 0.19 | 20 | |||
| Probable |
897 | 0.21 | 186 | |||
| Smith |
380 | 0.26 | 101 | |||
| SSX |
516 | 0.17 | 86 | |||
| Subtotal Proven + Probable |
1,811 | 0.21 | 387 | |||
| Total Proven |
1,974 | 0.20 | 388 | |||
| Total Probable |
1,585 | 0.20 | 316 | |||
| Total Proven +Probable
|
3,559
|
0.20
|
703
| |||
Notes:
| 1. | CIM (2014) definitions were followed for Mineral Reserves. |
| 2. | Mineral Reserves are estimated at a cut-off grade of 0.128 oz/st Au which assumes $102/st mining cost, $45/st processing cost, $18/st G&A cost and 86% metallurgical recovery. |
| 3. | Mineral Reserves are estimated using an average long term gold price of US$1,500/oz Au. |
| 4. | A minimum mining width of 15 ft was used assuming a cut and fill mining method. |
| 5. | Bulk density is 0.0794 t/ft3. |
| 6. | Numbers may not add due to rounding. |
Table 15-2 presents a summary of the Jerritt Canyon Mineral Reserves above and below the natural water table at 2,012 MASL.
Table 15-2: Summary of Mineral Reserves (effective date December 31, 2020, Metric Units)
Jerritt Canyon
| Category
|
Tonnage
|
Grade
|
Contained Metal
| |||
| Above 2,012 MASL | ||||||
| Proven |
961 | 6.1 | 187 | |||
| Smith |
175 | 5.9 | 33 | |||
| SSX
|
786
|
6.1
|
154
| |||
| First Majestic Silver Corp. | Jerritt Canyon Gold Mine, SLR Project No: 233.03396.R0000
| ||||
| NI 43-101 Technical Report - April 30, 2021 | 15-2 | |||
| Category
|
Tonnage (000 t)
|
Grade (g/t Au)
|
Contained Metal
| |||
| Probable |
625 | 6.4 | 129 | |||
| Smith |
49 | 6.2 | 10 | |||
| SSX |
576 | 6.4 | 119 | |||
| Subtotal Proven + Probable |
1,585 | 6.2 | 316 | |||
| Below 2,012 MASL | ||||||
| Proven |
830 | 7.5 | 200 | |||
| Smith |
733 | 7.7 | 180 | |||
| SSX |
97 | 6.4 | 20 | |||
| Probable |
813 | 7.1 | 186 | |||
| Smith |
345 | 9. | 101 | |||
| SSX |
468 | 5.7 | 86 | |||
| Subtotal Proven + Probable |
1,643 | 7.3 | 387 | |||
| Total Proven |
1,791 | 6.7 | 388 | |||
| Total Probable |
1,438 | 6.8 | 316 | |||
| Total Proven +Probable |
3,229 | 6.8 | 703 | |||
Notes:
| 1. | CIM (2014) definitions were followed for Mineral Reserves. |
| 2. | Mineral Reserves are estimated at a cut-off grade of 4.39 g/t Au which assumes $112/st mining cost, $50/st processing cost, $20/st G&A cost and 86% metallurgical recovery. |
| 3. | Mineral Reserves are estimated using an average long term gold price of US$1,500/oz Au. |
| 4. | A minimum mining width of 4.6 m was used assuming a cut and fill mining method. |
| 5. | Bulk density is 2.544 t/m3. |
| 6. | Numbers may not add due to rounding. |
The QP is not aware of any mining, metallurgical, infrastructure, permitting, or other relevant factors that could materially affect the Mineral Reserve estimate, aside from those identified in Section 20 of this Technical Report which are being mitigated by further work by JCG.
| 15.2 | Dilution |
SLR selected an overall dilution factor of 2% which was applied to all stopes. This is to account for various types of dilution and to simplify the process. SLR notes that this factor is consistent with the mining method and recent production results. Dilution factors include overbreak, and dilution from backfill.
| 15.3 | Extraction |
SLR selected an extraction factor of 95% which was applied to all stopes. This is to account for losses due to mining and is consistent with the mining method and recent production results.
| First Majestic Silver Corp. | Jerritt Canyon Gold Mine, SLR Project No: 233.03396.R0000
| ||||
| NI 43-101 Technical Report - April 30, 2021 | 15-3 | |||
| 15.4 | Cut-Off Grade |
Metal prices used for Mineral Reserves are based on consensus, long term forecasts from banks, financial institutions, and other sources. The cut-off grade used for the Mineral Reserves is 0.128 oz/st Au, and the inputs are provided in Table 15-3. Incremental stopes were included at a grade of 0.12 oz/st Au.
Table 15-3: Summary of Cut-Off Grade Factors – March 31, 2020
Jerritt Canyon
|
Item
|
Units
|
Value
| ||
| Gold |
$/oz Au | 1,500 | ||
| Mill Recovery |
% | 86 | ||
| Mining Cost |
$/st | 102.00 | ||
| Milling Cost |
$/st | 45.00 | ||
| General and Administrative (G&A) |
$/st | 18.00 | ||
| First Majestic Silver Corp. | Jerritt Canyon Gold Mine, SLR Project No: 233.03396.R0000
| ||||
| NI 43-101 Technical Report - April 30, 2021 | 15-4 | |||
| 16.0 | MINING METHODS |
Jerritt Canyon has been in operation since 1981, with open pit operations occurring from 1981 to 1999, and underground operations commencing in 1993 at SSX and Smith. SSX and Smith are currently contractor operated.
SSX is accessed via ramp located in the southeast portion of the underground mine at the bottom of a historical open pit, and underground workings strike northwest to southeast, spanning approximately 10,000 ft. SSX is comprised of seven mining zones, with Zone 1 in the east and Zone 7 in the west. The zones overlap in areas due to overlapping orebodies in the vertical plane. SSX is ventilated via a series of raises and through the main ramps. Mineralized material is hauled from muck bays and stockpiled near the portal, where it is then delivered to the mill via larger haul trucks. All mining voids are filled with cemented rock fill (CRF). Figure 16-1 presents an overall plan view of SSX and the active mining zones.
Smith is accessed via a ramp located at the bottom of the inactive Dash open pit. Underground workings are extensive and access eight distinct mining zones, though only six zones have been considered by SLR in the estimation of Mineral Reserves. Smith is ventilated via a series of raises and through the main ramp. Similarly to operations at SSX, mineralized material is hauled from muck bays and stockpiled near the portal, where it is then delivered to the mill via larger haul trucks. All mining voids are filled with CRF. Figure 16-2 presents an overall plan view of Smith and the active mining zones.
| First Majestic Silver Corp. | Jerritt Canyon Gold Mine, SLR Project No: 233.03396.R0000
| ||||
| NI 43-101 Technical Report - April 30, 2021 | 16-1 | |||
Figure 16-1: SSX Mine Plan View
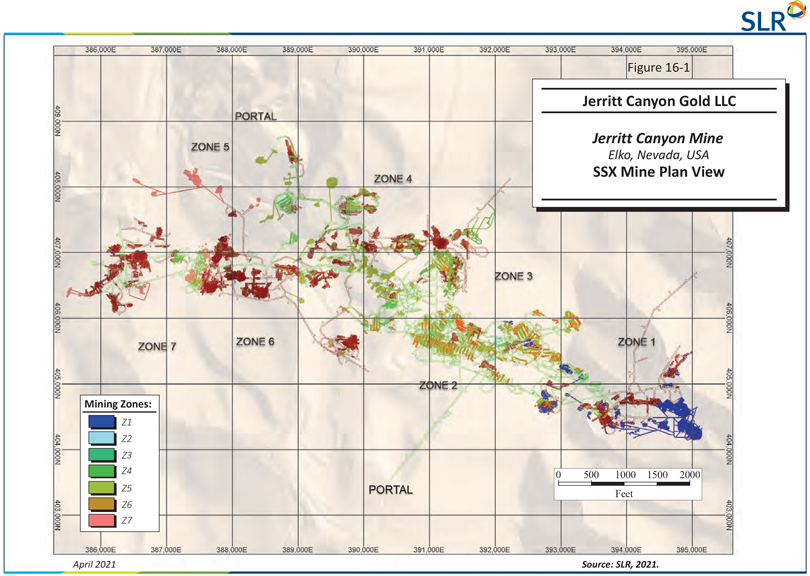
| First Majestic Silver Corp. | Jerritt Canyon Gold Mine, SLR Project No: 233.03396.R0000
| ||||
| NI 43-101 Technical Report - April 30, 2021 | 16-2 | |||
Figure 16-2: Smith Mine Plan View
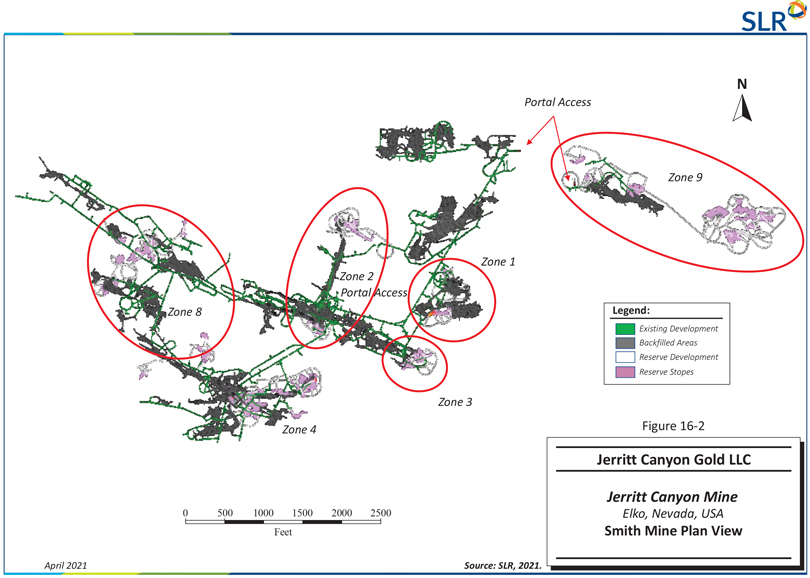
| First Majestic Silver Corp. | Jerritt Canyon Gold Mine, SLR Project No: 233.03396.R0000
| ||||
| NI 43-101 Technical Report - April 30, 2021 | 16-3 | |||
| 16.1 | Stoping Methods |
Production at SSX and Smith utilizes the cut and fill stoping method. Minimum mining openings are 15 ft by 15 ft, with widths of up to 25 ft where justified by the mineralized structure width. Stopes are mined using a combination of overhand and underhand methods, with a stope typically consisting of three lifts. The middle lift is mined first, followed by the top lift to allow for curing of the first lift before mining of the bottom lift occurs.
Ore is hauled to surface stockpiles using mine haul trucks for grade control and surface haul trucks to the mill feed stockpile.
These methods have been employed successfully at Jerritt Canyon since underground operations began. Based on SLR’s site visit, SLR considers the mining methods to be adequately applied.
| 16.2 | Mine Development |
SSX and Smith are accessed by way of surface portals and 15 ft by 15 ft declines typically grading 12% to 15%. Underground lateral development including level and stope access is generally designed to be 15 ft by 15 ft. Cut and fill stopes are typically mined in three lifts with access drift gradients varying from +15% to -15%. All aspects of the mining cycle are fully mechanized with excavations created using conventional drill, blast, muck, and support techniques.
| 16.3 | Geomechanics, Ground Support |
Gold mineralization at Jerritt Canyon is hosted by Hanson Creek Formation units I to III and the lower part of the Roberts Mountains Formation. The Hanson Creek host rock at Jerritt Canyon has a fair to poor classification with Rock Mass Rating (RMR) values typically in the 30 to 40 range.
Golder Associates, Inc. (Golder) completed a preliminary geotechnical assessment of the Starvation Canyon underground area in 2012 (Golder, 2012). Gold mineralization at Starvation Canyon occurs at the Hanson Creek II to III contact. Geotechnical data was collected from 12 boreholes which included logging for geotechnical parameters and borehole televiewer surveys to collect structural orientations. The Golder (2012) assessment concluded that a rock mass quality distribution in both mineralization and host rock consisted of 75% Good to Very Good (RMR76 >61), 15% Fair (RMR76 of 41 to 61), and the remaining 10% Poor to Very Poor (RMR76 <41).
Mine openings at all mines are primarily supported with 6 ft split sets on a 3 ft by 3 ft pattern with 6-gauge wire mesh and supplemented with shotcrete in areas of poor rock mass quality.
| 16.4 | Backfill |
Backfilling of production voids is completed using CRF, which is produced by crushing and screening mine waste material and placed using a load-haul-dump unit (LHD) with a rammer push plate attachment. Cement content varies from 5% to 6% for adjacent and undercut mining, with the majority of fill placed with 6% cement content. CRF is mixed at batch plants located near the portal of each mine and hauled underground by mine haul trucks. In cut and fill mines, CRF is loaded into cut and fill stopes using loaders and pushed tight to the back using a dozer or loader.
| First Majestic Silver Corp. | Jerritt Canyon Gold Mine, SLR Project No: 233.03396.R0000
| ||||
| NI 43-101 Technical Report - April 30, 2021 | 16-4 | |||
| 16.5 | Groundwater Control |
Initial studies of the groundwater at the Jerritt Canyon District (the District) indicated that groundwater occurs throughout the Mine area ranging from surface in the areas of springs to several hundred feet below the surface in upland areas (USDA, 1993). In general, the aquifer systems at Jerritt Canyon consist of both perched and regionally controlled aquifers occurring under confined and unconfined conditions. The regional groundwater system consists of consolidated sedimentary and igneous rocks being recharged in the Independence Mountains. The potentiometric surface generally follows the topography with fractures and limestone solution cavities being the primary conduits for groundwater flow. Local groundwater barriers formed by faults or low permeable rocks have created a complex pattern of perched and semi-perched aquifers (Eakin and Lamke, 1966).
Surface mining in the District has been concentrated in three exhausted surface areas, the Marble Canyon Extension Mine, Steer/Saval pits, and Dash Pit, however, the Dash Pit is currently used as a portal for Smith. In addition, underground mining has been concentrated at Murray, SSX, and Smith. Currently only SSX and Smith are active, with plans to develop these mines below the local water table, necessitating dewatering to access mineralized material. Groundwater studies are currently focused on Smith. The following subsections present a brief description of the hydrogeology of the District, and Smith groundwater management in regard to dewatering and pollution control of seepage from TSF 1.
| 16.5.1 | Hydrogeology |
The geology of the District (detailed in Section 7 of this Technical Report) has a profound influence on the groundwater flow and dewatering at Smith. The sedimentary rocks of the Roberts Mountain and Hanson Creek Formations which host the main ore body are the principal aquifers in the District and are part of the regional groundwater aquifer sytem. As illustrated in Figure 16-3, the Saval Discontinuity occurs between these two formations. Table 16-1 provides a brief description of the hydrogeology of these geologic formations.
| First Majestic Silver Corp. | Jerritt Canyon Gold Mine, SLR Project No: 233.03396.R0000
| ||||
| NI 43-101 Technical Report - April 30, 2021 | 16-5 | |||
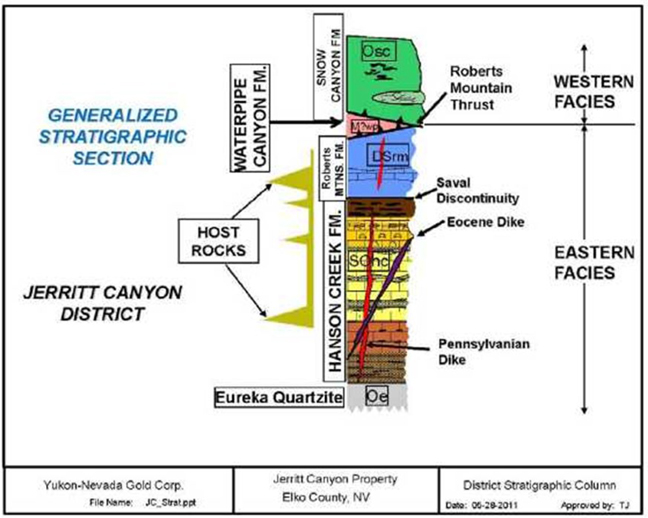
Source: Yukon Nevada Corp, 2011
Figure 16-3: Jerritt Mine Lithology
Table 16-1: Hydrogeologic Units in the Jerritt Canyon District
Jerritt Canyon
| Name | Age | Material | Unit Thickness | Hydrology | ||||
| Alluvium/ Colluvium |
Quaternary and Tertiary | SAND and GRAVEL | 10-100 ft on mountain flanks, up to 1,500 ft in basin fill | Moderate permeability, high porosity | ||||
| Snow Canyon Fm |
Ordovician | QUARTZITE, CHERT, ARGILLITE, METABASALT | Typically, ~1,000 ft, maximum 2,000 ft, often eroded | Low permeability, low porosity | ||||
| Waterpipe Canyon Fm |
Mississippian | Carbonaceous SHALE, CHERT, GREYWACKE | Maximum thickness 1,000 ft, may not be present | Very low permeability, moderate porosity | ||||
| First Majestic Silver Corp. | Jerritt Canyon Gold Mine, SLR Project No: 233.03396.R0000
| ||||
| NI 43-101 Technical Report - April 30, 2021 | 16-6 | |||
| Name | Age | Material | Unit Thickness | Hydrology | ||||
| Roberts Mountains Fm | Devonian and Silurian | SILTSTONE, calcareous to dolomitic | Typically, 600 feet, maximum 1,000 feet. Target unit. | Low to medium permeability, low porosity | ||||
| Hanson Creek Fm | Silurian and Ordovician | LIMESTONE, grey, occasionally carbonaceous, dolomitic. | Maximum thick-ness 750 feet, in five members. Target unit. | High permeability, moderate porosity | ||||
| Eureka Quartzite | Ordovician | QUARTZITE, massive | Approximately 600-800 feet thick | Very low permeability, very low porosity | ||||
SLR notes that according to JCG (2021), some of these units are not always encountered in this order, or at all, due to erosion, faulting, thrusting, intercalation, overturning, or other geologic processes that have occurred at the site.
Groundwater flows are controlled primarily by the openness and continuity of fractures and joints with the primary water bearing strata being the ore zones. Faulting and tectonic displacement of the materials in the District is extensive. The main faults trend west northwest - east southeast, and in general are permeable water conduits. Complementary faults and displacement sets at right angles, south southwest – north northeast, are generally highly mylonized, and tend to form a barrier to groundwater flow and compartmentalize groundwater.
The hydraulic characteristics of the main hydrogeologic units based on JCG (2021) are as follows:
16.5.1.1 Alluvium (Aquifer)
Deep alluvial aquifers occur in the basin fill on the eastern and western edges of the District. The following hydraulic characteristics of these aquifers are based on deep water supply wells on the eastern side of the Independence Mountains:
| · | Material: Boulders, cobbles, gravel, sand, and some silt. |
| · | Thickness: 50 ft to 1,500 ft |
| · | Hydraulic conductivity: 10-3 cm/sec to 10-4 cm/sec |
| · | Specific Storage: approximately10-6/ft |
| · | Porosity: approximately 30% |
| · | Drainable porosity: 10% |
| · | Flow: Porous media |
| · | Confinement: Unconfined |
| · | Artesian: No |
| · | Perched: No |
None of the borings proposed at Smith will be drilled into or through this aquifer.
16.5.1.2 Snow Canyon Complex (Ordovician) (Aquitard).
The Snow Canyon complex covers much of the District, and where present, forms an aquitard that confines underlying more permeable materials. The following hydrologic information on this aquitard has
| First Majestic Silver Corp. | Jerritt Canyon Gold Mine, SLR Project No: 233.03396.R0000
| ||||
| NI 43-101 Technical Report - April 30, 2021 | 16-7 | |||
been developed by JCG as a result of testing and modelling in the vicinity of Smith and from the injection well system used for the re-introduction of dewatering water to the bedrock flow system.
| · | Material: Consists of an upper unit of primarily poorly bedded turbiditic quartzite, a middle unit of chert, argillite, siltstone, shale, and local bedded barite, and a lower basalt sequence of limestone, chert, and greenstone (metabasalt). |
| · | Thickness: typically, approximately 1,000 ft, maximum 2,000 ft, often the uppermost unit in the Jerritt Canyon area, and thinner due to erosion. |
| · | Hydraulic conductivity: 10-5 cm/sec to 10-6 cm/sec |
| · | Specific Storage: approximately 10-6 /ft |
| · | Porosity: approximately 5% |
| · | Drainable porosity: approximately 1% |
| · | Flow: Fracture and porous media flow, depending on material |
| · | Confinement: Generally, forms a confining layer, but underlying carbonates may be unsaturated. |
| · | Artesian: No |
| · | Perched: Frequently, due to limited vertical permeability preventing significant flow of infiltrating precipitation to lower stratigraphic units and aquifers. Perched water may exit this unit to ground surface in the form of localized springs. |
Most of the borings proposed at Smith will be drilled through this aquitard.
16.5.1.3 Roberts Mountains Formation (Devonian and Silurian) ( Aquitard/Aquifer)
The Roberts Mountains Formation is the upper gold containing unit in the District and is the uppermost target for the drilling of exploration boreholes in the Jerritt Canyon area. It is generally of low permeability but contains higher permeability lamina that are capable of producing water. Accordingly, this formation acts as a low transmissivity horizontal aquifer, and a low permeability vertical aquitard. The following hydrologic information on this aquitard/aquifer has been developed by JCG as a result of testing and modelling in the vicinity of Smith and from the injection well system that is used for the re-introduction of dewatering water to the bedrock flow system.
| · | Material: Laminated carbonaceous, calcareous to dolomitic, siltstone. |
| · | Thickness: Typically, approximately 600 ft thick, maximum 1,000 feet, thinner due to erosion when uppermost unit in the Jerritt Canyon area. |
| · | Hydraulic conductivity: 10-4 cm/sec to 10-6 cm/sec, depending on the mineralogy of the lamina |
| · | Specific Storage: approximately 10-6 /ft |
| · | Porosity: approximately 20% |
| · | Drainable porosity: <5% |
| · | Flow: Principally fracture flow, with porous media flow dominating in less fractured zones remote from faulting. |
| · | Confinement: Generally confined, and when it is the uppermost unit can form a confining layer |
| · | Artesian: Generally, not |
| · | Perched: Frequently, where the underlying Hanson Creek formation is partially saturated. |
Most of the borings proposed at Smith will be drilled into or through this aquitard.
| First Majestic Silver Corp. | Jerritt Canyon Gold Mine, SLR Project No: 233.03396.R0000
| ||||
| NI 43-101 Technical Report - April 30, 2021 | 16-8 | |||
| 16.5.1.4 | Hanson Creek Formation (Silurian and Ordovician) (Aquifer) |
The Hanson Creek Formation is the major bedrock aquifer in the District, underlaying almost the entire Mine area. It is a thick layer of high permeability limestone and contains significant gold values so is frequently the target of exploration drilling. The formation has also been dewatered in the past (and presently) to allow access to mineralized material that is currently below the piezometric surface in the formation. Much of the information on the hydrology of this unit is derived from dewatering wells and injection wells associated with this dewatering by JCG and its predecessors.
| · | Material: Limestone; carbonaceous, argillaceous, calcareous, and dolomitized. |
| ¡ | SOhc1 (10 ft to 100 ft) black chert and carbonaceous limestone. |
| ¡ | SOhc2 (0 ft to 100 ft) gray limestone, fossiliferous and dolomitized. |
| ¡ | SOhc3 (0 ft to 300 ft) carbonaceous argillaceous limestone, hosts a significant amount of gold. |
| ¡ | SOhc4 (approximately 250 ft) carbonaceous limestone. |
| ¡ | SOhc5 (15 ft to 100 ft) chert, limestone, and laminated calcareous siltstones. |
| · | Thickness: Typically, 500 ft to a maximum of 750 ft. |
| · | Hydraulic conductivity: 10-2 cm/sec to 10-3 cm/sec, higher values in proximity to major northwest-southeast faults |
| · | Specific Storage: approximately 10-6 /ft |
| · | Porosity: approximately 10% |
| · | Drainable porosity: approximately 5% |
| · | Flow: Principally fracture flow, with porous media flow dominating in highly fractured zones associated with regional faulting. |
| · | Confinement: Frequently unconfined but confined on eastern and western edges of the Independence mountains. |
| · | Artesian: Rarely, at the periphery of the mountain range, where the piezometric pressure in this unit is naturally close to or above the ground surface. |
Specifically in the Smith area the hydrogeology is very complex. According to Brown (2021), the original geohydrology concept involved a continuous sheet of permeable carbonates comprising the Roberts Mountain and Hanson Creek formations, sandwiched between the low permeability Snow Canyon Complex above and the low permeability Eureka Quartzite below. The change is the addition of tectonic displacement of this system by approximately north-south trending mountain bounding faults, creating a horst and graben structure, with the grabens being infilled with alluvial and colluvial materials. The significance of this change is that the tectonism segmented the hydrologic system by displacing permeable bedrock materials against impermeable bedrock materials, and interposing mylonized materials (both bedrock and alluvial) between the blocks created. This results in a compartmentalization of the groundwater system, in which water infiltrates vertically into each compartment, and lateral flow of this water is essentially unrestricted within compartments, and significantly restricted between compartments. This model has been clearly evident in the current dewatering test work, where:
| · | The water level has been pulled down 30 ft in the Smith Zone 2/4 compartments. |
| · | The water level has remained unchanged in the immediately adjacent Zone 8 compartment to the west. |
| First Majestic Silver Corp. | Jerritt Canyon Gold Mine, SLR Project No: 233.03396.R0000
| ||||
| NI 43-101 Technical Report - April 30, 2021 | 16-9 | |||
| · | Injection of the dewatering water into the adjacent Upper (south) Injection Field has raised the water level approximately 200 ft without any observable effect on any surrounding compartment, including the Smith compartments. |
| 16.5.2 | Mine Water Management |
As previously mentioned, Smith consists of eight ore zones connected by a southwesterly trending decline originating from the portal on the west side of the former Dash Pit. Dewatering of ore zones 1, 2, and 4 began in December 2002. Over a three-year period, eleven dewatering wells were installed and discharge from these wells was directed to seven sumps and pumped to the surface. Peak discharge of approximately 1,600 gpm from these wells occurred in 2005. Dewatering continued to 2008, at which time the pumps were shut down. The water table has been drawn down to approximately 6,535 FASL. As of the end of 2011, the water table within Smith had recovered to near its original elevation of 6,600 FASL.
According to the Smith Dewatering Plan (Queenstake Resources USA, Ltd, 2012), geologic exploration conducted in 2011 to 2012 identified new, deep gold deposits below the water table within Zone 4 of Smith. Development of the mineral deposit in this area would require dewatering to reduce the groundwater level. To resume mining in Zone 2 and 4 workings, the Zone 4 groundwater level must be lowered by approximately 200 ft, from a level of 6,600 FASL to 6,400 FASL.
Dewatering goals of the current operation are to reduce the water level to the pre 2008 level of approximately 6,535 FASL. Currently, pumping is underway to dewater the existing workings. This consists of the operation of two dewatering wells and a barge to dewater Zones 2 and 4. The wells are each pumping at approximately 700 gpm while the barge pumps at approximately 400 gpm. Two additional, 500 ft deep underground dewatering wells have been designed. Details for a typical well are presented in Figure 16-4.
| First Majestic Silver Corp. | Jerritt Canyon Gold Mine, SLR Project No: 233.03396.R0000
| ||||
| NI 43-101 Technical Report - April 30, 2021 | 16-10 | |||
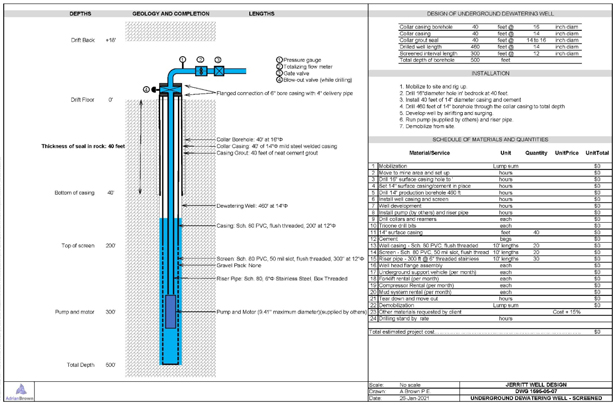
Source: (Adrian Brown, 2021)
Figure 16-4: Typical Dewatering Well
The dewatering schedule for Zones 2 and 4 are presented in Figure 16-5 and Figure 16-6. Dewatering at Smith is occurring at a rate of approximately 39 ft/month in Zones 2 and 4 concurrently. Zones 2 and 4 are expected to be fully dewatered to the bottom of the Mineral Reserves by June 2021. In the LOM schedule, material is not accessed until the water table has drawn down below the reserve elevation. Table 16-2 presents the scheduled Smith dewatering levels. SLR notes that this table represents predicted values as actual values beyond December 2020 were not reviewed by SLR.
Table 16-2: Smith Mine Dewatering Schedule
Jerritt Canyon
| 1-Jan-21 | 11-Jan-21 | 1-Feb-21 | 1-Mar-21 | 1-Apr-21 | 1-May-21 | 1-Jun-21 | 11-Jun-21 | |||||||||||
| Smith Zone 2 |
Water table elevation |
6,524 | 6,510 | 6,485 | 6,446 | 6,407 | 6,368 | 6,329 | 6,315 | |||||||||
| Smith Zone 4 |
Water table elevation |
6,594 | 6,580 | 6,555 | 6,516 | 6,477 | 6,438 | 6,399 | 6,385 | |||||||||
| First Majestic Silver Corp. | Jerritt Canyon Gold Mine, SLR Project No: 233.03396.R0000
| ||||
| NI 43-101 Technical Report - April 30, 2021 | 16-11 | |||
Figure 16-5: Smith Mine Zone 2 Dewatering Schedule
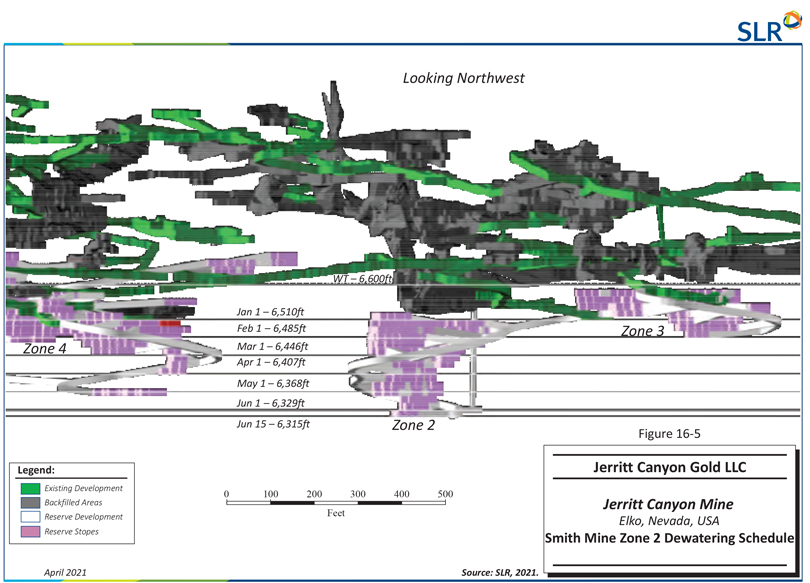
| First Majestic Silver Corp. | Jerritt Canyon Gold Mine, SLR Project No: 233.03396.R0000
| ||||
| NI 43-101 Technical Report - April 30, 2021 | 16-12 | |||
Figure 16-6: Smith Mine Zone 4 Dewatering Schedule
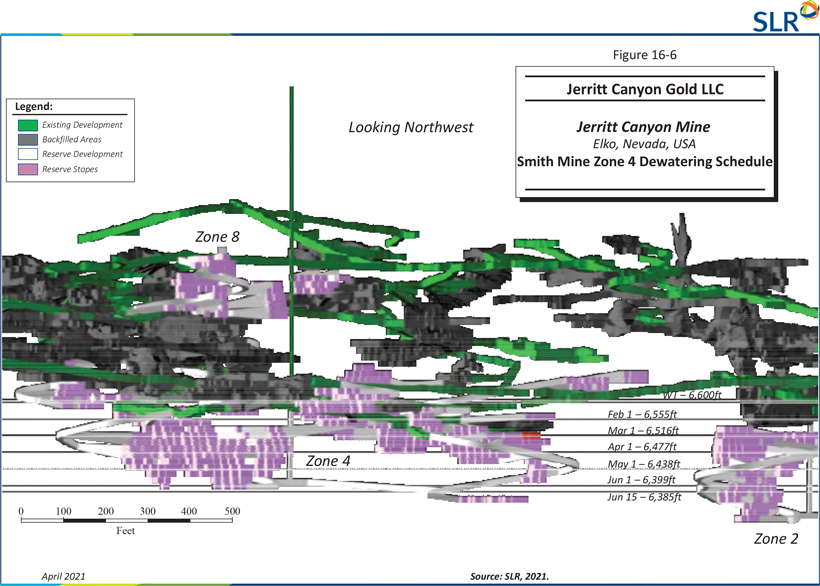
| First Majestic Silver Corp. | Jerritt Canyon Gold Mine, SLR Project No: 233.03396.R0000
| ||||
| NI 43-101 Technical Report - April 30, 2021 | 16-13 | |||
A connecting drift between Smith and SSX is being developed. Once the drift is established and piping infrastructure between the two mines installed, SSX will begin to draw down water. This drift is expected to be completed and water drawn down by the end of the first quarter 2022.
It is anticipated that over time Smith will be dewatered at a rate of 2,100 gpm. All pumped groundwater will continue to be conveyed to the water treatment plant (WTP) which has a capacity of 1,400 gpm. Any flows over 1,400 gpm will be routed to Zone 9 prior to treatment. Following treatment, the water is pumped to an underground injection well field consisting of three 1,200 ft deep injection wells located on USFS land. The injection wells and water disposal are covered under the existing Underground Injection Control (UIC) Permit UNEV93214. Due to the water treatment process minerals are added to the injected water to reduce dissolution of the aquifer. Two additional 500 ft deep dewatering wells are planned for 2022 in Zone 1.
Another aspect of Jerritt Canyon groundwater management is pollution control from TSF 1. Initially, TSF 1 was lined with compacted native soils. In addition, as shown in Figure 16-7, there are 90 seepage control wells, 14 freshwater recharge wells receiving water from the tailings WTP, and greater than 80 down gradient monitoring wells (Wanner et al, 2017). Currently, it is planned to replace these wells with five larger capacity wells. As of the writing of this Technical Report, one test well has been drilled and a step-drawdown test completed. The results of this test indicated that the well could be pumped at approximately 40 gpm. A longer term aquifer test with observation wells is planned. Water from these wells will also be pumped to the WTP. SLR notes that the recharge wells are also covered under UIC Permit UNEV93214.
| First Majestic Silver Corp. | Jerritt Canyon Gold Mine, SLR Project No: 233.03396.R0000
| ||||
| NI 43-101 Technical Report - April 30, 2021 | 16-14 | |||
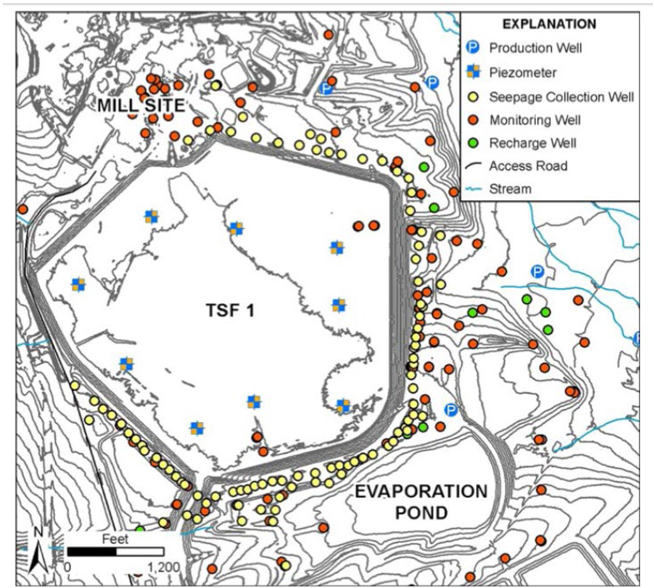
Source: (Wanner et al, 2017)
Figure 16-7: TSF 1 Seepage Control Wells
SLR notes that the current dewatering system does not have a backup power supply for surface water pumps. Any type of long term power loss can cause the operation to flood and damage infrastructure. A backup power system is recommended for site to keep critical infrastructure running and prevent damage.
| 16.6 | Mining Equipment |
Mining is completed with trackless equipment, including drill jumbos, bolters, production drills, loaders, and haul trucks. The contractor fleet is summarized in Table 16-3.
| First Majestic Silver Corp. | Jerritt Canyon Gold Mine, SLR Project No: 233.03396.R0000
| ||||
| NI 43-101 Technical Report - April 30, 2021 | 16-15 | |||
Table 16-3: Contractor Primary Mining Fleet
Jerritt Canyon
| Equipment Type/Size | Quantity | |
| Jumbo Drill |
6 | |
| Bolter |
8 | |
| LHD Loader 2.5 yd3 |
2 | |
| LHD Loader 6 yd3 |
12 | |
| Haul Truck 30 T |
17 | |
| Longhole Drill |
4 | |
| ANFO Loader |
3 | |
| Cement Truck |
2 | |
| Shotcreter |
2 | |
| Scissor Truck |
2 | |
| Jammers |
7 | |
| 16.7 | Production Rate |
The production rate from 2021 onward is planned at 1,200 stpd at SSX and 800 stpd at Smith. Table 16-4 presents the production from SSX and Smith from 2018 to 2020. SLR notes that the target production rates are achievable based on past production and given dewatering plans. SLR believes that there could be an opportunity to increase the production rate at Smith once the water is drawn down enough and more headings are available.
Table 16-4: Historical Mine Production 2018 to 2020
Jerritt Canyon
| Mine | Production Period | Tons Mined |
Mining Rate (stpd) |
Grade (oz/st Au) |
Contained Metal (oz Au ) | |||||
| Smith |
2018 | 367,188 | 1,006 | 0.143 | 52,486 | |||||
| 2019 | 279,575 | 766 | 0.156 | 43,743 | ||||||
| 2020 | 266,330 | 730 | 0.200 | 53,159 | ||||||
| SSX |
2018 | 524,170 | 1,436 | 0.155 | 81,172 | |||||
| 2019 | 436,010 | 1,195 | 0.171 | 74,437 | ||||||
| 2020 | 390,389 | 1,070 | 0.174 | 67,978 | ||||||
| First Majestic Silver Corp. | Jerritt Canyon Gold Mine, SLR Project No: 233.03396.R0000
| ||||
| NI 43-101 Technical Report - April 30, 2021 | 16-16 | |||
| 16.8 | Production Schedule |
The Jerritt Canyon production schedule is found in Table 16-5.
Table 16-5: Reserve Production Schedule
Jerritt Canyon
| Units | Total | 2021 Year 1 |
2022 Year 2 |
2023 Year 3 |
2024 Year 4 |
2025 Year 5 | ||||||||
| Operating Days |
days | 1,770 | 365 | 365 | 365 | 365 | 310 | |||||||
| Tons milled per day |
tons / day | 2,011 | 1,997 | 2,051 | 2,001 | 2,001 | 2,001 | |||||||
| Smith Production |
tons | 1,434,644 | 291,086 | 292,022 | 291,963 | 291,891 | 267,681 | |||||||
| Au |
oz/st | 0.23 | 0.19 | 0.24 | 0.21 | 0.22 | 0.28 | |||||||
| Au Contained |
oz | 324,017 | 54,477 | 69,230 | 62,738 | 63,222 | 74,350 | |||||||
| Waste |
tons | 928,101 | 392,416 | 238,916 | 181,456 | 68,656 | 46,657 | |||||||
| Development horizontal footage |
ft | 54,296 | 22,920 | 14,233 | 10,482 | 3,966 | 2,695 | |||||||
| SSX Production |
tons | 2,124,349 | 437,999 | 456,743 | 438,347 | 438,412 | 352,848 | |||||||
| Au |
oz/st | 0.18 | 0.18 | 0.19 | 0.18 | 0.18 | 0.17 | |||||||
| Au Contained |
oz | 379,146 | 77,037 | 84,664 | 80,812 | 77,537 | 59,097 | |||||||
| Waste |
tons | 330,794 | 72,906 | 141,591 | 66,892 | 36,296 | 13,109 | |||||||
| Development horizontal footage |
ft | 19,108 | 4,211 | 8,180 | 3,864 | 2,096 | 757 | |||||||
| Total Production |
tons | 3,558,993 | 729,085 | 748,765 | 730,310 | 730,303 | 620,529 | |||||||
| Au |
oz/st | 0.20 | 0.18 | 0.21 | 0.20 | 0.19 | 0.22 | |||||||
| Au Contained |
oz | 703,164 | 131,514 | 153,894 | 143,550 | 140,759 | 133,447 | |||||||
| Waste |
tons | 1,258,894 | 465,322 | 380,507 | 248,348 | 104,952 | 59,766 | |||||||
| Development horizontal footage |
ft | 73,405 | 27,131 | 22,413 | 14,345 | 6,062 | 3,452 | |||||||
| Total Moved |
tons | 4,817,887 | 1,194,407 | 1,129,271 | 978,658 | 835,255 | 680,295 | |||||||
| First Majestic Silver Corp. | Jerritt Canyon Gold Mine, SLR Project No: 233.03396.R0000
| ||||
| NI 43-101 Technical Report - April 30, 2021 | 16-17 | |||
| 17.0 | RECOVERY METHODS |
Mining and processing by the Freeport-FMC JV commenced at Jerritt Canyon in 1981. The initial processing facility processed mildly refractory, carbonaceous, preg-robbing mineralized material. Alkaline chlorination was used to passivate the carbonaceous constituents of the mineralized material to reduce preg-robbing during cyanidation to extract the gold. As a result of increases in chlorine consumption due to increased sulfide sulfur, the cost of operating the alkaline chlorination circuit increased. Thus, roasting, an alternative oxidation process that could treat both carbonaceous and sulfide refractory mineralized materials was selected to replace the chlorination circuit. The whole ore roaster was commissioned in 1989 and from 1989 to 1997, the two plants operated in parallel, with the chlorination circuit processing the less refractory mineralized materials at 3,500 stpd to 4,200 stpd until 1997, and the more refractory carbonaceous shale mineralized materials processed in the whole ore roaster at a design rate of 4,000 stpd. The design recovery of the whole ore roaster using oxygen instead of air was 87% to 90%. Pilot plant testing of the oxygen roasted calcine by Dorr Oliver (1987) achieved an average gold recovery of 88%. SLR notes that the process continues to operate consistently in the design range, depending primarily on roaster performance, as some of the mineralized materials are reported to have zero gold recovery without oxidation. The main deleterious elements are arsenic and mercury. The processing plant is designed with the appropriate gas cleaning systems including mercury scrubbing from the gas streams and mercury collection from the refinery retort condenser.
| 17.1 | Processing Plant |
The processing facilities at Jerritt Canyon are designed to operate at a rate of 4,500 stpd with an operating availability of 90% and are permitted to operate at 6,000 stpd. The plant operated at an average rate of 2,265 stpd during 2020. The facilities include:
| · | Primary crushing |
| · | Ore drying |
| · | Secondary crushing |
| · | Tertiary crushing |
| · | Dry grinding |
| · | Roasting |
| · | Thickening |
| · | Carbon in leach (CIL) |
| · | Carbon stripping |
| · | Carbon reactivation |
| · | Electrowinning |
| · | Electrowinning sludge refining |
| · | Oxygen plant |
| · | Cooling pond |
| · | Water evaporation pond |
| · | Tailings Impoundment |
Ore is delivered to the ROM area from the mines. The process flow sheet is presented in Figure 17-1.
| First Majestic Silver Corp. | Jerritt Canyon Gold Mine, SLR Project No: 233.03396.R0000
| ||||
| NI 43-101 Technical Report - April 30, 2021 | 17-1 | |||
| 17.1.1 | Primary Crushing |
ROM mineralized material is crushed to minus six inches with a 36 in. by 42 in., 200 hp jaw crusher.
| 17.1.2 | Dryer |
Crushed mineralized material from the primary crushing circuit is fed to the propane fired dryer via a 100 st surge bin and 48 in. by 20 in. apron feeder. The Heyl and Patterson dryer is 14 ft by 60 ft, driven by a 350 hp variable speed motor. Rotation speed is two to four revolutions per minute. The dryer shell contains 300 lifters (i.e., flights). The feed end of the dryer is equipped with a Hauck special open fired Starjet Sj750 Ratiomatic burner. Feed rate to the dryer is controlled to maintain mineralized material discharge moisture less than one percent. Discharge air from the dryer goes through two pulse-jet type bag houses, each containing 810 bags. Gas discharge from the bag houses is fed to a 56 ft, dual bed wet scrubber to remove remaining particles and mercury. Each bed contains 15 ft of Tri-Mer packing.
Material from the baghouse is moved with an FLSmidth Fuller-Kinyon pump directly to the roaster feed bin.
| 17.1.3 | Fine Crushing |
Dried mineralized material from the dryer is conveyed to the secondary crushing vibrating screen, a 5 ft by 12 ft double deck screen with 3⁄4 in. top deck screen panels and 1⁄4 in. bottom deck screen panels. Screen oversize is fed to the 4.25 ft standard Omnicone crusher. Minus 1⁄4 in. screen undersize by-passes the secondary crusher and is transported by screw conveyor and a standard conveyor belt to the high angle conveyor that joins the material on the fines conveyor from the crushing circuit. Fine material is transported to the 2,000 st capacity fine ore bin (FOB). Approximately 30% of the material discharging from the dryer discharge is minus 1⁄4 in.
Ore from the secondary crusher is conveyed to the 100 st tertiary crusher feed bin, which has two discharge points that each feed a 6 ft x 16 ft double-deck vibrating screen. The top deck of the screens has 3⁄4 in. openings and the bottom decks have 1⁄4 in openings. Oversize from each screen is fed to a 4.25 ft short head Omnicone crusher. Minus 1⁄4 in material by-passes the tertiary crushers and reports to fines conveyor that transports the material to a high angle conveyor that discharges to the FOB. Material stored in the FOB feeds the grinding circuit.
The fine crushing circuit is served by a north and a south baghouse. Fine material collected in the north baghouse is pneumatically conveyed to the roaster feed bin (RFB) by a puker system. The south baghouse has a FL Smidth Fuller-Kinyon pump to move fine material collected in the baghouse to the RFB.
| 17.1.4 | Grinding |
Ore from the FOB is conveyed to the 14.5 ft x 18.5ft ball mill. The grinding circuit was designed to reduce the mineralized material from 100% passing (P100) 1/4 in mineralized material to P100 35 mesh (i.e., 500 µm). The ball mill is driven by a 2,750 hp synchronous motor. The mixed ball charge is approximately 40% by volume. The makeup ball sizes are 2.5 in., 2.0 in., and 1.5 in. Mineralized material passes through the discharge grates to an air slide and then to a bucket product elevator that transfers the ground material to an Osepa air classifier. Classifier oversize reports back to the ball mill for further size reduction. The circulating load is approximately 300%.
Fines from the classifier oversize report to separator cyclones, where approximately 88% of the fines are removed from the air stream. The collected fines are deposited into the product bucket elevator feed air
| First Majestic Silver Corp. | Jerritt Canyon Gold Mine, SLR Project No: 233.03396.R0000
| ||||
| NI 43-101 Technical Report - April 30, 2021 | 17-2 | |||
slide. The air stream, with the remaining 12% entrained fines, reports to the 700 hp, 131,000 actual cubic feet per minute (acfm) separator fan. 66% to 75% of this stream is fed back into the air classifier through the separator fan, while 25% to 33% of the stream is bled into the classifier baghouse.
The classifier baghouse uses the 125 hp classifier baghouse fan to pull 44,800 acfm of air through the bag filters. The captured dust is transported via an air slide and the 60 hp product bucket elevator to the RFB.
| 17.1.5 | Roaster |
The roaster feed bucket elevator lifts the mixture of mineralized material and pulverized coal approximately 135 ft and discharges into the roaster feed air slide. A disengaging bin receives the air slide discharge and funnels this material into the fluidized feed distributor. The roaster system is comprised of two identical, side by side roaster trains, each train is permitted for 125 dry tons per hour (stph), however, normal operating conditions process 90 dry stph to 100 dry stph. The roasters are two-stage, countercurrent, fluid bed type, and utilize relatively pure oxygen to both fluidize the bed and oxidize refractory mineralized material. The mineralized material itself does not contain sufficient fuel value to sustain combustion so pulverized coal is added to control and maintain proper roasting temperatures in the stages. The temperature in the first stage is 1,030°F to 1,050°F. Retention time in each stage is one minute for every 4 in. water column (WC) (for example, 24 minutes at 95 in. WC in the first stage and 16 minutes in the second stage at 65 in. WC). The second stage discharge temperature is approximately 900°F.
Calcine from the roasters discharges into quench tanks for cooling.
| 17.1.6 | Gas Handling |
The gas handling circuit pulls the off-gas from the roaster first stage secondary cyclone and processes it to remove particulate material, sulfur dioxide gas, and mercury vapour prior to the discharge of clean gas to the atmosphere through the roaster stack. A vacuum, or negative differential pressure with respect to atmosphere, is maintained inside the roaster to prevent dust and toxic gases from escaping the vessel. This differential pressure is controlled by the operation of the gas handling circuit.
| 17.1.7 | Carbon in Leach |
Cooled slurry from the roaster quench system is pumped to a 100 ft diameter thickener. Thickener overflow is subsequently pumped to the cooling pond where it is recycled back to the roasters after cooling. Slurry from thickener underflow is pumped across a vibrating trash screen to remove oversize mineralized material particles, which are recycled back to the primary crusher. Trash screen undersize, which is approximately P80 200 mesh, discharges directly to the first of six CIL tanks. Milk of lime is added to the slurry and liquid sodium cyanide is added to the top of the slurry in the first CIL tank. Cyanide can also be added in subsequent stages as needed. Each CIL tank holds 20 g/L of coconut shell 6 mesh by 12 mesh activated carbon. Carbon is held in the tanks by screens with 18 mesh openings. The slurry in the CIL circuit flows by gravity from tank 1 to tank 2 to tank 3, and so on until the slurry discharges from the circuit. As carbon is loading with gold, it is advanced countercurrent to the slurry flow using carbon advance pumps. That is, the carbon is advanced from CIL tank 6 to tank 5 to tank 4 and so on until it is removed from CIL tank 1 and advanced to the carbon strip circuit. Slurry discharging from CIL tank 6 reports to the 30 mesh safety screen to collect any carbon that may have passed through the tank screens. The tailings are sampled by an inline Heath & Sherwood sample cutter before flowing to the TSF.
| First Majestic Silver Corp. | Jerritt Canyon Gold Mine, SLR Project No: 233.03396.R0000
| ||||
| NI 43-101 Technical Report - April 30, 2021 | 17-3 | |||
| 17.1.8 | Carbon Strip Circuit |
Activated carbon is stripped in six ton batches, using heat and pressure. The solution temperature is 280°F at a pressure of 50 psi to 60 psi. The flow rate is approximately 40 gpm and the average strip time is 12 hours to 14 hours.
Pregnant solution from the carbon strip solution reports to electrowinning (EW) cells where gold is recovered from the solution. Two EW cells, 150 ft3 and 50 ft3, respectively, operate in series.
| 17.1.9 | Refinery |
The EW cells are cleaned on a batch basis, with the resulting sludge pumped through a filter press to remove moisture, and then dried in a mercury retort for 48 hours. The temperature reaches 1,150°F to remove mercury from the sludge prior to smelting. Dried sludge from the retort furnace is mixed with flux (e.g., borax, niter, soda ash, and silica), which helps to create a stable slag to allow the oxidized impurities to separate from the precious metal doré as it is being smelted in the induction furnace. Doré bars weighing approximately 1,000 oz and containing approximately 90% to 95% gold are poured and shipped off site for additional refining. Mercury is collected from the retort condenser in one ton, flasks. Approximately five to six tons of mercury are produced annually at Jerritt Canyon. The mercury containers are shipped off-site to a third-party storage company.
| First Majestic Silver Corp. | Jerritt Canyon Gold Mine, SLR Project No: 233.03396.R0000
| ||||
| NI 43-101 Technical Report - April 30, 2021 | 17-4 | |||
Figure 17-1: Process Flow Sheet
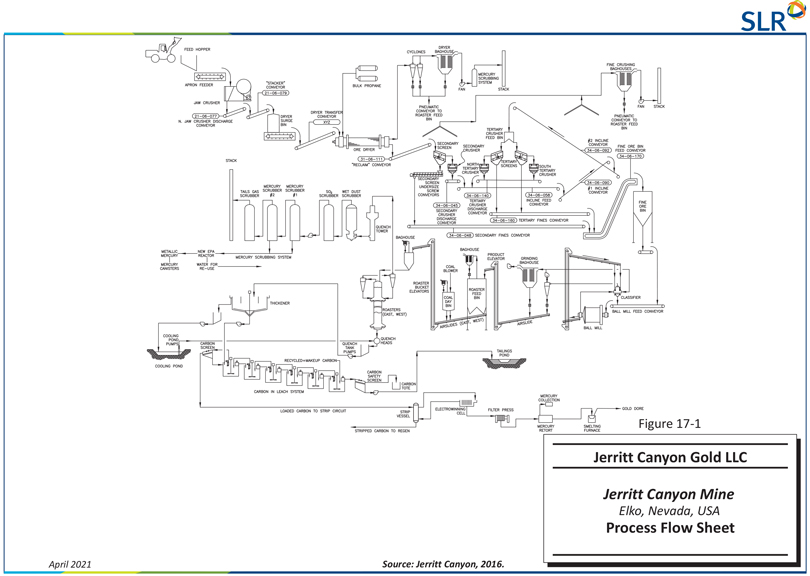
| First Majestic Silver Corp. | Jerritt Canyon Gold Mine, SLR Project No: 233.03396.R0000
| ||||
| NI 43-101 Technical Report - April 30, 2021 | 17-5 | |||
| 18.0 | PROJECT INFRASTRUCTURE |
Jerritt Canyon has been in production for many years and has well established infrastructure including:
| · | Office buildings |
| · | Warehouse facilities |
| · | Maintenance shops |
| · | Laboratory facilities |
| · | Communication networks |
| · | Onsite security |
| · | TSFs |
| · | Water management systems |
| 18.1 | Road Access |
The main access road is approximately seven miles long and is a 22 ft wide paved road between Nevada Highway 225 and the mill site. A 100 ft wide haul road provides access between the major ore-producing mines and the mill site. This road network is approximately 17 miles long.
| 18.2 | Water Sources |
Water for the mill site comes from two sources: deep underground water wells and a connected series of seepage recovery wells and pumps. All pumping wells are permitted through the Nevada Division of Water Resources water rights. Three potable water systems exist on the property and are permitted as public water supplies.
| 18.3 | Power |
Power to the mine site is supplied by NV Energy through a 125 kV, three-phase transmission line. Monthly power consumption is approximately 8.0 MWh.
| 18.4 | Sewage and Waste Disposal |
Domestic wastewater (sewage) at the mill site is treated in a packaged wastewater treatment plant. Treatment includes primary settling, air-enhanced digestion, and chlorine disinfection. Treated effluent is disposed of in the TSF. Each of the underground mines has an individual sewage disposal system consisting of a collection system, septic tank, and leach field.
| 18.5 | Ore Stockpiles |
There are a number of mineralized material stockpiles present at the mine site. The remote stockpiles are located distal to the mill facilities and are spread throughout the property mostly in the areas of the Smith, SSX, Saval 4, and West Mahala mines. There are also several mineralized material stockpiles located in the ROM area adjacent to the mill.
| First Majestic Silver Corp. | Jerritt Canyon Gold Mine, SLR Project No: 233.03396.R0000
| ||||
| NI 43-101 Technical Report - April 30, 2021 | 18-1 | |||
| 18.6 | Tailings Storage Facility |
Jerritt Canyon currently has two TSFs, TSF 1 and TSF 2, and two main process water storage facilities which include the water storage reservoir (WSR) and evaporation pond (Figure 18-1).
Currently, Jerritt Canyon operates a process WTP intended to produce water that meets NDEP Profile I discharge standards from the process water contained in the WSR and evaporation pond.
Additionally, Jerritt Canyon intends to convert the WSR into a TSF in the future, and has submitted to, and received approval from both the NDEP-Bureau of Mining Regulation and Reclamation (BMRR) and the NDWR for this planned construction. All these facilities are shown in plan view in Figure 18-1 and briefly described below:
| · | TSF 1 is currently inactive and in the process of being closed and reclaimed. |
| · | TSF 2 is currently active and used to dispose of tailings solids delivered to the impoundment in a slurry consisting of a ratio of 40 tons solids to 60 tons water. |
| · | The WSR is designed to store approximately 402 million gallons (Mgal) of process solution and is currently being maintained at is maximum operating capacity. |
| · | The evaporation pond is designed to store approximately 450 Mgal of process solution and is currently being maintained at its maximum operating capacity. The evaporation pond is also being used for disposal of brine concentrate from the process WTP. |
This section provides an overview and summary of the current and future planned operations of TSF 1 and TSF 2 together with a description of the mass and water balances for TSF 2 with regards to current and planned future production, and how the WSR, evaporation pond, and process WTP operation are integral to the overall water balance for TSF 2. SLR relies on the conclusions and recommendations in the various SRK Consulting reports listed in Section 27 of this Technical Report regarding the TSF and provides no conclusions or opinions regarding the stability of the listed dams and impoundments.
| First Majestic Silver Corp. | Jerritt Canyon Gold Mine, SLR Project No: 233.03396.R0000
| ||||
| NI 43-101 Technical Report - April 30, 2021 | 18-2 | |||
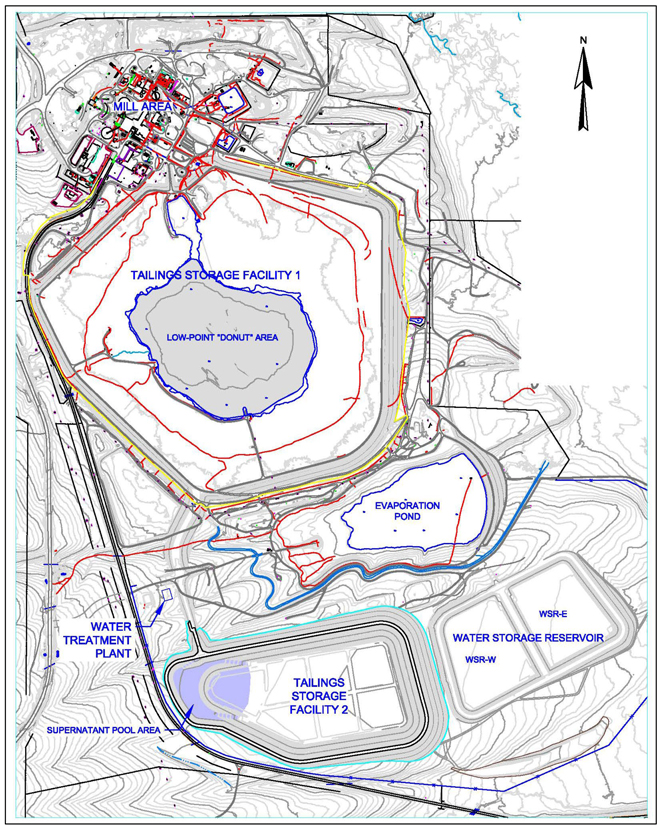
Figure 18-1: General Layout of Jerritt Canyon Tailings and Water Management Facilities
| First Majestic Silver Corp. | Jerritt Canyon Gold Mine, SLR Project No: 233.03396.R0000
| ||||
| NI 43-101 Technical Report - April 30, 2021 | 18-3 | |||
| 18.6.1 | TSF 1 |
TSF 1 was designed and constructed by Beckwith and Hauskins as an unlined facility in the mid-1980s, prior to the adoption of the Nevada Water Pollution Control regulations in 1991. As a result, seepage from TSF 1 was detected in the alluvium as early as 1981, when a recharge mound and migration of tailings decant solution were first observed. As TSF 1 was unlined, it seeped from its base and resulted in contamination of the underlying vadose zone and groundwater. The contamination was due mainly to chloride, which was used in the chlorination plant to oxidize mineralized material during process operations in the 1980s and 1990s.
This seepage from TSF 1 was found to be moving in the underlying vadose zone alluvium predominately to the south-southwest at a rate of approximately 450 gpm. Groundwater within a few hundred feet of TSF 1 was impacted with high concentrations of chloride and total dissolved solids. As a result of the seepage, TSF 1 was found to be noncompliant with the 1991 regulations which require tailings impoundments to be lined with a one foot thick soil layer of compacted earth with a hydraulic conductivity equivalent of 1x10⁻⁶ cm/s.
This resulted in the installation of groundwater recovery wells beginning in 1985 to intercept and pump contaminated groundwater back to the mill circuit, and downgradient groundwater monitoring wells to measure the chemistry. This procedure of interception well installation followed by groundwater monitoring well installation was repeated over the following +25 years of operation whenever an existing monitoring well indicated chloride concentrations above the NDEP “reference value” for groundwater (400 mg/l). In this instance, the monitoring well would become an interception well and a new monitoring well would be installed further downgradient. At the end of TSF 1’s continuous deposition operations between 1980 and 2014, there were 92 interception wells and 82 monitoring wells installed.
In 2010, SRK developed a Final Plan for Permanent Closure (FPPC) for TSF 1 which was subsequently approved by the State of Nevada regulatory agencies. For the 300 acre TSF 1 impoundment surface, the FPPC consists of regrading to promote runoff and preclude surface water impoundment, placing a working cover on which a high-density polyethylene (HDPE) liner will be installed, installing a three foot thick alluvial growth media cover, and revegetating the final surface with an approved seed mix. Reclamation and closure activities that have been completed on TSF 1 include:
| · | Outer embankment slopes have been graded, covered, and revegetated. |
| · | Removal of approximately 700 Mgal of supernatant water from the center low-point (i.e. “donut“) area of the impoundment surface (Figure 18-1) over a period of approximately four years. |
| · | Filling of the emptied low-point area with tailings slurry to achieve a tailings surface similar to that outside of the low-point area. In addition, the original closure plan called for authorization to deposit more tailings as necessary into the low-point area to account for settlement of the tailings surface in the low-point area. Additional tailings deposition into the low-point area occurred intermittently until the end of 2018. |
| · | Construction of a working cover for the remainder of the impoundment area that consists of waste rock, alluvium, or spent or rinsed heap leach ore, which forms the general closure topography that will ultimately drain water towards the closure spillway. Approximately 70% of this cover was placed between 2015 and 2020 outside the low-point area and is a minimum of two feet thick, but thicker in places depending on final surface slope requirements. |
| · | Installation of a synthetic liner over approximately 70% of the impoundment surface (i.e., excluding the low-point area). |
| First Majestic Silver Corp. | Jerritt Canyon Gold Mine, SLR Project No: 233.03396.R0000
| ||||
| NI 43-101 Technical Report - April 30, 2021 | 18-4 | |||
| · | Growth media has been installed over approximately 30% of the 300 acre impoundment surface. |
| · | Installation of a spillway capable of passing the Probable Maximum Flood (PMF). |
Activities that are in progress or have yet to be started include:
| · | Installation of above-liner drainage in areas of water accumulation requiring drainage. |
| · | Placement of three feet of alluvium above the liner to allow establishment of approved vegetation species. |
| · | Final covering of the low-point area with a synthetic liner and adequate above-liner drainage. |
| · | Final abandonment of TSF 1 internal monitoring wells and piezometers. |
| · | Final abandonment of TSF 1 seepage interception and monitoring wells. |
As a result of the removal of the supernatant water in the TSF 1 low-point area, monitoring data showed significant decreases in impoundment phreatic surfaces, as well as water levels in interception wells and external monitoring wells.
| 18.6.2 | TSF 2 |
For active tailings management, Jerritt Canyon is currently depositing tailings with a 40:60, solids/water, ratio into TSF 2 Phase 2. TSF 2 was designed by SRK in 2010 with a two layer HDPE liner which incorporates a LCRS to limit the risk of groundwater contamination (as in the case of its predecessor TSF 1). This design meets or exceeds the most current environmental and engineering standards.
TSF 2 (Phase 1) was constructed in 2011 and 2012 and commissioned in 2013 to store approximately 3.7 Mst of tailings. Shortly after commissioning, the NDEP-BMRR designated TSF 2 as a single lined tailings impoundment, because recoveries from its LCRS were significantly higher than flow limitations required by the State of Nevada. Regardless of this determination, the NDEP-BMRR still requires Jerritt Canyon to measure pumped flows from the LCRS as well as head development above the TSF 2 secondary HDPE liner.
As part of the TSF 2 monitoring program, JCG measures pumped flows from the LCRS, hydraulic head development above the TSF 2 secondary HDPE liner, and surrounding groundwater depths, and the presence (or absence) of process solution in the vadose zone underlying TSF 2.
Monitoring data for Phase 2 deposition indicate the following:
| · | Pumping from the LCRS is being performed at 20 gpm. |
| · | Head above the primary liner above the LCRS sump is approximately 15 ft. |
| · | Pumping from the overliner drain is being performed at 20 gpm. |
| · | Head above the overliner drain sump is approximately 50 ft. |
| · | Three vibrating wire piezometers installed in the TSF 2 embankment indicate no phreatic surface within the compacted earth embankment at its deepest section. |
The maximum operating elevations and related capacities for Phases 1 to 4 are summarized in Table 18-1. For Phases 2, 3, and 4, four feet of dry freeboard below the crest elevation is required to contain the PMF and wave run-up.
| First Majestic Silver Corp. | Jerritt Canyon Gold Mine, SLR Project No: 233.03396.R0000
| ||||
| NI 43-101 Technical Report - April 30, 2021 | 18-5 | |||
Table 18-1: Maximum Operating Elevations and Storage for TSF 2 Phases 1 to 4
Jerritt Canyon
| TSF 2 Phase | Max. Operating Tailings Elevation (FASL) |
Total Tailings Capacity at Max. Operating Elevation (acre-feet) |
Total Tailings Capacity1 at Max. Operating Elevation (tons) |
Embankment Crest Elevation (FASL) |
Theoretical Total Storage at Crest Elevation (acre-feet) | |||||
| Phase 1 |
6,366 | 2,297 | 3,740,000 | 6,372 | 2,729 | |||||
| Phase 2 |
6,378 | 3,202 | 5,231,600 | 6,382 | 3,531 | |||||
| Phase 3 |
6,386 | 3,868 | 6,319,000 | 6,390 | 4,213 | |||||
| Phase 4 |
6,398 | 4,942 | 8,072,300 | 6,402 | 5,319 | |||||
Note:
| 1. | For an assumed average dry density of 75 pounds per cubic foot (pcf). |
Phase 2 construction was performed and completed in 2018 as a 10 ft raise using the downstream method and extending the double-lined system to the crest elevation (TSF 2 Phase 2).
Phase 3 is currently being constructed as an eight foot raise using the centerline/downstream method (TSF 2 Phase 3). This centerline/downstream construction method is required to accelerate embankment construction due to tailings deposition above authorized Phase 2 elevations in the eastern portion of TSF 2. The Phase 3 HDPE containment will be installed as a single-lined system tied into the Phase 2 primary liner, as approved by the NDEP-BMRR. Construction and commissioning of TSF 2 Phase 3 is expected to be completed in May 2021.
A final Phase 4 raise is planned to add 12 ft to the Phase 3 embankment elevation and will allow storage of an additional 1.7 Mst of tailings as shown in Table 18-1. Phase 4 has been designed and approval is being awaited from the State of Nevada regulatory agencies (NDEP-BMRR and NDWR). Construction is planned for 2021 using the downstream method (TSF 2 Phase 4). The Phase 4 HDPE containment will also be installed as a single-lined system tied into the Phase 3 liner. Phase 4 construction will require approximately 1.5 million cubic yards of compacted fill excavated from an approved borrow source over one mile east of TSF 2.
| 18.6.2.1 Geological | and Hydrogeological Conditions |
The area underlying the footprint of TSF 2 is mapped as Qya (i.e. Quaternary alluvium), Figure 18-2. This unit is described as “relatively thin, coarse poorly sorted unconsolidated gravel and sand along present streams.” This material covers Older Quaternary alluvium (alluvial fans and older stream deposits) and Tertiary sedimentary units at the site. Both the Quaternary and Tertiary materials behave as soils from a geotechnical perspective. Hard bedrock was not encountered in any of the boreholes advanced for the TSF 2 geotechnical subsurface investigation performed in 2010 (SRK, 2011) and in 2015 (SRK, 2015).
Groundwater was not encountered in any of the boreholes advanced in the TSF 2 area during 2010 nor in any of the boreholes advanced into the potential borrow sources during 2015 (refer to Figure 18-2 for borehole locations).
| First Majestic Silver Corp. | Jerritt Canyon Gold Mine, SLR Project No: 233.03396.R0000
| ||||
| NI 43-101 Technical Report - April 30, 2021 | 18-6 | |||
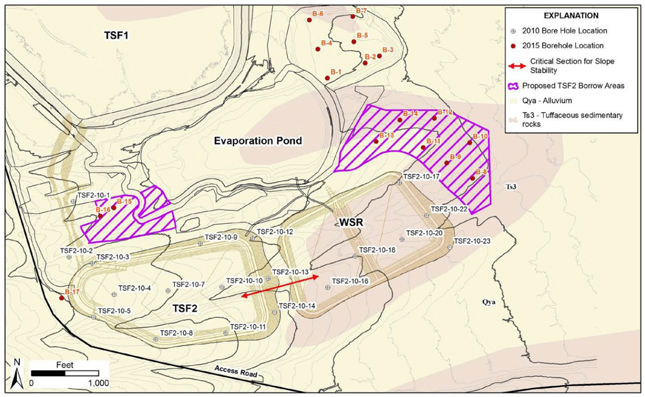
Source: SRK, 2011
Figure 18-2: TSF 2 Borehole Location and Geology (SRK, 2015)
The groundwater elevation data points nearest to TSF 2 are found in piezometers TSF2-PZ-2 and TSF2-PZ-4 and monitoring wells GW-50 and GW-83 (Figure 18-3). Groundwater depths for all but one of the TSF 2 groundwater monitoring points measured between 2018 and 2020 have been consistently greater than 100 ft. TSF 2 piezometer PZ-4 indicated the highest groundwater elevation at approximately 80 ft below ground surface. TSF 2 piezometers (PZ-1, PZ-3, PZ-5, PZ-6, PZ-7, & PZ-8) have remained dry since their installation in 2014, and TSF 2 monitoring well GW-82 has remained dry since 2018.
| First Majestic Silver Corp. | Jerritt Canyon Gold Mine, SLR Project No: 233.03396.R0000
| ||||
| NI 43-101 Technical Report - April 30, 2021 | 18-7 | |||
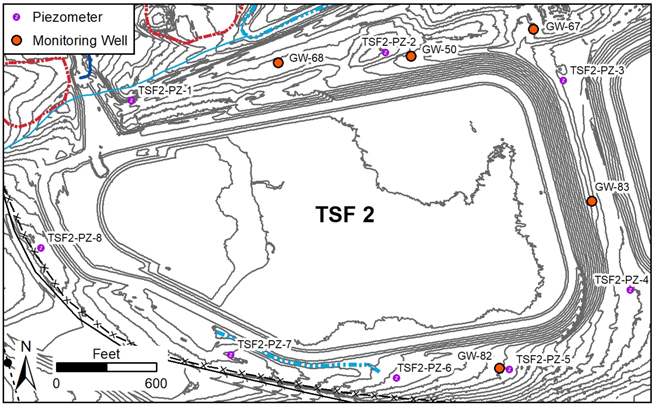
Figure 18-3: Locations of TSF 2 Piezometers and Monitoring Wells
| 18.6.2.2 | Geotechnical Stability |
Geotechnical properties for the native materials at the Jerritt Canyon and those used for construction of the TSF 2 embankment Phases 1 to 3 were evaluated through previous geotechnical investigations completed in 2010, 2015, and 2020. Borehole samples from TSF 2 borrow sources indicated the soils are comprised of mainly lean sandy clay or clayey sand with occasional inter-bedding of silty sand or clayey gravel (SRK, 2015).
The geomechanical properties for the fill material used in the Phase 4 stability analyses are based on a re-interpretation of the triaxial tests performed in 2010, and 2020 borrow sampling and analysis. Although some test results indicated a drain cohesion as high as 786 pounds per square foot (psf), SRK performed sensitivity analyses with lower values of cohesion. This demonstrated that the proposed grading plan with a downstream slope inclination of 2.5:1 (horizontal to vertical) meets the stability requirements. As a result of discussion held between SRK and the NDWR Office of Dam Safety, it was concluded that a cohesion of 0 psf and a drained (peak) friction angle of 32° would be assigned to the borrow material used to build the TSF 2 embankment.
Limit equilibrium slope stability analyses were performed for the Phase 4 expansion using circular slip surfaces through the whole embankment for the following conditions:
| · | Static conditions: |
| o | Embankment under its own weight (i.e., empty) |
| · | Seismic conditions: |
| First Majestic Silver Corp. | Jerritt Canyon Gold Mine, SLR Project No: 233.03396.R0000
| ||||
| NI 43-101 Technical Report - April 30, 2021 | 18-8 | |||
| o | Pseudo-static analysis conducted using a horizontal seismic coefficient equal to half the peak ground acceleration (PGA) with a return period of 10,000 years (i.e., half of 0.417 g, or 0.208 g). |
| o | Yield acceleration defined as the seismic coefficient yielding a pseudo static factor of safety of 1.0. |
| · | Post-earthquake, using residual shear strength. |
A phreatic surface within the tailings and through the lower part of the embankment was included in the model. The location of the phreatic surface was based on the LCRS sump elevation at the upstream toe of the embankment. If the LCRS and tailings underdrain system (overliner drain) is not pumped at a sufficient rate to keep phreatic levels at a minimum within the LCRS and underdrain sumps, it is possible for the phreatic table to be higher within the embankment, which could affect the stability. To minimize this risk, the phreatic levels within the LCRS and underdrain sumps should continue to be monitored with existing transducers. The phreatic level within the embankment will be accurately assessed through the instrumentation program (i.e. embankment vibrating wire piezometers) installed in the TSF 2 embankment.
The minimum factors of safety obtained for the Phase 4 expansion under the various conditions modelled are summarized in the Tailings Storage Facility 2 - Phase 4 Expansion Engineering Design Report (SRK, 2021). Results of geotechnical stability analyses performed by SRK for TSF 2 Phase 4 exhibit static factors of safety greater than 1.6 and pseudo-static factors of safety of 1.0. The results indicate that the stability requirements are met except for the pseudo-static condition. As the pseudo-static factor of safety is 1.0, which is less than 1.1, in accordance with Nevada Administrative Code (NAC) 535.210(9)(d), a deformation analysis was performed using the value of yield accelerations of 0.21 g and 0.22 g and the PGA of 0.417 g. The results for TSF 2 Phase 4 indicate the calculated seismic displacement is between five and six inches, which is less than the accepted state of practice criterion of 12 in.
| 18.6.2.3 | TSF 2 Phase 3 and 4 Depositional Mass Balance |
Separate mass balances were developed for the designs of TSF 2 Phase 3 and TSF 2 Phase 4 and are provided in Table 18-2 and Table 18-3, respectively. All calculations assume a daily deposition rate of 2,350 stpd.
For Table 18-2 (Phase 3), an average dry density of 75 pcf was used to determine the volumes of dry tailings deposited with height. This dry density was measured using precise topography while accounting for the tons of dry solids placed in the impoundment during Phase 3 expansion. SRK notes, that dry density is defined as mass of dry solids/total volume (solids and liquids). SRK is of the opinion that this relatively low value of 75 pcf is because the volume of water retained in the impoundment supernatant pond has saturated the tailings for almost the full height of the tailings profile.
Table 18-2 provides a tailings solids mass balance for the remaining capacity in the western portion of TSF 2 Phase 2 (i.e., between 6,356 FASL (the lowest topographic elevation measured in the July 14, 2020 bathymetric survey completed by NewFields), and 6,378 FASL (the maximum tailings storage elevation to ensure four feet of freeboard for PMF storm and wave run-up containment)).
Due to the tailings surface being nominally higher than 6,378 FASL in the eastern portion of TSF 2, tailings deposition is currently limited to the western portion of the impoundment, and the rates of rise, which are inversely proportional to area of deposition, are much higher than the rates of rise for the full area of the impoundment. This may potentially result in a lower than 75 pcf dry density and a shorter timeframe
| First Majestic Silver Corp. | Jerritt Canyon Gold Mine, SLR Project No: 233.03396.R0000
| ||||
| NI 43-101 Technical Report - April 30, 2021 | 18-9 | |||
than that calculated in Table 18-2. For Phase 3, Table 18-2 indicates that at an elevation of 6,378 FASL, a total mass of approximately 370,000 tons of dry tailings could be deposited on the western portion of TSF 2 over 161 days or 5.3 months beyond the July 14, 2020 bathymetric survey.
During the past year, high rates of rise contributed to a high degree of suspended solids in the TSF 2 supernatant pond which has to be removed as quickly as possible to maintain the supernatant pool in compliance with the maximum operating elevation of 6,378 FASL. This water is pumped directly into the WSR which is currently almost full, and then via the WTP to the mill circuit.
Based on March 2021 drone surveys and visual inspections of the TSF 2 Phase 2 supernatant pool and encroaching tailings beach, TSF 2 Phase 2 is rapidly approaching a condition where deposition will have to be reduced or temporarily suspended due to exceedance of the currently permitted Phase 2 operating level of 6,378 FASL in both the western and eastern portions of TSF 2. TSF 2 can resume full functionality once Phase 3 earthworks and HDPE liner deployment are completed, thus increasing the authorized storage elevation to 6,386 FASL.
SRK calculated a storage capacity of approximately 800,000 tons of dry solids between elevations 6,378 FASL and 6,386 FASL, which translates to an additional seven months of deposition at 2,350 stpd of tailings once the Phase 3 raise is commissioned.
Table 18-3 (Phase 4) provides the mass balance between elevations 6,378 FASL and 6,386 FASL and indicates much lower rates of rise from elevation 6,381 FASL (9 ft/annum) to elevation 6,398 FASL (6 ft/annum). As presented in Table 18-3, there is no tailings storage capacity between elevation 6,398 FASL and 6,402 FASL as this capacity is reserved for storage of the PMF (approximately two feet) and the calculated results of wave action (approximately two feet).As exhibited in Table 18-3, the areas are different for Phase 4 as a result of the implementation of downstream construction for the full raise height of 20 ft for the Phase 3 and 4 raises, thus the areas starting at elevation 6,378 FASL, and hence the volumes and dry tons at 75 pcf dry density, are also different. Phase 4 will require construction during the 2021 construction season (i.e., between May and November 2021) to ensure continued operation beyond November 2021. Phase 4 will be filled with tailings solids to 6,398 FASL within approximately 33 months (i.e., by December 2023). The total fill needed for the Phase 4 embankment is approximately 1.5 million cubic yards (compacted in-place).
Assuming a planned production rate of 2,350 stpd, TSF 2 Phase 4 will be filled to capacity by December 2023. The Jerritt Canyon Water Pollution Control Permit authorizes up to 3.0 Mst of dry tailings to be produced per annum (approximately 8,200 stpd). If the average deposition rate is increased above 2,350 stpd, the timeline for filling TSF 2 Phase 4 to capacity will be shortened proportionally.
| First Majestic Silver Corp. | Jerritt Canyon Gold Mine, SLR Project No: 233.03396.R0000
| ||||
| NI 43-101 Technical Report - April 30, 2021 | 18-10 | |||
Table 18-2: TSF 2 Phase 3 – Stage, Area, Storage, Time, Rate-of-Rise Characteristics
Jerritt Canyon
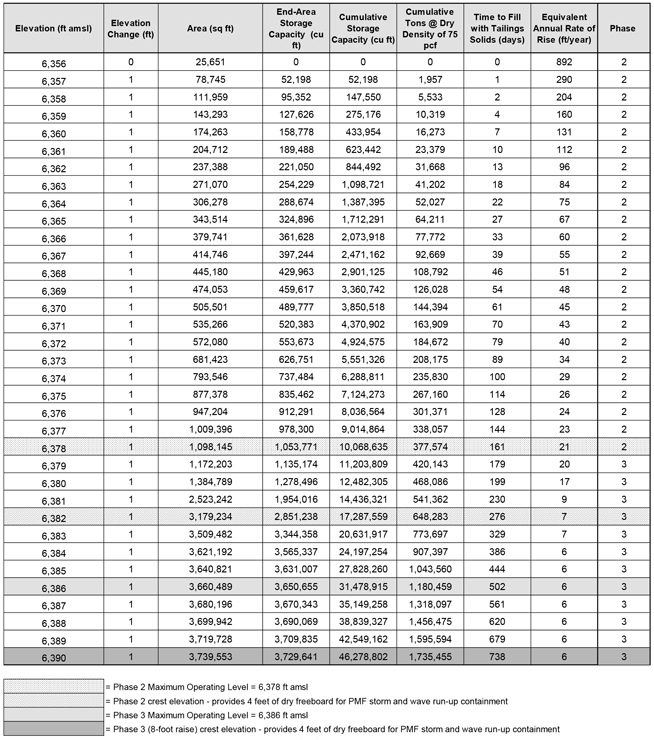
| First Majestic Silver Corp. | Jerritt Canyon Gold Mine, SLR Project No: 233.03396.R0000
| ||||
| NI 43-101 Technical Report - April 30, 2021 | 18-11 | |||
Table 18-3: TSF 2 Phases 2, 3, & 4 – Stage, Area, Storage, Time, Rate-of-Rise Characteristics
Jerritt Canyon
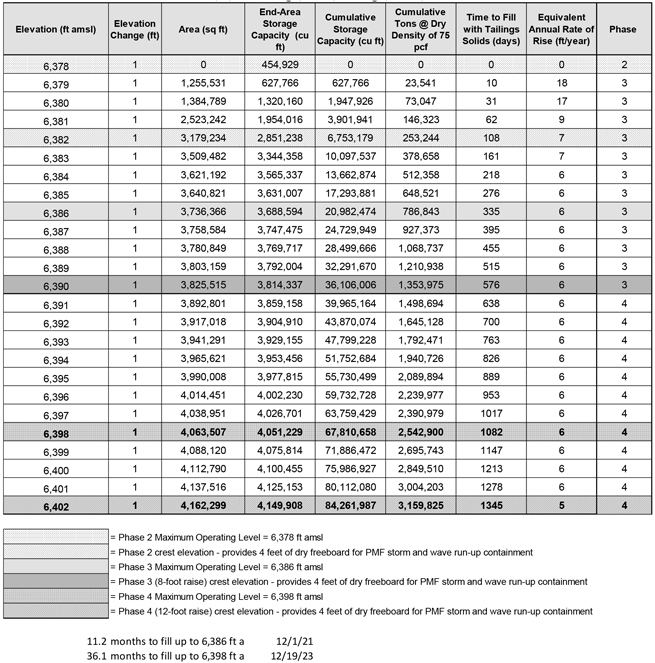
| 18.6.3 | WSR Conversion to TSF 3 |
The WSR was constructed between 2011 and 2012 and is capable of storing approximately 402 Mgal of process water. The WSR is comprised of two adjoining basins (west and east) bisected by an internal mid-berm dividing the WSR into West and East basins, of which 186 Mgal and 216 Mgal can be stored in the WSR West Basin (WSR-W) and WSR East Basin (WSR-E), respectively. The WSR-W and WSR-E basins are double geomembrane lined impoundments consisting of a 60 mil HDPE secondary liner, and an 80 mil HDPE primary liner, each with its own leak collection and recovery system (LCRS) constructed at the lowest
| First Majestic Silver Corp. | Jerritt Canyon Gold Mine, SLR Project No: 233.03396.R0000
| ||||
| NI 43-101 Technical Report - April 30, 2021 | 18-12 | |||
interior elevation of each basin. The crest of the mid-berm dividing the WSR-W and WSR-E is constructed at 6,263 FASL, while the final as-built elevation of the outer embankment crest was constructed to 6,268 FASL.
In 2020, Jerritt Canyon received approval from the NDEP-BMRR and the NDWR to convert the WSR to TSF 3. The WSR’s conversion to TSF 3 will allow Jerritt Canyon to dispose of and contain a maximum of 2.4 Mst of tailings solids. At an average mill production rate of 2,350 stpd, TSF 3 would provide approximately 2.6 years or 32 months of tailings storage.
Originally, Jerritt Canyon planned to convert the WSR into TSF 3 during the 2020 construction season after removing stored process solution via the process WTP. However, because the process WTP could not treat surplus process water at its design treatment rates, the WSR could not be emptied during 2020, and its conversion to TSF 3 could not be accomplished. As of March 21, 2021, the WSR is currently storing 193 Mgal in the WSR-E basin and 179 Mgal in the WSR-W basin for a total of 372 Mgal. Jerritt Canyon will need to convert the WSR into TSF 3 before December 2023 when TSF 2 Phase 4 is projected to reach its design capacity. Since TSF 3 would be commissioned before January 2024, additional tailings storage (beyond TSF 3) would need to be permitted and constructed before the end of 2025 to ensure a new facility is ready for tailings disposal by the middle of 2026. Likewise, if the average deposition rate is increased above 2,350 stpd, the timeline for filling TSF 3 and needing additional tailings storage beyond TSF 3 will be shortened proportionally.
The feasibility of converting the WSR into TSF 3 in a timely manner relies on the removal of 372 Mgal of process solution which is currently stored within the WSR by end 2022. Within the next two years, this volume will require removal via active and passive evaporation and/or treatment via the process WTP. If this volume cannot be removed by the end of 2022, other locations or methods of tailings disposal will need to be permitted, approved, and constructed.
| 18.6.4 | Evaporation Pond |
The evaporation pond was constructed in 2006 to store approximately 450 Mgal of process solution. The evaporation pond is double geomembrane lined with a 60 mil low linear density polyethylene (LLDPE) secondary liner, and an 8 mil HDPE primary liner with an LCRS constructed at the lowest interior elevation of its impoundment. The purpose of the evaporation pond was to facilitate the transfer of over 400 Mgal of TSF 1 supernatant solution to a double lined facility (i.e. evaporation pond). Removing this surplus process solution from TSF 1 has allowed for additional tailings deposition into TSF 1 and reduced the large hydraulic head on the TSF 1 impoundment causing process contamination of the vadose zone and groundwater underlying TSF 1.
Currently, the evaporation pond is being used to dispose of approximately 500 gpm of concentrate brine solution from the process WTP. As of March 2021, the evaporation pond is being maintained at its maximum operating elevation of 6,287 FASL and maximum capacity of 450 Mgal.
| 18.6.5 | Process Water Treatment Plant |
The process WTP (Figure 18-1) was designed by Linkan Engineering of Elko, Nevada to treat excess process water stored in the WSR to facilitate the construction of TSF 3. Treated effluent water (permeate) is temporarily stored in a 60,000 gallon tank before it is pumped to an injection field, where it is disposed of in injection wells WW#2, WW#3, and WW#4. Concentrate (brine) gravity drains via a dual containment pipeline to the evaporation pond for disposal, where it is recirculated back into the process solution
| First Majestic Silver Corp. | Jerritt Canyon Gold Mine, SLR Project No: 233.03396.R0000
| ||||
| NI 43-101 Technical Report - April 30, 2021 | 18-13 | |||
inventory. Fluids from the WTP clarifier underflow are pumped via a dual containment pipeline to the tailings slurry pipeline for disposal into TSF 2.
As of March 2021, the process WTP treats approximately 700 gpm of surplus process solution from the WSR-E basin. Of this amount, approximately 200 gpm is permeate and approximately 500 gpm is concentrate brine being disposed of in the evaporation pond. Therefore, the process WTP is only removing 200 gpm from the overall water balance inventory. Under these conditions, SRK recommends a significant increase in the WTP capacity is needed to eliminate positive water balances during the winter and spring.
| 18.6.6 | Tailings and Process Solution Water Balance |
SRK completed tailings and process solution water balance calculations to estimate pumping capacities required to maintain the supernatant pool elevation at least four feet below the TSF 2 embankment crest elevation, both during Phase 4 construction and operation. These calculations were used to determine future TSF scheduling and operational timing. The water balance includes inflows, outflows, and change in storage calculations, to assess the pumped flowrate that would have to be maintained during placement of tailings slurry in Phases 3 and 4. The resulting rate of supernatant removal varies from approximately 400 gpm to 600 gpm, which are currently being achieved by operations.
| 18.7 | Water Treatment Plants |
| 18.7.1 | Tailings Water Treatment |
An Engineering Design Change (EDC) for the installation of a WTP consisting of chemical pre-treatment, pH adjustment, coagulation, oxidation, an inclined plate settler, ultrafiltration (UF) system, sea water reverse osmosis (SWRO), and ion exchange (IX) vessels to treat antimony, arsenic, cadmium, chloride, manganese, mercury, nitrogen, selenium, sulfate, thallium, and total dissolved solids (TDS) was approved by the NDEP-BMRR in December 2016. Following approval, the WTP was subsequently commissioned in November 2019. Water contained in the WSR-E, WSR-W, TSF 2, and the evaporation pond requires treatment so the ponds can be drained to remove excess water from the site and facilitate future tailings storage.
The WTP is designed to process 800 gpm with a maximum flow of 1,000 gpm. Raw water from the Dash pit dewatering wells and the WSRs is pumped through separate double contained pipelines to a polyethylene reaction tank. Upstream from the reaction tank, sodium dimethyldithiocarbamate (NaDTC), sodium hydroxide (NaOH), ferric chloride (FeCl3), and sodium hypochlorite (NaOCl) are added to the raw water through an inline mixer for chemical pre-treatment, pH adjustment, coagulation, and oxidation, respectively. Process water is then pumped to an inclined plate settler (IPS) for solids separation. The solids laden underflow from the IPS is pumped back to TSF 2. The clarified effluent from the IPS is gravity fed to the UF feed tank.
Clarified process water is then pumped by variable frequency drive controlled feed pumps through 200 µm pre-strainers to protect the ultrafilters, and then through a UF system for suspended solids removal. Antiscalant (Vitec 3000) and FeCl3 is dosed into the UF feed tank for scale control and coagulation of fugitive suspended solids. Sulfuric acid is also added for pH adjustment. Hydrochloric acid may be substituted as the acid depending on cleaning characteristics observed during operation. After filtration, the UF filtrate flows to another polyethylene tank for SWRO feed. The process water is then pumped through three parallel SWRO units for removal of TDS. Bisulfide and antiscalant (Vitec 3000) is
| First Majestic Silver Corp. | Jerritt Canyon Gold Mine, SLR Project No: 233.03396.R0000
| ||||
| NI 43-101 Technical Report - April 30, 2021 | 18-14 | |||
added to the SWRO feed for chlorine removal and scaling control. These chemicals are added through an inline mixer into the SWRO feed pipe.
UF and SWRO cleaning waste and SWRO concentrate is sent to one of two sump chambers inside of the WTP that gravity-drains to the evaporation pond. Water from periodic UF flushes contains particulate solids and is sent to the other sump chamber which is recirculated to the reaction tank. SWRO permeate is sent to IX vessels for final polishing. Backwash water from the IX vessels is pumped to the same sump chamber as the SWRO and UF cleaning waste. Treated water from the IX is pumped to a 60,000 gallon existing tank located next to the Smith WTP. This water comingles with the treated effluent from the Smith WTP and is pumped through HDPE pipelines to injection wells.
| 18.7.2 | Smith Mine Water Treatment Plant |
The Smith WTP is designed to reduce arsenic and antimony concentrations in the Smith water to Nevada Profile 1 standards using chemical pre-treatment, coagulation, filtration and granular ferric oxide, GFO, adsorption at a design rate of 1,400 gpm. The Smith WTP was designed as an addition to the existing Dash WTP which receives approximately 1,400 gpm of dewatering well water from the Dash pit. Raw water from the Smith dewatering wells is pumped to a 282,000 gallon tank that serves as dewatering equalization, fire water pressure and reserve volume, and Smith WTP feed. Raw water flows by gravity from the 282,000 gallon tank to the WTP via a 12 in. HDPE pipeline. Upon entering the WTP, a pressure reducing valve reduces the pipeline pressure to a level appropriate for the process equipment.
Treatment begins with the addition of FeCl3 for coagulation and iron adsorption, sulfuric acid (H2SO4) to lower pH, and NaOCl for oxidation. Chemically pre-treated water flows through a reaction vessel, then to coagulation/filtration vessels, and finally through adsorption vessels into an existing 60,000 gallon finished water tank. A bypass/blend line allows controlled blending of filtrate from the coagulation/filtration vessels with water that has undergone the entire treatment process. NaOH will be added post treatment to raise the pH to permissible levels. All plant vessels will be connected by polyvinylchloride (PVC) piping and automatic valves for process control.
The coagulation/filtration and adsorption vessels are backwashed regularly into cone bottom backwash (BW) tanks. Process water is transported inside the building via single wall PVC pipes, and inside pipe in pipe configurations between the building and tank farm area. Supernatant from the BW tanks is transported via pipe in pipes from the tanks and pumped to the WTP intake, upstream from chemical addition. Solids laden process water is pumped from the BW tanks to the TSF for disposal.
The effluent from the WTP is pumped to the existing 60,000 gallon tank where it is comingled with treated effluent from the tailings WTP. Treated water is pumped using a dedicated pipeline to injection wells. The disposal pipeline is a combination of double containment methods using buried pipe in pipes, single wall pipes in lined trenches, and above grade pipe in pipes. The various methods are required to ensure the process pipe can be drained if service is necessary.
| First Majestic Silver Corp. | Jerritt Canyon Gold Mine, SLR Project No: 233.03396.R0000
| ||||
| NI 43-101 Technical Report - April 30, 2021 | 18-15 | |||
| 19.0 | MARKET STUDIES AND CONTRACTS |
| 19.1 | Markets |
The principal commodities at Jerritt Canyon are freely traded at prices that are widely known so that prospects for sale of any production are virtually assured. SLR used a gold price of US$1,700/oz Au for Mineral Resources and US$1,500/oz Au for Mineral Reserves.
The QP has reviewed the metal price assumptions and considers them reasonable to be used in the economic analysis that supports the Mineral Reserve estimates in this Report.
| 19.2 | Supply and Services Contracts |
Contracts and agreements are currently in place for the supply of goods and services necessary for the mining operations. These include, but are not limited to, contracts for drilling services, mine development and mine production, waste and ore haulage, maintenance service for the mining equipment, specialized maintenance service for processing plant equipment, supply of diesel for equipment operation, supply of electrical power, supply of explosives, supply of process reagents, and transportation and logistics services including infrastructure maintenance, catering and personnel transportation.
In the opinion of the QP, the terms, rates and charges set in the relevant service contracts and supply agreements for the mining and processing operation are within industry practice in North America.
| First Majestic Silver Corp. | Jerritt Canyon Gold Mine, SLR Project No: 233.03396.R0000
| ||||
| NI 43-101 Technical Report - April 30, 2021 | 19-1 | |||
| 20.0 | ENVIRONMENTAL STUDIES, PERMITTING, AND SOCIAL OR COMMUNITY IMPACT |
Jerritt Canyon has been in operation since 1981 and is primarily located on private land controlled by JCG and public land predominantly administered by the USFS, with small portions administered by the BLM. The Jerritt Canyon area consists of surface and underground mines, rock disposal areas (RDAs), haul roads, maintenance facilities, ancillary and support facilities, processing facilities, and TSFs.
| 20.1 | Environmental Studies |
Prior to and during operation, numerous environmental studies and evaluations have been conducted to support permit applications and operations. An Environmental Impact Statement (EIS) was completed and the Record of Decision (ROD) was issued in 1980.
Jerritt Canyon has a history of environmental concerns and permit exceedances that have been mitigated; however, a number of environmental regulatory concerns and permit exceedances currently exist. Since taking ownership in 2015, JCG has worked and continues to work diligently to mitigate the historic and current environmental concerns.
| 20.2 | Project Permitting & Current Status |
Operating permits are in place and current or in the process of being renewed, as presented in Table 20-1. At the time JCG assumed ownership from Veris on June 24, 2015, Veris was operating under the 2013 Second Modified Consent Decree. This decree has since been replaced by the Agreement for Adequate Reclamation Bond and Rock Disposal Area Seepage Treatment (NDEP, 2015) between JCG and the NDEP.
| First Majestic Silver Corp. | Jerritt Canyon Gold Mine, SLR Project No: 233.03396.R0000
| ||||
| NI 43-101 Technical Report - April 30, 2021 | 20-1 | |||
Table 20-1: Operating Permits
Jerritt Canyon
| Name of Governmental Authority |
License or Permit # | Name and Date of License, Permit, Approval or Consent |
Description and Expiry | Comments | ||||
| NDW1 |
S-464035 | Industrial Artificial Pond Permit | Mining Operation – Mill Facility period August 12, 2019 to August 11, 2022 |
- | ||||
| NDW |
S-464039 | Industrial Artificial Pond Permit | TSF 2, period August 8, 2019 to August 7, 2022 | - | ||||
| NDW |
S-464038 | Industrial Artificial Pond Permit | Water Storage Reservoir, period August 12, 2019 to August 11, 2022 | - | ||||
| NBRLPG2 |
5-5333-02 | Class 5 License | Lower Truck Shop Propane Tank, Expires July 31, 2021 |
- | ||||
| NBRLPG |
5-5333-03 | Class 5 License | Roaster Propane Tank Expires July 31, 2021 |
- | ||||
| NBRLPG |
5-5333-01 | Class 5 License | Lee Smith Mine Propane Tank, Expires July 31, 2021 |
- | ||||
| NBRLPG |
5-5333-04 | Class 5 License | SSX Mine Propane Tank Expires July 31, 2021 |
- | ||||
| NBRLPG |
5-5333-06 | Class 5 License | Steer Portal Propane Tank Expires July 31, 2021 |
- | ||||
| USFWS3 |
MB78444B-0 | Application for Migratory Bird Special Purpose Utility Permit, dated November 2014 | Effective June 2, 2016; Expired March 2, 2019 |
Renewal has been submitted. Have not received updated permit yet due to delays related to COVID-19. | ||||
|
NDEP-BAC4 |
AP1041-2217 | Mercury Operating Permit to Construct: Phase II for Facility ID No. A0004 | Signed August 25, 2015 This permit does not expire |
- | ||||
| First Majestic Silver Corp. | Jerritt Canyon Gold Mine, SLR Project No: 233.03396.R0000
| ||||
| NI 43-101 Technical Report - April 30, 2021 | 20-2 | |||
| Name of Governmental Authority |
License or Permit # | Name and Date of License, Permit, Approval or Consent |
Description and Expiry | Comments | ||||
| NDEP-BWPC5 |
NS2009504 | Groundwater Discharge Permit – Septic System Permit | Effective November 4, 2014; Expired November 3, 2019 |
Permit renewal application submitted on April 24, 2019. New permit has not been issued yet. | ||||
| NSFMD6 |
88128 | Fire Marshal Hazardous Materials Permit for the [Mine]-FDID 05001 | Expired February 28, 2021 | - | ||||
| NDEP- BAC |
1041-3422 | Class I Air Quality Operating Permit for Facility ID No. A0004 | Expired March 31, 2019 | Renewal currently in progress. | ||||
| NDEP-BWPC |
NEV0000020 | Water Pollution Control Permit | Expired September 17, 2019 | Renewal currently in progress. | ||||
| NDEP-BWPC |
UNEV93214 | Underground Injection Control Permit | Effective April 26, 2017; Expires April 26, 2022 |
- | ||||
| NDEP-BWM7 |
SW381 | Jerritt Canyon Mill Area Class III Landfill Waiver | Effective September 29, 2015; Expires September 29, 2020 |
Terminated on July 16, 2020. | ||||
| NDEP-BWM |
SW384 | Jerritt Canyon Burns Basin Area Class III Landfill Waiver | Effective September 29, 2020; Expires September 29, 2025 |
- | ||||
| NDEP-BWM |
SW385 | Jerritt Canyon Alchem Area Class III Landfill Waiver | Effective September 29, 2020; Expires September 29, 2025 |
- | ||||
| NDEP-BWM |
SW1775 | Jerritt Canyon New Mill Area Class III Landfill Waiver | Effective October 20, 2015; Expired October 20, 2020 |
Renewal application submitted on June 30, 2020 | ||||
| NDEP-BWPC |
GNV980001-50004 | Oil Water Separator permits for the [Mine] | The original permit for the site was issued in 1998 and has been maintained. | Renewed annually. | ||||
| NDEP-BMRR |
77 | Reclamation Permit | Effective June 30, 2016 | - | ||||
| NDPBHRCP8 |
05-11-0133-01 | Radioactive Materials License | N/A | - | ||||
| USFS |
Multiple | All authorizations or approvals in any form related to activities of the mine on federal lands (including approximately 350 Plans of Operation) | Effective June 26, 1984. | Updated annually with Annual Work Plans (AWPs). | ||||
| First Majestic Silver Corp. | Jerritt Canyon Gold Mine, SLR Project No: 233.03396.R0000
| ||||
| NI 43-101 Technical Report - April 30, 2021 | 20-3 | |||
| Name of Governmental Authority |
License or Permit # | Name and Date of License, Permit, Approval or Consent |
Description and Expiry | Comments | ||||
| BLM |
Various | All authorizations or approvals in any form related to activities of the mine on federal lands | Updated annually as disturbance requests are submitted. | - | ||||
| NDEP-BWPC |
NVR300000 | General stormwater discharge permit and associated authorization | Effective March 1, 2013 Expired February 28, 2018 |
This permit is currently in administrative continuance. Notices will be sent out by NDEP when renewal is required. | ||||
| NDWR |
N/A | Permit to appropriate waters | N/A | - | ||||
| NDWR |
J-171, South Drainage Retention Dam | Permits, authorizations or approvals to construct impoundments/dam safety | N/A | Annual Fee due each year by December 31. | ||||
| J-172, North Drainage Retention Dam | ||||||||
| J-249, Overflow Catchment | ||||||||
| J-313, Cooling Pond | ||||||||
| J-490, TSF 1 | ||||||||
| J-578, Evaporation Pond | ||||||||
| J-667, TSF 2 | ||||||||
| J-668, WSRs | ||||||||
| NDEP-BSDW9 |
EL-3013-12NTNC | Mill site Permit to Operate a Public Water System | Effective June 30, 2020; Expires June 30, 2021 |
Permit fees paid. Awaiting formal new permits. | ||||
| NDEP-BSDW |
EL-0313-TP03 | Permit to Operate a Treatment Plant – SSX Mine Arsenic Treatment plant | Effective June 30, 2020; Expires June 30, 2021 |
Permit fees paid. Awaiting formal new permits. | ||||
| First Majestic Silver Corp. | Jerritt Canyon Gold Mine, SLR Project No: 233.03396.R0000
| ||||
| NI 43-101 Technical Report - April 30, 2021 | 20-4 | |||
| Name of Governmental Authority |
License or Permit # | Name and Date of License, Permit, Approval or Consent |
Description and Expiry | Comments | ||||
|
NDEP-BSDW |
EL-0313-12NTNC | Permit to Operate a Public Water System – SSX Mine |
Effective June 30, 2020; Expires June 30, 2021 |
Permit fees paid. Awaiting formal new permits. | ||||
Notes:
| 1. | Nevada Department of Wildlife (NDW) |
| 2. | Nevada Board for the Regulation of Liquefied Petroleum Gas (NBRLPG) |
| 3. | United States Fish and Wildlife Service (USFWS) |
| 4. | Nevada Division of Environmental Protection - Bureau of Air Pollution Control (NDEP-BAC) |
| 5. | Nevada Division of Environmental Protection - Bureau of Water Pollution Control (NDEP-BWPC) |
| 6. | Nevada State Fire Marshal’s Division (NSFMD) |
| 7. | Nevada Division of Environmental Protection - Bureau of Waste Management (NDEP-BWM) |
| 8. | Nevada Division of Public and Behavioral Health, Radiation Control Program (NDPBHRCP) |
| 9. | Nevada Division of Environmental Protection - Bureau of Safe Drinking Water (NDEP-BSDW) |
| First Majestic Silver Corp. | Jerritt Canyon Gold Mine, SLR Project No: 233.03396.R0000
| ||||
| NI 43-101 Technical Report - April 30, 2021 | 20-5 | |||
Currently, SLR has identified seven environmental issues that have the potential to impact JCG’s ability to extract Mineral Reserves or the cost of doing so. Based on the data provided and communications with JCG, in addition to SLR’s experience working in the state of Nevada with the NDEP and United States Environmental Protection Agency, these environmental issues are being addressed by JCG in an acceptable manner and pace for the regulators. Therefore, the potential negative impact on JCG’s ability to extract the Mineral Reserves is minimal and it is likely that the mitigation of these issues will affect the cost of extracting Mineral Reserves. The issues identified are listed below and discussed in further detail in the following subsections:
| 1. | Numerous requests for modifications to permits are pending, and Jerritt Canyon has a track record of failure to follow through on timelines for commitments made to the regulators. This is a legacy issue that JCG has inherited. |
| 2. | Multiple violations of the Class I Air Quality Operating Permit and the Mercury Operating Permit to Construction in the past two years. Mitigation efforts are in progress but have not yet demonstrated the ability to achieve permit levels. |
| 3. | Multiple exceedances of the Reference Value water quality standards at injection wells and monitoring wells related to the UIC permit including aluminum, antimony, arsenic, iron, magnesium, manganese, nitrite, nickel, TDS, thallium, and sulfate. |
| 4. | Surface water: High concentrations and increasing concentrations of multiple constituents of concern including TDS and sulfate in surface water associated with mining activities and in particular seepage from the RDAs. These will be addressed though either active or passive remediation systems. |
| 5. | Groundwater: High concentrations and increasing concentrations of multiple constituents of concern including TDS, sulfate, arsenic, calcium, chloride, and selenium at multiple groundwater monitoring locations associated with mining activities, and in particular seepage from TSF 1. |
| 6. | Water management constraints including water treatment facilities. |
| 7. | Violation of Secondary Drinking Water Standards for iron at a water supply well. |
| 20.2.1 | Permitting Practices and Plans |
SLR’s review of the environmental permitting documents provided by JCG indicate that multiple permits are currently in the process of being renewed or updated, including the Class I Air Quality Operating Permit which currently has violations. In the last five years multiple requests for permit modifications and operating changes have been made by JCG and the conditions of the approvals have not been met within the time frame granted by NDEP. Three examples of this are:
| · | Additional tailings storage was to be constructed during the 2017 construction period (SRK, 2016) |
| · | Deposition of tailings was to revert back to TSF 2 by the end of October 2017 (SRK, 2017) |
| · | JCG has failed to meet many of the deadlines outlined in the Agreement for Adequate Reclamation Bond and Rock Disposal Area Seepage Treatment (NDEP, 2015) |
Jerritt Canyon has remained operational throughout these requests and operational changes, which demonstrates a positive working relationship between the JCG and the NDEP, as well as state and local support for the continued operation of Jerritt Canyon. Continued issues modifying and most importantly, meeting the conditions of permit approvals may, however, present a risk to the future operations of Jerritt Canyon.
| First Majestic Silver Corp. | Jerritt Canyon Gold Mine, SLR Project No: 233.03396.R0000
| ||||
| NI 43-101 Technical Report - April 30, 2021 | 20-6 | |||
| 20.2.2 | Class I Air Quality Operating Permit and Mercury Operating Permit Violations |
Jerritt Canyon has had exceedances for the Class I Air Quality Permit and Mercury Operating Permit within the past two years and is currently responding to the violations. Although progress is being made, continued exceedances of regulatory standards may result in fines, significant modification of permits, and/or the revocation of permits, however, SLR considers revocation of permits to be unlikely considering the mitigation efforts being taken by JCG.
The Class I Air Quality Permit has historically and is currently a challenge for Jerritt Canyon. Air monitoring and modelling indicates that, even after completing a number of changes to the processing facilities, passing the applicable standards pertaining to particulate matter 2.5 (PM 2.5) remain. Mitigation activities are ongoing by JCG.
| 20.2.3 | High/Increasing Concentrations in Groundwater and Surface Water |
Multiple constituents of concern including TDS, sulfate, arsenic, calcium, chloride, and selenium are elevated in seepage from the RDAs. Surface water concentrations can be directly associated with the RDAs which have been in various stages of water treatment/reclamation since 1999 as described in Section 20.2.4 and are currently being addressed in the proposed RDA closure plan. High/increasing concentrations of constituents of concern in groundwater associated with the operation of the TSF 1 as described in Section 20.2.5 and are currently being mitigated through closure and groundwater extraction wells. Additional impacts to groundwater quality are also be associated with the underground injection wells.
| 20.2.4 | Seepage from Rock Disposal Areas |
The original plan of operation of which the EIS ROD is based on, selected a valley fill option as the preferred RDA design (USFS and BLM, 1980). Design criteria rely on structuring the RDAs by draining storm water run-off and snowmelt towards the interior of the RDAs. This design resulted in seepage from the toes of four RDAs, which have elevated levels of TDS and sulfates. The four RDAs are:
| · | Marlboro Canyon |
| · | Gracie |
| · | Snow Canyon East |
| · | Dash East |
Jerritt Canyon staff have been working with NDEP-BMRR to develop mitigation actions and monitoring plans for the seepages since the late 1990s.
In 1999, a biological treatment method that used a surface sedimentation pond was studied and proved ineffective in addressing the elevated sulfates in the seepage from the RDAs. Therefore, in 2003, a treatment method that utilized a biological sulfate reducing trench (SRT) was analyzed for the Marlboro Canyon RDA. Monitoring of the water from this SRT continues presently; however, since 2004 target constituents are still elevated.
In 2012, Veris, commissioned a third party consultant to evaluate the Marlboro Canyon SRT and make any recommendations for improved operation. Their findings determined that while the passive treatment method was treating the seepage, the capacity was insufficient to treat the amount of seepage from the RDA as well as applicable water quality standards. As a result of their findings, Veris began assessing remedial actions to diminish the capture and infiltration of precipitation in the RDAs exhibiting seepage
| First Majestic Silver Corp. | Jerritt Canyon Gold Mine, SLR Project No: 233.03396.R0000
| ||||
| NI 43-101 Technical Report - April 30, 2021 | 20-7 | |||
and correspondingly reduce seepage from the RDA. These measures were completed at Gracie and partially completed at Snow Canyon East and Marlboro Canyon RDAs. Completion of this project is scheduled for the 2021 construction season.
In 2011 and 2012, a pilot treatment plant was constructed at the Dash East RDA to assess the effectiveness of an active chemical treatment method. During 2013 to 2014, the active treatment system at Dash East proved successful at removing sulfates and TDS. Sludge from the process, however, did not meet the Toxicity Characteristic Leaching Procedure (TCLP) standards for barium and thus JCG determined this treatment method undesirable.
Upon acquisition of Jerritt Canyon in 2015 by Sprott, JCG constructed SRTs at each of the RDAs, except the DASH RDA. The SRTs are passive bioreactor cells composed of mixed media, including lime, wood chips, straw, rock, and organic material with sulfate reducing bacteria. The cells were designed based on bench scale testing, which reduced both sulfate and TDS levels to within permissible discharge standards. While initial results of the system have not met expectations, JCG is working with a third party passive system expert to improve performance of the SRTs. This work will commence in 2021.
Closure plans currently being investigated require re-sloping the RDAs to a stable landform and the placement of an impermeable liner to prevent infiltration into the RDAs resulting in seepage reduction if not elimination. These closure plans are designed to mitigate the impacts to surface water as a result of seepage from the RDAs. Permitting for this closure option is currently underway.
| 20.2.5 | Seepage from TSF 1 |
The first phase of TSF 1 was designed in 1979 to 1980 and with the first phase of construction completed in October 1981. While the design incorporated an earthen embankment and compacted soil liner it did not include a synthetic liner. Seepage from TSF 1 was first observed in March 1982 and efforts to control and manage the seepage have continued since that time. Initial discharge to TSF 1 was terminated in November 2013, however, the NDEP issued approval for an EDC in 2016 that allowed for a temporary change to the operating status of TSF 1. The EDC was requested in order to fill a depression in TSF 1 that allowed accumulation of storm water after precipitation events and to provide additional storage capacity for tailings that were generated prior to the 2017 construction season. The EDC (SRK, 2017) stated that the “emergency storage of tailings within TSF 1 to allow continued operation of the Jerritt Canyon mill through the 2016 to 2017 winter (or through the 2017 construction season after additional tailings storage is available via TSF 2 Phase 2 or the WSR)”.
As closure activities (including liner installation and growth media placement) continue on the surface of TSF 1, the mitigation of the seepage plume is an on-going project. In September 2020, JCG drilled a well through the tailings and into the contaminated aquifer and conducted pumping tests. Additional pumping tests are scheduled to occur in the coming months. The pumping wells will be used to determine if the plume migration can be reversed and help to close the impoundment entirely.
| 20.2.6 | Water Management Constraints |
The water management system at Jerritt Canyon relies on pumping water from TSF 1 and TSF 2 to the evaporation pond, WSR-E, and WSR-W. Analyses of water samples taken from the various ponds indicate that the blended water quality from all ponds exceeds Nevada Profile I standards for antimony, arsenic, cadmium, chloride, manganese, mercury, nitrogen, selenium, sulfate, thallium, and TDS (Linkan, 2017). Bench and pilot testing was conducted to develop a process that will remove the contaminants in order
| First Majestic Silver Corp. | Jerritt Canyon Gold Mine, SLR Project No: 233.03396.R0000
| ||||
| NI 43-101 Technical Report - April 30, 2021 | 20-8 | |||
to meet the standards required for discharge. The WTP is located adjacent to the existing Dash East RDA WTP, now known as the Mine WTP.
The Dash East RDA WTP has been converted to treat water from dewatering of Smith. Water from the Dash East RDA has been re-routed and combined with the tailings supernatant for treatment. The two plants share chemical storage tanks and a concrete containment area. Effluent from both plants is combined in a 60,000 gallon temporary storage tank and subsequently pumped to two separate injection fields. The primary injection point for the tailings WTP is located north of the evaporation pond. The injection point for the Smith WTP is located on USFS land. The injection wells and water disposal are covered under the existing UIC Permit UNEV93214.
Brine generated from the Mine WTP is stored within the evaporation pond which currently receives other inflows associated with the operation of the TSFs. As a result, the evaporation pond is net gaining – the free capacity is diminishing over time. Additionally, the WSR-E and WSR-W are planned to be utilized as the footprint of TSF 3 and both ponds are currently storing solution.
| 20.2.7 | Violation of Secondary Drinking Water Standards |
Jerritt Canyon has exceeded the secondary drinking water quality standard for iron at one of the water supply wells (WW7) in 2020 resulting in a violation of the water supply permit limit. As a result of continued exceedances, corrective actions may be established including, but not limited to acquiring a replacement supply well, water treatment, or identifying another means of supply water to the mine. The implementation of these corrective actions will not have a significant impact on the operation of Jerritt Canyon.
| 20.3 | Social or Community Requirements |
Jerritt Canyon is located in Elko County, Nevada which is a mining friendly jurisdiction. The employees of JCG are residents of Elko, Nevada and the local area and numerous other mining operations are located nearby. JCG supports the adopt a highway program and conducts roadside cleanup on a voluntary basis as well as supports the local ranchers with fencing. Therefore, no particular social or community involvement required.
| 20.3.1 | Safety |
During SLR’s site visit, it was reported that the operation was shut down by the Mine Safety and Health Administration (MSHA) for approximately four weeks in 2017 due to dust issues in the plant. No additional shutdowns have been incurred in 2018. JCG permitted and completed a reconfiguration of the baghouse that has helped alleviate the concerns, however, personnel working inside the roaster building are required to wear respirators, which is considered the last line of defense from a safety perspective.
| 20.4 | Mine Closure Requirements |
Approved closure and reclamation plans are in place for Jerritt Canyon. Concurrent reclamation is completed where possible.
| First Majestic Silver Corp. | Jerritt Canyon Gold Mine, SLR Project No: 233.03396.R0000
| ||||
| NI 43-101 Technical Report - April 30, 2021 | 20-9 | |||
| 20.4.1 | Concurrent Reclamation Projects |
One of the most significant closure activities in progress at the time of writing was the closure of TSF 1, consisting of the installation of 12.5 million square feet of liner and placement of growth media covering approximately 4.0 million square feet. This cover not only will close the facility but will reduce infiltration and thus the volume of contaminated water to manage. The placement of cover on TSF 1 is scheduled for completion in 2021.
In 2020, JCG also completed the construction and installation of the TSF 1 spillway. The installation utilized a product called HydroTurfTM, which is an armored cover over an impermeable membrane, essentially creating a double-lined system. The turf with cementitious infill adds structural integrity to the system while covering the underlying geomembrane from UV degradation. The turf blades have a specified half-life of over 100 years and reinforce the cementitious infill, creating a long lasting structure.
JCG has also decommissioned the fuel dispensing area that has been in place since the construction of the mill and truckshop and replaced them with new double walled storage tanks with leak detection. Additionally, contaminated soil has been removed and the area is now being utilized as a light vehicle parking area.
The second area is located near the haul roads for utilization by heavy equipment. It consists of two double walled, 20,000 gallons tanks that store and dispense red diesel.
JCG has also fully demolished and removed the original chlorination circuit and building. The chlorination processing area is believed to be the source of a contaminant plume located throughout the mill. The plume is currently treated using a pump and treat system which was installed following JCG’s acquisition of Jerritt Canyon in 2015.
In addition to mill structures being removed, JCG has also removed an old office area utilized for operations near Murray, West Generator, and MCE. In addition to the removal of the facilities, the Alchem landfill located in the same area was re-contoured and seeded.
| 20.4.2 | Mine Closure Planning |
JCG submits AWPs every three years and submits annual updates to the USFS which include updates to the reclamation cost estimates. Nevada uses the “Standardized Cost Estimator” for estimating reclamation costs. Two separate estimates are completed for Jerritt Canyon. One is for the work to be done on private lands and the other is for work to be done on public lands (i.e., USFS and BLM). The total reclamation costs, as updated in 2019, are approximately $86.6 million, as summarized in Table 20-2.
Table 20-2: 2019 AWP Reclamation Costs
Jerritt Canyon
| Items | Private Lands | Public Lands | ||||||
| Earthwork/Recontouring |
$15,414,924 | $5,977,457 | ||||||
| Revegetation/Stabilization |
$604,420 | $1,284,131 | ||||||
| Detoxification/Water Treatment/Disposal of Wastes |
$30,243,110 | $24,870 | ||||||
| Structure, Equipment and Facility Removal, and Misc. |
$7,652,823 | $1,129,085 | ||||||
| Monitoring |
$1,754,975 | $370,434 | ||||||
| First Majestic Silver Corp. | Jerritt Canyon Gold Mine, SLR Project No: 233.03396.R0000
| ||||
| NI 43-101 Technical Report - April 30, 2021 | 20-10 | |||
| Items | Private Lands | Public Lands | ||
| Construction Management and Support |
$1,645,869 | $535,390 | ||
| Subtotal |
$57,316,121 | $9,321,367 | ||
| Indirect Costs |
$16,629,687 | $3,284,568 | ||
| Indirect Costs - Percentage of Direct Costs |
29% | 35% | ||
| Total |
$73,945,808 | $12,605,935 | ||
The Agreement for Adequate Reclamation Bond and Rock Disposal Area Seepage Treatment (NDEP, 2015) required payment of $10 million in bonds that had not been paid by Veris. On May 4, 2018, NDEP approved a good faith bonding payment schedule to resolve the bonding deficiency associated with the 2015 RDA Agreement. The schedule consisted of quarterly payments totaling $1,000,000 by February 15, 2019. This was completed and the final payment has been submitted.
As of December 08, 2020, NDEP provided a letter summarizing the financial instruments that form the bond, as shown in Table 20-3 (NDEP, 2020.).
Table 20-3: Bonds Held as of December 8, 2020
Jerritt Canyon
| Financial Instruments held by NDEP | Amount (US$) |
Financial Instruments held by USFS | Amount (US$) |
|||||||
| National Union Fire Insurance Co.
of |
$ | 41,277,523 | National Union Fire Insurance Co. of Pittsburg, PA Surety #919-065 |
$ | 10,949,287 | |||||
| Cash bond, interest earning |
$ | 19,432,640 | Insurance Co. of State of Pennsylvania Surety #919-064 |
$ | 273,389 | |||||
| Interest earned as of 12/04/2020 |
$ | 104,390 | Cash bond paid on 8/14/2019 | $ | 1,361,169 | |||||
| Cash bond |
$ | 18,235,645 | ||||||||
| NDEP Total Amount1 |
$ | 78,945,808 | USFS Total Amount (excludes interest) |
$ | 12,583,845 | |||||
Source: NDEP, 2020
Note:
| 1. | The interest earned with NDEP is not included in the total obligated amount. |
| First Majestic Silver Corp. | Jerritt Canyon Gold Mine, SLR Project No: 233.03396.R0000
| ||||
| NI 43-101 Technical Report - April 30, 2021 | 20-11 | |||
| 21.0 | CAPITAL AND OPERATING COSTS |
For the purpose of this Technical Report, SLR reviewed capital and operating costs required for mining and processing Jerritt Canyon Mineral Reserves. Capital and operating cost estimates were supplied to SLR by JCG largely in the form of US$/st (processed) values, based on recent operating performance and the current operating budget for 2021. SLR considers these cost estimates to be reasonable, though recommends that a cost estimation using first principals be developed for future cash flow models. All costs in this section are expressed in US dollars (US$).
| 21.1 | Capital Costs |
Sustaining capital costs were estimated by JCG, with the majority of the costs consisting of mine development and heavy mobile equipment needed to replace the aging fleet. Sustaining capital costs for Jerritt Canyon are summarized in Table 21-1.
Table 21-1: Sustaining Capital Cost Estimate
Jerritt Canyon
| Category |
Sustaining Costs (US$ millions)
|
Sustaining Cost Basis (US$/st milled)
| ||
| Mining |
21.4 | 6.00 | ||
| Tailings Facility |
9.0 | $9M in 2021 | ||
| Processing Plant |
3.6 | 1.00 | ||
| Reclamation and closure |
5.3 | 1.50 | ||
| Sustaining Exploration Diamond Drilling |
3.6 | 1.00 | ||
| Total |
42.8 | - | ||
SLR notes that reclamation costs have not been estimated for the end of mine life, though a progressive annual reclamation cost has been applied based on a rate of $1.50/st processed.
| 21.2 | Operating Costs |
Operating costs estimated by JCG, averaging US$121.5 million/yr or $164.68/st ore were estimated by JCG for mining, processing, and G&A. Operating cost inputs such as labour rates, consumables, and supplies were based on JCG operating data. A summary of Jerritt Canyon operating costs is provided in Table 21-2.
Table 21-2: Operating Cost Estimate
Jerritt Canyon
| Parameter |
Total LOM (US$ millions)
|
Average Year (US$ millions/yr)
|
LOM Unit Cost (US$/st milled)
| |||
| Mining | 315.6 | 65.6 | 88.69 | |||
| Labor |
133.5 | 27.5 | 37.50 | |||
| Variable Costs
|
93.4
|
19.3
|
26.25
| |||
| First Majestic Silver Corp. | Jerritt Canyon Gold Mine, SLR Project No: 233.03396.R0000
| ||||
| NI 43-101 Technical Report - April 30, 2021 | 21-1 | |||
| Parameter | Total LOM (US$ millions) |
Average Year (US$ millions/yr) |
LOM Unit Cost (US$/st milled) | |||
| Maintenance Cost |
14.9 | 3.1 | 4.20 | |||
| Fixed Costs |
57.1 | 11.8 | 16.05 | |||
| Dewatering Phase 1 |
1.4 | 1.4 in 2021 | 0.38 | |||
| Dewatering Phase 2 |
8.4 | 8.4 in 2021 | 2.36 | |||
| Dewatering Phase 3 |
1.6 | 1.6 in 2022 | 0.45 | |||
| Other costs |
5.3 | 1.1 | 1.50 | |||
| Development | 46.2 | 9.5 | 12.99 | |||
| Labor |
20.6 | 4.3 | 5.80 | |||
| Primary Development, Horizontal |
14.4 | 3.0 | 4.06 | |||
| Maintenance Cost |
2.3 | 0.5 | 0.65 | |||
| Fixed Costs |
8.8 | 1.8 | 2.48 | |||
| Processing | 160.2 | 33.1 | 45.00 | |||
| Labor |
56.9 | 11.8 | 16.00 | |||
| Variable Costs |
35.6 | 7.3 | 10.00 | |||
| Maintenance Cost |
32.0 | 6.6 | 9.00 | |||
| Fixed Costs |
35.6 | 7.3 | 10.00 | |||
| G&A | 64.1 | 13.2 | 18.00 | |||
| Total | 586.1 | 121.5 | 164.68 | |||
| First Majestic Silver Corp. | Jerritt Canyon Gold Mine, SLR Project No: 233.03396.R0000
| ||||
| NI 43-101 Technical Report - April 30, 2021 | 21-2 | |||
| 22.0 | ECONOMIC ANALYSIS |
This section has been optionally included in this Technical Report although JCG is a producing company, SSX and Smith are currently in production, and there is no planned material expansion.
The economic analysis contained in this Technical Report is based on the Mineral Reserves, economic assumptions provided by JCG for SSX and Smith, and the capital and operating costs as presented in Section 21 of this Technical Report.
| 22.1 | Economic Criteria |
| 22.1.1 | Physicals |
|
· |
Mine life: |
5 years (between 2021 and 2025): | ||
|
· |
Underground ore tonnes mined: |
3.559 Mst | ||
|
· |
Gold grade: |
0.20 oz/st Au | ||
|
· |
Processed: |
|||
|
¡ Total Ore Feed: |
3.559 Mst | |||
|
¡ Gold grade: |
0.20 oz/st Au | |||
|
· |
Contained Metal: |
|||
|
¡ Gold: |
703,164 oz Au | |||
|
· |
Average LOM Recovery: |
|||
|
¡ Gold recovery |
86% | |||
|
· |
Recovered Metal: |
|||
|
¡ Gold: |
604,721 oz Au | |||
|
· |
Payable Metal: |
|||
|
¡ Gold: |
604,721 oz Au | |||
| 22.1.2 | Revenue |
Revenue is estimated based on the following LOM weighted average metal prices:
|
· |
Gold price: |
US$1,500/oz Au |
| 22.1.3 | Capital Costs |
| · | LOM sustaining capital costs of US$42.8 million. |
| · | Closure costs of US$5.3 million were estimated annually based on US$1.50/st milled. |
| 22.1.4 | Operating Costs |
|
· |
LOM unit operating cost average of: | |||
|
¡ Mine Development: |
US$12.99/st mined | |||
| First Majestic Silver Corp. | Jerritt Canyon Gold Mine, SLR Project No: 233.03396.R0000
| ||||
| NI 43-101 Technical Report - April 30, 2021 | 22-1 | |||
|
¡ Underground Mining: |
US$88.66/st mined | |||
|
¡ Processing: |
US$45.00/st milled | |||
|
¡ G&A: |
US$18.00/st milled | |||
|
· |
Total unit operating costs: |
US$164.68/st milled. | ||
|
· |
LOM operating costs: |
US$586.1 million n. | ||
| 22.1.5 | Taxation and Royalties |
| · | The Corporate Federal income tax rate in Nevada is 21% and State income tax rate is 5% for an average realized effective income tax rate of 24.95%. |
| · | Nevada Select (ELY Gold) royalty rate: 0.5% NSR |
| · | NouHgt Technologies royalty rate: 0.225% NSR (based on mill throughput and realized gold price) |
| · | Leaseholder land royalties: average $1.05 million/yr |
| 22.2 | Cash Flow |
SLR reviewed the JCG LOM after-tax cash flow model to confirm the economics of the LOM plan. The model is based on JCG’s JCG Model Ver2.0 file, which includes Measured and Indicated material, as well as material from other areas on the Mine site, and credit for tolling. The JCG model does not take into account the following components:
| · | Financing costs |
| · | Existing working capital |
| · | Insurance |
| · | Overhead cost for a corporate office |
SLR has used JCG’s model as a reference for capital and operating cost rates but has created a standalone cash flow model to represent only the Mineral Reserve material. SLR’s cash flow cash flow summary is presented in Table 22-1. All costs are in Q4 2020 US dollars with no allowance for inflation.
| First Majestic Silver Corp. | Jerritt Canyon Gold Mine, SLR Project No: 233.03396.R0000
| ||||
| NI 43-101 Technical Report - April 30, 2021 | 22-2 | |||
Table 22-1: After-Tax Cash Flow Summary
Jerritt Canyon
| INPUTS | UNITS | TOTAL |
2021 Year 1 |
2022 Year 2 |
2023 Year 3 |
2024 Year 4 |
2025 Year 5 |
2026 Year 6 | ||||||||||||||||||||||||||||
| MINING |
||||||||||||||||||||||||||||||||||||
| Underground |
||||||||||||||||||||||||||||||||||||
| Operating Days |
365 | days | 1,770 | 365 | 365 | 365 | 365 | 310 | ||||||||||||||||||||||||||||
| Tonnes milled per day |
tons / day | 2,011 | 1,997 | 2,051 | 2,001 | 2,001 | 2,001 | |||||||||||||||||||||||||||||
| Smith Production |
tons | 1,434,644 | 291,086 | 292,022 | 291,963 | 291,891 | 267,681 | - | ||||||||||||||||||||||||||||
| Au |
oz/t | 0.23 | 0.19 | 0.24 | 0.21 | 0.22 | 0.28 | - | ||||||||||||||||||||||||||||
| Waste |
tons | 928,101 | 392,416 | 238,916 | 181,456 | 68,656 | 46,657 | - | ||||||||||||||||||||||||||||
| Total Moved |
tons | 2,362,745 | 683,502 | 530,938 | 473,419 | 360,548 | 314,338 | - | ||||||||||||||||||||||||||||
| SSX Production |
tons | 2,124,349 | 437,999 | 456,743 | 438,347 | 438,412 | 352,848 | - | ||||||||||||||||||||||||||||
| Au |
oz/t | 0.18 | 0.18 | 0.19 | 0.18 | 0.18 | 0.17 | - | ||||||||||||||||||||||||||||
| Waste |
tons | 330,794 | 72,906 | 141,591 | 66,892 | 36,296 | 13,109 | - | ||||||||||||||||||||||||||||
| Total Moved |
tons | 2,455,143 | 510,905 | 598,334 | 505,240 | 474,708 | 365,957 | - | ||||||||||||||||||||||||||||
| Total Production |
tons | 3,558,993 | 729,085 | 748,765 | 730,310 | 730,303 | 620,529 | - | ||||||||||||||||||||||||||||
| Au |
oz/t | 0.20 | 0.18 | 0.21 | 0.20 | 0.19 | 0.22 | |||||||||||||||||||||||||||||
| Waste |
tons | 1,258,894 | 465,322 | 380,507 | 248,348 | 104,952 | 59,766 | - | ||||||||||||||||||||||||||||
| Total Moved |
tons | 4,817,887 | 1,194,407 | 1,129,271 | 978,658 | 835,255 | 680,295 | - | ||||||||||||||||||||||||||||
| PROCESSING |
||||||||||||||||||||||||||||||||||||
| Mill Feed |
tons | 3,558,993 | 729,085 | 748,765 | 730,310 | 730,303 | 620,529 | - | ||||||||||||||||||||||||||||
| Au |
oz/t | 0.20 | 0.18 | 0.21 | 0.20 | 0.19 | 0.22 | - | ||||||||||||||||||||||||||||
| Contained Au |
oz | 703,164 | 131,514 | 153,894 | 143,550 | 140,759 | 133,447 | - | ||||||||||||||||||||||||||||
| Mill Recovery |
||||||||||||||||||||||||||||||||||||
| Au |
86% | % | 86% | 86% | 86% | 86% | 86% | 86% | 86% | |||||||||||||||||||||||||||
| Net Recovery |
||||||||||||||||||||||||||||||||||||
| Au |
% | 86% | 86% | 86% | 86% | 86% | 86% | 86% | ||||||||||||||||||||||||||||
| Total Average Recovery |
% | 86% | 86% | 86% | 86% | 86% | 86% | - | ||||||||||||||||||||||||||||
| Total Recovered |
||||||||||||||||||||||||||||||||||||
| Au |
oz | 604,721 | 113,102 | 132,349 | 123,453 | 121,053 | 114,764 | - | ||||||||||||||||||||||||||||
| REVENUE |
||||||||||||||||||||||||||||||||||||
| Metal Prices |
Input Units | |||||||||||||||||||||||||||||||||||
| Au |
US$1500 /oz Au | US$/oz Au | $ | 1,500.00 | $ | 1,500 | $ | 1,500 | $ | 1,500 | $ | 1,500 | $ | 1,500 | $ | 1,500 | ||||||||||||||||||||
| Au Payable Percentage |
100% | US$ ‘000 | 100% | 100% | 100% | 100% | 100% | 100% | 100% | |||||||||||||||||||||||||||
| Au Gross Revenue |
US$ ‘000 | $ | 907,081 | $ | 169,653 | $ | 198,523 | $ | 185,180 | $ | 181,580 | $ | 172,146 | $ | - | |||||||||||||||||||||
| Total Gross Revenue |
US$ ‘000 | $ | 907,081 | $ | 169,653 | $ | 198,523 | $ | 185,180 | $ | 181,580 | $ | 172,146 | $ | - | |||||||||||||||||||||
| Treatment |
$ | 0.40 | US$/oz | $ | 242 | $ | 45 | $ | 53 | $ | 49 | $ | 48 | $ | 46 | $ | - | |||||||||||||||||||
| Transport |
$ | 1,500.00 | US$/shipment (12/yr) | $ | 379 | $ | 78 | $ | 78 | $ | 78 | $ | 78 | $ | 66 | $ | - | |||||||||||||||||||
| Early Settlement fees |
$ | - | $ | - | $ | - | $ | - | $ | - | $ | - | $ | - | ||||||||||||||||||||||
| Total charges |
$ | 621 | $ | 123 | $ | 131 | $ | 128 | $ | 127 | $ | 112 | $ | - | ||||||||||||||||||||||
| Gross NSR |
$ | 906,460 | $ | 169,529 | $ | 198,392 | $ | 185,052 | $ | 181,453 | $ | 172,034 | $ | - | ||||||||||||||||||||||
| Royalties |
||||||||||||||||||||||||||||||||||||
| Nevada Select Royalty Inc |
0.5% | US$ ‘000 | $ | 4,532 | $ | 848 | $ | 992 | $ | 925 | $ | 907 | $ | 860 | $ | - | ||||||||||||||||||||
| NouHgt Technologies, LLC |
0.225 | US$ ‘000 | $ | 801 | $ | 164 | $ | 168 | $ | 164 | $ | 164 | $ | 140 | $ | - | ||||||||||||||||||||
| Leaseholder Roylties |
US$ ‘000 | $ | 5,092 | $ | 1,050 | $ | 1,050 | $ | 1,050 | $ | 1,050 | $ | 892 | $ | - | |||||||||||||||||||||
| Total Royalties |
US$ ‘000 | $ | 10,425 | $ | 2,062 | $ | 2,210 | $ | 2,140 | $ | 2,122 | $ | 1,892 | $ | - | |||||||||||||||||||||
| Net Smelter Return |
US$ ‘000 | $ | 896,035 | $ | 167,468 | $ | 196,181 | $ | 182,913 | $ | 179,331 | $ | 170,142 | $ | - | |||||||||||||||||||||
| First Majestic Silver Corp. | Jerritt Canyon Gold Mine, SLR Project No: 233.03396.R0000
| ||||
| NI 43-101 Technical Report - April 30, 2021 | 22-3 | |||
| INPUTS | UNITS | TOTAL | 2021 Year 1 |
2022 Year 2 |
2023 Year 3 |
2024 Year 4 |
2025 Year 5 |
2026 Year 6 |
||||||||||||||||||||||||||
| OPERATING COST |
||||||||||||||||||||||||||||||||||
|
Mining (Underground) |
$ | 101.68 | US$/t milled | $ | 101.68 | $ | 101.68 | $ | 101.68 | $ | 101.68 | $ | 101.68 | $ | 101.68 | $ | 101.68 | |||||||||||||||||
| Processing |
$ | 45.00 | US$/t milled | $ | 45.00 | $ | 45.00 | $ | 45.00 | $ | 45.00 | $ | 45.00 | $ | 45.00 | $ | 45.00 | |||||||||||||||||
| G&A |
$ | 18.00 | US$/t milled | $ | 18.00 | $ | 18.00 | $ | 18.00 | $ | 18.00 | $ | 18.00 | $ | 18.00 | $ | 18.00 | |||||||||||||||||
|
Total Unit Operating Cost |
US$/t milled | $ | 164.68 | $ | 164.68 | $ | 164.68 | $ | 164.68 | $ | 164.68 | $ | 164.68 | $ | 164.68 | |||||||||||||||||||
|
Mining (Underground) |
US$ ‘000 | $ | 361,867 | $ | 74,131 | $ | 76,132 | $ | 74,256 | $ | 74,255 | $ | 63,094 | $ | - | |||||||||||||||||||
| Processing |
US$ ‘000 | $ | 160,155 | $ | 32,809 | $ | 33,694 | $ | 32,864 | $ | 32,864 | $ | 27,924 | $ | - | |||||||||||||||||||
| G&A |
US$ ‘000 | $ | 64,062 | $ | 13,124 | $ | 13,478 | $ | 13,146 | $ | 13,145 | $ | 11,170 | $ | - | |||||||||||||||||||
|
Total Operating Cost |
$969.18/oz Au | US$ ‘000 | $ | 586,084 | $ | 120,063 | $ | 123,304 | $ | 120,265 | $ | 120,264 | $ | 102,187 | $ | - | ||||||||||||||||||
|
Operating Cashflow |
US$ ‘000 | $ | 309,950 | $ | 47,404 | $ | 72,877 | $ | 62,647 | $ | 59,067 | $ | 67,955 | $ | - | |||||||||||||||||||
| CAPITAL COST |
||||||||||||||||||||||||||||||||||
| Direct Cost |
||||||||||||||||||||||||||||||||||
|
Safety, Health & Environmental |
US$ ‘000 | $ | - | $ | - | $ | - | $ | - | $ | - | $ | - | $ | - | |||||||||||||||||||
| Heavy Mobile Equipment |
US$ ‘000 | $ | - | $ | - | $ | - | $ | - | $ | - | $ | - | $ | - | |||||||||||||||||||
| Expansion |
US$ ‘000 | $ | - | $ | - | $ | - | $ | - | $ | - | $ | - | $ | - | |||||||||||||||||||
|
Modernization |
US$ ‘000 | $ | - | $ | - | $ | - | $ | - | $ | - | $ | - | $ | - | |||||||||||||||||||
| Other |
US$ ‘000 | $ | - | $ | - | $ | - | $ | - | $ | - | $ | - | $ | - | |||||||||||||||||||
|
Total Direct Cost |
US$ ‘000 | $ | - | $ | - | $ | - | $ | - | $ | - | $ | - | $ | - | |||||||||||||||||||
|
Sustaining Cost |
||||||||||||||||||||||||||||||||||
| Mine Capital |
US$ ‘000 | $ | 21,354 | $ | 4,375 | $ | 4,493 | $ | 4,382 | $ | 4,382 | $ | 3,723 | $ | - | |||||||||||||||||||
| Exploration Capital |
US$ ‘000 | $ | - | $ | - | $ | - | $ | - | $ | - | $ | - | $ | - | |||||||||||||||||||
| Tailings Facility |
US$ ‘000 | $ | 9,000 | $ | 9,000 | $ | - | $ | - | $ | - | $ | - | $ | - | |||||||||||||||||||
| Processing Plant |
US$ ‘000 | $ | 3,559 | $ | 729 | $ | 749 | $ | 730 | $ | 730 | $ | 621 | $ | - | |||||||||||||||||||
| Reclamation and closure |
$ | 1.50 | US$ ‘000 | $ | 5,338 | $ | 1,094 | $ | 1,123 | $ | 1,095 | $ | 1,095 | $ | 931 | $ | - | |||||||||||||||||
| Sustaining Exploration Diamond Drilling |
$ | 1.00 | US$ ‘000 | $ | 3,559 | $ | 729 | $ | 749 | $ | 730 | $ | 730 | $ | 621 | $ | - | |||||||||||||||||
| Total Sustaining Cost |
US$ ‘000 | $ | 42,810 | $ | 15,926 | $ | 7,113 | $ | 6,938 | $ | 6,938 | $ | 5,895 | $ | - | |||||||||||||||||||
|
Working Capital |
US$ ‘000 | $ | (1,284 | ) | $ | (17,519 | ) | $ | (3,668 | ) | $ | 1,339 | $ | 236 | $ | 403 | $ | 17,925 | ||||||||||||||||
|
All in Sustaining Cost |
$1037.85/oz Au | US$ ‘000 | $ | 627,610 | $ | 118,471 | $ | 126,750 | $ | 128,542 | $ | 127,438 | $ | 108,485 | $ | 17,925 | ||||||||||||||||||
| CASH FLOW |
||||||||||||||||||||||||||||||||||
| Net Pre- Tax Cashflow |
US$ ‘000 | $ | 268,424 | $ | 48,996 | $ | 69,431 | $ | 54,371 | $ | 51,894 | $ | 61,657 | $ | (17,925 | ) | ||||||||||||||||||
| Cumulative Pre- Tax Cashflow |
US$ ‘000 | $ | 48,996 | $ | 118,428 | $ | 172,798 | $ | 224,692 | $ | 286,349 | $ | 268,424 | |||||||||||||||||||||
| Depreciation |
US$ ‘000 | $ | 42,810 | $ | 2,979 | $ | 5,401 | $ | 7,422 | $ | 10,839 | $ | 16,171 | $ | - | |||||||||||||||||||
| Taxes |
US$ ‘000 | $ | 65,319 | $ | 10,811 | $ | 16,555 | $ | 13,505 | $ | 11,760 | $ | 12,688 | $ | - | |||||||||||||||||||
| After- Tax Cashflow |
US$ ‘000 | $ | 203,105 | $ | 38,185 | $ | 52,876 | $ | 40,865 | $ | 40,134 | $ | 48,969 | $ | (17,925 | ) | ||||||||||||||||||
|
Cumulative After- Tax Cashflow |
US$ ‘000 | $ | 38,185 | $ | 91,061 | $ | 131,926 | $ | 172,061 | $ | 221,029 | $ | 203,105 | |||||||||||||||||||||
|
All- In Sustaining Cost |
US$/oz | $ | 1,041 | $ | 1,203 | $ | 986 | $ | 1,031 | $ | 1,052 | $ | 943 | |||||||||||||||||||||
|
PROJECT ECONOMICS |
||||||||||||||||||||||||||||||||||
| Pre- tax NPV at 5% discounting |
5.0% | US$ ‘000 | $234,234 | |||||||||||||||||||||||||||||||
| Pre- tax NPV at 7.5% discounting |
7.5% | US$ ‘000 | $219,617 | |||||||||||||||||||||||||||||||
| Pre- tax NPV at 10% discounting |
10.0% | US$ ‘000 | $206,383 | |||||||||||||||||||||||||||||||
| After- Tax NPV at 5% discounting |
5.0% | US$ ‘000 | $177,639 | |||||||||||||||||||||||||||||||
| After- Tax NPV at 7.5% discounting |
7.5% | US$ ‘000 | $166,719 | |||||||||||||||||||||||||||||||
|
After- tax NPV at 10% discounting |
10.0% | US$ ‘000 | $156,816 | |||||||||||||||||||||||||||||||
| First Majestic Silver Corp. | Jerritt Canyon Gold Mine, SLR Project No: 233.03396.R0000
| ||||
| NI 43- 101 Technical Report - April 30, 2021 | 22-4 | |||
| 22.2.1 | Cash Flow Analysis |
Mine economics have been evaluated using the discounted cash flow method, using mid-year discounting convention, and taking into account annual processed tonnages and gold grades. The associated process recovery, metal price, operating costs, royalties, and capital expenditures were also considered.
The economic analysis confirmed that the Jerritt Canyon Mineral Reserves are economically viable. The pre-tax net present value (NPV) at a 5% base discount rate is US$234 million and the after-tax NPV at a 5% base discount is US$178 million.
The summary of the results of the cash flow analysis is presented in Table 22-2.
Table 22-2: Cash Flow Analysis
Jerritt Canyon
| Item | Discount Rate | Units | Value | ||||||||||||
| Pre-tax NPV at 5% discount |
5% | US$ million | 234 | ||||||||||||
| Pre-tax NPV at 7.5% discount |
7.5% | US$ million | 220 | ||||||||||||
| Pre-tax NPV at 10% discount |
10% | US$ million | 206 | ||||||||||||
| After-Tax NPV at 5% discount |
5% | US$ million | 178 | ||||||||||||
| After-Tax NPV at 7.5% discount |
7.5% | US$ million | 167 | ||||||||||||
| After-tax NPV at 10% discount |
10% | US$ million | 157 | ||||||||||||
The undiscounted pre-tax cash flow is US$268 million, and the undiscounted after-tax cash flow is US$203 million. For this cash flow analysis, the internal rate of return (IRR) and payback are not applicable as there is no negative initial cash flow (no initial investment to be recovered).
| 22.3 | Sensitivity Analysis |
Project risks can be identified in both economic and non-economic terms. Key economic risks were examined by running cash flow sensitivities on after-tax NPV at a 5% discount rate. The following items were examined:
| · | Metal price |
| · | Head grade |
| · | Metallurgical recovery |
| · | Operating costs |
| · | Capital costs |
After-tax sensitivity over the base case has been calculated for -20% to +20% (for head grade), -10% to +5% (for recoveries), -20% to +20% (for metal prices), and -5% to +15% (operating costs and capital costs) variations to determine the most sensitive parameter of this project. The after-tax NPV is most sensitive to head grade and metal prices, followed by operating costs, and is least sensitive to capital costs.
The sensitivities are presented in Table 22-3 and Figure 22-1.
| First Majestic Silver Corp. | Jerritt Canyon Gold Mine, SLR Project No: 233.03396.R0000
| ||||
| NI 43-101 Technical Report - April 30, 2021 | 22-5 | |||
Table 22-3: After-Tax Sensitivity Analysis
Jerritt Canyon
| Head Grade
(oz/st Au) |
NPV at 5%
(US$ million) | |||||||||
| 80% |
0.16 | 58.8 | ||||||||
| 90% |
0.18 | 118.2 | ||||||||
| 100% | 0.20 | 177.6 | ||||||||
| 110% |
0.22 | 237.1 | ||||||||
| 120% |
0.24 | 296.5 | ||||||||
| Recovery (% Au) |
NPV at 5% (US$ million) | |||||||||
| 90% |
0.77 | 118.5 | ||||||||
| 98% |
0.82 | 148.1 | ||||||||
| 100% | 0.86 | 177.6 | ||||||||
| 103% |
0.88 | 192.4 | ||||||||
| 105% |
0.90 | 207.2 | ||||||||
| Metal Price (US$/oz Au) |
NPV at 5% (US$ million) | |||||||||
| 80% |
1,200 | 59.3 | ||||||||
| 90% |
1,350 | 118.5 | ||||||||
| 100% | 1,500 | 177.6 | ||||||||
| 110% |
1,650 | 236.8 | ||||||||
| 120% |
1,800 | 295.9 | ||||||||
| Operating Costs (US$ million) |
NPV at 5% (US$ million) | |||||||||
| 95.0% |
528.9 | 221.0 | ||||||||
| 97.5% |
557.1 | 199.6 | ||||||||
| 100.0% | 586.1 | 177.6 | ||||||||
| 107.5% |
677.3 | 107.9 | ||||||||
| 115.0% |
775.1 | 32.4 | ||||||||
| First Majestic Silver Corp. | Jerritt Canyon Gold Mine, SLR Project No: 233.03396.R0000
| ||||
| NI 43-101 Technical Report - April 30, 2021 | 22-6 | |||
|
Total Capital Costs (US$ million) |
NPV at 5% (US$ million) | |||||||||
| 95.0% |
40.7 | 179.0 | ||||||||
| 97.5% |
41.7 | 178.3 | ||||||||
| 100.0% | 42.8 | 177.6 | ||||||||
| 107.5% |
46.0 | 175.5 | ||||||||
| 115.0% |
49.2 | 173.5 | ||||||||
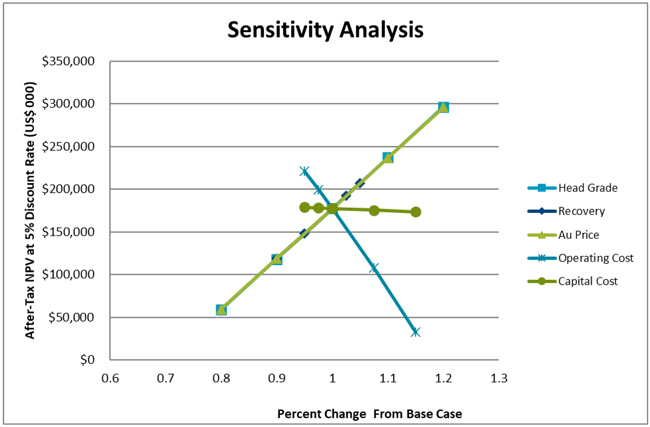
Figure 22-1: After-Tax NPV Sensitivity Graph
| First Majestic Silver Corp. | Jerritt Canyon Gold Mine, SLR Project No: 233.03396.R0000
| ||||
| NI 43-101 Technical Report - April 30, 2021 | 22-7 | |||
| 23.0 | ADJACENT PROPERTIES |
There are no adjacent properties to report in this section.
| First Majestic Silver Corp. | Jerritt Canyon Gold Mine, SLR Project No: 233.03396.R0000
| ||||
| NI 43-101 Technical Report - April 30, 2021 | 23-1 | |||
| 24.0 | OTHER RELEVANT DATA AND INFORMATION |
No additional information or explanation is necessary to make this Technical Report understandable and not misleading.
| First Majestic Silver Corp. | Jerritt Canyon Gold Mine, SLR Project No: 233.03396.R0000
| ||||
| NI 43-101 Technical Report - April 30, 2021 | 24-1 | |||
| 25.0 | INTERPRETATION AND CONCLUSIONS |
The QPs offer the following conclusions:
| 25.1 | Geology and Mineral Resources |
| · | JCG geologists have a good understanding of the regional, local, and deposit geology and controls on mineralization. |
| · | Exploration and development sampling and analysis programs involve industry standard practices, providing generally reasonable results. The drill hole database was verified by the QP and is suitable for Mineral Resource estimation work. The resulting data can effectively be used for the estimation of Mineral Resources and Mineral Reserves. |
| · | The methods and procedures utilized to gather geological, assaying, density, and other information are reasonable and meet generally accepted industry standards. |
| · | Sampling and assaying have been carried out using industry standard QA/QC practices. These practices include, but are not limited to, sampling, assaying, chain of custody of the samples, secure sample storage, use of third-party laboratories, and use of standards, blanks, and duplicates. |
| · | Since 2015, Jerritt Canyon has made considerable advances in the compilation and interpretation of historical geophysical and geochemical datasets resulting in the identification of 17 high priority target areas. The property holds significant exploration potential, particularly in the southern portion. |
| · | Since January 1, 2015 through December 31, 2020, JCG has drilled a total of 18,533 holes between RC and core from underground drilling sites, comprising 2,800,695 ft. This has enabled Jerritt Canyon to increase the size and confidence of the existing resources. |
| · | The geological wireframes are reasonable and plausible interpretations of the drill results. |
| · | The resource model has been prepared using appropriate methodology and assumptions, including: |
| ¡ | Treatment of high grade assays |
| ¡ | Compositing length |
| ¡ | Customized search parameters |
| ¡ | Bulk density |
| ¡ | Cut-off grade |
| ¡ | Classification |
| · | As of December 31, 2020 and at a cut-off grade of 0.11 oz/st Au, the Measured and Indicated Mineral Resources at Jerritt Canyon total 5.217 Mst grading 0.160 oz/st Au containing approximately 832,000 oz Au. In addition, Inferred Mineral Resources are estimated at 1.950 Mst grading 0.171 oz/st Au containing approximately 334,000 oz Au. |
| · | Mineral Resource estimates have been prepared utilizing acceptable estimation methodologies in accordance with CIM MRMR Best Practice Guidelines. The classification of Measured, Indicated, and Inferred Mineral Resources conforms to CIM (2014) definitions. |
| First Majestic Silver Corp. | Jerritt Canyon Gold Mine, SLR Project No: 233.03396.R0000
| ||||
| NI 43-101 Technical Report - April 30, 2021 | 25-1 | |||
| 25.2 | Mining and Mineral Reserves |
| · | Mining operations at Jerritt Canyon are well established and carried out by an experienced mining contractor at Smith and SSX using the cut and fill mining method. |
| · | A significant portion of the Mineral Reserves are located below the current water table. There is a dewatering plan in place for the mine below the 6,600 FASL water table, which allows for the inclusion of Mineral Reserves below this elevation. |
| · | Groundwater flows in the Roberts Mountain and Hanson Creek formations (the principle aquifers) are controlled primarily by the openness and continuity of fractures and joints with the primary water bearing strata being the ore zones. Faulting and tectonic displacement of the materials in the Jerritt Canyon District is extensive. |
| · | The main faults trend west northwest - east southeast, and in general are permeable water conduits. Complementary faults and displacement sets at right angles, south southwest – north northeast, are generally highly myolinitized, and tend to form a barrier to groundwater flow and compartmentalize groundwater. |
| · | Dewatering goals of the current operation are to reduce the water level to the pre 2008 level of approximately 6,535 FASL. Currently, pumping is underway to dewater the existing workings. This consists of the operation of two dewatering wells and a barge to dewater Zones 2 and 4. The wells are each pumping at approximately 700 gpm while the barge pumps at approximately 400 gpm. Two additional, 500 ft deep underground dewatering wells have been designed. |
| · | It is anticipated that over time Smith will be dewatered at a rate of 2,100 gpm. All pumped groundwater will continue to be conveyed to the WTP which has a capacity of 1,400 gpm. Any flows over 1,400 gpm will be routed to Zone 9 prior to treatment. Following treatment, the water is pumped to an underground injection well field consisting of three 1,200 ft deep injection wells located on USFS land. |
| · | Another aspect of Jerritt Canyon mine water/groundwater management is pollution control from TSF 1. Initially, TSF 1 was lined with compacted native soils. In addition, there are 90 seepage control wells, 14 freshwater recharge wells receiving water from the tailings WTP, and greater than 80 down gradient monitoring wells (Wanner et al, 2017). |
| · | Production is limited by mine capacity, and production forecasting is based on mining rates of 800 stpd for Smith and 1,200 stpd for SSX. There is potential for increased production from Smith once dewatering is advanced and more headings are available. |
| 25.3 | Mineral Processing and Metallurgical Testing |
| · | Historical gold grade-recovery relationships for three different time periods, 1) 1981 to 2020, 2)1989 to 2020 and 3) 1997 to 2020 were plotted. The first period is inception to date, the second period begins when the roaster was commissioned, and the third period begins when chlorination was discontinued. The inception to date line and the 1989 to 2020 lines are essentially the same. The 1997 to 2020 line indicates a slightly higher sensitivity of gold recovery to feed grade. The QP notes that the data are scattered and the correlations of the three lines are low suggesting that variables other than head grade, including sulfide sulfur oxidation, TOC, and roaster performance contribute to changes in gold recovery. |
| · | SLR notes that the process operating data indicate very consistent plant feed and operational performance and, with the low correlation between grade and recovery, the use of near term historical averages would provide a reasonable gold recovery value for planning purposes. The |
| First Majestic Silver Corp. | Jerritt Canyon Gold Mine, SLR Project No: 233.03396.R0000
| ||||
| NI 43-101 Technical Report - April 30, 2021 | 25-2 | |||
| operation is currently using a constant average gold recovery of 86% for the LOM plan and budget. The consistency in recovery could be affected by changes in mineralogical characteristics as new ore-types are encountered in the future. |
| · | The design recovery of the whole ore roaster using oxygen instead of air was 87% to 90%. Pilot plant testing of the oxygen roasted calcine by Dorr Oliver (1987) achieved an average gold recovery of 88%. SLR notes that the process continues to operate consistently in the design range depending primarily on roaster performance, as some of the mineralized materials are reported to have zero gold recovery without oxidation. |
| · | The main deleterious elements are arsenic and mercury. The processing plant is designed with the appropriate gas cleaning systems including mercury scrubbing from the gas streams and mercury collection from the refinery retort condenser. |
| 25.4 | Infrastructure |
| · | Jerritt Canyon is a mature operation that has been operating for nearly 40 years, and as a result the requisite infrastructure is in place including: |
| ¡ | Access Roads |
| ¡ | Power supply and distribution |
| ¡ | Office buildings |
| ¡ | Warehouse facilities |
| ¡ | Maintenance shops |
| ¡ | Laboratory facilities |
| ¡ | Communication networks |
| ¡ | Onsite security |
| ¡ | TSFs |
| ¡ | Water management systems |
| 25.5 | Tailings and Water Management Facilities |
| · | TSF 1 is currently inactive and in the process of being closed and reclaimed under a FPPC approved by the State of Nevada regulatory agencies. The TSF 1 FPPC consists of regrading the top impoundment surface to promote runoff and preclude surface water impoundment, placing a working cover impoundment surface on which an HDPE liner will be installed, installing a three foot thick alluvial growth media cover, and revegetating the final surface with an approved seed mix. As of the date of this Technical Report, the following reclamation and closure activities have been completed on TSF 1: |
| ¡ | Outer embankment slopes have been graded, covered, and revegetated. |
| ¡ | Working cover and HDPE liner have been installed over 70% of the 300 acre impoundment surface. |
| ¡ | Growth media has been installed over approximately 30% of the 300 acre impoundment surface. |
| First Majestic Silver Corp. | Jerritt Canyon Gold Mine, SLR Project No: 233.03396.R0000
| ||||
| NI 43-101 Technical Report - April 30, 2021 | 25-3 | |||
| · | For active tailings management, Jerritt Canyon is currently depositing tailings with a 40:60, solids/water, ratio into TSF 2 Phase 2. TSF 2 is an HDPE lined impoundment with a LCRS, which is designed and constructed to meet or exceed the most current environmental and engineering standards. As part of the TSF 2 monitoring program, Jerritt Canyon measures pumped flows from the LCRS, hydraulic head development above the TSF 2 secondary HDPE liner, and surrounding groundwater depths, and the presence (or absence) of process solution in the vadose zone underlying TSF 2. |
| · | TSF 2 Phase 3 is currently being constructed as an eight foot raise. Construction and commissioning of TSF 2 Phase 3 is expected in May 2021 and will only provide an additional seven months of tailings storage until December 2021, approximately. |
| · | TSF 2 Phase 4 is planned for construction during 2021 and will allow storage of an additional 1.7 Mst of tailings. Due to the short operational life of Phase 3, TSF 2 Phase 4 must be constructed and commissioned before December 2021. This construction will require approximately 1.5 million cubic yards of compacted fill excavated from approved borrow source over one mile east of TSF 2. Assuming a planned production rate of 2,350 stpd, TSF 2 Phase 4 will be filled to capacity by December 2023. The Jerritt Canyon Water Pollution Control Permit authorizes up to 3.0 Mst of dry tailings to be produced per annum (approximately 8,200 stpd). If the average deposition rate is increased above 2,350 stpd, the timeline for filling TSF 2 Phase 4 to capacity will be shortened proportionally. |
| · | Jerritt Canyon plans to convert the existing WSR to TSF 3 for tailings disposal after TSF 2 is filled to capacity. TSF 3 will store approximately of 2.4 Mst of tailings and provide 2.6 years of tailings storage at an assumed average production rate of 2,350 stpd. Since TSF 3 would be commissioned before January 2024, additional tailings storage (beyond TSF 3) would need to be permitted and constructed before the end of 2025 to ensure a new facility is ready for tailings disposal by the middle of 2026. Likewise, if the average deposition rate is increased above 2,350 stpd, the timeline for filling TSF 3 and needing additional tailings storage beyond TSF 3 will be shortened proportionally. |
| · | The feasibility of converting the WSR into TSF 3 in a timely manner relies on the removal of 372 Mgal of process solution which is currently stored within the WSR by the end of 2022. Within the next two years, this volume will require removal via active and passive evaporation and/or treatment via the process WTP. If this volume cannot be removed by the end of 2022, other locations or methods of tailings disposal will need to be permitted, approved, and constructed. |
| · | Currently, the process WTP only removes approximately 200 gpm of process solution from the site-wide water balance inventory as permeate. Under these conditions, a significant increase in the WTP capacity is needed to eliminate positive water balances during the winter and spring. At this stage, the exact increase is unknown, but may be three to four times the current treatment rate for costing purposes. |
| 25.6 | Environmental Considerations |
| · | All of the necessary permits and approvals to operate are either in place or in the process of being renewed or modified. |
| · | Jerritt Canyon has multiple violations related to their environmental permits including air quality, water supply, surface water, and UIC. |
| · | Although environmental permitting requirements are being exceeded, JCG is actively mitigating these issues. Persisting exceedances would likely result in corrective actions and/or fines and not |
| First Majestic Silver Corp. | Jerritt Canyon Gold Mine, SLR Project No: 233.03396.R0000
| ||||
| NI 43-101 Technical Report - April 30, 2021 | 25-4 | |||
| result in the revocation of operational permits due to the social and economic considerations of this operation. |
| 25.7 | Safety |
| · | The large number of MSHA citations and extended shutdowns imposed during 2017 have been resolved and JCG continues to adhere to MSHA’s regulations. |
| First Majestic Silver Corp. | Jerritt Canyon Gold Mine, SLR Project No: 233.03396.R0000
| ||||
| NI 43-101 Technical Report - April 30, 2021 | 25-5 | |||
| 26.0 | RECOMMENDATIONS |
The QPs offer the following recommendations:
| 26.1 | Geology and Mineral Resources |
| 1. | Explore the 17 high priority exploration targets. The QP concurs with First Majestic’s plans to carry out a multi-year exploration program that will include a significant amount of surface and underground drilling that will cost approximately US$10 million to US$15 million annually. |
| 2. | Continue drilling to expand Mineral Resources. |
| 3. | Continue to convert Inferred Mineral Resources to Indicated Mineral Resources. |
| 4. | Update the block models on a regular basis. |
| 5. | Improve mineralized material tracking and reconciliation procedures. |
| 26.2 | Mining and Mineral Reserves |
| 1. | The dewatering system does not have a backup power supply. Any type of long term power loss can cause the operation to flood and damage infrastructure. A backup power system is recommended for site to keep critical infrastructure running and prevent damage. |
| 2. | Consider and assess the viability of surface water wells. This could reduce the risk of flooding underground workings in the event of a site power grid interruption. |
| 3. | Adopt long term planning and Mineral Reserve estimation processes, initiated by a mining method optimization trade-off study, and carry out multiple mining method planning exercises with the intention of reducing operating cut-off grades. |
| 4. | Adjust mobile mining fleet as necessary to achieve reduced mining heights. |
| 5. | Review cut-off grades and modifying factors as part of the planning process and optimize them where appropriate. |
| 6. | Explore and evaluate the old workings of the mines to determine which areas are accessible. Much of the resource of the mine is located in these areas. Determine if new development is required or rehabilitation of old workings is feasible. If areas are not accessible, then the resource/reserves should be adjusted to reflect the update. |
| 26.3 | Mineral Processing and Metallurgical Testing |
| 1. | Complete metallurgical testing of samples from the various mining sources that represent the current and future feed to the processing plant in order to develop more accurate estimates for future gold recovery and to provide information to support blending of plant feed with respect to sulfide sulfur, TOC concentrations, and other variables that contribute to plant performance. Metallurgical testing of two main ore bodies is currently planned, including characterization and roast-CIL leach testing at various grind sizes. The estimated cost of the program is US$150,000. |
| 26.4 | Infrastructure |
| 1. | Construction of the additional TSF capacity and increased WTP capacity are critical to operation of the Mine. These projects should be completed as soon as possible, as planned. |
| First Majestic Silver Corp. | Jerritt Canyon Gold Mine, SLR Project No: 233.03396.R0000
| ||||
| NI 43-101 Technical Report - April 30, 2021 | 26-1 | |||
| 26.5 | Tailings and Water Management Facilities |
| 1. | Accelerate the removal of surplus process water from the system by the process WTP and forced-air (i.e. active) evaporation. The process WTP needs to treat and remove its original design rate of 700 gpm from the water inventory in order to empty the WSR within one year to prepare it for conversion to TSF 3 before the end of 2023 or preferably sooner. |
| 2. | Explore the feasibility of designing a downstream raise of the TSF 2 embankment (Phase 5 Raise). Depending on results of embankment stability analyses, which will dictate the additional raise height, TSF 2 Phase 5 could provide multiple years of additional tailings storage. |
| 3. | Investigate and identify ‘green field’ areas near the existing process facilities and mill site where future TSFs may be permitted, designed, constructed, and operated. Due to the multiple-year lead times for permitting such facilities, investigation and conceptual designs need to be initiated as soon as possible. |
| 4. | Regardless of which option is eventually selected for future tailings storage, Jerritt Canyon should start the permitting process for additional tailings storage in the near future, before TSF 2 Phase 4 is filled to capacity in 2023 and assuming the WSR cannot be emptied within the next year. |
| 26.6 | Environmental Considerations |
| 1. | JCG should continue to mitigate the environmental regulatory exceedances and challenges related to air and water quality to achieve compliance with all their environmental permits. |
| 2. | To maintain a strong working relationship with regulators, JCG should actively develop a permitting strategy and plan that involves seeking permit approvals and modifications on a regular basis. |
| 26.7 | Safety |
| 1. | Efforts to alleviate air quality concerns in the processing facilities and provide working areas that can be accessed without wearing respirators should be a top priority and pursued vigorously. |
| First Majestic Silver Corp. | Jerritt Canyon Gold Mine, SLR Project No: 233.03396.R0000
| ||||
| NI 43-101 Technical Report - April 30, 2021 | 26-2 | |||
| 27.0 | REFERENCES |
Brown, Adrian, 2006, Jerritt Canyon- Smith Mine Water Management.
Brown, Adrian, 2021, Personnel Communication (3/19/2021).
Canadian Institute of Mining, Metallurgy and Petroleum (CIM), 2014, CIM Definition Standards for Mineral Resources and Mineral Reserves, adopted by the CIM Council on May 10, 2014.
Canadian Institute of Mining, Metallurgy and Petroleum (CIM), 2019: Estimation of Mineral Resources and Mineral Reserves Best Practice Guidelines (MRMR Estimation Best Practice Guidelines), 74 pp.
Carlson, N., 1987, Complex Resistivity Survey, Jerritt Canyon Project, Elko Co., Nevada for Freeport McMoRan Gold Co.
Dames and Moore, 1995, Preliminary Ground Water Characterization, Dash Project Area.
Department of Conservation & Natural Resources NDEP, 2016, Engineering Design Change Approval – Tailings Supernatant Water Treatment Plant Jerritt Canyon Mine, Elko County Water Pollution Control Permit NEV0000020, December 6, 2016.
Department of Conservation & Natural Resources NDEP, 2018, Bond Secured by Cash Deposit Accepted, Reclamation Personal Bond Form Accepted, August 8, 2018.
Department of Conservation &Natural Resources NDEP, 2020, Obligation Under Cash bond Increased, Reclamation Permit 0077, December 8, 2020.
Deter, K.W. and McCord, T.H., 1991, Oxygen Whole Ore Roasting at Jerritt Canyon Joint Venture, for presentation at the 1991 SME Annual Meeting, Denver, CO, February 25 – 28, 1991.
Doe, T. C., 1987, Jerritt Canyon Geophysical Review, Freeport-McMoRan Gold Company, Inter-office Letter, 25p (This is hardcopy that included D. Smith (1987) and Young G. N., and D. H. Johnson, 1986.
Eakin T.E., and R.D. Lamke, 1966. Hydrologic Reconnaissance of the Humboldt River Basin, Nevada. Nevada Department of Conservation and Natural Resources, Bulletin No. 32.
Ellis, R. B., 1999, Compilation and Terrain Corrections for the Gradient Array Resistivity and Self Potential Data at the Jerritt Canyon Joint Venture, Elko County, Nevada for ANGLOGOLD (Jerritt Canyon) Corporation, August 1999, 83 p.
Ellis, R.B., 2016, Processing & Review of Airborne & Ground Geophysical Data for the Jerritt Canyon Project, Elko, County, Nevada. Report to Jerritt Canyon Gold, LLC (February 10, 2016).
| First Majestic Silver Corp. | Jerritt Canyon Gold Mine, SLR Project No: 233.03396.R0000
| ||||
| NI 43-101 Technical Report - April 30, 2021 | 27-1 | |||
Golder Associates, Inc., 2012, Preliminary Geotechnical Recommendations – Starvation Canyon Area Underground, Jerritt Canyon Mine, Elko County, Nevada, a technical memorandum by Otto, S.A., and Moffitt, K.M., September 4, 2012, 14 p.
Groundwater Review Questionnaire for Exploration Drilling Projects
Jerritt Gold Corporation, 2021, Groundwater Review Questionnaire for Exploration Drilling Projects - Jerritt Canyon Mining District, Questionnaire prepared by Jerritt Canyon Gold Corporation for the US Forest Service, Humboldt-Toiyabe National Forest to support the Jerritt Canyon Drilling Project Environmental Impact Statement, dated March 2021.
Johnson, P.E., Odell, M., Swanson, K. White, M., and Fox, J. 2013. NI 43-101 Technical Report Veris Gold Corp, Jerritt Canyon Property, Elko Count, Nevada, 256 p. (July 11, 2013).
Johnston, M.K., Thompson, T.B., Emmons, D.L., Jones, K., 2008, Geology of the Cove Mine, Lander County, Nevada, and a Genetic Model for the McCoy-Cove Hydrothermal System, Economic Geology, v. 103, pp. 759-782.
Jones, M., 2016, TSF1 Discharge Initiation Schedule, Letter to NDEP-BMRR, November 17, 2016.
Killin, K. P., J. Stephen, and M. Playford, 2011, Titan-24 DC/IP/MT survey 3D DC/IP inversion Geophysical Report (Volume II), Jerritt Canyon and Starvation Canyon Targets, Nevada, USA on behalf of Yukon Nevada Gold Corporation, British Columbia, Canada, Quantec Geoscience Ltd. Report CA00846T, 33 p.
Linkan Engineering, 2016, Smith Dewatering WTP Engineering Design Change (EDC) prepared for Jerritt Canyon Gold LLC Smith Dewatering Water Treatment Plant, August 2016.
Linkan Engineering, 2016, Tailings WTP Engineering Design Change (EDC) prepared for Jerritt Canyon Gold LLC Tailings Supernatant Water Treatment Plant, September 2016.
Marsden, J.O., and House, C. I, 2006, The Chemistry of Gold Extraction, Second Edition, Published by the Society of Mining, Metallurgy and Exploration, Inc.,
Muntean, J.L., and Henry C.D., 2007, Preliminary Geological Map of the Jerritt Canyon mining district, Elko County, Nevada, Open-File Report 2007-03.
Odell, M., White, M., Swanson, K., and Fox, J., 2012, NI 43-101 Technical Report Update, Yukon-Nevada Gold Corp., Jerritt Canyon property, Elko County, Nevada, USA (April 27, 2012).
Peatfield, G.R., and Rozelle, J.W., 2006, Technical Report on the Big Springs, Mac Ridge, and Dorsey Creek Mineral Properties, Independence Mountains District, Elko County, Nevada, U.S.A., for Gateway Gold Corp., 126 p. (March 14, 2006).
Perera, S., J. Stephen, and M. Gharibi, 2011, Titan-24 DC/IP/MT survey 3D DC/IP inversion Geophysical Report (Volume I), Jerritt Canyon and Starvation Canyon Targets, Nevada, USA on behalf of Yukon
| First Majestic Silver Corp. | Jerritt Canyon Gold Mine, SLR Project No: 233.03396.R0000
| ||||
| NI 43-101 Technical Report - April 30, 2021 | 27-2 | |||
Nevada Gold Corporation, British Columbia, Canada, Quantec Geoscience Ltd. Report CA00846T, 33 p.
Phinisey, J., 1999b, Cover letter for data file - E-Scan Survey at JCJV, AngloGold-Jerritt Canyon Joint Venture Inter-Office Memo to File, December 8, 1999, 5 p.
Pincock, Allen & Holt, 2003, Jerritt Canyon Mine, Elko County, Nevada, Technical Report, prepared for Queenstake Resources Ltd. (June 2003).
Pincock, Allen & Holt, 2004, Jerritt Canyon Mine, Elko County, Nevada, Technical Report, prepared for Queenstake Resources Ltd., no. 9234.06, 98 p. (July 26, 2004).
Pincock, Allen & Holt, 2005, Jerritt Canyon Mine, Elko County, Nevada, Technical Report, prepared for Queenstake Resources Ltd., no. 9234.07, 102 p. (February 23, 2005).
Queenstake Resources USA, Ltd, 2012, Smith Mine Dewatering Plan, prepared for the WPCP.
RPA, 2018, Technical Report on the Jerritt Canyon Mine, Elko County, Nevada, USA. (September 28, 2018).
Schaaf, K. E, 2000, Data transfer letter to J. D. Phinisey dated June 19, 2000 including survey control data, 2 p.
Shore Greg A. 1999, Reprocessing to confirm Jerritt Canyon 3D survey results, Letter from Premier Geophysics Inc. to Jeff Phinisey, AngloGold (Jerritt Canyon) Corp., November 30, 1999, 5 p. (Contained in J. Phinisey, 1999b).
Smith D., 1972, Results of Geophysical Test Surveys, Jerritt Canyon Project, Elko County, Nevada for the FMC Corporation, August 1972, 16 p.
Smith D., 1987, Jerritt Canyon Geophysical Study Report, Phase I (a), Review of Geology and Geophysics for Freeport -McMoRan Gold Company, Elko, Nevada, June 1987, 24 p. (This is hardcopy included in T.D. Doe, 1987).
Smith, D., 1990, Report on Jerritt Canyon Geophysical Surveys for Independence Mining Co., Elko County, Nevada.
SRK Consulting (US), Inc., 2003, Jerritt Canyon Mine Tentative Plan for Permanent Closure Attachment 7: 2003 Updated WPCP Renewal Application (September 2003).
SRK Consulting (US), Inc., 2006, Queenstake Resources Ltd., Technical Report, Jerritt Canyon Mine, report number 149203, endorsed by Landy Stinnett (P.E.) as the Qualified Person, 101 p. (April 2006).
SRK Consulting (US), Inc., 2007, Queenstake Resources Ltd., NI 43-101 Technical Report, Jerritt Canyon Mine, report number 149204, endorsed by Landy Stinnett (P.E.) as the Qualified Person, 110 p. (April 2007).
| First Majestic Silver Corp. | Jerritt Canyon Gold Mine, SLR Project No: 233.03396.R0000
| ||||
| NI 43-101 Technical Report - April 30, 2021 | 27-3 | |||
SRK Consulting (US), Inc., 2008, NI 43-101 Technical Report, Yukon-Nevada Gold Corp., Jerritt Canyon property, Elko County, NV, endorsed by Landy Stinnett (P.E.) as the Qualified Person, 100 p. (April 16, 2008).
SRK Consulting (US), Inc., 2011, Due Diligence Report, Jerritt Canyon Mine, Elko, Nevada, Report prepared for Deutsche Bank, Project no. 132900.050, 132 p. (August 29, 2011).
SRK Consulting, 2011, Water Storage Reservoir East Basin & Pipeline Corridor #4 Final As-Built Report for 2011 Construction Jerritt Canyon Mine Water Pollution Control Permit NEV0000020, December 2011.
SRK Consulting (U.S.), Inc., 2011, Design Report for Tailings Storage Facility 2 and Water Storage Reservoir (per NAC 535.210), July 18, 2011.
SRK Consulting, 2012, Tailings Storage Facility 2 As-Built Report for 2011 & 2012 Construction Jerritt Canyon Mine Water Pollution Control Permit NEV0000020, December 10, 2012.
SRK, 2015. Design Report Tailings Storage Facility 2 Phase 2 J-667 (per NAC 535.210). September 10, 2015.
SRK, 2021. Tailings Storage Facility 2 - Phase 4 Expansion Engineering Design Report, March 2021.
Standard Reclamation Cost Estimator, 2017, Jerritt Canyon 2017 AWP RCE (Rev 1)- (PRIVATE LANDS), July 21, 2017.
Standard Reclamation Cost Estimator, 2017, Jerritt Canyon 2017 AWP RCE (Rev 1)- (PUBLIC LANDS), July 21, 2017.
Stevens, D. L., 1976, Jerritt Canyon Project 7632-1 Aeromagnetics, Data Interpretation, Freeport McMoRan Inter-Office Memorandum to R. B. Hawkins and E. B. Bell, October 29, 1976, 4 p.
USDA Forest Service Humboldt National Forest, 1980, Final Environmental Impact Statement Jerritt Canyon Project Gold Mine and Mill, Elko County, Nevada, April 1980.
USDA, 1993, Jerritt Mine Expansion Draft Environmental Impact Statement.
V Construction, 2017, Jerritt Canyon Mine – TSF II Expansion Construction – Work Plan, September 6, 2017.
Valentini, Anthony E., 1988, Report on a combined Helicopter-borne magnetic, electromagnetic, and VLF survey, Elko Project, State of Nevada, United States for Freeport- McMoRan Gold Company by Aerodat Limited, June 8, 1988, 27 p.
Wanner, D, Bentel, D, and Jones, M, 2017, TSF1 Operational History and Closure Case Study.
Witherley, K. 2017, Jerritt Canyon Geophysical Overview. Report from Condor Consulting to Jerritt Canyon Gold LLC dated May 18, 2017.
| First Majestic Silver Corp. | Jerritt Canyon Gold Mine, SLR Project No: 233.03396.R0000
| ||||
| NI 43-101 Technical Report - April 30, 2021 | 27-4 | |||
Young G. N., and D. H. Johnson, 1986, The Association of Microfine Pyrite with Gold in Carlin Type Deposits as Determined by Complex-Resistivity Measurements, Presented at the 1986 Society of Exploration Geophysicists. Expanded abstract referenced and included in D. Smith (1987).
| First Majestic Silver Corp. | Jerritt Canyon Gold Mine, SLR Project No: 233.03396.R0000
| ||||
| NI 43-101 Technical Report - April 30, 2021 | 27-5 | |||
| 28.0 | DATE AND SIGNATURE PAGE |
This report titled “Technical Report on the Jerritt Canyon Gold Mine, Elko County, Nevada, USA” with an effective date of December 31, 2020 was prepared and signed by the following authors:
| (Signed & Sealed) Ryan Rodney | ||
| Dated at Lakewood, CO |
Ryan Rodney, C.P.G. | |
| April 30, 2021 |
Associate Geologist | |
| (Signed & Sealed) Gordon L. Fellows | ||
| Dated at Elko, NV |
Gordon L. Fellows, P.E. | |
| April 30, 2021 |
Jerritt Canyon, Mining Manager | |
| (Signed & Sealed) Chelsea Hamilton | ||
| Dated at Whitehorse, YT |
Chelsea Hamilton, P.Eng. | |
| April 30, 2021 |
Project Mining Engineer | |
| (Signed & Sealed) Andrew P. Hampton | ||
| Dated at Lakewood, CO |
Andrew P. Hampton, M.Sc., P.Eng. | |
| April 30, 2021 |
Principal Metallurgist | |
| (Signed & Sealed) Jeremy Scott Collyard | ||
| Dated at Lakewood, CO |
Jeremy Scott Collyard, MMSA QP | |
| April 30, 2021 |
Principal Environmental Specialist | |
| First Majestic Silver Corp. | Jerritt Canyon Gold Mine, SLR Project No: 233.03396.R0000
| ||||
| NI 43-101 Technical Report - April 30, 2021 | 28-1 | |||
| 29.0 | CERTIFICATE OF QUALIFIED PERSON |
| 29.1 | Ryan Rodney |
I, Ryan Rodney, C.P.G., as an author of this report entitled “Technical Report on the Jerritt Canyon Gold Mine, Elko County, Nevada, USA” with an effective date of December 31, 2020 prepared for First Majestic Silver Corp., do hereby certify that:
| 1. | I am an Associate Geologist with SLR International Corporation, of 1658 Cole Boulevard, Suite 100, Lakewood, CO USA 80401. |
| 2. | I am a graduate of the University of Arizona in 2008 with a B.Sc. degree in Geology. |
| 3. | I am Certified Professional Geologist with the American Institute of Professional Geologists (No. CPG-11954) and a Registered Member of SME (RM #4229254). I have worked as a geologist for a total of 13 years since my graduation. My relevant experience for the purpose of the Technical Report is: |
| · | Geologic modelling, resource estimation, and preparation of NI 43-101 Technical Reports |
| · | Planning and execution of resource exploration and reserve conversion drilling |
| · | Experienced user of acQuire, Maptek Vulcan, Maptek I-Site and Leapfrog |
| · | Worked as an Underground Mine Geologist for eight years |
| 4. | I have read the definition of “qualified person” set out in National Instrument 43-101 (NI 43-101) and certify that by reason of my education, affiliation with a professional association (as defined in NI 43-101) and past relevant work experience, I fulfill the requirements to be a “qualified person” for the purposes of NI 43-101. |
| 5. | I visited the Jerritt Canyon site on April 20, 2021. |
| 6. | I am responsible for Sections 2 to 12, 14, 23, and 24, and related disclosure in Sections 1, 25, 26, and 27 of the Technical Report. |
| 7. | I am independent of the Issuer applying the test set out in Section 1.5 of NI 43-101. |
| 8. | I have had prior involvement with the property that is the subject of the Technical Report, as I have prepared a report on Jerritt Canyon in 2021 for Jerritt Canyon LLC’s internal purposes. |
| 9. | I have read NI 43-101, and the Technical Report has been prepared in compliance with NI 43-101 and Form 43-101F1. |
| 10. | At the effective date of the Technical Report, to the best of my knowledge, information, and belief, the sections of the Technical Report for which I am responsible contain all scientific and technical information that is required to be disclosed to make the Technical Report not misleading. |
Dated this 30th day of April, 2021
(Signed & Sealed) Ryan Rodney
Ryan Rodney, C.P.G.
| First Majestic Silver Corp. | Jerritt Canyon Gold Mine, SLR Project No: 233.03396.R0000
| ||||
| NI 43-101 Technical Report - April 30, 2021 | 29-1 | |||

| 29.2 | Gordon L. Fellows |
I, Gordon L. Fellows, P.E., as an author of this report entitled “Technical Report on the Jerritt Canyon Mine, Elko County, Nevada, USA” with an effective date of December 31, 2020 prepared for First Majestic Silver Corp., do hereby certify that:
| 1. | I am the Jerritt Canyon Mine Mining Manager with Jerritt Canyon Gold LLC, which is an indirect wholly owned subsidiary of First Majestic Silver Corp. |
| 2. | I am a graduate of the Colorado School of Mines in 1987 with a Bachelor of Science in Mining Engineering and the University of Idaho in 2001 with a Master of Science in Mining Engineering. |
| 3. | I am registered as a Professional Engineer in the State of Washington (#39516), a Qualified Professional Member in good standing of the Mining & Metallurgical Society of America (#001152QP), and a Registered Member of The Society for Mining, Metallurgy & Exploration. I have worked as a mining engineer for a total of 34 years since my graduation. My relevant experience for the purpose of the Technical Report is: |
| · | Mine planning, underground mine design and scheduling, ventilation design and implementation in multiple mining methods for numerous projects in USA, South Africa, Tanzania, Bulgaria, Canada, Chile, Mexico and Honduras. |
| · | Technical Services Manager for a number of Canadian mining companies, including Dundee Precious Metals, Inc. and Barrick Gold Corp. |
| · | Mineral reserves estimation and preparation of NI 43-101 Technical Reports. |
| 4. | I have read the definition of “qualified person” set out in National Instrument 43-101 (NI 43-101) and certify that by reason of my education, affiliation with a professional association (as defined in NI 43-101) and past relevant work experience, I fulfill the requirements to be a “qualified person” for the purposes of NI 43-101. |
| 5. | I have worked at Jerritt Canyon from September 3, 2019 to present. |
| 6. | I am responsible for Sections 15, 16, and 18, and related disclosure in Sections 1, 25, 26, and 27 of the Technical Report. |
| 7. | I am not independent of the Issuer applying the test set out in Section 1.5 of NI 43-101. |
| 8. | I have had prior involvement with the property that is the subject of the Technical Report as I am the Jerritt Canyon Mine Mining Manager and have worked at site since September 3, 2019. |
| 9. | I have read NI 43-101, and the Technical Report has been prepared in compliance with NI 43-101 and Form 43-101F1. |
| 10. | At the effective date of the Technical Report, to the best of my knowledge, information, and belief, the sections of the Technical Report for which I am responsible contain all scientific and technical information that is required to be disclosed to make the Technical Report not misleading. |
Dated this 30th day of April, 2021
(Signed & Sealed) Gordon L. Fellows
Gordon L. Fellows, P.E.
HC 31 Box 78 Elko, Nevada 89801 TEL (775) 738-5600 FAX (775) 539-3191
| First Majestic Silver Corp. | Jerritt Canyon Gold Mine, SLR Project No: 233.03396.R0000
| ||||
| NI 43-101 Technical Report - April 30, 2021 | 20-2 | |||
| 29.3 | Chelsea Hamilton |
I, Chelsea Hamilton, P.Eng., as an author of this report entitled “Technical Report on the Jerritt Canyon Gold Mine, Elko County, Nevada, USA” with an effective date of December 31, 2020 prepared for First Majestic Silver Corp., do hereby certify that:
| 1. | I am a Project Mining Engineer with SLR Consulting Ltd, of 6131 6th Avenue, Whitehorse, YT Y1A 1N2. |
| 2. | I am a graduate of the University of Toronto in 2007 with a BASc in Mineral Engineering. |
| 3. | I am registered as a Professional Engineer in the Province of Ontario (Licence No. 100127897) and the Yukon Territory (License No. 3578). I have worked as a mining engineer for a total of 8 years since my graduation. My relevant experience for the purpose of the Technical Report is: |
| · | Mine planning, underground mine design and scheduling, ventilation design and implementation for numerous projects in Canada and USA. |
| · | Mining engineer for an underground gold mine in Ontario, Canada and an underground gold mine in Nevada, USA for a total of 3.5 years. |
| · | Precious Metals Equity Research Associate/Analyst in Toronto for a total of 2.5 years. |
| · | Mineral reserve estimation and preparation of NI 43-101 Technical Reports. |
| · | Experienced user of Deswik mine planning software. |
| 4. | I have read the definition of “qualified person” set out in National Instrument 43-101 (NI 43-101) and certify that by reason of my education, affiliation with a professional association (as defined in NI 43-101) and past relevant work experience, I fulfill the requirements to be a “qualified person” for the purposes of NI 43-101. |
| 5. | I did not visit Jerritt Canyon. |
| 6. | I am responsible for Sections 19, 21, and 22, and related disclosure in Sections 1, 25, 26, and 27 of the Technical Report. |
| 7. | I am independent of the Issuer applying the test set out in Section 1.5 of NI 43-101. |
| 8. | I have been involved with the property that is the subject of this Technical Report since 2020 and was involved in preparation of a report for Jerritt Canyon LLC’s internal purposes in 2021. |
| 9. | I have read NI 43-101, and the Technical Report has been prepared in compliance with NI 43-101 and Form 43-101F1. |
| 10. | At the effective date of the Technical Report, to the best of my knowledge, information, and belief, the sections of the Technical Report for which I am responsible contain all scientific and technical information that is required to be disclosed to make the Technical Report not misleading. |
Dated this 30th day of April, 2021
(Signed & Sealed) Chelsea Hamilton
Chelsea Hamilton, P.Eng.
| First Majestic Silver Corp. | Jerritt Canyon Gold Mine, SLR Project No: 233.03396.R0000
| ||||
| NI 43-101 Technical Report - April 30, 2021 | 29-3 | |||
| 29.4 | Andrew P. Hampton |
I, Andrew P. Hampton, M.Sc., P.Eng., as an author of this report entitled “Technical Report on the Jerritt Canyon Gold Mine, Elko County, Nevada, USA” with an effective date of December 31, 2020 prepared for First Majestic Silver Corp., do hereby certify that:
| 1. | I am a Principal Metallurgist with SLR International Corporation, of Suite 100, 1658 Cole Blvd, Lakewood, CO, USA 80401. |
| 2. | I am a graduate of Southern Illinois University in 1979 with a B.S. Degree in Geology, and a graduate of the University of Idaho in 1985, with an M.S. Degree in Metallurgical Engineering. |
| 3. | I am registered as a Professional Engineer in the Province of British Columbia (Licence No. 22046). I have worked as an extractive metallurgical engineer for a total of 36 years since my graduation. My relevant experience for the purpose of the Technical Report is: |
| · | Process plant engineering, operating, and maintenance experience at mining and chemical operations, including the Sunshine Mine, Kellogg, Idaho, Beker Industries Corp, phosphate and DAP plants in Florida and Louisiana, respectively, and the Delamar Mine in Jordan Valley Oregon. |
| · | Engineering and construction company experience on a wide range of related, precious metal projects and studies, requiring metallurgical testing, preliminary and detailed design, project management, and commissioning and start-up of process facilities and infrastructure. EPCM companies included Kilborn Engineering Pacific Ltd., SNC Lavalin Engineers and Constructors, Washington Group International Inc. and Outotec USA, Inc. |
| 4. | I have read the definition of “qualified person” set out in National Instrument 43-101 (NI 43-101) and certify that by reason of my education, affiliation with a professional association (as defined in NI 43-101) and past relevant work experience, I fulfill the requirements to be a “qualified person” for the purposes of NI 43-101. |
| 5. | I did not visit Jerritt Canyon. |
| 6. | I am responsible for Sections 13 and 17, and related disclosure in Sections 1, 25, 26, and 27 of the Technical Report. |
| 7. | I am independent of the Issuer applying the test set out in Section 1.5 of NI 43-101. |
| 8. | I have been involved with the property that is the subject of this Technical Report since 2020 and was involved in preparation of a report for Jerritt Canyon LLC’s internal purposes in 2021. |
| 9. | I have read NI 43-101, and the Technical Report has been prepared in compliance with NI 43-101 and Form 43-101F1. |
| 10. | At the effective date of the Technical Report, to the best of my knowledge, information, and belief, the sections of the Technical Report for which I am responsible contain all scientific and technical information that is required to be disclosed to make the Technical Report not misleading. |
Dated this 30th day of April, 2021
(Signed & Sealed) Andrew P. Hampton
Andrew P. Hampton, M.Sc., P.Eng.
| First Majestic Silver Corp. | Jerritt Canyon Gold Mine, SLR Project No: 233.03396.R0000
| ||||
| NI 43-101 Technical Report - April 30, 2021 | 29-4 | |||
| 29.5 | Jeremy Scott Collyard |
I, Jeremey Scott Collyard, MMSA QP, as an author of this report entitled “Technical Report on the Jerritt Canyon Gold Mine, Elko County, Nevada, USA” with an effective date of December 31, 2020 prepared for First Majestic Silver Corp., do hereby certify that:
| 1. | I am a Principal Environmental Specialist and United States Mining and Minerals Sector Lead with SLR International Corporation, of Suite 100, 1658 Cole Blvd, Lakewood, CO, USA, 80401. |
| 2. | I am a graduate of the University of Montana located in Missoula, Montana in 2002 with a Bachelors of Science in Forestry. |
| 3. | I am registered as a Qualified Professional with special expertise in Environmental Permitting with the Mining & Metallurgical Society of America (MMSA) (QP No. 1544QP). I have worked as an environmental scientist for a total of 18 years since my graduation. My relevant experience for the purpose of the Technical Report is: |
| · | Environmental permitting and compliance, and |
| · | Mine closure planning and execution. |
| 4. | I have read the definition of “qualified person” set out in National Instrument 43-101 (NI 43-101) and certify that by reason of my education, affiliation with a professional association (as defined in NI 43-101) and past relevant work experience, I fulfill the requirements to be a “qualified person” for the purposes of NI 43-101. |
| 5. | I visited Jerritt Canyon on April 20, 2021. |
| 6. | I am responsible for Section 20 and related disclosure in Sections 1, 25, 26, and 27 of the Technical Report. |
| 7. | I am independent of the Issuer applying the test set out in Section 1.5 of NI 43-101. |
| 8. | I have been involved with the property that is the subject of this Technical Report since 2020 and was involved in preparation of a report for Jerritt Canyon LLC’s internal purposes in 2021. |
| 9. | I have read NI 43-101, and the Technical Report has been prepared in compliance with NI 43-101 and Form 43-101F1. |
| 10. | At the effective date of the Technical Report, to the best of my knowledge, information, and belief, the sections of the Technical Report for which I am responsible contain all scientific and technical information that is required to be disclosed to make the Technical Report not misleading. |
Dated this 30th day of April, 2021
(Signed & Sealed) Jeremey Scott Collyard
Jeremey Scott Collyard, MMSA QP
| First Majestic Silver Corp. | Jerritt Canyon Gold Mine, SLR Project No: 233.03396.R0000
| ||||
| NI 43-101 Technical Report - April 30, 2021 | 29-5 | |||

Serious News for Serious Traders! Try StreetInsider.com Premium Free!
You May Also Be Interested In
- First Majestic Silver Corp. (FR:CN) (AG) PT Raised to Cdn$8.50 at BMO Capital
- ROSEN, A TRUSTED AND LEADING LAW FIRM, Encourages SSR Mining Inc. Investors to Secure Counsel Before Important Deadline in Securities Class Action First Filed by the Firm – SSRM
- New Collection From Wedding Dress Brand Stella York Celebrates 'That Forever Feeling'
Create E-mail Alert Related Categories
SEC FilingsSign up for StreetInsider Free!
Receive full access to all new and archived articles, unlimited portfolio tracking, e-mail alerts, custom newswires and RSS feeds - and more!
