

Form 6-K CEMEX SAB DE CV For: Jul 28
 Tweet
Tweet Share
Share
UNITED STATES
SECURITIES AND EXCHANGE COMMISSION
Washington, D.C. 20549
FORM 6-K
REPORT OF FOREIGN PRIVATE ISSUER
PURSUANT TO RULE 13a-16 or 15d-16
UNDER THE SECURITIES EXCHANGE ACT OF 1934
For the month of July, 2022
Commission File Number: 001-14946
CEMEX, S.A.B. de C.V.
(Translation of Registrant’s name into English)
Avenida Ricardo Margáin Zozaya #325, Colonia Valle del Campestre,
San Pedro Garza García, Nuevo León 66265, México
(Address of principal executive offices)
Indicate by check mark whether the registrant files or will file annual reports under cover Form 20-F or Form 40-F.
Form 20-F ☒ Form 40-F ☐
Indicate by check mark if the registrant is submitting the Form 6-K in paper as permitted by Regulation S-T Rule 101(b)(1):
Indicate by check mark if the registrant is submitting the Form 6-K in paper as permitted by Regulation S-T Rule 101(b)(7):
Contents
| 1. | Press release dated July 28, 2022, announcing second quarter 2022 results for CEMEX, S.A.B. de C.V. (NYSE: CX) (“CEMEX”). | |
| 2. | Second quarter 2022 results for CEMEX. | |
| 3. | Presentation regarding second quarter 2022 results for CEMEX. | |
SIGNATURE
Pursuant to the requirements of the Securities Exchange Act of 1934, CEMEX, S.A.B. de C.V. has duly caused this report to be signed on its behalf by the undersigned, thereunto duly authorized.
| CEMEX, S.A.B. de C.V. | ||||||
| (Registrant) | ||||||
| Date: | July 28, 2022 | By: | /s/ Rafael Garza Lozano | |||
| Name: Rafael Garza Lozano | ||||||
| Title: Chief Comptroller | ||||||
3
EXHIBIT INDEX
| EXHIBIT NO. |
DESCRIPTION | |
| 1. | Press release dated July 28, 2022, announcing second quarter 2022 results for CEMEX, S.A.B. de C.V. (NYSE: CX) (“CEMEX”). | |
| 2. | Second quarter 2022 results for CEMEX. | |
| 3. | Presentation regarding second quarter 2022 results for CEMEX. | |
4
Exhibit 1
|
|
Media Relations Jorge Pérez +52 (81) 8259-6666 |
Analyst and Investor Relations Alfredo Garza / Fabián Orta +1 (212) 317-6011 +52 (81) 8888-4327 |
|

STRONG PRICING DRIVES DOUBLE-DIGIT SALES GROWTH
| • | Year-to-date pricing covering input-cost inflation in dollar terms. |
| • | All regions with strong pricing performance. |
| • | EMEA region with 17% EBITDA growth. |
| • | CO2 emissions reduced by ~3% year-to-date. |
| • | Upgrade from Fitch Ratings to BB+; only one notch away from Investment Grade rating. |
| • | CEMEX Go evolving into industry-first fully automated experience. |
MONTERREY, MEXICO. JULY 28, 2022 – CEMEX, S.A.B. de C.V. (“CEMEX”) (NYSE: CX) announced today continued solid top line growth, with second quarter Net Sales growing 11%. Pricing was the main driver with cement, ready-mix and aggregates, increasing 16%,12%, and 14%, respectively. With a difficult second quarter 2021 comparison base, EBITDA decreased by 8%, primarily due to higher energy costs and supply chain disruptions.
CEMEX’s Consolidated 2022 Second Quarter Financial and Operational Highlights
| • | Net Sales increased 11% to US$4,080 million. |
| • | Operating EBITDA decreased 8% to US$723 million. |
| • | Operating EBITDA margin declined by 3.4 pp year-over-year. |
| • | Free Cash Flow after Maintenance Capital Expenditures was US$154 million. |
| • | Net Income of US$265 million. |
| • | Return on capital employed, excluding goodwill, for previous 12 months of 13.2%. |
“I am pleased that our pricing strategy is yielding results and has fully offset inflationary costs in the quarter. With improved supply chain dynamics and continued success of our pricing and cost containment strategies, we remain confident we can recover 2021 margins,” said Fernando A. González, CEO of CEMEX. “Our decarbonization program, Future in Action, continues making significant progress, with record levels of alternative fuel usage and clinker factor resulting in a 3% reduction in CO2 emissions in the first half of this year. We remain on track to achieve our ambitious 2030 goals, and on the right path to achieve carbon neutrality. On the digital innovation front, our industry-leading digital platform CEMEX Go continues evolving to provide our customers a superior fully automated digital experience.”
1
Geographical Markets 2022 Second Quarter Highlights
In the Europe, Middle East, Africa and Asia region, Net Sales increased 12% in the second quarter, to US$1,294 million. Operating EBITDA was US$193 million for the quarter, 8% higher.
Net Sales in Mexico increased 7% in the second quarter, to US$998 million. Operating EBITDA decreased 4% in the second quarter, to US$320 million.
CEMEX’s operations in the United States reported Net Sales of US$1,296 million in the second quarter, an increase of 15%. Operating EBITDA decreased 24% to US$162 million in the second quarter.
CEMEX’s operations in the South, Central America and the Caribbean region, reported Net Sales of US$418 million in the second quarter, an increase of 10%. Operating EBITDA decreased 7% to US$99 million in the quarter.
Note: All percentage variations related to Net Sales and EBITDA are on a like-to-like basis for the ongoing operations and for foreign exchange fluctuations compared to the same period of last year.
CEMEX is a global construction materials company that is building a better future through sustainable products and solutions. CEMEX is committed to achieving carbon neutrality through relentless innovation and industry-leading research and development. CEMEX is at the forefront of the circular economy in the construction value chain and is pioneering ways to increase the use of waste and residues as alternative raw materials and fuels in its operations with the use of new technologies. CEMEX offers cement, ready-mix concrete, aggregates, and urbanization solutions in growing markets around the world, powered by a multinational workforce focused on providing a superior customer experience, enabled by digital technologies. For more information, please visit: cemex.com
###
This press release contains forward-looking statements within the meaning of the U.S. federal securities laws. CEMEX intends these forward-looking statements to be covered by the safe harbor provisions for forward-looking statements in the U.S. federal securities laws. These forward-looking statements reflect CEMEX’s current expectations and projections about future events based on CEMEX’s knowledge of present facts and circumstances and assumptions about future events, as well as CEMEX’s current plans based on such facts and circumstances. These statements necessarily involve risks and uncertainties that could cause actual results to differ materially from CEMEX’s expectations. These factors may be revised or supplemented, but CEMEX is not under, and expressly disclaims, any obligation to update or correct this press release or any forward-looking statement contained herein, whether as a result of new information, future events or otherwise. Any or all of CEMEX’s forward-looking statements may turn out to be inaccurate. Accordingly, undue reliance on forward-looking statements should not be placed, as such forward-looking statements speak only as of the dates on which they are made. The content of this press release is for informational purposes only, and you should not construe any such information or other material as legal, tax, investment, financial, or other advice.
2
Exhibit 2
Second Quarter Results 2022 The Mexican Center of Philanthropy, Mexico City, Mexico Built with Fortis, part of our Vertua family of sustainable products Stock Listing Information Investor Relations NYSE (ADS) In the United States: Ticker: CX + 1 877 7CX NYSE Mexican Stock Exchange In Mexico: Ticker: CEMEXCPO + 52 (81) 8888 4292 Ratio of CEMEXCPO to CX = 10:1 E-Mail: [email protected]
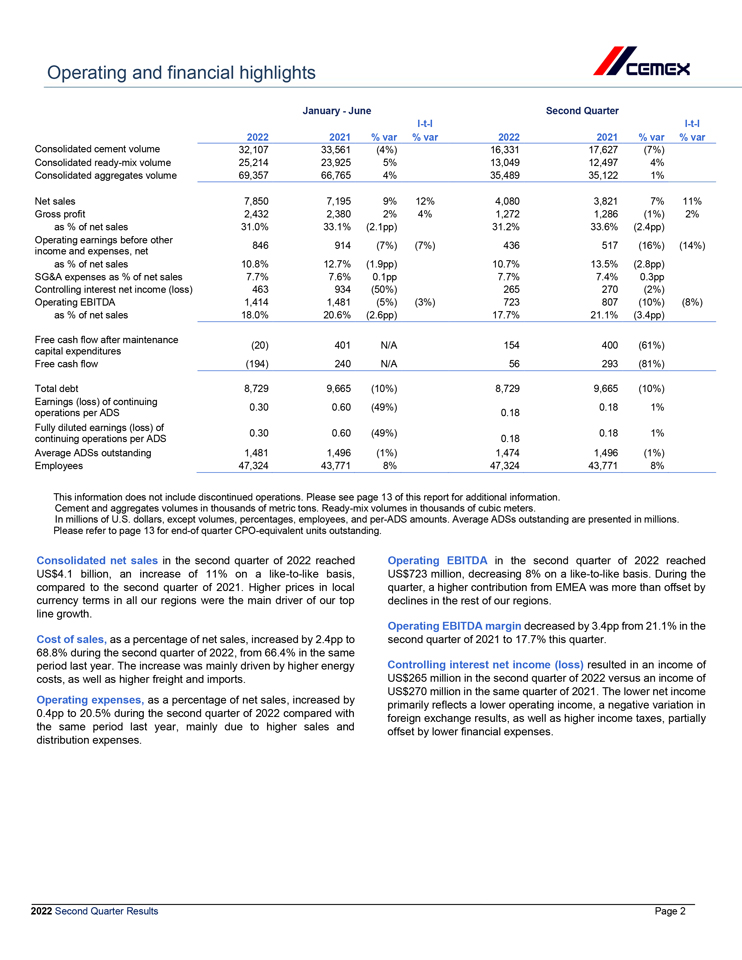
Operating and financial highlights January—June Second Quarter l-t-l l-t-l 2022 2021 % var % var 2022 2021 % var % var Consolidated cement volume 32,107 33,561 (4%) 16,331 17,627 (7%) Consolidated ready-mix volume 25,214 23,925 5% 13,049 12,497 4% Consolidated aggregates volume 69,357 66,765 4% 35,489 35,122 1% Net sales 7,850 7,195 9% 12% 4,080 3,821 7% 11% Gross profit 2,432 2,380 2% 4% 1,272 1,286 (1%) 2% as % of net sales 31.0% 33.1% (2.1pp) 31.2% 33.6% (2.4pp) Operating earnings before other 846 914 (7%) (7%) 436 517 (16%) (14%) income and expenses, net as % of net sales 10.8% 12.7% (1.9pp) 10.7% 13.5% (2.8pp) SG&A expenses as % of net sales 7.7% 7.6% 0.1pp 7.7% 7.4% 0.3pp Controlling interest net income (loss) 463 934 (50%) 265 270 (2%) Operating EBITDA 1,414 1,481 (5%) (3%) 723 807 (10%) (8%) as % of net sales 18.0% 20.6% (2.6pp) 17.7% 21.1% (3.4pp) Free cash flow after maintenance (20) 401 N/A 154 400 (61%) capital expenditures Free cash flow (194) 240 N/A 56 293 (81%) Total debt 8,729 9,665 (10%) 8,729 9,665 (10%) Earnings (loss) of continuing 0.30 0.60 (49%) 0.18 1% operations per ADS 0.18 Fully diluted earnings (loss) of 0.30 0.60 (49%) 0.18 1% continuing operations per ADS 0.18 Average ADSs outstanding 1,481 1,496 (1%) 1,474 1,496 (1%) Employees 47,324 43,771 8% 47,324 43,771 8% This information does not include discontinued operations. Please see page 13 of this report for additional information. Cement and aggregates volumes in thousands of metric tons. Ready-mix volumes in thousands of cubic meters. In millions of U.S. dollars, except volumes, percentages, employees, and per-ADS amounts. Average ADSs outstanding are presented in millions. Please refer to page 13 for end-of quarter CPO-equivalent units outstanding. Consolidated net sales in the second quarter of 2022 reached Operating EBITDA in the second quarter of 2022 reached US$4.1 billion, an increase of 11% on a like-to-like basis, US$723 million, decreasing 8% on a like-to-like basis. During the compared to the second quarter of 2021. Higher prices in local quarter, a higher contribution from EMEA was more than offset by currency terms in all our regions were the main driver of our top declines in the rest of our regions. line growth. Operating EBITDA margin decreased by 3.4pp from 21.1% in the Cost of sales, as a percentage of net sales, increased by 2.4pp to second quarter of 2021 to 17.7% this quarter. 68.8% during the second quarter of 2022, from 66.4% in the same period last year. The increase was mainly driven by higher energy Controlling interest net income (loss) resulted in an income of costs, as well as higher freight and imports. US$265 million in the second quarter of 2022 versus an income of US$270 million in the same quarter of 2021. The lower net income Operating expenses, as a percentage of net sales, increased by primarily reflects a lower operating income, a negative variation in 0.4pp to 20.5% during the second quarter of 2022 compared with foreign exchange results, as well as higher income taxes, partially the same period last year, mainly due to higher sales and offset by lower financial expenses. distribution expenses. 2022 Second Quarter Results Page 2
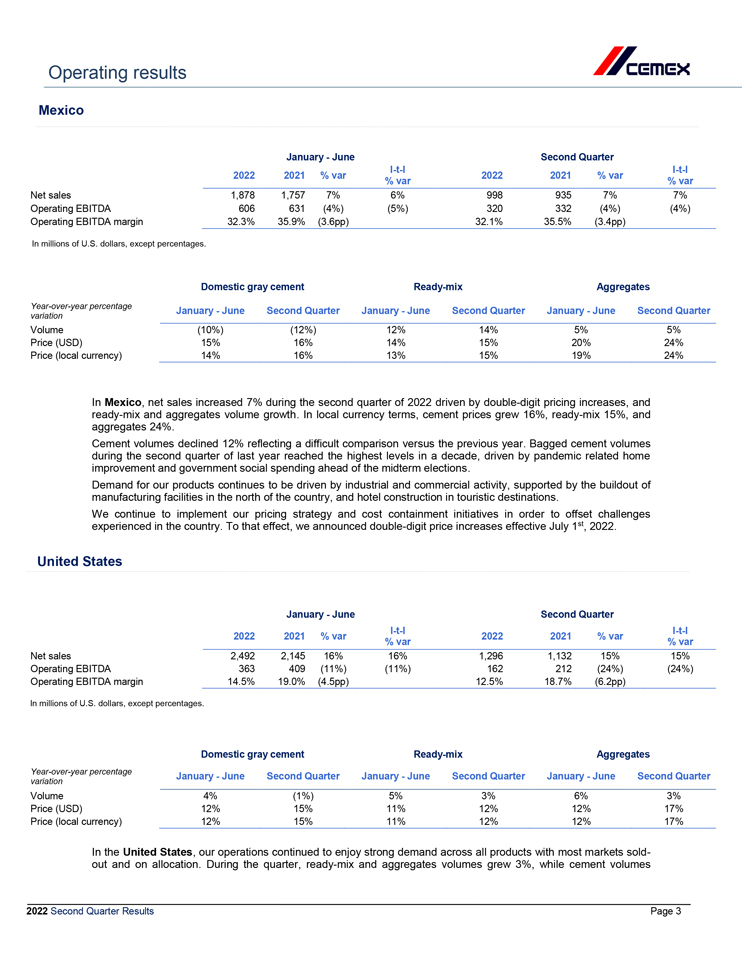
Operating results Mexico January—June Second Quarter l-t-l l-t-l 2022 2021 % var 2022 2021 % var % var % var Net sales 1,878 1,757 7% 6% 998 935 7% 7% Operating EBITDA 606 631 (4%) (5%) 320 332 (4%) (4%) Operating EBITDA margin 32.3% 35.9% (3.6pp) 32.1% 35.5% (3.4pp) In millions of U.S. dollars, except percentages. Domestic gray cement Ready-mix Aggregates Year-over-year percentage January—June Second Quarter January—June Second Quarter January—June Second Quarter variation Volume (10%) (12%) 12% 14% 5% 5% Price (USD) 15% 16% 14% 15% 20% 24% Price (local currency) 14% 16% 13% 15% 19% 24% In Mexico, net sales increased 7% during the second quarter of 2022 driven by double-digit pricing increases, and ready-mix and aggregates volume growth. In local currency terms, cement prices grew 16%, ready-mix 15%, and aggregates 24%. Cement volumes declined 12% reflecting a difficult comparison versus the previous year. Bagged cement volumes during the second quarter of last year reached the highest levels in a decade, driven by pandemic related home improvement and government social spending ahead of the midterm elections. Demand for our products continues to be driven by industrial and commercial activity, supported by the buildout of manufacturing facilities in the north of the country, and hotel construction in touristic destinations. We continue to implement our pricing strategy and cost containment initiatives in order to offset challenges experienced in the country. To that effect, we announced double-digit price increases effective July 1st, 2022. United States January—June Second Quarter l-t-l l-t-l 2022 2021 % var 2022 2021 % var % var % var Net sales 2,492 2,145 16% 16% 1,296 1,132 15% 15% Operating EBITDA 363 409 (11%) (11%) 162 212 (24%) (24%) Operating EBITDA margin 14.5% 19.0% (4.5pp) 12.5% 18.7% (6.2pp) In millions of U.S. dollars, except percentages. Domestic gray cement Ready-mix Aggregates Year-over-year percentage January—June Second Quarter January—June Second Quarter January—June Second Quarter variation Volume 4% (1%) 5% 3% 6% 3% Price (USD) 12% 15% 11% 12% 12% 17% Price (local currency) 12% 15% 11% 12% 12% 17% In the United States, our operations continued to enjoy strong demand across all products with most markets sold-out and on allocation. During the quarter, ready-mix and aggregates volumes grew 3%, while cement volumes 2022 Second Quarter Results Page 3
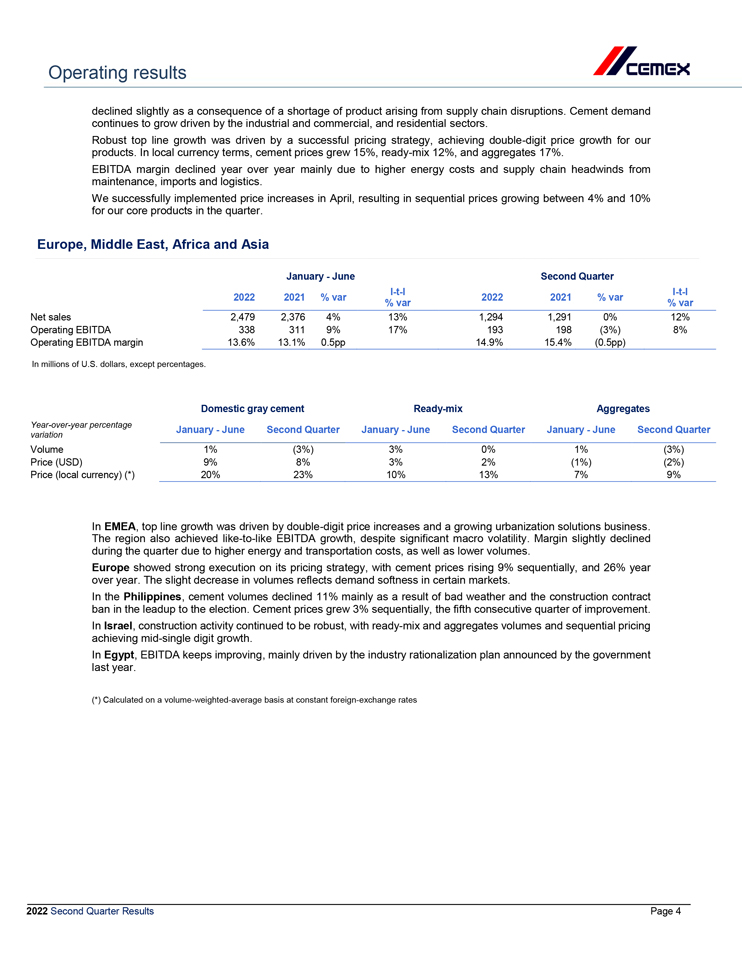
Operating results declined slightly as a consequence of a shortage of product arising from supply chain disruptions. Cement demand continues to grow driven by the industrial and commercial, and residential sectors. Robust top line growth was driven by a successful pricing strategy, achieving double-digit price growth for our products. In local currency terms, cement prices grew 15%, ready-mix 12%, and aggregates 17%. EBITDA margin declined year over year mainly due to higher energy costs and supply chain headwinds from maintenance, imports and logistics. We successfully implemented price increases in April, resulting in sequential prices growing between 4% and 10% for our core products in the quarter. Europe, Middle East, Africa and Asia January—June Second Quarter l-t-l l-t-l 2022 2021 % var 2022 2021 % var % var % var Net sales 2,479 2,376 4% 13% 1,294 1,291 0% 12% Operating EBITDA 338 311 9% 17% 193 198 (3%) 8% Operating EBITDA margin 13.6% 13.1% 0.5pp 14.9% 15.4% (0.5pp) In millions of U.S. dollars, except percentages. Domestic gray cement Ready-mix Aggregates Year-over-year percentage January—June Second Quarter January—June Second Quarter January—June Second Quarter variation Volume 1% (3%) 3% 0% 1% (3%) Price (USD) 9% 8% 3% 2% (1%) (2%) Price (local currency) (*) 20% 23% 10% 13% 7% 9% In EMEA, top line growth was driven by double-digit price increases and a growing urbanization solutions business. The region also achieved like-to-like EBITDA growth, despite significant macro volatility. Margin slightly declined during the quarter due to higher energy and transportation costs, as well as lower volumes. Europe showed strong execution on its pricing strategy, with cement prices rising 9% sequentially, and 26% year over year. The slight decrease in volumes reflects demand softness in certain markets. In the Philippines, cement volumes declined 11% mainly as a result of bad weather and the construction contract ban in the leadup to the election. Cement prices grew 3% sequentially, the fifth consecutive quarter of improvement. In Israel, construction activity continued to be robust, with ready-mix and aggregates volumes and sequential pricing achieving mid-single digit growth. In Egypt, EBITDA keeps improving, mainly driven by the industry rationalization plan announced by the government last year. (*) Calculated on a volume-weighted-average basis at constant foreign-exchange rates 2022 Second Quarter Results Page 4
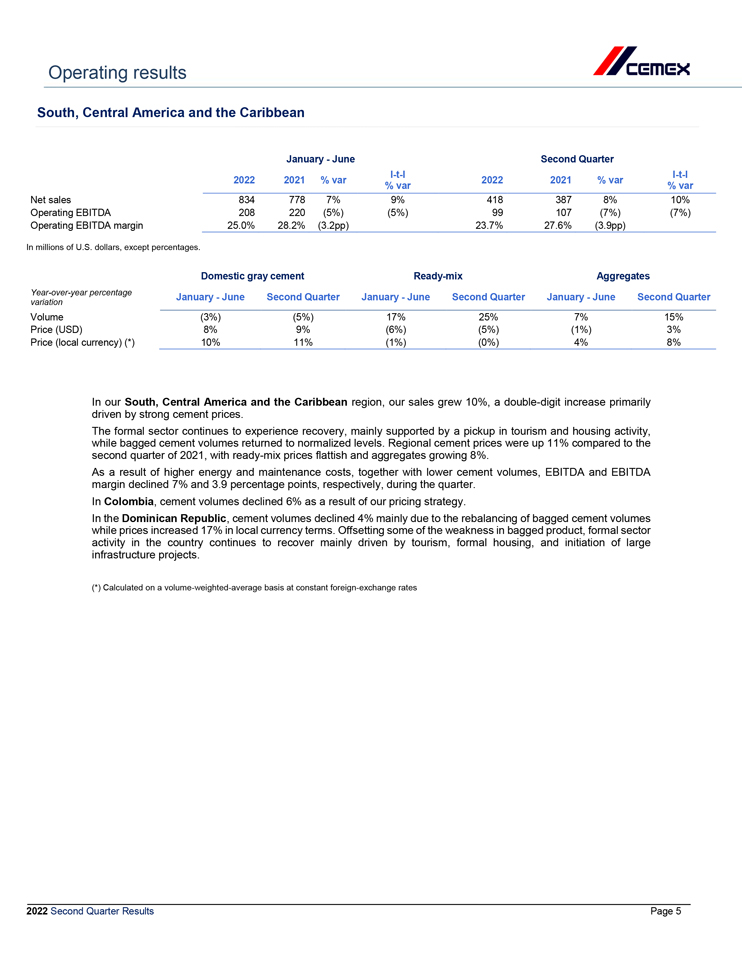
Operating results South, Central America and the Caribbean January—June Second Quarter l-t-l l-t-l 2022 2021 % var 2022 2021 % var % var % var Net sales 834 778 7% 9% 418 387 8% 10% Operating EBITDA 208 220 (5%) (5%) 99 107 (7%) (7%) Operating EBITDA margin 25.0% 28.2% (3.2pp) 23.7% 27.6% (3.9pp) In millions of U.S. dollars, except percentages. Domestic gray cement Ready-mix Aggregates Year-over-year percentage January—June Second Quarter January—June Second Quarter January—June Second Quarter variation Volume (3%) (5%) 17% 25% 7% 15% Price (USD) 8% 9% (6%) (5%) (1%) 3% Price (local currency) (*) 10% 11% (1%) (0%) 4% 8% In our South, Central America and the Caribbean region, our sales grew 10%, a double-digit increase primarily driven by strong cement prices. The formal sector continues to experience recovery, mainly supported by a pickup in tourism and housing activity, while bagged cement volumes returned to normalized levels. Regional cement prices were up 11% compared to the second quarter of 2021, with ready-mix prices flattish and aggregates growing 8%. As a result of higher energy and maintenance costs, together with lower cement volumes, EBITDA and EBITDA margin declined 7% and 3.9 percentage points, respectively, during the quarter. In Colombia, cement volumes declined 6% as a result of our pricing strategy. In the Dominican Republic, cement volumes declined 4% mainly due to the rebalancing of bagged cement volumes while prices increased 17% in local currency terms. Offsetting some of the weakness in bagged product, formal sector activity in the country continues to recover mainly driven by tourism, formal housing, and initiation of large infrastructure projects. (*) Calculated on a volume-weighted-average basis at constant foreign-exchange rates 2022 Second Quarter Results Page 5
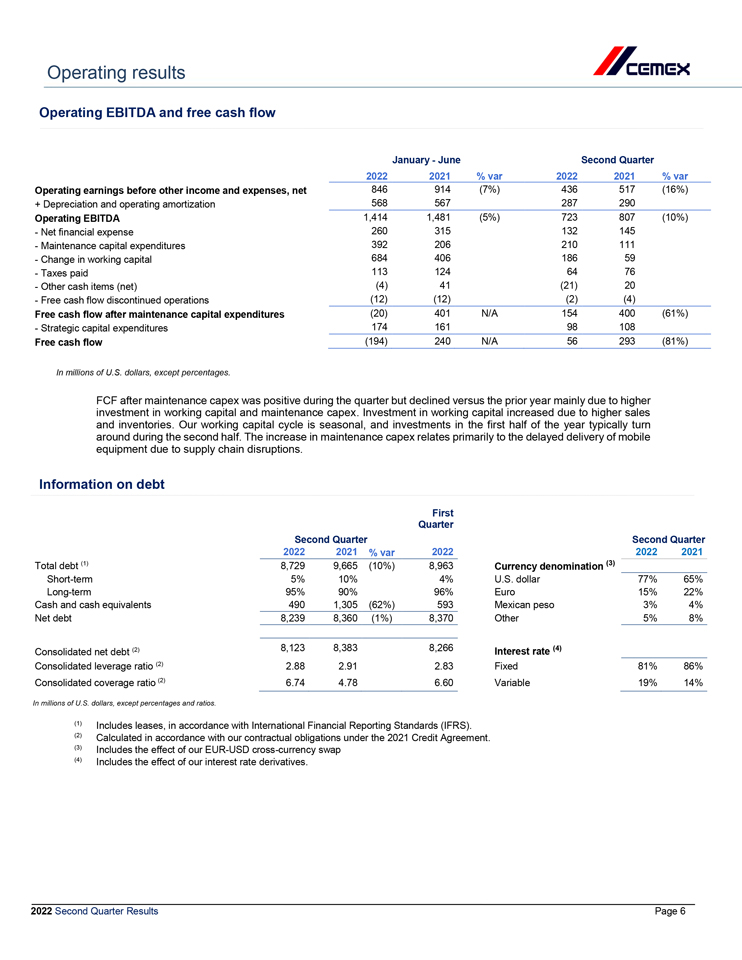
Operating results Operating EBITDA and free cash flow January—June Second Quarter 2022 2021 % var 2022 2021 % var Operating earnings before other income and expenses, net 846 914 (7%) 436 517 (16%) + Depreciation and operating amortization 568 567 287 290 Operating EBITDA 1,414 1,481 (5%) 723 807 (10%)—Net financial expense 260 315 132 145—Maintenance capital expenditures 392 206 210 111—Change in working capital 684 406 186 59—Taxes paid 113 124 64 76—Other cash items (net) (4) 41 (21) 20—Free cash flow discontinued operations (12) (12) (2) (4) Free cash flow after maintenance capital expenditures (20) 401 N/A 154 400 (61%)—Strategic capital expenditures 174 161 98 108 Free cash flow (194) 240 N/A 56 293 (81%) of U.S. except percentages. In millions dollars, FCF after maintenance capex was positive during the quarter but declined versus the prior year mainly due to higher investment in working capital and maintenance capex. Investment in working capital increased due to higher sales and inventories. Our working capital cycle is seasonal, and investments in the first half of the year typically turn around during the second half. The increase in maintenance capex relates primarily to the delayed delivery of mobile equipment due to supply chain disruptions. Information on debt First Quarter Second Quarter Second Quarter 2022 2021 % var 2022 2022 2021 Total debt (1) 8,729 9,665 (10%) 8,963 Currency denomination (3) Short-term 5% 10% 4% U.S. dollar 77% 65% Long-term 95% 90% 96% Euro 15% 22% Cash and cash equivalents 490 1,305 (62%) 593 Mexican peso 3% 4% Net debt 8,239 8,360 (1%) 8,370 Other 5% 8% Consolidated net debt (2) 8,123 8,383 8,266 Interest rate (4) Consolidated leverage ratio (2) 2.88 2.91 2.83 Fixed 81% 86% Consolidated coverage ratio (2) 6.74 4.78 6.60 Variable 19% 14% In millions of U.S. dollars, except percentages and ratios. (1) Includes leases, in accordance with International Financial Reporting Standards (IFRS). (2) Calculated in accordance with our contractual obligations under the 2021 Credit Agreement. (3) Includes the effect of our EUR-USD cross-currency swap (4) Includes the effect of our interest rate derivatives. 2022 Second Quarter Results Page 6
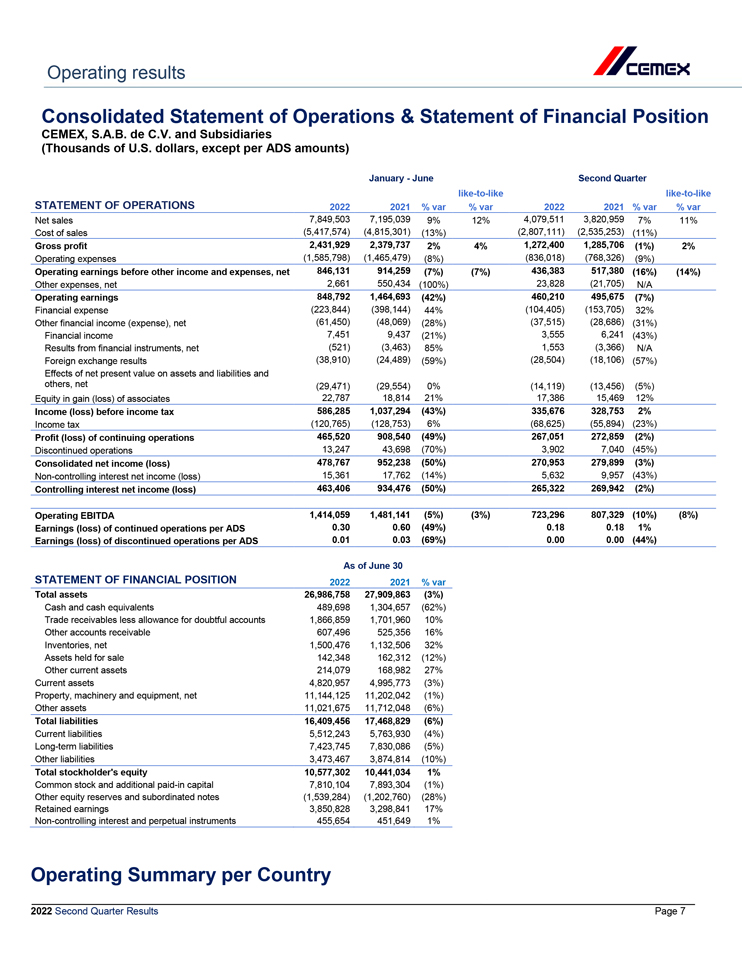
Operating results Consolidated Statement of Operations & Statement of Financial Position CEMEX, S.A.B. de C.V. and Subsidiaries (Thousands of U.S. dollars, except per ADS amounts) January—June Second Quarter like-to-like like-to-like STATEMENT OF OPERATIONS 2022 2021 % var % var 2022 2021 % var % var Net sales 7,849,503 7,195,039 9% 12% 4,079,511 3,820,959 7% 11% Cost of sales (5,417,574) (4,815,301) (13%) (2,807,111) (2,535,253) (11%) Gross profit 2,431,929 2,379,737 2% 4% 1,272,400 1,285,706 (1%) 2% Operating expenses (1,585,798) (1,465,479) (8%) (836,018) (768,326) (9%) Operating earnings before other income and expenses, net 846,131 914,259 (7%) (7%) 436,383 517,380 (16%) (14%) Other expenses, net 2,661 550,434 (100%) 23,828 (21,705) N/A Operating earnings 848,792 1,464,693 (42%) 460,210 495,675 (7%) Financial expense (223,844) (398,144) 44% (104,405) (153,705) 32% Other financial income (expense), net (61,450) (48,069) (28%) (37,515) (28,686) (31%) Financial income 7,451 9,437 (21%) 3,555 6,241 (43%) Results from financial instruments, net (521) (3,463) 85% 1,553 (3,366) N/A Foreign exchange results (38,910) (24,489) (59%) (28,504) (18,106) (57%) Effects of net present value on assets and liabilities and others, net (29,471) (29,554) 0% (14,119) (13,456) (5%) Equity in gain (loss) of associates 22,787 18,814 21% 17,386 15,469 12% Income (loss) before income tax 586,285 1,037,294 (43%) 335,676 328,753 2% Income tax (120,765) (128,753) 6% (68,625) (55,894) (23%) Profit (loss) of continuing operations 465,520 908,540 (49%) 267,051 272,859 (2%) Discontinued operations 13,247 43,698 (70%) 3,902 7,040 (45%) Consolidated net income (loss) 478,767 952,238 (50%) 270,953 279,899 (3%) Non-controlling interest net income (loss) 15,361 17,762 (14%) 5,632 9,957 (43%) Controlling interest net income (loss) 463,406 934,476 (50%) 265,322 269,942 (2%) Operating EBITDA 1,414,059 1,481,141 (5%) (3%) 723,296 807,329 (10%) (8%) Earnings (loss) of continued operations per ADS 0.30 0.60 (49%) 0.18 0.18 1% Earnings (loss) of discontinued operations per ADS 0.01 0.03 (69%) 0.00 0.00 (44%) As of June 30 STATEMENT OF FINANCIAL POSITION 2022 2021 % var Total assets 26,986,758 27,909,863 (3%) Cash and cash equivalents 489,698 1,304,657 (62%) Trade receivables less allowance for doubtful accounts 1,866,859 1,701,960 10% Other accounts receivable 607,496 525,356 16% Inventories, net 1,500,476 1,132,506 32% Assets held for sale 142,348 162,312 (12%) Other current assets 214,079 168,982 27% Current assets 4,820,957 4,995,773 (3%) Property, machinery and equipment, net 11,144,125 11,202,042 (1%) Other assets 11,021,675 11,712,048 (6%) Total liabilities 16,409,456 17,468,829 (6%) Current liabilities 5,512,243 5,763,930 (4%) Long-term liabilities 7,423,745 7,830,086 (5%) Other liabilities 3,473,467 3,874,814 (10%) Total stockholder’s equity 10,577,302 10,441,034 1% Common stock and additional paid-in capital 7,810,104 7,893,304 (1%) Other equity reserves and subordinated notes (1,539,284) (1,202,760) (28%) Retained earnings 3,850,828 3,298,841 17% Non-controlling interest and perpetual instruments 455,654 451,649 1% Operating Summary per Country 2022 Second Quarter Results Page 7
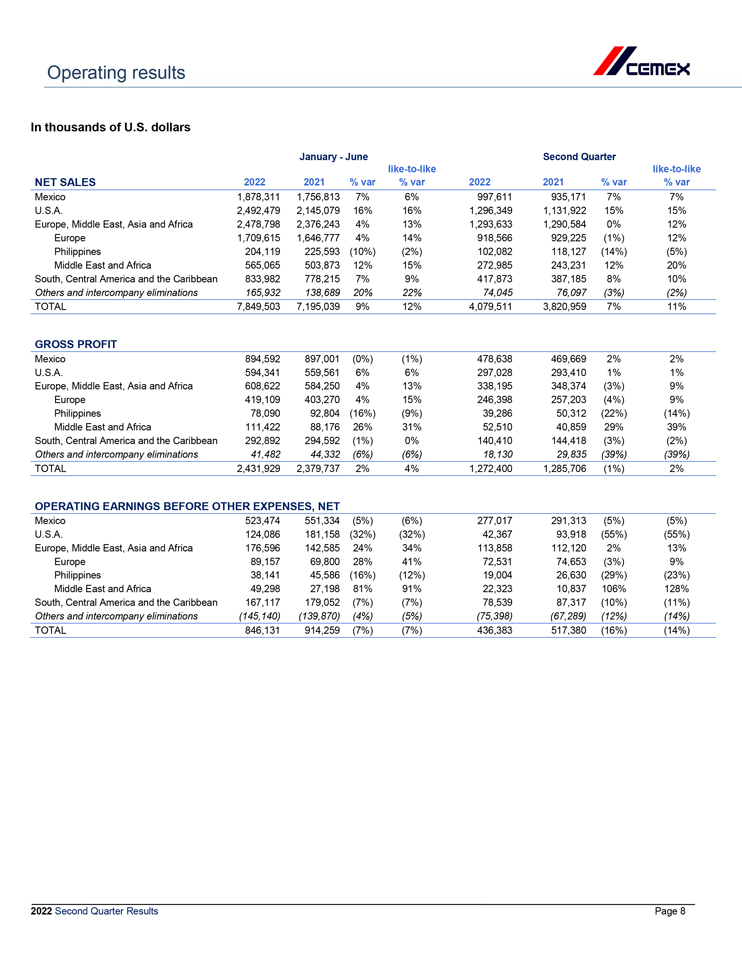
Operating results In thousands of U.S. dollars January—June Second Quarter like-to-like like-to-like NET SALES 2022 2021 % var % var 2022 2021 % var % var Mexico 1,878,311 1,756,813 7% 6% 997,611 935,171 7% 7% U.S.A. 2,492,479 2,145,079 16% 16% 1,296,349 1,131,922 15% 15% Europe, Middle East, Asia and Africa 2,478,798 2,376,243 4% 13% 1,293,633 1,290,584 0% 12% Europe 1,709,615 1,646,777 4% 14% 918,566 929,225 (1%) 12% Philippines 204,119 225,593 (10%) (2%) 102,082 118,127 (14%) (5%) Middle East and Africa 565,065 503,873 12% 15% 272,985 243,231 12% 20% South, Central America and the Caribbean 833,982 778,215 7% 9% 417,873 387,185 8% 10% Others and intercompany eliminations 165,932 138,689 20% 22% 74,045 76,097 (3%) (2%) TOTAL 7,849,503 7,195,039 9% 12% 4,079,511 3,820,959 7% 11% GROSS PROFIT Mexico 894,592 897,001 (0%) (1%) 478,638 469,669 2% 2% U.S.A. 594,341 559,561 6% 6% 297,028 293,410 1% 1% Europe, Middle East, Asia and Africa 608,622 584,250 4% 13% 338,195 348,374 (3%) 9% Europe 419,109 403,270 4% 15% 246,398 257,203 (4%) 9% Philippines 78,090 92,804 (16%) (9%) 39,286 50,312 (22%) (14%) Middle East and Africa 111,422 88,176 26% 31% 52,510 40,859 29% 39% South, Central America and the Caribbean 292,892 294,592 (1%) 0% 140,410 144,418 (3%) (2%) Others and intercompany eliminations 41,482 44,332 (6%) (6%) 18,130 29,835 (39%) (39%) TOTAL 2,431,929 2,379,737 2% 4% 1,272,400 1,285,706 (1%) 2% OPERATING EARNINGS BEFORE OTHER EXPENSES, NET Mexico 523,474 551,334 (5%) (6%) 277,017 291,313 (5%) (5%) U.S.A. 124,086 181,158 (32%) (32%) 42,367 93,918 (55%) (55%) Europe, Middle East, Asia and Africa 176,596 142,585 24% 34% 113,858 112,120 2% 13% Europe 89,157 69,800 28% 41% 72,531 74,653 (3%) 9% Philippines 38,141 45,586 (16%) (12%) 19,004 26,630 (29%) (23%) Middle East and Africa 49,298 27,198 81% 91% 22,323 10,837 106% 128% South, Central America and the Caribbean 167,117 179,052 (7%) (7%) 78,539 87,317 (10%) (11%) Others and intercompany eliminations (145,140) (139,870) (4%) (5%) (75,398) (67,289) (12%) (14%) TOTAL 846,131 914,259 (7%) (7%) 436,383 517,380 (16%) (14%) 2022 Second Quarter Results Page 8
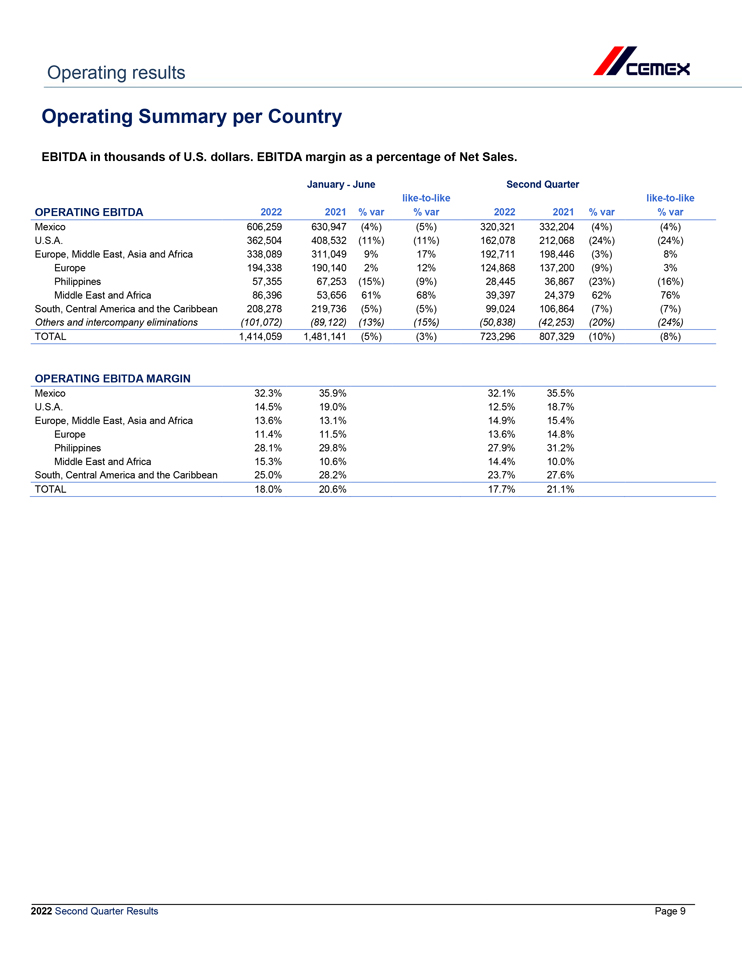
Operating results Operating Summary per Country EBITDA in thousands of U.S. dollars. EBITDA margin as a percentage of Net Sales. January—June Second Quarter like-to-like like-to-like OPERATING EBITDA 2022 2021 % var % var 2022 2021 % var % var Mexico 606,259 630,947 (4%) (5%) 320,321 332,204 (4%) (4%) U.S.A. 362,504 408,532 (11%) (11%) 162,078 212,068 (24%) (24%) Europe, Middle East, Asia and Africa 338,089 311,049 9% 17% 192,711 198,446 (3%) 8% Europe 194,338 190,140 2% 12% 124,868 137,200 (9%) 3% Philippines 57,355 67,253 (15%) (9%) 28,445 36,867 (23%) (16%) Middle East and Africa 86,396 53,656 61% 68% 39,397 24,379 62% 76% South, Central America and the Caribbean 208,278 219,736 (5%) (5%) 99,024 106,864 (7%) (7%) Others and intercompany eliminations (101,072) (89,122) (13%) (15%) (50,838) (42,253) (20%) (24%) TOTAL 1,414,059 1,481,141 (5%) (3%) 723,296 807,329 (10%) (8%) OPERATING EBITDA MARGIN Mexico 32.3% 35.9% 32.1% 35.5% U.S.A. 14.5% 19.0% 12.5% 18.7% Europe, Middle East, Asia and Africa 13.6% 13.1% 14.9% 15.4% Europe 11.4% 11.5% 13.6% 14.8% Philippines 28.1% 29.8% 27.9% 31.2% Middle East and Africa 15.3% 10.6% 14.4% 10.0% South, Central America and the Caribbean 25.0% 28.2% 23.7% 27.6% TOTAL 18.0% 20.6% 17.7% 21.1% 2022 Second Quarter Results Page 9
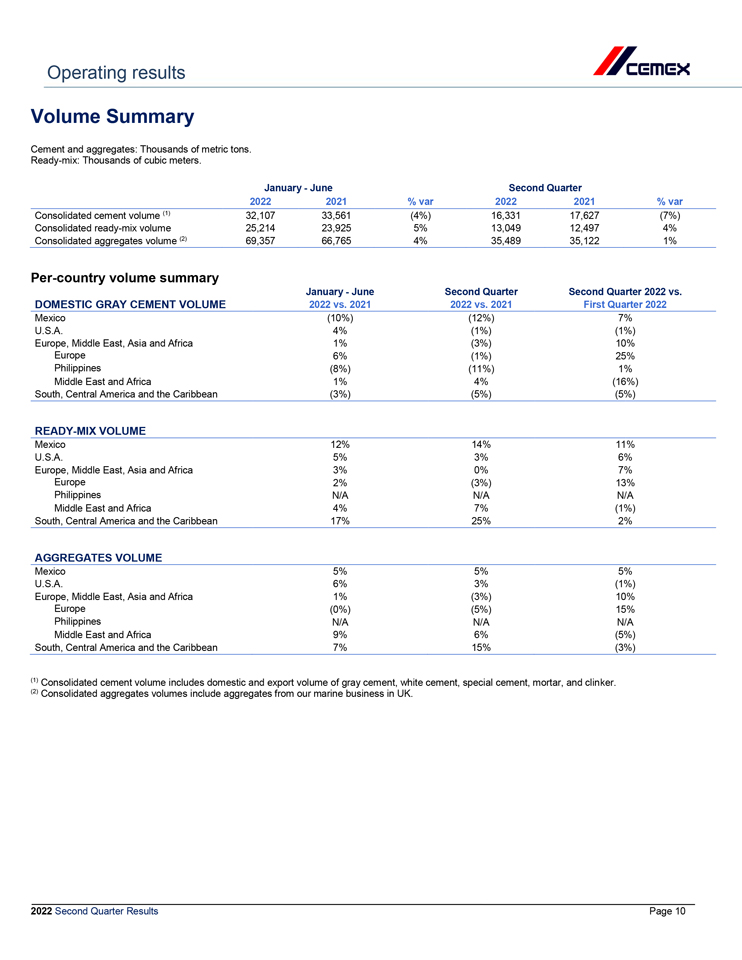
Operating results Volume Summary Cement and aggregates: Thousands of metric tons. Ready-mix: Thousands of cubic meters. January—June Second Quarter 2022 2021 % var 2022 2021 % var Consolidated cement volume (1) 32,107 33,561 (4%) 16,331 17,627 (7%) Consolidated ready-mix volume 25,214 23,925 5% 13,049 12,497 4% Consolidated aggregates volume (2) 69,357 66,765 4% 35,489 35,122 1% Per-country volume summary January—June Second Quarter Second Quarter 2022 vs. DOMESTIC GRAY CEMENT VOLUME 2022 vs. 2021 2022 vs. 2021 First Quarter 2022 Mexico (10%) (12%) 7% U.S.A. 4% (1%) (1%) Europe, Middle East, Asia and Africa 1% (3%) 10% Europe 6% (1%) 25% Philippines (8%) (11%) 1% Middle East and Africa 1% 4% (16%) South, Central America and the Caribbean (3%) (5%) (5%) READY-MIX VOLUME Mexico 12% 14% 11% U.S.A. 5% 3% 6% Europe, Middle East, Asia and Africa 3% 0% 7% Europe 2% (3%) 13% Philippines N/A N/A N/A Middle East and Africa 4% 7% (1%) South, Central America and the Caribbean 17% 25% 2% AGGREGATES VOLUME Mexico 5% 5% 5% U.S.A. 6% 3% (1%) Europe, Middle East, Asia and Africa 1% (3%) 10% Europe (0%) (5%) 15% Philippines N/A N/A N/A Middle East and Africa 9% 6% (5%) South, Central America and the Caribbean 7% 15% (3%) (1) Consolidated cement volume includes domestic and export volume of gray cement, white cement, special cement, mortar, and clinker. (2) Consolidated aggregates volumes include aggregates from our marine business in UK. 2022 Second Quarter Results Page 10
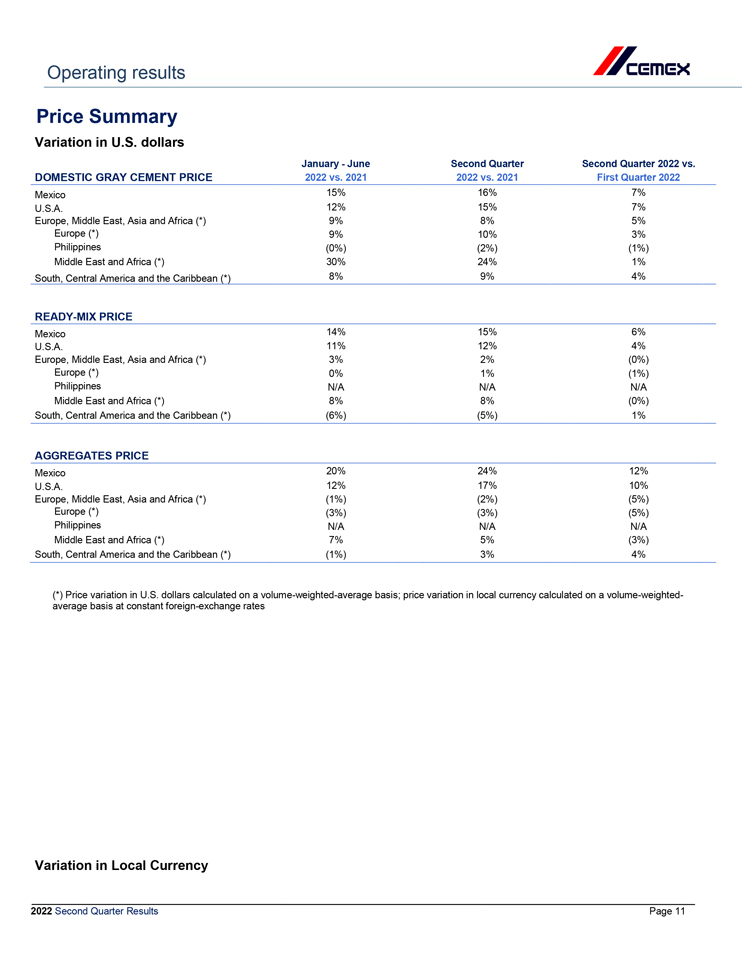
Operating results Price Summary Variation in U.S. dollars January—June Second Quarter Second Quarter 2022 vs. DOMESTIC GRAY CEMENT PRICE 2022 vs. 2021 2022 vs. 2021 First Quarter 2022 Mexico 15% 16% 7% U.S.A. 12% 15% 7% Europe, Middle East, Asia and Africa (*) 9% 8% 5% Europe (*) 9% 10% 3% Philippines (0%) (2%) (1%) Middle East and Africa (*) 30% 24% 1% South, Central America and the Caribbean (*) 8% 9% 4% READY-MIX PRICE Mexico 14% 15% 6% U.S.A. 11% 12% 4% Europe, Middle East, Asia and Africa (*) 3% 2% (0%) Europe (*) 0% 1% (1%) Philippines N/A N/A N/A Middle East and Africa (*) 8% 8% (0%) South, Central America and the Caribbean (*) (6%) (5%) 1% AGGREGATES PRICE Mexico 20% 24% 12% U.S.A. 12% 17% 10% Europe, Middle East, Asia and Africa (*) (1%) (2%) (5%) Europe (*) (3%) (3%) (5%) Philippines N/A N/A N/A Middle East and Africa (*) 7% 5% (3%) South, Central America and the Caribbean (*) (1%) 3% 4% (*) Price variation in U.S. dollars calculated on a volume-weighted-average basis; price variation in local currency calculated on a volume-weighted-average basis at constant foreign-exchange rates Variation in Local Currency 2022 Second Quarter Results Page 11
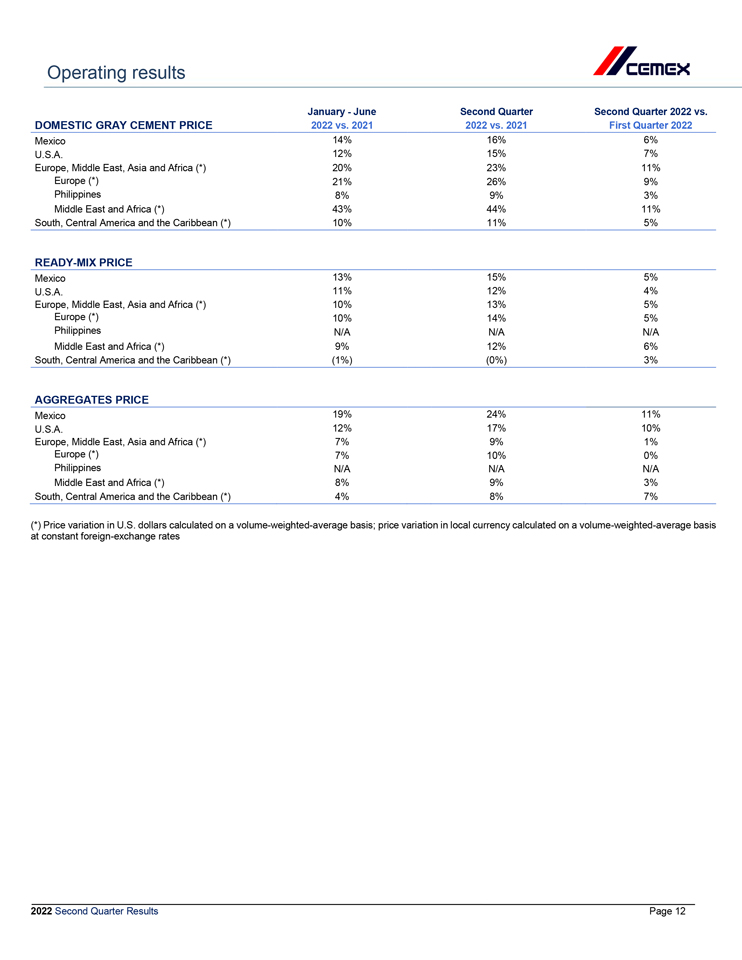
Operating results January—June Second Quarter Second Quarter 2022 vs. DOMESTIC GRAY CEMENT PRICE 2022 vs. 2021 2022 vs. 2021 First Quarter 2022 Mexico 14% 16% 6% U.S.A. 12% 15% 7% Europe, Middle East, Asia and Africa (*) 20% 23% 11% Europe (*) 21% 26% 9% Philippines 8% 9% 3% Middle East and Africa (*) 43% 44% 11% South, Central America and the Caribbean (*) 10% 11% 5% READY-MIX PRICE Mexico 13% 15% 5% U.S.A. 11% 12% 4% Europe, Middle East, Asia and Africa (*) 10% 13% 5% Europe (*) 10% 14% 5% Philippines N/A N/A N/A Middle East and Africa (*) 9% 12% 6% South, Central America and the Caribbean (*) (1%) (0%) 3% AGGREGATES PRICE Mexico 19% 24% 11% U.S.A. 12% 17% 10% Europe, Middle East, Asia and Africa (*) 7% 9% 1% Europe (*) 7% 10% 0% Philippines N/A N/A N/A Middle East and Africa (*) 8% 9% 3% South, Central America and the Caribbean (*) 4% 8% 7% (*) Price variation in U.S. dollars calculated on a volume-weighted-average basis; price variation in local currency calculated on a volume-weighted-average basis at constant foreign-exchange rates 2022 Second Quarter Results Page 12
Other information Operating Expenses The following table shows the breakdown of operating expenses Derivative instruments for the period presented. derivative The following instrument table shows and the the aggregate notional fair amount market for value each for type all of of January—June Second Quarter CEMEX’s presented. derivative instruments as of the last day of each quarter In thousands of US dollars 2022 2021 2022 2021 218,42 Administrative expenses 455,811 418,116 235,986 Second Quarter First Quarter 1 Selling expenses 150,598 130,323 77,963 63,455 2022 2021 2022 Distribution and logistic 436,87 Notiona 883,464 815,639 472,007 expenses 9 In millions of US Notional Fair Notional Fair l Fair Operating expenses 1,489,87 1,364,07 718,75 dollars 785,957 amount value amount value amount value before depreciation 3 8 5 Depreciation in operating Exchange rate 1,822 (8) 1,019 (29) 1,842 1 95,925 101,401 50,061 49,572 derivatives (1) expenses 1,585,79 1,465,47 768,32 Interest rate Operating expenses 836,018 1,310 58 1,333 (32) 1,313 31 8 9 6 swaps (2) Fuel 111 63 87 40 117 68 As % of Net Sales derivatives (3) Administrative expenses 5.8% 5.8% 5.8% 5.7% 3,243 113 2,440 (21) 3,272 100 SG&A expenses 7.7% 7.6% 7.7% 7.4% (1) Exchange rate derivatives to manage currency exposures arising from regular operations, net investment hedge and forecasted transactions. Equity-related information As of June 30, 2022, it includes a notional of US$1,547 million of net investment hedge. One CEMEX ADS represents ten CEMEX CPOs. One CEMEX (2) Interest-rate swap derivatives related to bank loans. In addition, as of CPO represents two Series A shares and one Series B share. The June 30, 2022, it includes a forward interest rate swap derivative following amounts are expressed in CPO-equivalent terms. related to the exposure to changes in interest rates. The forward interest rate swap is recognized as a cash flow hedge for forecasted Beginning-of-quarter outstanding CPO- transaction for a nominal amount of US$275 million. 14,487,786,971 (3) Forward contracts negotiated to hedge the price of the fuel for own equivalents consumption only in certain operations. End-of-quarter outstanding CPO-equivalents 14,487,786,971 For purposes of this report, outstanding CPO-equivalents equal Under IFRS, companies are required to recognize all derivative financial instruments on the balance sheet as assets or liabilities, were the total all held number in CPO of Series form A less and CPOs B shares held outstanding in subsidiaries, as ifwhich they at their estimated fair market value, with changes in such fair market values recorded in the income statement, except when as of June 30, 2022 were 20,541,277. transactions are entered into for cash-flow-hedging purposes. In such cases, changes in the fair market value of the related derivative instruments are recognized temporarily in equity and then underlying reclassified hedged into items earnings flow through as the the inverse income effects statement. of the changes Moreover, in fair in transactions value are recorded related directly to net in investment equity as part hedges, of the currency translation effect. They are reclassified to the income statement 2022, in connection only upon with disposal its derivatives of the net portfolio’s investment. fair As market of June value 30, recognition, liabilities, resulting CEMEX in a recognized net asset of increases US$113 million. in its assets and 2022 Second Quarter Results Page 13
Other information Assets held for sale and discontinued operations Other significant transactions of On Cementos December Progreso 29, 2021, Holdings, CEMEX signed S.L. for agreements the sale of its with operations affiliates On July 12, 2022, CEMEX and one of its affiliates entered into an agreement to divest a 65% equity interest in Neoris N.V. to Advent subject in Costa to Rica final and adjustments. El Salvador, The for assets a total for consideration divestment consist of $335 of International for a consideration of approximately U.S.$120 million. CEMEX is to retain an approximate 35% equity interest in Neoris. one one aggregates cement plant, quarry, one as grinding well as station, one distribution seven ready-mix center in plants, Costa The transaction seeks to accelerate the growth and development of Neoris, a global provider of tech consultancy and digital Rica subject and to one satisfaction distribution of closing center in conditions El Salvador. in Costa The transaction Rica and El is transformation services. This new ownership structure will focus on strengthening Neoris’s capabilities in cutting-edge, high-growth Salvador, currently expects including to finalize approvals this by transaction competition during authorities. the third CEMEX quarter verticals such as artificial intelligence, data science, cloud solutions, and automation, among others. These verticals are of and 2022. liabilities As of associated June 30, 2022 with these and December operations 31, were 2021 presented the assets in aligned with CEMEX’s priorities for its continued digital transformation, resulting in CEMEX committing to remain a key the held Statement for sale and of Financial liabilities directly Position related within the to assets line items held of for “Assets sale”. client of Neoris for the near future. Neoris will also continue focusing on strategic industries such as financial services, ended CEMEX’s June operations 30, 2022 of and these 2021 assets are for reported the six-month in the periods income telecommunications, media, manufacturing, retail, and consumer packaged goods, among others. The transaction, which values operations. statements,” net of income tax, in the single line item “Discontinued Neoris at an enterprise valuation of approximately US$200 million, is during subject the to second standard half closing of 2022. conditions, and is expected to close business On July 9, to 2021, Çimsa CEMEX Çimento concluded Sanayi the Ve sale Ticaret of its A. white Ş. agreed cement in As previously reported, in connection with the CO2 emission sold March included 2019 for CEMEX’s a price Buńol of approximately cement plant US$ in 155 Spain million. and its Assets white allowances in the European Union (the “Allowances”) under the EU Emissions Trading System (“EU ETS”), during the second half of operations cement business of these outside assets Mexico for the and six-month the United period States. ended CEMEX’s June 30, March 2021, in different transactions, CEMEX sold 12.3 million Allowances for approximately €509 million (approximately US$600 2021 the single are reported line item in “Discontinued the income statements, operations. ”net of income tax, in million). This sale is included in the six-month period ended June 30, 2021 as part of the line item “Other expenses, net”. On aggregates March 31, quarry 2021, in France CEMEX to sold LafargeHolcim 24 concrete for plants approximately and one Issuance of Subordinated Notes without Fixed Maturity US$ region 44 in million. the Southeast These assets of France, were located east in of the CEMEX´s Rhone Alpes Lyon On June 8, 2021, CEMEX, S.A.B. de C.V. successfully closed the issuance of US$1.0 billion of its 5.125% Subordinated Notes with operations, statement for which the six-month the company period ended retained. June CEMEX’s 30, 2021, income include no Fixed Maturity (the “Subordinated Notes”). CEMEX used the proceeds from the Subordinated Notes to redeem in full in June period the results ended of these March assets, 31, 2021 net in of the income single tax, line for item the “Discontinued three-month 2021 all outstanding series of perpetual debentures previously issued by consolidated special purpose vehicles for an aggregate operations.” amount of approximately US$447 million and for other general The following table presents condensed combined information of indebtedness. corporate purposes, The perpetual including debentures the were repayment accounted of asother part the 2022 income and 2021 statements of CEMEX’s for the discontinued six-month periods operations, ended previously June 30, of CEMEX’s non-controlling interest in equity. periods mentioned, ended in: a) June Costa 30, Rica 2022 and and El 2021; Salvador b) Spain for the related six-month to the Considering the overall characteristics of the Subordinated Notes, including that they do not have a contractual repayment date and 2021; white cement and c) the business southeast for the of France six-month for period the three-month ended June period 30, do not meet the definition of a financial liability under IFRS, CEMEX accounts for its Subordinated Notes as equity instruments ended March 31, 2021: in the line item “Other equity reserves and subordinated notes without fixed maturity.” STATEMENT OF Jan-Jun Second Quarter (Millions of U.S. dollars) 2022 2021 2022 2021 other Impairment intangible of property, assets in plant 3Q21 and equipment, goodwill and Sales 68 112 33 53 Cost of sales, operating -65 -100 -35 -49 During the third quarter of 2021, rising input cost inflation and expenses, and other impairment higher freight indicators and supply in Spain, chain disruptions the United led Arab to Emirates a confirmation (“UAE”) of Interest expense, net, and 20 1 11 2 and other businesses. As a result, we recognized a non-cash others aggregate goodwill impairment charge of approximately US$440 Income before income tax 23 13 9 6 business million comprised in Spain, of, US$ approximately, 96 million related US$317 to our million business related in to UAE, our Income tax -8 -4 -4 -3 and $27 million related to our IT business segment due to a Income from discontinued 15 9 5 3 reorganization. The impairment of goodwill in Spain and the UAE operations in businesses 2021 resulted versus from the an discounted excess of cash the net flow book projections value of as such of Net gain on sale -2 35 -1 4 September 30, 2021, related to these reporting segments. Income from discontinued 13 44 4 7 operations In addition, during the third quarter of 2021 we recognized non- cash technological impairment revamp charges of certain of internal intangible use assets software due of US$ to 49 a quarter million. of These 2021 did non-cash not impact charges our liquidity, recognized Operating during EBITDA the third and 2022 Second Quarter Results Page 14
Other information cash (loss) taxes and equity payable, were nevertheless affected in each our quarter. total assets, net income 2022 Second Quarter Results Page 15
Definitions of terms and disclosures Methodology for translation, consolidation, and presentation of results Under IFRS, CEMEX translates the financial statements of foreign subsidiaries using exchange rates at the reporting date for the balance sheet and the exchange rates at the end of each month for the income statement. Beginning on March 31, 2019 and for each subsequent period CEMEX reports its consolidated results in U.S. dollars. Breakdown of regions and subregions The South, Central America and the Caribbean region includes CEMEX’s operations in Bahamas, Colombia, the Dominican Republic, Guatemala, Guyana, Haiti, Jamaica, Trinidad & Tobago, Barbados, Nicaragua, Panama, Peru, and Puerto Rico, as well as trading operations in the Caribbean region. The EMEA region includes Europe, Middle East, Asia, and Africa. Asia subregion includes our Philippines operations. Europe subregion includes operations in Spain, Croatia, the Czech Republic, France, Germany, Poland, and the United Kingdom. Middle East and Africa subregion include the United Arab Emirates, Egypt, and Israel. Definition of terms Free cash flow equals operating EBITDA minus net interest expense, maintenance, and strategic capital expenditures, change in working capital, taxes paid, and other cash items (net other expenses less proceeds from the disposal of obsolete and/or substantially depleted operating fixed assets that are no longer in operation and coupon payments on our perpetual notes). l-t-l (like to like) on a like-to-like basis adjusting for currency fluctuations and for investments/divestments when applicable. Maintenance capital expenditures equal investments incurred for the purpose of ensuring the company’s operational continuity. These include capital expenditures on projects required to replace obsolete assets or maintain current operational levels, and mandatory capital expenditures, which are projects required to comply with governmental regulations or company policies. Net debt equals total debt (debt plus convertible bonds and financial leases) minus cash and cash equivalents. Operating EBITDA equals operating earnings before other income and expenses, net, plus depreciation and operating amortization. pp equals percentage points Prices all references to pricing initiatives, price increases or decreases, refer to our prices for our products SG&A expenses equal selling and administrative expenses Strategic capital expenditures equal investments incurred with the purpose of increasing the company’s profitability. These include capital expenditures on projects designed to increase profitability by expanding capacity, and margin improvement capital expenditures, which are projects designed to increase profitability by reducing costs. Working capital equals operating accounts receivable (including other current assets received as payment in kind) plus historical inventories minus operating payables. % var percentage variation Earnings per ADS Please refer to page 2 for the number of average ADSs outstanding used for the calculation of earnings per ADS. According to the IAS 33 Earnings per share, the weighted-average number of common shares outstanding is determined considering the number of days during the accounting period in which the shares have been outstanding, including shares derived from corporate events that have modified the stockholder’s equity structure during the period, such as increases in the number of shares by a public offering and the distribution of shares from stock dividends or recapitalizations of retained earnings and the potential diluted shares (Stock options, Restricted Stock Options and Mandatory Convertible Shares). The shares issued because of share dividends, recapitalizations and potential diluted shares are considered as issued at the beginning of the period. Exchange rates January—June Second Quarter Second Quarter 2022 2021 2022 2021 2022 2021 Average Average Average Average End of period End of period Mexican peso 20.19 20.34 20.05 20.04 20.10 19.94 Euro 0.9203 0.8312 0.9447 0.8295 0.954 0.8432 British pound 0.7778 0.7188 0.8047 0.7150 0.8216 0.7230 Amounts provided in units of local currency per U.S. dollar. 2022 Second Quarter Results Page 16
Disclaimer Except as the context otherwise may require, references in this report to “CEMEX,” “we,” “us” or “our” refer to CEMEX, S.A.B. de C.V. and its consolidated entities. The information contained in this report contains forward-looking statements within the meaning of the U.S. federal securities laws. We intend these forward-looking statements to be covered by the safe harbor provisions for forward-looking statements within the meaning of the U.S. federal securities laws. These forward-looking statements and information are necessarily subject to risks, uncertainties, and assumptions, including but not limited to statements related CEMEX’s plans, objectives, expectations (financial or otherwise), and typically can be identified by the use of words such as “will”, “may,” “assume,” “might,” “should,” “could,” “continue,” “would,” “can,” “consider,” “anticipate,” “estimate,” “expect,” “envision,” “plan,” “believe,” “foresee,” “predict,” “potential,” “target,” “strategy,” “intend,” “aimed”, and similar terms. Although CEMEX believes that its expectations are reasonable, it can give no assurance that these expectations will prove to be correct, and actual results may vary materially from historical results or results anticipated by forward-looking statements due to various factors. These forward-looking statements reflect, as of the date on which such forward-looking statements are made, our current expectations and projections about future events based on our knowledge of present facts and circumstances and assumptions about future events, unless otherwise indicated. These statements necessarily involve risks, uncertainties and assumptions that could cause actual results to differ materially from historical results or those anticipated in this report. Among others, such risks, uncertainties, and assumptions include those discussed in CEMEX’s most recent annual report and those detailed from time to time in CEMEX’s other filings with the Securities and Exchange Commission, which factors are incorporated herein by reference, including, but not limited to: impact of pandemics, epidemics or outbreaks of infectious diseases and the response of governments and other third parties, including with respect to the novel strain of the coronavirus identified in China in late 2019 and its variants (“COVID-19”), which have affected and may continue to adversely affect, among other matters, the ability of our operating facilities to operate at full or any capacity, supply chains, international operations, availability of liquidity, investor confidence and consumer spending, as well as the availability of, and demand for, our products and services; the cyclical activity of the construction sector; our exposure to other sectors that impact our and our clients’ businesses, such as, but not limited to, the energy sector; availability of raw materials and related fluctuating prices; volatility in pension plan asset values and liabilities, which may require cash contributions to the pension plans; the impact of environmental cleanup costs and other liabilities relating to existing and/or divested businesses; our ability to secure and permit aggregates reserves in strategically located areas; the timing and amount of federal, state and local funding for infrastructure; changes in the level of spending for private residential and private nonresidential construction; changes in our effective tax rate; competition in the markets in which we offer our products and services; general political, social, health, economic and business conditions in the markets in which we operate or that affect our operations and any significant economic, health, political or social developments in those markets, as well as any inherent risks to international operations; the regulatory environment, including environmental, energy, tax, labor, antitrust, and acquisition-related rules and regulations; our ability to satisfy our obligations under our material debt agreements, the indentures that govern our outstanding notes, and other debt instruments and financial obligations, including our subordinated notes with no fixed maturity and other financial obligations; the availability of short-term credit lines or working capital facilities, which can assist us in connection with market cycles; the impact of our below investment grade debt rating on our cost of capital and on the cost of the products and services we purchase; loss of reputation of our brands; our ability to consummate asset sales, fully integrate newly acquired businesses, achieve cost-savings from our cost-reduction initiatives, implement our pricing initiatives for our products and generally meet our “Operation Resilience” strategy’s goals; the increasing reliance on information technology infrastructure for our sales, invoicing, procurement, financial statements and other processes that can adversely affect our sales and operations in the event that the infrastructure does not work as intended, experiences technical difficulties or is subjected to cyber-attacks; changes in the economy that affect the demand for consumer goods, consequently affecting demand for our products and services; weather conditions, including but not limited to, excessive rain and snow, and disasters such as earthquakes and floods; trade barriers, including tariffs or import taxes and changes in existing trade policies or changes to, or withdrawals from, free trade agreements, including the United States-Mexico-Canada Agreement (“USMCA”), which was signed on November 30, 2019 and entered into force on July 1, 2020, superseding the North American Free Trade Agreement (“NAFTA”); availability and cost of trucks, railcars, barges and ships, as well as their licensed operators, for transport of our ☐materials; labor shortages and constraints; terrorist and organized criminal activities as well as geopolitical events, such as war and armed conflicts, including the current war between Russia and Ukraine; declarations of insolvency or bankruptcy, or becoming subject to similar proceedings; and, natural disasters and other unforeseen events (including global health hazards such as COVID-19). Should one or more of these risks or uncertainties materialize, or should underlying assumptions prove incorrect, actual results may vary materially from historical results, performance or achievements and/or results, performance or achievements expressly or implicitly anticipated by the forward-looking statements, or otherwise could have an impact on us or our consolidated entities. Any or all of CEMEX’s forward-looking statements may turn out to be inaccurate and the factors identified above are not exhaustive. Accordingly, undue reliance on forward-looking statements should not be placed, as such forward-looking statements speak only as of the dates on which they are made. These factors may be revised or supplemented, but CEMEX is not under, and expressly disclaims, any obligation to update or correct the information contained in this report or any forward-looking statement that it may make from time to time, whether as a result of new information, future events or otherwise. Readers should review future reports filed by us with the U.S. Securities and Exchange Commission and the Mexican Stock Exchange (Bolsa Mexicana de Valores). This report also includes statistical data regarding the production, distribution, marketing and sale of cement, ready mix concrete, clinker, aggregates and Urbanization Solutions. Unless the context indicates otherwise, all references to pricing initiatives, price increases or decreases, refer to CEMEX’s prices for CEMEX’s products. We generated some of this data internally, and some was obtained from independent industry publications and reports that we believe to be reliable sources. We have not independently verified this data nor sought the consent of any organizations to refer to their reports in this report. UNLESS OTHERWISE NOTED, ALL FIGURES ARE PRESENTED IN DOLLARS, BASED ON INTERNATIONAL FINANCIAL REPORTING STANDARDS, AS APPLICABLE 2022 Second Quarter Results Page 17

Disclaimer Copyright CEMEX, S.A.B. de C.V. and its subsidiaries 2022 Second Quarter Results Page 18

Second Quarter 2022 Results Exhibit 3

Except as the context otherwise may require, references in this presentation to “CEMEX,” “we,” “us” or “our” refer to CEMEX, S.A.B. de C.V. and its consolidated entities. The information contained in this presentation contains forward-looking statements within the meaning of the U.S. federal securities laws. We intend these forward-looking statements to be covered by the safe harbor provisions for forward-looking statements within the meaning of the U.S. federal securities laws. These forward-looking statements and information are necessarily subject to risks, uncertainties, and assumptions, including but not limited to statements related CEMEX’s plans, objectives, expectations (financial or otherwise), and typically can be identified by the use of words such as “will”, “may,” “assume,” “might,” “should,” “could,” “continue,” “would,” “can,” “consider,” “anticipate,” “estimate,” “expect,” “envision,” “plan,” “believe,” “foresee,” “predict,” “potential,” “target,” “strategy,” “intend,” “aimed” and similar terms. Although CEMEX believes that its expectations are reasonable, it can give no assurance that these expectations will prove to be correct, and actual results may vary materially from historical results or results anticipated by forward-looking statements due to various factors. These forward-looking statements reflect, as of the date on which such forward-looking statements are made, our current expectations and projections about future events based on our knowledge of present facts and circumstances and assumptions about future events, unless otherwise indicated. These statements necessarily involve risks, uncertainties and assumptions that could cause actual results to differ materially from historical results or those anticipated in this presentation. Among others, such risks, uncertainties, and assumptions include those discussed in CEMEX's most recent annual report and those detailed from time to time in CEMEX’s other filings with the Securities and Exchange Commission, which factors are incorporated herein by reference, including, but not limited to: impact of pandemics, epidemics or outbreaks of infectious diseases and the response of governments and other third parties, including with respect to the novel strain of the coronavirus identified in China in late 2019 and its variants (“COVID-19”), which have affected and may continue to adversely affect, among other matters, the ability of our operating facilities to operate at full or any capacity, supply chains, international operations, availability of liquidity, investor confidence and consumer spending, as well as the availability of, and demand for, our products and services; the cyclical activity of the construction sector; our exposure to other sectors that impact our and our clients’ businesses, such as, but not limited to, the energy sector; availability of raw materials and related fluctuating prices; volatility in pension plan asset values and liabilities, which may require cash contributions to the pension plans; the impact of environmental cleanup costs and other liabilities relating to existing and/or divested businesses; our ability to secure and permit aggregates reserves in strategically located areas; the timing and amount of federal, state and local funding for infrastructure; changes in the level of spending for private residential and private nonresidential construction; changes in our effective tax rate; competition in the markets in which we offer our products and services; general political, social, health, economic and business conditions in the markets in which we operate or that affect our operations and any significant economic, health, political or social developments in those markets, as well as any inherent risks to international operations; the regulatory environment, including environmental, energy, tax, labor, antitrust, and acquisition-related rules and regulations; our ability to satisfy our obligations under our material debt agreements, the indentures that govern our outstanding notes, and other debt instruments and financial obligations, including our subordinated notes with no fixed maturity and other financial obligations; the availability of short-term credit lines or working capital facilities, which can assist us in connection with market cycles; the impact of our below investment grade debt rating on our cost of capital and on the cost of the products and services we purchase; loss of reputation of our brands; our ability to consummate asset sales, fully integrate newly acquired businesses, achieve cost-savings from our cost-reduction initiatives, implement our pricing initiatives for our products and generally meet our “Operation Resilience” strategy’s goals; the increasing reliance on information technology infrastructure for our sales, invoicing, procurement, financial statements and other processes that can adversely affect our sales and operations in the event that the infrastructure does not work as intended, experiences technical difficulties or is subjected to cyber-attacks; changes in the economy that affect demand for consumer goods, consequently affecting the demand for our products and services; weather conditions, including but not limited to, excessive rain and snow, and disasters such as earthquakes and floods; trade barriers, including tariffs or import taxes and changes in existing trade policies or changes to, or withdrawals from, free trade agreements, including the United States-Mexico-Canada Agreement (“USMCA”), which was signed on November 30, 2019 and entered into force on July 1, 2020, superseding the North American Free Trade Agreement (“NAFTA”); availability and cost of trucks, railcars, barges and ships, as well as their licensed operators, for transport of our materials; labor shortages and constraints; terrorist and organized criminal activities as well as geopolitical events, such as war and armed conflicts, including the current war between Russia and Ukraine; declarations of insolvency or bankruptcy, or becoming subject to similar proceedings; and, natural disasters and other unforeseen events (including global health hazards such as COVID-19). Should one or more of these risks or uncertainties materialize, or should underlying assumptions prove incorrect, actual results may vary materially from historical results, performance or achievements and/or results, performance or achievements expressly or implicitly anticipated by the forward-looking statements, or otherwise could have an impact on us or our consolidated entities. Any or all of CEMEX’s forward-looking statements may turn out to be inaccurate and the factors identified above are not exhaustive. Accordingly, undue reliance on forward-looking statements should not be placed, as such forward-looking statements speak only as of the dates on which they are made. These factors may be revised or supplemented, but CEMEX is not under, and expressly disclaims, any obligation to update or correct the information contained in this presentation or any forward-looking statement that it may make from time to time, whether as a result of new information, future events or otherwise. Readers should review future reports filed by us with the U.S. Securities and Exchange Commission and the Mexican Stock Exchange (Bolsa Mexicana de Valores). This presentation also includes statistical data regarding the production, distribution, marketing and sale of cement, ready mix concrete, clinker, aggregates and Urbanization Solutions. Unless the context indicates otherwise, all references to pricing initiatives, price increases or decreases, refer to CEMEX’s prices for CEMEX’s products. We generated some of this data internally, and some was obtained from independent industry publications and reports that we believe to be reliable sources. We have not independently verified this data nor sought the consent of any organizations to refer to their reports in this presentation. UNLESS OTHERWISE NOTED, ALL FIGURES ARE PRESENTED IN DOLLARS, BASED ON INTERNATIONAL FINANCIAL REPORTING STANDARDS, AS APPLICABLE Copyright CEMEX, S.A.B. de C.V. and its subsidiaries

Key achievements in 2nd Quarter 2022 Double-digit growth in Sales, with all regions contributing Mid-teen percentage price growth for cement, ready-mix and aggregates YTD prices covering cost inflation Evolving our CEMEX Go platform into a full automated experience Urbanization Solutions Sales and EBITDA growing double-digit Strengthening our 2030 Climate Action commitments Casa Erasto, Mexico City, Mexico Built with Duramax, part of our Vertua family of sustainable products EMEA region with high single-digit EBITDA growth Upgrade from Fitch Ratings; only one notch away from IG rating Reduction of ~3% in CO2 emissions vs 4Q21 ROCE at 13.2%1, well above our cost of capital 1) Trailing twelve months as of June 2022, excluding goodwill

Sales growth driven by pricing Net Sales EBITDA EBITDA Margin FCF after maint. Capex Sales growth in all regions with high single-digit EBITDA growth in EMEA The Reflection Space, Monterrey, Mexico Built with Evolution, part of our Vertua family of sustainable products +11% l-t-l -8% l-t-l Millions of U.S. dollars

Cement volume performance reflects bagged cement rebalancing and supply chain disruption USA SCAC MEX EUROPE EMEA (l-t-l) 2Q22 YoY volume variation CONSOLIDATED VOLUMES Cement1 Ready-mix Aggregates Grey domestic cement

Double-digit growth in pricing Cement1 Ready-mix Aggregates USA SCAC MEX EUROPE Sequential (1Q22 to 2Q22) EMEA CONSOLIDATED PRICES (l-t-l) 2Q22 YoY and QoQ price variation 7% 5% 6% 11% 7% 4% 10% 5% 11% 3% 7% 5% 1% 5% 6% Grey domestic cement Note: For CEMEX, SCAC, Europe and EMEA, prices (l-t-l) are calculated on a volume-weighted average basis at constant foreign-exchange rates QoQ: 9% 5% 0%

Prices more than covering costs 2Q22 EBITDA variation 21.1% 17.7% -3.4pp EBITDA margin Millions of U.S. dollars

YTD pricing is covering inflation in dollar terms Cement1 Aggregates Ready-mix Unitary Prices Unitary Costs Own produced cement

Important progress in growth strategy Urb Sol: Offering a wide array of complementary solutions to build the sustainable cities of the future ~$1.2 B approved bolt-on investment pipeline ~$100 M of incremental EBITDA for 2022 from growth strategy Urbanization Solutions Optimizing our portfolio through: Pending divestment of Costa Rica and El Salvador Partnership for digital growth with Advent in Neoris Strengthens our leadership in industry’s digital transformation Expansion of aggregates business in Germany, accompanied by aggregates recycling capabilities Latest developments: Recent investments: Portfolio: Performance Materials Related Services Industrialized Construction Waste Management Circular Economy Germany: admixtures plant upgrade US: Florida block plants Mexico: Recycling facility Mexico: Consturama Supply warehouses

Future in Action yielding significant results Unlocking opportunities through innovation Vertua brand evolution Expanding brand to all products with sustainability attributes +20% of cement production already below 2030 target Alternative fuels increased 5pp to new high of 33% Reduced clinker factor by 1.6pp reaching record low of 74.5% CO2 emissions declined ~3% in 1H22 Working with Coolbrook to develop technology for the electrification of cement kiln heating Material progress in Rüdersdorf Carbon Neutral Alliance Reinforcing commitment towards net zero Set ambitious scope 3 and managed waste targets Launched Green financing framework, first in industry Aligning variable compensation to ~4500 employees New 2030 scope 3 and circular economy targets1 Vertua ready-mix reaching ~32% of total RM volumes Scope 3 target of ~20% reduction in purchased clinker, cement, fuels, and transportation vs. 2020 baseline. Circular Economy target of 40M tons of managed waste by 2030 (80% increase vs. 2021).

Evolving CEMEX Go to a fully automated customer experience COMMERCIAL MANAGEMENT PRODUCTION Working Smarter Commercial Supply Chain Full digital integration within our supply chain network to offer real-time options to our customers Automated digital confirmations to customers Agility to quickly respond to the unexpected Expecting to materially boost our adoption rate, with over 60% of our sales currently being processed through CX Go Increased operational efficiencies and improved customer experience SmartOps Enhancing Customer Experience Process & Technology People & Organization Digital Automation Data & AI

Regional Highlights

Mexico: Successful pricing strategy driving top line growth -8% -1% Domestic gray cement volumes¹ (%) Industrial and commercial sector continues driving recovery in formal demand Bagged cement volumes returned to normalized levels; difficult prior year comp lapses in 2H22 Pricing strategy contributing significantly to top line growth but still need to recover margin EBITDA negatively impacted by higher energy costs, supply chain and product mix effect Announced 2H22 price increases in all of our products Millions of U.S. dollars Average daily sales (ADS) Central Pavilion, Mexico City, Mexico Built with Hidratium, part of our Vertua family of sustainable products 6M22 2T22 6M22 vs. 6M21 2T22 vs. 2T21 6M22 2Q22 6M22 vs. 6M21 2Q22 vs. 2Q21 Ventas Netas 1878.31114582893 997.61083180019796 Cemento Volumen -9.9018568290886677E-2 -0.11536267227410349 Net Sales 1878.31114582893 997.61083180019796 Cement Volume -9.9018568290886677E-2 -0.11536267227410349 % var (comp) 6.1055201582060792E-2 6.7093988053385623E-2 Precio (ML) 0.14494961624490477 0.16268158151952677 % var (l-t-l) 6.1055201582060792E-2 6.7093988053385623E-2 Price (LC) 0.14494961624490477 0.16268158151952677 Flujo de Operación 606.25912283357684 320.32098942423778 Concreto Volumen 0.11788130456206722 0.14290192557081186 Operating EBITDA 606.25912283357684 320.32098942423778 Ready mix Volume 0.11788130456206722 0.14290192557081186 % var (comp) -4.6542276882750797E-2 -3.5431918172459734E-2 Precio (ML) 0.13290167394405983 0.15060501948460056 % var (l-t-l) -4.6542276882750797E-2 -3.5431918172459734E-2 Price (LC) 0.13290167394405983 0.15060501948460056 Margen Flujo de Operación 0.32276820812135715 0.32108812295694061 Agregados Volumen 4.7503777378866921E-2 4.7352463463382052E-2 Operating EBITDA margin 0.32276820812135715 0.32108812295694061 Aggregates Volume 4.7503777378866921E-2 4.7352463463382052E-2 var pp -3.5999999999999979 -3.3999999999999977 Precio (ML) 0.18776982620605365 0.23908933514407332 pp var -3.5999999999999979 -3.3999999999999977 Price (LC) 0.18776982620605365 0.23908933514407332 2T22 Acum. 2Q22 YTD 2T22 2Q22 Ventas Netas 997.61083180019796 1878.31114582893 Net Sales 997.61083180019796 1878.31114582893 % var (comp) 6.7093988053385623E-2 6.1055201582060792E-2 % var (l-t-l) 6.7093988053385623E-2 6.1055201582060792E-2 Flujo de Operación 320.32098942423778 606.25912283357684 Operating EBITDA 320.32098942423778 606.25912283357684 % var (comp) -3.5431918172459734E-2 -4.6542276882750797E-2 % var (l-t-l) -3.5431918172459734E-2 -4.6542276882750797E-2 Margen Flujo de Operación 0.32108812295694061 0.32276820812135715 Operating EBITDA margin 0.32108812295694061 0.32276820812135715 var pp -3.3999999999999977 -3.5999999999999979 pp var -3.3999999999999977 -3.5999999999999979

US: Strong pricing momentum but profitability impacted by supply chain disruption Robust top line growth driven by pricing strategy Healthy underlying demand driven by the Industrial & Commercial and residential sectors In sold out market, volume performance impacted by supply chain issues as a result of higher maintenance, low inventories and logistic-related disruptions Sequential price improvements of between 4% and 10% for our three core products, with YoY growth rates in the double-digit area EBITDA margin impacted by higher energy, maintenance, imports and logistic costs Natural Resource Agency Building, California, United States Built with Vertua concrete, part of our Vertua family of sustainable products Millions of U.S. dollars 6M22 2T22 6M22 vs. 6M21 2T22 vs. 2T21 6M22 2Q22 6M22 vs. 6M21 2Q22 vs. 2Q21 6M22 2Q22 Ventas Netas 2492.4790828200003 1296.3492340400001 Cemento Volumen 3.7025099143035492E-2 -9.6373179790908963E-3 Net Sales 2492.4790828200003 1296.3492340400001 Cement Volume 3.7025099143035492E-2 -9.6373179790908963E-3 Net Sales 2T22 Acum. % var (comp) 0.16195231619354628 0.14526416580370435 Precio (ML) 0.121794300471199 0.14706646747735919 % var (l-t-l) 0.16195231619354628 0.14526416580370435 Price (LC) 0.121794300471199 0.14706646747735919 % var (l-t-l) 0 2T22 Flujo de Operación 362.50400474000003 162.07821990999969 Concreto Volumen 4.623953203154417E-2 2.8700887959261515E-2 Operating EBITDA 362.50400474000003 162.07821990999969 Ready mix Volume 4.623953203154417E-2 2.8700887959261515E-2 Operating EBITDA 1296.3492340400001 2492.4790828200003 % var (comp) -0.11266673415544179 -0.23572672163770442 Precio (ML) 0.10577639957701818 0.11832520244072943 % var (l-t-l) -0.11266673415544179 -0.23572672163770442 Price (LC) 0.10577639957701818 0.11832520244072943 % var (l-t-l) 0.14526416580370435 0.16195231619354628 Margen Flujo de Operación 0.14543913617516166 0.12502666384496711 Agregados Volumen 6.1676915085963929E-2 3.1654977987200739E-2 Operating EBITDA margin 0.14543913617516166 0.12502666384496711 Aggregates Volume 6.1676915085963929E-2 3.1654977987200739E-2 Operating EBITDA margin 162.07821990999969 362.50400474000003 var pp -4.5000000000000009 -6.2 Precio (ML) 0.12472957601229717 0.17117247153628506 pp var -4.5000000000000009 -6.2 Price (LC) 0.12472957601229717 0.17117247153628506 pp var -0.23572672163770442 -0.11266673415544179 2T22 Acum. 2Q22 YTD 2T22 2Q22 Ventas Netas 1296.3492340400001 2492.4790828200003 Net Sales 1296.3492340400001 2492.4790828200003 % var (comp) 0.14526416580370435 0.16195231619354628 % var (l-t-l) 0.14526416580370435 0.16195231619354628 Flujo de Operación 162.07821990999969 362.50400474000003 Operating EBITDA 162.07821990999969 362.50400474000003 % var (comp) -0.23572672163770442 -0.11266673415544179 % var (l-t-l) -0.23572672163770442 -0.11266673415544179 Margen Flujo de Operación 0.12502666384496711 0.14543913617516166 Operating EBITDA margin 0.12502666384496711 0.14543913617516166 var pp -6.2 -4.5000000000000009 pp var -6.2 -4.5000000000000009

EMEA: High single-digit EBITDA growth despite volatility Double-digit top line growth supported by sustained solid pricing performance across all products EBITDA increasing 8%, while EBITDA margin continued to be pressured by unprecedented input cost inflation Cement prices in Europe improving 9% sequentially, and 26% YoY Reached ~70% of alternative fuels usage in our European operations Strong construction activity in Israel, coupled with continued improvement in Egypt’s EBITDA Voltaire College, Nimes, France Built with Vertua Concrete, part of our Vertua family of sustainable products Millions of U.S. dollars 6M22 2T22 6M22 vs. 6M21 2T22 vs. 2T21 6M22 2Q22 6M22 vs. 6M21 2Q22 vs. 2Q21 Ventas Netas 2478.798458618021 1293.6333826212569 Cemento Volumen 9.1275944905139204E-3 -3.0033791213345325E-2 Net Sales 2478.798458618021 1293.6333826212569 Cement Volume 9.1275944905139204E-3 -3.0033791213345325E-2 % var (comp) 0.1307506363388653 0.12225277393399483 Precio (comp) 0.20233035959264523 0.22949726986014313 % var (l-t-l) 0.1307506363388653 0.12225277393399483 Price (l-t-l) 0.20233035959264523 0.22949726986014313 Flujo de Operación 338.08904271420107 192.71055532386814 Concreto Volumen 2.6599581882805489E-2 4.9225892249123134E-3 Operating EBITDA 338.08904271420107 192.71055532386814 Ready mix Volume 2.6599581882805489E-2 4.9225892249123134E-3 % var (comp) 0.17296634580467773 8.2175698330624256E-2 Precio (comp) 9.8860878776986502E-2 0.13029595073715466 % var (l-t-l) 0.17296634580467773 8.2175698330624256E-2 Price (l-t-l) 9.8860878776986502E-2 0.13029595073715466 Margen Flujo de Operación 0.13639230795015597 0.14896844648008661 Agregados Volumen 1.4527640022653181E-2 -2.7426983454333937E-2 Operating EBITDA margin 0.13639230795015597 0.14896844648008661 Aggregates Volume 1.4527640022653181E-2 -2.7426983454333937E-2 var pp 0.50000000000000044 -0.50000000000000044 Precio (comp) 6.7841694786947876E-2 9.3151697718193746E-2 pp var 0.50000000000000044 -0.50000000000000044 Price (l-t-l) 6.7841694786947876E-2 9.3151697718193746E-2 2T22 Acum. 2Q22 YTD 2T22 2Q22 Ventas Netas 1293.6333826212569 2478.798458618021 Net Sales 1293.6333826212569 2478.798458618021 % var (comp) 0.12225277393399483 0.1307506363388653 % var (l-t-l) 0.12225277393399483 0.1307506363388653 Flujo de Operación 192.71055532386814 338.08904271420107 Operating EBITDA 192.71055532386814 338.08904271420107 % var (comp) 8.2175698330624256E-2 0.17296634580467773 % var (l-t-l) 8.2175698330624256E-2 0.17296634580467773 Margen Flujo de Operación 0.14896844648008661 0.13639230795015597 Operating EBITDA margin 0.14896844648008661 0.13639230795015597 var pp -0.50000000000000044 0.50000000000000044 pp var -0.50000000000000044 0.50000000000000044

SCAC: Double-digit growth in Net Sales driven by prices Top line driven by 11% growth in cement prices Formal sector activity improving throughout portfolio while bagged cement returns to normalized levels Quarterly EBITDA impacted by higher energy and maintenance costs and lower cement volumes In Colombia, activity driven by formal residential and infrastructure In the Dominican Republic, formal activity is improving on the back of tourism and reactivation of formal housing Ciudadela Verde, Bucaramanga, Colombia Built with Vertua Concrete, part of our Vertua family of sustainable products Millions of U.S. dollars 6M22 2T22 6M22 vs. 6M21 2T22 vs. 2T21 6M22 2Q22 6M22 vs. 6M21 2Q22 vs. 2Q21 Ventas Netas 833.98247055088245 417.87326656724616 Cemento Volumen -3.1250809146193693E-2 -4.5404559582149548E-2 Net Sales 833.98247055088245 417.87326656724616 Cement Volume -3.1250809146193693E-2 -4.5404559582149548E-2 % var (comp) 9.2986815988810215E-2 9.9693337601519591E-2 Precio (comp) 0.10263045677911171 0.1144614951917735 % var (l-t-l) 9.2986815988810215E-2 9.9693337601519591E-2 Price (l-t-l) 0.10263045677911171 0.1144614951917735 Flujo de Operación 208.27840720571237 99.023824178157341 Concreto Volumen 0.16699412988024728 0.25385912268330968 Operating EBITDA 208.27840720571237 99.023824178157341 Ready mix Volume 0.16699412988024728 0.25385912268330968 % var (comp) -5.2329402489264404E-2 -7.354058556521377E-2 Precio (comp) -1.4715609036462558E-2 -4.6734885282783221E-3 % var (l-t-l) -5.2329402489264404E-2 -7.354058556521377E-2 Price (l-t-l) -1.4715609036462558E-2 -4.6734885282783221E-3 Margen Flujo de Operación 0.24973955036265358 0.23697094813367764 Agregados Volumen 6.6141131204% 0.14710784841697636 Operating EBITDA margin 0.24973955036265358 0.23697094813367764 Aggregates Volume 6.6141131203815026E-2 0.14710784841697636 var pp -3.1999999999999975 -3.9000000000000035 Precio (comp) 4.1000661203% 8.3453715816754592E-2 pp var -3.1999999999999975 -3.9000000000000035 Price (l-t-l) 4.1000661203452061E-2 8.3453715816754592E-2 2T22 Acum. 2Q22 YTD 2T22 2Q22 Ventas Netas 417.87326656724616 833.98247055088245 Net Sales 417.87326656724616 833.98247055088245 % var (comp) 9.9693337601519591E-2 9.2986815988810215E-2 % var (l-t-l) 9.9693337601519591E-2 9.2986815988810215E-2 Flujo de Operación 99.023824178157341 208.27840720571237 Operating EBITDA 99.023824178157341 208.27840720571237 % var (comp) -7.354058556521377E-2 -5.2329402489264404E-2 % var (l-t-l) -7.354058556521377E-2 -5.2329402489264404E-2 Margen Flujo de Operación 0.23697094813367764 0.24973955036265358 Operating EBITDA margin 0.23697094813367764 0.24973955036265358 var pp -3.9000000000000035 -3.1999999999999975 pp var -3.9000000000000035 -3.1999999999999975

Financial Developments

Seasonal WC cycle and increased maintenance driving lower FCF; expected to reverse in 2H22 Controlling Interest Net Income US$ M Average working capital days Millions of U.S. dollars January - June Second Quarter Validación 2022 2021 % var 2022 2021 % var Flujo de operación TRUE TRUE TRUE TRUE TRUE TRUE Operating EBITDA 1414.0590445015819 1481.1411368861475 -4.5290817136842569E-2 723.29597822437177 807.32915567855775 -0.10408787650379894 - Gasto financiero neto TRUE TRUE TRUE TRUE TRUE TRUE - Net Financial Expense 259.9681213660744 314.60357042504955 132.15128745940436 144.76348177575696 - Inversiones en activo fijo de TRUE TRUE TRUE TRUE TRUE TRUE - Maintenance Capex 392.35488613749362 206.49062750488008 210.18710650800944 110.90217735695684 mantenimiento TRUE TRUE TRUE TRUE TRUE TRUE - Change in Working Capital 683.92562733154728 405.66420415813553 185.97601080911971 59.348250359094862 - Inversiones en capital de trabajo TRUE TRUE TRUE TRUE TRUE TRUE - Taxes Paid 113.33145432831012 123.93932421299961 63.718415213907207 76.403999318234085 - Impuestos TRUE TRUE TRUE TRUE TRUE TRUE - Other Cash Items (net) -3.5168175756328175 40.867158928596325 -20.687414705579258 19.762598685385342 - Otros gastos TRUE TRUE TRUE TRUE TRUE TRUE - Free Cash Flow -11.59731259367264 -11.603662176135213 -2.2659874934424313 -4.2795208995468057 - Flujo de efectivo libre de TRUE TRUE TRUE TRUE TRUE TRUE Discontinued Operations operaciones discontinuas Free Cash Flow after -20.406914492538149 401.17991383262159 N/A 154.21656043295275 400.42816908267645 -0.61487084990488861 Flujo de efectivo libre después TRUE TRUE #DIV/0! TRUE TRUE #DIV/0! Maintenance Capex de inv AF mtto - Strategic Capex 173.71854318045524 160.91004996666675 97.83587985124565 107.5546036934619 - Inversiones en activo fijo TRUE TRUE TRUE TRUE TRUE TRUE Free Cash Flow -,194.12545767299338 240.26986386595485 N/A 56.380680581707097 292.87356538921455 -0.80749139818481075 de operaciones discontinuas Flujo de efectivo libre TRUE TRUE TRUE TRUE TRUE TRUE OJO: Si en alguno de los dos años existe un flujo negativo el % var es = N/A Enero - Junio Segundo Trimestre OJO: Validar los signos de las variaciones 2022 2021 % var 2022 2021 % var Flujo de operación 1414.0590445015819 1481.1411368861475 -4.5290817136842569E-2 723.29597822437177 807.32915567855775 -0.10408787650379894 - Gasto financiero neto 259.9681213660744 314.60357042504955 132.15128745940436 144.76348177575696 - Inversiones en activo fijo de 392.35488613749362 206.49062750488008 210.18710650800944 110.90217735695684 mantenimiento - Inversiones en capital de trabajo 683.92562733154728 405.66420415813553 185.97601080911971 59.348250359094862 - Impuestos 113.33145432831012 123.93932421299961 63.718415213907207 76.403999318234085 - Otros gastos -3.5168175756328175 40.867158928596325 -20.687414705579258 19.762598685385342 - Flujo de efectivo libre de -11.59731259367264 -11.603662176135213 -2.2659874934424313 -4.2795208995468057 operaciones discontinuas Flujo de efectivo libre después -20.406914492538149 401.17991383262159 N/A 154.21656043295275 400.42816908267645 -0.61487084990488861 de inv AF mtto #DIV/0! #DIV/0! - Inversiones en activo fijo 173.71854318045524 160.91004996666675 97.83587985124565 107.5546036934619 estratégicas Flujo de efectivo libre -,194.12545767299338 240.26986386595485 N/A 56.380680581707097 292.87356538921455 -0.80749139818481075

No significant refinancing needs for the next 3 years Minimal interest rate risk, with 81% of our debt at fixed rates FX risks adequately addressed through a comprehensive and multi-tiered hedging strategy Credit rating upgrade by Fitch to BB+, with stable outlook Conservative financial risk profile in a volatile environment The Mexican Center of Philanthropy, Mexico City, Mexico Built with Fortis, part of our Vertua family of sustainable products 0.2 0.5 0.5 1.0 1.9 1.0 0.0 0.9 0.8 1.8 Debt maturity profile as of June 30th Billions of U.S. dollars

Green Financing Framework: first of its kind in our industry Our Green Financing Framework, first in our industry, extends beyond our decarbonization goals to include air quality, clean electricity and water management We have identified over $500M of these projects for 2021-2025 Project categories To be eligible, projects must adhere to EU Taxonomy which includes certain thresholds such as: Facilities are expected to result in a carbon intensity below 546 tons of CO2 per ton of cementitious product by 2025. Average carbon intensity of the electricity produced that is used for hydrogen manufacturing is at or below 100 grams of CO2 per KWh. Pollution Prevention & Control Renewable Energy Energy efficiency Clean transportation Sustainable Water and Wastewater management

2022 Outlook

2022 guidance1 Operating EBITDA2 Low to mid single-digit growth Consolidated volume growth Flat for Cement Low to mid single-digit increase for Ready-mix Low to mid single-digit increase for Aggregates Energy cost/ton of cement produced ~35% increase Capital expenditures ~$1,300 million total ~$800 M Maintenance, ~$500 M Strategic Investment in working capital ~$200 million Cash taxes ~$200 million Cost of debt3 Reduction of ~$20 million Reflects CEMEX’s current expectations Like-to-like for ongoing operations Including perpetual bonds and subordinated notes with no fixed maturity and the effect of our EUR-USD cross-currency swap

Appendix

Average life of debt: 5.6 years Debt maturity profile as of June 30, 2022 Total debt as of June 30, 2022: $8,729 million Fixed Income Other bank debt 2021 Credit Agreement Leases 847 543 879 > Millions of U.S. dollars

Consolidated volumes and prices Price (l-t-l) calculated on a volume-weighted average basis at constant foreign-exchange rates 6M22 vs. 6M21 2T22 vs. 2T21 2T22 vs. 1T22 Cemento gris doméstico Volumen (comp) -2.1379014368245852E-2 -5.1556109021963281E-2 4.0068712600499046E-2 Precio (USD) 0.11166901048986327 0.12228717104884949 5.4274081621961831E-2 Precio (comp) 0.14172048434742512 0.16480813933969429 6.6886825280389167E-2 Concreto Volumen (comp) 5.3887850722237784E-2 4.4210889384492802E-2 7.2682163891507168E-2 Precio (USD) 6.9749424661270598E-2 7.2986241293825957E-2 2.4712513302280782E-2 Precio (comp) 9.8289922619212211E-2 0.11642301700640512 4.5595184320172427E-2 Agregados Volumen (comp) 3.881991559341702E-2 1.045134951424842E-2 4.7886693452054319E-2 Precio (USD) 6.8342061628910322E-2 8.4282729377094023E-2 3.2357694277697378E-2 Precio (comp) 0.10289961856732033 0.13626270653682893 5.7328452126770769E-2 6M22 vs. 6M21 2Q22 vs. 2Q21 2Q22 vs. 1Q22 Domestic gray cement Volume (l-t-l) -2.1379014368245852E-2 -5.1556109021963281E-2 4.0068712600499046E-2 Price (USD) 0.11166901048986327 0.12228717104884949 5.4274081621961831E-2 Price (l-t-l) 0.14172048434742512 0.16480813933969429 6.6886825280389167E-2 Ready mix Volume (l-t-l) 5.3887850722237784E-2 4.4210889384492802E-2 7.2682163891507168E-2 Price (USD) 6.9749424661270598E-2 7.2986241293825957E-2 2.4712513302280782E-2 Price (l-t-l) 9.8289922619212211E-2 0.11642301700640512 4.5595184320172427E-2 Aggregates Volume (l-t-l) 3.881991559341702E-2 1.045134951424842E-2 4.7886693452054319E-2 Price (USD) 6.8342061628910322E-2 8.4282729377094023E-2 3.2357694277697378E-2 Price (l-t-l) 0.10289961856732033 0.13626270653682893 5.7328452126770769E-2 Validación Cemento gris doméstico 0 0 0 0 0 0 0 0 0 Concreto 0 0 0 0 0 0 0 0 0 Agregados 0 0 0 0 0 0 0 0 0

Additional information on debt Currency denomination3 Interest rate4 MXN 3% Millions of U.S. dollars Includes leases, in accordance with International Financial Reporting Standard (IFRS) Calculated in accordance with our contractual obligations under the 2021 Credit Agreement Includes the effect of our EURUSD cross-currency swap Includes the effect of our interest rate derivatives Segundo Trimestre Primer Trimestre Second Quarter First Quarter 2022 2021 % var 2022 2022 2021 % var 2022 Deuda Total1 8729.0850079669126 9665.3122907790821 -9.6864669722606989E-2 8962.8973900023557 Total debt1 8729.0850079669126 9665.3122907790821 -9.6864669722606989E-2 8962.8973900023557 Corto Plazo 4.5586802731688233E-2 9.7653141215875747E-2 4.1293003803025891E-2 Short-term 4.5586802731688233E-2 9.7653141215875747E-2 4.1293003803025891E-2 Largo Plazo 0.95441319726831197 0.90234685878412424 0.95870699619697397 Long-term 0.95441319726831197 0.90234685878412424 0.95870699619697397 Efectivo y equivalentes 489.69839999999999 1304.6569999999999 -0.62465352962502785 592.86260000000004 Cash and cash equivalents 489.69839999999999 1304.6569999999999 -0.62465352962502785 592.86260000000004 Deuda neta 8239.3866079669133 8359.6552907790829 -1.4386799291213448E-2 8370.0347900023553 Net debt 8239.3866079669133 8359.6552907790829 -1.4386799291213448E-2 8370.0347900023553 Deuda neta Consolidada2 8123.1301354073275 8383 -3.0999625980278278E-2 8265.8745448169793 Consolidated net debt2 8123.1301354073275 8383 -3.0999625980278278E-2 8265.8745448169793 Razón de apalancamiento consolidado2 2.88 2.91 2.8337008267239878 Consolidated leverage ratio2 2.88 2.91 2.8337008267239878 Razón de cobertura de intereses consolidado2 6.74 4.78 6.6 Consolidated coverage ratio2 6.74 4.78 6.6 1 Incluye notas convertibles subordinadas y arrendamientos, de acuerdo a las NIIFs (IFRS por sus siglas en inglés) 2 Calculado de acuerdo a nuestras obligaciones contractuales bajo el Contrato de Crédito de 2017, según fue enmendado y reexpresado el 2 de abril de 2019. Los montos y razones financieras de 2018 no han sido auditados, y no corresponden con los montos y razones financieras reportadas durante 2018 de acuerdo a nuestro Contrato de Crédito de julio de 2017, y se muestran en este documento únicamente para efectos informativos, dando efecto a la adopción de IFRS 16, Arrendamientos, como si hubiera estado vigente desde enero 1 de 2018. 1 Includes convertible notes and leases, in accordance with International Financial Reporting Standard (IFRS)2 Calculated in accordance with our contractual obligations under the 2017 Facilities Agreement, as amended and restated on April 2, 2019. 2018 amounts and ratios are not audited, and were not the actual amounts and ratios reported during 2018 under our Facilities Agreement dated July 2017, and are shown in this document for reference purposes only, giving effect to the adoption of IFRS 16, Leases, as if it had been in effect from January 1, 2018. OJO: Información viene del data bridge - COVENANTS Currency Denomination 2Q22 US Dollar #REF! Euro #REF! Mexican Peso #REF! Other #REF! Interest rate 2Q22 Fixed #REF! Variable #REF! Validacion Deuda Total1 0 0 0 0 Costo Plazo 0 0 0 0 Largo Plazo 0 0 0 0 Notas perpetuas #REF! #REF! #REF! #REF! Efectivo y equivalentes 0 0 0 0 Deuda neta más notas perpetuas 0 0 0 0 Deuda Consolidada Fondeada2 /Flujo de operación3 0 0 0 0 Cobertura de intereses3 4 0 0 0 0

Additional information on debt Total debt1 by instrument Millions of U.S. dollars Includes leases, in accordance with IFRS Second Quarter First Quarter 2022 % of total 2022 % of total Fixed Income 4780.8875883358205 0.54769313359962446 5318.1623500000005 0.59333928433546212 5318 0.59339433162240574 2021 Credit Agreement 2471.0609324915422 0.28308197597739421 2127.0905465452715 0.23731625692169747 2127 0.23733541620174067 Others1 1477.1870024066266 0.16922489042298144 1517.8521774029718 0.1693444587428404 1517 0.16927025217585359 Total Debt 8729.1355232339884 8963.1050739482434 8962 Segundo Trimestre Primer Trimestre 2022 % del total 2022 % del total Renta Fija 4780.8875883358205 0.54769313359962446 5318.1623500000005 0.59333928433546212 Contrato de Crédito 2021 2471.0609324915422 0.28308197597739421 2127.0905465452715 0.23731625692169747 Otros1 1477.1870024066266 0.16922489042298144 1517.8521774029718 0.1693444587428404 Deuda Total 8729.1355232339884 8963.1050739482434 CHECK VALUES CHANGED TO REACH 100% OJO: Información viene del data bridge

2Q22 volume and price summary: selected countries and regions Price (LC) for Europe calculated on a volume-weighted-average basis at constant foreign-exchange rates Domestic gray cement Ready mix Aggregates 2Q22 vs. 2Q21 2Q22 vs. 2Q21 2Q22 vs. 2Q21 Volume Price (USD) Price (LC) Volume Price (USD) Price (LC) Volume Price (USD) Price (LC) Mexico -0.11536267227410596 0.16255501594595609 0.1626815815195278 0 0.14290192557081222 0.15073696766138617 0.15060501948459776 0 4.7352463463382052E-2 0.23946987946779727 0.23908933514407799 U.S. -9.6373179790910334E-3 0.1470664674773636 0.1470664674773636 0 2.8700887959259184E-2 0.118325202440733 0.118325202440733 0 3.1654977987197561E-2 0.17117247153628209 0.17117247153628209 Europe -1.0733282025109325E-2 0.10307740322948893 0.25591914173543245 0 -2.6392413544960677E-2 5.6671763053058313E-3 0.14045242995995985 0 -4.6446054074545863E-2 -3.1279246377548149E-2 9.6002871142641388E-2 Israel N/A N/A N/A 0 6.0663102752093689E-2 6.7682243636690592E-2 0.11276800731246632 0 6.1326262770300573E-2 4.6684104283424149E-2 9.0081249535294339E-2 Philippines -0.10932803240079678 -1.5532010968369729E-2 8.7602749867987606E-2 0 N/A N/A N/A 0 N/A N/A N/A Colombia -6.0478396028150402E-2 8.1455659797281463E-3 8.2127020423175837E-2 0 0.33273374289993785 -4.570866352202841E-2 2.3109704850250792E-2 0 0.34557055546134058 -5.0352550499542459E-2 1.8586854047616754E-2 Panama 5.8976661274260093E-2 -3.9512192882198906E-2 -3.9512192882198906E-2 0 0.24967907573812581 2.8026613055222103E-2 2.8026613055222103E-2 0 0.15344533320675602 0.24231828674146236 0.24231828674146236 Dominican Republic -3.868642260787844E-2 0.2068222463089685 0.16562437246543935 0 0.25683915398644419 0.12613163734921878 8.7453173021642364E-2 0 N/A N/A N/A Cemento gris doméstico Concreto Agregados 2T22 vs. 2T21 2T22 vs. 2T21 2T22 vs. 2T21 Volumen Precio Precio Volumen Precio Precio Volumen Precio Precio (USD) (ML) (USD) (ML) (USD) (ML) México -0.11536267227410596 0.16255501594595609 0.1626815815195278 0.14290192557081222 0.15073696766138617 0.15060501948459776 4.7352463463382052E-2 0.23946987946779727 0.23908933514407799 Estados Unidos -9.6373179790910334E-3 0.1470664674773636 0.1470664674773636 2.8700887959259184E-2 0.118325202440733 0.118325202440733 3.1654977987197561E-2 0.17117247153628209 0.17117247153628209 Europa -1.0733282025109325E-2 0.10307740322948893 0.25591914173543245 -2.6392413544960677E-2 5.6671763053058313E-3 0.14045242995995985 -4.6446054074545863E-2 -3.1279246377548149E-2 9.6002871142641388E-2 Israel N/A N/A N/A 6.0663102752093689E-2 6.7682243636690592E-2 0.11276800731246632 6.1326262770300573E-2 4.6684104283424149E-2 9.0081249535294339E-2 Filipinas -0.10932803240079678 -1.5532010968369729E-2 8.7602749867987606E-2 N/A N/A N/A N/A N/A N/A Colombia -6.0478396028150402E-2 8.1455659797281463E-3 8.2127020423175837E-2 0.33273374289993785 -4.570866352202841E-2 2.3109704850250792E-2 0.34557055546134058 -5.0352550499542459E-2 1.8586854047616754E-2 Panamá 5.8976661274260093E-2 -3.9512192882198906E-2 -3.9512192882198906E-2 0.24967907573812581 2.8026613055222103E-2 2.8026613055222103E-2 0.15344533320675602 0.24231828674146236 0.24231828674146236 República Dominicana -3.868642260787844E-2 0.2068222463089685 0.16562437246543935 0.25683915398644419 0.12613163734921878 8.7453173021642364E-2 N/A N/A N/A Validación México 0 0 0 0 0 0 0 0 0 Estados Unidos 0 0 0 0 0 0 0 0 0 Europa 0 0 0 0 0 0 0 0 0 Israel N/A N/A N/A 0 0 0 0 0 0 Filipinas 0 0 0 N/A N/A N/A N/A N/A N/A Colombia 0 0 0 0 0 0 0 0 0 Panamá 0 0 0 0 0 0 0 0 0 Costa Rica #REF! #REF! #REF! #REF! #REF! #REF! #REF! #REF! #REF! República Dominicana 0 0 0 0 0 0 N/A N/A N/A

6M22 volume and price summary: selected countries and regions Price (LC) for Europe calculated on a volume-weighted-average basis at constant foreign-exchange rates Domestic gray cement Ready mix Aggregates 6M22 vs. 6M21 6M22 vs. 6M21 6M22 vs. 6M21 Volume Price (USD) Price (LC) Volume Price (USD) Price (LC) Volume Price (USD) Price (LC) Mexico -9.9018568290886677E-2 0.15396234131999822 0.14494961624490518 0 0.11788130456206722 0.14224164524826241 0.13290167394405983 0 4.7503777378866921E-2 0.19767408566697514 0.18776982620605365 U.S. 3.7025099143035492E-2 0.12179430047120146 0.12179430047120146 0 4.623953203154417E-2 0.10577639957702509 0.10577639957702509 0 6.1676915085963929E-2 0.12472957601230117 0.12472957601230117 Europe 5.7930026331953502E-2 9.1722147809044557E-2 0.20661242384307951 0 2.0547943594796211E-2 2.0837951066299113E-3 0.10258775280786163 0 -2.9611251064610312E-3 -2.5295348455576253E-2 6.7777424450071094E-2 Israel N/A N/A N/A 0 3.2403073958659101E-2 8.3155904514228121E-2 8.8806649007150379E-2 0 8.7357820665393604E-2 7.4317599285758332E-2 7.8887252989625276E-2 Philippines -8.4089264470232877E-2 -1.8996464947520846E-3 8.084641474404472E-2 0 N/A N/A N/A 0 N/A N/A N/A Colombia -9.5236986251324551E-3 -1.892325113909072E-2 4.683726742392548E-2 0 0.22721159749172948 -4.8001734390176035E-2 1.5777480364217146E-2 0 0.24564922497154362 -5.1921491342073342E-2 1.1553320383022959E-2 Panama 5.2448651516544147E-2 -5.1029937022565967E-2 -5.1029937022565967E-2 0 0.2028402635764599 -1.966768401676925E-2 -1.966768401676925E-2 0 0.17466406478751231 0.17158481896853692 0.17158481896853692 Dominican Republic -4.0560735227824954E-2 0.17907317638769901 0.14042127079142336 0 0.28789969446517327 0.15274672695973737 0.11522062601781521 0 N/A N/A N/A Cemento gris doméstico Concreto Agregados 6M22 vs. 6M21 6M22 vs. 6M21 6M22 vs. 6M21 Volumen Precio Precio Volumen Precio Precio Volumen Precio Precio (USD) (ML) (USD) (ML) (USD) (ML) México -9.9018568290886677E-2 0.15396234131999822 0.14494961624490518 0.11788130456206722 0.14224164524826241 0.13290167394405983 4.7503777378866921E-2 0.19767408566697514 0.18776982620605365 Estados Unidos 3.7025099143035492E-2 0.12179430047120146 0.12179430047120146 4.623953203154417E-2 0.10577639957702509 0.10577639957702509 6.1676915085963929E-2 0.12472957601230117 0.12472957601230117 Europa 5.7930026331953502E-2 9.1722147809044557E-2 0.20661242384307951 2.0547943594796211E-2 2.0837951066299113E-3 0.10258775280786163 -2.9611251064610312E-3 -2.5295348455576253E-2 6.7777424450071094E-2 Israel N/A N/A N/A 3.2403073958659101E-2 8.3155904514228121E-2 8.8806649007150379E-2 8.7357820665393604E-2 7.4317599285758332E-2 7.8887252989625276E-2 Filipinas -8.4089264470232877E-2 -1.8996464947520846E-3 8.084641474404472E-2 0 N/A N/A N/A 0 N/A N/A N/A Colombia -9.5236986251324551E-3 -1.892325113909072E-2 4.683726742392548E-2 0.22721159749172948 -4.8001734390176035E-2 1.5777480364217146E-2 0.24564922497154362 -5.1921491342073342E-2 1.1553320383022959E-2 Panamá 5.2448651516544147E-2 -5.1029937022565967E-2 -5.1029937022565967E-2 0.2028402635764599 -1.966768401676925E-2 -1.966768401676925E-2 0.17466406478751231 0.17158481896853692 0.17158481896853692 República Dominicana -4.0560735227824954E-2 0.17907317638769901 0.14042127079142336 0.28789969446517327 0.15274672695973737 0.11522062601781521 N/A N/A N/A Validación México 0 0 0 0 0 0 0 0 0 Estados Unidos 0 0 0 0 0 0 0 0 0 Europa 0 0 0 0 0 0 0 0 0 Israel N/A N/A N/A 0 0 0 0 0 0 Filipinas 0 0 0 N/A N/A N/A N/A N/A N/A Colombia 0 0 0 0 0 0 0 0 0 Panamá 0 0 0 0 0 0 0 0 0 Costa Rica #REF! #REF! #REF! #REF! #REF! #REF! #REF! #REF! #REF! República Dominicana 0 0 0 0 0 0 N/A N/A N/A

2022 expected volume outlook1: selected countries/regions Cement Ready-mix Aggregates CEMEX Flat Low to mid single-digit increase Low to mid single-digit increase Mexico Low to mid single-digit decline High single-digit increase Low to mid single-digit increase USA Low single-digit increase Low single-digit increase Low single-digit increase Europe Flat Flat to low single-digit decline Flat Colombia Flat Low teens increase N/A Panama Low to mid single-digit increase At least 20% increase N/A Dominican Republic Low single-digit decrease Low teens increase N/A Israel N/A Flat Low single-digit increase Philippines Flat to low single-digit decrease N/A N/A Reflects CEMEX’s current expectations. Volumes on a like-to-like basis

Relevant ESG indicators Carbon strategy 1H22 1H21 2021 Kg of CO2 per ton of cementitious 574 599 591 Alternative fuels (%) 33% 28% 29% Clinker factor 74.5% 76.1% 75.8% Low-carbon products 1H22 1H21 2021 Blended cement as % of total cement produced 74% 70% 68% Vertua concrete as % of total 32% 20% 20% Customers and suppliers 2Q22 2Q21 2021 Net Promoter Score (NPS) 66 68 70 % of sales using CX Go 59% 66% 62% Health and safety 1H22 1H21 2021 Employee fatalities 1 0 1 Employee L-T-I frequency rate 0.5 0.5 0.5 Operations with zero fatalities and injuries (%) 98% 98% 95%

Definitions SCAC South, Central America and the Caribbean EMEA Europe, Middle East, Africa and Asia Cement When providing cement volume variations, refers to domestic gray cement operations (starting in 2Q10, the base for reported cement volumes changed from total domestic cement including clinker to domestic gray cement) LC Local currency l-t-l (like to like) On a like-to-like basis adjusting for currency fluctuations and for investments/divestments when applicable Maintenance capital expenditures Investments incurred for the purpose of ensuring the company’s operational continuity. These include capital expenditures on projects required to replace obsolete assets or maintain current operational levels, and mandatory capital expenditures, which are projects required to comply with governmental regulations or company policies Operating EBITDA Operating earnings before other expenses, net plus depreciation and operating amortization IFRS International Financial Reporting Standards, as issued by the International Accounting Standards Board Pp Percentage points Prices All references to pricing initiatives, price increases or decreases, refer to our prices for our products Strategic capital expenditures Investments incurred with the purpose of increasing the company’s profitability. These include capital expenditures on projects designed to increase profitability by expanding capacity, and margin improvement capital expenditures, which are projects designed to increase profitability by reducing costs TCL Operations Trinidad Cement Limited includes Barbados, Guyana, Jamaica and Trinidad and Tobago USD U.S. dollars % var Percentage variation

Serious News for Serious Traders! Try StreetInsider.com Premium Free!
You May Also Be Interested In
- Cemex S.A. (CX) May July call spreader active
- Four ONDA Partners Earn Placement on D Magazine’s Best Lawyers List
- Port Houston Regular Commission Meeting
Create E-mail Alert Related Categories
SEC FilingsSign up for StreetInsider Free!
Receive full access to all new and archived articles, unlimited portfolio tracking, e-mail alerts, custom newswires and RSS feeds - and more!
