

Form 6-K Banco Santander, S.A. For: Apr 04
 Tweet
Tweet Share
Share
FORM 6-K
SECURITIES AND EXCHANGE COMMISSION
Washington, D.C. 20549
Report of Foreign Issuer
Pursuant to Rule 13a-16 or 15d-16 of
the Securities Exchange Act of 1934
For the month of April, 2022
Commission File Number: 001-12518
Banco Santander, S.A.
(Exact name of registrant as specified in its charter)
Ciudad Grupo Santander
28660 Boadilla del Monte (Madrid) Spain
(Address of principal executive office)
Indicate by check mark whether the registrant files or will file annual reports under cover of Form 20-F or Form 40-F:
| Form 20-F | X |
Form 40-F |
Indicate by check mark if the registrant is submitting the Form 6-K in paper as permitted by Regulation S-T Rule 101(b)(1):
| Yes | No | X |
Indicate by check mark if the registrant is submitting the Form 6-K in paper as permitted by Regulation S-T Rule 101(b)(7):
| Yes | No | X |
Banco Santander, S.A.
TABLE OF CONTENTS
Item |
|
| 1 | Report of Other Relevant Information dated April 4, 2022 |

Banco Santander, S.A. (the “Bank” or “Banco Santander”), in compliance with the Securities Market legislation, hereby communicates the following:
OTHER RELEVANT INFORMATION
From and including the first quarter of 2022, a change in Grupo Santander’s (the “Group”) financial reporting of segments will be carried out to reflect two main modifications, as described below. The attached presentation includes the Group’s quarterly pro forma financial figures for 2021 reported on this new basis to allow a comparison between 2021 and 2022 results.
Aiming at providing more transparency and a better capital allocation to continue enhancing our profitability, the main modifications
are as follows:
| • | Reallocation of certain financial costs of the Corporate Centre segment in the Group’s results to the business units: |
| • | Further clarity in the MREL/TLAC regulation1 makes it possible to better allocate the cost of the eligible debt issuances to the business units; |
| • | In addition, other financial costs, primarily the cost of funding the excess capital held by the business unit above of Group’s CET1 ratio have been reassigned accordingly. |
| • | Downsizing of Other Europe: |
| • | The Corporate and Investment Banking (CIB) branches of Banco Santander in Europe and other business lines previously reported under “Other Europe” have been now integrated into the Spain unit to reflect how the business will be managed and supervised, in line with other regions. |
The abovementioned changes have no impact on the Group’s reported consolidated financial figures nor on the Group’s consolidated financial targets that have been set for the future.
A presentation will take place tomorrow, Tuesday 5 April 2022, at 13:00 hrs (Madrid time). For further information, please contact Investor Relations ([email protected]).
Boadilla del Monte (Madrid), 4 April 2022
______________
1- MREL: Minimum Requirement for Own Funds and Eligible Liabilities, binding minimum requirement for own funds and eligible liabilities, both total and subordinated, with loss absorption capacity, which is required to be met under the Bank Recovery and Resolution Directive (BRRD).
- TLAC: Total loss absorbing capacity, requirement which is required to be met under the Capital Requirements Directive V (CRD V) package.
Item 1

Reallocation of the Corporate Centre’s financial costs to operating units and other reporting changes Here. Now. April 2022

Important information 2 Non - IFRS and alternative performance measures This document contains, in addition to the financial information prepared in accordance with International Financial Reporting Standards (“IFRS”) and derived from our financial statements, alternative performance measures (“APMs”) as defined in the Guidelines on Alternative Performance Measures issued by the European Securities and Markets Authority (ESMA) on 5 October 2015 (ESMA/ 2015 / 1415 en) and other non - IFRS measures (“Non - IFRS Measures”) . These financial measures that qualify as APMs and non - IFRS measures have been calculated with information from Santander Group ; however those financial measures are not defined or detailed in the applicable financial reporting framework nor have been audited or reviewed by our auditors . We use these APMs and non - IFRS measures when planning, monitoring and evaluating our performance . We consider these APMs and non - IFRS measures to be useful metrics for our management and investors to compare operating performance between accounting periods, as these measures exclude items outside the ordinary course of business, which are grouped in the “net capital gains and provisions” line and are further detailed in Section 3 . 2 . of the Economic and Financial Review in our Directors’ Report included in our Annual Report on Form 20 - F for the year ended 31 December 2021 . Nonetheless, these APMs and non - IFRS measures should be considered supplemental information to, and are not meant to substitute IFRS measures . Furthermore, companies in our industry and others may calculate or use APMs and non - IFRS measures differently, thus making them less useful for comparison purposes . For further details on APMs and Non - IFRS Measures, including their definition or a reconciliation between any applicable management indicators and the financial data presented in the consolidated financial statements prepared under IFRS, please see the 2021 Annual Report on Form 20 - F filed with the U . S . Securities and Exchange Commission on 1 March 2022 , as well as the section “Alternative performance measures” of the annex to the Banco Santander Q 4 2021 Financial Report, published as Inside Information on 2 February 2022 . These documents are available on Santander’s website (www . santander . com) . Underlying measures, which are included in this document, are non - IFRS measures . The businesses included in each of our geographic segments and the accounting principles under which their results are presented here may differ from the included businesses and local applicable accounting principles of our public subsidiaries in such geographies . Accordingly, the results of operations and trends shown for our geographic segments may differ materially from those of such subsidiaries . Forward - looking statements Banco Santander advises that this document contains “forward - looking statements” as per the meaning of the U . S . Private Securities Litigation Reform Act of 1995 . These statements may be identified by words like “expect”, “project”, “anticipate”, “should”, “intend”, “probability”, “risk”, “VaR”, “RoRAC”, “RoRWA”, “TNAV”, “target”, “goal”, “objective”, “estimate”, “future” and similar expressions . Found throughout this document, they include (but are not limited to) statements on our future business development, economic performance and shareholder remuneration policy . However, a number of risks, uncertainties and other important factors may cause actual developments and results to differ materially from our expectations . The following important factors, among others, could affect our future results and could cause materially different outcomes from those anticipated in forward - looking statements : ( 1 ) general economic or industry conditions of areas where we have significant operations or investments (such as a worse economic environment ; higher volatility in the capital markets ; inflation or deflation ; changes in demographics, consumer spending, investment or saving habits ; and the effects of the COVID - 19 pandemic in the global economy) ; ( 2 ) exposure to various market risks (particularly interest rate risk, foreign exchange rate risk, equity price risk and risks associated with the replacement of benchmark indices) ; ( 3 ) potential losses from early repayments on our loan and investment portfolio, declines in value of collateral securing our loan portfolio, and counterparty risk ; ( 4 ) political stability in Spain, the United Kingdom, other European countries, Latin America and the US ; ( 5 ) changes in legislation, regulations or taxes, including regulatory capital and liquidity requirements, especially in view of the UK exit from the European Union and increased regulation in response to financial crisis ; ( 6 ) our ability to integrate successfully our acquisitions and related challenges that result from the inherent diversion of management’s focus and resources from other strategic opportunities and operational matters ; and ( 7 ) changes in our access to liquidity and funding on acceptable terms, in particular if resulting from credit spreads shifts or downgrade in credit ratings for the entire group or significant subsidiaries .

Important information 3 Numerous factors could affect our future results and could cause those results deviating from those anticipated in the forward - looking statements . Other unknown or unpredictable factors could cause actual results to differ materially from those in the forward - looking statements . Forward - looking statements speak only as of the date of this document and are informed by the knowledge, information and views available on such date . Santander is not required to update or revise any forward - looking statements, regardless of new information, future events or otherwise . No offer The information contained in this document is subject to, and must be read in conjunction with, all other publicly available information, including, where relevant any fuller disclosure document published by Santander . Any person at any time acquiring securities must do so only on the basis of such person’s own judgment as to the merits or the suitability of the securities for its purpose and only on such information as is contained in such public information having taken all such professional or other advice as it considers necessary or appropriate in the circumstances and not in reliance on the information contained in this document . No investment activity should be undertaken on the basis of the information contained in this document . In making this document available Santander gives no advice and makes no recommendation to buy, sell or otherwise deal in shares in Santander or in any other securities or investments whatsoever . Neither this document nor any of the information contained therein constitutes an offer to sell or the solicitation of an offer to buy any securities . No offering of securities shall be made in the United States except pursuant to registration under the U . S . Securities Act of 1933 , as amended, or an exemption therefrom . Nothing contained in this document is intended to constitute an invitation or inducement to engage in investment activity for the purposes of the prohibition on financial promotion in the U . K . Financial Services and Markets Act 2000 . Historical performance is not indicative of future results Statements about historical performance or accretion must not be construed to indicate that future performance, share price or future earnings (including earnings per share) in any future period will necessarily match or exceed those of any prior period . Nothing in this document should be taken as a profit forecast .

4 Executive Summary These changes have no impact on the Group’s reported consolidated financial figures With the aim of increasing transparency and improving capital allocation to continue enhancing our profitability, we will make the following main changes to our financial reporting from and including Q1 2022: Additionally in the secondary segments, we completed the usual annual adjustment of the perimeter of the Global Customer Relationship Model between Retail Banking and SCIB and between Retail Banking and Wealth Management & Insurance . • The Corporate and Investment Banking branches of Banco Santander, S . A . in Europe and other business lines previously reported in “Other Europe” have been incorporated in Spain in order to reflect how the businesses will be managed and supervised, in line with the other regions . Primary segme n ts • MREL/TLAC costs of eligible debt issuances will be allocated to the business units. • The cost of funding the excess CET1 capital above the Group’s ratio will be charged to the operating units. C or p orate Centre NOTE: changes to 2021 figures have not been audited
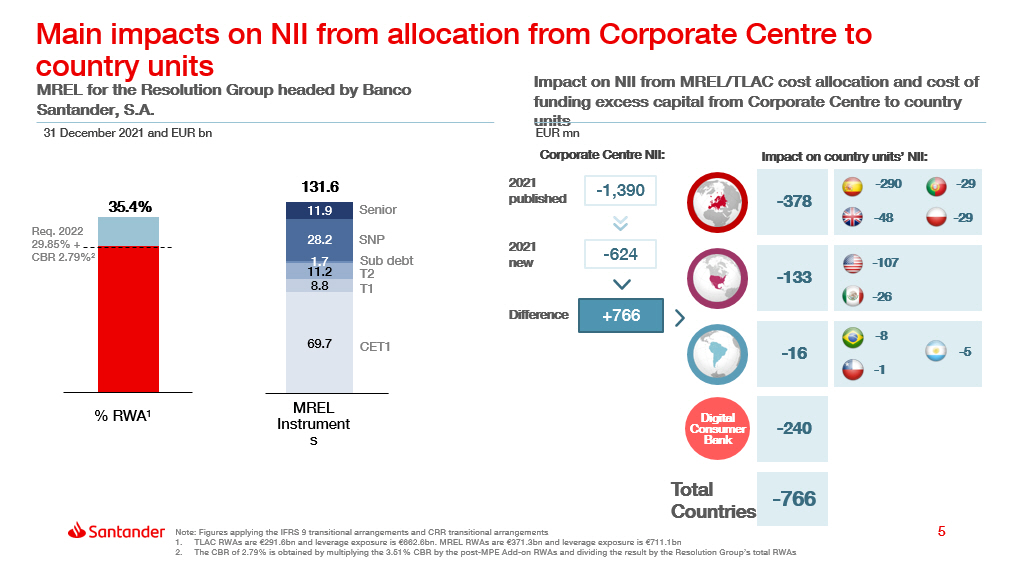
5 Main impacts on NII from allocation from Corporate Centre to country units Impact on NII from MREL/TLAC cost allocation and cost of funding excess capital from Corporate Centre to country units - 378 - 107 - 26 - 8 - 1 - 133 - 16 - 240 - 290 - 29 - 48 - 29 Digital Consumer B a n k - 1,390 2021 published +766 Difference - 624 2021 new Impact on country units’ NII: - 766 Total C ou n tri e s - 5 MREL for the Resolution Group headed by Banco Santander, S.A. 3 5 .4 % Req. 2022 29.85% + CBR 2.79% 2 11.9 28.2 1.7 11.2 8.8 69.7 Sub debt 1 3 1.6 C E T 1 S eni or SNP T2 T1 % RWA 1 MREL Instruments Note: Figures applying the IFRS 9 transitional arrangements and CRR transitional arrangements 1. TLAC RWAs are €291.6bn and leverage exposure is €662.6bn. MREL RWAs are €371.3bn and leverage exposure is €711.1bn 2. The CBR of 2.79% is obtained by multiplying the 3.51% CBR by the post - MPE Add - on RWAs and dividing the result by the Resolution Group’s total RWAs 31 December 2021 and EUR bn EUR mn Corporate Centre NII:

6 Main impacts from perimeter changes from Other Europe to Spain Total assets Spain Impacts on Income Statement Total income Other Europe - 1,032 - 91 +1,032 +91 Operating expenses - 712 + 712 Loans 1 - 44 +44 LLPs - 487 + 487 Deposits 2 - 26 +26 Underlying PBT +154 - 154 RWAs - 30 +30 Underlying profit +127 - 127 (1) Gross loans and advances to customers excluding reverse repos (2) Customer deposits excluding repos Spain Other Europe Impact on Balance Sheet volumes FY2021 and EUR mn 31 December 2021 and EUR bn

Impacts on profit by primary and secondary segments North America South America DCB 3,053 1,332 3,328 - 93 - 168 - 11 2021 published 2021 new Dif f e r en c e Europe 2,9 7 8 2,7 5 0 - 229 o/w Spain 957 627 - 330 2,960 1,164 3,317 Corporate Centre - 2,037 +501 - 1,535 Retail Banking 2021 published 7,8 6 9 2021 new Difference 7,3 8 9 G r o up 8,6 5 4 0 8,6 5 4 SCIB 2,167 2,113 - 54 WM&I 907 941 +34 PagoNxt - 253 - 253 0 Corporate Centre - 2,0 3 7 - 1,5 3 5 +501 Group 8,654 8,654 0 7 - 480 Underlying profit. Primary segments EUR mn Underlying profit. Secondary segments EUR mn

Impact on Europe’s costs 2020 - 2021 Costs: 2020 - 2021 published vs 2021 new EUR mn 2020 Published Spain 3,607 2021 Published 3,340 2021 New 4,052 Portug a l 590 563 563 Po la nd 629 6 6 3 663 U K 2,5 3 9 2,5 9 2 2,5 9 2 4 countries 7, 3 65 7 , 1 5 7 7, 8 69 Other E u ro p e 909 1,1 6 1 450 E U ROPE 8, 2 75 8 , 3 8, 3 18 8 We reiterate our 2022 Group efficiency ratio target of 45% (from 46.2% in 2021) and we expect to deliver efficiency improvements in Europe vs. 52.2% (restated) in 2021

Adjusted RoTE 2022 public targets Efficiency ratio Published New EUROPE >12% >10% Spain >11% ~8% UK >13% ~13% Portugal ~19% ~19% Poland ~14% >13% NORTH AMERICA ~20% ~20% US ~19% ~19% Mexico ~29% ~29% SOUTH AMERICA ~25% ~25% Brazil >26% >26% Chile >27% >27% DCB >15% ~14% TOTAL GROUP >13% >13% 9 Published New EUROPE ~50% ~52% Spain ~45% ~50% UK ~52% ~53% Portugal ~42% ~42% Poland ~39% ~40% NORTH AMERICA ~44% ~44% US ~43% ~43% Mexico ~43% ~43% SOUTH AMERICA ~35% ~35% Brazil ~30% ~30% Chile <40% <40% DCB ~44% ~46% TOTAL GROUP ~45% ~45% These changes have no impact on the Group’s consolidated financial targets

Appendix: Primary segments 10

11 Europe EUR million NEW (pro forma) Q1'21 Q2'21 Q3'21 Q4'21 PREVIOUS Q1'21 Q2'21 Q3'21 Q4'21 DIFFERENCES Q1'21 Q2'21 Q3'21 Q4'21 Income statement Net interest income 2 , 55 1 2 , 65 6 2,650 2 , 71 7 2 , 64 5 2 , 75 1 2,744 2,812 ( 94 ) ( 95 ) (94) ( 95 ) Net fee income 1 , 07 2 1 , 08 6 1,080 1 , 10 8 1 , 07 2 1 , 08 6 1,079 1,108 — — — — Gains (losses) on financial transactions * 383 84 101 186 383 84 101 186 — — — — Other operating income 50 21 283 ( 93 ) 49 21 284 (93) — — — — T o t a l i n c o m e 4 , 05 5 3 , 84 8 4 , 11 4 3 , 91 7 A d m i n is t r a t i v e e x p e n s e s a n d a m o r t i z a t i on s ( 2 ,071) ( 2 ,072) ( 2 ,048) ( 2 ,126) 4 , 14 9 3 , 94 2 4 , 20 8 4 , 01 3 (2,071) (2,072) (2,048) (2,127) ( 94 ) ( 94 ) ( 94 ) ( 96 ) — — — — Net operating income 1,983 1,777 2,065 1,790 2,077 1,870 2,160 1,886 (95) (93) (95) (96) Net loan - loss provisions ( 596 ) ( 606 ) (675) (416) ( 595 ) (606) ( 676 ) (416) — — — — Other gains (losses) and provisions ( 251 ) ( 344 ) (258) (436) ( 251 ) (344) ( 258 ) (436) — — — — Profit before tax 1,138 824 1,133 939 1,231 919 1,227 1,034 (93) (95) (94) (95) Tax on profit ( 366 ) ( 264 ) (291) (292) ( 402 ) (303) ( 328 ) (329) 36 38 37 37 Profit from continuing operations 772 560 842 647 829 616 899 705 (57) (56) (57) (58) Net profit from discontinued operations — — — — — — 0 (0) — — — — Consolidated profit 772 560 842 647 829 616 899 705 (57) (56) (57) (58) Non - controlling interests (2) (17) (31) (20) (3) (17) (31) (20) — — — — Underlying attributable profit to the parent 769 542 809 629 826 599 867 685 (57) (57) (58) (57) NEW (pro forma) PREVIOUS DIFFERENCES Mar - 21 Jun - 21 Sep - 21 Dic - 21 Balance sheet Loans and advances to customers 582,033 584,804 590,822 590,610 Mar - 21 Jun - 21 Sep - 21 Dic - 21 582,033 584,804 590,822 590,610 Mar - 21 Jun - 21 Sep - 21 Dic - 21 — — — — Cash, central banks and credit institutions 216,518 200,772 201,791 219,155 243,575 243,814 247,362 256,433 (27,057) (43,042) (45,571) (37,278) Debt instruments 76,451 77,472 70,762 67,068 76,451 77,472 70,762 67,068 — — — — Other financial assets 47,751 49,395 48,326 37,250 47,751 49,395 48,326 37,250 — — — — Other asset accounts 33,892 32,651 30,408 29,793 33,892 32,651 30,408 29,793 — — — — Total assets 956,646 945,094 942,110 943,875 983,703 988,136 987,681 981,153 (27,057) (43,042) (45,571) (37,278) Customer deposits 596,875 599,463 608,939 619,486 596,875 599,463 608,939 619,486 — — — — Central banks and credit institutions 163,619 154,328 149,297 156,258 190,620 197,256 194,697 193,307 ( 27 , 000 ) ( 42 , 928 ) ( 45 , 399 ) ( 37 , 049 ) Marketable debt securities 88 , 09 0 79,019 75,468 73,629 88 , 09 0 79,019 75,468 73,629 — — — — Other financial liabilities 50 , 54 2 54,859 51,041 38,706 50 , 54 2 54,859 51,041 38,706 — — — — Other liabilities accounts 13,014 11,966 11,208 10,929 13 , 01 4 11 , 96 6 11 , 20 8 10 , 92 9 — — — — Total liabilities 912,140 899,635 895,954 899,007 939,140 942,563 941,353 936,056 (27,000) (42,928) (45,399) (37,049) Total equity 44,506 45,459 46,156 44,868 44 , 56 3 45 , 57 3 46 , 32 8 45 , 09 7 ( 57 ) ( 114 ) ( 171 ) ( 229 ) Memorandum items: Gross loans and advances to customers ** 558,455 562,209 567,283 575,983 558,455 562,209 567,283 575,983 — — — — Customer funds 674,618 681,433 694,670 711,799 674,618 681,433 694,670 711,799 — — — — Customer deposits *** 575,671 578,759 589,067 603,739 Mutual funds 98,947 102,675 105,603 108,060 575,671 578,759 589,067 603,739 98,947 102,675 105,603 108,060 — — — — — — — — (*). - Includes exchange differences. (**). - Excluding reverse repos. (***). - Excluding repos.

12 Spain EUR million NEW (pro forma) Q1'21 Q2'21 Q3'21 Q4'21 PREVIOUS Q1'21 Q2'21 Q3'21 Q4'21 DIFFERENCES Q1'21 Q2'21 Q3'21 Q4'21 Income statement Net interest income 1 , 07 4 1 , 06 5 998 1 , 02 8 1 , 01 9 1 , 01 5 975 985 54 51 23 44 Net fee income 684 693 679 732 587 617 616 661 97 77 62 71 Gains (losses) on financial transactions * 209 62 65 190 132 123 95 201 77 (62) (30) ( 11 ) Other operating income 101 13 266 ( 112 ) 45 ( 62 ) 194 (200) 55 74 72 88 T o t a l i n c o m e 2 , 06 8 1 , 83 3 2 , 00 9 1 , 83 9 1 , 78 5 1 , 69 3 1 , 88 1 1 , 64 7 28 3 14 0 12 7 192 Administrative expenses and amortizations ( 1 , 016 ) (1,011) (984) (1,040) (867) (852) (818) (803) (149) (160) (166) (237) Ne t op e r a t i n g i n c o m e 1 , 05 2 82 2 1 , 02 4 798 91 8 84 2 1 , 06 3 844 13 4 ( 20 ) ( 39 ) ( 45 ) Net loan - loss provisions ( 472 ) ( 612 ) (603) ( 633 ) ( 449 ) (492) ( 449 ) ( 443 ) ( 24 ) ( 120 ) ( 154 ) ( 190 ) Other gains (losses) and provisions ( 131 ) ( 147 ) (161) ( 74 ) ( 129 ) (147) ( 162 ) ( 88 ) ( 1 ) — — 14 P r o f i t b e f o r e t a x 44 9 6 3 26 0 91 34 0 20 2 45 3 312 10 9 ( 140 ) ( 193 ) ( 221 ) Tax on profit ( 147 ) (14) (57) (18) (97) (55) (113) (85) (50) 41 56 67 P r o f i t f r o m c on t i nu i n g op e r a t i on s 30 2 4 8 20 3 74 N e t p r o f i t f r o m d is con t i nu e d op e r a t i on s — — — — 24 3 14 7 34 0 227 — — — — 5 9 ( 99 ) ( 137 ) ( 153 ) — — — — Consolidated profit 302 48 203 74 243 147 340 227 5 9 ( 99 ) ( 137 ) ( 153 ) Non - controlling interests 0 0 0 (0) 0 0 0 (0) — — — — Underlying attributable profit to the parent 302 49 203 73 243 147 340 227 5 9 ( 99 ) ( 137 ) ( 153 ) Balance sheet NEW (pro forma) Mar - 21 Jun - 21 Sep - 21 Dec - 21 PREVIOUS Mar - 21 Jun - 21 Sep - 21 Dec - 21 DIFFERENCES Mar - 21 Jun - 21 Sep - 21 Dec - 21 Loans and advances to customers 241,816 243,087 248,618 248,211 191,062 192,716 193,129 195,041 50,754 50,371 55,489 53,169 Cash, central banks and credit institutions 132,664 121,367 126,409 130,773 123,553 128,622 133,062 142,040 9,111 (7,255) (6,653) (11,268) Debt instruments 37,326 38,801 33,730 30,043 18,551 18,864 15,869 13,915 18,775 19,937 17,861 16,128 Other financial assets 44,512 45,935 45,256 34,553 2,428 2,496 2,459 2,550 42,083 43,440 42,797 32,004 Other asset accounts 21,232 19,673 18,756 18,677 20,002 17,595 17,644 17,712 1,229 2,078 1,112 965 Total assets 477,549 468,863 472,768 462,256 355,597 360,293 362,161 371,258 121,953 108,571 110,607 90,998 Customer deposits 276 , 00 7 275,195 284,681 292,251 249 , 27 9 253,301 257,488 265 , 00 4 26 , 72 8 21,894 27,193 27,248 Central banks and credit institutions 100 , 81 1 90,218 88,880 83,229 51 , 65 0 50,243 50,581 52 , 85 5 49 , 16 1 39,975 38,299 30,373 Marketable debt securities 30 , 64 3 29,565 29,043 28,582 27 , 21 2 26,660 25,840 25 , 42 8 3 , 43 1 2,905 3,203 3,154 Other financial liabilities 45 , 36 4 49,888 45,813 33,994 7 , 32 6 10,793 8,604 7 , 93 7 38 , 03 7 39,095 37,209 26,057 Other liabilities accounts 5,858 4,930 4,708 5,198 4 , 69 2 3 , 84 8 4 , 04 6 4 , 14 7 1,165 1,082 661 1,051 Total liabilities 458,683 449,796 453,125 443,254 340,159 344,845 346,559 355,371 118,523 104,951 106,566 87,883 Total equity 18,867 19,068 19,643 19,002 15 , 43 9 15 , 44 8 15 , 60 2 15 , 88 7 3,428 3,620 4,041 3,115 Memorandum items: Gross loans and advances to customers ** 233,762 236,942 241,084 245,386 197,435 199,041 199,614 201,549 36 , 32 7 37,901 41,470 43 , 83 7 Customer funds 342,421 347,294 360,409 370,927 322,356 329,525 335,646 345,298 20 , 06 5 17,770 24,763 25 , 62 9 Customer deposits *** 269,344 271,071 282,251 290,633 249,279 253,301 257,488 265,004 20 , 06 5 17,770 24,763 25 , 62 9 Mutual funds 73,078 76,224 78,158 80,295 73 , 07 8 76 , 22 4 78 , 15 8 80 , 29 5 — — — — (*). - Includes exchange differences. (**). - Excluding reverse repos. (***). - Excluding repos.

United Kingdom EUR million NEW (pro forma) Q1'21 Q2'21 Q3'21 Q4'21 PREVIOUS Q1'21 Q2'21 Q3'21 Q4'21 DIFFERENCES Q1'21 Q2'21 Q3'21 Q4'21 Income statement Net interest income 989 1 , 08 8 1 , 15 6 1 , 15 1 1 , 00 1 1 , 10 0 1 , 16 8 1 , 16 3 ( 12 ) ( 12 ) ( 12 ) ( 12 ) Net fee income 120 117 114 82 120 117 114 82 — — — — Gains (losses) on financial transactions * ( 12 ) ( 4 ) 18 ( 10 ) ( 12 ) ( 4 ) 18 ( 10 ) — — — — Other operating income 3 ( 2 ) 3 3 3 ( 2 ) 3 3 — — — — T o t a l i n c o m e 1 , 09 9 1 , 19 9 1 , 29 1 1 , 22 6 A d m i n is t r a t i v e e x p e n s e s a n d a m o r t i z a t i on s ( 6 52) ( 6 48) ( 6 38) ( 6 55) 1 , 11 1 1 , 21 1 1 , 30 3 1 , 23 8 ( 6 52) ( 6 48) ( 6 38) ( 6 55) ( 12 ) ( 12 ) ( 12 ) ( 12 ) — — — — Net operating income 447 551 653 571 459 563 665 583 (12) (12) (12) (12) Net loan - loss provisions ( 18 ) 86 ( 1 ) 178 ( 18 ) 86 (1) 178 — — — — Other gains (losses) and provisions ( 31 ) ( 63 ) ( 39 ) ( 187 ) ( 31 ) ( 63 ) (39) (187) — — — — Profit before tax 398 575 613 563 410 587 625 575 (12) (12) (12) (12) Tax on profit ( 113 ) ( 184 ) ( 170 ) ( 146 ) ( 116 ) ( 188 ) (174) (149) 4 4 4 4 P r o f i t f r o m c on t i nu i n g op e r a t i on s 28 6 39 1 44 3 417 N e t p r o f i t f r o m d is con t i nu e d op e r a t i on s — — — — 29 4 39 9 45 2 425 — — — — ( 8 ) ( 8 ) ( 8 ) ( 8 ) — — — — Consolidated profit 286 391 443 417 Non - controlling interests — — — — Underlying attributable profit to the parent 286 391 443 417 294 399 452 425 — — — — 294 399 452 425 (8) (8) (8) (8) — — — — (8) (8) (8) (8) NEW (pro forma) PREVIOUS DIFFERENCES M a r - 2 1 J un - 2 1 Se p - 2 1 Di c - 2 1 M a r - 2 1 J un - 2 1 Se p - 2 1 Di c - 2 1 M a r - 2 1 J un - 2 1 Se p - 2 1 Di c - 2 1 Balance sheet Loans and advances to customers 261,943 261,139 261,841 261,414 261,943 261,139 261,841 261,414 — — — — Cash, central banks and credit institutions 66,090 62,751 60,317 72,499 66 , 09 0 62 , 75 1 60 , 31 7 72 , 49 9 — — — — Debt instruments 9,230 8,292 8,032 7,832 9 , 23 0 8 , 29 2 8 , 03 2 7 , 83 2 — — — — Other financial assets 796 913 541 389 79 6 91 3 54 1 389 — — — — Other asset accounts 6,786 7,517 6,163 5,667 6 , 78 6 7 , 51 7 6 , 16 3 5 , 66 7 — — — — Total assets 344,844 340,612 336,894 347,801 344,844 340,612 336,894 347,801 — — — — Customer deposits 241 , 48 3 243 , 61 7 242,678 242 , 73 9 241 , 48 3 243,617 242 , 67 8 242 , 73 9 — — — — Central banks and credit institutions 28 , 99 0 30 , 62 0 30,725 44 , 11 9 28 , 98 1 30,603 30 , 69 9 44 , 08 6 8 17 25 34 Marketable debt securities 52 , 63 2 44 , 50 7 41,830 40 , 79 6 52 , 63 2 44,507 41 , 83 0 40 , 79 6 — — — — Other financial liabilities 3 , 15 6 2 , 69 1 2,895 2 , 55 8 3 , 15 6 2,691 2 , 89 5 2 , 55 8 — — — — Other liabilities accounts 3,731 3,696 3,213 2,442 3 , 73 1 3 , 69 6 3 , 21 3 2 , 44 2 — — — — Total liabilities 329,992 325,131 321,339 332,654 329,983 325,114 321,314 332,620 8 1 7 2 5 34 Total equity 14,852 15,481 15,555 15,147 14 , 86 1 15 , 49 8 15 , 58 0 15 , 18 1 ( 8 ) ( 17 ) ( 25 ) ( 34 ) Memorandum items: Gross loans and advances to customers ** 244,338 242,616 243,757 247,775 244,338 242,616 243,757 247,775 — — — — Customer funds 235,469 235,803 234,041 237,780 235,469 235,803 234,041 237,780 — — — — Customer deposits *** 227,119 227,212 225,411 228,790 227,119 227,212 225,411 228,790 8,35 0 8,59 1 8,63 0 8,99 1 — — — — M u t u a l f und s 8,35 0 8,59 1 8,63 0 8,99 1 (*). - Includes exchange differences. (**). - Excluding reverse repos. (***). - Excluding repos. — — — — 13
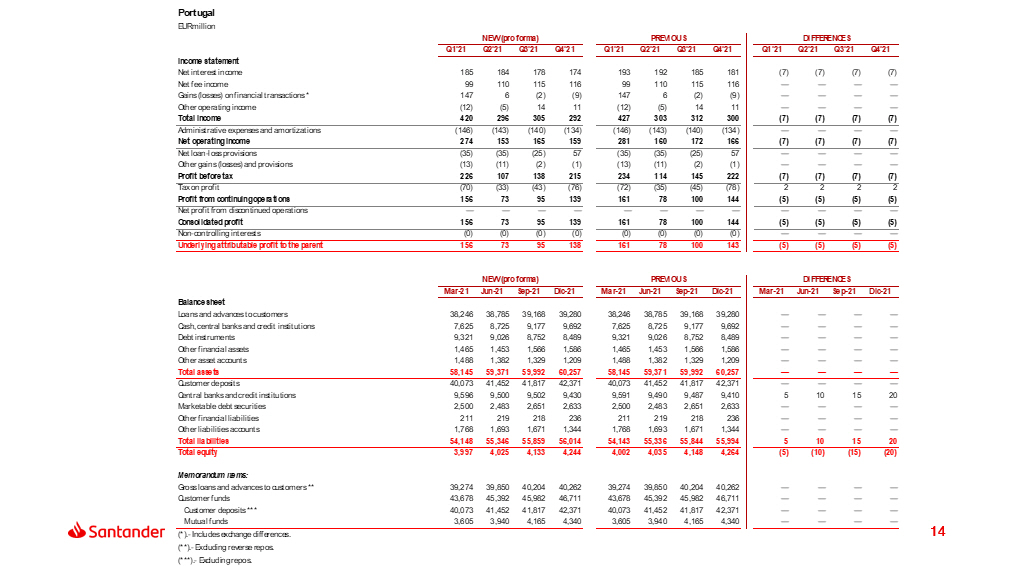
Portugal EUR million NEW (pro forma) Q1'21 Q2'21 Q3'21 Q4'21 PREVIOUS Q1'21 Q2'21 Q3'21 Q4'21 DIFFERENCES Q1'21 Q2'21 Q3'21 Q4'21 Income statement Net interest income 185 184 178 174 193 192 185 181 ( 7 ) ( 7 ) (7) ( 7 ) Net fee income 99 110 115 116 99 110 115 116 — — — — Gains (losses) on financial transactions * 147 6 ( 2 ) ( 9 ) 147 6 (2) ( 9 ) — — — — Other operating income ( 12 ) ( 5 ) 14 11 ( 12 ) ( 5 ) 14 11 — — — — T o t a l i n c o m e 42 0 29 6 30 5 292 A d m i n is t r a t i v e e x p e n s e s a n d a m o r t i z a t i on s ( 1 46) ( 1 43) ( 1 40) ( 1 34) 42 7 30 3 31 2 300 ( 1 46) ( 1 43) ( 1 40) ( 1 34) ( 7 ) ( 7 ) ( 7 ) ( 7 ) — — — — Net operating income 274 153 165 159 281 160 172 166 (7) (7) (7) (7) Net loan - loss provisions ( 35 ) (35) (25) 57 ( 35 ) (35) (25) 57 — — — — Other gains (losses) and provisions ( 13 ) (11) (2) ( 1 ) ( 13 ) (11) (2) ( 1 ) — — — — Profit before tax 226 107 138 215 234 114 145 222 (7) (7) (7) (7) Tax on profit ( 70 ) (33) (43) ( 76 ) ( 72 ) (35) (45) ( 78 ) 2 2 2 2 P r o f i t f r o m c on t i nu i n g op e r a t i on s 15 6 7 3 9 5 139 N e t p r o f i t f r o m d is con t i nu e d op e r a t i on s — — — — 16 1 7 8 10 0 144 — — — — ( 5 ) ( 5 ) ( 5 ) ( 5 ) — — — — Consolidated profit 156 73 95 139 161 78 100 144 (5) (5) (5) (5) Non - controlling interests (0) (0) (0) (0) (0) (0) (0) (0) — — — — Underlying attributable profit to the parent 156 73 95 138 161 78 100 143 (5) (5) (5) (5) NEW (pro forma) PREVIOUS DIFFERENCES Mar - 21 Jun - 21 Sep - 21 Dic - 21 Mar - 21 Jun - 21 Sep - 21 Dic - 21 Mar - 21 Jun - 21 Sep - 21 Dic - 21 Balance sheet Loans and advances to customers 38 , 24 6 38 , 78 5 39 , 16 8 39 , 28 0 38 , 24 6 38,785 39 , 16 8 39 , 28 0 — — — — Cash, central banks and credit institutions 7 , 62 5 8 , 72 5 9 , 17 7 9 , 69 2 7 , 62 5 8,725 9 , 17 7 9 , 69 2 — — — — Debt instruments 9 , 32 1 9 , 02 6 8 , 75 2 8 , 48 9 9 , 32 1 9,026 8 , 75 2 8 , 48 9 — — — — Other financial assets 1 , 46 5 1 , 45 3 1 , 56 6 1 , 58 6 1 , 46 5 1,453 1 , 56 6 1 , 58 6 — — — — Other asset accounts 1,488 1,382 1,329 1,209 1,488 1,382 1,329 1,209 — — — — Total assets 58,145 59,371 59,992 60,257 58,145 59,371 59,992 60,257 — — — — Customer deposits 40 , 07 3 41 , 45 2 41 , 81 7 42 , 37 1 40 , 07 3 41,452 41 , 81 7 42 , 37 1 — — — — Central banks and credit institutions 9 , 59 6 9 , 50 0 9 , 50 2 9 , 43 0 9 , 59 1 9,490 9 , 48 7 9 , 41 0 5 10 15 20 Marketable debt securities 2 , 50 0 2 , 48 3 2 , 65 1 2 , 63 3 2 , 50 0 2,483 2 , 65 1 2 , 63 3 — — — — Other financial liabilities 211 219 218 236 211 219 218 236 — — — — Other liabilities accounts 1,768 1,693 1,671 1,344 1,768 1,693 1,671 1,344 — — — — Total liabilities 54,148 55,346 55,859 56,014 54,143 55,336 55,844 55,994 5 1 0 1 5 20 Total equity 3,997 4,025 4,133 4,244 4,002 4,035 4,148 4,264 ( 5 ) ( 10 ) ( 15 ) ( 20 ) Memorandum items: Gross loans and advances to customers ** 39 , 27 4 39,850 40,204 40,262 39 , 27 4 39,850 40,204 40,262 — — — — Customer funds 43 , 67 8 45,392 45,982 46,711 43 , 67 8 45,392 45,982 46,711 — — — — Customer deposits *** 40,07 3 41,45 2 41,81 7 42,37 1 40,07 3 41,45 2 41,81 7 42,37 1 — — — — M u t u a l f und s 3,60 5 3,94 0 4,16 5 4,34 0 (*). - Includes exchange differences. (**). - Excluding reverse repos. (***). - Excluding repos. 3,60 5 3,94 0 4,16 5 4,34 0 — — — — 14

Poland EUR million NEW (pro forma) Q1'21 Q2'21 Q3'21 Q4'21 PREVIOUS Q1'21 Q2'21 Q3'21 Q4'21 DIFFERENCES Q1'21 Q2'21 Q3'21 Q4'21 Income statement Net interest income 233 242 244 302 240 250 251 309 ( 7 ) ( 7 ) (7) ( 7 ) Net fee income 127 126 133 132 127 126 133 132 — — — — Gains (losses) on financial transactions * 20 21 22 14 20 21 22 14 — — — — Other operating income ( 30 ) 20 ( 1 ) 12 ( 30 ) 20 (1) 12 — — — — T o t a l i n c o m e 34 9 41 0 39 8 460 A d m i n is t r a t i v e e x p e n s e s a n d a m o r t i z a t i on s ( 1 58) ( 1 63) ( 1 62) ( 1 79) 35 7 41 7 40 5 467 ( 1 58) ( 1 63) ( 1 62) ( 1 79) ( 7 ) ( 7 ) ( 7 ) ( 7 ) — — — — Net operating income 191 247 236 281 199 254 243 288 (7) (7) (7) (7) Net loan - loss provisions ( 68 ) ( 45 ) ( 47 ) ( 39 ) ( 68 ) ( 45 ) ( 47 ) ( 39 ) — — — — Other gains (losses) and provisions ( 72 ) ( 126 ) ( 56 ) ( 150 ) ( 72 ) ( 126 ) ( 56 ) ( 150 ) — — — — Profit before tax 51 76 133 91 58 83 140 99 (7) (7) (7) (7) Tax on profit ( 30 ) ( 32 ) ( 35 ) ( 44 ) ( 33 ) ( 34 ) ( 37 ) ( 46 ) 2 2 2 2 Profit from continuing operations 20 44 97 48 26 49 103 53 (5) (5) (5) (5) Net profit from discontinued operations — — — — — — — — — — — — Consolidated profit 20 44 97 48 26 49 103 53 (5) (5) (5) (5) Non - controlling interests (5) (15) (32) (17) (5) (15) (32) (17) — — — — Underlying attributable profit to the parent 15 29 65 31 21 34 70 36 (5) (5) (5) (5) NEW (pro forma) PREVIOUS DIFFERENCES Mar - 21 Jun - 21 Sep - 21 Dic - 21 Mar - 21 Jun - 21 Sep - 21 Dic - 21 Mar - 21 Jun - 21 Sep - 21 Dic - 21 Balance sheet Loans and advances to customers 28 , 19 9 28 , 89 1 28 , 92 5 29 , 81 7 28 , 19 9 28,891 28 , 92 5 29 , 81 7 — — — — Cash, central banks and credit institutions 3 , 71 4 1 , 88 9 1 , 74 6 2 , 96 8 3 , 71 4 1,889 1 , 74 6 2 , 96 8 — — — — Debt instruments 14 , 12 5 15 , 17 1 14 , 59 5 15 , 08 2 14 , 12 5 15,171 14 , 59 5 15 , 08 2 — — — — Other financial assets 994 778 824 503 994 778 824 503 — — — — Other asset accounts 1,320 1,287 1,277 1,419 1,320 1,287 1,277 1,419 — — — — Total assets 48,351 48,016 47,367 49,788 48,351 48,016 47,367 49,788 — — — — Customer deposits 36 , 26 6 36 , 01 5 36 , 24 7 37 , 91 9 36 , 26 6 36,015 36 , 24 7 37 , 91 9 — — — — Central banks and credit institutions 2 , 60 2 2 , 28 6 2 , 02 3 3 , 33 2 2 , 59 7 2,276 2 , 00 8 3 , 31 2 5 10 15 20 Marketable debt securities 2 , 31 5 2 , 46 4 1 , 94 4 1 , 61 8 2 , 31 5 2,464 1 , 94 4 1 , 61 8 — — — — Other financial liabilities 927 844 885 692 927 844 885 692 — — — — Other liabilities accounts 1,180 1,240 1,210 1,529 1,180 1,240 1,210 1,529 — — — — Total liabilities 43,290 42,849 42,309 45,091 43,285 42,839 42,293 45,071 5 1 0 1 5 20 Total equity 5,061 5,167 5,058 4,697 5,066 5,177 5,074 4,717 ( 5 ) ( 10 ) ( 15 ) ( 20 ) Memorandum items: Gross loans and advances to customers ** 29 , 23 5 29,884 29,955 30,657 29 , 23 5 29,884 29,955 30,657 — — — — Customer funds 40 , 65 4 40,764 41,042 42,325 40 , 65 4 40,764 41,042 42,325 — — — — Customer deposits *** 36,26 6 36,01 5 36,24 7 37,91 9 36,26 6 36,01 5 36,24 7 37,91 9 — — — — M u t u a l f und s 4,38 7 4,74 9 4,79 5 4,40 6 (*). - Includes exchange differences. (**). - Excluding reverse repos. (***). - Excluding repos. 4,38 7 4,74 9 4,79 5 4,40 6 — — — — 15

Other Europe EUR million NEW (pro forma) Q1'21 Q2'21 Q3'21 Q4'21 PREVIOUS Q1'21 Q2'21 Q3'21 Q4'21 DIFFERENCES Q1'21 Q2'21 Q3'21 Q4'21 Income statement Net interest income 71 76 75 61 192 195 165 174 ( 122 ) ( 119 ) ( 91 ) ( 112 ) Net fee income 41 38 39 44 138 115 101 117 ( 97 ) ( 77 ) ( 62 ) ( 72 ) Gains (losses) on financial transactions * 18 2 ( 3 ) 2 96 (62) ( 33 ) ( 10 ) ( 78 ) 64 29 12 Other operating income ( 12 ) ( 5 ) 2 ( 8 ) 43 70 74 80 ( 55 ) ( 75 ) ( 71 ) ( 89 ) T o t a l i n c o m e 11 9 11 1 11 3 99 46 9 31 8 30 7 361 ( 351 ) ( 207 ) ( 195 ) ( 261 ) Administrative expenses and amortizations ( 101 ) (106) (125) (118) (249) (267) (290) (356) 148 161 165 237 Ne t op e r a t i n g i n c o m e 1 8 5 ( 13 ) ( 19 ) 22 1 5 1 1 7 5 ( 203 ) ( 46 ) ( 30 ) ( 24 ) Net loan - loss provisions ( 3 ) (1) 1 21 ( 26 ) ( 121 ) ( 153 ) ( 169 ) 23 120 154 190 Other gains (losses) and provisions ( 2 ) 1 0 ( 24 ) ( 6 ) 2 ( 0 ) ( 9 ) 3 ( 1 ) — ( 14 ) P r o f i t b e f o r e t a x 1 3 5 ( 11 ) ( 22 ) 18 9 ( 67 ) ( 136 ) ( 173 ) ( 176 ) 7 2 12 5 152 Tax on profit ( 6 ) (1) 14 (8) (84) 9 41 30 78 (10) (27) (38) Profit from continuing operations 7 4 3 (30) 106 (58) (95) (143) (98) 62 99 113 Net profit from discontinued operations — — — — — — 0 (0) — — — — Consolidated profit 7 4 3 (30) 106 (58) (95) (143) (98) 62 99 113 Non - controlling interests 3 (3) 0 (1) 3 (2) 1 (2) — (1) (1) 2 Underlying attributable profit to the parent 10 1 3 (31) 108 (60) (94) (146) (98) 61 98 115 NEW (pro forma) PREVIOUS DIFFERENCES Mar - 21 Jun - 21 Sep - 21 Dec - 21 Mar - 21 Jun - 21 Sep - 21 Dec - 21 Mar - 21 Jun - 21 Sep - 21 Dec - 21 Balance sheet Loans and advances to customers 11 , 83 0 12 , 90 2 12 , 27 1 11 , 88 9 62 , 58 4 63 , 27 3 67,760 65,058 (50,754) (50,371) (55,489) (53,169) Cash, central banks and credit institutions 6 , 42 2 6 , 03 4 4 , 13 2 3 , 22 4 42 , 70 6 41 , 82 8 43,060 29,234 (36,283) (35,794) (38,928) (26,010) Debt instruments 6 , 44 9 6 , 18 2 5 , 65 3 5 , 62 0 25 , 22 4 26 , 11 9 23,514 21,748 (18,775) (19,937) (17,861) (16,128) Other financial assets ( 16 ) 316 139 219 42 , 06 8 43 , 75 5 42,937 32,222 (42,083) (43,440) (42,797) (32,004) Other asset accounts 3,067 2,792 2,883 2,821 4,296 4,870 3,995 3,785 (1,229) (2,078) (1,112) (965) Total assets 27,752 28,225 25,078 23,773 176,877 179,845 181,266 152,049 (149,125) (151,620) (156,188) (128,276) Customer deposits 3 , 04 6 3 , 18 4 3 , 51 6 4 , 20 4 29 , 77 4 25 , 07 8 30,709 31,452 ( 26 , 728 ) (21,894) (27,193) (27,248) Central banks and credit institutions 21 , 61 7 21 , 69 7 18 , 15 7 16 , 14 8 97 , 91 4 104 , 64 4 101,922 83,644 ( 76 , 297 ) (82,947) (83,765) (67,496) Marketable debt securities — 0 0 — 3 , 43 1 2 , 90 5 3,203 3,154 ( 3 , 431 ) (2,905) (3,203) (3,154) Other financial liabilities 884 1 , 21 8 1 , 23 1 1 , 22 6 38 , 92 1 40 , 31 3 38,440 27,283 ( 38 , 037 ) (39,095) (37,209) (26,057) Other liabilities accounts 476 407 408 417 1,641 1,489 1,069 1,468 ( 1 , 165 ) ( 1 , 082 ) ( 661 ) ( 1 , 051 ) Total liabilities 26,023 26,506 23,311 21,995 171,682 174,429 175,343 147,000 (145,659) (147,923) (152,031) (125,006) Total equity 1,729 1,719 1,767 1,778 5,195 5,416 5,923 5,048 ( 3 , 466 ) ( 3 , 696 ) ( 4 , 156 ) ( 3 , 270 ) Memorandum items: G r o s s l o a n s a n d a d v a n c e s t o c us t om er s ** 11 , 84 5 12,916 12,284 11,903 48 , 17 3 50,818 53,754 55,740 (36,327) (37,901) (41,470) (43,837) C us t om e r fun d s 12 , 39 5 12,180 13,196 14,055 32 , 46 0 29,949 37,959 39,684 (20,065) (17,770) (24,763) (25,629) C us t om e r d e p o s i t s *** 2 , 87 0 3,010 3,341 4,026 22 , 93 5 20,779 28,104 29,655 (20,065) (17,770) (24,763) (25,629) M u t u a l f und s 9,52 6 9,17 0 9,85 5 10,02 9 (*). - Includes exchange differences. (**). - Excluding reverse repos. (***). - Excluding repos. 9,52 6 9,17 0 9,85 5 10,02 9 — — — — 16

North America EUR million NEW (pro forma) Q1'21 Q2'21 Q3'21 Q4'21 PREVIOUS Q1'21 Q2'21 Q3'21 Q4'21 DIFFERENCES Q1'21 Q2'21 Q3'21 Q4'21 Income statement Net interest income 1 , 97 1 1 , 97 7 2 , 03 7 2,086 2 , 00 5 2 , 01 0 2 , 07 0 2 , 11 9 ( 33 ) ( 33 ) ( 33 ) ( 33 ) Net fee income 451 410 386 397 451 410 386 397 — — — — Gains (losses) on financial transactions * 98 32 70 24 98 32 70 24 — — — — Other operating income 215 267 252 180 215 267 252 180 — — — — T o t a l i n c o m e 2 , 73 5 2 , 68 6 2 , 74 5 2 , 68 7 Administrative expenses and amortizations (1,149) (1,194) (1,275) (1,349) 2 , 76 8 2 , 71 9 2 , 77 9 2 , 72 0 (1,149) (1,194) (1,275) (1,349) ( 33 ) ( 33 ) ( 33 ) ( 33 ) — — — — Net operating income 1,587 1,492 1,471 1,337 1,620 1,525 1,504 1,371 (33) (33) (33) (33) Net loan - loss provisions ( 393 ) ( 195 ) (506) ( 115 ) ( 393 ) ( 195 ) (506) (115) — — — — Other gains (losses) and provisions ( 20 ) 8 (38) ( 96 ) ( 20 ) 8 (38) (96) — — — — Profit before tax 1,174 1,305 926 1,127 1,207 1,338 959 1,160 (33) (33) (33) (33) Tax on profit ( 287 ) ( 314 ) (177) ( 237 ) ( 297 ) ( 324 ) (187) (247) 10 10 10 10 P r o f i t f r o m c on t i nu i n g op e r a t i on s 88 7 99 0 74 9 889 N e t p r o f i t f r o m d is con t i nu e d op e r a t i on s — — — — 91 0 1 , 01 4 77 2 913 — — — — ( 23 ) ( 23 ) ( 23 ) ( 23 ) — — — — Consolidated profit 887 990 749 889 91 0 1 , 01 4 77 2 913 ( 23 ) ( 23 ) ( 23 ) ( 23 ) Non - controlling interests (137) (159) (112) (148) ( 137 ) ( 159 ) ( 112 ) ( 148 ) — — — — Underlying attributable profit to the parent 750 831 637 741 77 3 85 4 66 1 765 ( 23 ) ( 23 ) ( 23 ) ( 23 ) NEW (pro forma) PREVIOUS DIFFERENCES M a r - 2 1 J un - 2 1 Se p - 2 1 Di c - 2 1 M a r - 2 1 J un - 2 1 Se p - 2 1 Di c - 2 1 M a r - 2 1 J un - 2 1 Se p - 2 1 Di c - 2 1 Balance sheet Loans and advances to customers 122,702 126,360 128,339 137,428 122,702 126,360 128,339 137,428 — — — — Cash, central banks and credit institutions 31,414 37,075 37,244 34,857 31 , 41 4 37 , 07 5 37 , 24 4 34 , 85 7 — — — — Debt instruments 38,692 35,512 37,367 38,500 38 , 69 2 35 , 51 2 37 , 36 7 38 , 50 0 — — — — Other financial assets 12,075 10,863 10,919 12,555 12 , 07 5 10 , 86 3 10 , 91 9 12 , 55 5 — — — — Other asset accounts 21,733 20,952 21,040 21,394 21 , 73 3 20 , 95 2 21 , 04 0 21 , 39 4 — — — — Total assets 226,617 230,762 234,911 244,734 226,617 230,762 234,911 244,734 — — — — Customer deposits 120 , 09 0 115,106 122,906 121 , 98 9 120 , 09 0 115,106 122,906 121 , 98 9 — — — — Central banks and credit institutions 22 , 96 5 30,684 25,406 35 , 15 2 22 , 94 2 30,638 25,336 35 , 05 9 23 47 70 93 Marketable debt securities 38 , 18 9 38,288 40,025 38 , 06 1 38 , 18 9 38,288 40,025 38 , 06 1 — — — — Other financial liabilities 13 , 76 2 14,205 13,249 14 , 65 2 13 , 76 2 14,205 13,249 14 , 65 2 — — — — Other liabilities accounts 5,881 6,014 6,059 6,194 5 , 88 1 6 , 01 4 6 , 05 9 6 , 19 4 — — — — Total liabilities 200,886 204,297 207,645 216,048 200,863 204,250 207,575 215,955 2 3 4 7 7 0 93 Total equity 25,731 26,465 27,265 28,686 25 , 75 4 26 , 51 2 27 , 33 5 28 , 77 9 ( 23 ) ( 47 ) ( 70 ) ( 93 ) Memorandum items: Gross loans and advances to customers ** 122,862 125,635 127,113 134,090 122,862 125,635 127,113 134,090 — — — — Customer funds 127,263 130,087 133,978 137,206 127,263 130,087 133,978 137,206 — — — — Customer deposits *** 104,581 105,171 108,528 111,004 104,581 105,171 108,528 111,004 22,68 3 24,91 6 25,45 0 26,20 2 — — — — M u t u a l f und s 22,68 3 24,91 6 25,45 0 26,20 2 (*). - Includes exchange differences. (**). - Excluding reverse repos. (***). - Excluding repos. — — — — 17

United States EUR million NEW (pro forma) Q1'21 Q2'21 Q3'21 Q4'21 PREVIOUS Q1'21 Q2'21 Q3'21 Q4'21 DIFFERENCES Q1'21 Q2'21 Q3'21 Q4'21 Income statement Net interest income 1 , 31 0 1,300 1 , 33 2 1 , 35 6 1 , 33 7 1 , 32 6 1,359 1 , 38 3 ( 27 ) (27) (27) ( 27 ) Net fee income 241 191 174 176 241 191 174 176 — — — — Gains (losses) on financial transactions * 70 20 34 28 70 20 34 28 — — — — Other operating income 254 298 282 211 254 298 282 211 — — — — T o t a l i n c o m e 1 , 87 5 1 , 80 9 1 , 82 2 1 , 77 1 A d m i n is t r a t i v e e x p e n s e s a n d a m o r t i z a t i on s ( 7 48) ( 7 83) ( 8 15) ( 8 50) 1 , 90 2 1 , 83 5 1 , 84 9 1 , 79 7 ( 7 48) ( 7 83) ( 8 15) ( 8 50) ( 27 ) ( 27 ) ( 27 ) ( 27 ) — — — — Net operating income 1,127 1,025 1,007 920 1,154 1,052 1,034 947 (27) (27) (27) (27) Net loan - loss provisions ( 165 ) 9 ( 294 ) 31 ( 165 ) 9 ( 294 ) 31 — — — — Other gains (losses) and provisions ( 15 ) 15 ( 6 ) ( 110 ) ( 15 ) 15 ( 6 ) ( 110 ) — — — — Profit before tax 947 1,049 708 841 974 1,076 734 868 (27) (27) (27) (27) Tax on profit ( 227 ) ( 251 ) ( 133 ) ( 189 ) ( 235 ) ( 259 ) ( 141 ) ( 197 ) 8 8 8 8 P r o f i t f r o m c on t i nu i n g op e r a t i on s 72 0 79 9 57 5 652 N e t p r o f i t f r o m d is con t i nu e d op e r a t i on s — — — — 73 9 81 7 59 3 671 — — — — ( 19 ) ( 19 ) ( 19 ) ( 19 ) — — — — Consolidated profit 720 799 575 652 739 817 593 671 (19) (19) (19) (19) Non - controlling interests (122) (143) (96) (133) (122) (143) (96) (133) — — — — Underlying attributable profit to the parent 598 655 479 519 616 674 498 538 (19) (19) (19) (19) NEW (pro forma) PREVIOUS DIFFERENCES Mar - 21 Jun - 21 Sep - 21 Dic - 21 Mar - 21 Jun - 21 Sep - 21 Dic - 21 Mar - 21 Jun - 21 Sep - 21 Dic - 21 Balance sheet Loans and advances to customers 91 , 77 7 93,724 95,953 103,548 91 , 77 7 93,724 95,953 103,548 — — — — Cash, central banks and credit institutions 21 , 21 4 25,444 27,322 24,033 21 , 21 4 25,444 27,322 24,033 — — — — Debt instruments 15 , 15 4 15,922 16,025 16,341 15 , 15 4 15,922 16,025 16,341 — — — — Other financial assets 3 , 58 4 3,576 4,039 4,258 3 , 58 4 3,576 4,039 4,258 — — — — Other asset accounts 17,861 17,257 17,458 17,638 17,861 17,257 17,458 17,638 — — — — Total assets 149,590 155,923 160,798 165,819 149,590 155,923 160,798 165,819 — — — — Customer deposits 83 , 63 3 79,384 87,316 83,159 83 , 63 3 79,384 87,316 83,159 — — — — Central banks and credit institutions 8 , 60 2 17,401 11,731 21,926 8 , 58 3 17,363 11,675 21,851 19 37 56 75 Marketable debt securities 31 , 54 1 32,123 33,838 31,482 31 , 54 1 32,123 33,838 31,482 — — — — Other financial liabilities 3 , 68 1 3,898 4,058 4,038 3 , 68 1 3,898 4,058 4,038 — — — — Other liabilities accounts 3,475 3,880 3,938 4,140 3,475 3,880 3,938 4,140 — — — — Total liabilities 130,931 136,685 140,881 144,745 130,913 136,648 140,825 144,670 1 9 3 7 5 6 75 Total equity 18,658 19,237 19,917 21,074 18,677 19,275 19,973 21,149 ( 19 ) ( 37 ) ( 56 ) ( 75 ) Memorandum items: Gross loans and advances to customers ** 91 , 40 8 93,519 95,318 99,731 91 , 40 8 93,519 95,318 99,731 — — — — Customer funds 85 , 51 2 87,206 90,837 91,865 85 , 51 2 87,206 90,837 91,865 — — — — Customer deposits *** 74,10 7 74,05 8 77,14 1 77,77 5 74,10 7 74,05 8 77,14 1 77,77 5 — — — — M u t u a l f und s 11,40 5 13,14 8 13,69 6 14,09 0 (*). - Includes exchange differences. (**). - Excluding reverse repos. (***). - Excluding repos. 11,40 5 13,14 8 13,69 6 14,09 0 — — — — 18

Mexico EUR million NEW (pro forma) Q1'21 Q2'21 Q3'21 Q4'21 PREVIOUS Q1'21 Q2'21 Q3'21 Q4'21 DIFFERENCES Q1'21 Q2'21 Q3'21 Q4'21 Income statement Net interest income 661 678 705 730 667 684 711 736 ( 7 ) (7) (7) ( 7 ) Net fee income 204 210 203 211 204 210 203 211 — — — — Gains (losses) on financial transactions * 28 12 37 ( 4 ) 28 12 37 ( 4 ) — — — — Other operating income ( 34 ) ( 28 ) (31) ( 26 ) ( 34 ) (28) ( 31 ) ( 26 ) — — — — T o t a l i n c o m e 85 8 87 2 91 3 910 A d m i n is t r a t i v e e x p e n s e s a n d a m o r t i z a t i on s ( 3 73) ( 3 79) ( 4 25) ( 4 66) 86 5 87 8 91 9 917 ( 3 73) ( 3 79) ( 4 25) ( 4 66) ( 7 ) ( 7 ) ( 7 ) ( 7 ) — — — — Net operating income 485 493 488 444 492 499 494 451 (7) (7) (7) (7) Net loan - loss provisions ( 228 ) ( 204 ) ( 213 ) (146) ( 228 ) ( 204 ) ( 213 ) ( 146 ) — — — — Other gains (losses) and provisions ( 5 ) ( 6 ) ( 1 ) (6) ( 5 ) ( 6 ) ( 1 ) ( 6 ) — — — — Profit before tax 253 282 274 292 259 289 280 298 (7) (7) (7) (7) Tax on profit ( 61 ) ( 66 ) ( 47 ) (49) ( 63 ) ( 68 ) ( 49 ) ( 51 ) 2 2 2 2 P r o f i t f r o m c on t i nu i n g op e r a t i on s 19 2 21 7 22 7 243 N e t p r o f i t f r o m d is con t i nu e d op e r a t i on s — — — — 19 6 22 1 23 1 247 — — — — ( 5 ) ( 5 ) ( 5 ) ( 5 ) — — — — Consolidated profit 192 217 227 243 196 221 231 247 (5) (5) (5) (5) Non - controlling interests (14) (16) (16) (14) (14) (16) (16) (14) — — — — Underlying attributable profit to the parent 177 200 210 228 182 205 215 233 (5) (5) (5) (5) NEW (pro forma) PREVIOUS DIFFERENCES Mar - 21 Jun - 21 Sep - 21 Dic - 21 Mar - 21 Jun - 21 Sep - 21 Dic - 21 Mar - 21 Jun - 21 Sep - 21 Dic - 21 Balance sheet Loans and advances to customers 30 , 91 0 32,618 32,368 33,860 30 , 91 0 32,618 32,368 33,860 — — — — Cash, central banks and credit institutions 9 , 98 0 11,418 9,682 10,593 9 , 98 0 11,418 9,682 10,593 — — — — Debt instruments 23 , 53 8 19,590 21,343 22,159 23 , 53 8 19,590 21,343 22,159 — — — — Other financial assets 8 , 49 0 7,285 6,880 8,297 8 , 49 0 7,285 6,880 8,297 — — — — Other asset accounts 3,617 3,429 3,300 3,474 3,617 3,429 3,300 3,474 — — — — Total assets 76,535 74,340 73,572 78,383 76,535 74,340 73,572 78,383 — — — — Customer deposits 36 , 44 5 35,712 35,581 38,820 36 , 44 5 35,712 35,581 38,820 — — — — Central banks and credit institutions 14 , 35 8 13,267 13,639 13,201 14 , 35 4 13,258 13,625 13,183 5 9 14 18 Marketable debt securities 6 , 64 8 6,165 6,187 6,579 6 , 64 8 6,165 6,187 6,579 — — — — Other financial liabilities 10 , 05 4 10,260 9,144 10,559 10 , 05 4 10,260 9,144 10,559 — — — — Other liabilities accounts 2,389 2,111 2,077 2,022 2,389 2,111 2,077 2,022 — — — — Total liabilities 69,894 67,516 66,628 71,180 69,890 67,507 66,615 71,162 5 9 1 4 18 Total equity 6,641 6,824 6,943 7,203 6,645 6,834 6,957 7,221 ( 5 ) ( 9 ) ( 14 ) ( 18 ) Memorandum items: Gross loans and advances to customers ** 31 , 43 7 32,097 31,777 34,339 31 , 43 7 32,097 31,777 34,339 — — — — Customer funds 41 , 74 0 42,870 43,132 45,330 41 , 74 0 42,870 43,132 45,330 — — — — Customer deposits *** 30,46 2 31,10 3 31,37 7 33,21 8 30,46 2 31,10 3 31,37 7 33,21 8 — — — — M u t u a l f und s 11,27 8 11,76 7 11,75 4 12,11 2 (*). - Includes exchange differences. (**). - Excluding reverse repos. (***). - Excluding repos. 11,27 8 11,76 7 11,75 4 12,11 2 — — — — 19

Other North America EUR million NEW (pro forma) Q1'21 Q2'21 Q3'21 Q4'21 PREVIOUS Q1'21 Q2'21 Q3'21 Q4'21 DIFFERENCES Q1'21 Q2'21 Q3'21 Q4'21 Income statement Net interest income 0 0 0 0 0 0 0 0 — — — — Net fee income 7 8 9 10 7 8 9 10 — — — — Gains (losses) on financial transactions * 0 ( 0 ) ( 0 ) ( 0 ) 0 ( 0 ) ( 0 ) ( 0 ) — — — — Other operating income ( 5 ) ( 2 ) 1 ( 4 ) ( 5 ) ( 2 ) 1 ( 4 ) — — — — Total income 2 5 10 5 2 5 10 5 — — — — Administrative expenses and amortizations ( 28 ) ( 32 ) ( 35 ) ( 33 ) ( 28 ) ( 32 ) ( 35 ) ( 33 ) — — — — Net operating income (26) (26) (25) (27) (26) (26) (25) (27) — — — — Net loan - loss provisions ( 0 ) ( 0 ) 0 ( 0 ) ( 0 ) ( 0 ) 0 ( 0 ) — — — — Other gains (losses) and provisions ( 0 ) ( 0 ) ( 31 ) 21 ( 0 ) ( 0 ) ( 31 ) 21 — — — — Profit before tax (26) (27) (55) (7) (26) (27) (55) (7) — — — — Tax on profit 1 2 3 1 1 2 3 1 — — — — Profit from continuing operations (25) (25) (52) (5) (25) (25) (52) (5) — — — — Net profit from discontinued operations — — — — — — — — — — — — Consolidated profit (25) (25) (52) (5) (25) (25) (52) (5) — — — — Non - controlling interests 0 0 0 (1) 0 0 0 (1) — — — — Underlying attributable profit to the parent (25) (25) (52) (6) (25) (25) (52) (6) — — — — NEW (pro forma) PREVIOUS DIFFERENCES Mar - 21 Jun - 21 Sep - 21 Dic - 21 Mar - 21 Jun - 21 Sep - 21 Dic - 21 M a r - 2 1 J un - 2 1 Se p - 2 1 Di c - 2 1 Balance sheet Loans and advances to customers 16 18 18 20 16 18 18 20 — — — — Cash, central banks and credit institutions 220 214 240 231 220 214 240 231 — — — — Debt instruments — — — — — — — — — — — — Other financial assets 1 1 1 0 1 1 1 0 — — — — Other asset accounts 255 266 282 282 255 266 282 282 — — — — Total assets 492 499 541 533 492 499 541 533 — — — — Customer deposits 12 10 9 11 12 10 9 11 — — — — Central banks and credit institutions 4 16 36 25 4 16 36 25 — — — — Marketable debt securities — — — — — — — — — — — — Other financial liabilities 27 46 46 54 27 46 46 54 — — — — Other liabilities accounts 17 23 44 32 17 23 44 32 — — — — Total liabilities 61 95 136 123 61 95 136 123 — — — — Total equity 432 404 406 410 432 404 406 410 — — — — Memorandum items: Gross loans and advances to customers ** 17 19 18 20 17 19 18 20 — — — — Customer funds 12 10 9 11 12 10 9 11 — — — — Customer deposits *** 12 10 9 11 12 10 9 11 — — — — Mutual funds — — — — (*). - Includes exchange differences. (**). - Excluding reverse repos. (***). - Excluding repos. — — — — — — — — 20

South America EUR million NEW (pro forma) Q1'21 Q2'21 Q3'21 Q4'21 PREVIOUS Q1'21 Q2'21 Q3'21 Q4'21 DIFFERENCES Q1'21 Q2'21 Q3'21 Q4'21 Income statement Net interest income 2 , 57 0 2,756 2,916 3 , 06 5 2 , 57 5 2,760 2,920 3,069 ( 4 ) (4) (4) ( 4 ) Net fee income 842 928 956 995 842 928 956 995 — — — — Gains (losses) on financial transactions * 205 177 206 127 205 177 206 127 — — — — Other operating income ( 83 ) (92) (92) ( 140 ) ( 83 ) (92) (92) (140) — — — — T o t a l i n c o m e 3 , 53 5 3 , 76 8 3 , 98 7 4 , 04 8 A d m i n is t r a t i v e e x p e n s e s a n d a m o r t i z a t i on s ( 1 ,219) ( 1 ,299) ( 1 ,398) ( 1 ,464) 3 , 53 9 3 , 77 2 3 , 99 1 4 , 05 2 (1,219) (1,299) (1,398) (1,464) ( 4 ) ( 4 ) ( 4 ) ( 4 ) — — — — Net operating income 2,316 2,469 2,589 2,583 2,320 2,473 2,593 2,587 (4) (4) (4) (4) Net loan - loss provisions ( 683 ) ( 809 ) (892) (867) ( 683 ) (809) ( 892 ) (867) — — — — Other gains (losses) and provisions ( 132 ) ( 55 ) (124) (162) ( 132 ) (55) ( 124 ) (162) — — — — Profit before tax 1,500 1,605 1,573 1,554 1,505 1,609 1,577 1,558 (4) (4) (4) (4) Tax on profit ( 598 ) ( 594 ) (612) (556) ( 599 ) (595) ( 613 ) (557) 1 1 1 1 P r o f i t f r o m c on t i nu i n g op e r a t i on s 90 3 1 , 01 1 96 1 998 N e t p r o f i t f r o m d is con t i nu e d op e r a t i on s — — — — 90 5 1 , 01 4 96 4 1 , 00 1 — — — — ( 3 ) ( 3 ) ( 3 ) ( 3 ) — — — — Consolidated profit 903 1,011 961 998 90 5 1 , 01 4 96 4 1 , 00 1 ( 3 ) ( 3 ) ( 3 ) ( 3 ) Non - controlling interests (132) (143) (138) (143) ( 132 ) ( 143 ) ( 138 ) ( 143 ) — — — — Underlying attributable profit to the parent 770 868 823 855 77 3 87 1 82 6 858 ( 3 ) ( 3 ) ( 3 ) ( 3 ) NEW (pro forma) PREVIOUS DIFFERENCES M a r - 2 1 J un - 2 1 Se p - 2 1 Di c - 2 1 M a r - 2 1 J un - 2 1 Se p - 2 1 Di c - 2 1 M a r - 2 1 J un - 2 1 Se p - 2 1 Di c - 2 1 Balance sheet Loans and advances to customers 115,576 124,784 121,133 123,920 115,576 124,784 121,133 123,920 — — — — Cash, central banks and credit institutions 44,049 50,441 47,010 43,134 44 , 04 9 50 , 44 1 47 , 01 0 43 , 13 4 — — — — Debt instruments 48,061 49,949 51,730 51,451 48 , 06 1 49 , 94 9 51 , 73 0 51 , 45 1 — — — — Other financial assets 14,402 12,455 16,326 23,809 14 , 40 2 12 , 45 5 16 , 32 6 23 , 80 9 — — — — Other asset accounts 15,013 16,244 15,777 15,491 15 , 01 3 16 , 24 4 15 , 77 7 15 , 49 1 — — — — Total assets 237,102 253,874 251,976 257,805 237,102 253,874 251,976 257,805 — — — — Customer deposits 111 , 59 2 124,500 121,470 120 , 50 0 111 , 59 2 124,500 121,470 120 , 50 0 — — — — Central banks and credit institutions 45 , 62 4 44,741 45,877 44 , 31 4 45 , 62 1 44,735 45,869 44 , 30 3 3 6 8 11 Marketable debt securities 20 , 97 4 22,965 22,810 23 , 46 1 20 , 97 4 22,965 22,810 23 , 46 1 — — — — Other financial liabilities 31 , 51 9 31,731 33,881 40 , 49 0 31 , 51 9 31,731 33,881 40 , 49 0 — — — — Other liabilities accounts 7,520 9,148 8,066 8,610 7 , 52 0 9 , 14 8 8 , 06 6 8 , 61 0 — — — — Total liabilities 217,229 233,086 232,104 237,375 217,226 233,080 232,096 237,364 3 6 8 11 Total equity 19,874 20,788 19,872 20,430 19 , 87 6 20 , 79 4 19 , 88 1 20 , 44 1 ( 3 ) ( 6 ) ( 8 ) ( 11 ) Memorandum items: Gross loans and advances to customers ** 120,478 130,052 126,335 128,916 120,478 130,052 126,335 128,916 — — — — Customer funds 150,343 168,336 162,588 162,212 150,343 168,336 162,588 162,212 — — — — Customer deposits *** 103,135 115,589 111,092 110,875 103,135 115,589 111,092 110,875 47,20 8 52,74 7 51,49 6 51,33 7 — — — — M u t u a l f und s 47,20 8 52,74 7 51,49 6 51,33 7 (*). - Includes exchange differences. (**). - Excluding reverse repos. (***). - Excluding repos. — — — — 21
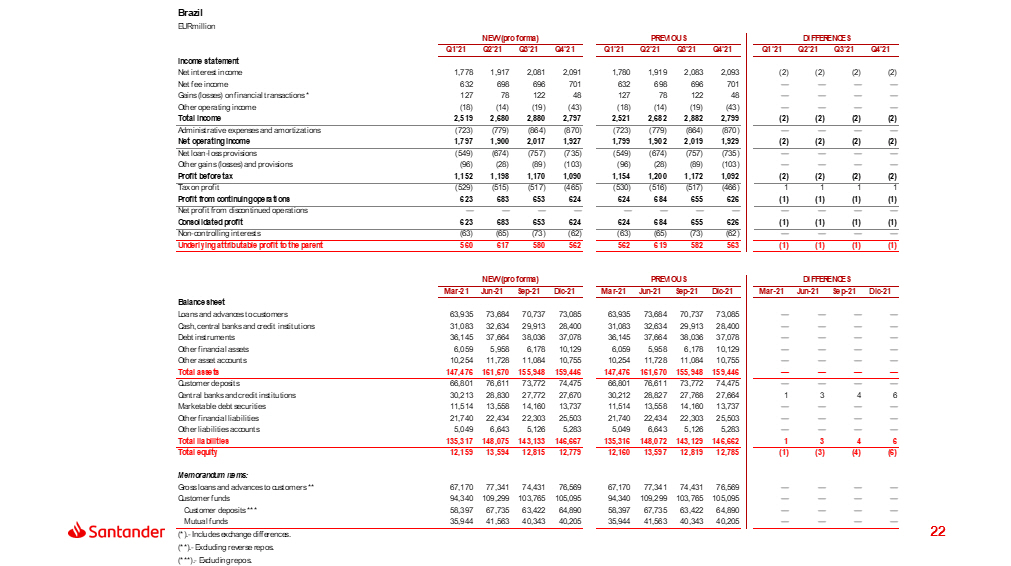
Brazil EUR million NEW (pro forma) Q1'21 Q2'21 Q3'21 Q4'21 PREVIOUS Q1'21 Q2'21 Q3'21 Q4'21 DIFFERENCES Q1'21 Q2'21 Q3'21 Q4'21 Income statement Net interest income 1 , 77 8 1 , 91 7 2 , 08 1 2 , 09 1 1 , 78 0 1 , 91 9 2 , 08 3 2 , 09 3 ( 2 ) ( 2 ) (2) ( 2 ) Net fee income 632 698 696 701 632 698 696 701 — — — — Gains (losses) on financial transactions * 127 78 122 48 127 78 122 48 — — — — Other operating income ( 18 ) ( 14 ) ( 19 ) ( 43 ) ( 18 ) ( 14 ) ( 19 ) ( 43 ) — — — — T o t a l i n c o m e 2 , 51 9 2 , 68 0 2 , 88 0 2 , 79 7 A d m i n is t r a t i v e e x p e n s e s a n d a m o r t i z a t i on s ( 7 23) ( 7 79) ( 8 64) ( 8 70) 2 , 52 1 2 , 68 2 2 , 88 2 2 , 79 9 ( 7 23) ( 7 79) ( 8 64) ( 8 70) ( 2 ) ( 2 ) ( 2 ) ( 2 ) — — — — Net operating income 1,797 1,900 2,017 1,927 1,799 1,902 2,019 1,929 (2) (2) (2) (2) Net loan - loss provisions ( 549 ) (674) (757) (735) ( 549 ) ( 674 ) (757) ( 735 ) — — — — Other gains (losses) and provisions ( 96 ) (28) (89) (103) ( 96 ) ( 28 ) (89) ( 103 ) — — — — Profit before tax 1,152 1,198 1,170 1,090 1,154 1,200 1,172 1,092 (2) (2) (2) (2) Tax on profit ( 529 ) (515) (517) (465) ( 530 ) ( 516 ) (517) ( 466 ) 1 1 1 1 P r o f i t f r o m c on t i nu i n g op e r a t i on s 62 3 68 3 65 3 624 N e t p r o f i t f r o m d is con t i nu e d op e r a t i on s — — — — 62 4 68 4 65 5 626 — — — — ( 1 ) ( 1 ) ( 1 ) ( 1 ) — — — — Consolidated profit 623 683 653 624 624 684 655 626 (1) (1) (1) (1) Non - controlling interests (63) (65) (73) (62) (63) (65) (73) (62) — — — — Underlying attributable profit to the parent 560 617 580 562 562 619 582 563 (1) (1) (1) (1) NEW (pro forma) PREVIOUS DIFFERENCES Mar - 21 Jun - 21 Sep - 21 Dic - 21 Mar - 21 Jun - 21 Sep - 21 Dic - 21 Mar - 21 Jun - 21 Sep - 21 Dic - 21 Balance sheet Loans and advances to customers 63 , 93 5 73,684 70,737 73,085 63 , 93 5 73,684 70,737 73,085 — — — — Cash, central banks and credit institutions 31 , 08 3 32,634 29,913 28,400 31 , 08 3 32,634 29,913 28,400 — — — — Debt instruments 36 , 14 5 37,664 38,036 37,078 36 , 14 5 37,664 38,036 37,078 — — — — Other financial assets 6 , 05 9 5,958 6,178 10,129 6 , 05 9 5,958 6,178 10,129 — — — — Other asset accounts 10,254 11,728 11,084 10,755 10,254 11,728 11,084 10,755 — — — — Total assets 147,476 161,670 155,948 159,446 147,476 161,670 155,948 159,446 — — — — Customer deposits 66 , 80 1 76,611 73,772 74,475 66 , 80 1 76,611 73,772 74,475 — — — — Central banks and credit institutions 30 , 21 3 28,830 27,772 27,670 30 , 21 2 28,827 27,768 27,664 1 3 4 6 Marketable debt securities 11 , 51 4 13,558 14,160 13,737 11 , 51 4 13,558 14,160 13,737 — — — — Other financial liabilities 21 , 74 0 22,434 22,303 25,503 21 , 74 0 22,434 22,303 25,503 — — — — Other liabilities accounts 5,049 6,643 5,126 5,283 5 , 04 9 6 , 64 3 5 , 12 6 5 , 28 3 — — — — Total liabilities 135,317 148,075 143,133 146,667 135,316 148,072 143,129 146,662 1 3 4 6 Total equity 12,159 13,594 12,815 12,779 12 , 16 0 13 , 59 7 12 , 81 9 12 , 78 5 ( 1 ) ( 3 ) ( 4 ) ( 6 ) Memorandum items: Gross loans and advances to customers ** 67 , 17 0 77 , 34 1 74 , 43 1 76 , 56 9 67 , 17 0 77 , 34 1 74 , 43 1 76 , 56 9 — — — — Customer funds 94,340 109,299 103,765 105,095 94,340 109,299 103,765 105,095 — — — — Customer deposits *** 58,39 7 67,73 5 63,42 2 64,89 0 58,39 7 67,73 5 63,42 2 64,89 0 — — — — M u t u a l f und s 35,94 4 41,56 3 40,34 3 40,20 5 (*). - Includes exchange differences. (**). - Excluding reverse repos. (***). - Excluding repos. 35,94 4 41,56 3 40,34 3 40,20 5 — — — — 22

Chile EUR million NEW (pro forma) Q1'21 Q2'21 Q3'21 Q4'21 PREVIOUS Q1'21 Q2'21 Q3'21 Q4'21 DIFFERENCES Q1'21 Q2'21 Q3'21 Q4'21 Income statement Net interest income 497 511 467 508 497 511 467 508 — — — — Net fee income 95 96 104 100 95 96 104 100 — — — — Gains (losses) on financial transactions * 32 48 29 21 32 48 29 21 — — — — Other operating income ( 10 ) ( 18 ) ( 17 ) ( 7 ) ( 10 ) ( 18 ) ( 17 ) ( 7 ) — — — — Total income 614 637 582 622 614 637 583 622 — — — — Administrative expenses and amortizations ( 236 ) ( 245 ) ( 229 ) ( 233 ) ( 236 ) ( 245 ) ( 229 ) ( 233 ) — — — — Net operating income 378 392 354 389 378 392 354 390 — — — — Net loan - loss provisions ( 100 ) ( 82 ) ( 84 ) ( 75 ) ( 100 ) ( 82 ) ( 84 ) ( 75 ) — — — — Other gains (losses) and provisions ( 1 ) 5 ( 5 ) ( 14 ) ( 1 ) 5 ( 5 ) ( 14 ) — — — — Profit before tax 277 315 265 300 277 315 265 301 — — — — Tax on profit ( 55 ) ( 69 ) ( 59 ) ( 47 ) ( 55 ) ( 70 ) ( 59 ) ( 47 ) — — — — Profit from continuing operations 222 245 206 254 222 246 206 254 — — — — Net profit from discontinued operations — — — — — — — — — — — — Consolidated profit 222 245 206 254 222 246 206 254 — — — — Non - controlling interests (69) (77) (64) (80) (69) (77) (64) (80) — — — — Underlying attributable profit to the parent 152 168 142 174 153 169 142 174 — — — — NEW (pro forma) PREVIOUS DIFFERENCES Mar - 21 Jun - 21 Sep - 21 Dic - 21 Mar - 21 Jun - 21 Sep - 21 Dic - 21 Mar - 21 Jun - 21 Sep - 21 Dic - 21 Balance sheet Loans and advances to customers 40 , 76 0 39,922 37,851 37,849 40 , 76 0 39,922 37,851 37,849 — — — — Cash, central banks and credit institutions 6 , 26 5 11,748 9,573 6,773 6 , 26 5 11,748 9,573 6,773 — — — — Debt instruments 8 , 86 7 8,315 9,682 10,955 8 , 86 7 8,315 9,682 10,955 — — — — Other financial assets 8 , 15 8 6,293 9,901 13,469 8 , 15 8 6,293 9,901 13,469 — — — — Other asset accounts 3,105 2,883 3,011 2,942 3,105 2,883 3,011 2,942 — — — — Total assets 67,154 69,162 70,017 71,987 67,154 69,162 70,017 71,987 — — — — Customer deposits 30 , 43 5 33,316 31,509 29,525 30 , 43 5 33,316 31,509 29,525 — — — — Central banks and credit institutions 11 , 37 4 11,665 12,904 12,109 11 , 37 4 11,664 12,903 12,109 — — 1 1 Marketable debt securities 9 , 28 0 9,083 8,323 9,264 9 , 28 0 9,083 8,323 9,264 — — — — Other financial liabilities 8 , 98 1 8,513 10,683 13,841 8 , 98 1 8,513 10,683 13,841 — — — — Other liabilities accounts 1,799 1,871 2,230 2,543 1,799 1,871 2,230 2,543 — — — — Total liabilities 61,869 64,448 65,648 67,283 61,869 64,447 65,648 67,282 — — 1 1 Total equity 5,285 4,714 4,369 4,704 5,285 4,714 4,370 4,705 — — (1) (1) Memorandum items: Gross loans and advances to customers ** 42 , 04 9 41,125 38,927 38,930 42 , 04 9 41,125 38,927 38,930 — — — — Customer funds 39 , 62 6 42,312 40,165 37,847 39 , 62 6 42,312 40,165 37,847 — — — — Customer deposits *** 30,38 3 33,28 1 31,48 0 29,48 4 30,38 3 33,28 1 31,48 0 29,48 4 — — — — M u t u a l f und s 9,24 3 9,03 1 8,68 4 8,36 3 (*). - Includes exchange differences. (**). - Excluding reverse repos. (***). - Excluding repos. 9,24 3 9,03 1 8,68 4 8,36 3 — — — — 23

Argentina EUR million NEW (pro forma) Q1'21 Q2'21 Q3'21 Q4'21 PREVIOUS Q1'21 Q2'21 Q3'21 Q4'21 DIFFERENCES Q1'21 Q2'21 Q3'21 Q4'21 Income statement Net interest income 203 234 267 361 204 235 268 362 ( 1 ) (1) (1) ( 1 ) Net fee income 74 87 110 149 74 87 110 149 — — — — Gains (losses) on financial transactions * 32 34 43 39 32 34 43 39 — — — — Other operating income ( 47 ) (56) (56) ( 86 ) ( 47 ) ( 56 ) (56) ( 86 ) — — — — T o t a l i n c o m e 26 1 30 0 36 4 463 A d m i n is t r a t i v e e x p e n s e s a n d a m o r t i z a t i on s ( 1 71) ( 1 79) ( 2 04) ( 2 52) 26 2 30 1 36 5 464 ( 1 71) ( 1 79) ( 2 04) ( 2 52) ( 1 ) ( 1 ) ( 1 ) ( 1 ) — — — — Net operating income 91 121 160 211 92 122 161 212 (1) (1) (1) (1) Net loan - loss provisions ( 14 ) ( 35 ) (40) ( 52 ) ( 14 ) ( 35 ) (40) ( 52 ) — — — — Other gains (losses) and provisions ( 34 ) ( 31 ) (29) ( 42 ) ( 34 ) ( 31 ) (29) ( 42 ) — — — — Profit before tax 42 55 91 117 44 57 92 118 (1) (1) (1) (1) Tax on profit 2 7 (19) ( 24 ) 2 6 (19) ( 24 ) — — — — Profit from continuing operations 45 62 72 93 46 63 73 94 (1) (1) (1) (1) Net profit from discontinued operations — — — — — — — — — — — — Consolidated profit 45 62 72 93 46 63 73 94 (1) (1) (1) (1) Non - controlling interests (0) (0) (0) (1) (0) (0) (0) (1) — — — — Underlying attributable profit to the parent 44 62 72 92 45 62 73 93 (1) (1) (1) (1) NEW (pro forma) PREVIOUS DIFFERENCES Mar - 21 Jun - 21 Sep - 21 Dic - 21 Mar - 21 Jun - 21 Sep - 21 Dic - 21 Mar - 21 Jun - 21 Sep - 21 Dic - 21 Balance sheet Loans and advances to customers 4 , 31 0 4 , 45 7 4 , 65 2 5,173 4 , 31 0 4 , 45 7 4 , 65 2 5 , 17 3 — — — — Cash, central banks and credit institutions 3 , 64 7 3 , 20 7 4 , 10 1 5,243 3 , 64 7 3 , 20 7 4 , 10 1 5 , 24 3 — — — — Debt instruments 1 , 61 1 2 , 18 8 2 , 39 4 1,358 1 , 61 1 2 , 18 8 2 , 39 4 1 , 35 8 — — — — Other financial assets 65 77 79 92 65 77 79 92 — — — — Other asset accounts 827 835 865 966 827 835 865 966 — — — — Total assets 10,459 10,765 12,092 12,832 10,459 10,765 12,092 12,832 — — — — Customer deposits 7 , 51 8 7 , 78 7 8 , 86 0 9,170 7 , 51 8 7 , 78 7 8 , 86 0 9 , 17 0 — — — — Central banks and credit institutions 822 826 837 649 821 824 834 645 1 2 2 3 Marketable debt securities 67 63 63 204 67 63 63 204 — — — — Other financial liabilities 696 675 762 1,013 696 675 762 1 , 01 3 — — — — Other liabilities accounts 324 313 356 443 324 313 356 443 — — — — Total liabilities 9,427 9,664 10,878 11,479 9,426 9,663 10,875 11,475 1 2 2 3 Total equity 1,032 1,101 1,214 1,353 1,033 1,102 1,216 1,357 ( 1 ) ( 2 ) ( 2 ) ( 3 ) Memorandum items: Gross loans and advances to customers ** 4 , 54 4 4 , 71 3 4,928 5 , 45 4 4 , 54 4 4,713 4,928 5,454 — — — — Customer funds 9 , 49 9 9 , 89 6 11,285 11 , 89 1 9 , 49 9 9,896 11,285 11,891 — — — — Customer deposits *** 7,51 8 7,78 7 8,86 0 9,17 0 7,51 8 7,78 7 8,86 0 9,17 0 — — — — M u t u a l f und s 1,98 1 2,10 9 2,42 5 2,72 1 (*). - Includes exchange differences. (**). - Excluding reverse repos. (***). - Excluding repos. 1,98 1 2,10 9 2,42 5 2,72 1 — — — — 24

Other South America EUR million NEW (pro forma) Q1'21 Q2'21 Q3'21 Q4'21 PREVIOUS Q1'21 Q2'21 Q3'21 Q4'21 DIFFERENCES Q1'21 Q2'21 Q3'21 Q4'21 Income statement Net interest income 92 93 102 105 93 93 102 106 ( 1 ) ( 1 ) (1) ( 1 ) Net fee income 41 46 45 46 41 46 45 46 — — — — Gains (losses) on financial transactions * 14 17 13 19 14 17 13 19 — — — — Other operating income ( 7 ) (5) 1 ( 4 ) ( 7 ) (5) 1 ( 4 ) — — — — T o t a l i n c o m e 14 0 15 2 16 0 166 A d m i n is t r a t i v e e x p e n s e s a n d a m o r t i z a t i on s ( 9 0) ( 9 6) ( 1 01) ( 1 10) 14 1 15 2 16 1 166 ( 9 0) ( 9 6) ( 1 01) ( 1 10) ( 1 ) ( 1 ) ( 1 ) ( 1 ) — — — — Net operating income 51 56 59 55 51 57 60 56 (1) (1) (1) (1) Net loan - loss provisions ( 20 ) ( 19 ) (11) ( 4 ) ( 20 ) ( 19 ) ( 11 ) ( 4 ) — — — — Other gains (losses) and provisions ( 1 ) ( 1 ) (1) ( 4 ) ( 1 ) ( 1 ) ( 1 ) ( 4 ) — — — — Profit before tax 30 37 47 47 30 37 47 48 (1) (1) (1) (1) Tax on profit ( 16 ) ( 16 ) (18) ( 20 ) ( 16 ) ( 16 ) ( 18 ) ( 20 ) — — — — Profit from continuing operations 13 21 29 27 14 21 30 28 — — — — Net profit from discontinued operations — — — — — — — — — — — — Consolidated profit 13 21 29 27 14 21 30 28 — — — — Non - controlling interests 0 0 0 (1) 0 0 0 (1) — — — — Underlying attributable profit to the parent 14 21 29 27 14 21 30 27 — — — — NEW (pro forma) PREVIOUS DIFFERENCES Mar - 21 Jun - 21 Sep - 21 Dic - 21 Mar - 21 Jun - 21 Sep - 21 Dic - 21 Mar - 21 Jun - 21 Sep - 21 Dic - 21 Balance sheet Loans and advances to customers 6 , 57 1 6 , 72 0 7 , 89 3 7 , 81 3 6 , 57 1 6,720 7 , 89 3 7 , 81 3 — — — — Cash, central banks and credit institutions 3 , 05 5 2 , 85 2 3 , 42 3 2 , 71 8 3 , 05 5 2,852 3 , 42 3 2 , 71 8 — — — — Debt instruments 1 , 43 9 1 , 78 2 1 , 61 8 2 , 06 1 1 , 43 9 1,782 1 , 61 8 2 , 06 1 — — — — Other financial assets 121 127 168 119 121 127 168 119 — — — — Other asset accounts 828 797 817 828 828 797 817 828 — — — — Total assets 12,013 12,278 13,919 13,539 12,013 12,278 13,919 13,539 — — — — Customer deposits 6 , 83 7 6 , 78 6 7 , 32 9 7 , 33 1 6 , 83 7 6,786 7 , 32 9 7 , 33 1 — — — — Central banks and credit institutions 3 , 21 4 3 , 42 1 4 , 36 5 3 , 88 6 3 , 21 4 3,420 4 , 36 3 3 , 88 5 — 1 1 1 Marketable debt securities 114 261 264 255 114 261 264 255 — — — — Other financial liabilities 103 109 133 134 103 109 133 134 — — — — Other liabilities accounts 348 322 354 340 348 322 354 340 — — — — Total liabilities 10,616 10,898 12,445 11,946 10,615 10,898 12,444 11,945 — 1 1 1 Total equity 1,397 1,379 1,475 1,593 1,398 1,380 1,476 1,595 — ( 1 ) ( 1 ) ( 1 ) Memorandum items: G r o s s l o a n s a n d a d v a n c e s t o c us t om er s ** 6 , 71 5 6 , 87 4 8,048 7,963 6 , 71 5 6,874 8 , 04 8 7 , 96 3 — — — — C us t om e r fun d s 6 , 87 8 6 , 82 9 7,373 7,378 6 , 87 8 6,829 7 , 37 3 7 , 37 8 — — — — C us t om e r d e p o s i t s *** 6 , 83 7 6 , 78 6 7,329 7,331 6 , 83 7 6,786 7 , 32 9 7 , 33 1 — — — — Mutual funds 41 43 44 48 (*). - Includes exchange differences. (**). - Excluding reverse repos. (***). - Excluding repos. 41 43 44 48 — — — — 25
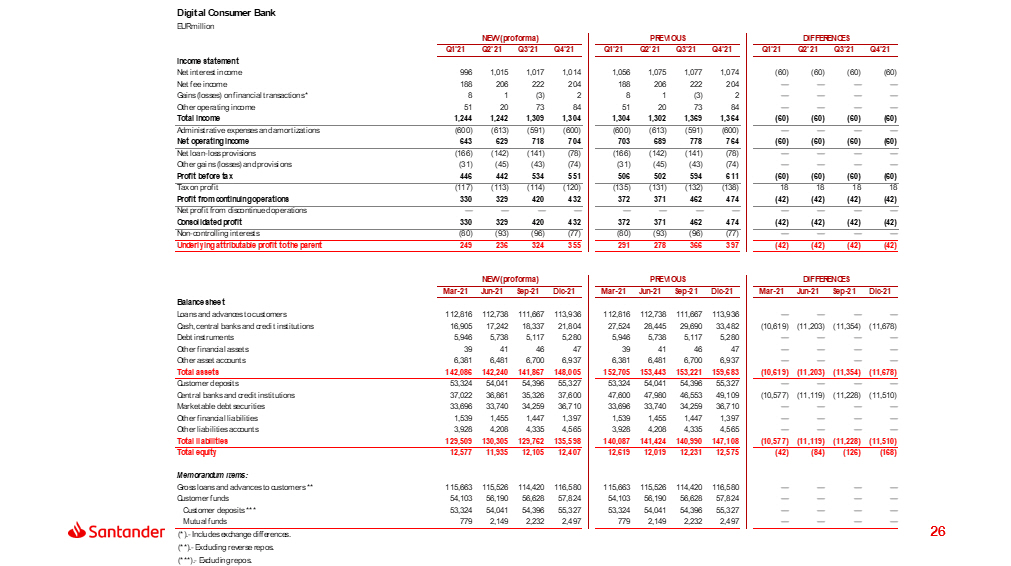
Digital Consumer Bank EUR million NEW (pro forma) Q1'21 Q2'21 Q3'21 Q4'21 PREVIOUS Q1'21 Q2'21 Q3'21 Q4'21 DIFFERENCES Q1'21 Q2'21 Q3'21 Q4'21 Income statement Net interest income 996 1 , 01 5 1 , 01 7 1 , 01 4 1 , 05 6 1 , 07 5 1,077 1 , 07 4 ( 60 ) (60) (60) ( 60 ) Net fee income 188 206 222 204 188 206 222 204 — — — — Gains (losses) on financial transactions * 8 1 ( 3 ) 2 8 1 (3) 2 — — — — Other operating income 51 20 73 84 51 20 73 84 — — — — T o t a l i n c o m e 1 , 24 4 1 , 24 2 1 , 30 9 1 , 30 4 A d m i n is t r a t i v e e x p e n s e s a n d a m o r t i z a t i on s ( 6 00) ( 6 13) ( 5 91) ( 6 00) 1 , 30 4 1 , 30 2 1 , 36 9 1 , 36 4 ( 6 00) ( 6 13) ( 5 91) ( 6 00) ( 60 ) ( 60 ) ( 60 ) ( 60 ) — — — — Net operating income 643 629 718 704 703 689 778 764 (60) (60) (60) (60) Net loan - loss provisions ( 166 ) ( 142 ) ( 141 ) (78) ( 166 ) (142) ( 141 ) (78) — — — — Other gains (losses) and provisions ( 31 ) ( 45 ) ( 43 ) (74) ( 31 ) (45) ( 43 ) (74) — — — — Profit before tax 446 442 534 551 506 502 594 611 (60) (60) (60) (60) Tax on profit ( 117 ) ( 113 ) ( 114 ) (120) ( 135 ) (131) ( 132 ) (138) 18 18 18 18 P r o f i t f r o m c on t i nu i n g op e r a t i on s 33 0 32 9 42 0 432 N e t p r o f i t f r o m d is con t i nu e d op e r a t i on s — — — — 37 2 37 1 46 2 474 — — — — ( 42 ) ( 42 ) ( 42 ) ( 42 ) — — — — C on s o l i d at ed p r o f i t 33 0 32 9 42 0 432 37 2 37 1 46 2 474 ( 42 ) ( 42 ) ( 42 ) ( 42 ) N o n - c o n t r o ll i n g i n t ere s t s ( 80 ) ( 93 ) ( 96 ) ( 77 ) ( 80 ) ( 93 ) ( 96 ) ( 77 ) — — — — U nd er ly i n g att r i bu ta b l e p r o f i t t o t h e p a re n t 24 9 23 6 32 4 355 29 1 27 8 36 6 397 ( 42 ) ( 42 ) ( 42 ) ( 42 ) NEW (pro forma) PREVIOUS DIFFERENCES M a r - 2 1 J un - 2 1 Se p - 2 1 Di c - 2 1 M a r - 2 1 J un - 2 1 Se p - 2 1 Di c - 2 1 M a r - 2 1 J un - 2 1 Se p - 2 1 Di c - 2 1 Balance sheet Loans and advances to customers 112,816 112,738 111,667 113,936 112,816 112,738 111,667 113,936 — — — — Ca sh , c e n t r a l b a nk s a n d c re d i t i ns t i t u t i o n s 16 , 90 5 17 , 24 2 18 , 33 7 21 , 80 4 27 , 52 4 28 , 44 5 29 , 69 0 33 , 48 2 (10,619) (11,203) (11,354) (11,678) D e b t i ns t r u m e n t s 5 , 94 6 5 , 73 8 5 , 11 7 5 , 28 0 5 , 94 6 5 , 73 8 5 , 11 7 5 , 28 0 — — — — O t h e r f i n a nc i a l a ss e t s 3 9 4 1 4 6 47 O t h e r a ss e t a ccoun t s 6,38 1 6,48 1 6,70 0 6,93 7 Total assets 142,086 142,240 141,867 148,005 3 9 4 1 4 6 47 6,38 1 6,48 1 6,70 0 6,93 7 152,705 153,443 153,221 159,683 — — — — — — — — (10,619) (11,203) (11,354) (11,678) Customer deposits 53 , 32 4 54,041 54,396 55 , 32 7 53 , 32 4 54,041 54,396 55 , 32 7 — — — — Central banks and credit institutions 37 , 02 2 36,861 35,326 37 , 60 0 47 , 60 0 47,980 46,553 49 , 10 9 ( 10 , 577 ) ( 11 , 119 ) ( 11 , 228 ) ( 11 , 510 ) Marketable debt securities 33 , 69 6 33,740 34,259 36 , 71 0 33 , 69 6 33,740 34,259 36 , 71 0 — — — — Other financial liabilities 1 , 53 9 1,455 1,447 1 , 39 7 1 , 53 9 1,455 1,447 1 , 39 7 — — — — Other liabilities accounts 3,928 4,208 4,335 4,565 3 , 92 8 4 , 20 8 4 , 33 5 4 , 56 5 — — — — Total liabilities 129,509 130,305 129,762 135,598 140,087 141,424 140,990 147,108 (10,577) (11,119) (11,228) (11,510) Total equity 12,577 11,935 12,105 12,407 12 , 61 9 12 , 01 9 12 , 23 1 12 , 57 5 ( 42 ) ( 84 ) ( 126 ) ( 168 ) Memorandum items: Gross loans and advances to customers ** 115,663 115,526 114,420 116,580 115,663 115,526 114,420 116,580 — — — — Customer funds 54,103 56,190 56,628 57,824 54 , 10 3 56 , 19 0 56 , 62 8 57 , 82 4 — — — — Customer deposits *** 53,324 54,041 54,396 55,327 53 , 32 4 54 , 04 1 54 , 39 6 55 , 32 7 — — — — M u t u a l f und s 77 9 2,14 9 2,23 2 2,49 7 (*). - Includes exchange differences. (**). - Excluding reverse repos. (***). - Excluding repos. 77 9 2,14 9 2,23 2 2,49 7 — — — — 26

Corporate Centre EUR million NEW (pro forma) Q1'21 Q2'21 Q3'21 Q4'21 PREVIOUS Q1'21 Q2'21 Q3'21 Q4'21 DIFFERENCES Q1'21 Q2'21 Q3'21 Q4'21 Income statement Net interest income ( 133 ) ( 164 ) ( 162 ) ( 165 ) ( 324 ) ( 355 ) ( 354 ) ( 357 ) 191 192 192 192 Net fee income ( 5 ) ( 8 ) ( 2 ) ( 12 ) ( 5 ) ( 8 ) ( 2 ) ( 12 ) — — — — Gains (losses) on financial transactions * ( 44 ) ( 52 ) ( 49 ) 5 ( 44 ) ( 52 ) ( 49 ) 5 — — — — Other operating income 3 ( 15 ) ( 11 ) ( 5 ) 3 ( 15 ) ( 11 ) ( 5 ) — — — — T o t a l i n c o m e ( 179 ) ( 239 ) ( 224 ) ( 177 ) A d m i n is t r a t i v e e x p e n s e s a n d a m o r t i z a t i on s ( 7 9) ( 8 1) ( 8 9) ( 9 7) ( 370 ) ( 430 ) ( 416 ) ( 370 ) ( 7 9) ( 8 1) ( 8 9) ( 9 7) 19 1 19 2 19 2 192 — — — — Net operating income (258) (319) (314) (274) (449) (511) (505) (467) 191 192 192 192 Net loan - loss provisions ( 154 ) ( 9 ) (6) 13 ( 154 ) (9) ( 6 ) 13 — — — — Other gains (losses) and provisions ( 33 ) ( 33 ) (43) ( 82 ) ( 33 ) (33) ( 43 ) (82) — — — — Profit before tax (445) (361) (362) (343) (635) (553) (553) (535) 191 192 192 192 Tax on profit 42 ( 47 ) (58) 40 108 19 8 106 (66) (66) (66) (66) P r o f i t f r o m c on t i nu i n g op e r a t i on s ( 402 ) ( 409 ) ( 420 ) ( 303 ) N e t p r o f i t f r o m d is con t i nu e d op e r a t i on s — — ( 0 ) 0 ( 527 ) ( 534 ) ( 545 ) ( 429 ) — — ( 0 ) 0 12 5 12 5 12 5 126 — — — — Consolidated profit (402) (409) (420) (303) (527) (534) (545) (429) 125 125 125 126 Non - controlling interests 0 (1) (0) (0) 0 (1) (0) (0) — — — — Underlying attributable profit to the parent (402) (410) (420) (303) (527) (535) (545) (429) 125 125 125 126 NEW (pro forma) PREVIOUS DIFFERENCES Mar - 21 Jun - 21 Sep - 21 Dec - 21 Mar - 21 Jun - 21 Sep - 21 Dec - 21 Mar - 21 Jun - 21 Sep - 21 Dec - 21 Balance sheet Loans and advances to customers 6 , 63 2 5 , 83 2 6,350 6 , 78 7 6 , 63 2 5,832 6,350 6,787 — — — — Cash, central banks and credit institutions 89 , 69 5 71 , 90 8 81,150 88 , 91 8 89 , 69 5 71,908 81,150 88,918 — — — — Debt instruments 1 , 45 0 1 , 60 5 1,423 1 , 55 5 1 , 45 0 1,605 1,423 1,555 — — — — Other financial assets 2 , 00 5 2 , 01 6 2,157 2 , 20 3 2 , 00 5 2,016 2,157 2,203 — — — — Other asset accounts 119,024 118,374 116,606 116,007 119,024 118,374 116,606 116,007 — — — — Total assets 218,806 199,736 207,687 215,470 218,806 199,736 207,687 215,470 — — — — Customer deposits 974 1 , 01 7 1,324 1 , 04 2 974 1,017 1,324 1,042 — — — — Central banks and credit institutions 62 , 31 5 38 , 66 4 45,798 53 , 06 1 62 , 44 0 38,914 46,173 53,563 ( 125 ) ( 250 ) ( 375 ) ( 501 ) Marketable debt securities 64 , 35 4 69 , 21 7 71,720 74 , 30 2 64 , 35 4 69,217 71,720 74,302 — — — — Other financial liabilities 1 , 08 5 534 1,495 431 1 , 08 5 534 1,495 431 — — — — Other liabilities accounts 8,106 8,009 7,197 7,113 8,106 8,009 7,197 7,113 — — — — Total liabilities 136,834 117,441 127,534 135,950 136,959 117,691 127,909 136,451 ( 125 ) ( 250 ) ( 375 ) ( 501 ) Total equity 81,972 82,295 80,154 79,520 81,847 82,044 79,778 79,019 12 5 25 0 37 5 501 Memorandum items: G r o s s l o a n s a n d a d v a n c e s t o c us t om er s ** 6 , 97 2 6,138 6,589 6 , 81 3 6 , 97 2 6,138 6,589 6,813 — — — — C us t om e r fun d s 992 1,021 1,324 1 , 04 2 992 1,021 1,324 1,042 — — — — C us t om e r d e p o s i t s *** 974 1,017 1,324 1 , 04 2 974 1,017 1,324 1,042 — — — — Mutual funds 18 4 0 — (*). - Includes exchange differences. (**). - Excluding reverse repos. (***). - Excluding repos. 18 4 0 — — — — — 27

28 Appendix: Secondary segments

Retail Banking EUR million NEW (pro forma) Q1'21 Q2'21 Q3'21 Q4'21 PREVIOUS Q1'21 Q2'21 Q3'21 Q4'21 DIFFERENCES Q1'21 Q2'21 Q3'21 Q4'21 Income statement Net interest income 7 , 28 6 7 , 57 3 7 , 77 0 7,966 7 , 47 2 7,766 7 , 96 8 8 , 18 3 ( 186 ) ( 193 ) ( 198 ) ( 216 ) Net fee income 1 , 72 1 1 , 76 8 1 , 75 4 1,801 1 , 70 9 1,753 1 , 74 6 1 , 80 1 12 16 8 ( 1 ) Gains (losses) on financial transactions * 230 155 194 260 246 171 216 287 ( 16 ) ( 16 ) ( 21 ) ( 26 ) Other operating income 119 142 244 (116) 109 121 243 ( 154 ) 11 21 1 39 T o t a l i n c o m e 9 , 35 7 9 , 63 8 9 , 96 2 9 , 91 2 9 , 53 6 9 , 81 1 10 , 17 3 10 , 11 7 ( 179 ) ( 172 ) ( 211 ) ( 205 ) Administrative expenses and amortizations ( 4 , 137 ) (4,229) (4,309) (4,429) (4,157) (4,247) (4,336) (4,453) 21 17 27 25 Ne t o p e r a t i n g i n c o m e 5 , 22 0 5 , 40 9 5 , 65 4 5 , 48 3 5 , 37 8 5 , 56 4 5 , 83 7 5 , 66 3 ( 158 ) ( 155 ) ( 183 ) ( 180 ) Net loan - loss provisions ( 1 , 783 ) (1,724) ( 2 , 190 ) ( 1 , 384 ) ( 1 , 783 ) (1,726) (2,199) ( 1 , 406 ) — 2 8 22 Other gains (losses) and provisions ( 398 ) (454) ( 442 ) ( 759 ) ( 405 ) (463) (445) ( 752 ) 7 9 3 ( 7 ) P r o f i t b e f o r e t a x 3 , 03 9 3 , 23 1 3 , 02 2 3 , 34 0 3 , 19 0 3 , 37 5 3 , 19 4 3 , 50 6 ( 151 ) ( 144 ) ( 172 ) ( 165 ) Tax on profit ( 1 , 005 ) (1,019) (872) (1,002) (1,047) (1,057) (905) (1,042) 43 38 33 40 Profit from continuing operations 2,034 2,212 2,150 2,338 2 , 14 3 2 , 31 8 2 , 28 8 2 , 46 4 (108 ) (106 ) (139 ) (126 ) Net profit from discontinued operations — — — — — — 0 ( 0 ) — — — — Consolidated profit 2,034 2,212 2,150 2,338 2 , 14 3 2 , 31 8 2 , 28 8 2 , 46 4 (108 ) (106 ) (139 ) (126 ) Non - controlling interests (306) (364) (328) (347) ( 307 ) ( 364 ) ( 329 ) ( 345 ) — ( 1 ) 1 ( 2 ) Underlying attributable profit to the parent 1,728 1,848 1,822 1,991 1 , 83 6 1 , 95 4 1 , 96 0 2 , 11 9 (108 ) (106 ) (138 ) (128 ) 29 (*). - Includes exchange differences.

Corporate & Investment Banking EUR million NEW (pro forma) Q1'21 Q2'21 Q3'21 Q4'21 PREVIOUS Q1'21 Q2'21 Q3'21 Q4'21 DIFFERENCES Q1'21 Q2'21 Q3'21 Q4'21 Income statement Net interest income 690 716 729 785 720 739 747 788 ( 30 ) ( 23 ) (19) ( 3 ) Net fee income 462 427 433 422 466 434 435 416 ( 4 ) ( 6 ) (2) 6 Gains (losses) on financial transactions * 427 119 164 56 412 101 144 28 15 18 20 28 Other operating income 39 (11) 73 88 57 9 87 109 ( 18 ) ( 20 ) (15) ( 21 ) T o t a l i n c o m e 1 , 61 8 1 , 25 2 1 , 39 9 1 , 35 1 1 , 65 5 1 , 28 3 1 , 41 4 1 , 34 1 ( 37 ) ( 31 ) ( 15 ) 10 Administrative expenses and amortizations ( 545 ) (560) (595) (679) (526) (543) (574) (658) (19) (17) (22) (21) Ne t o p e r a t i n g i n c o m e 1 , 07 3 69 1 80 4 672 1 , 13 0 74 0 84 0 682 ( 56 ) ( 49 ) ( 36 ) ( 11 ) Net loan - loss provisions ( 49 ) (20) ( 11 ) ( 71 ) ( 47 ) (21) ( 7 ) (55) ( 2 ) 1 (4) ( 16 ) Other gains (losses) and provisions ( 29 ) 22 ( 3 ) ( 7 ) ( 25 ) 31 ( 1 ) (16) ( 5 ) ( 9 ) (2) 9 P r o f i t b e f o r e t a x 99 5 69 3 79 0 594 1 , 05 8 75 0 83 2 611 ( 63 ) ( 57 ) ( 42 ) ( 18 ) Tax on profit ( 291 ) (185) (210) (135) (318) (215) (245) (158) 28 31 35 22 P r o f i t f r o m c on t i nu i n g o p e r a t i on s 70 5 50 8 57 9 458 N e t p r o f i t f r o m d is con t i nu e d op e r a t i on s — — — — 74 0 53 4 58 7 454 — — — — ( 35 ) ( 26 ) ( 7 ) 4 — — — — Consolidated profit 705 508 579 458 740 534 587 454 (35 ) (26 ) (7 ) 4 Non - controlling interests (34) (39) (39) (25) (36) (41) (40) (31) 2 2 — 6 Underlying attributable profit to the parent 670 469 540 433 704 494 547 423 (33 ) (24 ) (7 ) 10 30 (*). - Includes exchange differences.
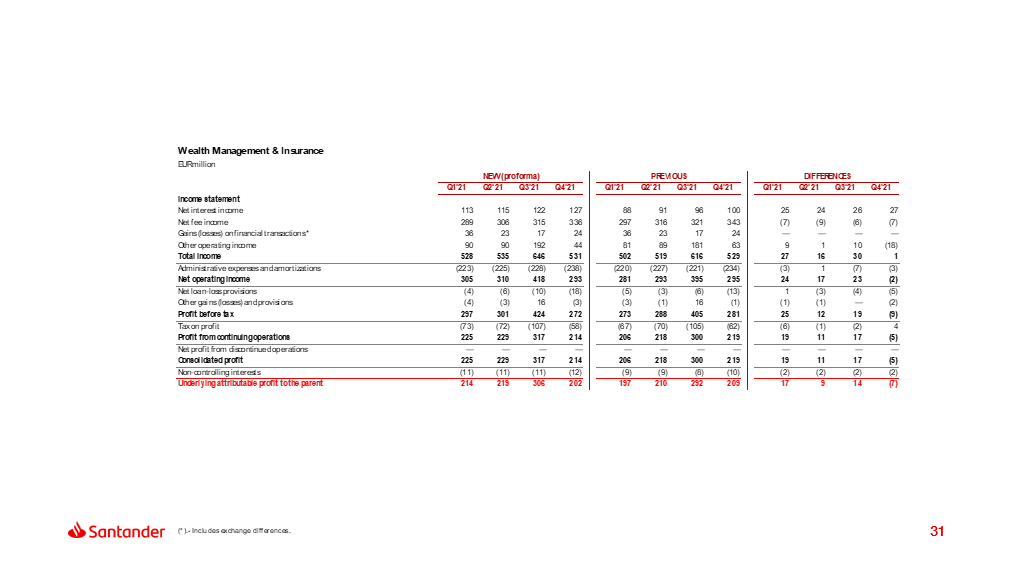
Wealth Management & Insurance EUR million NEW (pro forma) Q1'21 Q2'21 Q3'21 Q4'21 PREVIOUS Q1'21 Q2'21 Q3'21 Q4'21 DIFFERENCES Q1'21 Q2'21 Q3'21 Q4'21 Income statement Net interest income 113 115 122 127 88 91 96 100 25 24 26 27 Net fee income 289 306 315 336 297 316 321 343 ( 7 ) (9) (6) ( 7 ) Gains (losses) on financial transactions * 36 23 17 24 36 23 17 24 — — — — Other operating income 90 90 192 44 81 89 181 63 9 1 10 ( 18 ) T o t a l i n c o m e 52 8 53 5 64 6 531 50 2 51 9 61 6 529 2 7 1 6 3 0 1 Administrative expenses and amortizations ( 223 ) (225) (228) (238) (220) (227) (221) (234) (3) 1 (7) (3) Ne t o p e r a t i n g i n c o m e 30 5 31 0 41 8 293 28 1 29 3 39 5 295 2 4 1 7 2 3 ( 2 ) Net loan - loss provisions ( 4 ) (6) (10) (18) ( 5 ) (3) (6) ( 13 ) 1 (3) (4) ( 5 ) Other gains (losses) and provisions ( 4 ) (3) 16 (3) ( 3 ) (1) 16 ( 1 ) ( 1 ) (1) — ( 2 ) P r o f i t b e f o r e t a x 29 7 30 1 42 4 272 27 3 28 8 40 5 281 2 5 1 2 1 9 ( 9 ) Tax on profit ( 73 ) (72) (107) (58) (67) (70) (105) (62) (6) (1) (2) 4 P r o f i t f r o m c on t i nu i n g o p e r a t i on s 22 5 22 9 31 7 214 N e t p r o f i t f r o m d is con t i nu e d op e r a t i on s — — — — 20 6 21 8 30 0 219 — — — — 1 9 1 1 1 7 ( 5 ) — — — — Consolidated profit 225 229 317 214 20 6 21 8 30 0 219 1 9 1 1 1 7 (5 ) Non - controlling interests (11) (11) (11) (12) ( 9 ) ( 9 ) ( 8 ) ( 10 ) ( 2 ) ( 2 ) ( 2 ) ( 2 ) Underlying attributable profit to the parent 214 219 306 202 19 7 21 0 29 2 209 1 7 9 1 4 (7 ) 31 (*). - Includes exchange differences.

PagoNxt EUR million NEW (pro forma) Q1'21 Q2'21 Q3'21 Q4'21 PREVIOUS Q1'21 Q2'21 Q3'21 Q4'21 DIFFERENCES Q1'21 Q2'21 Q3'21 Q4'21 Income statement Net interest income ( 1 ) (1) 0 3 ( 1 ) ( 1 ) 0 3 — — — — Net fee income 81 127 140 144 81 127 141 144 — — — — Gains (losses) on financial transactions * 1 (0) ( 2 ) ( 0 ) 1 ( 0 ) ( 2 ) ( 0 ) — — — — Other operating income ( 15 ) (3) 5 14 ( 15 ) ( 3 ) 5 14 — — — — Total income 67 123 144 161 67 123 144 161 — — — — Administrative expenses and amortizations ( 136 ) (162) ( 181 ) ( 194 ) ( 136 ) ( 162 ) ( 181 ) ( 194 ) — — — — Net operating income (69) (40) (36) (33) (69) (40) (36) (33) — — — — Net loan - loss provisions ( 2 ) (2) ( 2 ) ( 3 ) ( 2 ) ( 2 ) ( 2 ) ( 3 ) — — — — Other gains (losses) and provisions ( 2 ) (3) ( 34 ) 1 ( 2 ) ( 3 ) ( 34 ) 1 — — — — Profit before tax (73) (46) (73) (35) (73) (45) (73) (35) — — — — Tax on profit 1 (10) ( 6 ) ( 9 ) 1 ( 10 ) ( 6 ) ( 9 ) — — — — Profit from continuing operations (72) (56) (79) (44) (72) (56) (79) (44) — — — — Net profit from discontinued operations — — — — — — — — — — — — Consolidated profit (72) (56) (79) (44) (72) (56) (79) (44) — — — — Non - controlling interests 0 0 (0) (2) 0 0 (0) (2) — — — — Underlying attributable profit to the parent (72) (56) (79) (47) (72) (56) (79) (47) — — — — 32 (*). - Includes exchange differences.

Thank You. Our purpose is to help people and businesses prosper. Our culture is based on believing that everything we do should be:
SIGNATURE
Pursuant to the requirements of the Securities Exchange Act of 1934, the registrant has duly caused this report to be signed on its behalf by the undersigned, thereunto duly authorized.
| Banco Santander, S.A. | |||||
| Date: | April 4, 2022 | By: | /s/ Pedro de Mingo Kaminouchi | ||
| Name: | Pedro de Mingo Kaminouchi | ||||
| Title: | Head of Regulatory Compliance | ||||
Serious News for Serious Traders! Try StreetInsider.com Premium Free!
You May Also Be Interested In
- Tesla (TSLA) Issues Letter to Shareholders, Seeks Approval to Reincorporate to Texas
- House of Streams, Presented by SHRIMP.co (Stream House Media Productions Ltd.), Premieres as an Original Reality Series in Spring 2024
- Bragar Eagel & Squire, P.C. Reminds Investors That Class Action Lawsuits Have Been Filed Against Luna, and HireRight Innovations and Encourages Investors to Contact the Firm
Create E-mail Alert Related Categories
SEC FilingsSign up for StreetInsider Free!
Receive full access to all new and archived articles, unlimited portfolio tracking, e-mail alerts, custom newswires and RSS feeds - and more!
