

Form 497K WELLS FARGO FUNDS TRUST
 Tweet
Tweet Share
Share|
. |
Summary Prospectus |

Allspring Index Asset Allocation Fund
|
Class/Ticker: Class A - SFAAX - Class C - WFALX |
Link to Prospectus |
Link to SAI |
Before you invest, you may want to review the Fund’s prospectus, which contains more information about the Fund and its risks. You can find the Fund’s prospectus, reports to shareholders and other information about the Fund online at allspringglobal.com/reports. You can also get information at no cost by calling 1-800-222-8222, or by sending an email request to [email protected]. The current prospectus (“Prospectus”) and statement of additional information (“SAI”), dated February 1, 2021 as supplemented December 6, 2021, as supplemented from time to time, are incorporated by reference into this summary prospectus. The Fund’s SAI may be obtained, free of charge, in the same manner as the Prospectus.
Investment Objective
The Fund seeks long-term total return, consisting of capital appreciation and current income.
Fees and Expenses
These tables are intended to help you understand the various costs and expenses you will pay if you buy and hold shares of the Fund. You may qualify for sales charge discounts if you and your family invest, or agree to invest in the future, at least $10,000 in the aggregate in specified classes of certain Allspring Funds. More information about these and other discounts is available from your financial professional and in “Share Class Features” and “Reductions and Waivers of Sales Charges” on pages 28 and 29 of the Prospectus and “Additional Purchase and Redemption Information” on page 87 of the Statement of Additional Information. Investors who purchase through certain intermediaries may be subject to different sales charge discounts than those outlined shares in these sections. Please see Appendix A on page 44 for further information.
|
Shareholder Fees (fees paid directly from your investment) |
||
|
Class A |
Class C |
|
|
Maximum sales charge (load) imposed on purchases (as a percentage of offering price) |
5.75% |
None |
|
Maximum deferred sales charge (load) (as a percentage of offering price) |
None1 |
1.00% |
| 1. | Investments of $1 million or more are not subject to a front-end sales charge but generally will be subject to a deferred sales charge of 1.00% if redeemed within 18 months from the date of purchase. |
|
Annual Fund Operating Expenses (expenses that you pay each year as a percentage of the value of your investment) |
||
|
Class A |
Class C |
|
|
Management Fees |
0.60% |
0.60% |
|
Distribution (12b-1) Fees |
0.00% |
0.75% |
|
Other Expenses |
0.50% |
0.50% |
|
Total Annual Fund Operating Expenses |
1.10% |
1.85% |
|
Fee Waivers |
(0.02)% |
(0.02)% |
|
Total Annual Fund Operating Expenses After Fee Waivers1 |
1.08% |
1.83% |
| 1. | The Manager has contractually committed through January 31, 2022, to waive fees and/or reimburse expenses to the extent necessary to cap Total Annual Fund Operating Expenses After Fee Waivers at 1.08% for Class A and 1.83% for Class C. Brokerage commissions, stamp duty fees, interest, taxes, acquired fund fees and expenses (if any), and extraordinary expenses are excluded from the expense cap. Prior to or after the commitment expiration date, the cap may be increased or the commitment to maintain the cap may be terminated only with the approval of the Board of Trustees. |
1
Example of Expenses
The example below is intended to help you compare the costs of investing in the Fund with the costs of investing in other funds. The example assumes a $10,000 initial investment, 5% annual total return, and that fees and expenses remain the same as in the tables above. To the extent that the Manager is waiving fees or reimbursing expenses, the example assumes that such waiver or reimbursement will only be in place through the date noted above. Although your actual costs may be higher or lower, based on these assumptions, your costs would be:
|
Assuming Redemption at End of Period |
Assuming No Redemption |
|||
|
After: |
Class A |
Class C |
Class C |
|
|
1 Year |
$679 |
$286 |
$186 |
|
|
3 Years |
$903 |
$580 |
$580 |
|
|
5 Years |
$1,145 |
$999 |
$999 |
|
|
10 Years |
$1,836 |
$2,168 |
$2,168 |
|
Portfolio Turnover
The Fund pays transaction costs, such as commissions, when it buys and sells securities (or “turns over” its portfolio). A higher portfolio turnover rate may indicate higher transaction costs and may result in higher taxes when Fund shares are held in a taxable account. These costs, which are not reflected in annual fund operating expenses or in the example, affect the Fund’s performance. During the most recent fiscal year, the Fund’s portfolio turnover rate was 19% of the average value of its portfolio.
Principal Investment Strategies
The Fund invests in equity and fixed income securities with an emphasis on equity securities. Under normal circumstances, we invest at least 80% of the Fund’s net assets in equity and fixed income securities designed to replicate the holdings and weightings of the securities comprising the S&P 500 Index and Bloomberg U.S. Treasury Index. We seek to achieve the Fund’s investment objective by allocating up to 75% of its assets in equity securities and up to 55% of its assets in fixed income securities.
The Fund’s “neutral” target allocation is as follows:
| ■ | 60% of the Fund’s total assets in equity securities; and |
| ■ | 40% of the Fund’s total assets in fixed income securities. |
The Fund does not select individual securities for investment; rather, it buys substantially all of the securities of various indexes to replicate such indices. The Fund invests the equity portion of its assets in common stocks to replicate the S&P 500 Index, and invests the fixed income portion of its assets in U.S. Treasury notes and bonds to replicate the Bloomberg U.S. Treasury Index. We seek to maintain 95% or better performance correlation with the respective indexes, before fees and expenses, regardless of market conditions.
We employ both quantitative analysis and qualitative judgments in making tactical allocations among stocks and bonds. Quantitative analysis involves the use of proprietary asset allocation models, which employ various valuation techniques. Qualitative judgments are made based on assessments of a number of factors, including economic conditions, corporate earnings, monetary policy, market valuations, investor sentiment, and technical market factors. We use futures contracts to implement changes to target allocations and to make adjustments to the duration of the Fund’s fixed income portion.
The percentage of Fund assets that we invest in different asset classes may temporarily deviate from the Fund’s target allocations due to changes in market values. We may use cash flows or effect transactions to re-establish the target allocations.
Portfolio Asset Allocation
The following table provides the Fund’s neutral allocations and target allocation ranges.
|
Investment Style |
Neutral Target |
Target Allocation |
|
|
Stock Funds |
60% |
45-75% |
|
|
Bond Funds |
40% |
25-55% |
|
Principal Investment Risks
An investment in the Fund may lose money, is not a deposit of a bank or its affiliates, is not insured or guaranteed by the Federal Deposit Insurance Corporation or any other governmental agency, and is primarily subject to the risks briefly summarized below.
Market Risk. The values of, and/or the income generated by, securities held by the Fund may decline due to general market
2
conditions or other factors, including those directly involving the issuers of such securities. Securities markets are volatile and may decline significantly in response to adverse issuer, regulatory, political, or economic developments. Different sectors of the market and different security types may react differently to such developments.
Equity Securities Risk. The values of equity securities may experience periods of substantial price volatility and may decline significantly over short time periods. In general, the values of equity securities are more volatile than those of debt securities. Equity securities fluctuate in value and price in response to factors specific to the issuer of the security, such as management performance, financial condition, and market demand for the issuer’s products or services, as well as factors unrelated to the fundamental condition of the issuer, including general market, economic and political conditions. Different parts of a market, industry and sector may react differently to adverse issuer, market, regulatory, political, and economic developments.
Debt Securities Risk. Debt securities are subject to credit risk and interest rate risk. Credit risk is the possibility that the issuer or guarantor of a debt security may be unable, or perceived to be unable, to pay interest or repay principal when they become due. In these instances, the value of an investment could decline and the Fund could lose money. Credit risk increases as an issuer’s credit quality or financial strength declines. Interest rate risk is the possibility that interest rates will change over time. When interest rates rise, the value of debt securities tends to fall. The longer the terms of the debt securities held by a Fund, the more the Fund is subject to this risk. If interest rates decline, interest that the Fund is able to earn on its investments in debt securities may also decline, which could cause the Fund to reduce the dividends it pays to shareholders, but the value of those securities may increase. Very low or negative interest rates may magnify interest rate risk.
Derivatives Risk. The use of derivatives, such as futures, options and swap agreements, can lead to losses, including those magnified by leverage, particularly when derivatives are used to enhance return rather than mitigate risk. Certain derivative instruments may be difficult to sell when the portfolio manager believes it would be appropriate to do so, or the other party to a derivative contract may be unwilling or unable to fulfill its contractual obligations.
Futures Contracts Risk. A Fund that uses futures contracts, which are a type of derivative, is subject to the risk of loss caused by unanticipated market movements. In addition, there may at times be an imperfect correlation between the movement in the prices of futures contracts and the value of their underlying instruments or indexes, and there may at times not be a liquid secondary market for certain futures contracts.
Index Tracking Risk. A Fund may not achieve exact correlation between the performance of the Fund and the index it tracks due to factors such as transaction costs, shareholder purchases and redemptions and the timing of changes in the composition of the index. The Fund may invest in only a representative sample of the securities that comprise the index and may hold securities not included in the index, subjecting the Fund to increased tracking risk. Maintaining investments in securities regardless of market conditions or the investment merits of the securities in seeking to replicate an index’s composition or performance could cause the Fund’s returns to be lower than if the Fund employed an active strategy.
Management Risk. Investment decisions, techniques, analyses or models implemented by a Fund’s manager or sub-adviser in seeking to achieve the Fund’s investment objective may not produce expected returns, may cause the Fund’s shares to lose value or may cause the Fund to underperform other funds with similar investment objectives.
U.S. Government Obligations Risk. U.S. Government obligations may be adversely impacted by changes in interest rates, and securities issued or guaranteed by U.S. Government agencies or government-sponsored entities may not be backed by the full faith and credit of the U.S. Government.
3
Performance
The following information provides some indication of the risks of investing in the Fund by showing changes in the Fund’s performance from year to year. The Fund’s average annual total returns are compared to the performance of one or more indices. Past performance before and after taxes is no guarantee of future results. Current month-end performance is available on the Fund’s website at www.allspringglobal.com.
|
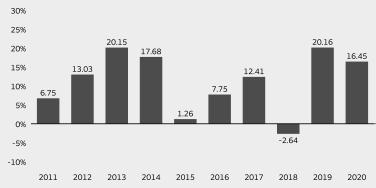
Calendar Year Total Returns for Class A as of 12/31 each year |
||
|
. |
Highest Quarter: |
+12.57% |
|
Lowest Quarter: |
-8.50% |
|
|
|
||

|
Average Annual Total Returns for the periods ended 12/31/2020 (returns reflect applicable sales charges) |
||||
|
Inception Date of Share Class |
1 Year |
5 Year |
10 Year |
|
|
Class A (before taxes) |
11/13/1986 |
9.56% |
9.04% |
10.15% |
|
Class A (after taxes on distributions) |
11/13/1986 |
8.44% |
8.34% |
9.46% |
|
Class A (after taxes on distributions and the sale of Fund Shares) |
11/13/1986 |
6.19% |
7.01% |
8.19% |
|
Class C (before taxes) |
4/1/1998 |
14.35% |
9.51% |
9.98% |
|
Index Asset Allocation Blended Index (reflects no deduction for fees, expenses, or taxes)1 |
15.18% |
10.89% |
11.40% |
|
|
Bloomberg U.S. Treasury Index (reflects no deduction for fees, expenses, or taxes) |
8.00% |
3.77% |
3.34% |
|
|
S&P 500 Index (reflects no deduction for fees, expenses, or taxes) |
18.40% |
15.22% |
13.88% |
|
| 1. | Source: Allspring Funds Management, LLC. The Index Asset Allocation Blended Index is composed 60% of the S&P 500 Index and 40% of the Bloomberg U.S. Treasury Index. Prior to April 1, 2015, the Index Asset Allocation Blended Index was composed 60% of the S&P 500 Index and 40% of the Bloomberg U.S. Treasury 20+ Year Index. You cannot invest directly in an index. |
After-tax returns are calculated using the historical highest individual federal marginal income tax rates and do not reflect the impact of state, local or foreign taxes. Actual after-tax returns depend on an investor’s tax situation and may differ from those shown, and after-tax returns shown are not relevant to tax-exempt investors or investors who hold their Fund shares through tax-deferred arrangements, such as 401(k) Plans or Individual Retirement Accounts.
4
Fund Management
|
Manager |
Sub-Adviser |
Portfolio Manager, Title/Managed Since |
|
Allspring Funds Management, LLC |
Allspring Global Investments, LLC |
Kandarp R. Acharya, CFA, FRM, Portfolio Manager / 2013 |
Purchase and Sale of Fund Shares
In general, you can buy or sell shares of the Fund online or by mail, phone or wire on any day the New York Stock Exchange is open for regular trading. You also may buy and sell shares through a financial professional.
|
Minimum Investments |
To Buy or Sell Shares |
|
Minimum Initial Investment |
Mail: Allspring Funds |
Tax Information
Any distributions you receive from the Fund may be taxable as ordinary income or capital gains, except when your investment is in an IRA, 401(k) or other tax-advantaged investment plan. However, subsequent withdrawals from such a tax-advantaged investment plan may be subject to federal income tax. You should consult your tax adviser about your specific tax situation.
Payments to Intermediaries
If you purchase a Fund through an intermediary, the Fund and its related companies may pay the intermediary for the sale of Fund shares and related services. These payments may create a conflict of interest by influencing the intermediary and your financial professional to recommend the Fund over another investment. Consult your financial professional or visit your intermediary’s website for more information.
|
Link to Prospectus |
Link to SAI |
5
This page intentionally left blank
|
©2021 Allspring Global Investments Holdings, LLC. All rights reserved. |
6
|
. |
Summary Prospectus |

Allspring Index Asset Allocation Fund
|
Class/Ticker: Administrator Class - WFAIX |
Link to Prospectus |
Link to SAI |
Before you invest, you may want to review the Fund’s prospectus, which contains more information about the Fund and its risks. You can find the Fund’s prospectus, reports to shareholders and other information about the Fund online at allspringglobal.com/reports. You can also get information at no cost by calling 1-800-222-8222, or by sending an email request to [email protected]. The current prospectus (“Prospectus”) and statement of additional information (“SAI”), dated February 1, 2021 as supplemented December 6, 2021, as supplemented from time to time, are incorporated by reference into this summary prospectus. The Fund’s SAI may be obtained, free of charge, in the same manner as the Prospectus.
Investment Objective
The Fund seeks long-term total return, consisting of capital appreciation and current income.
Fees and Expenses
These tables are intended to help you understand the various costs and expenses you will pay if you buy and hold shares of the Fund.
|
Shareholder Fees (fees paid directly from your investment) |
|
|
Maximum sales charge (load) imposed on purchases (as a percentage of offering price) |
None |
|
Maximum deferred sales charge (load) (as a percentage of offering price) |
None |
|
Annual Fund Operating Expenses (expenses that you pay each year as a percentage of the value of your investment) |
|
|
Management Fees |
0.60% |
|
Distribution (12b-1) Fees |
0.00% |
|
Other Expenses |
0.42% |
|
Total Annual Fund Operating Expenses |
1.02% |
|
Fee Waivers |
(0.12)% |
|
Total Annual Fund Operating Expenses After Fee Waivers1 |
0.90% |
| 1. | The Manager has contractually committed through January 31, 2022, to waive fees and/or reimburse expenses to the extent necessary to cap Total Annual Fund Operating Expenses After Fee Waiver at 0.90% for Administrator Class. Brokerage commissions, stamp duty fees, interest, taxes, acquired fund fees and expenses (if any), and extraordinary expenses are excluded from the expense cap. Prior to or after the commitment expiration date, the cap may be increased or the commitment to maintain the cap may be terminated only with the approval of the Board of Trustees. |
Example of Expenses
The example below is intended to help you compare the costs of investing in the Fund with the costs of investing in other funds. The example assumes a $10,000 initial investment, 5% annual total return, and that fees and expenses remain the same as in the tables above. To the extent that the Manager is waiving fees or reimbursing expenses, the example assumes that such waiver or reimbursement will only be in place through the date noted above. Although your actual costs may be higher or lower, based on these assumptions, your costs would be:
|
After: |
|
|
1 Year |
$92 |
|
3 Years |
$313 |
|
5 Years |
$552 |
1
|
After: |
|
|
10 Years |
$1,237 |
2
Portfolio Turnover
The Fund pays transaction costs, such as commissions, when it buys and sells securities (or “turns over” its portfolio). A higher portfolio turnover rate may indicate higher transaction costs and may result in higher taxes when Fund shares are held in a taxable account. These costs, which are not reflected in annual fund operating expenses or in the example, affect the Fund’s performance. During the most recent fiscal year, the Fund’s portfolio turnover rate was 19% of the average value of its portfolio.
Principal Investment Strategies
The Fund invests in equity and fixed income securities with an emphasis on equity securities. Under normal circumstances, we invest at least 80% of the Fund’s net assets in equity and fixed income securities designed to replicate the holdings and weightings of the securities comprising the S&P 500 Index and Bloomberg U.S. Treasury Index. We seek to achieve the Fund’s investment objective by allocating up to 75% of its assets in equity securities and up to 55% of its assets in fixed income securities.
The Fund’s “neutral” target allocation is as follows:
| ■ | 60% of the Fund’s total assets in equity securities; and |
| ■ | 40% of the Fund’s total assets in fixed income securities. |
The Fund does not select individual securities for investment; rather, it buys substantially all of the securities of various indexes to replicate such indices. The Fund invests the equity portion of its assets in common stocks to replicate the S&P 500 Index, and invests the fixed income portion of its assets in U.S. Treasury notes and bonds to replicate the Bloomberg U.S. Treasury Index. We seek to maintain 95% or better performance correlation with the respective indexes, before fees and expenses, regardless of market conditions.
We employ both quantitative analysis and qualitative judgments in making tactical allocations among stocks and bonds. Quantitative analysis involves the use of proprietary asset allocation models, which employ various valuation techniques. Qualitative judgments are made based on assessments of a number of factors, including economic conditions, corporate earnings, monetary policy, market valuations, investor sentiment, and technical market factors. We use futures contracts to implement changes to target allocations and to make adjustments to the duration of the Fund’s fixed income portion.
The percentage of Fund assets that we invest in different asset classes may temporarily deviate from the Fund’s target allocations due to changes in market values. We may use cash flows or effect transactions to re-establish the target allocations.
Portfolio Asset Allocation
The following table provides the Fund’s neutral allocations and target allocation ranges.
|
Investment Style |
Neutral Target |
Target Allocation |
|
|
Stock Funds |
60% |
45-75% |
|
|
Bond Funds |
40% |
25-55% |
|
Principal Investment Risks
An investment in the Fund may lose money, is not a deposit of a bank or its affiliates, is not insured or guaranteed by the Federal Deposit Insurance Corporation or any other governmental agency, and is primarily subject to the risks briefly summarized below.
Market Risk. The values of, and/or the income generated by, securities held by the Fund may decline due to general market conditions or other factors, including those directly involving the issuers of such securities. Securities markets are volatile and may decline significantly in response to adverse issuer, regulatory, political, or economic developments. Different sectors of the market and different security types may react differently to such developments.
Equity Securities Risk. The values of equity securities may experience periods of substantial price volatility and may decline significantly over short time periods. In general, the values of equity securities are more volatile than those of debt securities. Equity securities fluctuate in value and price in response to factors specific to the issuer of the security, such as management performance, financial condition, and market demand for the issuer’s products or services, as well as factors unrelated to the fundamental condition of the issuer, including general market, economic and political conditions. Different parts of a market, industry and sector may react differently to adverse issuer, market, regulatory, political, and economic developments.
Debt Securities Risk. Debt securities are subject to credit risk and interest rate risk. Credit risk is the possibility that the issuer or guarantor of a debt security may be unable, or perceived to be unable, to pay interest or repay principal when they become due. In these instances, the value of an investment could decline and the Fund could lose money. Credit risk increases as an issuer’s credit quality or financial strength declines. Interest rate risk is the possibility that interest rates will change over time. When interest rates rise, the value of debt securities tends to fall. The longer the terms of the debt securities held by a Fund,
3
the more the Fund is subject to this risk. If interest rates decline, interest that the Fund is able to earn on its investments in debt securities may also decline, which could cause the Fund to reduce the dividends it pays to shareholders, but the value of those securities may increase. Very low or negative interest rates may magnify interest rate risk.
Derivatives Risk. The use of derivatives, such as futures, options and swap agreements, can lead to losses, including those magnified by leverage, particularly when derivatives are used to enhance return rather than mitigate risk. Certain derivative instruments may be difficult to sell when the portfolio manager believes it would be appropriate to do so, or the other party to a derivative contract may be unwilling or unable to fulfill its contractual obligations.
Futures Contracts Risk. A Fund that uses futures contracts, which are a type of derivative, is subject to the risk of loss caused by unanticipated market movements. In addition, there may at times be an imperfect correlation between the movement in the prices of futures contracts and the value of their underlying instruments or indexes, and there may at times not be a liquid secondary market for certain futures contracts.
Index Tracking Risk. A Fund may not achieve exact correlation between the performance of the Fund and the index it tracks due to factors such as transaction costs, shareholder purchases and redemptions and the timing of changes in the composition of the index. The Fund may invest in only a representative sample of the securities that comprise the index and may hold securities not included in the index, subjecting the Fund to increased tracking risk. Maintaining investments in securities regardless of market conditions or the investment merits of the securities in seeking to replicate an index’s composition or performance could cause the Fund’s returns to be lower than if the Fund employed an active strategy.
Management Risk. Investment decisions, techniques, analyses or models implemented by a Fund’s manager or sub-adviser in seeking to achieve the Fund’s investment objective may not produce expected returns, may cause the Fund’s shares to lose value or may cause the Fund to underperform other funds with similar investment objectives.
U.S. Government Obligations Risk. U.S. Government obligations may be adversely impacted by changes in interest rates, and securities issued or guaranteed by U.S. Government agencies or government-sponsored entities may not be backed by the full faith and credit of the U.S. Government.
4
Performance
The following information provides some indication of the risks of investing in the Fund by showing changes in the Fund’s performance from year to year. The Fund’s average annual total returns are compared to the performance of one or more indices. Past performance before and after taxes is no guarantee of future results. Current month-end performance is available on the Fund’s website at www.allspringglobal.com.
|
Calendar Year Total Returns for Administrator Class as of 12/31 each year |
||
|
. |
Highest Quarter: |
+12.65% |
|
Lowest Quarter: |
-8.46% |
|
|
|
||
|
Average Annual Total Returns for the periods ended 12/31/2020 |
||||
|
Inception Date of Share Class |
1 Year |
5 Year |
10 Year |
|
|
Administrator Class (before taxes) |
11/8/1999 |
16.45% |
10.53% |
11.04% |
|
Administrator Class (after taxes on distributions) |
11/8/1999 |
15.20% |
9.78% |
10.28% |
|
Administrator Class (after taxes on distributions and the sale of Fund Shares) |
11/8/1999 |
10.32% |
8.23% |
8.95% |
|
Index Asset Allocation Blended Index (reflects no deduction for fees, expenses, or taxes)1 |
15.18% |
10.89% |
11.40% |
|
|
Bloomberg U.S. Treasury Index (reflects no deduction for fees, expenses, or taxes) |
8.00% |
3.77% |
3.34% |
|
|
S&P 500 Index (reflects no deduction for fees, expenses, or taxes) |
18.40% |
15.22% |
13.88% |
|
| 1. | Source: Allspring Funds Management, LLC. The Index Asset Allocation Blended Index is composed 60% of the S&P 500 Index and 40% of the Bloomberg U.S. Treasury Index. Prior to April 1, 2015, the Index Asset Allocation Blended Index was composed 60% of the S&P 500 Index and 40% of the Bloomberg U.S. Treasury 20+ Year Index. You cannot invest directly in an index. |
After-tax returns are calculated using the historical highest individual federal marginal income tax rates and do not reflect the impact of state, local or foreign taxes. Actual after-tax returns depend on an investor’s tax situation and may differ from those shown, and after-tax returns shown are not relevant to tax-exempt investors or investors who hold their Fund shares through tax-deferred arrangements, such as 401(k) Plans or Individual Retirement Accounts.
5
Fund Management
|
Manager |
Sub-Adviser |
Portfolio Manager, Title/Managed Since |
|
Allspring Funds Management, LLC |
Allspring Global Investments, LLC |
Kandarp R. Acharya, CFA, FRM, Portfolio Manager / 2013 |
Purchase and Sale of Fund Shares
Administrator Class shares are generally available through intermediaries for the accounts of their customers and directly to institutional investors and individuals. Institutional investors may include corporations; private banks and trust companies; endowments and foundations; defined contribution, defined benefit and other employer sponsored retirement plans; institutional retirement plan platforms; insurance companies; registered investment advisor firms; bank trusts; 529 college savings plans; family offices; and funds of funds, including those managed by Allspring Funds Management. In general, you can buy or sell shares of the Fund online or by mail, phone or wire, on any day the New York Stock Exchange (“NYSE”) is open for regular trading. You also may buy and sell shares through a financial professional.
|
Minimum Investments |
To Buy or Sell Shares |
|
Minimum Initial Investment |
Mail: Allspring Funds |
Tax Information
Any distributions you receive from the Fund may be taxable as ordinary income or capital gains, except when your investment is in an IRA, 401(k) or other tax-advantaged investment plan. However, subsequent withdrawals from such a tax-advantaged investment plan may be subject to federal income tax. You should consult your tax adviser about your specific tax situation.
Payments to Intermediaries
If you purchase a Fund through an intermediary, the Fund and its related companies may pay the intermediary for the sale of Fund shares and related services. These payments may create a conflict of interest by influencing the intermediary and your financial professional to recommend the Fund over another investment. Consult your financial professional or visit your intermediary’s website for more information.
|
Link to Prospectus |
Link to SAI |
|
©2021 Allspring Global Investments Holdings, LLC. All rights reserved. |
6
|
. |
Summary Prospectus |

Allspring Index Asset Allocation Fund
|
Class/Ticker: Institutional Class - WFATX |
Link to Prospectus |
Link to SAI |
Before you invest, you may want to review the Fund’s prospectus, which contains more information about the Fund and its risks. You can find the Fund’s prospectus, reports to shareholders and other information about the Fund online at allspringglobal.com/reports. You can also get information at no cost by calling 1-800-222-8222, or by sending an email request to [email protected]. The current prospectus (“Prospectus”) and statement of additional information (“SAI”), dated February 1, 2021 as supplemented December 6, 2021, as supplemented from time to time, are incorporated by reference into this summary prospectus. The Fund’s SAI may be obtained, free of charge, in the same manner as the Prospectus.
Investment Objective
The Fund seeks long-term total return, consisting of capital appreciation and current income.
Fees and Expenses
These tables are intended to help you understand the various costs and expenses you will pay if you buy and hold shares of the Fund.
|
Shareholder Fees (fees paid directly from your investment) |
|
|
Maximum sales charge (load) imposed on purchases (as a percentage of offering price) |
None |
|
Maximum deferred sales charge (load) (as a percentage of offering price) |
None |
|
Annual Fund Operating Expenses (expenses that you pay each year as a percentage of the value of your investment) |
|
|
Management Fees |
0.60% |
|
Distribution (12b-1) Fees |
0.00% |
|
Other Expenses |
0.17% |
|
Total Annual Fund Operating Expenses |
0.77% |
|
Fee Waivers |
(0.02)% |
|
Total Annual Fund Operating Expenses After Fee Waivers1 |
0.75% |
| 1. | The Manager has contractually committed through January 31, 2022, to waive fees and/or reimburse expenses to the extent necessary to cap Total Annual Fund Operating Expenses After Fee Waiver at 0.75% for Institutional Class. Brokerage commissions, stamp duty fees, interest, taxes, acquired fund fees and expenses (if any), and extraordinary expenses are excluded from the expense cap. Prior to or after the commitment expiration date, the cap may be increased or the commitment to maintain the cap may be terminated only with the approval of the Board of Trustees. |
Example of Expenses
The example below is intended to help you compare the costs of investing in the Fund with the costs of investing in other funds. The example assumes a $10,000 initial investment, 5% annual total return, and that fees and expenses remain the same as in the tables above. To the extent that the Manager is waiving fees or reimbursing expenses, the example assumes that such waiver or reimbursement will only be in place through the date noted above. Although your actual costs may be higher or lower, based on these assumptions, your costs would be:
|
After: |
|
|
1 Year |
$77 |
|
3 Years |
$244 |
|
5 Years |
$426 |
1
|
After: |
|
|
10 Years |
$952 |
2
Portfolio Turnover
The Fund pays transaction costs, such as commissions, when it buys and sells securities (or “turns over” its portfolio). A higher portfolio turnover rate may indicate higher transaction costs and may result in higher taxes when Fund shares are held in a taxable account. These costs, which are not reflected in annual fund operating expenses or in the example, affect the Fund’s performance. During the most recent fiscal year, the Fund’s portfolio turnover rate was 19% of the average value of its portfolio.
Principal Investment Strategies
The Fund invests in equity and fixed income securities with an emphasis on equity securities. Under normal circumstances, we invest at least 80% of the Fund’s net assets in equity and fixed income securities designed to replicate the holdings and weightings of the securities comprising the S&P 500 Index and Bloomberg U.S. Treasury Index. We seek to achieve the Fund’s investment objective by allocating up to 75% of its assets in equity securities and up to 55% of its assets in fixed income securities.
The Fund’s “neutral” target allocation is as follows:
| ■ | 60% of the Fund’s total assets in equity securities; and |
| ■ | 40% of the Fund’s total assets in fixed income securities. |
The Fund does not select individual securities for investment; rather, it buys substantially all of the securities of various indexes to replicate such indices. The Fund invests the equity portion of its assets in common stocks to replicate the S&P 500 Index, and invests the fixed income portion of its assets in U.S. Treasury notes and bonds to replicate the Bloomberg U.S. Treasury Index. We seek to maintain 95% or better performance correlation with the respective indexes, before fees and expenses, regardless of market conditions.
We employ both quantitative analysis and qualitative judgments in making tactical allocations among stocks and bonds. Quantitative analysis involves the use of proprietary asset allocation models, which employ various valuation techniques. Qualitative judgments are made based on assessments of a number of factors, including economic conditions, corporate earnings, monetary policy, market valuations, investor sentiment, and technical market factors. We use futures contracts to implement changes to target allocations and to make adjustments to the duration of the Fund’s fixed income portion.
The percentage of Fund assets that we invest in different asset classes may temporarily deviate from the Fund’s target allocations due to changes in market values. We may use cash flows or effect transactions to re-establish the target allocations.
Portfolio Asset Allocation
The following table provides the Fund’s neutral allocations and target allocation ranges.
|
Investment Style |
Neutral Target |
Target Allocation |
|
|
Stock Funds |
60% |
45-75% |
|
|
Bond Funds |
40% |
25-55% |
|
Principal Investment Risks
An investment in the Fund may lose money, is not a deposit of a bank or its affiliates, is not insured or guaranteed by the Federal Deposit Insurance Corporation or any other governmental agency, and is primarily subject to the risks briefly summarized below.
Market Risk. The values of, and/or the income generated by, securities held by the Fund may decline due to general market conditions or other factors, including those directly involving the issuers of such securities. Securities markets are volatile and may decline significantly in response to adverse issuer, regulatory, political, or economic developments. Different sectors of the market and different security types may react differently to such developments.
Equity Securities Risk. The values of equity securities may experience periods of substantial price volatility and may decline significantly over short time periods. In general, the values of equity securities are more volatile than those of debt securities. Equity securities fluctuate in value and price in response to factors specific to the issuer of the security, such as management performance, financial condition, and market demand for the issuer’s products or services, as well as factors unrelated to the fundamental condition of the issuer, including general market, economic and political conditions. Different parts of a market, industry and sector may react differently to adverse issuer, market, regulatory, political, and economic developments.
Debt Securities Risk. Debt securities are subject to credit risk and interest rate risk. Credit risk is the possibility that the issuer or guarantor of a debt security may be unable, or perceived to be unable, to pay interest or repay principal when they become due. In these instances, the value of an investment could decline and the Fund could lose money. Credit risk increases as an issuer’s credit quality or financial strength declines. Interest rate risk is the possibility that interest rates will change over time. When interest rates rise, the value of debt securities tends to fall. The longer the terms of the debt securities held by a Fund,
3
the more the Fund is subject to this risk. If interest rates decline, interest that the Fund is able to earn on its investments in debt securities may also decline, which could cause the Fund to reduce the dividends it pays to shareholders, but the value of those securities may increase. Very low or negative interest rates may magnify interest rate risk.
Derivatives Risk. The use of derivatives, such as futures, options and swap agreements, can lead to losses, including those magnified by leverage, particularly when derivatives are used to enhance return rather than mitigate risk. Certain derivative instruments may be difficult to sell when the portfolio manager believes it would be appropriate to do so, or the other party to a derivative contract may be unwilling or unable to fulfill its contractual obligations.
Futures Contracts Risk. A Fund that uses futures contracts, which are a type of derivative, is subject to the risk of loss caused by unanticipated market movements. In addition, there may at times be an imperfect correlation between the movement in the prices of futures contracts and the value of their underlying instruments or indexes, and there may at times not be a liquid secondary market for certain futures contracts.
Index Tracking Risk. A Fund may not achieve exact correlation between the performance of the Fund and the index it tracks due to factors such as transaction costs, shareholder purchases and redemptions and the timing of changes in the composition of the index. The Fund may invest in only a representative sample of the securities that comprise the index and may hold securities not included in the index, subjecting the Fund to increased tracking risk. Maintaining investments in securities regardless of market conditions or the investment merits of the securities in seeking to replicate an index’s composition or performance could cause the Fund’s returns to be lower than if the Fund employed an active strategy.
Management Risk. Investment decisions, techniques, analyses or models implemented by a Fund’s manager or sub-adviser in seeking to achieve the Fund’s investment objective may not produce expected returns, may cause the Fund’s shares to lose value or may cause the Fund to underperform other funds with similar investment objectives.
U.S. Government Obligations Risk. U.S. Government obligations may be adversely impacted by changes in interest rates, and securities issued or guaranteed by U.S. Government agencies or government-sponsored entities may not be backed by the full faith and credit of the U.S. Government.
4
Performance
The following information provides some indication of the risks of investing in the Fund by showing changes in the Fund’s performance from year to year. The Fund’s average annual total returns are compared to the performance of one or more indices. Past performance before and after taxes is no guarantee of future results. Current month-end performance is available on the Fund’s website at www.allspringglobal.com.
|
Calendar Year Total Returns for Institutional Class as of 12/31 each year1 |
||
|
. |
Highest Quarter: |
+12.67% |
|
Lowest Quarter: |
-8.44% |
|
|
|
||

|
Average Annual Total Returns for the periods ended 12/31/20201 |
||||
|
Inception Date of Share Class |
1 Year |
5 Year |
10 Year |
|
|
Institutional Class (before taxes) |
10/31/2016 |
16.61% |
10.68% |
11.11% |
|
Institutional Class (after taxes on distributions) |
10/31/2016 |
15.30% |
9.88% |
10.33% |
|
Institutional Class (after taxes on distributions and the sale of Fund Shares) |
10/31/2016 |
10.43% |
8.33% |
9.00% |
|
Index Asset Allocation Blended Index (reflects no deduction for fees, expenses, or taxes)2 |
15.18% |
10.89% |
11.40% |
|
|
Bloomberg U.S. Treasury Index (reflects no deduction for fees, expenses, or taxes) |
8.00% |
3.77% |
3.34% |
|
|
S&P 500 Index (reflects no deduction for fees, expenses, or taxes) |
18.40% |
15.22% |
13.88% |
|
| 1. | Historical performance shown for the Institutional Class shares prior to their inception reflects the performance of the Administrator Class shares, and is not adjusted to reflect the expenses of the Institutional Class shares. If these expenses had been included, returns for the Institutional Class shares would be higher. |
| 2. | Source: Allspring Funds Management, LLC. The Index Asset Allocation Blended Index is composed 60% of the S&P 500 Index and 40% of the Bloomberg U.S. Treasury Index. Prior to April 1, 2015, the Index Asset Allocation Blended Index was composed 60% of the S&P 500 Index and 40% of the Bloomberg U.S. Treasury 20+ Year Index. You cannot invest directly in an index. |
After-tax returns are calculated using the historical highest individual federal marginal income tax rates and do not reflect the impact of state, local or foreign taxes. Actual after-tax returns depend on an investor’s tax situation and may differ from those shown, and after-tax returns shown are not relevant to tax-exempt investors or investors who hold their Fund shares through tax-deferred arrangements, such as 401(k) Plans or Individual Retirement Accounts.
5
Fund Management
|
Manager |
Sub-Adviser |
Portfolio Manager, Title/Managed Since |
|
Allspring Funds Management, LLC |
Allspring Global Investments, LLC |
Kandarp R. Acharya, CFA, FRM, Portfolio Manager / 2013 |
Purchase and Sale of Fund Shares
Institutional Class shares are generally available through intermediaries for the accounts of their customers and directly to institutional investors and individuals. Institutional investors may include corporations; private banks and trust companies; endowments and foundations; defined contribution, defined benefit and other employer sponsored retirement plans; institutional retirement plan platforms; insurance companies; registered investment advisor firms; bank trusts; 529 college savings plans; family offices; and funds of funds, including those managed by Allspring Funds Management. In general, you can buy or sell shares of the Fund online or by mail, phone or wire, on any day the New York Stock Exchange (“NYSE”) is open for regular trading. You also may buy and sell shares through a financial professional.
|
Minimum Investments |
To Buy or Sell Shares |
|
Minimum Initial Investment Minimum Additional Investment |
Mail: Allspring Funds Contact your financial professional. |
Tax Information
Any distributions you receive from the Fund may be taxable as ordinary income or capital gains, except when your investment is in an IRA, 401(k) or other tax-advantaged investment plan. However, subsequent withdrawals from such a tax-advantaged investment plan may be subject to federal income tax. You should consult your tax adviser about your specific tax situation.
Payments to Intermediaries
If you purchase a Fund through an intermediary, the Fund and its related companies may pay the intermediary for the sale of Fund shares and related services. These payments may create a conflict of interest by influencing the intermediary and your financial professional to recommend the Fund over another investment. Consult your financial professional or visit your intermediary’s website for more information.
|
Link to Prospectus |
Link to SAI |
|
©2021 Allspring Global Investments Holdings, LLC. All rights reserved. |
6
Serious News for Serious Traders! Try StreetInsider.com Premium Free!
You May Also Be Interested In
- Wells Fargo Upgrades Neurocrine Bio. (NBIX) to Overweight 'as the Company is Knocking on the Doors of the Large-Cap Club'
- Domino's Pizza (DPZ) PT Raised to $475 at Wells Fargo
- Spotify (SPOT) PT Raised to $400 at Wells Fargo
Create E-mail Alert Related Categories
SEC FilingsRelated Entities
Wells FargoSign up for StreetInsider Free!
Receive full access to all new and archived articles, unlimited portfolio tracking, e-mail alerts, custom newswires and RSS feeds - and more!
