

Form 497K WELLS FARGO FUNDS TRUST
 Tweet
Tweet Share
Share
Allspring Emerging Growth Fund
|
Class/Ticker: Class R6 - WEGRX |
Link to Prospectus |
Link to SAI |
Before you invest, you may want to review the Fund’s prospectus, which contains more information about the Fund and its risks. You can find the Fund’s prospectus, reports to shareholders and other information about the Fund online at allspringglobal.com/reports. You can also get information at no cost by calling 1-800-222-8222, or by sending an email request to [email protected]. The current prospectus (“Prospectus”) and statement of additional information (“SAI”), dated October 1, 2021, as supplemented December 6, 2021, as supplemented from time to time, are incorporated by reference into this summary prospectus. The Fund’s SAI may be obtained, free of charge, in the same manner as the Prospectus.
Investment Objective
The Fund seeks long-term capital appreciation.
Fees and Expenses
These tables are intended to help you understand the various costs and expenses you will pay if you buy and hold shares of the Fund.
|
Shareholder Fees (fees paid directly from your investment) |
|
|
Maximum sales charge (load) imposed on purchases (as a percentage of offering price) |
None |
|
Maximum deferred sales charge (load) (as a percentage of offering price) |
None |
|
Annual Fund Operating Expenses (expenses that you pay each year as a percentage of the value of your investment)1 |
|
|
Management Fees2 |
0.84% |
|
Distribution (12b-1) Fees |
0.00% |
|
Other Expenses |
0.08% |
|
Total Annual Fund Operating Expenses3 |
0.92% |
|
Fee Waivers |
(0.07)% |
|
Total Annual Fund Operating Expenses After Fee Waivers4 |
0.85% |
| 1. | Expenses have been adjusted as necessary from amounts incurred during the Fund’s most recent fiscal year to reflect current fees and expenses. |
| 2. | Includes the fees charged by the Manager for providing advisory services to the master portfolio in which the Fund invests substantially all of its assets. |
| 3. | Includes other expenses allocated from the master portfolio in which the Fund invests. |
| 4. | The Manager has contractually committed through September 30, 2022, to waive fees and/or reimburse expenses to the extent necessary to cap Total Annual Fund Operating Expenses After Fee Waivers at 0.85% for Class R6. Brokerage commissions, stamp duty fees, interest, taxes, acquired fund fees and expenses (if any) from funds in which the underlying affiliated master portfolios and funds invest and from money market funds, and extraordinary expenses are excluded from the expense cap. All other acquired fund fees and expenses from the affiliated master portfolios and funds are included in the expense cap. Prior to or after the commitment expiration date, the cap may be increased or the commitment to maintain the cap may be terminated only with the approval of the Board of Trustees. |
Example of Expenses
The example below is intended to help you compare the costs of investing in the Fund with the costs of investing in other funds. The example assumes a $10,000 initial investment, 5% annual total return, and that fees and expenses remain the same as in the tables above. To the extent that the Manager is waiving fees or reimbursing expenses, the example assumes that such waiver or reimbursement will only be in place through the date noted above. Although your actual costs may be higher or lower, based on these assumptions, your costs would be:
1
|
After: |
|
|
1 Year |
$87 |
|
3 Years |
$286 |
|
5 Years |
$502 |
|
10 Years |
$1,125 |
Portfolio Turnover
The Fund pays transaction costs, such as commissions, when it buys and sells securities (or “turns over” its portfolio). A higher portfolio turnover rate may indicate higher transaction costs and may result in higher taxes when Fund shares are held in a taxable account. These costs, which are not reflected in annual fund operating expenses or in the example, affect the Fund’s performance. During the most recent fiscal year, the Fund’s portfolio turnover rate was 48% of the average value of its portfolio.
Principal Investment Strategies
Under normal circumstances, we invest:
| ■ | at least 80% of the Fund’s total assets in equity securities of small-capitalization companies; and |
| ■ | up to 25% of the Fund’s total assets in equity securities of foreign issuers through American Depository Receipts (ADRs) and similar investments. |
The Fund is a feeder fund that invests substantially all of its assets in the Emerging Growth Portfolio, a master portfolio with a substantially identical investment objective and substantially similar investment strategies. We may invest in additional master portfolios, in other Allspring Funds, or directly in a portfolio of securities.
We invest principally in equity securities of small-capitalization companies, which we define as companies with market capitalizations within the range of the Russell 2000® Index at the time of purchase. The market capitalization range of the Russell 2000® Index was approximately $34.49 million to $28.21 billion, as of August 31, 2021, and is expected to change frequently. Small-capitalization companies may include both domestic and foreign small-capitalization companies.
We seek small-capitalization companies that are in the emerging phase of their life cycle. We believe earnings and revenue growth relative to consensus expectations are critical factors in determining stock price movements. Thus, our investment process focuses on identifying companies with robust and sustainable growth in revenue and earnings that are underappreciated by the market. To find that growth, we use bottom-up research, emphasizing companies whose management teams have a history of successfully executing their strategy and whose business model have sufficient profit potential. We forecast revenue and earnings growth along with other key financial metrics to assess investment potential. We then combine that company-specific analysis with our assessment of what the market is discounting for growth to form a buy/sell decision about a particular stock. We seek to capitalize on investment opportunities where a sizable gap exists between market consensus and our expectation for a company’s growth prospects. We may invest in any sector and, at times, we may emphasize one or more particular sectors. In addition, our investment process is built on a foundation of continuous risk management and a strict sell discipline. We sell a company’s securities when we see signs that can cause a company’s growth prospects to deteriorate, as this often leads to lower valuation potential. We may also sell or trim a position when we need to raise money to fund the purchase of a better investment opportunity or when valuation has extended beyond our expectations.
Principal Investment Risks
Because the Fund invests substantially all of its assets in a master portfolio with a substantially identical investment objective and substantially similar investment strategies, the following principal risks include those risks that result from the Fund’s investment in the master portfolio. In this section, references to the Fund should be read to include the Fund and the master portfolio, as appropriate.
The Fund’s performance will not correlate perfectly with that of the master portfolio due to the impact of the Fund’s fees and expenses and to the timing and magnitude of cash flows into and out of the Fund, which will create cash balances that cause the Fund’s performance to deviate from the performance of the master portfolio.
An investment in the Fund may lose money, is not a deposit of a bank or its affiliates, is not insured or guaranteed by the Federal Deposit Insurance Corporation or any other governmental agency, and is primarily subject to the risks briefly summarized below.
Market Risk. The values of, and/or the income generated by, securities held by the Fund may decline due to general market conditions or other factors, including those directly involving the issuers of such securities. Securities markets are volatile and may decline significantly in response to adverse issuer, regulatory, political, or economic developments. Different sectors of the market and different security types may react differently to such developments.
Equity Securities Risk. The values of equity securities may experience periods of substantial price volatility and may decline
2
significantly over short time periods. In general, the values of equity securities are more volatile than those of debt securities. Equity securities fluctuate in value and price in response to factors specific to the issuer of the security, such as management performance, financial condition, and market demand for the issuer’s products or services, as well as factors unrelated to the fundamental condition of the issuer, including general market, economic and political conditions. Different parts of a market, industry and sector may react differently to adverse issuer, market, regulatory, political, and economic developments.
Smaller Company Securities Risk. Securities of companies with smaller market capitalizations tend to be more volatile and less liquid than those of larger companies.
Foreign Investment Risk. Foreign investments may be subject to lower liquidity, greater price volatility and risks related to adverse political, regulatory, market or economic developments. Foreign investments may involve exposure to changes in foreign currency exchange rates and may be subject to higher withholding and other taxes.
Growth/Value Investing Risk. Securities that exhibit growth or value characteristics tend to perform differently and shift into and out of favor with investors depending on changes in market and economic sentiment and conditions.
Management Risk. Investment decisions, techniques, analyses or models implemented by a Fund’s manager or sub-adviser in seeking to achieve the Fund’s investment objective may not produce expected returns, may cause the Fund’s shares to lose value or may cause the Fund to underperform other funds with similar investment objectives.
Performance
The following information provides some indication of the risks of investing in the Fund by showing changes in the Fund’s performance from year to year. The Fund’s average annual total returns are compared to the performance of one or more indices. Past performance before and after taxes is no guarantee of future results. Current month-end performance is available on the Fund’s website at allspringglobal.com.
|
Calendar Year Total Returns for Class R6 as of 12/31 each year1 |
||
|
. |
Highest Quarter: |
+42.82% |
|
Lowest Quarter: |
-22.56% |
|
|
Year-to-date total return as of June 30, 2021 is +9.32% |
||

|
Average Annual Total Returns for the periods ended 12/31/20201 |
||||
|
Inception Date of Share Class |
1 Year |
5 Year |
10 Year |
|
|
Class R6 |
7/31/2018 |
58.80% |
22.44% |
16.26% |
|
Russell 2000® Growth Index (reflects no deduction for fees, expenses, or taxes) |
34.63% |
16.36% |
13.48% |
|
| 1. | Historical performance shown for the Class R6 shares prior to their inception reflects the performance of the Institutional Class shares, and includes the higher expenses applicable to the Institutional Class shares. If these expenses had not been included, returns for the Class R6 shares would be higher. |
3
Fund Management
|
Manager |
Sub-Adviser1 |
Portfolio Manager, Title / Managed Since1 |
|
Allspring Funds Management, LLC |
Allspring Global Investments, LLC |
Robert Gruendyke, CFA, Portfolio Manager / 2020 |
| 1. | The sub-adviser and portfolio managers listed above are the sub-adviser and portfolio managers of the master portfolio in which the Fund invests substantially all of its assets. The Fund itself does not have a sub-adviser or portfolio managers. |
Purchase and Sale of Fund Shares
Class R6 shares generally are available only to certain retirement plans, including: 401(k) plans, 457 plans, profit sharing and money purchase pension plans, defined benefit plans, target benefit plans, and non-qualified deferred compensation plans. Class R6 shares also are generally available only to retirement plans where plan level or omnibus accounts are held on the books of the Fund. Class R6 shares also are available to funds of funds including those managed by Allspring Funds Management. Class R6 shares generally are not available to retail accounts but may be offered through intermediaries for the accounts of their customers to certain institutional and fee-based investors, and in each case, only if a dealer agreement is in place with Allspring Funds Distributor, LLC to offer Class R6 shares.
|
Institutions Purchasing Fund Shares |
|
Minimum Initial Investment |
Tax Information
By investing in a Fund through a tax-deferred retirement account, you will not be subject to tax on dividends and capital gains distributions from the Fund or the sale of Fund shares if those amounts remain in the tax-deferred account.
Distributions taken from retirement plan accounts generally are taxable as ordinary income. For special rules concerning tax-deferred retirement accounts, including applications, restrictions, tax advantages, and potential sales charge waivers, contact your investment professional. To determine if a retirement plan may be appropriate for you and to obtain further information, consult your tax adviser.
|
Link to Prospectus |
Link to SAI |
|
©2022 Allspring Global Investments Holdings, LLC. All rights reserved. |
4

Allspring Emerging Growth Fund
|
Class/Ticker: Class A - WEMAX - Class C - WEMCX |
Link to Prospectus |
Link to SAI |
Before you invest, you may want to review the Fund’s prospectus, which contains more information about the Fund and its risks. You can find the Fund’s prospectus, reports to shareholders and other information about the Fund online at allspringglobal.com/reports. You can also get information at no cost by calling 1-800-222-8222, or by sending an email request to [email protected]. The current prospectus (“Prospectus”) and statement of additional information (“SAI”), dated October 1, 2021, as supplemented December 6, 2021, as supplemented from time to time, are incorporated by reference into this summary prospectus. The Fund’s SAI may be obtained, free of charge, in the same manner as the Prospectus.
Investment Objective
The Fund seeks long-term capital appreciation.
Fees and Expenses
These tables are intended to help you understand the various costs and expenses you will pay if you buy and hold shares of the Fund. You may qualify for sales charge discounts if you and your family invest, or agree to invest in the future, at least $50,000 in the aggregate in specified classes of certain Allspring Funds. More information about these and other discounts is available from your financial professional and in “Share Class Features” and “Reductions and Waivers of Sales Charges” on pages 40 and 41 of the Prospectus and “Additional Purchase and Redemption Information” on page 98 of the Statement of Additional Information. Investors who purchase through certain intermediaries may be subject to different sales charge discounts than those outlined shares in these sections. Please see Appendix A on page 64 for further information.
|
Shareholder Fees (fees paid directly from your investment) |
||
|
Class A |
Class C |
|
|
Maximum sales charge (load) imposed on purchases (as a percentage of offering price) |
5.75% |
None |
|
Maximum deferred sales charge (load) (as a percentage of offering price) |
None1 |
1.00% |
| 1. | Investments of $1 million or more are not subject to a front-end sales charge but generally will be subject to a deferred sales charge of 1.00% if redeemed within 18 months from the date of purchase. |
|
Annual Fund Operating Expenses (expenses that you pay each year as a percentage of the value of your investment)1 |
||
|
Class A |
Class C |
|
|
Management Fees2 |
0.84% |
0.84% |
|
Distribution (12b-1) Fees |
0.00% |
0.75% |
|
Other Expenses |
0.51% |
0.51% |
|
Total Annual Fund Operating Expenses3 |
1.35% |
2.10% |
|
Fee Waivers |
(0.07)% |
(0.07)% |
|
Total Annual Fund Operating Expenses After Fee Waivers4 |
1.28% |
2.03% |
| 1. | Expenses have been adjusted as necessary from amounts incurred during the Fund’s most recent fiscal year to reflect current fees and expenses. |
| 2. | Includes the fees charged by the Manager for providing advisory services to the master portfolio in which the Fund invests substantially all of its assets. |
| 3. | Includes other expenses allocated from the master portfolio in which the Fund invests. |
| 4. | The Manager has contractually committed through September 30, 2022, to waive fees and/or reimburse expenses to the extent necessary to cap Total Annual Fund Operating Expenses After Fee Waivers at 1.28% for Class A and 2.03% for Class C. Brokerage commissions, stamp duty fees, interest, taxes, acquired fund fees and expenses (if any) from funds in which the underlying affiliated master portfolios and funds invest and from money market funds, and extraordinary expenses are excluded from the expense cap. All other acquired fund fees and expenses from the affiliated master portfolios and funds are included in the expense cap. Prior to or after the commitment expiration date, the cap may be increased or the commitment to maintain the cap may be terminated only with the approval of the Board of Trustees. |
1
Example of Expenses
The example below is intended to help you compare the costs of investing in the Fund with the costs of investing in other funds. The example assumes a $10,000 initial investment, 5% annual total return, and that fees and expenses remain the same as in the tables above. To the extent that the Manager is waiving fees or reimbursing expenses, the example assumes that such waiver or reimbursement will only be in place through the date noted above. Although your actual costs may be higher or lower, based on these assumptions, your costs would be:
|
Assuming Redemption at End of Period |
Assuming No Redemption |
|||
|
After: |
Class A |
Class C |
Class C |
|
|
1 Year |
$698 |
$306 |
$206 |
|
|
3 Years |
$972 |
$651 |
$651 |
|
|
5 Years |
$1,266 |
$1,122 |
$1,122 |
|
|
10 Years |
$2,100 |
$2,426 |
$2,426 |
|
Portfolio Turnover
The Fund pays transaction costs, such as commissions, when it buys and sells securities (or “turns over” its portfolio). A higher portfolio turnover rate may indicate higher transaction costs and may result in higher taxes when Fund shares are held in a taxable account. These costs, which are not reflected in annual fund operating expenses or in the example, affect the Fund’s performance. During the most recent fiscal year, the Fund’s portfolio turnover rate was 48% of the average value of its portfolio.
Principal Investment Strategies
Under normal circumstances, we invest:
| ■ | at least 80% of the Fund’s total assets in equity securities of small-capitalization companies; and |
| ■ | up to 25% of the Fund’s total assets in equity securities of foreign issuers through American Depository Receipts (ADRs) and similar investments. |
The Fund is a feeder fund that invests substantially all of its assets in the Emerging Growth Portfolio, a master portfolio with a substantially identical investment objective and substantially similar investment strategies. We may invest in additional master portfolios, in other Allspring Funds, or directly in a portfolio of securities.
We invest principally in equity securities of small-capitalization companies, which we define as companies with market capitalizations within the range of the Russell 2000® Index at the time of purchase. The market capitalization range of the Russell 2000® Index was approximately $34.49 million to $28.21 billion, as of August 31, 2021, and is expected to change frequently. Small-capitalization companies may include both domestic and foreign small-capitalization companies.
We seek small-capitalization companies that are in the emerging phase of their life cycle. We believe earnings and revenue growth relative to consensus expectations are critical factors in determining stock price movements. Thus, our investment process focuses on identifying companies with robust and sustainable growth in revenue and earnings that are underappreciated by the market. To find that growth, we use bottom-up research, emphasizing companies whose management teams have a history of successfully executing their strategy and whose business model have sufficient profit potential. We forecast revenue and earnings growth along with other key financial metrics to assess investment potential. We then combine that company-specific analysis with our assessment of what the market is discounting for growth to form a buy/sell decision about a particular stock. We seek to capitalize on investment opportunities where a sizable gap exists between market consensus and our expectation for a company’s growth prospects. We may invest in any sector and, at times, we may emphasize one or more particular sectors. In addition, our investment process is built on a foundation of continuous risk management and a strict sell discipline. We sell a company’s securities when we see signs that can cause a company’s growth prospects to deteriorate, as this often leads to lower valuation potential. We may also sell or trim a position when we need to raise money to fund the purchase of a better investment opportunity or when valuation has extended beyond our expectations.
Principal Investment Risks
Because the Fund invests substantially all of its assets in a master portfolio with a substantially identical investment objective and substantially similar investment strategies, the following principal risks include those risks that result from the Fund’s investment in the master portfolio. In this section, references to the Fund should be read to include the Fund and the master portfolio, as appropriate.
The Fund’s performance will not correlate perfectly with that of the master portfolio due to the impact of the Fund’s fees and expenses and to the timing and magnitude of cash flows into and out of the Fund, which will create cash balances that cause the Fund’s performance to deviate from the performance of the master portfolio.
An investment in the Fund may lose money, is not a deposit of a bank or its affiliates, is not insured or guaranteed by the
2
Federal Deposit Insurance Corporation or any other governmental agency, and is primarily subject to the risks briefly summarized below.
Market Risk. The values of, and/or the income generated by, securities held by the Fund may decline due to general market conditions or other factors, including those directly involving the issuers of such securities. Securities markets are volatile and may decline significantly in response to adverse issuer, regulatory, political, or economic developments. Different sectors of the market and different security types may react differently to such developments.
Equity Securities Risk. The values of equity securities may experience periods of substantial price volatility and may decline significantly over short time periods. In general, the values of equity securities are more volatile than those of debt securities. Equity securities fluctuate in value and price in response to factors specific to the issuer of the security, such as management performance, financial condition, and market demand for the issuer’s products or services, as well as factors unrelated to the fundamental condition of the issuer, including general market, economic and political conditions. Different parts of a market, industry and sector may react differently to adverse issuer, market, regulatory, political, and economic developments.
Smaller Company Securities Risk. Securities of companies with smaller market capitalizations tend to be more volatile and less liquid than those of larger companies.
Foreign Investment Risk. Foreign investments may be subject to lower liquidity, greater price volatility and risks related to adverse political, regulatory, market or economic developments. Foreign investments may involve exposure to changes in foreign currency exchange rates and may be subject to higher withholding and other taxes.
Growth/Value Investing Risk. Securities that exhibit growth or value characteristics tend to perform differently and shift into and out of favor with investors depending on changes in market and economic sentiment and conditions.
Management Risk. Investment decisions, techniques, analyses or models implemented by a Fund’s manager or sub-adviser in seeking to achieve the Fund’s investment objective may not produce expected returns, may cause the Fund’s shares to lose value or may cause the Fund to underperform other funds with similar investment objectives.
Performance
The following information provides some indication of the risks of investing in the Fund by showing changes in the Fund’s performance from year to year. The Fund’s average annual total returns are compared to the performance of one or more indices. Past performance before and after taxes is no guarantee of future results. Current month-end performance is available on the Fund’s website at allspringglobal.com.
|
Calendar Year Total Returns for Class A as of 12/31 each year |
||
|
. |
Highest Quarter: |
+42.72% |
|
Lowest Quarter: |
-22.65% |
|
|
Year-to-date total return as of June 30, 2021 is +9.05% |
||

|
Average Annual Total Returns for the periods ended 12/31/2020 (returns reflect applicable sales charges) |
||||
|
Inception Date of Share Class |
1 Year |
5 Year |
10 Year |
|
|
Class A (before taxes) |
3/31/2008 |
49.16% |
20.45% |
15.03% |
|
Class A (after taxes on distributions) |
3/31/2008 |
41.74% |
16.67% |
12.40% |
|
Class A (after taxes on distributions and the sale of Fund Shares) |
3/31/2008 |
33.29% |
15.52% |
11.71% |
|
Class C (before taxes) |
3/31/2008 |
56.28% |
21.00% |
14.87% |
3
|
Average Annual Total Returns for the periods ended 12/31/2020 (returns reflect applicable sales charges) |
||||
|
Inception Date of Share Class |
1 Year |
5 Year |
10 Year |
|
|
Russell 2000® Growth Index (reflects no deduction for fees, expenses, or taxes) |
34.63% |
16.36% |
13.48% |
|
After-tax returns are calculated using the historical highest individual federal marginal income tax rates and do not reflect the impact of state, local or foreign taxes. Actual after-tax returns depend on an investor’s tax situation and may differ from those shown, and after-tax returns shown are not relevant to tax-exempt investors or investors who hold their Fund shares through tax-deferred arrangements, such as 401(k) Plans or Individual Retirement Accounts. After-tax returns are shown for only one class of shares. After-tax returns for any other class will vary.
Fund Management
|
Manager |
Sub-Adviser1 |
Portfolio Manager, Title / Managed Since1 |
|
Allspring Funds Management, LLC |
Allspring Global Investments, LLC |
Robert Gruendyke, CFA, Portfolio Manager / 2020 |
| 1. | The sub-adviser and portfolio managers listed above are the sub-adviser and portfolio managers of the master portfolio in which the Fund invests substantially all of its assets. The Fund itself does not have a sub-adviser or portfolio managers. |
Purchase and Sale of Fund Shares
In general, you can buy or sell shares of the Fund online or by mail, phone or wire on any day the New York Stock Exchange is open for regular trading. You also may buy and sell shares through a financial professional.
|
Minimum Investments |
To Buy or Sell Shares |
|
Minimum Initial Investment |
Mail: Allspring Funds |
Tax Information
Any distributions you receive from the Fund may be taxable as ordinary income or capital gains, except when your investment is in an IRA, 401(k) or other tax-advantaged investment plan. However, subsequent withdrawals from such a tax-advantaged investment plan may be subject to federal income tax. You should consult your tax adviser about your specific tax situation.
Payments to Intermediaries
If you purchase a Fund through an intermediary, the Fund and its related companies may pay the intermediary for the sale of Fund shares and related services. These payments may create a conflict of interest by influencing the intermediary and your financial professional to recommend the Fund over another investment. Consult your financial professional or visit your intermediary’s website for more information.
|
Link to Prospectus |
Link to SAI |
4
This page intentionally left blank
5
|
©2022 Allspring Global Investments Holdings, LLC. All rights reserved. |
6

Allspring Emerging Growth Fund
|
Class/Ticker: Institutional Class - WEMIX |
Link to Prospectus |
Link to SAI |
Before you invest, you may want to review the Fund’s prospectus, which contains more information about the Fund and its risks. You can find the Fund’s prospectus, reports to shareholders and other information about the Fund online at allspringglobal.com/reports. You can also get information at no cost by calling 1-800-222-8222, or by sending an email request to [email protected]. The current prospectus (“Prospectus”) and statement of additional information (“SAI”), dated October 1, 2021, as supplemented December 6, 2021, as supplemented from time to time, are incorporated by reference into this summary prospectus. The Fund’s SAI may be obtained, free of charge, in the same manner as the Prospectus.
Investment Objective
The Fund seeks long-term capital appreciation.
Fees and Expenses
These tables are intended to help you understand the various costs and expenses you will pay if you buy and hold shares of the Fund.
|
Shareholder Fees (fees paid directly from your investment) |
|
|
Maximum sales charge (load) imposed on purchases (as a percentage of offering price) |
None |
|
Maximum deferred sales charge (load) (as a percentage of offering price) |
None |
|
Annual Fund Operating Expenses (expenses that you pay each year as a percentage of the value of your investment)1 |
|
|
Management Fees2 |
0.84% |
|
Distribution (12b-1) Fees |
0.00% |
|
Other Expenses |
0.18% |
|
Total Annual Fund Operating Expenses3 |
1.02% |
|
Fee Waivers |
(0.12)% |
|
Total Annual Fund Operating Expenses After Fee Waivers4 |
0.90% |
| 1. | Expenses have been adjusted as necessary from amounts incurred during the Fund’s most recent fiscal year to reflect current fees and expenses. |
| 2. | Includes the fees charged by the Manager for providing advisory services to the master portfolio in which the Fund invests substantially all of its assets. |
| 3. | Includes other expenses allocated from the master portfolio in which the Fund invests. |
| 4. | The Manager has contractually committed through September 30, 2022, to waive fees and/or reimburse expenses to the extent necessary to cap Total Annual Fund Operating Expenses After Fee Waivers at 0.90% for Institutional Class. Brokerage commissions, stamp duty fees, interest, taxes, acquired fund fees and expenses (if any) from funds in which the underlying affiliated master portfolios and funds invest and from money market funds, and extraordinary expenses are excluded from the expense cap. All other acquired fund fees and expenses from the affiliated master portfolios and funds are included in the expense cap. Prior to or after the commitment expiration date, the cap may be increased or the commitment to maintain the cap may be terminated only with the approval of the Board of Trustees. |
Example of Expenses
The example below is intended to help you compare the costs of investing in the Fund with the costs of investing in other funds. The example assumes a $10,000 initial investment, 5% annual total return, and that fees and expenses remain the same as in the tables above. To the extent that the Manager is waiving fees or reimbursing expenses, the example assumes that such waiver or reimbursement will only be in place through the date noted above. Although your actual costs may be higher or lower, based on these assumptions, your costs would be:
1
|
After: |
|
|
1 Year |
$92 |
|
3 Years |
$313 |
|
5 Years |
$552 |
|
10 Years |
$1,237 |
Portfolio Turnover
The Fund pays transaction costs, such as commissions, when it buys and sells securities (or “turns over” its portfolio). A higher portfolio turnover rate may indicate higher transaction costs and may result in higher taxes when Fund shares are held in a taxable account. These costs, which are not reflected in annual fund operating expenses or in the example, affect the Fund’s performance. During the most recent fiscal year, the Fund’s portfolio turnover rate was 48% of the average value of its portfolio.
Principal Investment Strategies
Under normal circumstances, we invest:
| ■ | at least 80% of the Fund’s total assets in equity securities of small-capitalization companies; and |
| ■ | up to 25% of the Fund’s total assets in equity securities of foreign issuers through American Depository Receipts (ADRs) and similar investments. |
The Fund is a feeder fund that invests substantially all of its assets in the Emerging Growth Portfolio, a master portfolio with a substantially identical investment objective and substantially similar investment strategies. We may invest in additional master portfolios, in other Allspring Funds, or directly in a portfolio of securities.
We invest principally in equity securities of small-capitalization companies, which we define as companies with market capitalizations within the range of the Russell 2000® Index at the time of purchase. The market capitalization range of the Russell 2000® Index was approximately $34.49 million to $28.21 billion, as of August 31, 2021, and is expected to change frequently. Small-capitalization companies may include both domestic and foreign small-capitalization companies.
We seek small-capitalization companies that are in the emerging phase of their life cycle. We believe earnings and revenue growth relative to consensus expectations are critical factors in determining stock price movements. Thus, our investment process focuses on identifying companies with robust and sustainable growth in revenue and earnings that are underappreciated by the market. To find that growth, we use bottom-up research, emphasizing companies whose management teams have a history of successfully executing their strategy and whose business model have sufficient profit potential. We forecast revenue and earnings growth along with other key financial metrics to assess investment potential. We then combine that company-specific analysis with our assessment of what the market is discounting for growth to form a buy/sell decision about a particular stock. We seek to capitalize on investment opportunities where a sizable gap exists between market consensus and our expectation for a company’s growth prospects. We may invest in any sector and, at times, we may emphasize one or more particular sectors. In addition, our investment process is built on a foundation of continuous risk management and a strict sell discipline. We sell a company’s securities when we see signs that can cause a company’s growth prospects to deteriorate, as this often leads to lower valuation potential. We may also sell or trim a position when we need to raise money to fund the purchase of a better investment opportunity or when valuation has extended beyond our expectations.
Principal Investment Risks
Because the Fund invests substantially all of its assets in a master portfolio with a substantially identical investment objective and substantially similar investment strategies, the following principal risks include those risks that result from the Fund’s investment in the master portfolio. In this section, references to the Fund should be read to include the Fund and the master portfolio, as appropriate.
The Fund’s performance will not correlate perfectly with that of the master portfolio due to the impact of the Fund’s fees and expenses and to the timing and magnitude of cash flows into and out of the Fund, which will create cash balances that cause the Fund’s performance to deviate from the performance of the master portfolio.
An investment in the Fund may lose money, is not a deposit of a bank or its affiliates, is not insured or guaranteed by the Federal Deposit Insurance Corporation or any other governmental agency, and is primarily subject to the risks briefly summarized below.
Market Risk. The values of, and/or the income generated by, securities held by the Fund may decline due to general market conditions or other factors, including those directly involving the issuers of such securities. Securities markets are volatile and may decline significantly in response to adverse issuer, regulatory, political, or economic developments. Different sectors of the market and different security types may react differently to such developments.
Equity Securities Risk. The values of equity securities may experience periods of substantial price volatility and may decline
2
significantly over short time periods. In general, the values of equity securities are more volatile than those of debt securities. Equity securities fluctuate in value and price in response to factors specific to the issuer of the security, such as management performance, financial condition, and market demand for the issuer’s products or services, as well as factors unrelated to the fundamental condition of the issuer, including general market, economic and political conditions. Different parts of a market, industry and sector may react differently to adverse issuer, market, regulatory, political, and economic developments.
Smaller Company Securities Risk. Securities of companies with smaller market capitalizations tend to be more volatile and less liquid than those of larger companies.
Foreign Investment Risk. Foreign investments may be subject to lower liquidity, greater price volatility and risks related to adverse political, regulatory, market or economic developments. Foreign investments may involve exposure to changes in foreign currency exchange rates and may be subject to higher withholding and other taxes.
Growth/Value Investing Risk. Securities that exhibit growth or value characteristics tend to perform differently and shift into and out of favor with investors depending on changes in market and economic sentiment and conditions.
Management Risk. Investment decisions, techniques, analyses or models implemented by a Fund’s manager or sub-adviser in seeking to achieve the Fund’s investment objective may not produce expected returns, may cause the Fund’s shares to lose value or may cause the Fund to underperform other funds with similar investment objectives.
Performance
The following information provides some indication of the risks of investing in the Fund by showing changes in the Fund’s performance from year to year. The Fund’s average annual total returns are compared to the performance of one or more indices. Past performance before and after taxes is no guarantee of future results. Current month-end performance is available on the Fund’s website at allspringglobal.com.
|
Calendar Year Total Returns for Institutional Class as of 12/31 each year |
||
|
. |
Highest Quarter: |
+42.88% |
|
Lowest Quarter: |
-22.57% |
|
|
Year-to-date total return as of June 30, 2021 is +9.31% |
||

|
Average Annual Total Returns for the periods ended 12/31/2020 |
||||
|
Inception Date of Share Class |
1 Year |
5 Year |
10 Year |
|
|
Institutional Class (before taxes) |
3/31/2008 |
58.79% |
22.36% |
16.22% |
|
Institutional Class (after taxes on distributions) |
3/31/2008 |
51.67% |
18.83% |
13.73% |
|
Institutional Class (after taxes on distributions and the sale of Fund Shares) |
3/31/2008 |
38.82% |
17.22% |
12.82% |
|
Russell 2000® Growth Index (reflects no deduction for fees, expenses, or taxes) |
34.63% |
16.36% |
13.48% |
|
After-tax returns are calculated using the historical highest individual federal marginal income tax rates and do not reflect the impact of state, local or foreign taxes. Actual after-tax returns depend on an investor’s tax situation and may differ from those shown, and after-tax returns shown are not relevant to tax-exempt investors or investors who hold their Fund shares through tax-deferred arrangements, such as 401(k) Plans or Individual Retirement Accounts.
3
Fund Management
|
Manager |
Sub-Adviser1 |
Portfolio Manager, Title / Managed Since1 |
|
Allspring Funds Management, LLC |
Allspring Global Investments, LLC |
Robert Gruendyke, CFA, Portfolio Manager / 2020 |
| 1. | The sub-adviser and portfolio managers listed above are the sub-adviser and portfolio managers of the master portfolio in which the Fund invests substantially all of its assets. The Fund itself does not have a sub-adviser or portfolio managers. |
Purchase and Sale of Fund Shares
Institutional Class shares are generally available through intermediaries for the accounts of their customers and directly to institutional investors and individuals. Institutional investors may include corporations; private banks and trust companies; endowments and foundations; defined contribution, defined benefit and other employer sponsored retirement plans; institutional retirement plan platforms; insurance companies; registered investment advisor firms; bank trusts; 529 college savings plans; family offices; and funds of funds, including those managed by Allspring Funds Management. In general, you can buy or sell shares of the Fund online or by mail, phone or wire, on any day the New York Stock Exchange (“NYSE”) is open for regular trading. You also may buy and sell shares through a financial professional.
|
Minimum Investments |
To Buy or Sell Shares |
|
Minimum Initial Investment Minimum Additional Investment |
Mail: Allspring Funds Contact your financial professional. |
Tax Information
Any distributions you receive from the Fund may be taxable as ordinary income or capital gains, except when your investment is in an IRA, 401(k) or other tax-advantaged investment plan. However, subsequent withdrawals from such a tax-advantaged investment plan may be subject to federal income tax. You should consult your tax adviser about your specific tax situation.
Payments to Intermediaries
If you purchase a Fund through an intermediary, the Fund and its related companies may pay the intermediary for the sale of Fund shares and related services. These payments may create a conflict of interest by influencing the intermediary and your financial professional to recommend the Fund over another investment. Consult your financial professional or visit your intermediary’s website for more information.
|
Link to Prospectus |
Link to SAI |
|
©2022 Allspring Global Investments Holdings, LLC. All rights reserved. |
4

Allspring Emerging Growth Fund
|
Class/Ticker: Administrator Class - WFGDX |
Link to Prospectus |
Link to SAI |
Before you invest, you may want to review the Fund’s prospectus, which contains more information about the Fund and its risks. You can find the Fund’s prospectus, reports to shareholders and other information about the Fund online at allspringglobal.com/reports. You can also get information at no cost by calling 1-800-222-8222, or by sending an email request to [email protected]. The current prospectus (“Prospectus”) and statement of additional information (“SAI”), dated October 1, 2021, as supplemented December 6, 2021, as supplemented from time to time, are incorporated by reference into this summary prospectus. The Fund’s SAI may be obtained, free of charge, in the same manner as the Prospectus.
Investment Objective
The Fund seeks long-term capital appreciation.
Fees and Expenses
These tables are intended to help you understand the various costs and expenses you will pay if you buy and hold shares of the Fund.
|
Shareholder Fees (fees paid directly from your investment) |
|
|
Maximum sales charge (load) imposed on purchases (as a percentage of offering price) |
None |
|
Maximum deferred sales charge (load) (as a percentage of offering price) |
None |
|
Annual Fund Operating Expenses (expenses that you pay each year as a percentage of the value of your investment)1 |
|
|
Management Fees2 |
0.84% |
|
Distribution (12b-1) Fees |
0.00% |
|
Other Expenses |
0.43% |
|
Total Annual Fund Operating Expenses3 |
1.27% |
|
Fee Waivers |
(0.07)% |
|
Total Annual Fund Operating Expenses After Fee Waivers4 |
1.20% |
| 1. | Expenses have been adjusted as necessary from amounts incurred during the Fund’s most recent fiscal year to reflect current fees and expenses. |
| 2. | Includes the fees charged by the Manager for providing advisory services to the master portfolio in which the Fund invests substantially all of its assets. |
| 3. | Includes other expenses allocated from the master portfolio in which the Fund invests. |
| 4. | The Manager has contractually committed through September 30, 2022, to waive fees and/or reimburse expenses to the extent necessary to cap Total Annual Fund Operating Expenses After Fee Waivers at 1.20% for Administrator Class. Brokerage commissions, stamp duty fees, interest, taxes, acquired fund fees and expenses (if any) from funds in which the underlying affiliated master portfolios and funds invest and from money market funds, and extraordinary expenses are excluded from the expense cap. All other acquired fund fees and expenses from the affiliated master portfolios and funds are included in the expense cap. Prior to or after the commitment expiration date, the cap may be increased or the commitment to maintain the cap may be terminated only with the approval of the Board of Trustees. |
Example of Expenses
The example below is intended to help you compare the costs of investing in the Fund with the costs of investing in other funds. The example assumes a $10,000 initial investment, 5% annual total return, and that fees and expenses remain the same as in the tables above. To the extent that the Manager is waiving fees or reimbursing expenses, the example assumes that such waiver or reimbursement will only be in place through the date noted above. Although your actual costs may be higher or lower, based on these assumptions, your costs would be:
1
|
After: |
|
|
1 Year |
$122 |
|
3 Years |
$396 |
|
5 Years |
$690 |
|
10 Years |
$1,528 |
Portfolio Turnover
The Fund pays transaction costs, such as commissions, when it buys and sells securities (or “turns over” its portfolio). A higher portfolio turnover rate may indicate higher transaction costs and may result in higher taxes when Fund shares are held in a taxable account. These costs, which are not reflected in annual fund operating expenses or in the example, affect the Fund’s performance. During the most recent fiscal year, the Fund’s portfolio turnover rate was 48% of the average value of its portfolio.
Principal Investment Strategies
Under normal circumstances, we invest:
| ■ | at least 80% of the Fund’s total assets in equity securities of small-capitalization companies; and |
| ■ | up to 25% of the Fund’s total assets in equity securities of foreign issuers through American Depository Receipts (ADRs) and similar investments. |
The Fund is a feeder fund that invests substantially all of its assets in the Emerging Growth Portfolio, a master portfolio with a substantially identical investment objective and substantially similar investment strategies. We may invest in additional master portfolios, in other Allspring Funds, or directly in a portfolio of securities.
We invest principally in equity securities of small-capitalization companies, which we define as companies with market capitalizations within the range of the Russell 2000® Index at the time of purchase. The market capitalization range of the Russell 2000® Index was approximately $28.21 million to $34.49 billion, as of August 31, 2021, and is expected to change frequently. Small-capitalization companies may include both domestic and foreign small-capitalization companies.
We seek small-capitalization companies that are in the emerging phase of their life cycle. We believe earnings and revenue growth relative to consensus expectations are critical factors in determining stock price movements. Thus, our investment process focuses on identifying companies with robust and sustainable growth in revenue and earnings that are underappreciated by the market. To find that growth, we use bottom-up research, emphasizing companies whose management teams have a history of successfully executing their strategy and whose business model have sufficient profit potential. We forecast revenue and earnings growth along with other key financial metrics to assess investment potential. We then combine that company-specific analysis with our assessment of what the market is discounting for growth to form a buy/sell decision about a particular stock. We seek to capitalize on investment opportunities where a sizable gap exists between market consensus and our expectation for a company’s growth prospects. We may invest in any sector and, at times, we may emphasize one or more particular sectors. In addition, our investment process is built on a foundation of continuous risk management and a strict sell discipline. We sell a company’s securities when we see signs that can cause a company’s growth prospects to deteriorate, as this often leads to lower valuation potential. We may also sell or trim a position when we need to raise money to fund the purchase of a better investment opportunity or when valuation has extended beyond our expectations.
Principal Investment Risks
Because the Fund invests substantially all of its assets in a master portfolio with a substantially identical investment objective and substantially similar investment strategies, the following principal risks include those risks that result from the Fund’s investment in the master portfolio. In this section, references to the Fund should be read to include the Fund and the master portfolio, as appropriate.
The Fund’s performance will not correlate perfectly with that of the master portfolio due to the impact of the Fund’s fees and expenses and to the timing and magnitude of cash flows into and out of the Fund, which will create cash balances that cause the Fund’s performance to deviate from the performance of the master portfolio.
An investment in the Fund may lose money, is not a deposit of a bank or its affiliates, is not insured or guaranteed by the Federal Deposit Insurance Corporation or any other governmental agency, and is primarily subject to the risks briefly summarized below.
Market Risk. The values of, and/or the income generated by, securities held by the Fund may decline due to general market conditions or other factors, including those directly involving the issuers of such securities. Securities markets are volatile and may decline significantly in response to adverse issuer, regulatory, political, or economic developments. Different sectors of the market and different security types may react differently to such developments.
Equity Securities Risk. The values of equity securities may experience periods of substantial price volatility and may decline
2
significantly over short time periods. In general, the values of equity securities are more volatile than those of debt securities. Equity securities fluctuate in value and price in response to factors specific to the issuer of the security, such as management performance, financial condition, and market demand for the issuer’s products or services, as well as factors unrelated to the fundamental condition of the issuer, including general market, economic and political conditions. Different parts of a market, industry and sector may react differently to adverse issuer, market, regulatory, political, and economic developments.
Smaller Company Securities Risk. Securities of companies with smaller market capitalizations tend to be more volatile and less liquid than those of larger companies.
Foreign Investment Risk. Foreign investments may be subject to lower liquidity, greater price volatility and risks related to adverse political, regulatory, market or economic developments. Foreign investments may involve exposure to changes in foreign currency exchange rates and may be subject to higher withholding and other taxes.
Growth/Value Investing Risk. Securities that exhibit growth or value characteristics tend to perform differently and shift into and out of favor with investors depending on changes in market and economic sentiment and conditions.
Management Risk. Investment decisions, techniques, analyses or models implemented by a Fund’s manager or sub-adviser in seeking to achieve the Fund’s investment objective may not produce expected returns, may cause the Fund’s shares to lose value or may cause the Fund to underperform other funds with similar investment objectives.
Performance
The following information provides some indication of the risks of investing in the Fund by showing changes in the Fund’s performance from year to year. The Fund’s average annual total returns are compared to the performance of one or more indices. Past performance before and after taxes is no guarantee of future results. Current month-end performance is available on the Fund’s website at allspringglobal.com.
|
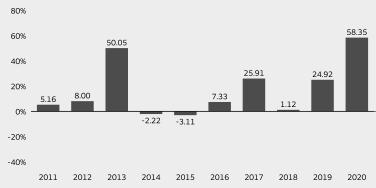
Calendar Year Total Returns for Administrator Class as of 12/31 each year |
||
|
. |
Highest Quarter: |
+42.74% |
|
Lowest Quarter: |
-22.61% |
|
|
Year-to-date total return as of June 30, 2021 is +9.15% |
||
|
Average Annual Total Returns for the periods ended 12/31/2020 |
||||
|
Inception Date of Share Class |
1 Year |
5 Year |
10 Year |
|
|
Administrator Class (before taxes) |
1/31/2007 |
58.35% |
22.00% |
15.87% |
|
Administrator Class (after taxes on distributions) |
1/31/2007 |
50.78% |
18.30% |
13.29% |
|
Administrator Class (after taxes on distributions and the sale of Fund Shares) |
1/31/2007 |
38.81% |
16.87% |
12.48% |
|
Russell 2000® Growth Index (reflects no deduction for fees, expenses, or taxes) |
34.63% |
16.36% |
13.48% |
|
After-tax returns are calculated using the historical highest individual federal marginal income tax rates and do not reflect the impact of state, local or foreign taxes. Actual after-tax returns depend on an investor’s tax situation and may differ from those shown, and after-tax returns shown are not relevant to tax-exempt investors or investors who hold their Fund shares through tax-deferred arrangements, such as 401(k) Plans or Individual Retirement Accounts.
3
Fund Management
|
Manager |
Sub-Adviser1 |
Portfolio Manager, Title / Managed Since1 |
|
Allspring Funds Management, LLC |
Allspring Global Investments, LLC |
Robert Gruendyke, CFA, Portfolio Manager / 2020 |
| 1. | The sub-adviser and portfolio managers listed above are the sub-adviser and portfolio managers of the master portfolio in which the Fund invests substantially all of its assets. The Fund itself does not have a sub-adviser or portfolio managers. |
Purchase and Sale of Fund Shares
Administrator Class shares are generally available through intermediaries for the accounts of their customers and directly to institutional investors and individuals. Institutional investors may include corporations; private banks and trust companies; endowments and foundations; defined contribution, defined benefit and other employer sponsored retirement plans; institutional retirement plan platforms; insurance companies; registered investment advisor firms; bank trusts; 529 college savings plans; family offices; and funds of funds, including those managed by Allspring Funds Management. In general, you can buy or sell shares of the Fund online or by mail, phone or wire, on any day the New York Stock Exchange (“NYSE”) is open for regular trading. You also may buy and sell shares through a financial professional.
|
Minimum Investments |
To Buy or Sell Shares |
|
Minimum Initial Investment |
Mail: Allspring Funds |
Tax Information
Any distributions you receive from the Fund may be taxable as ordinary income or capital gains, except when your investment is in an IRA, 401(k) or other tax-advantaged investment plan. However, subsequent withdrawals from such a tax-advantaged investment plan may be subject to federal income tax. You should consult your tax adviser about your specific tax situation.
Payments to Intermediaries
If you purchase a Fund through an intermediary, the Fund and its related companies may pay the intermediary for the sale of Fund shares and related services. These payments may create a conflict of interest by influencing the intermediary and your financial professional to recommend the Fund over another investment. Consult your financial professional or visit your intermediary’s website for more information.
|
Link to Prospectus |
Link to SAI |
|
©2022 Allspring Global Investments Holdings, LLC. All rights reserved. |
4
Serious News for Serious Traders! Try StreetInsider.com Premium Free!
You May Also Be Interested In
- Rubrik IPO: 5 key things to know
- Wells Fargo (WFC) Weighs Debut Risk Transfer as Banks Shore Up Capital - Bloomberg
- Marsh & McLennan (MMC) PT Raised to $213 at Wells Fargo
Create E-mail Alert Related Categories
SEC FilingsRelated Entities
Wells FargoSign up for StreetInsider Free!
Receive full access to all new and archived articles, unlimited portfolio tracking, e-mail alerts, custom newswires and RSS feeds - and more!
