

Form 497K RBC FUNDS TRUST
 Tweet
Tweet Share
Share
| Fund Summary | RBC SMID Cap Growth Fund | |||||
Investment Objective
The Fund seeks long-term capital appreciation.
Fees and Expenses of the Fund
This table describes the fees and expenses that you may pay if you buy, hold and sell shares of the Fund. You may pay other fees, such as brokerage commissions and other fees to financial intermediaries, which are not reflected in the tables and examples below. You may qualify for sales charge discounts on purchases of Class A shares of the Fund if you and your family invest, or agree to invest in the future, at least $25,000 in Class A shares of the RBC Funds. More information about these and other discounts is available from your financial intermediary and under the subheading “Reducing the Initial Sales Charge on Purchases of Class A Shares” on page 64 of the Fund’s Prospectus.
| Class A | Class I | Class R6 | ||||||||||
| Shareholder Fees (fees paid directly from your investment) |
||||||||||||
| Maximum Sales Charge (Load) Imposed on Purchases (as a % of offering price) |
5.75 | % | None | None | ||||||||
| Maximum Deferred Sales Charge (Load) (as a % of offering or sales price, whichever is less) |
None | 1 | None | None | ||||||||
| Annual Fund Operating Expenses |
||||||||||||
| Management Fees |
0.70 | % | 0.70 | % | 0.70 | % | ||||||
| Distribution and Service (12b-1) Fees |
0.25 | % | None | None | ||||||||
| Other Expenses |
0.32 | % | 0.34 | % | 17.75 | % | ||||||
|
|
|
|
|
|
|
|||||||
| Total Annual Fund Operating Expenses |
1.27 | % | 1.04 | % | 18.45 | % | ||||||
| Fee Waiver and/or Expense Reimbursement2 |
(0.20 | )% | (0.22 | )% | (17.68 | )% | ||||||
|
|
|
|
|
|
|
|||||||
| Total Annual Fund
Operating |
1.07 | % | 0.82 | % | 0.77 | % | ||||||
| 1 | A 1.00% CDSC is imposed on redemptions of Class A shares made within 12 months of a purchase of $1 million or more of Class A shares on which no front-end sales charge was paid. |
| 2 | The Advisor has contractually agreed to waive fees and/or pay operating expenses in order to limit the Fund’s total expenses (excluding brokerage and other investment-related costs, interest, taxes, dues, fees and other charges of governments and their agencies, extraordinary expenses such as litigation and indemnification, other expenses not incurred in the ordinary course of the Fund’s business and acquired fund fees and expenses) to 1.07% of the Fund’s average daily net assets for Class A shares, 0.82% for Class I shares and 0.77% for Class R6 shares. This expense limitation agreement is in place until January 31, 2024 and may not be terminated by the Advisor prior to that date. The expense limitation agreement may be revised or terminated by the Fund’s board of trustees if the board consents to a revision or termination as being in the best interests of the Fund. The Advisor is entitled to recoup from the Fund or class the fees and/or operating expenses previously waived or reimbursed for a period of 12 months from the date of such waiver or reimbursement, provided that such recoupment does not cause the Fund’s expense ratio (after the repayment is taken into account) to exceed the lesser of: (i) the Fund’s expense limitation at the time of the waiver or reimbursement and (ii) the Fund’s expense limitation at the time of recoupment. |
1
| Fund Summary | RBC SMID Cap Growth Fund | |||||
Example: This example is intended to help you compare the cost of investing in the Fund with the cost of investing in other mutual funds. The example assumes that you invest $10,000 in the Fund for the time periods indicated and then redeem all of your shares at the end of those periods. The example also assumes that your investment has a 5% return each year and that the Fund’s operating expenses remain the same. The costs for the Fund reflect the net expenses of the Fund that result from the contractual expense limitation in the first year only. Although your actual costs may be higher or lower, based on these assumptions your costs would be:
| Class A | Class I | Class R6 | ||||||||||
| One Year |
$ | 678 | $ | 84 | $ | 79 | ||||||
| Three Years |
$ | 936 | $ | 309 | $ | 3,425 | ||||||
| Five Years |
$ | 1,214 | $ | 553 | $ | 5,931 | ||||||
| Ten Years |
$ | 2,004 | $ | 1,251 | $ | 9,780 | ||||||
Portfolio Turnover
The Fund pays transaction costs, such as commissions, when it buys and sells securities (or “turns over” its portfolio). A higher portfolio turnover rate may indicate higher transaction costs and may result in higher taxes when Fund shares are held in a taxable account. These costs, which are not reflected in annual fund operating expenses or in the example, affect the Fund’s performance. During the most recent fiscal year, the Fund’s portfolio turnover rate was 25% of the average value of its portfolio.
Principal Investment Strategies
The Fund seeks long-term capital appreciation by normally investing at least 80% of its assets in common stocks of small- and mid-capitalization growth companies that fall within the market capitalization range of the Russell 2500™ Growth Index at the time of investment. For purposes of this policy, the term “assets” means net assets plus the amount of borrowings for investment purposes. As of December 31, 2022, the market capitalization range for the Russell 2500™ Growth Index was approximately $6.1 million to $17.1 billion. The Advisor uses a bottom-up investment approach employing fundamental analysis to identify individual companies for inclusion in the Fund’s portfolio.
In analyzing companies for investment, the Advisor looks for, among other things, companies that it believes have:
| • | Positive future revenue and earnings growth prospects |
| • | Consistent financial results |
| • | High returns on equity and profit margins relative to industry peers |
| • | A strong balance sheet |
| • | Attractive valuation metrics |
In addition, the Advisor prefers companies that it believes possess the following qualitative characteristics:
| • | Superior company management |
| • | A stable and durable business model |
2
| Fund Summary | RBC SMID Cap Growth Fund | |||||
The Fund’s portfolio will normally consist of approximately 65 to 80 companies.
As part of the investment process, the Advisor takes environmental, social and governance (“ESG”) factors into account through an integrated approach within the investment team’s fundamental investment analysis framework. ESG factors are considered with respect to many companies in which the Fund may invest in order to identify issuers the Advisor believes will be materially impacted by such factors. ESG factors are some of the many factors considered in making investment decisions. The determinations based on ESG factors may not be conclusive and securities of such issuers may be purchased and retained by the Fund.
Principal Risks
The value of your investment in the Fund will change daily, which means that you could lose money. An investment in the Fund is not a bank deposit and is not insured or guaranteed by the Federal Deposit Insurance Corporation (“FDIC”) or any other government agency. By itself, the Fund is not a balanced investment program. There is no guarantee that the Fund will meet its goal. The principal risks of investing in the Fund include:
Equity Market Risk. Equity securities represent an ownership interest, or the right to acquire an ownership interest, in an issuer. The values of equity securities, including common stocks, may decline due to general market conditions which are not specifically related to a particular company, such as real or perceived adverse economic conditions, changes in the general outlook for corporate earnings, changes in interest or currency rates or adverse investor sentiment generally. Common stocks are generally exposed to greater risk than other types of securities, such as preferred stock and debt obligations, because common stockholders generally have inferior rights to receive payment from issuers.
Small Company Risk. Stocks of smaller and less seasoned companies involve greater risks than those of larger companies. These companies may not have the management experience, financial resources, product diversification and competitive strengths of larger companies. Smaller companies may be more sensitive to changes in the economy overall. Historically, small company stocks have been more volatile than those of larger companies. As a result, the Fund’s net asset value may be subject to rapid and substantial changes.
Mid-Sized Company Risk. Stocks of mid-sized companies may carry greater risks than those of larger companies because mid-sized companies may have less management experience, competitive strengths and financial resources than larger companies. Mid-sized companies may also be more vulnerable to adverse business or economic events and may be more volatile than larger companies.
Growth Investing Risk. Growth investing attempts to identify companies that the Advisor believes will experience rapid earnings growth relative to value or other types of stocks. Therefore, growth stocks may trade at higher multiples of current earnings compared to value or other stocks, leading to inflated prices and thus potentially greater declines in value.
3
| Fund Summary | RBC SMID Cap Growth Fund | |||||
Market Risk. The markets in which the Fund invests may go down in value, sometimes sharply and unpredictably. The success of the Fund’s investment program may be affected by general economic and market conditions, such as interest rates, availability of credit, inflation rates, economic uncertainty, changes in laws, and national and international political circumstances. Unexpected volatility or illiquidity could impair the Fund’s profitability or result in losses. A Fund’s investments may be overweighted from time to time in one or more sectors, which will increase the Fund’s exposure to risk of loss from adverse developments affecting those sectors.
Active Management Risk. The Fund is actively managed and its performance therefore will reflect in part the Advisor’s ability to make investment decisions that are suited to achieve the Fund’s investment objective.
Performance Information
The bar chart and performance table provide an indication of the risks of an investment in the Fund by showing changes in performance from year to year and by showing how the Fund’s average annual total returns (before and after taxes) compare with those of a broad-based securities index. The returns for Class I and Class R6 shares may be different than the returns of Class A shares shown in the bar chart and performance table because fees and expenses of the classes differ. The bar chart shows the Fund’s performance for the past ten calendar years. Sales charges are not reflected in the bar chart, and if those charges had been included, the returns would be less than those shown below. Past performance (before and after taxes) does not indicate how the Fund will perform in the future. Updated information on the Fund’s performance can be obtained by visiting www.rbcgam.com or by calling 1-800-422-2766.
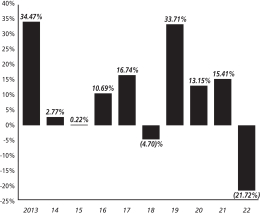
RBC SMID Cap Growth Fund – Class A
Annual Total Returns
|
||||||||||||||||
| During the periods shown in the chart for the RBC SMID Cap Growth Fund – Class A: |
| |||||||||||||||
| Quarter | Year | Returns | ||||||||||||||
| Best quarter: | Q2 | 2020 | 24.65% | |||||||||||||
| Worst quarter: | Q1 | 2020 | (23.39)% | |||||||||||||
4
| Fund Summary | RBC SMID Cap Growth Fund | |||||
Performance Table
The table below shows after-tax returns for Class A shares only and assumes applicable maximum sales charges. After-tax returns for Class I shares will vary. After-tax returns are calculated using the historical highest individual federal marginal income tax rates and do not reflect the impact of state and local taxes. Actual after-tax returns depend on an investor’s tax situation and may differ from those shown. After-tax returns shown are not relevant to investors who hold Fund shares through tax-deferred arrangements, such as qualified retirement plans. In some cases, returns after taxes on distributions and sale of Fund shares may be higher than returns before taxes because the calculations assume that the investor received a tax benefit for any loss incurred on the sale of the shares. The inception date of Class A and Class I is December 31, 1990 and of Class R6 is November 21, 2016. Performance shown for Class R6 prior to its inception date is based on the performance of Class I shares, adjusted to reflect the fees and expenses of Class R6 shares.
| Average Annual Total Returns (for the periods ended December 31, 2022)1 |
|
|||||||||||||||||
| Past Year |
Past 5 Years |
Past 10 Years |
Since Inception |
|||||||||||||||
| Class A Before Taxes |
(21.72 | )% | 7.96% | 10.13% | 10.50% | |||||||||||||
| Class A After Taxes on Distributions |
(23.37 | )% | 5.19% | 7.14% | 8.52% | |||||||||||||
| Class A After Taxes on Distributions and Sale of Shares |
(11.65 | )% | 6.21% | 7.75% | 8.62% | |||||||||||||
| Class I Before Taxes |
(16.71 | )% | 9.52% | 11.07% | 11.02% | |||||||||||||
| Class R6 Before Taxes |
(16.75 | )% | 9.57% | 11.15% | 11.25% | |||||||||||||
| Russell 2500™ Growth Index (reflects no deduction for fees, expenses or taxes; inception calculated from December 31, 1990) |
(26.21 | )% | 5.97% | 10.62% | 9.87% | |||||||||||||
| 1 | The performance for the period from June 1, 1994 to April 19, 2004 reflects the performance of the Mid Cap Equity Fund, the predecessor to RBC SMID Cap Growth Fund. The performance of the Fund also includes the performance of a common trust fund (“CTF”) account advised by the Advisor (including its predecessor) and managed the same as the Fund in all material respects for the period from December 31, 1990 to June 1, 1994, as adjusted to reflect the full contractual rate of expenses associated with the Fund at its inception. The CTF account was not registered with the Securities and Exchange Commission (“SEC”) under the 1940 Act and therefore was not subject to the investment restrictions imposed by law on registered mutual funds. If the CTF account had been registered, the CTF account’s performance may have been adversely affected. Fund performance reflects applicable fee waivers/expense reimbursements (which, if excluded, would cause performance to be lower). |
Investment Advisor
RBC Global Asset Management (U.S.) Inc.
Portfolio Manager
The following individuals are jointly and primarily responsible for the day-to-day management of the Fund’s portfolio:
| • | Kenneth A. Tyszko, Managing Director and Senior Portfolio Manager of the Advisor, has been the lead portfolio manager of the Fund since October 2009. |
5
| Fund Summary | RBC SMID Cap Growth Fund | |||||
| • | Richard J. Drage, Portfolio Manager of the Advisor, has been a portfolio manager of the Fund since January 2021. |
Tax Information
The Fund’s distributions generally are taxable to you as ordinary income, capital gains, or a combination of both, unless you are investing through a tax-deferred arrangement, such as a 401(k) plan or individual retirement account, in which case you may be taxed later upon withdrawal of your investment from such arrangement.
Important Additional Information
Purchase and Sale of Fund Shares
You may purchase or redeem (sell) shares of the Fund by phone (1-800-422-2766), by mail (RBC Funds, c/o U.S. Bank Global Fund Services, P.O. Box 701, Milwaukee, WI 53201-0701) or by wire. The following table provides the Fund’s minimum initial and subsequent investment requirements, which may be reduced or modified in some cases.
| Minimum Initial Investment: | ||
| Class A |
$1,000 ($250 for IRA and $100 for Automatic Monthly Investment Plan) | |
| Class I |
$250,000 ($0 for Qualified Retirement Plans) | |
| Class R6 |
$250,000 for Institutional Investors1 $0 for Eligible Investors1 | |
| Minimum Subsequent Investment: | ||
| Class A |
None | |
| Class I |
None | |
| Class R6 |
None | |
| 1 | For more information about Institutional Investors and Eligible Investors, see “Additional Policies about Transactions” on page 46 of the Fund’s Prospectus. |
Payments to Broker-Dealers and Other Financial Intermediaries
If you purchase shares of the Fund through a broker-dealer or other financial intermediary (such as a bank), the Fund and/or the Advisor may pay the intermediary for the sale of Fund shares and related services. These payments may create a conflict of interest by influencing the broker-dealer or other intermediary and your salesperson to recommend the Fund over another investment. Ask your salesperson or visit your financial intermediary’s website for more information.
6
Serious News for Serious Traders! Try StreetInsider.com Premium Free!
You May Also Be Interested In
- 5 Benefits of 401(k) Rollover
- EMPOWERING WOMEN: pH-D FEMININE HEALTH'S COMMITMENT TO VAGINAL WELLNESS
- ECM Wins 2024 Automate Innovation Awards for PrintStator Electric Motor CAD Software
Create E-mail Alert Related Categories
SEC FilingsSign up for StreetInsider Free!
Receive full access to all new and archived articles, unlimited portfolio tracking, e-mail alerts, custom newswires and RSS feeds - and more!
