

Form 497K Provident Mutual Funds,
 Tweet
Tweet Share
Share| SUMMARY PROSPECTUS | January 31, 2023 | ||||
Provident Trust Strategy Fund
(Ticker Symbol: PROVX)
__________________________
Before you invest, you may want to review the Provident Trust Strategy Fund’s (the “Fund”) Prospectus, which contains more information about the Fund and its risks. The current statutory Prospectus and Statement of Additional Information (“SAI”) dated January 31, 2023 are incorporated by reference into this Summary Prospectus. You can find the Fund’s Prospectus, SAI, reports to shareholders and other information about the Fund online at www.provfunds.com. You can also get this information at no cost by calling 1-855-739-9950 or by sending an e-mail request to info@provtrust.com.
Investment Objective: The Fund seeks long-term growth of capital.
Fees and Expenses of the Fund: The following table describes the fees and expenses that you may pay if you buy, hold, and sell shares of the Fund. You may pay other fees, such as brokerage commissions and other fees to financial intermediaries, which are not reflected in the tables and examples below.
Shareholder Fees (fees paid directly from your investment) | None | ||||
Annual Fund Operating Expenses (expenses that you pay each year as a percentage of the value of your investment) | |||||
| Management Fees | 0.63 | % | |||
| Distribution and/or Service (12b-1) Fees | None | ||||
Other Expenses(1) | 0.30 | % | |||
Total Annual Fund Operating Expenses(1) | 0.93 | % | |||
(1)Other Expenses and Total Annual Fund Operating Expenses include acquired fund fees and expenses (“AFFE”), which are indirect fees and expenses that the Fund incurs from investing in the shares of other mutual funds, including money market funds. Please note that the amount of Total Annual Fund Operating Expenses shown in the above table will differ from the “Financial Highlights” section of the Prospectus, which reflects the direct operating expenses of the Fund and does not include indirect expenses, such as AFFE. Without AFFE, Total Annual Fund Operating Expenses would have been 0.92% for the Fund.
Example
This Example is intended to help you compare the cost of investing in the Fund with the cost of investing in other mutual funds. The Example assumes that you invest $10,000 in the Fund for the time periods indicated and then redeem all of your shares at the end of these periods. The Example also assumes that your investment has a 5% return each year and that the Fund’s operating expenses remain the same (taking into account the contractual expense limitation for one year). Although your actual costs may be higher or lower, based on these assumptions, your costs would be:
| 1 Year | 3 Years | 5 Years | 10 Years | ||||||||
| $95 | $296 | $515 | $1,143 | ||||||||
Portfolio Turnover
The Fund pays transaction costs, such as commissions, when it buys and sells securities (or “turns over” its portfolio). A higher portfolio turnover rate may indicate higher transaction costs and may result in higher taxes when Fund shares are held in a taxable account. These costs, which are not reflected in annual fund operating expenses or in the Example, affect the Fund’s performance. During the most recent fiscal year, the Fund’s portfolio turnover rate was 3% of the average value of its portfolio.
1
Principal Investment Strategies
The Fund invests mainly in a limited number of multi-capitalization growth stocks. The Fund is a non-diversified core growth equity fund. The Fund will compare itself to, and attempt to exceed, the S&P 500® Index over full investment cycles. Provident Trust Company (the “Adviser”) selects common stocks of all market capitalizations based on their potential to appreciate in value relative to other stocks. When selecting individual stock investments, the Adviser takes a “bottom-up” investment approach, meaning that it selects investments based on its assessment of whether an individual company has the potential for above average growth. Stock selection criteria include improving revenue and earnings growth, increasing margins, significant stock ownership by management and improving price-to-earnings ratios. The Adviser generally prefers to invest in large capitalization and medium capitalization stocks but may also invest a portion of the Fund’s portfolio in small capitalization stocks. The Fund is non-diversified, which means that, compared to diversified mutual funds, the Fund may invest a greater percentage of its assets in a particular issuer.
The Adviser employs a sell discipline pursuant to which it will:
•Reduce or sell an entire position when a security reaches the Adviser’s target price,
•Reduce or sell a position as part of its asset allocation process or for portfolio diversification, or
•Sell an entire position when fundamentals are deteriorating.
Principal Risks
There is a risk that you could lose all or a portion of your money on your investment in the Fund. This risk may increase during times of significant market volatility. The risks below could affect the value of your investment, and because of these risks, the Fund is a suitable investment only for those investors who have long-term investment goals.
•Stock Market Risk: The prices of the securities in which the Fund invests may decline for a number of reasons. The price declines of common stocks, in particular, may be steep, sudden and/or prolonged. Price changes may occur in the market as a whole, or they may occur in only a particular company, industry, or sector of the market.
•Non-Diversification Risk: Because the Fund is non-diversified, the Fund’s shares may be more susceptible to adverse changes in the value of a particular security than would be the shares of a diversified mutual fund. Thus, the Fund is more sensitive to economic, business and political changes which may result in greater price fluctuations of the Fund’s shares.
•Equity Securities Risks: Common stocks and other equity securities held by the Fund will fluctuate in value based on the earnings of the company and on general industry and market conditions, leading to fluctuations in the Fund’s share price. Depending on a company’s market capitalization, it may be subject to some or all of the following additional risks:
◦Large Capitalization Companies Risk: Larger, more established companies may be unable to respond as quickly to new competitive challenges such as changes in consumer tastes as innovative, smaller competitors. Also, large capitalization companies are sometimes unable to attain the high growth rates of successful, smaller companies, especially during extended periods of economic expansion.
◦Medium Capitalization Companies Risk: Medium capitalization companies tend to be more susceptible to adverse business or economic events than large capitalization companies, and there is a risk that the securities of medium capitalization companies may have limited liquidity and greater price volatility than securities of large capitalization companies.
◦Small Capitalization Companies Risk: Small capitalization companies typically have relatively lower revenues, limited product lines and lack of management depth, and may have a smaller share of the market for their products or services, than large and medium capitalization companies. There is a risk that the securities of small capitalization companies may have limited liquidity and greater price volatility than securities of large and medium capitalization companies, which can negatively affect the Fund’s ability to sell these securities at quoted market prices. Finally, there are periods when investing in small capitalization company stocks falls out of favor with investors and small capitalization company stocks may underperform.
2
•Recent Market Events: U.S. and international markets have experienced volatility in recent months and years due to a number of economic, political and global macro factors including the impact of the coronavirus (COVID-19) as a global pandemic, uncertainties regarding interest rates, rising inflation, trade tensions, and the threat of tariffs imposed by the U.S. and other countries. As a result of continuing political tensions and armed conflicts, including the war between Ukraine and Russia, the U.S. and the European Union imposed sanctions on certain Russian individuals and companies, including certain financial institutions, and have limited certain exports and imports to and from Russia. The war has contributed to recent market volatility and may continue to do so. Continuing market volatility as a result of recent market conditions or other events may have an adverse effect on the performance of the Fund.
•Asset Allocation Risk: The Fund may allocate its investments among various asset classes. The Fund’s performance will be affected by the Adviser’s ability to anticipate correctly the relative potential returns and risks of the asset classes in which the Fund invests.
•Management Risk: The Fund is subject to management risk as an actively-managed investment portfolio and depends on the Adviser’s investment strategies to produce the desired results.
•Redemption Risks: The Fund may experience periods of redemptions that could cause the Fund to liquidate its assets at inopportune times or at a loss or depressed value, particularly during periods of declining or illiquid markets. Redemption risk is greater to the extent that the Fund has investors with large shareholdings, short investment horizons, or unpredictable cash flow needs. In addition, redemption risk is heightened during periods of overall market turmoil. The redemption by one or more large shareholders of their holdings in the Fund could hurt performance and/or cause the remaining shareholders in the Fund to lose money. If the Fund is forced to liquidate its assets under unfavorable conditions or at inopportune times, the value of your investment could decline.
Performance
The bar chart and table show the historical performance of the Fund’s shares and provide some indication of the risks of investing in the Fund. The bar chart shows how the Fund’s total returns before taxes have varied from year to year, while the table compares the Fund’s average annual total returns to the returns of the S&P 500® Index. The Fund’s past performance (before and after taxes) is not necessarily an indication of how the Fund will perform in the future. Updated performance information is available on the Fund’s website at www.provfunds.com or by calling 1‑855‑739‑9950.
Provident Trust Strategy Fund
Annual Total Returns (calendar years 2013 – 2022)
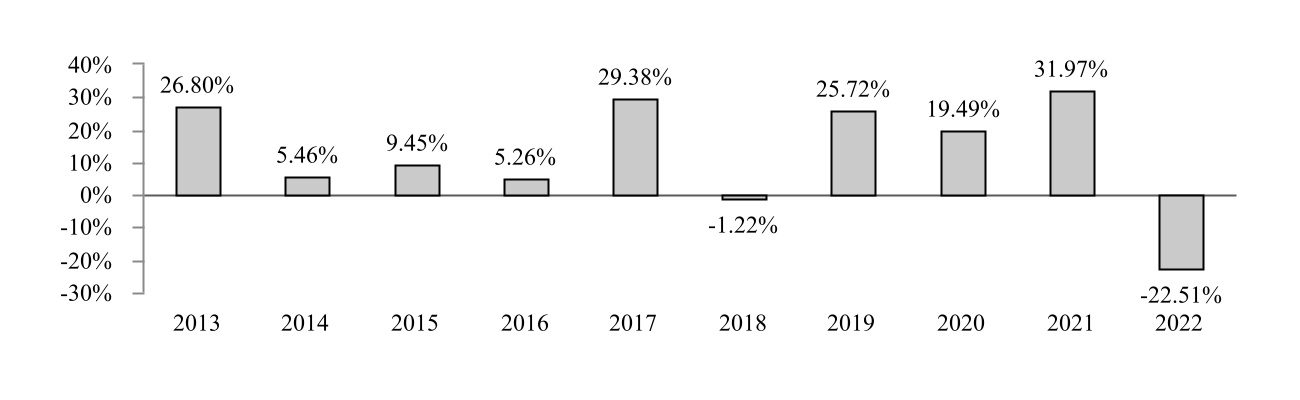
During the ten-year period shown on the bar chart, the Fund’s best and worst quarters are shown below:
| Best Quarter | 2nd Quarter 2020 | 17.80% | ||||||
| Worst Quarter | 2nd Quarter 2022 | -14.41% | ||||||
3
After-tax returns are calculated using the historical highest individual federal marginal income tax rates and do not reflect the impact of state and local taxes. Actual after-tax returns depend on an investor’s tax situation and may differ from those shown. The after-tax returns shown are not relevant to investors who hold their shares through tax-deferred or other tax-advantaged arrangements such as 401(k) plans or Individual Retirement Accounts (“IRAs”).
Average Annual Total Returns (for the periods ended December 31, 2022) | 1 Year | 5 Years | 10 Years | ||||||||
| Provident Trust Strategy Fund | |||||||||||
| Return before taxes | -22.51% | 8.70% | 11.70% | ||||||||
| Return after taxes on distributions | -25.49% | 6.91% | 10.26% | ||||||||
| Return after taxes on distributions and sale of Fund shares | -11.22% | 6.76% | 9.47% | ||||||||
S&P 500® Index (reflects no deduction for fees, expenses or taxes) | -18.11% | 9.42% | 12.56% | ||||||||
The S&P 500® Index consists of 500 selected common stocks, most of which are listed on the New York Stock Exchange (“NYSE”). The Standard & Poor’s Ratings Group designates the stocks to be included in the Index on a statistical basis. A particular stock’s weighting in the Index is based on its relative total market value (i.e., its market price per share times the number of shares outstanding). Stocks may be added or deleted from the Index from time to time. A direct investment in an index is not possible.
In certain cases, the figure representing “Return After Taxes on Distributions and Sale of Fund Shares” may be higher than the other return figures for the same period. A higher after-tax return results when a capital loss occurs upon redemption and provides an assumed tax benefit to the investor.
Investment Adviser
Provident Trust Company is the investment adviser for the Fund.
Portfolio Managers
J. Scott Harkness, CFA, has been the Portfolio Manager of the Fund since 2002. Michael A. Schelble, CFA, has been the Assistant Portfolio Manager of the Fund since 2002.
Purchase and Sale of Fund Shares
The minimum initial investment amount for all new accounts is $1,000. The subsequent investments in the Fund for existing accounts may be made with a minimum investment of $50 if purchased through the Automatic Investment Plan, $1,000 for telephone purchases, and $100 for all other accounts.
You may purchase and redeem shares of the Fund each day the NYSE is open. You may purchase and redeem Fund shares through the mail (Provident Trust Strategy Fund, c/o U.S. Bank Global Fund Services, P.O. Box 701, Milwaukee, WI 53201-0701), by wire transfer, by telephone at 1-855-739-9950, or through a financial intermediary. Investors who wish to purchase or redeem shares through a broker-dealer or other financial intermediary should contact the intermediary regarding the hours during which orders may be placed.
Tax Information
The Fund’s distributions are taxable, and will be taxed as ordinary income or long-term capital gains, unless you are investing through a tax-deferred or other tax-advantaged arrangement, such as a 401(k) plan or an IRA, in which case such distributions may be taxable at a later date.
Payments to Broker-Dealers and Other Financial Intermediaries
If you purchase Fund shares through a broker-dealer or other financial intermediary (such as a bank), the Fund and its related companies may pay the intermediary for the sale of Fund shares and related services. Fund shares may also be available on certain brokerage platforms. An investor transacting in Fund shares through a broker acting as an agent for the investor may be required to pay a commission and/or other forms of compensation to the broker. If made, these payments may create conflicts of interest by influencing the broker-dealer or other intermediary and your salesperson to
4
recommend the Fund over another investment. Ask your salesperson or visit your financial intermediary’s website for more information.
5
Serious News for Serious Traders! Try StreetInsider.com Premium Free!
You May Also Be Interested In
- Q2 Metals Announces Assay Results from Its 2023 Inaugural Drill Program at the Mia Lithium Property, James Bay Territory, Quebec, Canada
- The Spaceport Company Signs Agreement with Maritime Launch to Provide Tracking and Telemetry Stations for Spaceport Nova Scotia
- Opera Reports First Quarter Results Ahead of Expectations, Raises Full Year Outlook
Create E-mail Alert Related Categories
SEC FilingsSign up for StreetInsider Free!
Receive full access to all new and archived articles, unlimited portfolio tracking, e-mail alerts, custom newswires and RSS feeds - and more!
