

Form 497K JANUS INVESTMENT FUND
 Tweet
Tweet Share
Share[JANUS
HENDERSON LOGO]
Janus Henderson Forty
Fund
| Ticker: |
JDCAX |
Class A Shares |
JARTX |
Class S Shares |
JFRNX |
Class N Shares |
JACTX |
Class T Shares |
| |
JACCX |
Class C Shares |
JCAPX |
Class I Shares |
JDCRX |
Class R Shares |
|
|
Summary Prospectus dated January 27, 2023
Before you invest, you may want to review the
Fund’s Prospectus, which contains more information about the Fund and its risks. You can find the Fund’s Prospectus,
reports to shareholders, and other information about the Fund online at janushenderson.com/info. You can also get this
information at no cost by calling a Janus Henderson representative at 1-877-335-2687 or by sending an email request to
[email protected].
| Investment Objective |
Janus Henderson Forty Fund seeks long-term growth of capital.
| Fees and Expenses of the Fund |
This table describes the fees and expenses that you may pay if you buy, hold, and sell Shares
of the Fund. Each share class has different expenses, but represents an investment in the same Fund. For Class A Shares, you may qualify for sales charge discounts if you and your family invest, or
agree to invest in the future, at least $50,000 in the Fund or in other Janus Henderson funds. More information about these and other discounts, as well as eligibility requirements for each share class, is available from your financial professional and in the “Purchases” section on page
97 of the Fund’s Prospectus and in the “Purchases” section on page 79 of the Fund’s Statement of Additional Information. In addition, please see Appendix A – Intermediary Sales Charge Waivers and Discounts. You may also incur brokerage commissions
charged by your broker or financial intermediary when buying Class I Shares or Class N
Shares of the Fund that are not reflected in the table or in the example below.
| SHAREHOLDER FEES
(fees paid directly from your investment) |
|
Class A |
|
Class C |
|
Class S |
|
Class I |
|
Class N |
|
Class R |
|
Class T |
| Maximum Sales Charge (load) Imposed on Purchases (as a percentage of offering price) |
|
5.75% |
|
None |
|
None |
|
None |
|
None |
|
None |
|
None |
| Maximum Deferred Sales Charge (load) (as a percentage of the lower of original purchase price or redemption proceeds) |
|
None |
|
1.00% |
|
None |
|
None |
|
None |
|
None |
|
None |
| ANNUAL FUND OPERATING EXPENSES
(expenses that you pay each year as a percentage of the value
of your investment) |
|
Class A |
|
Class C |
|
Class S |
|
Class I |
|
Class N |
|
Class R |
|
Class T |
| Management Fees(1) |
|
0.55% |
|
0.55% |
|
0.55% |
|
0.55% |
|
0.55% |
|
0.55% |
|
0.55% |
| Distribution/Service (12b-1) Fees |
|
0.25% |
|
1.00% |
|
0.25% |
|
None |
|
None |
|
0.50% |
|
None |
| Other Expenses |
|
0.09% |
|
0.09% |
|
0.27% |
|
0.09% |
|
0.02% |
|
0.27% |
|
0.26% |
| Total Annual Fund Operating Expenses |
|
0.89% |
|
1.64% |
|
1.07% |
|
0.64% |
|
0.57% |
|
1.32% |
|
0.81% |
(1)
This fee may adjust up or down monthly based on the Fund’s performance
relative to its benchmark index over the performance measurement period. For more information regarding performance-based advisory fees, refer to “Management
Expenses” in the Fund’s Prospectus.
EXAMPLE:
The Example is intended to help you compare the cost of investing in the Fund with the cost of investing in other mutual funds. The Example assumes that you invest $10,000 in the Fund for the time periods indicated and reinvest all dividends and distributions. The Example also assumes that your investment has a 5% return each year and that the Fund’s operating expenses remain the same. Class C Shares automatically convert to Class A Shares after eight years. The Example for Class C
Shares for the ten-year period reflects the conversion to Class A Shares. Although your actual costs may be higher or lower, based on these assumptions your costs would be:
| If Shares are redeemed: |
1 Year |
3 Years |
5 Years |
10 Years |
| Class A Shares |
$ 661 |
$ 843 |
$ 1,040
|
$ 1,608 |
| Class C Shares |
$ 267 |
$ 517 |
$ 892 |
$ 1,743 |
| Class S Shares |
$ 109 |
$ 340 |
$ 590 |
$ 1,306 |
| Class I Shares |
$ 65 |
$ 205 |
$ 357 |
$ 798 |
1 | Janus Henderson Forty Fund
| If Shares are redeemed: |
1 Year |
3 Years |
5 Years |
10 Years |
| Class N Shares |
$ 58 |
$ 183 |
$ 318 |
$ 714 |
| Class R Shares |
$ 134 |
$ 418 |
$ 723 |
$ 1,590 |
| Class T Shares |
$ 83 |
$ 259 |
$ 450 |
$ 1,002 |
| If Shares are not redeemed: |
1 Year |
3 Years |
5 Years |
10 Years |
| Class A Shares |
$ 661 |
$ 843 |
$ 1,040
|
$ 1,608 |
| Class C Shares |
$ 167 |
$ 517 |
$ 892 |
$ 1,743 |
| Class S Shares |
$ 109 |
$ 340 |
$ 590 |
$ 1,306 |
| Class I Shares |
$ 65 |
$ 205 |
$ 357 |
$ 798 |
| Class N Shares |
$ 58 |
$ 183 |
$ 318 |
$ 714 |
| Class R Shares |
$ 134 |
$ 418 |
$ 723 |
$ 1,590 |
| Class T Shares |
$ 83 |
$ 259 |
$ 450 |
$ 1,002 |
Portfolio Turnover: The Fund pays transaction costs, such as commissions, when it buys and sells securities (or
“turns over” its portfolio). A higher portfolio turnover rate may indicate higher transaction costs and may result in higher taxes when Fund shares are held in a taxable account. These costs, which are not reflected in annual fund operating expenses or in the Example, affect the Fund’s performance. During the most recent fiscal year, the Fund’s portfolio turnover rate was 39% of the average value of its portfolio.
| Principal investment strategies |
The Fund pursues its investment objective by normally investing primarily in a portfolio of
30-40 common stocks selected for their growth potential. The Fund may invest in companies of any size, but will invest primarily in larger, well-established companies. The Fund may also invest in foreign securities. The Fund is classified as non-diversified, which allows it to hold larger positions in securities compared to a fund that is classified as diversified. As of September 30, 2022, the Fund held stocks of 33 companies. Of these holdings, 30 comprised approximately 93.32% of the Fund’s holdings.
The portfolio managers apply a “bottom up” approach that focuses on fundamental
research and considers, among other factors, a company’s sustainable competitive advantages, long-term growth potential, and shareholder value. The Fund will
generally consider selling a security when, in the portfolio managers’ opinion, there is a deterioration in a company’s financials, the investment thesis for owning the position has changed, or if the security exceeds its targeted value.
The Fund may seek to earn additional income through lending its securities to certain
qualified broker-dealers and institutions on a short-term or long-term basis, in an amount equal to up to one-third of its total assets as determined at the time of the loan origination.
| Principal investment risks |
The biggest risk is that the Fund’s returns will vary, and you could lose money. The Fund is designed for long-term investors seeking an equity portfolio, including common stocks. Common stocks tend to be more volatile than many other investment choices. The principal risks associated with investing in the Fund are set forth below.
Market Risk. The value of the Fund’s portfolio may decrease due to short-term
market movements and over more prolonged market downturns. As a result, the Fund’s net asset value may fluctuate and it may be more difficult to value or sell the
Fund’s holdings. Market risk may affect a single issuer, industry, economic sector, or the market as a whole. Market risk may be magnified if certain social, political, economic, and other conditions and events (such as terrorism, conflicts, including related sanctions, social unrest, natural disasters, epidemics and pandemics, including
COVID-19) adversely interrupt the global economy and financial markets. It is important to understand that the value of your investment may fall, sometimes sharply, in response to changes in the market, and you could lose money.
Portfolio Management Risk. The Fund is an actively managed investment portfolio and
is therefore subject to the risk that the investment strategies and research process employed for the
Fund may fail to produce the intended results. The Fund may underperform its benchmark index or other mutual funds with similar
investment objectives.
Growth Securities
Risk. Securities of companies perceived to be
“growth” companies may be more volatile than other stocks and may involve special risks. If the portfolio
managers’ perception of a company’s growth potential is not realized, the
2 | Janus Investment Fund
securities purchased may not perform as expected, reducing the Fund’s returns. In addition, because different types of stocks tend to shift in and out of favor depending on market and economic conditions, “growth” stocks may perform differently from the market as a whole and other types of securities.
Nondiversification Risk. The Fund is classified as nondiversified under the Investment Company Act of 1940, as amended. This
gives the Fund’s portfolio managers more flexibility to hold larger positions in
securities. As a result, an increase or decrease in the value of a single security held by the Fund may have a greater impact on the Fund’s net asset value and
total return.
Issuer Concentration Risk. The Fund’s portfolio may be comprised of a relatively small number of issuers in comparison to
other funds. As a result, the Fund may be subject to greater risks than a fund that invests in a greater number of issuers. A change in the value of any single investment held by the Fund may affect the overall value of the Fund more than it would affect a fund that holds more investments. In particular, the Fund may be more susceptible to adverse developments affecting any single issuer held by the Fund and may be susceptible to greater losses because of these developments. The Fund’s policy of concentrating its portfolio in a smaller number of holdings could result
in more volatility in the Fund’s performance and share price.
Industry and Sector Risk. Although the Fund does not concentrate its investments in specific
industries or sectors, it may have a significant portion of its assets invested in
securities of companies conducting similar business, or business within the same economic sector. Companies in the same industry or economic sector may be similarly
affected by economic or market events, making the Fund more vulnerable to unfavorable developments than funds that invest more broadly. As the Fund’s portfolio becomes more concentrated, the Fund is less able to spread risk and potentially reduce the risk of loss and volatility. In addition, the Fund may be overweight or underweight in certain industries or sectors relative to its benchmark index, which may cause the Fund’s performance to be more or less sensitive to developments affecting those sectors.
Mid-Sized Companies Risk. Investments in securities issued by mid-sized companies may involve greater risks than are
customarily associated with larger, more established companies. For example, while
mid-sized companies may realize more substantial growth than larger or more established issuers, they may also suffer more significant losses as a result of their
narrow product lines, limited operating history, greater exposure to competitive threats, limited financial resources, limited trading markets, and the potential lack of management depth. Securities issued by mid-sized
companies tend to be more volatile than securities issued by larger or more established companies and may underperform as compared to the securities of larger or more established companies. These holdings are also subject to wider price fluctuations
and tend to be less liquid than stocks of larger or more established companies, which could have a significant adverse effect on the Fund’s returns, especially as market conditions change.
Foreign Exposure Risk. Foreign markets can be more volatile than the U.S. market. As a result, the Fund’s returns and net asset value may be affected by fluctuations in currency exchange rates or political or economic conditions in a particular country. In some foreign markets, there may not be protection against failure by other parties to complete transactions. It may not be possible for the Fund to repatriate capital, dividends, interest, and other income from a particular country or governmental entity. In addition, a market swing in one or more countries or regions where the Fund has invested a significant amount of its assets may have a greater effect on the Fund’s performance than it would in a more geographically diversified portfolio.
Securities Lending Risk. There is the risk that when portfolio securities are lent, the securities may not be returned on a
timely basis, and the Fund may experience delays and costs in recovering the security or gaining access to the collateral provided to the Fund to collateralize the loan. If the Fund is unable to recover a security on loan, the Fund may use the collateral to purchase replacement securities in the market. There is a risk that the value of the collateral could decrease below the cost of the replacement security by the time the replacement investment is made, resulting in a loss to the Fund.
An investment in the Fund is not a bank deposit and is not insured or
guaranteed by the Federal Deposit Insurance Corporation or any other government agency.
| Performance information |
The following information provides some indication of the risks of investing in the Fund by
showing how the Fund’s performance has varied over time. Class S Shares, Class A Shares, Class C Shares, Class I Shares, and Class R Shares of the Fund
commenced operations on July 6, 2009, after the reorganization of each corresponding class of shares of Janus Adviser
3 | Janus Henderson Forty Fund
Forty Fund (the “JAD Predecessor Fund”) into each respective share class of the
Fund. Class T Shares of the Fund commenced operations on July 6, 2009. Class N Shares of the Fund commenced operations on May 31, 2012.
•
The performance shown for Class S Shares reflects the performance of the JAD Predecessor Fund’s Class S Shares (formerly named Class I Shares) from August 1, 2000 to July 6, 2009 (prior to the reorganization), calculated using the fees and expenses of Class S Shares of the JAD Predecessor Fund, net of any applicable fee and expense limitations or waivers. For the periods prior to August 1, 2000, the performance shown for Class S Shares reflects the historical performance of the Retirement Shares of Janus Aspen Series – Forty Portfolio (as a result of a separate prior reorganization of those Retirement Shares into the JAD Predecessor Fund). The performance shown for certain periods prior to August 1, 2000 was calculated using the fees and expenses of Class S Shares of the JAD Predecessor Fund, without the effect of any fee and expense limitations or waivers.
•
The performance shown for Class A Shares reflects the performance of the JAD
Predecessor Fund’s Class A Shares from September 30, 2004 to July 6, 2009 (prior to the reorganization), calculated using the fees and expenses of Class A Shares
of the JAD Predecessor Fund, net of any applicable fee and expense limitations or waivers. For the periods August 1, 2000 to September 30, 2004, the performance shown for Class A Shares reflects the historical performance of the JAD Predecessor Fund’s Class S Shares (formerly named Class I Shares). For the periods prior to August 1, 2000, the performance shown for Class A Shares reflects the historical performance of the Retirement Shares of Janus Aspen Series – Forty Portfolio (as a result of a separate prior reorganization of those Retirement Shares into the JAD Predecessor Fund). The performance shown for certain periods prior to September 30, 2004 was calculated using the fees and expenses of Class S Shares of the JAD Predecessor Fund, without the effect of any fee and expense limitations or waivers.
•
The performance shown for Class C Shares reflects the performance of the JAD Predecessor Fund’s Class C Shares from September 30, 2002 to July 6, 2009 (prior to the reorganization), calculated using the fees and expenses of Class C Shares of the JAD Predecessor Fund, net of any applicable fee and expense limitations or waivers. For the periods August 1, 2000 to September 30, 2002, the performance shown for Class C Shares reflects the historical performance of the JAD Predecessor Fund’s Class S Shares (formerly named Class I Shares). For the periods prior to August 1, 2000, the performance shown for Class C Shares reflects the historical performance of the Retirement Shares of Janus Aspen Series – Forty Portfolio (as a result of a separate prior reorganization of those Retirement Shares into the JAD Predecessor Fund). The performance shown for certain periods prior to September 30, 2002 was calculated using the fees and expenses of Class S Shares of the JAD Predecessor Fund, without the effect of any fee and expense limitations or waivers.
•
The performance shown for Class I Shares reflects the performance of the JAD Predecessor Fund’s Class I Shares from November 28, 2005 to July 6, 2009 (prior to the reorganization), calculated using the fees and expenses of Class I Shares of the JAD Predecessor Fund, net of any applicable fee and expense limitations or waivers. For the periods August 1, 2000 to November 28, 2005, the performance shown for Class I Shares reflects the historical performance of the JAD Predecessor Fund’s Class S Shares (formerly named Class I Shares). For the periods prior to August 1, 2000, the performance shown for Class I Shares reflects the historical performance of the Retirement Shares of Janus Aspen Series – Forty Portfolio (as a result of a separate prior reorganization of those Retirement Shares into the JAD Predecessor Fund). The performance shown for certain periods prior to November 28, 2005 was calculated using the fees and expenses of Class S Shares of the JAD Predecessor Fund, without the effect of any fee and expense limitations or waivers.
•
The performance shown for Class N Shares reflects the performance of the
Fund’s Class S Shares from July 6, 2009 to May 31, 2012, calculated using the fees and expenses of Class S Shares, net of any applicable fee and expense
limitations or waivers. For the period from August 1, 2000 to July 6, 2009, the performance shown for Class N Shares reflects the performance of Class S Shares (formerly named Class I Shares) of the JAD Predecessor Fund (prior to the reorganization of those Class S Shares into the Fund), calculated using the fees and expenses of Class S Shares of the JAD Predecessor Fund, net of any applicable fee and expense limitations or waivers. For the periods prior to August 1, 2000, the performance shown for Class N Shares reflects the historical performance of the Retirement Shares of Janus Aspen Series – Forty Portfolio (as a result of a separate prior reorganization of those Retirement Shares into the JAD Predecessor Fund). The performance for certain periods prior to August 1, 2000 was calculated using the fees and expenses of Class S Shares of the JAD Predecessor Fund, without the effect of any fee and expense limitations or waivers.
•
The performance shown for Class R Shares reflects the performance of the JAD
Predecessor Fund’s Class R Shares from September 30, 2004 to July 6, 2009 (prior to the reorganization), calculated using the fees and expenses of Class R Shares
of the JAD Predecessor Fund, net of any applicable fee and expense limitations or waivers. For the periods August 1, 2000 to September 30, 2004, the performance shown for Class R Shares reflects the historical performance of the JAD Predecessor Fund’s Class S Shares (formerly named Class I Shares). For the periods prior to August 1, 2000, the performance shown for Class R Shares reflects the historical performance of the Retirement Shares of Janus Aspen
4 | Janus Investment Fund
Series – Forty Portfolio (as a result of a separate prior reorganization of
those Retirement Shares into the JAD Predecessor Fund). The performance shown for certain periods prior to September 30, 2004 was calculated using the fees and expenses
of Class R Shares of the JAD Predecessor Fund, without the effect of any fee and expense limitations or waivers.
•
The performance shown for Class T Shares reflects the performance of the JAD
Predecessor Fund’s Class S Shares (formerly named Class I Shares) from August 1, 2000 to July 6, 2009 (prior to the reorganization), calculated using the fees and
expenses of Class S Shares of the JAD Predecessor Fund, net of any applicable fee and expense limitations or waivers. For the periods prior to August 1, 2000, the performance shown for Class T Shares reflects the historical performance of the Retirement Shares of Janus Aspen Series – Forty Portfolio (as a result of a separate prior reorganization of those Retirement Shares into the JAD Predecessor Fund). The performance shown for certain periods prior to August 1, 2000 was calculated using the fees and expenses of Class S Shares of the JAD Predecessor Fund, without the effect of any fee and expense limitations or waivers.
If Class A Shares, Class C Shares, Class I Shares, Class R Shares, and Class T Shares of
the Fund had been available during each period prior to July 6, 2009, or Class N Shares of the Fund had been available during periods prior to May 31, 2012, the performance shown for each respective share class may have been different. The performance shown for the periods following the Fund’s commencement of Class S Shares, Class A Shares, Class C Shares, Class I Shares, Class N Shares, Class R Shares, and Class T Shares reflects the fees and expenses of each respective share class, net of any applicable fee and expense limitations or waivers.
The bar chart depicts the change in performance from year to year during the periods indicated. The
bar chart figures do not include any applicable sales charges that an investor may pay when they buy or sell Class A Shares or Class C Shares of the Fund. If sales charges were included, the returns would be lower. The table compares the Fund’s average annual returns for the periods indicated to a
broad-based securities market index, as well as to one or more supplemental indices that have investment characteristics similar to those of the Fund. All figures
assume reinvestment of dividends and distributions. For certain periods, the Fund’s performance reflects the effect of expense waivers. Without the effect of these expense waivers, the performance shown would have been lower.
The Fund’s past performance (before and after taxes) does not necessarily indicate how it will perform in the future. Updated performance information is available at janushenderson.com/performance or by calling 1-877-335-2687.
| Annual Total Returns for Class S Shares (calendar year-end) |
 |
| Best Quarter: |
2nd Quarter 2020 |
26.53% |
Worst Quarter: |
2nd Quarter 2022 |
– 25.58% |
5 | Janus Henderson Forty Fund
| Average Annual Total Returns (periods ended 12/31/22) |
|
|
|
|
| |
1 Year |
5 Years |
10 Years |
Since Inception
of Predecessor Fund
(5/1/97) |
| Class S Shares |
|
|
|
|
| Return Before Taxes |
– 33.81% |
9.13% |
12.52% |
10.75% |
| Return After Taxes on Distributions |
– 33.82% |
7.43% |
9.31% |
9.43% |
| Return After Taxes on Distributions and Sale of Fund Shares(1) |
– 20.01% |
7.30% |
9.45% |
9.19% |
| Russell 1000® Growth Index
(reflects no deduction for expenses, fees, or taxes) |
– 29.14% |
10.96% |
14.10% |
8.30% |
| S&P 500® Index
(reflects no deduction for expenses, fees, or taxes) |
– 18.11% |
9.42% |
12.56% |
8.30% |
| Class A Shares |
|
|
|
|
| Return Before Taxes(2) |
– 37.51% |
8.00% |
11.97% |
10.62% |
| Russell 1000® Growth Index
(reflects no deduction for expenses, fees, or taxes) |
– 29.14% |
10.96% |
14.10% |
8.30% |
| S&P 500® Index
(reflects no deduction for expenses, fees, or taxes) |
– 18.11% |
9.42% |
12.56% |
8.30% |
| Class C Shares |
|
|
|
|
| Return Before Taxes(3) |
– 34.82% |
8.58% |
11.92% |
10.19% |
| Russell 1000® Growth Index
(reflects no deduction for expenses, fees, or taxes) |
– 29.14% |
10.96% |
14.10% |
8.30% |
| S&P 500® Index
(reflects no deduction for expenses, fees, or taxes) |
– 18.11% |
9.42% |
12.56% |
8.30% |
| Class I Shares |
|
|
|
|
| Return Before Taxes |
– 33.54% |
9.59% |
12.97% |
11.07% |
| Russell 1000® Growth Index
(reflects no deduction for expenses, fees, or taxes) |
– 29.14% |
10.96% |
14.10% |
8.30% |
| S&P 500® Index
(reflects no deduction for expenses, fees, or taxes) |
– 18.11% |
9.42% |
12.56% |
8.30% |
| Class N Shares |
|
|
|
|
| Return Before Taxes |
– 33.49% |
9.66% |
13.06% |
10.97% |
| Russell 1000® Growth Index
(reflects no deduction for expenses, fees, or taxes) |
– 29.14% |
10.96% |
14.10% |
8.30% |
| S&P 500® Index
(reflects no deduction for expenses, fees, or taxes) |
– 18.11% |
9.42% |
12.56% |
8.30% |
| Class R Shares |
|
|
|
|
| Return Before Taxes |
– 33.98% |
8.85% |
12.22% |
10.49% |
| Russell 1000® Growth Index
(reflects no deduction for expenses, fees, or taxes) |
– 29.14% |
10.96% |
14.10% |
8.30% |
| S&P 500® Index
(reflects no deduction for expenses, fees, or taxes) |
– 18.11% |
9.42% |
12.56% |
8.30% |
6 | Janus Investment Fund
| Average Annual Total Returns (periods ended 12/31/22) |
|
|
|
|
| |
1 Year |
5 Years |
10 Years |
Since
Inception
of Predecessor Fund
(5/1/97) |
| Class T Shares |
|
|
|
|
| Return Before Taxes |
– 33.64% |
9.41% |
12.79% |
10.89% |
| Russell 1000® Growth Index
(reflects no deduction for expenses, fees, or taxes) |
– 29.14% |
10.96% |
14.10% |
8.30% |
| S&P 500® Index
(reflects no deduction for expenses, fees, or taxes) |
– 18.11% |
9.42% |
12.56% |
8.30% |
(1)
If the Fund incurs a loss, which generates a tax benefit, the Return After Taxes on Distributions
and Sale of Fund Shares may exceed the Fund’s other return figures.
(2)
Calculated assuming maximum permitted sales loads.
(3)
The one
year return is calculated to include the contingent deferred sales charge.
The Fund’s primary benchmark index is the Russell 1000 Growth Index. The Fund also compares its performance to the S&P 500 Index. The indices are described below.
•
The Russell 1000 Growth Index measures the performance of those Russell 1000
companies with higher price-to-book ratios and higher forecasted growth values.
•
The S&P 500 Index is a commonly recognized, market capitalization-weighted
index of 500 widely held equity securities, designed to measure broad U.S. equity performance.
After-tax returns are calculated using distributions for the Fund’s Class S
Shares for the periods following July 6, 2009; for the JAD Predecessor Fund’s Class S Shares (formerly named Class I Shares) for the periods August 1, 2000 to
July 6, 2009; and actual distributions for other classes of shares for periods prior to August 1, 2000. After-tax returns are calculated using the historically highest individual federal marginal income tax rates and do not reflect the impact of state and local taxes. Actual after-tax returns depend on your individual tax situation and may differ from those shown in
the preceding table. The after-tax return information shown above does not apply to Fund shares held through a tax-advantaged account, such as a 401(k) plan or an IRA.
After-tax returns are only shown for Class S Shares of the Fund. After-tax returns for the other classes of Shares will vary from those shown for Class S Shares due to varying sales charges (as applicable), fees, and expenses among the classes.
| Management |
Investment Adviser: Janus Henderson Investors US LLC
Portfolio Managers: A. Douglas Rao is Executive Vice President and Co-Portfolio Manager of the Fund, which he has managed or co-managed
since June 2013. Brian Recht is Executive Vice President and
Co-Portfolio Manager of the Fund, which he has co-managed since March 2022. Nick Schommer, CFA, is Executive Vice President and Co-Portfolio Manager of the Fund, which he has co-managed since January 2016.
7 | Janus Henderson Forty Fund
| Purchase and sale of Fund shares |
Minimum Investment Requirements
| Class A Shares, Class C Shares*, Class S Shares, Class R Shares, and Class T
Shares |
|
| Non-retirement accounts |
$2,500** |
| Certain tax-advantaged accounts or UGMA/UTMA accounts |
$500 |
| Class I Shares |
|
| Institutional investors (investing directly with the Fund)
|
$1,000,000 |
| Through an intermediary institution |
|
| • non-retirement accounts |
$2,500† |
| • certain tax-advantaged accounts or UGMA/UTMA accounts |
$500† |
| Class N Shares |
|
| Retirement investors (investing through an adviser-assisted,
employer-sponsored retirement plan) |
None |
| Retail investors (investing through a financial intermediary omnibus
account) |
$2,500*** |
| Institutional investors (investing directly with the Fund)
|
$1,000,000 |
†
Exceptions to these minimums may apply for certain tax-advantaged, tax-qualified
and retirement plans, including health savings accounts, accounts held through certain wrap programs, and certain retail brokerage accounts.
*
The maximum purchase in Class C Shares is $500,000 for any single
purchase.
**
Class A, Class C, Class S, and Class T shares held through certain supermarket
and/or self-directed brokerage accounts, or through wrap programs, may not be subject to these minimums. Please contact your financial intermediary for more
information. For Class R shareholders, there is no investment minimum for defined
contribution plans. Investors in a defined contribution plan through a third party administrator should refer to their plan document or contact their plan administrator
for additional information regarding account minimums.
***
Investors in certain tax-advantaged accounts or accounts held through certain wrap
programs or bank trust platforms may not be subject to this minimum.
Purchases, exchanges, and redemptions can generally be made only through institutional
channels, such as financial intermediaries and retirement platforms. Class I Shares may
be purchased directly by certain institutional investors who established Class I Shares accounts before August 4, 2017. You should contact your financial intermediary or refer to your plan documents for information on
how to invest in the Fund. Requests must be received in good order by the Fund or its agents (financial intermediary or plan sponsor, if applicable) prior to the close
of the trading session of the New York Stock Exchange in order to receive that day’s net asset value. For additional information, refer to
“Purchases,” “Exchanges,” and/or “Redemptions” in the Prospectus.
| Tax information |
The Fund’s distributions are taxable, and will be taxed as ordinary income or capital
gains, unless you are investing through a tax-advantaged arrangement, such as a 401(k) plan or an individual retirement account (in which case you may be taxed upon withdrawal of your investment from such account).
| Payments to broker-dealers and other financial intermediaries |
If you purchase
Class A Shares, Class C Shares, Class S Shares, Class I Shares, Class R Shares, or Class T Shares of the Fund through a broker-dealer or other financial intermediary (such as a bank), the Fund or
its distributor (or its affiliates) may pay the intermediary for the sale of Fund shares and related services. These payments may create a conflict of interest by
influencing the broker-dealer or other intermediary and your salesperson to recommend the Fund over another investment or to recommend one share class over another. There is some regulatory uncertainty concerning whether marketing support or other similar payments may be made or received in connection with Class I Shares where a financial intermediary has imposed its own sales charges or transaction fees. As a result, based on future regulatory developments, such payments may be terminated, or the Fund may prohibit financial intermediaries from imposing such sales charges or transaction fees in connection with Class I Shares. Ask your salesperson or visit your financial intermediary’s website for more information.
8 | Janus Investment Fund
[JANUS
HENDERSON LOGO]
Janus Henderson Forty
Fund
| Ticker: |
JFRDX |
Class D Shares |
Summary Prospectus dated January 27, 2023
Before you invest, you may want to review the
Fund’s Prospectus, which contains more information about the Fund and its risks. You can find the Fund’s Prospectus,
reports to shareholders, and other information about the Fund online at janushenderson.com/reports. You can also get this
information at no cost by calling a Janus Henderson representative at 1-800-525-3713 or by sending an email request to
[email protected].
| Investment Objective |
Janus Henderson Forty Fund seeks long-term growth of capital.
| Fees and Expenses of the Fund |
This table describes the fees and expenses that you may pay if you buy, hold, and sell Shares of the Fund.
| ANNUAL FUND OPERATING EXPENSES
(expenses that you pay each year as a percentage of the value of your investment) |
|
Class D |
| Management Fees(1) |
|
0.55% |
| Other Expenses |
|
0.14% |
| Total Annual Fund Operating Expenses |
|
0.69% |
(1)
This fee may adjust up or down monthly based on the Fund’s performance
relative to its benchmark index over the performance measurement period. For more information regarding performance-based advisory fees, refer to “Management
Expenses” in the Fund’s Prospectus.
EXAMPLE:
The Example is intended to help you compare the cost of investing in the Fund with the cost of investing in other mutual funds. The Example assumes that you invest $10,000 in the Fund for the time periods indicated, reinvest all dividends and distributions, and then redeem all of your Shares at the end of each period. The Example also assumes that your investment has a 5% return each year and that the Fund’s operating expenses remain the same. Although your actual costs may be higher or lower, based on these assumptions your costs would
be:
| |
1 Year |
3 Years |
5 Years |
10 Years |
| Class D Shares |
$ 70 |
$ 221 |
$ 384 |
$ 859 |
Portfolio Turnover: The Fund pays transaction costs, such as commissions, when it buys and sells securities (or
“turns over” its portfolio). A higher portfolio turnover rate may indicate higher transaction costs and may result in higher taxes when Fund shares are held in a taxable account. These costs, which are not reflected in annual fund operating expenses or in the Example, affect the Fund’s performance. During the most recent fiscal year, the Fund’s portfolio turnover rate was 39% of the average value of its portfolio.
| Principal investment strategies |
The Fund pursues its investment objective by normally investing primarily in a portfolio of
30-40 common stocks selected for their growth potential. The Fund may invest in companies of any size, but will invest primarily in larger, well-established companies. The Fund may also invest in foreign securities. The Fund is classified as non-diversified, which allows it to hold larger positions in securities compared to a fund that is classified as diversified. As of September 30, 2022, the Fund held stocks of 33 companies. Of these holdings, 30 comprised approximately 93.32% of the Fund’s holdings.
The portfolio managers apply a “bottom up” approach that focuses on fundamental
research and considers, among other factors, a company’s sustainable competitive advantages, long-term growth potential, and shareholder value. The Fund will
generally consider selling a security when, in the portfolio managers’ opinion, there is a deterioration in a company’s financials, the investment thesis for owning the position has changed, or if the security exceeds its targeted value.
The Fund may seek to earn additional income through lending its securities to certain
qualified broker-dealers and institutions on a short-term or long-term basis, in an amount equal to up to one-third of its total assets as determined at the time of the loan origination.
1 | Janus Henderson Forty Fund
| Principal investment risks |
The biggest risk is that the Fund’s returns will vary, and you could lose money. The Fund is designed for long-term investors seeking an equity portfolio, including common stocks. Common stocks tend to be more volatile than many other investment choices. The principal risks associated with investing in the Fund are set forth below.
Market Risk. The value of the Fund’s portfolio may decrease due to short-term
market movements and over more prolonged market downturns. As a result, the Fund’s net asset value may fluctuate and it may be more difficult to value or sell the
Fund’s holdings. Market risk may affect a single issuer, industry, economic sector, or the market as a whole. Market risk may be magnified if certain social, political, economic, and other conditions and events (such as terrorism, conflicts, including related sanctions, social unrest, natural disasters, epidemics and pandemics, including
COVID-19) adversely interrupt the global economy and financial markets. It is important to understand that the value of your investment may fall, sometimes sharply, in response to changes in the market, and you could lose money.
Portfolio Management Risk. The Fund is an actively managed investment portfolio and
is therefore subject to the risk that the investment strategies and research process employed for the
Fund may fail to produce the intended results. The Fund may underperform its benchmark index or other mutual funds with similar
investment objectives.
Growth Securities
Risk. Securities of companies perceived to be
“growth” companies may be more volatile than other stocks and may involve special risks. If the portfolio
managers’ perception of a company’s growth potential is not realized, the
securities purchased may not perform as expected, reducing the Fund’s returns. In addition, because different types of stocks tend to shift in and out of
favor depending on market and economic conditions, “growth” stocks may perform differently from the market as a whole and other types of
securities.
Nondiversification Risk. The Fund is classified as nondiversified under the Investment Company Act
of 1940, as amended. This gives the Fund’s portfolio managers more flexibility to hold larger positions in securities. As a result, an increase or decrease in
the value of a single security held by the Fund may have a greater impact on the Fund’s net asset value and total return.
Issuer Concentration Risk. The Fund’s portfolio may be comprised of a relatively small number
of issuers in comparison to other funds. As a result, the Fund may be subject to greater risks than a fund that invests in a greater number of issuers. A change in the value of any single investment held by the Fund may affect the overall value of the Fund more than it would affect a fund that holds more investments. In particular, the Fund may be more susceptible to adverse developments affecting any single issuer held by the Fund and may be susceptible to greater losses because of these developments. The Fund’s policy of concentrating its portfolio in a smaller number of holdings could result
in more volatility in the Fund’s performance and share price.
Industry and Sector Risk. Although the Fund does not concentrate its investments in specific industries or sectors, it may
have a significant portion of its assets invested in securities of companies conducting similar business, or business within the same economic sector. Companies in the same industry or economic sector may be similarly affected by economic or market events, making the Fund more vulnerable to unfavorable developments than funds that invest more broadly. As the Fund’s portfolio becomes more concentrated, the Fund is less able to spread risk and potentially reduce the risk of loss and volatility. In addition, the Fund may be overweight or underweight in certain industries or sectors relative to its benchmark index, which may cause the Fund’s performance to be more or less sensitive to developments affecting those sectors.
Mid-Sized Companies Risk. Investments in securities issued by mid-sized companies may involve greater risks than are
customarily associated with larger, more established companies. For example, while
mid-sized companies may realize more substantial growth than larger or more established issuers, they may also suffer more significant losses as a result of their
narrow product lines, limited operating history, greater exposure to competitive threats, limited financial resources, limited trading markets, and the potential lack of management depth. Securities issued by mid-sized
companies tend to be more volatile than securities issued by larger or more established companies and may underperform as compared to the securities of larger or more established companies. These holdings are also subject to wider price fluctuations
and tend to be less liquid than stocks of larger or more established companies, which could have a significant adverse effect on the Fund’s returns, especially as market conditions change.
Foreign Exposure Risk. Foreign markets can be more volatile than the U.S. market. As a result, the Fund’s returns and net asset value may be affected by fluctuations in currency exchange rates or political or economic conditions in a particular country. In some foreign markets, there may not be protection against failure by other parties to complete transactions. It may
2 | Janus Investment Fund
not be possible for the Fund to repatriate capital, dividends, interest, and other income from
a particular country or governmental entity. In addition, a market swing in one or more countries or regions where the Fund has invested a significant amount of its assets may have a greater effect on the Fund’s performance than it would in a more geographically diversified portfolio.
Securities Lending Risk. There is the risk that when portfolio securities are lent, the securities may not be returned on a
timely basis, and the Fund may experience delays and costs in recovering the security or gaining access to the collateral provided to the Fund to collateralize the loan. If the Fund is unable to recover a security on loan, the Fund may use the collateral to purchase replacement securities in the market. There is a risk that the value of the collateral could decrease below the cost of the replacement security by the time the replacement investment is made, resulting in a loss to the Fund.
An investment in the Fund is not a bank deposit and is not insured or
guaranteed by the Federal Deposit Insurance Corporation or any other government agency.
| Performance information |
The following information provides some indication of the risks of investing in the Fund by
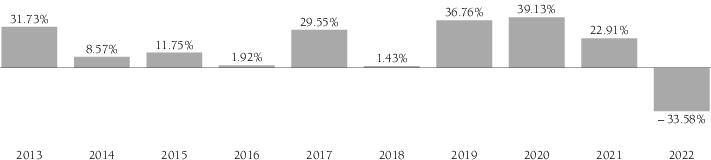
showing how the Fund’s performance has varied over time. Class D Shares of the Fund commenced operations on January 27, 2017. The performance shown for
Class D Shares reflects the performance of the Fund’s Class S Shares from July 6, 2009 to January 27, 2017, calculated using the fees and expenses of Class S
Shares, net of any applicable fee and expense limitations or waivers. The performance shown for Class D Shares reflects the performance of Janus Adviser Forty Fund’s (the “JAD Predecessor Fund”) Class S Shares (formerly named Class I Shares) from August 1, 2000 to July 6, 2009 (prior to the reorganization), calculated using the fees and expenses of Class S Shares of the JAD Predecessor Fund, net of any applicable fee and expense limitations or waivers. For the periods prior to August 1, 2000, the performance shown for Class D Shares reflects the historical performance of the Retirement Shares of Janus Aspen Series – Forty Portfolio (as a result of a separate prior reorganization of those Retirement Shares into the JAD Predecessor Fund). The performance shown for certain periods prior to August 1, 2000 was calculated using the fees and expenses of Class S Shares of the JAD Predecessor Fund, without the effect of any fee and expense limitations or waivers.
If Class D Shares of the Fund had been available during periods prior to January 27, 2017, the performance shown may have been different. The performance shown for periods following the Fund’s commencement of Class D Shares reflects the fees and expenses of Class D Shares, net of any applicable fee and expense limitations or waivers.
The bar chart depicts the change in performance from year to year during the periods
indicated. The table compares the Fund’s average annual returns for the periods
indicated to a broad-based securities market index, as well as to one or more supplemental indices that have investment characteristics similar to those of the Fund.
All figures assume reinvestment of dividends and distributions. For certain periods, the Fund’s performance reflects the effect of expense waivers. Without the
effect of these expense waivers, the performance shown would have been lower.
The Fund’s past performance (before and after taxes) does not
necessarily indicate how it will perform in the future. Updated
performance information is available at
janushenderson.com/allfunds or by calling 1-800-525-3713.
| Annual Total Returns for Class D Shares (calendar year-end) |
 |
| Best Quarter: |
2nd Quarter 2020 |
26.66% |
Worst Quarter: |
2nd Quarter 2022 |
– 25.51% |
3 | Janus Henderson Forty Fund
| Average Annual Total Returns (periods ended 12/31/22) |
|
|
|
|
| |
1 Year |
5 Years |
10 Years |
Since Inception
of Predecessor Fund
(5/1/97) |
| Class D Shares |
|
|
|
|
| Return Before Taxes |
– 33.58% |
9.52% |
12.77% |
10.85% |
| Return After Taxes on Distributions |
– 33.59% |
7.82% |
9.54% |
9.52% |
| Return After Taxes on Distributions and Sale of Fund Shares(1) |
– 19.87% |
7.61% |
9.64% |
9.26% |
| Russell 1000® Growth Index
(reflects no deduction for expenses, fees, or taxes) |
– 29.14% |
10.96% |
14.10% |
8.30% |
| S&P 500® Index
(reflects no deduction for expenses, fees, or taxes) |
– 18.11% |
9.42% |
12.56% |
8.30% |
(1)
If the Fund incurs a loss, which generates a tax benefit, the Return After Taxes on Distributions
and Sale of Fund Shares may exceed the Fund’s other return figures.
The Fund’s primary benchmark index is the Russell 1000 Growth Index. The Fund also
compares its performance to the S&P 500 Index. The indices are described below.
•
The Russell 1000 Growth Index measures the performance of those Russell 1000
companies with higher price-to-book ratios and higher forecasted growth values.
•
The S&P 500 Index is a commonly recognized, market capitalization-weighted
index of 500 widely held equity securities, designed to measure broad U.S. equity performance.
After-tax returns are calculated using distributions for the Fund’s Class D
Shares for the periods following January 27, 2017; for the Fund’s Class S Shares for periods July 6, 2009 to January 27, 2017; for the JAD Predecessor
Fund’s Class S Shares (formerly named Class I Shares) for the periods August 1, 2000 to July 6, 2009; and actual distributions for other classes of shares for periods prior to August 1, 2000. If Class D Shares of the Fund had been available during these earlier periods, distributions may have been different and thus, after-tax returns may have been different from those shown. After-tax returns
are calculated using the historically highest individual federal marginal income tax rates and do not reflect the impact of state and local taxes. Actual after-tax returns depend on your individual tax situation and may differ
from those shown in the preceding table. The after-tax return information shown above does not apply to Fund shares held through a tax-advantaged account, such as a 401(k) plan or an IRA.
| Management |
Investment Adviser: Janus Henderson Investors US LLC
Portfolio Managers: A. Douglas Rao is Executive Vice President and Co-Portfolio Manager of the Fund, which he has managed or co-managed
since June 2013. Brian Recht is Executive Vice President and
Co-Portfolio Manager of the Fund, which he has co-managed since March 2022. Nick Schommer, CFA, is Executive Vice President and Co-Portfolio Manager of the Fund, which he has co-managed since January 2016.
| Purchase and sale of Fund shares |
| Minimum Investment Requirements |
|
| To open a new regular Fund account |
$2,500 |
| To open a new regular Fund account with an automatic investment program
of $50 per month |
$100 |
| To open a new UGMA/UTMA account, Coverdell Education Savings Account, or a retirement Fund account |
|
| • without an automatic investment
program |
$1,000 |
| • with an automatic investment program of $50 per month |
$100 |
| To add to any existing type of Fund account without an automatic
investment program |
$50 |
4 | Janus Investment Fund
You may generally purchase, exchange, or redeem Fund Shares on any business day by written
request, wire transfer, telephone, and in most cases, online at
janushenderson.com/individual. You may conduct transactions by mail (Janus Henderson, P.O. Box 219109, Kansas City, MO 64121-9109), or by telephone at 1-800-525-3713. Purchase, exchange, or redemption requests must be received in
good order by the Fund or its agents prior to the close of the trading session of the New York Stock Exchange in order to receive that day’s net asset value. For
additional information, refer to “To Open an Account or Buy Shares,” “To Exchange Shares,” and/or “To Sell Shares” in the
Prospectus.
| Tax information |
The Fund’s distributions are taxable, and will be taxed as ordinary income or capital
gains, unless you are investing through a tax-advantaged arrangement, such as a 401(k) plan or an individual retirement account (in which case you may be taxed upon withdrawal of your investment from such account).
| Payments to broker-dealers and other financial intermediaries |
With respect to share classes not offered in this Prospectus, the Fund or its distributor (or
its affiliates) pay select broker-dealer firms or other financial intermediaries for the sale of Fund shares and related services. These payments may create a conflict of interest by influencing a broker-dealer or other intermediary or a salesperson to recommend the Fund over another investment or to recommend one share class over another.
5 | Janus Henderson Forty Fund
Serious News for Serious Traders! Try StreetInsider.com Premium Free!
You May Also Be Interested In
- Janus Henderson Group (JHG) PT Raised to $33 at Morgan Stanley
- Craft Cannabis Cultivator Hamilton Farms Lands on Dispensary Shelves in New Jersey
- Raynes & Lawn Law Firm Nationally Recognized for Its Work on Medical Malpractice and Birth Injuries
Create E-mail Alert Related Categories
SEC FilingsSign up for StreetInsider Free!
Receive full access to all new and archived articles, unlimited portfolio tracking, e-mail alerts, custom newswires and RSS feeds - and more!
