

Form 497K FIDELITY INCOME FUND
 Tweet
Tweet Share
ShareFidelity Managed Retirement Income Fund℠
Class/Ticker
Fidelity Advisor Managed Retirement Income Fund℠
A/FRAMX I/FRIMX
Summary Prospectus
September 29, 2022
Before you invest, you may want to review the fund's prospectus, which contains more information about the fund and its risks. You can find the fund's prospectus, reports to shareholders, and other information about the fund (including the fund's SAI) online at institutional.fidelity.com/fafunddocuments. You can also get this information at no cost by calling 1-866-997-1254 or by sending an e-mail request to [email protected]. The fund's prospectus and SAI dated September 29, 2022 are incorporated herein by reference.
245 Summer Street, Boston, MA 02210
Fund Summary
Fund/Class:
Fidelity Managed Retirement Income Fund℠/Fidelity Advisor Managed Retirement Income Fund℠ A, I
Investment Objective
The fund seeks high current income and, as a secondary objective, capital appreciation.
Fee Table
The following table describes the fees and expenses that may be incurred when you buy and hold shares of the fund. In addition to the fees and expenses described below, your broker may also require you to pay brokerage commissions on purchases and sales of certain share classes of the fund.
You may qualify for sales charge discounts if you and your family invest, or agree to invest in the future, at least $50,000 in the fund or certain other Fidelity® funds. More information about these and other discounts is available from your investment professional and in the "Fund Distribution" section beginning on page 47 of the prospectus. Different intermediaries may provide additional waivers or reductions of the sales charge. Please see “Sales Charge Waiver Policies Applied by Certain Intermediaries” in the “Appendix” section of the prospectus.
Shareholder fees
(fees paid directly from your investment)
| Class A | Class I | |
| Maximum sales charge (load) on purchases (as a % of offering price) | 5.75% | None |
| Maximum contingent deferred sales charge (as a % of the lesser of original purchase price or redemption proceeds) | None(a) | None |
(a) Class A purchases of $1 million or more will not be subject to a front-end sales charge. Such Class A purchases may be subject, upon redemption, to a contingent deferred sales charge (CDSC) of 1.00%.
Annual Operating Expenses
(expenses that you pay each year as a % of the value of your investment)
| Class A | Class I | |
| Management fee | 0.45% | 0.45% |
| Distribution and/or Service (12b-1) fees | 0.25% | None |
| Other expenses | 0.00% | 0.00% |
| Total annual operating expenses | 0.70% | 0.45% |
This example helps compare the cost of investing in the fund with the cost of investing in other funds.
Let's say, hypothetically, that the annual return for shares of the fund is 5% and that your shareholder fees and the annual operating expenses for shares of the fund are exactly as described in the fee table. This example illustrates the effect of fees and expenses, but is not meant to suggest actual or expected fees and expenses or returns, all of which may vary. For every $10,000 you invested, here's how much you would pay in total expenses if you sell all of your shares at the end of each time period indicated:
| Class A | Class I | |
| 1 year | $642 | $46 |
| 3 years | $786 | $144 |
| 5 years | $942 | $252 |
| 10 years | $1,395 | $567 |
Portfolio Turnover
The fund will not incur transaction costs, such as commissions, when it buys and sells shares of underlying Fidelity® funds (or "turns over" its portfolio), but it could incur transaction costs if it were to buy and sell other types of securities directly. If the fund were to buy and sell other types of securities directly, a higher portfolio turnover rate could indicate higher transaction costs and could result in higher taxes when fund shares are held in a taxable account. Such costs, if incurred, would not be reflected in annual operating expenses or in the example and would affect the fund's performance. During the most recent fiscal year, the fund's portfolio turnover rate was 64% of the average value of its portfolio.
Principal Investment Strategies
- Investing primarily in a combination of Fidelity® U.S. equity funds, international equity funds, bond funds, and short-term funds (underlying Fidelity® funds) in a manner that supports a withdrawal strategy to provide investors with income in retirement.
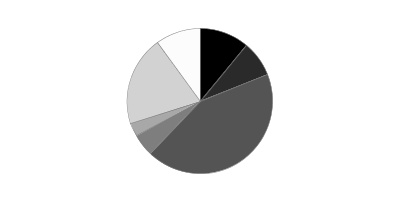
- Allocating assets according to a stable neutral asset allocation strategy (approximately 11% in U.S. equity funds, 8% in international equity funds, 43% in U.S. investment grade bond funds, 5% in international bond funds, 3% in long-term treasury bond funds, 0% in long-term inflation-protected bond funds, 20% in short-term inflation-protected bond funds, and 10% in short-term funds). Fidelity Management & Research Company LLC (the Adviser) may modify the fund’s neutral asset allocations from time to time when in the interests of shareholders.
- Buying and selling futures contracts (both long and short positions) in an effort to manage cash flows efficiently, remain fully invested, or facilitate asset allocation.
- Allocating assets among underlying Fidelity® funds and futures according to a stable neutral asset allocation of approximately:
| U.S. Equity Funds | 11% | |
| International Equity Funds | 8% | |
| U.S. Investment Grade Bond Funds | 43% | |
| International Bond Funds | 5% | |
| Long-Term Treasury Bond Funds | 3% | |
| Long-Term Inflation-Protected Bond Funds | 0% | |
| Short-Term Inflation-Protected Bond Funds | 20% | |
| Short-Term Funds | 10% |

* The Adviser may change these percentages over time. As a result of the active asset allocation strategy (discussed below), actual allocations may differ from the neutral allocations above. The allocation percentages may not add to 100% due to rounding.
- The Adviser, under normal market conditions, will use an active asset allocation strategy to increase or decrease asset class exposures relative to the neutral asset allocations reflected above by up to 10% for equity funds, bond funds and short-term funds to reflect the Adviser's market outlook, which is primarily focused on the intermediate term. The asset allocations in the pie chart above are referred to as neutral because they do not reflect any decisions made by the Adviser to overweight or underweight an asset class.
- The Adviser may also make active asset allocations within other asset classes (such as commodities, high yield debt (also referred to as junk bonds), floating rate debt, real estate debt, and emerging markets debt) from 0% to 10% of the fund’s total assets individually, but no more than 25% in aggregate within those other asset classes. Such asset classes are not reflected in the neutral asset allocations reflected in the pie chart above. Emerging markets include countries that have an emerging stock market as defined by MSCI, countries or markets with low- to middle-income economies as classified by the World Bank, and other countries or markets that the Adviser identifies as having similar emerging markets characteristics.
The fund's investment objective is intended to support a withdrawal strategy to provide investors with income in retirement. Please contact Fidelity or your investment professional for more information.
Principal Investment Risks
- Asset Allocation Risk. The fund is subject to risks resulting from the Adviser's asset allocation decisions. If the Adviser's asset allocation strategy does not work as intended, the fund may not achieve its objective. If the fund is unable to achieve its objective, the payment strategy may not work as intended. The selection of underlying funds and the allocation of the fund's assets among various asset classes could cause the fund to lose value or its results to lag relevant benchmarks or other funds with similar objectives. In addition, the fund's active asset allocation strategy may cause the fund to have a risk profile different than that portrayed above from time to time and may increase losses.
- Investing in Other Funds. The fund bears all risks of investment strategies employed by the underlying funds, including the risk that the underlying funds will not meet their investment objectives.
- Stock Market Volatility. Stock markets are volatile and can decline significantly in response to adverse issuer, political, regulatory, market, or economic developments. Different parts of the market, including different market sectors, and different types of securities can react differently to these developments.
- Interest Rate Changes. Interest rate increases can cause the price of a debt or money market security to decrease.
- Foreign Exposure. Foreign markets, particularly emerging markets, can be more volatile than the U.S. market due to increased risks of adverse issuer, political, regulatory, market, or economic developments and can perform differently from the U.S. market. The extent of economic development; political stability; market depth, infrastructure, and capitalization; and regulatory oversight can be less than in more developed markets. Emerging markets typically have less established legal, accounting and financial reporting systems than those in more developed markets, which may reduce the scope or quality of financial information available to investors. Emerging markets can be subject to greater social, economic, regulatory, and political uncertainties and can be extremely volatile. Foreign exchange rates also can be extremely volatile.
- Industry Exposure. Market conditions, interest rates, and economic, regulatory, or financial developments could significantly affect a single industry or group of related industries.
- Prepayment. The ability of an issuer of a debt security to repay principal prior to a security's maturity can cause greater price volatility if interest rates change.
- Issuer-Specific Changes. The value of an individual security or particular type of security can be more volatile than, and can perform differently from, the market as a whole. A decline in the credit quality of an issuer or a provider of credit support or a maturity-shortening structure for a security can cause the price of a security to decrease. Lower-quality debt securities (those of less than investment-grade quality, also referred to as high yield debt securities or junk bonds) and certain types of other securities involve greater risk of default or price changes due to changes in the credit quality of the issuer. The value of lower-quality debt securities and certain types of other securities can be more volatile due to increased sensitivity to adverse issuer, political, regulatory, market, or economic developments.
- Correlation to Index. The performance of an underlying index fund and its index may vary somewhat due to factors such as fees and expenses of the underlying fund, transaction costs, sample selection, regulatory restrictions, and timing differences associated with additions to and deletions from the index. Errors in the construction or calculation of the index may occur from time to time and may not be identified and corrected for some period of time, which may have an adverse impact on an underlying fund and its shareholders.
- Passive Management Risk. Some of the underlying funds in which the fund invests are managed with a passive investment strategy, attempting to track the performance of an unmanaged index of securities, regardless of the current or projected performance of an underlying fund's index or of the actual securities included in the index. This differs from an actively managed fund, which typically seeks to outperform a benchmark index. As a result, the performance of these underlying funds could be lower than actively managed funds that may shift their portfolio assets to take advantage of market opportunities or lessen the impact of a market decline or a decline in the value of one or more issuers. An underlying index fund may be concentrated to approximately the same extent that its index concentrates in the securities of issuers in a particular industry or group of industries.
- Leverage Risk. Leverage can increase market exposure, magnify investment risks, and cause losses to be realized more quickly.
- Inflation-Protected Debt Exposure. Increases in real interest rates can cause the price of inflation-protected debt securities to decrease. Interest payments on inflation-protected debt securities can be unpredictable.
- Commodity-Linked Investing. The value of commodities and commodity-linked investments may be affected by the performance of the overall commodities markets as well as weather, political, tax, and other regulatory and market developments. Commodity-linked investments may be more volatile and less liquid than the underlying commodity, instruments, or measures.
- Commodity Futures. Investments in commodity futures contracts are also subject to the risk of the failure of any of the exchanges on which an underlying fund's positions trade or of its clearinghouses or counterparties. In addition, certain commodity exchanges limit fluctuations in certain futures contract prices during a single day by regulations referred to as "daily price fluctuation limits" or "daily limits." Under such daily limits, during a single trading day no trades may be executed at prices beyond the daily limit. If triggered, these limits could prevent the underlying fund from liquidating unfavorable positions and subject the underlying fund to losses or prevent it from entering into desired trades during the particular trading day.
An investment in the fund is not a deposit of a bank and is not insured or guaranteed by the Federal Deposit Insurance Corporation or any other government agency. You could lose money by investing in the fund.
Performance
The following information is intended to help you understand the risks of investing in the fund. The information illustrates the changes in the performance of the fund's shares from year to year and compares the performance of the fund's shares to the performance of a securities market index and a hypothetical composite of market indexes over various periods of time. The indexes have characteristics relevant to the fund's investment strategies. Index descriptions appear in the "Additional Index Information" section of the prospectus. Prior to June 1, 2017, the fund operated under certain different investment policies and a different pricing structure. The fund's historical performance prior to June 1, 2017 may not represent its current investment policies and does not reflect the fund's current pricing structure. Past performance (before and after taxes) is not an indication of future performance.
Visit institutional.fidelity.com for more recent performance information.
Year-by-Year Returns
The returns in the bar chart do not reflect any applicable sales charges; if sales charges were reflected, returns would be lower than those shown.

| During the periods shown in the chart for Class A: | Returns | Quarter ended |
| Highest Quarter Return | 6.10% | March 31, 2012 |
| Lowest Quarter Return | (3.98)% | March 31, 2020 |
| Year-to-Date Return | (10.26)% | June 30, 2022 |
Average Annual Returns
Unlike the returns in the bar chart, the returns in the table reflect the maximum applicable sales charges. After-tax returns are calculated using the historical highest individual federal marginal income tax rates, but do not reflect the impact of state or local taxes. After-tax returns for Class A are shown in the table below and after-tax returns for other classes will vary. Actual after-tax returns may differ depending on your individual circumstances. The after-tax returns shown are not relevant if you hold your shares in a retirement account or in another tax-deferred arrangement, such as an employee benefit plan (profit sharing, 401(k), or 403(b) plan). Return After Taxes on Distributions and Sale of Fund Shares may be higher than other returns for the same period due to a tax benefit of realizing a capital loss upon the sale of fund shares.
| For the periods ended December 31, 2021 | Past 1 year | Past 5 years | Past 10 years |
| Class A - Return Before Taxes | (3.38)% | 3.84% | 4.84% |
| Return After Taxes on Distributions | (4.44)% | 2.57% | 3.91% |
| Return After Taxes on Distributions and Sale of Fund Shares | (1.79)% | 2.60% | 3.52% |
| Class I - Return Before Taxes | 2.78% | 5.34% | 5.73% |
| Bloomberg U.S. Aggregate Bond Index (reflects no deduction for fees, expenses, or taxes) |
(1.54)% | 3.57% | 2.90% |
| Fidelity Managed Retirement Income Composite Index℠ (reflects no deduction for fees or expenses) |
3.09% | 5.64% | 5.79% |
Investment Adviser
Fidelity Management & Research Company LLC (FMR) (the Adviser) is the fund's manager.
Portfolio Manager(s)
Andrew Dierdorf (co-manager) has managed the fund since June 2009.
Brett Sumsion (co-manager) has managed the fund since January 2014.
Purchase and Sale of Shares
You may buy or sell shares through a retirement account or through an investment professional. You may buy or sell shares in various ways:
Internet
institutional.fidelity.com
Phone
To reach a Fidelity representative 1-877-208-0098
| Fidelity Investments P.O. Box 770002 Cincinnati, OH 45277-0081 |
Overnight Express: Fidelity Investments 100 Crosby Parkway Covington, KY 41015 |
Shares of the fund are not eligible for purchase by registered investment companies or business development companies to the extent such acquisition is in reliance on Rule 12d1-4 under the Investment Company Act of 1940.
Class I eligibility requirements are listed in the "Additional Information about the Purchase and Sale of Shares" section of the prospectus.
The price to buy one share of Class A is its offering price, if you pay a front-end sales charge, or its net asset value per share (NAV), if you qualify for a front-end sales charge waiver. The price to buy one share of Class I is its NAV. Shares will be bought at the offering price or NAV, as applicable, next calculated after an order is received in proper form.
The price to sell one share of Class A is its NAV, minus any applicable contingent deferred sales charge (CDSC). The price to sell one share of Class I is its NAV. Shares will be sold at the NAV next calculated after an order is received in proper form, minus any applicable CDSC.
The fund is open for business each day the New York Stock Exchange (NYSE) is open.
There is no purchase minimum for fund shares.
Tax Information
Distributions you receive from the fund are subject to federal income tax and generally will be taxed as ordinary income or capital gains, and may also be subject to state or local taxes, unless you are investing through a tax-advantaged retirement account (in which case you may be taxed later, upon withdrawal of your investment from such account).
Payments to Broker-Dealers and Other Financial Intermediaries
The fund, the Adviser, Fidelity Distributors Company LLC (FDC), and/or their affiliates may pay intermediaries, which may include banks, broker-dealers, retirement plan sponsors, administrators, or service-providers (who may be affiliated with the Adviser or FDC), for the sale of fund shares and related services. These payments may create a conflict of interest by influencing your intermediary and your investment professional to recommend the fund over another investment. Ask your investment professional or visit your intermediary's web site for more information.
Current regulations allow Fidelity to send a single copy of shareholder documents for Fidelity® funds, such as prospectuses, annual and semi-annual reports, and proxy materials, to certain mutual fund customers whom we believe are members of the same family who share the same address. For certain types of accounts, we will not send multiple copies of these documents to you and members of your family who share the same address. Instead, we will send only a single copy of these documents. This will continue for as long as you are a shareholder, unless you notify us otherwise. If at any time you choose to receive individual copies of any documents, please call 1-877-208-0098. We will begin sending individual copies to you within 30 days of receiving your call.
Fidelity Distributors Company LLC (FDC) is a member of the Securities Investor Protection Corporation (SIPC). You may obtain information about SIPC, including the SIPC brochure, by visiting www.sipc.org or calling SIPC at 202-371-8300.
Fidelity Investments & Pyramid Design and Fidelity are registered service marks of FMR LLC. © 2022 FMR LLC. All rights reserved.
Fidelity Managed Retirement Income Fund, Fidelity Advisor Managed Retirement Income Fund, and Fidelity Managed Retirement Income Composite Index are service marks of FMR LLC.
Any third-party marks that may appear above are the marks of their respective owners.
| 1.9884166.109 | AR87-SUM-0922 |
Fidelity Managed Retirement Income Fund℠
Class/Ticker
Fidelity Advisor Managed Retirement Income Fund℠
Z6/FRYMX
Summary Prospectus
September 29, 2022
Before you invest, you may want to review the fund's prospectus, which contains more information about the fund and its risks. You can find the fund's prospectus, reports to shareholders, and other information about the fund (including the fund's SAI) online at institutional.fidelity.com/fafunddocuments. You can also get this information at no cost by calling 1-866-997-1254 or by sending an e-mail request to [email protected]. The fund's prospectus and SAI dated September 29, 2022 are incorporated herein by reference.
245 Summer Street, Boston, MA 02210
Fund Summary
Fund/Class:
Fidelity Managed Retirement Income Fund℠/Fidelity Advisor Managed Retirement Income Fund℠ Z6
Investment Objective
The fund seeks high current income and, as a secondary objective, capital appreciation.
Fee Table
The following table describes the fees and expenses that may be incurred when you buy and hold shares of the fund. In addition to the fees and expenses described below, your broker may also require you to pay brokerage commissions on purchases and sales of certain share classes of the fund.
Shareholder fees
| (fees paid directly from your investment) | None |
Annual Operating Expenses
(expenses that you pay each year as a % of the value of your investment)
| Management fee | 0.25% | |
| Distribution and/or Service (12b-1) fees | None | |
| Other expenses | 0.00% | |
| Total annual operating expenses | 0.25% |
This example helps compare the cost of investing in the fund with the cost of investing in other funds.
Let's say, hypothetically, that the annual return for shares of the fund is 5% and that your shareholder fees and the annual operating expenses for shares of the fund are exactly as described in the fee table. This example illustrates the effect of fees and expenses, but is not meant to suggest actual or expected fees and expenses or returns, all of which may vary. For every $10,000 you invested, here's how much you would pay in total expenses if you sell all of your shares at the end of each time period indicated:
| 1 year | $26 |
| 3 years | $80 |
| 5 years | $141 |
| 10 years | $318 |
Portfolio Turnover
The fund will not incur transaction costs, such as commissions, when it buys and sells shares of underlying Fidelity® funds (or "turns over" its portfolio), but it could incur transaction costs if it were to buy and sell other types of securities directly. If the fund were to buy and sell other types of securities directly, a higher portfolio turnover rate could indicate higher transaction costs and could result in higher taxes when fund shares are held in a taxable account. Such costs, if incurred, would not be reflected in annual operating expenses or in the example and would affect the fund's performance. During the most recent fiscal year, the fund's portfolio turnover rate was 64% of the average value of its portfolio.
Principal Investment Strategies
- Investing primarily in a combination of Fidelity® U.S. equity funds, international equity funds, bond funds, and short-term funds (underlying Fidelity® funds) in a manner that supports a withdrawal strategy to provide investors with income in retirement.
- Allocating assets according to a stable neutral asset allocation strategy (approximately 11% in U.S. equity funds, 8% in international equity funds, 43% in U.S. investment grade bond funds, 5% in international bond funds, 3% in long-term treasury bond funds, 0% in long-term inflation-protected bond funds, 20% in short-term inflation-protected bond funds, and 10% in short-term funds). Fidelity Management & Research Company LLC (the Adviser) may modify the fund’s neutral asset allocations from time to time when in the interests of shareholders.
- Buying and selling futures contracts (both long and short positions) in an effort to manage cash flows efficiently, remain fully invested, or facilitate asset allocation.
- Allocating assets among underlying Fidelity® funds and futures according to a stable neutral asset allocation of approximately:
| U.S. Equity Funds | 11% | |
| International Equity Funds | 8% | |
| U.S. Investment Grade Bond Funds | 43% | |
| International Bond Funds | 5% | |
| Long-Term Treasury Bond Funds | 3% | |
| Long-Term Inflation-Protected Bond Funds | 0% | |
| Short-Term Inflation-Protected Bond Funds | 20% | |
| Short-Term Funds | 10% |
* The Adviser may change these percentages over time. As a result of the active asset allocation strategy (discussed below), actual allocations may differ from the neutral allocations above. The allocation percentages may not add to 100% due to rounding.
- The Adviser, under normal market conditions, will use an active asset allocation strategy to increase or decrease asset class exposures relative to the neutral asset allocations reflected above by up to 10% for equity funds, bond funds and short-term funds to reflect the Adviser's market outlook, which is primarily focused on the intermediate term. The asset allocations in the pie chart above are referred to as neutral because they do not reflect any decisions made by the Adviser to overweight or underweight an asset class.
- The Adviser may also make active asset allocations within other asset classes (such as commodities, high yield debt (also referred to as junk bonds), floating rate debt, real estate debt, and emerging markets debt) from 0% to 10% of the fund’s total assets individually, but no more than 25% in aggregate within those other asset classes. Such asset classes are not reflected in the neutral asset allocations reflected in the pie chart above. Emerging markets include countries that have an emerging stock market as defined by MSCI, countries or markets with low- to middle-income economies as classified by the World Bank, and other countries or markets that the Adviser identifies as having similar emerging markets characteristics.
The fund's investment objective is intended to support a withdrawal strategy to provide investors with income in retirement. Please contact Fidelity or your investment professional for more information.
Principal Investment Risks
- Asset Allocation Risk. The fund is subject to risks resulting from the Adviser's asset allocation decisions. If the Adviser's asset allocation strategy does not work as intended, the fund may not achieve its objective. If the fund is unable to achieve its objective, the payment strategy may not work as intended. The selection of underlying funds and the allocation of the fund's assets among various asset classes could cause the fund to lose value or its results to lag relevant benchmarks or other funds with similar objectives. In addition, the fund's active asset allocation strategy may cause the fund to have a risk profile different than that portrayed above from time to time and may increase losses.
- Investing in Other Funds. The fund bears all risks of investment strategies employed by the underlying funds, including the risk that the underlying funds will not meet their investment objectives.
- Stock Market Volatility. Stock markets are volatile and can decline significantly in response to adverse issuer, political, regulatory, market, or economic developments. Different parts of the market, including different market sectors, and different types of securities can react differently to these developments.
- Interest Rate Changes. Interest rate increases can cause the price of a debt or money market security to decrease.
- Foreign Exposure. Foreign markets, particularly emerging markets, can be more volatile than the U.S. market due to increased risks of adverse issuer, political, regulatory, market, or economic developments and can perform differently from the U.S. market. The extent of economic development; political stability; market depth, infrastructure, and capitalization; and regulatory oversight can be less than in more developed markets. Emerging markets typically have less established legal, accounting and financial reporting systems than those in more developed markets, which may reduce the scope or quality of financial information available to investors. Emerging markets can be subject to greater social, economic, regulatory, and political uncertainties and can be extremely volatile. Foreign exchange rates also can be extremely volatile.
- Industry Exposure. Market conditions, interest rates, and economic, regulatory, or financial developments could significantly affect a single industry or group of related industries.
- Prepayment. The ability of an issuer of a debt security to repay principal prior to a security's maturity can cause greater price volatility if interest rates change.
- Issuer-Specific Changes. The value of an individual security or particular type of security can be more volatile than, and can perform differently from, the market as a whole. A decline in the credit quality of an issuer or a provider of credit support or a maturity-shortening structure for a security can cause the price of a security to decrease. Lower-quality debt securities (those of less than investment-grade quality, also referred to as high yield debt securities or junk bonds) and certain types of other securities involve greater risk of default or price changes due to changes in the credit quality of the issuer. The value of lower-quality debt securities and certain types of other securities can be more volatile due to increased sensitivity to adverse issuer, political, regulatory, market, or economic developments.
- Correlation to Index. The performance of an underlying index fund and its index may vary somewhat due to factors such as fees and expenses of the underlying fund, transaction costs, sample selection, regulatory restrictions, and timing differences associated with additions to and deletions from the index. Errors in the construction or calculation of the index may occur from time to time and may not be identified and corrected for some period of time, which may have an adverse impact on an underlying fund and its shareholders.
- Passive Management Risk. Some of the underlying funds in which the fund invests are managed with a passive investment strategy, attempting to track the performance of an unmanaged index of securities, regardless of the current or projected performance of an underlying fund's index or of the actual securities included in the index. This differs from an actively managed fund, which typically seeks to outperform a benchmark index. As a result, the performance of these underlying funds could be lower than actively managed funds that may shift their portfolio assets to take advantage of market opportunities or lessen the impact of a market decline or a decline in the value of one or more issuers. An underlying index fund may be concentrated to approximately the same extent that its index concentrates in the securities of issuers in a particular industry or group of industries.
- Leverage Risk. Leverage can increase market exposure, magnify investment risks, and cause losses to be realized more quickly.
- Inflation-Protected Debt Exposure. Increases in real interest rates can cause the price of inflation-protected debt securities to decrease. Interest payments on inflation-protected debt securities can be unpredictable.
- Commodity-Linked Investing. The value of commodities and commodity-linked investments may be affected by the performance of the overall commodities markets as well as weather, political, tax, and other regulatory and market developments. Commodity-linked investments may be more volatile and less liquid than the underlying commodity, instruments, or measures.
- Commodity Futures. Investments in commodity futures contracts are also subject to the risk of the failure of any of the exchanges on which an underlying fund's positions trade or of its clearinghouses or counterparties. In addition, certain commodity exchanges limit fluctuations in certain futures contract prices during a single day by regulations referred to as "daily price fluctuation limits" or "daily limits." Under such daily limits, during a single trading day no trades may be executed at prices beyond the daily limit. If triggered, these limits could prevent the underlying fund from liquidating unfavorable positions and subject the underlying fund to losses or prevent it from entering into desired trades during the particular trading day.
An investment in the fund is not a deposit of a bank and is not insured or guaranteed by the Federal Deposit Insurance Corporation or any other government agency. You could lose money by investing in the fund.
Performance
The following information is intended to help you understand the risks of investing in the fund. The information illustrates the changes in the performance of the fund's shares from year to year and compares the performance of the fund's shares to the performance of a securities market index and a hypothetical composite of market indexes over various periods of time. The indexes have characteristics relevant to the fund's investment strategies. Index descriptions appear in the "Additional Index Information" section of the prospectus. Past performance is not an indication of future performance.
Visit institutional.fidelity.com for more recent performance information.
Year-by-Year Returns

| During the periods shown in the chart: | Returns | Quarter ended |
| Highest Quarter Return | 5.76% | June 30, 2020 |
| Lowest Quarter Return | (3.88)% | March 31, 2020 |
| Year-to-Date Return | (10.06)% | June 30, 2022 |
Average Annual Returns
| For the periods ended December 31, 2021 | Past 1 year | Life of class(a) |
| Class Z6 | 2.98% | 6.17% |
| Bloomberg U.S. Aggregate Bond Index (reflects no deduction for fees, expenses, or taxes) |
(1.54)% | 3.04% |
| Fidelity Managed Retirement Income Composite Index℠ (reflects no deduction for fees or expenses) |
3.09% | 6.02% |
(a) From August 1, 2019
Investment Adviser
Fidelity Management & Research Company LLC (FMR) (the Adviser) is the fund's manager.
Portfolio Manager(s)
Andrew Dierdorf (co-manager) has managed the fund since June 2009.
Brett Sumsion (co-manager) has managed the fund since January 2014.
Purchase and Sale of Shares
Shares of the fund are not eligible for purchase by registered investment companies or business development companies to the extent such acquisition is in reliance on Rule 12d1-4 under the Investment Company Act of 1940.
Shares generally are available only to certain employer-sponsored retirement plans. For this purpose, employer-sponsored retirement plans generally include profit sharing, 401(k), 403(b), 457(b), defined benefit, retiree health savings plans, and similar plans, but generally do not include: retail retirement or non-retirement accounts; Individual Retirement Accounts (IRAs) (such as traditional, Roth, SEP, SARSEP, and SIMPLE IRAs); Coverdell Education Savings Accounts; individual 403(b) accounts that are not part of an employer’s 403(b) plan; plans investing through the Fidelity Advisor® 403(b) program; plans covering self-employed individuals and their employees (formerly Keogh/H.R. 10 plans); health savings accounts; or qualified tuition programs.
Plan participants may purchase Class Z6 shares of the fund only if Class Z6 shares are eligible for sale and available through their plan. You may buy or sell shares by contacting your employer-sponsored retirement plan.
The price to buy one share is its net asset value per share (NAV). Shares will be bought at the NAV next calculated after an order is received in proper form.
The price to sell one share is its NAV. Shares will be sold at the NAV next calculated after an order is received in proper form.
The fund is open for business each day the New York Stock Exchange (NYSE) is open.
There is no purchase minimum for fund shares.
Tax Information
Distributions by the fund to tax-advantaged retirement plan accounts are not taxable currently (but you may be taxed later, upon withdrawal of your investment from such account).
Payments to Broker-Dealers and Other Financial Intermediaries
The fund, the Adviser, Fidelity Distributors Company LLC (FDC), and/or their affiliates may pay intermediaries, which may include banks, broker-dealers, retirement plan sponsors, administrators, or service-providers (who may be affiliated with the Adviser or FDC), for the sale of fund shares and related services. These payments may create a conflict of interest by influencing your intermediary and your investment professional to recommend the fund over another investment. Currently, the Board of Trustees of the fund has not authorized such payments for Class Z6 shares of the fund. Ask your investment professional or visit your intermediary's web site for more information.
Fidelity Distributors Company LLC (FDC) is a member of the Securities Investor Protection Corporation (SIPC). You may obtain information about SIPC, including the SIPC brochure, by visiting www.sipc.org or calling SIPC at 202-371-8300.
Fidelity Investments & Pyramid Design, Fidelity, and Fidelity Advisor are registered service marks of FMR LLC. © 2022 FMR LLC. All rights reserved.
Fidelity Managed Retirement Income Fund, Fidelity Advisor Managed Retirement Income Fund, and Fidelity Managed Retirement Income Composite Index are service marks of FMR LLC.
Any third-party marks that may appear above are the marks of their respective owners.
| 1.9895912.105 | R87-Z6-SUM-0922 |
Fidelity Managed Retirement Income Fund℠
Class/Ticker
K/FRKMX
Summary Prospectus
September 29, 2022
Before you invest, you may want to review the fund's prospectus, which contains more information about the fund and its risks. You can find the fund's prospectus, reports to shareholders, and other information about the fund (including the fund's SAI) online at www.fidelity.com/workplacedocuments. You can also get this information at no cost by calling 1-800-835-5095 or by sending an e-mail request to [email protected]. The fund's prospectus and SAI dated September 29, 2022 are incorporated herein by reference.
245 Summer Street, Boston, MA 02210
Fund Summary
Fund/Class:
Fidelity Managed Retirement Income Fund℠/K
Investment Objective
The fund seeks high current income and, as a secondary objective, capital appreciation.
Fee Table
The following table describes the fees and expenses that may be incurred when you buy and hold shares of the fund. In addition to the fees and expenses described below, your broker may also require you to pay brokerage commissions on purchases and sales of certain share classes of the fund.
Shareholder fees
| (fees paid directly from your investment) | None |
Annual Operating Expenses
(expenses that you pay each year as a % of the value of your investment)
| Management fee | 0.35% | |
| Distribution and/or Service (12b-1) fees | None | |
| Other expenses | 0.00% | |
| Total annual operating expenses | 0.35% |
This example helps compare the cost of investing in the fund with the cost of investing in other funds.
Let's say, hypothetically, that the annual return for shares of the fund is 5% and that your shareholder fees and the annual operating expenses for shares of the fund are exactly as described in the fee table. This example illustrates the effect of fees and expenses, but is not meant to suggest actual or expected fees and expenses or returns, all of which may vary. For every $10,000 you invested, here's how much you would pay in total expenses if you sell all of your shares at the end of each time period indicated:
| 1 year | $36 |
| 3 years | $113 |
| 5 years | $197 |
| 10 years | $443 |
Portfolio Turnover
The fund will not incur transaction costs, such as commissions, when it buys and sells shares of underlying Fidelity® funds (or "turns over" its portfolio), but it could incur transaction costs if it were to buy and sell other types of securities directly. If the fund were to buy and sell other types of securities directly, a higher portfolio turnover rate could indicate higher transaction costs and could result in higher taxes when fund shares are held in a taxable account. Such costs, if incurred, would not be reflected in annual operating expenses or in the example and would affect the fund's performance. During the most recent fiscal year, the fund's portfolio turnover rate was 64% of the average value of its portfolio.
Principal Investment Strategies
- Investing primarily in a combination of Fidelity® U.S. equity funds, international equity funds, bond funds, and short-term funds (underlying Fidelity® funds) in a manner that supports a withdrawal strategy to provide investors with income in retirement.
- Allocating assets according to a stable neutral asset allocation strategy (approximately 11% in U.S. equity funds, 8% in international equity funds, 43% in U.S. investment grade bond funds, 5% in international bond funds, 3% in long-term treasury bond funds, 0% in long-term inflation-protected bond funds, 20% in short-term inflation-protected bond funds, and 10% in short-term funds). Fidelity Management & Research Company LLC (the Adviser) may modify the fund’s neutral asset allocations from time to time when in the interests of shareholders.
- Buying and selling futures contracts (both long and short positions) in an effort to manage cash flows efficiently, remain fully invested, or facilitate asset allocation.
- Allocating assets among underlying Fidelity® funds and futures according to a stable neutral asset allocation of approximately:
| U.S. Equity Funds | 11% | |
| International Equity Funds | 8% | |
| U.S. Investment Grade Bond Funds | 43% | |
| International Bond Funds | 5% | |
| Long-Term Treasury Bond Funds | 3% | |
| Long-Term Inflation-Protected Bond Funds | 0% | |
| Short-Term Inflation-Protected Bond Funds | 20% | |
| Short-Term Funds | 10% |

* The Adviser may change these percentages over time. As a result of the active asset allocation strategy (discussed below), actual allocations may differ from the neutral allocations above. The allocation percentages may not add to 100% due to rounding.
- The Adviser, under normal market conditions, will use an active asset allocation strategy to increase or decrease asset class exposures relative to the neutral asset allocations reflected above by up to 10% for equity funds, bond funds and short-term funds to reflect the Adviser's market outlook, which is primarily focused on the intermediate term. The asset allocations in the pie chart above are referred to as neutral because they do not reflect any decisions made by the Adviser to overweight or underweight an asset class.
- The Adviser may also make active asset allocations within other asset classes (such as commodities, high yield debt (also referred to as junk bonds), floating rate debt, real estate debt, and emerging markets debt) from 0% to 10% of the fund’s total assets individually, but no more than 25% in aggregate within those other asset classes. Such asset classes are not reflected in the neutral asset allocations reflected in the pie chart above. Emerging markets include countries that have an emerging stock market as defined by MSCI, countries or markets with low- to middle-income economies as classified by the World Bank, and other countries or markets that the Adviser identifies as having similar emerging markets characteristics.
The fund's investment objective is intended to support a withdrawal strategy to provide investors with income in retirement. Please contact Fidelity or your investment professional for more information.
Principal Investment Risks
- Asset Allocation Risk. The fund is subject to risks resulting from the Adviser's asset allocation decisions. If the Adviser's asset allocation strategy does not work as intended, the fund may not achieve its objective. If the fund is unable to achieve its objective, the payment strategy may not work as intended. The selection of underlying funds and the allocation of the fund's assets among various asset classes could cause the fund to lose value or its results to lag relevant benchmarks or other funds with similar objectives. In addition, the fund's active asset allocation strategy may cause the fund to have a risk profile different than that portrayed above from time to time and may increase losses.
- Investing in Other Funds. The fund bears all risks of investment strategies employed by the underlying funds, including the risk that the underlying funds will not meet their investment objectives.
- Stock Market Volatility. Stock markets are volatile and can decline significantly in response to adverse issuer, political, regulatory, market, or economic developments. Different parts of the market, including different market sectors, and different types of securities can react differently to these developments.
- Interest Rate Changes. Interest rate increases can cause the price of a debt or money market security to decrease.
- Foreign Exposure. Foreign markets, particularly emerging markets, can be more volatile than the U.S. market due to increased risks of adverse issuer, political, regulatory, market, or economic developments and can perform differently from the U.S. market. The extent of economic development; political stability; market depth, infrastructure, and capitalization; and regulatory oversight can be less than in more developed markets. Emerging markets typically have less established legal, accounting and financial reporting systems than those in more developed markets, which may reduce the scope or quality of financial information available to investors. Emerging markets can be subject to greater social, economic, regulatory, and political uncertainties and can be extremely volatile. Foreign exchange rates also can be extremely volatile.
- Industry Exposure. Market conditions, interest rates, and economic, regulatory, or financial developments could significantly affect a single industry or group of related industries.
- Prepayment. The ability of an issuer of a debt security to repay principal prior to a security's maturity can cause greater price volatility if interest rates change.
- Issuer-Specific Changes. The value of an individual security or particular type of security can be more volatile than, and can perform differently from, the market as a whole. A decline in the credit quality of an issuer or a provider of credit support or a maturity-shortening structure for a security can cause the price of a security to decrease. Lower-quality debt securities (those of less than investment-grade quality, also referred to as high yield debt securities or junk bonds) and certain types of other securities involve greater risk of default or price changes due to changes in the credit quality of the issuer. The value of lower-quality debt securities and certain types of other securities can be more volatile due to increased sensitivity to adverse issuer, political, regulatory, market, or economic developments.
- Correlation to Index. The performance of an underlying index fund and its index may vary somewhat due to factors such as fees and expenses of the underlying fund, transaction costs, sample selection, regulatory restrictions, and timing differences associated with additions to and deletions from the index. Errors in the construction or calculation of the index may occur from time to time and may not be identified and corrected for some period of time, which may have an adverse impact on an underlying fund and its shareholders.
- Passive Management Risk. Some of the underlying funds in which the fund invests are managed with a passive investment strategy, attempting to track the performance of an unmanaged index of securities, regardless of the current or projected performance of an underlying fund's index or of the actual securities included in the index. This differs from an actively managed fund, which typically seeks to outperform a benchmark index. As a result, the performance of these underlying funds could be lower than actively managed funds that may shift their portfolio assets to take advantage of market opportunities or lessen the impact of a market decline or a decline in the value of one or more issuers. An underlying index fund may be concentrated to approximately the same extent that its index concentrates in the securities of issuers in a particular industry or group of industries.
- Leverage Risk. Leverage can increase market exposure, magnify investment risks, and cause losses to be realized more quickly.
- Inflation-Protected Debt Exposure. Increases in real interest rates can cause the price of inflation-protected debt securities to decrease. Interest payments on inflation-protected debt securities can be unpredictable.
- Commodity-Linked Investing. The value of commodities and commodity-linked investments may be affected by the performance of the overall commodities markets as well as weather, political, tax, and other regulatory and market developments. Commodity-linked investments may be more volatile and less liquid than the underlying commodity, instruments, or measures.
- Commodity Futures. Investments in commodity futures contracts are also subject to the risk of the failure of any of the exchanges on which an underlying fund's positions trade or of its clearinghouses or counterparties. In addition, certain commodity exchanges limit fluctuations in certain futures contract prices during a single day by regulations referred to as "daily price fluctuation limits" or "daily limits." Under such daily limits, during a single trading day no trades may be executed at prices beyond the daily limit. If triggered, these limits could prevent the underlying fund from liquidating unfavorable positions and subject the underlying fund to losses or prevent it from entering into desired trades during the particular trading day.
An investment in the fund is not a deposit of a bank and is not insured or guaranteed by the Federal Deposit Insurance Corporation or any other government agency. You could lose money by investing in the fund.
Performance
The following information is intended to help you understand the risks of investing in the fund. The information illustrates the changes in the performance of the fund's shares from year to year and compares the performance of the fund's shares to the performance of a securities market index and a hypothetical composite of market indexes over various periods of time. The indexes have characteristics relevant to the fund's investment strategies. Index descriptions appear in the "Additional Index Information" section of the prospectus. Past performance is not an indication of future performance.
Visit www.401k.com and log in for more recent performance information.
Year-by-Year Returns

| During the periods shown in the chart: | Returns | Quarter ended |
| Highest Quarter Return | 5.73% | June 30, 2020 |
| Lowest Quarter Return | (3.91)% | March 31, 2020 |
| Year-to-Date Return | (10.11)% | June 30, 2022 |
Average Annual Returns
| For the periods ended December 31, 2021 | Past 1 year | Life of class(a) |
| Class K | 2.87% | 6.07% |
| Bloomberg U.S. Aggregate Bond Index (reflects no deduction for fees, expenses, or taxes) |
(1.54)% | 3.04% |
| Fidelity Managed Retirement Income Composite Index℠ (reflects no deduction for fees or expenses) |
3.09% | 6.02% |
(a) From August 1, 2019
Investment Adviser
Fidelity Management & Research Company LLC (FMR) (the Adviser) is the fund's manager.
Portfolio Manager(s)
Andrew Dierdorf (co-manager) has managed the fund since June 2009.
Brett Sumsion (co-manager) has managed the fund since January 2014.
Purchase and Sale of Shares
Shares generally are available only to certain employer-sponsored retirement plans and certain Fidelity health savings accounts that are made available through employers. For this purpose, employer-sponsored retirement plans generally include profit sharing, 401(k), 403(b), 457(b), defined benefit, retiree health savings plans, and similar plans, but generally do not include: retail retirement or non-retirement accounts; Individual Retirement Accounts (IRAs) (such as traditional, Roth, SEP, SARSEP, and SIMPLE IRAs); Coverdell Education Savings Accounts; individual 403(b) accounts that are not part of an employer’s 403(b) plan; plans investing through the Fidelity Advisor® 403(b) program; plans covering self-employed individuals and their employees (formerly Keogh/H.R. 10 plans); health savings accounts; or qualified tuition programs. Plan participants may purchase shares only if shares are eligible for sale and available through their plan. You may buy or sell shares in various ways:
Internet
www.401k.com
Phone
For Individual Accounts (investing through a retirement plan sponsor or other institution), refer to your plan materials or contact that institution directly.
For Retirement Plan Level Accounts:
Corporate Clients 1-800-962-1375
"Not for Profit" Clients 1-800-343-0860
|
Redemptions: Fidelity Investments |
Overnight Express: Fidelity Investments |
TDD- Service for the Deaf and Hearing Impaired
1-800-544-0118
Shares of the fund are not eligible for purchase by registered investment companies or business development companies to the extent such acquisition is in reliance on Rule 12d1-4 under the Investment Company Act of 1940.
The price to buy one share is its net asset value per share (NAV). Shares will be bought at the NAV next calculated after an order is received in proper form.
The price to sell one share is its NAV. Shares will be sold at the NAV next calculated after an order is received in proper form.
The fund is open for business each day the New York Stock Exchange (NYSE) is open.
There is no purchase minimum for fund shares.
Tax Information
Distributions by the fund to tax-advantaged retirement plan accounts are not taxable currently (but you may be taxed later, upon withdrawal of your investment from such account).
Payments to Broker-Dealers and Other Financial Intermediaries
The fund, the Adviser, Fidelity Distributors Company LLC (FDC), and/or their affiliates may pay intermediaries, which may include banks, broker-dealers, retirement plan sponsors, administrators, or service-providers (who may be affiliated with the Adviser or FDC), for the sale of fund shares and related services. These payments may create a conflict of interest by influencing your intermediary and your investment professional to recommend the fund over another investment. Ask your investment professional or visit your intermediary's web site for more information.
Fidelity Distributors Company LLC (FDC) is a member of the Securities Investor Protection Corporation (SIPC). You may obtain information about SIPC, including the SIPC brochure, by visiting www.sipc.org or calling SIPC at 202-371-8300.
Fidelity Investments & Pyramid Design and Fidelity are registered service marks of FMR LLC. © 2022 FMR LLC. All rights reserved.
Fidelity Managed Retirement Income Fund and Fidelity Managed Retirement Income Composite Index are service marks of FMR LLC.
Any third-party marks that may appear above are the marks of their respective owners.
| 1.9893689.105 | R87-K-SUM-0922 |
Fidelity Managed Retirement Income Fund℠
Class/Ticker
K6/FRHMX
Summary Prospectus
September 29, 2022
Before you invest, you may want to review the fund's prospectus, which contains more information about the fund and its risks. You can find the fund's prospectus, reports to shareholders, and other information about the fund (including the fund's SAI) online at www.fidelity.com/workplacedocuments. You can also get this information at no cost by calling 1-800-835-5095 or by sending an e-mail request to [email protected]. The fund's prospectus and SAI dated September 29, 2022 are incorporated herein by reference.
245 Summer Street, Boston, MA 02210
Fund Summary
Fund/Class:
Fidelity Managed Retirement Income Fund℠/K6
Investment Objective
The fund seeks high current income and, as a secondary objective, capital appreciation.
Fee Table
The following table describes the fees and expenses that may be incurred when you buy and hold shares of the fund. In addition to the fees and expenses described below, your broker may also require you to pay brokerage commissions on purchases and sales of certain share classes of the fund.
Shareholder fees
| (fees paid directly from your investment) | None |
Annual Operating Expenses
(expenses that you pay each year as a % of the value of your investment)
| Management fee | 0.25% | |
| Distribution and/or Service (12b-1) fees | None | |
| Other expenses | 0.00% | |
| Total annual operating expenses | 0.25% |
This example helps compare the cost of investing in the fund with the cost of investing in other funds.
Let's say, hypothetically, that the annual return for shares of the fund is 5% and that your shareholder fees and the annual operating expenses for shares of the fund are exactly as described in the fee table. This example illustrates the effect of fees and expenses, but is not meant to suggest actual or expected fees and expenses or returns, all of which may vary. For every $10,000 you invested, here's how much you would pay in total expenses if you sell all of your shares at the end of each time period indicated:
| 1 year | $26 |
| 3 years | $80 |
| 5 years | $141 |
| 10 years | $318 |
Portfolio Turnover
The fund will not incur transaction costs, such as commissions, when it buys and sells shares of underlying Fidelity® funds (or "turns over" its portfolio), but it could incur transaction costs if it were to buy and sell other types of securities directly. If the fund were to buy and sell other types of securities directly, a higher portfolio turnover rate could indicate higher transaction costs and could result in higher taxes when fund shares are held in a taxable account. Such costs, if incurred, would not be reflected in annual operating expenses or in the example and would affect the fund's performance. During the most recent fiscal year, the fund's portfolio turnover rate was 64% of the average value of its portfolio.
Principal Investment Strategies
- Investing primarily in a combination of Fidelity® U.S. equity funds, international equity funds, bond funds, and short-term funds (underlying Fidelity® funds) in a manner that supports a withdrawal strategy to provide investors with income in retirement.
- Allocating assets according to a stable neutral asset allocation strategy (approximately 11% in U.S. equity funds, 8% in international equity funds, 43% in U.S. investment grade bond funds, 5% in international bond funds, 3% in long-term treasury bond funds, 0% in long-term inflation-protected bond funds, 20% in short-term inflation-protected bond funds, and 10% in short-term funds). Fidelity Management & Research Company LLC (the Adviser) may modify the fund’s neutral asset allocations from time to time when in the interests of shareholders.
- Buying and selling futures contracts (both long and short positions) in an effort to manage cash flows efficiently, remain fully invested, or facilitate asset allocation.
- Allocating assets among underlying Fidelity® funds and futures according to a stable neutral asset allocation of approximately:
| U.S. Equity Funds | 11% | |
| International Equity Funds | 8% | |
| U.S. Investment Grade Bond Funds | 43% | |
| International Bond Funds | 5% | |
| Long-Term Treasury Bond Funds | 3% | |
| Long-Term Inflation-Protected Bond Funds | 0% | |
| Short-Term Inflation-Protected Bond Funds | 20% | |
| Short-Term Funds | 10% |

* The Adviser may change these percentages over time. As a result of the active asset allocation strategy (discussed below), actual allocations may differ from the neutral allocations above. The allocation percentages may not add to 100% due to rounding.
- The Adviser, under normal market conditions, will use an active asset allocation strategy to increase or decrease asset class exposures relative to the neutral asset allocations reflected above by up to 10% for equity funds, bond funds and short-term funds to reflect the Adviser's market outlook, which is primarily focused on the intermediate term. The asset allocations in the pie chart above are referred to as neutral because they do not reflect any decisions made by the Adviser to overweight or underweight an asset class.
- The Adviser may also make active asset allocations within other asset classes (such as commodities, high yield debt (also referred to as junk bonds), floating rate debt, real estate debt, and emerging markets debt) from 0% to 10% of the fund’s total assets individually, but no more than 25% in aggregate within those other asset classes. Such asset classes are not reflected in the neutral asset allocations reflected in the pie chart above. Emerging markets include countries that have an emerging stock market as defined by MSCI, countries or markets with low- to middle-income economies as classified by the World Bank, and other countries or markets that the Adviser identifies as having similar emerging markets characteristics.
The fund's investment objective is intended to support a withdrawal strategy to provide investors with income in retirement. Please contact Fidelity or your investment professional for more information.
Principal Investment Risks
- Asset Allocation Risk. The fund is subject to risks resulting from the Adviser's asset allocation decisions. If the Adviser's asset allocation strategy does not work as intended, the fund may not achieve its objective. If the fund is unable to achieve its objective, the payment strategy may not work as intended. The selection of underlying funds and the allocation of the fund's assets among various asset classes could cause the fund to lose value or its results to lag relevant benchmarks or other funds with similar objectives. In addition, the fund's active asset allocation strategy may cause the fund to have a risk profile different than that portrayed above from time to time and may increase losses.
- Investing in Other Funds. The fund bears all risks of investment strategies employed by the underlying funds, including the risk that the underlying funds will not meet their investment objectives.
- Stock Market Volatility. Stock markets are volatile and can decline significantly in response to adverse issuer, political, regulatory, market, or economic developments. Different parts of the market, including different market sectors, and different types of securities can react differently to these developments.
- Interest Rate Changes. Interest rate increases can cause the price of a debt or money market security to decrease.
- Foreign Exposure. Foreign markets, particularly emerging markets, can be more volatile than the U.S. market due to increased risks of adverse issuer, political, regulatory, market, or economic developments and can perform differently from the U.S. market. The extent of economic development; political stability; market depth, infrastructure, and capitalization; and regulatory oversight can be less than in more developed markets. Emerging markets typically have less established legal, accounting and financial reporting systems than those in more developed markets, which may reduce the scope or quality of financial information available to investors. Emerging markets can be subject to greater social, economic, regulatory, and political uncertainties and can be extremely volatile. Foreign exchange rates also can be extremely volatile.
- Industry Exposure. Market conditions, interest rates, and economic, regulatory, or financial developments could significantly affect a single industry or group of related industries.
- Prepayment. The ability of an issuer of a debt security to repay principal prior to a security's maturity can cause greater price volatility if interest rates change.
- Issuer-Specific Changes. The value of an individual security or particular type of security can be more volatile than, and can perform differently from, the market as a whole. A decline in the credit quality of an issuer or a provider of credit support or a maturity-shortening structure for a security can cause the price of a security to decrease. Lower-quality debt securities (those of less than investment-grade quality, also referred to as high yield debt securities or junk bonds) and certain types of other securities involve greater risk of default or price changes due to changes in the credit quality of the issuer. The value of lower-quality debt securities and certain types of other securities can be more volatile due to increased sensitivity to adverse issuer, political, regulatory, market, or economic developments.
- Correlation to Index. The performance of an underlying index fund and its index may vary somewhat due to factors such as fees and expenses of the underlying fund, transaction costs, sample selection, regulatory restrictions, and timing differences associated with additions to and deletions from the index. Errors in the construction or calculation of the index may occur from time to time and may not be identified and corrected for some period of time, which may have an adverse impact on an underlying fund and its shareholders.
- Passive Management Risk. Some of the underlying funds in which the fund invests are managed with a passive investment strategy, attempting to track the performance of an unmanaged index of securities, regardless of the current or projected performance of an underlying fund's index or of the actual securities included in the index. This differs from an actively managed fund, which typically seeks to outperform a benchmark index. As a result, the performance of these underlying funds could be lower than actively managed funds that may shift their portfolio assets to take advantage of market opportunities or lessen the impact of a market decline or a decline in the value of one or more issuers. An underlying index fund may be concentrated to approximately the same extent that its index concentrates in the securities of issuers in a particular industry or group of industries.
- Leverage Risk. Leverage can increase market exposure, magnify investment risks, and cause losses to be realized more quickly.
- Inflation-Protected Debt Exposure. Increases in real interest rates can cause the price of inflation-protected debt securities to decrease. Interest payments on inflation-protected debt securities can be unpredictable.
- Commodity-Linked Investing. The value of commodities and commodity-linked investments may be affected by the performance of the overall commodities markets as well as weather, political, tax, and other regulatory and market developments. Commodity-linked investments may be more volatile and less liquid than the underlying commodity, instruments, or measures.
- Commodity Futures. Investments in commodity futures contracts are also subject to the risk of the failure of any of the exchanges on which an underlying fund's positions trade or of its clearinghouses or counterparties. In addition, certain commodity exchanges limit fluctuations in certain futures contract prices during a single day by regulations referred to as "daily price fluctuation limits" or "daily limits." Under such daily limits, during a single trading day no trades may be executed at prices beyond the daily limit. If triggered, these limits could prevent the underlying fund from liquidating unfavorable positions and subject the underlying fund to losses or prevent it from entering into desired trades during the particular trading day.
An investment in the fund is not a deposit of a bank and is not insured or guaranteed by the Federal Deposit Insurance Corporation or any other government agency. You could lose money by investing in the fund.
Performance
The following information is intended to help you understand the risks of investing in the fund. The information illustrates the changes in the performance of the fund's shares from year to year and compares the performance of the fund's shares to the performance of a securities market index and a hypothetical composite of market indexes over various periods of time. The indexes have characteristics relevant to the fund's investment strategies. Index descriptions appear in the "Additional Index Information" section of the prospectus. Past performance is not an indication of future performance.
Visit www.401k.com and log in for more recent performance information.
Year-by-Year Returns

| During the periods shown in the chart: | Returns | Quarter ended |
| Highest Quarter Return | 5.75% | June 30, 2020 |
| Lowest Quarter Return | (3.86)% | March 31, 2020 |
| Year-to-Date Return | (10.06)% | June 30, 2022 |
Average Annual Returns
| For the periods ended December 31, 2021 | Past 1 year | Life of class(a) |
| Class K6 | 2.97% | 6.17% |
| Bloomberg U.S. Aggregate Bond Index (reflects no deduction for fees, expenses, or taxes) |
(1.54)% | 3.04% |
| Fidelity Managed Retirement Income Composite Index℠ (reflects no deduction for fees or expenses) |
3.09% | 6.02% |
(a) From August 1, 2019
Investment Adviser
Fidelity Management & Research Company LLC (FMR) (the Adviser) is the fund's manager.
Portfolio Manager(s)
Andrew Dierdorf (co-manager) has managed the fund since June 2009.
Brett Sumsion (co-manager) has managed the fund since January 2014.
Purchase and Sale of Shares
Shares generally are available only to certain employer-sponsored retirement plans. For this purpose, employer-sponsored retirement plans generally include profit sharing, 401(k), 403(b), 457(b), defined benefit, retiree health savings plans, and similar plans, but generally do not include: retail retirement or non-retirement accounts; Individual Retirement Accounts (IRAs) (such as traditional, Roth, SEP, SARSEP, and SIMPLE IRAs); Coverdell Education Savings Accounts; individual 403(b) accounts that are not part of an employer’s 403(b) plan; plans investing through the Fidelity Advisor® 403(b) program; plans covering self-employed individuals and their employees (formerly Keogh/H.R. 10 plans); health savings accounts; or qualified tuition programs. Plan participants may purchase shares only if shares are eligible for sale and available through their plan. You may buy or sell shares in various ways:
Internet
www.401k.com
Phone
For Individual Accounts (investing through a retirement plan sponsor or other institution), refer to your plan materials or contact that institution directly.
For Retirement Plan Level Accounts:
Corporate Clients 1-800-962-1375
"Not for Profit" Clients 1-800-343-0860
|
Redemptions: Fidelity Investments |
Overnight Express: Fidelity Investments |
TDD- Service for the Deaf and Hearing Impaired
1-800-544-0118
Shares of the fund are not eligible for purchase by registered investment companies or business development companies to the extent such acquisition is in reliance on Rule 12d1-4 under the Investment Company Act of 1940.
The price to buy one share is its net asset value per share (NAV). Shares will be bought at the NAV next calculated after an order is received in proper form.
The price to sell one share is its NAV. Shares will be sold at the NAV next calculated after an order is received in proper form.
The fund is open for business each day the New York Stock Exchange (NYSE) is open.
There is no purchase minimum for fund shares.
Tax Information
Distributions by the fund to tax-advantaged retirement plan accounts are not taxable currently (but you may be taxed later, upon withdrawal of your investment from such account).
Payments to Broker-Dealers and Other Financial Intermediaries
The fund, the Adviser, Fidelity Distributors Company LLC (FDC), and/or their affiliates may pay intermediaries, which may include banks, broker-dealers, retirement plan sponsors, administrators, or service-providers (who may be affiliated with the Adviser or FDC), for the sale of fund shares and related services. These payments may create a conflict of interest by influencing your intermediary and your investment professional to recommend the fund over another investment. Currently, the Board of Trustees of the fund has not authorized such payments for Class K6 shares of the fund. Ask your investment professional or visit your intermediary's web site for more information.
Fidelity Distributors Company LLC (FDC) is a member of the Securities Investor Protection Corporation (SIPC). You may obtain information about SIPC, including the SIPC brochure, by visiting www.sipc.org or calling SIPC at 202-371-8300.
Fidelity Investments & Pyramid Design and Fidelity are registered service marks of FMR LLC. © 2022 FMR LLC. All rights reserved.
Fidelity Managed Retirement Income Fund and Fidelity Managed Retirement Income Composite Index are service marks of FMR LLC.
Any third-party marks that may appear above are the marks of their respective owners.
| 1.9893701.105 | R87-K6-SUM-0922 |
Fidelity Managed Retirement Income Fund℠
Class/Ticker
Fidelity Managed Retirement Income Fund℠/FIRMX
In this summary prospectus, the term "shares" (as it relates to the fund) means the class of shares offered through this summary prospectus.
Summary Prospectus
September 29, 2022
Before you invest, you may want to review the fund's prospectus, which contains more information about the fund and its risks. You can find the fund's prospectus, reports to shareholders, and other information about the fund (including the fund's SAI) online at www.fidelity.com/funddocuments. You can also get this information at no cost by calling 1-800-FIDELITY or by sending an e-mail request to [email protected]. The fund's prospectus and SAI dated September 29, 2022 are incorporated herein by reference.
245 Summer Street, Boston, MA 02210
Fund Summary
Fund/Class:
Fidelity Managed Retirement Income Fund℠/Fidelity Managed Retirement Income Fund℠
Investment Objective
The fund seeks high current income and, as a secondary objective, capital appreciation.
Fee Table
The following table describes the fees and expenses that may be incurred when you buy and hold shares of the fund. In addition to the fees and expenses described below, your broker may also require you to pay brokerage commissions on purchases and sales of certain share classes of the fund.
Shareholder fees
| (fees paid directly from your investment) | None |
Annual Operating Expenses
(expenses that you pay each year as a % of the value of your investment)
| Management fee | 0.45% | |
| Distribution and/or Service (12b-1) fees | None | |
| Other expenses | 0.00% | |
| Total annual operating expenses | 0.45% |
This example helps compare the cost of investing in the fund with the cost of investing in other funds.
Let's say, hypothetically, that the annual return for shares of the fund is 5% and that your shareholder fees and the annual operating expenses for shares of the fund are exactly as described in the fee table. This example illustrates the effect of fees and expenses, but is not meant to suggest actual or expected fees and expenses or returns, all of which may vary. For every $10,000 you invested, here's how much you would pay in total expenses if you sell all of your shares at the end of each time period indicated:
| 1 year | $46 |
| 3 years | $144 |
| 5 years | $252 |
| 10 years | $567 |
Portfolio Turnover
The fund will not incur transaction costs, such as commissions, when it buys and sells shares of underlying Fidelity® funds (or "turns over" its portfolio), but it could incur transaction costs if it were to buy and sell other types of securities directly. If the fund were to buy and sell other types of securities directly, a higher portfolio turnover rate could indicate higher transaction costs and could result in higher taxes when fund shares are held in a taxable account. Such costs, if incurred, would not be reflected in annual operating expenses or in the example and would affect the fund's performance. During the most recent fiscal year, the fund's portfolio turnover rate was 64% of the average value of its portfolio.
Principal Investment Strategies
- Investing primarily in a combination of Fidelity® U.S. equity funds, international equity funds, bond funds, and short-term funds (underlying Fidelity® funds) in a manner that supports a withdrawal strategy to provide investors with income in retirement.
- Allocating assets according to a stable neutral asset allocation strategy (approximately 11% in U.S. equity funds, 8% in international equity funds, 43% in U.S. investment grade bond funds, 5% in international bond funds, 3% in long-term treasury bond funds, 0% in long-term inflation-protected bond funds, 20% in short-term inflation-protected bond funds, and 10% in short-term funds). Fidelity Management & Research Company LLC (the Adviser) may modify the fund’s neutral asset allocations from time to time when in the interests of shareholders.
- Buying and selling futures contracts (both long and short positions) in an effort to manage cash flows efficiently, remain fully invested, or facilitate asset allocation.
- Allocating assets among underlying Fidelity® funds and futures according to a stable neutral asset allocation of approximately:
| U.S. Equity Funds | 11% | |
| International Equity Funds | 8% | |
| U.S. Investment Grade Bond Funds | 43% | |
| International Bond Funds | 5% | |
| Long-Term Treasury Bond Funds | 3% | |
| Long-Term Inflation-Protected Bond Funds | 0% | |
| Short-Term Inflation-Protected Bond Funds | 20% | |
| Short-Term Funds | 10% |

* The Adviser may change these percentages over time. As a result of the active asset allocation strategy (discussed below), actual allocations may differ from the neutral allocations above. The allocation percentages may not add to 100% due to rounding.
- The Adviser, under normal market conditions, will use an active asset allocation strategy to increase or decrease asset class exposures relative to the neutral asset allocations reflected above by up to 10% for equity funds, bond funds and short-term funds to reflect the Adviser's market outlook, which is primarily focused on the intermediate term. The asset allocations in the pie chart above are referred to as neutral because they do not reflect any decisions made by the Adviser to overweight or underweight an asset class.
- The Adviser may also make active asset allocations within other asset classes (such as commodities, high yield debt (also referred to as junk bonds), floating rate debt, real estate debt, and emerging markets debt) from 0% to 10% of the fund’s total assets individually, but no more than 25% in aggregate within those other asset classes. Such asset classes are not reflected in the neutral asset allocations reflected in the pie chart above. Emerging markets include countries that have an emerging stock market as defined by MSCI, countries or markets with low- to middle-income economies as classified by the World Bank, and other countries or markets that the Adviser identifies as having similar emerging markets characteristics.
The fund's investment objective is intended to support a withdrawal strategy to provide investors with income in retirement. Please contact Fidelity or your investment professional for more information.
Principal Investment Risks
- Asset Allocation Risk. The fund is subject to risks resulting from the Adviser's asset allocation decisions. If the Adviser's asset allocation strategy does not work as intended, the fund may not achieve its objective. If the fund is unable to achieve its objective, the payment strategy may not work as intended. The selection of underlying funds and the allocation of the fund's assets among various asset classes could cause the fund to lose value or its results to lag relevant benchmarks or other funds with similar objectives. In addition, the fund's active asset allocation strategy may cause the fund to have a risk profile different than that portrayed above from time to time and may increase losses.
- Investing in Other Funds. The fund bears all risks of investment strategies employed by the underlying funds, including the risk that the underlying funds will not meet their investment objectives.
- Stock Market Volatility. Stock markets are volatile and can decline significantly in response to adverse issuer, political, regulatory, market, or economic developments. Different parts of the market, including different market sectors, and different types of securities can react differently to these developments.
- Interest Rate Changes. Interest rate increases can cause the price of a debt or money market security to decrease.
- Foreign Exposure. Foreign markets, particularly emerging markets, can be more volatile than the U.S. market due to increased risks of adverse issuer, political, regulatory, market, or economic developments and can perform differently from the U.S. market. The extent of economic development; political stability; market depth, infrastructure, and capitalization; and regulatory oversight can be less than in more developed markets. Emerging markets typically have less established legal, accounting and financial reporting systems than those in more developed markets, which may reduce the scope or quality of financial information available to investors. Emerging markets can be subject to greater social, economic, regulatory, and political uncertainties and can be extremely volatile. Foreign exchange rates also can be extremely volatile.
- Industry Exposure. Market conditions, interest rates, and economic, regulatory, or financial developments could significantly affect a single industry or group of related industries.
- Prepayment. The ability of an issuer of a debt security to repay principal prior to a security's maturity can cause greater price volatility if interest rates change.
- Issuer-Specific Changes. The value of an individual security or particular type of security can be more volatile than, and can perform differently from, the market as a whole. A decline in the credit quality of an issuer or a provider of credit support or a maturity-shortening structure for a security can cause the price of a security to decrease. Lower-quality debt securities (those of less than investment-grade quality, also referred to as high yield debt securities or junk bonds) and certain types of other securities involve greater risk of default or price changes due to changes in the credit quality of the issuer. The value of lower-quality debt securities and certain types of other securities can be more volatile due to increased sensitivity to adverse issuer, political, regulatory, market, or economic developments.
- Correlation to Index. The performance of an underlying index fund and its index may vary somewhat due to factors such as fees and expenses of the underlying fund, transaction costs, sample selection, regulatory restrictions, and timing differences associated with additions to and deletions from the index. Errors in the construction or calculation of the index may occur from time to time and may not be identified and corrected for some period of time, which may have an adverse impact on an underlying fund and its shareholders.
- Passive Management Risk. Some of the underlying funds in which the fund invests are managed with a passive investment strategy, attempting to track the performance of an unmanaged index of securities, regardless of the current or projected performance of an underlying fund's index or of the actual securities included in the index. This differs from an actively managed fund, which typically seeks to outperform a benchmark index. As a result, the performance of these underlying funds could be lower than actively managed funds that may shift their portfolio assets to take advantage of market opportunities or lessen the impact of a market decline or a decline in the value of one or more issuers. An underlying index fund may be concentrated to approximately the same extent that its index concentrates in the securities of issuers in a particular industry or group of industries.
- Leverage Risk. Leverage can increase market exposure, magnify investment risks, and cause losses to be realized more quickly.
- Inflation-Protected Debt Exposure. Increases in real interest rates can cause the price of inflation-protected debt securities to decrease. Interest payments on inflation-protected debt securities can be unpredictable.
- Commodity-Linked Investing. The value of commodities and commodity-linked investments may be affected by the performance of the overall commodities markets as well as weather, political, tax, and other regulatory and market developments. Commodity-linked investments may be more volatile and less liquid than the underlying commodity, instruments, or measures.
- Commodity Futures. Investments in commodity futures contracts are also subject to the risk of the failure of any of the exchanges on which an underlying fund's positions trade or of its clearinghouses or counterparties. In addition, certain commodity exchanges limit fluctuations in certain futures contract prices during a single day by regulations referred to as "daily price fluctuation limits" or "daily limits." Under such daily limits, during a single trading day no trades may be executed at prices beyond the daily limit. If triggered, these limits could prevent the underlying fund from liquidating unfavorable positions and subject the underlying fund to losses or prevent it from entering into desired trades during the particular trading day.
An investment in the fund is not a deposit of a bank and is not insured or guaranteed by the Federal Deposit Insurance Corporation or any other government agency. You could lose money by investing in the fund.
Performance
The following information is intended to help you understand the risks of investing in the fund. The information illustrates the changes in the performance of the fund's shares from year to year and compares the performance of the fund's shares to the performance of a securities market index and a hypothetical composite of market indexes over various periods of time. The indexes have characteristics relevant to the fund's investment strategies. Index descriptions appear in the "Additional Index Information" section of the prospectus. Prior to June 1, 2017, the fund operated under certain different investment policies and a different pricing structure. The fund's historical performance prior to June 1, 2017 may not represent its current investment policies and does not reflect the fund's current pricing structure. Past performance (before and after taxes) is not an indication of future performance.
Visit www.fidelity.com for more recent performance information.
Year-by-Year Returns

| During the periods shown in the chart: | Returns | Quarter ended |
| Highest Quarter Return | 6.15% | March 31, 2012 |
| Lowest Quarter Return | (3.92)% | March 31, 2020 |
| Year-to-Date Return | (10.15)% | June 30, 2022 |
Average Annual Returns
After-tax returns are calculated using the historical highest individual federal marginal income tax rates, but do not reflect the impact of state or local taxes. Actual after-tax returns may differ depending on your individual circumstances. The after-tax returns shown are not relevant if you hold your shares in a retirement account or in another tax-deferred arrangement, such as an employee benefit plan (profit sharing, 401(k), or 403(b) plan). Return After Taxes on Distributions and Sale of Fund Shares may be higher than other returns for the same period due to a tax benefit of realizing a capital loss upon the sale of fund shares.
| For the periods ended December 31, 2021 | Past 1 year | Past 5 years | Past 10 years |
| Fidelity Managed Retirement Income Fund℠ | |||
| Return Before Taxes | 2.76% | 5.34% | 5.73% |
| Return After Taxes on Distributions | 1.53% | 3.94% | 4.68% |
| Return After Taxes on Distributions and Sale of Fund Shares | 1.86% | 3.72% | 4.19% |
| Bloomberg U.S. Aggregate Bond Index (reflects no deduction for fees, expenses, or taxes) |
(1.54)% | 3.57% | 2.90% |
| Fidelity Managed Retirement Income Composite Index℠ (reflects no deduction for fees or expenses) |
3.09% | 5.64% | 5.79% |
Investment Adviser
Fidelity Management & Research Company LLC (FMR) (the Adviser) is the fund's manager.
Portfolio Manager(s)
Andrew Dierdorf (co-manager) has managed the fund since June 2009.
Brett Sumsion (co-manager) has managed the fund since January 2014.
Purchase and Sale of Shares
You may buy or sell shares through a Fidelity® brokerage account, through a retirement account, or through an investment professional. You may buy or sell shares in various ways:
Internet
www.fidelity.com
Phone
Fidelity Automated Service Telephone (FAST®) 1-800-544-5555
To reach a Fidelity representative 1-800-544-6666
|
Additional purchases: Fidelity Investments |
Redemptions: Fidelity Investments |
TDD- Service for the Deaf and Hearing Impaired
1-800-544-0118
Shares of the fund are not eligible for purchase by registered investment companies or business development companies to the extent such acquisition is in reliance on Rule 12d1-4 under the Investment Company Act of 1940.
The price to buy one share is its net asset value per share (NAV). Shares will be bought at the NAV next calculated after an order is received in proper form.
The price to sell one share is its NAV. Shares will be sold at the NAV next calculated after an order is received in proper form.
The fund is open for business each day the New York Stock Exchange (NYSE) is open.
There is no purchase minimum for fund shares.
Tax Information
Distributions you receive from the fund are subject to federal income tax and generally will be taxed as ordinary income or capital gains, and may also be subject to state or local taxes, unless you are investing through a tax-advantaged retirement account (in which case you may be taxed later, upon withdrawal of your investment from such account).
Payments to Broker-Dealers and Other Financial Intermediaries
The fund, the Adviser, Fidelity Distributors Company LLC (FDC), and/or their affiliates may pay intermediaries, which may include banks, broker-dealers, retirement plan sponsors, administrators, or service-providers (who may be affiliated with the Adviser or FDC), for the sale of fund shares and related services. These payments may create a conflict of interest by influencing your intermediary and your investment professional to recommend the fund over another investment. Ask your investment professional or visit your intermediary's web site for more information.
Current regulations allow Fidelity to send a single copy of shareholder documents for Fidelity® funds, such as prospectuses, annual and semi-annual reports, and proxy materials, to certain mutual fund customers whom we believe are members of the same family who share the same address. For certain types of accounts, we will not send multiple copies of these documents to you and members of your family who share the same address. Instead, we will send only a single copy of these documents. This will continue for as long as you are a shareholder, unless you notify us otherwise. If at any time you choose to receive individual copies of any documents, please call 1-800-544-8544. We will begin sending individual copies to you within 30 days of receiving your call.
Fidelity Distributors Company LLC (FDC) is a member of the Securities Investor Protection Corporation (SIPC). You may obtain information about SIPC, including the SIPC brochure, by visiting www.sipc.org or calling SIPC at 202-371-8300.
Fidelity Investments & Pyramid Design, Fidelity, and FAST are registered service marks of FMR LLC. © 2022 FMR LLC. All rights reserved.
Fidelity Managed Retirement Income Fund and Fidelity Managed Retirement Income Composite Index are service marks of FMR LLC.
Any third-party marks that may appear above are the marks of their respective owners.
| 1.9884160.109 | R87-SUM-0922 |
Serious News for Serious Traders! Try StreetInsider.com Premium Free!
You May Also Be Interested In
- W3WC Dubai Event: Where Visionaries Unite for Web3’s Tomorrow
- Construction contract in Latvia (solar panel power plant in Vārme parish)
- Sodexo - Financial report for First half Fiscal 2024 available
Create E-mail Alert Related Categories
SEC FilingsSign up for StreetInsider Free!
Receive full access to all new and archived articles, unlimited portfolio tracking, e-mail alerts, custom newswires and RSS feeds - and more!
