

Form 497K FIDELITY CHARLES STREET
 Tweet
Tweet Share
Share
Fund
/Ticker
Aggressive Growth Allocation Fund
/FRAGX
Summary Prospectus
November 29, 2022
Before you invest, you may want to review the fund's prospectus, which contains more information about the fund and its risks. You can find the fund's prospectus, reports to shareholders, and other information about the fund (including the fund's SAI) online at www.fidelity.com/funddocuments. You can also get this information at no cost by calling 1-800-FIDELITY or by sending an e-mail request to [email protected]. The fund's
prospectus
and
SAI
dated November 29, 2022 are incorporated herein by reference.
245 Summer Street, Boston, MA 02210
Fund Summary
Fund:
Aggressive Growth Allocation Fund
Investment Objective
Aggressive Growth Allocation Fund seeks capital appreciation.
Fee Table
The following table describes the fees and expenses that may be incurred when you buy and hold shares of the fund.
Shareholder fees
|
(fees paid directly from your investment)
|
None
|
Annual Operating Expenses
(expenses that you pay each year as a % of the value of your investment)
|
Management fee
|
0.10
%
|
|
Distribution and/or Service (12b-1) fees
|
None
|
|
Other expenses
|
0.00
%
|
|
Acquired fund fees and expenses
|
0.02
%
|
|
Total annual operating expenses
A
|
0.12
%
|
|
Fee waiver and/or expense reimbursement
B
|
0.10
%
|
|
Total annual operating expenses after fee waiver and/or expense reimbursement
A
|
0.02
%
|
A
Differs from the ratios of expenses to average net assets in the Financial Highlights section of the prospectus because of acquired fund fees and expenses.
B
Fidelity Management & Research Company LLC (FMR) has contractually agreed to waive 0.10% of the fund's management fee. This arrangement will remain in effect through
January 31, 2026
. FMR may not terminate this arrangement before the expiration date without the approval of the Board of Trustees and may extend it in its discretion after that date.
This
example
helps compare the cost of investing in the fund with the cost of investing in other funds.
Let's say, hypothetically, that the annual return for shares of the fund is 5% and that the fees and the annual operating expenses for shares of the fund are exactly as described in the fee table. This example illustrates the effect of fees and expenses, but is not meant to suggest actual or expected fees and expenses or returns, all of which may vary. For every $10,000 you invested, here's how much you would pay in total expenses if you sell all of your shares at the end of each time period indicated:
Let's say, hypothetically, that the annual return for shares of the fund is 5% and that the fees and the annual operating expenses for shares of the fund are exactly as described in the fee table. This example illustrates the effect of fees and expenses, but is not meant to suggest actual or expected fees and expenses or returns, all of which may vary. For every $10,000 you invested, here's how much you would pay in total expenses if you sell all of your shares at the end of each time period indicated:
|
1 year
|
$
|
2
|
|
3 years
|
$
|
6
|
|
5 years
|
$
|
32
|
|
10 years
|
$
|
118
|
Portfolio Turnover
The fund will not incur transaction costs, such as commissions, when it buys and sells shares of underlying Fidelity
®
funds (or "turns over" its portfolio), but it could incur transaction costs if it were to buy and sell other types of securities directly. If the fund were to buy and sell other types of securities directly, a higher portfolio turnover rate could indicate higher transaction costs and could result in higher taxes when fund shares are held in a taxable account. Such costs, if incurred, would not be reflected in annual operating expenses or in the example and would affect the fund's performance. For the period from February 9, 2022 to September 30, 2022, the fund's portfolio turnover rate was
14
% annualized of the average value of its portfolio.
Principal Investment Strategies
- Investing in a combination of two Fidelity® equity index funds (U.S. and international) and one Fidelity® investment-grade bond index fund.
- Allocating assets among underlying Fidelity® index funds according to an asset allocation of approximately:
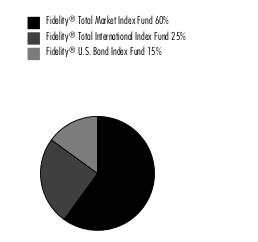 |
Principal Investment Risks
- Investing in Other Funds.
The fund bears all risks of investment strategies employed by the underlying funds, including the risk that the underlying funds will not meet their investment objectives.
- Stock Market Volatility.
Stock markets are volatile and can decline significantly in response to adverse issuer, political, regulatory, market, or economic developments. Different parts of the market, including different market sectors, and different types of securities can react differently to these developments.
- Interest Rate Changes.
Interest rate increases can cause the price of a debt security to decrease.
- Foreign and Emerging Markets Risk.
Foreign markets, particularly emerging markets, can be more volatile than the U.S. market due to increased risks of adverse issuer, political, regulatory, market, or economic developments and can perform differently from the U.S. market.
The extent of economic development; political stability; market depth, infrastructure, and capitalization; and regulatory oversight can be less than in more developed markets. Emerging markets typically have less established legal, accounting and financial reporting systems than those in more developed markets, which may reduce the scope or quality of financial information available to investors.
Emerging markets can be subject to greater social, economic, regulatory, and political uncertainties and can be extremely volatile.
Foreign exchange rates also can be extremely volatile.
- Prepayment.
The ability of an issuer of a debt security to repay principal prior to a security's maturity can cause greater price volatility if interest rates change.
- Issuer-Specific Changes.
The value of an individual security or particular type of security can be more volatile than, and can perform differently from, the market as a whole.
Changes in the financial condition of an issuer or counterparty (e.g., broker-dealer or other borrower in a securities lending transaction) can increase the risk of default by an issuer or counterparty, which can affect a security's or instrument's value or result in delays in recovering securities and/or capital from a counterparty.
A decline in the credit quality of an issuer or a provider of credit support or a maturity-shortening structure for a security can cause the price of a security to decrease.
- Correlation to Index.
The performance of an underlying index fund and its index may vary somewhat due to factors such as fees and expenses of the underlying fund, transaction costs, sample selection, regulatory restrictions, and timing differences associated with additions to and deletions from the index. Errors in the construction or calculation of the index may occur from time to time and may not be identified and corrected for some period of time, which may have an adverse impact on an underlying fund and its shareholders.
- Passive Management Risk.
Some of the underlying funds in which the fund invests are managed with a passive investment strategy, attempting to track the performance of an unmanaged index of securities, regardless of the current or projected performance of an underlying fund's index or of the actual securities included in the index. This differs from an actively managed fund, which typically seeks to outperform a benchmark index. As a result, the performance of these underlying funds could be lower than actively managed funds that may shift their portfolio assets to take advantage of market opportunities or lessen the impact of a market decline or a decline in the value of one or more issuers. An underlying index fund may be concentrated to approximately the same extent that its index concentrates in the securities of issuers in a particular industry or group of industries.
- Leverage Risk.
Leverage can increase market exposure, magnify investment risks, and cause losses to be realized more quickly.
- Mid Cap Investing.
The value of securities of medium size, less well-known issuers can perform differently from the market as a whole and other types of stocks and can be more volatile than that of larger issuers.
- Small Cap Investing.
The value of securities of smaller, less well-known issuers can perform differently from the market as a whole and other types of stocks and can be more volatile than that of larger issuers.
- Securities Lending Risk.
Securities lending involves the risk that the borrower may fail to return the securities loaned in a timely manner or at all. If the borrower defaults on its obligation to return the securities loaned because of insolvency or other reasons, an underlying fund could experience delays and costs in recovering the securities loaned or in gaining access to the collateral.
An investment in the fund is not a deposit of a bank and is not insured or guaranteed by the Federal Deposit Insurance Corporation or any other government agency
.
You could lose money by investing in the fund.
Performance
Performance history will be available for the fund after the fund has been in operation for one calendar year.
Investment Adviser
Fidelity Management & Research Company LLC (FMR) (the Adviser) is the fund's manager.
Portfolio Manager(s)
Sharon Delia Dolan (Co-Portfolio Manager) has managed the fund since 2022.
Kristina Stookey (Co-Portfolio Manager) has managed the fund since 2022.
Purchase and Sale of Shares
Shares are available only to certain Fidelity
®
health savings accounts that are made available through Raytheon Technologies Corporation ("Raytheon"). Current Raytheon employees, and recently separated former Raytheon employees, may buy shares of the fund.
You may buy or sell shares in various ways:
Internet
www.netbenefits.com
Phone
For Health Savings Accounts:
Corporate Clients 1-800-544-3716
Mail
|
Redemptions:
Fidelity Investments
P.O. Box 770001
Cincinnati, OH 45277-0035
|
Overnight Express:
Fidelity Investments
100 Crosby Parkway
Covington, KY 41015
|
TDD -
Service for the Deaf and Hearing Impaired
1-800-544-0118
The price to buy one share is its net asset value per share (NAV). Shares will be bought at the NAV next calculated after an order is received in proper form.
The price to sell one share is its NAV. Shares will be sold at the NAV next calculated after an order is received in proper form.
The fund is open for business each day the New York Stock Exchange (NYSE) is open.
There is no purchase minimum for fund shares.
Tax Information
Distributions by the fund to tax-advantaged accounts are not taxable currently (but you may be taxed later, upon withdrawal of your investment from such account).
Payments to Broker-Dealers and Other Financial Intermediaries
The fund, the Adviser, Fidelity Distributors Company LLC (FDC), and/or their affiliates may pay intermediaries, which may include banks, broker-dealers, administrators, or service-providers (who may be affiliated with the Adviser or FDC), for the sale of fund shares and related services. These payments may create a conflict of interest by influencing your intermediary and your investment professional to recommend the fund over another investment. Ask your investment professional or visit your intermediary's web site for more information.
Current regulations allow Fidelity to send a single copy of shareholder documents for Fidelity
®
funds, such as prospectuses, annual and semi-annual reports, and proxy materials, to certain mutual fund customers whom we believe are members of the same family who share the same address. For certain types of accounts, we will not send multiple copies of these documents to you and members of your family who share the same address. Instead, we will send only a single copy of these documents. This will continue for as long as you are a shareholder, unless you notify us otherwise. If at any time you choose to receive individual copies of any documents, please call 1-800-544-8544. We will begin sending individual copies to you within 30 days of receiving your call.
Fidelity Distributors Company LLC (FDC) is a member of the Securities Investor Protection Corporation (SIPC). You may obtain information about SIPC, including the SIPC brochure, by visiting www.sipc.org or calling SIPC at 202-371-8300.
Fidelity, the Fidelity Investments Logo and all other Fidelity trademarks or service marks used herein are trademarks or service marks of FMR LLC. Any third-party marks that are used herein are trademarks or service marks of their respective owners. © 2022 FMR LLC. All rights reserved.
|
1.9904657.101
|
AGF-SUM-1122
|
Serious News for Serious Traders! Try StreetInsider.com Premium Free!
You May Also Be Interested In
- Adams Diversified Equity Fund Declares Distribution and Announces First Quarter Performance
- Breaking New Ground: Cleanfarms Champions Circular Economy for Canadian Agricultural Plastics
- Glow Announces Late Filing of Financial Statements
Create E-mail Alert Related Categories
SEC FilingsSign up for StreetInsider Free!
Receive full access to all new and archived articles, unlimited portfolio tracking, e-mail alerts, custom newswires and RSS feeds - and more!
