

Form 497K FIDELITY ADVISOR SERIES
 Tweet
Tweet Share
ShareFidelity Advisor Focus Funds®
Fidelity Advisor® Industrials Fund
Class/Ticker
A/FCLAX M/FCLTX C/FCLCX I/FCLIX Z/FIKEX
Summary Prospectus
September 29, 2022
Before you invest, you may want to review the fund's prospectus, which contains more information about the fund and its risks. You can find the fund's prospectus, reports to shareholders, and other information about the fund (including the fund's SAI) online at institutional.fidelity.com/fafunddocuments. You can also get this information at no cost by calling 1-866-997-1254 or by sending an e-mail request to [email protected]. The fund's prospectus and SAI dated September 29, 2022 are incorporated herein by reference.
245 Summer Street, Boston, MA 02210
Fund Summary
Fund/Class:
Fidelity Advisor® Industrials Fund/A, M, C, I, Z
Investment Objective
The fund seeks capital appreciation.
Fee Table
The following table describes the fees and expenses that may be incurred when you buy and hold shares of the fund. In addition to the fees and expenses described below, your broker may also require you to pay brokerage commissions on purchases and sales of certain share classes of the fund.
You may qualify for sales charge discounts if you and your family invest, or agree to invest in the future, at least $50,000 in the fund or certain other Fidelity® funds. More information about these and other discounts is available from your investment professional and in the "Fund Distribution" section beginning on page 49 of the prospectus. Different intermediaries may provide additional waivers or reductions of the sales charge. Please see “Sales Charge Waiver Policies Applied by Certain Intermediaries” in the “Appendix” section of the prospectus.
Shareholder fees
(fees paid directly from your investment)
| Class A | Class M | Class C | Class I | Class Z | |
| Maximum sales charge (load) on purchases (as a % of offering price) | 5.75% | 3.50% | None | None | None |
| Maximum contingent deferred sales charge (as a % of the lesser of original purchase price or redemption proceeds) | None(a) | None(a) | 1.00%(b) | None | None |
(a) Class A and Class M purchases of $1 million or more will not be subject to a front-end sales charge. Such Class A and Class M purchases may be subject, upon redemption, to a contingent deferred sales charge (CDSC) of 1.00% or 0.25%, respectively.
(b) On Class C shares redeemed less than one year after purchase.
Annual Operating Expenses
(expenses that you pay each year as a % of the value of your investment)
| Class A | Class M | Class C | Class I | Class Z | |
| Management fee | 0.52% | 0.52% | 0.52% | 0.52% | 0.52% |
| Distribution and/or Service (12b-1) fees | 0.25% | 0.50% | 1.00% | None | None |
| Other expenses | 0.25% | 0.25% | 0.25% | 0.23% | 0.11% |
| Total annual operating expenses | 1.02% | 1.27% | 1.77% | 0.75% | 0.63% |
This example helps compare the cost of investing in the fund with the cost of investing in other funds.
Let's say, hypothetically, that the annual return for shares of the fund is 5% and that your shareholder fees and the annual operating expenses for shares of the fund are exactly as described in the fee table. This example illustrates the effect of fees and expenses, but is not meant to suggest actual or expected fees and expenses or returns, all of which may vary. For every $10,000 you invested, here's how much you would pay in total expenses if you sell all of your shares at the end of each time period indicated and if you hold your shares:
| Class A | Class M | Class C | Class I | Class Z | ||||||
| Sell All Shares |
Hold Shares |
Sell All Shares |
Hold Shares |
Sell All Shares |
Hold Shares |
Sell All Shares |
Hold Shares |
Sell All Shares |
Hold Shares |
|
| 1 year | $673 | $673 | $475 | $475 | $280 | $180 | $77 | $77 | $64 | $64 |
| 3 years | $881 | $881 | $739 | $739 | $557 | $557 | $240 | $240 | $202 | $202 |
| 5 years | $1,106 | $1,106 | $1,023 | $1,023 | $959 | $959 | $417 | $417 | $351 | $351 |
| 10 years | $1,751 | $1,751 | $1,830 | $1,830 | $1,886 | $1,886 | $930 | $930 | $786 | $786 |
Portfolio Turnover
The fund pays transaction costs, such as commissions, when it buys and sells securities (or "turns over" its portfolio). A higher portfolio turnover rate may indicate higher transaction costs and may result in higher taxes when fund shares are held in a taxable account. These costs, which are not reflected in annual operating expenses or in the example, affect the fund's performance. During the most recent fiscal year, the fund's portfolio turnover rate was 106% of the average value of its portfolio.
Principal Investment Strategies
- Normally investing primarily in common stocks.
- Normally investing at least 80% of assets in securities of companies principally engaged in the research, development, manufacture, distribution, supply, or sale of industrial products, services, or equipment.
- Investing in domestic and foreign issuers.
- Using fundamental analysis of factors such as each issuer's financial condition and industry position, as well as market and economic conditions, to select investments.
Principal Investment Risks
- Stock Market Volatility. Stock markets are volatile and can decline significantly in response to adverse issuer, political, regulatory, market, or economic developments. Different parts of the market, including different market sectors, and different types of securities can react differently to these developments.
- Foreign Exposure. Foreign markets can be more volatile than the U.S. market due to increased risks of adverse issuer, political, regulatory, market, or economic developments and can perform differently from the U.S. market.
- Industrials Industry Concentration. Industrial industries can be significantly affected by general economic trends, changes in consumer sentiment and spending, commodity prices, legislation, government regulation and spending, import controls, worldwide competition, and liability for environmental damage, depletion of resources, and mandated expenditures for safety and pollution control.
- Issuer-Specific Changes. The value of an individual security or particular type of security can be more volatile than, and can perform differently from, the market as a whole. The value of securities of smaller issuers can be more volatile than that of larger issuers.
- High Portfolio Turnover. High portfolio turnover (more than 100%) may result in increased transaction costs and potentially higher capital gains or losses. The effects of higher than normal portfolio turnover may adversely affect the fund's performance.
In addition, the fund is classified as non-diversified under the Investment Company Act of 1940 (1940 Act), which means that it has the ability to invest a greater portion of assets in securities of a smaller number of individual issuers than a diversified fund. As a result, changes in the market value of a single investment could cause greater fluctuations in share price than would occur in a more diversified fund.
An investment in the fund is not a deposit of a bank and is not insured or guaranteed by the Federal Deposit Insurance Corporation or any other government agency. You could lose money by investing in the fund.
Performance
The following information is intended to help you understand the risks of investing in the fund. The information illustrates the changes in the performance of the fund's shares from year to year and compares the performance of the fund's shares to the performance of a securities market index and an additional index over various periods of time. The indexes have characteristics relevant to the fund's investment strategies. Index descriptions appear in the "Additional Index Information" section of the prospectus. Past performance (before and after taxes) is not an indication of future performance.
Visit institutional.fidelity.com for more recent performance information.
Year-by-Year Returns
The returns in the bar chart do not reflect any applicable sales charges; if sales charges were reflected, returns would be lower than those shown.
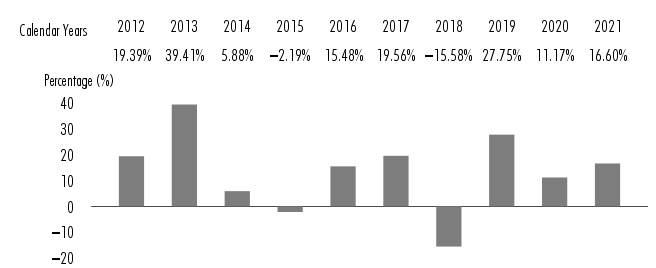
| During the periods shown in the chart for Class A: | Returns | Quarter ended |
| Highest Quarter Return | 19.81% | June 30, 2020 |
| Lowest Quarter Return | (28.79)% | March 31, 2020 |
| Year-to-Date Return | (21.54)% | June 30, 2022 |
Average Annual Returns
Unlike the returns in the bar chart, the returns in the table reflect the maximum applicable sales charges. After-tax returns are calculated using the historical highest individual federal marginal income tax rates, but do not reflect the impact of state or local taxes. After-tax returns for Class A are shown in the table below and after-tax returns for other classes will vary. Actual after-tax returns may differ depending on your individual circumstances. The after-tax returns shown are not relevant if you hold your shares in a retirement account or in another tax-deferred arrangement, such as an employee benefit plan (profit sharing, 401(k), or 403(b) plan). Return After Taxes on Distributions and Sale of Fund Shares may be higher than other returns for the same period due to a tax benefit of realizing a capital loss upon the sale of fund shares.
| For the periods ended December 31, 2021 | Past 1 year | Past 5 years | Past 10 years | Inception Date |
| Class A - Return Before Taxes | 9.89% | 9.51% | 12.11% | — |
| Return After Taxes on Distributions | 4.56% | 7.32% | 10.26% | — |
| Return After Taxes on Distributions and Sale of Fund Shares | 8.62% | 7.10% | 9.59% | — |
| Class M - Return Before Taxes | 12.23% | 9.74% | 12.08% | — |
| Class C - Return Before Taxes | 14.80% | 9.99% | 12.09% | — |
| Class I - Return Before Taxes | 16.92% | 11.12% | 13.07% | — |
| Class Z - Return Before Taxes | 17.08% | 9.27%(a) | — | October 2, 2018 |
| S&P 500® Index (reflects no deduction for fees, expenses, or taxes) |
28.71% | 18.47% | 16.55% | |
| MSCI U.S. IMI Industrials 25-50 Index (reflects no deduction for fees, expenses, or taxes) |
20.83% | 13.14% | 14.57% |
(a) Since inception October 2, 2018.
Investment Adviser
Fidelity Management & Research Company LLC (FMR) (the Adviser) is the fund's manager. Other investment advisers serve as sub-advisers for the fund.
Portfolio Manager(s)
Janet Glazer (portfolio manager) has managed the fund since December 2018.
Purchase and Sale of Shares
You may buy or sell shares through a retirement account or through an investment professional. You may buy or sell shares in various ways:
Internet
institutional.fidelity.com
Phone
To reach a Fidelity representative 1-877-208-0098
| Fidelity Investments P.O. Box 770002 Cincinnati, OH 45277-0081 |
Overnight Express: Fidelity Investments 100 Crosby Parkway Covington, KY 41015 |
Class I and Class Z eligibility requirements are listed in the "Additional Information about the Purchase and Sale of Shares" section of the prospectus.
The price to buy one share of Class A or Class M is its offering price, if you pay a front-end sales charge, or its net asset value per share (NAV), if you qualify for a front-end sales charge waiver. The price to buy one share of Class C, Class I, or Class Z is its NAV. Shares will be bought at the offering price or NAV, as applicable, next calculated after an order is received in proper form.
The price to sell one share of Class A, Class M, or Class C is its NAV, minus any applicable contingent deferred sales charge (CDSC). The price to sell one share of Class I or Class Z is its NAV. Shares will be sold at the NAV next calculated after an order is received in proper form, minus any applicable CDSC.
The fund is open for business each day the New York Stock Exchange (NYSE) is open.
There is no purchase minimum for fund shares.
Tax Information
Distributions you receive from the fund are subject to federal income tax and generally will be taxed as ordinary income or capital gains, and may also be subject to state or local taxes, unless you are investing through a tax-advantaged retirement account (in which case you may be taxed later, upon withdrawal of your investment from such account).
Payments to Broker-Dealers and Other Financial Intermediaries
The fund, the Adviser, Fidelity Distributors Company LLC (FDC), and/or their affiliates may pay intermediaries, which may include banks, broker-dealers, retirement plan sponsors, administrators, or service-providers (who may be affiliated with the Adviser or FDC), for the sale of fund shares and related services. These payments may create a conflict of interest by influencing your intermediary and your investment professional to recommend the fund over another investment. Ask your investment professional or visit your intermediary's web site for more information.
Current regulations allow Fidelity to send a single copy of shareholder documents for Fidelity® funds, such as prospectuses, annual and semi-annual reports, and proxy materials, to certain mutual fund customers whom we believe are members of the same family who share the same address. For certain types of accounts, we will not send multiple copies of these documents to you and members of your family who share the same address. Instead, we will send only a single copy of these documents. This will continue for as long as you are a shareholder, unless you notify us otherwise. If at any time you choose to receive individual copies of any documents, please call 1-877-208-0098. We will begin sending individual copies to you within 30 days of receiving your call.
Fidelity Distributors Company LLC (FDC) is a member of the Securities Investor Protection Corporation (SIPC). You may obtain information about SIPC, including the SIPC brochure, by visiting www.sipc.org or calling SIPC at 202-371-8300.
Fidelity Advisor Focus Funds, Fidelity Advisor, Fidelity Investments & Pyramid Design, and Fidelity are registered service marks of FMR LLC. © 2022 FMR LLC. All rights reserved.
Any third-party marks that may appear above are the marks of their respective owners.
| 1.915457.121 | AFCY-SUM-0922 |
Serious News for Serious Traders! Try StreetInsider.com Premium Free!
You May Also Be Interested In
- NB Bancorp, Inc. Reports First Quarter 2024 Financial Results
- The Lundquist Institute Receives $2.6 Million Grant from U.S. Army Medical Research Acquisition Activity to Develop Wearable Biosensors
- ROSEN, A RANKED AND LEADING FIRM, Encourages Innoviz Technologies Ltd. Investors to Secure Counsel Before Important Deadline in Securities Class Action – INVZ, INVZW
Create E-mail Alert Related Categories
SEC FilingsSign up for StreetInsider Free!
Receive full access to all new and archived articles, unlimited portfolio tracking, e-mail alerts, custom newswires and RSS feeds - and more!
