

Form 497K ALLSPRING FUNDS TRUST
 Tweet
Tweet Share
Share|
. |
Summary Prospectus |

Allspring Moderate Balanced Fund
|
Class/Ticker: Class A - WFMAX - Class C - WFBCX |
Link to Prospectus |
Link to SAI |
Before you invest, you may want to review the Fund’s prospectus, which contains more information about the Fund and its risks. You can find the Fund’s prospectus, reports to shareholders and other information about the Fund online at allspringglobal.com/reports. You can also get information at no cost by calling 1-800-222-8222, or by sending an email request to [email protected]. The current prospectus (“Prospectus”) and statement of additional information (“SAI”), dated October 1, 2022, as supplemented from time to time, are incorporated by reference into this summary prospectus. The Fund’s SAI may be obtained, free of charge, in the same manner as the Prospectus.
Investment Objective
The Fund seeks total return, consisting of current income and capital appreciation.
Fees and Expenses
These tables are intended to help you understand the various costs and expenses you will pay if you buy, hold and sell shares of the Fund. You may qualify for sales charge discounts if you and your family invest, or agree to invest in the future, at least $50,000 in the aggregate in specified classes of certain Allspring Funds. More information about these and other discounts is available from your financial professional and in “Share Class Features” and “Reductions and Waivers of Sales Charges” on pages 31 and 32 of the Prospectus and “Additional Purchase and Redemption Information” on page 84 of the Statement of Additional Information. Investors who purchase through certain intermediaries may be subject to different sales charge discounts than those outlined shares in these sections. Please see Appendix A on page 49 for further information.
|
Shareholder Fees (fees paid directly from your investment) |
||
|
Class A |
Class C |
|
|
Maximum sales charge (load) imposed on purchases (as a percentage of offering price) |
5.75% |
None |
|
Maximum deferred sales charge (load) (as a percentage of offering price) |
None1 |
1.00% |
| 1. | Investments of $1 million or more are not subject to a front-end sales charge but generally will be subject to a deferred sales charge of 1.00% if redeemed within 18 months from the date of purchase. |
|
Annual Fund Operating Expenses (expenses that you pay each year as a percentage of the value of your investment)1 |
||
|
Class A |
Class C |
|
|
Management Fees |
0.30% |
0.30% |
|
Distribution (12b-1) Fees |
0.00% |
0.75% |
|
Other Expenses |
0.57% |
0.57% |
|
Acquired Fund Fees and Expenses |
0.39% |
0.39% |
|
Total Annual Fund Operating Expenses |
1.26% |
2.01% |
|
Fee Waivers |
(0.11)% |
(0.11)% |
|
Total Annual Fund Operating Expenses After Fee Waiver2 |
1.15% |
1.90% |
| 1. | Expenses have been adjusted as necessary from amounts incurred during the Fund’s most recent fiscal year to reflect current fees and expenses. |
| 2. | The Manager has contractually committed through September 30, 2023, to waive fees and/or reimburse expenses to the extent necessary to cap Total Annual Fund Operating Expenses After Fee Waivers at 1.15% for Class A and 1.90% for Class C. Brokerage commissions, stamp duty fees, interest, taxes, acquired fund fees and expenses (if any) from funds in which the underlying affiliated master portfolios and funds invest and from money market funds, and extraordinary expenses are excluded from the expense cap. All other acquired fund fees and expenses from the affiliated master portfolios and funds are included in the expense cap. Prior to or after the commitment expiration date, the cap may be increased or the commitment to maintain the cap may be |
1
| terminated only with the approval of the Board of Trustees. |
Example of Expenses
The example below is intended to help you compare the costs of investing in the Fund with the costs of investing in other funds. The example assumes a $10,000 initial investment, 5% annual total return, and that fees and expenses remain the same as in the tables above. To the extent that the Manager is waiving fees or reimbursing expenses, the example assumes that such waiver or reimbursement will only be in place through the date noted above. Although your actual costs may be higher or lower, based on these assumptions, your costs would be:
|
Assuming Redemption at End of Period |
Assuming No Redemption |
|||
|
After: |
Class A |
Class C |
Class C |
|
|
1 Year |
$685 |
$293 |
$193 |
|
|
3 Years |
$941 |
$619 |
$619 |
|
|
5 Years |
$1,216 |
$1,072 |
$1,072 |
|
|
10 Years |
$1,998 |
$2,326 |
$2,326 |
|
Portfolio Turnover
The Fund pays transaction costs, such as commissions, when it buys and sells securities (or “turns over” its portfolio). A higher portfolio turnover rate may indicate higher transaction costs and may result in higher taxes when Fund shares are held in a taxable account. These costs, which are not reflected in annual fund operating expenses or in the example, affect the Fund’s performance. During the most recent fiscal year, the Fund’s portfolio turnover rate was 110% of the average value of its portfolio.
Principal Investment Strategies
We seek to achieve the Fund’s investment objective by allocating up to 50% of its assets to equity securities and up to 70% of its assets to fixed income securities.
The Fund’s “neutral” allocation is as follows:
| ■ | 60% of the Fund’s total assets in bond funds; and |
| ■ | 40% of the Fund’s total assets in stock funds. |
The Fund is a fund-of-funds that invests in various affiliated mutual funds (each, an “Underlying Fund”) employing a multi-asset, multi-style investment approach designed to reduce the price and return volatility of the Fund and to provide more consistent returns. The Fund’s broad diversification may help to reduce the overall impact of any one asset class underperforming, but may also limit upside potential. The Fund may invest in Allspring Master Portfolios, in other Allspring Funds, or directly in securities. We may adjust the Fund’s effective allocation throughout the year.
The fixed income portion of the Fund employs a variety of investment styles, intended in the aggregate to reduce price and return volatility, and deliver more consistent returns. The Fund’s fixed income portion may invest in U.S. investment grade bonds, below investment grade (high yield) bonds, inflation protected bonds, and foreign issues.
The equity portion of the Fund blends multiple investment styles in an attempt to reduce the risk associated with the use of a single style, which may move in and out of favor during the course of a market cycle. Equity holdings are diversified across U.S. large company, U.S. small company, international developed and emerging market stocks.
In addition, certain of the fixed income and equity master portfolios in which the Fund invests may employ a variety of derivative instruments such as futures, options and swap agreements. To the extent that one or more master portfolios is invested in such derivatives, the Fund will be exposed to the risks associated with such investments.
The Fund will incorporate a Tactical Asset Allocation (TAA) Overlay strategy which invests in long and/or short positions in exchange-traded futures contracts across a variety of asset classes, which include, but are not limited to, stocks, bonds, and currencies. The TAA Overlay strategy seeks to improve the Fund’s risk/return profile through the tactical use of futures contracts. The TAA Overlay uses qualitative and quantitative inputs to guide equity and fixed income exposures in the Fund. Dependent upon market conditions, the TAA Overlay may increase or decrease exposures to a given asset class.
As part of managing the Fund’s level of risk, both in absolute terms and relative to its benchmark, we may make changes to the allocations among investment styles at any time. We may use cash flows or effect transactions to accomplish these changes.
2
Portfolio Asset Allocation
The following table provides the Fund’s neutral allocation and target ranges.
|
Asset Class |
Neutral Allocation |
Range1 |
|
Bond Funds |
60% |
50% to 70% |
|
Stock Funds |
40% |
30% to 50% |
|
Tactical Asset Allocation Overlay (TAA) |
0% |
-10.0% to 10.0% |
| 1. | Negative values represent short positions in futures contracts that may be taken using the applicable overlay strategy. |
Principal Investment Risks
An investment in the Fund may lose money, is not a deposit of a bank or its affiliates, is not insured or guaranteed by the Federal Deposit Insurance Corporation or any other governmental agency, and is primarily subject to the risks briefly summarized below.
Market Risk. The values of, and/or the income generated by, securities held by the Fund may decline due to general market conditions or other factors, including those directly involving the issuers of such securities. Securities markets are volatile and may decline significantly in response to adverse issuer, regulatory, political, or economic developments. Different sectors of the market and different security types may react differently to such developments.
Debt Securities Risk. Debt securities are subject to credit risk and interest rate risk. Credit risk is the possibility that the issuer or guarantor of a debt security may be unable, or perceived to be unable, to pay interest or repay principal when they become due. In these instances, the value of an investment could decline and the Fund could lose money. Credit risk increases as an issuer’s credit quality or financial strength declines. Interest rate risk is the possibility that interest rates will change over time. When interest rates rise, the value of debt securities tends to fall. The longer the terms of the debt securities held by a Fund, the more the Fund is subject to this risk. If interest rates decline, interest that the Fund is able to earn on its investments in debt securities may also decline, which could cause the Fund to reduce the dividends it pays to shareholders, but the value of those securities may increase. Very low or negative interest rates may magnify interest rate risk.
Equity Securities Risk. The values of equity securities may experience periods of substantial price volatility and may decline significantly over short time periods. In general, the values of equity securities are more volatile than those of debt securities. Equity securities fluctuate in value and price in response to factors specific to the issuer of the security, such as management performance, financial condition, and market demand for the issuer’s products or services, as well as factors unrelated to the fundamental condition of the issuer, including general market, economic and political conditions. Different parts of a market, industry and sector may react differently to adverse issuer, market, regulatory, political, and economic developments.
Underlying Funds Risk. The risks associated with a Fund include the risks related to each Underlying Fund in which the Fund invests.
Derivatives Risk. The use of derivatives, such as futures, options and swap agreements, can lead to losses, including those magnified by leverage, particularly when derivatives are used to enhance return rather than mitigate risk. Certain derivative instruments may be difficult to sell when the portfolio manager believes it would be appropriate to do so, or the other party to a derivative contract may be unwilling or unable to fulfill its contractual obligations.
Emerging Markets Risk. Emerging market securities typically present even greater exposure to the risks described under “Foreign Investment Risk” and may be particularly sensitive to global economic conditions. Emerging market securities are also typically less liquid than securities of developed countries and could be difficult to sell, particularly during a market downturn.
Foreign Currency Contracts Risk. A Fund that enters into forwards or other foreign currency contracts, which are a type of derivative, is subject to the risk that the portfolio manager may be incorrect in his or her judgment of future exchange rate changes.
Foreign Investment Risk. Foreign investments may be subject to lower liquidity, greater price volatility and risks related to adverse political, regulatory, market or economic developments. Foreign investments may involve exposure to changes in foreign currency exchange rates and may be subject to higher withholding and other taxes.
Futures Contracts Risk. A Fund that uses futures contracts, which are a type of derivative, is subject to the risk of loss caused by unanticipated market movements. In addition, there may at times be an imperfect correlation between the movement in the prices of futures contracts and the value of their underlying instruments or indexes, and there may at times not be a liquid secondary market for certain futures contracts.
Growth/Value Investing Risk. Securities that exhibit growth or value characteristics tend to perform differently and shift into and out of favor with investors depending on changes in market and economic sentiment and conditions.
High Yield Securities Risk. High yield securities and unrated securities of similar credit quality (commonly known as
3
“junk bonds”) are considered speculative and have a much greater risk of default or of not returning principal and their values tend to be more volatile than higher-rated securities with similar maturities.
Management Risk. Investment decisions, techniques, analyses or models implemented by a Fund’s manager or sub-adviser in seeking to achieve the Fund’s investment objective may not produce expected returns, may cause the Fund’s shares to lose value or may cause the Fund to underperform other funds with similar investment objectives.
Mortgage- and Asset-Backed Securities Risk. Mortgage- and asset-backed securities may decline in value and become less liquid when defaults on the underlying mortgages or assets occur and may exhibit additional volatility in periods of rising interest rates. Rising interest rates tend to extend the duration of these securities, making them more sensitive to changes in interest rates than instruments with fixed payment schedules. When interest rates decline or are low, the prepayment of mortgages or assets underlying such securities can reduce a Fund’s returns.
Options Risk. A Fund that purchases options, which are a type of derivative, is subject to the risk of a loss of premiums without offsetting gains. A Fund that writes options receives a premium that may be small relative to the loss realized in the event of adverse changes in the value of the underlying instruments.
Smaller Company Securities Risk. Securities of companies with smaller market capitalizations tend to be more volatile and less liquid than those of larger companies.
Swaps Risk. Depending on their structure, swap agreements and options to enter into swap agreements (“swaptions”), both of which are types of derivatives, may increase or decrease a Fund’s exposure to long- or short-term interest rates, foreign currency values, mortgage-backed securities, corporate borrowing rates, or credit events or other reference points such as security prices or inflation rates.
U.S. Government Obligations Risk. U.S. Government obligations may be adversely impacted by changes in interest rates, and securities issued or guaranteed by U.S. Government agencies or government-sponsored entities may not be backed by the full faith and credit of the U.S. Government.
4
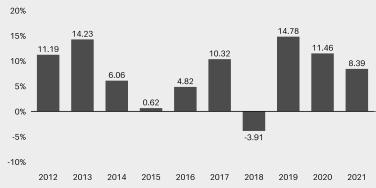
Performance
The following information provides some indication of the risks of investing in the Fund by showing changes in the Fund’s performance from year to year. The Fund’s average annual total returns are compared to the performance of one or more indices. Past performance before and after taxes is no guarantee of future results. Current month-end performance is available on the Fund’s website at www.allspringglobal.com.
|
Calendar Year Total Returns for Class A as of 12/31 each year |
||
|
. |
Highest Quarter: |
+10.54% |
|
Lowest Quarter: |
-9.49% |
|
|
Year-to-date total return as of June 30, 2022 is -13.32% |
||
|
Average Annual Total Returns for the periods ended 12/31/2021 (returns reflect applicable sales charges) |
||||
|
Inception Date of Share Class |
1 Year |
5 Year |
10 Year |
|
|
Class A (before taxes) |
1/30/2004 |
2.15% |
6.74% |
7.01% |
|
Class A (after taxes on distributions) |
1/30/2004 |
-1.26% |
4.22% |
5.29% |
|
Class A (after taxes on distributions and the sale of Fund Shares) |
1/30/2004 |
2.01% |
4.53% |
5.08% |
|
Class C (before taxes) |
1/30/2004 |
6.55% |
7.19% |
7.00% |
|
Moderate Balanced Blended Index (reflects no deduction for fees, expenses, or taxes)1 |
8.27% |
8.52% |
7.49% |
|
|
Bloomberg U.S. Aggregate Bond Index (reflects no deduction for fees, expenses, or taxes) |
-1.54% |
3.57% |
2.90% |
|
|
Bloomberg U.S. Short Treasury 9-12 Months Index (reflects no deduction for fees, expenses, or taxes) |
0.00% |
1.43% |
0.88% |
|
|
MSCI EAFE Index (Net) (reflects no deduction for fees, expenses, or taxes) |
11.26% |
9.55% |
8.03% |
|
|
Russell 1000® Growth Index (reflects no deduction for fees, expenses, or taxes) |
27.60% |
25.32% |
19.79% |
|
|
Russell 1000® Value Index (reflects no deduction for fees, expenses, or taxes) |
25.16% |
11.16% |
12.97% |
|
|
Russell 2000® Index (reflects no deduction for fees, expenses, or taxes) |
14.82% |
12.02% |
13.23% |
|
|
S&P 500 Index (reflects no deduction for fees, expenses, or taxes) |
28.71% |
18.47% |
16.55% |
|
| 1. | Source: Allspring Funds Management, LLC. The Moderate Balanced Blended Index is composed 45% of the Bloomberg U.S. Aggregate Bond Index, 15% of the Bloomberg U.S. Short Treasury 9-12 Months Index, 10% of the Russell 1000® Growth Index, 10% of the Russell 1000® Value Index, 10% of the S&P 500 Index, 6% of the MSCI EAFE Index (Net), and 4% of the Russell 2000® Index. You cannot invest directly in an index. |
5
After-tax returns are calculated using the historical highest individual federal marginal income tax rates and do not reflect the impact of state, local or foreign taxes. Actual after-tax returns depend on an investor’s tax situation and may differ from those shown, and after-tax returns shown are not relevant to tax-exempt investors or investors who hold their Fund shares through tax-deferred arrangements, such as 401(k) Plans or Individual Retirement Accounts. After-tax returns are shown for only one class of shares. After-tax returns for any other class will vary.
Fund Management
|
Manager |
Sub-Adviser |
Portfolio Manager, Title/Managed Since |
|
Allspring Funds Management, LLC |
Allspring Global Investments, LLC |
Kandarp R. Acharya, CFA, FRM, Portfolio Manager / 2013 |
Purchase and Sale of Fund Shares
In general, you can buy or sell shares of the Fund online or by mail, phone or wire on any day the New York Stock Exchange is open for regular trading. You also may buy and sell shares through a financial professional.
|
Minimum Investments |
To Buy or Sell Shares |
|
Minimum Initial Investment |
Mail: Allspring Funds |
Tax Information
Any distributions you receive from the Fund may be taxable as ordinary income or capital gains, except when your investment is in an IRA, 401(k) or other tax-advantaged investment plan. However, subsequent withdrawals from such a tax-advantaged investment plan may be subject to federal income tax. You should consult your tax adviser about your specific tax situation.
Payments to Intermediaries
If you purchase a Fund through an intermediary, the Fund and its related companies may pay the intermediary for the sale of Fund shares and related services. These payments may create a conflict of interest by influencing the intermediary and your financial professional to recommend the Fund over another investment. Consult your financial professional or visit your intermediary’s website for more information.
|
Link to Prospectus |
Link to SAI |
|
. |
©2022 Allspring Global Investments Holdings, LLC. All rights reserved. |

6
|
. |
Summary Prospectus |

Allspring Moderate Balanced Fund
|
Class/Ticker: Administrator Class - NVMBX |
Link to Prospectus |
Link to SAI |
Before you invest, you may want to review the Fund’s prospectus, which contains more information about the Fund and its risks. You can find the Fund’s prospectus, reports to shareholders and other information about the Fund online at allspringglobal.com/reports. You can also get information at no cost by calling 1-800-222-8222, or by sending an email request to [email protected]. The current prospectus (“Prospectus”) and statement of additional information (“SAI”), dated October 1, 2022, as supplemented from time to time, are incorporated by reference into this summary prospectus. The Fund’s SAI may be obtained, free of charge, in the same manner as the Prospectus.
Investment Objective
The Fund seeks total return, consisting of current income and capital appreciation.
Fees and Expenses
These tables are intended to help you understand the various costs and expenses you will pay if you buy, hold and sell shares of the Fund.
|
Shareholder Fees (fees paid directly from your investment) |
|
|
Maximum sales charge (load) imposed on purchases (as a percentage of offering price) |
None |
|
Maximum deferred sales charge (load) (as a percentage of offering price) |
None |
|
Annual Fund Operating Expenses (expenses that you pay each year as a percentage of the value of your investment)1 |
|
|
Management Fees |
0.30% |
|
Distribution (12b-1) Fees |
0.00% |
|
Other Expenses |
0.49% |
|
Acquired Fund Fees and Expenses |
0.39% |
|
Total Annual Fund Operating Expenses |
1.18% |
|
Fee Waivers |
(0.28)% |
|
Total Annual Fund Operating Expenses After Fee Waiver2 |
0.90% |
| 1. | Expenses have been adjusted as necessary from amounts incurred during the Fund’s most recent fiscal year to reflect current fees and expenses. |
| 2. | The Manager has contractually committed through September 30, 2023, to waive fees and/or reimburse expenses to the extent necessary to cap Total Annual Fund Operating Expenses After Fee Waivers at 0.90% for Administrator Class. Brokerage commissions, stamp duty fees, interest, taxes, acquired fund fees and expenses (if any) from funds in which the underlying affiliated master portfolios and funds invest and from money market funds, and extraordinary expenses are excluded from the expense cap. All other acquired fund fees and expenses from the affiliated master portfolios and funds are included in the expense cap. Prior to or after the commitment expiration date, the cap may be increased or the commitment to maintain the cap may be terminated only with the approval of the Board of Trustees. |
Example of Expenses
The example below is intended to help you compare the costs of investing in the Fund with the costs of investing in other funds. The example assumes a $10,000 initial investment, 5% annual total return, and that fees and expenses remain the same as in the tables above. To the extent that the Manager is waiving fees or reimbursing expenses, the example assumes that such waiver or reimbursement will only be in place through the date noted above. Although your actual costs may be higher or lower, based on these assumptions, your costs would be:
1
|
After: |
|
|
1 Year |
$92 |
|
3 Years |
$346 |
|
5 Years |
$621 |
|
10 Years |
$1,404 |
Portfolio Turnover
The Fund pays transaction costs, such as commissions, when it buys and sells securities (or “turns over” its portfolio). A higher portfolio turnover rate may indicate higher transaction costs and may result in higher taxes when Fund shares are held in a taxable account. These costs, which are not reflected in annual fund operating expenses or in the example, affect the Fund’s performance. During the most recent fiscal year, the Fund’s portfolio turnover rate was 110% of the average value of its portfolio.
Principal Investment Strategies
We seek to achieve the Fund’s investment objective by allocating up to 50% of its assets to equity securities and up to 70% of its assets to fixed income securities.
The Fund’s “neutral” allocation is as follows:
| ■ | 60% of the Fund’s total assets in bond funds; and |
| ■ | 40% of the Fund’s total assets in stock funds. |
The Fund is a fund-of-funds that invests in various affiliated mutual funds (each, an “Underlying Fund”) employing a multi-asset, multi-style investment approach designed to reduce the price and return volatility of the Fund and to provide more consistent returns. The Fund’s broad diversification may help to reduce the overall impact of any one asset class underperforming, but may also limit upside potential. The Fund may invest in Allspring Master Portfolios, in other Allspring Funds, or directly in securities. We may adjust the Fund’s effective allocation throughout the year.
The fixed income portion of the Fund employs a variety of investment styles, intended in the aggregate to reduce price and return volatility, and deliver more consistent returns. The Fund’s fixed income portion may invest in U.S. investment grade bonds, below investment grade (high yield) bonds, inflation protected bonds, and foreign issues.
The equity portion of the Fund blends multiple investment styles in an attempt to reduce the risk associated with the use of a single style, which may move in and out of favor during the course of a market cycle. Equity holdings are diversified across U.S. large company, U.S. small company, international developed and emerging market stocks.
In addition, certain of the fixed income and equity master portfolios in which the Fund invests may employ a variety of derivative instruments such as futures, options and swap agreements. To the extent that one or more master portfolios is invested in such derivatives, the Fund will be exposed to the risks associated with such investments.
The Fund will incorporate a Tactical Asset Allocation (TAA) Overlay strategy which invests in long and/or short positions in exchange-traded futures contracts across a variety of asset classes, which include, but are not limited to, stocks, bonds, and currencies. The TAA Overlay strategy seeks to improve the Fund’s risk/return profile through the tactical use of futures contracts. The TAA Overlay uses qualitative and quantitative inputs to guide equity and fixed income exposures in the Fund. Dependent upon market conditions, the TAA Overlay may increase or decrease exposures to a given asset class.
As part of managing the Fund’s level of risk, both in absolute terms and relative to its benchmark, we may make changes to the allocations among investment styles at any time. We may use cash flows or effect transactions to accomplish these changes.
Portfolio Asset Allocation
The following table provides the Fund’s neutral allocation and target ranges.
|
Asset Class |
Neutral Allocation |
Range1 |
|
Bond Funds |
60% |
50% to 70% |
|
Stock Funds |
40% |
30% to 50% |
|
Tactical Asset Allocation Overlay (TAA) |
0% |
-10.0% to 10.0% |
| 1. | Negative values represent short positions in futures contracts that may be taken using the applicable overlay strategy. |
2
Principal Investment Risks
An investment in the Fund may lose money, is not a deposit of a bank or its affiliates, is not insured or guaranteed by the Federal Deposit Insurance Corporation or any other governmental agency, and is primarily subject to the risks briefly summarized below.
Market Risk. The values of, and/or the income generated by, securities held by the Fund may decline due to general market conditions or other factors, including those directly involving the issuers of such securities. Securities markets are volatile and may decline significantly in response to adverse issuer, regulatory, political, or economic developments. Different sectors of the market and different security types may react differently to such developments.
Debt Securities Risk. Debt securities are subject to credit risk and interest rate risk. Credit risk is the possibility that the issuer or guarantor of a debt security may be unable, or perceived to be unable, to pay interest or repay principal when they become due. In these instances, the value of an investment could decline and the Fund could lose money. Credit risk increases as an issuer’s credit quality or financial strength declines. Interest rate risk is the possibility that interest rates will change over time. When interest rates rise, the value of debt securities tends to fall. The longer the terms of the debt securities held by a Fund, the more the Fund is subject to this risk. If interest rates decline, interest that the Fund is able to earn on its investments in debt securities may also decline, which could cause the Fund to reduce the dividends it pays to shareholders, but the value of those securities may increase. Very low or negative interest rates may magnify interest rate risk.
Equity Securities Risk. The values of equity securities may experience periods of substantial price volatility and may decline significantly over short time periods. In general, the values of equity securities are more volatile than those of debt securities. Equity securities fluctuate in value and price in response to factors specific to the issuer of the security, such as management performance, financial condition, and market demand for the issuer’s products or services, as well as factors unrelated to the fundamental condition of the issuer, including general market, economic and political conditions. Different parts of a market, industry and sector may react differently to adverse issuer, market, regulatory, political, and economic developments.
Underlying Funds Risk. The risks associated with a Fund include the risks related to each Underlying Fund in which the Fund invests.
Derivatives Risk. The use of derivatives, such as futures, options and swap agreements, can lead to losses, including those magnified by leverage, particularly when derivatives are used to enhance return rather than mitigate risk. Certain derivative instruments may be difficult to sell when the portfolio manager believes it would be appropriate to do so, or the other party to a derivative contract may be unwilling or unable to fulfill its contractual obligations.
Emerging Markets Risk. Emerging market securities typically present even greater exposure to the risks described under “Foreign Investment Risk” and may be particularly sensitive to global economic conditions. Emerging market securities are also typically less liquid than securities of developed countries and could be difficult to sell, particularly during a market downturn.
Foreign Currency Contracts Risk. A Fund that enters into forwards or other foreign currency contracts, which are a type of derivative, is subject to the risk that the portfolio manager may be incorrect in his or her judgment of future exchange rate changes.
Foreign Investment Risk. Foreign investments may be subject to lower liquidity, greater price volatility and risks related to adverse political, regulatory, market or economic developments. Foreign investments may involve exposure to changes in foreign currency exchange rates and may be subject to higher withholding and other taxes.
Futures Contracts Risk. A Fund that uses futures contracts, which are a type of derivative, is subject to the risk of loss caused by unanticipated market movements. In addition, there may at times be an imperfect correlation between the movement in the prices of futures contracts and the value of their underlying instruments or indexes, and there may at times not be a liquid secondary market for certain futures contracts.
Growth/Value Investing Risk. Securities that exhibit growth or value characteristics tend to perform differently and shift into and out of favor with investors depending on changes in market and economic sentiment and conditions.
High Yield Securities Risk. High yield securities and unrated securities of similar credit quality (commonly known as “junk bonds”) are considered speculative and have a much greater risk of default or of not returning principal and their values tend to be more volatile than higher-rated securities with similar maturities.
Management Risk. Investment decisions, techniques, analyses or models implemented by a Fund’s manager or sub-adviser in seeking to achieve the Fund’s investment objective may not produce expected returns, may cause the Fund’s shares to lose value or may cause the Fund to underperform other funds with similar investment objectives.
Mortgage- and Asset-Backed Securities Risk. Mortgage- and asset-backed securities may decline in value and become less liquid when defaults on the underlying mortgages or assets occur and may exhibit additional volatility in periods of rising interest rates. Rising interest rates tend to extend the duration of these securities, making them more sensitive to changes in interest rates than instruments with fixed payment schedules. When interest rates decline or are low, the prepayment of mortgages or assets underlying such securities can reduce a Fund’s returns.
3
Options Risk. A Fund that purchases options, which are a type of derivative, is subject to the risk of a loss of premiums without offsetting gains. A Fund that writes options receives a premium that may be small relative to the loss realized in the event of adverse changes in the value of the underlying instruments.
Smaller Company Securities Risk. Securities of companies with smaller market capitalizations tend to be more volatile and less liquid than those of larger companies.
Swaps Risk. Depending on their structure, swap agreements and options to enter into swap agreements (“swaptions”), both of which are types of derivatives, may increase or decrease a Fund’s exposure to long- or short-term interest rates, foreign currency values, mortgage-backed securities, corporate borrowing rates, or credit events or other reference points such as security prices or inflation rates.
U.S. Government Obligations Risk. U.S. Government obligations may be adversely impacted by changes in interest rates, and securities issued or guaranteed by U.S. Government agencies or government-sponsored entities may not be backed by the full faith and credit of the U.S. Government.
4
Performance
The following information provides some indication of the risks of investing in the Fund by showing changes in the Fund’s performance from year to year. The Fund’s average annual total returns are compared to the performance of one or more indices. Past performance before and after taxes is no guarantee of future results. Current month-end performance is available on the Fund’s website at www.allspringglobal.com.
|
Calendar Year Total Returns for Administrator Class as of 12/31 each year |
||
|
. |
Highest Quarter: |
+10.64% |
|
Lowest Quarter: |
-9.49% |
|
|
Year-to-date total return as of June 30, 2022 is -13.20% |
||

|
Average Annual Total Returns for the periods ended 12/31/2021 |
||||
|
Inception Date of Share Class |
1 Year |
5 Year |
10 Year |
|
|
Administrator Class (before taxes) |
11/11/1994 |
8.67% |
8.28% |
7.91% |
|
Administrator Class (after taxes on distributions) |
11/11/1994 |
4.98% |
5.66% |
6.10% |
|
Administrator Class (after taxes on distributions and the sale of Fund Shares) |
11/11/1994 |
5.90% |
5.72% |
5.80% |
|
Moderate Balanced Blended Index (reflects no deduction for fees, expenses, or taxes)1 |
8.27% |
8.52% |
7.49% |
|
|
Bloomberg U.S. Aggregate Bond Index (reflects no deduction for fees, expenses, or taxes) |
-1.54% |
3.57% |
2.90% |
|
|
Bloomberg U.S. Short Treasury 9-12 Months Index (reflects no deduction for fees, expenses, or taxes) |
0.00% |
1.43% |
0.88% |
|
|
MSCI EAFE Index (Net) (reflects no deduction for fees, expenses, or taxes) |
11.26% |
9.55% |
8.03% |
|
|
Russell 1000® Growth Index (reflects no deduction for fees, expenses, or taxes) |
27.60% |
25.32% |
19.79% |
|
|
Russell 1000® Value Index (reflects no deduction for fees, expenses, or taxes) |
25.16% |
11.16% |
12.97% |
|
|
Russell 2000® Index (reflects no deduction for fees, expenses, or taxes) |
14.82% |
12.02% |
13.23% |
|
|
S&P 500 Index (reflects no deduction for fees, expenses, or taxes) |
28.71% |
18.47% |
16.55% |
|
| 1. | Source: Allspring Funds Management, LLC. The Moderate Balanced Blended Index is composed 45% of the Bloomberg U.S. Aggregate Bond Index, 15% of the Bloomberg U.S. Short Treasury 9-12 Months Index, 10% of the Russell 1000® Growth Index, 10% of the Russell 1000® Value Index, 10% of the S&P 500 Index, 6% of the MSCI EAFE Index (Net), and 4% of the Russell 2000® Index. You cannot invest directly in an index. |
After-tax returns are calculated using the historical highest individual federal marginal income tax rates and do not reflect the impact of state, local or foreign taxes. Actual after-tax returns depend on an investor’s tax situation and may differ from those shown, and after-tax returns shown are not relevant to tax-exempt investors or investors who hold their Fund shares through tax-deferred arrangements, such as 401(k) Plans or Individual Retirement Accounts.
5
Fund Management
|
Manager |
Sub-Adviser |
Portfolio Manager, Title/Managed Since |
|
Allspring Funds Management, LLC |
Allspring Global Investments, LLC |
Kandarp R. Acharya, CFA, FRM, Portfolio Manager / 2013 |
Purchase and Sale of Fund Shares
Administrator Class shares are generally available through intermediaries for the accounts of their customers and directly to institutional investors and individuals. Institutional investors may include corporations; private banks and trust companies; endowments and foundations; defined contribution, defined benefit and other employer sponsored retirement plans; institutional retirement plan platforms; insurance companies; registered investment advisor firms; bank trusts; 529 college savings plans; family offices; and funds of funds, including those managed by Allspring Funds Management. In general, you can buy or sell shares of the Fund online or by mail, phone or wire, on any day the New York Stock Exchange (“NYSE”) is open for regular trading. You also may buy and sell shares through a financial professional.
|
Minimum Investments |
To Buy or Sell Shares |
|
Minimum Initial Investment |
Mail: Allspring Funds |
Tax Information
Any distributions you receive from the Fund may be taxable as ordinary income or capital gains, except when your investment is in an IRA, 401(k) or other tax-advantaged investment plan. However, subsequent withdrawals from such a tax-advantaged investment plan may be subject to federal income tax. You should consult your tax adviser about your specific tax situation.
Payments to Intermediaries
If you purchase a Fund through an intermediary, the Fund and its related companies may pay the intermediary for the sale of Fund shares and related services. These payments may create a conflict of interest by influencing the intermediary and your financial professional to recommend the Fund over another investment. Consult your financial professional or visit your intermediary’s website for more information.
|
Link to Prospectus |
Link to SAI |
|
. |
©2022 Allspring Global Investments Holdings, LLC. All rights reserved. |

6
|
. |
Summary Prospectus |

Allspring Moderate Balanced Fund
|
Class/Ticker: Institutional Class - WFMYX |
Link to Prospectus |
Link to SAI |
Before you invest, you may want to review the Fund’s prospectus, which contains more information about the Fund and its risks. You can find the Fund’s prospectus, reports to shareholders and other information about the Fund online at allspringglobal.com/reports. You can also get information at no cost by calling 1-800-222-8222, or by sending an email request to [email protected]. The current prospectus (“Prospectus”) and statement of additional information (“SAI”), dated October 1, 2022, as supplemented from time to time, are incorporated by reference into this summary prospectus. The Fund’s SAI may be obtained, free of charge, in the same manner as the Prospectus.
Investment Objective
The Fund seeks total return, consisting of current income and capital appreciation.
Fees and Expenses
These tables are intended to help you understand the various costs and expenses you will pay if you buy, hold and sell shares of the Fund.
|
Shareholder Fees (fees paid directly from your investment) |
|
|
Maximum sales charge (load) imposed on purchases (as a percentage of offering price) |
None |
|
Maximum deferred sales charge (load) (as a percentage of offering price) |
None |
|
Annual Fund Operating Expenses (expenses that you pay each year as a percentage of the value of your investment)1 |
|
|
Management Fees |
0.30% |
|
Distribution (12b-1) Fees |
0.00% |
|
Other Expenses |
0.24% |
|
Acquired Fund Fees and Expenses |
0.39% |
|
Total Annual Fund Operating Expenses |
0.93% |
|
Fee Waivers |
(0.13)% |
|
Total Annual Fund Operating Expenses After Fee Waiver2 |
0.80% |
| 1. | Expenses have been adjusted as necessary from amounts incurred during the Fund’s most recent fiscal year to reflect current fees and expenses. |
| 2. | The Manager has contractually committed through September 30, 2023, to waive fees and/or reimburse expenses to the extent necessary to cap Total Annual Fund Operating Expenses After Fee Waivers at 0.80% for Institutional Class. Brokerage commissions, stamp duty fees, interest, taxes, acquired fund fees and expenses (if any) from funds in which the underlying affiliated master portfolios and funds invest and from money market funds, and extraordinary expenses are excluded from the expense cap. All other acquired fund fees and expenses from the affiliated master portfolios and funds are included in the expense cap. Prior to or after the commitment expiration date, the cap may be increased or the commitment to maintain the cap may be terminated only with the approval of the Board of Trustees. |
Example of Expenses
The example below is intended to help you compare the costs of investing in the Fund with the costs of investing in other funds. The example assumes a $10,000 initial investment, 5% annual total return, and that fees and expenses remain the same as in the tables above. To the extent that the Manager is waiving fees or reimbursing expenses, the example assumes that such waiver or reimbursement will only be in place through the date noted above. Although your actual costs may be higher or lower, based on these assumptions, your costs would be:
1
|
After: |
|
|
1 Year |
$82 |
|
3 Years |
$283 |
|
5 Years |
$501 |
|
10 Years |
$1,128 |
Portfolio Turnover
The Fund pays transaction costs, such as commissions, when it buys and sells securities (or “turns over” its portfolio). A higher portfolio turnover rate may indicate higher transaction costs and may result in higher taxes when Fund shares are held in a taxable account. These costs, which are not reflected in annual fund operating expenses or in the example, affect the Fund’s performance. During the most recent fiscal year, the Fund’s portfolio turnover rate was 110% of the average value of its portfolio.
Principal Investment Strategies
We seek to achieve the Fund’s investment objective by allocating up to 50% of its assets to equity securities and up to 70% of its assets to fixed income securities.
The Fund’s “neutral” allocation is as follows:
| ■ | 60% of the Fund’s total assets in bond funds; and |
| ■ | 40% of the Fund’s total assets in stock funds. |
The Fund is a fund-of-funds that invests in various affiliated mutual funds (each, an “Underlying Fund”) employing a multi-asset, multi-style investment approach designed to reduce the price and return volatility of the Fund and to provide more consistent returns. The Fund’s broad diversification may help to reduce the overall impact of any one asset class underperforming, but may also limit upside potential. The Fund may invest in Allspring Master Portfolios, in other Allspring Funds, or directly in securities. We may adjust the Fund’s effective allocation throughout the year.
The fixed income portion of the Fund employs a variety of investment styles, intended in the aggregate to reduce price and return volatility, and deliver more consistent returns. The Fund’s fixed income portion may invest in U.S. investment grade bonds, below investment grade (high yield) bonds, inflation protected bonds, and foreign issues.
The equity portion of the Fund blends multiple investment styles in an attempt to reduce the risk associated with the use of a single style, which may move in and out of favor during the course of a market cycle. Equity holdings are diversified across U.S. large company, U.S. small company, international developed and emerging market stocks.
In addition, certain of the fixed income and equity master portfolios in which the Fund invests may employ a variety of derivative instruments such as futures, options and swap agreements. To the extent that one or more master portfolios is invested in such derivatives, the Fund will be exposed to the risks associated with such investments.
The Fund will incorporate a Tactical Asset Allocation (TAA) Overlay strategy which invests in long and/or short positions in exchange-traded futures contracts across a variety of asset classes, which include, but are not limited to, stocks, bonds, and currencies. The TAA Overlay strategy seeks to improve the Fund’s risk/return profile through the tactical use of futures contracts. The TAA Overlay uses qualitative and quantitative inputs to guide equity and fixed income exposures in the Fund. Dependent upon market conditions, the TAA Overlay may increase or decrease exposures to a given asset class.
As part of managing the Fund’s level of risk, both in absolute terms and relative to its benchmark, we may make changes to the allocations among investment styles at any time. We may use cash flows or effect transactions to accomplish these changes.
Portfolio Asset Allocation
The following table provides the Fund’s neutral allocation and target ranges.
|
Asset Class |
Neutral Allocation |
Range1 |
|
Bond Funds |
60% |
50% to 70% |
|
Stock Funds |
40% |
30% to 50% |
|
Tactical Asset Allocation Overlay (TAA) |
0% |
-10.0% to 10.0% |
| 1. | Negative values represent short positions in futures contracts that may be taken using the applicable overlay strategy. |
2
Principal Investment Risks
An investment in the Fund may lose money, is not a deposit of a bank or its affiliates, is not insured or guaranteed by the Federal Deposit Insurance Corporation or any other governmental agency, and is primarily subject to the risks briefly summarized below.
Market Risk. The values of, and/or the income generated by, securities held by the Fund may decline due to general market conditions or other factors, including those directly involving the issuers of such securities. Securities markets are volatile and may decline significantly in response to adverse issuer, regulatory, political, or economic developments. Different sectors of the market and different security types may react differently to such developments.
Debt Securities Risk. Debt securities are subject to credit risk and interest rate risk. Credit risk is the possibility that the issuer or guarantor of a debt security may be unable, or perceived to be unable, to pay interest or repay principal when they become due. In these instances, the value of an investment could decline and the Fund could lose money. Credit risk increases as an issuer’s credit quality or financial strength declines. Interest rate risk is the possibility that interest rates will change over time. When interest rates rise, the value of debt securities tends to fall. The longer the terms of the debt securities held by a Fund, the more the Fund is subject to this risk. If interest rates decline, interest that the Fund is able to earn on its investments in debt securities may also decline, which could cause the Fund to reduce the dividends it pays to shareholders, but the value of those securities may increase. Very low or negative interest rates may magnify interest rate risk.
Equity Securities Risk. The values of equity securities may experience periods of substantial price volatility and may decline significantly over short time periods. In general, the values of equity securities are more volatile than those of debt securities. Equity securities fluctuate in value and price in response to factors specific to the issuer of the security, such as management performance, financial condition, and market demand for the issuer’s products or services, as well as factors unrelated to the fundamental condition of the issuer, including general market, economic and political conditions. Different parts of a market, industry and sector may react differently to adverse issuer, market, regulatory, political, and economic developments.
Underlying Funds Risk. The risks associated with a Fund include the risks related to each Underlying Fund in which the Fund invests.
Derivatives Risk. The use of derivatives, such as futures, options and swap agreements, can lead to losses, including those magnified by leverage, particularly when derivatives are used to enhance return rather than mitigate risk. Certain derivative instruments may be difficult to sell when the portfolio manager believes it would be appropriate to do so, or the other party to a derivative contract may be unwilling or unable to fulfill its contractual obligations.
Emerging Markets Risk. Emerging market securities typically present even greater exposure to the risks described under “Foreign Investment Risk” and may be particularly sensitive to global economic conditions. Emerging market securities are also typically less liquid than securities of developed countries and could be difficult to sell, particularly during a market downturn.
Foreign Currency Contracts Risk. A Fund that enters into forwards or other foreign currency contracts, which are a type of derivative, is subject to the risk that the portfolio manager may be incorrect in his or her judgment of future exchange rate changes.
Foreign Investment Risk. Foreign investments may be subject to lower liquidity, greater price volatility and risks related to adverse political, regulatory, market or economic developments. Foreign investments may involve exposure to changes in foreign currency exchange rates and may be subject to higher withholding and other taxes.
Futures Contracts Risk. A Fund that uses futures contracts, which are a type of derivative, is subject to the risk of loss caused by unanticipated market movements. In addition, there may at times be an imperfect correlation between the movement in the prices of futures contracts and the value of their underlying instruments or indexes, and there may at times not be a liquid secondary market for certain futures contracts.
Growth/Value Investing Risk. Securities that exhibit growth or value characteristics tend to perform differently and shift into and out of favor with investors depending on changes in market and economic sentiment and conditions.
High Yield Securities Risk. High yield securities and unrated securities of similar credit quality (commonly known as “junk bonds”) are considered speculative and have a much greater risk of default or of not returning principal and their values tend to be more volatile than higher-rated securities with similar maturities.
Management Risk. Investment decisions, techniques, analyses or models implemented by a Fund’s manager or sub-adviser in seeking to achieve the Fund’s investment objective may not produce expected returns, may cause the Fund’s shares to lose value or may cause the Fund to underperform other funds with similar investment objectives.
Mortgage- and Asset-Backed Securities Risk. Mortgage- and asset-backed securities may decline in value and become less liquid when defaults on the underlying mortgages or assets occur and may exhibit additional volatility in periods of rising interest rates. Rising interest rates tend to extend the duration of these securities, making them more sensitive to changes in interest rates than instruments with fixed payment schedules. When interest rates decline or are low, the prepayment of mortgages or assets underlying such securities can reduce a Fund’s returns.
3
Options Risk. A Fund that purchases options, which are a type of derivative, is subject to the risk of a loss of premiums without offsetting gains. A Fund that writes options receives a premium that may be small relative to the loss realized in the event of adverse changes in the value of the underlying instruments.
Smaller Company Securities Risk. Securities of companies with smaller market capitalizations tend to be more volatile and less liquid than those of larger companies.
Swaps Risk. Depending on their structure, swap agreements and options to enter into swap agreements (“swaptions”), both of which are types of derivatives, may increase or decrease a Fund’s exposure to long- or short-term interest rates, foreign currency values, mortgage-backed securities, corporate borrowing rates, or credit events or other reference points such as security prices or inflation rates.
U.S. Government Obligations Risk. U.S. Government obligations may be adversely impacted by changes in interest rates, and securities issued or guaranteed by U.S. Government agencies or government-sponsored entities may not be backed by the full faith and credit of the U.S. Government.
4
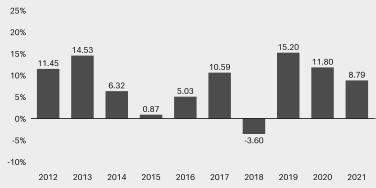
Performance
The following information provides some indication of the risks of investing in the Fund by showing changes in the Fund’s performance from year to year. The Fund’s average annual total returns are compared to the performance of one or more indices. Past performance before and after taxes is no guarantee of future results. Current month-end performance is available on the Fund’s website at www.allspringglobal.com.
|
Calendar Year Total Returns for Institutional Class as of 12/31 each year1 |
||
|
. |
Highest Quarter: |
+10.61% |
|
Lowest Quarter: |
-9.43% |
|
|
Year-to-date total return as of June 30, 2022 is -13.17% |
||
|
Average Annual Total Returns for the periods ended 12/31/20211 |
||||
|
Inception Date of Share Class |
1 Year |
5 Year |
10 Year |
|
|
Institutional Class (before taxes) |
7/31/2018 |
8.79% |
8.36% |
7.94% |
|
Institutional Class (after taxes on distributions) |
7/31/2018 |
5.07% |
5.72% |
6.13% |
|
Institutional Class (after taxes on distributions and the sale of Fund Shares) |
7/31/2018 |
5.98% |
5.77% |
5.83% |
|
Moderate Balanced Blended Index (reflects no deduction for fees, expenses, or taxes)2 |
8.27% |
8.52% |
7.49% |
|
|
Bloomberg U.S. Aggregate Bond Index (reflects no deduction for fees, expenses, or taxes) |
-1.54% |
3.57% |
2.90% |
|
|
Bloomberg U.S. Short Treasury 9-12 Months Index (reflects no deduction for fees, expenses, or taxes) |
0.00% |
1.43% |
0.88% |
|
|
MSCI EAFE Index (Net) (reflects no deduction for fees, expenses, or taxes) |
11.26% |
9.55% |
8.03% |
|
|
Russell 1000® Growth Index (reflects no deduction for fees, expenses, or taxes) |
27.60% |
25.32% |
19.79% |
|
|
Russell 1000® Value Index (reflects no deduction for fees, expenses, or taxes) |
25.16% |
11.16% |
12.97% |
|
|
Russell 2000® Index (reflects no deduction for fees, expenses, or taxes) |
14.82% |
12.02% |
13.23% |
|
|
S&P 500 Index (reflects no deduction for fees, expenses, or taxes) |
28.71% |
18.47% |
16.55% |
|
| 1. | Historical performance shown for the Institutional Class shares prior to their inception reflects the performance of the Administrator Class shares, and includes the higher expenses applicable to the Administrator Class shares. If these expenses had not been included, returns for the Institutional Class shares would be higher. |
| 2. | Source: Allspring Funds Management, LLC. The Moderate Balanced Blended Index is composed 45% of the Bloomberg U.S. Aggregate Bond Index, 15% of the Bloomberg U.S. Short Treasury 9-12 Months Index, 10% of the Russell 1000® Growth Index, 10% of the Russell 1000® Value Index, 10% of the S&P 500 Index, 6% of the MSCI EAFE Index (Net), and 4% of the Russell 2000® Index. You cannot invest directly in an index. |
After-tax returns are calculated using the historical highest individual federal marginal income tax rates and do not reflect the impact of state, local or foreign taxes. Actual after-tax returns depend on an investor’s tax situation and may
5
differ from those shown, and after-tax returns shown are not relevant to tax-exempt investors or investors who hold their Fund shares through tax-deferred arrangements, such as 401(k) Plans or Individual Retirement Accounts.
Fund Management
|
Manager |
Sub-Adviser |
Portfolio Manager, Title/Managed Since |
|
Allspring Funds Management, LLC |
Allspring Global Investments, LLC |
Kandarp R. Acharya, CFA, FRM, Portfolio Manager / 2013 |
Institutional Class shares are generally available through intermediaries for the accounts of their customers and directly to institutional investors and individuals. Institutional investors may include corporations; private banks and trust companies; endowments and foundations; defined contribution, defined benefit and other employer sponsored retirement plans; institutional retirement plan platforms; insurance companies; registered investment advisor firms; bank trusts; 529 college savings plans; family offices; and funds of funds, including those managed by Allspring Funds Management. In general, you can buy or sell shares of the Fund online or by mail, phone or wire, on any day the New York Stock Exchange (“NYSE”) is open for regular trading. You also may buy and sell shares through a financial professional.
Purchase and Sale of Fund Shares
|
Minimum Investments |
To Buy or Sell Shares |
|
Minimum Initial Investment |
Mail: Allspring Funds |
Tax Information
Any distributions you receive from the Fund may be taxable as ordinary income or capital gains, except when your investment is in an IRA, 401(k) or other tax-advantaged investment plan. However, subsequent withdrawals from such a tax-advantaged investment plan may be subject to federal income tax. You should consult your tax adviser about your specific tax situation.
Payments to Broker-Dealers and Other Financial Intermediaries
If you purchase a Fund through an intermediary, the Fund and its related companies may pay the intermediary for the sale of Fund shares and related services. These payments may create a conflict of interest by influencing the intermediary and your financial professional to recommend the Fund over another investment. Consult your financial professional or visit your intermediary’s website for more information.
|
Link to Prospectus |
Link to SAI |
|
. |
©2022 Allspring Global Investments Holdings, LLC. All rights reserved. |

6
Serious News for Serious Traders! Try StreetInsider.com Premium Free!
You May Also Be Interested In
- Nutriband Inc. (NASDAQ: NTRB) Advances Abuse Deterrent Tech Addressing Fentanyl Epidemic
- Midday movers: PepsiCo, JetBlue fall; GM, Danaher and UPS rise
- TOKEN2049 Dubai Hailed as an Outstanding Success, with 10,000 Attendees
Create E-mail Alert Related Categories
SEC FilingsSign up for StreetInsider Free!
Receive full access to all new and archived articles, unlimited portfolio tracking, e-mail alerts, custom newswires and RSS feeds - and more!
