

Form 497AD AETOS LONG/SHORT STRATEG
 Tweet
Tweet Share
Share
Aetos At-A-Glance Founded 2001 Leadership Anne Casscells Co-President & Chief Investment
Officer Michael Klein Co-President & Chief Risk Officer Locations New York, New York Menlo Park, California fund HIGHLIGHTS Inception September 1, 2002 Diversification # of Managers2: 17 # of Sub-Strategies: 4 Beta to Market
Indices1,3 US Aggregate Bond Index: 0.13 MSCI ACWI: 0.28 Geography Global AETOS FUND INFORMATION Aetos SEC-Registered 1940 Act Commingled Hedge Fund of Funds Long/Short Strategies Fund Multi-Strategy Arbitrage Fund Distressed
Investment Strategies Fund Performance and Statistics (since inception through October 31, 2022)1 Firm Overview Aetos Alternatives Management, LP (“Aetos”) is an independent firm that manages assets on behalf of institutional clients. Since
the firm’s inception, Aetos has been a leader in constructing fully customized hedge fund solutions for a broad range of institutional clients. Hedge fund solutions are offered primarily through 1) customized separate accounts and 2) commingled
fund portfolios invested in strategy-specific Aetos 1940 Act SEC-registered funds. FUND Overview The Aetos Long/Short Strategies Fund is an SEC-registered 1940 Act Commingled Hedge Fund of Funds. The Fund allocates its assets among a select
group of managers across a variety of long/short strategies designed to produce an attractive risk-adjusted return, largely independent of the benchmarks associated with traditional asset classes. The Fund is intended to be a vehicle by which
investors can access a portfolio of high-quality long/short strategies, constructed and monitored using disciplined processes. Historical Performance (since inception)1 Aetos Long/Short Strategies Fund 1 Data as of October 31, 2022. The
Aetos Long/Short Strategies Fund (the “Fund”) is an SEC-registered 1940 Act closed-end fund that is a component of Aetos’ commingled diversified absolute return investment asset allocation models. This information is being provided to
prospective investors that have expressed an interest in seeing the investment performance of one or more of the individual Aetos Funds in the models. The Fund returns do not represent the returns of the models as a whole or of any specific
client account. The performance figures shown are net of assumed investment advisory and performance fees of 0.75% of assets annually and 5% of profits above the three-month Treasury bill return, respectively, subject to a high-water mark.
Certain clients investing in accordance with the model may have a different fee arrangement. To the extent actual fees charged to a client differ from the fees shown herein, such client’s returns would vary accordingly. The performance figures
may include returns that are preliminary, unaudited, and estimated based on the most recent information provided by underlying fund managers and are subject to change. The returns also reflect Fund level expenses, some of which have been waived
and/or reimbursed by the Investment Adviser. Returns would have been lower without such waivers and reimbursements. Past performance does not guarantee future results. Investing in hedge funds involves substantial risks, including the risk of
loss of invested capital. Please see Notes and Disclosures section for important additional information. 2 Reflects number of managers in the Aetos Long/Short Strategies Fund as of November 1, 2022 and excludes managers that are under
redemption. 3 Reflects beta since the Aetos Long/Short Strategies Fund’s inception of September 1, 2002 through October 31, 2022. Annualized Returns 1 Year 3 Year 5 Year 10 Year Inception Fund -4.33% 4.44% 3.88% 5.09% 4.56% HFRI
FOF: Composite Index -6.99% 4.34% 3.06% 3.60% 3.55% US Aggregate Bond Index -15.68% -3.77% -0.54% 0.74% 3.07% MSCI ACWI -19.96% 4.85% 5.24% 7.98% 7.56% Volatility (Standard Deviation) - 3 Year 5 Year 10
Year Inception Fund - 9.73% 8.42% 6.86% 6.15% HFRI FOF: Composite Index - 7.28% 6.23% 4.95% 5.22% US Aggregate Bond Index - 5.38% 4.81% 3.95% 3.82% MSCI ACWI - 19.63% 17.32% 14.07% 15.76% Sharpe Ratios - 3 Year 5
Year 10 Year Inception Fund - 0.39 0.32 0.64 0.55 HFRI FOF: Composite Index - 0.51 0.30 0.58 0.45 US Aggregate Bond Index - -0.82 -0.36 0.01 0.50 MSCI ACWI - 0.21 0.23 0.52 0.41

1 Refer to footnote 1 on previous page. 2 Information is subject to change over time, excludes cash and
may not sum to 100% due to
rounding. Jan Feb Mar Apr May Jun Jul Aug Sep Oct Nov Dec Year 2022 -1.81% -0.80% 0.06% -0.74% -0.40% -2.16% 2.22% -0.10% -2.24% 1.91% - - -4.08% 2021 -5.99% 5.04% 1.65% 2.99% 0.00% -0.65% 1.05% 0.75% -0.14% 1.59% -2.61% 2.41% 5.79% 2020 -0.50% -2.60% -8.28% 5.96% 2.35% 0.09% 2.39% 2.70% -0.17% -0.63% 4.89% 2.89% 8.60% 2019 4.48% 1.73% 0.99% 2.24% -1.39% 1.96% 1.00% -0.32% -1.39% 1.83% 2.42% 0.92% 15.30% 2018 1.74% -1.89% -0.26% -0.06% 1.76% -0.59% 0.86% 0.37% -0.11% -4.15% -0.69% -1.86% -4.92% 2017 2.05% 0.49% 0.99% 0.68% 1.57% -0.04% 0.98% 0.76% 0.28% 0.73% -0.01% 0.15% 8.96% 2016 -3.88% -2.83% 0.41% -0.26% 3.34% -1.22% 1.97% 0.11% 0.87% -0.90% -0.28% 0.50% -2.36% 2015 -0.46% 2.02% 0.24% -0.81% 1.84% -1.08% 1.99% -1.34% -1.79% 2.85% 0.49% 0.21% 4.11% 2014 -0.74% 2.80% -1.40% -2.00% 2.30% 0.95% -1.10% 1.45% 1.36% 1.49% 1.88% 1.21% 8.37% 2013 2.06% 0.68% 1.97% 0.12% 0.74% 0.44% 1.05% -0.69% 1.67% 1.38% 1.97% 1.24% 13.35% 2012 1.62% 1.12% 0.68% 0.32% -1.30% 0.43% 1.04% 0.27% 0.54% -0.86% 0.32% -0.34% 3.88% 2011 -0.03% 0.40% -0.53% 1.54% -0.35% -0.61% 0.26% -2.89% -2.29% 2.57% -0.24% -0.35% -2.63% 2010 -1.76% 0.77% 1.68% 0.24% -2.86% -1.48% 1.37% -0.14% 2.95% 1.16% 0.04% 2.13% 4.02% 2009 1.00% -0.81% -0.32% -1.09% 3.15% -0.31% 1.29% 0.90% 1.53% -1.38% 2.11% 0.00% 6.14% 2008 -3.13% 1.92% -1.48% 0.68% 2.93% -0.37% -0.48% -0.63% -9.54% -2.53% -0.73% -0.19% -13.25% 2007 2.12% 0.42% 1.40% 1.71% 1.95% 0.69% 1.37% -1.79% 0.98% 1.91% 0.24% 0.91% 12.52% 2006 2.46% 0.07% 1.62% 1.31% -1.31% 0.13% 0.31% 0.96% -0.10% 0.87% 1.90% 1.02% 9.58% 2005 -0.02% 1.68% 0.44% -0.70% 1.09% 1.03% 1.18% 0.85% 1.03% -1.45% 1.06% 1.93% 8.38% 2004 2.09% 1.01% -0.32% -1.46% -0.21% 0.29% -0.24% -0.28% 1.03% 1.02% 1.88% 1.06% 5.97% 2003 -1.02% -0.63% -0.27% 1.86% 1.73% 1.36% 1.03% 1.11% -0.25% 1.65% 1.10% 0.98% 8.92% 2002 - - - - - - - - -1.08% 0.53% -0.31% 1.00% 0.13% Aetos
LONG/SHORT STRATEGIES FUND Historical Monthly Performance (net of fees)1 HISTORICAL EXPOSURES (quarterly over past 5 years) SUB-STRATEGY ALLOCATIONS (as of November 1, 2022)2 GEOGRAPHIC EXPOSURE (as of September 30, 2022)2

Aetos At-A-Glance Founded 2001 Leadership Anne Casscells Co-President & Chief Investment
Officer Michael Klein Co-President & Chief Risk Officer Locations New York, New York Menlo Park, California Portfolio HIGHLIGHTS Inception September 1, 2002 Diversification # of Managers2: 29 # of Strategies: 7 Beta to Market
Indices1,3 US Aggregate Bond Index: 0.11 MSCI ACWI: 0.22 Geography Global AETOS FUND INFORMATION Aetos SEC-Registered 1940 Act Commingled Hedge Fund of Funds Long/Short Strategies Fund Multi-Strategy Arbitrage Fund Distressed
Investment Strategies Fund Performance and Statistics (since inception through October 31, 2022)1 Firm Overview Aetos Alternatives Management, LP (“Aetos”) is an independent firm that manages assets on behalf of institutional clients. Since
the firm’s inception, Aetos has been a leader in constructing fully customized hedge fund solutions for a broad range of institutional clients. Hedge fund solutions are offered primarily through 1) customized separate accounts and 2) commingled
fund portfolios invested in strategy-specific Aetos 1940 Act SEC-registered funds. PORTFOLIO Overview The Aetos Growth Portfolio is a tactically allocated model portfolio comprised of allocations to the strategy-specific Aetos SEC-registered
1940 Act Commingled Hedge Funds of Funds: 1) Aetos Long/Short Strategies Fund, 2) Aetos Multi-Strategy Arbitrage Fund and 3) Aetos Distressed Investment Strategies Fund. The Portfolio is designed to provide institutional investors with
attractive risk-adjusted returns and low betas to traditional markets and is relatively concentrated by manager yet diversified by strategy. Historical Performance (since inception)1 Annualized Returns 1 Year 3 Year 5 Year 10
Year Inception Portfolio -3.49% 4.03% 3.42% 4.30% 4.50% HFRI FOF: Composite Index -6.99% 4.34% 3.06% 3.60% 3.55% US Aggregate Bond Index -15.68% -3.77% -0.54% 0.74% 3.07% MSCI
ACWI -19.96% 4.85% 5.24% 7.98% 7.56% Volatility (Standard Deviation) - 3 Year 5 Year 10 Year Inception Portfolio - 7.25% 5.98% 4.71% 4.56% HFRI FOF: Composite Index - 7.28% 6.23% 4.95% 5.22% US Aggregate Bond
Index - 5.38% 4.81% 3.95% 3.82% MSCI ACWI - 19.63% 17.32% 14.07% 15.76% Sharpe Ratios - 3 Year 5 Year 10 Year Inception Portfolio - 0.47 0.37 0.76 0.73 HFRI FOF: Composite Index - 0.51 0.30 0.58 0.45 US Aggregate
Bond Index - -0.82 -0.36 0.01 0.50 MSCI ACWI - 0.21 0.23 0.52 0.41 Aetos Growth Portfolio 1 Data as of October 31, 2022. The Aetos Growth Portfolio (the “Portfolio”) is an asset allocation model offered by Aetos since September
2002 to clients seeking a diversified absolute return investment program. The Portfolio consists of investments in the Aetos Funds—including the Aetos Long/Short Strategies Fund, Aetos Multi-Strategy Arbitrage Fund and Aetos Distressed
Investment Strategies Fund (and each of the Aetos Capital Market Neutral Strategies Fund and Aetos Capital Opportunities Fund when included in the Portfolio)—weighted in accordance with allocations determined by Aetos and in effect during the
periods shown. The Portfolio returns are of the model only and do not represent the returns of any specific client account. An actual client investing in accordance with the Aetos Growth Portfolio during the time periods shown would have had
allocations to the Aetos Funds that differed from those of the Portfolio for a variety of reasons, including that differences in the relative performance of the Aetos Funds during such periods would have shifted the client’s allocations to the
Aetos Funds away from those of the Portfolio. In addition, an actual client account may have experienced cash flows that could have resulted in further differences from the Portfolio. Accordingly, it is important that the Portfolio performance
not be understood as the actual performance of client accounts when making an investment decision. The performance figures shown are net of assumed investment advisory and performance fees of 0.75% of assets annually and 5% of profits above the
three-month Treasury bill return, respectively, subject to a high-water mark. Certain clients investing in accordance with the model may have a different fee arrangement. To the extent actual fees charged to a client differ from the fees shown
herein, such client’s returns would vary accordingly. The performance figures may include returns that are preliminary, unaudited, and estimated based on the most recent information provided by underlying fund managers and are subject to
change. The returns also reflect Fund level expenses, some of which have been waived and/or reimbursed by the Investment Adviser. Returns would have been lower without such waivers and reimbursements. Past performance does not guarantee future
results. Investing in hedge funds involves substantial risks, including the risk of loss of invested capital. Please see Notes and Disclosures section for important additional information. 2 Reflects number of managers in the Aetos Growth
Portfolio as of November 1, 2022 and excludes managers that are under redemption, except for one manager that still comprises a material allocation in the Aetos Distressed Investment Strategies Fund. 3 Reflects beta since the Aetos Growth
Portfolio’s inception of September 1, 2002 through October 31, 2022.
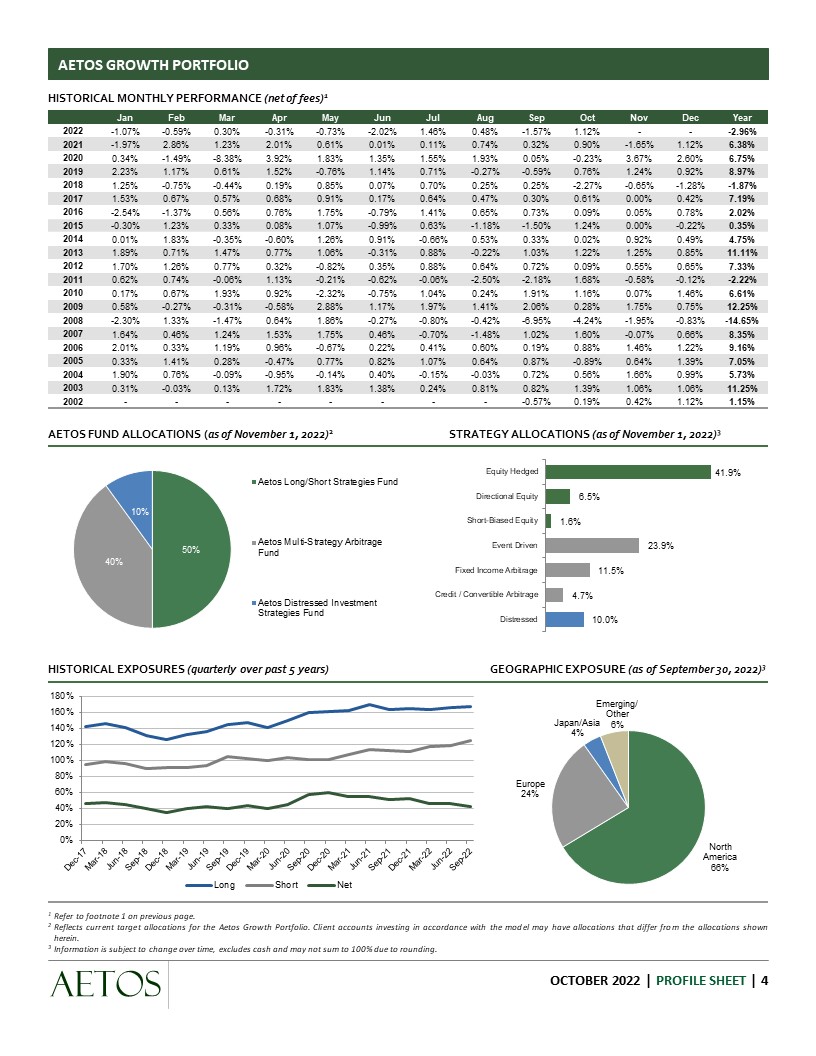
1 Refer to footnote 1 on previous page. 2 Reflects current target allocations for the Aetos Growth
Portfolio. Client accounts investing in accordance with the model may have allocations that differ from the allocations shown herein. 3 Information is subject to change over time, excludes cash and may not sum to 100% due to
rounding. Jan Feb Mar Apr May Jun Jul Aug Sep Oct Nov Dec Year 2022 -1.07% -0.59% 0.30% -0.31% -0.73% -2.02% 1.46% 0.48% -1.57% 1.12% - - -2.96% 2021 -1.97% 2.86% 1.23% 2.01% 0.61% 0.01% 0.11% 0.74% 0.32% 0.90% -1.65% 1.12% 6.38% 2020 0.34% -1.49% -8.38% 3.92% 1.83% 1.35% 1.55% 1.93% 0.05% -0.23% 3.67% 2.60% 6.75% 2019 2.23% 1.17% 0.61% 1.52% -0.76% 1.14% 0.71% -0.27% -0.59% 0.76% 1.24% 0.92% 8.97% 2018 1.25% -0.75% -0.44% 0.19% 0.85% 0.07% 0.70% 0.25% 0.25% -2.27% -0.65% -1.28% -1.87% 2017 1.53% 0.67% 0.57% 0.68% 0.91% 0.17% 0.64% 0.47% 0.30% 0.61% 0.00% 0.42% 7.19% 2016 -2.54% -1.37% 0.56% 0.76% 1.75% -0.79% 1.41% 0.65% 0.73% 0.09% 0.05% 0.78% 2.02% 2015 -0.30% 1.23% 0.33% 0.08% 1.07% -0.99% 0.63% -1.18% -1.50% 1.24% 0.00% -0.22% 0.35% 2014 0.01% 1.83% -0.35% -0.60% 1.26% 0.91% -0.66% 0.53% 0.33% 0.02% 0.92% 0.49% 4.75% 2013 1.89% 0.71% 1.47% 0.77% 1.06% -0.31% 0.88% -0.22% 1.03% 1.22% 1.25% 0.85% 11.11% 2012 1.70% 1.26% 0.77% 0.32% -0.82% 0.35% 0.88% 0.64% 0.72% 0.09% 0.55% 0.65% 7.33% 2011 0.62% 0.74% -0.06% 1.13% -0.21% -0.62% -0.06% -2.50% -2.18% 1.68% -0.58% -0.12% -2.22% 2010 0.17% 0.67% 1.93% 0.92% -2.32% -0.75% 1.04% 0.24% 1.91% 1.16% 0.07% 1.46% 6.61% 2009 0.58% -0.27% -0.31% -0.58% 2.88% 1.17% 1.97% 1.41% 2.06% 0.28% 1.75% 0.75% 12.25% 2008 -2.30% 1.33% -1.47% 0.64% 1.86% -0.27% -0.80% -0.42% -6.95% -4.24% -1.95% -0.83% -14.65% 2007 1.64% 0.46% 1.24% 1.53% 1.75% 0.46% -0.70% -1.48% 1.02% 1.60% -0.07% 0.66% 8.35% 2006 2.01% 0.33% 1.19% 0.96% -0.67% 0.22% 0.41% 0.60% 0.19% 0.88% 1.46% 1.22% 9.16% 2005 0.33% 1.41% 0.28% -0.47% 0.77% 0.82% 1.07% 0.64% 0.87% -0.89% 0.64% 1.39% 7.05% 2004 1.90% 0.76% -0.09% -0.95% -0.14% 0.40% -0.15% -0.03% 0.72% 0.56% 1.66% 0.99% 5.73% 2003 0.31% -0.03% 0.13% 1.72% 1.83% 1.38% 0.24% 0.81% 0.82% 1.39% 1.06% 1.06% 11.25% 2002 - - - - - - - - -0.57% 0.19% 0.42% 1.12% 1.15% AETOS
GROWTH PORTFOLIO Historical Monthly Performance (net of fees)1 AETOS FUND ALLOCATIONS (as of November 1, 2022)2 Strategy Allocations (as of November 1, 2022)3 HISTORICAL EXPOSURES (quarterly over past 5 years) GEOGRAPHIC EXPOSURE (as of
September 30, 2022)3

Aetos At-A-Glance Founded 2001 Leadership Anne Casscells Co-President & Chief Investment
Officer Michael Klein Co-President & Chief Risk Officer Locations New York, New York Menlo Park, California Portfolio HIGHLIGHTS Inception April 1, 2007 Diversification # of Managers2: 29 # of Strategies: 7 Beta to Market
Indices1,3 US Aggregate Bond Index: 0.12 MSCI ACWI: 0.24 Geography Global AETOS FUND INFORMATION Aetos SEC-Registered 1940 Act Commingled Hedge Fund of Funds Long/Short Strategies Fund Multi-Strategy Arbitrage Fund Distressed
Investment Strategies Fund Performance and Statistics (since inception through October 31, 2022)1 Firm Overview Aetos Alternatives Management, LP (“Aetos”) is an independent firm that manages assets on behalf of institutional clients. Since
the firm’s inception, Aetos has been a leader in constructing fully customized hedge fund solutions for a broad range of institutional clients. Hedge fund solutions are offered primarily through 1) customized separate accounts and 2) commingled
fund portfolios invested in strategy-specific Aetos 1940 Act SEC-registered funds. PORTFOLIO Overview The Aetos Prime Portfolio is a tactically allocated model portfolio comprised of allocations to the strategy-specific Aetos SEC-registered
1940 Act Commingled Hedge Funds of Funds: 1) Aetos Long/Short Strategies Fund, 2) Aetos Multi-Strategy Arbitrage Fund and 3) Aetos Distressed Investment Strategies Fund. The Portfolio is designed to provide institutional investors with
attractive risk-adjusted returns and low betas to traditional markets and is relatively concentrated by manager yet diversified by strategy. Historical Performance (since inception)1 Annualized Returns 1 Year 3 Year 5 Year 10
Year Inception Portfolio -3.64% 4.10% 3.48% 4.44% 3.45% HFRI FOF: Composite Index -6.99% 4.34% 3.06% 3.60% 2.05% US Aggregate Bond Index -15.68% -3.77% -0.54% 0.74% 2.70% MSCI
ACWI -19.96% 4.85% 5.24% 7.98% 5.00% Volatility (Standard Deviation) - 3 Year 5 Year 10 Year Inception Portfolio - 7.57% 6.31% 4.99% 5.14% HFRI FOF: Composite Index - 7.28% 6.23% 4.95% 5.55% US Aggregate Bond
Index - 5.38% 4.81% 3.95% 3.84% MSCI ACWI - 19.63% 17.32% 14.07% 16.77% Sharpe Ratios - 3 Year 5 Year 10 Year Inception Portfolio - 0.46 0.36 0.75 0.52 HFRI FOF: Composite Index - 0.51 0.30 0.58 0.23 US Aggregate
Bond Index - -0.82 -0.36 0.01 0.50 MSCI ACWI - 0.21 0.23 0.52 0.25 Aetos Prime Portfolio 1 Data as of October 31, 2022. The Aetos Prime Portfolio (the “Portfolio”) is an asset allocation model offered by Aetos since April 2007 to
clients seeking a diversified absolute return investment program. The Portfolio consists of investments in the Aetos Funds—including the Aetos Long/Short Strategies Fund, Aetos Multi-Strategy Arbitrage Fund and Aetos Distressed Investment
Strategies Fund (and the Aetos Capital Opportunities Fund when included in the Portfolio)—weighted in accordance with allocations determined by Aetos and in effect during the periods shown. The Portfolio returns are of the model only and do not
represent the returns of any specific client account. An actual client investing in accordance with the Aetos Prime Portfolio during the time periods shown would have had allocations to the Aetos Funds that differed from those of the Portfolio
for a variety of reasons, including that differences in the relative performance of the Aetos Funds during such periods would have shifted the client’s allocations to the Aetos Funds away from those of the Portfolio. In addition, an actual
client account may have experienced cash flows that could have resulted in further differences from the Portfolio. Accordingly, it is important that the Portfolio performance not be understood as the actual performance of client accounts when
making an investment decision. The performance figures shown are net of assumed investment advisory and performance fees of 0.75% of assets annually and 5% of profits above the three-month Treasury bill return, respectively, subject to a
high-water mark. Certain clients investing in accordance with the model may have a different fee arrangement. To the extent actual fees charged to a client differ from the fees shown herein, such client’s returns would vary accordingly. The
performance figures may include returns that are preliminary, unaudited, and estimated based on the most recent information provided by underlying fund managers and are subject to change. The returns also reflect Fund level expenses, some of
which have been waived and/or reimbursed by the Investment Adviser. Returns would have been lower without such waivers and reimbursements. Past performance does not guarantee future results. Investing in hedge funds involves substantial risks,
including the risk of loss of invested capital. Please see Notes and Disclosures section for important additional information. 2 Reflects number of managers in the Aetos Prime Portfolio as of November 1, 2022 and excludes managers that are
under redemption, except for one manager that still comprises a material allocation in the Aetos Distressed Investment Strategies Fund. 3 Reflects beta since the Aetos Prime Portfolio’s inception of April 1, 2007 through October 31, 2022.

1 Refer to footnote 1 on previous page. 2 Reflects current target allocations for the Aetos Prime
Portfolio. Client accounts investing in accordance with the model may have allocations that differ from the allocations shown herein. 3 Information is subject to change over time, excludes cash and may not sum to 100% due to rounding. Aetos
PRIME PORTFOLIO Historical Monthly Performance (net of
fees)1 Jan Feb Mar Apr May Jun Jul Aug Sep Oct Nov Dec Year 2022 -1.21% -0.61% 0.30% -0.38% -0.69% -2.05% 1.53% 0.39% -1.68% 1.25% - - -3.18% 2021 -2.57% 3.25% 1.31% 2.19% 0.63% -0.07% 0.29% 0.73% 0.25% 0.99% -1.79% 1.33% 6.58% 2020 0.20% -1.64% -8.39% 4.23% 1.89% 1.12% 1.68% 1.99% 0.02% -0.30% 3.89% 2.60% 6.88% 2019 2.58% 1.27% 0.65% 1.65% -0.86% 1.26% 0.73% -0.31% -0.73% 0.91% 1.39% 0.89% 9.79% 2018 1.32% -0.93% -0.37% 0.14% 1.01% -0.04% 0.71% 0.30% 0.17% -2.57% -0.67% -1.40% -2.37% 2017 1.61% 0.64% 0.62% 0.66% 0.99% 0.13% 0.68% 0.52% 0.30% 0.61% 0.00% 0.39% 7.35% 2016 -2.75% -1.64% 0.55% 0.64% 2.01% -0.83% 1.52% 0.57% 0.77% -0.06% 0.01% 0.73% 1.42% 2015 -0.33% 1.37% 0.30% -0.06% 1.19% -1.00% 0.86% -1.21% -1.55% 1.48% 0.08% -0.18% 0.91% 2014 -0.11% 2.02% -0.52% -0.82% 1.43% 0.96% -0.71% 0.68% 0.48% 0.26% 1.07% 0.60% 5.43% 2013 1.90% 0.70% 1.56% 0.68% 1.04% -0.19% 0.92% -0.30% 1.14% 1.26% 1.40% 0.92% 11.58% 2012 1.67% 1.21% 0.75% 0.35% -0.88% 0.37% 0.92% 0.59% 0.73% -0.05% 0.50% 0.50% 6.83% 2011 0.48% 0.67% -0.18% 1.20% -0.22% -0.63% 0.02% -2.59% -2.25% 1.84% -0.50% -0.18% -2.38% 2010 -0.17% 0.72% 1.84% 0.80% -2.39% -0.87% 1.07% 0.12% 2.05% 1.16% 0.08% 1.62% 6.10% 2009 0.62% -0.31% -0.36% -0.83% 2.80% 0.91% 1.86% 1.28% 1.91% 0.12% 1.83% 0.58% 10.85% 2008 -2.35% 1.35% -1.53% 0.69% 1.93% -0.15% -0.93% -0.37% -7.01% -3.73% -1.60% -0.72% -13.79% 2007 - - - 1.60% 1.78% 0.42% -0.66% -1.50% 1.12% 1.70% -0.10% 0.61% 5.03% HISTORICAL
EXPOSURES (quarterly over past 5 years) GEOGRAPHIC EXPOSURE (as of September 30, 2022)3 AETOS FUND ALLOCATIONS (as of November 1, 2022)2 Strategy Allocations (as of November 1, 2022)3

Aetos At-A-Glance Founded 2001 Leadership Anne Casscells Co-President & Chief Investment
Officer Michael Klein Co-President & Chief Risk Officer Locations New York, New York Menlo Park, California Portfolio HIGHLIGHTS Inception September 1, 2002 Diversification # of Managers2: 29 # of Strategies: 7 Beta to Market
Indices1,3 US Aggregate Bond Index: 0.12 MSCI ACWI: 0.21 Geography Global AETOS FUND INFORMATION Aetos SEC-Registered 1940 Act Commingled Hedge Fund of Funds Long/Short Strategies Fund Multi-Strategy Arbitrage Fund Distressed
Investment Strategies Fund Performance and Statistics (since inception through October 31, 2022)1 Firm Overview Aetos Alternatives Management, LP (“Aetos”) is an independent firm that manages assets on behalf of institutional clients. Since
the firm’s inception, Aetos has been a leader in constructing fully customized hedge fund solutions for a broad range of institutional clients. Hedge fund solutions are offered primarily through 1) customized separate accounts and 2) commingled
fund portfolios invested in strategy-specific Aetos 1940 Act SEC-registered funds. PORTFOLIO Overview The Aetos Balanced Portfolio is a tactically allocated model portfolio comprised of allocations to the strategy-specific Aetos
SEC-registered 1940 Act Commingled Hedge Funds of Funds: 1) Aetos Long/Short Strategies Fund, 2) Aetos Multi-Strategy Arbitrage Fund and 3) Aetos Distressed Investment Strategies Fund. The Portfolio is designed to provide institutional
investors with attractive risk-adjusted returns and low betas to traditional markets and is relatively concentrated by manager yet diversified by strategy. Historical Performance (since inception)1 Annualized Returns 1 Year 3 Year 5
Year 10 Year Inception Portfolio -3.34% 3.95% 3.36% 4.15% 4.27% HFRI FOF: Composite Index -6.99% 4.34% 3.06% 3.60% 3.55% US Aggregate Bond Index -15.68% -3.77% -0.54% 0.74% 3.07% MSCI
ACWI -19.96% 4.85% 5.24% 7.98% 7.56% Volatility (Standard Deviation) - 3 Year 5 Year 10 Year Inception Portfolio - 6.97% 5.69% 4.46% 4.46% HFRI FOF: Composite Index - 7.28% 6.23% 4.95% 5.22% US Aggregate Bond
Index - 5.38% 4.81% 3.95% 3.82% MSCI ACWI - 19.63% 17.32% 14.07% 15.76% Sharpe Ratios - 3 Year 5 Year 10 Year Inception Portfolio - 0.47 0.38 0.77 0.69 HFRI FOF: Composite Index - 0.51 0.30 0.58 0.45 US Aggregate
Bond Index - -0.82 -0.36 0.01 0.50 MSCI ACWI - 0.21 0.23 0.52 0.41 Aetos Balanced Portfolio 1 Data as of October 31, 2022. The Aetos Balanced Portfolio (the “Portfolio”) is an asset allocation model offered by Aetos since September
2002 to clients seeking a diversified absolute return investment program. The Portfolio consists of investments in the Aetos Funds—including the Aetos Long/Short Strategies Fund, Aetos Multi-Strategy Arbitrage Fund and Aetos Distressed
Investment Strategies Fund (and the Aetos Capital Market Neutral Strategies Fund when included in the Portfolio)—weighted in accordance with allocations determined by Aetos and in effect during the periods shown. The Portfolio returns are of
the model only and do not represent the returns of any specific client account. An actual client investing in accordance with the Aetos Balanced Portfolio during the time periods shown would have had allocations to the Aetos Funds that differed
from those of the Portfolio for a variety of reasons, including that differences in the relative performance of the Aetos Funds during such periods would have shifted the client’s allocations to the Aetos Funds away from those of the Portfolio.
In addition, an actual client account may have experienced cash flows that could have resulted in further differences from the Portfolio. Accordingly, it is important that the Portfolio performance not be understood as the actual performance of
client accounts when making an investment decision. The performance figures shown are net of assumed investment advisory and performance fees of 0.75% of assets annually and 5% of profits above the three-month Treasury bill return,
respectively, subject to a high-water mark. Certain clients investing in accordance with the model may have a different fee arrangement. To the extent actual fees charged to a client differ from the fees shown herein, such client’s returns
would vary accordingly. The performance figures may include returns that are preliminary, unaudited, and estimated based on the most recent information provided by underlying fund managers and are subject to change. The returns also reflect
Fund level expenses, some of which have been waived and/or reimbursed by the Investment Adviser. Returns would have been lower without such waivers and reimbursements. Past performance does not guarantee future results. Investing in hedge funds
involves substantial risks, including the risk of loss of invested capital. Please see Notes and Disclosures section for important additional information. 2 Reflects number of managers in the Aetos Balanced Portfolio as of November 1, 2022 and
excludes managers that are under redemption, except for one manager that still comprises a material allocation in the Aetos Distressed Investment Strategies Fund. 3 Reflects beta since the Aetos Balanced Portfolio’s inception of September 1,
2002 through October 31, 2022.

1 Refer to footnote 1 on previous page. 2 Reflects current target allocations for the Aetos Balanced
Portfolio. Client accounts investing in accordance with the model may have allocations that differ from the allocations shown herein. 3 Information is subject to change over time, excludes cash and may not sum to 100% due to
rounding. Jan Feb Mar Apr May Jun Jul Aug Sep Oct Nov Dec Year 2022 -0.94% -0.56% 0.29% -0.24% -0.77% -1.99% 1.39% 0.58% -1.46% 0.99% - - -2.74% 2021 -1.37% 2.47% 1.14% 1.84% 0.59% 0.08% -0.06% 0.76% 0.40% 0.82% -1.52% 0.91% 6.17% 2020 0.48% -1.33% -8.37% 3.61% 1.77% 1.57% 1.42% 1.86% 0.09% -0.16% 3.46% 2.60% 6.61% 2019 1.88% 1.06% 0.57% 1.39% -0.65% 1.02% 0.69% -0.23% -0.46% 0.60% 1.09% 0.95% 8.16% 2018 1.17% -0.56% -0.50% 0.24% 0.69% 0.17% 0.69% 0.21% 0.34% -1.97% -0.63% -1.17% -1.36% 2017 1.45% 0.71% 0.53% 0.70% 0.83% 0.22% 0.61% 0.41% 0.30% 0.61% -0.01% 0.45% 7.02% 2016 -2.33% -1.11% 0.57% 0.88% 1.50% -0.75% 1.31% 0.73% 0.70% 0.24% 0.09% 0.82% 2.62% 2015 -0.26% 1.09% 0.36% 0.23% 0.94% -0.98% 0.40% -1.15% -1.46% 0.99% -0.08% -0.27% -0.23% 2014 0.12% 1.64% -0.18% -0.38% 1.09% 0.86% -0.60% 0.38% 0.17% -0.23% 0.77% 0.38% 4.06% 2013 1.88% 0.73% 1.39% 0.87% 1.07% -0.44% 0.85% -0.15% 0.93% 1.17% 1.10% 0.78% 10.63% 2012 1.75% 1.35% 0.79% 0.30% -0.75% 0.32% 0.84% 0.70% 0.71% 0.24% 0.59% 0.80% 7.91% 2011 0.83% 0.82% 0.14% 1.03% -0.20% -0.61% -0.19% -2.34% -2.02% 1.46% -0.72% -0.01% -1.88% 2010 0.66% 0.60% 2.02% 1.10% -2.20% -0.51% 1.00% 0.40% 1.64% 1.14% 0.03% 1.21% 7.26% 2009 0.44% -0.11% -0.25% -0.34% 2.98% 1.63% 2.18% 1.54% 2.32% 0.55% 1.58% 0.96% 14.27% 2008 -1.73% 1.09% -1.49% 0.58% 1.76% -0.39% -0.69% -0.44% -6.91% -5.33% -2.56% -1.07% -16.19% 2007 1.53% 0.35% 1.13% 1.37% 1.63% 0.30% -2.10% -1.34% 0.93% 1.45% -0.11% 0.52% 5.74% 2006 1.84% 0.50% 0.91% 0.92% -0.38% 0.45% 0.52% 0.46% 0.28% 0.74% 1.32% 1.28% 9.17% 2005 0.46% 1.21% 0.26% -0.34% 0.66% 0.72% 0.99% 0.38% 0.75% -0.75% 0.44% 1.29% 6.23% 2004 1.58% 0.61% -0.03% -0.71% -0.17% 0.30% -0.23% 0.03% 0.51% 0.28% 1.45% 0.87% 4.55% 2003 0.79% 0.19% 0.31% 1.43% 1.98% 1.10% -0.20% 0.63% 1.10% 1.09% 1.05% 0.92% 10.87% 2002 - - - - - - - - -0.42% 0.16% 0.55% 1.10% 1.39% Aetos
Balanced PORTFOLIO Historical Monthly Performance (net of fees)1 AETOS FUND ALLOCATIONS (as of November 1, 2022)2 Strategy Allocations (as of November 1, 2022)3 HISTORICAL EXPOSURES (quarterly over past 5 years) GEOGRAPHIC EXPOSURE (as of
September 30, 2022)3

NOTES and Disclosures Investing in hedge funds and other alternatives investment strategies involves
substantial risks, including the risk of loss of invested capital. These risks remain substantial, notwithstanding the risk management practices Aetos employs in selecting and monitoring investments. Alternative investments are typically made
through investments in illiquid, unregulated investment funds that employ sophisticated investment techniques, often involving derivatives and leverage. Prospective investors should obtain independent advice with respect to the investment,
financial, legal, tax, accounting, regulatory and other aspects of an investment in the strategies offered by Aetos. For a more complete description of the risks associated with an investment with Aetos, please see Part 2 of Form ADV of Aetos
Alternatives Management, LP, which is available upon request from your Aetos contact and on the SEC website. Aetos Alternatives Management is an SEC-registered investment adviser and serves as investment adviser to SEC-registered 1940 Act
funds. Such registrations do not imply in any manner whatsoever that Aetos or the Aetos Funds have been sponsored, recommended, or approved, or that their abilities or qualifications have in any respect been passed upon by the United States or
any agency or any office thereof. Prospective investors should consider the investment objectives, risks, and the charges and expenses of the Aetos Funds carefully before investing. A free copy of the prospectus containing this and other
information may be obtained by calling 212-201-2500. Please read the prospectus carefully before investing. Indices have been provided by Bloomberg Index Services Limited. BLOOMBERG® is a trademark and service mark of Bloomberg Finance L.P.
and its affiliates (collectively “Bloomberg”). Bloomberg or Bloomberg’s licensors own all proprietary rights in the Bloomberg Indices. Bloomberg does not approve or endorse this material or guarantee the accuracy or completeness of any
information herein, nor does Bloomberg make any warranty, express or implied, as to the results to be obtained therefrom, and, to the maximum extent allowed by law, Bloomberg shall not have any liability or responsibility for injury or damages
arising in connection therewith. Indices are not actively managed, do not reflect any deduction for fees, expenses or taxes, and investors cannot invest directly in an unmanaged index. The volatility, investment holdings and other
characteristics of the indices presented may be materially different from those of investments made by Aetos referenced herein. The indices shown have not been selected as appropriate benchmarks to compare to the performance of those of
investments made by Aetos; rather they are provided to allow for comparisons to the performance of well-known and widely recognized indices. Bloomberg US Aggregate Bond Index: Index designed to broadly measure the performance of the investment
grade, US dollar-denominated, fixed-rate taxable bond market. The Bloomberg US Aggregate Bond Index includes Treasury securities, government-related and corporate securities, MBS, ABS, and CMBS with maturities of no less than one year. HFRI
Fund of Funds Composite Index: Index that includes fund of funds that invest with multiple managers through funds or managed accounts. Fund of funds design diversified portfolios of managers with the objective of significantly lowering the risk
(volatility) of investing with an individual manager. MSCI ACWI: Index designed to measure developed and emerging market equity performance. The MSCI ACWI consists of 47 country indexes comprising 23 developed and 24 emerging market country
indexes. TERMS Minimum Investment $1 million Subscription Frequency Monthly Redemption Frequency Quarterly with 90 days’ notice after 1 year lock-up period Fund Structures Onshore and offshore vehicles Auditor PricewaterhouseCoopers
LLP Administrator HedgeServ Limited Legal Counsel Clifford Chance LLP (onshore), Maples and Calder LLP (offshore) Custodian JP Morgan Chase Bank Aetos Commingled offerings Aetos Contact Information John Stimpson Managing Director,
Co-Head of Client Relations and Business Development 875 Third Avenue, 6th Floor New York, NY 10022 ( 212.201.2560 * [email protected] Elizabeth Leung Managing Director, Co-Head of Client Relations and Business Development 875 Third
Avenue, 6th Floor New York, NY 10022 ( 212.201.2562 * [email protected]
Serious News for Serious Traders! Try StreetInsider.com Premium Free!
You May Also Be Interested In
- Form 8.3 - Balanced Commercial Property Trust Limited
- E Source Announces Presence at CS Week Conference 48, Celebrates Client Wins
- FUNDAMENTAL INVENTIONS ENABLE THE BEST PPA AND MOST PORTABLE EFPGA/DSP/SDR/AI IP FOR ADAPTABLE SOCS
Create E-mail Alert Related Categories
SEC FilingsSign up for StreetInsider Free!
Receive full access to all new and archived articles, unlimited portfolio tracking, e-mail alerts, custom newswires and RSS feeds - and more!
