

Form 497 BAIRD FUNDS INC
 Tweet
Tweet Share
Share
1
TABLE OF CONTENTS
| BAIRD SMALL/MID CAP GROWTH FUND | |||||
| SMALL/MID CAP GROWTH COMPOSITE | |||||
| BACK COVER | |||||
| Summary Section | ||
| Baird MidCap Fund | ||
Investment Objective
The investment objective of the Baird MidCap Fund (the “Fund”) is to provide long-term growth of capital.
Fees and Expenses of the Fund
The table below describes the fees and expenses that you may pay if you buy, hold and sell shares of the Fund. You may pay other fees, such as brokerage commissions and other fees to financial intermediaries, which are not reflected in the table and example below.
Shareholder Fees
(fees paid directly from your investment)
None
Annual Fund Operating Expenses
(expenses that you pay each year as a percentage of the value of your investment)
Investor Class Shares | Institutional Class Shares | |||||||
| Management Fees | 0.75% | 0.75% | ||||||
Distribution and Service (12b-1) Fees | 0.25% | None | ||||||
| Other Expenses | 0.07% | 0.07% | ||||||
| Total Annual Fund Operating Expenses | 1.07% | 0.82% | ||||||
Example
This Example is intended to help you compare the cost of investing in the Fund with the cost of investing in other mutual funds.
The Example assumes that you invest $10,000 in the Fund for the time periods indicated and then redeem all of your shares at the end of those periods. The Example also assumes that your investment has a 5% return each year and that the Fund’s operating expenses remain the same. Although your actual costs may be higher or lower, based on these assumptions your costs would be:
1
| 1 Year | 3 Years | 5 Years | 10 Years | |||||||||||
| Investor Class Shares | $109 | $340 | $590 | $1,306 | ||||||||||
| Institutional Class Shares | $84 | $262 | $455 | $1,014 | ||||||||||
Portfolio Turnover
The Fund pays transaction costs, such as commissions, when it buys and sells securities (or “turns over” its portfolio). A higher portfolio turnover rate may indicate higher transaction costs and may result in higher taxes when Fund shares are held in a taxable account. These costs, which are not reflected in total annual fund operating expenses or in the example, affect the Fund’s performance. During the most recent fiscal year, the Fund’s portfolio turnover rate was 47% of the average value of its portfolio.
Principal Investment Strategies
The Fund normally invests at least 80% of its net assets, plus any borrowings for investment purposes, in the equity securities of U.S. and foreign mid-capitalization companies, principally common stocks, preferred stocks, securities convertible into common stocks and American Depositary Receipts (“ADRs”) that are traded on major U.S. exchanges. Although the Fund principally invests in U.S. companies, the Fund may invest up to 15% of its total assets in equity securities (consisting of common stocks, ordinary shares and ADRs) of foreign companies. The Fund defines mid-capitalization companies as those companies with a market capitalization within the range of companies in the Russell Midcap® Growth Index at the time of investment.
When analyzing equity securities to be purchased by the Fund, Robert W. Baird & Co. Incorporated (the “Advisor”) emphasizes a company’s growth prospects. The Fund’s investments are selected using a variety of both quantitative techniques and fundamental research in seeking to maximize the Fund’s expected return while controlling risk.
The Fund seeks a portfolio comprised of companies which reflect “PRIME” growth factors. These factors are analyzed as part of the Advisor’s investment process and are represented in the following ways:
•Durable Profitability. Companies with attractive margins and favorable margin trends can drive superior earnings growth.
•Sustainable Revenue Growth. Solid barriers to entry, favorable pricing and demonstrated product/service track record can aid top-line prospects.
•Favorable Industry dynamics.
•Management strength and integrity is a critical element of a high quality company. Growth, profitability and shareholder returns provide insight into management effectiveness. The Advisor seeks companies with management that position their company’s balance sheet to be a source of strength.
2
•Understanding market Expectations of a company is important in assessing risk/return opportunities.
The Advisor believes an analysis of these PRIME factors yields insights to the competitive strength of a business model.
The Advisor applies the following strategies when purchasing securities for the Fund’s portfolio:
•Intentionally avoiding short-term trading strategies and rapid shifts in industry positions.
•Setting sector limits at the greater of 30% of the Fund’s total assets or double the weighting of the Russell Midcap® Growth Index in any one sector, as defined by such index.
•Typically holding the securities of fewer than 60 companies with exposure to at least 20 industries.
•Seeking securities whose growth prospects, in the Advisor’s opinion, are not reflected in their current stock prices.
•Limiting the size of any one new position. No security will represent more than 5% of the Fund’s total assets at the time of purchase.
• Leveraging key tools, such as the Advisor’s proprietary tier-board, which provides a visual representation of portfolio positions and enables discussion on relative weights of underlying positions.
The Advisor may sell a security due to achievement of valuation targets, significant change in the initial investment premise or fundamental deterioration.
Principal Risks
Please be aware that you may lose money by investing in the Fund. The following is a summary description of certain risks of investing in the Fund.
Stock Market Risks
Stock prices vary and may fall, thus reducing the value of the Fund’s investments. Certain stocks selected for the Fund’s portfolio may decline in value more than the overall stock market. The U.S. and international markets have recently experienced extreme price volatility and reduced liquidity. Continuing market problems may have adverse effects on the Fund.
3
Growth-Style Investing Risks
Because the Fund focuses on growth-style stocks, its performance may at times be better or worse than the performance of funds that focus on other types of stocks or that have a different investment style. Growth stocks are often characterized by high price-to-earnings ratios, which may be more volatile than stocks with lower price-to-earnings ratios.
Management Risks
The Advisor’s judgments about the attractiveness, value and potential appreciation of particular companies’ stocks may prove to be incorrect. Such errors could result in a negative return to the Fund and a loss to you.
Equity Securities Risks
Equity securities may experience sudden, unpredictable drops in value or long periods of decline in value. This change may occur because of factors that affect securities markets generally or factors affecting specific industries, sectors or companies in which the Fund invests.
Common Stock Risks
Common stocks are susceptible to general stock market fluctuations and to volatile increases and decreases in value as market confidence in and perceptions of their issuers change. Holders of common stocks are generally subject to greater risk than holders of preferred stocks and debt obligations of the same issuer because common stockholders generally have inferior rights to receive payments from issuers in comparison with the rights of preferred stockholders, bondholders and other creditors.
Mid-Capitalization Risks
Mid-capitalization stocks are often more volatile and less liquid than investments in larger companies. The frequency and volume of trading in securities of mid-size companies may be substantially less than is typical of larger companies. Therefore, the securities of mid-size companies may be subject to greater and more abrupt price fluctuations. In addition, mid-size companies may lack the management experience, financial resources and product diversification of larger companies, making them more susceptible to market pressures and business failure.
Foreign Securities Risks
Securities of foreign issuers and ADRs are subject to certain inherent risks, such as political or economic instability of the country of issue and government policies, tax rates, withholding of foreign taxes, prevailing interest rates and credit conditions that may differ from those affecting domestic corporations. Securities of foreign issuers and ADRs may also be subject to currency fluctuations and controls and greater fluctuation in price than the securities of domestic corporations. Foreign companies generally are subject to different auditing and financial reporting standards than those applicable to domestic companies.
The United Kingdom (UK) withdrew from the European Union (EU) on January 31, 2020 following a June 2016 referendum referred to as “Brexit.” Although the UK and
4
EU agreed to a trade deal in December 2020, certain post-EU arrangements, such as those relating to the offering of cross-border financial services and sharing of cross-border data, have yet to be reached and the EU’s willingness to grant equivalency to the UK remains uncertain. There is significant market uncertainty regarding Brexit’s ramifications, and the range of possible political, regulatory, economic and market outcomes is difficult to predict. The uncertainty surrounding the UK’s economy, and its legal, political, and economic relationship with the remaining member states of the EU, may cause considerable disruption in securities markets, including decreased liquidity and increased volatility, as well as currency fluctuations in the British pound’s exchange rate against the U.S. dollar.
Recent Market Events
U.S. and international markets have experienced significant periods of volatility in recent months and years due to a number of economic, political, social and global macro factors including the impact of the coronavirus (COVID-19) global pandemic, which has resulted in a global health crisis, business interruptions, growth concerns in the U.S. and overseas, layoffs, rising unemployment claims, changed travel and social behaviors, reduced consumer spending, and fiscal, monetary and other government policy responses. The impact of the COVID-19 pandemic may last for an extended period of time.
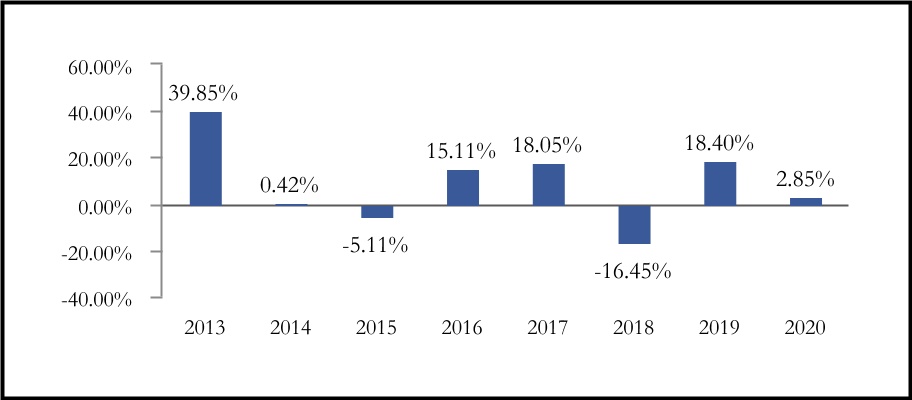
Performance
The performance information provides some indication of the risks of investing in the Fund by showing changes in the Fund’s performance from year to year and by showing how the Fund’s average annual returns for one, five and ten years and since inception period compare with those of a broad measure of market performance. Past performance, before and after taxes, is not necessarily an indication of how the Fund will perform in the future. Updated performance information is available on the Fund’s website at www.bairdfunds.com or by calling the Fund toll-free at 1-866-442-2473.
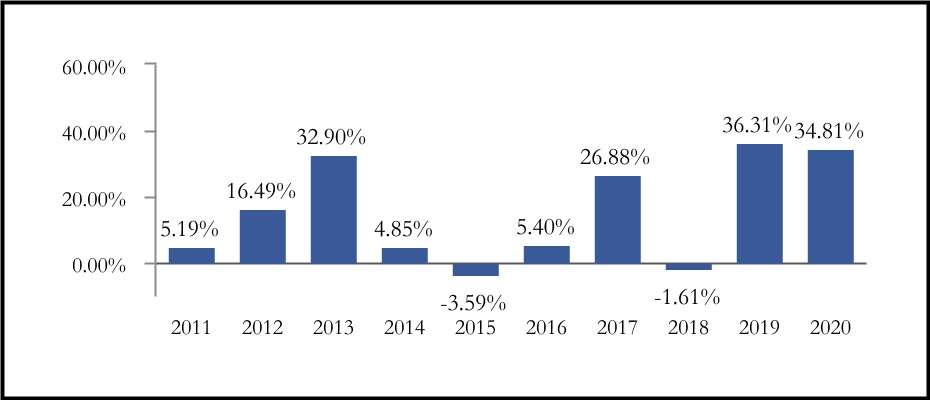
Calendar Year Returns for Institutional Class Shares
5
| Best quarter: | 2nd quarter 2020 | 29.44 | % | |||||
| Worst quarter: | 1st quarter 2020 | -19.30 | % | |||||
| Average Annual Total Returns as of December 31, 2020 | ||||||||||||||
| 1 Year | 5 Years | 10 Years | Since Inception (12/29/00) | |||||||||||
| Institutional Class | ||||||||||||||
| Return Before Taxes | 34.81% | 19.31% | 14.81% | 9.41% | ||||||||||
| Return After Taxes on Distributions | 31.76% | 17.88% | 13.91% | 8.63% | ||||||||||
| Return After Taxes on Distributions and Sale of Fund Shares | 22.29% | 15.42% | 12.28% | 7.85% | ||||||||||
| Investor Class | ||||||||||||||
| Return Before Taxes | 34.32% | 18.98% | 14.52% | 9.14% | ||||||||||
Russell MidCap® Growth Index (reflects no deduction for fees, expenses or taxes) | 35.59% | 18.66% | 15.04% | 8.91% | ||||||||||
After‑tax returns are shown only for Institutional Class shares, and the after‑tax returns for Investor Class shares will vary. After‑tax returns are calculated using the historical highest individual federal marginal income tax rates and do not reflect the impact of state and local taxes. Your actual after‑tax returns depend on your tax situation and may differ from those shown. After‑tax returns are not relevant if you hold your shares through a tax‑deferred account, such as a 401(k) plan or an individual retirement account.
Investment Advisor
Robert W. Baird & Co. Incorporated is the Fund’s investment advisor.
Portfolio Managers
| Name | Portfolio Manager of the Fund Since | Title | ||||||
| Charles F. Severson, CFA | 2000 | Senior Portfolio Manager for Baird Equity Asset Management and Managing Director of the Advisor | ||||||
| Kenneth M. Hemauer, CFA | 2010 | Senior Portfolio Manager for Baird Equity Asset Management and Managing Director of the Advisor | ||||||
6
For important information about the purchase and sale of Fund shares, tax information and financial intermediary compensation, please turn to “Purchase and Sale of Fund Shares, Taxes and Financial Intermediary Compensation” on page 44.
7
| Baird Small/Mid Cap Growth Fund | ||
Investment Objective
The investment objective of the Baird Small/Mid Cap Growth Fund (the “Fund”) is to provide long-term growth of capital.
Fees and Expenses of the Fund
The table below describes the fees and expenses that you may pay if you buy, hold and sell shares of the Fund. You may pay other fees, such as brokerage commissions and other fees to financial intermediaries, which are not reflected in the table and example below.
Shareholder Fees
(fees paid directly from your investment)
None
Annual Fund Operating Expenses
(expenses that you pay each year as a percentage of the value of your investment)
Investor Class Shares | Institutional Class Shares | |||||||
| Management Fees | 0.75% | 0.75% | ||||||
Distribution and Service (12b-1) Fees | 0.25% | None | ||||||
| Other Expenses | 0.68% | 0.68% | ||||||
| Total Annual Fund Operating Expenses | 1.68% | 1.43% | ||||||
Less: Fee Waiver/Expense Reimbursement(1) | -0.58% | -0.58% | ||||||
| Total Annual Fund Operating Expenses After Fee Waiver/Expense Reimbursement | 1.10% | 0.85% | ||||||
(1)Robert W. Baird & Co. Incorporated (the “Advisor”) has contractually agreed to waive management fees and/or reimburse other expenses in order to limit the Fund’s total annual fund operating expenses to 1.10% of average daily net assets for the Investor Class shares and 0.85% of average daily net assets for the Institutional Class shares. The Advisor’s expense reimbursement agreement includes fees and expenses incurred by the Fund in connection with the Fund’s investments in other investment companies (to the extent, in the aggregate, such expenses exceed 0.0049% of the Fund’s net assets) and interest expense, but excludes taxes, brokerage commissions and extraordinary expenses. If such excluded expenses were incurred, Fund expenses would be higher. The Advisor is entitled to recoup the fees waived and/or expenses reimbursed within a three-year period from the time the expenses were incurred, provided that the aggregate amount actually paid by the Fund toward the operating expenses in any month (taking into account the recoupment) will not cause the Fund to exceed the lesser of: (1) the expense cap in place at the time of the fee waiver and/or expense reimbursement; or (2) the expense cap in place at the time of the recoupment. The agreement will continue in effect at least through April 30, 2022 and may only be terminated prior to the end of this term by or with the consent of the Board of Directors.
8
Example
This Example is intended to help you compare the cost of investing in the Fund with the cost of investing in other mutual funds.
The Example assumes that you invest $10,000 in the Fund for the time periods indicated and then redeem all of your shares at the end of those periods. The Example also assumes that your investment has a 5% return each year and that the Fund’s operating expenses remain the same. Please note that the one-year numbers below are based on the Fund’s net expenses resulting from the fee waiver/expense reimbursement agreement described above. Although your actual costs may be higher or lower, based on these assumptions your costs would be:
| 1 Year | 3 Years | 5 Years | 10 Years | |||||||||||
| Investor Class Shares | $112 | $473 | $858 | $1,939 | ||||||||||
| Institutional Class Shares | $87 | $395 | $726 | $1,663 | ||||||||||
Portfolio Turnover
The Fund pays transaction costs, such as commissions, when it buys and sells securities (or “turns over” its portfolio). A higher portfolio turnover rate may indicate higher transaction costs and may result in higher taxes when Fund shares are held in a taxable account. These costs, which are not reflected in total annual fund operating expenses or in the example, affect the Fund’s performance. During the most recent fiscal year, the Fund’s portfolio turnover rate was 65% of the average value of its portfolio.
Principal Investment Strategies
The Fund normally invests at least 80% of its net assets, plus any borrowings for investment purposes, in the equity securities of U.S. and foreign small- and mid-capitalization companies, principally common stocks and American Depositary Receipts (“ADRs”) that are traded on major U.S. exchanges. Although the Fund principally invests in U.S. companies, the Fund may invest up to 15% of its total assets in equity securities (consisting of common stocks, ordinary shares and ADRs) of foreign companies. The Fund defines small- and mid-capitalization companies as those companies with a market capitalization within the range of companies in the Russell 2500® Growth Index at the time of investment.
When analyzing equity securities to be purchased by the Fund, the Advisor emphasizes a company’s growth prospects. The Fund’s investments are selected using a variety of both quantitative techniques and fundamental research in seeking to maximize the Fund’s expected return while controlling risk.
The Fund seeks a portfolio comprised of companies which reflect “PRIME” growth factors. These factors are analyzed as part of the Advisor’s investment process and are represented in the following ways:
9
•Durable Profitability. Companies with attractive margins and favorable margin trends can drive superior earnings growth.
•Sustainable Revenue Growth. Solid barriers to entry, favorable pricing and demonstrated product/service track records can aid top-line prospects.
•Favorable Industry dynamics.
•Management strength and integrity is a critical element of a high quality company. Growth, profitability and shareholder returns provide insight into management effectiveness. The Advisor seeks companies with management that position their company’s balance sheet to be a source of strength.
•Understanding market Expectations of a company is important in assessing risk/return opportunities.
The Advisor believes an analysis of these PRIME factors yields insights into the competitive strength of a business model.
The Advisor applies the following strategies when purchasing securities for the Fund’s portfolio:
•Typically holding the securities of fewer than 70 companies with exposure to approximately 20 industries.
•Seeking securities whose growth prospects, in the Advisor’s opinion, are not reflected in their current stock prices.
•Limiting the size of any one new position. No security will represent more than 5% of the Fund’s total assets at the time of purchase.
The Advisor may sell a security when the price meets or exceeds the Advisor’s targeted valuation or price range for the security, when a significant change occurs that adversely affects the Advisor’s premise or reasons for investing in the security or when the company experiences a fundamental deterioration in its business, financial condition or results, or growth prospects.
Principal Risks
Please be aware that you may lose money by investing in the Fund. The following is a summary description of certain risks of investing in the Fund.
Stock Market Risks
Stock prices vary and may fall, thus reducing the value of the Fund’s investments. Certain stocks selected for the Fund’s portfolio may decline in value more than the overall stock market. The U.S. and international markets have recently experienced
10
extreme price volatility and reduced liquidity. Continuing market problems may have adverse effects on the Fund.
Growth-Style Investing Risks
Because the Fund focuses on growth-style stocks, its performance may at times be better or worse than the performance of funds that focus on other types of stocks or that have a different investment style. Growth stocks are often characterized by high price-to-earnings ratios, which may be more volatile than stocks with lower price-to-earnings ratios.
Management Risks
The Advisor’s judgments about the attractiveness, value and potential appreciation of particular companies’ stocks may prove to be incorrect. Such errors could result in a negative return to the Fund and a loss to you.
Equity Securities Risks
Equity securities may experience sudden, unpredictable drops in value or long periods of decline in value. This change may occur because of factors that affect securities markets generally or factors affecting specific industries, sectors or companies in which the Fund invests.
Common Stock Risks
Common stocks are susceptible to general stock market fluctuations and to volatile increases and decreases in value as market confidence in and perceptions of their issuers change. Holders of common stocks are generally subject to greater risk than holders of preferred stocks and debt obligations of the same issuer because common stockholders generally have inferior rights to receive payments from issuers in comparison with the rights of preferred stockholders, bondholders and other creditors.
Small- and Mid-Capitalization Risks
Small- and mid-capitalization stocks are often more volatile and less liquid than investments in larger companies. The frequency and volume of trading in securities of small- and mid-size companies may be substantially less than is typical of larger companies. Therefore, the securities of small- and mid-size companies may be subject to greater and more abrupt price fluctuations. In addition, small- and mid-size companies may lack the management experience, financial resources and product diversification of larger companies, making them more susceptible to market pressures and business failure. Small- and mid-size companies in which the Fund may invest may be in the early stages of development and may not yet be profitable. These risks may be more pronounced for small-capitalization companies than for mid-capitalization companies.
Small Fund Risk
There can be no assurance that the Fund will grow to or maintain an economically viable size.
11
Foreign Securities Risks
Securities of foreign issuers and ADRs are subject to certain inherent risks, such as political or economic instability of the country of issue and government policies, tax rates, withholding of foreign taxes, prevailing interest rates and credit conditions that may differ from those affecting domestic corporations. Securities of foreign issuers and ADRs may also be subject to currency fluctuations and controls and greater fluctuation in price than the securities of domestic corporations. Foreign companies generally are subject to different auditing and financial reporting standards than those applicable to domestic companies.
The United Kingdom (UK) withdrew from the European Union (EU) on January 31, 2020 following a June 2016 referendum referred to as “Brexit.” Although the UK and EU agreed to a trade deal in December 2020, certain post-EU arrangements, such as those relating to the offering of cross-border financial services and sharing of cross-border data, have yet to be reached and the EU’s willingness to grant equivalency to the UK remains uncertain. There is significant market uncertainty regarding Brexit’s ramifications, and the range of possible political, regulatory, economic and market outcomes is difficult to predict. The uncertainty surrounding the UK’s economy, and its legal, political, and economic relationship with the remaining member states of the EU, may cause considerable disruption in securities markets, including decreased liquidity and increased volatility, as well as currency fluctuations in the British pound’s exchange rate against the U.S. dollar.
Recent Market Events
U.S. and international markets have experienced significant periods of volatility in recent months and years due to a number of economic, political, social and global macro factors including the impact of the coronavirus (COVID-19) global pandemic, which has resulted in a global health crisis, business interruptions, growth concerns in the U.S. and overseas, layoffs, rising unemployment claims, changed travel and social behaviors, reduced consumer spending, and fiscal, monetary and other government policy responses. The impact of the COVID-19 pandemic may last for an extended period of time.
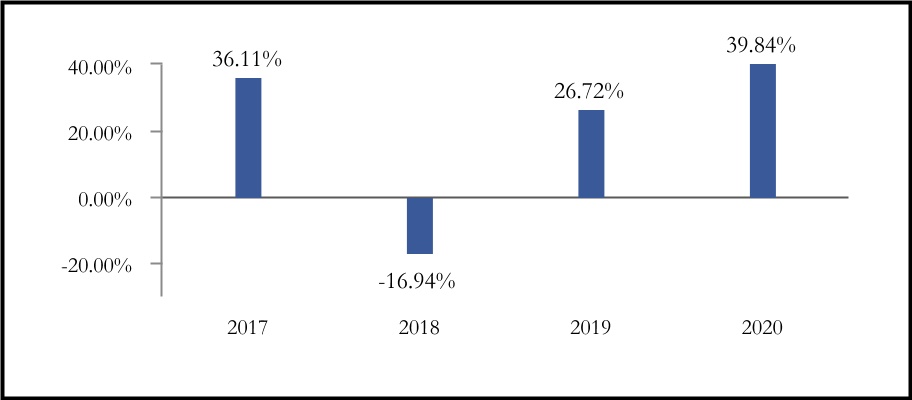
Performance
The performance information provides some indication of the risks of investing in the Fund by showing changes in the Fund’s performance for the past two calendar years and by showing how the Fund’s average annual returns for one year and since inception period compare with those of a broad measure of market performance. Past performance, before and after taxes, is not necessarily an indication of how the Fund will perform in the future. Updated performance information is available on the Fund’s website at www.bairdfunds.com or by calling the Fund toll-free at 1-866-442-2473.
12
Calendar Year Returns for Institutional Class Shares
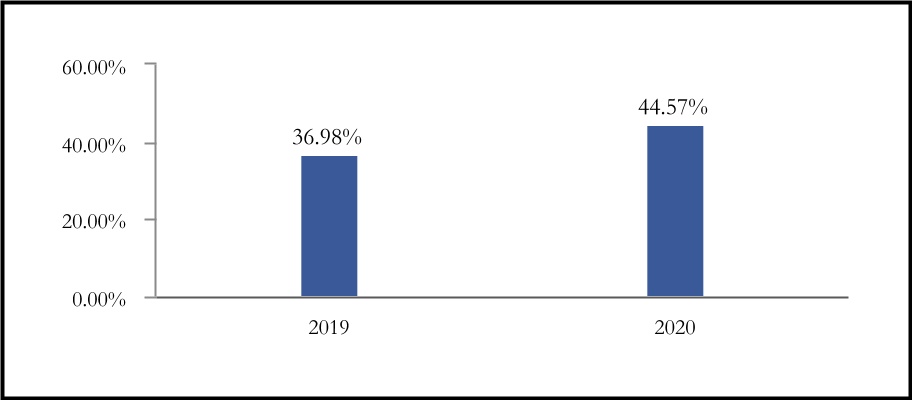
| Best quarter: | 2nd quarter 2020 | 33.43 | % | |||||
| Worst quarter: | 1st quarter 2020 | -18.52 | % | |||||
| Average Annual Total Returns as of December 31, 2020 | ||||||||
| 1 Year | Since Inception (10/31/18) | |||||||
| Institutional Class | ||||||||
Return Before Taxes | 44.57% | 30.23% | ||||||
Return After Taxes on Distributions | 43.73% | 29.88% | ||||||
Return After Taxes on Distributions and Sale of Fund Shares | 26.65% | 23.72% | ||||||
| Investor Class | ||||||||
Return Before Taxes | 43.89% | 29.75% | ||||||
Russell 2500® Growth Index (reflects no deduction for fees, expenses or taxes) | 40.47% | 27.48% | ||||||
After‑tax returns are shown only for Institutional Class shares, and the after‑tax returns for Investor Class shares will vary. After‑tax returns are calculated using the historical highest individual federal marginal income tax rates and do not reflect the impact of state and local taxes. Your actual after‑tax returns depend on your tax situation and may differ from those shown. After‑tax returns are not relevant if you hold your shares through a tax‑deferred account, such as a 401(k) plan or an individual retirement account.
Investment Advisor
Robert W. Baird & Co. Incorporated is the Fund’s investment advisor.
13
Portfolio Manager
| Name | Portfolio Manager of the Fund Since | Title | ||||||
| Jonathan Good | 2018 | Portfolio Manager for Baird Equity Asset Management and Director of the Advisor | ||||||
For important information about the purchase and sale of Fund shares, tax information and financial intermediary compensation, please turn to “Purchase and Sale of Fund Shares, Taxes and Financial Intermediary Compensation” on page 44.
14
| Baird Small/Mid Cap Value Fund | ||
Investment Objective
The investment objective of the Baird Small/Mid Cap Value Fund (the “Fund”) is to provide long-term capital appreciation.
Fees and Expenses of the Fund
The table below describes the fees and expenses that you may pay if you buy, hold and sell shares of the Fund. You may pay other fees, such as brokerage commissions and other fees to financial intermediaries, which are not reflected in the table and example below.
Shareholder Fees
(fees paid directly from your investment)
None
Annual Fund Operating Expenses
(expenses that you pay each year as a percentage of the value of your investment)
Investor Class Shares | Institutional Class Shares | |||||||
| Management Fees | 0.75% | 0.75% | ||||||
Distribution and Service (12b-1) Fees | 0.25% | None | ||||||
| Other Expenses | 0.90% | 0.90% | ||||||
| Total Annual Fund Operating Expenses | 1.90% | 1.65% | ||||||
Less: Fee Waiver/Expense Reimbursement(1) | -0.80% | -0.80% | ||||||
| Total Annual Fund Operating Expenses After Fee Waiver/Expense Reimbursement | 1.10% | 0.85% | ||||||
(1)Robert W. Baird & Co. Incorporated (the “Advisor”) has contractually agreed to waive management fees and/or reimburse other expenses in order to limit the Fund’s total annual fund operating expenses to 1.10% of average daily net assets for the Investor Class shares and 0.85% of average daily net assets for the Institutional Class shares. The Advisor’s expense reimbursement agreement includes the fees and expenses incurred by the Fund in connection with the Fund’s investments in other investment companies (to the extent, in the aggregate, such expenses exceed 0.0049% of the Fund’s net assets) and interest expense, but excludes taxes, brokerage commissions and extraordinary expenses. If such excluded expenses were incurred, Fund expenses would be higher. The Advisor is entitled to recoup the fees waived and/or expenses reimbursed within a three-year period from the time the expenses were incurred, provided that the aggregate amount actually paid by the Fund toward the operating expenses in any month (taking into account the recoupment) will not cause the Fund to exceed the lesser of: (1) the expense cap in place at the time of the fee waiver and/or expense reimbursement; or (2) the expense cap in place at the time of the recoupment. The agreement will continue in effect at least through April 30, 2022 and may only be terminated prior to the end of this term by or with the consent of the Board of Directors.
15
Example
This Example is intended to help you compare the cost of investing in the Fund with the cost of investing in other mutual funds.
The Example assumes that you invest $10,000 in the Fund for the time periods indicated and then redeem all of your shares at the end of those periods. The Example also assumes that your investment has a 5% return each year and that the Fund’s operating expenses remain the same. Please note that the one-year numbers below are based on the Fund’s net expenses resulting from the expense reimbursement agreement described above. Although your actual costs may be higher or lower, based on these assumptions your costs would be:
| 1 Year | 3 Years | 5 Years | 10 Years | |||||||||||
| Investor Class Shares | $112 | $519 | $952 | $2,157 | ||||||||||
| Institutional Class Shares | $87 | $442 | $822 | $1,887 | ||||||||||
Portfolio Turnover
The Fund pays transaction costs, such as commissions, when it buys and sells securities (or “turns over” its portfolio). A higher portfolio turnover rate may indicate higher transaction costs and may result in higher taxes when Fund shares are held in a taxable account. These costs, which are not reflected in total annual fund operating expenses or in the example, affect the Fund’s performance. During the most recent fiscal year, the Fund’s portfolio turnover rate was 84% of the average value of its portfolio.
Principal Investment Strategies
The Fund normally invests at least 80% of its net assets, plus any borrowings for investment purposes, in a diversified portfolio of common stocks of companies with small-to-medium market capitalizations. The Advisor defines such companies as those with a maximum market capitalization of $17 billion at the time of investment. Although the Fund invests principally in U.S. companies, the Fund may invest up to 15% of its total assets in equity securities (consisting of common stocks, ordinary shares and American Depositary Receipts (“ADRs”)) of foreign companies that are traded on U.S. exchanges. The Advisor seeks to identify industries and business models that it believes are priced at a discount to their true value because they are currently out of favor with the market or have earnings or profit potential that may be underestimated by Wall Street analysts. The Advisor seeks to purchase securities of small-to-medium capitalization companies believed to have favorable valuation characteristics and opportunities for increased growth. The Advisor primarily considers the following factors:
•Valuation – Low price/earnings, price/book and price/cash flow ratios. These characteristics are evaluated based upon a proprietary analysis of forecasted levels of profitability.
16
•Balance Sheet Strength – Above average projected net margins, returns on equity, returns on assets, free cash flow generation, and revenue and earnings growth rates; trends in balance sheet items, including inventories and accounts receivable and payable, are also scrutinized.
•Product Offering/Market Position – The company offers a valuable product or service and has a good market position within a viable industry.
•Accounting Policies and Management – The company possesses sound financial and accounting policies and has a high quality management team with a track record of success.
The Advisor also considers environmental, social and governance (ESG) factors in selecting investments for the Fund. As a long-term, buy and hold investor, the Advisor includes ESG considerations as part of its overall investment decision-making. The Advisor believes ESG factors vary across companies, industries, and sectors and therefore does not apply exclusionary ESG screens in selecting investments for the Fund.
The Advisor will typically sell a security held by the Fund when the investment thesis changes, the company’s fundamentals deteriorate, the Advisor identifies portfolio structure or risk management needs and/or the security’s valuation relative to its peer group is no longer attractive.
Principal Risks
Please be aware that you may lose money by investing in the Fund. The following is a summary description of certain risks of investing in the Fund.
Stock Market Risks
Stock prices vary and may fall, thus reducing the value of the Fund’s investments. Certain stocks selected for the Fund’s portfolio may decline in value more than the overall stock market. The U.S. and international markets have recently experienced extreme price volatility and reduced liquidity. Continuing market problems may have adverse effects on the Fund.
Value-Style Investing Risks
Because the Fund focuses on value-style stocks, its performance may at times be worse than the performance of funds that focus on other types of stocks or that have a different investment style. Value-style investing may go out of favor with investors, negatively impacting the Fund’s growth and performance. Value stocks may also fail to appreciate as much as anticipated, and their intrinsic value may not be recognized by the broader market.
17
Management Risks
The Advisor’s judgments about the attractiveness, value and potential appreciation of particular companies’ stocks may prove to be incorrect. Such errors could result in a negative return to the Fund and a loss to you.
Equity Securities Risks
Equity securities may experience sudden, unpredictable drops in value or long periods of decline in value. This change may occur because of factors that affect securities markets generally or factors affecting specific industries, sectors or companies in which the Fund invests.
Common Stock Risks
Common stocks are susceptible to general stock market fluctuations and to volatile increases and decreases in value as market confidence in and perceptions of their issuers change. Holders of common stocks are generally subject to greater risk than holders of preferred stocks and debt obligations of the same issuer because common stockholders generally have inferior rights to receive payments from issuers in comparison with the rights of preferred stockholders, bondholders and other creditors.
Small-to-Medium Market Capitalization Risks
Stocks of companies with small and medium market capitalizations involve a higher degree of risk than investments in the broad-based equities market. Small- to mid-capitalization stocks are often more volatile and less liquid than investments in larger companies, and are more likely to be adversely affected by poor economic or market conditions. In addition, small- to mid-capitalization companies may lack the management experience, financial resources and product diversification of larger companies, making them more susceptible to market pressures and business failure.
Financial Sector Risks
The Fund may invest a relatively large percentage of its assets in the financial sector given its weighting in the Fund’s benchmark and, therefore, the Fund’s performance may be adversely affected by volatility in financial and credit markets. Financial services companies (e.g., banks and insurance companies) are subject to extensive government regulation, interest rate risk, credit losses and price competition, among other factors.
Small Fund Risk
There can be no assurance that the Fund will grow to or maintain an economically viable size.
ESG Considerations Risk
Consideration of ESG factors in the investment process may cause the Advisor to forgo opportunities to invest in certain companies or to gain exposure to certain industries or regions and, therefore, carries the risk that, under certain market conditions, the Fund may underperform funds that do not consider such factors. There are not universally accepted ESG factors and the Advisor will consider them in its discretion.
18
Foreign Securities Risks
Securities of foreign issuers and ADRs are subject to certain inherent risks, such as political or economic instability of the country of issue and government policies, tax rates, withholding of foreign taxes, prevailing interest rates and credit conditions that may differ from those affecting domestic corporations. Securities of foreign issuers and ADRs may also be subject to currency fluctuations and controls and greater fluctuation in price than the securities of domestic corporations. Foreign companies generally are subject to different auditing and financial reporting standards than those applicable to domestic companies.
The United Kingdom (UK) withdrew from the European Union (EU) on January 31, 2020 following a June 2016 referendum referred to as “Brexit.” Although the UK and EU agreed to a trade deal in December 2020, certain post-EU arrangements, such as those relating to the offering of cross-border financial services and sharing of cross-border data, have yet to be reached and the EU’s willingness to grant equivalency to the UK remains uncertain. There is significant market uncertainty regarding Brexit’s ramifications, and the range of possible political, regulatory, economic and market outcomes is difficult to predict. The uncertainty surrounding the UK’s economy, and its legal, political, and economic relationship with the remaining member states of the EU, may cause considerable disruption in securities markets, including decreased liquidity and increased volatility, as well as currency fluctuations in the British pound’s exchange rate against the U.S. dollar.
Recent Market Events
U.S. and international markets have experienced significant periods of volatility in recent months and years due to a number of economic, political, social and global macro factors including the impact of the coronavirus (COVID-19) global pandemic, which has resulted in a global health crisis, business interruptions, growth concerns in the U.S. and overseas, layoffs, rising unemployment claims, changed travel and social behaviors, reduced consumer spending, and fiscal, monetary and other government policy responses. The impact of the COVID-19 pandemic may last for an extended period of time.
Performance
The performance information provides some indication of the risks of investing in the Fund by showing changes in the Fund’s performance from year to year and by showing how the Fund’s average annual returns for one and five years and since inception period compare with those of a broad measure of market performance. Past performance, before and after taxes, is not necessarily an indication of how the Fund will perform in the future. Updated performance information is available on the Fund’s website at www.bairdfunds.com or by calling the Fund toll-free at 1-866-442-2473.
19
Calendar Year Returns for Institutional Class Shares
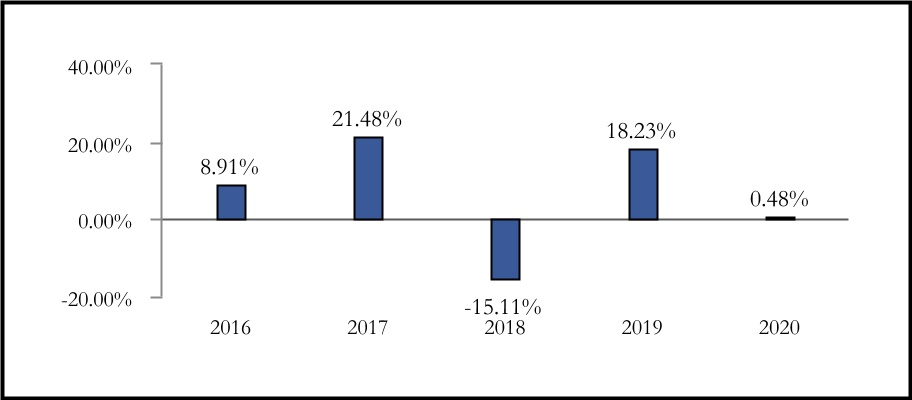
| Best quarter: | 4th quarter 2020 | 24.29 | % | |||||
| Worst quarter: | 1st quarter 2020 | -28.00 | % | |||||
| Average Annual Total Returns as of December 31, 2020 | |||||||||||
| 1 Year | 5 Years | Since Inception (11/30/15) | |||||||||
| Institutional Class | |||||||||||
| Return Before Taxes | 0.48% | 5.94% | 4.85% | ||||||||
| Return After Taxes on Distributions | 0.31% | 5.77% | 4.68% | ||||||||
| Return After Taxes on Distributions and Sale of Fund Shares | 0.41% | 4.63% | 3.77% | ||||||||
| Investor Class | |||||||||||
| Return Before Taxes | 0.15% | 5.64% | 4.56% | ||||||||
Russell 2500® Value Index (reflects no deduction for fees, expenses or taxes) | 4.88% | 9.43% | 8.26% | ||||||||
After‑tax returns are shown only for Institutional Class shares, and the after‑tax returns for Investor Class shares will vary. After‑tax returns are calculated using the historical highest individual federal marginal income tax rates and do not reflect the impact of state and local taxes. Your actual after‑tax returns depend on your tax situation and may differ from those shown. After‑tax returns are not relevant if you hold your shares through a tax‑deferred account, such as a 401(k) plan or an individual retirement account.
The Return After Taxes on Distributions and Sale of Fund Shares may be higher than other return figures when a capital loss occurs upon the redemption of Fund shares and provides an assumed tax benefit that increases the after‑tax return.
20
Investment Advisor
Robert W. Baird & Co. Incorporated is the Fund’s investment advisor.
Portfolio Manager
| Name | Portfolio Manager of the Fund Since | Title | ||||||
| Michelle E. Stevens, CFA | 2015 | Senior Portfolio Manager for Baird Equity Asset Management and Managing Director of the Advisor | ||||||
For important information about the purchase and sale of Fund shares, tax information and financial intermediary compensation, please turn to “Purchase and Sale of Fund Shares, Taxes and Financial Intermediary Compensation” on page 44.
21
| Baird SmallCap Value Fund | ||
Investment Objective
The investment objective of the Baird SmallCap Value Fund (the “Fund”) is to provide long-term capital appreciation.
Fees and Expenses of the Fund
The table below describes the fees and expenses that you may pay if you buy, hold and sell shares of the Fund. You may pay other fees, such as brokerage commissions and other fees to financial intermediaries, which are not reflected in the table and example below.
Shareholder Fees
(fees paid directly from your investment)
None
Annual Fund Operating Expenses
(expenses that you pay each year as a percentage of the value of your investment)
Investor Class Shares | Institutional Class Shares | |||||||
| Management Fees | 0.85% | 0.85% | ||||||
Distribution and Service (12b-1) Fees | 0.25% | None | ||||||
| Other Expenses | 0.79% | 0.79% | ||||||
| Total Annual Fund Operating Expenses | 1.89% | 1.64% | ||||||
Less: Fee Waiver/Expense Reimbursement(1) | -0.69% | -0.69% | ||||||
| Total Annual Fund Operating Expenses After Fee Waiver/Expense Reimbursement | 1.20% | 0.95% | ||||||
(1)Robert W. Baird & Co. Incorporated (the “Advisor”) has contractually agreed to waive management fees and/or reimburse other expenses in order to limit the Fund’s total annual fund operating expenses to 1.20% of average daily net assets for the Investor Class shares and 0.95% of average daily net assets for the Institutional Class shares. The Advisor’s expense reimbursement agreement includes the fees and expenses incurred by the Fund in connection with the Fund’s investments in other investment companies (to the extent, in the aggregate, such expenses exceed 0.0049% of the Fund’s net assets) and interest expense, but excludes taxes, brokerage commissions and extraordinary expenses. If such excluded expenses were incurred, Fund expenses would be higher. The Advisor is entitled to recoup the fees waived and/or expenses reimbursed within a three-year period from the time the expenses were incurred provided that the aggregate amount actually paid by the Fund toward the operating expenses in any month (taking into account the recoupment) will not cause the Fund to exceed the lesser of: (1) the expense cap in place at the time of the fee waiver and/or expense reimbursement; or (2) the expense cap in place at the time of the recoupment. The agreement will continue in effect at least through April 30, 2022 and may only be terminated prior to the end of this term by or with the consent of the Board of Directors.
22
Example
This Example is intended to help you compare the cost of investing in the Fund with the cost of investing in other mutual funds.
The Example assumes that you invest $10,000 in the Fund for the time periods indicated and then redeem all of your shares at the end of those periods. The Example also assumes that your investment has a 5% return each year and that the Fund’s operating expenses remain the same. Please note that the one-year numbers below are based on the Fund’s net expenses resulting from the expense reimbursement agreement described above. Although your actual costs may be higher or lower, based on these assumptions your costs would be:
| 1 Year | 3 Years | 5 Years | 10 Years | |||||||||||
| Investor Class Shares | $122 | $527 | $957 | $2,155 | ||||||||||
| Institutional Class Shares | $97 | $450 | $827 | $1,886 | ||||||||||
Portfolio Turnover
The Fund pays transaction costs, such as commissions, when it buys and sells securities (or “turns over” its portfolio). A higher portfolio turnover rate may indicate higher transaction costs and may result in higher taxes when Fund shares are held in a taxable account. These costs, which are not reflected in total annual fund operating expenses or in the example, affect the Fund’s performance. During the most recent fiscal year, the Fund’s portfolio turnover rate was 61% of the average value of its portfolio.
Principal Investment Strategies
The Fund normally invests at least 80% of its net assets, plus any borrowings for investment purposes, in a diversified portfolio of common stocks of companies with small market capitalizations. The Advisor defines such companies as those with a maximum market capitalization of $8 billion at the time of investment. Although the Fund invests principally in U.S. companies, the Fund may invest up to 15% of its total assets in equity securities (consisting of common stocks, ordinary shares and American Depositary Receipts (“ADRs”)) of foreign companies that are traded on U.S. exchanges. The Advisor seeks to identify industries and business models that it believes are priced at a discount to their true value because they are currently out of favor with the market or have earnings or profit potential that may be underestimated by Wall Street analysts. The Advisor seeks to purchase small-cap securities believed to have favorable valuation characteristics and opportunities for increased growth.
The Advisor also considers environmental, social and governance (ESG) factors in selecting investments for the Fund. As a long-term, buy and hold investor, the Advisor includes ESG considerations as part of its overall investment decision-making. The Advisor believes ESG factors vary across companies, industries, and sectors and therefore does not apply exclusionary ESG screens in selecting investments for the Fund.
23
The Advisor will typically sell a security held by the Fund when the investment thesis changes, the company’s fundamentals deteriorate, the Advisor identifies portfolio structure or risk management needs and/or the security’s valuation relative to its peer group is no longer attractive.
Principal Risks
Please be aware that you may lose money by investing in the Fund. The following is a summary description of certain risks of investing in the Fund.
Stock Market Risks
Stock prices vary and may fall, thus reducing the value of the Fund’s investments. Certain stocks selected for the Fund’s portfolio may decline in value more than the overall stock market. The U.S. and international markets have recently experienced extreme price volatility and reduced liquidity. Continuing market problems may have adverse effects on the Fund.
Value-Style Investing Risks
Because the Fund focuses on value-style stocks, its performance may at times be worse than the performance of funds that focus on other types of stocks or that have a different investment style. Value-style investing may go out of favor with investors, negatively impacting the Fund’s growth and performance. Value stocks may also fail to appreciate as much as anticipated, and their intrinsic value may not be recognized by the broader market.
Management Risks
The Advisor’s judgments about the attractiveness, value and potential appreciation of particular companies’ stocks may prove to be incorrect. Such errors could result in a negative return to the Fund and a loss to you.
Equity Securities Risks
Equity securities may experience sudden, unpredictable drops in value or long periods of decline in value. This change may occur because of factors that affect securities markets generally or factors affecting specific industries, sectors or companies in which the Fund invests.
Common Stock Risks
Common stocks are susceptible to general stock market fluctuations and to volatile increases and decreases in value as market confidence in and perceptions of their issuers change. Holders of common stocks are generally subject to greater risk than holders of preferred stocks and debt obligations of the same issuer because common stockholders generally have inferior rights to receive payments from issuers in comparison with the rights of preferred stockholders, bondholders and other creditors.
Small Market Capitalization Risks
Stocks of companies with small market capitalizations involve a higher degree of risk than investments in the broad-based equities market. Small-capitalization stocks are
24
often more volatile and less liquid than investments in larger companies, and are more likely to be adversely affected by poor economic or market conditions. In addition, small-capitalization companies may lack the management experience, financial resources and product diversification of larger companies, making them more susceptible to market pressures and business failure.
Financial Sector Risks
The Fund may invest a relatively large percentage of its assets in the financial sector given its weighting in the Fund’s benchmark and, therefore, the Fund’s performance may be adversely affected by volatility in financial and credit markets. Financial services companies are subject to extensive government regulation, interest rate risk, credit losses and price competition, among other factors.
Small Fund Risk
There can be no assurance that the Fund will grow to or maintain an economically viable size.
ESG Considerations Risk
Consideration of ESG factors in the investment process may cause the Advisor to forgo opportunities to invest in certain companies or to gain exposure to certain industries or regions and, therefore, carries the risk that, under certain market conditions, the Fund may underperform funds that do not consider such factors. There are not universally accepted ESG factors and the Advisor will consider them in its discretion.
Foreign Securities Risks
Securities of foreign issuers and ADRs are subject to certain inherent risks, such as political or economic instability of the country of issue and government policies, tax rates, withholding of foreign taxes, prevailing interest rates and credit conditions that may differ from those affecting domestic corporations. Securities of foreign issuers and ADRs may also be subject to currency fluctuations and controls and greater fluctuation in price than the securities of domestic corporations. Foreign companies generally are subject to different auditing and financial reporting standards than those applicable to domestic companies.
The United Kingdom (UK) withdrew from the European Union (EU) on January 31, 2020 following a June 2016 referendum referred to as “Brexit.” Although the UK and EU agreed to a trade deal in December 2020, certain post-EU arrangements, such as those relating to the offering of cross-border financial services and sharing of cross-border data, have yet to be reached and the EU’s willingness to grant equivalency to the UK remains uncertain. There is significant market uncertainty regarding Brexit’s ramifications, and the range of possible political, regulatory, economic and market outcomes is difficult to predict. The uncertainty surrounding the UK’s economy, and its legal, political, and economic relationship with the remaining member states of the EU, may cause considerable disruption in securities markets, including decreased liquidity and increased volatility, as well as currency fluctuations in the British pound’s exchange rate against the U.S. dollar.
25
Recent Market Events
U.S. and international markets have experienced significant periods of volatility in recent months and years due to a number of economic, political, social and global macro factors including the impact of the coronavirus (COVID-19) global pandemic, which has resulted in a global health crisis, business interruptions, growth concerns in the U.S. and overseas, layoffs, rising unemployment claims, changed travel and social behaviors, reduced consumer spending, and fiscal, monetary and other government policy responses. The impact of the COVID-19 pandemic may last for an extended period of time.
Performance
The performance information provides some indication of the risks of investing in the Fund by showing changes in the Fund’s performance from year to year and by showing how the Fund’s average annual returns for one and five years and since inception period compare with those of a broad measure of market performance. Past performance, before and after taxes, is not necessarily an indication of how the Fund will perform in the future. Updated performance information is available on the Fund’s website at www.bairdfunds.com or by calling the Fund toll-free at 1-866-442-2473.
Calendar Year Returns for Institutional Class Shares
| Best quarter: | 4th quarter 2020 | 27.62 | % | |||||
| Worst quarter: | 1st quarter 2020 | -27.11 | % | |||||
26
| Average Annual Total Returns as of December 31, 2020 | |||||||||||
| 1 Year | 5 Years | Since Inception (5/1/12) | |||||||||
| Institutional Class | |||||||||||
| Return Before Taxes | 2.85% | 6.69% | 7.73% | ||||||||
| Return After Taxes on Distributions | 1.56% | 5.96% | 7.14% | ||||||||
| Return After Taxes on Distributions and Sale of Fund Shares | 2.58% | 5.20% | 6.18% | ||||||||
| Investor Class | |||||||||||
| Return Before Taxes | 2.54% | 6.43% | 7.46% | ||||||||
Russell 2000® Value Index (reflects no deduction for fees, expenses or taxes) | 4.63% | 9.65% | 9.56% | ||||||||
After‑tax returns are shown only for Institutional Class shares, and the after‑tax returns for Investor Class shares will vary. After‑tax returns are calculated using the historical highest individual federal marginal income tax rates and do not reflect the impact of state and local taxes. Your actual after‑tax returns depend on your tax situation and may differ from those shown. After‑tax returns are not relevant if you hold your shares through a tax‑deferred account, such as a 401(k) plan or an individual retirement account.
The Return After Taxes on Distributions and Sale of Fund Shares may be higher than other return figures when a capital loss occurs upon the redemption of Fund shares and provides an assumed tax benefit that increases the after‑tax return.
Investment Advisor
Robert W. Baird & Co. Incorporated is the Fund’s investment advisor.
Portfolio Manager
| Name | Portfolio Manager of the Fund Since | Title | ||||||
| Michelle E. Stevens, CFA | 2012 | Senior Portfolio Manager for Baird Equity Asset Management and Managing Director of the Advisor | ||||||
For important information about the purchase and sale of Fund shares, tax information and financial intermediary compensation, please turn to “Purchase and Sale of Fund Shares, Taxes and Financial Intermediary Compensation” on page 44.
27
| Chautauqua International Growth Fund | ||
Investment Objective
The investment objective of the Chautauqua International Growth Fund (the “Fund”) is to provide long‑term capital appreciation.
Fees and Expenses of the Fund
The table below describes the fees and expenses that you may pay if you buy, hold and sell shares of the Fund. You may pay other fees, such as brokerage commissions and other fees to financial intermediaries, which are not reflected in the table and example below.
Shareholder Fees
(fees paid directly from your investment)
Investor Class Shares | Institutional Class Shares | |||||||
Redemption Fee (as a percentage of amount redeemed, for shares held 90 days or less) | 2.00% | 2.00% | ||||||
Annual Fund Operating Expenses
(expenses that you pay each year as a percentage of the value of your investment)
(expenses that you pay each year as a percentage of the value of your investment)
Investor Class Shares | Institutional Class Shares | |||||||
| Management Fees | 0.75% | 0.75% | ||||||
| Distribution and Service (12b‑1) Fees | 0.25% | None | ||||||
| Other Expenses | 0.15% | 0.15% | ||||||
| Total Annual Fund Operating Expenses | 1.15% | 0.90% | ||||||
Less: Fee Waiver/Expense Reimbursement(1) | -0.10% | -0.10% | ||||||
| Total Annual Fund Operating Expenses After Fee Waiver/Expense Reimbursement | 1.05% | 0.80% | ||||||
(1)Robert W. Baird & Co. Incorporated (the “Advisor”) has contractually agreed to waive management fees and/or reimburse other expenses in order to limit the Fund’s total annual fund operating expenses to 1.05% of average daily net assets for the Investor Class shares and 0.80% of average daily net assets for the Institutional Class shares. The Advisor’s expense reimbursement agreement includes the fees and expenses incurred by the Fund in connection with the Fund’s investments in other investment companies (to the extent, in the aggregate, such expenses exceed 0.0049% of the Fund’s net assets) and interest expense, but excludes taxes, brokerage commissions and extraordinary expenses. If such excluded expenses were incurred, Fund expenses would be higher. The Advisor is entitled to recoup the fees waived and/or expenses reimbursed within a three‑year period from the time the expenses were incurred provided that the aggregate amount actually paid by the Fund toward the operating expenses in any month (taking into account the recoupment) will not cause the Fund to exceed the lesser of: (1) the expense cap in place at the time of the fee waiver and/or expense reimbursement; or (2) the expense cap
28
in place at the time of the recoupment. The agreement will continue in effect at least through April 30, 2022 and may only be terminated prior to the end of this term by or with the consent of the Board of Directors.
Example
This Example is intended to help you compare the cost of investing in the Fund with the cost of investing in other mutual funds.
The Example assumes that you invest $10,000 in the Fund for the time periods indicated and then redeem all of your shares at the end of those periods. The Example also assumes that your investment has a 5% return each year and that the Fund’s operating expenses remain the same. Please note that the one‑year numbers below are based on the Fund’s net expenses resulting from the expense reimbursement agreement described above. Although your actual costs may be higher or lower, based on these assumptions your costs would be:
| 1 Year | 3 Years | 5 Years | 10 Years | |||||||||||
| Investor Class Shares | $107 | $355 | $623 | $1,389 | ||||||||||
| Institutional Class Shares | $82 | $277 | $489 | $1,099 | ||||||||||
Portfolio Turnover
The Fund pays transaction costs, such as commissions, when it buys and sells securities (or “turns over” its portfolio). A higher portfolio turnover rate may indicate higher transaction costs and may result in higher taxes when Fund shares are held in a taxable account. These costs, which are not reflected in total annual fund operating expenses or in the example, affect the Fund’s performance. During the most recent fiscal year, the Fund’s portfolio turnover rate was 31% of the average value of its portfolio.
Principal Investment Strategies
The Fund invests primarily in equity securities of non‑U.S. companies with medium to large market capitalizations (i.e., those typically with market capitalizations in excess of U.S. $5 billion at the time of purchase). Equity securities in which the Fund may invest include common stocks, preferred stocks, depositary shares and receipts, rights, warrants and exchange-traded funds (“ETFs”). Under normal market conditions, the Fund will invest at least 65% of its total assets at the time of purchase in non‑U.S. companies. The Fund will normally be diversified among at least three countries other than the U.S. The Fund invests in developed markets and emerging markets. In evaluating potential investments, the Advisor considers companies with growth characteristics that the Advisor believes are likely to benefit from current macro‑economic and global trends and possess sustainable competitive advantages. The Fund will normally hold the securities of a limited number (generally 25 to 35) of companies. While the Fund may invest in U.S. companies as a part of its investment
29
strategy, the Fund may invest up to 100% of its assets in non-U.S. companies and may at times have little or no investment in U.S. companies.
In determining whether a company is a U.S. or non-U.S. company, the Advisor considers a number of factors, including the company’s jurisdiction of incorporation or organization, the location of the company’s corporate or operational headquarters or principal place of business, the location of the principal trading market for the company’s common stock, the location(s) of a majority of the company’s assets or production of its goods and services, and the locations of the primary sources of the company’s revenues or profits.
The Advisor believes that environmental, social and governance (ESG) factors can have a material effect on investment returns. The Advisor seeks to understand pertinent ESG topics that are relevant to individual companies that are being considered for investment in the Fund. Examples include, but are not limited to, corporate governance structure, climate change, supply chain integrity, labor practices and human resource management.
The Fund may invest in ETFs. For example, the Fund may invest cash temporarily in ETFs until individual securities are identified for purchase or until the Fund is able to purchase securities in a particular country or region.
The Advisor will typically sell or reduce a position to mitigate specific risk, to take advantage of better opportunities, to avoid country risks, when the Advisor believes that valuations are high relative to changes in the company’s fundamentals, or when operational performance does not meet the Advisor’s expectations.
Principal Risks
Please be aware that you may lose money by investing in the Fund. The following is a summary description of certain risks of investing in the Fund.
Stock Market Risks
Stock prices vary and may fall, thus reducing the value of the Fund’s investments. Certain stocks selected for the Fund’s portfolio may decline in value more than the overall stock market. International markets have recently experienced extreme price volatility and reduced liquidity. Continuing market problems may have adverse effects on the Fund.
Growth‑Style Investing Risks
Because the Fund focuses on growth‑style stocks, its performance may at times be better or worse than the performance of funds that focus on other types of stocks or that have a different investment style. Growth stocks are often characterized by high price‑to‑earnings ratios, which may be more volatile than stocks with lower price‑to‑earnings ratios.
30
Limited Holdings Risks
Although it is diversified, the Fund may invest a relatively high percentage of assets in a focused number of issuers, which may result in increased volatility.
Management Risks
The Advisor’s judgments about the attractiveness, value and potential appreciation of particular companies’ stocks may prove to be incorrect. Such errors could result in a negative return to the Fund and a loss to you.
Equity Securities Risks
Equity securities may experience sudden, unpredictable drops in value or long periods of decline in value. This change may occur because of factors that affect securities markets generally or factors affecting specific industries, sectors or companies in which the Fund invests.
Common Stock Risks
Common stocks are susceptible to general stock market fluctuations and to volatile increases and decreases in value as market confidence in and perceptions of their issuers change. Holders of common stocks are generally subject to greater risk than holders of preferred stocks and debt obligations of the same issuer because common stockholders generally have inferior rights to receive payments from issuers in comparison with the rights of preferred stockholders, bondholders and other creditors.
Currency Risks
The value of foreign investments held by the Fund may be significantly affected by changes in foreign currency exchange rates. Generally, when the U.S. dollar rises in value against a foreign currency, an investment in that foreign currency loses value because it is worth fewer U.S. dollars. The foreign currency exchange market can be highly volatile for a variety of reasons. For example, changes in monetary policy, macro-economic factors, currency conversion expenses, restrictions, exchange control regulation, devaluation and political developments may have a significant impact on the value of any investments denominated in that currency.
Medium and Large Capitalization Risks
Stocks of companies with certain market capitalization may perform differently from the equities markets generally. At times, medium and large capitalization stocks may underperform as compared to small capitalization stocks. Larger, more established companies may be unable to respond to new competitive challenges such as changes in consumer tastes or innovative smaller competitors. Moreover, medium capitalization stocks may perform differently from large capitalization stocks, as medium capitalization stocks may be less liquid and more volatile than large capitalization stocks.
Foreign Securities Risks
Securities of foreign issuers and ADRs are subject to certain inherent risks, such as political or economic instability of the country of issue and government policies, tax
31
rates, withholding of foreign taxes, prevailing interest rates and credit conditions that may differ from those affecting domestic corporations. Securities of foreign issuers and ADRs may also be subject to currency fluctuations and controls and greater fluctuation in price than the securities of domestic corporations. Foreign companies generally are subject to different auditing and financial reporting standards than those applicable to domestic companies.
The United Kingdom (UK) withdrew from the European Union (EU) on January 31, 2020 following a June 2016 referendum referred to as “Brexit.” Although the UK and EU agreed to a trade deal in December 2020, certain post-EU arrangements, such as those relating to the offering of cross-border financial services and sharing of cross-border data, have yet to be reached and the EU’s willingness to grant equivalency to the UK remains uncertain. There is significant market uncertainty regarding Brexit’s ramifications, and the range of possible political, regulatory, economic and market outcomes is difficult to predict. The uncertainty surrounding the UK’s economy, and its legal, political, and economic relationship with the remaining member states of the EU, may cause considerable disruption in securities markets, including decreased liquidity and increased volatility, as well as currency fluctuations in the British pound’s exchange rate against the U.S. dollar.
Emerging Market Risks
Investments in emerging markets can involve risks in addition to and greater than those generally associated with investing in more developed foreign markets. The extent of economic development, political stability, market depth, infrastructure, capitalization, and regulatory oversight can be less than in more developed markets. Emerging market economies can be subject to greater social, economic, regulatory, and political uncertainties, including interruptions in trading. All of these factors can make emerging market securities more volatile and potentially less liquid than securities issued in more developed markets.
Region, Country, Sector Risks
The Fund may invest a higher percentage of its total assets in a particular country, region or sector of international markets, which may have a significant impact on the Fund’s overall portfolio.
ETF Risks
You will indirectly bear fees and expenses charged by the ETFs in which the Fund invests, in addition to the Fund’s direct fees and expenses. Accordingly, your cost of investing in the Fund will generally be higher than the cost of investing directly in the ETF. The market price of ETF shares may trade at a discount to their net asset value or an active trading market for ETF shares may not develop or be maintained. ETFs in which the Fund invests typically will not be able to replicate exactly the performance of the underlying assets they track.
32
Valuation Risks
The prices provided by the Fund’s pricing services or independent dealers or the fair value determinations made by the valuation committee of the Advisor may be different from the prices used by other mutual funds or from the prices at which securities are actually bought or sold. The prices of certain securities provided by pricing services may be subject to frequent and significant change, and will vary depending on the information that is available.
ESG Considerations Risk
Consideration of ESG factors in the investment process may cause the Advisor to forgo opportunities to invest in certain companies or to gain exposure to certain industries or regions and, therefore, carries the risk that, under certain market conditions, the Fund may underperform funds that do not consider such factors. There are not universally accepted ESG factors and the Advisor will consider them in its discretion.
Recent Market Events
U.S. and international markets have experienced significant periods of volatility in recent months and years due to a number of economic, political, social and global macro factors including the impact of the coronavirus (COVID-19) global pandemic, which has resulted in a global health crisis, business interruptions, growth concerns in the U.S. and overseas, layoffs, rising unemployment claims, changed travel and social behaviors, reduced consumer spending, and fiscal, monetary and other government policy responses. The impact of the COVID-19 pandemic may last for an extended period of time.
Performance
The performance information provides some indication of the risks of investing in the Fund by showing changes in the Fund’s performance from year to year and by showing how the Fund’s average annual returns for one year and since inception period compare with those of a broad measure of market performance. Past performance, before and after taxes, is not necessarily an indication of how the Fund will perform in the future. Updated performance information is available on the Fund’s website at www.bairdfunds.com or by calling the Fund toll-free at 1-866-442-2473.
33
Calendar Year Returns for Institutional Class Shares
| Best quarter: | 2nd quarter 2020 | 25.57 | % | |||||
| Worst quarter: | 4th quarter 2018 | -16.88 | % | |||||
| Average Annual Total Returns as of December 31, 2020 | ||||||||
| 1 Year | Since Inception (4/15/16) | |||||||
| Institutional Class | ||||||||
| Return Before Taxes | 39.84% | 14.81% | ||||||
| Return After Taxes on Distributions | 39.65% | 14.21% | ||||||
| Return After Taxes on Distributions and Sale of Fund Shares | 23.77% | 11.68% | ||||||
| Investor Class | ||||||||
| Return Before Taxes | 39.37% | 14.52% | ||||||
MSCI ACWI ex USA Index (reflects no deductions for fees, expenses or taxes) | 10.65% | 9.16% | ||||||
After‑tax returns are shown only for Institutional Class shares, and the after‑tax returns for Investor Class shares will vary. After‑tax returns are calculated using the historical highest individual federal marginal income tax rates and do not reflect the impact of state and local taxes. Your actual after‑tax returns depend on your tax situation and may differ from those shown. After‑tax returns are not relevant if you hold your shares through a tax‑deferred account, such as a 401(k) plan or an individual retirement account.
Investment Advisor
Robert W. Baird & Co. Incorporated is the Fund’s investment advisor.
34
Portfolio Managers
| Name | Portfolio Manager of the Fund Since | Title | ||||||
| Brian Beitner, CFA | 2016 | Portfolio Manager of the Fund, Partner of the Advisor’s Chautauqua Capital Management Division, and Managing Director of the Advisor | ||||||
| Jesse A. Flores, CFA | 2020 | Portfolio Manager of the Fund, Partner of the Advisor’s Chautauqua Capital Management Division, and Director of the Advisor | ||||||
| Haicheng Li, CFA | 2020 | Portfolio Manager of the Fund, Managing Partner of the Advisor’s Chautauqua Capital Management Division, and Director of the Advisor | ||||||
| Nathaniel R. Velarde | 2020 | Portfolio Manager of the Fund, Partner of the Advisor’s Chautauqua Capital Management Division, and Director of the Advisor | ||||||
For important information about the purchase and sale of Fund shares, tax information and financial intermediary compensation, please turn to “Purchase and Sale of Fund Shares, Taxes and Financial Intermediary Compensation” on page 44.
35
| Chautauqua Global Growth Fund | ||
Investment Objective
The investment objective of the Chautauqua Global Growth Fund (the “Fund”) is to provide long‑term capital appreciation.
Fees and Expenses of the Fund
The table below describes the fees and expenses that you may pay if you buy, hold and sell shares of the Fund. You may pay other fees, such as brokerage commissions and other fees to financial intermediaries, which are not reflected in the table and example below.
Shareholder Fees
(fees paid directly from your investment)
Investor Class Shares | Institutional Class Shares | |||||||
Redemption Fee (as a percentage of amount redeemed, for shares held 90 days or less) | 2.00% | 2.00% | ||||||
Annual Fund Operating Expenses
(expenses that you pay each year as a percentage of the value of your investment)
Investor Class Shares | Institutional Class Shares | |||||||
| Management Fees | 0.75% | 0.75% | ||||||
| Distribution and Service (12b‑1) Fees | 0.25% | None | ||||||
| Other Expenses | 0.29% | 0.29% | ||||||
| Total Annual Fund Operating Expenses | 1.29% | 1.04% | ||||||
Less: Fee Waiver/Expense Reimbursement(1) | -0.24% | -0.24% | ||||||
| Total Annual Fund Operating Expenses After Fee Waiver/Expense Reimbursement | 1.05% | 0.80% | ||||||
(1)Robert W. Baird & Co. Incorporated (the “Advisor”) has contractually agreed to waive management fees and/or reimburse other expenses in order to limit the Fund’s total annual fund operating expenses to 1.05% of average daily net assets for the Investor Class shares and 0.80% of average daily net assets for the Institutional Class shares. The Advisor’s expense reimbursement agreement includes the fees and expenses incurred by the Fund in connection with the Fund’s investments in other investment companies (to the extent, in the aggregate, such expenses exceed 0.0049% of the Fund’s net assets) and interest expense, but excludes taxes, brokerage commissions and extraordinary expenses. If such excluded expenses were incurred, Fund expenses would be higher. The Advisor is entitled to recoup the fees waived and/or expenses reimbursed within a three‑year period from the time the expenses were incurred; provided that the aggregate amount actually paid by the Fund toward the operating expenses in any month (taking into account the recoupment) will not cause the Fund to exceed the lesser of: (1) the expense cap in place at the time of the fee waiver and/or expense reimbursement or (2) the expense cap
36
in place at the time of the recoupment. The agreement will continue in effect at least through April 30, 2022 and may only be terminated prior to the end of this term by or with the consent of the Board of Directors.
Example
This Example is intended to help you compare the cost of investing in the Fund with the cost of investing in other mutual funds.
The Example assumes that you invest $10,000 in the Fund for the time periods indicated and then redeem all of your shares at the end of those periods. The Example also assumes that your investment has a 5% return each year and that the Fund’s operating expenses remain the same. Please note that the one‑year numbers below are based on the Fund’s net expenses resulting from the expense reimbursement agreement described above. Although your actual costs may be higher or lower, based on these assumptions your costs would be:
| 1 Year | 3 Years | 5 Years | 10 Years | |||||||||||
| Investor Class Shares | $107 | $385 | $685 | $1,535 | ||||||||||
| Institutional Class Shares | $82 | $307 | $551 | $1,249 | ||||||||||
Portfolio Turnover
The Fund pays transaction costs, such as commissions, when it buys and sells securities (or “turns over” its portfolio). A higher portfolio turnover rate may indicate higher transaction costs and may result in higher taxes when Fund shares are held in a taxable account. These costs, which are not reflected in total annual fund operating expenses or in the example, affect the Fund’s performance. During the most recent fiscal year, the Fund’s portfolio turnover rate was 24% of the average value of its portfolio.
Principal Investment Strategies
The Fund invests primarily in equity securities of both U.S. and non‑U.S. companies with medium to large market capitalizations (i.e., those typically with market capitalizations in excess of U.S. $5 billion at the time of purchase). Equity securities in which the Fund may invest include common stocks, preferred stocks, depositary shares and receipts, rights, warrants and exchange-traded funds (“ETFs”). Under normal market conditions, the Fund will invest at least 40% of its total assets at the time of purchase in non‑U.S. companies. The Fund will normally be diversified among at least three different countries, including the United States. The Fund invests in developed markets and emerging markets. In evaluating potential investments, the Advisor considers companies with growth characteristics that the Advisor believes are likely to benefit from current macro‑economic and global trends and possess sustainable competitive advantages. The Fund will normally hold a limited number (generally 35 to 45) of companies.
37
In determining whether a company is a U.S. or non-U.S. company, the Advisor considers a number of factors, including the company’s jurisdiction of incorporation or organization, the location of the company’s corporate or operational headquarters or principal place of business, the location of the principal trading market for the company’s common stock, the location(s) of a majority of the company’s assets or production of its goods and services, and the locations of the primary sources of the company’s revenues or profits.
The Advisor believes that environmental, social and governance (ESG) factors can have a material effect on investment returns. The Advisor seeks to understand pertinent ESG topics that are relevant to individual companies that are being considered for investment in the Fund. Examples include, but are not limited to, corporate governance structure, climate change, supply chain integrity, labor practices and human resource management.
The Fund may invest in ETFs. For example, the Fund may invest cash temporarily in ETFs until individual securities are identified for purchase or until the Fund is able to purchase securities in a particular country or region.
The Advisor will typically sell or reduce a position to mitigate specific risk, to take advantage of better opportunities, to avoid country risks, when the Advisor believes that valuations are high relative to the changes in the company’s fundamentals, or when operational performance does not meet the Advisor’s expectations.
Principal Risks
Please be aware that you may lose money by investing in the Fund. The following is a summary description of certain risks of investing in the Fund.
Stock Market Risks
Stock prices vary and may fall, thus reducing the value of the Fund’s investments. Certain stocks selected for the Fund’s portfolio may decline in value more than the overall stock market. The U.S. and international markets have recently experienced extreme price volatility and reduced liquidity. Continuing market problems may have adverse effects on the Fund.
Growth‑Style Investing Risks
Because the Fund focuses on growth‑style stocks, its performance may at times be better or worse than the performance of funds that focus on other types of stocks or that have a different investment style. Growth stocks are often characterized by high price‑to‑earnings ratios, which may be more volatile than stocks with lower price‑to‑earnings ratios.
Limited Holdings Risks
Although it is diversified, the Fund may invest a relatively high percentage of assets in a focused number of issuers, which may result in increased volatility.
38
Management Risks
The Advisor’s judgments about the attractiveness, value and potential appreciation of particular companies’ stocks may prove to be incorrect. Such errors could result in a negative return to the Fund and a loss to you.
Equity Securities Risks
Equity securities may experience sudden, unpredictable drops in value or long periods of decline in value. This change may occur because of factors that affect securities markets generally or factors affecting specific industries, sectors or companies in which the Fund invests.
Common Stock Risks
Common stocks are susceptible to general stock market fluctuations and to volatile increases and decreases in value as market confidence in and perceptions of their issuers change. Holders of common stocks are generally subject to greater risk than holders of preferred stocks and debt obligations of the same issuer because common stockholders generally have inferior rights to receive payments from issuers in comparison with the rights of preferred stockholders, bondholders and other creditors.
Currency Risks
The value of foreign investments held by the Fund may be significantly affected by changes in foreign currency exchange rates. Generally, when the U.S. dollar rises in value against a foreign currency, an investment in that foreign currency loses value because it is worth fewer U.S. dollars. The foreign currency exchange market can be highly volatile for a variety of reasons. For example, changes in monetary policy, macro-economic factors, currency conversion expenses, restrictions, exchange control regulation, devaluation and political developments may have a significant impact on the value of any investments denominated in that currency.
Medium to Large Capitalization Risks
Stocks of companies with certain market capitalization may perform differently from the equities markets generally. The Fund’s investments will focus on companies with medium to large market capitalizations. At times, medium capitalization and large capitalization stocks may underperform as compared to small capitalization stocks, and vice versa. Larger, more established companies may be unable to respond to new competitive challenges such as changes in consumer tastes or innovative smaller competitors. Moreover, mid capitalization stocks may perform differently from large capitalization stocks, as medium capitalization stocks may be less liquid and more volatile than large capitalization stocks.
Foreign Securities Risks
Securities of foreign issuers and ADRs are subject to certain inherent risks, such as political or economic instability of the country of issue and government policies, tax rates, withholding of foreign taxes, prevailing interest rates and credit conditions that
39
may differ from those affecting domestic corporations. Securities of foreign issuers and ADRs may also be subject to currency fluctuations and controls and greater fluctuation in price than the securities of domestic corporations. Foreign companies generally are subject to different auditing and financial reporting standards than those applicable to domestic companies.
The United Kingdom (UK) withdrew from the European Union (EU) on January 31, 2020 following a June 2016 referendum referred to as “Brexit.” Although the UK and EU agreed to a trade deal in December 2020, certain post-EU arrangements, such as those relating to the offering of cross-border financial services and sharing of cross-border data, have yet to be reached and the EU’s willingness to grant equivalency to the UK remains uncertain. There is significant market uncertainty regarding Brexit’s ramifications, and the range of possible political, regulatory, economic and market outcomes is difficult to predict. The uncertainty surrounding the UK’s economy, and its legal, political, and economic relationship with the remaining member states of the EU, may cause considerable disruption in securities markets, including decreased liquidity and increased volatility, as well as currency fluctuations in the British pound’s exchange rate against the U.S. dollar.
Emerging Market Risks
Investments in emerging markets can involve risks in addition to and greater than those generally associated with investing in more developed foreign markets. The extent of economic development, political stability, market depth, infrastructure, capitalization, and regulatory oversight can be less than in more developed markets. Emerging market economies can be subject to greater social, economic, regulatory, and political uncertainties, including interruptions in trading. All of these factors can make emerging market securities more volatile and potentially less liquid than securities issued in more developed markets.
Region, Country, Sector Risks
The Fund may invest a higher percentage of its total assets in a particular country, region or sector of international markets, which may have a significant impact on the Fund’s overall portfolio.
ETF Risks
You will indirectly bear fees and expenses charged by the ETFs in which the Fund invests, in addition to the Fund’s direct fees and expenses. Accordingly, your cost of investing in the Fund will generally be higher than the cost of investing directly in the ETF. The market price of ETF shares may trade at a discount to their net asset value or an active trading market for ETF shares may not develop or be maintained. ETFs in which the Fund invests typically will not be able to replicate exactly the performance of the underlying assets they track.
40
Valuation Risks
The prices provided by the Fund’s pricing services or independent dealers or the fair value determinations made by the valuation committee of the Advisor may be different from the prices used by other mutual funds or from the prices at which securities are actually bought or sold. The prices of certain securities provided by pricing services may be subject to frequent and significant change, and will vary depending on the information that is available.
ESG Considerations Risk
Consideration of ESG factors in the investment process may cause the Advisor to forgo opportunities to invest in certain companies or to gain exposure to certain industries or regions and, therefore, carries the risk that, under certain market conditions, the Fund may underperform funds that do not consider such factors. There are not universally accepted ESG factors and the Advisor will consider them in its discretion.
Recent Market Events
U.S. and international markets have experienced significant periods of volatility in recent months and years due to a number of economic, political, social and global macro factors including the impact of the coronavirus (COVID-19) global pandemic, which has resulted in a global health crisis, business interruptions, growth concerns in the U.S. and overseas, layoffs, rising unemployment claims, changed travel and social behaviors, reduced consumer spending, and fiscal, monetary and other government policy responses. The impact of the COVID-19 pandemic may last for an extended period of time.
Performance
The performance information provides some indication of the risks of investing in the Fund by showing changes in the Fund’s performance from year to year and by showing how the Fund’s average annual returns for one year and since inception period compare with those of a broad measure of market performance. Past performance, before and after taxes, is not necessarily an indication of how the Fund will perform in the future. Updated performance information is available on the Fund’s website at www.bairdfunds.com or by calling the Fund toll-free at 1-866-442-2473.
41
Calendar Year Returns for Institutional Class Shares
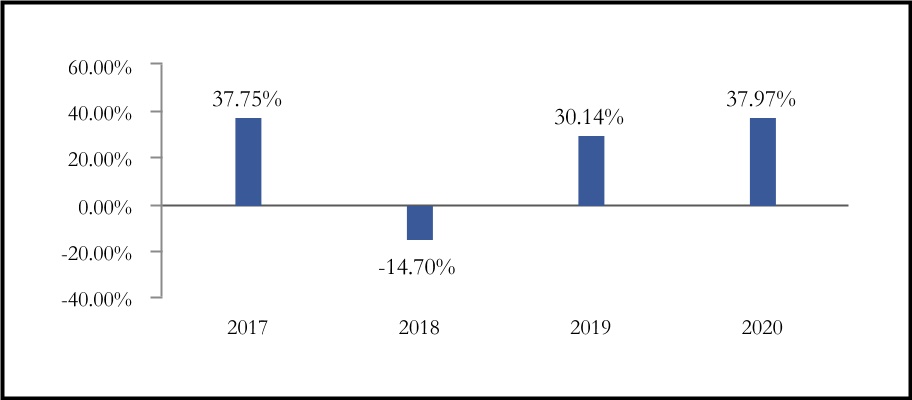
| Best quarter: | 2nd quarter 2020 | 24.11 | % | |||||
| Worst quarter: | 4th quarter 2018 | -18.81 | % | |||||
| Average Annual Total Returns as of December 31, 2020 | ||||||||
| 1 Year | Since Inception (4/15/16) | |||||||
| Institutional Class | ||||||||
| Return Before Taxes | 37.97% | 17.39% | ||||||
| Return After Taxes on Distributions | 37.86% | 16.90% | ||||||
| Return After Taxes on Distributions and Sale of Fund Shares | 22.63% | 13.88% | ||||||
| Investor Class | ||||||||
| Return Before Taxes | 37.94% | 17.15% | ||||||
MSCI ACWI Index (reflects no deductions for fees, expenses or taxes) | 16.25% | 12.65% | ||||||
After‑tax returns are shown only for Institutional Class shares, and the after‑tax returns for Investor Class shares will vary. After‑tax returns are calculated using the historical highest individual federal marginal income tax rates and do not reflect the impact of state and local taxes. Your actual after‑tax returns depend on your tax situation and may differ from those shown. After‑tax returns are not relevant if you hold your shares through a tax‑deferred account, such as a 401(k) plan or an individual retirement account.
Investment Advisor
Robert W. Baird & Co. Incorporated is the Fund’s investment advisor.
42
Portfolio Managers
| Name | Portfolio Manager of the Fund Since | Title | ||||||
| Brian Beitner, CFA | 2016 | Portfolio Manager of the Fund, Partner of the Advisor’s Chautauqua Capital Management Division, and Managing Director of the Advisor | ||||||
| Jesse A. Flores, CFA | 2020 | Portfolio Manager of the Fund, Partner of the Advisor’s Chautauqua Capital Management Division, and Director of the Advisor | ||||||
| Haicheng Li, CFA | 2020 | Portfolio Manager of the Fund, Managing Partner of the Advisor’s Chautauqua Capital Management Division, and Director of the Advisor | ||||||
| Nathaniel R. Velarde | 2020 | Portfolio Manager of the Fund, Partner of the Advisor’s Chautauqua Capital Management Division, and Director of the Advisor | ||||||
For important information about the purchase and sale of Fund shares, tax information and financial intermediary compensation, please turn to “Purchase and Sale of Fund Shares, Taxes and Financial Intermediary Compensation” on page 44.
43
| Purchase and Sale of Fund Shares, Taxes and Financial Intermediary Compensation | ||
Purchase and Sale of Fund Shares
You may purchase or redeem shares of each Fund on any day the New York Stock Exchange (the “NYSE”) is open by written request via mail (Baird Funds, Inc. c/o U.S. Bank Global Fund Services, P.O. Box 701, Milwaukee, WI 53201-0701) or overnight delivery (Baird Funds, Inc. c/o U.S. Bank Global Fund Services, 615 E. Michigan Street, Third Floor, Milwaukee, WI 53202), by wire transfer, by telephone at 1‑866‑442-2473, or through a financial intermediary. Purchases and redemptions by telephone are only permitted if you previously established these options on your account.
The minimum initial and subsequent investment amounts are shown below, although the Funds may reduce or waive them in some cases in their discretion.
| Initial Purchase | Subsequent Purchases | |||||||
| Investor Class | $1,000 – Individual Retirement Accounts (Traditional/Roth/SIMPLE/SEP IRAs) and Coverdell Education Savings Account | $100 | ||||||
| $2,500 – All Other Accounts | $100 | |||||||
| Institutional Class | $10,000 – All Account Types | No minimum | ||||||
Tax Information
Each Fund’s distributions may be subject to federal income tax and may be taxed as ordinary income or long-term capital gains unless you are investing through a tax-deferred or other tax-advantaged arrangement, such as a 401(k) plan or an individual retirement account (“IRA”). You may be taxed later upon the withdrawal of monies from such tax-deferred or other tax-advantaged arrangements.
Payments to Broker-Dealers and Other Financial Intermediaries
If you purchase Fund shares through a broker-dealer or other financial intermediary (such as a bank), the Fund and its related companies may pay the intermediary for the sale of Fund shares and related services. These payments may create a conflict of interest by influencing the broker-dealer or other intermediary and your salesperson to recommend the Fund over another investment. In addition, some broker-dealers may regard Institutional Class shares of the Fund as “clean” shares and charge you a commission on the purchase of such shares. Ask your salesperson or visit your financial intermediary’s website for more information.
44
| Principal Investment Strategies, Related Risks and Disclosure of Portfolio Holdings | ||
This Prospectus describes the Baird MidCap Fund (“MidCap Fund”), Baird Small/Mid Cap Growth Fund (the “Small/Mid Cap Growth Fund”), Baird Small/Mid Cap Value Fund (“Small/Mid Cap Value Fund”), Baird SmallCap Value Fund (“SmallCap Value Fund”), Chautauqua International Growth Fund (“International Growth Fund”) and Chautauqua Global Growth Fund (“Global Growth Fund”) (each, a “Fund” and collectively, the “Funds”), six mutual funds offered by Baird Funds, Inc. (“Baird Funds” or the “Company”).
| Investment Objectives | ||
MidCap Fund
The investment objective of the MidCap Fund is to provide long-term growth of capital.
Small/Mid Cap Growth Fund
The investment objective of the Small/Mid Cap Growth Fund is to provide long-term growth of capital.
Small/Mid Cap Value Fund
The investment objective of the Small/Mid Cap Value Fund is to provide long-term capital appreciation.
SmallCap Value Fund
The investment objective of the SmallCap Value Fund is to provide long-term capital appreciation.
International Growth Fund
The investment objective of the International Growth Fund is to provide long‑term capital appreciation.
Global Growth Fund
The investment objective of the Global Growth Fund is to provide long‑term capital appreciation.
These investment objectives are fundamental and may not be changed without shareholder approval. The percentage limitations set forth under “Principal Investment Strategies” are measured at the time of investment.
45
| Principal Investment Strategies | ||
MidCap Fund
The Fund normally invests at least 80% of its net assets, plus any borrowings for investment purposes, in the equity securities of mid-capitalization companies, principally common stocks, preferred stocks, securities convertible into common stocks and ADRs that are traded on major U.S. exchanges. Although the Fund principally invests in U.S. companies, the Fund may invest up to 15% of its total assets in equity securities (consisting of common stocks, ordinary shares and ADRs) of foreign companies. The Fund defines mid-capitalization companies as those companies with a market capitalization within the range of companies in the Russell Midcap® Growth Index at the time of investment. As of March 31, 2021, the market capitalization of companies in the Russell MidCap® Growth Index ranged from $702.3 million to $55.9 billion, with median and weighted average market capitalizations of $12.5 billion and $24.4 billion, respectively. The Index is reconstituted annually in June. The Russell Midcap® Growth Index measures the performance of those Russell Midcap® companies with higher price-to-book ratios and higher forecasted growth values. The Russell Midcap® Index consists of the 800 smallest companies in the Russell 1000® Index. The Russell 1000® Index consists of the largest 1,000 companies in the Russell 3000® Index, which in turn consists of the 3,000 largest U.S. domiciled publicly traded common stocks by market capitalization. These indices do not reflect any deduction for fees, expenses or taxes. A direct investment in an index is not possible.
When analyzing equity securities to be purchased by the Fund, the Advisor emphasizes a company’s growth prospects. The Fund’s investments are selected using a variety of both quantitative techniques and fundamental research in seeking to maximize the Fund’s expected return while controlling risk.
The Fund seeks a portfolio comprised of companies which reflect “PRIME” growth factors. These factors are analyzed as part of the Advisor’s investment process and are represented in the following ways:
•Durable Profitability. Companies with attractive margins and favorable margin trends can drive superior earnings growth.
•Sustainable Revenue Growth. Solid barriers to entry, favorable pricing and demonstrated product/service track record can aid top-line prospects.
•Favorable Industry dynamics.
•Management strength and integrity is a critical element of a high quality company. Growth, profitability and shareholder returns provide insight into management effectiveness. The Advisor seeks companies with management that position their company’s balance sheet to be a source of strength.
46
•Understanding market Expectations of a company is important in assessing risk/return opportunities.
The Advisor believes an analysis of these PRIME factors yields insights to the competitive strength of a business model.
The Advisor applies the following strategies when purchasing securities for the Fund’s portfolio:
•Intentionally avoiding short-term trading strategies and rapid shifts in industry positions.
•Setting sector limits at the greater of 30% of the Fund’s total assets or double the weighting of the Russell Midcap® Growth Index in any one sector, as defined by such index. Thus, the Fund may be heavily invested in a single sector. However, a single sector may include numerous subsectors or industries. The Fund may therefore be concentrated in one sector, while being diversified among several industries.
•Typically holding the securities of fewer than 60 companies with exposure to at least 20 industries.
•Seeking securities whose growth prospects, in the Advisor’s opinion, are not reflected in their current stock prices.
•Limiting the size of any one new position. No security will represent more than 5% of the Fund’s total assets at the time of purchase.
•Leveraging key tools, such as the Advisor’s proprietary tier-board, which provides a visual representation of portfolio positions and enables discussion on relative weights of underlying positions.
The Advisor may sell a security due to achievement of valuation targets, significant change in the initial investment premise or fundamental deterioration. Fundamental deterioration occurs when a company is no longer able to achieve the results generally expected by the investment management team due to a specific issue, such as a loss of a key customer or pricing pressure in the industry.
Small/Mid Cap Growth Fund
The Fund normally invests at least 80% of its net assets, plus any borrowings for investment purposes, in the equity securities of U.S. and foreign small- and mid-capitalization companies, principally common stocks and American Depositary Receipts (“ADRs”) that are traded on major U.S. exchanges. Although the Fund principally invests in U.S. companies, the Fund may invest up to 15% of its total assets in equity securities (consisting of common stocks, ordinary shares and ADRs) of foreign companies. The Fund defines small- and mid-capitalization companies as those companies with a market capitalization within the range of companies in the Russell
47
2500® Growth Index at the time of investment. As of March 31, 2021, the market capitalization of companies in the Russell 2500® Growth Index ranged from $49.3 million to $31.6 billion, with median and weighted average market capitalizations of $1.7 billion and $7.6 billion, respectively. The Russell 2500® Growth Index is reconstituted annually in June. The Russell 2500® Growth Index measures the performance of those Russell 2500® companies with higher price-to-book ratios and higher forecasted growth values. When sorted by market cap, the Russell 2500® Index consists of all of the companies in the Russell 3000® Index, except for the 500 largest companies by market capitalization in that index. The Russell 3000® Index consists of the 3,000 largest U.S. domiciled publicly traded common stocks by market capitalization. These indices do not reflect any deduction for fees, expenses or taxes. A direct investment in an index is not possible.
When analyzing equity securities to be purchased by the Fund, the Advisor emphasizes a company’s growth prospects. The Fund’s investments are selected using a variety of both quantitative techniques and fundamental research in seeking to maximize the Fund’s expected return while controlling risk.
The Fund seeks a portfolio comprised of companies which reflect “PRIME” growth factors. These factors are analyzed as part of the Advisor’s investment process and are represented in the following ways:
•Durable Profitability. Companies with attractive margins and favorable margin trends can drive superior earnings growth.
•Sustainable Revenue Growth. Solid barriers to entry, favorable pricing and demonstrated product/service track records can aid top-line prospects.
•Favorable Industry dynamics.
•Management strength and integrity is a critical element of a high quality company. Growth, profitability and shareholder returns provide insight into management effectiveness. The Advisor seeks companies with management that position their company’s balance sheet to be a source of strength.
•Understanding market Expectations of a company is important in assessing risk/return opportunities.
The Advisor believes an analysis of these PRIME factors yields insights into the competitive strength of a business model.
The Advisor applies the following strategies when purchasing securities for the Fund’s portfolio:
•Typically holding the securities of fewer than 70 companies with exposure to approximately 20 industries.
48
•Seeking securities whose growth prospects, in the Advisor’s opinion, are not reflected in their current stock prices.
•Limiting the size of any one new position. No security will represent more than 5% of the Fund’s total assets at the time of purchase.
The Advisor may sell a security when the price meets or exceeds the Advisor’s targeted valuation or price range for the security, when a significant change occurs that adversely affects the Advisor’s premise or reasons for investing in the security or when the company experiences a fundamental deterioration in its business, financial condition or results, or growth prospects. For example, if the Advisor’s premise for investing in a security is its belief that the company has strong management, that the company’s profitability will improve or that the company will be successful in expending its product or service offerings or in entering new markets, and an adverse event or development significantly impacts that premise, the Advisor would generally sell that security. Fundamental deterioration occurs when a company is no longer able to achieve the results generally expected by the investment management team due to a specific issue, such as a loss of a key customer or pricing pressure in the industry.
Small/Mid Cap Value Fund
The Fund normally invests at least 80% of its net assets, plus any borrowings for investment purposes, in a diversified portfolio of common stocks of companies with small to medium market capitalizations. The Advisor defines such companies as those with a maximum market capitalization of $17 billion at the time of investment.
Although the Fund principally invests in U.S. companies, the Fund may invest up to 15% of its total assets in equity securities consisting of common stocks, ordinary shares and ADRs of foreign companies that are traded on U.S. exchanges. The Advisor seeks to identify industries and business models that it believes are priced at a discount to their true value because they are currently out of favor with the market or have earnings or profit potential that may be underestimated by Wall Street analysts. The Advisor seeks to purchase securities believed to have favorable valuation characteristics and opportunities for increased growth. The Advisor primarily considers the following factors:
•Valuation – Low price/earnings, price/book and price/cash flow ratios. These characteristics are evaluated based upon a proprietary analysis of forecasted levels of profitability.
•Balance Sheet Strength – Above average projected net margins, returns on equity, returns on assets, free cash flow generation, and revenue and earnings growth rates; trends in balance sheet items, including inventories and accounts receivable and payable, are also scrutinized.
49
•Product Offering/Market Position – The company offers a valuable product or service and has a good market position within a viable industry.
•Accounting Policies and Management – The company possesses sound financial and accounting policies and has a high quality management team with a track record of success.
The Advisor believes that environmental, social and governance (ESG) factors can affect investment returns for the Fund. As a long-term, buy and hold investor, the Advisor includes ESG considerations as part of its overall investment decision-making. The Advisor’s research process takes a bottom-up approach and considers relevant opportunities and risks including ESG factors. The Advisor believes ESG factors vary across companies, industries, and sectors and therefore does not apply exclusionary ESG screens in selecting investments for the Fund. Rather, the Advisor considers a company’s attentiveness (or lack thereof) to ESG challenges and opportunities because it provides insight into a company’s quality of management, risk profile and other characteristics that may have long-term implications on the company’s performance.
The Advisor will typically sell a security held by the Fund when the investment thesis changes, the company’s fundamentals deteriorate, the Advisor identifies portfolio structure or risk management needs and/or the security’s valuation relative to its peer group is no longer attractive.
SmallCap Value Fund
The Fund normally invests at least 80% of its net assets, plus any borrowings for investment purposes, in a diversified portfolio of common stocks of companies with small market capitalizations. The Advisor defines such companies as those with a maximum market capitalization of $8 billion at the time of investment.
Although the Fund principally invests in U.S. companies, the Fund may invest up to 15% of its total assets in equity securities consisting of common stocks, ordinary shares and ADRs of foreign companies that are traded on U.S. exchanges. The Advisor seeks to identify industries and business models that it believes are priced at a discount to their true value because they are currently out of favor with the market or have earnings or profit potential that may be underestimated by Wall Street analysts. The Advisor seeks to purchase small-cap securities believed to have favorable valuation characteristics and opportunities for increased growth. The Advisor primarily considers the following factors:
•Valuation – Low price/earnings, price/book and price/cash flow ratios. These characteristics are evaluated based upon a proprietary analysis of forecasted levels of profitability.
•Balance Sheet Strength – Above average projected net margins, returns on equity, returns on assets, free cash flow generation, and revenue and earnings growth rates; trends in balance sheet items, including inventories and accounts receivable and payable, are also scrutinized.
50
•Product Offering/Market Position – The company offers a valuable product or service and has a good market position within a viable industry.
•Accounting Policies and Management – The company possesses sound financial and accounting policies and has a high quality management team with a track record of success.
The Advisor believes that environmental, social and governance (ESG) factors can affect investment returns for the Fund. As a long-term, buy and hold investor, the Advisor includes ESG considerations as part of its overall investment decision-making. The Advisor’s research process takes a bottom-up approach and considers relevant opportunities and risks including ESG factors. The Advisor believes ESG factors vary across companies, industries, and sectors and therefore does not apply exclusionary ESG screens in selecting investments for the Fund. Rather, the Advisor considers a company’s attentiveness (or lack thereof) to ESG challenges and opportunities because it provides insight into a company’s quality of management, risk profile and other characteristics that may have long-term implications on the company’s performance.
The Advisor will typically sell a security held by the Fund when the investment thesis changes, the company’s fundamentals deteriorate, the Advisor identifies portfolio structure or risk management needs and/or the security’s valuation relative to its peer group is no longer attractive.
| Other Principal Investment Strategies (all Funds) | ||
Cash or Similar Investments; Temporary Strategies Under normal circumstances, each Fund may invest up to 20% of its net assets in cash or liquid reserves (such as U.S. government securities, money market mutual funds, repurchase agreements, commercial paper or certificates of deposit). Each Fund may invest up to 100% of its total assets in cash or similar short-term investment grade securities (such as U.S. government securities, money market mutual funds, repurchase agreements, commercial paper or certificates of deposit) as a temporary defensive position during adverse market, economic or political conditions and in other limited circumstances. To the extent a Fund engages in any temporary strategies or maintains a substantial cash position, the Fund may not achieve its investment objective. To the extent that a Fund invests in money market funds, there will be some duplication of expenses because the Fund would bear its pro rata portion of such money market fund’s management fees and operational expenses. | Investment Grade Securities are: Securities rated in one of the four highest categories by Standard & Poor’s (“S&P”), Moody’s Investors Service, Inc. (“Moody’s”), Fitch Ratings (“Fitch”) or another nationally recognized statistical rating organization. | ||||
51
MidCap Fund, Small/Mid Cap Growth Fund, Small/Mid Cap Value Fund and SmallCap Value Fund
Each Fund will provide its shareholders with at least a 60-day notice of any change in such Fund’s policy to invest at least 80% of its assets in the types of securities suggested by its name. For each Fund, the percentage limitations set forth under “Principal Investment Strategies” are measured at the time of investment.
Temporary Investment Measures
Each Fund may temporarily depart from the policy to invest at least 80% of its assets in the types of securities suggested by its name when doing so is believed to be in the Fund’s best interest, so long as the investment is consistent with the Fund’s investment objective. For instance, a Fund may temporarily invest in equity securities of larger capitalization companies, real estate investment trusts or ETFs that are consistent with the Fund’s objective when the Advisor deems appropriate, such as in response to economic or market conditions or when needed for liquidity.
Foreign Securities and ADRs
Each Fund may invest up to 15% of its total assets in common stocks or ordinary shares of foreign issuers and ADRs that are traded on a major U.S. exchange. ADRs are receipts generally issued by U.S. banks or trust companies evidencing ownership of the underlying foreign securities and denominated in U.S. dollars. ADRs may be sponsored or unsponsored. “Sponsored” ADRs are issued jointly by the issuer of the underlying security and the depository and “unsponsored” ADRs are issued without the participation of the issuer of the deposited security. Holders of unsponsored ADRs generally bear all costs of the facility. With sponsored facilities, the underlying issuer typically bears some of the costs of the facility.
International Growth Fund and Global Growth Fund
The International Growth Fund invests primarily in equity securities of non‑U.S. companies with medium to large market capitalizations (i.e., those typically with market capitalizations in excess of U.S. $5 billion at the time of purchase). Equity securities in which the International Growth Fund may invest include common stocks, preferred stocks, depositary shares and receipts, rights, warrants and ETFs. Under normal conditions, the International Growth Fund will invest at least 65% of its total assets at the time of purchase in non‑U.S. companies. The International Growth Fund invests in developed markets and emerging markets. The International Growth Fund will typically own 25 to 35 companies in its portfolio. Under normal market conditions, the International Growth Fund will maintain investments in companies in at least three countries, other than the United States. While the Fund may invest in U.S. companies as part of its investment strategy, the Fund may invest up to 100% of its assets in non-U.S. companies and may at times have little or no investment in U.S. companies.
The Global Growth Fund invests primarily in equity securities of both U.S. and non‑U.S. companies with medium to large market capitalizations (i.e., those typically with market capitalizations in excess of U.S. $5 billion at the time of purchase). Equity
52
securities in which the Global Growth Fund may invest include common stocks, preferred stocks, depositary shares and receipts, rights, warrants and ETFs. Under normal market conditions, the Global Growth Fund will invest at least 40% of its total assets at the time of purchase in non‑U.S. companies. The Global Growth Fund invests in developed markets and emerging markets. The Global Growth Fund will typically own 35 to 45 companies in its portfolio. Under normal market conditions, the Global Growth Fund will maintain investments in at least three countries including the United States.
In determining whether a company is a U.S. or non‑U.S. company, the Advisor considers a number of factors, including the company’s jurisdiction of incorporation or organization, the location of the company’s corporate or operational headquarters or principal place of business, the location of principal trading market for the company’s common stock, the location(s) of a majority of the company’s assets or production of its goods and services, and the locations of the primary sources of the company’s revenues or profits. The International Growth Fund and Global Growth Fund will generally invest in companies with medium and larger market capitalizations (i.e., more than U.S. $5 billion at the time of purchase).
The Advisor seeks to identify companies to which the Advisor assigns a conviction weighting, which takes into account the company’s long‑term appreciation potential as adjusted for the risk of possible disappointment. In evaluating potential investments, the Advisor considers companies with growth characteristics that the Advisor believes are likely to benefit from current macro‑economic and global trends and possess sustainable competitive advantages. The Advisor’s investment process involves a simultaneous assessment of both top‑down and bottom‑up factors. The objective of the Advisor’s top-down analysis is to identify trends in economic and business developments and to understand the economic and currency impacts in the countries where the companies are doing business. With respect to its bottom‑up research, the Advisor utilizes both qualitative analysis as well as quantitative screens to select the best companies for the portfolios. With respect to quantitative screens, the Advisor primarily seeks companies that are growing faster and are more profitable than their peers. The Advisor also checks to ensure that a company meets its strict quality criteria including conservative accounting and balance sheet strength. The Advisor seeks to manage risk through the application of valuation analysis, an emphasis on quality and thoughtful diversification based on sector, country, and region.
The Advisor believes that environmental, social and governance (ESG) factors can affect investment returns. The Advisor believes that well-run companies are good corporate citizens that embrace environmental stewardship and have proper governance. The Advisor seeks to minimize negative outcomes by understanding pertinent ESG topics that are relevant to individual companies that are being considered for investment in the Fund. Examples include, but are not limited to, corporate governance structure, climate change, supply chain integrity, labor practices and human resource management.
53
The Advisor will typically sell or reduce a position to mitigate specific risk, to take advantage of better opportunities, to avoid country risks, when the Advisor believes that valuations are high relative to the company’s fundamentals, or when operational performance does not meet expectations.
| Principal Risks | ||
The main risks of investing in each of the Funds are:
Stock Market Risks
Equity security prices vary and may fall, thus reducing the value of a Fund’s investments. Certain stocks selected for a Fund’s portfolio may decline in value more than the overall stock market. U.S. and international markets have recently experienced extreme price volatility and reduced liquidity. As a result, many of the above risks may be increased. Continuing market problems may have adverse effects on the Funds.
Value-Style Investing Risks (Small/Mid Cap Value Fund and SmallCap Value Fund only)
Because the Small/Mid Cap Value Fund and SmallCap Value Fund focus on value-style stocks, the Funds’ performance may at times be worse than the performance of funds that focus on other types of stocks or that have a different investment style. Value style investing may go out of favor with investors, negatively impacting a Fund’s growth and performance. Value stocks may also fail to appreciate as much as anticipated, and their intrinsic value may not be recognized by the broader market.
Growth-Style Investing Risks (MidCap Fund, Small/Mid Cap Growth Fund, International Growth Fund and Global Growth Fund only)
Different types of stocks tend to shift into and out of favor with stock market investors depending on market and economic conditions. Because the MidCap Fund, Small/Mid Cap Growth Fund, International Growth Fund and Global Growth Fund focus on growth-style stocks, the Funds’ performance may at times be better or worse than the performance of funds that focus on other types of stocks or that have a different investment style. Growth stocks are often characterized by high price-to-earnings ratios, which may be more volatile than stocks with lower price-to-earnings ratios.
Limited Holdings Risks (International Growth Fund and Global Growth Fund)
Although they are diversified, the International Growth Fund and Global Growth Fund may have a relatively high percentage of assets in a smaller number of issuers and may have fewer holdings than other mutual funds. As a result, a decline in the value of an investment in a single issuer could cause a Fund’s overall value to decline to a greater degree than if the Fund held a more diverse portfolio.
54
Management Risks
The Advisor’s judgment about the attractiveness, value and potential appreciation of particular companies’ stocks may prove to be incorrect. Such errors could result in a negative return to a Fund and a loss to you.
Equity Securities Risks
Equity securities may experience sudden, unpredictable drops in value or long periods of decline in value. This change may occur because of factors that affect the securities markets in general, such as adverse changes in economic conditions, the general outlook for corporate earnings, interest rates or investor sentiment. Equity securities may also lose value because of factors affecting an entire industry or sector, such as increases in production costs, or factors directly related to a specific company, such as decisions made by its management.
Common Stock Risks
Common stocks are susceptible to general stock market fluctuations and to volatile increases and decreases in value as market confidence in and perceptions of their issuers change. These investor perceptions are based on various and unpredictable factors including: expectations regarding government, economic, monetary and fiscal policies; inflation and interest rates; economic expansion or contraction; and global or regional political, economic and banking crises. Holders of common stocks are generally subject to greater risk than holders of preferred stocks and debt obligations of the same issuer because common stockholders generally have inferior rights to receive payments from issuers in comparison with the rights of preferred stockholders, bondholders and other creditors.
ETF Risks (International Growth Fund and Global Growth Fund only)
The price of an ETF can fluctuate within a wide range, and a Fund could lose money investing in an ETF if the prices of the securities owned by the ETF go down. In addition, ETFs are subject to risks that the market price of ETF shares may trade at a discount to their NAV, an active trading market for ETF shares may not develop or be maintained, or trading of ETF shares may be halted if the listing exchange’s officials deem such action appropriate, the shares are de-listed from the exchange, or the activation of market-wide “circuit breakers” (which are tied to large decreases in stock prices) halts stock trading generally. Additionally, a Fund will bear its proportionate share of an ETF’s fees and expenses (including management fees, administration fees and custodian fees) in addition to the fees and expenses of the Fund.
Currency Risks (International Growth Fund and Global Growth Fund only)
The value of foreign investments held by the International Growth Fund and Global Growth Fund may be significantly affected by changes in foreign currency exchange rates. Generally, when the U.S. dollar rises in value against a foreign currency, an investment in that foreign currency loses value because it is worth fewer U.S. dollars. The foreign currency exchange market can be highly volatile for a variety of reasons. For example, changes in monetary policy, macro-economic factors, currency conversion
55
expenses, restrictions, exchange control regulation, devaluation and political developments may have a significant impact on the value of any investments denominated in that currency.
Medium and Large Market Capitalization Risks (International Growth Fund and Global Growth Fund only)
Stocks of companies with certain market capitalizations may perform differently from the equities markets generally. The Funds’ investments will focus on companies with medium and large market capitalizations. At times, medium capitalization and large capitalization stocks may underperform as compared to small capitalization stocks, and vice versa. Larger, more established companies may be unable to respond to new competitive challenges such as changes in consumer tastes or innovative smaller competitors. Moreover, medium capitalization stocks may perform differently from large capitalization stocks, as medium capitalization stocks may be less liquid and more volatile than large capitalization stocks.
Mid-Market Capitalization Risks (MidCap Fund only)
The Fund invests primarily in mid-capitalization stocks, which are often more volatile and less liquid than investments in larger companies. The frequency and volume of trading in securities of mid-size companies may be substantially less than is typical of larger companies. Therefore, the securities of mid-size companies may be subject to greater and more abrupt price fluctuations. In addition, mid-size companies may lack the management experience, financial resources and product diversification of larger companies, making them more susceptible to market pressures and business failure. You should expect that the value of the Fund’s shares will be more volatile than the value of shares in a fund that invests primarily in large-capitalization companies.
Smaller Market Capitalization Risks (Small/Mid Cap Growth Fund, Small/Mid Cap Value Fund and SmallCap Value Fund only)
Stocks of companies with small and medium market capitalizations involve a higher degree of risk than investments in the broad-based equities market. Small- to mid-capitalization stocks are often more volatile and less liquid than investments in larger companies, and are more likely to be adversely affected by poor economic or market conditions. The frequency and volume of trading in securities of smaller companies may be substantially less than is typical of larger companies. Therefore, the securities of small- to mid-capitalization companies may be subject to greater and more abrupt price fluctuations. In addition, small- to mid-capitalization companies may lack the management experience, financial resources and product diversification of larger companies, making them more susceptible to market pressures and business failure. A significant percentage of the outstanding shares of a smaller company may also be held by management, which could cause management to have greater influence over actions requiring shareholder approval. The risks of investing in smaller companies generally increase as the size of the companies decreases.
56
Financial Sector Risks (Small/Mid Cap Value Fund and SmallCap Value Fund only)
A Fund may invest a relatively large percentage of its assets in the financial sector and, therefore, a Fund’s performance may be adversely affected by volatility in financial and credit markets. Financial services companies (e.g., banks and insurance companies) are subject to extensive government regulation, interest rate risk, credit losses and price competition, among other factors. In recent years, the financial sector has been significantly impacted by bankruptcies and consolidations of major financial firms. These events may continue to have a significant negative impact on the valuations and stock prices of companies in this sector.
Foreign Securities Risks
Securities of foreign issuers and ADRs are subject to certain inherent risks, such as political or economic instability of the country of issue, the difficulty of predicting international trade patterns and the possibility of imposition of exchange controls. Such securities may also be subject to greater fluctuations in price than securities of domestic corporations. In addition, there may be less publicly available information about a foreign company than about a domestic company. Foreign companies generally are subject to different accounting, auditing and financial reporting standards than those applicable to domestic companies. With respect to certain foreign countries, there is a possibility of expropriation or confiscatory taxation, or diplomatic developments, which could affect investments in those countries. These risks are more pronounced in emerging market countries.
The United Kingdom (UK) withdrew from the European Union (EU) on January 31, 2020 following a June 2016 referendum referred to as “Brexit.” Although the UK and EU agreed to a trade deal in December 2020, certain post-EU arrangements, such as those relating to the offering of cross-border financial services and sharing of cross-border data, have yet to be reached and the EU’s willingness to grant equivalency to the UK remains uncertain. There is significant market uncertainty regarding Brexit’s ramifications, and the range of possible political, regulatory, economic and market outcomes is difficult to predict. The uncertainty surrounding the UK’s economy, and its legal, political, and economic relationship with the remaining member states of the EU, may cause considerable disruption in securities markets, including decreased liquidity and increased volatility, as well as currency fluctuations in the British pound’s exchange rate against the U.S. dollar.
Emerging Market Risks (International Growth Fund and Global Growth Fund only)
Investments in emerging markets can involve risks in addition to and greater than those generally associated with investing in more developed foreign markets. The extent of economic development, political stability, market depth, infrastructure, capitalization, and regulatory oversight can be less than in more developed markets. Emerging market economies can be subject to greater social, economic, regulatory and political uncertainties, including trading suspensions or stock market closures. The frequency, availability and quality of financial information about investments in emerging markets varies. Shareholders have limited rights and few practical remedies in emerging markets
57
and the ability of U.S. authorities to bring enforcement actions in emerging markets may be limited. All of these factors can make emerging market securities more volatile and potentially less liquid than securities issued in more developed markets.
Region, Country, Sector Risks (International Growth Fund and Global Growth Fund only)
A particular Fund may invest a higher percentage of its total assets in a particular country, region or sector of worldwide markets. In such a case, changes affecting that particular country, region or sector may have a significant impact on a Fund’s overall portfolio.
Valuation Risks (International Growth Fund and Global Growth Fund only)
When pricing foreign equity securities held by the International Growth Fund and Global Growth Fund, an evaluated adjustment factor provided by the fair value pricing service approved by the Board will generally be applied to the prices of such securities. The use of an evaluated adjustment factor in such instances is intended to price each such security at its fair value at the time a Fund calculates its NAV by estimating the impact of market fluctuation or movement on a security’s value if its local market were still open for trading alongside the U.S. markets. The prices of such securities, as modified by the evaluated adjustment factor, may be different from the prices used by other mutual funds or from the prices at which such securities are actually bought and sold. In addition, the prices of such securities may be subject to frequent and significant change, and will vary depending on the information that is available.
Small Fund Risk (Small/Mid Cap Growth Fund, Small/Mid Cap Value Fund and SmallCap Value Fund)
There can be no assurance that the Small/Mid Cap Growth Fund, Small/Mid Cap Value Fund or SmallCap Value Fund will grow to or maintain an economically viable size, in which case the Board of Directors may determine to liquidate the Fund. Liquidation of a Fund can be initiated without shareholder approval by the Board of Directors if it determines that liquidation is in the best interests of the Fund. While such risk may apply to funds of any size, such risk is heightened in funds with fewer assets under management.
ESG Considerations Risk (Small/Mid Cap Value Fund, SmallCap Value Fund, International Growth Fund and Global Growth Fund)
Consideration of ESG factors in the investment process may cause the Advisor to forgo opportunities to invest in certain companies or to gain exposure to certain industries or regions and, therefore, carries the risk that, under certain market conditions, the Fund may underperform funds that do not consider such factors. There are not universally accepted ESG factors and the Advisor will consider them in its discretion.
Recent Market Events
U.S. and international markets have experienced volatility in recent months and years due to a number of economic, political and global macro factors, including the impact of the coronavirus (COVID‑19) global pandemic, which has resulted in a public health
58
crisis, business interruptions, growth concerns in the U.S. and overseas, layoffs, rising unemployment claims, changed travel and social behaviors and reduced consumer spending. The effects of COVID‑19 have led to a substantial economic downturn or recession in the U.S. and global economies, the recovery from which is uncertain and may last for an extended period of time. Uncertainties regarding interest rates, political events, rising government debt in the U.S. and trade tensions have also contributed to market volatility. Global economies and financial markets are increasingly interconnected, which increases the possibility that conditions in one country or region might adversely impact issuers in a different country or region. In particular, a rise in protectionist trade policies, slowing global economic growth, risks associated with epidemic and pandemic diseases, risks associated with the United Kingdom’s departure from the European Union, the risk of trade disputes, and the possibility of changes to some international trade agreements, could affect the economies of many nations, including the United States, in ways that cannot necessarily be foreseen at the present time. Continuing market volatility as a result of recent market conditions or other events may have adverse effects on your account.
| Portfolio Holdings Disclosure Policy | ||
A description of the Funds’ policies and procedures with respect to the disclosure of the Funds’ portfolio holdings is available in the Statement of Additional Information (“SAI”) and on the Company’s website at www.bairdfunds.com.
Note Regarding Percentage Limitations
Whenever an investment objective, policy or strategy of the Funds set forth in this Prospectus or the Funds’ SAI states a maximum (or minimum) percentage of a Fund’s assets that may be invested in any type of security or asset class, the percentage is determined immediately after the Fund’s acquisition of that investment, except with respect to percentage limitations on temporary borrowing and illiquid investments. Accordingly, any later increase or decrease resulting from a change in the market value of a security or in a Fund’s assets (e.g., due to net sales or redemptions of Fund shares) will not cause the Fund to violate a percentage limitation. As a result, due to market fluctuations, cash inflows or outflows or other factors, a Fund may exceed such percentage limitations from time to time.
| Who May Want to Invest in the Funds | ||
The Funds may be appropriate for investors who:
•Wish to invest for the long-term;
•Want to realize capital appreciation on investments in equity securities;
•Are looking for an equity component to their portfolio;
59
•Are willing to assume the risk of investing in equity securities; and
•Have long-term goals such as planning for retirement.
The Funds are not appropriate for investors who have short-term financial goals.
Before investing in a Fund, you should carefully consider:
•Your investment goals;
•The amount of time you are willing to leave your money invested; and
•The amount of risk you are willing to take.
| Management of the Funds | ||
| The Advisor | ||
Robert W. Baird & Co. Incorporated (the “Advisor”), subject to the general supervision of the Company’s Board of Directors (the “Board”), serves as the Company’s investment advisor and administers the Company’s business affairs. The Advisor is responsible for the day-to-day management, including making investment decisions and buying and selling securities, of the MidCap Fund, Small/Mid Cap Growth Fund, Small/Mid Cap Value Fund, SmallCap Value Fund, International Growth Fund and Global Growth Fund in accordance with each Fund’s investment objective and policies. Pursuant to an Investment Advisory Agreement between the Company and the Advisor, for its services, the Advisor receives an annual fee of:
•0.75% of the average daily net assets of the MidCap Fund, Small/Mid Cap Growth Fund, Small/Mid Cap Value Fund, International Growth Fund and Global Growth Fund; and
•0.85% of the average daily net assets of the SmallCap Value Fund.
The advisory fee is accrued daily and paid monthly.
The Advisor has contractually agreed to waive its fees and/or reimburse each Fund’s total annual fund operating expenses at least through April 30, 2022 to the extent necessary to ensure that the total operating expenses, including the fees and expenses incurred by a Fund in connection with the Fund’s investments in other investment companies (to the extent, in the aggregate, such fees and expenses on an annual basis exceed 0.0049% of a Fund’s average daily net assets) and interest expense, but excluding taxes, brokerage commissions and extraordinary expenses, do not exceed an annual rate of:
60
•1.10% of the Investor Class’s average daily net assets and 0.85% of the Institutional Class’s average daily net assets for the MidCap Fund;
•1.10% of the Investor Class’s average daily net assets and 0.85% of the Institutional Class’s average daily net assets for the Small/Mid Cap Growth Fund;
•1.10% of the Investor Class’s average daily net assets and 0.85% of the Institutional Class’s average daily net assets for the Small/Mid Cap Value Fund;
•1.20% of the Investor Class’s average daily net assets and 0.95% of the Institutional Class’s average daily net assets for the SmallCap Value Fund;
•1.05% of the Investor Class’s average daily net assets and 0.80% of the Institutional Class’s average daily net assets for the International Growth Fund; and
•1.05% of the Investor Class’s average daily net assets and 0.80% of the Institutional Class’s average daily net assets for the Global Growth Fund.
The Advisor can recoup any expenses or fees of the Funds it has waived or reimbursed within a three-year period provided that the aggregate amount actually paid by a Fund toward the operating expenses in any month (taking into account the recoupment) will not cause the Fund to exceed the lesser of: (1) the expense caps in place at the time of the fee waiver and/or expense reimbursement; or (2) the expense cap in place at the time of the recoupment.
Any waivers or reimbursements have the effect of lowering the overall expense ratio for the applicable Fund and increasing the overall return to investors at the time any such amounts are waived and/or reimbursed.
After expense waivers, the net advisory fee paid to the Advisor for the fiscal year ended December 31, 2020 was equal to 0.75% of the MidCap Fund’s average daily net assets, 0.17% of the Small/Mid Cap Growth Fund’s average daily net assets, 0.00% of the Small/Mid Cap Value Fund’s average daily net assets, 0.16% of the SmallCap Value Fund’s average daily net assets, 0.65% of the International Growth Fund’s average daily net assets and 0.51% of the Global Growth Fund’s average daily net assets.
Discussions regarding the basis for the Board’s approval of the investment advisory agreements with respect to the Funds are available in the Funds’ 2020 annual report.
The Advisor was founded in 1919 and has its main office at 777 East Wisconsin Avenue, Milwaukee, Wisconsin 53202. The Advisor provides investment management
61
services for individuals and institutional clients including pension and profit sharing plans. As of December 31, 2020, the Advisor had approximately $173.5 billion in assets under discretionary management.
| Portfolio Managers | ||
MidCap Fund
Kenneth M. Hemauer, CFA
Ken co-manages the MidCap Fund. He is a Managing Director of the Advisor and a Senior Portfolio Manager for Baird Equity Asset Management. He joined Baird Equity Asset Management in 2001, after spending seven years as a Senior Analyst in the Equity Research Department of the Advisor. He received both a B.B.A. degree and an M.S. degree in Finance from the University of Wisconsin-Madison. He earned the Chartered Financial Analyst designation in 1995.
Charles F. Severson, CFA
Chuck co-manages the MidCap Fund. He is a Managing Director of the Advisor and a Senior Portfolio Manager for Baird Equity Asset Management. He joined the Advisor in 1987 as an Institutional Salesman. In 1991, Chuck joined Baird Equity Asset Management as a Portfolio Manager. He has a B.B.A. degree in Accounting and Finance and an M.S. degree in Finance from the University of Wisconsin-Madison. He earned the Chartered Financial Analyst designation in 1990.
Small/Mid Cap Growth Fund
Jonathan Good
Jonathan serves as the portfolio manager of the Small/Mid Cap Growth Fund. He is a Director of the Advisor and Portfolio Manager for Baird Equity Asset Management. Jonathan has over 19 years of investment experience and has been with Baird Equity Asset Management’s Growth team for 13 years. Before joining the Advisor, Jonathan worked at Gartmore Global Investments as an equity analyst for their Global Health Sciences Fund. Prior to Gartmore, he was at William Blair & Company as an equity research associate covering biotech, life sciences, diagnostics and orthopedics. Jonathan earned his B.S. degree in applied and biomedical sciences from the University of Pennsylvania and his MBA from the Kellogg School of Management at Northwestern University.
Small/Mid Cap Value Fund and SmallCap Value Fund
Michelle E. Stevens, CFA
Michelle is the portfolio manager for the Small/Mid Cap Value Fund and the SmallCap Value Fund and has managed each Fund since its inception. Michelle joined the
62
Advisor in December 2011 as a Managing Director and is a Senior Portfolio Manager for Baird Equity Asset Management. From October 2008 to December 2011, Michelle was Principal and the Chief Investment Officer of Riazzi Asset Management. From June 2001 through September 2008, she was Principal, Portfolio Manager and Value Equity Chief Investment Officer at Transamerica Investment Management, LLC.
International Growth Fund and Global Growth Fund
Brian Beitner, Jesse Flores, Haicheng Li and Nathaniel Velarde co-manage the International Growth and Global Growth Funds. All members of the team share decision-making responsibilities for those Funds.
Brian Beitner, CFA
Brian serves as a portfolio manager of the International Growth and Global Growth Funds. Brian is a Managing Director of the Advisor and Partner of the Advisor’s Chautauqua Capital Management division. Brian has over 35 years of investment management experience. Brian joined the Advisor in January 2016. Prior to joining the Advisor, Brian served as Managing Partner and Chief Investment Officer of Chautauqua Capital Management, LLC, an asset management firm founded by Brian in 2009. From November 1998 to December 2008 he was a Portfolio Manager at Trust Company of the West. Brian received his undergraduate degree and his MBA from the University of Southern California and he is a CFA charterholder.
Jesse A. Flores, CFA
Jesse serves as a portfolio manager of the International Growth and Global Growth Funds. Jesse is a Director of the Advisor and Partner of the Advisor’s Chautauqua Capital Management division. He joined Chautauqua Capital upon earning his MBA. Before graduate school, Jesse was an investment analyst at Blavin & Company where he was a generalist responsible for both equity and high-yield debt securities. Additionally, he covered U.S. semiconductors and hardware as a research analyst at Lehman Brothers and Roth Capital Partners. Jesse has a bachelor’s degree from Cornell University (McMullen Dean’s Scholar, Rawlings Presidential Research Scholar) and an MBA from the Stanford Graduate School of Business. He is a CFA charterholder.
Haicheng Li, CFA
Haicheng serves as a portfolio manager of the International Growth and Global Growth Funds. Haicheng is a Director of the Advisor and Managing Partner of the Advisor’s Chautauqua Capital Management division. Prior to joining the Advisor in 2016, Haicheng worked 14 years as a senior vice president, senior analyst and portfolio manager at TCW Group with specific expertise in healthcare. Haicheng earned an MBA from Stanford, a master’s degree in biological and biomedical sciences from Harvard’s Graduate School of Arts and Sciences and a master’s degree in medical sciences from Harvard Medical School, where she was a research fellow. Haicheng graduated summa cum laude from Rutgers University and was awarded a prestigious Phi Beta Kappa key for academic achievement. Haicheng is a CFA charterholder.
63
Nathaniel R. Velarde
Nate serves as a portfolio manager of the International Growth and Global Growth Funds. Nate is a Director of the Advisor and Partner of the Advisor’s Chautauqua Capital Management division. Prior to joining the Advisor in 2019, Nate was senior vice president, global equity analyst at PIMCO. Nate also spent 7 years at Nuveen Investments in the Tradewinds Global Investors and NWQ Investment Management divisions as managing director, senior equity analyst and director of research. Prior to Nuveen, Nate served as vice president, equity analyst at TCW Group primarily covering industrials, business services and basic materials. Nate earned a bachelor’s degree in economics and an MBA with concentrations in finance and strategic management from the University of Chicago, and a Master’s of Information and Data Science from the University of California - Berkeley.
The Funds’ SAI provides additional information about the portfolio managers, including other accounts managed, ownership of Fund shares and compensation.
| Historical Performance Information for Similar Accounts | ||
| Small/Mid Cap Growth Composite | ||
The following table sets forth the historical composite performance data for all advisory accounts that have investment objectives, policies, strategies and risks substantially similar to those of the Small/Mid Cap Growth Fund (the “Composite”). The Composite accounts are managed by Jonathan Good, the portfolio manager of the Small/Mid Cap Growth Fund, who was supported by analysts on the portfolio management team. The Composite includes all fully discretionary commission accounts that are fully invested in the small-to-mid cap growth investment strategy. The minimum account size for the composite is $100,000. As of December 31, 2020, the Composite consisted of two accounts.
PERFORMANCE OF THE COMPOSITE IS HISTORICAL AND DOES NOT REPRESENT THE FUTURE PERFORMANCE OF THE SMALL/MID CAP GROWTH FUND OR THE ADVISOR.
All returns presented were calculated on a total return basis and include all dividends and interest, accrued income, and realized and unrealized gains and losses and are net of transaction costs. Composite performance reflects the deduction of all management and other fees and expenses and any transaction costs. The methodology used to calculate average annual and calendar year total returns as presented in the following tables differs from the standards required by the SEC for calculation of performance for mutual funds. The Composite’s performance would have been lower than that shown if
64
the accounts included in the Composite had been subject to the net annual operating expenses of the Fund’s Investor Class shares. The standard investment management fee schedule for accounts included in the Composite is 0.85% on the first $10 million, 0.70% on the next $40 million and 0.60% on assets in excess of $50 million. Actual investment advisory fees may vary.
Securities transactions are accounted for on the trade date and accrual accounting is utilized. Cash and cash equivalents are included in performance returns. The Composite’s returns are calculated on a time-weighted basis. The Composite is not subject to the diversification requirements, tax restrictions or investment limitations imposed on the Fund by the 1940 Act, or Subchapter M of the Code. Consequently, the performance results of the Composite could have been adversely affected if it had been regulated under the federal securities and tax laws.
Composite
Average Annual Total Returns
Periods ended 12/31/2020 | Composite Net | Russell 2500® Growth Index (1) | ||||||
| 1 Year | 44.61% | 40.47% | ||||||
| 5 Year | 21.95% | 18.68% | ||||||
| Since Inception 9/30/15 | 21.58% | 18.55% | ||||||
Composite
Calendar Year Total Returns
| Period Ended | Composite Net | Russell 2500® Growth Index (1) | ||||||
| 2020 | 44.61% | 40.47% | ||||||
| 2019 | 37.04% | 32.65% | ||||||
| 2018 | 0.21% | -7.47% | ||||||
| 2017 | 28.70% | 24.46% | ||||||
| 2016 | 5.59% | 9.73% | ||||||
(1)The Russell 2500® Growth Index measures the performance of those Russell 2500® companies with higher price-to-book ratios and higher forecasted growth values. When sorted by market capitalization, the Russell 2500® Index consists of all of the companies in the Russell 3000® Index, except for the 500 largest companies by market capitalization in that index. The Russell 3000® Index consists of the 3,000 largest U.S. domiciled publicly traded common stocks by market capitalization. The Russell 2500® Growth Index reflects no deduction for fees, expenses or taxes.
For a complete list and description of the Advisor’s composites, additional information regarding policies for valuing portfolios and calculating performance, contact the Advisor at 777 East Wisconsin Avenue, Milwaukee, WI 53202 or call 1-800-792-4011.
65
| Financial Highlights | ||
The financial highlights tables are intended to help you understand each Fund’s financial performance for the past five fiscal years or the life of the Fund, as indicated in the tables below. Certain information reflects financial results for a single Fund share. The total returns presented in the table represent the rate that an investor would have earned or lost on an investment in the Fund for the stated periods (assuming reinvestment of all distributions). Information in the table for the fiscal years or periods ended December 31, 2020, 2019, 2018 and 2017 has been audited by Cohen & Company, Ltd., whose report, along with each Fund’s financial statements, is included in the Funds’ annual report, which is available upon request. Information in the table for the fiscal years or periods ended prior to December 31, 2017 was audited by a different public accounting firm.
66
| Baird MidCap Fund – Institutional Class | |||||||||||||||||||||||||||||
| Year Ended December 31, | |||||||||||||||||||||||||||||
| 2020 | 2019 | 2018 | 2017 | 2016 | |||||||||||||||||||||||||
| Per Share Data: | |||||||||||||||||||||||||||||
Net asset value, beginning of year | $22.90 | $17.72 | $19.16 | $15.80 | $14.99 | ||||||||||||||||||||||||
Income from investment operations: | |||||||||||||||||||||||||||||
Net investment loss(1) | (0.08) | (0.02) | (0.03) | (0.03) | (0.02) | ||||||||||||||||||||||||
Net realized and unrealized gains (losses) on investments | 7.99 | 6.44 | (0.30) | 4.28 | 0.83 | ||||||||||||||||||||||||
Total from investment operations | 7.91 | 6.42 | (0.33) | 4.25 | 0.81 | ||||||||||||||||||||||||
| Less distributions: | |||||||||||||||||||||||||||||
Distributions from net realized gains | (2.64) | (1.24) | (1.11) | (0.89) | — | ||||||||||||||||||||||||
Total distributions | (2.64) | (1.24) | (1.11) | (0.89) | — | ||||||||||||||||||||||||
| Net asset value, end of year | $28.17 | $22.90 | $17.72 | $19.16 | $15.80 | ||||||||||||||||||||||||
| Total return | 34.81 | % | 36.31 | % | (1.61) | % | 26.88 | % | 5.40 | % | |||||||||||||||||||
Supplemental data and ratios: | |||||||||||||||||||||||||||||
Net assets, end of year (millions) | $2,065.5 | $1,825.8 | $1,337.4 | $1,279.6 | $1,105.1 | ||||||||||||||||||||||||
| Ratio of expenses to average net assets | 0.82 | % | 0.82 | % | 0.81 | % | 0.83 | % | 0.82 | % | |||||||||||||||||||
Ratio of net investment loss to average net assets | (0.35) | % | (0.07) | % | (0.15) | % | (0.17) | % | (0.14) | % | |||||||||||||||||||
Portfolio turnover rate(2) | 47 | % | 43 | % | 38 | % | 45 | % | 57 | % | |||||||||||||||||||
(1)Calculated using average shares outstanding during the year.
(2)Portfolio turnover is calculated on the basis of the Fund as a whole without distinguishing between the classes of shares issued and excludes in-kind transactions, where applicable.
67
| Baird MidCap Fund – Investor Class | |||||||||||||||||||||||||||||
| Year Ended December 31, | |||||||||||||||||||||||||||||
| 2020 | 2019 | 2018 | 2017 | 2016 | |||||||||||||||||||||||||
| Per Share Data: | |||||||||||||||||||||||||||||
Net asset value, beginning of year | $21.53 | $16.76 | $18.23 | $15.10 | $14.36 | ||||||||||||||||||||||||
Income from investment operations: | |||||||||||||||||||||||||||||
Net investment loss(1) | (0.14) | (0.07) | (0.08) | (0.07) | (0.06) | ||||||||||||||||||||||||
Net realized and unrealized gains (losses) on investments | 7.47 | 6.08 | (0.28) | 4.09 | 0.80 | ||||||||||||||||||||||||
Total from investment operations | 7.33 | 6.01 | (0.36) | 4.02 | 0.74 | ||||||||||||||||||||||||
| Less distributions: | |||||||||||||||||||||||||||||
Distributions from net realized gains | (2.64) | (1.24) | (1.11) | (0.89) | — | ||||||||||||||||||||||||
Total distributions | (2.64) | (1.24) | (1.11) | (0.89) | — | ||||||||||||||||||||||||
| Net asset value, end of year | $26.22 | $21.53 | $16.76 | $18.23 | $15.10 | ||||||||||||||||||||||||
| Total return | 34.32 | % | 35.94 | % | (1.86) | % | 26.61 | % | 5.08 | % | |||||||||||||||||||
| Supplemental data and ratios: | |||||||||||||||||||||||||||||
Net assets, end of year (millions) | $200.3 | $148.3 | $95.5 | $111.4 | $137.2 | ||||||||||||||||||||||||
| Ratio of expenses to average net assets | 1.07 | % | 1.07 | % | 1.06 | % | 1.08 | % | 1.07 | % | |||||||||||||||||||
Ratio of net investment loss to average net assets | (0.60) | % | (0.32) | % | (0.40) | % | (0.42) | % | (0.39) | % | |||||||||||||||||||
Portfolio turnover rate(2) | 47 | % | 43 | % | 38 | % | 45 | % | 57 | % | |||||||||||||||||||
(1)Calculated using average shares outstanding during the year.
(2)Portfolio turnover is calculated on the basis of the Fund as a whole without distinguishing between the classes of shares issued and excludes in-kind transactions, where applicable.
68
| Baird Small/Mid Cap Growth Fund – Institutional Class | ||||||||||||||||||||
| Year Ended December 31, | Period Ended December 31, | |||||||||||||||||||
| 2020 | 2019 | 2018(1) | ||||||||||||||||||
| Per Share Data: | ||||||||||||||||||||
Net asset value, beginning of period | $ | 12.26 | $ | 8.95 | $ | 10.00 | ||||||||||||||
Income from investment operations: | ||||||||||||||||||||
Net investment loss(2) | (0.06) | (0.03) | (0.00 | ) | (3) | |||||||||||||||
Net realized and unrealized gains (losses) on investments | 5.52 | 3.34 | (1.05) | |||||||||||||||||
Total from investment operations | 5.46 | 3.31 | (1.05) | |||||||||||||||||
| Less distributions: | ||||||||||||||||||||
Distributions from net realized gains | (0.33) | — | — | |||||||||||||||||
Total distributions | (0.33) | — | — | |||||||||||||||||
| Net asset value, end of period | $ | 17.39 | $ | 12.26 | $ | 8.95 | ||||||||||||||
| Total return | 44.57 | % | 36.98 | % | (10.50) | % | (4) | |||||||||||||
| Supplemental data and ratios: | ||||||||||||||||||||
Net assets, end of period (millions) | $ | 51.2 | $ | 18.3 | $ | 7.3 | ||||||||||||||
Ratio of expenses to average net assets | 0.85 | % | 0.85 | % | 0.85 | % | (5) | |||||||||||||
Ratio of expenses to average net assets (before waivers) | 1.43 | % | 2.10 | % | 3.88 | % | (5) | |||||||||||||
Ratio of net investment loss to average net assets | (0.41) | % | (0.25) | % | (0.03) | % | (5) | |||||||||||||
Ratio of net investment loss to average net assets (before waivers) | (0.99) | % | (1.50) | % | (3.06) | % | (5) | |||||||||||||
Portfolio turnover rate(6) | 65 | % | 60 | % | 9 | % | (4) | |||||||||||||
(1)Inception was close of business on October 31, 2018.
(2)Calculated using average shares outstanding during the period.
(3)Amount is less than $0.005.
(4)Not annualized.
(5)Annualized.
(6)Portfolio turnover is calculated on the basis of the Fund as a whole without distinguishing between the classes of shares issued and excludes in-kind transactions, where applicable.
69
| Baird Small/Mid Cap Growth Fund – Investor Class | ||||||||||||||||||||
| Year Ended December 31, | Period Ended December 31, | |||||||||||||||||||
| 2020 | 2019 | 2018(1) | ||||||||||||||||||
| Per Share Data: | ||||||||||||||||||||
Net asset value, beginning of period | $ | 12.21 | $ | 8.94 | $ | 10.00 | ||||||||||||||
Income from investment operations: | ||||||||||||||||||||
Net investment loss(2) | (0.09) | (0.06) | (0.00 | ) | (3) | |||||||||||||||
Net realized and unrealized gains (losses) on investments | 5.46 | 3.33 | (1.06) | |||||||||||||||||
Total from investment operations | 5.37 | 3.27 | (1.06) | |||||||||||||||||
| Less distributions: | ||||||||||||||||||||
Distributions from net realized gains | (0.33) | — | — | |||||||||||||||||
Total distributions | (0.33) | — | — | |||||||||||||||||
| Net asset value, end of period | $ | 17.25 | $ | 12.21 | $ | 8.94 | ||||||||||||||
| Total return | 43.89 | % | 36.69 | % | (10.60) | % | (4) | |||||||||||||
| Supplemental data and ratios: | ||||||||||||||||||||
Net assets, end of period (thousands) | $ | 661.0 | $ | 287.3 | $ | 8.9 | ||||||||||||||
Ratio of expenses to average net assets | 1.10 | % | 1.10 | % | 1.10 | % | (5) | |||||||||||||
Ratio of expenses to average net assets (before waivers) | 1.68 | % | 2.35 | % | 4.13 | % | (5) | |||||||||||||
Ratio of net investment loss to average net assets | (0.66) | % | (0.50) | % | (0.28) | % | (5) | |||||||||||||
Ratio of net investment loss to average net assets (before waivers) | (1.24) | % | (1.75) | % | (3.31) | % | (5) | |||||||||||||
Portfolio turnover rate(6) | 65 | % | 60 | % | 9 | % | (4) | |||||||||||||
(1)Inception was close of business on October 31, 2018.
(2)Calculated using average shares outstanding during the period.
(3)Amount is less than $0.005.
(4)Not annualized.
(5)Annualized.
(6)Portfolio turnover is calculated on the basis of the Fund as a whole without distinguishing between the classes of shares issued and excludes in-kind transactions, where applicable.
70
| Baird Small/Mid Cap Value Fund – Institutional Class | |||||||||||||||||||||||||||||
| Year Ended December 31, | |||||||||||||||||||||||||||||
| 2020 | 2019 | 2018 | 2017 | 2016 | |||||||||||||||||||||||||
| Per Share Data: | |||||||||||||||||||||||||||||
| Net asset value, beginning of year | $12.32 | $10.51 | $12.43 | $10.29 | $9.52 | ||||||||||||||||||||||||
Income from investment operations: | |||||||||||||||||||||||||||||
Net investment income(1) | 0.08 | 0.12 | 0.04 | 0.07 | 0.13 | ||||||||||||||||||||||||
Net realized and unrealized gains (losses) on investments | (0.02) | (5) | 1.80 | (1.92) | 2.14 | 0.72 | |||||||||||||||||||||||
Total from investment operations | 0.06 | 1.92 | (1.88) | 2.21 | 0.85 | ||||||||||||||||||||||||
| Less distributions: | |||||||||||||||||||||||||||||
Distributions from net investment income | (0.09) | (0.11) | (0.04) | (0.07) | (0.08) | ||||||||||||||||||||||||
Distributions from net realized gains | — | — | (0.00 | ) | (2) | (0.00 | ) | (2) | — | ||||||||||||||||||||
Total distributions | (0.09) | (0.11) | (0.04) | (0.07) | (0.08) | ||||||||||||||||||||||||
| Net asset value, end of year | $12.29 | $12.32 | $10.51 | $12.43 | $10.29 | ||||||||||||||||||||||||
| Total return | 0.48 | % | 18.23 | % | (15.11) | % | 21.48 | % | 8.91 | % | |||||||||||||||||||
Supplemental data and ratios: | |||||||||||||||||||||||||||||
| Net assets, end of year (millions) | $23.0 | $24.3 | $17.1 | $16.9 | $11.9 | ||||||||||||||||||||||||
Ratio of expenses to average net assets | 0.85 | % | 0.85 | % | 0.94 | % | (3) | 0.95 | % | 0.95 | % | ||||||||||||||||||
Ratio of expenses to average net assets (before waivers) | 1.65 | % | 1.59 | % | 1.75 | % | 1.91 | % | 2.86 | % | |||||||||||||||||||
Ratio of net investment income to average net assets | 0.78 | % | 1.04 | % | 0.34 | % | 0.62 | % | 1.35 | % | |||||||||||||||||||
Ratio of net investment income (loss) to average net assets (before waivers) | (0.02) | % | 0.30 | % | (0.47) | % | (0.34) | % | (0.56) | % | |||||||||||||||||||
Portfolio turnover rate(4) | 84 | % | 37 | % | 34 | % | 60 | % | 38 | % | |||||||||||||||||||
(1)Calculated using average shares outstanding during the year.
(2)Amount is less than $0.005.
(3)Blended rate. Pursuant to the Expense Cap/Reimbursement Agreement effective December 1, 2018, the expense cap decreased to 0.85%. Prior to December 1, 2018, the expense cap was 0.95%.
(4)Portfolio turnover is calculated on the basis of the Fund as a whole without distinguishing between the classes of shares issued and excludes in-kind transactions, where applicable.
(5)Due to timing of capital share transactions, the per share amount of net realized and unrealized gain (loss) on investments varies from the amounts shown in the statement of operations in the Fund’s annual report.
71
| Baird Small/Mid Cap Value Fund – Investor Class | |||||||||||||||||||||||||||||
| Year Ended December 31, | |||||||||||||||||||||||||||||
| 2020 | 2019 | 2018 | 2017 | 2016 | |||||||||||||||||||||||||
| Per Share Data: | |||||||||||||||||||||||||||||
| Net asset value, beginning of year | $12.27 | $10.48 | $12.40 | $10.28 | $9.52 | ||||||||||||||||||||||||
Income from investment operations: | |||||||||||||||||||||||||||||
Net investment income(1) | 0.06 | 0.09 | 0.01 | 0.04 | 0.11 | ||||||||||||||||||||||||
Net realized and unrealized gains (losses) on investments | (0.04) | (5) | 1.78 | (1.90) | 2.13 | 0.71 | |||||||||||||||||||||||
Total from investment operations | 0.02 | 1.87 | (1.89) | 2.17 | 0.82 | ||||||||||||||||||||||||
| Less distributions: | |||||||||||||||||||||||||||||
Distributions from net investment income | (0.01) | (0.08) | (0.03) | (0.05) | (0.06) | ||||||||||||||||||||||||
Distributions from net realized gains | — | — | (0.00 | ) | (2) | (0.00 | ) | (2) | — | ||||||||||||||||||||
Total distributions | (0.01) | (0.08) | (0.03) | (0.05) | (0.06) | ||||||||||||||||||||||||
| Net asset value, end of year | $12.28 | $12.27 | $10.48 | $12.40 | $10.28 | ||||||||||||||||||||||||
| Total return | 0.15 | % | 17.86 | % | (15.25) | % | 21.08 | % | 8.64 | % | |||||||||||||||||||
Supplemental data and ratios: | |||||||||||||||||||||||||||||
| Net assets, end of year (thousands) | $79.1 | $560.4 | $341.5 | $86.1 | $53.2 | ||||||||||||||||||||||||
Ratio of expenses to average net assets | 1.10 | % | 1.10 | % | 1.19 | % | (3) | 1.20 | % | 1.20 | % | ||||||||||||||||||
Ratio of expenses to average net assets (before waivers) | 1.90 | % | 1.84 | % | 2.00 | % | 2.16 | % | 3.11 | % | |||||||||||||||||||
Ratio of net investment income to average net assets | 0.53 | % | 0.79 | % | 0.09 | % | 0.37 | % | 1.10 | % | |||||||||||||||||||
Ratio of net investment income (loss) to average net assets (before waivers) | (0.27) | % | 0.05 | % | (0.72) | % | (0.59) | % | (0.81) | % | |||||||||||||||||||
Portfolio turnover rate(4) | 84 | % | 37 | % | 34 | % | 60 | % | 38 | % | |||||||||||||||||||
(1)Calculated using average shares outstanding during the year.
(2)Amount is less than $0.005.
(3)Blended rate. Pursuant to the Expense Cap/Reimbursement Agreement effective December 1, 2018, the expense cap decreased to 1.10%. Prior to December 1, 2018, the expense cap was 1.20%.
(4)Portfolio turnover is calculated on the basis of the Fund as a whole without distinguishing between the classes of shares issued and excludes in-kind transactions, where applicable.
(5)Due to timing of capital share transactions, the per share amount of net realized and unrealized gain (loss) on investments varies from the amounts shown in the statement of operations in the Fund’s annual report.
72
| Baird SmallCap Value Fund – Institutional Class | |||||||||||||||||||||||||||||
| Year Ended December 31, | |||||||||||||||||||||||||||||
| 2020 | 2019 | 2018 | 2017 | 2016 | |||||||||||||||||||||||||
| Per Share Data: | |||||||||||||||||||||||||||||
Net asset value, beginning of year | $15.96 | $13.58 | $16.99 | $14.83 | $13.03 | ||||||||||||||||||||||||
Income from investment operations: | |||||||||||||||||||||||||||||
Net investment income(1) | 0.03 | 0.13 | 0.05 | 0.09 | 0.21 | ||||||||||||||||||||||||
Net realized and unrealized gains (losses) on investments | 0.43 | (4) | 2.36 | (2.85) | 2.59 | 1.76 | |||||||||||||||||||||||
Total from investment operations | 0.46 | 2.49 | (2.80) | 2.68 | 1.97 | ||||||||||||||||||||||||
| Less distributions: | |||||||||||||||||||||||||||||
Distributions from net investment income | (0.03) | (0.11) | (0.06) | (0.09) | (0.17) | ||||||||||||||||||||||||
Distributions from net realized gains | (0.83) | — | (0.55) | (0.43) | — | ||||||||||||||||||||||||
Total distributions | (0.86) | (0.11) | (0.61) | (0.52) | (0.17) | ||||||||||||||||||||||||
| Net asset value, end of year | $15.56 | $15.96 | $13.58 | $16.99 | $14.83 | ||||||||||||||||||||||||
| Total return | 2.85 | % | 18.40 | % | (16.45) | % | 18.05 | % | 15.11 | % | |||||||||||||||||||
| Supplemental data and ratios: | |||||||||||||||||||||||||||||
Net assets, end of year (millions) | $30.4 | $33.0 | $28.8 | $33.6 | $28.2 | ||||||||||||||||||||||||
| Ratio of expenses to average net assets | 0.95 | % | 0.95 | % | 1.00 | % | (2) | 1.00 | % | 1.00 | % | ||||||||||||||||||
Ratio of expenses to average net assets (before waivers) | 1.64 | % | 1.44 | % | 1.38 | % | 1.35 | % | 1.43 | % | |||||||||||||||||||
Ratio of net investment income to average net assets | 0.21 | % | 0.87 | % | 0.29 | % | 0.61 | % | 1.58 | % | |||||||||||||||||||
Ratio of net investment income (loss) to average net assets (before waivers) | (0.48) | % | 0.38 | % | (0.09) | % | 0.26 | % | 1.15 | % | |||||||||||||||||||
Portfolio turnover rate(3) | 61 | % | 55 | % | 36 | % | 30 | % | 49 | % | |||||||||||||||||||
(1)Calculated using average shares outstanding during the year.
(2)Blended rate. Pursuant to the Expense Cap/Reimbursement Agreement effective December 1, 2018, the expense cap decreased to 0.95%. Prior to December 1, 2018, the expense cap was 1.00%.
(3)Portfolio turnover is calculated on the basis of the Fund as a whole without distinguishing between the classes of shares issued and excludes in-kind transactions, where applicable.
(4)Due to timing of capital share transactions, the per share amount of net realized and unrealized gain (loss) on investments varies from the amounts shown in the statement of operations in the Fund’s annual report.
73
| Baird SmallCap Value Fund – Investor Class | |||||||||||||||||||||||||||||
| Year Ended December 31, | |||||||||||||||||||||||||||||
| 2020 | 2019 | 2018 | 2017 | 2016 | |||||||||||||||||||||||||
| Per Share Data: | |||||||||||||||||||||||||||||
Net asset value, beginning of year | $15.97 | $13.58 | $16.97 | $14.81 | $12.99 | ||||||||||||||||||||||||
Income from investment operations: | |||||||||||||||||||||||||||||
Net investment income (loss)(1) | (0.01) | 0.09 | 0.01 | 0.06 | 0.18 | ||||||||||||||||||||||||
Net realized and unrealized gains (losses) on investments | 0.42 | (4) | 2.37 | (2.85) | 2.58 | 1.75 | |||||||||||||||||||||||
Total from investment operations | 0.41 | 2.46 | (2.84) | 2.64 | 1.93 | ||||||||||||||||||||||||
| Less distributions: | |||||||||||||||||||||||||||||
Distributions from net investment income | (0.03) | (0.07) | — | (0.05) | (0.11) | ||||||||||||||||||||||||
Distributions from net realized gains | (0.83) | — | (0.55) | (0.43) | — | ||||||||||||||||||||||||
Total distributions | (0.86) | (0.07) | (0.55) | (0.48) | (0.11) | ||||||||||||||||||||||||
| Net asset value, end of year | $15.52 | $15.97 | $13.58 | $16.97 | $14.81 | ||||||||||||||||||||||||
| Total return | 2.54 | % | 18.19 | % | (16.71) | % | 17.78 | % | 14.84 | % | |||||||||||||||||||
| Supplemental data and ratios: | |||||||||||||||||||||||||||||
Net assets, end of year (millions) | $0.3 | $0.9 | $0.8 | $2.6 | $2.6 | ||||||||||||||||||||||||
| Ratio of expenses to average net assets | 1.20 | % | 1.20 | % | 1.25 | % | (2) | 1.25 | % | 1.25 | % | ||||||||||||||||||
Ratio of expenses to average net assets (before waivers) | 1.89 | % | 1.69 | % | 1.63 | % | 1.60 | % | 1.68 | % | |||||||||||||||||||
| Ratio of net investment income (loss) to average net assets | (0.04) | % | 0.62 | % | 0.04 | % | 0.36 | % | 1.33 | % | |||||||||||||||||||
Ratio of net investment income (loss) to average net assets (before waivers) | (0.73) | % | 0.13 | % | (0.34) | % | 0.01 | % | 0.90 | % | |||||||||||||||||||
Portfolio turnover rate(3) | 61 | % | 55 | % | 36 | % | 30 | % | 49 | % | |||||||||||||||||||
(1)Calculated using average shares outstanding during the year.
(2)Blended rate. Pursuant to the Expense Cap/Reimbursement Agreement effective December 1, 2018, the expense cap decreased to 1.20%. Prior to December 1, 2018, the expense cap was 1.25%.
(3)Portfolio turnover is calculated on the basis of the Fund as a whole without distinguishing between the classes of shares issued and excludes in-kind transactions, where applicable.
(4)Due to timing of capital share transactions, the per share amount of net realized and unrealized gain (loss) on investments varies from the amounts shown in the statement of operations in the Fund’s annual report.
74
| Chautauqua International Growth Fund – Institutional Class | ||||||||||||||||||||||||||||||||
| Year Ended December 31, | Period Ended December 31, 2016(1) | |||||||||||||||||||||||||||||||
| 2020 | 2019 | 2018 | 2017 | |||||||||||||||||||||||||||||
| Per Share Data: | ||||||||||||||||||||||||||||||||
Net asset value, beginning of period | $12.62 | $10.17 | $12.59 | $9.57 | $10.00 | |||||||||||||||||||||||||||
Income from investment operations: | ||||||||||||||||||||||||||||||||
Net investment income(2) | 0.01 | 0.30 | 0.06 | 0.04 | 0.00 | (3) | ||||||||||||||||||||||||||
Net realized and unrealized gains (losses) on investments and foreign currency translation | 5.00 | 2.42 | (2.19) | 3.41 | (0.43) | |||||||||||||||||||||||||||
Total from investment operations | 5.01 | 2.72 | (2.13) | 3.45 | (0.43) | |||||||||||||||||||||||||||
Less distributions: | ||||||||||||||||||||||||||||||||
Distributions from net investment income | (0.12) | (0.27) | (0.06) | (0.02) | — | |||||||||||||||||||||||||||
Distributions from net realized gains | — | — | (0.23) | (0.41) | — | |||||||||||||||||||||||||||
Total distributions | (0.12) | (0.27) | (0.29) | (0.43) | — | |||||||||||||||||||||||||||
Paid in capital from redemption fees | 0.00 | (3) | 0.00 | (3) | 0.00 | (3) | 0.00 | (3) | — | |||||||||||||||||||||||
| Net asset value, end of period | $17.51 | $12.62 | $10.17 | $12.59 | $9.57 | |||||||||||||||||||||||||||
| Total return | 39.84 | % | 26.72 | % | (16.94) | % | 36.11 | % | (4.30) | % | (4) | |||||||||||||||||||||
| Supplemental data and ratios: | ||||||||||||||||||||||||||||||||
Net assets, end of period (millions) | $321.8 | $172.7 | $85.4 | $74.2 | $14.8 | |||||||||||||||||||||||||||
Ratio of expenses to average net assets | 0.80 | % | 0.80 | % | 0.94 | % | (5) | 0.95 | % | 0.95 | % | (6) | ||||||||||||||||||||
Ratio of expenses to average net assets (before waivers) | 0.90 | % | 0.96 | % | 1.07 | % | 1.20 | % | 2.32 | % | (6) | |||||||||||||||||||||
Ratio of net investment income to average net assets | 0.07 | % | 2.56 | % | 0.51 | % | 0.30 | % | 0.06 | % | (6) | |||||||||||||||||||||
Ratio of net investment income (loss) to average net assets (before waivers) | (0.03) | % | 2.40 | % | 0.38 | % | 0.05 | % | (1.31) | % | (6) | |||||||||||||||||||||
Portfolio turnover rate(7) | 31 | % | 31 | % | 42 | % | 71 | % | 73 | % | (4) | |||||||||||||||||||||
(1)Inception was close of business on April 15, 2016.
(2)Calculated using average shares outstanding during the period.
(3)Amount is less than $0.005.
(4)Not annualized.
75
(5)Blended rate. Pursuant to the Expense Cap/Reimbursement Agreement effective December 1, 2018, the expense cap decreased to 0.80%. Prior to December 1, 2018, the expense cap was 0.95%.
(6)Annualized.
(7)Portfolio turnover is calculated on the basis of the Fund as a whole without distinguishing between the classes of shares issued and excludes in-kind transactions, where applicable.
76
| Chautauqua International Growth Fund – Investor Class | ||||||||||||||||||||||||||||||||
| Year Ended December 31, | Period Ended December 31, 2016(1) | |||||||||||||||||||||||||||||||
| 2020 | 2019 | 2018 | 2017 | |||||||||||||||||||||||||||||
| Per Share Data: | ||||||||||||||||||||||||||||||||
Net asset value, beginning of period | $12.60 | $10.15 | $12.57 | $9.56 | $10.00 | |||||||||||||||||||||||||||
Income from investment operations: | ||||||||||||||||||||||||||||||||
Net investment income (loss)(2) | (0.02) | 0.27 | 0.03 | 0.01 | (0.01) | |||||||||||||||||||||||||||
Net realized and unrealized gains (losses) on investments and foreign currency translation | 4.95 | (8) | 2.41 | (2.19) | 3.41 | (0.44) | ||||||||||||||||||||||||||
Total from investment operations | 4.93 | 2.68 | (2.16) | 3.42 | (0.45) | |||||||||||||||||||||||||||
| Less distributions: | ||||||||||||||||||||||||||||||||
Distributions from net investment income | (0.05) | (0.23) | (0.03) | (0.00 | ) | (3) | — | |||||||||||||||||||||||||
Distributions from net realized gains | — | — | (0.23) | (0.41) | — | |||||||||||||||||||||||||||
Total distributions | (0.05) | (0.23) | (0.26) | (0.41) | — | |||||||||||||||||||||||||||
Paid in capital from redemption fees | 0.00 | (3) | 0.00 | (3) | 0.00 | (3) | 0.00 | (3) | 0.01 | |||||||||||||||||||||||
| Net asset value, end of period | $17.48 | $12.60 | $10.15 | $12.57 | $9.56 | |||||||||||||||||||||||||||
| Total return | 39.37 | % | 26.42 | % | (17.21) | % | 35.86 | % | (4.40) | % | (4) | |||||||||||||||||||||
| Supplemental data and ratios: | ||||||||||||||||||||||||||||||||
Net assets, end of period (millions) | $0.7 | $1.5 | $2.1 | $1.6 | $0.3 | |||||||||||||||||||||||||||
Ratio of expenses to average net assets | 1.05 | % | 1.05 | % | 1.19 | % | (5) | 1.20 | % | 1.20 | % | (6) | ||||||||||||||||||||
Ratio of expenses to average net assets (before waivers) | 1.15 | % | 1.21 | % | 1.32 | % | 1.45 | % | 2.58 | % | (6) | |||||||||||||||||||||
Ratio of net investment income (loss) to average net assets | (0.18) | % | 2.31 | % | 0.26 | % | 0.05 | % | (0.19) | % | (6) | |||||||||||||||||||||
Ratio of net investment income (loss) to average net assets (before waivers) | (0.28) | % | 2.15 | % | 0.13 | % | (0.20) | % | (1.57) | % | (6) | |||||||||||||||||||||
Portfolio turnover rate(7) | 31 | % | 31 | % | 42 | % | 71 | % | 73 | % | (4) | |||||||||||||||||||||
(1)Inception was close of business on April 15, 2016.
(2)Calculated using average shares outstanding during the period.
(3)Amount is less than $0.005.
(4)Not annualized.
77
(5)Blended rate. Pursuant to the Expense Cap/Reimbursement Agreement effective December 1, 2018, the expense cap decreased to 1.05%. Prior to December 1, 2018, the expense cap was 1.20%.
(6)Annualized.
(7)Portfolio turnover is calculated on the basis of the Fund as a whole without distinguishing between the classes of shares issued and excludes in-kind transactions, where applicable.
(8)Due to timing of capital share transactions, the per share amount of net realized and unrealized gain (loss) on investments varies from the amounts shown in the statement of operations in the Fund’s annual report.
78
| Chautauqua Global Growth Fund – Institutional Class | ||||||||||||||||||||||||||||||||
| Year Ended December 31, | Period Ended December 31, 2016(1) | |||||||||||||||||||||||||||||||
| 2020 | 2019 | 2018 | 2017 | |||||||||||||||||||||||||||||
| Per Share Data: | ||||||||||||||||||||||||||||||||
Net asset value, beginning of period | $14.47 | $11.29 | $13.43 | $10.09 | $10.00 | |||||||||||||||||||||||||||
Income from investment operations: | ||||||||||||||||||||||||||||||||
Net investment income (loss)(2) | (0.03) | 0.22 | 0.00 | (3) | (0.04) | (0.01) | ||||||||||||||||||||||||||
Net realized and unrealized gains (losses) on investments and foreign currency translation | 5.49 | 3.18 | (1.98) | 3.85 | 0.10 | |||||||||||||||||||||||||||
Total from investment operations | 5.46 | 3.40 | (1.98) | 3.81 | 0.09 | |||||||||||||||||||||||||||
Less distributions: | ||||||||||||||||||||||||||||||||
Distributions from net investment income | (0.09) | (0.16) | (0.00 | ) | (3) | — | — | |||||||||||||||||||||||||
Distributions from net realized gains | — | (0.06) | (0.16) | (0.47) | — | |||||||||||||||||||||||||||
Total distributions | (0.09) | (0.22) | (0.16) | (0.47) | — | |||||||||||||||||||||||||||
Paid in capital from redemption fees | 0.01 | 0.00 | (3) | 0.00 | (3) | 0.00 | (3) | — | ||||||||||||||||||||||||
| Net asset value, end of period | $19.85 | $14.47 | $11.29 | $13.43 | $10.09 | |||||||||||||||||||||||||||
| Total return | 37.97 | % | 30.14 | % | (14.70) | % | 37.75 | % | 0.90 | % | (4) | |||||||||||||||||||||
| Supplemental data and ratios: | ||||||||||||||||||||||||||||||||
Net assets, end of period (millions) | $137.3 | $55.8 | $36.8 | $23.2 | $7.6 | |||||||||||||||||||||||||||
Ratio of expenses to average net assets | 0.80 | % | 0.80 | % | 0.94 | % | (5) | 0.95 | % | 0.95 | % | (6) | ||||||||||||||||||||
Ratio of expenses to average net assets (before waivers) | 1.04 | % | 1.23 | % | 1.34 | % | 2.26 | % | 3.65 | % | (6) | |||||||||||||||||||||
Ratio of net investment income (loss) to average net assets | (0.17) | % | 1.64 | % | 0.01 | % | (0.30) | % | (0.16) | % | (6) | |||||||||||||||||||||
Ratio of net investment income (loss) to average net assets (before waivers) | (0.41) | % | 1.21 | % | (0.39) | % | (1.61) | % | (2.86) | % | (6) | |||||||||||||||||||||
Portfolio turnover rate(7) | 24 | % | 26 | % | 38 | % | 61 | % | 69 | % | (4) | |||||||||||||||||||||
(1)Inception was close of business on April 15, 2016.
(2)Calculated using average shares outstanding during the period.
(3)Amount is less than $0.005.
(4)Not annualized.
79
(5)Blended rate. Pursuant to the Expense Cap/Reimbursement Agreement effective December 1, 2018, the expense cap decreased to 0.80%. Prior to December 1, 2018, the expense cap was 0.95%.
(6)Annualized.
(7)Portfolio turnover is calculated on the basis of the Fund as a whole without distinguishing between the classes of shares issued and excludes in-kind transactions, where applicable.
80
| Chautauqua Global Growth Fund – Investor Class | ||||||||||||||||||||||||||||||||
| Year Ended December 31, | Period Ended December 31, 2016(1) | |||||||||||||||||||||||||||||||
| 2020 | 2019 | 2018 | 2017 | |||||||||||||||||||||||||||||
| Per Share Data: | ||||||||||||||||||||||||||||||||
Net asset value, beginning of period | $14.36 | $11.22 | $13.37 | $10.08 | $10.00 | |||||||||||||||||||||||||||
Income from investment operations: | ||||||||||||||||||||||||||||||||
Net investment income (loss)(2) | (0.06) | 0.19 | (0.03) | (0.07) | (0.03) | |||||||||||||||||||||||||||
Net realized and unrealized gains (losses) on investments and foreign currency translation | 5.44 | 3.15 | (1.96) | 3.83 | 0.11 | |||||||||||||||||||||||||||
Total from investment operations | 5.38 | 3.34 | (1.99) | 3.76 | 0.08 | |||||||||||||||||||||||||||
| Less distributions: | ||||||||||||||||||||||||||||||||
Distributions from net investment income | (0.05) | (0.14) | — | — | — | |||||||||||||||||||||||||||
Distributions from net realized gains | — | (0.06) | (0.16) | (0.47) | — | |||||||||||||||||||||||||||
Total distributions | (0.05) | (0.20) | (0.16) | (0.47) | — | |||||||||||||||||||||||||||
| Paid in capital from redemption fees | 0.05 | 0.00 | (3) | 0.00 | (3) | 0.00 | (3) | 0.00 | (3) | |||||||||||||||||||||||
| Net asset value, end of period | $19.74 | $14.36 | $11.22 | $13.37 | $10.08 | |||||||||||||||||||||||||||
| Total return | 37.94 | % | 29.73 | % | (14.86) | % | 37.29 | % | 0.80 | % | (4) | |||||||||||||||||||||
| Supplemental data and ratios: | ||||||||||||||||||||||||||||||||
Net assets, end of period (millions) | $1.7 | $1.6 | $0.7 | $0.7 | $0.2 | |||||||||||||||||||||||||||
Ratio of expenses to average net assets | 1.05 | % | 1.05 | % | 1.19 | % | (5) | 1.20 | % | 1.20 | % | (6) | ||||||||||||||||||||
Ratio of expenses to average net assets (before waivers) | 1.29 | % | 1.48 | % | 1.59 | % | 2.51 | % | 3.90 | % | (6) | |||||||||||||||||||||
Ratio of net investment income (loss) to average net assets | (0.42) | % | 1.39 | % | (0.24) | % | (0.55) | % | (0.41) | % | (6) | |||||||||||||||||||||
Ratio of net investment income (loss) to average net assets (before waivers) | (0.66) | % | 0.96 | % | (0.64) | % | (1.86) | % | (3.11) | % | (6) | |||||||||||||||||||||
Portfolio turnover rate(7) | 24 | % | 26 | % | 38 | % | 61 | % | 69 | % | (4) | |||||||||||||||||||||
(1)Inception was close of business on April 15, 2016.
(2)Calculated using average shares outstanding during the period.
(3)Amount is less than $0.005.
(4)Not annualized.
81
(5)Blended rate. Pursuant to the Expense Cap/Reimbursement Agreement effective December 1, 2018, the expense cap decreased to 1.05%. Prior to December 1, 2018, the expense cap was 1.20%.
(6)Annualized.
(7)Portfolio turnover is calculated on the basis of the Fund as a whole without distinguishing between the classes of shares issued and excludes in-kind transactions, where applicable.
82
| Your Account | ||
| Distribution of Shares | ||
Distributor
The Advisor, Robert W. Baird & Co. Incorporated, is also the distributor (the “Distributor”) of shares of the Funds, and a member of the Financial Industry Regulatory Authority, Inc. (“FINRA”).
Rule 12b-1 Plan
The Funds have adopted a distribution and shareholder service plan on behalf of Investor Class shares and pursuant to Rule 12b-1 under the 1940 Act (the “Rule 12b-1 Plan”). Under the Rule 12b-1 Plan, the Investor Class shares pay the Distributor a fee at an annual rate of 0.25% of their average daily net asset value. The Distributor uses this fee primarily to finance activities that promote the sale of Investor Class shares. Such activities include, but are not necessarily limited to, compensating brokers, dealers, financial intermediaries and sales personnel for distribution and shareholder services, printing and mailing prospectuses to persons other than current shareholders, printing and mailing sales literature, and advertising. Because 12b-1 fees are ongoing, over time these fees will increase the cost of your investment and may cost you more than paying other types of sales charges.
Referral Program
The Distributor has established a referral program pursuant to which it may pay cash compensation to its sales personnel for sales of Institutional Class shares of the Funds. Compensation paid to participants in this program for sales of Institutional Class shares of the Funds may be more or less than compensation they receive for sales of shares of other investment companies. These payments may influence the Distributor’s sales personnel to recommend the Institutional Class shares of the Funds over another investment. These payments are only made for sales to non-ERISA institutional accounts. The Distributor will pay compensation under the referral program out of its own resources. Accordingly, the referral program will not affect the price an investor will pay for Institutional Class shares of the Funds. Please see “Fees and Expenses of the Funds” for information about the Funds’ fees and expenses.
Fund Purchases Through a Financial Intermediary
Financial intermediaries, such as banks, fiduciaries, custodians, investment advisers, and broker-dealers, hold shares of the Funds for their clients through omnibus or networked accounts. The Funds, and/or the Distributor on behalf of the Funds, retain financial intermediaries, as agents, to provide sub-transfer agency, administrative or
83
related shareholder services to their clients for the Funds. The Advisor, the Distributor and/or the Funds pay certain financial intermediaries for performing such services.
The Distributor may also retain financial intermediaries to provide sales, marketing support, or related services to their clients who beneficially own Fund shares. From time to time, the Advisor or the Distributor may pay those financial intermediaries for the provision of those services. Any such payments will be made from the Advisor’s or the Distributor’s own resources. These payments, sometimes referred to as marketing support or revenue sharing payments, are in addition to or in lieu of any amounts payable to the financial intermediary under the Funds’ Rule 12b-1 Plan for the provision of distribution and shareholder services provided by financial intermediaries on behalf of Investor Class shares.
The payments made to these financial intermediaries vary based on a number of factors, including the types of services provided and amount of their clients’ assets invested in the Funds and, with respect to marketing support payments, the level of sales activity. These payments may influence the financial intermediary to recommend the Funds, or a particular class of Fund shares, over another investment.
| Description of Classes | ||
Each Fund offers two classes of shares: Investor Class and Institutional Class. The classes differ with respect to their minimum investments and expenses. Investor Class shares impose a Rule 12b-1 fee that is assessed against the assets of a Fund attributable to that class. Accordingly, the performance information for the Investor Class shares would be lower than the performance information shown for the Institutional Class shares of each Fund.
Financial institutions may receive Rule 12b-1 fees from the Distributor based upon Investor Class shares owned by their clients or customers. The Distributor will determine the schedule of such fees and the basis upon which such fees will be paid.
| Share Price | ||
Shares of each class in a Fund are sold at their net asset value (“NAV”). Shares may be purchased or redeemed on days the New York Stock Exchange (the “NYSE”) is open. The NYSE is closed most national holidays and Good Friday.
84
| The NAV for each class of shares of a Fund is determined as of the close of regular trading on the NYSE (normally 3:00 p.m., Central time) Monday through Friday, except on days the NYSE is not open. If the NYSE closes early, the Fund will calculate the NAV at the closing time on that day. If an emergency exists as permitted by the SEC, NAV may be calculated at a different time. | When making a purchase request, make sure your request is in good order. “Good order” means your purchase request includes: •The name of the Fund and share class; •The dollar amount of shares to be purchased; •Purchase application or investment stub; and •Check payable to Baird Funds or, if paying by wire, receipt of Federal Funds. | ||||
| The NAV for a class of shares is determined by adding the value of each Fund’s investments, cash and other assets attributable to a particular share class, subtracting the liabilities attributable to that class and then dividing the result by the total number of shares outstanding in the class. | |||||
The Board has adopted Pricing and Valuation Committee Procedures (“Pricing Procedures”), which specify how a Fund’s investments are to be valued when calculating the Fund’s NAV. The Board has delegated responsibility for daily pricing of the Funds’ investments to the Advisor. The Funds’ accounting agent calculates the daily NAV for each Fund.
Each Fund’s portfolio investments are generally valued using pricing information provided by a primary independent pricing service. If pricing information is not available from the primary pricing service, pricing information from an approved secondary independent pricing service or another source set forth in the Pricing Procedures may be used. Should pricing information not be available from a primary or secondary pricing service or another permitted source, the investment will be priced at its “fair value” as determined by the Valuation Committee of the Advisor, subject to the ultimate supervision of the Board.
Equity securities, including ETFs and closed-end funds, that are listed on a U.S. securities exchange are generally valued at the last sale price or official closing price at the close of that exchange. If, on a particular day, an exchange-listed security does not trade, then the security will be valued at the average of the most recent bid and asked prices. Over-the-counter equity securities for which reliable quotations are available are valued at the average of the most recent bid and asked prices.
Foreign equity securities listed on a foreign exchange are generally valued at the last sale price on the exchange on which the security is primarily traded at the time of the close of the NYSE. Listed foreign equity securities not traded on a particular day are generally valued at the mean between the last reported bid and asked quotes, or the last sale price when appropriate; otherwise, the security will be priced at fair value by the Valuation Committee. If no such quotations are available, the security will be priced at fair value by the Valuation Committee. When pricing foreign equity securities held by the International Growth Fund and the Global Growth Fund that are traded on markets that have closed prior to the U.S. markets, an evaluated adjustment factor provided by
85
the fair value pricing service approved by the Board will generally be applied to the prices of such securities. The use of an evaluated adjustment factor in such instances is intended to price each such security at its fair value at the time a Fund calculates its NAV by estimating the impact of market fluctuation or movement on a security’s value if its local market were still open for trading alongside the U.S. markets. An evaluated adjustment factor will not be applied to securities primarily traded on markets that are open at the same time as U.S. equity markets are open, or when a reliable evaluated adjustment factor is unavailable.
Shares of mutual funds that are quoted on Nasdaq are generally valued at their last calculated NAV.
Debt obligations are generally valued using evaluated bid prices provided by the primary pricing service. If the primary pricing service does not price a particular debt obligation, a Fund may use an evaluated price provided by a secondary pricing service. If a secondary pricing service does not price a particular debt obligation, the Advisor may obtain and use a valuation from a dealer who was the underwriter for the issuance or who makes a market in that debt obligation or similar debt obligations. If the Advisor cannot obtain a price provided by such a dealer, the debt obligation will generally be priced at fair value by the Valuation Committee. Debt obligations purchased with a remaining maturity of 60 days or less are valued at market prices as described above, unless an evaluated price is not available from a pricing service, in which case such debt obligation is valued at acquisition cost, plus or minus any amortized discount or premium (“amortized cost”), or, if the Advisor does not believe amortized cost is reflective of the fair value of the debt obligation, the debt obligation is priced at fair value by the Valuation Committee.
If pricing information is not readily available from a pricing service or another permitted source, or if the Advisor deems the pricing information to not represent “fair value” of the investment, the investment will be priced at its “fair value” as determined by the Valuation Committee, subject to the ultimate supervision of the Board. The price of the security used by a Fund to calculate its NAV may differ from quoted or published prices for the same security. Fair value pricing involves subjective judgments and there is no single standard for determining a security’s fair value. It is possible that the fair value determined for a security is materially different from the value that could be realized upon the sale of that security or from the values that other mutual funds may determine. In addition, during periods of market volatility or illiquidity, the prices determined for any individual investment on any given day may vary significantly from the amount that can be obtained in an actual sale of that investment, and the Funds’ NAVs may fluctuate significantly from day to day or from period to period.
86
| Buying Shares | ||
Minimum Investments
| Initial Purchase | Subsequent Purchases | |||||||
| Investor Class | $1,000 – Individual Retirement Accounts (Traditional/Roth/SIMPLE/SEP IRAs) and Coverdell Education Savings Account | $100 | ||||||
| $2,500 – All Other Accounts | $100 | |||||||
| Institutional Class | $10,000 – All Account Types | No minimum | ||||||
Minimum Investment Reductions – Institutional Class Shares
The minimum initial investment amount for Institutional Class shares is waived for all employees, directors and officers of the Advisor or the Company and members of their families (including parents, grandparents, siblings, spouses, children and in-laws of such employees, directors and officers). It is also waived for clients of the Advisor who acquire shares of a Fund made available through a mutual fund asset allocation program offered by the Advisor.
Minimum Investment Reductions – Investor and Institutional Class Shares
The investment minimums noted above are waived for investments in Investor and Institutional Class shares by 401(k) and other employer-sponsored retirement plans (excluding IRAs and other one person retirement plans). Also, the minimum initial investment amount for Institutional Class and Investor Class shares may be waived or reduced at the discretion of the Distributor, including waivers or reductions for purchases by health savings plans or made through certain registered investment advisers and qualified third-party platforms.
In-Kind Payments
Payment for shares of the Funds may, in the discretion of the Funds, be made in the form of securities that are permissible investments for the Funds as described in the Prospectus. For further information about this form of payment, contact the Funds (toll-free) at 1-866-442-2473. In connection with an in-kind securities payment, a Fund will require, among other things, that the securities be valued on the day of purchase in accordance with the pricing methods used by the Fund; that the Fund receives satisfactory assurances that it will have good and marketable title to the securities received by it; that the securities be in proper form for transfer to the Fund; that adequate information be provided to the Fund concerning certain tax matters relating to the securities; and that the amount of the purchase be at least $1,000,000. You may realize a taxable gain or loss on the contributed securities at the time of the in-kind securities payment.
87
Timing of Requests
Shares may only be purchased on days when the NYSE is open for business. Your price per share will be the NAV next computed after your request is received in good order by a Fund or its agents. All requests received in good order before the close of regular trading on the NYSE (normally, 3:00 p.m., Central time) will be executed at the NAV computed on that day. Requests received after the close of regular trading on the NYSE will receive the next business day’s NAV.
Receipt of Orders
The Funds may authorize one or more broker-dealers to accept on their behalf purchase and redemption orders that are in good order. In addition, these broker-dealers may designate other financial intermediaries to accept purchase and redemption orders on a Fund’s behalf. Contracts with these agents require the agents to track the time that purchase and redemption orders are received. Purchase and redemption orders must be received by the Funds or their authorized intermediaries before the close of regular trading on the NYSE (normally, 3:00 p.m., Central time) to receive that day’s share price.
Customer Identification Procedures
The Company, on behalf of each Fund, is required to comply with various anti-money laundering laws and regulations. To help the government fight the funding of terrorism and money laundering activities, Federal law requires all financial institutions, including mutual funds, to obtain, verify and record information that identifies each person who opens an account.
In compliance with Uniting and Strengthening America by Providing Appropriate Tools Required to Intercept and Obstruct Terrorism Act of 2001 (the “USA PATRIOT Act”), please note that U.S. Bancorp Fund Services, LLC, the Company’s transfer agent (the “Transfer Agent”), will verify certain information on your account application as part of the Funds’ Anti-Money Laundering Program. As requested on the account application, you must supply your full name, date of birth, social security number and permanent street address. Mailing addresses containing only a P.O. Box will not be accepted. If you are opening the account in the name of a legal entity (e.g., partnership, limited liability company, business trust, corporation, etc.), you must also supply the identity of the beneficial owners. If you require assistance when completing your application, please call (toll free) 1-866-442-2473.
If the Company or the Transfer Agent does not have a reasonable belief of the identity of a shareholder, the initial purchase will be rejected or the shareholder will not be allowed to perform a transaction on the account until such information is received. In the rare event that the Transfer Agent is unable to verify a shareholder’s identity, the Fund reserves the right to redeem the shareholder’s account at the current day’s net asset value. The shareholder will be notified of such action within five business days. Any delay in processing the shareholder’s order will affect the purchase price you
88
receive for the shares. The Company, the Distributor and the Transfer Agent are not liable for fluctuations in NAV experienced as a result of such delays in processing. If at any time the Company or the Transfer Agent detects suspicious behavior or if certain account information matches government lists of suspicious persons, the Company or the Transfer Agent may determine not to open an account, may reject additional purchases, may close an existing account, may file a suspicious activity report and/or may take other action.
The Funds may not be sold to investors residing outside the U.S. and its territories, except upon evidence of compliance with the laws of the applicable foreign jurisdictions.
The Company has appointed an anti-money laundering compliance officer to oversee the implementation of the Company’s Anti-Money Laundering Program.
Market Timing Policy
Depending on various factors (including the size of the Fund, the amount of assets the Advisor typically maintains in cash or cash equivalents, and the dollar amount, number and frequency of trades), short-term or excessive trading into and out of the Funds, generally known as market timing, may harm all shareholders by: disrupting investment strategies; increasing brokerage, administrative and other expenses; decreasing tax efficiency; diluting the value of shares held by long-term shareholders; and impacting Fund performance. The Board has approved policies that seek to discourage frequent purchases and redemptions and curb the disruptive effects of market timing (the “Market Timing Policy”). Pursuant to the Market Timing Policy, the Funds may decline to accept an application or may reject a purchase request, including an exchange, from a market timer or an investor who, in the Advisor’s sole discretion, has a pattern of short-term or excessive trading or whose trading has been or may be disruptive to the Funds. For these purposes, the Advisor may consider an investor’s trading history in the Funds or other Baird Funds. The Funds, the Advisor and affiliates thereof are prohibited from entering into arrangements with any shareholder or other person to permit frequent purchases and redemptions of Fund shares.
The Company monitors and enforces its market timing policy through:
•Monitoring of trade activity;
•Restrictions and prohibitions on purchases and/or exchanges by persons believed to engage in frequent trading activity;
•Assessing a 2.00% redemption fee on redemptions and exchanges of International Growth and Global Growth Fund shares held for 90 days or less; and
89
•Regular reports to the Board by the Funds’ Chief Compliance Officer regarding any instances of suspected market timing and any waivers granted by the officers and Chief Compliance Officer of the Funds of the redemption fee.
In addition, if market timing is detected in an omnibus account held by a financial intermediary, the Funds may request that the intermediary restrict or prohibit further purchases or exchanges of Fund shares by any shareholder that has been identified as having violated the Market Timing Policy. The Funds may also request that the intermediary provide identifying information, such as social security numbers, and trading information about the underlying shareholders in the account in order to review any unusual patterns of trading activity discovered in the omnibus account.
While the Funds seek to take action that will detect and deter market timing, the risks of market timing cannot be completely eliminated. For example, the Funds may not be able to identify or reasonably detect or deter market timing transactions that may be facilitated by financial intermediaries or made difficult to identify through the use of omnibus accounts by those intermediaries that transmit purchase, exchange, or redemption orders to the Funds on behalf of their customers who are the beneficial owners. More specifically, unless the financial intermediaries have the ability to detect and deter market timing transactions themselves, the Funds may not be able to determine whether the purchase or sale is connected with a market timing transaction. In certain cases, the Company may rely on the market timing policies of financial intermediaries, even if those policies are different from the policy of the Company, when the Advisor believes that the policies are reasonably designed to prevent excessive trading practices that are detrimental to the Funds. Additionally, there can be no assurance that the systems and procedures of the Funds, Advisor or Distributor will be able to monitor all trading activity in a manner that would detect market timing. However, the Funds, the Advisor and the Distributor will attempt to detect and deter market timing in transactions by all Fund investors, whether directly through the Transfer Agent or through financial intermediaries.
Householding
In an effort to decrease costs, the Funds intend to reduce the number of duplicate prospectuses, proxy statements and other regulatory mailings you receive by sending only one copy of each to those addresses shared by two or more accounts and to shareholders we reasonably believe are from the same family or household. Once implemented, if you would like to discontinue householding for your accounts, please call the Funds toll-free at 1-866-442-2473 to request individual copies of these documents. Once the Funds receive notice to stop householding, we will begin sending individual copies 30 days after receiving your request. This policy does not apply to account statements.
90
Methods of Buying
| To Open an Account | To Add to an Account | |||||||
| By Telephone | You may not use the telephone purchase option for your initial purchase of a Fund’s shares. However, you may call the Funds (toll-free) at 1-866-442-2473 to open a new account by requesting an exchange into another Baird Fund. See “Exchanging Shares.” | After your account has been open for seven business days, you may call the Funds (toll-free) at 1-866-442-2473 to place your order for Fund shares. Money will then be moved from your bank account to your Fund account upon request. Only bank accounts held at domestic institutions that are Automated Clearing House (“ACH”) members may be used for telephone transactions. The minimum telephone purchase is $100. | ||||||
| By Mail | Make your check payable to “Baird Funds.” All checks must be in U.S. dollars drawn on a U.S. financial institution. Forward the check and your application to the address below. To prevent fraud, the Funds will not accept cash, money orders, third party checks, traveler’s checks, credit card checks, starter checks or U.S. Treasury checks for the purchase of shares. If your check is returned for any reason, a $25 fee will be assessed against your account and you will be responsible for any loss incurred by the Fund(s). The Funds are unable to accept post-dated checks or any conditional order or payment. | Fill out the Invest by Mail form from your confirmation statement, or indicate the Fund name, your name, address, and account number on a separate piece of paper along with your check. Make your check payable to “Baird Funds.” Forward the check and Invest by Mail form or separate letter of instruction to the address below. | ||||||
91
| To Open an Account | To Add to an Account | |||||||
| By Federal Funds Wire | Forward your application to Baird Funds at the address below. Call (toll-free) 1-866-442-2473 to obtain an account number. Wire funds using the instructions to the right. | Notify the Funds of an incoming wire by calling (toll-free) 1-866-442-2473. Use the following instructions: U.S. Bank National Association 777 E. Wisconsin Ave. Milwaukee, WI 53202 ABA#: 075000022 Credit: U.S. Bancorp Fund Services, LLC Account #: 112-952-137 Further Credit: (name of Fund, share class) (name/title on the account) (account #) Wired funds must be received prior to 3:00 pm Central time to be eligible for same day pricing. The Funds, the Advisor and the Transfer Agent are not responsible for the consequences of delays resulting from the banking or Federal Reserve Wire system, or from incomplete wiring instructions. | ||||||
| Automatic Investment Plan | Open a Fund account with one of the other methods. If by mail, be sure to include your bank account number on the appropriate section of your application and enclose a voided check or deposit slip with your initial purchase application. | Call the Funds (toll-free) at 1-866-442-2473 for instructions on how to set up an Automatic Investment Plan if you did not select the option on your original application. Regular automatic investments (minimum of $100) will be taken from your checking or savings account on a monthly basis. If you do not have sufficient funds in your account or if your account is closed at the time of the automatic transaction, you will be assessed a $25 fee. Any request to change or terminate your Automatic Investment Plan should be submitted to the Transfer Agent 5 days prior to effective date. | ||||||
| Through Shareholder Service Organizations | To purchase shares for another investor, call the Funds (toll-free) at 1-866-442-2473. | To purchase shares for another investor, call the Funds (toll-free) at 1-866-442-2473. | ||||||
92
| To Open an Account | To Add to an Account | |||||||
| By Exchange | Call the Funds (toll-free) at 1-866-442-2473 to obtain exchange information. See “Exchanging Shares.” | Call the Funds (toll-free) at 1-866-442-2473 to obtain exchange information. See “Exchanging Shares.” | ||||||
You should use the following addresses when sending documents by mail or by overnight delivery:
By Mail Baird Funds, Inc. c/o U.S. Bank Global Fund Services P.O. Box 701 Milwaukee, Wisconsin 53201-0701 | By Overnight Delivery Baird Funds, Inc. c/o U.S. Bank Global Fund Services 615 E. Michigan Street, Third Floor Milwaukee, Wisconsin 53202 | ||||
NOTE: The Funds and the Transfer Agent do not consider the U.S. Postal Service or other independent delivery services to be their agents. Only actual physical receipt by the Transfer Agent of purchase orders or redemption requests (e.g. retrieving mail from the post office or accepting delivery from a delivery service) constitutes receipt by the Transfer Agent. Therefore, deposit in the mail or with such services, or receipt at the Transfer Agent’s post office box, of purchase orders or redemption requests does not constitute receipt by the Transfer Agent. Receipt of purchase orders or redemption requests is based on when the order is received at the Transfer Agent’s offices.
| Selling Shares | ||
Methods of Selling
| To Sell Some or All of Your Shares | |||||
| By Telephone | If you did not decline telephone redemption options, call the Funds (toll-free) at 1-866-442-2473 to place the order. (Note: for security reasons, requests by telephone will be recorded.) Telephone redemptions involving $50,000 or more of Investor Class shares are not permitted. | ||||
| By Mail | Send a letter to the Funds that indicates the dollar amount or number of shares you wish to redeem. The letter should contain the Fund’s name, the account number and the number of shares or the dollar amount of shares to be redeemed. Be sure to have all shareholders sign the letter and, if necessary, have the signature guaranteed. For IRAs, requests submitted without an election regarding tax withholding will be subject to tax withholding. | ||||
93
| To Sell Some or All of Your Shares | |||||
| Systematic Withdrawal Plan | The Funds offer shareholders a Systematic Withdrawal Plan. Call the Funds (toll-free) at 1-866-442-2473 to obtain information on how to arrange for regular monthly or quarterly fixed withdrawal payments. The minimum payment you may receive is $50 per period. In order to participate in the Plan, your account balance must be at least $5,000 and the minimum payment you may receive is $50 per period. If you elect this method of redemption, the Fund will send a check to your address of record or will send the payment via electronic funds transfer through the Automated Clearing House (ACH) network directly to your bank account. For payment through the ACH network, your bank must be an ACH member and your bank account information must be maintained on your Fund account. This program may be terminated at any time by the Fund. You may also elect to terminate your participation in this Plan at any time by contacting the Transfer Agent at least five days prior to the next scheduled withdrawal. Note that this plan may deplete your investment and affect your income or yield. | ||||
| By a Financial Intermediary | Consult your account agreement for information on redeeming shares. | ||||
| By Exchange | Call the Funds (toll‑free) at 1‑866‑44BAIRD to obtain exchange information. See “Exchanging Shares” for further information. | ||||
Payment of Redemption Proceeds
| You may request redemption of your shares at any time. Shares may be redeemed on days the NYSE is open. The NYSE is closed most national holidays and Good Friday. Your shares will be redeemed at the next NAV per share calculated after your order is received in good order by a Fund or its agents. All requests received in good order before the close of regular trading on the NYSE (normally, 3:00 p.m., Central time) will be executed at the NAV computed on that day. Requests received after the close of regular trading on the NYSE will receive the next business day’s NAV. Payment of redemption proceeds for all methods of payment will be made promptly, typically within one to two days, and in any event not later than seven days after the receipt of a redemption request in proper form as discussed in this Prospectus. You may receive the proceeds in one of three ways: | When making a redemption request, make sure your request is in good order. “Good order” means your letter of instruction includes: •The name of the Fund; •The number of shares or the dollar amount of shares to be redeemed; •Signatures of all registered shareholders exactly as the shares are registered and, if necessary, with a signature guarantee; and •The account number. | ||||
94
•A check mailed to your account’s address. Your proceeds will typically be sent on the business day following the day on which the Fund or its agent receives your request in good order. Checks will not be forwarded by the U.S. Postal Service, so please notify us if your address has changed prior to a redemption request. A redemption request made within 15 days of an address change will require a signature guarantee. Proceeds will be sent to you in this way, unless you request one of the alternatives described below.
•The proceeds transmitted by Electronic Funds Transfer (“EFT”) to a properly pre-authorized bank account. The proceeds usually will arrive at your bank two banking days after we process your redemption.
•The proceeds transmitted by wire to a pre-authorized bank account for a $15 fee. This fee will be deducted from your redemption proceeds for complete and share specific redemptions. In the case of a partial redemption, the fee will be deducted from the remaining account balance. The fee is paid to the Transfer Agent to cover costs associated with the transfer. The Advisor reserves the right to waive the wire fee in limited circumstances. The proceeds usually will arrive at your bank the first banking day after we process your redemption. Be sure to have all necessary information from your bank. Your bank may charge a fee to receive wired funds.
Before selling recently purchased shares, please note that if the Transfer Agent has not yet collected payment for the shares you are selling, there may be a delay in sending the proceeds until the payment is collected, which may take up to 12 calendar days from the purchase date. This procedure is intended to protect the Funds and their shareholders from loss. This delay will not apply if you purchased your shares via wire payment.
The Funds typically expect they will hold cash or cash equivalents to meet redemption requests. The Funds may also use the proceeds from the sale of portfolio securities to meet redemption requests if consistent with the management of the Funds. The Funds may also meet redemption requests through the use of a line of credit. The Funds may also make redemptions in kind (i.e., payments in portfolio securities rather than cash) to meet redemption requests. These redemption methods will be used regularly and may also be used in stressed market conditions.
The Transfer Agent will send redemption proceeds by wire or EFT only to the bank and account designated on the account application or in written instructions (with signatures guaranteed) subsequently received by the Transfer Agent, and only if the bank is a member of the Federal Reserve System. If the dollar or share amount requested to be redeemed is greater than the current value of your account, your entire account balance will be redeemed. If you choose to redeem your account in full, any Automatic Investment Plan currently in effect for the account will be terminated unless you indicate otherwise in writing and any Systematic Withdrawal Plan will be terminated.
95
Redemption Fee
A redemption fee of 2.00% will be charged on shares of the International Growth Fund and Global Growth Fund that are redeemed (including in connection with an exchange) 90 days or less from their date of purchase, determined on a first-in, first-out basis. The redemption fee is paid directly to the International Growth and Global Growth Funds and is designed to offset brokerage commissions, market impact and other costs associated with fluctuations in Fund asset levels and cash flow caused by short-term shareholder trading. The redemption fee does not apply to:
•shares acquired through dividends or capital gains or investments;
•shares redeemed because of death or disability;
•shares redeemed through a systematic withdrawal program;
•shares redeemed due to return of excess contributions or in connection with required minimum distributions from retirement accounts; and
•shares redeemed in the event of an involuntary redemption and/or exchange transaction, including, for example, those required by law or regulation, a regulatory agency, a court order, or as a result of the liquidation of the International Growth Fund and Global Growth Fund by the Board of Directors.
In addition, subject to the approval of an officer of the International Growth and Global Growth Funds and the Funds’ Chief Compliance Officer, the redemption fee will not apply to:
•certain employer sponsored retirement accounts (including 401(k) and other types of defined contribution or employee benefit plans);
•omnibus accounts held by financial intermediaries whose systems are unable to assess a redemption fee; and
•shares redeemed through an automatic, non-discretionary rebalancing or asset allocation program.
The International Growth Fund and Global Growth Fund may waive the redemption fee in the case of hardship and in other limited circumstances with respect to certain types of redemptions or exchanges that do not indicate market timing strategies.
Signature Guarantees
The Transfer Agent may require a signature guarantee for certain redemption requests. A signature guarantee ensures that your signature is genuine and protects you from unauthorized account redemptions. A signature guarantee, from either a Medallion program member or a non-Medallion program member, or other acceptable signature verification of each owner is required in the following situations:
96
•If you are requesting a change in ownership on your account;
•When redemption proceeds are payable or sent to any person, address or bank account not on record;
•When a redemption request is received by the Transfer Agent and the account address has changed within the last 15 calendar days; and
•For all redemptions of Investor Class shares totaling $50,000 or more from any shareholder account.
The Funds reserve the right to waive any signature requirement at their discretion.
In addition to the situations described above, the Funds and/or the Transfer Agent reserve the right to require a signature guarantee or other acceptable signature verification in other instances based on the circumstances relative to the particular situation.
Signature guarantees are designed to protect both you and the Funds from fraud. Signature guarantees can be obtained from most banks, credit unions or saving associations, or from broker-dealers, national securities exchanges, registered securities exchanges or clearing agencies deemed eligible by the SEC. Notaries cannot provide signature guarantees.
Non-financial transactions including establishing or modifying certain services on an account may require signature verification from a Signature Validation Program member, or other acceptable form of authentication from a financial institution.
Corporate, Trust and Other Accounts
Redemption requests from corporate, trust and institutional accounts, and executors, administrators and guardians, require documents in addition to those described above evidencing the authority of the officers, trustees or others. In order to avoid delays in processing redemption requests for these accounts, you should call the Funds (toll-free) at 1-866-442-2473 before making the redemption request to determine what additional documents are required.
Transfer of Ownership
In order to change the account registrant or transfer ownership of an account, additional documents will be required. To avoid delays in processing these requests, you should call the Funds (toll-free) at 1-866-442-2473 before making your request to determine what additional documents are required.
97
| Exchanging Shares | ||
You may exchange all or a portion of your investment from the same class of one Baird Fund to an identically registered account in another Baird Fund. You may also exchange between classes of a Fund or other Baird Funds if you meet the minimum investment requirements for the class into which you would like to exchange. Any new account established through an exchange will be subject to the minimum investment requirements applicable to the shares acquired. Exchanges will be executed on the basis of the relative NAV of the shares exchanged. The exchange privilege may be exercised only in those states where the class of shares of the Fund being acquired legally may be sold.
An exchange from one Baird Fund to another Baird Fund is considered to be a sale of shares for federal income tax purposes on which you may realize a taxable capital gain or loss unless you are a tax-exempt investor or hold your shares through a tax-deferred account such as a 401(k) plan or an IRA. A conversion from shares of one class to shares of a different class within the same Baird Fund is generally not a taxable transaction for federal income tax purposes.
Call the Funds (toll-free) at 1-866-442-2473 to learn more about exchanges and other Baird Funds.
More Information about the Exchange Privilege
The Funds and other Baird Funds are intended as long‑term investment vehicles and not to provide a means of speculating on short‑term market movements. In addition, excessive trading can hurt the Funds’ performance and shareholders. Therefore, each Fund may terminate, without notice, the exchange privilege of any shareholder who uses the exchange privilege excessively. See “Your Account—Buying Shares—Market Timing Policy.” In addition, if you exchange your shares in a Fund for shares in any other Baird Fund, you may be subject to the redemption fee, if applicable to that Fund, described under “Your Account – Selling Shares – Redemption Fee.” The Funds may change or temporarily suspend the exchange privilege during unusual market conditions.
| General Transaction Policies | ||
The Funds reserve the right to:
•Vary or waive any minimum investment requirement.
•Refuse, change, discontinue, or temporarily suspend account services, including purchase, exchange, or telephone redemption privileges, for any reason.
98
•Reject any purchase or the purchase side of an exchange request for any reason. Generally, a Fund does this if the purchase or exchange is disruptive to the efficient management of the Fund (due to the timing of the investment or a shareholder’s history of excessive trading).
•Reinvest a distribution check in your account at a Fund’s then-current NAV and reinvest all subsequent distributions if you elect to receive distributions in cash and the U.S. Postal Service cannot deliver your check, or if a distribution check remains uncashed for six months. You may change the distribution option on your account at any time by writing or calling the transfer agent. Any request for change should be submitted five days prior to the next distribution.
•Redeem all shares in your account if your balance falls below the Funds’ minimum initial purchase amount for the applicable class of shares. If, within 60 days of a Fund’s written request, you have not increased your account balance, you may be required to redeem your shares. The Funds will not require you to redeem shares if the value of your account drops below the investment minimum due to fluctuations of NAV.
•Delay paying redemption proceeds for up to seven days after receiving a request in proper form as described in this Prospectus.
•Modify or terminate the Automatic Investment and Systematic Withdrawal Plans at any time.
•Modify or terminate the exchange privilege after a 60-day written notice to shareholders.
•Make a “redemption in kind” (a payment in portfolio securities rather than cash) if the amount you are redeeming is in excess of the lesser of (i) $250,000 or (ii) 1% of a Fund’s assets in any 90-day period. In such cases, you may incur brokerage costs in converting these securities to cash. The Funds expect that any redemptions in kind will be made with readily marketable securities. However, shareholders who receive a redemption in kind will bear market risk until they sell the securities. For federal income tax purposes, redemptions in kind are taxed in the same manner as redemptions made in cash. The redeeming shareholder will generally receive a pro rata share of each security and cash position held by the distributing Fund (e.g., rounding such security positions to the nearest 100 shares or other appropriate rounding lot method), with adjustments for restricted securities, odd lots or fractional shares, or such other method of redemption that addresses any potential for overreaching or other concerns that underlie Section 17 of the Investment Company Act if applicable. The distributing Fund will distribute cash in lieu of securities held
99
in the Fund not amounting to round lots or other securities not distributed pursuant to the adjustments described above.
•Reject any purchase or redemption request that does not contain all required documentation.
If you did not decline telephone privileges on the account application or in a letter to the Funds, you may be responsible for any fraudulent telephone orders as long as the Funds have taken reasonable precautions to verify your identity. If an account has more than one owner or authorized person, the Funds will accept telephone instructions from any one owner or authorized person. In addition, once you place a telephone transaction request, it cannot be canceled or modified after the close of regular trading on the NYSE (normally, 3:00 p.m. Central time).
Telephone trades must be received by or prior to the close of regular trading on the NYSE (normally, 3:00 p.m. Central time). During periods of significant economic or market change, shareholders may encounter higher than usual call waits and telephone transactions may be difficult to complete. Please allow sufficient time to place your telephone transaction. If you are unable to contact the Funds by telephone, you may also mail the requests to the Funds at the address listed under “Buying Shares.”
Your broker-dealer or other financial organization may establish policies that differ from those of the Funds. For example, the organization may charge transaction fees, set higher minimum investments, or impose certain limitations on buying or selling shares in addition to those identified in this Prospectus. Contact your broker-dealer or other financial organization for details.
Lost Shareholders, Inactive Accounts and Unclaimed Property. It is important that the Funds maintain a correct address for each shareholder. An incorrect address may cause a shareholder’s account statements and other mailings to be returned to the Funds. Based upon statutory requirements for returned mail, the Funds will attempt to locate the shareholder or rightful owner of the account. If the Funds are unable to locate the shareholder, then they will determine whether the shareholder’s account can legally be considered abandoned. Your mutual fund account may be transferred to the state government of your state of residence if no activity occurs within your account during the “inactivity period” specified in your state’s abandoned property laws. The Funds are legally obligated to escheat (or transfer) abandoned property to the appropriate state’s unclaimed property administrator in accordance with statutory requirements. The shareholder’s last known address of record determines which state has jurisdiction. Please proactively contact the Transfer Agent toll-free at 877-677-9414 at least annually to ensure your account remains in active status.
If you are a resident of the state of Texas, you may designate a representative to receive notifications that, due to inactivity, your mutual fund account assets may be delivered to
100
the Texas Comptroller. Please contact the Transfer Agent if you wish to complete a Texas Designation of Representative form.
| Distributions and Taxes | ||
| Distributions | ||
Each Fund makes distributions to its shareholders from the Fund’s net investment income and any realized net capital gain.
Distributions from a Fund’s net investment income are declared and paid annually. Net capital gain, if any, is generally distributed annually. It is expected that each Fund’s distributions will be primarily distributions of net capital gain.
Each share class determines its net investment income and net capital gain distributions in the same manner. However, because Investor Class shares pay Rule 12b-1 fees, distributions of net investment income paid to Investor Class shareholders will be lower per share than those paid to Institutional Class shareholders.
All of your distributions from a Fund’s net investment income and net capital gain will be reinvested in additional shares of the same class of that Fund unless you instruct otherwise on your account application or have redeemed all shares you held in the Fund.
| Taxation | ||
Changes in income tax laws, potentially with retroactive effect, could impact a Fund’s investments or the tax consequences to you of investing in a Fund. Some of the changes could affect the timing, amount and tax treatment of Fund distributions made to shareholders. Please consult your tax adviser before investing.
Fund distributions are taxable regardless of whether the distributions are received in cash or reinvested in additional Fund shares, unless you are a tax-exempt investor or hold your shares through a tax-deferred arrangement, such as a 401(k) plan or an IRA. Distributions of a Fund’s investment company taxable income (which includes dividends, interest, net short-term capital gain and net gain from foreign currency transactions), if any, generally are taxable to the Fund’s shareholders as ordinary income, except to the extent any of the distributions are attributable to and reported as “qualified dividend income,” as described below. For corporate shareholders, distributions of a Fund’s investment company taxable income may be eligible for the intercorporate dividends-received deduction. Fund distributions may not be subject to
101
federal income tax if you are a tax-exempt investor or are investing through a tax-deferred arrangement, such as a 401(k) plan or an IRA, in which case you may be subject to federal income tax upon withdrawal of money from such tax-deferred arrangements. A Fund may be required to withhold federal income tax at a rate set under Section 3406 of the Code (backup withholding) from dividend payments, distributions, and redemption proceeds if you fail to furnish the Fund with your correct Social Security or other applicable taxpayer identification number. You must certify that the number is correct and that you are not subject to backup withholding. The certification is included as part of the share purchase application form.
For non-corporate shareholders, to the extent that a distribution of investment company taxable income is attributable to and reported as “qualified dividend” income, such income may be eligible for the reduced federal income tax rates applicable to net long-term capital gain. If for any taxable year a Fund has gross income (excluding net capital gain) of which at least 95% was “qualified dividends,” all of that Fund’s distributions of investment company taxable income for such taxable year will be eligible for the lower federal income tax rates on “qualified dividends.” Certain holding period requirements also must be satisfied by both a Fund and the shareholder to obtain “qualified dividend” treatment.
Distributions of a Fund’s net capital gain (the excess of net long-term capital gain over net short-term capital loss) will generally be taxable as long-term capital gains whether reinvested in additional Fund shares or received in cash and regardless of the length of time that a shareholder has owned Fund shares.
A distribution of a Fund’s investment company taxable income or net capital gain declared by the Fund in October, November or December, but paid during January of the following year, is taxable as if received on December 31 of the year such distribution was declared.
If the value of shares is reduced below a shareholder’s cost basis as a result of a distribution by a Fund, the distribution will be taxable even though it, in effect, represents a return of invested capital. Investors considering buying shares just prior to a distribution of a Fund’s investment company taxable income or net capital gain should be aware that, although the price of shares purchased at that time may reflect the amount of the forthcoming distribution, such distribution may nevertheless be taxable to them.
Certain individuals, trusts, and estates may be subject to a Net Investment Income (“NII”) tax of 3.8% (in addition to regular income tax). The NII tax is imposed on the lesser of (i) a taxpayer’s investment income, net of deductions properly allocable to such income or (ii) the amount by which such taxpayer’s modified adjusted gross income exceeds certain thresholds ($250,000 for married individuals filing jointly, $200,000 for unmarried individuals and $125,000 for married individuals filing separately). Each Fund’s distributions are includable in a shareholder’s investment income for purposes of this NII tax. In addition, any capital gain realized by a shareholder upon a sale,
102
exchange or redemption of Fund shares is includable in the shareholder’s investment income for purposes of this NII tax.
The federal income tax status of all distributions made by each Fund for the preceding year will be reported to shareholders annually. Distributions made by the Funds may also be subject to state and local taxes. Please note that distributions of both investment company taxable income and net capital gain are taxable even if reinvested in additional Fund shares.
Shareholders who sell, exchange or redeem shares generally will have a capital gain or loss from the sale, exchange or redemption. The amount of the gain or loss and the rate of federal income tax will depend mainly upon the amount paid for the shares, the amount received from the sale, exchange or redemption, and the length of time that the shares were held by a shareholder. Gain or loss realized upon a sale, exchange or redemption of Fund shares will generally be treated as a long-term capital gain or loss if the shares have been held for more than one year, and, if held for one year or less, as a short-term capital gain or loss. Any loss arising from the sale, exchange or redemption of shares held for six months or less, however, is treated as a long-term capital loss to the extent of any distributions of net capital gain received or deemed to be received with respect to such shares. In determining the holding period of such shares for this purpose, any period during which your risk of loss is offset by means of options, short sales or similar transactions is not counted. If you purchase Fund shares (through reinvestment of distributions or otherwise) within 30 days before or after selling, exchanging or redeeming shares of the same Fund at a loss, all or part of that loss will not be deductible and will instead increase the basis of the newly acquired shares to preserve the loss until a future sale, exchange or redemption.
If more than 50% of the value of a Fund’s total assets at the close of its taxable year consists of stock and securities in foreign corporations, the Fund will be eligible to, and may, file an election with the Internal Revenue Service (“IRS”) that would enable the Fund’s shareholders, in effect, to receive the benefit of the foreign tax credit with respect to any income taxes paid by the Fund to foreign countries and U.S. possessions. Please see the SAI for additional information regarding the foreign tax credit.
Each Fund is required to report to certain shareholders and the IRS the cost basis of Fund shares acquired on or after January 1, 2012, when such shareholders subsequently sell, exchange or redeem those Fund shares. The Funds will determine cost basis using the average cost method unless you elect in writing (and not over the telephone) any alternate IRS-approved cost basis method. Please see the SAI for more information regarding cost basis reporting.
Additional tax information may be found in the SAI. Because everyone’s tax situation is unique, always consult your tax professional about federal, state and local tax consequences of an investment in the Funds.
103
Serious News for Serious Traders! Try StreetInsider.com Premium Free!
You May Also Be Interested In
- Jack Henry (JKHY) PT Raised to $186 at Baird
- Bank of America (BAC) PT Raised to $38 at Baird
- APi Group Corporation (APG) Prices 11M Share Offering at $37.50/sh
Create E-mail Alert Related Categories
SEC FilingsRelated Entities
Robert W BairdSign up for StreetInsider Free!
Receive full access to all new and archived articles, unlimited portfolio tracking, e-mail alerts, custom newswires and RSS feeds - and more!
