

Form 425 Cerberus Telecom Acquisi Filed by: Cerberus Telecom Acquisition Corp.
 Tweet
Tweet Share
Share

Filed by Cerberus Telecom Acquisition Corp. Pursuant to Rule 425 under the Securities Act of 1933 and deemed filed pursuant to Rule 14a-12 of the Securities Exchange Act of 1934 Subject Company: Cerberus Telecom Acquisition Corp. Commission File No. 001-39647 KORE: Sales Presentation April 9, 2021Filed by Cerberus Telecom Acquisition Corp. Pursuant to Rule 425 under the Securities Act of 1933 and deemed filed pursuant to Rule 14a-12 of the Securities Exchange Act of 1934 Subject Company: Cerberus Telecom Acquisition Corp. Commission File No. 001-39647 KORE: Sales Presentation April 9, 2021

Disclaimer This presentation (this “Presentation”) is provided for informational purposes only and has been prepared to assist interested parties in making their own evaluation with respect to a potential business combination between Cerberus Telecom Acquisition Corp. (“CTAC”) and KORE Wireless (“KORE” or the “Company”) (the “Proposed Transaction”) and for no other purpose. No representations or warranties, express or implied are given in, or in respect of, this Presentation. To the fullest extent permitted by law in no circumstances will CTAC, KORE or any of their respective subsidiaries, shareholders or affiliates, or any of their respective partners, directors, officers, employees, advisers, consultants, agents or other representatives (collectively, “Representatives”) be responsible or liable for any direct, indirect, consequential or other loss or loss of profit arising from the provision or use of this Presentation, its contents, its omissions, reliance on the information contained within it, or on opinions communicated in relation thereto or otherwise arising in connection therewith. Industry and market data used in this Presentation have been obtained from third-party industry publications and sources as well as from research reports prepared for other purposes. None of CTAC, KORE nor any of their respective Representatives has independently verified the data obtained from these sources and cannot assure you of the data’s accuracy or completeness. This data is subject to change. In furnishing this Presentation each of CTAC, KORE, and their respective Representatives expressly disclaims any obligation to update any information contained herein or to correct any omissions, inaccuracies, or errors. In addition, this Presentation does not purport to be all-inclusive or to contain all of the information that may be required to make a full or complete analysis of KORE or the Proposed Transaction. Viewers of this Presentation should each make their own independent evaluation of KORE and of the relevance and adequacy of the information and should make such other investigations as they deem necessary. Forward-Looking Statements This Presentation includes certain statements that are not historical facts but are forward-looking statements for purposes of the safe harbor provisions under the United States Private Securities Litigation Reform Act of 1995. Forward-looking statements generally are accompanied by words such as “believe,” “may,” “will,” “estimate,” “continue,” “anticipate,” “intend,” “expect,” “should,” “would,” “plan,” “predict,” “potential,” “seem,” “seek,” “future,” “outlook,” and similar expressions that predict or indicate future events or trends or that are not statements of historical matters. These forward-looking statements include, but are not limited to, statements regarding estimates and forecasts of revenue and other financial and performance metrics and projections of market opportunity and expectations. These statements are based on various assumptions and on the current expectations of CTAC or the Company’s management, as applicable as projected revenue and Adjusted EBITDA (as defined herein) are not predictions of actual performance. These forward-looking statements are provided for illustrative purposes only and are not intended to serve as, and must not be relied on by any investor or other person as, a guarantee, an assurance, a prediction or a definitive statement of fact or probability. Actual events and circumstances are difficult or impossible to predict and will differ from assumptions. Many actual events and circumstances are beyond the control of CTAC and/or the Company. These forward-looking statements are subject to a number of risks and uncertainties, including general economic, financial, legal, political and business conditions and changes in domestic and foreign markets; the potential effects of COVID- 19; risks related to the rollout of the Company’s business and the timing of expected business milestones; changes in the assumptions underlying the Company’s expectations regarding its future business; the effects of competition on the Company’s future business; and the outcome of judicial proceedings to which the Company is, or may become a party. If the risks materialize or assumptions prove incorrect, actual results could differ materially from the results implied by these forward-looking statements. There may be additional risks that the Company presently does not know or that the Company currently believes are immaterial that could also cause actual results to differ materially from those contained in the forward-looking statements. In addition, forward-looking statements reflect the Company’s expectations, plans or forecasts of future events and views as of the date of this Presentation. The Company and CTAC anticipate that subsequent events and developments will cause these assessments to change. However, while the Company and/or CTAC may elect to update these forward-looking statements at some point in the future, each of the Company and CTAC specifically disclaims any obligation to do so. These forward-looking statements should not be relied upon as representing the Company’s assessments as of any date subsequent to the date of this Presentation. Accordingly, undue reliance should not be placed upon the forward-looking statements. Use of Projections This Presentation contains projected financial information with respect to KORE. Such projected financial information constitutes forward-looking information, and is for illustrative purposes only and should not be relied upon as necessarily being indicative of future results. The Company’s independent auditors have not audited, reviewed, compiled or performed any procedures with respect to the projections for the purpose of their inclusion in this Presentation, and accordingly, they did not express an opinion or provide any other form of assurance with respect thereto for the purpose of this Presentation. The assumptions and estimates underlying such financial forecast information are inherently uncertain and are subject to a wide variety of significant business, economic, competitive and other risks and uncertainties. See “Forward-Looking Statements” above. Actual results may differ materially from the results contemplated by the financial forecast information contained in this Presentation, and the inclusion of such information in this Presentation is not intended, and should not be regarded, as a representation by any person that the results reflected in such forecasts will be achieved. No Offer or Solicitation This Presentation is not intended to, and shall not constitute (i) a solicitation of a proxy, consent or authorization with respect to any securities or in respect of the Proposed Transaction or (ii) an offer to sell or the solicitation of an offer to buy or a recommendation to purchase any security of CTAC, the Company or any of their respective affiliates, nor shall there be any sale of securities in any jurisdiction in which such offer, solicitation or sale would be unlawful prior to registration or qualification under the securities laws of any such jurisdiction. No offering of securities shall be made except by means of a prospectus meeting the requirements of Section 10 of the Securities Act or in reliance on an exemption from the registration requirements of the Securities Act. You should not construe the contents of this Presentation as legal, tax, accounting or investment advice or a recommendation. You should consult your own counsel and tax and financial advisors as to legal, financial, and related matters concerning the matters described herein, and, by accepting this Presentation, you confirm that you are not relying upon the information contained herein to make any decision. 2Disclaimer This presentation (this “Presentation”) is provided for informational purposes only and has been prepared to assist interested parties in making their own evaluation with respect to a potential business combination between Cerberus Telecom Acquisition Corp. (“CTAC”) and KORE Wireless (“KORE” or the “Company”) (the “Proposed Transaction”) and for no other purpose. No representations or warranties, express or implied are given in, or in respect of, this Presentation. To the fullest extent permitted by law in no circumstances will CTAC, KORE or any of their respective subsidiaries, shareholders or affiliates, or any of their respective partners, directors, officers, employees, advisers, consultants, agents or other representatives (collectively, “Representatives”) be responsible or liable for any direct, indirect, consequential or other loss or loss of profit arising from the provision or use of this Presentation, its contents, its omissions, reliance on the information contained within it, or on opinions communicated in relation thereto or otherwise arising in connection therewith. Industry and market data used in this Presentation have been obtained from third-party industry publications and sources as well as from research reports prepared for other purposes. None of CTAC, KORE nor any of their respective Representatives has independently verified the data obtained from these sources and cannot assure you of the data’s accuracy or completeness. This data is subject to change. In furnishing this Presentation each of CTAC, KORE, and their respective Representatives expressly disclaims any obligation to update any information contained herein or to correct any omissions, inaccuracies, or errors. In addition, this Presentation does not purport to be all-inclusive or to contain all of the information that may be required to make a full or complete analysis of KORE or the Proposed Transaction. Viewers of this Presentation should each make their own independent evaluation of KORE and of the relevance and adequacy of the information and should make such other investigations as they deem necessary. Forward-Looking Statements This Presentation includes certain statements that are not historical facts but are forward-looking statements for purposes of the safe harbor provisions under the United States Private Securities Litigation Reform Act of 1995. Forward-looking statements generally are accompanied by words such as “believe,” “may,” “will,” “estimate,” “continue,” “anticipate,” “intend,” “expect,” “should,” “would,” “plan,” “predict,” “potential,” “seem,” “seek,” “future,” “outlook,” and similar expressions that predict or indicate future events or trends or that are not statements of historical matters. These forward-looking statements include, but are not limited to, statements regarding estimates and forecasts of revenue and other financial and performance metrics and projections of market opportunity and expectations. These statements are based on various assumptions and on the current expectations of CTAC or the Company’s management, as applicable as projected revenue and Adjusted EBITDA (as defined herein) are not predictions of actual performance. These forward-looking statements are provided for illustrative purposes only and are not intended to serve as, and must not be relied on by any investor or other person as, a guarantee, an assurance, a prediction or a definitive statement of fact or probability. Actual events and circumstances are difficult or impossible to predict and will differ from assumptions. Many actual events and circumstances are beyond the control of CTAC and/or the Company. These forward-looking statements are subject to a number of risks and uncertainties, including general economic, financial, legal, political and business conditions and changes in domestic and foreign markets; the potential effects of COVID- 19; risks related to the rollout of the Company’s business and the timing of expected business milestones; changes in the assumptions underlying the Company’s expectations regarding its future business; the effects of competition on the Company’s future business; and the outcome of judicial proceedings to which the Company is, or may become a party. If the risks materialize or assumptions prove incorrect, actual results could differ materially from the results implied by these forward-looking statements. There may be additional risks that the Company presently does not know or that the Company currently believes are immaterial that could also cause actual results to differ materially from those contained in the forward-looking statements. In addition, forward-looking statements reflect the Company’s expectations, plans or forecasts of future events and views as of the date of this Presentation. The Company and CTAC anticipate that subsequent events and developments will cause these assessments to change. However, while the Company and/or CTAC may elect to update these forward-looking statements at some point in the future, each of the Company and CTAC specifically disclaims any obligation to do so. These forward-looking statements should not be relied upon as representing the Company’s assessments as of any date subsequent to the date of this Presentation. Accordingly, undue reliance should not be placed upon the forward-looking statements. Use of Projections This Presentation contains projected financial information with respect to KORE. Such projected financial information constitutes forward-looking information, and is for illustrative purposes only and should not be relied upon as necessarily being indicative of future results. The Company’s independent auditors have not audited, reviewed, compiled or performed any procedures with respect to the projections for the purpose of their inclusion in this Presentation, and accordingly, they did not express an opinion or provide any other form of assurance with respect thereto for the purpose of this Presentation. The assumptions and estimates underlying such financial forecast information are inherently uncertain and are subject to a wide variety of significant business, economic, competitive and other risks and uncertainties. See “Forward-Looking Statements” above. Actual results may differ materially from the results contemplated by the financial forecast information contained in this Presentation, and the inclusion of such information in this Presentation is not intended, and should not be regarded, as a representation by any person that the results reflected in such forecasts will be achieved. No Offer or Solicitation This Presentation is not intended to, and shall not constitute (i) a solicitation of a proxy, consent or authorization with respect to any securities or in respect of the Proposed Transaction or (ii) an offer to sell or the solicitation of an offer to buy or a recommendation to purchase any security of CTAC, the Company or any of their respective affiliates, nor shall there be any sale of securities in any jurisdiction in which such offer, solicitation or sale would be unlawful prior to registration or qualification under the securities laws of any such jurisdiction. No offering of securities shall be made except by means of a prospectus meeting the requirements of Section 10 of the Securities Act or in reliance on an exemption from the registration requirements of the Securities Act. You should not construe the contents of this Presentation as legal, tax, accounting or investment advice or a recommendation. You should consult your own counsel and tax and financial advisors as to legal, financial, and related matters concerning the matters described herein, and, by accepting this Presentation, you confirm that you are not relying upon the information contained herein to make any decision. 2

Disclaimer (Cont’d) Non-GAAP Financial Measures This Presentation includes certain financial measures not presented in accordance with generally accepted accounting principles (“GAAP”) including, but not limited to EBITDA, Adjusted EBITDA and certain ratios and other metrics derived therefrom. These non-GAAP financial measures are not measures of financial performance in accordance with GAAP and may exclude items that are significant in understanding and assessing the Company’s financial results. Therefore, these measures should not be considered in isolation or as an alternative to net income, cash flows from operations or other measures of profitability, liquidity or performance under GAAP. You should be aware that the Company’s Presentation of these measures may not be comparable to similarly-titled measures used by other companies. The Company believes these non-GAAP measures of financial results provide useful information to management and investors regarding certain financial and business trends relating to the Company’s financial condition and results of operations. The Company believes that the use of these non-GAAP financial measures provides an additional tool for investors to use in evaluating ongoing operating results and trends in the Company, and in comparing the Company’s financial measures with those of other similar companies, many of which present similar non-GAAP financial measures to investors. These non-GAAP financial measures are subject to inherent limitations as they reflect the exercise of judgments by management about which expense and income are excluded or included in determining these non-GAAP financial measures. Please refer to footnotes where presented on each page of this Presentation or to the tables therein for a reconciliation of these measures to what the Company believes are the most directly comparable measure evaluated in accordance with GAAP. This Presentation also includes certain projections of non-GAAP financial measures. The Company does not provide reconciliations of EBITDA, Adjusted EBITDA, or Adjusted EBITDA margin to net income on a forward-looking basis because the Company is unable to forecast the amount or significance of certain items required to develop meaningful comparable GAAP financial measures without unreasonable efforts. These items include gains or losses on sale or consolidation transactions, accelerated depreciation, impairment charges, gains or losses on retirement of debt and variations in effective tax rate, which are difficult to predict and estimate and are primarily dependent on future events, but which are excluded from the Company's calculations of EBITDA, Adjusted EBITDA, and Adjusted EBITDA margin. Certain monetary amounts, percentages and other figures included in this Presentation have been subject to rounding adjustments. Certain other amounts that appear in this Presentation may not sum due to rounding. In connection with the contemplated filing by CTAC of a proxy statement / prospectus on Form S-4 with respect to the Proposed Transaction, and in the course of the review by the SEC of such proxy statement / prospectus, CTAC may make changes to the information presented in this Presentation, including, without limitation, the description of the Company’s business and the financial information and other data (including the prospective financial information and other data) included in this Presentation. Comments by the SEC on information in the proxy statement / prospectus may require modification or reformulation of the information we present in this Presentation, and any such modification or reformulation could be significant. In particular, we note that the SEC has adopted certain rules regarding the use of Adjusted EBITDA and other financial measures that do not comply with generally accepted accounting principles in the United States, which rules will be applicable to the proxy statement / prospectus expected to be filed with respect to the Proposed Transaction. Participants in the Solicitation CTAC and its directors and executive officers may be deemed participants in the solicitation of proxies from CTAC’s stockholders with respect to the Proposed Transaction. A list of the names of those directors and executive officers and a description of their interests in CTAC is contained in CTAC’s Registration Statement on Form S-1, as effective on October 21, 2020, which was filed with the SEC and is available free of charge at the SEC’s web site at www.sec.gov, or by directing a written request to CTAC at 875 Third Avenue, 11th Floor, New York NY, 10022. Additional information regarding the interests of such participants will be contained in the proxy statement / prospectus for the Proposed Transaction when available. The Company and its directors and executive officers may also be deemed to be participants in the solicitation of proxies from the stockholders of CTAC in connection with the Proposed Transaction. A list of the names of such directors and executive officers and information regarding their interests in the Proposed Transaction will be included in the proxy statement / prospectus for the Proposed Transaction when available. Trademarks This Presentation contains trademarks, service marks, trade names and copyrights of KORE and other companies, which are the property of their respective owners. Solely for convenience, some of the trademarks, service marks, trade names and copyrights referred to in this Presentation may be listed without the TM, SM © or ® symbols, but CTAC and the Company will assert, to the fullest extent under applicable law, the rights of the applicable owners, if any, to these trademarks, service marks, trade names and copyrights. Additional Information CTAC intends to file with the SEC a proxy statement / prospectus on Form S-4 relating to the Proposed Transaction, which will be mailed to its stockholders once definitive. This Presentation does not contain, or purport to contain, all the information that should be considered concerning the Proposed Transaction and is not intended to form the basis of any investment decision or any other decision in respect of the Proposed Transaction. CTAC’s stockholders and other interested persons are advised to read, when available, the preliminary proxy statement / prospectus and the amendments thereto and the proxy statement / prospectus and other documents filed in connection with the Proposed Transaction, as these materials will contain important information about the Company, CTAC and the Proposed Transaction. When available, the proxy statement / prospectus and other relevant materials for the Proposed Transaction will be mailed to stockholders of CTAC as of a record date to be established for voting on the proposed Business Combination. Stockholders will also be able to obtain copies of the preliminary proxy statement / prospectus, the definitive proxy statement / prospectus and other documents filed with the SEC, without charge, once available, at the SEC’s website at www.sec.gov, or by directing a written request to CTAC at 875 Third Avenue, 11th Floor, New York NY, 10022. Term Loan/Deal Terms This Presentation does not reflect the potential amendment of the Company’s term loan indebtedness, and certain other terms of the Proposed Transaction that are subject to ongoing negotiation. PCAOB Audit In connection with the preparation of the proxy statement / prospectus related to the Proposed Transaction, the Company will be re-auditing its financial statements for prior years ended December 31 in accordance with the standards established by the Public Company Accounting Oversight Board (PCAOB), as required by the rules and regulations of the U.S. Securities and Exchange Commission. Such re-audit may result in revisions and/or changes to the Company’s financial statements, as compared to the Company’s current financial statements presented herein which have been audited pursuant to the standards promulgated by the American Institute of Certified Public Accountants (AICPA), which changes and revisions cannot be quantified at this time and which may be material. Accordingly, you should not place undue reliance on the historical financial information contained in this Presentation. 3Disclaimer (Cont’d) Non-GAAP Financial Measures This Presentation includes certain financial measures not presented in accordance with generally accepted accounting principles (“GAAP”) including, but not limited to EBITDA, Adjusted EBITDA and certain ratios and other metrics derived therefrom. These non-GAAP financial measures are not measures of financial performance in accordance with GAAP and may exclude items that are significant in understanding and assessing the Company’s financial results. Therefore, these measures should not be considered in isolation or as an alternative to net income, cash flows from operations or other measures of profitability, liquidity or performance under GAAP. You should be aware that the Company’s Presentation of these measures may not be comparable to similarly-titled measures used by other companies. The Company believes these non-GAAP measures of financial results provide useful information to management and investors regarding certain financial and business trends relating to the Company’s financial condition and results of operations. The Company believes that the use of these non-GAAP financial measures provides an additional tool for investors to use in evaluating ongoing operating results and trends in the Company, and in comparing the Company’s financial measures with those of other similar companies, many of which present similar non-GAAP financial measures to investors. These non-GAAP financial measures are subject to inherent limitations as they reflect the exercise of judgments by management about which expense and income are excluded or included in determining these non-GAAP financial measures. Please refer to footnotes where presented on each page of this Presentation or to the tables therein for a reconciliation of these measures to what the Company believes are the most directly comparable measure evaluated in accordance with GAAP. This Presentation also includes certain projections of non-GAAP financial measures. The Company does not provide reconciliations of EBITDA, Adjusted EBITDA, or Adjusted EBITDA margin to net income on a forward-looking basis because the Company is unable to forecast the amount or significance of certain items required to develop meaningful comparable GAAP financial measures without unreasonable efforts. These items include gains or losses on sale or consolidation transactions, accelerated depreciation, impairment charges, gains or losses on retirement of debt and variations in effective tax rate, which are difficult to predict and estimate and are primarily dependent on future events, but which are excluded from the Company's calculations of EBITDA, Adjusted EBITDA, and Adjusted EBITDA margin. Certain monetary amounts, percentages and other figures included in this Presentation have been subject to rounding adjustments. Certain other amounts that appear in this Presentation may not sum due to rounding. In connection with the contemplated filing by CTAC of a proxy statement / prospectus on Form S-4 with respect to the Proposed Transaction, and in the course of the review by the SEC of such proxy statement / prospectus, CTAC may make changes to the information presented in this Presentation, including, without limitation, the description of the Company’s business and the financial information and other data (including the prospective financial information and other data) included in this Presentation. Comments by the SEC on information in the proxy statement / prospectus may require modification or reformulation of the information we present in this Presentation, and any such modification or reformulation could be significant. In particular, we note that the SEC has adopted certain rules regarding the use of Adjusted EBITDA and other financial measures that do not comply with generally accepted accounting principles in the United States, which rules will be applicable to the proxy statement / prospectus expected to be filed with respect to the Proposed Transaction. Participants in the Solicitation CTAC and its directors and executive officers may be deemed participants in the solicitation of proxies from CTAC’s stockholders with respect to the Proposed Transaction. A list of the names of those directors and executive officers and a description of their interests in CTAC is contained in CTAC’s Registration Statement on Form S-1, as effective on October 21, 2020, which was filed with the SEC and is available free of charge at the SEC’s web site at www.sec.gov, or by directing a written request to CTAC at 875 Third Avenue, 11th Floor, New York NY, 10022. Additional information regarding the interests of such participants will be contained in the proxy statement / prospectus for the Proposed Transaction when available. The Company and its directors and executive officers may also be deemed to be participants in the solicitation of proxies from the stockholders of CTAC in connection with the Proposed Transaction. A list of the names of such directors and executive officers and information regarding their interests in the Proposed Transaction will be included in the proxy statement / prospectus for the Proposed Transaction when available. Trademarks This Presentation contains trademarks, service marks, trade names and copyrights of KORE and other companies, which are the property of their respective owners. Solely for convenience, some of the trademarks, service marks, trade names and copyrights referred to in this Presentation may be listed without the TM, SM © or ® symbols, but CTAC and the Company will assert, to the fullest extent under applicable law, the rights of the applicable owners, if any, to these trademarks, service marks, trade names and copyrights. Additional Information CTAC intends to file with the SEC a proxy statement / prospectus on Form S-4 relating to the Proposed Transaction, which will be mailed to its stockholders once definitive. This Presentation does not contain, or purport to contain, all the information that should be considered concerning the Proposed Transaction and is not intended to form the basis of any investment decision or any other decision in respect of the Proposed Transaction. CTAC’s stockholders and other interested persons are advised to read, when available, the preliminary proxy statement / prospectus and the amendments thereto and the proxy statement / prospectus and other documents filed in connection with the Proposed Transaction, as these materials will contain important information about the Company, CTAC and the Proposed Transaction. When available, the proxy statement / prospectus and other relevant materials for the Proposed Transaction will be mailed to stockholders of CTAC as of a record date to be established for voting on the proposed Business Combination. Stockholders will also be able to obtain copies of the preliminary proxy statement / prospectus, the definitive proxy statement / prospectus and other documents filed with the SEC, without charge, once available, at the SEC’s website at www.sec.gov, or by directing a written request to CTAC at 875 Third Avenue, 11th Floor, New York NY, 10022. Term Loan/Deal Terms This Presentation does not reflect the potential amendment of the Company’s term loan indebtedness, and certain other terms of the Proposed Transaction that are subject to ongoing negotiation. PCAOB Audit In connection with the preparation of the proxy statement / prospectus related to the Proposed Transaction, the Company will be re-auditing its financial statements for prior years ended December 31 in accordance with the standards established by the Public Company Accounting Oversight Board (PCAOB), as required by the rules and regulations of the U.S. Securities and Exchange Commission. Such re-audit may result in revisions and/or changes to the Company’s financial statements, as compared to the Company’s current financial statements presented herein which have been audited pursuant to the standards promulgated by the American Institute of Certified Public Accountants (AICPA), which changes and revisions cannot be quantified at this time and which may be material. Accordingly, you should not place undue reliance on the historical financial information contained in this Presentation. 3
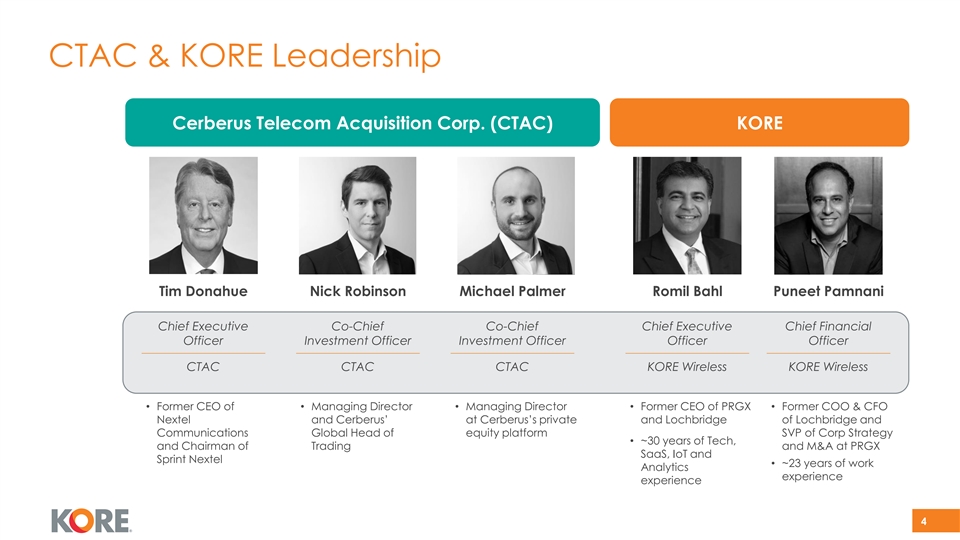
CTAC & KORE Leadership Cerberus Telecom Acquisition Corp. (CTAC) KORE Tim Donahue Nick Robinson Michael Palmer Romil Bahl Puneet Pamnani Chief Executive Co-Chief Co-Chief Chief Executive Chief Financial Officer Investment Officer Investment Officer Officer Officer CTAC CTAC CTAC KORE Wireless KORE Wireless • Former CEO of • Managing Director • Managing Director • Former CEO of PRGX • Former COO & CFO Nextel and Cerberus’ at Cerberus’s private and Lochbridge of Lochbridge and Communications Global Head of equity platform SVP of Corp Strategy • ~30 years of Tech, and Chairman of Trading and M&A at PRGX SaaS, IoT and Sprint Nextel • ~23 years of work Analytics experience experience 4CTAC & KORE Leadership Cerberus Telecom Acquisition Corp. (CTAC) KORE Tim Donahue Nick Robinson Michael Palmer Romil Bahl Puneet Pamnani Chief Executive Co-Chief Co-Chief Chief Executive Chief Financial Officer Investment Officer Investment Officer Officer Officer CTAC CTAC CTAC KORE Wireless KORE Wireless • Former CEO of • Managing Director • Managing Director • Former CEO of PRGX • Former COO & CFO Nextel and Cerberus’ at Cerberus’s private and Lochbridge of Lochbridge and Communications Global Head of equity platform SVP of Corp Strategy • ~30 years of Tech, and Chairman of Trading and M&A at PRGX SaaS, IoT and Sprint Nextel • ~23 years of work Analytics experience experience 4

Transaction overview Summary of KORE and CTAC proposed business combination th • On December 24 , 2020, KORE and CTAC executed a non-binding term sheet setting forth the potential terms of a business combination Transaction Timing • Definitive documentation was signed March 12, 2021 • The transaction is expected to close in Q3 2021 • Transaction implies a fully diluted pro forma enterprise value of $1,014mm, representing 15.2x based on 2022E Adj. EBITDA of $66.5mm and 16.9x based on 2021E Adj. EBITDA of $60.0mm Valuation • Existing holders of common stock, including majority KORE shareholder Abry Partners, are expected to roll 100% of their common equity • The transaction will be funded by a combination of CTAC cash held in a trust account and proceeds from a $225mm PIPE Capital Structure 1 • Transaction is expected to result in up to $484mm of total cash proceeds to fund the transaction (1) Assumes no redemption of CTAC’s existing shareholders, however actual proceeds available for the transaction are dependent on shareholder redemptions 5Transaction overview Summary of KORE and CTAC proposed business combination th • On December 24 , 2020, KORE and CTAC executed a non-binding term sheet setting forth the potential terms of a business combination Transaction Timing • Definitive documentation was signed March 12, 2021 • The transaction is expected to close in Q3 2021 • Transaction implies a fully diluted pro forma enterprise value of $1,014mm, representing 15.2x based on 2022E Adj. EBITDA of $66.5mm and 16.9x based on 2021E Adj. EBITDA of $60.0mm Valuation • Existing holders of common stock, including majority KORE shareholder Abry Partners, are expected to roll 100% of their common equity • The transaction will be funded by a combination of CTAC cash held in a trust account and proceeds from a $225mm PIPE Capital Structure 1 • Transaction is expected to result in up to $484mm of total cash proceeds to fund the transaction (1) Assumes no redemption of CTAC’s existing shareholders, however actual proceeds available for the transaction are dependent on shareholder redemptions 5

Sources & uses / pro forma valuation ($ in millions) Estimated Sources & Uses Illustrative Pro Forma Valuation Illustrative Share Price $ 10.00 Sources ($mm) 5 Pro Forma Shares Outstanding 90.3 1 Existing KORE Shareholders Equity Rollover $ 346 38.3 % Implied Equity Value $ 903 2 SPAC Cash in Trust 259 28.7 6 Plus: Est. Pre-Transaction Net Debt $ 294 3 SPAC Sponsor Shares 73 8.1 Less: Paydown of Debt (50) Less: PF Cash to Balance Sheet (133) PIPE Investors 225 24.9 Implied Pro Forma Enterprise Value $ 1,014 Total Sources $ 903 100.0 % Implied 2022E Adj. EBITDA Multiple 15.2 x Uses 5 Illustrative Pro Forma Ownership 1 Existing KORE Shareholders Equity Rollover $ 346 38.3 % 3 SPAC Sponsor Shares 73 8.1 24.9% 4 Paydown of Preferred 262 29.0 38.3% 8.1% Paydown of Term Loan 50 5.5 28.7% Cash to Balance Sheet 133 14.7 Estimated Fees and Expenses 39 4.3 1 Existing KORE Shareholders Equity Rollover 2 Total Uses $ 903 100.0 % SPAC Public Investors 3 SPAC Sponsor Shares PIPE Investors (1) Represents existing holders of KORE common stock, including Abry Partners. (2) Assumes estimated cash held in trust at closing and no redemption of CTAC public shares. (3) SPAC Sponsor Shares include 6.479mm CTAC Founder Shares and 0.818mm of CTAC Private Placement Shares underlying the Private Placement Units. (4) Paydown of preferred reflects estimated aggregate liquidation preference as of 06/30/2021. (5) Excludes dilutive impact of 8.639mm warrants from CTAC’s public offering and 0.273mm Private Placement Warrants underlying the Private Placement Units. All warrants have a strike price of $11.50 per share. Also excludes the impact of pro rata dilution for new management equity plan expected to be adopted at closing. (6) Pre-Transaction Net Debt equals financial indebtedness net of pre-transaction estimated cash and excludes potential debt-like items such as tax liabilities among others. 6Sources & uses / pro forma valuation ($ in millions) Estimated Sources & Uses Illustrative Pro Forma Valuation Illustrative Share Price $ 10.00 Sources ($mm) 5 Pro Forma Shares Outstanding 90.3 1 Existing KORE Shareholders Equity Rollover $ 346 38.3 % Implied Equity Value $ 903 2 SPAC Cash in Trust 259 28.7 6 Plus: Est. Pre-Transaction Net Debt $ 294 3 SPAC Sponsor Shares 73 8.1 Less: Paydown of Debt (50) Less: PF Cash to Balance Sheet (133) PIPE Investors 225 24.9 Implied Pro Forma Enterprise Value $ 1,014 Total Sources $ 903 100.0 % Implied 2022E Adj. EBITDA Multiple 15.2 x Uses 5 Illustrative Pro Forma Ownership 1 Existing KORE Shareholders Equity Rollover $ 346 38.3 % 3 SPAC Sponsor Shares 73 8.1 24.9% 4 Paydown of Preferred 262 29.0 38.3% 8.1% Paydown of Term Loan 50 5.5 28.7% Cash to Balance Sheet 133 14.7 Estimated Fees and Expenses 39 4.3 1 Existing KORE Shareholders Equity Rollover 2 Total Uses $ 903 100.0 % SPAC Public Investors 3 SPAC Sponsor Shares PIPE Investors (1) Represents existing holders of KORE common stock, including Abry Partners. (2) Assumes estimated cash held in trust at closing and no redemption of CTAC public shares. (3) SPAC Sponsor Shares include 6.479mm CTAC Founder Shares and 0.818mm of CTAC Private Placement Shares underlying the Private Placement Units. (4) Paydown of preferred reflects estimated aggregate liquidation preference as of 06/30/2021. (5) Excludes dilutive impact of 8.639mm warrants from CTAC’s public offering and 0.273mm Private Placement Warrants underlying the Private Placement Units. All warrants have a strike price of $11.50 per share. Also excludes the impact of pro rata dilution for new management equity plan expected to be adopted at closing. (6) Pre-Transaction Net Debt equals financial indebtedness net of pre-transaction estimated cash and excludes potential debt-like items such as tax liabilities among others. 6
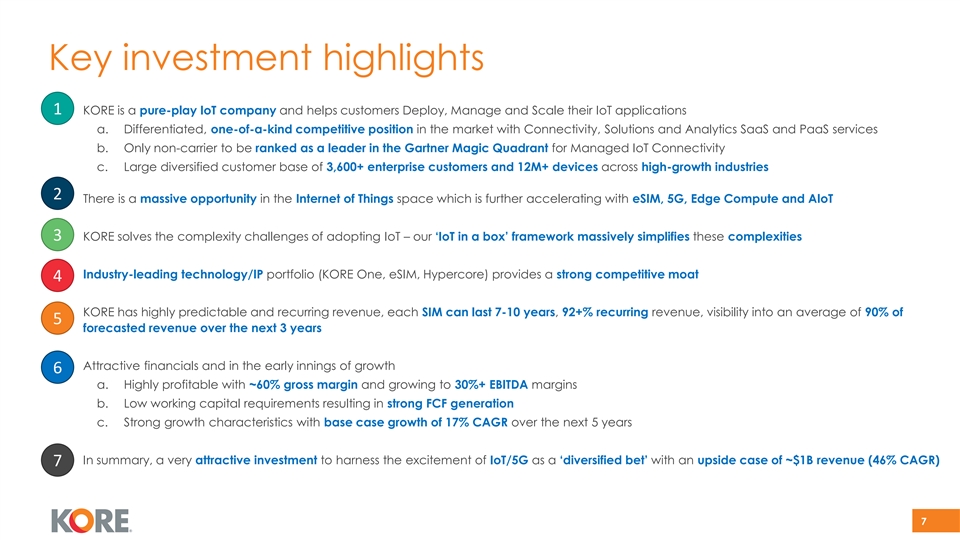
Key investment highlights 1 1. KORE is a pure-play IoT company and helps customers Deploy, Manage and Scale their IoT applications a. Differentiated, one-of-a-kind competitive position in the market with Connectivity, Solutions and Analytics SaaS and PaaS services b. Only non-carrier to be ranked as a leader in the Gartner Magic Quadrant for Managed IoT Connectivity c. Large diversified customer base of 3,600+ enterprise customers and 12M+ devices across high-growth industries 2 2. There is a massive opportunity in the Internet of Things space which is further accelerating with eSIM, 5G, Edge Compute and AIoT 3 3. KORE solves the complexity challenges of adopting IoT – our ‘IoT in a box’ framework massively simplifies these complexities 4. Industry-leading technology/IP portfolio (KORE One, eSIM, Hypercore) provides a strong competitive moat 4 5. KORE has highly predictable and recurring revenue, each SIM can last 7-10 years, 92+% recurring revenue, visibility into an average of 90% of 5 forecasted revenue over the next 3 years 6. Attractive financials and in the early innings of growth 6 a. Highly profitable with ~60% gross margin and growing to 30%+ EBITDA margins b. Low working capital requirements resulting in strong FCF generation c. Strong growth characteristics with base case growth of 17% CAGR over the next 5 years 7. In summary, a very attractive investment to harness the excitement of IoT/5G as a ‘diversified bet’ with an upside case of ~$1B revenue (46% CAGR) 7 7Key investment highlights 1 1. KORE is a pure-play IoT company and helps customers Deploy, Manage and Scale their IoT applications a. Differentiated, one-of-a-kind competitive position in the market with Connectivity, Solutions and Analytics SaaS and PaaS services b. Only non-carrier to be ranked as a leader in the Gartner Magic Quadrant for Managed IoT Connectivity c. Large diversified customer base of 3,600+ enterprise customers and 12M+ devices across high-growth industries 2 2. There is a massive opportunity in the Internet of Things space which is further accelerating with eSIM, 5G, Edge Compute and AIoT 3 3. KORE solves the complexity challenges of adopting IoT – our ‘IoT in a box’ framework massively simplifies these complexities 4. Industry-leading technology/IP portfolio (KORE One, eSIM, Hypercore) provides a strong competitive moat 4 5. KORE has highly predictable and recurring revenue, each SIM can last 7-10 years, 92+% recurring revenue, visibility into an average of 90% of 5 forecasted revenue over the next 3 years 6. Attractive financials and in the early innings of growth 6 a. Highly profitable with ~60% gross margin and growing to 30%+ EBITDA margins b. Low working capital requirements resulting in strong FCF generation c. Strong growth characteristics with base case growth of 17% CAGR over the next 5 years 7. In summary, a very attractive investment to harness the excitement of IoT/5G as a ‘diversified bet’ with an upside case of ~$1B revenue (46% CAGR) 7 7
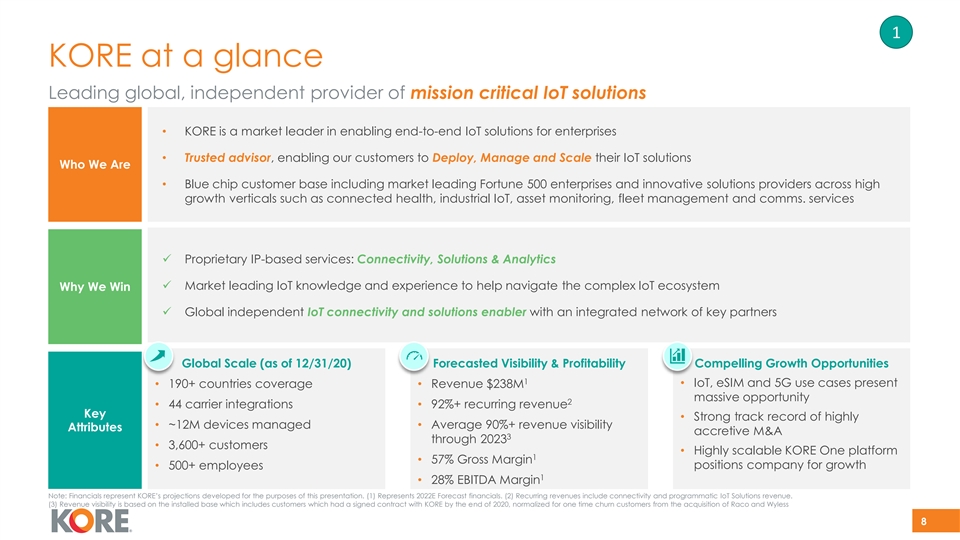
1 KORE at a glance Leading global, independent provider of mission critical IoT solutions • KORE is a market leader in enabling end-to-end IoT solutions for enterprises • Trusted advisor, enabling our customers to Deploy, Manage and Scale their IoT solutions Who We Are • Blue chip customer base including market leading Fortune 500 enterprises and innovative solutions providers across high growth verticals such as connected health, industrial IoT, asset monitoring, fleet management and comms. services ✓ Proprietary IP-based services: Connectivity, Solutions & Analytics ✓ Market leading IoT knowledge and experience to help navigate the complex IoT ecosystem Why We Win ✓ Global independent IoT connectivity and solutions enabler with an integrated network of key partners Global Scale (as of 12/31/20) Forecasted Visibility & Profitability Compelling Growth Opportunities 1 • IoT, eSIM and 5G use cases present • 190+ countries coverage• Revenue $238M massive opportunity 2 • 44 carrier integrations• 92%+ recurring revenue Key • Strong track record of highly • ~12M devices managed• Average 90%+ revenue visibility Attributes accretive M&A 3 through 2023 • 3,600+ customers • Highly scalable KORE One platform 1 • 57% Gross Margin positions company for growth • 500+ employees 1 • 28% EBITDA Margin Note: Financials represent KORE’s projections developed for the purposes of this presentation. (1) Represents 2022E Forecast financials. (2) Recurring revenues include connectivity and programmatic IoT Solutions revenue. (3) Revenue visibility is based on the installed base which includes customers which had a signed contract with KORE by the end of 2020, normalized for one time churn customers from the acquisition of Raco and Wyless 81 KORE at a glance Leading global, independent provider of mission critical IoT solutions • KORE is a market leader in enabling end-to-end IoT solutions for enterprises • Trusted advisor, enabling our customers to Deploy, Manage and Scale their IoT solutions Who We Are • Blue chip customer base including market leading Fortune 500 enterprises and innovative solutions providers across high growth verticals such as connected health, industrial IoT, asset monitoring, fleet management and comms. services ✓ Proprietary IP-based services: Connectivity, Solutions & Analytics ✓ Market leading IoT knowledge and experience to help navigate the complex IoT ecosystem Why We Win ✓ Global independent IoT connectivity and solutions enabler with an integrated network of key partners Global Scale (as of 12/31/20) Forecasted Visibility & Profitability Compelling Growth Opportunities 1 • IoT, eSIM and 5G use cases present • 190+ countries coverage• Revenue $238M massive opportunity 2 • 44 carrier integrations• 92%+ recurring revenue Key • Strong track record of highly • ~12M devices managed• Average 90%+ revenue visibility Attributes accretive M&A 3 through 2023 • 3,600+ customers • Highly scalable KORE One platform 1 • 57% Gross Margin positions company for growth • 500+ employees 1 • 28% EBITDA Margin Note: Financials represent KORE’s projections developed for the purposes of this presentation. (1) Represents 2022E Forecast financials. (2) Recurring revenues include connectivity and programmatic IoT Solutions revenue. (3) Revenue visibility is based on the installed base which includes customers which had a signed contract with KORE by the end of 2020, normalized for one time churn customers from the acquisition of Raco and Wyless 8

1 KORE business model: offering high demand IoT services Product line Products Product description Primary pricing method • IoT connectivity services offered through market leading IoT platform ‘KORE One’ Connectivity • Our connectivity solutions allow devices to seamlessly and securely connect as a Service Per subscriber per month anywhere in the world across any connected network, which we call our multiple (CaaS) for lifetime of device (7-10 Connectivity devices, multiple locations, multiple carriers CaaS value prop years and growing) 74% of 2020E 1 59% of 2025E Multi-year contracts with Connectivity automatic renewals • Connectivity Management Platform as a Service (or individual KORE One engine) Enablement as a Service • Cellular Core Network as a Service (cloud native HyperCore) (CEaaS) • Outsourced platform-enabled services (e.g., logistics, configuration, device IoT Device Upfront fee per device or per management) Management device per month Services • Sourcing of 3rd party devices globally, device design and selection services IoT Solutions 26% of 2020E • KORE’s SecurityPro SaaS platform IoT Security Per subscriber per month 1 41% of 2025E Location Based • KORE’s PositionLogic SaaS platform and LBS APIs Per subscriber per month Services (LBS) Product list is being expanded e.g., through the Private Networking (PNaaS) offering and industry pre-configured solutions 1 Percentage of revenue from go forward customers. 91 KORE business model: offering high demand IoT services Product line Products Product description Primary pricing method • IoT connectivity services offered through market leading IoT platform ‘KORE One’ Connectivity • Our connectivity solutions allow devices to seamlessly and securely connect as a Service Per subscriber per month anywhere in the world across any connected network, which we call our multiple (CaaS) for lifetime of device (7-10 Connectivity devices, multiple locations, multiple carriers CaaS value prop years and growing) 74% of 2020E 1 59% of 2025E Multi-year contracts with Connectivity automatic renewals • Connectivity Management Platform as a Service (or individual KORE One engine) Enablement as a Service • Cellular Core Network as a Service (cloud native HyperCore) (CEaaS) • Outsourced platform-enabled services (e.g., logistics, configuration, device IoT Device Upfront fee per device or per management) Management device per month Services • Sourcing of 3rd party devices globally, device design and selection services IoT Solutions 26% of 2020E • KORE’s SecurityPro SaaS platform IoT Security Per subscriber per month 1 41% of 2025E Location Based • KORE’s PositionLogic SaaS platform and LBS APIs Per subscriber per month Services (LBS) Product list is being expanded e.g., through the Private Networking (PNaaS) offering and industry pre-configured solutions 1 Percentage of revenue from go forward customers. 9

1 KORE differentiators and IoT customer use cases • KORE differentiators• KORE customer IoT use cases Connected ✓ 44 carrier integrations (each takes ~2 years) Fleet Mgmt. Blood Sugar ✓ Industry leading KORE One platform (7 engines) Monitors ✓ ConnectivityPro service and related APIs Connectivity ✓ eSIM technology stack/ proprietary IP ✓ Hypercore technology Connected Home Gas Tank Security Monitors ✓ Deep industry vertical knowledge and experience — Connected Health – FDA, HIPAA, ISO 9001/13485 Connected — Fleet Management – SaaS product and APIs, video Offender Alcohol bundle Trackers Monitors ✓ Unmatched breadth of solutions and analytics services IoT Solutions — SecurityPro network intelligence service — Asset management, mobile data management, Smart City logistics services Smart Lighting — Network certification expertise Meters Systems ✓ 3,400+ connectivity-only customers for cross-sell 101 KORE differentiators and IoT customer use cases • KORE differentiators• KORE customer IoT use cases Connected ✓ 44 carrier integrations (each takes ~2 years) Fleet Mgmt. Blood Sugar ✓ Industry leading KORE One platform (7 engines) Monitors ✓ ConnectivityPro service and related APIs Connectivity ✓ eSIM technology stack/ proprietary IP ✓ Hypercore technology Connected Home Gas Tank Security Monitors ✓ Deep industry vertical knowledge and experience — Connected Health – FDA, HIPAA, ISO 9001/13485 Connected — Fleet Management – SaaS product and APIs, video Offender Alcohol bundle Trackers Monitors ✓ Unmatched breadth of solutions and analytics services IoT Solutions — SecurityPro network intelligence service — Asset management, mobile data management, Smart City logistics services Smart Lighting — Network certification expertise Meters Systems ✓ 3,400+ connectivity-only customers for cross-sell 10

2 KORE is well positioned in the early innings of an exciting growth opportunity in IoT 2020 2025 2030 $906B $382B $608B $250B $78B $269B ~$7 Trillion $35B $48B Applications & Platforms Managed Services Connectivity 3% 5% 2% 7% 12% 10% 5% 12% 12% 40% 57% 10% 21% 78% 26% Connected Devices = 22 billion Connected Devices = 37 billion Connected Devices = 91 billion IoT Devices = 12 billion IoT Devices = 25 billion IoT Devices = 75 billion M2M IoT Smartphones PC / Tablets TVs Other Source: GSMA (IoT Revenue: State of the Market 2020); Ericsson (Mobility Report 2020); Cisco Annual Internet Report Highlights Tool 2020; IDC (Worldwide 5G Connections Forecast, 2019-2023) and KORE Forecasts 11 Devices (bn) TAM ($bn)2 KORE is well positioned in the early innings of an exciting growth opportunity in IoT 2020 2025 2030 $906B $382B $608B $250B $78B $269B ~$7 Trillion $35B $48B Applications & Platforms Managed Services Connectivity 3% 5% 2% 7% 12% 10% 5% 12% 12% 40% 57% 10% 21% 78% 26% Connected Devices = 22 billion Connected Devices = 37 billion Connected Devices = 91 billion IoT Devices = 12 billion IoT Devices = 25 billion IoT Devices = 75 billion M2M IoT Smartphones PC / Tablets TVs Other Source: GSMA (IoT Revenue: State of the Market 2020); Ericsson (Mobility Report 2020); Cisco Annual Internet Report Highlights Tool 2020; IDC (Worldwide 5G Connections Forecast, 2019-2023) and KORE Forecasts 11 Devices (bn) TAM ($bn)

2 Significant potential growth opportunity IoT connections by technology 80,000 of total mobile data over 5G 45% (1) • CaaS networks 70,000 ‐ Licensed Broadband & Critical IoT ‐ Unlicensed (4G/5G) Low-Power Wide- ‐ Satellite Area Connections 60,000 2.7B (2) by 2025 Massive IoT • CEaaS (Licensed LPWA – NBIoT ‐ CNaaS & CAT-M) 5G eSIM revenue 50,000 ‐ CMPaaS at scale generated in $0.9B Legacy ‐ PNaaS 2024 (2G/3G) (3) • IoT Solutions Unlicensed LPWA and 40,000 ‐ Managed Satellite Massive IoT Services Powered by LPWA eSIM 30,000 ‐ Analytics Adoption (3) • IoT Solutions 20,000 ‐ Managed Short-Range IoT Services (WiFi, BT, Z-Wave) ‐ Analytics 10,000 0 2020 2021 2022 2023 2024 2025 2026 2027 2028 2029 2030 Source: Cisco Annual Internet Report Highlights Tool 2020, GSMA (IoT Revenue: State of the Market 2020); Ericsson (Mobility Report 2020), KORE Forecasts Note: (1) CaaS = Connectivity as a Service – managed connectivity services offering for connecting IoT device; (2)CEaaS = Connectivity Enablement as a Service – includes managed Core Network as a Service (CNaaS), Private Networking as a Service (PNaaS) and Connectivity Management Platform (CMPaaS); (3) IoT Solutions = IoT managed services including IoT product design, supply chain, configuration, connectivity, and reverse logistics for customers 12 Connections (Millions)2 Significant potential growth opportunity IoT connections by technology 80,000 of total mobile data over 5G 45% (1) • CaaS networks 70,000 ‐ Licensed Broadband & Critical IoT ‐ Unlicensed (4G/5G) Low-Power Wide- ‐ Satellite Area Connections 60,000 2.7B (2) by 2025 Massive IoT • CEaaS (Licensed LPWA – NBIoT ‐ CNaaS & CAT-M) 5G eSIM revenue 50,000 ‐ CMPaaS at scale generated in $0.9B Legacy ‐ PNaaS 2024 (2G/3G) (3) • IoT Solutions Unlicensed LPWA and 40,000 ‐ Managed Satellite Massive IoT Services Powered by LPWA eSIM 30,000 ‐ Analytics Adoption (3) • IoT Solutions 20,000 ‐ Managed Short-Range IoT Services (WiFi, BT, Z-Wave) ‐ Analytics 10,000 0 2020 2021 2022 2023 2024 2025 2026 2027 2028 2029 2030 Source: Cisco Annual Internet Report Highlights Tool 2020, GSMA (IoT Revenue: State of the Market 2020); Ericsson (Mobility Report 2020), KORE Forecasts Note: (1) CaaS = Connectivity as a Service – managed connectivity services offering for connecting IoT device; (2)CEaaS = Connectivity Enablement as a Service – includes managed Core Network as a Service (CNaaS), Private Networking as a Service (PNaaS) and Connectivity Management Platform (CMPaaS); (3) IoT Solutions = IoT managed services including IoT product design, supply chain, configuration, connectivity, and reverse logistics for customers 12 Connections (Millions)

2 5G will enable a connected planet Construction and mining Digitized education $1.1T $0.3T Precision agriculture Connected healthcare $0.3T $1.1T Powering the digital economy $13.2 Trillion in global economic value by 2035 $2.3T $2.2T Richer mobile Smart city experiences $4.7T $1.2T Smart manufacturing Intelligent Retail Source: The 5G Economy (Qualcomm) 132 5G will enable a connected planet Construction and mining Digitized education $1.1T $0.3T Precision agriculture Connected healthcare $0.3T $1.1T Powering the digital economy $13.2 Trillion in global economic value by 2035 $2.3T $2.2T Richer mobile Smart city experiences $4.7T $1.2T Smart manufacturing Intelligent Retail Source: The 5G Economy (Qualcomm) 13
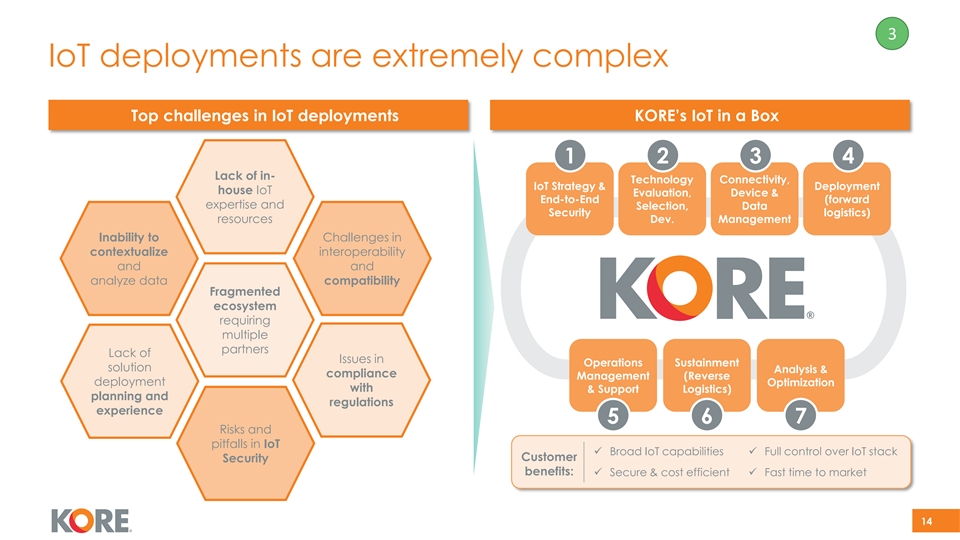
3 IoT deployments are extremely complex • Top challenges in IoT deployments• KORE’s IoT in a Box 1 2 3 4 Lack of in- Technology Connectivity, IoT Strategy & Deployment house IoT Evaluation, Device & End-to-End (forward expertise and Selection, Data Security logistics) resources Dev. Management Inability to Challenges in contextualize interoperability and and analyze data compatibility Fragmented ecosystem requiring multiple partners Lack of Issues in Operations Sustainment solution Analysis & compliance Management (Reverse deployment Optimization with & Support Logistics) planning and regulations experience 5 6 7 Risks and pitfalls in IoT ✓ Broad IoT capabilities✓ Full control over IoT stack Customer Security benefits: ✓ Secure & cost efficient✓ Fast time to market 143 IoT deployments are extremely complex • Top challenges in IoT deployments• KORE’s IoT in a Box 1 2 3 4 Lack of in- Technology Connectivity, IoT Strategy & Deployment house IoT Evaluation, Device & End-to-End (forward expertise and Selection, Data Security logistics) resources Dev. Management Inability to Challenges in contextualize interoperability and and analyze data compatibility Fragmented ecosystem requiring multiple partners Lack of Issues in Operations Sustainment solution Analysis & compliance Management (Reverse deployment Optimization with & Support Logistics) planning and regulations experience 5 6 7 Risks and pitfalls in IoT ✓ Broad IoT capabilities✓ Full control over IoT stack Customer Security benefits: ✓ Secure & cost efficient✓ Fast time to market 14

3 Customer case study: Customer #1 Customer #1 is a multinational medical devices company. KORE works with the cardiac monitoring (pacemakers and related devices) division, which is a market leader in this line of products. It has been KORE’s customer for >10 years. Cardiac Device Bedside Monitor KORE CaaS Physician Portal KORE Solution: IoT enablement of cardiac devices KORE global connectivity • Helped design a custom connectivity device which works with • Provided a global connectivity package to provide a large number of cellular networks globally; contracted connectivity across a large number of countries manufacturing with a global contract manufacturer • Acting as a trusted advisor for customer with transition of 2G/3G • KORE is an extension of the customer’s supply chain, configuring devices to LTE (in 2021/22) & handling 200-300K devices per year (growing 20%+ year) with • Almost 1 million subscribers and growing fast, leading to facilities which are: significant CaaS revenue stream for 7-10 years per device ✓ ISO 13485 / 9001 certified • Upsell to eSIM highly likely given global footprint of services ✓ FDA Registration 21 CFR Part 820 compliant ✓ HIPAA (U.S.) and GDPR (EU) compliant 153 Customer case study: Customer #1 Customer #1 is a multinational medical devices company. KORE works with the cardiac monitoring (pacemakers and related devices) division, which is a market leader in this line of products. It has been KORE’s customer for >10 years. Cardiac Device Bedside Monitor KORE CaaS Physician Portal KORE Solution: IoT enablement of cardiac devices KORE global connectivity • Helped design a custom connectivity device which works with • Provided a global connectivity package to provide a large number of cellular networks globally; contracted connectivity across a large number of countries manufacturing with a global contract manufacturer • Acting as a trusted advisor for customer with transition of 2G/3G • KORE is an extension of the customer’s supply chain, configuring devices to LTE (in 2021/22) & handling 200-300K devices per year (growing 20%+ year) with • Almost 1 million subscribers and growing fast, leading to facilities which are: significant CaaS revenue stream for 7-10 years per device ✓ ISO 13485 / 9001 certified • Upsell to eSIM highly likely given global footprint of services ✓ FDA Registration 21 CFR Part 820 compliant ✓ HIPAA (U.S.) and GDPR (EU) compliant 15

4 KORE IP 1. KORE One Platform KORE Technology Secure, universal data KORE One Streaming processing pipe Connected Devices Carrier Partnerships 4. IoT Network KORE One Analytics Data analytics and reporting Services KORE Data routing gateway KORE One Aggregator including cloud ConnectivityPro KORE Seamless integration with KORE One Integration SecurityPro carriers, customers KORE KORE One Monetization Billing and real-time rating eSIM Validation Tool Large-scale meta data KORE One Network Intelligence LoRa Satellite 4G/LTE 5G acquisition and visualization User interface / dashboard for Enterprise & Cloud KORE One Interface reporting & SSO Applications Key highlights 2. KORE eSIM 1 2 LBS and PL • Highly scalable platform, capable of scaling to MNO 100MM+ SIMs (current 12MM+) + • Modern, API-led, micro-services architecture • eSIM, hypercore capabilities driving private 3. KORE HyperCore networking and connected products IMSI integration HyperCore HSS PGW OCS SMSC 164 KORE IP 1. KORE One Platform KORE Technology Secure, universal data KORE One Streaming processing pipe Connected Devices Carrier Partnerships 4. IoT Network KORE One Analytics Data analytics and reporting Services KORE Data routing gateway KORE One Aggregator including cloud ConnectivityPro KORE Seamless integration with KORE One Integration SecurityPro carriers, customers KORE KORE One Monetization Billing and real-time rating eSIM Validation Tool Large-scale meta data KORE One Network Intelligence LoRa Satellite 4G/LTE 5G acquisition and visualization User interface / dashboard for Enterprise & Cloud KORE One Interface reporting & SSO Applications Key highlights 2. KORE eSIM 1 2 LBS and PL • Highly scalable platform, capable of scaling to MNO 100MM+ SIMs (current 12MM+) + • Modern, API-led, micro-services architecture • eSIM, hypercore capabilities driving private 3. KORE HyperCore networking and connected products IMSI integration HyperCore HSS PGW OCS SMSC 16
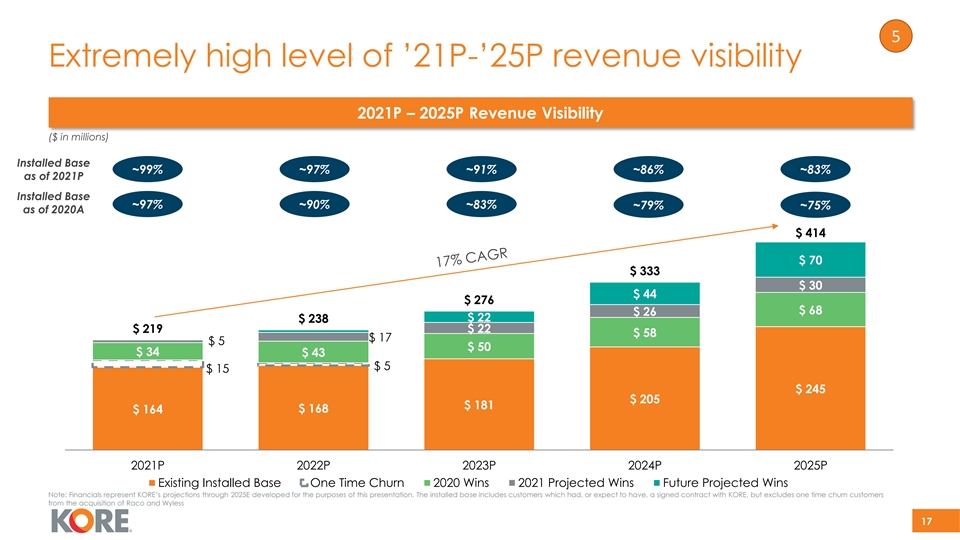
5 Extremely high level of ’21P-’25P revenue visibility 2021P – 2025P Revenue Visibility ($ in millions) Installed Base ~99% ~97% ~91% ~86% ~83% as of 2021P Installed Base ~97% ~90% ~83% ~79% ~75% as of 2020A $ 414 $ 70 $ 333 $ 30 $ 44 $ 276 $ 68 $ 26 $ 22 $ 238 $ 219 $ 22 $ 58 $ 17 $ 5 $ 50 $ 34 $ 43 $ 5 $ 15 $ 245 $ 205 $ 181 $ 168 $ 164 2021P 2022P 2023P 2024P 2025P Existing Installed Base One Time Churn 2020 Wins 2021 Projected Wins Future Projected Wins Note: Financials represent KORE’s projections through 2025E developed for the purposes of this presentation. The installed base includes customers which had, or expect to have, a signed contract with KORE, but excludes one time churn customers from the acquisition of Raco and Wyless 175 Extremely high level of ’21P-’25P revenue visibility 2021P – 2025P Revenue Visibility ($ in millions) Installed Base ~99% ~97% ~91% ~86% ~83% as of 2021P Installed Base ~97% ~90% ~83% ~79% ~75% as of 2020A $ 414 $ 70 $ 333 $ 30 $ 44 $ 276 $ 68 $ 26 $ 22 $ 238 $ 219 $ 22 $ 58 $ 17 $ 5 $ 50 $ 34 $ 43 $ 5 $ 15 $ 245 $ 205 $ 181 $ 168 $ 164 2021P 2022P 2023P 2024P 2025P Existing Installed Base One Time Churn 2020 Wins 2021 Projected Wins Future Projected Wins Note: Financials represent KORE’s projections through 2025E developed for the purposes of this presentation. The installed base includes customers which had, or expect to have, a signed contract with KORE, but excludes one time churn customers from the acquisition of Raco and Wyless 17
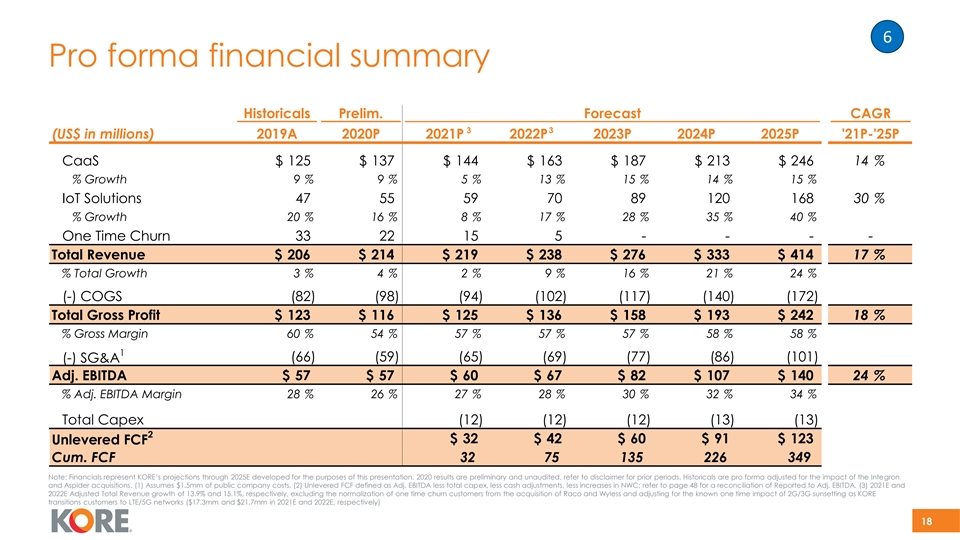
6 Pro forma financial summary Historicals Prelim. Forecast CAGR 3 3 (US$ in millions) 2019A 2020P 2021P 2022P 2023P 2024P 2025P '21P-'25P CaaS $ 125 $ 137 $ 144 $ 163 $ 187 $ 213 $ 246 14 % % Growth 9 % 9 % 5 % 13 % 15 % 14 % 15 % IoT Solutions 47 55 59 70 89 120 168 30 % % Growth 20 % 16 % 8 % 17 % 28 % 35 % 40 % One Time Churn 33 22 15 5 - - - - Total Revenue $ 206 $ 214 $ 219 $ 238 $ 276 $ 333 $ 414 17 % % Total Growth 3 % 4 % 2 % 9 % 16 % 21 % 24 % (-) COGS (82) (98) (94) (102) (117) (140) (172) Total Gross Profit $ 123 $ 116 $ 125 $ 136 $ 158 $ 193 $ 242 18 % % Gross Margin 60 % 54 % 57 % 57 % 57 % 58 % 58 % 1 (66) (59) (65) (69) (77) (86) (101) (-) SG&A Adj. EBITDA $ 57 $ 57 $ 60 $ 67 $ 82 $ 107 $ 140 24 % % Adj. EBITDA Margin 28 % 26 % 27 % 28 % 30 % 32 % 34 % Total Capex (12) (12) (12) (13) (13) 2 $ 32 $ 42 $ 60 $ 91 $ 123 Unlevered FCF Cum. FCF 32 75 135 226 349 Note: Financials represent KORE’s projections through 2025E developed for the purposes of this presentation. 2020 results are preliminary and unaudited, refer to disclaimer for prior periods. Historicals are pro forma adjusted for the impact of the Integron and Aspider acquisitions. (1) Assumes $1.5mm of public company costs. (2) Unlevered FCF defined as Adj. EBITDA less total capex, less cash adjustments, less increases in NWC; refer to page 48 for a reconciliation of Reported to Adj. EBITDA. (3) 2021E and 2022E Adjusted Total Revenue growth of 13.9% and 15.1%, respectively, excluding the normalization of one time churn customers from the acquisition of Raco and Wyless and adjusting for the known one time impact of 2G/3G sunsetting as KORE transitions customers to LTE/5G networks ($17.3mm and $21.7mm in 2021E and 2022E, respectively) 186 Pro forma financial summary Historicals Prelim. Forecast CAGR 3 3 (US$ in millions) 2019A 2020P 2021P 2022P 2023P 2024P 2025P '21P-'25P CaaS $ 125 $ 137 $ 144 $ 163 $ 187 $ 213 $ 246 14 % % Growth 9 % 9 % 5 % 13 % 15 % 14 % 15 % IoT Solutions 47 55 59 70 89 120 168 30 % % Growth 20 % 16 % 8 % 17 % 28 % 35 % 40 % One Time Churn 33 22 15 5 - - - - Total Revenue $ 206 $ 214 $ 219 $ 238 $ 276 $ 333 $ 414 17 % % Total Growth 3 % 4 % 2 % 9 % 16 % 21 % 24 % (-) COGS (82) (98) (94) (102) (117) (140) (172) Total Gross Profit $ 123 $ 116 $ 125 $ 136 $ 158 $ 193 $ 242 18 % % Gross Margin 60 % 54 % 57 % 57 % 57 % 58 % 58 % 1 (66) (59) (65) (69) (77) (86) (101) (-) SG&A Adj. EBITDA $ 57 $ 57 $ 60 $ 67 $ 82 $ 107 $ 140 24 % % Adj. EBITDA Margin 28 % 26 % 27 % 28 % 30 % 32 % 34 % Total Capex (12) (12) (12) (13) (13) 2 $ 32 $ 42 $ 60 $ 91 $ 123 Unlevered FCF Cum. FCF 32 75 135 226 349 Note: Financials represent KORE’s projections through 2025E developed for the purposes of this presentation. 2020 results are preliminary and unaudited, refer to disclaimer for prior periods. Historicals are pro forma adjusted for the impact of the Integron and Aspider acquisitions. (1) Assumes $1.5mm of public company costs. (2) Unlevered FCF defined as Adj. EBITDA less total capex, less cash adjustments, less increases in NWC; refer to page 48 for a reconciliation of Reported to Adj. EBITDA. (3) 2021E and 2022E Adjusted Total Revenue growth of 13.9% and 15.1%, respectively, excluding the normalization of one time churn customers from the acquisition of Raco and Wyless and adjusting for the known one time impact of 2G/3G sunsetting as KORE transitions customers to LTE/5G networks ($17.3mm and $21.7mm in 2021E and 2022E, respectively) 18

6 KORE’s TCV wins increased by 69% in 2020 Estimated TCV (Total Contract Value) of Wins by Quarter $ 58 $ 51 $ 44 $ 42 $ 33 $ 27 $ 20 $ 20 Q1 19 Q2 19 Q3 19 Q4 19 Q1 20 Q2 20 Q3 20 Q4 20 2019 TCV: $110MM 2020 TCV: $186MM +69% TCV Growth Note: Total Contract Value (TCV) is the estimated revenue from new or existing customer wins over an approx. 3-year time period based on customer and sales force forecasts of unit growth and contracted prices 196 KORE’s TCV wins increased by 69% in 2020 Estimated TCV (Total Contract Value) of Wins by Quarter $ 58 $ 51 $ 44 $ 42 $ 33 $ 27 $ 20 $ 20 Q1 19 Q2 19 Q3 19 Q4 19 Q1 20 Q2 20 Q3 20 Q4 20 2019 TCV: $110MM 2020 TCV: $186MM +69% TCV Growth Note: Total Contract Value (TCV) is the estimated revenue from new or existing customer wins over an approx. 3-year time period based on customer and sales force forecasts of unit growth and contracted prices 19

6 KORE’s SIM growth momentum is accelerating 2020 sequential SIM growth for Go Forward 2020 average SIM count for Go Forward customers customers (in M) (in M, % of total) Annualized 10.9 18% 10% 29% 48% Growth : 10 % 9.7 1.2 9.1 8.9 12 % 10 % 9 % 64 % 0.6 60 % 63 % 64 % 0.4 0.2 26 % 27 % 27 % 26 % Q1 Q2 Q3 Q4 Q1 Q2 Q3 Q4 Healthcare Industrial, Fleet, Asset Monitoring Communications & Other Note: Represents go forward SIMs; ~12M total SIMs as of 2020E. 206 KORE’s SIM growth momentum is accelerating 2020 sequential SIM growth for Go Forward 2020 average SIM count for Go Forward customers customers (in M) (in M, % of total) Annualized 10.9 18% 10% 29% 48% Growth : 10 % 9.7 1.2 9.1 8.9 12 % 10 % 9 % 64 % 0.6 60 % 63 % 64 % 0.4 0.2 26 % 27 % 27 % 26 % Q1 Q2 Q3 Q4 Q1 Q2 Q3 Q4 Healthcare Industrial, Fleet, Asset Monitoring Communications & Other Note: Represents go forward SIMs; ~12M total SIMs as of 2020E. 20
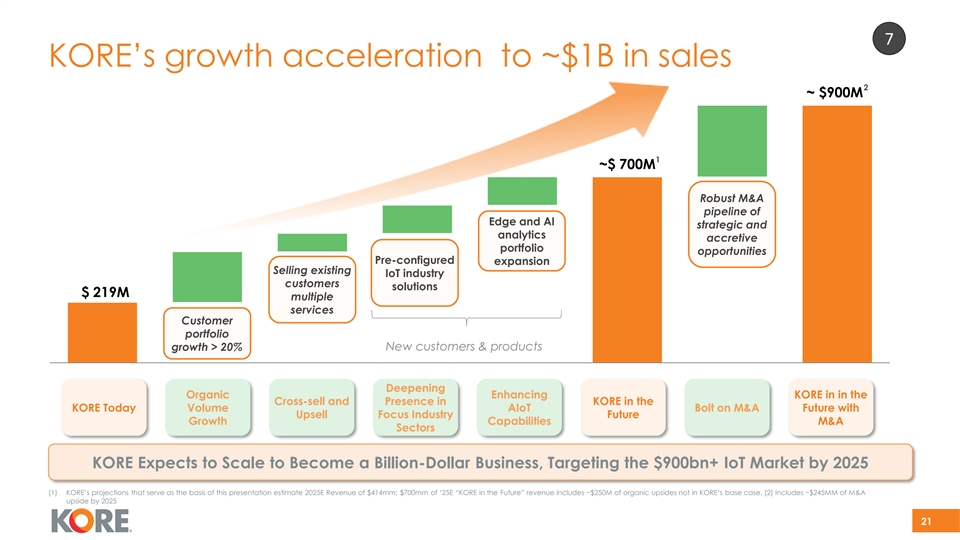
7 KORE’s growth acceleration to ~$1B in sales 2 ~ $900M 1 ~$ 700M Robust M&A pipeline of Edge and AI strategic and analytics accretive portfolio opportunities Pre-configured expansion Selling existing IoT industry customers solutions $ 219M multiple services Customer portfolio growth > 20% New customers & products Deepening Organic Enhancing KORE in in the Cross-sell and Presence in KORE in the KORE Today Volume AIoT Bolt on M&A Future with Upsell Focus Industry Future Growth Capabilities M&A Sectors KORE Expects to Scale to Become a Billion-Dollar Business, Targeting the $900bn+ IoT Market by 2025 (1) KORE’s projections that serve as the basis of this presentation estimate 2025E Revenue of $414mm; $700mm of ‘25E “KORE in the Future” revenue includes ~$250M of organic upsides not in KORE’s base case. (2) Includes ~$245MM of M&A upside by 2025 217 KORE’s growth acceleration to ~$1B in sales 2 ~ $900M 1 ~$ 700M Robust M&A pipeline of Edge and AI strategic and analytics accretive portfolio opportunities Pre-configured expansion Selling existing IoT industry customers solutions $ 219M multiple services Customer portfolio growth > 20% New customers & products Deepening Organic Enhancing KORE in in the Cross-sell and Presence in KORE in the KORE Today Volume AIoT Bolt on M&A Future with Upsell Focus Industry Future Growth Capabilities M&A Sectors KORE Expects to Scale to Become a Billion-Dollar Business, Targeting the $900bn+ IoT Market by 2025 (1) KORE’s projections that serve as the basis of this presentation estimate 2025E Revenue of $414mm; $700mm of ‘25E “KORE in the Future” revenue includes ~$250M of organic upsides not in KORE’s base case. (2) Includes ~$245MM of M&A upside by 2025 21
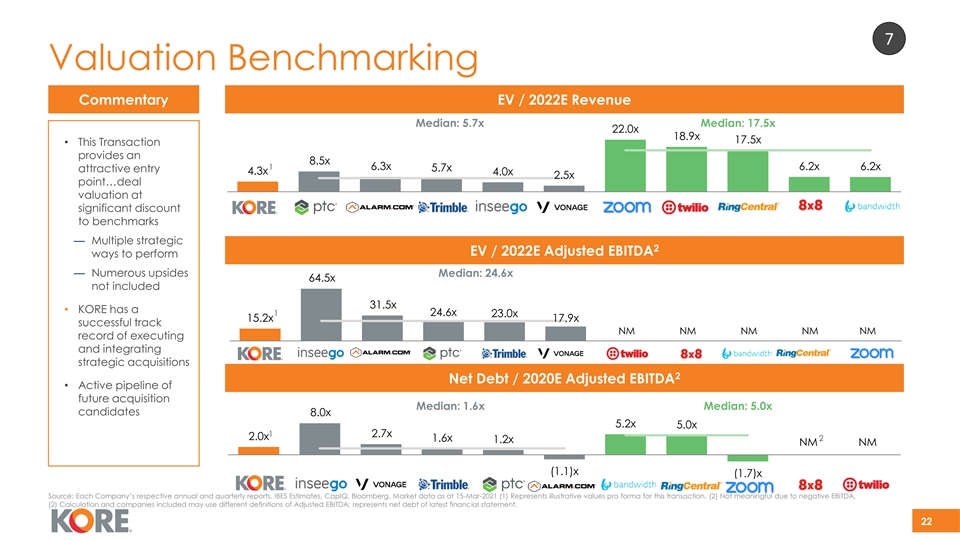
7 Valuation Benchmarking Commentary EV / 2022E Revenue Median: 5.7x Median: 17.5x 22.0x 18.9x 17.5x • This Transaction provides an 8.5x 1 6.3x 6.2x 6.2x attractive entry 5.7x 4.3x 4.0x 2.5x point…deal valuation at KORE PTC ALRM TRMB INSG VG ZM TWLO RNG EGHT BAND significant discount to benchmarks — Multiple strategic 2 EV / 2022E Adjusted EBITDA ways to perform — Numerous upsides Median: 24.6x 64.5x not included 31.5x • KORE has a 1 24.6x 23.0x 15.2x 17.9x successful track NM NM NM NM NM record of executing and integrating KING INSG ALRM PTC TRMB VG TWLO EGHT BAND RNG ZM strategic acquisitions 2 Net Debt / 2020E Adjusted EBITDA • Active pipeline of future acquisition Median: 1.6x Median: 5.0x candidates 8.0x 5.2x 5.0x 1 2.7x 2.0x 2 1.6x 1.2x NM NM (1.1)x (1.7)x KORE INSG VG TRMB PTC ALRM BAND RNG ZM TWLO EGHT Source: Each Company’s respective annual and quarterly reports, IBES Estimates, CapIQ, Bloomberg. Market data as at 15-Mar-2021 (1) Represents illustrative values pro forma for this transaction. (2) Not meaningful due to negative EBITDA. (2) Calculation and companies included may use different definitions of Adjusted EBITDA; represents net debt of latest financial statement. 227 Valuation Benchmarking Commentary EV / 2022E Revenue Median: 5.7x Median: 17.5x 22.0x 18.9x 17.5x • This Transaction provides an 8.5x 1 6.3x 6.2x 6.2x attractive entry 5.7x 4.3x 4.0x 2.5x point…deal valuation at KORE PTC ALRM TRMB INSG VG ZM TWLO RNG EGHT BAND significant discount to benchmarks — Multiple strategic 2 EV / 2022E Adjusted EBITDA ways to perform — Numerous upsides Median: 24.6x 64.5x not included 31.5x • KORE has a 1 24.6x 23.0x 15.2x 17.9x successful track NM NM NM NM NM record of executing and integrating KING INSG ALRM PTC TRMB VG TWLO EGHT BAND RNG ZM strategic acquisitions 2 Net Debt / 2020E Adjusted EBITDA • Active pipeline of future acquisition Median: 1.6x Median: 5.0x candidates 8.0x 5.2x 5.0x 1 2.7x 2.0x 2 1.6x 1.2x NM NM (1.1)x (1.7)x KORE INSG VG TRMB PTC ALRM BAND RNG ZM TWLO EGHT Source: Each Company’s respective annual and quarterly reports, IBES Estimates, CapIQ, Bloomberg. Market data as at 15-Mar-2021 (1) Represents illustrative values pro forma for this transaction. (2) Not meaningful due to negative EBITDA. (2) Calculation and companies included may use different definitions of Adjusted EBITDA; represents net debt of latest financial statement. 22
Important Information and Where to Find It
This communication is being made in respect of the proposed merger transaction involving CTAC and KORE. CTAC and Pubco have filed a registration statement on Form S-4 with the SEC, which includes a proxy statement of CTAC and a prospectus of Pubco, and CTAC will file other documents regarding the proposed transaction with the SEC. A definitive proxy statement/prospectus will also be sent to the stockholders of CTAC, seeking required stockholder approval. Before making any voting or investment decision, investors and security holders of CTAC are urged to carefully read the entire registration statement and proxy statement/prospectus, when they become available, and any other relevant documents filed with the SEC, as well as any amendments or supplements to these documents, because they will contain important information about the proposed transaction. The documents filed by CTAC with the SEC may be obtained free of charge at the SEC’s website at www.sec.gov. In addition, the documents filed by CTAC with the SEC may be obtained free of charge from CTAC’s website at www.cerberusacquisition.com or upon written request to Cerberus Telecom Acquisition Corp., 875 Third Avenue, New York, NY 10022.
This communication does not constitute an offer to sell or the solicitation of an offer to buy any securities or a solicitation of any vote or approval, nor shall there be any sale of any securities in any state or jurisdiction in which such offer, solicitation, or sale would be unlawful prior to registration or qualification under the securities laws of such other jurisdiction.
Participants in the Solicitation
CTAC, KORE and certain of their respective directors and executive officers may be deemed to be participants in the solicitation of proxies from the stockholders of CTAC, in favor of the approval of the merger. Information regarding CTAC’s and KORE’s directors and executive officers and other persons who may be deemed participants in the transaction may be obtained by reading the registration statement and the proxy statement/prospectus and other relevant documents filed with the SEC when they become available. Free copies of these documents may be obtained as described above.
Forward-Looking Statements
This communication includes certain statements that are not historical facts but are forward-looking statements for purposes of the safe harbor provisions under the United States Private Securities Litigation Reform Act of 1995. Forward-looking statements generally are accompanied by words such as “believe,” “may,” “will,” “estimate,” “continue,” “anticipate,” “intend,” “expect,” “should,” “would,” “plan,” “predict,” “potential,” “seem,” “seek,” “future,” “outlook,” and similar expressions that predict or indicate future events or trends or that are not statements of historical matters. These forward-looking statements include, but are not limited to, statements regarding estimates and forecasts of revenue and other financial and performance metrics and projections of market opportunity and expectations. These statements are based on various assumptions and on the current expectations of CTAC or KORE’s management. These forward-looking statements are provided for illustrative purposes only and are not intended to serve as, and must not be relied on by any investor or other person as, a guarantee, an assurance, a prediction or a definitive statement of fact or probability. Actual events and circumstances are difficult or impossible to predict and will differ from assumptions. Many actual events and circumstances are beyond the control of CTAC and/or KORE. These forward-looking statements are subject to a number of risks and uncertainties, including general economic, financial, legal, political and business conditions and changes in domestic and foreign markets; the potential effects of COVID-19; risks related to the rollout of KORE’s business and the timing of expected business milestones; changes in the assumptions underlying the KORE’s expectations regarding its future business; the effects of competition on KORE’s future business; and the outcome of judicial proceedings to which KORE is, or may become a party. If the risks materialize or assumptions prove incorrect, actual results could differ materially from the results implied by these forward-looking statements. There may be additional risks that KORE presently does not know or that KORE currently believes are immaterial that could also cause actual results to differ materially from those contained in the forward-looking statements. In addition, forward-looking statements reflect KORE’s expectations, plans or forecasts of future events and views as of the date of this communication. KORE and CTAC anticipate that subsequent events and developments will cause these assessments to change. However, while KORE and/or CTAC may elect to update these forward-looking statements at some point in the future, each of KORE and CTAC specifically disclaims any obligation to do so. These forward-looking statements should not be relied upon as representing KORE’s assessments as of any date subsequent to the date of this communication. Accordingly, undue reliance should not be placed upon the forward-looking statements.
Serious News for Serious Traders! Try StreetInsider.com Premium Free!
You May Also Be Interested In
- Discover Financial Services reports mixed Q1 results as earnings fall short
- Carrier Global (CARR) Invests in Strategic Thermal Labs
- Sanara MedTech (SMTI) Announces $55M Debt Facility
Create E-mail Alert Related Categories
SEC FilingsRelated Entities
Cerberus Capital, Definitive AgreementSign up for StreetInsider Free!
Receive full access to all new and archived articles, unlimited portfolio tracking, e-mail alerts, custom newswires and RSS feeds - and more!
