

Form 424B4 FIGS, Inc.
 Tweet
Tweet Share
ShareTable of Contents
Filed Pursuant to Rule 424(b)(4)
Registration No. 333-259504

| CLASS A COMMON STOCK | 8,917,385 SHARES |
The selling stockholders identified in this prospectus, who are Tulco LLC, our majority stockholder, and our co-founders and co-Chief Executive Officers, are offering 8,917,385 shares of our Class A common stock. We will not receive any of the proceeds from the sale of the shares being sold by the selling stockholders.
Our Class A common stock is listed on the New York Stock Exchange, or the NYSE, under the symbol “FIGS.” The last reported sale price of our Class A common stock on the NYSE on September 15, 2021 was $40.66 per share.
We have two classes of authorized common stock: Class A common stock and Class B common stock. The rights of the holders of each class of our common stock are identical, except with respect to voting and conversion rights. Each share of Class A common stock is entitled to one vote per share. Each share of Class B common stock is entitled to 20 votes per share and is convertible into one share of Class A common stock. See the section titled “Description of Capital Stock” for more information. All outstanding shares of our Class B common stock are held by our co-founders and co-Chief Executive Officers, Heather Hasson and Trina Spear, and Tulco, LLC, our majority stockholder. Immediately following the completion of this offering, these holders will represent approximately 80.0% of the voting power of our outstanding capital stock, assuming no exercise of the underwriters’ option to purchase additional shares.
We are a “controlled company” within the meaning of the corporate governance rules of the New York Stock Exchange.
We are an “emerging growth company” as that term is used in the Jumpstart Our Business Startups Act of 2012 and, as such, may elect to comply with certain reduced public company reporting requirements.
See “Risk Factors” beginning on page 16 to read about factors you should consider before buying shares of our Class A common stock. Neither the Securities and Exchange Commission nor any other regulatory body has approved or disapproved of these securities or passed upon the accuracy or adequacy of this prospectus. Any representation to the contrary is a criminal offense.
| Per Share | Total | |||||||
| Public offering price |
$ | 40.25 | $ | 358,924,746 | ||||
| Underwriting discount and commissions (1) |
$ | 1.41 | $ | 12,573,513 | ||||
| Proceeds, before expenses, to the selling stockholders |
$ | 38.84 | $ | 346,351,233 | ||||
(1) See “Underwriting” beginning on page 140 for additional information regarding underwriter compensation.
The underwriters have the option for a period of 30 days to purchase up to an additional 1,337,607 shares from the selling stockholders at the public offering price, less the underwriting discount and commissions.
The underwriters expect to deliver the shares against payment in New York, New York on September 20, 2021.
| GOLDMAN SACHS & CO. LLC | MORGAN STANLEY |
| BARCLAYS | CREDIT SUISSE | BofA SECURITIES |
| COWEN | GUGGENHEIM SECURITIES | KEYBANC CAPITAL MARKETS |
| OPPENHEIMER & CO. | PIPER SANDLER |
TELSEY ADVISORY GROUP |
| ACADEMY SECURITIES | R. SEELAUS & CO., LLC |
RAMIREZ & CO., INC. |
SIEBERT WILLIAMS SHANK |
Prospectus dated September 15, 2021
Table of Contents
| Page | ||||
| 1 | ||||
| 16 | ||||
| 54 | ||||
| 56 | ||||
| 57 | ||||
| 58 | ||||
| 59 | ||||
| Management’s Discussion and Analysis of Financial Condition and Results of Operations |
62 | |||
| 84 | ||||
| 107 | ||||
| 115 | ||||
| 121 | ||||
| 123 | ||||
| 125 | ||||
| 133 | ||||
| Material U.S. Federal Income Tax Consequences to Non-U.S. Holders of Our Class A Common Stock |
136 | |||
| 140 | ||||
| 147 | ||||
| 147 | ||||
| 147 | ||||
| F-1 | ||||
Neither we, the selling stockholders, nor any of the underwriters have authorized anyone to provide any information or to make any representations other than those contained in this prospectus or in any free writing prospectuses we have prepared. Neither we, the selling stockholders, nor any of the underwriters take responsibility for, and can provide no assurance as to the reliability of, any other information that others may give you. This prospectus is an offer to sell only the shares offered hereby, but only under circumstances and in jurisdictions where it is lawful to do so. The information contained in this prospectus is accurate only as of the date of this prospectus, regardless of the time of delivery of this prospectus or of any sale of our Class A common stock.
For investors outside of the United States: Neither we, the selling stockholders, nor any of the underwriters have done anything that would permit this offering or possession or distribution of this prospectus in any jurisdiction where action for that purpose is required, other than in the United States. Persons outside of the United States who come into possession of this prospectus must inform themselves about, and observe any restrictions relating to, the offering of the shares of our Class A common stock and the distribution of this prospectus outside of the United States.
i
Table of Contents
This summary highlights selected information presented in more detail elsewhere in this prospectus. This summary does not contain all the information you should consider before investing in our Class A common stock. You should carefully read this prospectus in its entirety before investing in our Class A common stock, including the sections titled “Risk Factors,” “Management’s Discussion and Analysis of Financial Condition and Results of Operations,” and “Special Note Regarding Forward-Looking Statements,” and our financial statements and the accompanying notes included elsewhere in this prospectus. Unless otherwise indicated, the terms “FIGS,” “Wear FIGS,” “we,” “us” and “our” refer to FIGS, Inc.
Our Mission
Our mission is to celebrate, empower and serve those who serve others.
Who We Are
We are a founder-led, direct-to-consumer healthcare apparel and lifestyle brand that seeks to celebrate, empower and serve current and future generations of healthcare professionals. We are committed to helping this growing, global community of professionals, whom we refer to as Awesome Humans, look, feel and perform at their best—24/7, 365 days a year. We create technically advanced apparel and products that feature an unmatched combination of comfort, durability, function and style, all at an affordable price. In doing so, we have redefined what scrubs are—giving rise to our tag-line: why wear scrubs, when you can #wearFIGS?
We have revolutionized the large and fragmented healthcare apparel market. We branded a previously unbranded industry and de-commoditized a previously commoditized product—elevating scrubs and creating premium products for healthcare professionals. Most importantly, we built a community and lifestyle around a profession. As a result, we have become the industry’s category-defining healthcare apparel and lifestyle brand.
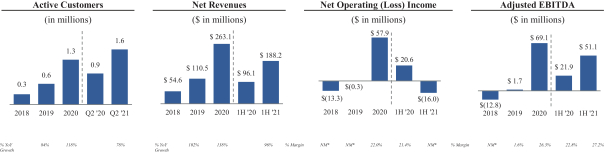
We market and sell 98% of our products through our digital platform, consisting of our website and mobile app, to a rapidly growing community of loyal customers. From 2017 to 2020, we grew net revenues from $17.6 million to $263.1 million, representing a compound annual growth rate, or CAGR, of 146%. In addition, in 2020, we delivered operating income and Adjusted EBITDA of $57.9 million and $69.1 million, respectively.
We Are Obsessed with Our Community of Awesome Humans.
We are dedicated to empowering and celebrating every healthcare professional across all disciplines and levels of experience. The healthcare community informs and inspires us, and we place these Awesome Humans at the center of everything we do. We purposefully design products to serve their particular needs and we sell those products through a convenient direct-to-consumer, or DTC, model tailored to their around-the-clock lifestyle. We use our digital platform to celebrate Awesome Humans in aspirational, creative and unexpected ways. We leverage social media platforms to listen to, engage with, understand and better serve our community of healthcare professionals at scale. Our Ambassador Program, which consists of hundreds of healthcare professionals from around the world, further drives engagement with our community. Our Ambassadors are an extension of our team and are evangelists for our brand. Our differentiated community-based approach has allowed us to build a growing base of approximately 1.6 million active customers who are passionate and loyal to our brand.
1
Table of Contents
Innovation Drives Our Product Development.
We create technically advanced apparel and products for the modern healthcare professional. Our design philosophy is rooted in Technical Comfort™—the conviction that design, comfort and function are non-negotiable. While multi-billion-dollar companies were focused on athletes, we believed that nobody was sufficiently focused on healthcare professionals—extraordinary people who care for patients, cure diseases and save lives, and who deserve to look, feel and perform at their best. As a result, we developed cutting-edge fabric technology and product designs to specifically address their needs. Our proprietary fabric technology, called FIONx, offers four-way stretch, anti-odor, anti-wrinkle and moisture-wicking properties. Our scrubs feature easy-to-access zippered pockets for professional and personal items such as stethoscopes, scissors, smartphones and ID badges. Our lifestyle apparel and other non-scrub offerings allow medical professionals to be outfitted—on and off shift. By enabling all healthcare professionals to have access to these products, we make the healthcare community more inclusive and aim to elevate the entire healthcare ecosystem.
We Are a Digitally Native Direct-to-Consumer Brand.
We are a digitally native DTC brand that utilizes technology to deliver a differentiated customer experience. We disrupted the industry’s historical distribution model, which required healthcare professionals to physically travel to brick-and-mortar stores to purchase their uniforms. We have built the largest DTC platform in healthcare apparel, leading the industry in the shift to digital. By selling directly through our digital platform, we control all aspects of the customer experience. Further, we are able to engage with our community of healthcare professionals before, during and after purchase, through our digital platform and numerous other channels. This direct engagement enables us to establish personal relationships at scale and provides us with valuable customer data and feedback that we leverage across our organization to better serve our community.
We Leverage Data Science to Connect with and Serve Our Community.
We leverage our rich customer data set, bolstered by the inherent benefits of our DTC model, to serve our community more effectively and efficiently. We develop proprietary and customized data solutions designed to optimize our product innovation, inventory analytics, marketing efforts and operational efficiency. We maintain centralized Data Science and Data Engineering teams and de-centralized Data Analysts working directly within each key functional area of the company. This approach enables us to gather and manage extensive data, and rapidly and directly apply that data to deliver customer insights and improve our core operating activities and decision-making processes. Our vast and growing data set plays a critical role in driving new customer acquisition as well as in our community engagement and retention strategy.
We Give Back to the Community We Serve.
In line with our purpose-driven mission, giving back is ingrained in everything we do at FIGS and has been from the beginning. When we started FIGS, we created an initiative called Threads for Threads to donate scrubs to healthcare professionals who work in resource-poor countries and lack the proper uniforms to do their jobs safely. By providing clean scrubs to these individuals, we aim to empower them and improve the quality of care they provide. Our efforts have been supported by over 60 organizations who understand the needs of local healthcare professionals and work with us to ensure that we provide what is needed. To date, we have donated hundreds of thousands of FIGS scrubs and other products to medical professionals in need. In response to the COVID-19 pandemic, in 2020, we focused our giving efforts locally in the United States, donating personal protective equipment, scrubs, funds and other essential products to frontline workers affected by the pandemic. Through all of these efforts, our approach is simple: we give back to the healthcare community that gives so much of itself to serving others.
2
Table of Contents
Our Recent Financial Performance
We have demonstrated rapid growth, strong profitability and positive cash flow generation. In 2020, we achieved the following results compared to 2019:
| • | Expanded our community of active customers by 118% from 0.6 million to approximately 1.3 million; |
| • | Increased net revenues from $110.5 million to $263.1 million, representing 138% year-over-year growth; |
| • | Increased gross margin by 50 basis points from 71.8% to 72.3%; |
| • | Improved net operating (loss) income from $(0.3) million to $57.9 million; |
| • | Increased Adjusted EBITDA from $1.7 million to $69.1 million, representing an Adjusted EBITDA margin of 26.3% in 2020; |
| • | Increased cash flow from operations from $6.5 million to $21.7 million; and |
| • | Increased free cash flow from $1.8 million to $19.5 million. |
In the six months ended June 30, 2021, we had the following results compared to the six months ended June 30, 2020:
| • | Expanded our community of active customers by 79.2% from approximately 0.9 million to approximately 1.6 million; |
| • | Increased net revenues from $96.1 million to $188.2 million, representing 95.8% year-over-year growth; |
| • | Increased gross margin by 0.2 percentage points from 72.3% to 72.5%; |
| • | Net operating income (loss) decreased from $20.6 million to $(16.0) million; |
| • | Increased Adjusted EBITDA from $21.9 million to $51.1 million, representing an Adjusted EBITDA margin of 27.2% in 2021; |
| • | Increased cash flow from operations from $24.3 million to $32.7 million; and |
| • | Increased free cash flow from $23.2 million to $31.7 million. |
| * | NM = Not Meaningful |
We define an active customer as a unique customer account that has made at least one purchase in the preceding 12-month period. See the section titled “Selected Financial Data—Non-GAAP Financial Measures” for information regarding Adjusted EBITDA, Adjusted EBITDA margin and free cash flow, including a reconciliation to the most directly comparable financial measures prepared in accordance with generally accepted accounting principles in the United States, or U.S. GAAP.
3
Table of Contents
Our Market Opportunity
Healthcare Apparel Is a Large, Growing and Non-Discretionary Industry.
According to the Bureau of Labor Statistics, the healthcare sector is the largest and fastest growing job segment in the United States, employing over 20 million professionals in 2020. Total U.S. employment between 2019 and 2029 is expected to grow by 15% for all healthcare professionals versus just 4% for all occupations. Within this growing market, healthcare apparel is a large, fundamentally attractive industry underpinned by its scale, recurring nature and compelling growth outlook. In 2020, the total addressable market of the healthcare apparel industry was an estimated $12.0 billion in the United States and $79.0 billion globally, according to an April 2021 Frost & Sullivan study that we commissioned. Unlike most other categories in the apparel sector, the healthcare apparel industry is largely non-discretionary, recession resistant and much less susceptible to fashion or fad risk. Hospitals, medical offices, clinics and laboratories routinely require healthcare professionals to wear scrubs, lab coats and other medical apparel during every shift. Over time, healthcare apparel purchasing has shifted from institutions to the individual, with approximately 85% of all medical professionals now purchasing their own uniforms. Due to frequent wear, healthcare apparel continuously needs to be replenished, resulting in highly predictable, recurring demand for such products.
The Industry Has Historically Lacked Innovation.
Prior to FIGS, the healthcare apparel industry had operated for over 100 years with little change or innovation. Despite attractive market fundamentals, the industry had been held back, and its consumers underserved, by legacy participants with outdated business models.
We believe that key limitations of industry incumbents include:
| • | Commoditized Products. Legacy manufacturers typically sell commoditized product offerings that are notoriously ill-fitting, uncomfortable, baggy, boxy and lacking in design and functionality, with minimal focus on fabric technology or performance. |
| • | Brand Obscurity. Traditional scrubs manufacturers sell under third-party licenses, and therefore do not retain control over the product and have limited ability to promote brand loyalty. |
| • | Antiquated Distribution. An outdated distribution strategy causes incumbent manufacturers to rely on a highly fragmented network of discount brick-and-mortar medical supply stores, often in inconvenient locations, and unappealing aggregated online sites operated by third-party retailers. |
| • | Channel Conflict. Due to legacy wholesale relationships, many incumbent manufacturers do not sell DTC despite consumers’ growing desire to engage directly with brands. |
| • | Customer Separation. Incumbent manufacturers generally do not have a direct connection with the end customer—the healthcare professional. As a result, they lack valuable feedback regarding customers’ needs and preferences. |
| • | Challenged Margins. Structurally challenged margin profiles, stemming from third-party brand licensing and wholesale distribution economics, likely impacts incumbent manufacturers’ ability to invest in product innovation, marketing and customer experience. |
The Industry is Fundamentally Changing.
We believe the healthcare apparel sector is positioned for continued strong growth driven by the following key industry dynamics:
| • | Resilient Industry with Favorable Long-Term Trends. The healthcare apparel industry is growing and has demonstrated resilience across economic cycles, driven by the non-discretionary, replenishment nature of its products and the secular growth of the healthcare sector. |
4
Table of Contents
| • | Increased Demand for Healthcare Professionals. Healthcare is the fastest growing job sector in the United States, having grown by 22% from January 2011 to January 2020. |
| • | Acceleration of eCommerce. The shift to eCommerce is rapidly accelerating as consumers continue to embrace the convenience of online and mobile shopping. For healthcare professionals who work long shifts and all hours of the day and night, the convenience of eCommerce is even more necessary. |
| • | Attraction to Purpose-Driven Brands. Consumers are increasingly attracted to, and interested in engaging with, purpose-driven brands using social media channels. |
| • | Magnified Importance of Technically Advanced Healthcare Apparel. The COVID-19 pandemic has magnified the indispensability of healthcare professionals. Due to the pandemic, more healthcare professionals are choosing to wear medical apparel, and a greater number of hospitals, medical offices and clinics are requiring staff to wear scrubs and other medical apparel. While we demonstrated consistent and significant growth prior to 2020, we believe the pandemic has accelerated awareness of the FIGS brand and a shift in purchasing decisions that will continue to drive future growth. |
Supported by these key trends, the healthcare apparel industry is expected to demonstrate strong and consistent growth, with the total addressable market in the United States expected to grow by a 6.1% CAGR over the next five years, from approximately $12.0 billion in 2020 to approximately $16.0 billion in 2025, according to the Frost & Sullivan study.
What Sets Us Apart
We believe that the following competitive strengths have been key drivers of our success to date and strategically position us for continued success.
Deeply Passionate, Loyal Community
We have been building a large, growing community of deeply loyal customers who share an authentic emotional connection with FIGS. During 2020, our community more than doubled to approximately 1.3 million active customers, about 60% of whom were repeat customers. Our brand awareness is driven largely by word of mouth among healthcare professionals who are passionate about FIGS, and whose passion quickly spreads through hospitals and healthcare institutions, where thousands of healthcare professionals often work in close proximity to one another. In addition, through our digital platform and social media presence, we showcase the daily wins and challenges that healthcare professionals experience, and allow our community to engage with each other on common ground, bridging gaps that previously existed across disciplines and experience levels within the healthcare profession. Our strong customer loyalty is demonstrated by our compelling revenue retention metrics. In 2020, we retained 75% of the 2019 and prior cohorts’ net revenues, including 100% of the 2019 net revenues generated by 2018 and prior cohorts.
Authentic, Category-Defining Brand
FIGS is the first digitally native lifestyle brand outfitting healthcare professionals. Our brand represents premium products combined with a seamless digital customer experience that healthcare professionals have never experienced before. Many of our customers form a deep emotional connection with our brand because we are the first brand in the industry to seek relentlessly to understand and fulfill their unique needs. Through our Ambassador Program, we have formed meaningful relationships with hundreds of Awesome Humans who help us reach millions of healthcare professionals around the world in an intimate, authentic and personalized way. Our strong brand affinity is demonstrated by our high Net Promoter Score of +81. See the section titled “Industry and Market Data” for additional information regarding Net Promoter Score.
5
Table of Contents
Industry-Leading Product Innovation
We strive to create the most innovative, functional, comfortable and stylish healthcare apparel in the industry. Our design philosophy stems from an unwavering focus on what healthcare professionals need from their apparel in order to look, feel and perform at their best. Our innovative products are designed, sourced and manufactured from the fiber level. Our proprietary FIONx fabric technology is made from what we believe to be the best combination of materials and is core-spun for maximum durability to withstand the demands of a healthcare professional’s work without sacrificing comfort. We design products that offer technical features such as four-way stretch, anti-odor, anti-wrinkle, and moisture-wicking properties. Our approach and products are distinct from those of legacy manufacturers, who offer poorly fitting scrubs and other commoditized healthcare apparel offerings. By elevating healthcare apparel, we seek to create products that healthcare professionals never even knew they needed or wanted, and that not only meet but exceed their expectations. We dream about inventing the future so that design is aesthetically pleasing, while also solving real problems for our community. This combination of form and function results in a range of products that deliver maximum comfort, function and style.
Digitally Native Direct-to-Consumer Strategy
Our business is powered by a digitally native DTC strategy, which offers significant competitive advantages. Unlike most incumbent scrubs manufacturers, who sell through legacy distribution channels and do not have direct touchpoints with the end customer, we directly engage with and serve medical professionals through our digital platform. By owning all aspects of the customer experience, including website and app design, marketing content, storytelling and post-purchase customer engagement, we deliver an elevated, personalized and seamless experience. Our DTC strategy also gives us access to valuable real-time customer data that allows us to better acquire and retain customers and reliably predict buying patterns. This leads to operational efficiencies throughout our supply chain, inventory management and new product development.
Highly Effective Merchandising and Product Launch Model
We have developed a highly effective merchandising strategy, anchored by our recurring, functional offering of 13 core scrubwear styles, which represented approximately 82% of our net revenues in 2020. The remaining 18% of net revenues in 2020 was generated by limited edition scrubwear styles as well as our lifestyle apparel and other non-scrub offerings, which include lab coats, underscrubs, outerwear, activewear, loungewear, compression socks, footwear, masks, face shields and other products. We launch limited edition colors or styles approximately weekly, driving recurring traffic to our digital platform where customers often purchase limited edition products along with our core offerings. These launches not only drive interest in the limited edition products themselves, they also drive our core business, as, on average, 90% of sales on launch days are core styles. This innovative, lower-risk merchandising strategy drives recurring demand while maintaining inventory efficiency.
Attractive Financial Profile Driving Robust Growth, Profitability and Cash Flow Generation
Our business model supports our attractive financial profile characterized by robust growth, profitability and cash flow generation. We have built an industry-leading business with only approximately $60.0 million of outside equity capital raised between 2013 and 2020, reflecting our focus on scalability and capital efficiency. As a successful DTC brand with a highly effective merchandising model, we benefit from structurally advantaged product margins and have experienced rapid growth and strong profitability. In 2020, we delivered net revenue growth of 138%, gross margins of 72.3%, operating income margins of 22.0% and Adjusted EBITDA margins of 26.3%. Due to our modest capital expenditure requirements, we enjoy significant cash flow generation.
6
Table of Contents
Mission-Driven, Founder-Led Culture and Execution
Our company culture, strategic vision and operational execution are driven by our visionary co-founders and co-Chief Executive Officers, Heather Hasson and Trina Spear. Ms. Hasson and Ms. Spear are successful entrepreneurs who offer highly complementary skillsets that have helped to scale FIGS from selling out of the back of a car to generating net revenues of $263.1 million in 2020.
Our company culture mirrors our founders’ mission to celebrate, empower and serve those who serve others. We understand that authentically serving humans starts from within, and we are passionate about supporting our community and ensuring that our company reflects the world we want to live in.
Our Growth Strategies
In 2020, the total addressable market of the U.S. healthcare apparel industry was approximately $12.0 billion, according to the Frost & Sullivan study. Notwithstanding our rapid growth, we estimate that our share of this U.S. healthcare apparel industry was approximately 2.1%, presenting substantial opportunity for further growth. We believe we are well-positioned to significantly expand our market share and drive sustainable growth and profitability by executing on the following strategies:
Continue to Increase Customer Loyalty
We have the opportunity to create customers for life—customers who return to FIGS repeatedly throughout their medical careers. Healthcare apparel continuously needs to be replenished, resulting in highly predictable, recurring demand. As a result, customer loyalty and retention will continue to be a key driver of our growth. We encourage repeat purchases by introducing innovative limited edition styles, products and color drops. We inspire customer loyalty by building authentic relationships with our community and by creating thoughtful brand and performance marketing focused on retention. For example, through our #FIGSLOVE program, we send special gifts, such as embroidered lab coats, to members of our community when they graduate from school, open a new practice or reach other career milestones. We aim to be part of their journey, building deep, lasting relationships along the way.
For customers that were acquired between 2017 and 2019, approximately 50% returned for a second purchase, demonstrating our high customer retention and engagement. After a second purchase, 63% of those customers in that cohort purchased again. After a third purchase, 70% of those customers in that cohort purchased yet again. By leveraging data analytics and developing new personalization capabilities, we plan to continue to deepen our existing customer relationships to further improve our strong customer retention and engagement.
Grow Brand Awareness and Attract New Customers
As of June 30, 2021, we served a community of approximately 1.6 million active customers, which compares to a broader total addressable market of over 20 million healthcare professionals in the United States. In addition, while men on average represented approximately 25% of the U.S. healthcare workforce in 2019, our men’s business represented only 17% of our net revenues in 2020, presenting significant opportunity to expand our customer base.
We have a significant opportunity to grow brand awareness and attract new customers to FIGS through word of mouth, brand marketing and performance marketing. Among U.S. healthcare professionals and medical students, we have aided and unaided brand awareness of 55% and 22%, respectively, according to a survey
7
Table of Contents
performed by Frost & Sullivan. See “Industry and Market Data” for additional information. Hospitals and other healthcare institutions, which often employ thousands of healthcare professionals working in close physical proximity on a daily basis, serve as ideal environments for growing awareness of our brand through word of mouth. Brand marketing and performance marketing also work together to drive millions of visits to our digital platform. Brand marketing includes differentiated content, our network of hundreds of Ambassadors, and social media, all of which result in outsized engagement with our community. Our digital-centric performance marketing efforts are designed to drive customers from awareness to consideration to conversion. These efforts include retargeting, paid search and product listing advertisements, paid social media advertisements, search engine optimization, personalized email and mobile push notifications through our app. Our highly productive, diversified strategy generates a significant return on new customer acquisition investments resulting from high average order value, strong product margins and attractive repeat purchase behavior.
Broaden Our Lifestyle Offerings
We intend to continue to leverage healthcare professionals’ trust in our technical function, fit, comfort and style, as well as our rapid product development capabilities to broaden and deepen our product offerings. We have strategically expanded our addressable market over time by creating new innovative products and entering or creating new categories that are complementary to our core offerings. Our category expansion strategy is focused on outfitting the medical professional—on and off shift—to work, at work and from work. Our customers often begin their FIGS journey with our core scrubs and expand their purchases to limited edition scrubs and lifestyle and other products, such as lab coats, underscrubs, outerwear, activewear, loungewear, compression socks, footwear, masks and face shields. As we continue to expand our offerings to fully outfit the medical professional, we believe we have a significant opportunity to continue to expand our share of both the uniform and lifestyle wardrobe of our customers.
Utilize Data Science to Expand Our Community, Elevate Customer Experience and Drive Intelligent Replenishment
We expect to drive continued growth from our use of proprietary data science. Through hundreds of data attributes associated with millions of customers, we have a unique ability to welcome new healthcare professionals to our community and drive repeat business from them. As just one illustration of this, we are able to identify geographic regions where FIGS is under-represented, use our knowledge of existing community members to build machine learning-derived customer segments to identify who is most likely to purchase from us, and drive our customers to a digital experience that is pre-populated with the products most likely to appeal to them.
Similarly, we believe that traditional fixed-time subscription models are disconnected from a healthcare professional’s actual needs. Instead, we use an intelligent replenishment model that is tied to individualized buying preferences. To us, it is fundamental that we cater to the unique preferences of each healthcare professional—how often they want to buy certain products, which products they are most likely to buy, and through which channel they are most likely to transact. By leveraging data science, we are able to answer these questions for each member of our large and growing community in increasingly accurate ways, and to create replenishment opportunities that are tied to those customized needs.
Pursue International Expansion
While we expect the majority of our near-term growth to continue to come from the United States, we believe there is a tremendous opportunity over the long term to serve healthcare professionals throughout the rest of the world. According to the Frost & Sullivan study, the number of healthcare professionals and medical students internationally is expected to grow from approximately 118 million in 2020 to an estimated 124 million
8
Table of Contents
in 2025, and the total addressable market for international healthcare apparel is expected to grow from an estimated $67.0 billion in 2020 to an estimated $86.0 billion in 2025. In 2020, we successfully piloted international expansion by selling into Australia, Canada and the United Kingdom. Over time, we plan to enter other new markets as we seek to enhance our ability to serve our international customers and further establish FIGS as a global brand. In order to offer a more localized experience to customers internationally, we plan to launch products that are specific to local markets and digital experiences that are tied to local culture. We also intend to offer market-specific languages, currency and content, as well as strategic international shipping and distribution hubs. We plan to leverage our social media strategy and expand our network of Ambassadors to grow our brand awareness globally.
Enter New Professional Markets
Outside of the healthcare apparel industry, we believe we have a compelling long-term opportunity to enter into other uniform-wearing professional markets. In the United States, there are 40 million people outside of healthcare in service-based industries that traditionally wear uniforms every day, such as food service, hospitality, construction and transportation. The occupational nature of these professions is generally hands-on, labor-intensive and often requires apparel with technical specifications. Furthermore, we believe the incumbent apparel manufacturers in these markets suffer from limitations similar to those faced by the legacy healthcare apparel manufacturers. In our view, these markets—similar to the healthcare apparel market—have long been underserved by incumbent apparel manufacturers and are ripe for disruption. We believe we are strategically positioned to leverage our core competencies to expand into these new markets in the future.
Risk Factors Summary
Our business is subject to numerous risks and uncertainties, including those highlighted in the section titled “Risk Factors” immediately following this Prospectus Summary. Some of these risks include:
| • | Our recent rapid growth may not be sustainable or indicative of future growth, and we expect our growth rate to ultimately slow over time. |
| • | If we fail to manage our growth effectively, our business, financial condition and results of operations may be adversely affected. |
| • | We have only recently achieved profitability and may not maintain profitability in the future. |
| • | Our success depends on our ability to maintain the value and reputation of our brand. |
| • | If we fail to attract new customers, retain existing customers, or fail to maintain or increase sales to those customers, our business, financial condition, results of operations and growth prospects will be harmed. |
| • | If our marketing efforts are not successful, our business, financial condition and results of operations could be harmed. |
| • | Our business depends on our ability to maintain a strong community of engaged customers and Ambassadors, including through the use of social media. We may not be able to maintain and enhance our brand if we experience negative publicity related to our marketing efforts or use of social media, fail to maintain and grow our network of Ambassadors or otherwise fail to meet our customers’ expectations. |
| • | If we do not continue to successfully develop and introduce new, innovative and updated products, we may not be able to maintain or increase our sales and profitability. |
| • | The market for healthcare apparel is highly competitive. |
9
Table of Contents
| • | Our future success depends on the continuing efforts of our key employees and our ability to attract and retain highly skilled personnel and senior management. |
| • | We plan to expand into additional international markets, which will expose us to new risks. |
| • | Shipping is a critical part of our business and any changes in, or disruptions to, our shipping arrangements, could adversely affect our business, financial condition and results of operations. |
| • | If we are unable to accurately forecast customer demand, manage our inventory and plan for future expenses, our results of operations could be adversely affected. |
| • | Our business may be subject to uncertainty as a result of the COVID-19 pandemic. |
| • | Our reliance on a limited number of third-party suppliers to provide materials for and produce our products could cause problems in our supply chain and subject us to additional risks. |
| • | The dual-class structure of our common stock and voting agreement among us and the Class B stockholders has the effect of concentrating control with our co-founders and co-Chief Executive Officers, and Tulco, LLC. |
| • | We are a “controlled company” within the meaning of the rules of the New York Stock Exchange and, as a result, qualify for, and rely on, exemptions from certain corporate governance requirements. You do not have the same protections afforded to stockholders of companies that are subject to such requirements. |
Our Dual-Class Capital Structure
We have two classes of authorized common stock: Class A common stock and Class B common stock. The rights of the holders of each class of our common stock are identical, except with respect to voting and conversion rights. Each share of Class A common stock is entitled to one vote per share. Each share of Class B common stock is entitled to 20 votes per share and is convertible into one share of Class A common stock. All outstanding shares of our Class B common stock are held by our co-founders and co-Chief Executive Officers, Heather Hasson and Trina Spear, and Tulco, LLC, our majority stockholder. Immediately following the completion of this offering, these holders will represent approximately 80.0% of the voting power of our outstanding capital stock, assuming no exercise of the underwriters’ option to purchase additional shares.
Holders of shares of our Class A common stock and Class B common stock generally vote together as a single class on all matters (including the election of directors) submitted to a vote of stockholders, unless otherwise required by Delaware law or our amended and restated certificate of incorporation. Our amended and restated certificate of incorporation does not provide for cumulative voting for the election of directors.
Each outstanding share of Class B common stock is convertible at any time at the option of the holder into one share of Class A common stock. In addition, each share of Class B common stock will convert automatically into one share of Class A common stock upon any transfer, whether or not for value, except for certain permitted transfers described in our amended and restated certificate of incorporation, including transfers for estate planning purposes or charitable transfers where voting control is retained by the transferring holder or transfers to affiliates or certain other related entities of the transferring holder. Once converted or transferred and converted into Class A common stock, the Class B common stock may not be reissued.
All outstanding shares of our Class B common stock will convert automatically into shares of our Class A common stock upon the earlier of (1) the date fixed by our board of directors that is not less than 60 days or more than 180 days following the death or disability of both Ms. Hasson and Ms. Spear and (2) June 1, 2031, the 10-year anniversary of the date of the closing of our initial public offering, or IPO, each of which we refer to as a final conversion event. In addition, if prior to a final conversion event Tulco, LLC and its permitted transferees
10
Table of Contents
cease to hold at least 20% of the aggregate number of shares of all classes of common stock then outstanding (calculated on a diluted basis to include any issued and outstanding stock options, restricted stock units or other equity awards, whether vested or unvested), then any shares of Class B common stock then held by Tulco, LLC and its permitted transferees will convert automatically into shares of our Class A common stock on a date fixed by our board of directors that is not less than 60 days or more than 180 days following such occurrence. Once converted into Class A common stock, the Class B common stock may not be reissued.
Upon the conversion of all shares of Class B common stock into shares of Class A common stock, the rights of the holders of all outstanding shares of common stock will be identical.
See the section titled “Description of Capital Stock” for more information.
Corporate Information
We were formed in 2013 as FIGS, Inc., a Delaware corporation. Our principal executive offices are located at 2834 Colorado Avenue, Suite 100 Santa Monica, California 90404 and our telephone number is (424) 300-8330. Our website address is www.wearfigs.com. The information contained on, or that can be accessed through, our website is not incorporated by reference into, and is not a part of, this prospectus. Investors should not rely on any such information in deciding whether to purchase our Class A common stock.
We have announced, and we intend to continue to announce, material information to the public through filings with the Securities and Exchange Commission, or the SEC, the investor relations page on our website, press releases, public conference calls, and public webcasts. Any updates to the list of disclosure channels through which we will announce information will be posted on the investor relations page on our website.
Trademarks
FIGS, the CROSS & SHIELD logo, Threads for Threads, FIONtechnology, FIONx, Technical Comfort, Awesome Humans and other registered or common law trade names, trademarks, or service marks of FIGS appearing in this prospectus are the property of FIGS. This prospectus may contain additional trade names, trademarks, and service marks of other companies that are the property of their respective owners. We do not intend our use or display of other companies’ trade names, trademarks, or service marks to imply a relationship with, or endorsement or sponsorship of us by, these other companies. Solely for convenience, our trademarks and tradenames referred to in this prospectus may appear without the ® and ™ symbols, but those references are not intended to indicate, in any way, that we will not assert, to the fullest extent under applicable law, our rights, or the right of the applicable licensor, to these trademarks and tradenames.
Implications of Being an Emerging Growth Company
We qualify as an “emerging growth company” as defined in Section 2(a) of the Securities Act of 1933, as amended, or the Securities Act, as modified by the Jumpstart Our Business Startups Act of 2012, or the JOBS Act. As an emerging growth company, we may take advantage of specified reduced disclosure and other requirements that are otherwise applicable, in general, to public companies that are not emerging growth companies. These provisions include:
| • | the option to present only two years of audited financial statements and only two years of related Management’s Discussion and Analysis of Financial Condition and Results of Operations in this prospectus; |
| • | not being required to comply with the auditor attestation requirements of Section 404 of the Sarbanes-Oxley Act of 2002; |
11
Table of Contents
| • | reduced disclosure obligations regarding executive compensation in our periodic reports, proxy statements and registration statements; and |
| • | exemptions from the requirements of holding a nonbinding advisory vote on executive compensation and stockholder approval of any golden parachute payments not previously approved. |
We will remain an emerging growth company until the earliest to occur of: (1) the last day of the fiscal year in which we have more than $1.07 billion in annual revenue; (2) the date we qualify as a “large accelerated filer,” with at least $700 million of equity securities held by non-affiliates; (3) the date on which we have issued, in any three-year period, more than $1.0 billion in non-convertible debt securities; and (4) the last day of the fiscal year ending after the fifth anniversary of the completion of our IPO.
We have elected to take advantage of certain of the reduced disclosure obligations in the registration statement of which this prospectus is a part and may elect to take advantage of other reduced reporting requirements in future filings. As a result, the information that we provide may be different than the information you receive from other public companies in which you hold stock.
Emerging growth companies can also take advantage of the extended transition period provided in Section 13(a) of the Securities Exchange Act of 1934, as amended, or the Exchange Act, for complying with new or revised accounting standards. In other words, an emerging growth company can delay the adoption of certain accounting standards until those standards would otherwise apply to private companies. We have elected to take advantage of this extended transition period and, as a result, our operating results and financial statements may not be comparable to the operating results and financial statements of companies who have adopted the new or revised accounting standards.
12
Table of Contents
THE OFFERING
| Class A common stock offered by the selling stockholders |
8,917,385 shares |
| Option to purchase additional shares of Class A common stock offered by the selling stockholders |
The selling stockholders have granted the underwriters a 30-day option to purchase up to 1,337,607 additional shares of our Class A common stock at the public offering price, less the underwriting discounts and commissions. |
| Class A common stock to be outstanding after this offering |
151,111,820 shares |
| Class B common stock to be outstanding after this offering |
12,302,907 shares |
| Total common stock to be outstanding after this offering |
163,414,727 shares |
| Use of Proceeds |
The selling stockholders will receive all net proceeds from the sale of the shares of Class A common stock to be sold in this offering, and we will not receive any of these proceeds. See the section titled “Use of Proceeds” for additional information. |
| Voting Rights |
Shares of our Class A common stock are entitled to one vote per share. Shares of our Class B common stock are entitled to 20 votes per share. |
| Holders of our Class A common stock and Class B common stock generally vote together as a single class, unless otherwise required by law or our amended and restated certificate of incorporation. Each share of our Class B common stock is convertible into one share of our Class A common stock at any time and will convert automatically upon certain transfers and in certain other circumstances as described in our amended and restated certificate of incorporation. See “—Our Dual-Class Capital Structure” above. All outstanding shares of our Class B common stock are held by our co-founders and co-Chief Executive Officers, Heather Hasson and Trina Spear, and Tulco, LLC, our majority stockholder. Immediately following the completion of this offering, these holders will represent approximately 80.0% of the voting power of our outstanding capital stock, assuming no exercise of the underwriters’ option to purchase additional shares. These Class B stockholders have the ability to control the outcome of matters submitted to our stockholders for approval, including the election of our directors and the approval of any change of control transaction. In addition, we and the Class B stockholders have entered into a voting agreement with respect to the election of directors. See the sections titled “Principal and Selling Stockholders” and “Description of Capital Stock” for additional information. |
13
Table of Contents
| Controlled Company |
We are a “controlled company” within the meaning of the corporate governance rules of the NYSE. |
| Risk Factors |
See the section titled “Risk Factors” and other information included in this prospectus for a discussion of some of the factors you should consider before deciding to purchase shares of our Class A common stock. |
| NYSE Symbol |
“FIGS” |
The number of shares of our common stock to be outstanding after this offering as set forth above is based upon 147,730,670 shares of our Class A common stock and 13,264,059 shares of our Class B common stock outstanding, in each case, as of August 31, 2021. This does not include the following additional equity awards that have already been granted:
| • | 39,718,610 shares of our Class A common stock issuable upon the exercise of outstanding stock options under our Amended 2016 Equity Incentive Plan, or our 2016 Plan, as of August 31, 2021, at a weighted-average exercise price of $3.74 per share, including 33,387,120 shares underlying stock option awards that are subject to the Equity Award Exchange Agreement (defined below); and |
| • | 3,381,520 shares of our Class A common stock issuable upon the vesting and settlement of outstanding restricted stock units, or RSUs, under our 2016 Plan as of August 31, 2021, all of which are subject to the Equity Award Exchange Agreement. |
This also does not include the following additional shares of our Class A common stock that have been reserved for future issuance:
| • | 13,157,003 shares of our Class A common stock reserved for future issuance under our 2021 Equity Incentive Plan, or our 2021 Plan; and |
| • | 1,605,647 shares of our Class A common stock reserved for issuance under our 2021 Employee Stock Purchase Plan, or our ESPP. |
Pursuant to an equity award exchange right agreement entered into between us and our co-founders and co-Chief Executive Officers, Ms. Hasson and Ms. Spear, or the Equity Award Exchange Agreement, each of Ms. Hasson and Ms. Spear have a right to require us to exchange any shares of Class A common stock received upon the exercise of stock options or the vesting and settlement of RSUs, in each case granted under our 2016 Plan and outstanding prior to the date of effectiveness of the registration statement related to our IPO, for an equivalent number of shares of Class B common stock. As of August 31, 2021, this included an aggregate of 33,387,120 shares underlying outstanding options and an aggregate of 3,381,520 shares underlying outstanding RSUs held by Ms. Hasson and Ms. Spear. The Equity Award Exchange Agreement does not cover any equity awards granted to Ms. Hasson or Ms. Spear in connection with or following the completion of our IPO.
Except as otherwise indicated, all information in this prospectus reflects and assumes:
| • | no exercise of outstanding stock options or vesting and settlement of outstanding RSUs referred to above after August 31, 2021, other than the exercise of stock options in connection with the sale of shares in this offering (see “Principal and Selling Stockholders” for more information); and |
| • | no exercise by the underwriters of their option to purchase up to an additional 1,337,607 shares of our Class A common stock from the selling stockholders in this offering. |
14
Table of Contents
SUMMARY FINANCIAL DATA
The following tables summarize our financial data for the periods and as of the dates indicated. We derived our summary statements of operations data for the years ended December 31, 2019 and 2020 from our audited financial statements included elsewhere in this prospectus. We derived our summary statements of operations data for the six months ended June 30, 2020 and 2021 and the summary balance sheet data as of June 30, 2021 from our unaudited financial statements included elsewhere in this prospectus. In our opinion, the unaudited interim financial statements have been prepared on a basis consistent with our audited financial statements and contain all adjustments, consisting only of normal and recurring adjustments, necessary for a fair presentation of such interim financial statements. Our historical results are not necessarily indicative of the results to be expected in the future and our interim results are not necessarily indicative of the results that may be expected for the full fiscal year or any other future period. You should read the following summary financial data in conjunction with the sections titled “Selected Financial and Other Data” and “Management’s Discussion and Analysis of Financial Condition and Results of Operations” and our financial statements, the accompanying notes and other financial information included elsewhere in this prospectus.
| Years Ended December 31, | Six Months Ended June 30, | |||||||||||||||
| 2019 | 2020 | 2020 | 2021 | |||||||||||||
| (in thousands, except share and per share data) | ||||||||||||||||
| Statements of Operations Data: |
||||||||||||||||
| Net revenues |
$ | 110,494 | $ | 263,112 | $ | 96,110 | $ | 188,196 | ||||||||
| Cost of goods sold |
31,158 | 72,888 | 26,578 | 51,683 | ||||||||||||
|
|
|
|
|
|
|
|
|
|||||||||
| Gross profit |
79,336 | 190,224 | 69,532 | 136,513 | ||||||||||||
| Operating expenses: |
||||||||||||||||
| Selling |
24,840 | 51,896 | 19,644 | 36,337 | ||||||||||||
| Marketing |
33,193 | 38,852 | 16,142 | 26,327 | ||||||||||||
| General and administrative(1) |
21,650 | 41,536 | 13,150 | 89,850 | ||||||||||||
|
|
|
|
|
|
|
|
|
|||||||||
| Total operating expenses |
79,683 | 132,284 | 48,936 | 152,514 | ||||||||||||
|
|
|
|
|
|
|
|
|
|||||||||
| Net (loss) income from operations |
(347 | ) | 57,940 | 20,596 | (16,001 | ) | ||||||||||
| Other income (loss), net |
459 | 136 | 116 | (69 | ) | |||||||||||
|
|
|
|
|
|
|
|
|
|||||||||
| Net income (loss) before income tax provision |
112 | 58,076 | 20,712 | (16,070 | ) | |||||||||||
| Provision for income taxes |
— | 8,318 | 2,403 | 13,036 | ||||||||||||
|
|
|
|
|
|
|
|
|
|||||||||
| Net income (loss) |
$ | 112 | $ | 49,758 | $ | 18,309 | $ | (29,106 | ) | |||||||
|
|
|
|
|
|
|
|
|
|||||||||
| Basic earnings (loss) per share(2) |
$ | — | $ | 0.32 | $ | 0.12 | $ | (0.19) | ||||||||
|
|
|
|
|
|
|
|
|
|||||||||
| Diluted earnings (loss) per share(2) |
$ | — | $ | 0.30 | $ | 0.12 | $ | (0.19) | ||||||||
|
|
|
|
|
|
|
|
|
|||||||||
| Weighted-average shares outstanding - basic(2) |
153,052,983 | 153,327,308 | 153,052,983 | 155,725,959 | ||||||||||||
|
|
|
|
|
|
|
|
|
|||||||||
| Weighted-average shares outstanding - diluted(2) |
153,624,013 | 163,331,348 | 153,661,856 | 155,725,959 | ||||||||||||
|
|
|
|
|
|
|
|
|
|||||||||
| (1) | Includes stock-based compensation expense of $0.2 million and $8.7 million for the years ended December 31, 2019 and 2020, respectively, and $0.3 million and $61.0 million for the six months ended June 30, 2020 and 2021, respectively. |
| (2) | See Note 13 to our audited financial statements and Note 11 to our unaudited interim financial statements included elsewhere in this prospectus for an explanation of the calculations of our basic and diluted earnings per share and the weighted-average number of shares used in the computation of the per share amounts. |
| As of December 31, | As of June 30, | |||||||||||
| 2019 | 2020 | 2021 | ||||||||||
| (in thousands) | ||||||||||||
| Balance Sheet Data: |
||||||||||||
| Cash and cash equivalents |
$ | 38,353 | $ | 58,133 | $ | 163,968 | ||||||
| Total assets |
62,598 | 133,855 | 254,254 | |||||||||
| Total liabilities |
23,784 | 36,178 | 50,539 | |||||||||
| Total stockholders’ equity |
38,814 | 97,677 | 203,715 | |||||||||
15
Table of Contents
Investing in our Class A common stock involves a high degree of risk. You should consider carefully the risks and uncertainties described below, together with all of the other information in this prospectus, including the section titled “Management’s Discussion and Analysis of Financial Condition and Results of Operations” and our financial statements and the accompanying notes included elsewhere in this prospectus before deciding whether to invest in shares of our Class A common stock. The risks and uncertainties described below are not the only ones we face. Additional risks and uncertainties that we are unaware of or that we deem immaterial may also become important factors that adversely affect our business. If any of the following risks occur, our business, financial condition, results of operations and future prospects could be adversely affected. In that event, the market price of our Class A common stock could decline, and you could lose part or all of your investment.
Risks Related to Our Business
Our recent rapid growth may not be sustainable or indicative of future growth, and we expect our growth rate to ultimately slow over time.
We have experienced significant and rapid growth. Net revenues increased from $110.5 million in 2019 to $263.1 million in 2020. For the six months ended June 30, 2020 and 2021, we had net revenues of $96.1 million and $188.2 million, respectively. Our historical rate of growth may not be sustainable or indicative of our future rate of growth, and in future periods, our net revenues could grow more slowly than we expect or decline. We believe that continued growth in net revenues, as well as our ability to improve or maintain margins and profitability, will depend upon, among other factors, our ability to address the challenges, risks and difficulties described elsewhere in this “Risk Factors” section. We cannot provide assurance that we will be able to successfully manage any such challenges or risks to our future growth. Any of these factors could cause our net revenue growth to slow or decline and may adversely affect our margins and profitability. Even if our net revenues continue to increase, we expect that our growth rate may slow for a number of other reasons, including if there is a slowdown in the growth of demand for our products, increased competition, a decrease in the growth or reduction in the size of our overall market or if we cannot capitalize on growth opportunities. Failure to continue to grow our net revenues or improve or maintain margins would adversely affect our business, financial condition and results of operations. You should not rely on our historical rate of growth as an indication of our future performance.
If we fail to manage our growth effectively, our business, financial condition and results of operations may be adversely affected.
We have expanded our operations rapidly since our founding in 2013. To manage our growth effectively, we must continue to implement our operational plans and strategies, improve and expand our infrastructure of people and information systems and expand, train and manage our employee base. We have rapidly increased employee headcount since our inception to support the growth in our business. To support our continued growth, we must effectively integrate, develop and motivate a large number of new employees. We face significant competition for personnel, including in Southern California, where our headquarters is located. To attract top talent, we may need to increase our employee compensation levels to remain competitive in attracting and retaining talented employees. In addition, we could be required to continue to expand our sales and marketing, product development and distribution functions, to upgrade our management information systems and other processes and technology and to obtain more space for our expanding workforce. Additionally, the growth of our business places significant demands on our existing management and other employees. Failure to manage our employee base and hiring needs effectively, including successfully integrating our new hires, may adversely affect our business, financial condition and results of operations.
16
Table of Contents
In addition, we are required to manage relationships with a growing number of customers, suppliers, manufacturers, distributors and other third parties. If we are unable to expand supply, manufacturing and distribution capabilities when required, or our information technology systems and our other processes are inadequate to support the future growth of these relationships, we could experience delays in customer service and order response and shipping times, which would adversely impact our reputation and brand. If we are unable to manage the growth of our organization effectively, our business, financial condition and results of operations may be adversely affected.
We only recently achieved profitability and may not be profitable in the future.
We have a history of operating losses and only recently achieved profitability. We expect our operating expenses to increase in the future as we increase our sales and marketing efforts, continue to invest in developing new products, hire additional personnel, expand our operating infrastructure and expand into new geographies. Further, as a public company, we incur additional legal, accounting and other expenses that we did not incur as a private company. These efforts and additional expenses may be more costly than we expect, and we cannot guarantee that we will be able to increase our net revenues to offset our increased operating expenses. Our net revenues growth may slow for a number of other reasons, including if we experience reduced demand for our products, increased competition, a decrease in the growth or reduction in the size of our overall market or if we cannot capitalize on growth opportunities. If our net revenues do not grow at a greater rate than our operating expenses, we will not be able to maintain the level of profitability that we recently achieved.
Our success depends on our ability to maintain the value and reputation of our brand.
The FIGS brand is integral to our business strategy and our ability to attract and engage customers. Maintaining, promoting and positioning our brand will depend largely on the success of our marketing and branding efforts and our ability to provide a consistent, high quality product and customer experience. Our brand may suffer if we fail to achieve these objectives or if our public image were to be tarnished by negative publicity about us, including our products, technology, customer service, personnel, marketing efforts, Ambassadors or suppliers. Even isolated incidents involving our company, suppliers, agents or third-party service providers, or the products we sell, could erode the trust and confidence of our customers and damage the strength of our brand, especially if such incidents result in adverse publicity, governmental investigations, product recalls or litigation.
In addition, the importance of our brand may increase to the extent we experience increased competition, which could require additional expenditures on our brand promotion activities. Maintaining and enhancing our brand image also may require us to make additional investments in areas such as merchandising, marketing and online operations. These investments may be substantial and may not ultimately be successful. Moreover, if we are unsuccessful in protecting our intellectual property rights in our brand, the value of our brand may be harmed. Any harm to our brand and reputation could adversely affect our ability to attract and engage customers and negatively impact our business, financial condition and results of operations.
If we fail to attract new customers, retain existing customers, or fail to maintain or increase sales to those customers, our business, financial condition, results of operations and growth prospects will be harmed.
Our success depends in large part upon widespread adoption of our products by healthcare professionals. In order to attract new customers and continue to expand our customer base, we must appeal to and attract healthcare professionals who identify with our products. If the number of healthcare professionals who are willing to purchase our products does not continue to increase, if we fail to deliver a high quality shopping experience or if our current or potential future customers are not convinced that our products are superior to alternatives, then our ability to retain existing customers, acquire new customers and grow our business may be harmed. We have made significant investments in enhancing our brand and attracting new customers, and we expect to continue to make significant investments to promote our products, including campaigns that can be expensive and may not always result in new customers or increased sales of our products. These factors, in turn,
17
Table of Contents
may increase our customer acquisition costs over time. Further, as our brand becomes more widely known, we may not attract new customers or increase our net revenues at the same rates as we have in the past. If we are unable to acquire new customers who purchase products in numbers sufficient to grow our business, we may not be able to generate the scale necessary to drive beneficial network effects with our suppliers, our net revenues may decrease, and our business, financial condition and operating results may be materially adversely affected.
In addition, our future success depends in part on our ability to increase sales to our existing customers over time, as a significant portion of our net revenues are generated from sales to existing customers, particularly those existing customers who are highly engaged and make frequent and/or large purchases of the products we offer. If existing customers no longer find our products appealing, are not satisfied with our customer service, including shipping times, or if we are unable to timely update our products to meet current trends and customer demands, our existing customers may not make purchases, or if they do, they may make fewer or smaller purchases in the future.
If we are unable to continue to attract new customers or our existing customers decrease their spending on the products we offer or fail to make repeat purchases of our products, our business, financial condition, results of operations and growth prospects will be harmed.
If our marketing efforts are not successful, our business, financial condition and results of operations could be harmed.
We create differentiated brand marketing content and utilize performance marketing to drive customers from awareness to consideration to conversion, and promoting awareness of our brand and products is important to our ability to grow our business, drive customer engagement and attract new customers. Our marketing strategy includes brand marketing campaigns across platforms, including email, digital, display, site, direct-mail, commercials, social media and Ambassadors, as well as performance marketing efforts, including retargeting, paid search and product listing advertisements, paid social media advertisements, search engine optimization, personalized email and mobile push notifications through our app.
We have historically benefited from social media, customer referrals and word of mouth to advertise our brand. Social networks are important as a source of new customers and as a means by which to connect with existing customers, and such importance may be increasing. In addition, we have implemented grassroots marketing efforts such as engaging with local doctors, nurses and other healthcare professionals, some of whom we refer to as our Ambassadors, to assist us by introducing our brand and culture to their communities. Our social media and grassroots efforts must be tailored to each particular market. This requires substantial efforts as we enter new markets, as well as ongoing attention and resources. We also seek to engage with our customers and build awareness of our brands through sponsoring unique events and experiences. If our marketing efforts and messaging are not appropriately tailored to and accepted by the healthcare community, we may fail to attract customers and our brand and reputation may be harmed. In addition, our marketing initiatives may become increasingly expensive as competition increases, and generating a meaningful return on those initiatives may be difficult. Our future growth and profitability and the success of our brand will depend in part upon the effectiveness and efficiency of these marketing efforts.
We receive a significant amount of visits to our digital platform via social media or other channels used by our existing and prospective customers. As eCommerce and social media continue to rapidly evolve, we must continue to establish relationships with these channels and may be unable to develop or maintain these relationships on acceptable terms. In addition, we currently receive a significant number of visits to our website and mobile app via search engine results. Search engines frequently change the algorithms that determine the ranking and display of results of a user’s search, which could reduce the number of visits to our website, in turn reducing new customer acquisition and adversely affecting our results of operations. If we are unable to cost-effectively drive traffic to our digital platform, our ability to acquire new customers and our financial condition would suffer. Email marketing efforts are also important to our marketing efforts. If we are unable to
18
Table of Contents
successfully deliver emails to our customers or if customers do not engage with our emails, whether out of choice, because those emails are marked as low priority or spam or for other reasons, our business could be adversely affected. Our marketing initiatives may become increasingly expensive and generating a meaningful return on those initiatives may be difficult or unpredictable. Even if we successfully increase net revenues as a result of our marketing efforts, it may not offset the additional marketing expenses we incur.
If our marketing efforts are not successful in promoting awareness of our products, driving customer engagement or attracting new customers, or if we are not able to cost-effectively manage our marketing expenses, our results of operations could be adversely affected.
Our business depends on our ability to maintain a strong community of engaged customers and Ambassadors, including through the use of social media. We may not be able to maintain and enhance our brand if we experience negative publicity related to our marketing efforts or use of social media, fail to maintain and grow our network of Ambassadors or otherwise fail to meet our customers’ expectations.
We partner with Ambassadors to help raise awareness of our brand and engage with our community. Our ability to maintain relationships with our existing Ambassadors and to identify new Ambassadors is critical to expanding and maintaining our customer base. As our market becomes increasingly competitive or as we expand internationally, recruiting and maintaining new Ambassadors may become increasingly difficult. If we are not able to develop and maintain strong relationships with our Ambassador network, our ability to promote and maintain awareness of our brand may be adversely affected. Further, if we incur excessive expenses in this effort, our business, financial condition and results of operations may be adversely affected.
We and our Ambassadors use third-party social media platforms to raise awareness of our brand and engage with our community. As existing social media platforms evolve and new platforms develop, we and our Ambassadors must continue to maintain a presence on these platforms and establish presences on emerging popular social media platforms. If we are unable to cost-effectively use social media platforms as marketing tools, our ability to acquire new customers and our financial condition may suffer. Furthermore, as laws and regulations governing the use of these platforms evolve, any failure by us, our Ambassadors, our sponsors or third parties acting at our direction to abide by applicable laws and regulations in the use of these platforms could subject us to regulatory investigations, class action lawsuits, liability, fines or other penalties and adversely affect our business, financial condition and results of operations. In addition, an increase in the use of social media for product promotion and marketing may cause an increase in the burden on us to monitor compliance of such materials, and increase the risk that such materials could contain problematic product or marketing claims in violation of applicable regulations. For example, in some cases, the Federal Trade Commission has sought enforcement action where an endorsement has failed to clearly and conspicuously disclose a financial relationship or material connection between an influencer and an advertiser.
We also do not prescribe what our Ambassadors post, and our Ambassadors could engage in behavior or use their platforms in a manner that reflects poorly on our brand or is in violation of applicable regulations or platform terms of service, and may be attributed to us. Negative commentary regarding us, our products or Ambassadors and other third parties who are affiliated with us, whether accurate or not, may be posted on social media platforms at any time and may adversely affect our reputation, brand and business. The harm may be immediate, without affording us an opportunity for redress or correction and could have an adverse effect on our business, financial condition and results of operations.
In addition, customer complaints or negative publicity related to our website, mobile app, products, product delivery times, customer data handling, marketing efforts, security practices or customer support, especially on blogs and social media websites, could diminish customer loyalty and community engagement.
19
Table of Contents
If we do not continue to successfully develop and introduce new, innovative and updated products, we may not be able to maintain or increase our sales and profitability.
We are an apparel and lifestyle brand for healthcare professionals. As a result, our success depends in part on our ability to create apparel for healthcare professionals, as well as to anticipate and react to changing customer demands in a timely manner. All of our products are subject to changing customer preferences that cannot be predicted with certainty. If we do not continue to introduce new products or innovations on existing products in a timely manner or our new products or innovations are not accepted by our customers, or if our competitors introduce similar products in a more timely fashion, our brand or our position as a leader in medical apparel could be harmed.
Further, our new products and innovations on existing and future products may not receive the same level of customer acceptance as our products have in the past. Customer preferences could change, especially as we expand our product offerings beyond our core scrubwear, and our future success depends in part on our ability to anticipate and respond to these changes. Our failure to anticipate and respond in a timely manner to changing customer preferences could lead to, among other things, lower sales, excess inventory or inventory shortages, markdowns and write-offs and diminished brand loyalty. Even if we are successful in anticipating customer needs and preferences, our ability to adequately address those needs and preferences will in part depend upon our continued ability to develop and introduce innovative, high quality products and designs and maintain our distinctive brand identity as we expand the range of products we offer. A failure to effectively introduce new products or innovations on existing products that appeal to our customers could result in a decrease in net revenues and excess inventory levels, which could adversely affect our business, financial condition and results of operations.
The market for healthcare apparel is highly competitive.
We compete in the healthcare apparel industry, principally on the basis of product quality, innovation, style, price and brand image, as well as customer experience and service. The industry is highly competitive and includes established companies as well as new entrants. We compete against wholesalers of healthcare apparel, such as Careismatic Brands, Barco Uniforms, Landau Uniforms and Superior Group of Companies. Additionally, we compete with healthcare apparel specialty retailers, such as Scrubs & Beyond and Uniform Advantage as well as digitally native brands such as Jaanuu. In addition, we may face future competition from large, diversified apparel companies with brand recognition and well-established sales, manufacturing and distribution infrastructure that choose to expand into the production and marketing of medical apparel. Some of our competitors have longer operating histories, larger market share and greater resources than we do.
Our competitors may be able to achieve and maintain market share more quickly and effectively than we can. Similarly, if customers perceive the products offered by our competitors to be of higher quality than ours, or our competitors offer similar products at lower prices, our revenues may decline, which would adversely affect our results of operations.
Many of our potential competitors promote their brands primarily through traditional forms of advertising, such as print media, and have substantial resources to devote to such efforts. Our competitors may also use traditional forms of advertising more quickly in new markets than we can. While we believe that our DTC business model offers us competitive advantages, our competitors may also be able to increase sales in their new and existing markets faster than we do by emphasizing different distribution channels than we do, such as wholesale and an extensive franchise network of retail stores, and many of our competitors have substantial resources to devote toward increasing sales in such ways. Competition may result in pricing pressures, reduced profit margins or lost market share or a failure to grow our market share, any of which could substantially harm our business, financial condition and results of operations.
20
Table of Contents
Our future success depends on the continuing efforts of our key employees and our ability to attract and retain highly skilled personnel and senior management.
We are dependent on our ability to continue to identify, attract, develop, integrate and retain qualified and highly skilled personnel, including senior management, designers, product managers, engineers, data scientists and logistics and supply chain personnel. In particular, we are highly dependent on the services of our co-founders and co-Chief Executive Officers, Heather Hasson and Trina Spear, who are critical to the development of our business, future vision and strategic direction. We also heavily rely on the continued service and performance of other members of our senior management team, who provide leadership, contribute to the core areas of our business and help us to efficiently execute our business. If the senior management team, including any new hires that we make, fails to work together effectively and to execute our plans and strategies on a timely basis, our business and future growth prospects could be harmed.
Additionally, the loss of any key personnel could make it more difficult to manage our operations research, development, production and marketing activities, reduce our employee retention and net revenues and impair our ability to compete. Although we have entered into employment offer letters or agreements with certain of our key personnel, these agreements have no specific duration and constitute at-will employment. We have not obtained key man life insurance policies on any of our senior management team. As a result, we would have no way to cover the financial loss if we were to lose the services of members of our senior management team.
Competition for highly skilled personnel is often intense, especially in Southern California, where our headquarters is located. We may not be successful in attracting, integrating or retaining qualified personnel to fulfill our current or future needs. We may experience difficulty in hiring and retaining highly skilled employees with appropriate qualifications. Failure to manage our employee base and hiring needs effectively, including successfully integrating our new hires, or to retain and motivate our current personnel may adversely affect our business, financial condition and results of operations.
If we cannot maintain our culture as we grow, we could lose the innovation, teamwork and passion that we believe contribute to our success and our business may be harmed.
We believe that a critical component of our success has been our corporate culture. We have invested substantial time and resources in building our culture, which is rooted in passion, purpose and innovation. As we continue to grow, including geographically expanding our presence outside of our headquarters in Santa Monica, California, and developing the infrastructure associated with being a public company, we will need to maintain our culture among a larger number of employees, dispersed across various geographic regions. Any failure to preserve our culture could negatively affect our future success, including our ability to retain and recruit personnel and to effectively focus on and pursue our corporate objectives.
We plan to expand into additional international markets, which will expose us to new and significant risks.
Our future growth depends in part on our expansion efforts outside of the United States. Our current operations and customer base are based largely in the United States, with shipping capabilities to Australia, Canada and the United Kingdom. Therefore, we have a limited number of customers and experience operating outside of the United States. We also have limited experience with regulatory environments and market practices outside of the United States and cannot guarantee that we will be able to penetrate or successfully operate in any market outside of the United States. In connection with our expansion efforts outside of North America, we may encounter obstacles we do not face in the United States, including cultural and linguistic differences, differences in regulatory environments and market practices, difficulties in keeping abreast of market, business and technical developments and foreign customers’ tastes and preferences.
We may also encounter difficulty expanding into new markets because of limited brand recognition in those markets, leading to delayed acceptance of our apparel by customers there. In particular, we have no assurance that our marketing efforts will prove successful outside of the narrow geographic regions in which they have
21
Table of Contents
been used in the United States. The expansion into new markets may also present competitive, merchandising, forecasting and distribution challenges that are different from or more severe than those we currently face. There are also other risks and costs inherent in doing business in international markets, including:
| • | the need to adapt and localize products for specific countries to account for, among other things, different cultural tastes, size and fit preferences or regulatory requirements; |
| • | difficulty establishing and managing international operations and the increased operations, travel, infrastructure, including establishment of local delivery service and customer service operations, and legal compliance costs associated with locations in different countries or regions; |
| • | increased shipping times to and from international markets; |
| • | the need to vary pricing and margins to effectively compete in international markets; |
| • | increased competition from local providers of similar products; |
| • | the ability to protect and enforce intellectual property rights abroad; |
| • | the need to offer customer support in various languages; |
| • | difficulties in understanding and complying with local laws, regulations and customs in other jurisdictions; |
| • | compliance with anti-bribery laws, such as the U.S. Foreign Corrupt Practices Act, or FCPA, and the U.K. Bribery Act 2010, or U.K. Bribery Act, by us, our employees and our business partners; |
| • | complexity and other risks associated with current and future legal requirements in other countries, including legal requirements related to medical apparel, customer advertising protection, customer product safety and data privacy frameworks, such as the EU General Data Protection Regulation 2016/679, or GDPR; |
| • | varying business practices and customs related to the sale of medical apparel; |
| • | varying levels of internet technology adoption and infrastructure, and increased or varying network and hosting service provider costs; |
| • | tariffs and other non-tariff barriers, such as quotas and local content rules, as well as tax consequences; |
| • | fluctuations in currency exchange rates and the requirements of currency control regulations, which might restrict or prohibit conversion of other currencies into U.S. dollars; and |
| • | political or social unrest or economic instability in a specific country or region in which we operate, including, for example, the effects of “Brexit,” which could have an adverse impact on our operations in that location. |
Our failure to successfully manage these risks could harm our international operations and have an adverse effect on our business, financial condition and results of operations.
Shipping is a critical part of our business and any changes in, or disruptions to, our shipping arrangements could adversely affect our business, financial condition and results of operations.
We currently rely on third-party global providers to deliver the products we offer on our website and mobile app. If we are not able to negotiate acceptable pricing and other terms with these providers, or if these providers experience performance problems or other difficulties in processing our orders or delivering our products to customers, it could negatively impact our results of operations and our customers’ experience. For example, changes to the terms of our shipping arrangements or the imposition of surcharges or surge pricing may adversely impact our margins and profitability. In addition, our ability to receive inbound inventory efficiently and ship merchandise to customers may be negatively affected by factors beyond our and these providers’ control, including pandemic, weather, fire, flood, power loss, earthquakes, acts of war or terrorism or other
22
Table of Contents
events specifically impacting other shipping partners, such as labor disputes, financial difficulties, system failures and other disruptions to the operations of the shipping companies on which we rely. We have in the past experienced, and may in the future experience, shipping delays for reasons outside of our control. We are also subject to risks of damage or loss during delivery by our shipping vendors. If the products ordered by our customers are not delivered in a timely fashion, including to international customers, or are damaged or lost during the delivery process, our customers could become dissatisfied and cease buying products from us, which would adversely affect our business, financial condition and results of operations.
If we experience problems with our distribution and warehouse management system, our ability to meet customer expectations, manage inventory, complete sales and achieve objectives for operating efficiencies could be harmed.
We rely on our sole fulfillment center in the City of Industry, California, which is operated by our third-party logistics provider, for all of our product distribution. Our fulfillment center includes computer-controlled and automated equipment and relies on a warehouse management system to manage supply chain fulfillment operations, which means its operations are complicated and may be subject to a number of risks related to cybersecurity, the proper operation of software and hardware, electronic or power interruptions or other system failures. In addition, because all of our products are distributed from our City of Industry fulfillment center, our operations could also be interrupted by labor difficulties, or by floods, fires or other natural disasters near our fulfillment center. We maintain business interruption insurance, but it may not adequately protect us from the adverse effects that could result from significant disruptions to our distribution system, such as the long-term loss of customers or an erosion of our brand image. Moreover, if we or our third-party logistics provider are unable to adequately staff our fulfillment center to meet demand or if the cost of such staffing is higher than historical or projected costs due to mandated wage increases, regulatory changes, hazard pay, international expansion or other factors, our results of operations could be harmed. In addition, operating a fulfillment center comes with potential risks, such as workplace safety issues and employment claims for the failure or alleged failure to comply with labor laws or laws respecting union organizing activities. Our distribution capacity is also dependent on the timely performance of services by third parties, including the shipping of our products to and from our City of Industry distribution facility. We may need to operate additional fulfillment centers in the future to keep pace with the growth of our business, and we cannot assure you that we will be able to locate suitable facilities on commercially acceptable terms in accordance with our expansion plans, nor can we assure you that we will be able to recruit qualified managerial and operational personnel to support our expansion plans. If we encounter problems with our distribution and warehouse management systems, our ability to meet customer expectations, manage inventory and fulfillment capacity, complete sales, fulfill orders in a timely manner and achieve objectives for operating efficiencies could be harmed, which could also harm our reputation and our relationship with our customers.
If we are unable to accurately forecast customer demand, manage our inventory and plan for future expenses, our results of operations could be adversely affected.
We base our current and future inventory needs and expense levels on our operating forecasts and estimates of future demand. To ensure adequate inventory supply, we must be able to forecast inventory needs and expenses and place orders sufficiently in advance with our suppliers and manufacturers, based on our estimates of future demand for particular products. Failure to accurately forecast demand may result in inefficient inventory supply or increased costs. This risk may be exacerbated by the fact that we may not carry a significant amount of inventory and may not be able to satisfy short-term demand increases. Accordingly, if we fail to accurately forecast customer demand, we may experience excess inventory levels or a shortage of products available for sale. Inventory levels in excess of customer demand may result in inventory write-downs or write-offs and the sale of excess inventory at discounted prices, which would cause our gross margins to suffer and could impair the strength and premium nature of our brand. Further, lower than forecasted demand could also result in excess manufacturing capacity or reduced manufacturing efficiencies, which could result in lower margins. Conversely, if we underestimate customer demand, our suppliers and manufacturers may not be able to
23
Table of Contents
deliver products to meet our requirements, and we may be subject to higher costs in order to secure the necessary production capacity or we may incur increased shipping costs. An inability to meet customer demand and delays in the delivery of our products to our customers could result in reputational harm and damaged customer relationships and have an adverse effect on our business, financial condition and results of operations.
Moreover, while we devote significant attention to forecasting efforts, the volume, timing, value and type of the orders we receive are inherently uncertain. In addition, we cannot be sure the same growth rates, trends and other key performance metrics are meaningful predictors of future growth. Our business, as well as our ability to forecast demand, is also affected by general economic and business conditions in the United States and the degree of customer confidence in future economic conditions, and we anticipate that our ability to forecast demand due to these types of factors will be increasingly affected by conditions in international markets. A significant portion of our expenses is fixed, and as a result, we may be unable to adjust our spending in a timely manner to compensate for any unexpected shortfall in net revenues. Any failure to accurately predict net revenues or gross margins could cause our operating results to be lower than expected, which could adversely affect our financial condition.
Merchandise returns could harm our business.
We allow our customers to return our products, subject to our return policy. We generally accept merchandise returns for full refund if returned within 30 days of the original purchase date and for exchange up to 30 days from the original purchase date. Our revenue is reported net of returns and discounts. We estimate our liability for product returns based on historical return trends and an evaluation of current economic and market conditions. We record the expected customer refund liability as a reduction to revenue, and the expected inventory right of recovery as a reduction of cost of goods sold. The introduction of new products, changes in customer confidence or shopping habits or other competitive and general economic conditions could cause actual returns to exceed our estimates. If actual return costs differ from previous estimates, the amount of the liability and corresponding revenue are adjusted in the period in which such costs occur. In addition, from time to time, our products may be damaged in transit, which can also increase return rates. Returned goods may also be damaged in transit as part of the return process which can impede our ability to resell returned goods. Competitive pressures could cause us to alter our return policies or our shipping policies, which could result in an increase in damaged products and an increase in product returns. If the rate of product returns increases significantly or if product return economics become less efficient, our business, financial condition and results of operations could be harmed.
The fluctuating cost of raw materials could increase our cost of goods sold and cause our business, financial condition and results of operations to suffer.
We have in the past experienced, and may in the future experience, fluctuations in the cost of raw materials used in our products for reasons beyond our control. For example, our core scrubs fabric includes synthetic fabric, the components of which may experience price fluctuations. Our costs for raw materials are affected by, among other things, weather, customer demand, speculation on the commodities market, the relative valuations and fluctuations of the currencies of producer versus customer countries and other factors that are generally unpredictable and beyond our control. Increases in the cost of raw materials could adversely affect our cost of goods sold, business, financial condition and results of operations.
Our business may be subject to uncertainty as a result of the COVID-19 pandemic.
The COVID-19 pandemic has magnified the indispensability of healthcare professionals and the demand for scrubs and other medical apparel. We experienced increased demand in 2020 and in the six months ended June 30, 2021, while certain of our ocean freight providers, as well as some of our suppliers and manufacturers, particularly those operating in Vietnam, are experiencing delays, in the past have experienced delays and shut-downs, and could experience delays and shut-downs again in the future due to the COVID-19 pandemic. In order
24
Table of Contents
to manage the impact of these disruptions and meet our customers’ expectations, we have from time to time used faster but more expensive air freight, which has in the past increased our cost of goods sold, and we may from time to time need to continue to use more expensive air freight in the future. The COVID-19 pandemic may continue to adversely affect workforces, economies and financial markets globally, potentially leading to an economic downturn and a reduction in consumer spending or an inability for our suppliers, vendors or other parties with whom we do business to meet their contractual obligations, which could negatively impact our business and results of operations. We believe the COVID-19 pandemic has accelerated the awareness of the FIGS brand and a shift in purchasing decisions that will continue to drive future growth; however, there can be no assurance that these trends will continue, and the ultimate impact of the COVID-19 pandemic on our business remains uncertain.
Our reliance on a limited number of third-party suppliers to provide materials for and produce our products could cause problems in our supply chain and subject us to additional risks.
We rely on third-party suppliers to manufacture our raw materials and products. Our products are manufactured by third parties and may be available, in the short-term, from a limited number of sources. We choose not to enter into long-term contracts with any of our suppliers or manufacturers for the production and supply of our raw materials and products, and typically transact business with our suppliers on an order-by-order basis. We also compete with other companies for raw materials and production.
We currently source the vast majority of the fabrics used in our products from two third-party suppliers in China, and we source the other raw materials used in our products, including items such as content labels, elastics, buttons, clasps and drawcords, from suppliers located predominantly in the Asia Pacific region. We also work with a limited number of manufacturing partners that produce our products in facilities located in South East Asia, China and South America, with the vast majority of our products currently being produced by our two largest manufacturing suppliers in South East Asia. We are continuously working to diversify our sourcing and manufacturing capabilities.
We may experience a disruption in the supply of fabrics or raw materials from current sources, and we may be unable to locate alternative materials suppliers of comparable quality at an acceptable price, or at all. In addition, if we experience significantly increased demand, or if we need to replace an existing supplier or manufacturer, we may be unable to locate additional supplies of fabrics or raw materials or additional manufacturing capacity on terms that are acceptable to us, or at all, or we may be unable to locate any supplier or manufacturer with sufficient capacity to meet our requirements or to fill our orders in a timely manner. Identifying a suitable supplier is an involved process that requires us to become satisfied with its quality control, responsiveness and service, financial stability and labor and other ethical practices. Even if we are able to expand existing or find new manufacturing or fabric sources, we may encounter delays in production and added costs as a result of the time it takes to train our suppliers and manufacturers in our methods, products, and quality control standards. Our supply of fabric or the manufacture of our products could be disrupted or delayed by the impact of global health pandemics, including the current COVID-19 pandemic, and the related government and private sector responsive actions, such as border closures, restrictions on product shipments and travel restrictions. For example, as a result of the COVID-19 pandemic, certain of our ocean freight providers, as well as some of our suppliers and manufacturers, particularly those operating in Vietnam, are experiencing delays, in the past have experienced delays and shutdowns, and could experience delays and shutdowns again in the future. In order to manage the impact of these disruptions and meet our customers’ expectations, we have from time to time used faster but more expensive air freight, which has in the past increased our cost of goods sold, and we may from time to time need to continue to use more expensive air freight in the future. Any delays, interruption or increased costs in the supply of fabric or the manufacture of our products could have an adverse effect on our ability to meet customer demand for our products and result in lower net revenues, increased cost of goods sold and lower income from operations, both in the short and long term.
25
Table of Contents
Moreover, we have occasionally received, and may in the future receive, shipments of products that fail to comply with our technical specifications or that fail to conform to our quality control standards. Under these circumstances, unless we are able to obtain replacement products in a timely manner, we risk the loss of net revenues resulting from the inability to sell those products and related increased administrative and shipping costs. Additionally, if the unacceptability of our products is not discovered until after such products are purchased by our customers, our customers could lose confidence in our products, and our business and brand could be harmed.
The operations of many of our suppliers are subject to additional risks that are beyond our control and that could harm our business, financial condition and results of operations.
Substantially all of our suppliers are located outside of the United States, and as a result, we are subject to risks associated with doing business abroad, including:
| • | the imposition of new laws and regulations, including those relating to labor conditions, quality and safety standards, imports, duties, taxes and other charges on imports, as well as trade restrictions and restrictions on currency exchange or the transfer of funds; |
| • | political unrest, terrorism, labor disputes and economic instability resulting in the disruption of trade from foreign countries in which our products are manufactured; |
| • | reduced protection for intellectual property rights, including trademark protection, in some countries, particularly in China; |
| • | disruptions or delays in shipments whether due to port congestion, labor disputes, product regulations and/or inspections or other factors, natural disasters or health pandemics, or other transportation disruptions; and |
| • | the impact of health conditions, including the ongoing COVID-19 pandemic, and related government and private sector responsive actions, and other changes in local economic conditions in countries where our manufacturers, suppliers or customers are located. |
These and other factors beyond our control could interrupt our suppliers’ production in offshore facilities, influence the ability of our suppliers to export our products cost-effectively or at all and inhibit our suppliers’ ability to procure certain materials, any of which could harm our business, financial condition and results of operations.
Any failure by us or our manufacturers or suppliers to comply with product safety, labor or other laws, provide safe conditions for our or their workers or use or be transparent about ethical business practices may damage our reputation and brand and harm our business.
We are committed to supporting our communities around the globe. Operating with compassion and integrity is core to our values, which makes our reputation sensitive to allegations of unethical or improper business practices, whether real or perceived. The failure of any of our suppliers or manufacturers to provide safe and humane factory conditions and oversight at their facilities could damage our reputation and brand or result in legal claims against us. We rely on our manufacturers’ and suppliers’ compliance reporting in order to comply with regulations applicable to our products. This is further complicated by the fact that expectations of ethical business practices continually evolve and may be substantially more demanding than applicable legal requirements.
We do not control our suppliers and manufacturers or their business, and they may not comply with our guidelines or applicable law. The products we sell are subject to regulation by the Federal Customer Product Safety Commission, the Federal Trade Commission and similar state and international regulatory authorities. Product safety, labeling and licensing concerns may require us to voluntarily remove selected merchandise from our inventory. Such recalls or voluntary removal of merchandise can result in, among other things, lost sales, diverted resources, potential harm to our reputation and increased customer service costs and legal expenses,
26
Table of Contents
which could adversely affect our results of operations. Moreover, failure of our suppliers or manufacturers to comply with applicable laws and regulations and contractual requirements could lead to litigation against us or cause us to seek other vendors, which could increase our costs and result in delayed delivery of our products, product shortages or other disruptions of our operations.
Ethical business practices are also driven in part by legal developments and by groups active in publicizing and organizing public responses to perceived ethical shortcomings. In addition to evaluating the substance of companies’ practices, such groups also often scrutinize companies’ transparency as to such practices and the policies and procedures they use to ensure compliance by their suppliers and other business partners. If we do not meet the transparency standards expected by parties active in promoting ethical business practices, we may attract negative publicity, regardless of whether the actual labor and other business practices adhered to by us and our independent manufacturers are consistent with ethical business practices. Such negative publicity could harm our brand image, business, financial condition and results of operations.
We conduct business with suppliers and manufacturers based in China, which exposes us to risks inherent in doing business there.
We source raw material for our core scrubwear from, and conduct limited manufacturing in, the People’s Republic of China. With the rapid development of the Chinese economy, the cost of labor has increased and may continue to increase. Our results of operations will be adversely affected if the labor costs of our third-party suppliers and manufacturers increase significantly. In addition, our manufacturers and suppliers may be unable to find a sufficient number of qualified workers due to the competitive market for skilled labor in China.
Conducting business in China exposes us to political, legal and economic risks. In particular, the political, legal and economic climate in China is fluid and unpredictable. Our ability to operate in China may be adversely affected by changes in U.S. and Chinese laws and regulations, including those related to taxation, import and export tariffs, environmental regulations, land use rights, intellectual property, currency controls, network security, employee benefits, hygiene supervision and other matters. In addition, Chinese trade regulations are continuously evolving, and we may become subject to other forms of taxation, tariffs and duties. Furthermore, the third parties we rely on in China may disclose our confidential information or intellectual property to competitors or third parties, which could result in the illegal sale of counterfeit versions of our products. If any of these events occur, our business, financial condition and results of operations could be adversely affected.
Increases in labor costs, including wages, could adversely affect our business, financial condition and results of operations.
Labor is a significant portion of our cost structure and is subject to many external factors, including unemployment levels, prevailing wage rates, minimum wage laws, potential collective bargaining arrangements, health insurance costs and other insurance costs and changes in employment and labor legislation or other workplace regulation. From time to time, legislative proposals are made to increase the federal minimum wage in the United States, as well as the minimum wage in California and a number of other states and municipalities, and to reform entitlement programs, such as health insurance and paid leave programs. As minimum wage rates increase or related laws and regulations change, we may need to increase not only the wage rates of our minimum wage employees, but also the wages paid to our other hourly or salaried employees. None of our domestic employees is currently covered by a collective bargaining agreement, but any attempt by our employees to organize a labor union could result in increased legal and other associated costs. Any increase in the cost of our labor could have an adverse effect on our business, financial condition and results of operations or if we fail to pay such higher wages we could suffer increased employee turnover. Increases in labor costs could force us to increase prices, which could adversely impact our sales. If competitive pressures or other factors prevent us from offsetting increased labor costs by increases in prices, our profitability may decline and could adversely affect our business, financial condition and results of operations. In particular, the job market in Southern California, where our principal offices and fulfillment center as well as the majority of our employees are located, is very competitive.
27
Table of Contents
In addition, a significant portion of our products are produced in Asia, with some of our products produced in China. Increases in the costs of labor and other costs of doing business in these regions could increase our costs to produce our products and could have a negative impact on our operations and earnings. Factors that could negatively affect our business include a potential significant revaluation of the currencies used in these countries, which may result in an increase in the cost of producing products, labor shortage and increases in labor costs, and difficulties and additional costs in transporting products manufactured from these countries. Also, the imposition of trade sanctions or other regulations against products imported by us from, or the loss of “normal trade relations” status with, any country in which our products are manufactured, could significantly increase our cost of products and harm our business.
Our sales and profitability may decline if product costs increase or selling prices decrease.
Our business is subject to pressure on costs and pricing caused by many factors, including competition, constrained sourcing capacity and related inflationary pressure, pressure from customers to reduce the prices we charge for our products and changes in customer demand. These factors may cause us to experience increased costs while also causing us to reduce prices. If we were to increase prices in response to increased costs, we may experience reduced sales. Any of the forgoing could cause our operating margin to decline if we are unable to offset these factors with reductions in operating costs and could adversely affect our business, financial condition and results of operations.
If we do not successfully optimize, operate and manage the expansion of the capacity of our fulfillment center, our business, financial condition and results of operations could be harmed.
We anticipate the need to add additional fulfillment center capacity and lease new warehouse space to serve as fulfillment centers as our business continues to grow. If we continue to add fulfillment and warehouse capabilities, add products categories with different fulfillment requirements or change the mix in products that we sell, our fulfillment network will become increasingly complex and operating it will become more challenging. The expansion of our fulfillment center capacity may put pressure on our managerial, financial, operational and other resources. We cannot assure you that we will be able to locate suitable facilities on commercially acceptable terms in accordance with our expansion plans, nor can we assure you that we will be able to recruit qualified managerial and operational personnel to support our expansion plans. In addition, we may be required to expand our capacity sooner than we anticipate. If we are unable to secure new facilities for the expansion of our fulfillment operations, recruit qualified personnel to support any such facilities or effectively control expansion-related expenses, our order fulfillment and shipping times may be delayed and our business, financial condition and results of operations could be adversely affected.
Our credit agreement contains restrictive covenants that may limit our operating flexibility.
Although we have not drawn on our existing line of credit, our existing credit agreement contains restrictive covenants that, among other things, limit our ability to transfer or dispose of assets, merge with other companies or consummate certain changes of control, acquire other companies, incur additional indebtedness and liens and enter into new businesses. We therefore may not be able to engage in any of the foregoing transactions unless we obtain the consent of the lender or terminate the credit agreement, which may limit our operating flexibility. In addition, our credit agreement is secured by all of our assets and requires us to satisfy certain financial covenants. There is no guarantee that we will be able to generate sufficient cash flow or sales to meet these financial covenants or pay the principal and interest when due under our credit facility. Furthermore, there is no guarantee that future working capital, borrowings or equity financing will be available to repay or refinance any such debt. Any inability to comply with the terms of our credit agreement, including failing to make scheduled payments or to meet the financial covenants, would adversely affect our business. See the section titled “Management’s Discussion and Analysis of Financial Condition and Results of Operations—Liquidity and Capital Resources” for additional information regarding the terms of our existing credit agreement.
28
Table of Contents
A downturn in the economy may adversely affect our business.
We believe that due to the non-discretionary nature of healthcare apparel, our business is largely resistant to recessionary pressures. However, due to our limited operating history, we have not experienced a sustained recessionary period and can therefore not predict the effect on our sales and profitability of a downturn in the economy. It is possible that a downturn in the economy in markets in which we sell our products may harm our business, financial condition and results of operations.
We may seek to grow our business through acquisitions of, or investments in, new or complementary businesses, facilities, technologies or products, or through strategic alliances, and the failure to manage these acquisitions, investments or alliances, or to integrate them with our existing business, could adversely affect us.
From time to time, we may consider opportunities to acquire or make investments in new or complementary businesses, facilities, technologies, offerings or products, or enter into strategic alliances, that may enhance or augment our capabilities, expand our outsourcing and supplier network, complement our current products or services or expand the breadth of our markets. Acquisitions, investments and other strategic alliances involve numerous risks, including:
| • | problems integrating the acquired business, facilities, technologies or products, including issues maintaining uniform standards, procedures, controls, policies and culture; |
| • | unanticipated costs associated with acquisitions, investments or strategic alliances; |
| • | diversion of management’s attention from our existing business; |
| • | adverse effects on existing business relationships with suppliers, outsourced manufacturing partners and other third parties; |
| • | risks associated with entering new markets in which we may have limited or no experience; |
| • | potential loss of key employees of acquired businesses; and |
| • | increased legal and accounting compliance costs. |
We may be unable to identify acquisitions or strategic relationships we deem suitable. Even if we do, we may be unable to successfully complete any such transactions on favorable terms or at all, or to successfully integrate any acquired business, facilities, technologies or products into our business or retain any key personnel, suppliers or customers. These efforts could be expensive and time-consuming and may disrupt our ongoing business and prevent management from focusing on our operations. If we are unable to identify suitable acquisitions or strategic relationships, or if we are unable to integrate any acquired businesses, facilities, technologies and products effectively, our business, financial condition and results of operations could be adversely affected.
Certain of our key operating metrics are subject to inherent challenges in measurement, and any real or perceived inaccuracies in our metrics or the underlying data may cause a loss of investor confidence in such metrics and the market price of our Class A common stock may decline.
We track certain key operating metrics using internal data analytics tools, which have certain limitations. In addition, we rely on data received from third parties, including third-party platforms, to track certain performance indicators, and we may be limited in our ability to verify such data. In addition, our methodologies for tracking metrics may change over time, which could result in changes to the metrics we report. If we undercount or overcount performance due to the internal data analytics tools we use or issues with the data received from third parties, or if our internal data analytics tools contain algorithmic or other technical errors, the data we report may not be accurate or comparable with prior periods. In addition, limitations, changes or errors with respect to how we measure data may affect our understanding of certain details of our business, which could affect our longer-term strategies. If our performance metrics are not, or are not perceived to be, accurate representations of our business, if we discover material inaccuracies in our metrics or the data on which such metrics are based, or if we
29
Table of Contents
can no longer calculate any of our key performance metrics with a sufficient degree of accuracy, investors could lose confidence in the accuracy and completeness of such metrics, which could cause the price of our Class A common stock to decline.
We may incur losses from fraud.
We have occasionally in the past incurred and may in the future incur losses from various types of fraud, including stolen credit card numbers, claims that a customer did not authorize a purchase and merchant fraud. As a general matter, we are liable for fraudulent credit card transactions. Although we have measures in place to detect and reduce the occurrence of fraudulent activity on our digital platform, those measures may not always be effective. In addition to the direct costs of such losses, if the fraud is related to credit card transactions and becomes excessive, it could potentially result in us paying higher fees or affecting our ability to accept credit cards for payment. Our failure to adequately prevent fraudulent transactions could damage our reputation, result in litigation or regulatory action and lead to expenses that could substantially impact our operating results.
Additionally, we have occasionally in the past been, and may in the future be, subject to fraudulent purchases by individuals purchasing our products in bulk with the intention of unlawfully reselling such products at a premium. While we have procedures in place to detect and prevent such practices, our failure to identify those activities may adversely affect our brand and reputation.
Our business is affected by seasonality.
Unlike the traditional apparel industry, the healthcare apparel industry is generally not seasonal in nature. However, due to our continued strong sequential growth as well as our decision to conduct select promotions during the holiday season, we historically have generated a higher proportion of net revenues, and incurred higher selling and marketing expenses, during the fourth quarter of the year compared to other quarters, and we expect these trends to continue.
Risks Related to Information Technology, Intellectual Property and Data Security and Privacy
System interruptions that impair customer access to our website or other performance failures in our technology infrastructure could damage our business, reputation and brand and substantially harm our business, financial condition and results of operations.
We rely on information technology networks and systems and our website to market and sell our products and to manage a variety of business processes and activities and to comply with regulatory, legal and tax requirements. We depend on our information technology infrastructure for digital marketing activities and for electronic communications among our personnel, customers, manufacturers and suppliers around the world. Our website, portions of which are run through Shopify, and information technology systems, some of which are managed by third parties, may be susceptible to damage, disruptions or shutdowns due to failures during the process of upgrading or replacing software, databases or components, power outages, hardware failures, computer viruses, attacks by computer hackers, telecommunication failures, user errors or catastrophic events. Our website serves as an effective extension of our marketing strategies by exposing potential new customers to our brand, product offerings and enhanced content. Due to the importance of our website and internet-related operations, we are vulnerable to website downtime and other technical failures, which may be outside of our control. Further, any slow down or material disruption of our systems, or the systems of our third-party service providers, or our website could disrupt our ability to track, record and analyze the products that we sell and could negatively impact our operations, shipment of goods, ability to process financial information and transactions, and our ability to receive and process customer orders or engage in normal business activities. Our third-party technology providers may also change their policies, terms or offerings from time to time, may fail to introduce new features and offerings that meet our needs as we expand, or may cease to provide services to us on favorable terms, or at all, which could require us to adjust how we use our information technology systems, including our website, or switch to alternative third-party service providers which could be costly, cause interruptions and could ultimately adversely affect our business, financial condition, results of operations and growth prospects.
30
Table of Contents
If our website or information technology systems, including those run by or those of our third-party providers, suffer damage, disruption or shutdown and we or our third-party providers do not effectively resolve the issues in a timely manner, our business, financial condition and results of operations may be adversely affected, and we could experience delays in reporting our financial results.
If our computer and communications hardware fail, or if we suffer an interruption or degradation of services, we could lose customer data and miss order fulfillment deadlines, which could harm our business. Our systems and operations are vulnerable to damage or interruption from fire, flood, power loss, telecommunications failure, terrorist attacks, cyberattacks, data loss, acts of war, break-ins, earthquake and similar events. Any failure or interruption of our website, mobile app, internal business applications or our technology infrastructure could harm our ability to serve our clients, which could adversely affect our business, financial condition and results of operations.
We use complex custom-built proprietary software in our technology infrastructure. Our proprietary software may contain undetected errors or vulnerabilities, some of which may only be discovered after the software has been implemented in our production environment or released to end users. In addition, we seek to continually update and improve our software, and we may not always be successful in executing these upgrades and improvements, and the operation of our systems may be subject to failure. We may experience slowdowns or interruptions in our website when we are updating it. For example, in the past we have experienced minor slowdowns while updating our website. Moreover, new technologies or infrastructures may not be fully integrated with existing systems on a timely basis, or at all. Any errors or vulnerabilities discovered in our software after commercial implementation or release could result in damage to our reputation, loss of customers, disruption to our eCommerce channels, loss of revenue or liability for damages, any of which could adversely affect our growth prospects and our business.
Additionally, if we expand our use of third-party services, including cloud-based services, our technology infrastructure may be subject to increased risk of slowdown or interruption as a result of integration with such services and/or failures by such third parties, which are out of our control. Our net revenues depend on the number of visitors who shop on our website and the volume of orders we can handle. Unavailability of our website or mobile app or reduced order fulfillment performance would reduce the volume of goods sold and could also adversely affect customer perception of our brand. We may experience periodic system interruptions from time to time. In addition, continued growth in our transaction volume, as well as surges in online traffic and orders associated with promotional activities or seasonal trends in our business, place additional demands on our technology platform and could cause or exacerbate slowdowns or interruptions. If there is a substantial increase in the volume of traffic on our website or the number of orders placed by customers, we will be required to further expand, scale and upgrade our technology, transaction processing systems and network infrastructure. There can be no assurance that we will be able to accurately project the rate or timing of increases, if any, in the use of our website or mobile app or expand, scale and upgrade our technology, systems and infrastructure to accommodate such increases on a timely basis. In order to remain competitive, we must continue to enhance and improve the responsiveness, functionality and features of our website, which is particularly challenging given the rapid rate at which new technologies, customer preferences and expectations and industry standards and practices are evolving in the eCommerce industry. Our or our third-party vendors’ inability to continue to update, improve and scale our website or mobile app and the underlying technology infrastructure could harm our reputation and our ability to acquire, retain and serve our customers, which could adversely affect our business, financial condition and results of operations.
Further, we endeavor to continually upgrade existing technologies and business applications, and we may be required to implement new technologies or business applications in the future. The implementation of upgrades and changes requires significant investments. Our results of operations may be affected by the timing, effectiveness and costs associated with the successful implementation of any upgrades or changes to our systems and infrastructure. In the event that it is more difficult for our customers to buy products from us on their mobile devices, or if our customers choose not to buy products from us on their mobile devices or to use mobile products that do not offer access to our websites, our customer growth could be harmed and our business, financial condition and results of operations may be adversely affected.
31
Table of Contents
We must continue to expand and scale our information technology systems, and our failure to do so could adversely affect our business, financial condition and results of operations.
We will need to continue to expand and scale our information technology systems and personnel to support recent and expected future growth. As such, we will continue to invest in and implement modifications and upgrades to our information technology systems and procedures, including replacing legacy systems with successor systems, making changes to legacy systems or acquiring new systems with new functionality, hiring employees with information technology expertise and building new policies, procedures, training programs and monitoring tools. These types of activities subject us to inherent costs and risks associated with replacing and changing these systems, including impairment of our ability to fulfill customer orders, potential disruption of our internal control structure, capital expenditures, additional administration and operating expenses, acquisition and retention of sufficiently skilled personnel to implement and operate the new systems, demands on management time, the introduction of errors or vulnerabilities and other risks and costs of delays or difficulties in transitioning to or integrating new systems into our current systems. These implementations, modifications and upgrades may not result in productivity improvements at a level that outweighs the costs of implementation, or at all. Additionally, difficulties with implementing new technology systems, delays in our timeline for planned improvements, significant system failures or our inability to successfully modify our information systems to respond to changes in our business needs may cause disruptions in our business operations and adversely affect our business, financial condition and results of operations.
Some of our software and systems contain open source software, which may pose particular risks to our proprietary applications.
We use software licensed to us by third-party developers under “open source” licenses in connection with the development or deployment of our proprietary software and expect to continue to use open source software in the future. Some open source licenses contain express requirements, which may be triggered under certain circumstances, that licensees make available source code for modifications or derivative works created or prohibit such modifications or derivative works from being licensed for a fee. Although we monitor our use of open source software to avoid subjecting our platform to such requirements, the terms of many open source licenses have not been interpreted by U.S. or foreign courts, and there is a risk that these licenses could be construed in a way that could impose unanticipated conditions or restrictions on our ability to develop or use our proprietary software. We may face claims from third parties demanding the release or license of the open source software or derivative works that we developed from such software (which could include our proprietary source code) or otherwise seeking to enforce the terms of applicable open source licenses. These claims could result in litigation and could require us to publicly release portions of our proprietary source code or cease distributing or otherwise using the implicated solutions unless and until we can re-engineer them.
In addition, our use of open source software may present greater risks than use of other third-party commercial software, as open source licensors generally do not provide support, warranties, indemnification or other contractual protections regarding infringement claims or the quality of the code. To the extent that our platform depends upon the successful operation of open source software, any undetected errors or defects in open source software that we use could prevent the deployment or impair the functionality of our systems and injure our reputation. In addition, the public availability of such software may make it easier for others to compromise our platform. Any of these risks could be difficult to eliminate or manage and, if not addressed, could have an adverse effect on our business, financial condition and results of operations.
Our business may be adversely affected if we are unable to provide our customers a cost-effective shopping platform that is able to respond and adapt to rapid changes in technology.
The number of people who access the internet through devices other than personal computers, including smartphones and portable computers, such as laptops and tablets, has increased dramatically in the past few years. The smaller screen size, functionality and memory associated with some alternative devices may make the
32
Table of Contents
use of our website and purchasing our products more difficult. The versions of our website and our mobile app developed for such alternative devices may not be compelling to customers. In addition, it is time consuming and costly to keep pace with rapidly changing and continuously evolving technology.
As existing mobile devices and platforms evolve and new mobile devices and platforms are released, it is difficult to predict the problems we may encounter in adjusting and developing applications for changed and alternative devices and platforms, and we may need to devote significant resources to the redevelopment, support and maintenance of our website and mobile app. The timing, effectiveness and costs associated with the successful implementation of any upgrades or changes to our systems and infrastructure serving website or mobile device users may affect our results of operations. If we are unable to attract customers to our websites through these devices or are slow to develop versions of our website or mobile app that are more compatible with alternative devices, or if our customers choose not to buy products from us on their mobile devices or use mobile products that do not offer access to our websites, we may fail to capture a significant share of customers in the medical apparel market, which could adversely affect our business. In addition, in the event that it is more difficult for our customers to buy products from us on their mobile devices, or if our customers choose not to buy products from us on their mobile devices or to use mobile products that do not offer access to our websites, our customer growth could be harmed and our business, financial condition and results of operations may be adversely affected.
Our customer engagement on mobile devices depends upon effective operation with mobile operating systems, networks, and standards that we do not control.
An increasing number of our customers purchase our products through our mobile app. We are dependent on the interoperability of our website and mobile app with popular mobile operating systems that we do not control, such as Android and iOS, and any changes in such systems that degrade the functionality of our digital offering could adversely affect the user experience of our website and mobile app on mobile devices. Additionally, in order to deliver a consistent shopping experience to mobile devices, it is important that our mobile app is designed effectively and works well with a range of mobile technologies, systems, networks, and standards that we do not control. We may not be successful in developing relationships with key participants in the mobile industry or in developing products that operate effectively with these technologies, systems, networks, or standards. In the event that it is more difficult for our customers to access and use our mobile app on their mobile devices or if our customers choose not to access or use our mobile app on their mobile devices or use mobile products that do not offer access to our platform, our sales and growth prospects could be adversely impacted.
If sensitive information about our customers is disclosed, or if we or our third-party providers are subject to real or perceived cyberattacks, our customers may curtail use of our website or mobile app, we may be exposed to liability and our reputation could suffer.
Operating our business and platform involves the collection, storage and transmission of proprietary and confidential information, as well as the personal information of our employees and customers. Some of our third-party service providers, such as identity verification and payment processing providers, also regularly have access to customer data. In an effort to protect sensitive information, we rely on a variety of security measures, including encryption and authentication technology licensed from third parties. However, advances in computer capabilities, increasingly sophisticated tools and methods used by hackers and cyber terrorists, new discoveries in the field of cryptography or other developments may result in our failure or inability to adequately protect sensitive information.
Like other eCommerce companies, we are also vulnerable to hacking, malware, computer viruses, unauthorized access, phishing or social engineering attacks, ransomware attacks, credential stuffing attacks, denial-of-service attacks, exploitation of software vulnerabilities and other real or perceived cyberattacks. Additionally, as a result of the ongoing COVID-19 pandemic, certain functional areas of our workforce remain in a remote work environment, which has heightened the risk of these potential vulnerabilities. Any of these incidents could lead to interruptions or shutdowns of our platform, loss or corruption of data or unauthorized
33
Table of Contents
access to or disclosure of personal data or other sensitive information. Cyberattacks could also result in the theft of our intellectual property, damage to our IT systems or disruption of our ability to make financial reports and other public disclosures required of public companies. We have been subject to attempted cyber, phishing or social engineering attacks in the past and may continue to be subject to such attacks and other cybersecurity incidents in the future. If we gain greater visibility, we may face a higher risk of being targeted by cyberattacks. Advances in computer capabilities, new technological discoveries or other developments may result in cyberattacks becoming more sophisticated and more difficult to detect. We and our third-party service providers may not have the resources or technical sophistication to anticipate or prevent all such cyberattacks. Moreover, techniques used to obtain unauthorized access to systems change frequently and may not be known until launched against us or our third-party service providers. Security breaches can also occur as a result of non-technical issues, including intentional or inadvertent actions by our employees, our third-party service providers, or their personnel.
We and our third-party service providers may experience cyberattacks aimed at disrupting our and their services. If we or our third-party service providers experience, or are believed to have experienced, security breaches that result in marketplace performance or availability problems or the loss or corruption of, or unauthorized access to or disclosure of, personal data or confidential information, people may become unwilling to provide us the information necessary to make purchases on our website. Existing customers may also decrease or stop their purchases altogether. While we maintain cyber errors and omissions insurance coverage that covers certain aspects of cyber risks, these losses may not be adequately covered by insurance or other contractual rights available to us. The successful assertion of one or more large claims against us that exceed or are not covered by our insurance coverage or changes in our insurance policies, including premium increases or the imposition of large deductible or co-insurance requirements, could have an adverse effect on our business, financial condition and results of operations.
Furthermore, we may be required to disclose personal data pursuant to demands from individuals, privacy advocates, regulators, government agencies and law enforcement agencies in various jurisdictions with conflicting privacy and security laws. This disclosure or refusal to disclose personal data may result in a breach of privacy and data protection policies, notices, laws, rules, court orders and regulations and could result in proceedings or actions against us in the same or other jurisdictions, damage to our reputation and brand and inability to provide our products to customers in certain jurisdictions. Additionally, changes in the laws and regulations that govern our collection, use and disclosure of customer data could impose additional requirements with respect to the retention and security of customer data, could limit our marketing activities and have an adverse effect on our business, financial condition and results of operations.
Failure to comply with federal, state or foreign laws and regulations or our contractual obligations relating to privacy, data protection and customer protection, or the expansion of current or the enactment of new laws and regulations relating to privacy, data protection and customer protection, could adversely affect our business and our financial condition.
We collect and maintain significant amounts of data relating to our customers and employees, and we face risks inherent in both handling large volumes of data and in protecting the security of such data. Our actual or perceived failure to comply with any federal, state or foreign laws and regulations, or applicable industry standards that govern or apply to our collection, use, retention, sharing and security of data, could result in enforcement actions that require us to change our business practices in a manner that may negatively impact our revenue, as well as expose ourselves to litigation, fines, civil and/or criminal penalties and adverse publicity that could cause our customers to lose trust in us, negatively impacting our reputation and business in a manner that harms our financial position. Laws and regulations in the United States and around the world restrict how information about individuals is collected, processed, stored, used and disclosed, as well as set standards for its security, implement notice requirements regarding privacy practices, and provide individuals with certain rights regarding the use, disclosure and sale of their protected personal information. These laws and regulations are still being tested in courts, and they are subject to new and differing interpretations by courts and regulatory officials.
34
Table of Contents
We are working to comply with the privacy and data protection laws and regulations that apply to us, and we anticipate needing to devote significant additional resources to complying with these laws and regulations. It is possible that these laws and regulations may be interpreted and applied in a manner that is inconsistent from jurisdiction to jurisdiction or inconsistent with our current policies and practices.
In the United States, both federal and various state governments have adopted, or are considering, laws, guidelines or rules for the collection, distribution, use and storage of information collected from or about consumers or their devices. For example, California enacted the California Consumer Privacy Act, or the CCPA, which went into effect on January 1, 2020. The CCPA gives California residents expanded rights to access and delete their personal information, opt out of certain personal information sharing and receive detailed information about how their personal information is used. The CCPA provides for civil penalties for violations, as well as statutory damages and a private right of action for data breaches that is expected to increase data breach litigation. Further, in November 2020, California voters passed the California Privacy Rights Act, or CPRA. The CPRA, which is expected to take effect on January 1, 2023 and to create obligations with respect to certain data relating to consumers as of January 1, 2022, significantly expands the CCPA, including by introducing additional obligations such as data minimization and storage limitations, granting additional rights to consumers, such as correction of personal information and additional opt-out rights, and creates a new entity, the California Privacy Protection Agency, to implement and enforce the law. Personal information we handle may be subject to the CCPA and CPRA, which may increase our compliance costs and potential liability. Other states have considered similar bills, which could be enacted in the future. For example, on March 2, 2021, the Governor of Virginia signed into law the Virginia Consumer Data Protection Act, or the VCDPA, which gives consumers rights similar to the CCPA and also requires covered businesses to implement security measures and conduct data protection assessments. In addition, on July 7, 2021, Colorado enacted the Colorado Privacy Act, or CoCPA, which closely resembles the VCDPA. The VCDPA and CoCPA will become effective in 2023 and be enforceable by their respective states’ Attorney General and/or district attorneys. We will need to comply with these laws if our operations fall within their scope. In addition to fines and penalties that may be imposed for failure to comply with state laws, some states also provide for private rights of action to customers for misuse of or unauthorized access to personal information. Our compliance with these changing, increasingly burdensome, and sometimes conflicting regulations and requirements may cause us to incur substantial costs or require us to change our business practices, which may impact our financial condition. If we fail to comply with these regulations or requirements, we may be exposed to litigation expenses and possible significant liability, fees or fines. Further, any such claim, proceeding or action could harm our reputation, brand and business, force us to incur significant expenses in defense of such proceedings, distract our management, increase our costs of doing business, result in a loss of customers and suppliers or an inability to process credit card payments and may result in the imposition of monetary penalties. We may also be contractually required to indemnify and hold harmless third parties from the costs or consequences of non-compliance with any laws, regulations or other legal obligations relating to privacy or consumer protection or any inadvertent or unauthorized use or disclosure of data that we store or handle as part of operating our business.
In addition to risks posed by new privacy laws, we could be subject to claims alleging violations of long-established federal and state privacy and consumer protection laws. For example, the Telephone Consumer Protection Act, or TCPA, is a federal law that imposes significant restrictions on the ability to make telephone calls or send text messages to mobile telephone numbers without the prior consent of the person being contacted. The TCPA provides for substantial statutory damages for violations, which has generated extensive class-action litigation. In addition, class-action plaintiffs in the United States are employing novel legal theories to allege that federal and state eavesdropping/wiretapping laws and state constitutions prohibit the use of analytics technologies widely employed by website and mobile app operators to understand how their users interact with their services. Despite our compliance efforts, our use of text messaging communications or similar analytics technologies could expose us to costly litigation, government enforcement actions, damages and penalties, which could adversely affect our business, financial condition and results of operations.
35
Table of Contents
Outside of the United States, certain foreign jurisdictions, including the European Economic Area, or EEA, and the United Kingdom, have laws and regulations which are more restrictive in certain respects than those in the United States. For example, the EEA and the United Kingdom have adopted the GDPR, or a UK-only adoption of the GDPR, or UK GDPR, respectively, which may apply to our collection, control, use, sharing, disclosure and other processing of data relating to an identified or identifiable living individual (personal data). The GDPR, UK GDPR and national implementing legislation in EEA member states and the United Kingdom, such as the UK Data Protection Act 2018, impose a strict data protection compliance regime including: providing detailed disclosures about how personal data is collected and processed (in a concise, intelligible and easily accessible form); granting new rights for data subjects in regard to their personal data (including the right to be “forgotten” and the right to data portability), as well as enhancing current rights (e.g., data subject access requests); requirements to have data processing agreements in place to govern the processing of personal data on behalf of other organizations; introducing the obligation to notify data protection regulators or supervisory authorities (and in certain cases, affected individuals) of significant data breaches; maintaining a record of data processing; and complying with the principal of accountability and the obligation to demonstrate compliance through policies, procedures, trainings and audits.
We also may be subject to specific requirements with respect to cross-border transfers of personal data out of the EEA and United Kingdom. Recent legal developments in the EEA and United Kingdom have created complexity and uncertainty regarding transfers of personal data out of Europe. On July 16, 2020, the Court of Justice of the European Union, or CJEU, invalidated the EU-US Privacy Shield Framework, or Privacy Shield, under which personal data could be transferred from the EEA to US entities who had self-certified under the Privacy Shield scheme. While the CJEU upheld the adequacy of the standard contractual clauses (a standard form of contract approved by the European Commission as an adequate personal data transfer mechanism, and potential alternative to the Privacy Shield), it made clear that reliance on them alone may not necessarily be sufficient in all circumstances. Use of the standard contractual clauses must now be assessed on a case-by-case basis taking into account the legal regime applicable in the destination country, in particular applicable surveillance laws and rights of individuals and additional measures and/or contractual provisions may need to be put in place. The CJEU went on to state that if a competent supervisory authority believes that the standard contractual clauses cannot be complied with in the destination country and the required level of protection cannot be secured by other means, such supervisory authority is under an obligation to suspend or prohibit that transfer. On June 4, 2021, the European Commission adopted new standard contractual clauses, and the European Data Protection Board has released related guidelines. We may have obligations to conduct transfer impact assessments for such cross-border data transfers and implement additional security measures. If we elect to rely on the new standard contractual clauses, we may be required to expend significant resources to update our contractual arrangements and to comply with resulting obligations.
These recent developments may require us to review and amend the legal mechanisms by which we make and/or receive personal data transfers to/ in the United States. We could suffer additional costs, complaints and/or regulatory investigations or fines, and/or if we are otherwise unable to transfer personal data between and among countries and regions in which we operate, it could affect the manner in which we provide our services, the geographical location or segregation of our relevant systems and operations, and could adversely affect our business, financial condition and results of operations.
The withdrawal of the United Kingdom from the European Union has created uncertainty with regard to the regulation of data protection in the United Kingdom. Going forward, we may have to comply with multiple data protection regimes in the EEA and in the United Kingdom. On June 28, 2021, the European Commission issued an adequacy decision under the GDPR which allows transfers of personal information from the EEA to the United Kingdom to continue without restriction for a period of four years ending June 27, 2025. During these four years, the European Commission could intervene if the United Kingdom deviates from the level of data protection in place at the time of issuance of the adequacy decision. If the adequacy decision is withdrawn or not renewed, transfers of personal information from the EEA to the United Kingdom will require a valid transfer mechanism and we may be required to implement new processes and put new agreements in place to continue
36
Table of Contents
making such transfers. In addition, while the United Kingdom’s data protection regime currently permits data transfers from the United Kingdom to the EEA and other third countries covered by a European Commission adequacy decision, this is subject to change. In particular, the UK Information Commissioner’s Office is working on its own version of the standard contractual clauses and it is unclear whether the European Commission’s new standard contractual clauses will continue to be a valid mechanism for personal information transfers from the United Kingdom. We may need to implement both UK and EU versions of standard contractual clauses, which would require significant resources and necessitate significant cost.
We depend on a number of third parties in relation to the operation of our business, a number of which process personal data on our behalf. Any violation of data or security laws by our third-party processors, or their acts or omissions that cause us to violate our legal obligations, could have an adverse effect on our business and result in the fines and penalties outlined below.
Fines for certain breaches of the GDPR, or UK GDPR and Data Protection Act 2018, are up to the greater of 20 million Euros (or 17.5 million pound sterling respectively) or 4% of total global annual turnover, whichever is higher. In addition to the foregoing, a breach of the GDPR or UK GDPR could result in regulatory investigations, reputational damage, orders to cease/ change our processing of our data, enforcement notices, and/ or assessment notices (for a compulsory audit). We may also face civil claims including representative actions and other class action type litigation (where individuals have suffered harm), potentially amounting to significant compensation or damages liabilities, as well as associated costs, diversion of internal resources and reputational harm.
We are also subject to evolving privacy laws on cookies and e-marketing. In the EEA and United Kingdom, regulators are increasingly focusing on compliance with requirements in the online behavioral advertising ecosystem. Under the ePrivacy Directive and national implementation laws, informed consent is required for the placement of a cookie or similar technologies on a user’s device and for direct electronic marketing. The GDPR also imposes conditions on obtaining valid consent, such as a prohibition on pre-checked consents and a requirement to ensure separate consents are sought for each type of cookie or similar technology. In the European Union, current national laws that implement the ePrivacy Directive are expected to be replaced by an EU regulation known as the ePrivacy Regulation which will significantly increase fines for non-compliance. While the text of the ePrivacy Regulation is still under development, a recent European court decision and regulators’ recent guidance are driving increased attention to cookies and tracking technologies. As regulators start to enforce the strict approach in recent guidance, this could lead to substantial costs, require significant systems changes, limit the effectiveness of our marketing activities, divert the attention of our technology personnel, adversely affect our margins, increase costs and subject us to additional liabilities. Regulation of cookies and similar technologies, and any decline of cookies or similar online tracking technologies as a means to identify and potentially target individuals, may lead to broader restrictions and impairments on our marketing and personalization activities and may negatively impact our efforts to understand users.
Furthermore, compliance with legal and contractual obligations requires us to make public statements about our privacy and data security practices, including the statements we make in our online privacy policy. Although we endeavor to comply with these statements, should they prove to be untrue or be perceived as untrue, even through circumstances beyond our reasonable control, we may face litigation, claims, investigations, inquiries or other proceedings by the U.S. Federal Trade Commission, state attorneys general and other federal, state and foreign regulators and private litigants alleging violations of privacy or consumer protection laws.
We are also subject to the Payment Card Industry, or PCI, Data Security Standard, which is a security standard designed to protect payment card data as mandated by payment card industry entities. We rely on vendors to handle PCI matters and to ensure PCI compliance. Despite our compliance efforts, we may become subject to claims that we have violated the PCI Data Security Standard, which could subject us to substantial fines and penalties.
37
Table of Contents
Any actual or perceived non-compliance with these rapidly changing laws, regulations or standards or our contractual obligations relating to privacy, data protection and consumer protection by us or the third-party companies we work with could result in litigation and proceedings against us by governmental entities, consumers or others, fines and civil or criminal penalties for us or company officials, obligations to cease offerings or to substantially modify our business in a manner that makes it less effective in certain jurisdictions, negative publicity and harm to our brand and reputation, and reduced overall demand for our products, any of which could have an adverse effect on our business, financial condition and results of operations.
Government regulation of the internet and eCommerce is evolving, and unfavorable changes or failure by us to comply with these regulations could substantially harm our business, financial condition and results of operations.
We are subject to general business regulations and laws as well as regulations and laws specifically governing the internet and eCommerce. Existing and future regulations and laws could impede the growth of the internet, eCommerce or mobile commerce, which could in turn adversely affect our growth. These regulations and laws may involve taxes, tariffs, privacy and data security, anti-spam, content protection, electronic contracts and communications, customer protection and internet neutrality. It is not clear how existing laws governing issues such as property ownership, sales and other taxes and customer privacy apply to the internet as the vast majority of these laws were adopted prior to the advent of the internet and do not contemplate or address the unique issues raised by the internet or eCommerce. It is possible that general business regulations and laws, or those specifically governing the internet or eCommerce, may be interpreted and applied in a manner that is inconsistent from one jurisdiction to another and may conflict with other rules or our practices. We cannot be sure that our practices comply fully with all such laws and regulations. Any failure, or perceived failure, by us to comply with any of these laws or regulations could result in damage to our reputation, a loss in business and proceedings or actions against us by governmental entities, customers, suppliers or others. Any such proceeding or action could hurt our reputation, force us to spend significant amounts in defense of these proceedings, distract our management, increase our costs of doing business, decrease the use of our website and mobile app by customers and suppliers and may result in the imposition of monetary liabilities. We may also be contractually liable to indemnify and hold harmless third parties from the costs or consequences of our own non-compliance with any such laws or regulations. As a result, adverse developments with respect to these laws and regulations could substantially harm our business, financial condition and results of operations.
Any failure or inability to protect or enforce our intellectual property rights could diminish the value of our brand, weaken our competitive position and harm our business, financial condition and results of operations.
We currently rely on a combination of copyright, trademark, trade dress, design patent and other intellectual property laws as well as confidentiality procedures and contractual restrictions to establish and protect our intellectual property rights. However, the steps we take to protect our intellectual property rights may not be adequate to prevent infringement of these rights by others, including imitation of our products and misappropriation of our brand.
Our success depends in large part on our brand image. We believe that our trademarks and other intellectual property rights have significant value and are important to differentiating our products from those of our competitors and creating and sustaining demand for our products. We have applied for and obtained certain U.S. and foreign trademark registrations and will continue to evaluate the registration of additional trademarks as appropriate. However, we cannot guarantee that any of our pending trademark applications will be approved by the applicable governmental authorities. Moreover, even if our applications are approved, third parties may seek to oppose or otherwise challenge these registrations or other of our intellectual property rights. Third parties may also knowingly or unknowingly infringe our intellectual property rights. In any of these cases, we may be required to expend significant time and expense to defend or enforce our rights.
We also currently hold various domain names relating to our brand. We may be unable to prevent third parties from acquiring and using domain names that are confusingly similar to, or that otherwise have a negative
38
Table of Contents
impact on, the value of our trademarks and other proprietary rights. Any inability or failure to do so could adversely affect our brand and make it more difficult for users to find our website.
Additionally, the expansion of our product lines and the geographic scope of our sales and marketing could pose additional intellectual property challenges. For example, certain foreign countries do not protect intellectual property rights as fully as they are protected in the United States, and accordingly, intellectual property protection may be limited, or in some circumstances unavailable, in some foreign countries where we choose to do business. Thus, it may be more difficult for us to successfully challenge the use of our intellectual property rights by other parties in these countries. If we fail to protect and maintain our intellectual property rights, the value of our brand could be diminished, and our competitive position may suffer.
Our fabrics and manufacturing technology may be imitated by our competitors.
We have applications pending for design patents in the United States and have obtained or have applications pending for corresponding industrial design registrations in other countries on certain aspects of some of our product designs. In addition, our products are made using our proprietary blends of raw materials, fabrics and fabric treatments, which results in products unique to us; however, we do not own or license the intellectual property rights for the underlying fabric technology, fabrics treatments or fabrics. Our ability to obtain intellectual property protection for our products is therefore limited. As a result, our current and future competitors may attempt to imitate our products and do so at lower prices. If our competitors are successful in doing so, our net revenues and profitability could suffer.
We may incur costs to defend against, face liability for or be vulnerable to intellectual property infringement claims brought against us by others.
Although we are not currently aware of any such claims, third parties may assert claims against us alleging that we infringe upon, misappropriate, dilute or otherwise violate their intellectual property rights, particularly as we expand our business and the number of products we offer. These risks have been amplified by the increase in third parties whose sole or primary business is to assert such claims. Our defense of any claim, regardless of its merit, could be expensive and time consuming and could divert management resources. We cannot predict the outcome of lawsuits and cannot ensure that the results of any such actions will not have an adverse effect on our business, financial condition or results of operations. Successful infringement claims against us could result in significant monetary liability or prevent us from selling some of our products. In addition, resolution of claims may require us to redesign or rebrand our products, license rights from third parties, cease using certain brand names or other intellectual property rights altogether or make substantial payments for royalty or license fees, legal fees, settlement payments or other costs or damages. Any of these events could harm our business and cause our results of operations, liquidity and financial condition to suffer.
The inability to acquire, use or maintain our marks and domain names for our websites could substantially harm our business, financial condition and results of operations.
We currently are the registrant of marks for our products in numerous jurisdictions and are the registrant of the internet domain name for the website wearfigs.com, as well as various related domain names. However, we have not registered our marks represented by our domain names in all major international jurisdictions. Domain names generally are regulated by internet regulatory bodies and may not be generally protectable as trademarks in and of themselves. As our business grows, we may incur material costs in connection with the registration, maintenance and protection of our marks. If we do not have or cannot obtain on reasonable terms the ability to use our marks in a particular country, or to use or register our domain name, we could be forced either to incur significant additional expenses to market our products within that country, including the development of a new brand and the creation of new promotional materials and packaging, or to elect not to sell products in that country. Either result could adversely affect our business, financial condition and results of operations.
Furthermore, the regulations governing domain names and laws protecting marks and similar proprietary rights could change in ways that block or interfere with our ability to use relevant domains or the FIGS brand.
39
Table of Contents
Also, we might not be able to prevent third parties from registering, using or retaining domain names that interfere with our customer communications or infringe or otherwise decrease the value of our marks, domain names and other proprietary rights. Regulatory bodies also may establish additional generic or country-code top-level domains or may allow modifications of the requirements for registering, holding or using domain names. As a result, we might not be able to register, use or maintain the domain names that use the name FIGS or “wearFIGS” in all of the countries and territories in which we currently or intend to conduct business.
Risks Related to Other Legal, Regulatory and Tax Matters
We may face exposure to foreign currency exchange rate fluctuations.
While we have historically transacted in U.S. dollars with our customers, we may transact in foreign currencies in the future as we expand offerings and operations internationally. In addition, certain of our foreign operating expenses are denominated in the currencies of the countries and territories in which our third-party vendors are located. Accordingly, changes in the value of foreign currencies relative to the U.S. dollar can affect our net revenues and results of operations. As a result of such foreign currency exchange rate fluctuations, it could be more difficult to detect underlying trends in our business and results of operations. In addition, to the extent that fluctuations in currency exchange rates cause our results of operations to differ from our expectations or the expectations of our investors, the trading price of our Class A common stock could be lowered. We do not currently maintain a program to hedge transactional exposures in foreign currencies. However, in the future, we may use derivative instruments, such as foreign currency forward and option contracts, to hedge certain exposures to fluctuations in foreign currency exchange rates. The use of such hedging activities may not offset any or more than a portion of the adverse financial effects of unfavorable movements in foreign exchange rates over the limited time the hedges are in place and may introduce additional risks if we are unable to structure effective hedges with such instruments.
The United Kingdom’s withdrawal from the European Union may have a negative effect on global economic conditions, financial markets and our business.
Following a national referendum and enactment of legislation by the government of the United Kingdom, the United Kingdom formally withdrew from the European Union and ratified a trade and cooperation agreement governing its future relationship with the European Union. The agreement, which was applied provisionally from January 1, 2021 and entered into force on May 1, 2021, addresses trade, economic arrangements, law enforcement, judicial cooperation and a governance framework including procedures for dispute resolution, among other things. Because the agreement merely sets forth a framework in many respects and will require complex additional bilateral negotiations between the United Kingdom and the European Union as both parties continue to work on the rules for implementation, significant political and economic uncertainty remains about how the precise terms of the relationship between the parties will differ from the terms before withdrawal.
These developments, or the perception that any related developments could occur, have had and may continue to have an adverse effect on global economic conditions and financial markets, and may significantly reduce global market liquidity, restrict the ability of key market participants to operate in certain financial markets or restrict our access to capital. Any of these factors could have an adverse effect on our business, financial condition and results of operations and reduce the price of Class A common stock.
Any failure to comply with trade, anti-corruption and other regulations could lead to investigations or actions by government regulators and negative publicity.
The labeling, distribution, importation, marketing and sale of our products are subject to extensive regulation by various federal agencies, including the Federal Trade Commission, Customer Product Safety Commission and state attorneys general in the United States, the Competition Bureau and Health Canada in Canada, as well as by various other federal, state, provincial, local and international regulatory authorities in the countries in which our products are distributed or sold. If we fail to comply with any of these regulations, we
40
Table of Contents
could become subject to enforcement actions or the imposition of significant penalties or claims, which could harm our results of operations or our ability to conduct our business. For example, we and our co-founders and co-Chief Executive Officers are currently defendants in two actions brought by Strategic Partners, Inc., or SPI. See “Business—Legal Proceedings” for additional information. While we believe the claims asserted by SPI in both actions are without basis or merit, and we intend to vigorously defend against such claims, these proceedings or any investigations or inquiries by governmental agencies related to these or any other matters, could result in significant settlement amounts, damages, fines or other penalties, divert financial and management resources and result in significant legal fees. An unfavorable outcome of any particular proceeding could have an adverse impact on our business, financial condition and results of operations. In addition, the adoption of new regulations or changes in the interpretation of existing regulations may result in significant compliance costs or discontinuation of product sales and could impair the marketing of our products, resulting in significant loss of net revenues.
We derive a significant portion of our products from third-party manufacturing and supply partners in foreign countries and territories, including countries and territories perceived to carry an increased risk of corrupt business practices. We are subject to the FCPA, the U.S. domestic bribery statute contained in 18 U.S.C. § 201, the U.S. Travel Act, the USA PATRIOT Act, the U.K. Bribery Act, and possibly other anti-bribery and anti-money laundering laws in countries in which we conduct activities. These laws prohibit companies and their employees and third-party intermediaries from corruptly promising, authorizing, offering or providing, directly or indirectly, improper payments or anything of value to foreign government officials, political parties and private-sector recipients for the purpose of obtaining or retaining business, directing business to any person or securing any advantage. In addition, U.S. public companies are required to maintain records that accurately and fairly represent their transactions and have an adequate system of internal accounting controls. In many foreign countries, including countries in which we may conduct business, it may be a local custom that businesses engage in practices that are prohibited by the FCPA or other applicable laws and regulations. We face significant risks if we or any of our directors, officers, employees, agents or other partners or representatives fail to comply with these laws, and governmental authorities in the United States and elsewhere could seek to impose substantial civil and/or criminal fines and penalties, which could adversely affect our reputation, business, financial condition and results of operations.
If our employees, contractors and agents, and companies to which we outsource certain of our business operations were to take actions in violation of our policies or applicable law, there could be an adverse effect on our reputation, business, financial condition and results of operations.
Any violation of the FCPA, other applicable anti-corruption laws or anti-money laundering laws could result in whistleblower complaints, adverse media coverage, investigations, loss of export privileges, severe criminal or civil sanctions and, in the case of the FCPA, suspension or debarment from U.S. government contracts, any of which could have an adverse effect on our business, financial condition and results of operations. In addition, responding to any enforcement action may result in a significant diversion of management’s attention and resources and significant defense costs and other professional fees.
Our ability to source and distribute our merchandise profitably or at all could be harmed if new trade restrictions are imposed or existing trade restrictions become more burdensome.
Substantially all of our apparel products are currently manufactured outside of the United States. The United States and the countries in which our products are produced or sold internationally have imposed and may impose additional quotas, duties, tariffs or other restrictions or regulations, or may adversely adjust prevailing quota, duty or tariff levels. Countries impose, modify and remove tariffs and other trade restrictions in response to a diverse array of factors, including global and national economic and political conditions, which make it impossible for us to predict future developments regarding tariffs and other trade restrictions. Trade restrictions, including tariffs, quotas, export controls, trade sanctions, embargoes, safeguards and customs restrictions, could increase the cost or reduce the supply of products available to us or may require us to modify our supply chain
41
Table of Contents
organization or other current business practices, any of which could harm our business, financial condition and results of operations.
Changes in tax laws, including as a result of the 2020 United States presidential and congressional elections, may impact our future financial position and results of operation.
New income, sales, use or other tax laws, statutes, rules, regulations or ordinances could be enacted at any time, or interpreted, changed, modified or applied adversely to us, any of which could adversely affect our business operations and financial performance. In particular, the most recent presidential and congressional elections in the United States could result in significant changes in, and uncertainty with respect to, tax legislation, regulation and government policy directly affecting our business or indirectly affecting us because of impacts on our customers, suppliers and manufacturers. For example, the Biden administration recently proposed to increase the U.S. corporate income tax rate from 21% to 28%, increase U.S. taxation of international business operations, and impose a global minimum tax. We are currently unable to predict whether such changes will occur and, if so, the ultimate impact on our business. To the extent that such changes have a negative impact on us, our suppliers, manufacturers or our customers, including as a result of related uncertainty, these changes may adversely impact our business, financial condition, results of operations and cash flows.
We could be required to collect additional sales taxes that may increase the costs our customers would have to pay for our products and adversely affect our results of operations.
Following the U.S. Supreme Court’s decision in 2018 in South Dakota v. Wayfair, Inc., a state may impose sales tax collection obligations on certain retailers, including eCommerce companies, that lack any physical presence within such state. The Supreme Court’s Wayfair decision has removed a significant impediment to the enactment of laws imposing sales tax collection obligations on out-of-state eCommerce companies, and an increasing number of states have adopted such laws. Although we believe that we currently collect sales taxes in all states that require us to do so, a successful assertion by one or more states requiring us to collect sales taxes where we currently do not collect sales taxes, or to collect additional sales taxes in a state in which we currently collect sales taxes, could result in substantial tax liabilities (including penalties and interest). In addition, the imposition of additional sales tax collection obligations, whether for prior years or prospectively, could create additional administrative burdens for us, put us at a competitive disadvantage if similar obligations are not imposed on our competitors and decrease our future sales, which could have an adverse impact on our business and results of operations.
Existing and potential tariffs imposed by the U.S. government or a global trade war could increase the cost of our products, which could have an adverse effect on our business, financial condition and results of operations.
The U.S. government has in recent years imposed increased tariffs on imports from certain foreign countries, and any imposition of additional tariffs by the United States could result in the adoption of tariffs by other countries, leading to a global trade war. While the U.S. government’s recent tariffs on certain imports from China only affect a small portion of our production, any such future tariffs by the United States or other countries could have a significant impact on our business. While we may attempt to renegotiate prices with suppliers or diversify our supply chain in response to tariffs, such efforts may not yield immediate results or may be ineffective. We might also consider increasing prices to the end customer; however, this could reduce the competitiveness of our products and adversely affect net revenues. If we fail to manage these dynamics successfully, gross margins and profitability could be adversely affected. As of the date of this prospectus, tariffs have not had a material impact on our business, but increased tariffs or trade restrictions implemented by the United States or other countries in connection with a global trade war could have an adverse effect on our business, financial condition and results of operations.
42
Table of Contents
Our ability to use our net operating loss carryforwards may be limited.
As of December 31, 2020, we had U.S. federal and state net operating loss carryforwards of approximately $1.8 million and $16.0 million, respectively. Under legislation enacted in 2017, informally titled, the Tax Cuts and Jobs Act, or the TCJA, as modified in 2020 by the Coronavirus Aid, Relief, and Economic Security Act, or the CARES Act, unused U.S. federal net operating losses generated in tax years beginning after December 31, 2017, will not expire and may be carried forward indefinitely, but the deductibility of such federal net operating loss carryforwards in taxable years beginning after December 31, 2020, is limited to 80% of taxable income. It is uncertain if and to what extent various states will conform to the TCJA or the CARES Act. Our ability to utilize our federal net operating carryforwards may be limited under Section 382 of the Internal Revenue Code of 1986, as amended, or the Code. The limitations apply if we experience an “ownership change,” which is generally defined as a greater than 50 percentage point change (by value) in the ownership of our equity by certain stockholders over a rolling three-year period. Similar provisions of state tax law may also apply to limit the use of our state net operating loss carryforwards. We have previously experienced ownership changes, and although such prior ownership changes have not materially limited our utilization of affected net operating loss carryforwards, future changes in our stock ownership (including as a result of this offering), which may be outside of our control, may trigger an ownership change that materially impacts our ability to utilize pre-change net operating loss carryforwards. In addition, there may be periods during which the use of net operating loss carryforwards is suspended or otherwise limited. For example, in 2020, California generally suspended the use of California net operating loss carryforwards to offset taxable income in tax years beginning after 2019 and before 2023. Accordingly, our ability to use our net operating loss carryforwards to offset taxable income may be subject to such limitations or special rules that apply at the state level, which could adversely affect our results of operations.
Risks Related to the Ownership of Our Class A Common Stock and this Offering
An active market may not be sustainable, and you may not be able to resell your shares at or above the price you paid.
It is possible that an active or liquid market in our Class A common stock may not be sustainable. In the absence of an active trading market for our Class A common stock, you may not be able to resell any shares you hold at or above the public offering price or at all. We cannot predict the prices at which our Class A common stock will trade.
Our stock price may be volatile or may decline regardless of our operating performance, resulting in substantial losses for investors purchasing shares in this offering.
The market price of our Class A common stock may fluctuate significantly in response to numerous factors, many of which are beyond our control, including:
| • | actual or anticipated fluctuations in our financial condition and results of operations; |
| • | the financial projections we may provide to the public, any changes in these projections or our failure to meet these projections; |
| • | failure of securities analysts to initiate or maintain coverage of our company, changes in financial estimates or ratings by any securities analysts who follow our company or our failure to meet these estimates or the expectations of investors; |
| • | announcements by us or our competitors of significant technical innovations, acquisitions, strategic partnerships, joint ventures, results of operations or capital commitments; |
| • | changes in stock market valuations and operating performance of other healthcare and technology companies generally, or those in our industry in particular; |
| • | price and volume fluctuations in the overall stock market, including as a result of trends in the economy as a whole; |
43
Table of Contents
| • | changes in our board of directors or management; |
| • | sales of large blocks of our Class A common stock, including sales by Tulco, LLC, our co-founders and co-Chief Executive Officers or our other executive officers and directors; |
| • | lawsuits threatened or filed against us; |
| • | anticipated or actual changes in laws, regulations or government policies applicable to our business; |
| • | changes in our capital structure, such as future issuances of debt or equity securities; |
| • | short sales, hedging and other derivative transactions involving our capital stock; |
| • | general economic conditions in the United States; |
| • | other events or factors, including those resulting from war, pandemics (including COVID-19), incidents of terrorism or responses to these events; and |
| • | the other factors described in the sections of this prospectus titled “Risk Factors” and “Special Note Regarding Forward-Looking Statements.” |
The stock market has recently experienced extreme price and volume fluctuations. The market prices of securities of companies have experienced fluctuations that often have been unrelated or disproportionate to their results of operations. Market fluctuations could result in extreme volatility in the price of shares of our Class A common stock, which could cause a decline in the value of your investment. Price volatility may be greater if the public float and trading volume of shares of our Class A common stock is low. Furthermore, in the past, stockholders have sometimes instituted securities class action litigation against companies following periods of volatility in the market price of their securities. Any similar litigation against us could result in substantial costs, divert management’s attention and resources, and harm our business, financial condition and results of operations.
The dual-class structure of our common stock may adversely affect the trading market for our Class A common stock.
We cannot predict whether our dual-class structure will result in a lower or more volatile market price of our Class A common stock or in adverse publicity or other adverse consequences. For example, certain index providers have announced restrictions on including companies with dual class or multi-class share structures in certain of their indexes. In July 2017, S&P Dow Jones and FTSE Russell announced changes to their eligibility criteria for the inclusion of shares of public companies on certain indices, including the Russell 2000, the S&P 500, the S&P MidCap 400 and the S&P SmallCap 600, to exclude companies with multiple classes of shares of common stock from being added to these indices. Beginning in 2017, MSCI, a leading stock index provider, opened public consultations on their treatment of no-vote and multi-class structures and temporarily barred new multi-class listings from certain of its indices; however, in October 2018, MSCI announced its decision to include equity securities “with unequal voting structures” in its indices and to launch a new index that specifically includes voting rights in its eligibility criteria. As a result, our dual-class capital structure would make us ineligible for inclusion in any of these indices, and mutual funds, exchange-traded funds and other investment vehicles that attempt to passively track these indices will not be investing in our stock. These policies are still fairly new, and it remains unclear what effect, if any, they will have on the valuations of publicly traded companies excluded from the indices in the longer term, but it is possible that they may depress these valuations compared to those of other similar companies that are included. Furthermore, we cannot assure you that other stock indices will not take a similar approach to S&P Dow Jones or FTSE Russell in the future. Exclusion from indices could make our Class A common stock less attractive to investors and, as a result, the market price of our Class A common stock could be adversely affected.
44
Table of Contents
Sales, directly or indirectly, of a substantial amount of our Class A common stock in the public markets by our existing security holders may cause the price of our Class A common stock to decline.
Sales of a substantial number of shares of our Class A common stock into the public market, particularly sales by our directors, executive officers and principal stockholders, or the perception that these sales might occur, could cause the market price of our Class A common stock to decline. Many of our existing security holders have substantial unrecognized gains on the value of the equity they hold and may take steps to sell their shares or otherwise secure or limit their risk exposure to the value of their unrecognized gains on those shares. We are unable to predict the timing or effect of such sales on the market price of our Class A common stock.
All of the shares of Class A common stock sold in our IPO are, and all of the shares of Class A common stock to be sold in this offering will be, freely tradable without restrictions or further registration under the Securities Act, except that any shares held by our affiliates, as defined in Rule 144 under the Securities Act, may only be sold in compliance with Rule 144 and any applicable lock-up agreements described below.
In connection with our IPO, we, all of our directors and executive officers and holders of substantially all of our outstanding securities entered into market standoff agreements with us or lock-up agreements with the underwriters that restrict our and their ability to sell or transfer shares of our capital, with respect to the company, for 180 days after May 26, 2021, and with respect to the company’s officers, directors and stockholders, until the earlier of (i) 180 days after May 26, 2021, the date of the final prospectus related to our IPO, or the IPO Prospectus, and (ii) the second full trading day following our second public release of quarterly or annual financial results following the date of the IPO Prospectus, or the Final Release Date, subject to certain exceptions and the early release provisions described below.
The lock-up agreements expired with respect to a number of shares equal to 15% of the aggregate number of shares of common stock owned by each holder or issuable upon exercise of vested equity awards owned by each holder immediately prior to the commencement of trading on August 27, 2021, upon satisfaction of the following conditions: (1) the latter of (a) the date we published our first quarterly or annual financial results following the date of the IPO Prospectus and (b) the 90th day following the date of the IPO Prospectus and (2) the closing price of our class A common stock on the NYSE was at least 33% greater than the IPO price of the shares to the public as set forth on the cover of IPO Prospectus for at least 10 trading days (including the date these conditions were met) in any 15-day consecutive trading day period. In connection with this offering, we and all of our directors and executive officers, and Tulco, LLC, Heather Hasson and Catherine Spear as the selling stockholders in this offering, entered into lock-up agreements that prohibit us and them from offering for sale, selling, contracting to sell, granting any option for the sale of, transferring or otherwise disposing of any shares of our common stock, stock options or any security or instrument related to this common stock, or stock option that would have otherwise been released pursuant to the foregoing early release provisions and which are not being sold in this offering until the Final Release Date. In addition, we and Goldman Sachs & Co. LLC and Morgan Stanley & Co. LLC may release certain stockholders from the market standoff agreements or lock-up agreements prior to the end of the lock-up period. If not otherwise early released, when the applicable market standoff and lock-up periods expire, we and our security holders subject to a lock-up agreement or market standoff agreement will be able to sell our shares freely in the public market, except that any shares held by our affiliates, as defined in Rule 144 under the Securities Act, would only be able to be sold in compliance with Rule 144. Sales of a substantial number of such shares upon expiration of the lock-up and market standoff agreements, or the perception that such sales may occur, or early release of these agreements, could cause our market price to fall or make it more difficult for you to sell your Class A common stock at a time and price that you deem appropriate.
In addition, as of June 30, 2021, we had stock options outstanding that, if fully exercised, would result in the issuance of 41,625,846 shares of Class A common stock including 34,841,314 shares that are exchangeable for an equal number of shares of Class B common stock. All of the shares of common stock issuable upon the exercise of stock options, and the 14,890,697 shares of Class A common stock reserved for future issuance under our 2021 Plan and ESPP, will be registered for public resale under the Securities Act. Accordingly, these shares will be able to be freely sold in the public market upon issuance subject to existing lock-up or market standoff agreements and applicable vesting requirements.
45
Table of Contents
Further, following the completion of this offering, holders of 64,834,274 shares of our common stock have rights, subject to certain conditions, to require us to file registration statements for the public resale of such shares or to include such shares in registration statements that we may file for us or other stockholders.
The dual-class structure of our common stock and voting agreement among us and the Class B stockholders has the effect of concentrating voting control with our co-founders and co-Chief Executive Officers, Heather Hasson and Trina Spear, and Tulco, LLC, who will hold in the aggregate 80.0% of the voting power of our capital stock following the completion of this offering, which may limit or preclude your ability to influence corporate matters, including the election of directors and the approval of any change of control transaction.
Our Class B common stock has 20 votes per share and our Class A common stock has one vote per share. All outstanding shares of our Class B common stock are held by our co-founders and co-Chief Executive Officers, Ms. Hasson and Ms. Spear, and Tulco, LLC, our majority stockholder. Immediately following the completion of this offering, these holders will represent approximately 80.0% of the voting power of our outstanding capital stock, assuming no exercise of the underwriters’ option to purchase additional shares.
These stockholders have the ability to control the outcome of matters submitted to our stockholders for approval, including the election of our directors and the approval of any change of control transaction. In addition, we and the Class B stockholders have entered into a voting agreement with respect to the election of directors. This concentrated control will limit or preclude your ability to influence corporate matters for the foreseeable future, including the election of directors, amendments of our organizational documents, and any merger, consolidation, sale of all or substantially all of our assets, or other major corporate transaction requiring stockholder approval. In addition, this may prevent or discourage unsolicited acquisition proposals or offers for our capital stock that you may feel are in your best interest as one of our stockholders.
Future transfers by holders of Class B common stock will generally result in those shares converting to Class A common stock, subject to limited exceptions, such as certain transfers effected for estate planning purposes. The conversion of Class B common stock to Class A common stock will have the effect, over time, of increasing the relative voting power of those holders of Class B common stock who retain their shares in the long term. See the section titled “Description of Capital Stock—Anti-Takeover Provisions” for additional information.
We are a “controlled company” within the meaning of the rules of the NYSE and, as a result, qualify for, and rely on, exemptions from certain corporate governance requirements. You do not have the same protections afforded to stockholders of companies that are subject to such requirements.
Our co-founders and co-Chief Executive Officers, Ms. Hasson and Ms. Spear, and Tulco, LLC together control a majority of the voting power of our outstanding common stock and have entered into a voting agreement, with respect to the election of directors. As a result, we are a “controlled company” within the meaning of the corporate governance standards of the NYSE. Under these rules, a listed company of which more than 50% of the voting power is held by an individual, group or another company is a “controlled company” and may elect not to comply with certain corporate governance requirements, including:
| • | the requirement that a majority of the board of directors consist of independent directors; |
| • | the requirement that our nominating and corporate governance committee be composed entirely of independent directors with a written charter addressing the committee’s purpose and responsibilities; |
| • | the requirement that our compensation committee be composed entirely of independent directors with a written charter addressing the committee’s purpose and responsibilities; and |
| • | the requirement for an annual performance evaluation of our governance and compensation committees. |
We will rely on these exemptions and, as a result, do not have a majority of independent directors on our board of directors or governance and compensation committees consisting entirely of independent directors. Accordingly, you do not have the same protections afforded to stockholders of companies that are subject to all of the corporate governance requirements of the NYSE.
46
Table of Contents
We are an “emerging growth company” and our compliance with the reduced reporting and disclosure requirements applicable to “emerging growth companies” may make our Class A common stock less attractive to investors.
We are an “emerging growth company,” as defined in the JOBS Act, and we have elected to take advantage of certain exemptions and relief from various reporting requirements that are applicable to other public companies that are not “emerging growth companies.” These provisions include, but are not limited to: being exempt from compliance with the auditor attestation requirements of Section 404(b) of the Sarbanes-Oxley Act; being exempt from any rules that could be adopted by the Public Company Accounting Oversight Board requiring mandatory audit firm rotations or a supplement to the auditor’s report on financial statements; being subject to reduced disclosure obligations regarding executive compensation in our periodic reports and proxy statements; and not being required to hold nonbinding advisory votes on executive compensation or on any golden parachute payments not previously approved.
In addition, while we are an “emerging growth company,” we will not be required to comply with any new financial accounting standard until such standard is generally applicable to private companies. As a result, our financial statements may not be comparable to companies that are not “emerging growth companies” or elect not to avail themselves of this provision.
We may remain an “emerging growth company” until as late as December 31, 2026, the fiscal year-end following the fifth anniversary of the completion of our IPO, though we may cease to be an “emerging growth company” earlier under certain circumstances, including if (1) we have more than $1.07 billion in annual net revenues in any fiscal year, (2) we become a “large accelerated filer,” with at least $700 million of equity securities held by non-affiliates as of the end of the second quarter of that fiscal year or (3) we issue more than $1.0 billion of non-convertible debt over a three-year period.
The exact implications of the JOBS Act are still subject to interpretations and guidance by the SEC and other regulatory agencies, and we cannot assure you that we will be able to take advantage of all of the benefits of the JOBS Act. In addition, investors may find our Class A common stock less attractive to the extent we rely on the exemptions and relief granted by the JOBS Act. If some investors find our Class A common stock less attractive as a result, there may be a less active trading market for our Class A common stock and our stock price may decline or become more volatile.
If securities or industry analysts do not publish research, or publish inaccurate or unfavorable research, about our business, the price of our Class A common stock and trading volume could decline.
The trading market for our Class A common stock depends in part on the research and reports that securities or industry analysts publish about us or our business, our market and our competitors. We do not have any control over these analysts. If few securities analysts commence coverage of us, or if industry analysts cease coverage of us, the trading price for our Class A common stock would be negatively affected. If one or more of the analysts who cover us downgrade our Class A common stock or publish inaccurate or unfavorable research about our business, our Class A common stock price would likely decline. If one or more of these analysts cease coverage of us or fail to publish reports on us regularly, demand for our Class A common stock could decrease, which might cause our Class A common stock price and trading volume to decline.
We do not currently intend to pay dividends for the foreseeable future.
We currently intend to retain any future earnings to finance the operation and expansion of our business and we do not currently expect to declare or pay any dividends in the foreseeable future. Moreover, the terms of our existing credit agreement restrict our ability to pay dividends, and any additional debt we may incur in the future may include similar restrictions. In addition, Delaware law may impose requirements that may restrict our ability to pay dividends to holders of our common stock. As a result, stockholders must rely on sales of their Class A common stock after price appreciation, which may never occur as the only way to realize any future gains on
47
Table of Contents
their investment. As a result, investors seeking cash dividends should not purchase our Class A common stock. See “Dividend Policy.”
Delaware law and provisions in our amended and restated certificate of incorporation and amended and restated bylaws could make a merger, tender offer or proxy contest more difficult, limit attempts by our stockholders to replace or remove our current management and depress the market price of our Class A common stock.
Provisions in our amended and restated certificate of incorporation and our amended and restated bylaws may discourage, delay or prevent a merger, acquisition or other change in control of us or tender offer that stockholders may consider favorable, including transactions in which stockholders might otherwise receive a premium for their shares. These provisions could also limit the price that investors might be willing to pay in the future for shares of our Class A common stock, thereby depressing the market price of our Class A common stock. In addition, these provisions may frustrate or prevent any attempts by our stockholders to replace or remove our current management. Because our board of directors is responsible for appointing the members of our management team, these provisions could in turn affect any attempt by our stockholders to replace current members of our management team. Among others, these provisions include that:
| • | provide for a dual-class common stock structure in which holders of our Class B common stock may have the ability to control the outcome of matters requiring stockholder approval, including the election of directors and significant corporate transactions, such as a merger or other sale of our company or its assets, even if they own significantly less than a majority of the outstanding shares of our common stock; |
| • | restrict the forum for certain litigation against us to Delaware or the federal courts, as applicable; |
| • | our board of directors has the exclusive right to expand the size of our board of directors and to elect directors to fill a vacancy created by the expansion of the board of directors or the resignation, death or removal of a director, which prevents stockholders from being able to fill vacancies on our board of directors; |
| • | our board of directors is divided into three classes, Class I, Class II and Class III, with each class serving staggered three-year terms, which may delay the ability of stockholders to change the membership of a majority of our board of directors; |
| • | our stockholders may act by written consent until such time as holders of our Class B common stock beneficially own less than a majority of the voting power, at which time our stockholders will no longer be able to act by written consent and instead must take action at an annual or special meeting of our stockholders; |
| • | a special meeting of stockholders may be called only by the chair of the board of directors, a chief executive officer, or the board of directors, which may delay the ability of our stockholders to force consideration of a proposal or to take action, including the removal of directors; |
| • | our amended and restated certificate of incorporation prohibits cumulative voting in the election of directors, which limits the ability of minority stockholders to elect director candidates; |
| • | our board of directors may alter our amended and restated bylaws without obtaining stockholder approval; |
| • | the required approval of the holders of at least two-thirds of the shares entitled to vote at an election of directors to adopt, amend or repeal our amended and restated bylaws or repeal the provisions of our amended and restated certificate of incorporation regarding the election and removal of directors; |
| • | stockholders must provide advance notice and additional disclosures in order to nominate individuals for election to the board of directors or to propose matters that can be acted upon at a stockholders’ meeting, which may discourage or deter a potential acquiror from conducting a solicitation of proxies |
48
Table of Contents
| to elect the acquiror’s own slate of directors or otherwise attempting to obtain control of our company; and |
| • | our board of directors is authorized to issue shares of preferred stock and to determine the terms of those shares, including preferences and voting rights, without stockholder approval, which could be used to significantly dilute the ownership of a hostile acquirer. |
Moreover, because we are incorporated in Delaware, we are governed by the provisions of Section 203 of the Delaware General Corporation Law, which generally prohibits a person who owns in excess of 15% of our outstanding voting stock from merging or combining with us for a period of three years after the date of the transaction in which the person acquired in excess of 15% of our outstanding voting stock, unless the merger or combination is approved in a prescribed manner.
Our amended and restated certificate of incorporation provides that the Court of Chancery of the State of Delaware is the sole and exclusive forum for certain stockholder litigation matters and the federal district courts of the United States are the exclusive forum for the resolution of any complaint asserting a cause of action arising under the Securities Act, which could limit our stockholders’ ability to obtain a favorable judicial forum for disputes with us or our directors, officers, employees or stockholders.
Our amended and restated certificate of incorporation provides that, unless we otherwise consent in writing, (A) (1) any derivative action or proceeding brought on behalf of the Company, (2) any action asserting a claim of breach of a fiduciary duty owed by any current or former director, officer, other employee or stockholder of the Company to the Company or the Company’s stockholders, (3) any action asserting a claim arising pursuant to any provision of the Delaware General Corporation Law, our amended and restated certificate of incorporation or our amended and restated bylaws (as either may be amended or restated) or as to which the Delaware General Corporation Law confers exclusive jurisdiction on the Court of Chancery of the State of Delaware or (4) any action asserting a claim governed by the internal affairs doctrine of the law of the State of Delaware shall, to the fullest extent permitted by law, be exclusively brought in the Court of Chancery of the State of Delaware or, if such court does not have subject matter jurisdiction thereof, the federal district court of the State of Delaware; and (B) the federal district courts of the United States shall be the exclusive forum for the resolution of any complaint asserting a cause of action arising under the Securities Act. Notwithstanding the foregoing, the exclusive forum provision shall not apply to claims seeking to enforce any liability or duty created by the Exchange Act. The choice of forum provision may limit a stockholder’s ability to bring a claim in a judicial forum that it finds favorable for disputes with us or our directors, officers or other employees, which may discourage such lawsuits against us and our directors, officers, and other employees, although our stockholders will not be deemed to have waived our compliance with federal securities laws and the rules and regulations thereunder. Alternatively, if a court were to find the choice of forum provision contained in our amended and restated certificate of incorporation to be inapplicable or unenforceable in an action, we may incur additional costs associated with resolving such action in other jurisdictions, which could harm our business, financial condition and results of operations. Any person or entity purchasing or otherwise acquiring or holding any interest in shares of our capital stock shall be deemed to have notice of and consented to the forum provisions in our amended and restated certificate of incorporation.
General Risk Factors
Our quarterly results of operations may fluctuate, and if our operating and financial performance in any given period does not meet the guidance that we have provided to the public or the expectations of our investors and securities analysts, the trading price of our Class A common stock may decline.
Our quarterly results of operations may fluctuate for a variety of reasons, many of which are beyond our control. These reasons include those described in these risk factors as well as the following:
| • | fluctuations in product mix; |
| • | our ability to effectively launch and manage new products; |
49
Table of Contents
| • | fluctuations in the levels or quality of inventory; |
| • | fluctuations in capacity as we expand our operations; |
| • | our success in engaging existing customers and attracting new customers; |
| • | the amount and timing of our operating expenses; |
| • | the timing and success of new products launches; |
| • | the impact of competitive developments and our response to those developments; |
| • | our ability to manage our existing business and future growth; and |
| • | economic and market conditions, particularly those affecting our industry. |
Fluctuations in our quarterly results of operations may cause those results to fall below the guidance that we have provided to the public or the expectations of our investors and securities analysts, which could cause the trading price of our Class A common stock to decline. Fluctuations in our results could also cause a number of other problems. For example, analysts or investors might change their models for valuing our Class A common stock, we could experience short-term liquidity issues, our ability to retain or attract key personnel may diminish and other unanticipated issues may arise.
In addition, we believe that our quarterly results of operations may vary in the future and that period-to-period comparisons of our results of operations may not be meaningful. You should not rely on the results of one quarter as an indication of future performance.
The estimates of market opportunity and forecasts of market growth included in this prospectus may prove to be inaccurate, and even if the markets in which we compete achieve the forecasted growth, our business could fail to grow at similar rates, or at all.
The estimates of market opportunity and forecasts of market growth included in this prospectus may prove to be inaccurate. Market opportunity estimates and growth forecasts are subject to significant uncertainty and are based on assumptions and estimates that may not prove to be accurate, including as a result of any of the risks described in this prospectus.
The variables that go into the calculation of our market opportunity are subject to change over time, and there is no guarantee that any particular number or percentage of addressable customers covered by our market opportunity estimates will purchase our products at all or generate any particular level of net revenues for us. In addition, our ability to expand in any of our target markets depends on a number of factors, including the cost, performance and perceived value associated with our products and traditional medical apparel. Even if the markets in which we compete meet the size estimates and growth forecasted in this prospectus, our business could fail to grow at similar rates, or at all. Our growth is subject to many factors, including our success in implementing our business strategy, which is subject to many risks and uncertainties. Accordingly, the forecasts of market growth included in this prospectus should not be taken as indicative of our future growth.
Our results of operations could be adversely affected by natural disasters, public health crises, political crises or other catastrophic events.
Our principal offices and our fulfillment center are located in Southern California, an area which has a history of earthquakes, and are thus vulnerable to damage. Natural disasters, such as earthquakes, wildfires, hurricanes, tornadoes, floods and other adverse weather and climate conditions; unforeseen public health crises, such as epidemics and pandemics, including the ongoing COVID-19 pandemic; political crises, such as terrorist attacks, war and other political instability; or other catastrophic events, whether occurring in the United States or internationally, could disrupt our operations in any of our offices and fulfillment center or the operations of one or more of our third-party providers or vendors. In particular, these types of events could impact our merchandise
50
Table of Contents
supply chain, including the ability of third parties to manufacture and ship merchandise and our ability to ship products to customers from or to the impacted region. For example, as a result of the COVID-19 pandemic, certain of our ocean freight providers, as well as some of our suppliers and manufacturers, particularly those operating in Vietnam, are experiencing delays, in the past have experienced delays and shutdowns, and could experience delays and shutdowns again in the future. In addition, these types of events could negatively impact customer spending in the impacted regions. To the extent any of these events occur, our business, financial condition and results of operations could be adversely affected.
We are subject to periodic claims and litigation that could result in unexpected expenses and could ultimately be resolved against us.
From time to time, we may be involved in litigation and other proceedings, including matters related to commercial disputes, product liability, intellectual property, trade, customs laws and regulations, employment, regulatory compliance and other claims related to our business. For example, we and our co-founders and co-Chief Executive Officers are currently defendants in two actions brought by SPI. See “Business—Legal Proceedings” for additional information. While we believe the claims asserted by SPI in both actions are without basis or merit, and we intend to vigorously defend against such claims, these or any other proceeding or audit could result in significant settlement amounts, damages, fines, penalties or other relief such as an injunction, divert financial and management resources and result in significant legal fees. An unfavorable outcome of any particular proceeding could exceed the limits of our insurance policies, or our insurance carriers may decline to fund such final settlements or judgments or all or part of the legal costs associated with the proceeding, which could have an adverse impact on our business, financial condition and results of operations. In addition, any such proceeding could negatively impact our brand equity and our reputation.
Our insurance may not provide adequate coverage against claims.
Some of the merchandise we sell may expose us to product liability claims and litigation or regulatory actions relating to personal injury. We believe that we maintain insurance customary for businesses of our size and type. However, there are types of losses we may incur that cannot or may not be insured against or that we believe are not economically reasonable to insure. Moreover, any loss incurred could exceed policy limits and policy payments made to us may not be made on a timely basis. In addition, some of our agreements with our suppliers may not indemnify us from product liability for a particular supplier’s merchandise or our suppliers may not have sufficient resources or insurance to satisfy their indemnity and defense obligations.
We incur significant additional costs as a result of being a public company, and our management is required to devote substantial time to compliance with our public company responsibilities and corporate governance practices.
We incur increased costs associated with corporate governance requirements that are applicable to us as a public company, including rules and regulations of the SEC, under the Sarbanes-Oxley Act, the Dodd-Frank Wall Street Reform and Customer Protection Act of 2010, and the Exchange Act, as well as the rules of the NYSE. These rules and regulations significantly increase our accounting, legal and financial compliance costs and make some activities more time consuming. We cannot always predict or estimate all of the additional costs we will incur as a public company or the timing of such costs. We expect such expenses to further increase after we are no longer an “emerging growth company.” We also expect these rules and regulations to make it more expensive for us to maintain directors’ and officers’ liability insurance. As a result, it may be more difficult for us to attract and retain qualified persons to serve on our board of directors or as executive officers. In addition, our management team needs to devote substantial attention to transitioning to interacting with public company analysts and investors and complying with the increasingly complex laws pertaining to public companies, which may divert attention away from the day-to-day management of our business. Increases in costs incurred or diversion of management’s attention as a result of becoming a publicly traded company may adversely affect our business, financial condition and results of operations.
51
Table of Contents
If our estimates or judgments relating to our critical accounting policies are based on assumptions that change or prove to be incorrect, our results of operations could fall below the expectations of our investors and securities analysts, resulting in a decline in the trading price of our Class A common stock.
The preparation of financial statements in conformity with U.S. GAAP requires management to make estimates and assumptions that affect the amounts reported in our financial statements and accompanying notes. We base our estimates on historical experience and on various other assumptions that we believe to be reasonable under the circumstances, as discussed in the section titled “Management’s Discussion and Analysis of Financial Condition and Results of Operations” included elsewhere in this prospectus, the results of which form the basis for making judgments about the carrying values of assets, liabilities, equity, net revenues and expenses that are not readily apparent from other sources. Our results of operations may be adversely affected if our assumptions change or if actual circumstances differ from those in our assumptions, which could cause our results of operations to fall below our publicly announced guidance or the expectations of securities analysts and investors, resulting in a decline in the market price of our Class A common stock.
Our reported financial results may be negatively impacted by changes in U.S. GAAP.
U.S. GAAP is subject to interpretation by the Financial Accounting Standards Board, or FASB, the SEC and various bodies formed to promulgate and interpret appropriate accounting principles. FASB has in the past issued new or revised accounting standards that superseded existing guidance and significantly impacted the reporting of financial results. Any future change in U.S. GAAP principles or interpretations could also have a significant effect on our reported financial results and may even affect the reporting of transactions completed before the announcement or effectiveness of a change. It is difficult to predict the impact of future changes to accounting principles or our accounting policies, any of which could negatively affect our reported results of operations.
If we are unable to implement and maintain effective internal control over financial reporting, investors may lose confidence in the accuracy and completeness of our reported financial information and the market price of our Class A common stock may be negatively affected.
As a public company, we are required to maintain internal control over financial reporting and to report any material weaknesses in our internal controls. Section 404 of the Sarbanes-Oxley Act requires that, beginning with our second annual report after the completion of the IPO, we provide a management report on the effectiveness of our internal control over financial reporting. If we have a material weakness in our internal control over financial reporting, we may not detect errors on a timely basis and our financial statements may be materially misstated. We are implementing the process and documentation necessary to perform the evaluation needed to comply with Section 404 of the Sarbanes-Oxley Act. We may not be able to complete our evaluation, testing and any required remediation in a timely fashion.
During the evaluation and testing process, if we identify one or more material weaknesses in our internal control over financial reporting, our management will be unable to conclude that our internal control over financial reporting is effective. Moreover, when we are no longer an emerging growth company, our independent registered public accounting firm will be required to issue an attestation report on the effectiveness of our internal control over financial reporting. Even if our management concludes that our internal control over financial reporting is effective, our independent registered public accounting firm may conclude that there are material weaknesses with respect to our internal controls or the level at which our internal controls are documented, designed, implemented or reviewed. If we are unable to conclude that our internal control over financial reporting is effective, or, when we are no longer an emerging growth company, if our auditors were to express an adverse opinion on the effectiveness of our internal control over financial reporting because we had one or more material weaknesses, investors could lose confidence in the accuracy and completeness of our financial disclosures, which could cause the price of our Class A common stock to decline. Internal control deficiencies could also result in a restatement of our financial results in the future.
52
Table of Contents
In addition, we do not currently have an internal audit function. We will need to hire additional personnel to support our internal accounting and audit functions. If we are unable to hire additional personnel, our ability to report our results of operations on a timely and accurate basis could be impaired and we could suffer adverse regulatory consequences or violate NYSE listing standards. There could also be a negative reaction in the financial markets due to a loss of investor confidence in us and the reliability of our financial statements, which could have an adverse effect on our business, financial condition and results of operations.
Our disclosure controls and procedures may not prevent or detect all errors or acts of fraud.
We are subject to the periodic reporting requirements of the Exchange Act. We have designed our disclosure controls and procedures to provide reasonable assurance that information we must disclose in reports we file or submit under the Exchange Act is accumulated and communicated to management, and recorded, processed, summarized and reported within the time periods specified in the rules and forms of the SEC. We believe that any disclosure controls and procedures, no matter how well-conceived and operated, can provide only reasonable, not absolute, assurance that the objectives of the control system are met. These inherent limitations include the realities that judgments in decision-making can be faulty, and that breakdowns can occur because of simple error or mistake. Additionally, controls can be circumvented by the individual acts of some persons, by collusion of two or more people or by an unauthorized override of the controls. Accordingly, because of the inherent limitations in our control system, misstatements due to error or fraud may occur and not be detected.
We may require additional capital to support business growth, and this capital might not be available or may be available only by diluting existing stockholders.
We intend to continue making investments to support our business growth and may require additional funds to support this growth. Our future capital requirements will depend on many factors, including our rate of revenue growth, the timing and extent of international expansion efforts and other growth initiatives, the expansion of our marketing activities and overall economic conditions. To the extent that current and anticipated future sources of liquidity are insufficient to fund our future business activities and requirements, we may need to engage in equity or debt financings to secure additional funds. If we raise additional funds through further issuances of equity or convertible debt securities, our existing stockholders could suffer significant dilution, and any new equity securities we issue could have rights, preferences and privileges superior to those of holders of our Class A common stock. Any debt financing secured by us in the future could involve restrictive covenants relating to our capital raising activities and other financial and operational matters, which may make it more difficult for us to obtain additional capital and to pursue business opportunities. In addition, we may not be able to obtain additional financing on terms favorable to us, if at all. If we are unable to obtain adequate financing or financing on terms satisfactory to us, when we require it, our ability to continue to support our business growth and to respond to business challenges could be significantly limited, and our business and prospects could fail or be adversely affected.
53
Table of Contents
SPECIAL NOTE REGARDING FORWARD-LOOKING STATEMENTS
This prospectus contains forward-looking statements. All statements contained in this prospectus other than statements of historical fact, including statements regarding our future operating results and financial position, our business strategy and plans, market growth, and our objectives for future operations, are forward-looking statements. The words “believe,” “may,” “will,” “estimate,” “potential,” “continue,” “anticipate,” “intend,” “expect,” “could,” “would,” “project,” “plan”, “target,” and similar expressions are intended to identify forward-looking statements.
Forward-looking statements contained in this prospectus include, but are not limited to, statements about:
| • | our future financial performance, including our expectations regarding our net revenues, cost of goods sold, gross profit, operating expenses and other operating results, as well as our ability to achieve and maintain future profitability; |
| • | our business plan, beliefs and objectives for future operations; |
| • | our ability to continue to experience and effectively manage our rapid growth; |
| • | our market opportunity; |
| • | our international expansion plans; |
| • | our ability to promote our brand; |
| • | our ability to attract new customers and to retain and drive repeat purchases from our existing customers; |
| • | our ability to develop new products and bring them to market in a timely manner; |
| • | our expectations concerning relationships with third parties; |
| • | our ability to maintain, protect and enhance our intellectual property; |
| • | the effects of increased competition in our markets and our ability to compete effectively; and |
| • | economic and industry trends, projected growth or trend analysis. |
We caution you that the foregoing list may not contain all of the forward-looking statements made in this prospectus.
We have based these forward-looking statements largely on our current expectations and projections about future events and trends that we believe may affect our financial condition, results of operations, business strategy and short-term and long-term business operations and objectives. These forward-looking statements are subject to a number of risks, uncertainties and assumptions, including those described in the section titled “Risk Factors.” Moreover, we operate in a very competitive and rapidly changing environment. New risks emerge from time to time. It is not possible for our management to predict all risks, nor can we assess the impact of all factors on our business or the extent to which any factor, or combination of factors, may cause actual results to differ materially from those contained in any forward-looking statements we may make. In light of these risks, uncertainties and assumptions, the future events and trends discussed in this prospectus may not occur and actual results could differ materially and adversely from those anticipated or implied in the forward-looking statements.
You should not rely upon forward-looking statements as predictions of future events. The events and circumstances reflected in the forward-looking statements may not be achieved or occur. For example, statements that “we believe” and similar statements reflect our beliefs and opinions on the relevant subject. These statements are based upon information available to us as of the date of this prospectus, and while we believe such information forms a reasonable basis for such statements, such information may be limited or incomplete, and our statements should not be read to indicate that we have conducted an exhaustive inquiry into, or review of, all
54
Table of Contents
potentially available relevant information. These statements are inherently uncertain, and we cannot guarantee future results, performance or achievements. We undertake no obligation to update any of these forward-looking statements for any reason after the date of this prospectus or to conform these statements to actual results or revised expectations, except as required by law.
You should read this prospectus and the documents that we reference in this prospectus and have filed with the SEC as exhibits to the registration statement of which this prospectus is a part with the understanding that our actual future results, performance and events and circumstances may be materially different from what we expect. See “Where You Can Find Additional Information.”
55
Table of Contents
Unless otherwise indicated, information contained in this prospectus concerning our industry and the markets in which we operate, including our general expectations, market position, market opportunity and market size, is based on information from various sources, including our own estimates, as well as assumptions that we have made that are based on such data and other similar sources, and on our knowledge of the market for our products and services. This information involves a number of assumptions and limitations, and you are cautioned not to give undue weight to such estimates. While we believe the market position, market opportunity and market size information included in this prospectus is generally reliable, information of this sort is inherently imprecise. In addition, projections, assumptions and estimates of our future performance and the future performance of the industry in which we operate is necessarily subject to a high degree of uncertainty and risk due to a variety of factors, including those described in the section titled “Risk Factors” and elsewhere in this prospectus. These and other factors could cause results to differ materially from those expressed in the estimates made by the independent parties and by us.
Certain information in this prospectus is based on the following research study, which we commissioned: Frost & Sullivan, US and Global Total Addressable Market (TAM) Assessment for the Medical Apparel Market, April 2021. The Frost & Sullivan study included a quantitative and qualitative analysis of the industry through primary and secondary research, including a quantitative survey, encompassing 200 respondents in the United States, all of whom were either professionals or medical students over the age of 18, wear scrubs to work or at school and own or have purchased at least one set of scrubs in the past 12 months. The Frost & Sullivan study calculated the U.S. and global total addressable markets for the healthcare apparel industry by identifying the total number of individuals in the engaged population (which is defined as healthcare professionals and medical students) and multiplying that number by the estimated average spend of the engaged population on medical apparel (based on data aggregated from the survey study).
This prospectus also includes references to our Net Promoter Score, or NPS, which we use to measure our customers’ brand loyalty and satisfaction, and can range from -100 to +100 based on the question: “How likely are you to recommend FIGS to a friend or colleague?” Responses were collected from 0, Not Likely, to 10, Very Likely. Our NPS is based on approximately 11,500 customers who responded to the survey question, between January 1, 2021 and March 31, 2021, which was automatically generated via email 10 days after purchase, and randomly distributed across our markets. Our NPS was calculated by using the standard methodology of subtracting the percentage of customers who responded that they are not likely to recommend FIGS (6 or lower) from the percentage of customers who responded that they are very likely to recommend FIGS (9 or 10). The NPS gives no weight to customers who declined to answer the survey question. This method is substantially consistent with how businesses across our industry and other industries typically calculate their NPS.
Certain monetary amounts, percentages and other figures included elsewhere in this prospectus have been subject to rounding adjustments. Accordingly, figures shown as totals in certain tables or charts may not be the arithmetic aggregation of the figures that precede them, and figures expressed as percentages in the text may not total 100% or, as applicable, when aggregated may not be the arithmetic aggregation of the percentages that precede them.
56
Table of Contents
Table of Contents
We have never declared or paid cash dividends on our capital stock. We currently intend to retain all available funds and any future earnings for use in the operation of our business and do not anticipate paying any dividends on our capital stock in the foreseeable future. Any future determination to declare dividends will be made at the discretion of our board of directors and will depend on our financial condition, operating results, capital requirements, general business conditions and other factors that our board of directors may deem relevant. In addition, our existing credit agreement contains restrictions on our ability to pay cash dividends on our capital stock. See the section titled “Management’s Discussion and Analysis of Financial Condition and Results of Operations—Liquidity and Capital Resources” for additional information.
58
Table of Contents
The selected statements of operations data for the years ended December 31, 2019 and 2020 and the selected balance sheet data as of December 31, 2019 and 2020 have been derived from our audited financial statements included elsewhere in this prospectus. We derived our selected statement of operations data for the six months ended June 30, 2020 and 2021 and the balance sheet data as of June 30, 2021 from our unaudited financial statements included elsewhere in this prospectus. In our opinion, the unaudited interim financial statements have been prepared on a basis consistent with our audited financial statements and contain all adjustments, consisting only of normal and recurring adjustments, necessary for a fair presentation of such interim financial statements. You should read the financial data set forth below in conjunction with our financial statements and the accompanying notes and the information in “Management’s Discussion and Analysis of Financial Condition and Results of Operations” contained elsewhere in this prospectus. Our historical results are not necessarily indicative of the results to be expected for any other period in the future and our interim results are not necessarily indicative of the results that may be expected for the full fiscal year or any other future period.
| Years Ended December 31, | Six Months Ended June 30, |
|||||||||||||||
| 2019 | 2020 | 2020 | 2021 | |||||||||||||
| (in thousands, except share and per share data) | ||||||||||||||||
| Statements of Operations Data: |
||||||||||||||||
| Net revenues |
$ | 110,494 | $ | 263,112 | $ | 96,110 | $ | 188,196 | ||||||||
| Cost of goods sold |
31,158 | 72,888 | 26,578 | 51,683 | ||||||||||||
|
|
|
|
|
|
|
|
|
|||||||||
| Gross profit |
79,336 | 190,224 | 69,532 | 136,513 | ||||||||||||
| Operating expenses: |
||||||||||||||||
| Selling |
24,840 | 51,896 | 19,644 | 36,337 | ||||||||||||
| Marketing |
33,193 | 38,852 | 16,142 | 26,327 | ||||||||||||
| General and administrative(1) |
21,650 | 41,536 | 13,150 | 89,850 | ||||||||||||
|
|
|
|
|
|
|
|
|
|||||||||
| Total operating expenses |
79,683 | 132,284 | 48,936 | 152,514 | ||||||||||||
|
|
|
|
|
|
|
|
|
|||||||||
| Net (loss) income from operations |
(347 | ) | 57,940 | 20,596 | (16,001 | ) | ||||||||||
| Other income (loss), net |
459 | 136 | 116 | (69 | ) | |||||||||||
|
|
|
|
|
|
|
|
|
|||||||||
| Net income (loss) before income tax provision |
112 | 58,076 | 20,712 | (16,070 | ) | |||||||||||
| Provision for income taxes |
— | 8,318 | 2,403 | 13,036 | ||||||||||||
|
|
|
|
|
|
|
|
|
|||||||||
| Net income (loss) |
$ | 112 | $ | 49,758 | $ | 18,309 | $ | (29,106 | ) | |||||||
|
|
|
|
|
|
|
|
|
|||||||||
| Basic earnings (loss) per share |
$ | — | $ | 0.32 | $ | 0.12 | $ | (0.19 | ) | |||||||
|
|
|
|
|
|
|
|
|
|||||||||
| Diluted earnings (loss) per share |
$ | — | $ | 0.30 | $ | 0.12 | $ | (0.19 | ) | |||||||
|
|
|
|
|
|
|
|
|
|||||||||
| Weighted-average shares outstanding-basic(2) |
153,052,983 | 153,327,308 | 153,052,983 | 155,725,959 | ||||||||||||
|
|
|
|
|
|
|
|
|
|||||||||
| Weighted-average shares outstanding-diluted(2) |
153,624,013 | 163,331,348 | 153,661,856 | 155,725,959 | ||||||||||||
|
|
|
|
|
|
|
|
|
|||||||||
| (1) | Includes stock-based compensation expense of $0.2 million and $8.7 million for the years ended December 31, 2019 and 2020, respectively, and $0.3 million and $61.0 million for the six months ended June 30, 2020 and 2021, respectively. |
| (2) | See Note 13 to our audited financial statements and Note 11 to our unaudited interim financial statements included elsewhere in this prospectus for an explanation of the calculations of our basic and diluted earnings per share and the weighted-average number of shares used in the computation of the per share amounts. |
| As of December 31, | As of June 30, | |||||||||||
| 2019 | 2020 | 2021 | ||||||||||
| (in thousands) | ||||||||||||
| Balance Sheet Data: |
||||||||||||
| Cash and cash equivalents |
$ | 38,353 | $ | 58,133 | $ | 163,968 | ||||||
| Total assets |
62,598 | 133,855 | 254,254 | |||||||||
| Total liabilities |
23,784 | 36,178 | 50,539 | |||||||||
| Total stockholders’ equity |
38,814 | 97,677 | 203,715 | |||||||||
59
Table of Contents
Non-GAAP Financial Measures
| Years Ended December 31, |
Six Months Ended June 30, |
|||||||||||||||
| 2019 | 2020 | 2020 | 2021 | |||||||||||||
| (dollars in thousands) | ||||||||||||||||
| Adjusted EBITDA |
$ | 1,728 | $ | 69,094 | $ | 21,947 | $ | 51,141 | ||||||||
| Adjusted EBITDA Margin |
1.6 | % | 26.3 | % | 22.8 | % | 27.2 | % | ||||||||
| Net cash provided by operating activities |
6,531 | 21,748 | 24,309 | 32,741 | ||||||||||||
| Free cash flow |
1,770 | 19,486 | 23,229 | 31,718 | ||||||||||||
We report our financial results in accordance with U.S. GAAP. In addition to our U.S. GAAP financial results, we believe the non-GAAP financial measures, Adjusted EBITDA, Adjusted EBITDA margin and free cash flow, are useful in evaluating our performance. Our non-GAAP financial measures should not be considered in isolation from, or as substitutes for, financial information prepared in accordance with U.S. GAAP.
Adjusted EBITDA and Adjusted EBITDA Margin
We calculate Adjusted EBITDA as net income adjusted to exclude: other income, net; gain/loss on disposal of assets; provision for income taxes; depreciation and amortization expense; stock-based compensation expense; transaction costs; and expenses related to non-ordinary course disputes. Adjusted EBITDA Margin is calculated by dividing Adjusted EBITDA by net revenues.
Management believes that excluding certain non-cash items and items that may vary substantially in frequency and magnitude period-to-period from net income provides useful supplemental measures that assist in evaluating our ability to generate earnings, provide consistency and comparability with our past financial performance and facilitate period-to-period comparisons of our core operating results as well as the results of our peer companies.
There are several limitations related to the use of Adjusted EBITDA and Adjusted EBITDA Margin as analytical tools, including:
| • | other companies may calculate Adjusted EBITDA and Adjusted EBITDA Margin differently, which reduces their usefulness as a comparative measure; |
| • | Adjusted EBITDA and Adjusted EBITDA Margin do not reflect other income (loss), net; |
| • | Adjusted EBITDA and Adjusted EBITDA Margin do not reflect any gain or loss on disposal of assets; |
| • | Adjusted EBITDA and Adjusted EBITDA Margin do not reflect our tax provision, which reduces cash available to us; |
| • | Adjusted EBITDA and Adjusted EBITDA Margin do not reflect recurring, non-cash expenses of depreciation and amortization of property and equipment and, although these are non-cash expenses, the assets being depreciated and amortized may have to be replaced in the future; |
| • | Adjusted EBITDA and Adjusted EBITDA Margin do not reflect the impact of stock-based compensation expense; |
| • | Adjusted EBITDA and Adjusted EBITDA Margin do not reflect transaction costs; and |
| • | Adjusted EBITDA and Adjusted EBITDA Margin do not reflect expenses related to non-ordinary course disputes. |
60
Table of Contents
The following table reflects a reconciliation of Adjusted EBITDA to net income, the most directly comparable financial measure prepared in accordance with U.S. GAAP:
| Years Ended December 31, |
Six Months Ended June 30, |
|||||||||||||||
| 2019 | 2020 | 2020 | 2021 | |||||||||||||
| (dollars in thousands) | ||||||||||||||||
| Net income (loss) |
$ | 112 | $ | 49,758 | $ | 18,309 | $ | (29,106 | ) | |||||||
| Add (deduct): |
||||||||||||||||
| Other income (loss), net |
(459 | ) | (136 | ) | (116 | ) | 69 | |||||||||
| Gain/loss on disposal |
120 | 2 | — | — | ||||||||||||
| Provision for income taxes |
— | 8,318 | 2,403 | 13,036 | ||||||||||||
| Depreciation and amortization expense(1) |
517 | 946 | 399 | 656 | ||||||||||||
| Stock-based compensation expense(2) |
179 | 8,713 | 287 | 61,731 | ||||||||||||
| Transaction costs |
— | 296 | — | 339 | ||||||||||||
| Expenses related to non-ordinary course disputes(3) |
1,259 | 1,197 | 665 | 4,416 | ||||||||||||
|
|
|
|
|
|
|
|
|
|||||||||
| Adjusted EBITDA |
$ | 1,728 | $ | 69,094 | $ | 21,947 | $ | 51,141 | ||||||||
|
|
|
|
|
|
|
|
|
|||||||||
| Adjusted EBITDA Margin |
1.6 | % | 26.3 | % | 22.8 | % | 27.2 | % | ||||||||
| (1) | Excludes amortization of debt issuance costs included in “Other income (loss), net.” |
| (2) | Includes stock-based compensation expense and payroll taxes related to equity award activity. |
| (3) | Represents legal fees incurred in connection with the litigation claims described in the section titled “Business—Legal Proceedings.” |
Free Cash Flow
We calculate free cash flow as net cash (used in) provided by operating activities reduced by capital expenditures, including purchases of property and equipment and capitalized software development costs. Management believes free cash flow is a useful measure of liquidity and an additional basis for assessing our ability to generate cash. There are limitations related to the use of free cash flow as an analytical tool, including: other companies may calculate free cash flow differently, which reduces its usefulness as a comparative measure; and free cash flow does reflect our future contractual commitments and it does not represent the total residual cash flow for a given period.
The following table presents a reconciliation of free cash flow to net cash (used in) provided by operating activities, the most directly comparable financial measure prepared in accordance with U.S. GAAP:
| Years Ended December 31, |
Six Months Ended June 30, |
|||||||||||||||
| 2019 | 2020 | 2020 | 2021 | |||||||||||||
| (in thousands) | ||||||||||||||||
| Net cash provided by operating activities |
$ | 6,531 | $ | 21,748 | $ | 24,309 | $ | 32,741 | ||||||||
| Less: capital expenditures |
(4,761 | ) | (2,262 | ) | (1,080 | ) | (1,023 | ) | ||||||||
|
|
|
|
|
|
|
|
|
|||||||||
| Free cash flow |
$ | 1,770 | $ | 19,486 | $ | 23,229 | $ | 31,718 | ||||||||
|
|
|
|
|
|
|
|
|
|||||||||
61
Table of Contents
MANAGEMENT’S DISCUSSION AND ANALYSIS OF
FINANCIAL CONDITION AND RESULTS OF OPERATIONS
The following discussion and analysis of our financial condition and results of operations should be read in conjunction with the section titled “Selected Financial Data” and the financial statements and related notes included elsewhere in this prospectus. Some of the information contained in this discussion and analysis, including information with respect to our plans and strategy for our business, includes forward-looking statements that involve risks and uncertainties. You should review the sections titled “Special Note Regarding Forward-Looking Statements” and “Risk Factors” for a discussion of forward-looking statements and important factors that could cause actual results to differ materially from the results described in or implied by the forward-looking statements contained in the following discussion and analysis.
Overview
Our mission is to celebrate, empower and serve those who serve others.
We are a founder-led, direct-to-consumer healthcare apparel and lifestyle brand that seeks to celebrate, empower and serve current and future generations of healthcare professionals. We are committed to helping this growing, global community of professionals, whom we refer to as Awesome Humans, look, feel and perform at their best—24/7, 365 days a year. We create technically advanced apparel and products that feature an unmatched combination of comfort, durability, function and style, all at an affordable price. In doing so, we have redefined what scrubs are—giving rise to our tag-line: why wear scrubs, when you can #wearFIGS?
We have revolutionized the large and fragmented healthcare apparel market. We branded a previously unbranded industry and de-commoditized a previously commoditized product—elevating scrubs and creating premium products for healthcare professionals. Most importantly, we built a community and lifestyle around a profession. As a result, we have become the industry’s category-defining healthcare apparel and lifestyle brand.
We generate revenue by selling technically advanced apparel for the modern healthcare professional. Our offerings include scrubwear, as well as lifestyle apparel and other non-scrub offerings, such as lab coats, underscrubs, outerwear, activewear, loungewear, compression socks, footwear, masks and face shields. We design all of our products in-house, leverage third-party suppliers and manufacturers to produce our raw materials and finished products, and utilize shallow initial buys and data-driven repurchasing decisions to test new products. We directly and actively manage every step of our product development and production process to ensure that our extremely high quality standards are met. We have a highly efficient merchandising model. Due to the non-discretionary, replenishment nature of healthcare apparel, we maintain low inventory risk driven by a high volume of repeat purchases and a focus on our core scrubs offerings. In 2020, we generated 82% of net revenues from our 13 core scrubwear styles, 5% of net revenues from limited edition scrubwear styles, and the remaining 13% from our lifestyle apparel and other non-scrub offerings. We primarily market and sell our products through our digital platform, consisting of our website and mobile app, to a rapidly growing community of loyal customers.
At June 30, 2021, we had approximately 1.6 million active customers. Our customers come to us through word of mouth referrals, as well as through our data-driven brand and performance marketing efforts. Our customers primarily come to us through word of mouth referrals, as well as through our data-driven brand and performance marketing efforts. As our brand awareness has grown and our data analytics capabilities have evolved, our marketing efficiency has improved. Between 2018 and 2020, our customer acquisition costs decreased by 61%. Our new customers spend on average approximately $215 with us during their first 12 months, which has remained consistent over the past three years. We are profitable on a first purchase basis, and our first order contribution profit to customer acquisition cost, or CAC, has increased with each annual customer cohort since 2018, rising to 1.3x in 2020. See the sections titled “—Key Operational and Business Metrics” for a definition of active customers and “—Factors Affecting Our Performance” for a definition of contribution profit and CAC.
62
Table of Contents
We have demonstrated rapid growth and strong profitability and cash flow generation. In 2020, we achieved the following results compared to 2019:
| • | Expanded our community of active customers by 118% from 0.6 million to approximately 1.3 million; |
| • | Increased net revenues from $110.5 million to $263.1 million, representing 138% year-over-year growth; |
| • | Increased gross margin by 50 basis points from 71.8% to 72.3%; |
| • | Improved net operating (loss) income from $(0.3) million to $57.9 million; |
| • | Increased Adjusted EBITDA from $1.7 million to $69.1 million, representing an Adjusted EBITDA margin of 26.3% in 2020; |
| • | Increased cash flow from operations from $6.5 million to $21.7 million; and |
| • | Increased free cash flow from $1.8 million to $19.5 million. |
In the six months ended June 30, 2021, we had the following results compared to the six months ended June 30, 2020:
| • | Expanded our community of active customers by 79.2% from approximately 0.9 million to approximately 1.6 million; |
| • | Increased net revenues from $96.1 million to $188.2 million, representing 95.8% year-over-year growth; |
| • | Increased gross margin by 0.2 percentage points from 72.3% to 72.5%; |
| • | Net operating income (loss) decreased from $20.6 million to $(16.0) million; |
| • | Increased Adjusted EBITDA from $21.9 million to $51.1 million, representing an Adjusted EBITDA margin of 27.2% in 2021; |
| • | Increased cash flow from operations from $24.3 million to $32.7 million; and |
| • | Increased free cash flow from $23.2 million to $31.7 million. |
See the section titled “Selected Financial Data—Non-GAAP Financial Measures” for information regarding Adjusted EBITDA, Adjusted EBITDA margin and free cash flow, including a reconciliation to the most directly comparable financial measures prepared in accordance with U.S. GAAP.
63
Table of Contents
Key Operational and Business Metrics
In addition to the measures presented in our financial statements, we use the following key operational and business metrics to evaluate our business, measure our performance, develop financial forecasts and make strategic decisions.
| Years Ended December 31, |
Six Months Ended June 30, |
|||||||||||||||
| 2019 | 2020 | 2020 | 2021 | |||||||||||||
| Active customers (in thousands) |
596 | 1,300 | 905 | 1,622 | ||||||||||||
| Average order value |
$ | 95 | $ | 94 | $ | 89 | $ | 101 | ||||||||
| Adjusted EBITDA (in thousands)(1) |
$ | 1,728 | $ | 69,094 | $ | 21,947 | $ | 51,141 | ||||||||
| Adjusted EBITDA Margin(1) |
1.6 | % | 26.3 | % | 22.8 | % | 27.2 | % | ||||||||
| Free cash flow (in thousands)(1) |
$ | 1,770 | $ | 19,486 | $ | 23,229 | $ | 31,718 | ||||||||
| (1) | See the section titled Selected Financial Data—Non-GAAP Financial Measures” for information regarding Adjusted EBITDA, Adjusted EBITDA Margin and free cash flow, including a reconciliation to the most directly comparable financial measure prepared in accordance with U.S. GAAP. |
Active Customers
The number of active customers is an important indicator of our growth as it reflects the reach of our digital platform, our brand awareness and overall value proposition. We define an active customer as a unique customer account that has made at least one purchase in the preceding 12-month period. In any particular period, we determine our number of active customers by counting the total number of customers who have made at least one purchase in the preceding 12-month period, measured from the last date of such period.
Average Order Value
We define average order value as the sum of the total net revenues in a given period divided by the total orders placed in that period. Total orders are the summation of all completed individual purchase transactions in a given period. We believe our relatively high average order value demonstrates the premium nature of our product. Average order value may fluctuate as we expand into and increase our presence in additional product categories and price points as well as expand internationally.
Adjusted EBITDA and Adjusted EBITDA Margin
Adjusted EBITDA and Adjusted EBITDA Margin are key performance measures that our management uses to assess our operating performance. We calculate Adjusted EBITDA as net income adjusted to exclude: other income, net; gain/loss on disposal of assets; provision for income taxes; depreciation and amortization expense; stock-based compensation expense; transaction costs; and legal expenses related to non-ordinary course disputes. Adjusted EBITDA Margin is calculated by dividing Adjusted EBITDA by net revenues.
Free Cash Flow
Free cash flow is a key performance measure that our management uses to assess our ability to generate cash. We calculate free cash flow as cash flows (used in) provided by operating activities reduced by capital expenditures, including purchases of property and equipment and capitalized software development costs.
Factors Affecting Our Performance
Brand Awareness and Loyalty
Our ability to promote and maintain brand awareness and loyalty is critical to our success. We have a significant opportunity to continue to grow our brand awareness and loyalty through word of mouth, brand marketing and performance marketing. We have made significant investments to strengthen the FIGS brand
64
Table of Contents
through our marketing strategy, which includes brand marketing campaigns across platforms, including email, digital, display, site, direct-mail, commercials, social media and Ambassadors, as well as performance marketing efforts, including retargeting, paid search and product listing advertisements, paid social media advertisements, search engine optimization, personalized email and mobile push notifications through our app. We plan to continue to invest in our brand and performance marketing to help drive our future growth.
Net Revenues per Active Customer
We believe the growth in our net revenues per active customer demonstrates our increasing value proposition for our customer base. We calculate net revenues per active customer as the total net revenues for a specified time period divided by the number of active customers during that same time period. Our historical growth in net revenues per active customer is presented in the graph below. Through our differentiated core products, limited edition color and style releases and lifestyle apparel and other non-scrub products, we have repeatedly drawn customers back to our digital platform and increased our net revenues per active customer. As we continue to expand our products to fully outfit the medical professional, we believe we have a significant opportunity to continue to expand our share of both the uniform and lifestyle wardrobe of our customers and increase our net revenues per active customer over time. Our future growth will depend in part on our ability to continue to increase our net revenues per active customer.
Net Revenues per Active Customer
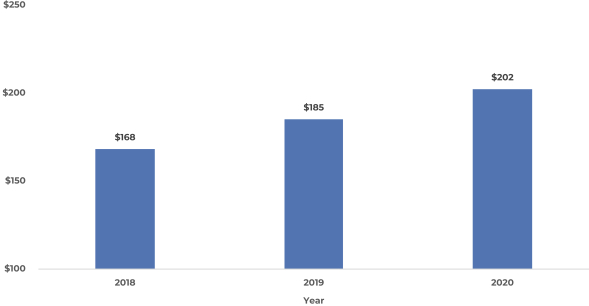
Customer Acquisition Cost
Our business performance depends in part on our continued ability to cost-effectively acquire new customers. We define customer acquisition cost, or CAC, as performance and brand marketing expense attributable to both new customer acquisition and repeat customer retention in a period divided by the customers acquired during that same period. Our strategic investments in performance marketing, such as retargeting, paid search and product listing advertisements, paid social media advertisements, search engine optimization, personalized email and mobile push notifications through our app, compounded with strong brand awareness driven largely through word of mouth, have led to significant improvements in CAC, which declined 61% from 2018 to 2020, as shown in the graph below. In addition, in 2020, we successfully increased our marketing efficiency such that we achieved 1.3x our CAC on a customer’s first purchase contribution profit. Contribution profit is defined as gross profit, less any shipping variable costs, fulfillment variable costs, packaging variable costs and merchant processing fees.
65
Table of Contents
Customer Acquisition Cost
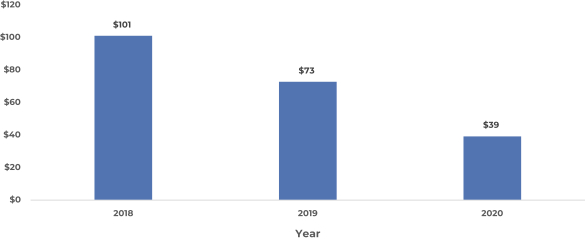
Customer Retention and Engagement
Our continued success depends in part on our ability to retain, and drive repeat purchases from, our existing customers. We monitor retention across our entire customer base. Our goal is to attract and convert visitors into active customers and foster relationships that drive repeat purchases. As of December 31, 2020, we had approximately 1.3 million active customers, up from 596,000 customers as of December 31, 2019. Approximately 62% of our net revenues in 2020 came from repeat customers, which we define as customers who have made a prior purchase with us in any period. Over the last four years, we have consistently increased the percentage of net revenues from repeat customers while also continuing to increase the number of new customers acquired, as shown in the graph below. These newly acquired customers frequently make one or more repeat purchase in the same year, which is supplemented by the embedded growth from prior-year cohorts’ customers who continue to purchase from us.
Net Revenues from New Customers and Repeat Customers
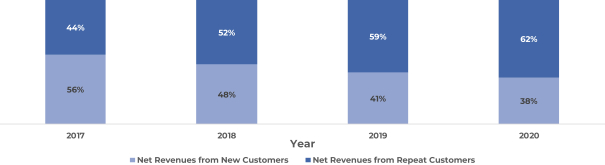
The increasing share of our net revenues from customers who have made a previous purchase with us in a prior year reflects our customer loyalty and the net revenues retention behavior we see in our cohorts. We believe the increasing contribution from repeat customers is reflective of our ability to engage and retain our customers through our differentiated product offerings, community-driven brand and customized customer experience. Cohort net revenues retention is calculated as net revenues attributable to a given customer cohort as a percentage of total net revenues attributable to the same customer cohort during the prior year. On a weighted-average net revenues basis across the 2017, 2018 and 2019 cohorts, we retained 60% of the cohorts’ net revenues
66
Table of Contents
between the year of initial purchase to the following first full year. On a weighted-average net revenues basis across the 2017 and 2018 cohorts, we retained 94% of the cohorts’ net revenues from the first full year to the second full year. In 2020, we retained 75% of the 2019 and prior cohorts’ net revenues, including 100% of the 2019 net revenues generated by 2018 and prior cohorts. This cohort behavior demonstrates, as depicted in the graph below, our ability to not only retain customers, but also to increase our customers’ spend as they place orders more frequently.
Cohort Net Revenue Retention
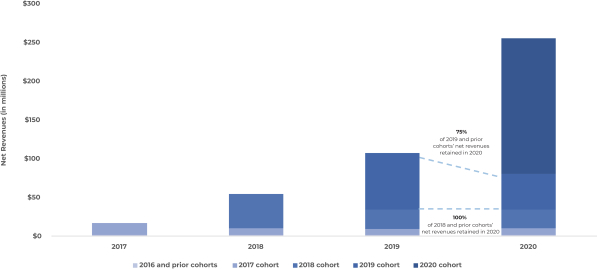
Impact of COVID-19
The COVID-19 pandemic has magnified the indispensability of healthcare professionals. Due to the pandemic, more healthcare professionals are also choosing to wear medical apparel, and a greater number of hospitals, medical offices and clinics are requiring staff to wear scrubs and other medical apparel while at work. In addition, the ability to purchase through eCommerce channels has become increasingly important to consumers during the pandemic. We experienced increased demand in 2020 and in the six months ended June 30, 2021, while certain of our ocean freight providers, as well as some of our suppliers and manufacturers, particularly those operating in Vietnam, are experiencing delays, in the past have experienced shutdowns, and could experience delays and shutdowns again in the future due to the COVID-19 pandemic. In order to manage the impact of these disruptions and meet our customers’ expectations, we have from time to time used faster but more expensive air freight during 2020 and in the six months ended June 30, 2021, which increased our cost of goods sold, and we may from time to time need to continue to use more expensive air freight in the future. COVID-19 may continue to adversely affect workforces, economies and financial markets globally, potentially leading to an economic downturn and a reduction in consumer spending or an inability for our suppliers, vendors or other parties with whom we do business to meet their contractual obligations, which could negatively impact our business and results of operations. We believe the COVID-19 pandemic has accelerated the awareness of the FIGS brand and a shift in purchasing decisions that will continue to drive future growth; however, there can be no assurance that these trends will continue and the ultimate impact of the COVID-19 pandemic remains uncertain.
Initial Public Offering
On June 1, 2021, we completed our IPO by issuing 4,636,364 shares of our Class A common stock at a price to the public of $22.00 per share, resulting in net proceeds to us of $95.1 million, after deducting the underwriting discount and commissions of $6.1 million and deferred offering expenses of $0.8 million, net of reimbursements. We incurred a total of $8.7 million of expenses, before reimbursements, in connection with the IPO.
67
Table of Contents
Components of Results of Operations
Net Revenues
Net revenues consist of sales of healthcare apparel, footwear and other products primarily through our digital platform. We recognize product sales at the time control is transferred to the customer, which is when the product is shipped to the customer. Net revenues represent the sale of these items and shipping revenue, net of estimated returns and discounts. Net revenues are primarily driven by the growth in the number of active customers, the frequency with which customers purchase and the average order value.
Cost of Goods Sold
Cost of goods sold consists principally of the cost of purchased merchandise and includes import duties and other taxes, freight-in, defective merchandise returned by customers, inventory write-offs and other miscellaneous shrinkage. Our cost of goods sold has and may continue to fluctuate with the cost of the raw materials used in our products. As we continue to scale, we expect cost of goods sold to minimally decrease as a percentage of net revenues.
Gross Profit and Gross Margin
We define gross profit as net revenues less cost of goods sold. Gross margin is gross profit expressed as a percentage of net revenues. Our gross margin has fluctuated historically and may continue to fluctuate from period to period based on a number of factors, including the timing and mix of the product offerings we sell as well as our ability to reduce costs, in any given period.
Operating Expenses
Our operating expenses consist of selling, marketing and general and administrative expenses.
Selling
Selling expenses represent the costs incurred for fulfillment expenses and selling and distribution expenses. Fulfillment expenses consist of costs incurred in operating and staffing a third-party fulfillment center, including costs associated with inspecting and warehousing inventories and picking, packaging and preparing customer orders for shipment. Selling and distribution expenses consist primarily of shipping and other transportation costs incurred delivering merchandise to customers and from customers returning merchandise, merchant processing fees and packaging. We expect fulfillment, selling and distribution costs to increase in absolute dollars as we increase our net revenues.
Marketing
Marketing expenses consist primarily of online performance marketing costs, such as retargeting, paid search and product listing advertisements, paid social media advertisements, search engine optimization, personalized email and mobile push notifications through our app. Marketing expenses also include our spend on brand marketing channels, including billboards, podcasts, commercials, photo and video shoot development, expenses associated with our Ambassador Program and other forms of online and offline marketing. We expect our marketing expenses to increase in absolute dollars as we continue to grow our business.
General and Administrative
General and administrative expenses consist primarily of employee-related costs, including salaries, bonuses, benefits, stock-based compensation, other related costs and other general overhead, including certain third-party consulting and contractor expenses, certain facilities costs, software expenses, legal expenses and recruiting fees. We expect our general and administrative expenses to increase in absolute dollars as we continue
68
Table of Contents
to grow our business. We also anticipate that we will incur significant additional legal, accounting, insurance, investor relations and other expenses to support our transition to and operations as a public company, including costs associated with our compliance with the Sarbanes-Oxley Act.
Other Income, Net
Other income, net consists of interest income or expense associated with our debt financing arrangements, amortization of debt issuance costs and interest income earned on investments, as well as gain or loss on foreign currency, primarily driven by payment to vendors for amounts not denominated in U.S. dollars.
Provision for Income Taxes
Our provision for income taxes consists of an estimate of federal and state income taxes based on enacted federal and state tax rates, as adjusted for allowable credits, deductions and uncertain tax positions.
Results of Operations
The following table sets forth our results of operations for the periods presented:
| Years Ended December 31, | Six Months Ended June 30, | |||||||||||||||
| 2019 | 2020 | 2020 | 2021 | |||||||||||||
| (in thousands) | ||||||||||||||||
| Statements of Operations Data: |
||||||||||||||||
| Net revenues |
$ | 110,494 | $ | 263,112 | $ | 96,110 | $ | 188,196 | ||||||||
| Cost of goods sold |
31,158 | 72,888 | 26,578 | 51,683 | ||||||||||||
|
|
|
|
|
|
|
|
|
|||||||||
| Gross profit |
79,336 | 190,224 | 69,532 | 136,513 | ||||||||||||
| Operating expenses: |
||||||||||||||||
| Selling |
24,840 | 51,896 | 19,644 | 36,337 | ||||||||||||
| Marketing |
33,193 | 38,852 | 16,142 | 26,327 | ||||||||||||
| General and administrative(1) |
21,650 | 41,536 | 13,150 | 89,850 | ||||||||||||
|
|
|
|
|
|
|
|
|
|||||||||
| Total operating expenses |
79,683 | 132,284 | 48,936 | 152,514 | ||||||||||||
|
|
|
|
|
|
|
|
|
|||||||||
| Net (loss) income from operations |
(347 | ) | 57,940 | 20,596 | (16,001 | ) | ||||||||||
| Other income (loss), net |
459 | 136 | 116 | (69 | ) | |||||||||||
|
|
|
|
|
|
|
|
|
|||||||||
| Net income (loss) before income tax provision |
112 | 58,076 | 20,712 | (16,070 | ) | |||||||||||
| Provision for income taxes |
— | 8,318 | 2,403 | 13,036 | ||||||||||||
|
|
|
|
|
|
|
|
|
|||||||||
| Net income (loss) |
$ | 112 | $ | 49,758 | $ | 18,309 | $ | (29,106 | ) | |||||||
|
|
|
|
|
|
|
|
|
|||||||||
| (1) | Includes stock-based compensation expense of $0.2 million and $8.7 million for the years ended December 31, 2019 and 2020, respectively, and $0.3 million and $61.0 million for the six months ended June 30, 2020 and 2021, respectively. |
69
Table of Contents
The following table sets forth our results of operations as a percentage of net revenues for the periods presented:
| Years Ended December 31, | Six Months Ended June 30, | |||||||||||||||
| 2019 | 2020 | 2020 | 2021 | |||||||||||||
| Statements of Operations Data, as a percentage of net revenues: |
||||||||||||||||
| Net revenues |
100.0 | % | 100.0 | % | 100.0 | % | 100.0 | % | ||||||||
| Cost of goods sold |
28.2 | 27.7 | 27.7 | 27.5 | ||||||||||||
|
|
|
|
|
|
|
|
|
|||||||||
| Gross profit |
71.8 | 72.3 | 72.3 | 72.5 | ||||||||||||
| Operating expenses: |
||||||||||||||||
| Selling |
22.5 | 19.7 | 20.4 | 19.3 | ||||||||||||
| Marketing |
30.0 | 14.8 | 16.8 | 14.0 | ||||||||||||
| General and administrative |
19.6 | 15.8 | 13.7 | 47.7 | ||||||||||||
|
|
|
|
|
|
|
|
|
|||||||||
| Total operating expenses |
72.1 | 50.3 | 50.9 | 81.0 | ||||||||||||
|
|
|
|
|
|
|
|
|
|||||||||
| Net (loss) income from operations |
(0.3 | ) | 22.0 | 21.4 | (8.5 | ) | ||||||||||
| Other income (loss), net |
0.4 | 0.1 | 0.1 | (0.0 | ) | |||||||||||
|
|
|
|
|
|
|
|
|
|||||||||
| Net income (loss) before income tax provision |
0.1 | 22.1 | 21.6 | (8.5 | ) | |||||||||||
| Provision for income taxes |
— | 3.2 | 2.5 | 6.9 | ||||||||||||
|
|
|
|
|
|
|
|
|
|||||||||
| Net income (loss) |
0.1 | % | 18.9 | % | 19.1 | % | (15.5 | )% | ||||||||
|
|
|
|
|
|
|
|
|
|||||||||
Comparison of Years Ended December 31, 2019 and 2020
Net Revenues
| Years Ended December 31, | ||||||||||||
| 2019 | 2020 | % Change | ||||||||||
| (in thousands) | ||||||||||||
| Net revenues |
$ | 110,494 | $ | 263,112 | 138.1 | % | ||||||
Net revenues increased by $152.6 million, or 138.1%, for 2020 compared to 2019. The increase in net revenue was primarily driven by new customer acquisition coupled with strong retention of existing customers. During 2020, we observed increased customer traffic on our digital platform and improved conversion rates resulting in increased orders, partially offset by a slight decrease in average order value from $95 in 2019 to $94 in 2020 as a result of the launch of lower priced items, such as masks.
Cost of Goods Sold, Gross Profit and Gross Margin
| Years Ended December 31, | ||||||||||||
| 2019 | 2020 | % Change | ||||||||||
| (in thousands) | ||||||||||||
| Cost of goods sold |
$ | 31,158 | $ | 72,888 | 133.9 | % | ||||||
| Gross profit |
79,336 | 190,224 | 139.8 | |||||||||
| Gross margin |
71.8 | % | 72.3 | % | 0.5 | % | ||||||
Cost of goods sold increased by $41.7 million, or 133.9%, in 2020 compared to 2019. This increase was primarily driven by an increase in total number of orders in 2020 as compared to 2019.
Gross profit, calculated as net revenues less cost of goods sold, increased by $110.9 million, or 139.8%, in 2020 compared to 2019, primarily due to the significant increase in total number of orders in 2020 as compared to 2019.
70
Table of Contents
Gross margin, expressed as a percentage and calculated as gross profit divided by net revenue, increased by 50 basis points in 2020 compared to 2019. The increase in gross margin was primarily the result of lower product costs and lower discounts. These gross margin improvements were partially offset by an increase in freight-in due to the utilization of more expensive air freight to meet increased customer demand. Air freight is more expensive on a per unit basis compared to our primary method of freight-in via ocean shipping.
Operating Expenses
| Years Ended December 31, | ||||||||||||
| 2019 | 2020 | % Change | ||||||||||
| (in thousands) | ||||||||||||
| Operating expenses: |
||||||||||||
| Selling |
$ | 24,840 | $ | 51,896 | 108.9 | % | ||||||
| Marketing |
33,193 | 38,852 | 17.0 | |||||||||
| General and administrative |
21,650 | 41,536 | 91.9 | |||||||||
| Total operating expenses |
$ | 79,683 | $ | 132,284 | 66.0 | % | ||||||
Operating expenses increased by $52.6 million, or 66.0%, in 2020 compared to 2019 and, as a percentage of net revenues, decreased by 21.8%.
Selling expense increased by $27.1 million, or 108.9%, in 2020 compared to 2019 and, as a percentage of net revenues, decreased by 2.8%. The decrease in selling expense as a percentage of net revenues was due primarily to improvements in shipping and fulfillment expenses as revenues increased.
Marketing expense increased by $5.7 million, or 17.0%, in 2020 compared to 2019 and, as a percentage of net revenues, decreased by 15.3%. The decrease in marketing expense as a percentage of net revenues was due primarily to more effective marketing strategies, particularly in our performance marketing expenses.
General and administrative expense increased by $19.9 million, or 91.9%, in 2020 compared to 2019 and, as a percentage of net revenues, decreased by 3.8%. The decrease in general and administrative expense as a percentage of net revenues was primarily due to revenue growing at a faster rate than our personnel expenses, including wages and benefits, as well as a decrease in other costs as a percentage of net revenues, including legal fees, professional fees and other corporate expenses.
Other Income, Net
| Years Ended December 31, | ||||||||||||
| 2019 | 2020 | % Change | ||||||||||
| (in thousands) | ||||||||||||
| Other income, net |
$ | 459 | $ | 136 | (70.4 | )% | ||||||
Other income, net decreased by $0.3 million, or 70.4%, in 2020 compared to 2019, primarily due to a decrease in interest income driven by a decrease in interest rates, partially offset by an increase in our average cash balance.
Provision for Income Taxes
| Years Ended December 31, | ||||||||||||
| 2019 | 2020 | % Change | ||||||||||
| (in thousands) | ||||||||||||
| Provision for income taxes |
— | $ | 8,318 | — | ||||||||
Provision for income taxes increased by $8.3 million in 2020 compared to 2019 due to an increase in net income before income tax provision.
71
Table of Contents
Comparison of Six Months Ended June 30, 2020 and 2021
Net Revenues
| Six Months Ended June 30, |
||||||||||||
| 2020 | 2021 | % Change | ||||||||||
| (in thousands) | ||||||||||||
| Net revenues |
$ | 96,110 | $ | 188,196 | 95.8 | % | ||||||
Net revenues increased by $92.1 million, or 95.8%, for the six months ended June 30, 2021, compared to the same period last year. The increase in net revenue was primarily driven by new customer acquisition coupled with strong retention of existing customers, which drove increased sales of our products. Compared to the same period last year, we observed increased customer traffic on our digital platform as well as an increase in average order value from $89 to $101 which contributed to the increase in net revenues. Average order value increased as a result of a sales mix shift away from lower priced products to higher priced scrubwear and an increase in units per transaction.
Cost of Goods Sold, Gross Profit and Gross Margin
| Six Months Ended June 30, |
||||||||||||
| 2020 | 2021 | % Change | ||||||||||
| (in thousands) | ||||||||||||
| Cost of goods sold |
$ | 26,578 | $ | 51,683 | 94.5 | % | ||||||
| Gross profit |
69,532 | 136,513 | 96.3 | % | ||||||||
| Gross margin |
72.3 | % | 72.5 | % | 0.2 | % | ||||||
Cost of goods sold increased by $25.1 million, or 94.5%, for the six months ended June 30, 2021, compared to the same period last year. This increase was primarily driven by an increase in the total number of orders in the first half of 2021 as compared to the same period in 2020.
Gross profit increased by $67.0 million, or 96.3%, for the six months ended June 30, 2021, compared to the same period last year, primarily due to the increase in the total number of orders.
Gross margin increased by 0.2 percentage points for the six months ended June 30, 2021, compared to the same period last year. The increase in gross margin was primarily related to a sales mix shift away from lower margin products to higher margin scrubwear, offset by an increase in freight-in due to the utilization of more expensive air freight to meet increased customer demand.
Operating Expenses
| Six Months Ended June 30, |
||||||||||||
| 2020 | 2021 | % Change | ||||||||||
| (in thousands) | ||||||||||||
| Selling |
$ | 19,644 | $ | 36,337 | 85.0 | % | ||||||
| Marketing |
16,142 | 26,327 | 63.1 | % | ||||||||
| General and administrative |
13,150 | 89,850 | 583.3 | % | ||||||||
| Total operating expenses |
$ | 48,936 | $ | 152,514 | 211.7 | % | ||||||
Operating expenses increased by $103.6 million, or 211.7%, for the six months ended June 30, 2021, compared to the same period last year and, as a percentage of net revenues, increased by 30.1%.
72
Table of Contents
Selling expense increased by $16.7 million, or 85.0%, for the six months ended June 30, 2021, compared to the same period last year and, as a percentage of net revenues, decreased by 1.1%. The decrease in selling expense as a percentage of net revenues was primarily due to leverage in shipping as a result of an increase in average order value.
Marketing expense increased by $10.2 million, or 63.1%, for the six months ended June 30, 2021, compared to the same period last year and, as a percentage of net revenues, decreased by 2.8%. The decrease in marketing expense as a percentage of net revenues was primarily due to more effective marketing strategies, particularly increased efficiency of our performance marketing expenses.
General and administrative expense increased by $76.7 million, or 583.3%, for the six months ended June 30, 2021, compared to the same period last year and, as a percentage of net revenues, increased by 34.1%. The increase in general and administrative expense as a percentage of net revenues was primarily due to an increase in stock-based compensation expense in connection with the IPO.
Other Income (Loss), Net
| Six Months Ended June 30, |
||||||||||||
| 2020 | 2021 | % Change | ||||||||||
| (in thousands) | ||||||||||||
| Other income (loss), net |
$ | 116 | $ | (69 | ) | (159.5 | )% | |||||
Other income (loss), net decreased by $0.2 million, or 159.5%, for the six months ended June 30, 2021, compared to the same period last year, primarily due to an increase in interest expense from our revolving credit facility commitment fee, as well as a decrease in interest income driven by a decrease in interest rates, partially offset by an increase in our average cash balance.
Provision for Income Taxes
| Six Months Ended June 30, |
||||||||||||
| 2020 | 2021 | % Change | ||||||||||
| (in thousands) | ||||||||||||
| Provision for income taxes |
2,403 | $ | 13,036 | 442.5 | % | |||||||
Provision for income taxes increased by $10.6 million, or 442.5%, for the six months ended June 30, 2021, compared to the same period last year, primarily due to an increase in non-deductible items including stock-based compensation expense.
Quarterly Results of Operations and Key Metrics
Quarterly Results of Operations
The following table sets forth our unaudited quarterly consolidated statements of operations data for each of the quarters indicated. The information for each of these quarters has been prepared on a basis consistent with our audited annual consolidated financial statements appearing elsewhere in this prospectus and, in our opinion, include all normal recurring adjustments necessary for the fair statement of the financial information contained in those statements. The following unaudited consolidated quarterly financial data should be read in conjunction with our annual consolidated financial statements and the related notes included elsewhere in this prospectus. These quarterly results are not necessarily indicative of our operating results for a full year or any future period.
73
Table of Contents
| Three Months Ended | ||||||||||||||||||||||||
| March 31, 2020 |
June 30, 2020 |
September 30, 2020 |
December 30, 2020 |
March 31, 2021 |
June 30, 2021 |
|||||||||||||||||||
| (in thousands) | ||||||||||||||||||||||||
| Net revenues |
$ | 31,967 | $ | 64,143 | $ | 76,809 | $ | 90,193 | $ | 87,079 | $ | 101,117 | ||||||||||||
| Cost of goods sold |
7,655 | 18,923 | 20,176 | 26,134 | 24,719 | 26,964 | ||||||||||||||||||
|
|
|
|
|
|
|
|
|
|
|
|
|
|||||||||||||
| Gross profit |
24,312 | 45,220 | 56,633 | 64,059 | 62,360 | 74,153 | ||||||||||||||||||
| Operating expenses: |
||||||||||||||||||||||||
| Selling |
6,739 | 12,905 | 13,998 | 18,254 | 17,114 | 19,222 | ||||||||||||||||||
| Marketing |
7,337 | 8,805 | 9,655 | 13,055 | 10,840 | 15,488 | ||||||||||||||||||
| General and administrative |
6,200 | 6,950 | 8,407 | 19,979 | 18,346 | 71,504 | ||||||||||||||||||
|
|
|
|
|
|
|
|
|
|
|
|
|
|||||||||||||
| Total operating expenses |
20,276 | 28,660 | 32,060 | 51,288 | 46,300 | 106,214 | ||||||||||||||||||
|
|
|
|
|
|
|
|
|
|
|
|
|
|||||||||||||
| Net income (loss) from operations |
4,036 | 16,560 | 24,573 | 12,771 | 16,060 | (32,061 | ) | |||||||||||||||||
| Other income (loss), net |
98 | 18 | 12 | 8 | (38 | ) | (31 | ) | ||||||||||||||||
|
|
|
|
|
|
|
|
|
|
|
|
|
|||||||||||||
| Net income (loss) before income tax provision |
4,134 | 16,578 | 24,585 | 12,779 | 16,022 | (32,092 | ) | |||||||||||||||||
| Provision for income taxes |
— | 2,403 | 5,262 | 653 | 4,582 | 8,454 | ||||||||||||||||||
|
|
|
|
|
|
|
|
|
|
|
|
|
|||||||||||||
| Net income (loss) |
$ | 4,134 | $ | 14,175 | $ | 19,323 | $ | 12,126 | $ | 11,440 | $ | (40,546 | ) | |||||||||||
|
|
|
|
|
|
|
|
|
|
|
|
|
|||||||||||||
| The following table sets forth our results of operations as a percentage of net revenues for the periods presented: |
| |||||||||||||||||||||||
| Three Months Ended | ||||||||||||||||||||||||
| March 31, 2020 |
June 30, 2020 |
September 30, 2020 |
December 31, 2020 |
March 31, 2021 |
June 30, 2021 |
|||||||||||||||||||
| Net revenues |
100.0 | % | 100.0 | % | 100.0 | % | 100.0 | % | 100.0 | % | 100.0 | % | ||||||||||||
| Cost of goods sold |
23.9 | 29.5 | 26.3 | 29.0 | 28.4 | 26.7 | ||||||||||||||||||
|
|
|
|
|
|
|
|
|
|
|
|
|
|||||||||||||
| Gross profit |
76.1 | 70.5 | 73.7 | 71.0 | 71.6 | 73.3 | ||||||||||||||||||
| Operating expenses: |
||||||||||||||||||||||||
| Selling |
21.1 | 20.1 | 18.2 | 20.2 | 19.7 | 19.0 | ||||||||||||||||||
| Marketing |
23.0 | 13.7 | 12.6 | 14.5 | 12.4 | 15.3 | ||||||||||||||||||
| General and administrative |
19.4 | 10.8 | 10.9 | 22.2 | 21.1 | 70.7 | ||||||||||||||||||
|
|
|
|
|
|
|
|
|
|
|
|
|
|||||||||||||
| Total operating expenses |
63.4 | 44.7 | 41.7 | 56.9 | 53.2 | 105.0 | ||||||||||||||||||
|
|
|
|
|
|
|
|
|
|
|
|
|
|||||||||||||
| Net (loss) income from operations |
12.6 | 25.8 | 32.0 | 14.2 | 18.4 | (31.7 | ) | |||||||||||||||||
| Other income (loss), net |
0.3 | 0.0 | 0.0 | 0.0 | 0.0 | (0.0 | ) | |||||||||||||||||
|
|
|
|
|
|
|
|
|
|
|
|
|
|||||||||||||
| Net income (loss) before income tax provision |
12.9 | 25.8 | 32.0 | 14.2 | 18.4 | (31.7 | ) | |||||||||||||||||
| Provision for income taxes |
— | 3.7 | 6.9 | 0.7 | 5.3 | 8.4 | ||||||||||||||||||
|
|
|
|
|
|
|
|
|
|
|
|
|
|||||||||||||
| Net income (loss) |
12.9 | % | 22.1 | % | 25.2 | % | 13.4 | % | 13.1 | % | (40.1 | )% | ||||||||||||
|
|
|
|
|
|
|
|
|
|
|
|
|
|||||||||||||
Quarterly Trends
Quarterly Net Revenues Trends
Quarterly net revenues generally increased quarter-over-quarter primarily due to new customer acquisition coupled with strong retention of existing customers, which drove increased sales of our products. We generally drove sequential quarter-over-quarter orders growth in 2020 through continued improvements in conversion and increased brand awareness. We experienced some seasonality with higher levels of net revenues in the fourth quarter of the fiscal year driven by seasonal holiday demand.
Quarterly Cost of Goods Sold and Gross Profit Trends
Quarterly cost of goods sold generally increased quarter-over-quarter primarily due to an increase in total orders and associated product costs, inbound freight and duties.
74
Table of Contents
Quarterly gross profit generally increased quarter-over-quarter primarily due to the increase in total number of orders.
We experienced quarterly fluctuations in gross margin percentage as a result of our promotional calendar, timing of product launches and mix of ocean and air freight.
Quarterly Operating Expenses Trends
Selling expenses have generally increased quarter-over-quarter in each period presented above primarily due to an increase in shipping and fulfillment costs to support the increase in number of orders. Marketing expenses have generally increased quarter-over-quarter in the each period presented above as we have expanded our base of active customers.
General and administrative expenses have generally increased quarter-over-quarter in each period presented above as a result of headcount expansion and increased investments in software, recruiting, professional fees and other corporate expenses to support our growth.
In the first quarter of 2021, we experienced a sequential decrease in operating expenses. Selling expenses declined as a result of a lower total number of orders due to typically higher volume in the last quarter of the year coupled with improvements as a percentage of net revenues due to fulfillment and packaging efficiencies. Marketing expenses declined due to more effective performance marketing strategies in the first quarter and lighter spend following a strong holiday campaign in the fourth quarter of 2020. General and administrative expenses decreased as a result of lower stock compensation expense in the first quarter of 2021 offset by increases in personnel expense and investments in other corporate expenses.
In the second quarter of 2021, we experienced a sequential increase in operating expenses, primarily due to an increase in stock-based compensation expense in connection with the IPO and, to a lesser extent, higher order volume.
Quarterly Adjusted EBITDA and Adjusted EBITDA Margin
The following table reflects a reconciliation of Adjusted EBITDA to net income, the most directly comparable financial measure prepared in accordance with U.S. GAAP:
| Three Months Ended | ||||||||||||||||||||||||
| March 31, 2020 |
June 30, 2020 |
September 30, 2020 |
December 31, 2020 |
March 31, 2021 |
June 30, 2021 |
|||||||||||||||||||
| (in thousands) | ||||||||||||||||||||||||
| Net income |
$ | 4,134 | $ | 14,175 | $ | 19,323 | $ | 12,126 | $ | 11,440 | $ | (40,546 | ) | |||||||||||
| Add (deduct): |
||||||||||||||||||||||||
| Other income (loss), net |
(98 | ) | (18 | ) | (12 | ) | (8 | ) | 38 | 31 | ||||||||||||||
| Gain on disposal |
— | — | — | 2 | — | — | ||||||||||||||||||
| Provision for income taxes |
— | 2,403 | 5,262 | 653 | 4,582 | 8,454 | ||||||||||||||||||
| Depreciation and amortization expense(1) |
218 | 181 | 256 | 291 | 313 | 344 | ||||||||||||||||||
| Stock-based compensation expense(2) |
50 | 237 | 693 | 7,733 | 5,015 | 56,716 | ||||||||||||||||||
| Transaction costs |
— | — | — | 296 | 525 | (186 | ) | |||||||||||||||||
| Expenses related to non-ordinary course disputes(3) |
300 | 365 | 206 | 326 | 2,436 | 1,980 | ||||||||||||||||||
| Adjusted EBITDA |
$ | 4,604 | $ | 17,343 | $ | 25,728 | $ | 21,419 | $ | 24,349 | $ | 26,793 | ||||||||||||
| Adjusted EBITDA Margin |
14.4 | % | 27.0 | % | 33.5 | % | 23.7 | % | 28.0 | % | 26.5 | % | ||||||||||||
| (1) | Excludes amortization of debt issuance costs included in “Other income (loss), net.” |
| (2) | Includes stock-based compensation expense and payroll taxes related to equity award activity. |
| (3) | Represents legal fees incurred in connection with the litigation claims described in the section titled “Business—Legal Proceedings.” |
75
Table of Contents
We have demonstrated continued strong quarterly performance in Adjusted EBITDA and Adjusted EBITDA margin. Beginning in the second quarter of 2020, we saw an increase in our Adjusted EBITDA margin, primarily as a result of decreases in operating expenses as a percentage of net revenues. We experienced some seasonal fluctuation in the fourth quarter of 2020 with larger marketing investments to support our holiday campaign.
Quarterly Free Cash Flow
The following table presents a reconciliation of free cash flow to net cash (used in) provided by operating activities, the most directly comparable financial measure prepared in accordance with U.S. GAAP:
| Three Months Ended | ||||||||||||||||||||||||
| March 31, 2020 |
June 30, 2020 |
September 30, 2020 |
December 31, 2020 |
March 31, 2021 |
June 30, 2021 |
|||||||||||||||||||
| (in thousands) | ||||||||||||||||||||||||
| Net cash (used in) provided by operating activities |
$ | (821 | ) | $ | 25,130 | $ | (1,233 | ) | $ | (1,328 | ) | $ | 16,109 | $ | 16,632 | |||||||||
| Less: capital expenditures |
(972 | ) | (109 | ) | (546 | ) | (635 | ) | (528 | ) | (495 | ) | ||||||||||||
| Free cash flow |
$ | (1,793 | ) | $ | 25,021 | $ | (1,779 | ) | $ | (1,963 | ) | $ | 15,581 | $ | 16,137 | |||||||||
Our free cash flow has fluctuated over time primarily as a result of timing of inventory purchases to support our growth. Minimal capital expenditure requirements have been consistent on a quarterly basis and have resulted in strong annual free cash flow generation.
Seasonality
Unlike the traditional apparel industry, the healthcare apparel industry is generally not seasonal in nature. However, due to our historically strong sequential growth as well as our decision to conduct select promotions during the holiday season we historically have generated a higher proportion of net revenues, and incurred higher selling and marketing expenses, during the fourth quarter of the year compared to other quarters, and we expect these trends to continue.
Liquidity and Capital Resources
As of December 31, 2020 and June 30, 2021, we had $58.1 million and $164.0 million of cash and cash equivalents, respectively. Since inception, we have financed operations primarily through cash flow from operating activities, the sale of our capital stock and borrowings under credit facilities. We completed our IPO on June 1, 2021 by issuing 4,636,364 shares of our Class A common stock at a price to the public of $22 per share, resulting in net proceeds to us of $95.1 million, after deducting underwriting discounts and commissions of $6.1 million and deferred offering expenses of $0.8 million, net of reimbursements. We incurred a total of $8.7 million of expenses, before reimbursements, in connection with the IPO.
In December 2020, we entered into a credit agreement with JPMorgan Chase Bank, N.A., providing for a revolving credit facility in an initial amount of up to $50.0 million, or the Prior Credit Facility. The Prior Credit Facility would have matured in December 2025. As of June 30, 2021, we had no borrowings under the Prior Credit Facility. In September 2021, we entered into a new credit agreement with Bank of America, N.A., providing for a revolving credit facility in an initial amount of up to $100.0 million, or the Existing Credit Facility, and terminated the Prior Credit Facility. The Existing Credit Facility will mature in September 2026. The Existing Credit Facility is secured by substantially all of our assets, subject to customary exceptions. In addition, the Existing Credit Facility is subject to customary affirmative covenants and negative covenants as well as a financial covenant. The financial covenant is tested at the end of each fiscal quarter, beginning with the quarter ending September 30, 2021, and requires that we not be in excess of a maximum total leverage ratio. As of September 13, 2021, we have no outstanding borrowings under the Existing Credit Facility. There were no outstanding borrowings under the Prior Credit Facility but letters of credit with an aggregate face amount of approximately $3.2 million were outstanding
76
Table of Contents
under this facility as of September 7, 2021. The letters of credit remain outstanding, but our reimbursement obligations are secured by cash collateral pledged by us to JPMorgan Chase Bank, N.A. in the amount of approximately $3.3 million. See Note 14 to our unaudited interim financial statements included elsewhere in this prospectus for more information regarding the Existing Credit Facility.
We believe that existing cash and cash equivalents and positive cash flows from operations will be sufficient to support working capital and capital expenditure requirements for at least the next 12 months. Our future capital requirements may vary materially from those currently planned and will depend on many factors, including our rate of revenue growth, the timing and extent of international expansion efforts and other growth initiatives, the expansion of our marketing activities and overall economic conditions. To the extent that current and anticipated future sources of liquidity are insufficient to fund our future business activities and requirements, we may be required to seek additional equity or debt financing. The sale of additional equity would result in additional dilution to our stockholders. The incurrence of additional debt financing would result in debt service obligations and the instruments governing such debt could provide for operating and financing covenants that would restrict our operations. There can be no assurances that we will be able to raise additional capital when needed or on terms acceptable to us. The inability to raise capital if needed would adversely affect our ability to achieve our business objectives.
Historical Cash Flows
The following table summarizes our cash flows for the periods presented:
| Years Ended December 31, |
Six Months Ended June 30, |
|||||||||||||||
| 2019 | 2020 | 2020 | 2021 | |||||||||||||
| (in thousands) |
||||||||||||||||
| Cash (used in) provided by operating activities |
$ | 6,531 | $ | 21,748 | $ | 24,309 | $ | 32,741 | ||||||||
| Cash used in investing activities |
(4,761 | ) | (2,262 | ) | (1,080 | ) | (1,023 | ) | ||||||||
| Cash provided by financing activities |
14,000 | 294 | — | 74,117 | ||||||||||||
|
|
|
|
|
|
|
|
|
|||||||||
| Net (decrease) increase in cash and cash equivalents |
$ | 15,770 | $ | 19,780 | $ | 23,229 | $ | 105,835 | ||||||||
|
|
|
|
|
|
|
|
|
|||||||||
Operating Activities
Cash (used in) provided by operating activities consist primarily of net income adjusted for certain items including depreciation and amortization, stock-based compensation expense and the effect of changes in operating assets and liabilities.
Net cash provided by operating activities increased by $8.4 million for the six months ended June 30, 2021, compared to the same period last year. We saw an increase in cash provided from operating activities as a result of improvements in net income, excluding the impact of non-cash adjustments, of $17.4 million. This increase was offset by cash consumed as a result of a net change in operating assets and liabilities of $9.0 million. The increase in cash consumed was primarily due to an increase in inventory balances of $11.0 million due to higher inventory purchases to support our growth and higher receivables of $4.9 million related to expense reimbursements in connection with the IPO. The increases in cash consumed were partially offset by higher accounts payable and accrued expense balances of $7.6 million from the timing of accruals during the period.
Net cash provided by operating activities increased $15.2 million in 2020 compared to 2019, primarily as a result of an increase in net income of $49.6 million driven by improved financial performance. Our improved financial performance, including net income was driven primarily by increased brand awareness and increased visits to our digital platform which resulted in more orders in 2020 compared to 2019. We also believe that our increased efficiency in attracting new customers contributed to this improved financial performance in 2020.
77
Table of Contents
In addition to improved financial performance, net cash provided by operating activities in 2020 included an increase in non-cash adjustments of $2.0 million. The increase in non-cash adjustments consisted of $8.5 million in higher stock-based compensation expense from equity awards granted in 2020, partially offset by a $6.5 million increase in deferred income tax benefit.
The increase in net cash provided by operating activities in 2020 was partially offset by an increase in cash consumed by net change in operating assets and liabilities of $36.8 million, primarily due to an increase in inventory purchases to support our growth.
Investing Activities
Cash used in investing activities relate to capital expenditures and other investing activities.
Cash used in investing activities of $1.0 million for the six months ended June 30, 2021 was comparable to same period last year.
Capital expenditures during the six months ended June 30, 2021 and June 30, 2020 were primarily related to purchases of computer equipment, furniture and fixtures, and included capitalized software development costs.
Cash used in investing activities decreased by $2.5 million, to $2.3 million in 2020 from $4.8 million in 2019.
Capital expenditures in 2019 were primarily related to our new office build, including $3.0 million for leasehold improvements.
Capital expenditures in 2020 were primarily comprised of $1.7 million of capitalization of software.
Financing Activities
Cash provided by financing activities consist primarily of net proceeds from the sale of our common stock, borrowings, fees associated with our existing line of credit and proceeds from the exercise of stock options.
Cash provided by financing activities was $74.1 million for the six months ended June 30, 2021, which was attributable to proceeds from our IPO and proceeds from stock option exercises, partially offset by tax payments related to net share settlements on restricted stock units.
There were no comparable financing cash flow activities for the six months ended June 30, 2020.
In 2020, net cash provided by financing activities was $0.3 million, which was attributable to $0.4 million in proceeds from stock option exercises, partially offset by $0.1 million of fees associated with our existing line of credit.
In 2019, net cash provided by financing activities was $14.0 million, which was attributable to a capital contribution.
78
Table of Contents
Contractual Obligations and Commitments
The following table summarizes our contractual obligations as of December 31, 2020:
| Payments Due by Period | ||||||||||||||||||||
| Total | Less than 1 Year |
1-3 Years | 3-5 Years | More than 5 Years |
||||||||||||||||
| (in thousands) | ||||||||||||||||||||
| Operating lease commitments |
$19,634 | $ 1,941 | $3,986 | $4,259 | $9,448 | |||||||||||||||
| Inventory purchase obligations |
33,837 | 33,837 | — | — | — | |||||||||||||||
|
|
|
|
|
|
|
|
|
|
|
|||||||||||
| Total |
$53,471 | $35,778 | $3,986 | $4,259 | $9,448 | |||||||||||||||
|
|
|
|
|
|
|
|
|
|
|
|||||||||||
The commitment amounts in the table above are associated with contracts that are enforceable and legally binding and that specify all significant terms, including fixed or minimum services to be used, fixed, minimum or variable price provisions, and the approximate timing of the actions under the contracts. Our operating lease commitments relate primarily to our office space in Santa Monica, California. Inventory purchase obligations represent open purchase orders for the materials and merchandise at the end of the fiscal year. These purchase orders can be impacted by various factors, including the timing of issuing orders and the timing of shipment of orders. The table does not include obligations under agreements that we can cancel without a significant penalty.
Critical Accounting Policies and Estimates
We believe that the following accounting policies involve a high degree of judgment and complexity. Accordingly, these are the policies we believe are the most critical to aid in fully understanding and evaluating our financial condition and results of our operations. See Note 2 to our audited financial statements and Note 2 to our unaudited financial statements appearing elsewhere in this prospectus for a description of our other significant accounting policies. The preparation of our financial statements in conformity with U.S. GAAP requires us to make estimates and judgments that affect the amounts reported in those financial statements and accompanying notes. Although we believe that the estimates we use are reasonable, due to the inherent uncertainty involved in making those estimates, actual results reported in future periods could differ from those estimates.
Revenue Recognition
Our primary source of revenues is from sales of healthcare apparel, footwear and other products primarily through our digital platform.
We determine revenue recognition through the following steps in accordance with Topic 606, which we adopted effective January 1, 2018:
| • | identification of the contract, or contracts, with a customer; |
| • | identification of the performance obligations in the contract; |
| • | determination of the transaction price; |
| • | allocation of the transaction price to the performance obligations in the contract; and |
| • | recognition of revenue when, or as, we satisfy a performance obligation. |
Revenue is recognized upon shipment when control of the promised goods or services is transferred to our customers, in an amount that reflects the consideration we expect to be entitled to in exchange for those goods or services. Our revenue is reported net of sales returns and discounts. We estimate our liability for product returns based on historical return trends and an evaluation of current economic and market conditions. We record the
79
Table of Contents
expected customer refund liability as a reduction to revenue, and the expected inventory right of recovery as a reduction of cost of goods sold. If actual return costs differ from previous estimates, the amount of the liability and corresponding revenue are adjusted in the period in which such costs occur.
Stock-Based Compensation
We have granted stock-based awards consisting primarily of stock options and RSUs to employees and consultants. Stock-based compensation expense related to stock-based awards is recognized based on the fair value of the awards granted. We estimate the fair value of each option award granted using the Black-Scholes option pricing model. The Black-Scholes option pricing model requires the input of highly subjective assumptions, including the fair value of the underlying common stock, the risk-free interest rate, the expected volatility of the price of our common stock, the expected dividend yield of our common stock and the expected term of the option. The assumptions used to determine the fair value of the option awards represent management’s best estimates. These estimates involve inherent uncertainties and the application of management’s judgment. The related stock-based compensation expense is recognized on a straight-line basis over the requisite service period of the awards, which is generally four years. We account for forfeitures as they occur. If factors change and different assumptions are used, our stock-based compensation expense could be materially different in the future. These assumptions and estimates are as follows:
| • | Fair Value of Common Stock. As our common stock is not publicly traded, the fair value was determined by our board of directors, with input from management and valuation reports prepared by third-party valuation specialists as described below under “—Common Stock Valuations.” |
| • | Risk-Free Interest Rate. The risk-free interest rate for the expected term of the options was based on the U.S. Treasury yield curve in effect at the time of the grant. |
| • | Expected Volatility. As we do not have a trading history for our common stock, the expected volatility was estimated by taking the average historic price volatility for industry peers, consisting of several public companies in our industry which are either similar in size, stage of life cycle or financial leverage, over a period equivalent to the expected term of the awards. |
| • | Expected Dividend Yield. We have never declared or paid any cash dividends and do not currently plan to pay cash dividends in the foreseeable future. As a result, an expected dividend yield of zero percent was used. |
| • | Expected Term. We estimate the expected term by using the simplified method, which calculates the expected term as the average of the time-to-vesting and the contractual life of the options. |
We estimate the fair value of each RSU granted based on the fair value of our common stock on the date of grant. All of our RSUs vest upon the satisfaction of both a service-based vesting condition and a liquidity-based vesting condition. The service-based vesting condition for the awards is satisfied in substantially equal quarterly installments over the four-year period following December 31, 2019, subject to the individual’s continued service to us. The liquidity-based vesting condition was satisfied in connection with the completion of our IPO.
We will continue to use judgment in evaluating the assumptions related to our stock-based compensation on a prospective basis. As we continue to accumulate additional data related to our common stock, we may refine our estimation process, which could materially impact our future stock-based compensation expense.
Common Stock Valuations
Prior to our IPO, given the absence of a public trading market of our common stock, and in accordance with the American Institute of Certified Public Accountants Accounting and Valuation Guide, Valuation of Privately-Held Company Equity Securities Issued as Compensation, our board of directors exercised reasonable judgment
80
Table of Contents
and considered numerous and subjective factors to determine the best estimate of fair value of our common stock at each grant date, including:
| • | contemporaneous independent third-party valuations of our common stock; |
| • | the prices at which our common stock was sold in secondary transactions; |
| • | our results of operations, financial position and capital resources; |
| • | industry outlook; |
| • | the lack of marketability of our common stock; |
| • | the fact that the stock option grants involve illiquid securities in a private company; |
| • | the likelihood of achieving a liquidity event, such as an initial public offering or a sale of our company, given prevailing market conditions; |
| • | the history and nature of our business, industry trends, and competitive environment; and |
| • | general economic outlook, including economic growth, inflation and unemployment, interest rate environment and global economic trends. |
In valuing our common stock, the fair value of our business, or enterprise value, was determined using a combination of the market approach and income approach. The market approach estimates value based on a comparison of the subject company to comparable public companies in a similar line of business and secondary transactions of our capital stock. From the comparable companies, a representative market value multiple is determined and then applied to the subject company’s financial results to estimate the value of the subject company. The market approach also includes consideration of the transaction price of secondary sales of our capital stock. The income approach estimates value based on the expectation of future cash flows, which are then discounted to present value.
For each valuation, the enterprise value was then allocated to the common stock using a combination of methods, including the Option Pricing Model, or OPM, and the consideration of private secondary transactions. The OPM allocates a company’s equity value among various capital investors, taking into account any liquidation preferences, participation rights, dividend policy and conversion rights. The use of OPM is appropriate when the range of possible future outcomes is difficult to predict and can result in a highly speculative forecast. When evaluating private secondary transactions, we considered the relative size of such transaction to our fully diluted capitalization, as well as the facts and circumstances of each transaction to determine the extent to which they represented a fair value exchange. Factors considered include transaction volume, timing, whether the transactions occurred among willing and unrelated parties and whether the transactions involved investors with access to our financial information.
Application of these approaches involves the use of estimates, judgment and assumptions that are highly complex and subjective, such as those regarding our expected future revenues, expenses, cash flows, discount rates and market multiples, the selection of comparable companies and the probability of possible future events. Changes in any or all of these estimates and assumptions, or the relationships between those assumptions, impact our valuations as of each valuation date and may have a material impact on the valuation of our common stock.
Following our IPO, the fair value of our common stock is based on the closing price as reported by NYSE.
Inventory
Inventories are stated at the lower of cost and net realizable value. Cost is determined using an average cost method. Cost of inventory includes import duties and other taxes and transport and handling costs. We write down inventory where it appears that the carrying cost of the inventory may not be recovered through subsequent
81
Table of Contents
sale of the inventory. We analyze the quantity of inventory on hand, the quantity sold in the past year, the anticipated sales volume, the expected sales price and the cost of making the sale when evaluating the value of our inventory. If the sales volume or sales price of specific products declines, additional write-downs may be required.
Income Taxes
We are subject to income taxes in the United States. We compute our provision for income taxes using the asset and liability method, under which deferred tax assets and liabilities are recognized for the expected future tax consequences of temporary differences between the financial reporting and tax bases of assets and liabilities. Deferred tax assets and liabilities are measured using the currently enacted tax rates that are expected to apply to taxable income for the years in which those tax assets and liabilities are expected to be realized or settled. Valuation allowances are established when necessary to reduce deferred tax assets to the amount expected to be realized and the charge is recorded to earnings.
Significant judgment is required in determining our uncertain tax positions. We continuously review issues raised in connection with all ongoing examinations and open tax years to evaluate the adequacy of our tax liabilities. We evaluate uncertain tax positions under a two-step approach. The first step is to evaluate the uncertain tax position for recognition by determining if the weight of available evidence indicates that it is more likely than not that the position will be sustained upon examination based on its technical merits. The second step is, for those positions that meet the recognition criteria, to measure the largest amount of benefit that is more likely than not of being realized. We believe our recorded tax liabilities are adequate to cover all open tax years based on our assessment. This assessment relies on estimates and assumptions and involves significant judgments about future events. To the extent that our view as to the outcome of these matters changes, we will adjust income tax expense in the period in which such determination is made. We classify interest and penalties related to income taxes as income tax expense.
Loss Contingencies
We may be involved in legal proceedings, claims and regulatory, tax or government inquiries and investigations that arise in the ordinary course of business resulting in loss contingencies. We accrue for loss contingencies when losses become probable and are reasonably estimable. If the reasonable estimate of the loss is a range and no amount within the range is a better estimate, the minimum amount of the range is recorded as a liability. We do not accrue for contingent losses that, in our judgment, are considered to be reasonably possible, but not probable; however, we disclose the range of such reasonably possible losses. Loss contingencies considered remote are generally not disclosed.
Off-Balance Sheet Arrangements
We did not have during the periods presented, and we do not currently have, any off-balance sheet financing arrangements or any relationships with unconsolidated entities or financial partnerships, including entities sometimes referred to as structured finance or special purpose entities, that were established for the purpose of facilitating off-balance sheet arrangements or other contractually narrow or limited purposes.
Qualitative and Quantitative Disclosures about Market Risk
We are exposed to market risks in the ordinary course of our business. Market risk represents the risk of loss that may impact our financial position due to adverse changes in financial market prices and rates. Our market risk exposure is primarily the result of fluctuations in interest rates and foreign exchange rates.
Interest Rate Risk
At June 30, 2021, we had cash and cash equivalents of $164.0 million. Interest-earning instruments carry a degree of interest rate risk. We do not enter into investments for trading or speculative purposes and have not
82
Table of Contents
used any derivative financial instruments to manage our interest rate risk exposure. A hypothetical 10% change in interest rates would not result in a material impact on our financial statements.
Foreign Currency Risk
Our net revenues are primarily denominated in U.S. dollars and are not currently subject to significant foreign currency risk. Some foreign operating expenses are denominated in the currencies of the countries and territories in which our third-party vendors are located and may be subject to fluctuations due to changes in foreign currency exchange rates. Fluctuations in foreign currency exchange rates may cause us to recognize transaction gains and losses in our results of operations. To date, foreign currency transaction gains and losses have not been material to our financial statements, and we have not engaged in any foreign currency hedging transactions.
Recently Adopted Accounting Pronouncements
See Note 2 to our financial statements included elsewhere in this prospectus for a description of recently adopted accounting pronouncements.
Emerging Growth Company Status
In April 2012, the JOBS Act was enacted. Section 107 of the JOBS Act provides that an “emerging growth company” may take advantage of the extended transition period provided in Section 7(a)(2)(B) of the Securities Act for complying with new or revised accounting standards. Therefore, an emerging growth company can delay the adoption of certain accounting standards until those standards would otherwise apply to private companies. We have elected to use the extended transition period under the JOBS Act until the earlier of the date we (1) are no longer an emerging growth company or (2) affirmatively and irrevocably opt out of the extended transition period provided in the JOBS Act. As a result, our financial statements may not be comparable to companies that comply with new or revised accounting pronouncements as of public company effective dates.
83
Table of Contents
Our Mission
Our mission is to celebrate, empower and serve those who serve others.
Who We Are
We are a founder-led, direct-to-consumer healthcare apparel and lifestyle brand that seeks to celebrate, empower and serve current and future generations of healthcare professionals. We are committed to helping this growing, global community of professionals, whom we refer to as Awesome Humans, look, feel and perform at their best—24/7, 365 days a year. We create technically advanced apparel and products that feature an unmatched combination of comfort, durability, function and style, all at an affordable price. In doing so, we have redefined what scrubs are—giving rise to our tag-line: why wear scrubs, when you can #wearFIGS?
We have revolutionized the large and fragmented healthcare apparel market. We branded a previously unbranded industry and de-commoditized a previously commoditized product—elevating scrubs and creating premium products for healthcare professionals. Most importantly, we built a community and lifestyle around a profession. As a result, we have become the industry’s category-defining healthcare apparel and lifestyle brand.
We market and sell 98% of our products through our digital platform, consisting of our website and mobile app, to a rapidly growing community of loyal customers. From 2017 to 2020, we grew net revenues from $17.6 million to $263.1 million, representing a compound annual growth rate, or CAGR, of 146%. In addition, in 2020, we delivered operating income and Adjusted EBITDA of $57.9 million and $69.1 million, respectively.
We Are Obsessed with Our Community of Awesome Humans.
We are dedicated to empowering and celebrating every healthcare professional across all disciplines and levels of experience. The healthcare community informs and inspires us, and we place these Awesome Humans at the center of everything we do. We purposefully design products to serve their particular needs and we sell those products through a convenient direct-to-consumer, or DTC, model tailored to their around-the-clock lifestyle. We use our digital platform to celebrate Awesome Humans in aspirational, creative and unexpected ways. We leverage social media platforms, such as Instagram, to listen to, engage with, understand and better serve our community of healthcare professionals at scale. Our Ambassador Program gives healthcare professionals a platform where they can tell their stories. This program, which consists of hundreds of Awesome Humans from around the world who represent a diverse cross-section of the healthcare industry, helps us interact with and drive engagement with our community. Our Ambassadors are an extension of our team and are evangelists for our brand. Our differentiated approach to creating authentic and meaningful relationships with our community has allowed us to build a growing base of approximately 1.6 million active customers who are passionate and loyal to our brand, as demonstrated by our strong customer retention and engagement.
Innovation Drives Our Product Development.
We create technically advanced apparel and products for the modern healthcare professional. Our design philosophy is rooted in Technical Comfort™—the conviction that design, comfort and function are non-negotiable. While multi-billion-dollar companies were focused on athletes, we believed that nobody was sufficiently focused on healthcare professionals—extraordinary people who care for patients, cure diseases and save lives, and who deserve to look, feel and perform at their best. As a result, we developed cutting-edge fabric technology and product designs to specifically address their needs. Our proprietary fabric technology, called FIONx, offers four-way stretch, anti-odor, anti-wrinkle and moisture-wicking properties. Our scrubs feature easy-to-access zippered pockets for professional and personal items such as stethoscopes, scissors, smartphones
84
Table of Contents
and ID badges. Our lifestyle apparel and other non-scrub offerings, such as lab coats, underscrubs, outerwear, activewear, loungewear, compression socks, footwear, masks and face shields, are specifically designed for the needs and preferences of the medical community. By enabling all healthcare professionals to have access to these products, we make the healthcare community more inclusive and aim to elevate the entire healthcare ecosystem.
We Are a Digitally Native Direct-to-Consumer Brand.
We are a digitally native DTC brand that utilizes technology to deliver a differentiated customer experience. We disrupted the industry’s historical distribution model, which required healthcare professionals to physically travel to brick-and-mortar stores to purchase their uniforms. We have built the largest DTC platform in healthcare apparel, leading the industry in the shift to digital. By selling directly through our digital platform, we control all aspects of the customer experience. Further, we are able to engage with our community of healthcare professionals before, during and after purchase, through our digital platform, email, social media, podcasts, in-person events and numerous other channels. This direct engagement enables us to establish personal relationships at scale and provides us with valuable customer data and feedback that we leverage across our organization to better serve our community.
We Leverage Data Science to Connect with and Serve Our Community.
We leverage our rich customer data set, bolstered by the inherent benefits of our DTC model, to serve our community more effectively and efficiently. We develop proprietary and customized data solutions designed to optimize our product innovation, inventory analytics, marketing efforts and operational efficiency. We maintain centralized Data Science and Data Engineering teams and de-centralized Data Analysts working directly within each key functional area of the company. This approach enables us to gather and manage extensive data, and rapidly and directly apply that data to deliver customer insights and improve our core operating activities and decision-making processes. Our vast and growing data set plays a critical role in driving new customer acquisition as well as in our community engagement and retention strategy.
We Give Back to the Community We Serve.
In line with our purpose-driven mission, giving back is ingrained in everything we do at FIGS and has been from the beginning. When we started FIGS, we created an initiative called Threads for Threads to donate scrubs to healthcare professionals who work in resource-poor countries and lack the proper uniforms to do their jobs safely. By providing clean scrubs to these individuals, we aim to empower them and improve the quality of care they provide. Our efforts have been supported by over 60 organizations who understand the needs of local healthcare professionals and work with us to ensure that we provide what is needed. To date, we have donated hundreds of thousands of FIGS scrubs and other products to medical professionals in need.
In an effort to empower and support our healthcare community, we have also given in a variety of other ways, including by:
| • | Working with our community of Ambassadors to provide time, expertise and care to local healthcare institutions, providers and patients through medical giving trips; |
| • | Granting funds through our New Icons initiative to help pay the tuition of selected Awesome Humans who represent the next generation of healthcare; |
| • | Promoting diversity and inclusion in the healthcare profession by donating to, and raising awareness for, organizations with our shared values, such as the National Black Nurses Association and Student National Medical Association; |
| • | Creating a special capsule collection, through which we donated funds to Wild Aid for each product sold within the collection, to help fight poaching and climate change and to protect endangered species; and |
| • | Donating funds and supplies to support rehabilitation efforts following the 2020 wildfires in Australia. |
85
Table of Contents
In response to the COVID-19 pandemic, in 2020, we focused our giving efforts locally in the United States, donating personal protective equipment, scrubs, funds and other essential products to frontline workers affected by the pandemic.
Through all of these efforts, our approach is simple: we give back to the healthcare community that gives so much of itself to serving others.
Our Recent Financial Performance
We have demonstrated rapid growth, strong profitability and positive cash flow generation. In 2020, we achieved the following results compared to 2019:
| • | Expanded our community of active customers by 118% from 0.6 million to approximately 1.3 million; |
| • | Increased net revenues from $110.5 million to $263.1 million, representing 138% year-over-year growth; |
| • | Increased gross margin by 50 basis points from 71.8% to 72.3%; |
| • | Improved net operating (loss) income from $(0.3) million to $57.9 million; |
| • | Increased Adjusted EBITDA from $1.7 million to $69.1 million, representing an Adjusted EBITDA margin of 26.3% in 2020; |
| • | Increased cash flow from operations from $6.5 million to $21.7 million; and |
| • | Increased free cash flow from $1.8 million to $19.5 million. |
In the six months ended June 30, 2021, we had the following results compared to the six months ended June 30, 2020:
| • | Expanded our community of active customers by 79.2% from approximately 0.9 million to approximately 1.6 million; |
| • | Increased net revenues from $96.1 million to $188.2 million, representing 95.8% year-over-year growth; |
| • | Increased gross margin by 0.2 percentage points from 72.3% to 72.5%; |
| • | Net operating income (loss) decreased from $20.6 million to $(16.0) million; |
| • | Increased Adjusted EBITDA from $21.9 million to $51.1 million, representing an Adjusted EBITDA margin of 27.2% in 2021; |
| • | Increased cash flow from operations from $24.3 million to $32.7 million; and |
| • | Increased free cash flow from $23.2 million to $31.7 million. |
*NM = Not Meaningful
86
Table of Contents
We define an active customer as a unique customer account that has made at least one purchase in the preceding 12-month period. See the section titled “Selected Financial Data—Non-GAAP Financial Measures” for information regarding Adjusted EBITDA, Adjusted EBITDA margin and free cash flow, including a reconciliation to the most directly comparable financial measures prepared in accordance with U.S. GAAP.
Our Market Opportunity
Healthcare Apparel Is a Large, Growing and Non-Discretionary Industry.
According to the Bureau of Labor Statistics, the healthcare sector is the largest and fastest growing job segment in the United States, employing over 20 million professionals in 2020. Total U.S. employment between 2019 and 2029 is expected to grow by 15% for all healthcare professionals versus just 4% for all occupations. Within this growing market, healthcare apparel is a large, fundamentally attractive industry underpinned by its scale, recurring nature and compelling growth outlook. In 2020, the total addressable market of the healthcare apparel industry was an estimated $12.0 billion in the United States and $79.0 billion globally, according to an April 2021 Frost & Sullivan study that we commissioned. Unlike most other categories in the apparel sector, the healthcare apparel industry is largely non-discretionary, recession resistant and much less susceptible to fashion or fad risk. Hospitals, medical offices, clinics and laboratories routinely require healthcare professionals such as doctors, nurses and medical technicians to wear scrubs, lab coats and other medical apparel during every shift. Over time, healthcare apparel purchasing has shifted from institutions to the individual, with approximately 85% of all medical professionals now purchasing their own uniforms. Due to frequent wear, healthcare apparel continuously needs to be replenished, resulting in highly predictable, recurring demand for such products.
The Industry Has Historically Lacked Innovation.
Prior to FIGS, the healthcare apparel industry had operated for over 100 years with little change or innovation. Despite attractive market fundamentals, the industry had been held back, and its consumers underserved, by legacy participants with outdated business models.
We believe that key limitations of industry incumbents include:
| • | Commoditized Products. Legacy manufacturers typically sell commoditized product offerings that are notoriously ill-fitting, uncomfortable, baggy, boxy and lacking in design and functionality, with minimal focus on fabric technology or performance. In addition, any adjacent lifestyle products offered by these manufacturers are extremely limited. |
| • | Brand Obscurity. Traditional scrubs manufacturers sell under third-party licenses, and therefore do not retain control over the product and have limited ability to promote brand loyalty. |
| • | Antiquated Distribution. An outdated distribution strategy causes incumbent manufacturers to rely on a highly fragmented network of discount brick-and-mortar medical supply stores, often in inconvenient locations, and unappealing aggregated online sites operated by third-party retailers. |
| • | Channel Conflict. Due to legacy wholesale relationships, many incumbent manufacturers do not sell DTC despite consumers’ growing desire to engage directly with brands. |
| • | Customer Separation. Incumbent manufacturers generally do not have a direct connection with the end customer—the healthcare professional. As a result, they lack valuable feedback regarding customers’ needs and preferences. |
| • | Challenged Margins. Structurally challenged margin profiles, stemming from third-party brand licensing and wholesale distribution economics, likely impacts incumbent manufacturers’ ability to invest in product innovation, marketing and customer experience. |
87
Table of Contents
The Industry is Fundamentally Changing.
We believe the healthcare apparel sector is positioned for continued strong growth driven by the following key industry dynamics:
| • | Resilient Industry with Favorable Long-Term Trends. The healthcare apparel industry is growing and has demonstrated resilience across economic cycles, driven by the non-discretionary, replenishment nature of its products and the secular growth of the healthcare sector. |
| • | Increased Demand for Healthcare Professionals. Healthcare is the fastest growing job sector in the United States, having grown by 22% from January 2011 to January 2020. With an expanding aging population, proliferation of chronic illness, greater access to healthcare in the United States provided by the Affordable Care Act and an increasing focus on health and wellness, the demand for healthcare professionals continues to grow. |
| • | Acceleration of eCommerce. The shift to eCommerce is rapidly accelerating as consumers continue to embrace the convenience of online and mobile shopping. For healthcare professionals who work long shifts and all hours of the day and night, the convenience of eCommerce is even more necessary. |
| • | Attraction to Purpose-Driven Brands. Consumers are increasingly attracted to, and interested in engaging with, purpose-driven brands using social media channels. Particularly among Millennials and Generation Z, purpose-driven brands are the expectation, not a luxury. |
| • | Magnified Importance of Technically Advanced Healthcare Apparel. The COVID-19 pandemic has magnified the indispensability of healthcare professionals. During a time when the need for high-performance healthcare apparel has never been greater, we quickly rose to the challenge by ramping up production to meet demand and by donating PPE, scrubs, funds and other essential products to frontline workers. Due to the pandemic, more healthcare professionals are choosing to wear medical apparel, and a greater number of hospitals, medical offices and clinics are requiring staff to wear scrubs and other medical apparel. While we demonstrated consistent and significant growth prior to 2020, we believe the pandemic has accelerated awareness of the FIGS brand and a shift in purchasing decisions that will continue to drive future growth. |
Supported by these key trends, the healthcare apparel industry is expected to demonstrate strong and consistent growth, with the total addressable market in the United States expected to grow by a 6.1% CAGR over the next five years, from approximately $12.0 billion in 2020 to approximately $16.0 billion in 2025, according to the Frost & Sullivan study.
What Sets Us Apart
We believe that the following competitive strengths have been key drivers of our success to date and strategically position us for continued success.
Deeply Passionate, Loyal Community
We have been building a large, growing community of deeply loyal customers who share an authentic emotional connection with FIGS. During 2020, our community more than doubled to approximately 1.3 million active customers, about 60% of whom were repeat customers. Our brand awareness is driven largely by word of mouth among healthcare professionals who are passionate about FIGS, and whose passion quickly spreads through hospitals and healthcare institutions, where thousands of healthcare professionals often work in close proximity to one another. In addition, through our digital platform and social media presence, we provide venues for our community to engage with each other on common ground. We are proud that our products and digital platform are connecting healthcare professionals and bridging gaps that previously existed across varying disciplines and experience levels. Through our digital platform, we showcase the daily wins and challenges healthcare professionals
88
Table of Contents
experience and highlight their stories of courage, dedication and selflessness. Our strong customer loyalty is demonstrated by our compelling revenue retention metrics. In 2020, we retained 75% of the 2019 and prior cohorts’ net revenues, including 100% of the 2019 net revenues generated by 2018 and prior cohorts.
Authentic, Category-Defining Brand
FIGS is the first digitally native lifestyle brand outfitting healthcare professionals. Our brand represents high quality, functional, comfortable and stylish products combined with a seamless digital customer experience that healthcare professionals have never experienced before. Many of our customers form a deep emotional connection with our brand because we are the first brand in the industry to seek relentlessly to understand and fulfill their unique needs. We are purpose-driven with a mission to celebrate, empower and serve those who serve others, and this purpose resonates with our community. We collaborate with other highly regarded brands to further extend our brand reach and enhance our appeal with customers. Through our Ambassador Program, we have formed meaningful relationships with hundreds of Awesome Humans who help us reach millions of healthcare professionals around the world in an intimate, authentic and personalized way. Our strong brand affinity is demonstrated by our high Net Promoter Score of +81. See the section titled “Industry and Market Data” for additional information regarding Net Promoter Score.
Industry-Leading Product Innovation
We strive to create the most innovative, functional, comfortable and stylish healthcare apparel in the industry. Our design philosophy stems from an unwavering focus on what healthcare professionals need from their apparel in order to look, feel and perform at their best. Our innovative products are designed, sourced and manufactured from the fiber level. Our proprietary FIONx fabric technology is made from what we believe to be the best combination of materials and is core-spun for maximum durability to withstand the demands of a healthcare professional’s work without sacrificing comfort. We design products that offer technical features such as four-way stretch, anti-odor, anti-wrinkle, and moisture-wicking properties. Our approach and products are distinct from those of legacy manufacturers, who offer poorly fitting scrubs and other commoditized healthcare apparel offerings. We attribute our ability to develop superior products to a number of factors, including our talented design, product development and production teams, feedback from healthcare professionals, our data-driven design process, and our obsessive focus on quality. Through those factors, we seek to create products that healthcare professionals never even knew they needed or wanted, and that not only meet but exceed their expectations. We dream about inventing the future so that design is aesthetically pleasing, while also solving real problems for our community. This combination of form and function results in a range of products that deliver maximum comfort, function and style.
Digitally Native Direct-to-Consumer Strategy
Our business is powered by a digitally native DTC strategy, which offers significant competitive advantages. Unlike most incumbent scrubs manufacturers, who sell through legacy distribution channels and do not have direct touchpoints with the end customer, we directly engage with and serve medical professionals through our digital platform. By owning all aspects of the customer experience, including website and app design, marketing content, storytelling and post-purchase customer engagement, we deliver an elevated, personalized and seamless experience. Our DTC strategy also gives us access to valuable real-time customer data that we leverage in all aspects of our business, including apparel design and merchandising, customer acquisition and retention, demand forecasting and inventory optimization. We are able to use data to tailor the digital experience to healthcare professionals based on a number of factors, including whether that individual has purchased from us before, which products they have purchased, what size they wear, which colors they prefer and what type of healthcare professional they are. We capture demographic, geographic and psychographic data that enables us to reliably predict buying patterns, leading to operational efficiencies throughout our supply chain, inventory management and new product development.
89
Table of Contents
Highly Effective Merchandising and Product Launch Model
We have developed a highly effective merchandising strategy, anchored by our recurring, functional offering of 13 core scrubwear styles, which represented approximately 82% of our net revenues in 2020. We offer these core styles in six core colors as well as limited edition colors to generate excitement around the brand and create a sense of purchase urgency. The remaining 18% of net revenues in 2020 was generated by limited edition scrubwear styles as well as our lifestyle apparel and other non-scrub offerings, which include lab coats, underscrubs, outerwear, activewear, loungewear, compression socks, footwear, masks, face shields and other products. For our limited edition colors and styles, we utilize a disciplined buying approach with shallow initial buys and data-driven repurchasing decisions to minimize inventory risk while creating scarcity. We launch limited edition colors or styles approximately weekly, driving recurring traffic to our digital platform where customers often purchase limited edition products along with our core offerings. These launches not only drive interest in the limited edition products themselves, they also drive our core business, as, on average, 90% of sales on launch days are core styles. This innovative, lower-risk merchandising strategy drives recurring demand while maintaining inventory efficiency. As an additional benefit, our approach has resulted in a return rate of approximately 10% in 2019 and 2020, which is far lower than the broader online apparel return rates that tend to be in the 30% to 40% range.
Attractive Financial Profile Driving Robust Growth, Profitability and Cash Flow Generation
Our business model supports our attractive financial profile characterized by robust growth, profitability and cash flow generation. We have built an industry-leading business with only approximately $60.0 million of outside equity capital raised between 2013 and 2020, reflecting our focus on scalability and capital efficiency. As a successful DTC brand with a highly effective merchandising model, we benefit from structurally advantaged product margins. Through our DTC strategy, we leverage data in our marketing initiatives to drive efficient customer acquisition and retention, which has contributed to our rapid growth and strong profitability. In 2020, we delivered net revenue growth of 138%, gross margins of 72.3%, operating income margins of 22.0% and Adjusted EBITDA margins of 26.3%. Due to our modest capital expenditure requirements, we enjoy significant cash flow generation.
Mission-Driven, Founder-Led Culture and Execution
Our company culture, strategic vision and operational execution are driven by our visionary co-founders and co-Chief Executive Officers, Heather Hasson and Trina Spear. Ms. Hasson and Ms. Spear are successful entrepreneurs who offer highly complementary skillsets that have helped to scale FIGS from selling out of the back of a car to generating net revenues of $263.1 million in 2020. Our Chief Financial Officer, Jeff Lawrence, who previously served as Chief Financial Officer of Domino’s Pizza, brings over 25 years of experience from his prior roles driving technology and digital strategies, international expansion and overall financial success.
Our company culture mirrors our founders’ mission to celebrate, empower and serve those who serve others. We understand that authentically serving humans starts from within, and we are passionate about supporting our community and ensuring that our company reflects the world we want to live in. Through Threads for Threads, we donate medical apparel to healthcare professionals in need around the world. We are committed to operating responsibly and promoting ethical and sustainable business practices through our sourcing and manufacturing. We prioritize building a diverse, inclusive, equitable and supportive team that is driven by creativity and purposeful innovation.
Our Growth Strategies
In 2020, the total addressable market of the U.S. healthcare apparel industry was approximately $12.0 billion, according to the Frost & Sullivan study. Notwithstanding our rapid growth, we estimate that our share of this U.S. healthcare apparel industry was approximately 2.1%, presenting substantial opportunity for
90
Table of Contents
further growth. We believe we are well-positioned to significantly expand our market share and drive sustainable growth and profitability by executing on the following strategies:
Continue to Increase Customer Loyalty
We have the opportunity to create customers for life—customers who return to FIGS repeatedly throughout their medical careers. Healthcare apparel continuously needs to be replenished, resulting in highly predictable, recurring demand. As a result, customer loyalty and retention will continue to be a key driver of our growth. We encourage repeat purchases by introducing innovative limited edition styles, products and color drops. We inspire customer loyalty by building authentic relationships with our community and by creating thoughtful brand and performance marketing focused on retention. For example, through our #FIGSLOVE program, we send special gifts, such as embroidered lab coats, to members of our community when they graduate from school, open a new practice or reach other career milestones. We aim to be part of their journey, building deep, lasting relationships along the way.
For customers that were acquired between 2017 and 2019, approximately 50% returned for a second purchase, demonstrating our high customer retention and engagement. After a second purchase, 63% of those customers in that cohort purchased again. After a third purchase, 70% of those customers in that cohort purchased yet again. For our repeat customers, the average number of days between purchases is 98 days. Customers that we retain also tend to spend more with us over time. Our 2017, 2018 and 2019 customer cohorts increased revenue per customer per cohort from year 0 to year 1 by 54%, 52% and 62%, respectively. Our repeat customers make frequent purchases, buy a variety of products and become evangelists for our brand. By leveraging data analytics and developing new personalization capabilities, we plan to continue to deepen our existing customer relationships to further improve our strong customer retention and engagement.
Grow Brand Awareness and Attract New Customers
As of June 30, 2021, we served a community of approximately 1.6 million active customers, which compares to a broader total addressable market of over 20 million healthcare professionals in the United States. In addition, while men on average represented approximately 25% of the U.S. healthcare workforce in 2019, our men’s business represented only 17% of our net revenues in 2020, presenting significant opportunity to expand our customer base.
We have a significant opportunity to grow brand awareness and attract new customers to FIGS through word of mouth, brand marketing and performance marketing. Among U.S. healthcare professionals and medical students, we have aided and unaided brand awareness of 55% and 22%, respectively, according to a survey performed by Frost & Sullivan. See “Industry and Market Data” for additional information. Hospitals and other healthcare institutions, which often employ thousands of healthcare professionals working in close physical proximity on a daily basis, serve as ideal environments for growing awareness of our brand through word of mouth. Brand marketing and performance marketing also work together to drive millions of visits to our digital platform. We create differentiated brand marketing content to grow and retain our loyal community while highlighting the spirit of the FIGS brand. We leverage authentic relationships with healthcare professionals who serve as Ambassadors by exhibiting outsized engagement with our community through social media. We complement social media efforts with offline brand marketing strategies, such as billboards and commercials, that deliver emotional and inspiring content that drive brand awareness. Our digital-centric performance marketing efforts are designed to drive customers from awareness to consideration to conversion. These efforts include retargeting, paid search and product listing advertisements, paid social media advertisements, search engine optimization, personalized email and mobile push notifications through our app. Our highly productive, diversified strategy generates a significant return on new customer acquisition investments resulting from high average order value, strong product margins and attractive repeat purchase behavior.
Broaden Our Lifestyle Offerings
We intend to continue to leverage healthcare professionals’ trust in our technical function, fit, comfort and style, as well as our rapid product development capabilities to broaden and deepen our product offerings. We
91
Table of Contents
have strategically expanded our addressable market over time by creating new innovative products and entering or creating new categories that are complementary to our core offerings. Our category expansion strategy is focused on outfitting the medical professional—on and off shift—to work, at work and from work. Our customers often begin their FIGS journey with our core scrubs and expand their purchases to limited edition scrubs and lifestyle and other products, such as underscrubs, outerwear, activewear, loungewear, compression socks, footwear, masks and face shields. As we continue to expand our offerings to fully outfit the medical professional, we believe we have a significant opportunity to continue to expand our share of both the uniform and lifestyle wardrobe of our customers.
Utilize Data Science to Expand Our Community, Elevate Customer Experience and Drive Intelligent Replenishment
We expect to drive continued growth from our use of proprietary data science. Through hundreds of data attributes associated with millions of customers, we have a unique ability to welcome new healthcare professionals to our community and drive repeat business from them. As just one illustration of this, we are able to identify geographic regions where FIGS is under-represented, use our knowledge of existing community members to build machine learning-derived customer segments to identify who is most likely to purchase from us, and drive our customers to a digital experience that is pre-populated with the products most likely to appeal to them.
Similarly, we believe that traditional fixed-time subscription models do not sufficiently leverage data and thus are disconnected from a healthcare professional’s actual needs. Instead, we use an intelligent replenishment model that is tied to individualized buying preferences. To us, it is fundamental that we cater to the unique preferences of each healthcare professional—how often they want to buy certain products, which products they are most likely to buy, and through which channel they are most likely to transact. By leveraging data science, we are able to answer these questions for each member of our large and growing community in increasingly accurate ways, and to create replenishment opportunities that are tied to those customized needs. The healthcare professionals we serve are among the busiest people in the world and we respect their time. Using data science to make their buying experience as seamless and accommodating as possible is a fundamental part of the value we create for our community and we believe will drive continued growth for our business.
Pursue International Expansion
While we expect the majority of our near-term growth to continue to come from the United States, we believe there is a tremendous opportunity over the long term to serve healthcare professionals throughout the rest of the world. According to the Frost & Sullivan study, the number of healthcare professionals and medical students internationally is expected to grow from approximately 118 million in 2020 to an estimated 124 million in 2025, and the total addressable market for international healthcare apparel is expected to grow from an estimated $67.0 billion in 2020 to an estimated $86.0 billion in 2025. In 2020, we successfully piloted international expansion by selling into Australia, Canada and the United Kingdom. Customer reception to date in these markets has been strong and has proven that our brand resonates with customers outside of the United States. Over time, we plan to enter other new markets. We intend to make strategic investments in these markets as we seek to enhance our ability to serve our international customers and further establish FIGS as a global brand. In order to offer a more localized experience to customers internationally, we plan to launch products that are specific to local markets and digital experiences that are tied to local culture. We also intend to offer market-specific languages, currency and content, as well as strategic international shipping and distribution hubs. We plan to leverage our social media strategy and expand our network of Ambassadors to grow our brand awareness globally.
Enter New Professional Markets
Outside of the healthcare apparel industry, we believe we have a compelling long-term opportunity to enter into other uniform-wearing professional markets. In the United States, there are 40 million people outside of
92
Table of Contents
healthcare in service-based industries that traditionally wear uniforms every day, such as food service, hospitality, construction and transportation. The occupational nature of these professions is generally hands-on, labor-intensive and often requires apparel with technical specifications. Furthermore, we believe the incumbent apparel manufacturers in these markets suffer from limitations similar to those faced by the legacy healthcare apparel manufacturers. In our view, these markets—similar to the healthcare apparel market—have long been underserved by incumbent apparel manufacturers and are ripe for disruption. We believe we are strategically positioned to leverage our core competencies to expand into these new markets in the future.
Our Products
We approach product design with the healthcare professional in mind. With an intimate understanding of how medical professionals move, work and interact with colleagues and patients, we seek to design products that solve their unique needs. We are constantly challenging ourselves to create the highest quality and most innovative fabrications, styles and product features for healthcare professionals. Our apparel is comfortable, durable, functional and stylish, all at an affordable price point. As a result of our efforts, healthcare professionals now have a destination to outfit themselves with products that allow them to look, feel and perform at their best.
We Believe in Continuous Innovation
The needs of healthcare professionals are always changing, and we aim to understand and address their needs through direct interactions with our community. We leverage customer data, customer feedback, focus groups and practitioner testing to understand how to best serve healthcare professionals. Our Ambassadors and other healthcare professionals test our products in real world circumstances and provide valuable and practical feedback. Our tight feedback loop through our digital platform and social media channels, as well as our customer experience team, enables us to quickly incorporate ideas from our community into our product design. The healthcare community is always innovating, and our talented design and product development teams are inspired by this community to create innovative designs that solve real problems. The combinations of art and science, and form and function, create the foundation for every product we make.
| • | Fabric Innovation for Comfort and Performance. We believe healthcare professionals deserve to be outfitted in technical apparel that allows them to perform at their best, which is why we developed our own proprietary scrubs fabric and fabrication system. Our FIONx scrubs fabric is extremely soft and features Silvadur antimicrobial technology for odor control and fabric durability, four-way stretch to allow for greater mobility, moisture-wicking properties to assist with body temperature regulation and anti-wrinkle for extra convenience. |
| • | Functional Innovation. We have redefined scrubs to meet the unique needs of healthcare professionals. Our scrubs have a large number of specially designed pockets to comfortably hold professional equipment, such as stethoscopes, iPads, charts, dental loupes and flushes. They also include bungee loops for security badges and other pockets for personal belongings, such as keys, phones, wallets and rings. As an extra surprise, we include a hidden inspirational message on every FIGS product. |
| • | Fit Innovation. Our technical design team ensures our products are tailored to provide optimal fit, comfort and mobility. In addition, we believe in fit inclusivity and strive to outfit every healthcare professional. Accordingly, we offer seven sizes for women (XXS-2XL), six sizes for men (XS-2XL), three lengths for women (petite, regular, tall) and three lengths for men (short, regular, tall). We also offer various maternity offerings. |
| • | Style Innovation. We believe that healthcare professionals have the right to be stylish and look good while wearing their uniform. Our design and apparel team is comprised of experts throughout the technical fashion world, ensuring that our products have a sophisticated silhouette in addition to being comfortable, high-performing and functional. Our products are designed for a medical professional’s lifestyle—on and off shift—to work, at work and from work. |
93
Table of Contents
Product Offerings
Mix of 2020 Net Revenues
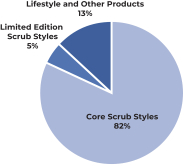
Our core scrubwear assortment, which consists of 13 styles available on our digital platform year-round, represented 82% of our net revenues in 2020. Our core styles consist of three women’s scrub tops, four women’s scrub pants, three men’s scrub tops and three men’s scrub pants. We offer these core styles in six core colors as well as new and exciting limited edition colors. In addition to our core scrub styles, we offer scrubs in limited edition styles, which represented 5% of our net revenues in 2020. The remaining 13% of our net revenues was generated from sales of our lifestyle apparel and other non-scrub offerings.
94
Table of Contents
Core Scrubwear Styles

From left to right: Women’s Catarina One-Pocket Scrub Top ($38) & Zamora Jogger Scrub Pants ($48) | Men’s Chisec Three-Pocket Scrub Top ($38) & Cairo Cargo Scrub Pants ($48)
Limited Edition Scrubwear Styles

From left to right: Men’s Kale Scrub Top ($48) & Lodhi Scrub Pants ($56) | Women’s Jundah Scrub Top ($48) & Mundri Scrub Pants ($58) | Women’s Keji Scrub Top ($48) | Men’s The 20 Pocket Scrub Pants ($56)
95
Table of Contents
Lifestyle Apparel and Other Non-Scrub Offerings
Our lifestyle apparel and other non-scrub offerings include lab coats, underscrubs, outerwear, activewear, loungewear, compression socks, footwear, masks, face shields and other products. Our lab coats are designed for both students and professionals and feature technical liquid repellent and anti-static fabric with functional pockets for stethoscopes, tablets and pens.

From left to right: Women’s Bellvue Long Lab Coat ($118) | Men’s Huacho Lab Coat ($128)
Our underscrubs include choices of our supersoft Pima cotton or moisture-wicking performance seamless fabrications.

From left to right: Women’s Salta Performance Underscrub ($58) | Men’s Makato Performance Underscrub ($58)
96
Table of Contents
We offer activewear, including sports bras and performance leggings for the active medical professional.

From left to right: 300 Performance Sports Bra ($48) | 300 Performance Legging ($68)
We also offer outwear for healthcare professionals to wear on and off shift, including fleeces and scrubs jackets.

From left to right: Men’s On-Shift Fleece ($98) | Women’s On-Shift Fleece Vest ($98) | Men’s Cobaki Performance Scrub Jacket ($88) | Women’s Sydney Performance Scrub Jacket ($88)
97
Table of Contents
Our men’s and women’s compression socks feature light compression to help relieve leg fatigue, and we are regularly introducing new sock designs that feature witty sayings or clever puns.

From left to right: Compression Socks— Love EKG, Tropical Vibes Black, Pink Pills, Blood, Tropical Vibes Green, Blue Pills ($28)
We also sell a number of other products that are meant to outfit the modern healthcare professional from head-to-toe, including masks, face shields, scrub caps, lanyards and badge reels. We also offer tote bags, fanny packs, backpacks, baseball caps and beanies.

Clockwise from top left: FIGS High-Def Face Shield ($18) | FIONx Face Masks ($8) | FIGS | New Balance ($98)
98
Table of Contents
Our products work together as part of the FIGS Layering System, and are intentionally designed from base layer to outer layer, on shift to off shift.

Our Community of Awesome Humans
We strive to celebrate, empower and serve healthcare professionals across all levels of experience and areas of expertise. While there is considerable diversity in demographics and income levels within the healthcare sector, we attract a diverse range of healthcare professionals by having a differentiated brand and offering premium products at an affordable price point. We estimate that our active customer mix in 2020 was comprised of the following:
| Healthcare Professionals |
Gender |
Age | ||

|
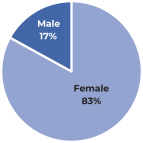
|
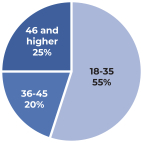
| ||
Our customers included a wide range of experience levels and areas of expertise, including registered nurses, nurse practitioners, orthodontists, dental hygienists, pharmacists, physical therapists, occupational therapists, veterinarians, sales representatives, estheticians, speech pathologists, emergency medical technicians, surgeons and healthcare administrators, among others. As a testament to the affordability of our products, in 2020, approximately two-thirds of our customer base earned less than $100,000, and approximately one-third of our customer base earned less than $50,000. Due to the high proportion of our customer mix that is comprised of students and young professionals whose earnings will grow over the course of their careers, we believe we are well positioned to retain and increase engagement of these customers, expanding our share of their uniform and lifestyle wardrobe over time.
Our Marketing Strategy
We create differentiated brand marketing content and utilize performance marketing to drive customers from awareness to consideration to conversion. Our fluidity in brand and performance marketing has led to the creation of a brand characterized by stickiness and high purchase frequency.
99
Table of Contents
Brand Marketing
We attract and retain customers in large part through our unique ability to engage with our community, which we do across multiple channels, including marketing campaigns, social media and our Ambassador Program.
Marketing campaigns. Our marketing campaigns, which feature some of the Awesome Humans in our community, have established FIGS as a leader of innovative storytelling. All of our creative assets are created in-house, allowing us to launch campaigns at an accelerated pace to celebrate the products we bring to market and the people who will wear them. We launch at least two fully integrated 360-degree marketing campaigns each year that feature Awesome Humans in larger-than-life scenarios, bringing the people, their profession and our brand to life. Campaigns are launched through a holistic, multi-media strategy, where hero messaging and imagery are woven through every platform, including email, digital, display, site, direct-mail, commercials, social media and Ambassadors. We believe our campaigns and inspiring messaging contribute to high brand affinity among our community.
In July 2020, FIGS launched its New Icons Campaign, a 360-degree marketing campaign celebrating healthcare professionals serving on the frontline of the COVID-19 pandemic the way FIGS has always viewed them: as icons. By drawing on the resilience, dedication and endurance required to excel in healthcare, FIGS brought various individuals’ unique challenges and stories to life. Some of the Awesome Humans featured in The New Icons Campaign included:
| • | Adam C., M.D.; Emergency Medicine Physician. Adam, an Emergency Medicine Physician, had the unique and challenging experience of fighting the pandemic on both coasts as the surge traveled from New York to California. When COVID-19 hit New York, Adam was just a few months away from completing his Emergency Medicine Residency program. Once his program finished, Adam started his first full-time job in California to fight the second wave of the pandemic. |
| • | Ana W., R.N.; Emergency Medicine Nurse. As Ana watched the pandemic unfold, she knew she had to leave the comfort of her home in San Diego, California to help her fellow healthcare professionals in New York. With encouragement from her husband and two sons, Ana first joined the frontline responders in Harlem, New York treating COVID-19 patients. She then completed two additional emergency medicine tours in some of the hardest hit areas of Texas – leaving her family for upwards of six weeks at a time. |
| • | Lexie R., R.N.; Pediatric Intensive Care Unit Transport Nurse. Lexie is a nurse and a member of the transport team for her pediatric intensive care unit. She’s on call for up to 96 hours at a time, and when her beeper goes off, she moves into action quickly. She does her job almost entirely in the air, in the confines of a helicopter, with an extremely minimal team. |
| • | Darien S., M.D., M.B.A.; Emergency Medicine Physician. Darien is a New York-based Emergency Medicine Physician. Darien witnessed the toll of the pandemic while treating patients in the ER. Darien is a medical contributor for ABC News and uses his platforms to educate others, inspire future healthcare professionals and stop the spread of misinformation. |
The New Icons Campaign included commercial films, out-of-home placements, a capsule scrubs collection, digital and social content and the launch of a giving initiative to support the next generation of healthcare professionals—The New Icons Grants. Five grant winners were selected from thousands of healthcare industry applicants and each received $50,000 to help pay for tuition and student loans.
100
Table of Contents
Social Media. We were the first healthcare apparel company to have a significant presence on social media. We use social media to foster a dialogue with our community and grow an enthusiastic, highly engaged fan base. On Instagram, our primary platform, we have on average doubled our number of followers year over year since our launch and have a four-year follower growth rate of over 2,400%. Today, we have over half a million followers on Instagram, which is almost twice the number of followers of our nearest competitor. We are proud of our robust following and above-average engagement rate, which was 1.7% in 2020 (versus the industry average of 0.8%). Social media is the primary place for our community to congregate, share stories, follow product launches and interact with our brand, and in turn, our community shares feedback that informs our product and content decisions. We strive to create content that has value and purpose—whether to amplify a cause, make people laugh, or to celebrate and educate about our product—and social media is where our creativity and deep connection to our community meet.
Our Ambassador Program. FIGS is the first company to have brand ambassadors in the healthcare apparel industry, providing a platform for healthcare professionals to tell their stories. Our Ambassador Program consists of hundreds of Awesome Humans from around the world, representing a diverse array of specialties and levels of experience across various professions and geographies. We have formed deep and meaningful relationships with our Ambassadors and their loyalty, love and involvement with our brand fosters organic sharing, storytelling and intimate connections with the millions of healthcare professionals in our community. Our Ambassadors are inspiring, teaching and mentoring the next generation of healthcare professionals, and their impact goes beyond social media—they’re teaching at conventions, leading organizations and associations, and innovating within their specialties, bringing FIGS with them everywhere they go. Our Ambassadors are an extension of our team, and we regularly speak with them about their lives and how we can help support them. Through annual events, such as our three-day, four-night FIGS Immersion, we bring together our community to share their experiences, heal from trauma and, most importantly, bond. Our Ambassador Program is a microcosm of our FIGS community—they are invaluable to us, they inspire and inform everything we do, and we would not be where we are today without them.
Performance Marketing
Our performance marketing is rooted in a digital centric approach that aims to offer the right products to the right healthcare professionals at the right times. Our sophisticated performance marketing efforts include retargeting, paid search and product listing advertisements, paid social media advertisements, search engine optimization, personalized email and mobile push notifications through our app. When combined with our community-driven brand marketing, our performance marketing supports attractive customer acquisition and retention metrics. Because we can pinpoint specifically who our customers are and where they live and work, we are able to target them with greater efficiency and less expense than other companies whose customers come from a much less defined group.
Our Teams Business
We have built a differentiated B2B custom platform, known as Teams, to revolutionize, consumerize and elevate what had previously been an outdated buying process for institutional customers. Through Teams, healthcare administrators can seamlessly and efficiently solicit individual orders and then buy FIGS products for their teams with only a few clicks. Our Teams business is centered around partnering with institutional departments and medical offices that wish to standardize and professionalize their teams. Our model is entirely inbound: teams apply to enter our program through an elegant and exclusive, concierge-like experience. We have partnered with departments at renowned institutions such as Children’s Hospital of Los Angeles and the Herman Ostrow School of Dentistry of USC.
101
Table of Contents
Our Data Analytics
Data is an essential and embedded capability throughout our organization. We have centralized Data Science and Data Engineering teams and de-centralized Data Analysts working directly within each key functional area. This approach enables the harvesting and management of extensive data, the development of a suite of proprietary tools, and the direct and rapid application of data science in core operating activities and decision-making processes throughout the company.
The scale of our data is vast and growing. A rich set of hundreds of data attributes is associated with millions of customers; the customer data set is a blend of first-party, deterministic and observed behaviors along with a complementary, expanded set of enriched elements derived from data science. In addition, we have established a unique approach to capturing and tracking precise and granular data from all stages of the order journey. These extensive data sets are used to build proprietary data science solutions applied to key functions across the company, including product, supply chain, merchandising and inventory management, marketing and customer experience.
Product
Drawing upon our full breadth of data and using data science solutions to cluster, segment and visualize our customers, we are able to develop richly detailed pictures of our customers. We use these personas to shape our unique understanding of our customers and to inform our product development. Our customer and demand prediction models deliver not only direct predictions, but also provide inferences on the drivers of those predictions. Those inferences include powerful insights into the products, features, functionality and other factors that are most likely to drive conversion. We use those inferences as inputs into the product design and development process.
Supply Chain
We have built a proprietary integration for our product lifecycle from purchase order to manufacturing to shipping. This deep integration enables extensive management and oversight of the product flow and also fuels a variety of prediction models (e.g., inventory planning and analytics). By combining the product lifecycle data integration with sophisticated demand predictions, we are able to continuously assess the supply chain and improve efficiency.
Merchandising and Inventory Management
Through our customer ontology, we develop precisely defined customer segments that roll-up into a mosaic representation of our customers. This approach allows us to understand buying behaviors, preferred DTC channels (e.g., site, social, SMS), product preferences and decision drivers. It also enables us to manage purchasing and inventory effectively and efficiently. We use data-driven models to predict and anticipate demand for our products. The high concentration of core scrub sales enables our merchandising and inventory models to be highly predictive, which reliably extends to limited edition product launches through advanced data science techniques. Through our customer and demand predictions, we are able to anticipate optimal times for launch, including day of week and time of day.
Marketing
We are also able to use our customer ontology to create customized segments that can be launched efficiently across media channels. This precise segmentation supports highly tailored messaging and lower costs per impression. We employ a suite of dynamic learning tools to understand creative performance and behavior at a granular customer segment level. These tools enable us to more effectively develop and place our creative assets. Combining our micro-segments and creative optimization drives our ability to create finely tuned campaigns that allow us to reach our target audiences with creative assets that we believe have the highest probability to drive conversion.
102
Table of Contents
Customer Experience
The integration of our customer ontology and predictions into the engineering of our DTC channels enables customized customer experiences. For example, we are able to use customized email and SMS communication to deliver personalized recommendations and offers that are more likely to convert into a purchase. We continue to evolve the site experience to support tuned recommendations based on prediction models and to offer product bundles based on cluster analysis. Using our customer data, we are able to determine individual customer level predictions to make direct and tailored outreach with messaging that has a higher probability of success for each customer. This means that we can provide a better customer experience by presenting products that the healthcare professionals in our community need, exactly when they need them.
Our Technology
In addition to our use of data analytics throughout the company, we internally develop custom, proprietary technology solutions where doing so would be a true differentiator and core to the unique needs of our community, and we otherwise leverage best-of-breed, third-party components and software to help build out our platform capabilities. Consistent with this philosophy, we created our own headless digital platform, which is a fully customized front-end architecture that allows our community of healthcare professionals to experience features and functionality that are specifically tailored to their needs. We then combine that customized presentation layer with the backend engine from Shopify, which is a proven and industry-leading e-commerce solution. By pairing our own in-house technology with cloud software, we have been able to create a truly differentiated user experience that we can adjust as necessary while also leveraging engineering talent from some of the best SAAS companies in the world to scale rapidly and efficiently.
Supply Chain
We have built a supply chain that is optimized for our business and through which we control the design, development and fulfillment of our products.
Manufacturing
We have a diversified and flexible supply chain that leverages third-party suppliers and manufacturers to produce our raw materials and finished products. We directly and actively manage every step of our product development and production process. The extent to which we manage production is differentiated from the typical model of primarily relying on third-party agents to manage production. We believe our approach has enabled us to produce premium products through greater control of the end-to-end production process.
Our in-house innovation and design team works closely with our suppliers to develop the materials for our products that meet our exact specifications for comfort, stretch, durability, functionality and performance. In 2020, approximately 92% of our production utilized our main scrubwear fabric technology FIONx, which enables us to achieve consistency and scale. Our in-house production team selects our fabric and trim suppliers, directly manages the relationships between these suppliers and our finished product manufacturers, and drives our production allocation strategy and production schedules.
We have 13 core scrubwear styles that we produce year-round, which represented 82% of our net revenues in 2020. Similar to our core FIONx fabric, the continuous production of our core scrubwear styles provides us with consistency and scale in our production. We have three manufacturing partners that produce our core scrubwear styles across nine different facilities in South East Asia. For production outside of our core scrubwear category, we have additional manufacturing partners located across Asia and South America. We manage a diversified supplier network, which consisted of approximately 30 global production partners across 12 countries in 2020.
103
Table of Contents
As a company devoted to the needs of healthcare professionals, quality is critically important to us. We have our own in-house quality control team and also independent third-party quality controllers that each conduct detailed quality control checks on our fabric, trims and finished products to ensure that our extremely high quality standards are met. We maintain stringent Acceptable Quality Limit, or AQL, standards, which define the level of quality required to pass our inspection processes. Within our core scrubwear, we maintain an AQL of 1.5 for our finished garment production, which is significantly more rigorous than the apparel industry average of 2.5.
We purchase our finished product from our manufacturers on a purchase order basis and do not have any long-term agreements requiring us to use any supplier or manufacturer. We have long-standing relationships with our vendors, which are strengthened by the consistency and longevity of our core fabric and core style profile. Further, unlike typical apparel brands, we offer our manufacturing partners predictable and consistent growth in inventory purchases with less seasonality.
We regularly source new suppliers and manufacturers to support our ongoing innovation and growth, particularly in our non-scrub categories, and we carefully evaluate all new suppliers and manufacturers to ensure they share our standards for quality of manufacturing, ethical working conditions and social and environmental sustainability practices. In line with our values, we require all of our manufacturers to be certified through the Worldwide Responsible Accredited Production (WRAP) program, which is an independent organization dedicated to promoting safe, lawful, humane and ethical manufacturing. Furthermore, we require all suppliers and manufacturers to contractually commit to upholding these standards. Once a vendor is part of FIGS’ production network, our in-house production team partners with third-party inspectors to closely monitor each partner’s compliance with applicable laws and FIGS’ standards on an ongoing basis.
Warehouse and Embroidery
We ship our finished products to customers across the United States as well as internationally to Australia, Canada and the United Kingdom. We distribute our products from our fulfillment center located in City of Industry, California, where we have created an innovative warehouse-within-a-warehouse model at our third-party logistics provider’s site. Within this space, we also operate a technology-enabled embroidery workshop, through which we offer text and logo embroidery on scrub tops, lab coats and outerwear, enabling our healthcare professionals to tell the world who they are and what they do. Our embroidery workshop is fully staffed by FIGS embroidery team members who complete the application and quality control of our embroidery product. We regularly evaluate our distribution infrastructure and capacity to ensure that we are able to meet our anticipated needs and support our continued growth.
Our People and Human Capital
As a company whose mission is to celebrate, empower and serve those who serve others, we understand that authentically serving humans starts from within. At FIGS, we are creating the world we want to live in, and we work hard to ensure that our company reflects what we want to see in our community. We prioritize building a diverse, inclusive, equitable and supportive team that is driven by creativity and purposeful innovation and represents a mix of gender, racial and ethnic backgrounds, industries and levels of experience.
We are growing fast and recognize that the awesome individuals who work at FIGS are at the center of our success. As of June 30, 2021, we employed 233 team members in the United States across our Santa Monica, California headquarters, our City of Industry, California fulfillment center location and remote locations, with women and people of color representing 68% and 38%, respectively, of our workforce, as of March 10, 2021. None of our employees is represented by a labor union. We have not experienced any work stoppages and we consider our relations with our employees to be good.
104
Table of Contents
We believe that in order to be successful, each of our employees must feel empowered to be able to show up as their true authentic selves. As we continue to grow, we are proactive in ensuring that every single person at FIGS has a platform to be seen, heard and celebrated. To accomplish this goal, we are intensely focused on our culture, recruiting, retaining and incentivizing our employees, employee development and engagement, diversity, equity and inclusion and community outreach. In 2020, we launched a Culture Committee to foster an empowering and supportive experience for all FIGS employees and help ensure that all FIGS voices are represented and heard. In addition, in light of COVID-19, we introduced new well-being perks, like food delivery stipends and virtual gym memberships, and team-building initiatives to nurture a sense of togetherness during a time when we could not be together physically.
Competition
Competition in the healthcare apparel industry is principally on the basis of product quality, innovation, style, price, brand image, distribution model, as well as customer experience and service. We believe we have competitive advantages from our technical product innovation, our focus on empowering the community of healthcare professionals, and our high quality brand image. In addition, we believe our digitally native DTC distribution strategy differentiates us from the industry incumbents and allows us to establish personal customer relationships and more effectively support healthcare professionals. We are also differentiated by our commitment to community-based marketing that increases brand awareness and strengthens customer loyalty.
The healthcare apparel industry includes established companies as well as new entrants. We compete against wholesalers of healthcare apparel, such as Careismatic Brands, Barco Uniforms, Landau Uniforms and Superior Group of Companies. Additionally, we compete with healthcare apparel aggregated retailers, such as Scrubs & Beyond and Uniform Advantage, as well as DTC brands such as Jaanuu.
Government Regulation
In the United States and the other jurisdictions in which we operate, we are subject to labor and employment laws, laws governing advertising, safety regulations and other laws, including consumer protection regulations that apply to the promotion and sale of merchandise and the operation of fulfillment centers and privacy, data security and data protection laws and regulations, such as the California Consumer Privacy Act (CCPA), the General Data Protection Regulation 2016/679 (GDPR), the ePrivacy Directive and national implementing and supplementing laws in the European Economic Area. Our products sold outside of the United States may be subject to tariffs, treaties and various trade agreements, as well as laws affecting the importation of consumer goods. We monitor changes in these laws and believe that we are in material compliance with applicable laws.
Our Intellectual Property
To establish and protect our proprietary rights, we rely on a combination of trademark, patent, copyright and trade secret laws, as well as contractual restrictions in license agreements, confidentiality and non-disclosure agreements and other contracts. Our intellectual property is an important component of our business, and we believe that our know-how and continuing innovation are important to developing and maintaining our competitive position. We also believe having distinctive marks that are readily identifiable on our products is an important factor in continuing to build our brand and distinguish our products. We consider the FIGS name and CROSS & SHIELD logo trademarks to be among our most valuable intellectual property assets. In addition, we have applied to register or have registered the trademarks for several of our fabrics and product names, and have also sought and/or obtained trademark registrations for several of our tag lines.
As of September 3, 2021, we owned seven U.S. trademark registrations, had five pending U.S. trademark applications, owned 62 foreign trademark registrations and had 30 pending foreign trademark applications.
105
Table of Contents
As of September 3, 2021, we have submitted 13 U.S. design patent applications and filed 39 foreign design registrations. Each of these designs relates to our core scrubs. The term of protection for design patents and design registrations is limited in duration and depends on the jurisdiction in which they are granted. Although our U.S. design patent applications have not yet issued, the term for any resulting issued design patents in the U.S. generally extends 15 years from the date of patent grant. If the foreign design registrations issued to us are maintained until the end of their terms, they are expected to expire in 2025, at which point we intend to renew them, to the extent they are renewable. We intend to pursue additional intellectual property protection to the extent we believe it would be beneficial and cost-effective.
While there is no active litigation involving any of our patents or other intellectual property rights, and we have not received any notices of patent or other intellectual property infringement, we may be required to enforce or defend our intellectual property rights against third parties in the future. See “Risk Factors—Risks Related to Information Technology, Intellectual Property and Data Security and Privacy” for additional information regarding these and other risks related to our intellectual property portfolio and their potential effect on us.
Our Facilities
We are headquartered in Santa Monica, California, where we lease approximately 27,000 square feet of office space under a lease agreement that expires in January 2030. We designed, built and use this location for product innovation and design, content creation, technology, customer experience, as well as our other teams. We also maintain a dedicated photo studio space at this location.
We also operate a 6,000 square foot embroidery workshop within our approximately 175,000 square feet of dedicated warehouse space at our third-party logistics provider’s location in City of Industry, California, which we lease pursuant to a services agreement.
We believe that these facilities are sufficient to meet our current and anticipated future needs and that suitable additional space will be available as needed to accommodate expansion of our operations.
Legal Proceedings
On February 22, 2019, Strategic Partners, Inc., or SPI, filed an action against us (later naming our co-founders and co-Chief Executive Officers) in Los Angeles County Superior Court, in which SPI alleged, among other things, false advertising, unfair business practices, untrue and misleading advertising, intentional interference with prospective economic relations, conversion and breach of fiduciary duty. The case was removed to the U.S. District Court for the Central District of California, or the Central District, in March 2019. On September 3, 2019, SPI filed an additional action against our co-founders and co-Chief Executive Officers (later naming us) in Los Angeles County Superior Court covering the same subject matter as the previously filed federal action; this later state court action has been stayed until the conclusion of the Central District action. On August 10, 2021, the Central District partially granted our motion for judgment on the pleadings, dismissing without leave to amend certain of SPI’s claims for unfair business practices and the entirety of SPI’s claims for conversion, breach of fiduciary and aiding and abetting breach of fiduciary duty. SPI has in response filed a motion for reconsideration, and we have opposed that motion. The Central District action is ongoing with respect to claims based on SPI’s allegations of false advertising. We believe the claims asserted by SPI in both actions are without basis or merit, and we intend to continue to vigorously defend against such claims; however, we cannot be certain of the outcome of these proceedings and, if determined adversely to us, our business and financial condition may be adversely affected.
In addition to the matter described above, from time to time, we have been and may become subject to arbitration, litigation or claims arising in the ordinary course of business. The results of any current or future claims or proceedings cannot be predicted with certainty, and regardless of the outcome, litigation can have an adverse impact on us because of defense and litigation costs, diversion of management resources, reputational harm and other factors.
106
Table of Contents
The following table provides information regarding our executive officers and directors as of the date of this prospectus.
| Name |
Age | Position(s) | ||||
| Executive Officers: |
||||||
| Heather Hasson |
39 | Co-Founder, Co-Chief Executive Officer and Director | ||||
| Trina Spear |
38 | Co-Founder, Co-Chief Executive Officer and Director | ||||
| Jeffrey D. Lawrence |
48 | Chief Financial Officer | ||||
| Non-Employee Directors: |
||||||
| J. Martin Willhite(1)(3) |
50 | Director | ||||
| Sheila Antrum(1)(2) |
63 | Director | ||||
| Michael Soenen(2)(3) |
51 | Director | ||||
| (1) | Member of the Nominating and Corporate Governance Committee. |
| (2) | Member of the Audit Committee. |
| (3) | Member of the Compensation Committee. |
Executive Officers
Heather Hasson co-founded our company and serves as our co-Chief Executive Officer and as chairperson of our board of directors. Prior to co-founding FIGS, Ms. Hasson was an entrepreneur, having served as founder and CEO of Heather Hasson bags, a high-end bag line, and FIGS Ties, a tie and scarf company. Since January 2021, Ms. Hasson also has served as a member of the board of directors of G Squared Ascend I Inc. and G Squared Ascend II Inc., two blank check companies, and as a member of the board of directors of RxArt, a non-profit whose mission is to help children heal through the extraordinary power of visual art. Ms. Hasson holds a B.A. in Political Science from the University of Wisconsin-Madison. We believe that Ms. Hasson is qualified to serve as a member of our board of directors based on her experience in the apparel industry and the knowledge of our company she brings as our co-founder and co-Chief Executive Officer.
Trina Spear co-founded our company and serves as our co-Chief Executive Officer and as a member of our board of directors. Prior to co-founding FIGS, Ms. Spear served as an Associate at the Blackstone Group Inc. Ms. Spear began her career at Citigroup Global Markets Inc. Since August 2020, Ms. Spear also has served as a member of the board of directors of one, a blank check company. Ms. Spear holds a B.A. in Economics from Tufts University and an M.B.A. from Harvard Business School. We believe that Ms. Spear is qualified to serve as a member of our board of directors based on the perspective and experience she brings as our co-founder and co-Chief Executive Officer.
Jeffrey D. Lawrence has served as our Chief Financial Officer since December 2020. Prior to joining our company, Mr. Lawrence served as Executive Vice President and Chief Financial Officer of Domino’s Pizza, Inc., a global, publicly traded restaurant chain, where he had worked since May 2000. Prior to joining Domino’s, Mr. Lawrence was a Manager of Audit and Business Advisory Services at Arthur Andersen LLP, an accounting firm, from July 1995 to May 2000. Mr. Lawrence holds a B.B.A. in Accounting from Wayne State University and an M.B.A. from the Stephen M. Ross School of Business at the University of Michigan.
Non-Employee Directors
J. Martin Willhite has served as a member of our board of directors since February 2019. Since June 2017, Mr. Willhite has served as Vice Chairman at Tulco, LLC, an investment firm. Before that, from October 2011 to June 2017, Mr. Willhite served as General Counsel at Legendary Entertainment, a film and television production company, where he also served as Chief Operating Officer from April 2013 to June 2017. Before that,
107
Table of Contents
Mr. Willhite was a Partner at Munger, Tolles & Olson, LLP, a law firm. Mr. Willhite holds a B.A. in Philosophy from Brigham Young University and a J.D. from Loyola Law School. We believe that Mr. Willhite is qualified to serve as a member of our board of directors based on his broad leadership, operational, legal and transactional experience.
Sheila Antrum has served as a member of our board of directors since May 2021. Since 2007, Ms. Antrum has served in roles of increasing responsibility at the University of California, including serving as the Senior Vice President and Chief Operating Officer of UCSF Health since August 2017, UCSF Health President-Adult Services since September 2015 and the Chief Nursing Officer of UCSF Medical Center from September 2007 to 2017 and again as interim Chief Nursing Officer from 2019 to 2020. Before that, from 2003 to 2007, Ms. Antrum served as the Chief of Ambulatory Operations and Associate Director of Clinical Cancer Center Operations at the University of California San Diego Medical Center. Ms. Antrum also has served on the board of directors of Integer Holdings Corporation since February 2021. Ms. Antrum holds a B.A. of Science in Nursing from Hampton University and a Master’s in Health Services Administration from the University of Michigan School of Public Health. We believe Ms. Antrum is qualified to serve as a member of our board of directors based on her extensive leadership experience in the healthcare space.
Michael Soenen has served as a member of our board of directors since May 2021. From 2015 through 2020, Mr. Soenen served as a member of the Investment Committee and Co-Head of Operations Group at Valor Equity Partners L.P., an investment firm. Before that, from 1997 to 2008, Mr. Soenen served in roles of increasing responsibility at FTD Group, Inc., a provider of floral and specialty gift products, including as President, Chief Executive Officer and Chairman from 2004 to 2008. Mr. Soenen also currently serves on the boards of directors of several privately-held companies. Mr. Soenen holds a B.A. in Economics from Kalamazoo College. We believe that Mr. Soenen is qualified to serve as a member of our board of directors based on his broad leadership, operational and transactional experience.
Family Relationships
There are no family relationships among any of our directors or executive officers.
Board of Directors Composition
Our business and affairs are managed under the direction of our board of directors. Our board of directors currently consists of five members with one vacancy.
We, our co-founders and co-Chief Executive Officers, Ms. Hasson and Ms. Spear, Tulco, LLC and certain related persons and entities have entered into a voting agreement under which such parties have agreed, upon the terms set forth in the voting agreement, to vote their shares for the election of each of Ms. Hasson, Ms. Spear and, for so long as Tulco, LLC and its permitted transferees hold, in the aggregate, at least 10% of the total number of outstanding shares of all classes of our common stock (calculated on a diluted basis to include any issued and outstanding options, RSUs or other equity awards, whether vested or unvested), an individual designated by Tulco, LLC, Mr. Willhite, to our board of directors, and to vote against their removal. The voting agreement will be in effect until: (1) the time at which neither the co-founders nor any of their permitted transferees hold shares of Class B common stock, (2) with respect to Tulco, LLC, the time at which Tulco, LLC and its permitted transferees cease to hold, in the aggregate, at least 10% of the total number of outstanding shares of all classes of our common stock (calculated on a diluted basis to include any issued and outstanding options, RSUs or other equity awards, whether vested or unvested) or (3) a final conversion event. The conversion of our Class B common stock to Class A common stock is provided for in our amended and restated certificate of incorporation, see section titled “Description of Capital Stock—Common Stock—Conversion.”
The number of directors is fixed by our board of directors, subject to the terms of our amended and restated certificate of incorporation and amended and restated bylaws. Each of our current directors will continue to serve until the election and qualification of his or her successor, or his or her earlier death, resignation or removal.
108
Table of Contents
Classified Board of Directors
Our board of directors is divided into three classes with staggered three-year terms. Upon expiration of the term of a class of directors, directors for that class will be elected for three-year terms at the annual meeting of stockholders in the year in which that term expires. As a result, only one class of directors will be elected at each annual meeting of our stockholders, with the other classes continuing for the remainder of their respective three-year terms. Each director’s term will continue until the election and qualification of his or her successor, or his or her earlier death, resignation or removal. Our directors is divided among the three classes as follows:
| • | Class I directors, whose initial term will expire at our first annual meeting of stockholders following the IPO, consist of Trina Spear and Sheila Antrum; |
| • | Class II directors, whose initial term will expire at our second annual meeting of stockholders following the IPO, consist of Heather Hasson and Michael Soenen; and |
| • | Class III directors, whose initial term will expire at our third annual meeting of stockholders following the IPO, consist of J. Martin Willhite. |
Our amended and restated certificate of incorporation and amended and restated bylaws provide that only our board of directors may fill vacancies on our board. We expect that any additional directorships resulting from an increase in the number of directors will be distributed among the three classes so that, as nearly as possible, each class will consist of one-third of the total number of directors.
The classification of our board of directors may have the effect of delaying or preventing changes in our control or management. See the section titled “Description of Capital Stock—Anti-Takeover Provisions—Amended and Restated Certificate of Incorporation and Amended and Restated Bylaws Provisions” for additional information.
Director Independence
Our common stock is listed on the NYSE. Our co-founders and co-Chief Executive Officers, Heather Hasson and Trina Spear, and Tulco, LLC together control a majority of the voting power of our outstanding common stock and have entered into a voting agreement with respect to the election of directors. As a result, we are a “controlled company” within the meaning of the corporate governance standards of the NYSE. Under these rules, a listed company of which more than 50% of the voting power is held by an individual, group or another company is a “controlled company” and may elect not to comply with certain corporate governance requirements.
Under the rules of the NYSE, a director will only qualify as an “independent director” if, in the opinion of that company’s board of directors, that person does not have a relationship that would interfere with the exercise of independent judgment in carrying out the responsibilities of a director. As a “controlled company” we have elected not to comply with the requirement that independent directors must comprise a majority of our board of directors and that our compensation and nominating and corporate governance committees be independent.
Audit committee members must still satisfy the independence criteria set forth in Rule 10A-3 under the Exchange Act. In order to be considered independent for purposes of Rule 10A-3, a member of an audit committee of a listed company may not, other than in his or her capacity as a member of the audit committee, the board of directors, or any other board committee: (1) accept, directly or indirectly, any consulting, advisory or other compensatory fee from the listed company or any of its subsidiaries; or (2) be an affiliated person of the listed company or any of its subsidiaries. Our board of directors has undertaken a review of the independence of each director and considered whether each director has a material relationship with us that could compromise his or her ability to exercise independent judgment in carrying out his or her responsibilities. As a result of this review, our board of directors determined that each of Ms. Antrum and Mr. Soenen are “independent directors” as defined under the applicable rules and regulations of the SEC and the listing requirements and rules of the
109
Table of Contents
NYSE. In making these determinations, our board of directors reviewed and discussed information provided by the directors and us with regard to each director’s business and personal activities and current and prior relationships as they may relate to us and our management, including the beneficial ownership of our capital stock by each non-employee director and the transactions involving them described in the section titled “Certain Relationships and Related Party Transactions.”
Lead Independent Director
Heather Hasson serves as both our Co-Chief Executive Officer and as chairperson of our board of directors. Our board of directors has adopted corporate governance guidelines that provide that one of our independent directors will serve as our lead independent director. Our board of directors has appointed Michael Soenen to serve as our lead independent director. As lead independent director, Mr. Soenen will preside over periodic meetings of our independent directors, serve as a liaison between the chairperson of our board of directors and the independent directors, and perform such additional duties as our board of directors may otherwise determine and delegate.
Committees of Our Board of Directors
Our board of directors has established an audit committee, a compensation committee and a nominating and corporate governance committee, each of which has the composition and responsibilities described below. Members serve on these committees until their resignation or until otherwise determined by our board of directors. Each committee operates under a written charter approved by our board of directors that satisfies the applicable rules of the SEC and the listing standards of the NYSE. Copies of each committee’s charter are posted on the Investor Relations section of our website. The reference to our website in this prospectus does not include or incorporate by reference the information on our website into this prospectus.
Audit Committee
Our audit committee oversees our corporate accounting and financial reporting process and assists our board of directors in monitoring our financial systems. Our audit committee is responsible for, among other things:
| • | appointing, compensating, retaining, evaluating, terminating and overseeing our independent registered public accounting firm; |
| • | discussing with our independent registered public accounting firm their independence from management; |
| • | reviewing with our independent registered public accounting firm the scope and results of their audit; |
| • | approving all audit and permissible non-audit services to be performed by our independent registered public accounting firm; |
| • | overseeing the financial reporting process and discussing with management and our independent registered public accounting firm the interim and annual financial statements that we file with the SEC; |
| • | reviewing and monitoring our accounting principles, accounting policies, financial and accounting controls and compliance with legal and regulatory requirements; and |
| • | establishing procedures for the confidential anonymous submission of concerns regarding questionable accounting, internal controls or auditing matters. |
Our audit committee consists of Michael Soenen and Sheila Antrum, with Mr. Soenen serving as chair. We intend to rely on the phase-in period available to newly public companies under NYSE listing standards with respect to the requirement that our audit committee have at least three members. Our board of directors has affirmatively determined that Mr. Soenen and Ms. Antrum meet the requirements for independence under the current NYSE rules and the additional independence standards applicable to audit committee members
110
Table of Contents
established pursuant to Rule 10A-3 under the Exchange Act. In addition, our board of directors has determined that Mr. Soenen is an “audit committee financial expert” as defined in Item 407(d) of Regulation S-K promulgated under the Securities Act. Each member of our audit committee is financially literate.
Compensation Committee
Our compensation committee oversees our compensation policies, plans and benefits programs. Our compensation committee is responsible for, among other things:
| • | reviewing and approving corporate goals and objectives relevant to the compensation of our co-Chief Executive Officers, evaluating our co-Chief Executive Officers’ performance in light of these goals and objectives and setting compensation; |
| • | reviewing and setting or making recommendations to our board of directors regarding the compensation of our other executive officers; and |
| • | reviewing and approving or making recommendations to our board of directors regarding our incentive compensation and equity-based plans and arrangements. |
Our compensation committee consists of Michael Soenen and J. Martin Willhite, with Mr. Soenen serving as chair. As a controlled company, we intend to rely on the exemption from the requirement that we have a compensation committee composed entirely of independent directors. Each of Messrs. Soenen, and Willhite is a non-employee director, as defined in Section 16b-3 of the Exchange Act.
Nominating and Corporate Governance Committee
Our nominating and corporate governance committee oversees and assists our board of directors in reviewing and recommending nominees for election as directors. Our nominating and corporate governance committee is responsible for, among other things:
| • | identifying individuals qualified to become members of our board of directors, consistent with criteria approved by our board of directors; |
| • | recommending to our board of directors the nominees for election to our board of directors at annual meetings of our stockholders; |
| • | evaluating the overall effectiveness of our board of directors; and |
| • | developing and recommending to our board of directors a set of corporate governance guidelines and principles. |
Our nominating and corporate governance committee consists of Sheila Antrum and J. Martin Willhite, with Mr. Willhite serving as chair. As a controlled company, we intend to rely on the exemption from the requirement that we have a nominating and corporate governance committee composed entirely of independent directors.
Board Diversity
Each year, our nominating and corporate governance committee will review, with the board of directors, the appropriate characteristics, skills and experience required for the board of directors as a whole and its individual members. In evaluating the suitability of individual candidates, our nominating and corporate governance committee will consider factors including, without limitation, an individual’s character, integrity, judgment, potential conflicts of interest, other commitments and diversity. While we have no formal policy regarding board diversity for our board of directors as a whole nor for each individual member, the nominating and corporate governance committee does consider such factors as gender, race, ethnicity, experience and area of expertise, as well as other individual attributes that contribute to the total diversity of viewpoints and experience represented on the board of directors.
111
Table of Contents
Role of the Board in Risk Oversight
Our board of directors has an active role, as a whole and also at the committee level, in overseeing the management of our risks. Our board of directors is responsible for general oversight of risks and regular review of information regarding our risks, including credit risks, liquidity risks and operational risks. The compensation committee is responsible for overseeing the management of risks relating to our executive compensation plans and arrangements. The audit committee is responsible for overseeing the management of risks relating to accounting matters and financial reporting. The nominating and corporate governance committee is responsible for overseeing the management of risks associated with the independence of our board of directors and potential conflicts of interest. Although each committee is responsible for evaluating certain risks and overseeing the management of such risks, the entire board of directors is regularly informed through discussions from committee members about such risks. Our board of directors believes its administration of its risk oversight function has not negatively affected our board of directors’ leadership structure.
Compensation Committee Interlocks and Insider Participation
None of the members of our compensation committee is or has been an officer or employee of our company. None of our executive officers has served as a member of the board of directors, or as a member of the compensation or similar committee, of any entity that has one or more executive officers who served on our board of directors or compensation committee.
Code of Business Conduct and Ethics
We have adopted a written code of business conduct and ethics that applies to our directors, officers and employees, including our principal executive officers, principal financial officer, principal accounting officer or controller or persons performing similar functions. A current copy of the code is posted on the Investor Relations section of our website.
Non-Employee Director Compensation
2020 Director Compensation Program
During the year ended December 31, 2020, J. Martin Willhite was our only non-employee director, and as reflected in the table below, we did not provide him with any cash, equity or other compensation. Our co-founders and co-Chief Executive Officers, Heather Hasson and Trina Spear, are also members of our board of directors but did not receive any additional compensation for service as a director. See the section titled “Executive Compensation” for more information.
| Name |
Fees Earned or Paid in Cash |
Option Awards ($) |
Total ($) | |||||||||
| J. Martin Willhite |
$ | — | $ | — | $ | — | ||||||
We have reimbursed, and will continue to reimburse, any non-employee director for his or her reasonable out-of-pocket expenses incurred in attending board of directors and committee meetings.
Before the IPO, we did not have a formal policy to provide any cash or equity compensation to our non-employee directors for their service on our board of directors or committees of our board of directors. In connection with the IPO, our board of directors approved a non-employee director compensation policy as further described below.
112
Table of Contents
Director IPO Grants
Our board of directors approved the grant of RSU awards pursuant to the 2021 Plan to our non-employee directors in connection with the IPO. These RSUs became effective upon the closing of the IPO, and each had a value of $150,000 (with the number of shares determined based on the initial public offering price per share of our Class A common stock in our IPO, or the IPO Price). Each award will vest in full on the earlier of the first anniversary of the closing of the IPO and our annual stockholders’ meeting in 2022, subject to continued service as of such date.
Post-IPO Director Compensation Program
In connection with the IPO, our board of directors adopted and our stockholders approved a nonemployee director compensation program, or the Director Compensation Program. The Director Compensation Program will provide for annual retainer fees and long-term equity awards for certain of our non-employee directors each, an Eligible Director. The material terms of the Director Compensation Program are summarized below.
The Director Compensation Program consists of the following components:
Cash Compensation
| • | Annual Retainer: $50,000 |
| • | Annual Committee Chair Retainer: |
| ○ | Audit: $20,000 |
| ○ | Compensation: $15,000 |
| ○ | Nominating and Governance: $10,000 |
| • | Annual Committee Member (Non-Chair) Retainer: |
| ○ | Audit: $10,000 |
| ○ | Compensation: $7,500 |
| ○ | Nominating and Governance: $5,000 |
Annual cash retainers will be paid in quarterly installments in arrears and will be pro-rated for any partial calendar quarter of service.
Equity Compensation
| • | Initial Grant: Each Eligible Director who is initially elected or appointed to serve on the Board after the IPO automatically will be granted, on the date on which such Eligible Director is appointed or elected to serve on the Board, a restricted stock unit award with a value of approximately $150,000, multiplied by a fraction (i) the numerator of which is the difference between 365 and the number of days from the date of the immediately preceding annual meeting of the Company’s stockholders (or the effective date of the IPO, if there is no preceding annual meeting date) through the election or appointment date and (ii) the denominator of which is 365. These initial grants will vest in full on the earlier to occur of (x) the one-year anniversary of the applicable grant date and (y) the date of the next annual meeting of the Company’s stockholders following the grant date, subject to such Eligible Director’s continued service through the applicable vesting date. |
| • | Annual Grant: An Eligible Director who is serving on our board of directors as of the date of the annual meeting of the Company’s stockholders each calendar year (beginning with calendar year 2022) will be granted, on such annual meeting date, a RSU award with a value of approximately $150,000. Each annual grant will vest in full on the earlier to occur of (A) the first anniversary of the applicable grant date and (B) the date of the next annual meeting following the grant date, subject to such Eligible Director’s continued service through the applicable vesting date. |
113
Table of Contents
In addition, each Initial Grant and Annual Grant will vest in full upon a change in control of the Company (as defined in the 2021 Plan) if the Eligible Director will not become a member of the board of the Company or the ultimate parent of the Company as of immediately following such change in control.
Compensation under our Director Compensation Program will be subject to the annual limits on non-employee director compensation set forth in the 2021 Plan, as described in the section titled “Executive Compensation.”
114
Table of Contents
Executive Compensation
This section discusses the material components of the executive compensation program for our executive officers who are named in the “2020 Summary Compensation Table” below. In 2020, our named executive officers were as follows:
| • | Heather Hasson, Co-Chief Executive Officer; |
| • | Trina Spear, Co-Chief Executive Officer; and |
| • | Jeffrey D. Lawrence, Chief Financial Officer. |
2020 Summary Compensation Table
The following table sets forth information concerning the compensation of our named executive officers for 2020:
| Name and Principal Position |
Year | Salary ($) | Bonus ($)(1) | Stock Awards ($)(2) |
Option Awards ($)(2) |
All Other Compensation(4) ($) |
Total ($) | |||||||||||||||||||||
| Heather Hasson |
2020 | 456,154 | 1,000,000 | — | 38,125,365 | 47,329 | 39,628,848 | |||||||||||||||||||||
| Co-Chief Executive Officer |
||||||||||||||||||||||||||||
| Trina Spear |
2020 | 456,154 | 1,000,000 | — | 38,125,365 | 64,212 | 39,645,731 | |||||||||||||||||||||
| Co-Chief Executive Officer |
||||||||||||||||||||||||||||
| Jeffrey D. Lawrence(3) |
2020 | 1,923 | — | — | 5,402,086 | — | 5,404,009 | |||||||||||||||||||||
| Chief Financial Officer |
||||||||||||||||||||||||||||
| (1) | Amounts include discretionary bonuses paid to Mses. Hasson and Spear for their performance in 2020. We provide additional information regarding the annual bonuses in “—Narrative to Summary Compensation Table—2020 Bonuses” below. |
| (2) | Amounts reflect the full grant-date fair value of stock awards and stock options granted during 2020, rather than the amounts paid to or realized by the named individual. In 2020, Mses. Hasson and Spear were granted RSUs that are subject to both service-based and liquidity-based vesting conditions. As required pursuant to SEC disclosure rules, the grant-date fair values of these awards included in the table above were computed based on the probable outcomes of the performance conditions as of the applicable grant date; achievement of the performance conditions for these RSUs was not deemed probable on the grant date and, accordingly, no value is included in the table for these awards. Assuming achievement of the performance conditions, the values of these RSUs to each of Mses. Hasson and Spear, as of the grant date, are $12,206,554. We provide information regarding the assumptions used to calculate the value of all stock awards and option awards made to named executive officers in Note 12 to the financial statements included in this prospectus. |
| (3) | Mr. Lawrence’s employment with us commenced on December 31, 2020; therefore, certain amounts for Mr. Lawrence, such as base salary, reflect a partial year of service. |
| (4) | Amounts include Company reimbursement of legal fees. |
Narrative to Summary Compensation Table
2020 Salaries
The named executive officers receive a base salary to compensate them for services rendered to us. The base salary payable to each named executive officer is intended to provide a fixed component of compensation reflecting the executive’s skill set, experience, role and responsibilities.
In 2020, Mses. Hasson and Spear were each entitled to receive an annual base salary of $375,000, which was increased to $650,000 in September 2020. Mr. Lawrence’s annual base salary is $500,000. The 2020 Summary Compensation Table above shows the actual base salaries paid to each named executive officer in 2020.
115
Table of Contents
2020 Bonuses
In 2020, each of Mses. Hasson and Spear was eligible to receive an annual discretionary cash bonus in an aggregate amount no greater than $1,000,000, with such amount determined in the sole discretion of our board of directors. The actual bonuses paid to each executive in 2020 are set forth above in the Summary Compensation Table in the column entitled “Bonus.” Because Mr. Lawrence’s employment with us commenced on December 31, 2020, he did not receive a bonus for 2020.
Equity Compensation
We historically have used stock options as the primary incentive for long-term compensation to our employees (including our named executive officers) because they are able to profit from stock options only if our stock price increases relative to the stock option’s exercise price, which generally is set at or above the fair market value of our common stock as of the applicable grant date. Generally, the stock options we grant vest in equal monthly installments over four years, either monthly during the four-year period or monthly following a one-year cliff, subject to the employee’s continued service with us as of the vesting date. In 2020, we granted restricted stock units to our co-Chief Executive Officers, Heather Hasson and Trina Spear. The equity awards granted to our named executive officers in 2020 are discussed below.
2020 Stock Option Awards
On September 16, 2020, we granted nonqualified stock options covering 10,236,060 shares of our common stock to each of Mses. Hasson and Spear. The stock options have an exercise price of $5.10 per share, which is a premium exercise price to the fair market value on the grant date, and vest in equal monthly installments over the five-year period following the grant date. If the executive’s service is terminated (i) by our company other than for death, disability, or “cause” or (ii) by executive for “good reason” (each, as defined in the applicable executive’s employment agreement), and, in each case, such termination occurs (a) during the period beginning 3 months prior and ending 12 months following a change in control and (b) prior to the second anniversary of the grant date, then 100% of any then-unvested shares subject to the option shall become fully vested immediately prior to the later of the executive’s termination and the change in control. If a change in control occurs on or after the second anniversary of the grant date, then 100% of the then-unvested shares subject to the option will accelerate and vest in full immediately prior to the change in control, provided that executive remains in continuous service through the consummation of the change in control.
In connection with Mr. Lawrence’s commencement of employment with us on December 31, 2020, we granted Mr. Lawrence a stock option covering 2,047,212 shares of our common stock. The stock option has an exercise price of $6.03 per share and vests over a four-year period, with 25% of the shares subject to the option vesting on the first anniversary of Mr. Lawrence’s start date with our company and the remaining shares vesting in substantially equal monthly installments thereafter. If Mr. Lawrence’s service is terminated by us without “cause” or by him for “good reason” (each, as defined in his offer letter), in either case, within 12 months following a change in control of our company (as defined in his offer letter), then 100% of the then-unvested shares subject to the option will vest in full.
2020 RSU Awards
On June 26, 2020, we granted RSU awards covering 2,705,220 shares of our common stock to each of Mses. Hasson and Spear. The RSU awards were originally subject to a service-based requirement and a liquidity event requirement, such that the RSUs would on the first date upon which both requirements were satisfied. The RSUs will satisfy the service-based requirement in equal quarterly installments over the four-year period following December 31, 2019, subject to the executive’s continued service. The liquidity event requirement was satisfied as to any then-outstanding RSUs in connection with the completion of our IPO.
116
Table of Contents
If the executive’s service is terminated (i) by our company (or a successor or affiliate) other than for death, disability, or “cause” or (ii) by the executive for “good reason” (each, as defined in the applicable executive’s employment agreement), and, in each case, such termination occurs (a) during the period beginning 3 months prior and ending 12 months following a change in control and (b) prior to the second anniversary of the grant date, then 100% of any then-outstanding and unvested RSUs will accelerate and vest. If a change in control occurs on or after the second anniversary of the grant date, then 100% of the RSUs that are then outstanding and unvested will accelerate and vest immediately prior to the change in control, provided that the executive remains in continuous service through such time.
Equity Compensation Plans
We maintain the 2021 Equity Incentive Plan, or the 2021 Plan, in order to facilitate the grant of cash and equity incentives to directors, employees (including our named executive officers) and consultants of our company and our affiliates, and to enable us to obtain and retain services of these individuals, which we believe is essential to our long-term success. Prior to our IPO, we maintained the Amended 2016 Equity Incentive Plan, or the 2016 Plan.
IPO-Related Equity Award Actions
Pursuant to the amended and restated employment agreements entered into with each of Mses. Hasson and Spear in connection with the IPO, our board of directors approved the grant of equity awards to each of Mses. Hasson and Spear under the 2021 Plan. With respect to each award, $7,500,000 was granted in the form of a nonqualified stock option and $2,500,000 was granted in the form of an RSU award, both based on the IPO Price, or the IPO awards. The aggregate number of shares of our Class A common stock subject to the stock options was 1,454,194 shares of our Class A common stock.
The stock option vests and becomes exercisable as to 1/48th of the shares of Class A common stock underlying the stock option on each monthly anniversary of the grant date, and the RSU award will vest as to 1/16th of the award on each quarterly anniversary of the grant date, in each case, subject to the executive’s continued service with us through the applicable vesting date. If the executive’s service terminates due to a termination by our company without “cause” or by the executive for “good reason”, or due to death or “disability” (each, as defined in the applicable executive’s amended and restated employment agreement), then each award will vest in full.
In addition, our board of directors approved the accelerated vesting of the outstanding stock options (excluding, for clarity, the IPO award) held by Ms. Hasson, effective as of the closing of the IPO.
Other Elements of Compensation
Retirement Plans
We currently maintain a 401(k) retirement savings plan, or the 401(k) plan, for our employees, including our named executive officers, who satisfy certain eligibility requirements. Our named executive officers are eligible to participate in the 401(k) plan on the same terms as other full-time employees. The Code allows eligible employees to defer a portion of their compensation, within prescribed limits, on a pre-tax basis through contributions to the 401(k) plan. Currently, we match contributions made by participants in the 401(k) plan up to a specified percentage of the employee contributions, and these matching contributions are fully vested as of the date on which the contribution is made, provided that the participant has completed one year of service with us. We believe that providing a vehicle for tax-deferred retirement savings through our 401(k) plan, and making fully vested matching contributions, adds to the overall desirability of our compensation package and further incentivizes our employees, including our named executive officers, in accordance with our compensation policies.
117
Table of Contents
Employee Benefits and Perquisites
All of our full-time employees, including our named executive officers, are eligible to participate in our health and welfare plans, including medical, dental and vision benefits.
We believe the perquisites described above are necessary and appropriate to provide a competitive compensation package to our named executive officers.
No Tax Gross-Ups
We have not made gross-up payments to cover our named executive officers’ personal income taxes that may pertain to any of the compensation paid or provided by our company.
Outstanding Equity Awards at Year-End
The following table summarizes the number of shares of common stock underlying incentive plan awards for each named executive officer as of December 31, 2020. Each equity award listed in the following table was granted under the 2016 Plan and covers our Class A common stock. Shares underlying each equity award listed in the following table held by Mses. Hasson and Spear are exchangeable for Class B common stock pursuant to the Equity Award Exchange Agreement.
| Grant Date | Option Awards | Stock Awards | ||||||||||||||||||||||||||||||
| Name |
Number of Securities Underlying Unexercised Options (#) Exercisable |
Number of Securities Underlying Unexercised Options (#) Unexercisable |
Equity Incentive Plan Awards: Number of Securities Underlying Unexercised Unearned Options (#) |
Option Exercise Price ($) |
Option Expiration Date |
Equity Incentive Plan Awards: Number of Unearned Shares, Units or Other Rights That Have Not Vested (#) |
Equity Incentive Plan Awards: Market or Payout Value of Unearned Shares, Units or Other Rights That Have Not Vested ($) |
|||||||||||||||||||||||||
| Heather Hasson |
02/22/2018 | (1) | 2,707,497 | 712,503 | — | 0.86 | 02/21/2028 | — | — | |||||||||||||||||||||||
| 06/27/2018 | (2) | 900,000 | — | — | 1.37 | 06/26/2028 | — | — | ||||||||||||||||||||||||
| 06/26/2020 | (3) | — | — | — | — | — | 2,705,220 | 23,123,619 | ||||||||||||||||||||||||
| 09/16/2020 | (4) | 511,803 | 9,724,257 | — | 5.10 | 09/15/2030 | — | — | ||||||||||||||||||||||||
| Trina Spear |
02/22/2018 | (1) | 6,091,875 | 1,603,125 | — | 0.86 | 02/21/2028 | — | — | |||||||||||||||||||||||
| 06/27/2018 | (2) | 900,000 | — | — | 1.37 | 06/26/2028 | — | — | ||||||||||||||||||||||||
| 06/26/2020 | (3) | — | — | — | — | — | 2,705,220 | 23,123,619 | ||||||||||||||||||||||||
| 09/16/2020 | (4) | 511,803 | 9,724,257 | — | 5.10 | 09/15/2030 | — | — | ||||||||||||||||||||||||
| Jeffrey D. Lawrence |
12/31/2020 | (5) | — | 2,047,212 | — | 6.03 | 12/30/2030 | — | — | |||||||||||||||||||||||
| (1) | This option vests and becomes exercisable with respect to 1/48 of the total number of shares underlying the option on each monthly anniversary of the vesting commencement date. In the event of a change in control of our company (as defined in the 2016 Plan), 100% of the shares subject to the option shall vest as of immediately prior to the change in control. |
| (2) | This option vests with respect to 1/48 of the total number of shares underlying the option on each monthly anniversary of the vesting commencement date. In the event of a change in control of our company (as defined in the 2016 Plan), 100% of the shares subject to the option shall vest as of immediately prior to the change in control. This option has an early exercise feature, such that, if early exercised, the unvested shares are subject to a right of repurchase by the Company in connection with a termination of service. |
| (3) | As of December 31, 2020, this RSU award was scheduled to vest upon the satisfaction of both a (i) service-based requirement, which is satisfied in substantially equal quarterly installments over the four-year period following December 31, 2019, and (ii) liquidity event requirement, which was satisfied in connection with the IPO. Please refer to “—2020 RSU Awards” above for additional detail regarding the vesting of this award, including accelerated vesting. |
| (4) | This option vests and becomes exercisable with respect to 1/60 of the total number of shares underlying the option on each monthly anniversary of the grant date. Please refer to “—2020 Stock Option Awards” above for additional detail regarding the vesting of this award, including accelerated vesting. |
118
Table of Contents
| (5) | This option vests and becomes exercisable over a four-year period, with 25% of the total number of shares underlying the option vesting on the first anniversary of Mr. Lawrence’s start date with us, and 1/48 of the total number of shares underlying the option vesting on each monthly anniversary thereafter. If Mr. Lawrence’s employment is terminated by us without “cause” or by him for “good reason” within 12 months following a change in control, then 100% of the then-unvested shares subject to the option will vest in full. |
Executive Compensation Arrangements
The following is a summary of the compensatory agreements we have entered into with our named executive officers.
Employment Agreements with Heather Hasson and Trina Spear. We are party to employment agreements with our co-Chief Executive Officers Heather Hasson and Trina Spear, each of which was originally entered into in October 2017 and amended in September 2020. Each of these employment agreements were amended and restated upon the effectiveness of the registration statement in connection with our IPO (the “pricing”, and such agreements, the “A&R agreements”).
Pursuant to the employment agreements (as amended in September 2020), each of Mses. Hasson and Spear is entitled to receive a base salary of $650,000, which were increased to $1,000,000 under the A&R agreements. In addition, each is eligible to receive an annual discretionary bonus in an aggregate amount no greater than $1,000,000 (or, under the A&R agreements, with a target amount equal to 100% of base salary, which may be earned in an amount up to 200% of base salary if maximum performance goals are achieved), as determined by the compensation committee of our board of directors in its sole discretion, and subject to the executive’s continued employment through the bonus payment date. In addition, each is eligible to participate in the health, welfare, retirement, vacation and other employee benefit plans, practices, policies and programs generally available to other senior executives; and, under the A&R agreements, the company will pay the filing and legal fees associated with any required filings under the Hart-Scott-Rodino Act with respect to the acquisition of our securities.
Pursuant to the terms of the applicable executive’s employment agreement, we granted each executive an option to purchase shares of our common stock (3,420,000 shares for Ms. Hasson and 7,695,000 shares for Ms. Spear) in February 2018 at a per share exercise price equal to $0.86. Additionally, pursuant to the A&R agreements and in connection with the IPO, we approved the grant to each of Mses. Hasson and Spear equity awards with an aggregate value of $10,000,000. Please see “—IPO-Related Equity Award Actions” for additional details. Ms. Hasson’s employment agreement had an eight-year term, and Ms. Spear’s employment agreement had a ten-year term, following which each executive will continue as an at-will employee. Under the A&R agreements, each of Mses. Hasson and Spear’s agreements has a five-year term following the completion of the IPO in June 2021.
Pursuant to the employment agreements, if Ms. Hasson’s or Ms. Spear’s employment is terminated by us without “cause” or by the executive for “good reason” during the period beginning three months prior to and ending 12 months following a “change in control” (each, as defined in the applicable executive’s employment agreement), the executive will receive the following severance payments and benefits: (i) continued payments of base salary for 18 (or, under the A&R agreements, 24) months following the date of termination; (ii) 100% accelerated vesting and exercisability of the option granted in February 2018 and, under the A&R agreements, all equity awards granted to the executive prior to or in connection with the IPO; (iii) under the A&R agreements, a lump-sum amount equal to 200% of the cost of 18 months of COBRA premiums; and (iv) under the A&R agreements, a pro-rated target bonus for the year in which the termination occurs and an amount equal to 200% of the executive’s target bonus for the year in which the termination occurs. If Ms. Hasson’s or Ms. Spear’s employment is terminated by us without “cause” or by the executive for “good reason” not within the change in control period described above, the executive will receive the severance payments and benefits set forth in items (i) through (iii) above. The severance payments and benefits described above are subject to the executive’s timely execution and non-revocation of a release of claims in our favor. Additionally, under the A&R agreements, if Ms. Hasson’s or Ms. Spear’s employment is terminated due to death or disability, the executive
119
Table of Contents
will receive 100% accelerated vesting (and exercisability, if applicable) of all equity awards granted to the executive prior to or in connection with the IPO. Further, under the A&R agreements, if a change in control of the company occurs, Mses. Hasson and Spear will each receive 100% accelerated vesting (and exercisability, if applicable) of all outstanding equity awards granted prior to the IPO (excluding, for clarity, the IPO awards).
Mses. Hasson and Spear are also subject to the terms and conditions of an employee confidential information and invention assignment agreement, a one-year post-termination non-solicitation covenant, and an indefinite mutual non-disparagement covenant.
Offer Letter with Jeffrey D. Lawrence. We entered into an offer letter with Mr. Lawrence on December 24, 2020, pursuant to which Mr. Lawrence commenced employment with us as our Chief Financial Officer on December 31, 2020. Pursuant to the offer letter, Mr. Lawrence is eligible to receive a base salary of $500,000 and an annual discretionary bonus equal to $500,000 as determined by our board of directors, subject to his continued employment through the bonus payment date. In addition, Mr. Lawrence is eligible to participate in our standard benefit programs.
In connection with the commencement of his employment with us, and pursuant to the offer letter, we granted Mr. Lawrence a stock option to purchase 2,047,212 shares of our common stock on December 31, 2020 at a per share exercise price equal to $6.03. Mr. Lawrence’s employment with us is at-will.
Pursuant to the offer letter, if Mr. Lawrence’s employment is terminated by us without “cause” or by him for “good reason” (and other than due to death or disability) during the 12-month period following a “change in control” (each, as defined in the offer letter), Mr. Lawrence will receive the following severance payments and benefits: (i) continued payment of base salary for 12 months following the date of termination, (ii) up to 12 months of company-paid COBRA continuation, (iii) a pro-rated target bonus for the year of termination, paid in a lump-sum, and (iv) 100% accelerated vesting and exercisability of the option granted in December 2020 under the offer letter. If Mr. Lawrence’s employment is terminated by us without “cause” or by him for “good reason” (and other than due to death or disability) not within the change in control period described above, Mr. Lawrence will receive the following severance payments and benefits: (i) continued payments of base salary for 12 months following the date of termination and (ii) up to 12 months of COBRA continuation.
The severance payments and benefits described above are subject to Mr. Lawrence’s timely execution and non-revocation of a release of claims in our favor. Mr. Lawrence entered into our standard employee confidential information and invention assignment agreement as a condition of his employment.
Cash Sale Bonus Letters. On February 22, 2018, we entered into cash sale bonus letter agreements with each of Mses. Hasson and Spear. Pursuant to the letter agreements, upon the occurrence of a sale of our company in which the implied equity valuation of our company is equal to or greater than $400 million and either (i) the cash consideration actually received by our stockholders is equal to or greater than $400 million or (ii) the cash consideration actually received by our stockholders is equal to or greater than $300 million and the sum of such cash consideration plus any publicly traded equity securities actually received by our stockholders is equal to or greater than $400 million, and, in either case, provided that such sale qualifies as a change in control event under Section 409A of the Code (a “Qualifying Cash Sale”), each executive will be eligible to earn a transaction bonus equal to $1,500,000 for Ms. Hasson and $3,750,000 for Ms. Spear, paid in a single lump sum within ten days following the Qualifying Cash Sale. Mses. Hasson and Spear need not be employed or engaged by our company on the date of the Qualifying Cash Sale in order to receive the bonus.
120
Table of Contents
CERTAIN RELATIONSHIPS AND RELATED PARTY TRANSACTIONS
In addition to the compensation arrangements discussed in the sections titled “Management” and “Executive Compensation,” the following is a description of each transaction since January 1, 2018 and each currently proposed transaction in which:
| • | we have been or are to be a participant; |
| • | the amount involved exceeds or will exceed $120,000; and |
| • | any of our directors, executive officers or holders of more than 5% of our capital stock, or any immediate family member of, or person sharing the household with, any of these individuals, had or will have a direct or indirect material interest. |
Transactions with Tulco, LLC
Promissory Note
On February 22, 2018, we issued a $2.5 million promissory note to Tulco, LLC, a holder of greater than 5% of our capital stock and our majority stockholder, which promissory note was cancelled in connection with our common stock financing with Tulco, LLC in May 2018.
Common Stock Purchase Agreement
On May 14, 2018, we entered into a common stock purchase agreement with Tulco, LLC, pursuant to which we issued and sold to Tulco, LLC an aggregate of 36,675,000 shares of our common stock for an initial aggregate purchase price of $20.0 million, comprised of $17.5 million in cash and the cancellation of the $2.5 million promissory note. Under the agreement, Tulco, LLC also agreed to pay us an aggregate of $30.0 million in additional milestone payments based on our achievement of certain net revenues targets. Following entry into this agreement, we achieved all milestones and, as a result, have received an aggregate of $50.0 million in consideration from Tulco, LLC under this agreement.
Purchase Order Agreement
On June 15, 2020, we entered into a purchase order agreement with Tulco, LLC, pursuant to which Tulco, LLC purchased from us 100,000 isolation gowns and 10,000 masks for an aggregate purchase price of $4.2 million. We then facilitated the donation of the products to Albert Einstein Medical Center in Philadelphia, Pennsylvania, East Boston Neighborhood Health Center in East Boston, Massachusetts, Grady Health System in Atlanta, Georgia and the Alaska Native Tribal Health Consortium in Anchorage, Alaska.
Professional Fees
In connection with the preparation of our 2017 and 2018 audits, Tulco, LLC paid an aggregate of $257,000 of our audit and tax preparation fees, $136,000 of which were repaid to Tulco, LLC by us.
Tulco, LLC reimbursed us for certain of our professional fees in connection with the IPO. These reimbursements totaled $4.9 million. We received payment of the amount due from Tulco during the third quarter of 2021.
Stockholders’ Agreement
In connection with a secondary sale of an aggregate of 57,046,824 shares of our common stock at a price per share of approximately $8.55, in which certain of our holders of our common stock participated, including, but not limited to, Tulco, LLC, Ms. Hasson and Ms. Spear, on October 23, 2020, we entered into an amended and restated stockholders’ agreement with certain holders of our common stock, including, but not limited to, Ms. Hasson, Ms. Spear and Tulco, LLC, pursuant to which these holders are entitled to certain rights relating to the registration of their shares. See “Description of Capital Stock—Registration Rights” for additional information.
121
Table of Contents
Voting Agreement
We, our co-founders and co-Chief Executive Officers, Ms. Hasson and Ms. Spear, Tulco, LLC, and certain related persons and entities entered into a voting agreement in connection with the IPO, under which such parties agree, upon the terms set forth in the voting agreement, to vote their shares for the election of each of Ms. Hasson, Ms. Spear and, for so long as Tulco, LLC and its permitted transferees hold, in the aggregate, at least 10% of the total number of outstanding shares of all classes of our common stock (calculated on a diluted basis to include any issued and outstanding options, RSUs or other equity awards, whether vested or unvested), an individual designated by Tulco, LLC to our board of directors, and to vote against their removal. See “Description of Capital Stock—Voting Agreement” for additional information.
Exchange Transactions
In connection with the IPO, we entered into an exchange agreement with our co-founders and co-Chief Executive Officers, Ms. Hasson and Ms. Spear, Tulco, LLC and certain related entities pursuant to which an aggregate of 6,776,438 shares of Class A common stock held by Ms. Hasson and Ms. Spear and their respective affiliated trusts and 6,300,000 shares of Class A common stock held by Tulco, LLC were exchanged into an equivalent number of shares of Class B common stock.
In addition, pursuant to the Equity Award Exchange Agreement entered into in connection with the IPO between us and Ms. Hasson and Ms. Spear, each of Ms. Hasson and Ms. Spear have a right to require us to exchange any shares of Class A common stock received upon the exercise of stock options or the vesting and settlement of RSUs, in each case granted under our 2016 Plan and outstanding prior to the date of effectiveness of the registration statement related to our IPO, for an equivalent number of shares of Class B common stock. As of August 31, 2021, this included an aggregate of 33,387,120 shares underlying outstanding options and an aggregate of 3,381,520 shares underlying outstanding RSUs held by Ms. Hasson and Ms. Spear. The Equity Award Exchange Agreement does not cover any equity awards granted to Ms. Hasson or Ms. Spear following the completion of the IPO.
Employment and Compensation Arrangements
We have entered into employment agreements with and have granted equity awards to our executive officers. In addition, we have entered into a cash sale bonus agreement with each of our co-founders and co-Chief Executive Officers, Ms. Spear and Ms. Hasson. See the section titled “Executive Compensation—Executive Compensation Arrangements” for additional information.
Indemnification Agreements
We have entered into indemnification agreements with each of our directors and executive officers. See the section titled “Description of Capital Stock—Limitations on Liability and Indemnification Matters.”
Policies and Procedures for Transactions with Related Persons
Our board of directors has adopted a written related person transaction policy setting forth the policies and procedures for the review and approval or ratification of related person transactions. This policy will cover, with certain exceptions set forth in Item 404 of Regulation S-K under the Securities Act, any transaction, arrangement or relationship, or any series of similar transactions, arrangements or relationships, in which we were or are to be a participant, where the amount involved exceeds $120,000 in any fiscal year and a related person had, has or will have a direct or indirect material interest, including without limitation, purchases of goods or services by or from the related person or entities in which the related person has a material interest, indebtedness, guarantees of indebtedness and employment by us of a related person. In reviewing and approving any such transactions, our audit committee is tasked to consider all relevant facts and circumstances, including, but not limited to, whether the transaction is on terms comparable to those that could be obtained in an arm’s length transaction and the extent of the related person’s interest in the transaction. All of the transactions described in this section occurred prior to the adoption of this policy.
122
Table of Contents
PRINCIPAL AND SELLING STOCKHOLDERS
The following table presents certain information with respect to the beneficial ownership of our common stock as of August 31, 2021, and as adjusted to reflect the sale of Class A common stock offered by the selling stockholders in this offering, assuming no exercise of the underwriters’ option to purchase additional shares of our Class A common stock, by:
| • | each of our directors; |
| • | each of our named executive officers; |
| • | all of our directors and executive officers as a group; |
| • | each stockholder known by us to be the beneficial owner of more than 5% of our outstanding shares of Class A common stock or Class B common stock; and |
| • | the selling stockholders. |
We have determined beneficial ownership in accordance with the rules of the SEC. Unless otherwise indicated below, to our knowledge, based on information furnished to us, the persons and entities named in the table have sole voting and investment power with respect to all shares that they beneficially own, subject to applicable community property laws. Shares of our Class A common stock subject to stock options that are currently exercisable or exercisable within 60 days of August 31, 2021 and subject to RSUs vesting within 60 days of August 31, 2021 are deemed to be outstanding and to be beneficially owned by the person holding the options and/or RSUs, as the case may be, for the purpose of computing the percentage ownership of that person but are not treated as outstanding for the purpose of computing the percentage ownership of any other person.
Unless otherwise indicated, the address of each beneficial owner in the table below is c/o FIGS, Inc., 2834 Colorado Avenue, Suite 100, Santa Monica, California 90404.
| Name of Beneficial Owner |
Shares Beneficially Owned Before this Offering |
% Total Voting Power Before this Offering(1) |
Number of Shares Being Offered |
Shares Beneficially Owned After this Offering |
% Total Voting Power After this Offering(1) |
|||||||||||||||||||||||||||||||||||||||
| Class A | Class B | Class A | Class B | |||||||||||||||||||||||||||||||||||||||||
| Shares | % | Shares | % | Shares | % | Shares | % | |||||||||||||||||||||||||||||||||||||
| 5% Stockholders: |
||||||||||||||||||||||||||||||||||||||||||||
| Tulco, LLC(2) |
58,067,602 | 39.3 | 6,300,000 | 47.5 | 44.6 | 5,536,235 | 52,531,367 | 34.8 | 6,300,000 | 51.2 | 45.0 | |||||||||||||||||||||||||||||||||
| Viking Global Opportunities Illiquid Investments Sub-Master LP(3) |
14,742,689 | 10.0 | — | — | 3.6 | — | 14,742,689 | 9.8 | — | — | 3.7 | |||||||||||||||||||||||||||||||||
| Commonwealth of Pennsylvania, Public School Employees’ Retirement System(4) |
9,943,587 | 6.7 | — | — | 2.4 | — | 9,943,587 | 6.6 | — | — | 2.5 | |||||||||||||||||||||||||||||||||
| Named Executive Officers and Directors |
||||||||||||||||||||||||||||||||||||||||||||
| Heather Hasson(5) |
14,807,977 | 9.1 | 1,546,976 | 11.7 | 10.7 | 2,419,998 | 12,336,308 | 7.5 | 1,546,976 | 12.6 | 10.6 | |||||||||||||||||||||||||||||||||
| Catherine Spear(6) |
10,933,477 | 6.9 | 5,417,083 | 40.8 | 28.1 | 961,152 | 10,933,477 | 6.7 | 4,455,931 | 36.2 | 24.5 | |||||||||||||||||||||||||||||||||
| Jeffrey D. Lawrence |
— | — | — | — | — | — | — | — | — | — | — | |||||||||||||||||||||||||||||||||
| J. Martin Willhite(2) |
— | — | — | — | — | — | — | — | — | — | — | |||||||||||||||||||||||||||||||||
| Sheila Antrum |
— | — | — | — | — | — | — | — | — | — | — | |||||||||||||||||||||||||||||||||
| Michael Soenen |
— | — | — | — | — | — | — | — | — | — | — | |||||||||||||||||||||||||||||||||
| All executive officers and directors as a group (six persons)(7) |
25,741,454 | 14.8 | 6,964,059 | 52.5 | 37.6 | 3,381,150 | 23,269,785 | 13.3 | 6,002,907 | 48.8 | 34.1 | |||||||||||||||||||||||||||||||||
| * | Represents beneficial ownership of less than 1% of our outstanding shares of common stock. |
| (1) | Percentage of total voting power represents voting power with respect to all shares of our Class A common stock and Class B common stock, as a single class. The holders of our Class B common stock are entitled to 20 votes per share and holders of our Class A common stock are entitled to one vote per share. See the section titled “Description of Capital Stock—Common Stock” for more information about the voting rights of our Class A common stock and Class B common stock. |
| (2) | Thomas J. Tull, founder, Chairman and Chief Executive Officer of Tulco, LLC and a member of its board of directors, may control Tulco, LLC. Mr. Tull may be deemed to have or share beneficial ownership of the Class A and Class B common stock held directly by Tulco, LLC. J. Martin Willhite, a member of our board of directors, is Vice Chairman of Tulco, LLC and a member of its board of directors. The mailing address of Tulco, LLC and Messrs. Tull and Willhite is 61 E. Colorado Blvd., Unit 200, Pasadena, CA 91105. |
123
Table of Contents
| (3) | Viking Global Opportunities Illiquid Investments Sub-Master LP (the “Opportunities Fund”) has the authority to dispose of and vote the Class A common stock directly owned by it, which power may be exercised by its general partner, Viking Global Opportunities Portfolio GP LLC (“Opportunities GP”), and by Viking Global Investors LP (“VGI”), which provides managerial services to Opportunities Fund. O. Andreas Halvorsen, David C. Ott and Rose Shabet, as Executive Committee members of Viking Global Partners LLC (the general partner of VGI) and Viking Global Opportunities GP LLC, the sole member of Opportunities GP, have shared authority to direct the voting and disposition of investments beneficially owned by VGI, Opportunities GP and the Opportunities Fund. The address of each of the entities is c/o Viking Global Investors LP, 55 Railroad Avenue, Greenwich, Connecticut 06830. |
| (4) | James H. Grossman, Jr., the Authorized Person for the Commonwealth of Pennsylvania, Public School Employees’ Retirement System, holds voting and investment power over the shares of Class A common stock held by the Commonwealth of Pennsylvania, Public School Employees’ Retirement System. The address of Commonwealth of Pennsylvania, Public School Employees’ Retirement System is 5 North Fifth Street, Harrisburg, Pennsylvania 17101. |
| (5) | Includes (a) 942,453 shares of Class B common stock held by the Maple Tree Irrevocable Trust, (b) 14,631,799 shares of Class A common stock issuable upon the exercise of stock options exercisable within 60 days of August 31, 2021 and (c) 176,178 shares of Class A common stock issuable upon the settlement of RSUs vesting within 60 days of August 31, 2021, in each case, beneficially owned prior to this offering. Assuming the exchange of all of the shares of Class A common stock underlying Ms. Hasson’s eligible options and RSUs vesting within 60 days of August 31, 2021 for shares of Class B common stock pursuant to the Equity Award Exchange Agreement, Ms. Hasson would have total voting power after this offering of 43.1%. |
| (6) | Includes (a) 2,939,544 shares of Class B common stock held by the Catherine Spear Revocable Trust, (b) 983,016 shares of Class B common stock held by the Wingaersheek Irrevocable Trust I, (c) 983,016 shares of Class B common stock held by the Wingaersheek Irrevocable Trust II, (d) 10,757,299 shares of Class A common stock issuable upon the exercise of stock options exercisable within 60 days of August 31, 2021 and (e) 176,178 shares of Class A common stock issuable upon the settlement of RSUs vesting within 60 days of August 31, 2021, in each case, beneficially owned prior to this offering. Assuming the exchange of all of the shares of Class A common stock underlying Ms. Spear’s eligible options and RSUs vesting within 60 days of August 31, 2021 for shares of Class B common stock pursuant to the Equity Award Exchange Agreement, Ms. Spear would have total voting power after this offering of 50.0%. |
| (7) | Consists of (a) 6,964,059 shares of Class B common stock, (b) 25,389,098 shares of Class A common stock issuable upon the exercise of stock options exercisable within 60 days of August 31, 2021 and (c) 352,357 shares of Class A common stock issuable upon the settlement of RSUs vesting within 60 days of August 31, 2021, in each case, beneficially owned prior to this offering. Assuming the exchange of the shares of Class A common stock underlying all of Mses. Hasson’s and Spear’s eligible options and RSUs vesting within 60 days of August 31, 2021 for shares of Class B common stock pursuant to the Equity Award Exchange Agreement, Mses. Hasson and Spear would have total voting power after this offering of 67.9%. |
124
Table of Contents
The following description summarizes the most important terms of our capital stock. Because it is only a summary, it does not contain all the information that may be important to you. For a complete description of the information contained in this section, you should refer to our amended and restated certificate of incorporation, amended and restated bylaws and amended and restated stockholders’ agreement, each of which are incorporated by reference as exhibits to registration statement of which this prospectus forms a part, and to the applicable provisions of Delaware law.
General
Our authorized capital stock consists of 1,000,000,000 shares of our Class A common stock and 150,000,000 shares of our Class B common stock, in each case, $0.0001 par value per share, and 100,000,000 shares of undesignated preferred stock, $0.0001 par value per share.
As of August 31, 2021 there were outstanding:
| • | 147,730,670 shares of our Class A common stock, held by approximately 41 stockholders of record; and |
| • | 13,264,059 shares of our Class B common stock, held by seven stockholders of record. |
These stockholder figures do not include a substantially greater number of holders whose shares are held of record by the banks, brokers and other financial institutions.
Common Stock
We have two classes of authorized common stock: Class A common stock and Class B common stock. The rights of the holders of each class of our common stock are identical, except with respect to voting and conversion rights.
Dividend Rights
Subject to preferences that may apply to any shares of preferred stock outstanding at the time, the holders of our common stock are entitled to receive dividends out of funds legally available if our board of directors, in its discretion, determines to issue dividends and then only at the times and in the amounts that our board of directors may determine. See the section titled “Dividend Policy” for additional information.
Voting Rights
Holders of our Class A common stock are entitled to one vote for each share of Class A common stock held on all matters submitted to a vote of stockholders. Holders of our Class B common stock are entitled to 20 votes for each share of Class B common stock held on all matters submitted to a vote of stockholders.
All outstanding shares of our Class B common stock are held by our co-founders and co-Chief Executive Officers, Heather Hasson and Trina Spear, and Tulco, LLC, our majority stockholder. Immediately following the completion of this offering, these holders will represent approximately 80.0% of the voting power of our outstanding capital stock, assuming no exercise of the underwriters’ option to purchase additional shares.
Holders of shares of our Class A common stock and Class B common stock vote together as a single class on all matters (including the election of directors) submitted to a vote of stockholders, unless otherwise required by Delaware law or our amended and restated certificate of incorporation. Delaware law could require either holders of our Class A common stock or Class B common stock to vote separately as a single class in the following circumstances:
| • | if we were to seek to amend our amended and restated certificate of incorporation to increase or decrease the par value of a class of our capital stock, then that class would be required to vote separately to approve the proposed amendment; and |
125
Table of Contents
| • | if we were to seek to amend our amended and restated certificate of incorporation in a manner that alters or changes the powers, preferences or special rights of a class of our capital stock in a manner that affected its holders adversely, then that class would be required to vote separately to approve the proposed amendment. |
Our amended and restated certificate of incorporation does not provide for cumulative voting for the election of directors. As a result, the holders of a majority of our voting shares can elect all of the directors then standing for election. Our amended and restated certificate of incorporation establishes a classified board of directors, to be divided into three classes with staggered three-year terms. Only one class of directors will be elected at each annual meeting of our stockholders, with the other classes continuing for the remainder of their respective three-year terms.
No Preemptive or Similar Rights
None of our common stock is entitled to preemptive rights or subject to redemption or sinking fund provisions.
Right to Receive Liquidation Distributions
Upon our liquidation, dissolution or winding up, the assets legally available for distribution to our stockholders would be distributable ratably among the holders of our common stock and any participating preferred stock outstanding at that time, subject to the prior satisfaction of all outstanding debt and liabilities and the preferential rights of and the payment of liquidation preferences, if any, on any shares of preferred stock outstanding at that time.
Change of Control Transactions
In the case of any distribution or payment in respect of the shares of our Class A common stock or Class B common stock upon a merger or consolidation with or into any other entity, or other substantially similar transaction, the holders of our Class A common stock and Class B common stock will be treated equally and identically with respect to shares of Class A common stock or Class B common stock owned by them, unless the only difference in the per share distribution to the holders of the Class A common stock and Class B common stock is that any securities distributed to the holder of a share of Class B common stock have 20 times the voting power of any securities distributed to the holder of a share of Class A common stock, or such merger, consolidation or other transaction is approved by the affirmative vote of the holders of a majority of the outstanding shares of Class A common stock and Class B common stock, each voting as a separate class.
Subdivisions and Combinations
If we subdivide or combine in any manner outstanding shares of Class A common stock or Class B common stock, the outstanding shares of the other class will be subdivided or combined in the same manner, unless different treatment of the shares of each class is approved by the affirmative vote of the holders of a majority of the outstanding shares of Class A common stock and Class B common stock, each voting as a separate class.
Conversion
Each outstanding share of Class B common stock is convertible at any time at the option of the holder into one share of Class A common stock. In addition, each share of Class B common stock will convert automatically into one share of Class A common stock upon any transfer, whether or not for value, except for certain permitted transfers described in our amended and restated certificate of incorporation, including transfers for estate planning purposes or charitable transfers where voting control is retained by the transferring holder or transfers to affiliates or certain other related entities of the transferring holder. Once converted or transferred and converted into Class A common stock, the Class B common stock may not be reissued.
126
Table of Contents
All outstanding shares of our Class B common stock will convert automatically into shares of our Class A common stock upon the earlier of (1) the date fixed by our board of directors that is not less than 60 days or more than 180 days following the death or disability of both Ms. Hasson and Ms. Spear and (2) June 1, 2031, the 10-year anniversary of the date of the closing of the IPO, each of which we refer to as a final conversion event. In addition, if prior to a final conversion event Tulco, LLC and its permitted transferees cease to hold at least 20% of the aggregate number of shares of all classes of common stock then outstanding (calculated on a diluted basis to include any issued and outstanding stock options, RSUs or other equity awards, whether vested or unvested), then any shares of Class B common stock then held by Tulco, LLC and its permitted transferees will convert automatically into shares of our Class A common stock on a date fixed by our board of directors that is not less than 60 days or more than 180 days following such occurrence. Once converted into Class A common stock, the Class B common stock may not be reissued.
Upon the conversion of all shares of Class B common stock into shares of Class A common stock, the rights of the holders of all outstanding common stock will be identical.
Preferred Stock
Pursuant to the provisions of our amended and restated certificate of incorporation, our board of directors is authorized, subject to limitations prescribed by Delaware law, to issue preferred stock in one or more series, to establish from time to time the number of shares to be included in each series and to fix the designation, powers, preferences and rights of the shares of each series and any of its qualifications, limitations or restrictions, in each case without further vote or action by our stockholders. Our board of directors can also increase or decrease the number of shares of any series of preferred stock, but not below the number of shares of that series then outstanding, without any further vote or action by our stockholders. Our board of directors may authorize the issuance of preferred stock with voting or conversion rights that could adversely affect the voting power or other rights of the holders of our common stock. The issuance of preferred stock, while providing flexibility in connection with possible acquisitions and other corporate purposes, could, among other things, have the effect of delaying, deferring or preventing a change in control of our company and might adversely affect the market price of our Class A common stock and the voting and other rights of the holders of our Class A common stock and Class B common stock. We have no current plans to issue any shares of preferred stock.
Stock Options
As of August 31, 2021, we had outstanding options to purchase an aggregate of 39,718,610 shares of our Class A common stock under our 2016 Plan, with a weighted-average exercise price of $3.74 per share, assuming the reclassification of all shares of common stock underlying outstanding options under our 2016 Plan into shares of Class A common stock, including 33,387,120 shares underlying stock option awards that are subject to the Equity Award Exchange Agreement.
RSUs
As of August 31, 2021, 3,381,520 shares of our Class A common stock were subject to RSUs under our 2016 Plan, assuming the reclassification of all shares of common stock underlying outstanding RSUs under our 2016 Plan into shares of Class A common stock, all of which are subject to the Equity Award Exchange Agreement.
Voting Agreement
We, our co-founders and co-Chief Executive Officers, Ms. Hasson and Ms. Spear, and Tulco, LLC, and certain related persons and entities have entered into a voting agreement, under which such parties agreed upon the terms set forth in the voting agreement, to vote their shares for the election of each of Ms. Hasson, Ms. Spear and for so long as Tulco, LLC and its permitted transferees hold, in the aggregate, at least 10% of the total number of outstanding shares of all classes of our common stock (calculated on a diluted basis to include any
127
Table of Contents
issued and outstanding options, RSUs or other equity awards, whether vested or unvested), an individual designated by Tulco, LLC to our board of directors, and to vote against their removal. The voting agreement will be in effect until: (1) the time at which neither of the co-founders nor any of their permitted transferees hold shares of Class B common stock, (2) with respect to Tulco, LLC, the time at which Tulco, LLC and its permitted transferees cease to hold, in the aggregate, at least 10% of the total number of outstanding shares of all classes of our common stock (calculated on a diluted basis to include any issued and outstanding options, restricted stock units or other equity awards, whether vested or unvested) or (3) a final conversion event. The conversion of our Class B common stock to Class A common stock is provided for in our amended and restated certificate of incorporation, see section titled “—Common Stock—Conversion.”
Registration Rights
Following the completion of this offering, subject to the lock-up agreements entered into in connection with our IPO and this offering, the holders of 64,834,274 outstanding shares of our common stock, will be entitled to rights with respect to the registration of these shares under the Securities Act. These rights are provided under the terms of our amended and restated stockholders’ agreement between us and the holders of these shares, which was entered into in October 2020, and include demand registration rights, Form S-3 registration rights and piggyback registration rights. The registration of shares of our common stock by the exercise of registration rights described below would enable the holders to sell these shares without restriction under the Securities Act when the applicable registration statement is declared effective. Our amended and restated stockholders’ agreement does not provide for any maximum cash penalties or any penalties connected with delays in registering our common stock.
In any registration made pursuant to such amended and restated stockholders’ agreement, all fees, costs, and expenses of underwritten registrations, including reasonable fees and disbursements not to exceed $50,000 of one special counsel to the selling stockholders, will be borne by us and all selling expenses, including the estimated underwriting discounts and commissions, will be borne by the holders of the shares being registered. However, we will not be required to bear the expenses in connection with the exercise of the requested and Form S-3 registration rights of a registration if the request is subsequently withdrawn at the request of the selling stockholders holding a majority of registrable securities to be registered, unless such holders agree to forfeit their right to either one demand registration or one Form S-3 registration.
Generally, in an underwritten offering, the managing underwriter, if any, has the right, subject to specified conditions, to limit the number of shares such holders may include. The registration rights terminate upon the earliest of: (1) three years following the completion of the IPO, (2) as to any given holder of registration rights, at such time following the IPO when such holder of registration rights can sell all of such holder’s registrable securities in compliance with Rule 144(b)(1)(i) and all registrable securities held by such holder can be sold in any three-month period without registration pursuant to Rule 144 under the Securities Act and (3) a transaction or series of related transactions (whether by merger, consolidation, share transfer, new issuance of “voting securities,” as defined in the amended and restated stockholders’ agreement, or otherwise) in which a “person” as defined in the amended and restated stockholders’ agreement, acquires, directly or indirectly, (i) a majority of the voting power of our company (or the surviving or acquiring entity) or (ii) all or substantially all of the assets of our company and its direct and indirect subsidiaries (on a consolidated basis).
Demand Registration Rights
The holders of an aggregate of 64,834,274 shares of our common stock following this offering, or their permitted transferees, are entitled to demand registration rights. Under the terms of the amended and restated stockholders’ agreement, at any time after 180 days following the effective date of this prospectus, holders of at least 35% of the voting securities (as defined in the amended and restated stockholders’ agreement) then-outstanding can request that we register the offer and sale of their shares on a registration statement on Form S-1 under the Securities Act with an anticipated aggregate offering price, net of selling expenses, of at least
128
Table of Contents
$25.0 million. We are required to effect only one registration pursuant to this provision of the amended and restated stockholders’ agreement. We may postpone the filing of a registration statement no more than once during any 12-month period for up to 90 days if our board of directors determines that the filing would be detrimental to us and our stockholders. We are not required to effect a requested registration under certain additional circumstances specified in the amended and restated stockholders’ agreement.
Form S-3 Registration Rights
The holders of an aggregate of 64,834,274 shares of our common stock following this offering or their permitted transferees are also entitled to Form S-3 registration rights. If we are eligible and qualified to file a registration statement on Form S-3, holders can request that we register the offer and sale of all or part of their shares on a registration statement on Form S-3 with an anticipated aggregate offering price, net of selling expenses, of at least $10.0 million. We are required to effect at most two registration statements on Form S-3 in any 12-month period. We may postpone the filing of a registration statement on Form S-3 no more than once during any 12-month period for up to 90 days if our board of directors determines that the filing would be detrimental to us and our stockholders. We are not required to effect a registration on Form S-3 under certain additional circumstances specified in the amended and restated stockholders’ agreement.
Piggyback Registration Rights
If we register any of our common stock for public sale, the holders of an aggregate of 64,834,274 shares of our common stock following this offering or their permitted transferees are entitled to piggyback registration rights. However, this right does not apply to (1) a registration relating to the sale or grant of securities to our employees pursuant to a stock option, stock purchase, equity incentive or similar plan; (2) a registration relating to an SEC Rule 145 transaction; (3) a registration on any form that does not include substantially the same information as would be required to be included in a registration statement covering the sale of the voting securities, as defined in the amended and restated stockholders’ agreement; or (4) a registration in which the only common stock being registered is common stock issuable upon conversion of debt securities that are also being registered. The underwriters of any underwritten offering will have the right, in their sole discretion, to limit, because of marketing reasons, the number of shares registered by these holders, in which case the number of shares to be registered will be apportioned, first, to us, and second, pro rata among these holders, according to the total amount of securities entitled to be included by each holder, subject to additional circumstances specified in the amended and restated stockholders’ agreement.
Anti-Takeover Provisions
The provisions of Delaware law, our amended and restated certificate of incorporation and our amended and restated bylaws could have the effect of delaying, deferring, or discouraging another person from acquiring control of our company. These provisions, which are summarized below, may have the effect of discouraging takeover bids. They are also designed, in part, to encourage persons seeking to acquire control of us to negotiate first with our board of directors. We believe that the benefits of increased protection of our potential ability to negotiate with an unfriendly or unsolicited acquirer outweigh the disadvantages of discouraging a proposal to acquire us because negotiation of these proposals could result in an improvement of their terms.
Delaware Law
We are subject to the provisions of Section 203 of the Delaware General Corporation Law, or DGCL, regulating corporate takeovers. In general, DGCL Section 203 prohibits a publicly held Delaware corporation from engaging in a “business combination” with an “interested stockholder” for a period of three years following the date on which the person became an interested stockholder unless:
| • | prior to the date of the transaction, the board of directors of the corporation approved either the business combination or the transaction which resulted in the stockholder becoming an interested stockholder; |
129
Table of Contents
| • | the interested stockholder owned at least 85% of the voting stock of the corporation outstanding at the time the transaction commenced, excluding for purposes of determining the voting stock outstanding, but not the outstanding voting stock owned by the interested stockholder, (1) shares owned by persons who are directors and also officers and (2) shares owned by employee stock plans in which employee participants do not have the right to determine confidentially whether shares held subject to the plan will be tendered in a tender or exchange offer; or |
| • | at or subsequent to the date of the transaction, the business combination is approved by the board of directors of the corporation and authorized at an annual or special meeting of stockholders, and not by written consent, by the affirmative vote of at least two-thirds of the outstanding voting stock that is not owned by the interested stockholder. |
Generally, a “business combination” includes a merger, asset or stock sale, or other transaction or series of transactions together resulting in a financial benefit to the interested stockholder. An “interested stockholder” is a person who, together with affiliates and associates, owns or, within three years prior to the determination of interested stockholder status, did own 15% or more of a corporation’s outstanding voting stock. We expect the existence of this provision to have an anti-takeover effect with respect to transactions our board of directors does not approve in advance. We also anticipate that DGCL Section 203 may also discourage attempts that might result in a premium over the market price for the shares of common stock held by stockholders.
Amended and Restated Certificate of Incorporation and Amended and Restated Bylaws Provisions
Our amended and restated certificate of incorporation and our amended and restated bylaws includes a number of provisions that could deter hostile takeovers or delay or prevent changes in control of our management team, including the following:
| • | Dual-Class Common Stock. As described above in the section titled “—Common Stock—Voting Rights,” our amended and restated certificate of incorporation provides for a dual-class common stock structure pursuant to which holders of our Class B common stock have the ability to control the outcome of matters requiring stockholder approval, even if they own significantly less than a majority of all outstanding shares of our common stock, including the election of directors and significant corporate transactions, such as a merger or other sale of our company or its assets. Current investors, executives and employees have the ability to exercise significant influence over those matters. |
| • | Board of Directors Vacancies. Our amended and restated certificate of incorporation and amended and restated bylaws authorize only our board of directors to fill vacant directorships, including newly created seats. In addition, the number of directors constituting our board of directors is permitted to be set only by a resolution adopted by a majority vote of our entire board of directors. These provisions would prevent a stockholder from increasing the size of our board of directors and then gaining control of our board of directors by filling the resulting vacancies with its own nominees. This makes it more difficult to change the composition of our board of directors but promotes continuity of management. |
| • | Classified Board. Our amended and restated certificate of incorporation and amended and restated bylaws provides that our board of directors is classified into three classes of directors. The existence of a classified board of directors could discourage a third party from making a tender offer or otherwise attempting to obtain control of us as it is more difficult and time consuming for stockholders to replace a majority of the directors on a classified board of directors. See the section titled “Management—Board of Directors Composition” for additional information. |
| • | Directors Removed Only for Cause. Our amended and restated certificate of incorporation provides that stockholders may remove directors only for cause. |
| • | Supermajority Requirements for Amendments of Our Amended and Restated Certificate of Incorporation and Amended and Restated Bylaws. Our amended and restated certificate of incorporation further provides that the affirmative vote of holders of at least two-thirds of the voting power of all of the then |
130
Table of Contents
| outstanding shares of voting stock is required to amend certain provisions of our amended and restated certificate of incorporation, including provisions relating to the classified board, the size of the board, removal of directors, special meetings, actions by written consent, and designation of our preferred stock. In addition, the affirmative vote of holders of 66 2/3% of the voting power of each of our Class A common stock and Class B common stock, voting separately by class, is required to amend the provisions of our amended and restated certificate of incorporation relating to the terms of our Class B common stock. The affirmative vote of holders of at least 66 2/3% of the voting power of all of the then outstanding shares of voting stock is required to amend or repeal our amended and restated bylaws, although our amended and restated bylaws may be amended by a simple majority vote of our board of directors. |
| • | Stockholder Action; Special Meeting of Stockholders. Our amended and restated certificate of incorporation provides that special meetings of our stockholders may be called only by our board of directors, the chairman of our board of directors, or either of our co-Chief Executive Officers. Our amended and restated certificate of incorporation provides that our stockholders may act by written consent until such time as holders of our Class B common stock beneficially own less than a majority of the voting power, at which time our stockholders will no longer be able to act by written consent and instead must take action at an annual or special meeting of our stockholders. As a result, holders of our capital stock will not be able to amend our amended and restated bylaws or remove directors without holding a meeting of our stockholders called in accordance with our amended and restated bylaws. Further, our amended and restated bylaws provides that special meetings of our stockholders may be called only by our board of directors, the chairman of our board of directors, or our co-Chief Executive Officers, thus prohibiting a stockholder from calling a special meeting. These provisions might delay the ability of our stockholders to force consideration of a proposal or for stockholders to take any action, including the removal of directors. |
| • | Advance Notice Requirements for Stockholder Proposals and Director Nominations. Our amended and restated bylaws provide advance notice procedures for stockholders seeking to bring business before our annual meeting of stockholders or to nominate candidates for election as directors at our annual meeting of stockholders. Our amended and restated bylaws also specify certain requirements regarding the form and content of a stockholder’s notice. These provisions might preclude our stockholders from bringing matters before our annual meeting of stockholders or from making nominations for directors at our annual meeting of stockholders if the proper procedures are not followed. We expect that these provisions might also discourage or deter a potential acquirer from conducting a solicitation of proxies to elect the acquirer’s own slate of directors or otherwise attempting to obtain control of our company. |
| • | No Cumulative Voting. The DGCL provides that stockholders are not entitled to the right to cumulate votes in the election of directors unless a corporation’s certificate of incorporation provides otherwise. Our amended and restated certificate of incorporation and amended and restated bylaws does not provide for cumulative voting. |
| • | Issuance of Undesignated Preferred Stock. Our board of directors have the authority, without further action by the stockholders, to issue up to shares of undesignated preferred stock with rights and preferences, including voting rights, designated from time to time by our board of directors. The existence of authorized but unissued shares of preferred stock enables our board of directors to render more difficult or to discourage an attempt to obtain control of us by means of a merger, tender offer, proxy contest or other means. |
| • | Choice of Forum. Our amended and restated certificate of incorporation provides that, unless we consent in writing to the selection of an alternative forum, (A)(i) any derivative action or proceeding brought on behalf of us, (ii) any action asserting a claim of breach of a fiduciary duty owed by any of our current or former directors, officers, other employees or stockholders to us or our stockholders, (iii) any action asserting a claim arising pursuant to any provision of the DGCL, our amended and restated certificate of incorporation or amended and restated bylaws (as either may be |
131
Table of Contents
| amended or restated) or as to which the DGCL confers exclusive jurisdiction on the Court of Chancery of the State of Delaware, or (iv) any action asserting a claim governed by the internal affairs doctrine of the law of the State of Delaware shall, to the fullest extent permitted by law, be exclusively brought in the Court of Chancery of the State of Delaware or, if such court does not have subject matter jurisdiction thereof, the federal district court of the State of Delaware, and (B) the federal district courts of the United States shall be the exclusive forum for the resolution of any complaint asserting a cause of action arising under the Securities Act. Notwithstanding the foregoing, the exclusive forum provision shall not apply to claims seeking to enforce any liability or duty created by the Exchange Act. Our amended and restated certificate of incorporation also provides that, to the fullest extent permitted by law, any person or entity purchasing or otherwise acquiring or holding any interest in shares of our capital stock shall be deemed to have notice of and consented to the foregoing. By agreeing to this provision, however, stockholders have not be deemed to have waived our compliance with the federal securities laws and the rules and regulations thereunder. |
Limitations on Liability and Indemnification Matters
Our amended and restated certificate of incorporation provides that we will indemnify each of our directors and executive officers to the fullest extent permitted by the DGCL. We have entered into indemnification agreements with each of our directors and executive officers that may, in some cases, be broader than the specific indemnification provisions contained under Delaware law. Further, pursuant to our indemnification agreements and directors’ and officers’ liability insurance, our directors and executive officers are indemnified and insured against the cost of defense, settlement or payment of a judgment under certain circumstances. In addition, as permitted by Delaware law, our amended and restated certificate of incorporation includes provisions that eliminate the personal liability of our directors for monetary damages resulting from breaches of certain fiduciary duties as a director. The effect of this provision is to restrict our rights and the rights of our stockholders in derivative suits to recover monetary damages against a director for breach of fiduciary duties as a director.
These provisions may be held not to be enforceable for violations of the federal securities laws of the United States.
Listing
Our Class A common stock is listed on the NYSE under the symbol “FIGS.”
Transfer Agent and Registrar
The transfer agent and registrar for our Class A common stock is Computershare Trust Company, N.A.
132
Table of Contents
SHARES ELIGIBLE FOR FUTURE SALE
As of August 31, 2021, we had a total of 147,730,670 shares of our Class A common stock and 13,264,059 shares of our Class B common stock outstanding, including 30,344,317 shares of Class A common stock that were sold in our IPO and prior to giving effect to the sale of 8,917,385 shares of Class A common stock by the selling stockholders in this offering. All of the shares sold in our IPO and to be sold in this offering may be resold in the public market without restriction unless held by “affiliates” as that term is defined in Rule 144. Shares of our Class B common stock are convertible into an equivalent number of shares of our Class A common stock and generally convert into shares of our Class A common stock upon transfer.
The remaining outstanding shares of our Class A common stock (including shares issuable upon conversion of our Class B common stock) are deemed “restricted securities” as defined in Rule 144 under the Securities Act. Restricted securities may be sold in the public market only if they are registered under the Securities Act or if they qualify for an exemption from registration under Rule 144 or Rule 701 under the Securities Act, which rules are summarized below. As a result of the lock-up agreements and market standoff provisions described below and subject to the provisions of Rule 144 or Rule 701, shares will be available for sale in the public market as follows:
| • | beginning on the date of this prospectus, all of the shares of Class A common stock sold in this offering, will be immediately available for sale in the public market; and |
| • | the remainder of the shares of our common stock will be eligible for sale in the public market beginning on the earlier of 180 days after the date of the IPO Prospectus and the second full trading day following our second public release of quarterly or annual financial results following the date of the IPO Prospectus. |
Lock-Up Agreements and Market Standoff Provisions
In connection with our IPO, all of our directors, and holders of substantially all of our outstanding capital stock entered into lock-up agreements that prohibit them from offering for sale, selling, contracting to sell, granting any option for the sale of, transferring or otherwise disposing of any shares of our common stock, stock options or any security or instrument related to this common stock, or stock option for a period that ends on the earlier of (i) 180 days after May 26, 2021, the date of the final prospectus related to our IPO, or the IPO Prospectus, and (ii) the second full trading day following our second public release of quarterly or annual financial results following the date of the IPO Prospectus, or the Final Release Date, subject to certain exceptions and the early release provisions described below.
The lock-up agreements described above expired with respect to a number of shares equal to 15% of the aggregate number of shares of common stock owned by each holder or issuable upon exercise of vested equity awards owned by each holder immediately prior to the commencement of trading on August 27, 2021, upon satisfaction of the following conditions: (1) the latter of (a) the date we published our first quarterly or annual financial results following the date of the IPO Prospectus and (b) the 90th day following the date of the IPO Prospectus and (2) the closing price of our class A common stock on the NYSE was at least 33% greater than the price of the shares to the public as set forth on the cover of IPO Prospectus for at least 10 trading days (including the date these conditions were met) in any 15-day consecutive trading day period. In connection with this offering, we and all of our directors and executive officers, and Tulco, LLC, Heather Hasson and Catherine Spear as the selling stockholders in this offering, entered into lock-up agreements that prohibit us and them from offering for sale, selling, contracting to sell, pledge, granting any option for the sale of, transferring or otherwise disposing of any shares of our common stock, stock options or any security or instrument related to our common stock, or stock options that would have otherwise been released pursuant to the foregoing early release provisions and which are not being sold in this offering until the Final Release Date. These agreements are subject to certain customary exceptions. See the section titled “Underwriting” for additional information.
133
Table of Contents
Rule 144
In general, under Rule 144, as currently in effect, once we have been subject to the public company reporting requirements of Section 13 or Section 15(d) of the Exchange Act for at least 90 days, a person who is not deemed to have been one of our affiliates for purposes of the Securities Act at any time during the 90 days preceding a sale and who has beneficially owned the shares proposed to be sold for at least six months, including the holding period of any prior owner other than our affiliates, is entitled to sell those shares without complying with the manner of sale, volume limitation or notice provisions of Rule 144, subject to compliance with the public information requirements of Rule 144 and the requirements of the lock-up and market standoff agreements, as described above. If such a person has beneficially owned the shares proposed to be sold for at least one year, including the holding period of any prior owner other than our affiliates, then that person would be entitled to sell those shares (subject to the requirements of the lock-up and market standoff agreements, as described above) without complying with any of the requirements of Rule 144.
In general, under Rule 144, as currently in effect, our affiliates or persons selling shares on behalf of our affiliates are entitled to sell upon expiration of the lock-up and market standoff provisions described above, within any three-month period, a number of shares that does not exceed the greater of:
| • | 1% of the number of shares of our Class A common stock then outstanding, which will equal approximately 1,511,118 shares immediately after this offering; or |
| • | the average weekly trading volume of our Class A common stock during the four calendar weeks preceding the filing of a notice on Form 144 with respect to that sale. |
Sales under Rule 144 by our affiliates or persons selling shares on behalf of our affiliates are also subject to certain manner of sale provisions and notice requirements and to the availability of current public information about us.
Rule 701
Rule 701 generally allows a stockholder who purchased shares of our capital stock pursuant to a written compensatory plan or contract and who is not deemed to have been an affiliate of our company during the immediately preceding 90 days to sell these shares in reliance upon Rule 144, but without being required to comply with the public information, holding period, volume limitation, or notice provisions of Rule 144. Rule 701 also permits affiliates of our company to sell their Rule 701 shares under Rule 144 without complying with the holding period requirements of Rule 144. All holders of Rule 701 shares, however, are required by that rule to wait until 90 days after the date of this prospectus before selling those shares pursuant to Rule 701. Moreover, all Rule 701 shares are subject to lock-up agreements and or market standoff agreements as described above and under the section titled “Underwriting” and will not become eligible for sale until the expiration of those agreements.
Registration Statements
We have filed one or more registration statements on Form S-8 under the Securities Act covering all of the shares of our Class A common stock subject to outstanding stock options and the shares of our Class A common stock reserved for issuance under our equity incentive plans. However, the shares registered on Form S-8 may be subject to the volume limitations and the manner of sale, notice and public information requirements of Rule 144 and will not be eligible for resale until expiration of the lock-up and market standoff agreements to which they are subject.
134
Table of Contents
Registration Rights
We have granted demand, Form S-3, and piggyback registration rights to certain of our stockholders to sell approximately 64,834,274 shares of our common stock. Registration of the sale of these shares under the Securities Act would result in these shares becoming freely tradable without restriction under the Securities Act immediately upon the effectiveness of the registration, except for shares purchased by affiliates. See the section titled “Description of Capital Stock—Registration Rights” for additional information.
135
Table of Contents
MATERIAL U.S. FEDERAL INCOME TAX CONSEQUENCES TO NON-U.S. HOLDERS OF OUR CLASS A COMMON STOCK
The following discussion is a summary of the material U.S. federal income tax consequences to Non-U.S. Holders (as defined below) of the purchase, ownership and disposition of our Class A common stock sold pursuant to this offering, but does not purport to be a complete analysis of all potential tax effects. The effects of other U.S. federal tax laws, such as estate and gift tax laws, and any applicable state, local or non-U.S. tax laws are not discussed. This discussion is based on the U.S. Internal Revenue Code of 1986, as amended, or the Code, Treasury Regulations promulgated thereunder, judicial decisions, and published rulings and administrative pronouncements of the U.S. Internal Revenue Service, or the IRS, in each case in effect as of the date hereof. These authorities may change or be subject to differing interpretations. Any such change or differing interpretation may be applied retroactively in a manner that could adversely affect a Non-U.S. Holder. We have not sought and will not seek any rulings from the IRS regarding the matters discussed below. There can be no assurance the IRS or a court will not take a contrary position to that discussed below regarding the tax consequences of the purchase, ownership and disposition of our Class A common stock.
This discussion is limited to Non-U.S. Holders that hold our Class A common stock as a “capital asset” within the meaning of Section 1221 of the Code (generally, property held for investment). This discussion does not address all U.S. federal income tax consequences relevant to a Non-U.S. Holder’s particular circumstances, including the impact of the Medicare contribution tax on net investment income, the alternative minimum tax provisions of the Code, and the special tax accounting rules under Section 451(b) of the Code. In addition, it does not address consequences relevant to Non-U.S. Holders subject to special rules, including, without limitation:
| • | U.S. expatriates and former citizens or long-term residents of the United States; |
| • | persons holding our Class A common stock as part of a hedge, straddle, synthetic security or other risk reduction strategy or as part of a conversion transaction or other integrated investment; |
| • | banks, insurance companies, and other financial institutions; |
| • | brokers, dealers or traders in securities; |
| • | “controlled foreign corporations,” “passive foreign investment companies,” and corporations that accumulate earnings to avoid U.S. federal income tax; |
| • | partnerships or other entities or arrangements treated as partnerships for U.S. federal income tax purposes (and investors therein); |
| • | tax-exempt organizations or governmental organizations; |
| • | persons deemed to sell our Class A common stock under the constructive sale provisions of the Code; |
| • | persons who hold or receive our Class A common stock pursuant to the exercise of any employee stock option or otherwise as compensation; |
| • | persons that own, or are deemed to own, during the applicable testing period, more than 5% of our outstanding capital stock (except to the extent specifically set forth below); |
| • | tax-qualified retirement plans; and |
| • | “qualified foreign pension funds” as defined in Section 897(l)(2) of the Code and entities all of the interests of which are held by qualified foreign pension funds. |
If an entity treated as a partnership for U.S. federal income tax purposes holds our Class A common stock, the tax treatment of a partner in the partnership will depend on the status of the partner, the activities of the partnership and certain determinations made at the partner level. Accordingly, partnerships holding our Class A common stock and the partners in such partnerships should consult their tax advisors regarding the U.S. federal income tax consequences to them.
136
Table of Contents
THIS DISCUSSION IS FOR INFORMATIONAL PURPOSES ONLY AND IS NOT TAX ADVICE. INVESTORS SHOULD CONSULT THEIR TAX ADVISORS WITH RESPECT TO THE APPLICATION OF THE U.S. FEDERAL INCOME TAX LAWS TO THEIR PARTICULAR SITUATIONS AS WELL AS ANY TAX CONSEQUENCES OF THE PURCHASE, OWNERSHIP AND DISPOSITION OF OUR CLASS A COMMON STOCK ARISING UNDER U.S. FEDERAL NON-INCOME TAX LAWS, INCLUDING ESTATE OR GIFT TAX LAWS OR UNDER THE LAWS OF ANY STATE, LOCAL OR NON-U.S. TAXING JURISDICTION OR UNDER ANY APPLICABLE INCOME TAX TREATY.
Definition of a Non-U.S. Holder
For purposes of this discussion, a “Non-U.S. Holder” is any beneficial owner of our Class A common stock that is neither a “U.S. person” nor an entity treated as a partnership for U.S. federal income tax purposes. A U.S. person is any person that, for U.S. federal income tax purposes, is or is treated as any of the following:
| • | an individual who is a citizen or resident of the United States; |
| • | a corporation created or organized under the laws of the United States, any state thereof, or the District of Columbia; |
| • | an estate, the income of which is subject to U.S. federal income tax regardless of its source; or |
| • | a trust that (1) is subject to the primary supervision of a U.S. court and the control of one or more “United States persons” (within the meaning of Section 7701(a)(30) of the Code), or (2) has a valid election in effect to be treated as a United States person for U.S. federal income tax purposes. |
Distributions
As described in the section entitled “Dividend Policy,” we do not anticipate declaring or paying dividends to holders of our Class A common stock in the foreseeable future. However, if we do make distributions of cash or property on our Class A common stock, such distributions will constitute dividends for U.S. federal income tax purposes to the extent paid from our current or accumulated earnings and profits, as determined under U.S. federal income tax principles. Amounts not treated as dividends for U.S. federal income tax purposes will constitute a return of capital and first be applied against and reduce a Non-U.S. Holder’s adjusted tax basis in its Class A common stock, but not below zero. Any excess will be treated as capital gain and will be treated as described below under “—Sale or Other Taxable Disposition.”
Subject to the discussion below on effectively connected income, dividends paid to a Non-U.S. Holder of our Class A common stock will be subject to U.S. federal withholding tax at a rate of 30% of the gross amount of the dividends (or such lower rate specified by an applicable income tax treaty, provided the Non-U.S. Holder furnishes a valid IRS Form W-8BEN or W-8BEN-E (or other applicable documentation) certifying qualification for the lower treaty rate). A Non-U.S. Holder that does not timely furnish the required documentation, but that qualifies for a reduced treaty rate, may obtain a refund of any excess amounts withheld by timely filing an appropriate claim for refund with the IRS. Non-U.S. Holders should consult their tax advisors regarding their entitlement to benefits under any applicable income tax treaty.
If dividends paid to a Non-U.S. Holder are effectively connected with the Non-U.S. Holder’s conduct of a trade or business within the United States (and, if required by an applicable income tax treaty, the Non-U.S. Holder maintains a permanent establishment in the United States to which such dividends are attributable), the Non-U.S. Holder will be exempt from the U.S. federal withholding tax described above. To claim the exemption, the Non-U.S. Holder must furnish to the applicable withholding agent a valid IRS Form W-8ECI, certifying that the dividends are effectively connected with the Non-U.S. Holder’s conduct of a trade or business within the United States.
137
Table of Contents
Any such effectively connected dividends will be subject to U.S. federal income tax on a net income basis at the regular rates applicable to United States persons. A Non-U.S. Holder that is a corporation also may be subject to a branch profits tax at a rate of 30% (or such lower rate specified by an applicable income tax treaty) on such effectively connected dividends, as adjusted for certain items. Non-U.S. Holders should consult their tax advisors regarding any applicable tax treaties that may provide for different rules.
Sale or Other Taxable Disposition
Subject to the discussion below regarding backup withholding, a Non-U.S. Holder will not be subject to U.S. federal income tax on any gain realized upon the sale or other taxable disposition of our Class A common stock unless:
| • | the gain is effectively connected with the Non-U.S. Holder’s conduct of a trade or business within the United States (and, if required by an applicable income tax treaty, the Non-U.S. Holder maintains a permanent establishment in the United States to which such gain is attributable); |
| • | the Non-U.S. Holder is a nonresident alien individual present in the United States for 183 days or more during the taxable year of the disposition and certain other requirements are met; or |
| • | our Class A common stock constitutes a U.S. real property interest, or USRPI, by reason of our status as a U.S. real property holding corporation, or USRPHC at any time during the five-year period preceding such disposition (or the Non-U.S. Holders’ holding period, if shorter), for U.S. federal income tax purposes. |
Gain described in the first bullet point above generally will be subject to U.S. federal income tax on a net income basis at the regular graduated rates applicable to United States persons. A Non-U.S. Holder that is a corporation also may be subject to a branch profits tax at a rate of 30% (or such lower rate specified by an applicable income tax treaty) on such effectively connected gain, as adjusted for certain items.
A Non-U.S. Holder described in the second bullet point above will be subject to U.S. federal income tax at a rate of 30% (or such lower rate specified by an applicable income tax treaty) on gain realized upon the sale or other taxable disposition of our Class A common stock, which may be offset by U.S. source capital losses of the Non-U.S. Holder (even though the individual is not considered a resident of the United States), provided the Non-U.S. Holder has timely filed U.S. federal income tax returns with respect to such losses.
With respect to the third bullet point above, we believe we currently are not, and do not anticipate becoming, a USRPHC. Because the determination of whether we are a USRPHC depends, however, on the fair market value of our USRPIs relative to the fair market value of our non-U.S. real property interests and our other business assets, there can be no assurance we currently are not a USRPHC or will not become one in the future. Even if we are or were to become a USRPHC, gain arising from the sale or other taxable disposition of our Class A common stock by a Non-U.S. Holder will not be subject to U.S. federal income tax if our Class A common stock is “regularly traded,” as defined by applicable Treasury Regulations, on an established securities market, and such Non-U.S. Holder owned, actually and constructively, 5% or less of our Class A common stock throughout the shorter of the five-year period ending on the date of the sale or other taxable disposition or the Non-U.S. Holder’s holding period.
Non-U.S. Holders should consult their tax advisors regarding potentially applicable income tax treaties that may provide for different rules.
Information Reporting and Backup Withholding
Payments of dividends on our Class A common stock will not be subject to backup withholding, provided the applicable withholding agent does not have actual knowledge or reason to know the holder is a United States person and the holder either certifies its non-U.S. status, such as by furnishing a valid IRS Form W-8BEN,
138
Table of Contents
W-8BEN-E or W-8ECI, or otherwise establishes an exemption. However, information returns are required to be filed with the IRS in connection with any distributions on our Class A common stock paid to the Non-U.S. Holder, regardless of whether such distributions constitute dividends or whether any tax was actually withheld. In addition, proceeds of the sale or other taxable disposition of our Class A common stock within the United States or conducted through certain U.S.-related brokers generally will not be subject to backup withholding or information reporting if the applicable withholding agent receives the certification described above and does not have actual knowledge or reason to know that such holder is a United States person or the holder otherwise establishes an exemption. Proceeds of a disposition of our Class A common stock conducted through a non-U.S. office of a non-U.S. broker generally will not be subject to backup withholding or information reporting.
Copies of information returns that are filed with the IRS may also be made available under the provisions of an applicable treaty or agreement to the tax authorities of the country in which the Non-U.S. Holder resides or is established.
Backup withholding is not an additional tax. Any amounts withheld under the backup withholding rules may be allowed as a refund or a credit against a Non-U.S. Holder’s U.S. federal income tax liability, provided the required information is timely furnished to the IRS.
Additional Withholding Tax on Payments Made to Foreign Accounts
Withholding taxes may be imposed under Sections 1471 to 1474 of the Code (such Sections commonly referred to as the Foreign Account Tax Compliance Act, or FATCA) on certain types of payments made to non-U.S. financial institutions and certain other non-U.S. entities. Specifically, a 30% withholding tax may be imposed on dividends on, or (subject to the proposed Treasury Regulations discussed below) gross proceeds from the sale or other disposition of, our Class A common stock paid to a “foreign financial institution” or a “non-financial foreign entity” (each as defined in the Code), unless (1) the foreign financial institution undertakes certain diligence and reporting obligations, (2) the non-financial foreign entity either certifies it does not have any “substantial United States owners” (as defined in the Code) or furnishes identifying information regarding each substantial United States owner, or (3) the foreign financial institution or non-financial foreign entity otherwise qualifies for an exemption from these rules. If the payee is a foreign financial institution and is subject to the diligence and reporting requirements in (1) above, it must enter into an agreement with the U.S. Department of the Treasury requiring, among other things, that it undertake to identify accounts held by certain “specified United States persons” or “United States owned foreign entities” (each as defined in the Code), annually report certain information about such accounts, and withhold 30% on certain payments to non-compliant foreign financial institutions and certain other account holders. Foreign financial institutions located in jurisdictions that have an intergovernmental agreement with the United States governing FATCA may be subject to different rules.
Under the applicable Treasury Regulations and administrative guidance, withholding under FATCA generally applies to payments of dividends on our Class A common stock. While withholding under FATCA would have applied also to payments of gross proceeds from the sale or other disposition of stock, proposed Treasury Regulations eliminate FATCA withholding on payments of gross proceeds entirely. Taxpayers generally may rely on these proposed Treasury Regulations until final Treasury Regulations are issued.
Prospective investors should consult their tax advisors regarding the potential application of withholding under FATCA to their investment in our Class A common stock.
EACH PROSPECTIVE INVESTOR SHOULD CONSULT ITS OWN TAX ADVISOR REGARDING THE TAX CONSEQUENCES OF THE PURCHASE, OWNERSHIP AND DISPOSITION OF OUR CLASS A COMMON STOCK ARISING UNDER U.S. FEDERAL NON-INCOME TAX LAWS, INCLUDING ESTATE OR GIFT TAX LAWS, OR UNDER THE LAWS OF ANY STATE, LOCAL OR NON-U.S. TAXING JURISDICTION OR UNDER ANY APPLICABLE INCOME TAX TREATY.
139
Table of Contents
The company, the selling stockholders and the underwriters named below will enter into an underwriting agreement with respect to the shares of Class A common stock being offered. Subject to certain conditions, each underwriter will severally agree to purchase the number of shares of Class A common stock indicated in the following table. Goldman Sachs & Co. LLC and Morgan Stanley & Co. LLC are the representatives of the underwriters.
| Underwriters |
Number of Shares |
|||
| Goldman Sachs & Co. LLC |
2,764,390 | |||
| Morgan Stanley & Co. LLC |
2,318,520 | |||
| Barclays Capital Inc. |
1,248,434 | |||
| Credit Suisse Securities (USA) LLC |
1,248,434 | |||
| BofA Securities, Inc. |
356,695 | |||
| Cowen and Company, LLC |
164,972 | |||
| Guggenheim Securities, LLC |
164,972 | |||
| KeyBanc Capital Markets Inc. |
164,972 | |||
| Oppenheimer & Co. Inc. |
164,972 | |||
| Piper Sandler & Co. |
164,972 | |||
| Telsey Advisory Group LLC |
66,880 | |||
| Academy Securities, Inc. |
22,293 | |||
| R. Seelaus & Co., LLC |
22,293 | |||
| Samuel A. Ramirez & Company, Inc. |
22,293 | |||
| Siebert Williams Shank & Co., LLC |
22,293 | |||
|
|
|
|||
| Total |
8,917,385 | |||
|
|
|
|||
The underwriters will be committed to take and pay for all of the shares of Class A common stock being offered, if any are taken, other than the shares of Class A common stock covered by the option described below unless and until this option is exercised.
The underwriters have an option to buy up to an additional 1,337,607 shares of Class A common stock from the selling stockholders to cover sales by the underwriters of a greater number of shares of Class A common stock than the total number set forth in the table above. They may exercise that option for 30 days from the date of this prospectus. If any shares of Class A common stock are purchased pursuant to this option, the underwriters will severally purchase shares of Class A common stock in approximately the same proportion as set forth in the table above.
The following table shows the per share and total underwriting discounts and commissions to be paid to the underwriters by the selling stockholders. Such amounts are shown assuming both no exercise and full exercise of the underwriters’ option to purchase 1,337,607 additional shares of Class A common stock from the selling stockholders.
| No Exercise | Full Exercise | |||||||
| Per Share |
$ | 1.41 | $ | 1.41 | ||||
| Total |
$ | 12,573,513 | $ | 14,459,539 | ||||
Shares of Class A common stock sold by the underwriters to the public will initially be offered at the public offering price set forth on the cover of this prospectus. Any shares of Class A common stock sold by the underwriters to securities dealers may be sold at a discount of up to $0.845250 per share from the public offering price. After the initial offering of the shares of Class A common stock, the representatives may change the
140
Table of Contents
offering price and the other selling terms. The offering of the shares of Class A common stock by the underwriters is subject to receipt and acceptance and subject to the underwriters’ right to reject any order in whole or in part.
In connection with the IPO, the company, our directors, executive officers, the IPO selling stockholders and the holders of substantially of all of our capital stock, entered into lock-up agreements with the IPO underwriters under which they agreed that not to offer, sell, contract to sell, pledge, grant any option to purchase, make any short sale or otherwise transfer or dispose of any shares of the common stock until the Final Release Date, without the prior written consent of Goldman Sachs & Co., LLC & Morgan Stanley & Co. LLC, subject to certain exceptions. These IPO lock-up agreements expired on August 27, 2021 with respect to a number of shares equal to 15% of the aggregate number of shares of common stock owned by each holder or issuable upon exercise of vested equity awards owned by each holder immediately prior to the commencement of trading of the IPO (the “Early Release Shares”).
In connection with this offering, the company and its officers, directors and certain of its stockholders have agreed with the underwriters, subject to certain exceptions, not to dispose of or hedge any of their common stock or securities (except for any shares being sold in this offering) convertible into or exchangeable for shares of Class A common stock (the “Lock-up Restrictions”) during the period from the date of this prospectus continuing through the Final Release Date (the “Lock-up Period”), except with the prior written consent of Goldman Sachs & Co. LLC and Morgan Stanley & Co. LLC, and subject to certain exceptions below. See the section of this prospectus titled “Shares Eligible for Future Sale” for a discussion of certain transfer restrictions.
Notwithstanding the Lock-up Restrictions, holders subject to Lock-up Restrictions may (a) transfer the holder’s Early Release Shares: (i) as a bona fide gift or gifts or charitable contribution, or for bona fide estate planning purposes; provided that the donee or donees thereof agree to be bound in writing by the Lock-up Restrictions; (ii) to any trust for the direct or indirect benefit of the holder or the immediate family of the holder, or if the holder is a trust, to a trustor or beneficiary of the trust, provided that the trustee of the trust agrees to be bound in writing by the Lock-up Restrictions; and provided further that any such transfer shall not involve a disposition for value; (iii) in connection with the sale or other transfer of the holder’s shares of common stock acquired in open market transactions after the completion of this offering; (iv) upon death, by will or intestacy, provided that the legatee, heir or other transferee, as the case may be, agrees to be bound in writing by the Lock-up Restrictions; (v) to any immediate family member, provided that such immediate family member agrees to be bound by the Lock-up Restrictions; (vi) to a partnership, limited liability company or other entity of which the holder and the immediate family members of the holder are the legal and beneficial owner of all of the outstanding equity securities or similar interests, provided that the transferee agrees to be bound in writing by the Lock-up Restrictions; (vii) by operation of law or pursuant to a qualified domestic order or in connection with a divorce settlement or any related court order, provided that such transferee agrees to be bound in writing by the Lock-up Restrictions; (viii) as part of a distribution, transfer or disposition without consideration by the holder to its limited or general partners, members or equity holders, or to any investment fund or other entity controlling, controlled by, managing or managed by or under common control or management with the holder or affiliates of the holder (including, for the avoidance of doubt, where the holder is a partnership, to its general partner or a successor partnership or fund, or any other funds managed by such partnership), provided that the transferee agrees to be bound in writing by the Lock-up Restrictions; (ix) pursuant to a bona fide third-party merger, consolidation, tender offer or other similar transaction involving a change of control of the company occurring after the settlement of this offering that is approved by the company’s board of directors and made to all holders of the company’s capital stock, provided that all of the holder’s Early Release Shares subject to the Lock-up Restrictions that are not so transferred, tendered or otherwise disposed of remain subject to the Lock-up Restrictions; and provided further that, in the event that such change of control is not completed, the holder’s Early Release Shares shall remain subject to the Lock-up Restrictions and title to the holder’s Early Release Shares of the company shall remain with the holder; (x) to the company pursuant to contractual arrangements under which the company has, in connection with the termination of service of the holder, (A) the option to repurchase such Early Release Shares or (B) a right of first refusal with respect to transfers of such Early Release
141
Table of Contents
Shares; provided that in the case of clauses (A) and (B) above, (1) such contractual arrangement (or a form thereof) is described in this prospectus or filed as an exhibit to the registration statement and (2) such contractual arrangement is in effect on the date of this prospectus; (xi) to the underwriters pursuant to the underwriting agreement; (xii) in connection with the vesting or settlement of restricted stock units or the exercise of options or other rights to purchase the shares of common stock (including, in each case, by way of “net” or “cashless” exercise), including (A) any transfer to the company for the payment of exercise price, tax withholdings or remittance payments due as a result of the vesting, settlement or exercise of such restricted stock units, options or rights, and (B) any transfer of shares of common stock necessary to generate such amount of cash needed for the payment of withholding taxes due as a result of the vesting or settlement of restricted stock units or the exercise of options or other rights to purchase shares of common stock, in all such cases, pursuant to equity awards granted under a stock incentive plan or other equity award plan, which plan is described in this prospectus; or (xiii) with the prior written consent of Goldman Sachs & Co. LLC and Morgan Stanley & Co. LLC on behalf of the underwriters; and (b) enter into a written plan meeting the requirements of Rule 10b5-1 under the Exchange Act relating to the transfer, sale or other disposition of securities of the holder, if then permitted by the company; provided that the securities subject to the plan may not be sold during the Lock-Up Period (except to the extent otherwise allowed pursuant to clause (a) above) and no public announcement or filing under the Exchange Act, or any other public filing or announcement, shall be required or shall be voluntarily made regarding the establishment of such plan during the Lock-Up Period. Notwithstanding anything to the contrary, in the case of clauses (i) through (iii), (v), (vi), (viii) and (x)(B) above, no filing under the Exchange Act or any other public filing or disclosure reporting a reduction in beneficial ownership of Early Release Shares by or on behalf of the holder shall be required or voluntarily made during the Lock-Up Period; in the case of any transfers pursuant to clauses (iv), (vii), (x)(A) and (xii) above, any filing that is required under the Exchange Act to be made during the Lock-Up Period shall clearly indicate in the footnotes thereto that the filing relates to the circumstances described in such clauses; and in the case of any transfers pursuant to clauses (ii), (iv) and (v), any such transfer shall not involve a disposition for value.
The Lock-up Restrictions do not apply to the company with respect to (1) the shares to be sold in this offering, (2) any shares of common stock or any securities or other awards (including without limitation options, restricted stock or restricted stock units) convertible into, exercisable for, or that represent the right to receive, shares of common stock pursuant to any stock option plan, incentive plan or stock purchase plan of the company (collectively, “Company Stock Plans”) or otherwise in equity compensation arrangements described in the registration statement and this prospectus or any shares of common stock issuable upon the exercise, conversion or settlement of such awards, provided that any recipient thereof has provided to the Goldman Sachs & Co. LLC and Morgan Stanley & Co. LLC a signed lock-up letter, (3) the issuance by the company of shares of its Class A common stock upon the conversion of shares of its Class B common stock, provided the recipient of such shares of Class A common stock shall have provided to Goldman Sachs & Co. LLC and Morgan Stanley & Co. LLC a signed lock-up letter, (4) the filing by the company of any registration statement on Form S-8 or a successor form thereto relating to any Company Stock Plan described in the registration statement and this prospectus or any assumed employee benefit plan contemplated by clause (5), and (5) any shares of common stock or any securities convertible into or exchangeable for, or that represent the right to receive, shares of common stock issued in connection with any bona fide joint venture, commercial or collaborative relationship or the acquisition or license by the company of the securities, businesses, property or other assets of another person or entity or pursuant to any employee benefit plan assumed by the company in connection with any such acquisition, provided that in the case of clause (5), the aggregate number of shares that the company may sell or issue or agree to sell or issue pursuant to clause (5), (x) shall not exceed 5.0% of the total number of shares of common stock issued and outstanding immediately following the completion of the offering) and (y) the recipients thereof provide to Goldman Sachs & Co. LLC and Morgan Stanley & Co. LLC a signed lock-up letter.
Our Class A common stock is listed on the NYSE under the symbol “FIGS.”
In connection with the offering, the underwriters may purchase and sell shares of common stock in the open market. These transactions may include short sales, stabilizing transactions and purchases to cover positions
142
Table of Contents
created by short sales. Short sales involve the sale by the underwriters of a greater number of shares than they are required to purchase in the offering, and a short position represents the amount of such sales that have not been covered by subsequent purchases. A “covered short position” is a short position that is not greater than the amount of additional shares for which the underwriters’ option described above may be exercised. The underwriters may cover any covered short position by either exercising their option to purchase additional shares or purchasing shares in the open market. In determining the source of shares to cover the covered short position, the underwriters will consider, among other things, the price of shares available for purchase in the open market as compared to the price at which they may purchase additional shares pursuant to the option described above. “Naked” short sales are any short sales that create a short position greater than the amount of additional shares for which the option described above may be exercised. The underwriters must cover any such naked short position by purchasing shares in the open market. A naked short position is more likely to be created if the underwriters are concerned that there may be downward pressure on the price of the Class A common stock in the open market after pricing that could adversely affect investors who purchase in the offering. Stabilizing transactions consist of various bids for or purchases of Class A common stock made by the underwriters in the open market prior to the completion of the offering.
The underwriters may also impose a penalty bid. This occurs when a particular underwriter repays to the underwriters a portion of the underwriting discount received by it because the representatives have repurchased shares sold by or for the account of such underwriter in stabilizing or short covering transactions.
Purchases to cover a short position and stabilizing transactions, as well as other purchases by the underwriters for their own accounts, may have the effect of preventing or retarding a decline in the market price of the company’s Class A stock, and together with the imposition of the penalty bid, may stabilize, maintain or otherwise affect the market price of the Class A common stock. As a result, the price of the Class A common stock may be higher than the price that otherwise might exist in the open market. The underwriters are not required to engage in these activities and may end any of these activities at any time. These transactions may be effected on the NYSE, in the over-the-counter market or otherwise.
The company and the selling stockholders estimate that their share of the total expenses of the offering, excluding underwriting discounts and commissions, will be approximately $1.5 million. We have agreed to reimburse the underwriters for certain of their expenses in an amount up to $45,000.
The selling stockholders will agree to indemnify the several underwriters against certain liabilities, including liabilities under the Securities Act.
The underwriters and their respective affiliates are full service financial institutions engaged in various activities, which may include sales and trading, commercial and investment banking, advisory, investment management, investment research, principal investment, hedging, market making, brokerage and other financial and non-financial activities and services. Certain of the underwriters and their respective affiliates have provided, and may in the future provide, a variety of these services to the issuer and to persons and entities with relationships with the issuer, for which they received or will receive customary fees and expenses. Affiliates of Goldman Sachs & Co. LLC beneficially own a less than 1% interest in Tulco, LLC, our majority stockholder and the selling stockholders, which was acquired in 2018. An affiliate of Guggenheim Securities, LLC beneficially owns approximately a 2.7% interest in the Company. Bank of America, N.A., an affiliate of Bank of America Securities, Inc., is the lender under the company’s New Credit Facility, and has and will continue to receive customary fees and expenses for serving in such role. In addition, the underwriters in this offering also served as underwriters in our initial public offering in June 2021.
In the ordinary course of their various business activities, the underwriters and their respective affiliates, officers, directors and employees may purchase, sell or hold a broad array of investments and actively trade securities, derivatives, loans, commodities, currencies, credit default swaps and other financial instruments for their own account and for the accounts of their customers, and such investment and trading activities may involve or relate to assets, securities and/or instruments of the issuer (directly, as collateral securing other obligations or
143
Table of Contents
otherwise) and/or persons and entities with relationships with the issuer. The underwriters and their respective affiliates may also communicate independent investment recommendations, market color or trading ideas and/or publish or express independent research views in respect of such assets, securities or instruments and may at any time hold, or recommend to clients that they should acquire, long and/or short positions in such assets, securities and instruments.
Selling Restrictions
European Economic Area
In relation to each Member State of the European Economic Area (each a “Relevant State”), no shares have been offered or will be offered pursuant to the offering to the public in that Relevant State prior to the publication of a prospectus in relation to the shares which has been approved by the competent authority in that Relevant State or, where appropriate, approved in another Relevant State and notified to the competent authority in that Relevant State, all in accordance with the Prospectus Regulation, except that the shares may be offered to the public in that Relevant State at any time:
| (a) | to any legal entity which is a qualified investor as defined under Article 2 of the Prospectus Regulation; |
| (b) | to fewer than 150 natural or legal persons (other than qualified investors as defined under Article 2 of the Prospectus Regulation), subject to obtaining the prior consent of the representatives for any such offer; or |
| (c) | in any other circumstances falling within Article 1(4) of the Prospectus Regulation, |
provided that no such offer of the shares shall require the company or any of the underwriters to publish a prospectus pursuant to Article 3 of the Prospectus Regulation or supplement a prospectus pursuant to Article 23 of the Prospectus Regulation.
For the purposes of this provision, the expression an “offer to the public” in relation to the shares in any Relevant State means the communication in any form and by any means of sufficient information on the terms of the offer and any shares to be offered so as to enable an investor to decide to purchase or subscribe for any shares, and the expression “Prospectus Regulation” means Regulation (EU) 2017/1129.
United Kingdom
No shares have been offered or will be offered pursuant to the offering to the public in the United Kingdom prior to the publication of a prospectus in relation to the shares which has been approved by the Financial Conduct Authority, except that the shares may be offered to the public in the United Kingdom at any time:
| (d) | to any legal entity which is a qualified investor as defined under Article 2 of the UK Prospectus Regulation; |
| (e) | to fewer than 150 natural or legal persons (other than qualified investors as defined under Article 2 of the UK Prospectus Regulation), subject to obtaining the prior consent of the representatives for any such offer; or |
| (f) | in any other circumstances falling within Section 86 of the FSMA. |
provided that no such offer of the shares shall require the company or any underwriter to publish a prospectus pursuant to Section 85 of the FSMA or supplement a prospectus pursuant to Article 23 of the UK Prospectus Regulation.
For the purposes of this provision, the expression an “offer to the public” in relation to the shares in the United Kingdom means the communication in any form and by any means of sufficient information on the terms of the offer and any shares to be offered so as to enable an investor to decide to purchase or subscribe for any
144
Table of Contents
shares and the expression “UK Prospectus Regulation” means Regulation (EU) 2017/1129 as it forms part of domestic law by virtue of the European Union (Withdrawal) Act 2018.
Canada
The securities may be sold in Canada only to purchasers purchasing, or deemed to be purchasing, as principal that are accredited investors, as defined in National Instrument 45-106 Prospectus Exemptions or subsection 73.3(1) of the Securities Act (Ontario), and are permitted clients, as defined in National Instrument 31-103 Registration Requirements, Exemptions, and Ongoing Registrant Obligations. Any resale of the securities must be made in accordance with an exemption form, or in a transaction not subject to, the prospectus requirements of applicable securities laws.
Securities legislation in certain provinces or territories of Canada may provide a purchaser with remedies for rescission or damages if this prospectus (including any amendment thereto) contains a misrepresentation, provided that the remedies for rescission or damages are exercised by the purchaser within the time limit prescribed by the securities legislation of the purchaser’s province or territory. The purchaser should refer to any applicable provisions of the securities legislation of the purchaser’s province or territory of these rights or consult with a legal advisor.
Pursuant to section 3A.3 of National Instrument 33-105 Underwriting Conflicts (NI 33-105), the underwriters are not required to comply with the disclosure requirements of NI 33-105 regarding underwriter conflicts of interest in connection with this offering.
Hong Kong
The shares may not be offered or sold in Hong Kong by means of any document other than (i) in circumstances which do not constitute an offer to the public within the meaning of the Companies (Winding Up and Miscellaneous Provisions) Ordinance (Cap. 32 of the Laws of Hong Kong) (“Companies (Winding Up and Miscellaneous Provisions) Ordinance”) or which do not constitute an invitation to the public within the meaning of the Securities and Futures Ordinance (Cap. 571 of the Laws of Hong Kong) (“Securities and Futures Ordinance”), or (ii) to “professional investors” as defined in the Securities and Futures Ordinance and any rules made thereunder, or (iii) in other circumstances which do not result in the document being a “prospectus” as defined in the Companies (Winding Up and Miscellaneous Provisions) Ordinance, and no advertisement, invitation or document relating to the shares may be issued or may be in the possession of any person for the purpose of issue (in each case whether in Hong Kong or elsewhere), which is directed at, or the contents of which are likely to be accessed or read by, the public in Hong Kong (except if permitted to do so under the securities laws of Hong Kong) other than with respect to shares which are or are intended to be disposed of only to persons outside Hong Kong or only to “professional investors” in Hong Kong as defined in the Securities and Futures Ordinance and any rules made thereunder.
Singapore
This prospectus has not been registered as a prospectus with the Monetary Authority of Singapore. Accordingly, this prospectus and any other document or material in connection with the offer or sale, or invitation for subscription or purchase, of the shares may not be circulated or distributed, nor may the shares be offered or sold, or be made the subject of an invitation for subscription or purchase, whether directly or indirectly, to persons in Singapore other than (i) to an institutional investor (as defined under Section 4A of the Securities and Futures Act, Chapter 289 of Singapore (the “SFA”)) under Section 274 of the SFA, (ii) to a relevant person (as defined in Section 275(2) of the SFA) pursuant to Section 275(1) of the SFA, or any person pursuant to Section 275(1A) of the SFA, and in accordance with the conditions specified in Section 275 of the SFA or (iii) otherwise pursuant to, and in accordance with the conditions of, any other applicable provision of the SFA, in each case subject to conditions set forth in the SFA.
145
Table of Contents
Where the shares are subscribed or purchased under Section 275 of the SFA by a relevant person which is a corporation (which is not an accredited investor (as defined in Section 4A of the SFA)) the sole business of which is to hold investments and the entire share capital of which is owned by one or more individuals, each of whom is an accredited investor, the securities (as defined in Section 239(1) of the SFA) of that corporation shall not be transferable for 6 months after that corporation has acquired the shares under Section 275 of the SFA except: (1) to an institutional investor under Section 274 of the SFA or to a relevant person (as defined in Section 275(2) of the SFA), (2) where such transfer arises from an offer in that corporation’s securities pursuant to Section 275(1A) of the SFA, (3) where no consideration is or will be given for the transfer, (4) where the transfer is by operation of law, (5) as specified in Section 276(7) of the SFA, or (6) as specified in Regulation 32 of the Securities and Futures (Offers of Investments) (Shares and Debentures) Regulations 2005 of Singapore (“Regulation 32”).
Where the shares are subscribed or purchased under Section 275 of the SFA by a relevant person which is a trust (where the trustee is not an accredited investor (as defined in Section 4A of the SFA)) whose sole purpose is to hold investments and each beneficiary of the trust is an accredited investor, the beneficiaries’ rights and interest (howsoever described) in that trust shall not be transferable for 6 months after that trust has acquired the shares under Section 275 of the SFA except: (1) to an institutional investor under Section 274 of the SFA or to a relevant person (as defined in Section 275(2) of the SFA), (2) where such transfer arises from an offer that is made on terms that such rights or interest are acquired at a consideration of not less than S$200,000 (or its equivalent in a foreign currency) for each transaction (whether such amount is to be paid for in cash or by exchange of securities or other assets), (3) where no consideration is or will be given for the transfer, (4) where the transfer is by operation of law, (5) as specified in Section 276(7) of the SFA, or (6) as specified in Regulation 32.
Japan
The securities have not been and will not be registered under the Financial Instruments and Exchange Act of Japan (Act No. 25 of 1948, as amended), or the FIEA. The securities may not be offered or sold, directly or indirectly, in Japan or to or for the benefit of any resident of Japan (including any person resident in Japan or any corporation or other entity organized under the laws of Japan) or to others for reoffering or resale, directly or indirectly, in Japan or to or for the benefit of any resident of Japan, except pursuant to an exemption from the registration requirements of the FIEA and otherwise in compliance with any relevant laws and regulations of Japan.
146
Table of Contents
The validity of the shares of our Class A common stock offered hereby will be passed upon for us by Latham & Watkins LLP. Certain legal matters will be passed upon for the underwriters by Cooley LLP.
The financial statements audited by Ernst & Young LLP as of and for each of the years ended December 31, 2019 and 2020 have been included in this prospectus in reliance on their report given on their authority as experts in accounting and auditing.
WHERE YOU CAN FIND ADDITIONAL INFORMATION
We have filed with the SEC a registration statement on Form S-1 under the Securities Act with respect to the shares of our Class A common stock offered hereby. This prospectus, which constitutes a part of the registration statement, does not contain all of the information set forth in the registration statement or the exhibits and schedules filed therewith. For further information about us and the Class A common stock offered hereby, reference is made to the registration statement and the exhibits filed therewith. Statements contained in this prospectus regarding the contents of any contract or any other document that is filed as an exhibit to the registration statement are not necessarily complete, and in each instance, we refer you to the copy of such contract or other document filed as an exhibit to the registration statement. The SEC maintains a website that contains reports, proxy, and information statements and other information regarding registrants that file electronically with the SEC. The address of the website is www.sec.gov.
We are subject to the information and periodic reporting requirements of the Exchange Act and, in accordance with this law, will file periodic reports, proxy statements and other information with the SEC. These periodic reports, proxy statements and other information will be available for inspection and copying at the SEC’s public reference facilities and the website of the SEC referred to above. We also maintain a website at www.wearfigs.com. You may access these materials free of charge as soon as reasonably practicable after they are electronically filed with, or furnished to, the SEC. The inclusion of our website address in this prospectus is an inactive textual reference only. The information contained in or accessible through our website is not part of this prospectus or the registration statement of which this prospectus forms a part, and investors should not rely on such information in making a decision to purchase our Class A common stock in this offering.
147
Table of Contents
F-1
Table of Contents
Report of Independent Registered Public Accounting Firm
To the Stockholders and the Board of Directors of FIGS, Inc.
Opinion on the Financial Statements
We have audited the accompanying balance sheets of FIGS, Inc. (the Company) as of December 31, 2019 and 2020, the related statements of income and comprehensive income, stockholders’ equity and cash flows for the years then ended and the related notes (collectively referred to as the “financial statements”). In our opinion, the financial statements present fairly, in all material respects, the financial position of the Company at December 31, 2019 and 2020, and the results of its operations and its cash flows for each of the two years in the period ended December 31, 2020, in conformity with U.S. generally accepted accounting principles.
Basis for Opinion
These financial statements are the responsibility of the Company’s management. Our responsibility is to express an opinion on the Company’s financial statements based on our audits. We are a public accounting firm registered with the Public Company Accounting Oversight Board (United States) (PCAOB) and are required to be independent with respect to the Company in accordance with the U.S. federal securities laws and the applicable rules and regulations of the Securities and Exchange Commission and the PCAOB.
We conducted our audits in accordance with the standards of the PCAOB. Those standards require that we plan and perform the audit to obtain reasonable assurance about whether the financial statements are free of material misstatement, whether due to error or fraud. The Company is not required to have, nor were we engaged to perform, an audit of its internal control over financial reporting. As part of our audits we are required to obtain an understanding of internal control over financial reporting but not for the purpose of expressing an opinion on the effectiveness of the Company’s internal control over financial reporting. Accordingly, we express no such opinion.
Our audits included performing procedures to assess the risks of material misstatement of the financial statements, whether due to error or fraud, and performing procedures that respond to those risks. Such procedures included examining, on a test basis, evidence regarding the amounts and disclosures in the financial statements. Our audits also included evaluating the accounting principles used and significant estimates made by management, as well as evaluating the overall presentation of the financial statements. We believe that our audits provide a reasonable basis for our opinion.
/s/ Ernst & Young
We have served as the Company’s auditor since 2017.
Los Angeles, California
March 17, 2021, except for the effects of the stock split discussed in Note 2 to the financial statements, as to which the date is May 20, 2021
F-2
Table of Contents
FIGS, INC.
(In thousands, except share and per share data)
| As of December 31, | ||||||||
| Assets | 2019 | 2020 | ||||||
| Current assets |
||||||||
| Cash and cash equivalents |
$ | 38,353 | $ | 58,133 | ||||
| Accounts receivable |
1,758 | 5,780 | ||||||
| Inventory, net |
14,300 | 49,735 | ||||||
| Prepaid expenses and other current assets |
1,992 | 6,665 | ||||||
|
|
|
|
|
|||||
| Total current assets |
56,403 | 120,313 | ||||||
| Non-current assets |
||||||||
| Property and equipment, net |
5,749 | 6,529 | ||||||
| Deferred tax assets |
— | 6,507 | ||||||
| Other assets |
446 | 506 | ||||||
|
|
|
|
|
|||||
| Total non-current assets |
6,195 | 13,542 | ||||||
|
|
|
|
|
|||||
| Total assets |
$ | 62,598 | $ | 133,855 | ||||
|
|
|
|
|
|||||
| Liabilities and stockholders’ equity |
||||||||
| Current liabilities |
||||||||
| Accounts payable |
$ | 10,522 | $ | 11,965 | ||||
| Accrued expenses |
3,186 | 6,682 | ||||||
| Accrued compensation and benefits |
1,848 | 4,214 | ||||||
| Sales tax payable |
2,548 | 3,076 | ||||||
| Gift card liability |
991 | 3,019 | ||||||
| Deferred revenue |
988 | 1,781 | ||||||
| Returns reserve |
776 | 1,677 | ||||||
| Income tax payable |
— | 105 | ||||||
|
|
|
|
|
|||||
| Total current liabilities |
20,859 | 32,519 | ||||||
| Non-current liabilities |
||||||||
| Deferred rent and lease incentive |
2,925 | 3,659 | ||||||
|
|
|
|
|
|||||
| Total liabilities |
23,784 | 36,178 | ||||||
|
|
|
|
|
|||||
| Commitments and contingencies |
||||||||
| Stockholders’ equity |
||||||||
| Common stock—par value $0.0001 per share, 171,000,000 and 207,000,000 shares authorized as of December 31, 2019 and 2020, respectively; 153,052,983 and 154,444,851 shares issued and outstanding as of December 31, 2019 and 2020, respectively. |
15 | 15 | ||||||
| Additional paid-in capital |
61,070 | 70,175 | ||||||
| (Accumulated deficit) retained earnings |
(22,271 | ) | 27,487 | |||||
|
|
|
|
|
|||||
| Total stockholders’ equity |
38,814 | 97,677 | ||||||
|
|
|
|
|
|||||
| Total liabilities and stockholders’ equity |
$ | 62,598 | $ | 133,855 | ||||
|
|
|
|
|
|||||
The accompanying notes are an integral part of these financial statements.
F-3
Table of Contents
FIGS, INC.
STATEMENTS OF INCOME AND COMPREHENSIVE INCOME
(In thousands, except share and per share data)
| Years ended December 31, | ||||||||
| 2019 | 2020 | |||||||
| Net revenues |
$ | 110,494 | $ | 263,112 | ||||
| Cost of goods sold |
31,158 | 72,888 | ||||||
|
|
|
|
|
|||||
| Gross profit |
79,336 | 190,224 | ||||||
| Operating expenses |
||||||||
| Selling |
24,840 | 51,896 | ||||||
| Marketing |
33,193 | 38,852 | ||||||
| General and administrative |
21,650 | 41,536 | ||||||
|
|
|
|
|
|||||
| Total operating expenses |
79,683 | 132,284 | ||||||
|
|
|
|
|
|||||
| Net (loss) income from operations |
(347 | ) | 57,940 | |||||
| Other income, net |
||||||||
| Interest income |
460 | 136 | ||||||
| Other expense |
(1 | ) | — | |||||
|
|
|
|
|
|||||
| Total other income, net |
459 | 136 | ||||||
|
|
|
|
|
|||||
| Net income before provision for income taxes |
112 | 58,076 | ||||||
| Provision for income taxes |
— | 8,318 | ||||||
| Net income and comprehensive income |
$ | 112 | $ | 49,758 | ||||
|
|
|
|
|
|||||
| Basic earnings per share |
$ | — | $ | 0.32 | ||||
|
|
|
|
|
|||||
| Diluted earnings per share |
$ | — | $ | 0.30 | ||||
|
|
|
|
|
|||||
| Weighted-average shares outstanding—basic |
153,052,983 | 153,327,308 | ||||||
|
|
|
|
|
|||||
| Weighted-average shares outstanding—diluted |
153,624,013 | 163,331,348 | ||||||
|
|
|
|
|
|||||
The accompanying notes are an integral part of these financial statements.
F-4
Table of Contents
FIGS, INC.
STATEMENTS OF STOCKHOLDERS’ EQUITY
(In thousands, except share data)
| Common Stock | ||||||||||||||||||||||||
| Shares | Amount | Contribution Receivable |
Additional Paid-in Capital |
(Accumulated Deficit) Retained Earnings |
Total Stockholders’ Equity |
|||||||||||||||||||
| December 31, 2018 |
153,052,983 | $ | 15 | $ | (14,000 | ) | $ | 60,891 | $ | (22,383 | ) | $ | 24,523 | |||||||||||
|
|
|
|
|
|
|
|
|
|
|
|
|
|||||||||||||
| Stock-based compensation |
— | — | — | 179 | — | 179 | ||||||||||||||||||
| Contributed capital |
— | — | 14,000 | — | — | 14,000 | ||||||||||||||||||
| Net income |
— | — | — | — | 112 | 112 | ||||||||||||||||||
|
|
|
|
|
|
|
|
|
|
|
|
|
|||||||||||||
| December 31, 2019 |
153,052,983 | $ | 15 | $ | — | $ | 61,070 | $ | (22,271 | ) | $ | 38,814 | ||||||||||||
|
|
|
|
|
|
|
|
|
|
|
|
|
|||||||||||||
| Stock-based compensation |
— | — | — | 8,713 | — | 8,713 | ||||||||||||||||||
| Stock option exercises |
1,391,868 | — | — | 392 | — | 392 | ||||||||||||||||||
| Net income |
— | — | — | — | 49,758 | 49,758 | ||||||||||||||||||
|
|
|
|
|
|
|
|
|
|
|
|
|
|||||||||||||
| December 31, 2020 |
154,444,851 | $ | 15 | $ | — | $ | 70,175 | $ | 27,487 | $ | 97,677 | |||||||||||||
|
|
|
|
|
|
|
|
|
|
|
|
|
|||||||||||||
The accompanying notes are an integral part of these financial statements.
F-5
Table of Contents
FIGS, INC.
(In thousands)
| Years Ended December 31, |
||||||||
| Cash flows from operating activities: | 2019 | 2020 | ||||||
| Net income |
$ | 112 | $ | 49,758 | ||||
| Adjustments to reconcile net income to net cash provided by operating activities: |
||||||||
| Depreciation and amortization expense |
517 | 946 | ||||||
| Benefit for deferred income taxes |
— | (6,507 | ) | |||||
| Loss on disposal of property and equipment |
120 | 2 | ||||||
| Stock-based compensation |
179 | 8,713 | ||||||
| Changes in operating assets and liabilities: |
||||||||
| Accounts receivable |
(1,266 | ) | (4,023 | ) | ||||
| Inventory |
(763 | ) | (35,435 | ) | ||||
| Prepaid expenses and other current assets |
254 | (4,672 | ) | |||||
| Other assets |
(342 | ) | 38 | |||||
| Accounts payable |
2,715 | 1,207 | ||||||
| Accrued expenses |
464 | 4,266 | ||||||
| Deferred revenue |
(712 | ) | 794 | |||||
| Accrued compensation and benefits |
713 | 2,366 | ||||||
| Returns reserve |
267 | 901 | ||||||
| Sales tax payable |
636 | 527 | ||||||
| Income tax payable |
— | 105 | ||||||
| Gift card liability |
722 | 2,028 | ||||||
| Deferred rent and lease incentive |
2,915 | 734 | ||||||
|
|
|
|
|
|||||
| Net cash provided by operating activities |
6,531 | 21,748 | ||||||
| Cash flows from investing activities: |
||||||||
| Purchases of property and equipment |
(4,761 | ) | (2,262 | ) | ||||
|
|
|
|
|
|||||
| Net cash used in investing activities |
(4,761 | ) | (2,262 | ) | ||||
| Cash flows from financing activities: |
||||||||
| Payment of financing costs |
— | (98 | ) | |||||
| Proceeds from contributed capital |
14,000 | — | ||||||
| Proceeds from stock option exercises |
— | 392 | ||||||
|
|
|
|
|
|||||
| Net cash provided by financing activities |
14,000 | 294 | ||||||
|
|
|
|
|
|||||
| Net increase in cash and cash equivalents |
15,770 | 19,780 | ||||||
| Cash and cash equivalents, beginning of year |
22,583 | 38,353 | ||||||
|
|
|
|
|
|||||
| Cash and cash equivalents, end of year |
$ | 38,353 | $ | 58,133 | ||||
|
|
|
|
|
|||||
| Supplemental disclosures: |
||||||||
| Income taxes paid |
$ | — | $ | 18,162 | ||||
| Property and equipment in accounts payable and accrued expenses |
$ | 770 | $ | 236 | ||||
The accompanying notes are an integral part of these financial statements.
F-6
Table of Contents
FIGS, INC.
FOR THE YEARS ENDED DECEMBER 31, 2019 AND 2020
1. DESCRIPTION OF BUSINESS
FIGS, Inc. (the “Company”), a Delaware Corporation, was founded in 2013 and is a founder-led, direct-to-consumer healthcare apparel and lifestyle brand company. The Company designs and sells healthcare apparel and other non-scrub offerings, such as lab coats, underscrubs, outerwear, activewear, loungewear, compression socks footwear, masks and face shields. The Company markets and sells its products primarily in the United States. Sales are primarily generated through the Company’s digital platforms.
Impact of COVID-19
In December 2019, a novel strain of coronavirus, which causes the disease known as COVID-19, was reported to have surfaced in Wuhan, China. Since then, COVID-19 coronavirus has spread globally. In March 2020, the World Health Organization declared the COVID-19 outbreak a pandemic. The ongoing COVID-19 global and national health emergency has caused significant disruption in the international and United States economies and financial markets. The spread of COVID-19 has caused illness, quarantines, cancellation of events and travel, business and school shutdowns, reduction in business activity and financial transactions, labor shortages, supply chain interruptions and overall economic and financial market instability.
In response to public health directives and orders and to help minimize the risk of the virus to employees, the Company has taken precautionary measures, including implementing work from home policies for certain employees. The COVID-19 pandemic has the potential to significantly impact the Company’s manufacturing supply chain, distribution, logistics and other services. Certain of the Company’s suppliers experienced delays and shut-downs due to the COVID-19 pandemic. In order to manage the impact of these disruptions and meet its customers’ expectations, the Company increased the use of more costly air freight during 2020, which increased cost of goods sold. The Company has not experienced the pandemic’s adverse impacts in any additional material respect.
2. SUMMARY OF SIGNIFICANT ACCOUNTING POLICIES
Basis of Presentation
The Company has prepared the accompanying financial statements in accordance with generally accepted accounting principles in the United States of America (“U.S. GAAP”).
Stock Split
On May 19, 2021, the Company effected a nine-for-one forward stock split of its issued and outstanding common stock, stock options and RSUs. Accordingly, all share and per share information has been retroactively adjusted to reflect the stock split for all periods presented.
Use of Estimates
The preparation of financial statements in conformity with U.S. GAAP requires management to make estimates and assumptions that affect reported amounts of assets and liabilities, disclosure of contingent assets and liabilities at the date of the financial statements, and the reported amounts of revenues and expenses during the reporting periods presented. Significant estimates include, but are not limited to, the valuation of the net realizable value of inventory, reserves for sales returns, allowances for doubtful accounts, stock-based compensation, contingent sales tax liability, and the useful lives and recoverability of long-lived assets. Actual results could differ from those estimates.
F-7
Table of Contents
Loss Contingencies
The Company may be involved in legal proceedings, claims and regulatory, tax or government inquiries and investigations that arise in the ordinary course of business resulting in loss contingencies. Loss contingencies are accrued for when losses become probable and are reasonably estimable. If the reasonable estimate of the loss is a range and no amount within the range is a better estimate, the minimum amount of the range is recorded as a liability. The Company does not accrue for contingent losses that, in its judgment, are considered to be reasonably possible, but not probable; however, the range of such reasonably possible losses would be disclosed. Loss contingencies considered remote are generally not disclosed.
Fair Value of Financial Instruments
Fair value is defined as the price that would be received to sell an asset or paid to transfer a liability in an orderly transaction between market participants at the measurement date. The Company uses valuation techniques that are based upon observable and unobservable inputs. Observable inputs are developed using market data such as publicly available information and reflect the assumptions market participants would use, while unobservable inputs are developed using the best information available about the assumptions market participants would use. Assets and liabilities are classified in the fair value hierarchy based on the lowest level input that is significant to the fair value measurement:
Level 1: Unadjusted quoted prices in active markets for identical assets or liabilities.
Level 2: Observable inputs other than quoted prices included in Level 1, such as quoted prices for similar assets and liabilities in active markets; quoted prices for identical or similar assets and liabilities in markets that are not active; or other inputs that are observable or can be corroborated by observable market data.
Level 3: Unobservable inputs that are supported by little or no market activity and that are significant to the fair value of the assets or liabilities. This includes certain pricing models, discounted cash flow methodologies, and similar techniques that use significant unobservable inputs.
To the extent that the valuation is based on models or inputs that are less observable or unobservable in the market, the determination of fair value requires more judgment. Accordingly, the degree of judgment exercised by the Company in determining fair value is greatest for instruments categorized in Level 3. A financial instrument’s level within the fair value hierarchy is based on the lowest level of any input that is significant to the fair value measurement. The Company has no assets or liabilities classified as Level 3 on its balance sheets as of December 31, 2019 and 2020.
Concentrations of Credit Risk
Financial instruments that potentially subject the Company to concentrations of credit risk consist of cash and cash equivalents.
The Company’s cash and cash equivalents are held with creditworthy financial institutions. Although the Company’s deposits held with banks may exceed the amount of federal insurance provided on such deposits, the Company has not experienced any losses in such accounts. The Company invests its excess cash in money market accounts.
The Company is exposed to credit risk in the event of a default by the financial institutions holding its cash and cash equivalents for the amounts reflected on the balance sheets.
F-8
Table of Contents
Comprehensive Income
Comprehensive income includes net income as well as other changes in stockholders’ equity that result from transactions and economic events other than those with stockholders. For the years ended December 31, 2019 and 2020, there was no difference between net income and comprehensive income.
Cash and Cash Equivalents
The Company considers highly liquid investments with original maturities of three months or less to be cash equivalents. The Company’s cash equivalents, which are funds held in a money market account, are measured at fair value on a recurring basis. The carrying amount of cash equivalents was $27.6 million and $50.2 million as of December 31, 2019 and 2020, respectively, which approximates fair value and was determined based upon Level 1 inputs. The money market account is valued using quoted market prices with no valuation adjustments applied and is categorized as Level 1.
Accounts Receivable
Accounts receivable consists of trade accounts receivables relating primarily to the credit card receivables arising from the sale of products to customers through the Company’s digital platforms. Trade accounts receivable is reported net of an allowance for doubtful accounts. The Company had no allowance for doubtful accounts as of December 31, 2019 and 2020. Other receivables generally relate to amounts due to the Company that result from activities that are not related to the direct sale of the Company’s products.
Inventory, Net
Inventory consists of finished goods and is accounted for using an average cost method. Inventory is valued at the lower of cost or net realizable value. The Company records a provision for excess and obsolete inventory to adjust the carrying value of inventory based on assumptions regarding future demand for the Company’s products.
Lower of cost or net realizable value is evaluated by considering obsolescence, excessive levels of inventory, deterioration, and other factors. Adjustments to reduce the cost of inventory to its net realizable value, if required, are made for estimated excess, obsolescence, or impaired inventory. Excess and obsolete inventory is charged to cost of goods sold.
The Company recorded an allowance to write down inventory of $0.8 million as of December 31, 2020, to reduce inventory to the lower of cost or to its net realizable value. There was no allowance to write down inventory as of December 31, 2019.
Property and Equipment, Net
Property and equipment are recorded at cost, net of accumulated depreciation and amortization. The Company depreciates property and equipment using the straight-line method over the estimated useful lives of the assets, which range from three to ten years.
| Estimated useful life (years) | ||
| Furniture and fixtures |
7 | |
| Office equipment |
5 | |
| Machinery and equipment |
10 | |
| Computer equipment |
3 | |
| Software and website development |
5 | |
| Leasehold improvements |
Shorter of the lease term or the estimated life of the asset |
F-9
Table of Contents
Upon the sale or disposal of property and equipment, the cost and related accumulated depreciation and amortization are removed from the balance sheet and the resulting gain or loss is reflected in general and administrative expense in the statements of income and comprehensive income. Maintenance and repairs are charged to the general and administrative expenses in the statements of income and comprehensive income as incurred, while expenditures for major renewals and betterments that extend the useful life of an asset or provide additional utility are capitalized.
The Company has incurred costs related to the development of the Company’s websites. The Company capitalizes these website development costs, as applicable, in accordance with ASC Subtopic 350-50, Intangibles—Goodwill and Other—Website Development Costs (“ASC 350-50”). ASC 350-50 requires that costs incurred during the website development stage be capitalized. Capitalized website costs include salary and benefit costs for Company employees and contractors that develop the website. When the development phase is substantially complete and the website is ready for its intended purpose, capitalized costs are amortized using the straight-line method over the five-year useful life.
Cloud Computing Costs
The Company also capitalizes software license fees and implementation costs associated with cloud hosting arrangements that are service contracts. These amounts are included in other assets in the accompanying balance sheets. Amortization of the software license fees is calculated using the straight-line method over the term of the service contract. Amortization of the implementation costs is calculated using the straight-line method based on the term of the service contract or based on the expected utilization of the asset and commences once the module or component is ready for its intended use.
Impairment of Long-Lived Assets
The Company reviews its long-lived assets for impairment whenever events or changes in circumstances indicate that the carrying amount of an asset may not be recoverable. Recoverability of assets to be held and used is measured by a comparison of the carrying amount of the asset or group of assets to the future undiscounted cash flows expected to be generated by the asset or asset group. If the evaluation of the forecasted cash flows indicates that the carrying value of the assets is not recoverable, the assets are written down to their fair value. No such impairments have been identified for the years ended December 31, 2019 and 2020.
Deferred Rent and Lease Incentive
The Company leases certain facilities under non-cancelable operating leases. The Company’s leases generally contain escalating payments over the lease term or rent holiday periods. Rent expense is recognized on a straight-line basis over the term of the lease, beginning when the Company takes possession of the leased space. The difference between the rent expense and cash paid to landlords is recorded as a deferred rent liability in the accompanying balance sheets.
In certain cases, the Company receives allowances for construction and leasehold improvements from its landlords which are recorded as a deferred lease credit in the accompanying balance sheets and amortizes the deferred lease credit as a reduction of rent expense in the accompanying statements of income and comprehensive income over the term of the lease.
Sales Tax
Based on the 2018 Supreme Court decision in South Dakota v. Wayfair Inc., an increasing number of states have considered or adopted laws or administrative practices, with or without notice, that impose new taxes on remote sellers to collect transaction taxes such as sales, consumption, or similar taxes. The Company follows the guidelines of ASC 450, Contingencies, and its financial statements reflect the current impact of such legislation.
F-10
Table of Contents
Revenue Recognition
The Company recognizes revenues in accordance with Financial Accounting Standards Board (“FASB”) ASU 2014-09, Revenue from Contracts with Customers (Topic 606) (“ASC 606”). Revenue is recognized in an amount that reflects the consideration expected to be received in exchange for products. To determine revenue recognition for contracts with customers within the scope of ASC 606, the Company recognizes revenue from the commercial sales of products and contracts by applying the following five steps (i) identify the contract(s) with a customer; (ii) identify the performance obligations of the contract(s); (iii) determine the transaction price; (iv) allocate the transaction price to the performance obligations in the contract(s); and (v) recognize revenue when (or as) we satisfy the performance obligations.
The Company only applies the five-step model to contracts when it is probable that the Company will collect the consideration it is entitled to in exchange for the good or services it transfers to the customer. The Company recognizes revenue at a point in time when it satisfies a performance obligation and transfers control of the products to the respective customers, which occurs when the goods are transferred to a common carrier. Shipping and handling costs associated with outbound freight incurred to transfer a product to a customer are treated as a fulfillment activity, and as a result, any fees received from customers are included in the transaction price for the performance obligation of providing goods to the customer.
The Company generally provides refunds for goods returned within 30 days from the original purchase date. A returns reserve is recorded by the Company based on the historical refund pattern. The returns reserve in the balance sheets was $0.8 million and $1.7 million as of December 31, 2019 and 2020, respectively.
Taxes assessed by a governmental authority that are both imposed on and concurrent with a specific revenue-producing transaction, that are collected by the Company from a customer, are excluded from revenue. The Company records deferred revenue when it receives payments in advance of the transfer of the goods to a common carrier. The amounts recorded are expected to be recognized as revenue within the 12 months following the balance sheet and, therefore, are classified as current liabilities in the balance sheets.
The Company does not have significant contract balances other than deferred revenue, the allowance for sales returns and liabilities related to its gift cards. The Company does not have significant contract acquisition costs.
The following table presents the disaggregation of the Company’s net revenues for the years ended December 31, 2019 and 2020 (in thousands):
| Years ended December 31, | ||||||||
| 2019 | 2020 | |||||||
| By geography: |
||||||||
| United States |
$ | 109,932 | $ | 253,723 | ||||
| Rest of the world |
562 | 9,389 | ||||||
|
|
|
|
|
|||||
| $ | 110,494 | $ | 263,112 | |||||
|
|
|
|
|
|||||
| By product: |
||||||||
| Scrubs |
$ | 97,629 | $ | 227,988 | ||||
| Non-scrubs |
12,865 | 35,124 | ||||||
|
|
|
|
|
|||||
| $ | 110,494 | $ | 263,112 | |||||
|
|
|
|
|
|||||
Cost of Goods Sold
Cost of goods sold consists primarily of the cost of purchased merchandise and includes import duties and other taxes, freight-in, defective merchandise returned by customers, inventory write-offs and other miscellaneous shrinkage as well as compensation and benefits related to embroidery personnel.
F-11
Table of Contents
Selling Expenses
Selling expenses primarily include the cost of shipping and handling, fulfillment and credit card sales processing. Shipping and handling costs are associated with outbound freight after control over a product has transferred to a customer and, as such, are included in selling expenses.
Marketing Expenses
Marketing expenses primarily consist of digital and brand advertising. The Company’s marketing costs are primarily comprised of digital advertising through search engines and social media and are expensed as incurred.
General and Administrative Expenses
General and administrative expenses consist primarily of employee-related costs, including salaries, bonuses, benefits and stock-based compensation, charitable contributions, including the cost of product donations, other related costs, including certain third-party consulting and contractor expenses, certain facilities costs, software expenses, legal expenses and recruiting fees, and overhead.
Stock-Based Compensation
The Company measures and recognizes stock-based compensation expense for all stock option awards granted to employees and non-employees based on their estimated fair values as of the grant date using the Black-Scholes option-pricing model. The Company’s use of the Black-Scholes option-pricing model to estimate the fair value of stock options granted requires the input of various assumptions which are as follows:
| • | Risk-free interest rate—determined by reference to the U.S. Treasury yield curve in effect at the time of grant of the award for time periods approximately equal to the expected term of the award. |
| • | Expected volatility—as there is no public market for its common stock, the Company determines the volatility for awards granted based on an analysis of reported data for a group of peer companies that issued options with substantially similar terms. The expected volatility has been determined using a weighted-average of the historical volatility measures of this group of guideline companies. The Company expects to continue to do so until such time as it has adequate historical data regarding the volatility of its own traded stock price. |
| • | Expected dividend yield—the Company has not paid, and does not currently anticipate paying, cash dividends on its common stock; therefore, the expected dividend yield is assumed to be zero. |
| • | Expected term—the expected term of the Company’s stock options granted to employees has been determined utilizing the “simplified” method for awards that qualify as “plain-vanilla” options, which calculates the expected term as the average of the time-to-vesting and the contractual life of options. |
| • | Fair value of common stock—the fair value of the Company’s common stock has been determined on input from management and approved by the Board, utilizing the valuation of the Company’s enterprise value determined utilizing various methods, including the guideline public company method or a weighting of the guideline public company method and discounted cash flow method. The total enterprise value is then allocated to the various outstanding equity instruments, including the underlying common stock, utilizing the option-pricing model or private secondary transactions or a weighting of them. |
For employee and non-employee options, the Company recognizes compensation expense based on the grant date fair value of the award over the requisite service period, which is generally the vesting period of the respective award based on the grant date fair value of the award. The Company accounts for forfeitures as they occur.
F-12
Table of Contents
The Company measures the fair value of the restricted stock units (“RSUs”) granted to employees based on the fair market value of its common stock on the grant date. The Company’s RSU grants vest upon the satisfaction of both a service condition and a performance condition. The service condition for these awards is satisfied ratably over four years. The performance condition is satisfied upon the occurrence of a qualifying event, defined as a change of control transaction or an initial public offering (“IPO”) and is not deemed probable to occur until it occurs. As of December 31, 2019 and 2020, the performance condition was not probable to occur and, therefore, no stock-based compensation expense has been recognized for the Company’s RSU awards. If and when the performance condition is deemed probable to occur, the Company will record cumulative stock-based compensation expense using the accelerated attribution method for those RSUs for which the service condition has been satisfied prior to the qualifying event, and the Company will record the remaining unrecognized stock-based compensation expense over the remainder of the requisite service period.
The Company classifies stock-based compensation expense in its statements of income and comprehensive income in the same manner in which the award recipient’s cash compensation costs are classified. For the years ended December 31, 2019 and 2020, the Company recorded stock-based compensation of $0.2 million and $8.7 million, respectively, which are all recorded in general and administrative expense on the statements of income and comprehensive income.
Income Taxes
The Company accounts for income taxes under the asset and liability method. This approach requires the recognition of deferred tax assets and liabilities for the expected future tax consequences attributed to temporary differences between the financial reporting basis and the respective tax basis of these assets and liabilities. Deferred tax assets and liabilities are measured using the enacted tax rates expected to apply to taxable income in the years in which the differences are expected to be recovered or settled. The effect on deferred tax assets and liabilities of a change in the tax rates is recognized in income in the period that includes the enactment date.
A valuation allowance is recorded for carryforwards and other deferred tax assets when it is more likely than not that some or all of the deferred tax assets will not be realized. Based on its facts, the Company considered all available evidence, both positive and negative, including historical levels of taxable income, expectations, and risks associated with estimates of future taxable income, and ongoing prudent and feasible tax planning strategies in assessing the need for a valuation allowance. As of December 31, 2019, the Company recorded a valuation allowance against its deferred tax assets as it was more likely than not that the Company would not be able to realize its deferred tax assets. The Company has released its valuation allowance in 2020 and is not recording a valuation allowance against any of its deferred tax assets as of December 31, 2020.
The Company uses a two-step approach to recognizing and measuring uncertain tax positions. The first step is to evaluate the tax position for recognition by determining if the weight of available evidence indicates that it is more likely than not that the position will be sustained on audit, including resolution of related appeals and litigation processes, if any. The second step is to measure the largest amount of tax benefit as the largest amount that is more likely than not to be realized upon settlement.
Changes in recognition or measurement are reflected in the period in which the change in judgment occurs. As of December 31, 2019 and 2020, there are no known uncertain tax positions.
Earnings per Share
The Company presents both basic and diluted earnings per share amounts. Basic earnings per share is calculated by dividing net income by the weighted average number of common shares outstanding during the year. Diluted earnings per share is based upon the weighted average number of common and common equivalent shares outstanding during the year. Common equivalent shares are excluded from the computation of diluted earnings per
F-13
Table of Contents
share in periods for which they have an anti-dilutive effect. Stock options for which the exercise price exceeds the average market price over the period are anti-dilutive and, accordingly, excluded from the calculation.
Segment Information
Operating segments are defined as components of an entity for which separate financial information is available and that is regularly reviewed by the chief operating decision maker (“CODM”), in deciding how to allocate resources to an individual segment and in assessing performance. The Company’s CODM are its co-chief executive officers. The Company manages its operations as a single segment for the purposes of assessing performance and making operating decisions. Therefore, the Company has concluded that it has one reportable segment.
Recently Adopted Accounting Pronouncements
In August 2018, the FASB issued ASU 2018-13, Fair Value Measurement (Topic 820), Disclosure Framework—Changes to the Disclosure Requirements for Fair Value Measurement, (“ASU 2018-13”). This update removed the following disclosure requirements: (1) the amount of and reasons for transfers between Level 1 and Level 2 of the fair value hierarchy; (2) the policy for timing of transfers between levels; and (3) the valuation processes for Level 3 fair value measurements. Additionally, this update added the following disclosure requirements: (1) the changes in unrealized gains and losses for the period included in other comprehensive income and loss for recurring Level 3 fair value measurements held at the end of the reporting period; (2) the range and weighted average of significant unobservable inputs used to develop Level 3 fair value measurements. For certain unobservable inputs, an entity may disclose other quantitative information (such as the median or arithmetic average) in lieu of the weighted average if the entity determines that other quantitative information would be a more reasonable and rational method to reflect the distribution of unobservable inputs used to develop Level 3 fair value measurements. ASU 2018-13 was effective for fiscal years beginning after December 15, 2019 with early adoption permitted. The Company has adopted this update as of January 1, 2020 and noted no effect on the financial statements and related disclosures.
Recently Issued Accounting Pronouncements
In February 2016, the FASB issued ASU 2016- 02, Leases (Topic 842), as subsequently amended, which sets out the principles for the recognition, measurement, presentation and disclosure of leases for both parties to a contract (i.e., lessees and lessors), and replaces the existing guidance in ASC 840, Leases. The new standard also requires lessees to recognize operating and finance lease liabilities and corresponding right-of-use assets on the balance sheet and to provide enhanced disclosures surrounding the amount, timing and uncertainty of cash flows arising from leasing arrangements. The Company is required to adopt the standard on January 1, 2022 and is currently evaluating the impact that ASU 2016-02 will have on the financial statements and related disclosures.
In June 2016, the FASB issued ASU 2016-13, Financial Instruments-Credit Losses: Measurement of Credit Losses on Financial Instruments (Topic 326) (“ASU 2016-13”). ASU 2016-13 requires measurement and recognition of expected credit losses for financial assets. In April 2019, the FASB issued clarification to ASU 2016-13 within ASU No. 2019-04, Codification Improvements to Topic 326, Financial Instruments-Credit Losses, Topic 815, Derivatives and Hedging, and Topic 825, Financial Instruments. This update is effective for entities other than public business entities, including emerging growth companies that elected to defer compliance with new or revised financial accounting standards until a company that is not an issuer is required to comply with such standards, for annual reporting periods beginning after December 15, 2021. The Company is currently evaluating the impact that ASU 2016-13 will have on the financial statements and related disclosures.
In December 2019, the FASB issued ASU 2019-12, Simplifying the Accounting for Income Taxes (“ASU 2019-12”). ASU 2019-12 eliminates certain exceptions related to the approach for intra-period tax allocation, the methodology for calculating income taxes in an interim period and the recognition of deferred tax
F-14
Table of Contents
liabilities for outside basis differences. It also clarifies and simplifies other aspects of the accounting for income taxes. This update is effective for entities other than public business entities, including emerging growth companies that elected to defer compliance with new or revised financial accounting standards until a company that is not an issuer is required to comply with such standards, for annual reporting periods beginning after December 15, 2021, and interim periods within annual periods beginning after December 15, 2022. The Company is currently evaluating the impact that ASU 2019-12 will have on the financial statements and related disclosures.
3. FAIR VALUE OF FINANCIAL ASSETS AND LIABILITIES
As of December 31, 2019 and 2020, the Company’s cash equivalents consisted of money market funds, classified as Level 1 financial assets, as these assets are valued using quoted market prices in active markets without any valuation adjustment (in thousands).
| Fair Value Measurement as of December 31, 2019 |
||||||||||||||||
| Level 1 | Level 2 | Level 3 | Total | |||||||||||||
| Assets |
|
|||||||||||||||
| Money market funds |
$ | 27,593 | $ | — | $ | — | $ | 27,593 | ||||||||
|
|
|
|
|
|
|
|
|
|||||||||
| $ | 27,593 | $ | — | $ | — | $ | 27,593 | |||||||||
|
|
|
|
|
|
|
|
|
|||||||||
| Fair Value Measurement as of December 31, 2020 |
||||||||||||||||
| Level 1 | Level 2 | Level 3 | Total | |||||||||||||
| Assets |
|
|||||||||||||||
| Money market funds |
$ | 50,219 | $ | — | $ | — | $ | 50,219 | ||||||||
|
|
|
|
|
|
|
|
|
|||||||||
| $ | 50,219 | $ | — | $ | — | $ | 50,219 | |||||||||
|
|
|
|
|
|
|
|
|
|||||||||
There have been no transfers between fair value levels during the years ended December 31, 2019 and 2020. The carrying values of other current assets, accounts payable and accrued expenses approximate their fair values due to the short-term nature of these assets and liabilities.
4. ACCOUNTS RECEIVABLE
The accounts receivable consisted of the following (in thousands):
| December 31, | ||||||||
| 2019 | 2020 | |||||||
| Trade |
$ | 1,381 | $ | 1,704 | ||||
| Other |
377 | 4,076 | ||||||
|
|
|
|
|
|||||
| $ | 1,758 | $ | 5,780 | |||||
|
|
|
|
|
|||||
The other accounts receivable as of December 31, 2019 and 2020 is primarily comprised of receivables related to vendor refunds and amounts due to the Company that result from activities that are not related to the direct sale of the Company’s products.
F-15
Table of Contents
5. PREPAID EXPENSES AND OTHER CURRENT ASSETS
Prepaid expenses and other current assets consist of the following (in thousands):
| December 31, | ||||||||
| 2019 | 2020 | |||||||
| Inventory deposits |
$ | 363 | $ | 963 | ||||
| Prepaid expenses |
786 | 1,406 | ||||||
| Prepaid taxes |
— | 3,493 | ||||||
| Sample kits |
391 | 33 | ||||||
| Other prepaid expenses and current assets |
452 | 770 | ||||||
|
|
|
|
|
|||||
| $ | 1,992 | $ | 6,665 | |||||
|
|
|
|
|
|||||
6. PROPERTY AND EQUIPMENT, NET
Property and equipment, net consists of the following (in thousands):
| December 31, | ||||||||
| 2019 | 2020 | |||||||
| Furniture and fixtures |
$ | 769 | $ | 808 | ||||
| Office equipment |
546 | 765 | ||||||
| Machinery and equipment |
424 | 752 | ||||||
| Computer equipment |
378 | 610 | ||||||
| Software and website design |
19 | 1,704 | ||||||
| Vehicles |
19 | — | ||||||
| Leasehold improvements |
3,017 | 3,017 | ||||||
| Capital projects in progress |
1,041 | 312 | ||||||
|
|
|
|
|
|||||
| Total property and equipment |
6,213 | 7,968 | ||||||
| Less: accumulated depreciation and amortization |
(464 | ) | (1,439 | ) | ||||
|
|
|
|
|
|||||
| Property and equipment, net |
$ | 5,749 | $ | 6,529 | ||||
|
|
|
|
|
|||||
Depreciation and amortization expense for the years ended December 31, 2019 and 2020 on property and equipment was $0.5 million and $0.9 million, respectively.
7. ACCRUED EXPENSES
Accrued expenses consist of the following (in thousands):
| December 31, | ||||||||
| 2019 | 2020 | |||||||
| Accrued inventory |
$ | — | $ | 3,151 | ||||
| Accrued shipping |
877 | 656 | ||||||
| Other accrued expenses |
2,309 | 2,875 | ||||||
|
|
|
|
|
|||||
| $ | 3,186 | $ | 6,682 | |||||
|
|
|
|
|
|||||
F-16
Table of Contents
8. FINANCING ARRANGEMENTS
On September 5, 2017, the Company, as borrower, entered into a credit agreement with First Choice Bank, as lender, administrative agent and promissory note issuer for a $5.0 million revolving credit facility (the “Prior Credit Facility”). On October 5, 2018, the principal amount of the Prior Credit Facility was increased to $10.0 million. On January 7, 2019, the Company amended the Prior Credit Facility to extend the maturity date to January 12, 2022 and carved out of the Prior Credit Facility two standby letters of credit. The Company had letters of credit aggregating to $2.3 million as of December 31, 2019. Availability under the Credit Facility was $7.7 million as of December 31, 2019. On January 10, 2020, the Company amended and extended a letter of credit, increasing the aggregate of letters of credit to $2.4 million. In December 2020, the Prior Credit Facility was terminated.
On December 2, 2020, the Company, as borrower, entered into a credit agreement with JPMorgan Chase Bank, N.A for an initial $50.0 million revolving credit facility (including capacity to issue letters of credit (the “Existing Credit Facility”). The Existing Credit Facility has a maturity date of December 2, 2025 (“Maturity Date”). Subject to certain conditions, the Existing Credit Facility also provides for an additional $25.0 million of capacity. The Company had letters of credit aggregating to $3.2 million outstanding under the Existing Credit Facility as of December 31, 2020. As of December 31, 2020, the Company has not made any borrowings under the Existing Credit Facility. Borrowings under the Existing Credit Facility are payable on the Maturity Date. Borrowings bear interest at LIBOR (with a 0.5% floor) plus 1.75%. The interest rate for undrawn amounts is 0.25%.
9. RELATED PARTY TRANSACTIONS
Tulco, LLC (“Tulco”) is the majority stockholder of the Company. Tulco paid for certain of the Company’s professional fees which were expensed as incurred in the year ended December 31, 2019 and amounted to $0.1 million. These were reimbursed by the Company in 2020 and are recorded within accrued expenses on the accompanying balance sheet as of December 31, 2019.
On May 14, 2018, the Company entered into a common stock purchase agreement with Tulco pursuant to which the Company issued and sold 36,675,000 shares of common stock for a total purchase price of $50.0 million. As consideration, May 14, 2019, Tulco paid $17.5 million in cash and cancelled the $2.5 million owed by the Company to Tulco pursuant to a promissory note dated as of February 22, 2018. The remaining $30.0 million of capital contributions were payable upon the Company’s achievement of certain milestones at defined dates in the years ended December 31, 2018 and December 31, 2019. During the year ended December 31, 2018, $16.0 million of contributions were made. The remaining $14.0 million contribution was made in the year ended December 31, 2019.
In 2020, the Company sold $4.2 million of masks and other products to Tulco, the amounts of which are included in net revenues for the year ended December 31, 2020.
10. COMMITMENTS AND CONTINGENCIES
Taxes on Remote Sellers
As discussed in Note 2, the Company is subject to state laws or administrative practices with respect to the taxes on remote sellers. In accordance with ASC 450, Contingencies, the Company recorded $1.6 million and $1.9 million within sales tax payable on the Company’s balance sheets as of December 31, 2019 and 2020, respectively, as an estimate of contingent sales tax payable.
Operating Leases
The Company leases its office facilities and certain office equipment under non-cancelable operating leases that expire on various dates through December 2029. During the years ended December 31, 2019 and 2020, the Company recorded rent expense of $1.9 million and $1.8 million, respectively.
F-17
Table of Contents
Future minimum lease payments under non-cancelable operating leases for the years succeeding December 31, 2020 are as follows (in thousands):
| 2021 |
$ | 1,941 | ||
| 2022 |
1,963 | |||
| 2023 |
2,023 | |||
| 2024 |
2,093 | |||
| 2025 |
2,166 | |||
| Thereafter |
9,448 | |||
|
|
|
|||
| $ | 19,634 |
Inventory Purchase Obligations
Inventory purchase obligations as of December 31, 2020 were approximately $33.8 million. These inventory purchase obligations can be impacted by various factors, including the timing of issuing orders and the timing of the shipment of orders.
Legal Contingencies
Legal claims may arise from time to time in the normal course of business, the results of which may have a material effect on the Company’s accompanying financial statements. The Company currently has legal actions against it with respect to its litigation with Strategic Partners, Inc. The Company believes the claims are without basis or merit, and intends to vigorously defend against such claims. Accordingly, an accrual for any potential liability has not been recorded.
11. INCOME TAXES
The current and deferred income tax provision as of December 31, 2019 was $0. The provision for income taxes for the year ended December 31, 2020 is as follows (in thousands):
| Year Ended December 31, |
||||
| 2020 | ||||
| Current income tax provision |
||||
| Federal |
$ | 9,087 | ||
| State |
5,738 | |||
|
|
|
|||
| Total current provision |
14,825 | |||
|
|
|
|||
| Deferred income tax benefit |
||||
| Federal |
(3,504 | ) | ||
| State |
(3,003 | ) | ||
|
|
|
|||
| Total deferred benefit |
(6,507 | ) | ||
|
|
|
|||
| Provision for income taxes |
$ | 8,318 | ||
|
|
|
|||
On March 18, 2020, the Families First Coronavirus Response Act (“FFCR Act”), and on March 27, 2020, the Coronavirus Aid, Relief, and Economic Security Act (“CARES Act”) were each enacted in response to the COVID-19 pandemic. The FFCR Act and the CARES Act contain numerous income tax provisions relating to refundable payroll tax credits, deferment of employer side social security payments, net operating loss carryback periods, alternative minimum tax credit refunds, modifications to the net interest deduction limitations and technical corrections to tax depreciation methods for qualified improvement property. The FFCR Act and CARES Act did not have a material impact on the Company’s financial statements as of December 31, 2020;
F-18
Table of Contents
however, the Company continues to examine the impacts the FFCR Act and CARES Act may have on its business, results of operations, financial condition, liquidity and related disclosures.
On June 29, 2020, Assembly Bill 85 (“A.B. 85”) was signed into California law. A.B. 85 provides for a three-year suspension of the use of net operating losses for medium and large businesses and a three-year cap on the use of business incentive tax credits to offset no more than $5.0 million of tax per year. A.B. 85 suspends the use of net operating losses for taxable years 2020, 2021 and 2022 for certain taxpayers with taxable income of $1.0 million or more. The carryover period for any net operating losses that are suspended under this provision will be extended. A.B. 85 also requires that business incentive tax credits including carryovers may not reduce the applicable tax by more than $5.0 million for taxable years 2020, 2021 and 2022. In connection with A.B. 85, the Company was not able to offset its California taxable income with its net operating losses for the year ended December 31, 2020.
A reconciliation from the income tax expense using the U.S. statutory federal income tax rate to the provision for income taxes is as follows (in thousands):
| December 31, | ||||||||
| 2019 | 2020 | |||||||
| Tax at U.S. statutory rate |
$ | 23 | $ | 12,196 | ||||
| State taxes, net of federal benefit |
— | 4,176 | ||||||
| Non-deductible expenses |
— | (2,116 | ) | |||||
| Change in valuation allowance |
(75 | ) | (5,994 | ) | ||||
| Other |
52 | 56 | ||||||
|
|
|
|
|
|||||
| Provision for income taxes |
$ | — | $ | 8,318 | ||||
|
|
|
|
|
|||||
The effective tax rate for years ending December 31, 2019 and 2020 was 0% and 14.3%, respectively. For the year ended December 31, 2019, there was no income tax provision recorded, as the Company recorded a full valuation allowance on its net deferred tax asset and utilized net operating loss carryforwards to offset current taxes payable. During 2019, the Company weighed all available positive and negative evidence and determined that it was more likely than not that the deferred tax assets were not fully realizable. The Company determined during 2020 that all the deferred tax assets were realizable due to the Company now being in a three year cumulative pretax book income position, resulting in the full release in the valuation allowance. As of December 31, 2020, the Company has recorded a valuation allowance of $0, which is a decrease of $6.0 million from December 31, 2019. The 2020 income tax provision is a result of the current earnings of the Company, offset by the stock-based compensation permanent adjustment and the tax benefit from the release in valuation allowance.
F-19
Table of Contents
Significant components of the deferred income taxes are as follows (in thousands):
| December 31, | ||||||||
| 2019 | 2020 | |||||||
| Deferred tax assets |
||||||||
| Net operating losses |
$ | 3,710 | $ | 1,490 | ||||
| Uniform capitalization adjustment to inventory |
539 | 1,135 | ||||||
| Stock-based compensation |
137 | 1,503 | ||||||
| Accrued compensation and benefits |
475 | 1,032 | ||||||
| Tenant improvement allowance |
510 | 459 | ||||||
| Inventory reserve |
142 | 991 | ||||||
| Deferred rent |
297 | 564 | ||||||
| Returns reserve |
217 | 469 | ||||||
| Sales tax accrual |
457 | 528 | ||||||
| Other |
145 | 148 | ||||||
|
|
|
|
|
|||||
| Total deferred tax assets |
6,629 | 8,319 | ||||||
| Less: valuation allowance |
(5,994 | ) | — | |||||
|
|
|
|
|
|||||
| Total net deferred tax assets |
635 | 8,319 | ||||||
| Deferred Tax Liabilities |
||||||||
| Property and equipment |
(635 | ) | (1,812 | ) | ||||
|
|
|
|
|
|||||
| Total deferred tax liabilities |
(635 | ) | (1,812 | ) | ||||
|
|
|
|
|
|||||
| Net deferred tax assets |
$ | — | $ | 6,507 | ||||
|
|
|
|
|
|||||
As of December 31, 2020, the Company had available federal net operating loss (“NOL”) carryforwards of approximately $1.8 million, which begin to expire in 2034. The Company also has available state NOL carryforwards of approximately $16.0 million as of December 31, 2020, which begin to expire in 2033. The majority of the state NOL carryforwards relate to the state of California. The utilization of California NOL carryforwards has been suspended by state legislation for tax years beginning before January 1, 2023. Years ending December 31, 2014 through December 31, 2019 remain open and subject to audit.
The Company had no material unrecognized tax benefits as of December 31, 2019 and 2020. The Company’s policy is to recognize interest and penalties accrued on the unrecognized tax liability as income tax expense. During the years ended December 31, 2019 and 2020, there were no such interest and penalties.
12. STOCK-BASED COMPENSATION
2016 Stock Incentive Plan
The Company’s 2016 Stock Incentive Plan (the “2016 Plan”) provides for the Company to issue restricted stock, RSUs, stock appreciation rights, incentive stock options, non-statutory stock options and other stock-based awards to employees, officers, members of the Board of Directors (the “Board”), consultants and advisors of the Company.
All options and awards typically expire ten years from the date of grant if not exercised. In the event of a termination of employment, all unvested options will be forfeited immediately. Any vested options may be exercised within three months, depending on the circumstances of termination, and except for instances of termination “with cause” whereby any vested options or awards are forfeited immediately.
Shares that expire, are terminated, surrendered or canceled under the 2016 Plan without having been exercised are available for future awards. In addition, shares of common stock that are tendered to the Company by a participant to exercise an award are added to the number of shares of common stock available for future awards. The 2016 Plan is administered by the Board.
F-20
Table of Contents
During the years ended December 31, 2019 and 2020, the Company granted stock options to purchase 672,120 and 25,928,154 shares of common stock, respectively. Also, during the year ended December 31, 2020, the Company granted 5,410,440 RSUs, which have both time-based and performance-based vesting conditions, all of which remain unvested as of December 31, 2020.
Under the Plan, up to 51,716,934 shares of common stock of the Company may be awarded through the granting of one or more of the following types of awards: (a) nonqualified stock options, (b) qualified stock options (c) RSU awards, (d) restricted stock awards and (e) stock appreciation rights. To date, the Company has granted nonqualified and qualified stock options with vesting periods of two to five years. The Company issues new common stock upon exercise of stock options. As of December 31, 2019 and 2020, the number of shares available for issuance under the Plan were 1,318,986 and 5,028,687, respectively.
Stock Option Valuation
The assumptions that the Company used to determine the grant date fair value of stock options granted were as follows, presented on a weighted-average basis:
| December 31, | ||||
| 2019 | 2020 | |||
| Risk free interest rate |
1.81% | 0.42% | ||
| Expected volatility |
57% | 44% | ||
| Expected dividend yield |
0% | 0% | ||
| Expected term (in years) |
6.25 | 6.45 | ||
A summary of the stock option activity under the Plan, is as follows:
| Stock Options Outstanding | ||||||||||||
| Number of Shares |
Weighted- Average Exercise Price (per share) |
Weighted- Average Remaining Contractual Term (in years) |
||||||||||
| Outstanding at December 31, 2018 |
15,596,550 | $ | 0.83 | 9.25 | ||||||||
| Granted |
672,120 | 0.46 | ||||||||||
| Exercised |
— | — | ||||||||||
| Forfeited |
(707,400 | ) | 0.46 | |||||||||
|
|
|
|
|
|||||||||
| Outstanding at December 31, 2019 |
15,561,270 | $ | 0.83 | 8.28 | ||||||||
|
|
|
|
|
|||||||||
| Granted |
25,928,154 | 4.89 | ||||||||||
| Exercised |
(1,391,868 | ) | 0.28 | |||||||||
| Forfeited |
(260,361 | ) | 0.44 | |||||||||
|
|
|
|
|
|||||||||
| Outstanding at December 31, 2020 |
39,837,195 | $ | 3.49 | 8.87 | ||||||||
|
|
|
|
|
|||||||||
| Exercisable at December 31, 2019 |
7,597,683 | $ | 0.83 | 8.17 | ||||||||
|
|
|
|
|
|||||||||
| Exercisable at December 31, 2020 |
11,421,063 | $ | 1.27 | 7.45 | ||||||||
|
|
|
|
|
|||||||||
The aggregate intrinsic value of stock options is calculated as the difference between the exercise price of the stock options and the fair value of the Company’s common stock for those stock options that had exercise prices lower than the fair value of the common stock as of the end of the period. As of December 31, 2019, the aggregate intrinsic value of stock options outstanding and stock options exercisable was $0.3 million and $0.2 million, respectively. As of December 31, 2020, the aggregate intrinsic value of stock options outstanding and stock options exercisable was $100.8 million and $54.3 million, respectively. The aggregate intrinsic
F-21
Table of Contents
value of stock options exercised during the year ended December 31, 2020 was $1.2 million. There were no exercises of stock options for the year ended December 31, 2019.
The weighted-average grant date fair values per share of the Company’s stock options granted during the years ended December 31, 2019 and 2020 was $0.25 and $3.53, respectively. The fair value of stock options vested during the years ended December 31, 2019 and 2020 was $0.2 million and $4.8 million, respectively.
As of December 31, 2020, total unrecognized compensation cost related to the unvested stock option awards was $86.7 million, to be recognized over a weighted-average period of 4.5 years.
Restricted Stock Units
In 2020, the Company granted a total of 5,410,440 RSUs to employees which vest upon the satisfaction of both a service and a performance condition. The service condition for these awards is satisfied over four years. The performance condition is satisfied upon the occurrence of a qualifying event, defined as a change of control transaction or an IPO. As the performance condition is not considered probable of occurring, through December 31, 2020, the Company had not recognized any stock-based compensation expense related to these awards.
13. EARNINGS PER SHARE
The following table sets forth the computation of basic and diluted earnings per share and a reconciliation of the weighted average number of common and common equivalent shares outstanding for the years ended December 31, 2019 and 2020 (in thousands, except share and per share amounts).
| Years Ended December 31, | ||||||||
| 2019 | 2020 | |||||||
| Numerator: |
||||||||
| Net income basic and diluted |
$ | 112 | $ | 49,758 | ||||
| Denominator: |
||||||||
| Weighted-average shares—basic |
153,052,983 | 153,327,308 | ||||||
| Effect of dilutive stock options |
571,030 | 10,004,040 | ||||||
|
|
|
|
|
|||||
| Weighted-average shares—diluted |
153,624,013 | 163,331,348 | ||||||
|
|
|
|
|
|||||
| Earnings per share: |
||||||||
| Basic earnings per share |
$ | — | $ | 0.32 | ||||
| Effect of dilutive stock options |
— | (0.02 | ) | |||||
| Diluted earnings per share |
$ | — | $ | 0.30 | ||||
The Company excluded the following from the computation of diluted earnings per share for the years ended December 31, 2019 and 2020 because including them would have had an anti-dilutive effect:
| Years Ended December 31, | ||||||||
| 2019 | 2020 | |||||||
| Stock options to purchase common stock |
15,697,638 | 31,485,366 | ||||||
|
|
|
|
|
|||||
The Company also had RSUs outstanding as of December 31, 2020, which include a performance based vesting condition satisfied upon the occurrence of a qualifying event, defined as a change of control transaction or an IPO. Because the necessary conditions for the vesting of the restricted stock had not been satisfied as of December 31, 2020, the Company has excluded the RSUs from the table above as of December 31, 2020 and the calculation of diluted net income per share for the year ended December 31, 2020.
F-22
Table of Contents
14. EMPLOYEE BENEFIT PLAN
The Company maintains a defined contribution 401(k) plan for the benefit of all employees who have met the eligibility requirements. Participants may contribute up to 100% of their eligible compensation, subject only to annual limitations set by the Internal Revenue Service. In 2019 and 2020, the Company matched 100% of the participant contributions, up to the first 6% of the participant’s deferrals. For the years ended December 31, 2019 and 2020, the Company recorded expense for matching contributions of $0.3 million and $0.6 million, respectively, within general and administrative expenses on the Company’s statements of income and comprehensive income.
15. SUBSEQUENT EVENTS
Management has evaluated subsequent events occurring through March 17, 2021, the date that these financial statements were issued, and with respect to the stock split discussed in Note 2, through May 20, 2021, and determined that no additional subsequent events occurred that would require recognition or disclosure in these financial statements.
F-23
Table of Contents
FIGS, INC.
(In thousands, except share and per share data)
| As of | ||||||||
| December 31, | June 30, | |||||||
| 2020 | 2021 | |||||||
| (Unaudited) | ||||||||
| Assets |
||||||||
| Current assets |
||||||||
| Cash and cash equivalents |
$ | 58,133 | $ | 163,968 | ||||
| Accounts receivable |
5,780 | 3,934 | ||||||
| Due from related party |
— | 4,875 | ||||||
| Inventory, net |
49,735 | 62,374 | ||||||
| Prepaid expenses and other current assets |
6,665 | 8,339 | ||||||
|
|
|
|
|
|||||
| Total current assets |
120,313 | 243,490 | ||||||
| Non-current assets |
||||||||
| Property and equipment, net |
6,529 | 6,908 | ||||||
| Deferred tax assets |
6,507 | 3,354 | ||||||
| Other assets |
506 | 502 | ||||||
|
|
|
|
|
|||||
| Total non-current assets |
13,542 | 10,764 | ||||||
|
|
|
|
|
|||||
| Total assets |
$ | 133,855 | $ | 254,254 | ||||
|
|
|
|
|
|||||
| Liabilities and stockholders’ equity |
||||||||
| Current liabilities |
||||||||
| Accounts payable |
$ | 11,965 | $ | 16,472 | ||||
| Accrued expenses |
6,682 | 15,315 | ||||||
| Accrued compensation and benefits |
4,214 | 4,144 | ||||||
| Sales tax payable |
3,076 | 3,912 | ||||||
| Gift card liability |
3,019 | 3,369 | ||||||
| Deferred revenue |
1,781 | 679 | ||||||
| Returns reserve |
1,677 | 2,128 | ||||||
| Income tax payable |
105 | 910 | ||||||
|
|
|
|
|
|||||
| Total current liabilities |
32,519 | 46,929 | ||||||
| Non-current liabilities |
||||||||
| Deferred rent and lease incentive |
3,659 | 3,610 | ||||||
|
|
|
|
|
|||||
| Total liabilities |
36,178 | 50,539 | ||||||
|
|
|
|
|
|||||
F-24
Table of Contents
| As of | ||||||||
| December 31, | June 30, | |||||||
| 2020 | 2021 | |||||||
| (Unaudited) | ||||||||
| Commitments and contingencies |
||||||||
| Stockholders’ equity |
||||||||
| Common stock—par value $0.0001 per share, 207,000,000 and zero shares authorized as of December
31, 2020 and June 30, 2021, respectively; |
15 | — | ||||||
| Class A Common stock—par value $0.0001 per share, zero and
1,000,000,000 shares |
— | 15 | ||||||
| Class B Common stock—par value $0.0001 per share, zero and 150,000,000 shares
|
— | 1 | ||||||
| Preferred stock—par value $0.0001 per share, zero and 100,000,000 shares
|
— | — | ||||||
| Additional paid-in capital |
70,175 | 205,318 | ||||||
| Retained earnings (accumulated deficit) |
27,487 | (1,619 | ) | |||||
|
|
|
|
|
|||||
| Total stockholders’ equity |
97,677 | 203,715 | ||||||
|
|
|
|
|
|||||
| Total liabilities and stockholders’ equity |
$ | 133,855 | $ | 254,254 | ||||
|
|
|
|
|
|||||
The accompanying notes are an integral part of these unaudited financial statements.
F-25
Table of Contents
STATEMENTS OF OPERATIONS AND COMPREHENSIVE INCOME (LOSS)
(In thousands, except share and per share data)
(Unaudited)
| Three months ended June 30, | Six months ended June 30, | |||||||||||||||
| 2020 | 2021 | 2020 | 2021 | |||||||||||||
| Net revenues |
$ | 64,143 | $ | 101,117 | $ | 96,110 | $ | 188,196 | ||||||||
| Cost of goods sold |
18,923 | 26,964 | 26,578 | 51,683 | ||||||||||||
|
|
|
|
|
|
|
|
|
|||||||||
| Gross profit |
45,220 | 74,153 | 69,532 | 136,513 | ||||||||||||
| Operating expenses |
||||||||||||||||
| Selling |
12,905 | 19,222 | 19,644 | 36,337 | ||||||||||||
| Marketing |
8,805 | 15,488 | 16,142 | 26,327 | ||||||||||||
| General and administrative |
6,950 | 71,504 | 13,150 | 89,850 | ||||||||||||
|
|
|
|
|
|
|
|
|
|||||||||
| Total operating expenses |
28,660 | 106,214 | 48,936 | 152,514 | ||||||||||||
|
|
|
|
|
|
|
|
|
|||||||||
| Net income (loss) from operations |
16,560 | (32,061 | ) | 20,596 | (16,001 | ) | ||||||||||
| Other income (loss), net |
||||||||||||||||
| Interest income (expense) |
19 | (31 | ) | 117 | (67 | ) | ||||||||||
| Other expense |
(1 | ) | — | (1 | ) | (2 | ) | |||||||||
|
|
|
|
|
|
|
|
|
|||||||||
| Total other income (loss), net |
18 | (31 | ) | 116 | (69 | ) | ||||||||||
|
|
|
|
|
|
|
|
|
|||||||||
| Net income (loss) before provision for income taxes |
16,578 | (32,092 | ) | 20,712 | (16,070 | ) | ||||||||||
| Provision for income taxes |
2,403 | 8,454 | 2,403 | 13,036 | ||||||||||||
| Net income (loss) and comprehensive income (loss) |
$ | 14,175 | $ | (40,546 | ) | $ | 18,309 | $ | (29,106 | ) | ||||||
|
|
|
|
|
|
|
|
|
|||||||||
| Earnings (loss) attributable to Class A and Class B common stockholders |
||||||||||||||||
| Basic earnings (loss) per share |
$ | 0.09 | $ | (0.26 | ) | $ | 0.12 | $ | (0.19 | ) | ||||||
|
|
|
|
|
|
|
|
|
|||||||||
| Diluted earnings (loss) per share |
$ | 0.09 | $ | (0.26 | ) | $ | 0.12 | $ | (0.19 | ) | ||||||
|
|
|
|
|
|
|
|
|
|||||||||
| Weighted-average shares outstanding—basic |
153,052,983 | 156,867,484 | 153,052,983 | 155,725,959 | ||||||||||||
|
|
|
|
|
|
|
|
|
|||||||||
| Weighted-average shares outstanding—diluted |
153,680,642 | 156,867,484 | 153,661,856 | 155,725,959 | ||||||||||||
|
|
|
|
|
|
|
|
|
|||||||||
The accompanying notes are an integral part of these unaudited financial statements.
F-26
Table of Contents
FIGS, INC.
STATEMENTS OF STOCKHOLDERS’ EQUITY
(In thousands, except share data)
(Unaudited)
| Common Stock | Class A Common Stock |
Class B Common Stock |
Additional Paid-in Capital |
(Accumulated Deficit) Retained Earnings |
Total Stockholders’ Equity |
|||||||||||||||||||||||||||||||
| Shares | Amount | Shares | Amount | Shares | Amount | |||||||||||||||||||||||||||||||
| December 31, 2019 |
153,052,983 | $ | 15 | — | $ | — | — | $ | — | $ | 61,070 | $ | (22,271 | ) | $ | 38,814 | ||||||||||||||||||||
|
|
|
|
|
|
|
|
|
|
|
|
|
|
|
|
|
|
|
|||||||||||||||||||
| Stock-based compensation |
— | — | — | — | — | — | 50 | — | 50 | |||||||||||||||||||||||||||
| Net income |
— | — | — | — | — | — | — | 4,134 | 4,134 | |||||||||||||||||||||||||||
|
|
|
|
|
|
|
|
|
|
|
|
|
|
|
|
|
|
|
|||||||||||||||||||
| March 31, 2020 |
153,052,983 | $ | 15 | — | $ | — | — | $ | — | $ | 61,120 | $ | (18,137 | ) | $ | 42,998 | ||||||||||||||||||||
|
|
|
|
|
|
|
|
|
|
|
|
|
|
|
|
|
|
|
|||||||||||||||||||
| Stock-based compensation |
— | — | — | — | — | — | 236 | — | 236 | |||||||||||||||||||||||||||
| Net income |
— | — | — | — | — | — | — | 14,175 | 14,175 | |||||||||||||||||||||||||||
|
|
|
|
|
|
|
|
|
|
|
|
|
|
|
|
|
|
|
|||||||||||||||||||
| June 30, 2020 |
153,052,983 | $ | 15 | — | $ | — | — | $ | — | $ | 61,356 | $ | (3,962 | ) | $ | 57,409 | ||||||||||||||||||||
|
|
|
|
|
|
|
|
|
|
|
|
|
|
|
|
|
|
|
|||||||||||||||||||
| Common Stock | Class A Common Stock |
Class B Common Stock |
Additional Paid-in Capital |
(Accumulated Deficit) Retained Earnings |
Total Stockholders’ Equity |
|||||||||||||||||||||||||||||||
| Shares | Amount | Shares | Amount | Shares | Amount | |||||||||||||||||||||||||||||||
| December 31, 2020 |
154,444,851 | $ | 15 | — | $ | — | — | $ | — | $ | 70,175 | $ | 27,487 | $ | 97,677 | |||||||||||||||||||||
|
|
|
|
|
|
|
|
|
|
|
|
|
|
|
|
|
|
|
|||||||||||||||||||
| Stock-based compensation |
— | — | — | — | — | — | 5,015 | — | 5,015 | |||||||||||||||||||||||||||
| Stock option exercises |
204,309 | — | — | — | — | — | 123 | — | 123 | |||||||||||||||||||||||||||
| Net income |
— | — | — | — | — | — | — | 11,440 | 11,440 | |||||||||||||||||||||||||||
|
|
|
|
|
|
|
|
|
|
|
|
|
|
|
|
|
|
|
|||||||||||||||||||
| March 31, 2021 |
154,649,160 | $ | 15 | — | $ | — | — | $ | — | $ | 75,313 | $ | 38,927 | $ | 114,255 | |||||||||||||||||||||
|
|
|
|
|
|
|
|
|
|
|
|
|
|
|
|
|
|
|
|||||||||||||||||||
| Issuance of Class A Common Stock upon exchange of Common Stock |
(142,851,852 | ) | (14 | ) | 142,851,852 | 14 | — | — | — | — | — | |||||||||||||||||||||||||
| Issuance of Class B Common Stock upon exchange of Common Stock |
(12,148,029 | ) | (1 | ) | — | — | 12,148,029 | 1 | — | — | — | |||||||||||||||||||||||||
| Issuance of Class A Common Stock upon initial public offering, net of offering costs |
— | — | 4,636,364 | 1 | — | — | 95,100 | — | 95,101 | |||||||||||||||||||||||||||
| Issuance of Class A Common Stock upon vesting of Restricted Stock, net of tax withholdings |
— | — | 1,166,538 | — | — | — | — | — | — | |||||||||||||||||||||||||||
| Issuance of Class B Common Stock upon exchange of Class A Restricted Stock |
— | — | (1,116,030 | ) | — | 1,116,030 | — | — | — | — | ||||||||||||||||||||||||||
| Restricted Stock surrendered for employees’ tax liability |
— | — | — | — | — | — | (21,556 | ) | — | (21,556 | ) | |||||||||||||||||||||||||
| Stock-based compensation |
— | — | — | — | — | 56,012 | — | 56,012 | ||||||||||||||||||||||||||||
| Stock option exercises |
350,721 | — | 94,810 | — | — | — | 449 | — | 449 | |||||||||||||||||||||||||||
| Net loss |
— | — | — | — | — | — | — | (40,546 | ) | (40,546 | ) | |||||||||||||||||||||||||
|
|
|
|
|
|
|
|
|
|
|
|
|
|
|
|
|
|
|
|||||||||||||||||||
| June 30, 2021 |
— | $ | — | 147,633,534 | $ | 15 | 13,264,059 | $ | 1 | $ | 205,318 | $ | (1,619 | ) | $ | 203,715 | ||||||||||||||||||||
|
|
|
|
|
|
|
|
|
|
|
|
|
|
|
|
|
|
|
|||||||||||||||||||
The accompanying notes are an integral part of these unaudited financial statements.
F-27
Table of Contents
FIGS, INC.
(In thousands)
(Unaudited)
| Six months ended June 30, |
||||||||
| 2020 | 2021 | |||||||
| Cash flows from operating activities: |
||||||||
| Net income (loss) |
$ | 18,309 | $ | (29,106 | ) | |||
| Adjustments to reconcile net income (loss) to net cash provided by operating activities: |
||||||||
| Depreciation and amortization expense |
398 | 666 | ||||||
| Provision (benefit) for deferred income taxes |
(688 | ) | 3,153 | |||||
| Stock-based compensation |
286 | 61,027 | ||||||
| Changes in operating assets and liabilities: |
||||||||
| Accounts receivable |
(505 | ) | 1,846 | |||||
| Due from related party |
— | (4,875 | ) | |||||
| Inventory |
(1,611 | ) | (12,639 | ) | ||||
| Prepaid expenses and other current assets |
(4,314 | ) | (1,674 | ) | ||||
| Other assets |
61 | (6 | ) | |||||
| Accounts payable |
(402 | ) | 4,575 | |||||
| Accrued expenses |
5,912 | 8,553 | ||||||
| Deferred revenue |
1,597 | (1,102 | ) | |||||
| Accrued compensation and benefits |
(237 | ) | (70 | ) | ||||
| Returns reserve |
804 | 451 | ||||||
| Sales tax payable |
638 | 836 | ||||||
| Income tax payable |
3,090 | 805 | ||||||
| Gift card liability |
498 | 350 | ||||||
| Deferred rent and lease incentive |
473 | (49 | ) | |||||
|
|
|
|
|
|||||
| Net cash provided by operating activities |
24,309 | 32,741 | ||||||
| Cash flows from investing activities: |
||||||||
| Purchases of property and equipment |
(1,080 | ) | (1,023 | ) | ||||
|
|
|
|
|
|||||
| Net cash used in investing activities |
(1,080 | ) | (1,023 | ) | ||||
| Cash flows from financing activities: |
||||||||
| Proceeds from issuance of Class A Common Stock in initial public offering, net of underwriting discounts |
— | 95,881 | ||||||
| Payments of initial public offering issuance costs, net of reimbursements |
— | (780 | ) | |||||
| Proceeds from stock option exercises |
— | 572 | ||||||
| Tax payments related to net share settlements on restricted stock units |
— | (21,556 | ) | |||||
|
|
|
|
|
|||||
| Net cash provided by financing activities |
— | 74,117 | ||||||
| Net increase in cash and cash equivalents |
23,229 | 105,835 | ||||||
| Cash and cash equivalents, beginning of period |
38,353 | 58,133 | ||||||
|
|
|
|
|
|||||
| Cash and cash equivalents, end of period |
$ | 61,582 | $ | 163,968 | ||||
|
|
|
|
|
|||||
| Supplemental disclosures: |
||||||||
| Property and equipment included in accounts payable and accrued expenses |
$ | — | $ | 247 | ||||
|
|
|
|
|
|||||
| Deferred offering costs recorded in stockholders’ equity upon initial public offering |
$ | — | $ | 780 | ||||
|
|
|
|
|
|||||
The accompanying notes are an integral part of these unaudited financial statements.
F-28
Table of Contents
FIGS, INC.
NOTES TO INTERIM FINANCIAL STATEMENTS (UNAUDITED)
| 1. | DESCRIPTION OF BUSINESS |
FIGS, Inc. (the “Company”), a Delaware Corporation, was founded in 2013 and is a founder-led, direct-to-consumer healthcare apparel and lifestyle brand company. The Company designs and sells healthcare apparel and other non-scrub offerings, such as lab coats, underscrubs, outerwear, activewear, loungewear, compression socks footwear, masks and face shields. The Company markets and sells its products primarily in the United States. Sales are primarily generated through the Company’s digital platforms.
Impact of COVID-19
In December 2019, a novel strain of coronavirus, which causes the disease known as COVID-19, was reported to have surfaced in Wuhan, China. Since then, COVID-19 coronavirus has spread globally. In March 2020, the World Health Organization declared the COVID-19 outbreak a pandemic. The ongoing COVID-19 global and national health emergency has caused significant disruption in the international and United States economies and financial markets. The spread of COVID-19 has caused illness, quarantines, cancellation of events and travel, business and school shutdowns, reduction in business activity and financial transactions, labor shortages, supply chain interruptions and overall economic and financial market instability.
In response to public health directives and orders, and to help minimize the risk of the virus to employees, the Company has taken precautionary measures, including implementing work from home policies for certain employees. The COVID-19 pandemic has the potential to significantly impact the Company’s manufacturing supply chain, distribution, logistics and other services. Certain of the Company’s ocean freight providers, as well as some of its suppliers and manufacturers, are experiencing delays and in the past have experienced shutdowns due to the COVID-19 pandemic. In order to manage the impact of these disruptions and meet its customers’ expectations, the Company has from time to time used, and in the future may continue to use, faster but more expensive air freight, which in the past increased, and which in the future may continue to increase, our cost of goods sold. COVID-19 may continue to adversely affect workforces, economies and financial markets globally, potentially leading to an economic downturn and a reduction in consumer spending or an inability for the Company’s suppliers, vendors or other parties with whom it does business to meet their contractual obligations, which could negatively impact the Company’s business and results of operations.
Initial Public Offering
On June 1, 2021, the Company completed an initial public offering (the “IPO”) by issuing 4,636,364 shares of Class A common stock at a price to the public of $22 per share, resulting in net proceeds of $95.1 million, after deducting the underwriting discount and commissions of $6.1 million and deferred offering expenses of $0.8 million, net of reimbursements. The Company incurred a total of $8.7 million of expenses, before reimbursements, in connection with the IPO.
| 2. | SUMMARY OF SIGNIFICANT ACCOUNTING POLICIES |
Basis of Presentation
The accompanying unaudited financial statements are prepared in accordance with U.S. generally accepted accounting principles (“GAAP”) for interim financial information. Our fiscal year ends on December 31. Certain information and footnote disclosures normally included in the Company’s annual audited financial statements and accompanying notes have been condensed or omitted in these accompanying interim financial statements and footnotes. Certain reclassifications have been made to prior-year amounts to conform to the current period presentation. These unaudited financial statements should be read in conjunction with the audited financial
F-29
Table of Contents
statements and related notes for the year ended December 31, 2020, included elsewhere in this prospectus.
In our opinion, the unaudited financial statements include all adjustments of a normal recurring nature necessary for the fair presentation of our financial position, results of operations, and cash flows. The results of operations for the three and six months ended June 30, 2021 are not necessarily indicative of the results to be expected for the year ending December 31, 2021.
Stock Split
On May 19, 2021, the Company effected a nine-for-one forward stock split of its issued and outstanding common stock, stock options and restricted stock units (“RSUs”). Accordingly, all share and per share information has been retroactively adjusted to reflect the stock split for all periods presented.
Use of Estimates
The preparation of financial statements in conformity with U.S. GAAP requires management to make estimates and assumptions that affect reported amounts of assets and liabilities, disclosure of contingent assets and liabilities at the date of the financial statements, and the reported amounts of revenues and expenses during the reporting periods presented. Significant estimates include, but are not limited to, the valuation of the net realizable value of inventory, reserves for sales returns, allowances for doubtful accounts, stock-based compensation, contingent sales tax liability, and the useful lives and recoverability of long-lived assets. Actual results could differ from those estimates.
Deferred Offering Costs
The Company capitalized certain legal, professional accounting and other third-party fees that were directly associated with the Company’s equity offering as deferred costs. After consummation of the IPO on June 1, 2021, these costs were recorded in stockholders’ equity as a reduction of proceeds generated as a result of the offering.
Inventory, Net
Inventory consists of finished goods and is accounted for using an average cost method. Inventory is valued at the lower of cost or net realizable value. The Company records a provision for excess and obsolete inventory to adjust the carrying value of inventory based on assumptions regarding future demand for the Company’s products.
Lower of cost or net realizable value is evaluated by considering obsolescence, excessive levels of inventory, deterioration, and other factors. Adjustments to reduce the cost of inventory to its net realizable value, if required, are made for estimated excess, obsolescence, or impaired inventory. Excess and obsolete inventory is charged to cost of goods sold.
The Company recorded an allowance to write down inventory of $0.8 million and $0.4 million as of December 31, 2020 and June 30, 2021, respectively, to reduce inventory to the lower of cost or to its net realizable value.
Revenue Recognition
The Company recognizes revenue in accordance with Financial Accounting Standards Board (“FASB”) ASU 2014-09, Revenue from Contracts with Customers (Topic 606) (“ASC 606”). Revenue is recognized in an
F-30
Table of Contents
amount that reflects the consideration expected to be received in exchange for products. To determine revenue recognition for contracts with customers within the scope of ASC 606, the Company recognizes revenue from the commercial sales of products and contracts by applying the following five steps: (i) identify the contract(s) with a customer; (ii) identify the performance obligations of the contract(s); (iii) determine the transaction price; (iv) allocate the transaction price to the performance obligations in the contract(s); and (v) recognize revenue when (or as) we satisfy the performance obligations.
The Company only applies the five-step model to contracts when it is probable that the Company will collect the consideration it is entitled to in exchange for the good or services it transfers to the customer. The Company recognizes revenue at a point in time when it satisfies a performance obligation and transfers control of the products to the respective customers, which occurs when the goods are transferred to a common carrier. Shipping and handling costs associated with outbound freight incurred to transfer a product to a customer are treated as a fulfillment activity, and as a result, any fees received from customers are included in the transaction price for the performance obligation of providing goods to the customer.
The Company generally provides refunds for goods returned within 30 days from the original purchase date. A returns reserve is recorded by the Company based on the historical refund pattern. The returns reserve on the balance sheets was $1.7 million and $2.1 million as of December 31, 2020 and June 30, 2021, respectively.
Taxes assessed by a governmental authority that are both imposed on and concurrent with a specific revenue-producing transaction, that are collected by the Company from a customer, are excluded from revenue. The Company records deferred revenue when it receives payments in advance of the transfer of the goods to a common carrier. The amounts recorded are expected to be recognized as revenue within the 12 months following the balance sheet and, therefore, are classified as current liabilities in the balance sheets.
The Company does not have significant contract balances other than deferred revenue, the allowance for sales returns and liabilities related to its gift cards. The Company does not have significant contract acquisition costs.
The following table presents the disaggregation of the Company’s net revenues for the three and six months ended June 30, 2020 and 2021 as follows (in thousands):
| Three months ended June 30, |
Six months ended June 30, |
|||||||||||||||
| 2020 | 2021 | 2020 | 2021 | |||||||||||||
| By geography: |
||||||||||||||||
| United States |
$ | 62,256 | $ | 93,121 | $ | 93,833 | $ | 174,728 | ||||||||
| Rest of the world |
1,887 | 7,996 | 2,277 | 13,468 | ||||||||||||
|
|
|
|
|
|
|
|
|
|||||||||
| $ | 64,143 | $ | 101,117 | $ | 96,110 | $ | 188,196 | |||||||||
|
|
|
|
|
|
|
|
|
|||||||||
| By product: |
||||||||||||||||
| Scrubs |
$ | 57,379 | $ | 90,315 | $ | 85,931 | $ | 166,530 | ||||||||
| Non-scrubs |
6,764 | 10,802 | 10,179 | 21,666 | ||||||||||||
|
|
|
|
|
|
|
|
|
|||||||||
| $ | 64,143 | $ | 101,117 | $ | 96,110 | $ | 188,196 | |||||||||
|
|
|
|
|
|
|
|
|
|||||||||
Recently Adopted Accounting Pronouncements
In August 2018, the FASB issued ASU 2018-13, Fair Value Measurement (Topic 820), Disclosure Framework—Changes to the Disclosure Requirements for Fair Value Measurement, (“ASU 2018-13”). This update removed the following disclosure requirements: (1) the amount of and reasons for transfers between Level 1 and Level 2 of the fair value hierarchy; (2) the policy for timing of transfers between levels; and (3) the valuation processes for Level 3 fair value measurements. Additionally, this update added the following disclosure
F-31
Table of Contents
requirements: (1) the changes in unrealized gains and losses for the period included in other comprehensive income and loss for recurring Level 3 fair value measurements held at the end of the reporting period; (2) the range and weighted average of significant unobservable inputs used to develop Level 3 fair value measurements. For certain unobservable inputs, an entity may disclose other quantitative information (such as the median or arithmetic average) in lieu of the weighted average if the entity determines that other quantitative information would be a more reasonable and rational method to reflect the distribution of unobservable inputs used to develop Level 3 fair value measurements. ASU 2018-13 was effective for fiscal years beginning after December 15, 2019 with early adoption permitted. The Company adopted this update as of January 1, 2020 and noted no effect on the financial statements and related disclosures.
Recently Issued Accounting Pronouncements
In February 2016, the FASB issued ASU 2016- 02, Leases (Topic 842), as subsequently amended, which sets out the principles for the recognition, measurement, presentation and disclosure of leases for both parties to a contract (i.e., lessees and lessors), and replaces the existing guidance in ASC 840, Leases. The new standard also requires lessees to recognize operating and finance lease liabilities and corresponding right-of-use assets on the balance sheet and to provide enhanced disclosures surrounding the amount, timing and uncertainty of cash flows arising from leasing arrangements. The Company is required to adopt the standard on January 1, 2022 and is currently evaluating the impact that ASU 2016-02 will have on the financial statements and related disclosures.
In June 2016, the FASB issued ASU 2016-13, Financial Instruments-Credit Losses: Measurement of Credit Losses on Financial Instruments (Topic 326) (“ASU 2016-13”). ASU 2016-13 requires measurement and recognition of expected credit losses for financial assets. In April 2019, the FASB issued clarification to ASU 2016-13 within ASU No. 2019-04, Codification Improvements to Topic 326, Financial Instruments-Credit Losses, Topic 815, Derivatives and Hedging, and Topic 825, Financial Instruments. This update is effective for entities other than public business entities, including emerging growth companies that elected to defer compliance with new or revised financial accounting standards until a company that is not an issuer is required to comply with such standards, for annual reporting periods beginning after December 15, 2021. The Company is currently evaluating the impact that ASU 2016-13 will have on the financial statements and related disclosures.
In December 2019, the FASB issued ASU 2019-12, Simplifying the Accounting for Income Taxes (“ASU 2019-12”). ASU 2019-12 eliminates certain exceptions related to the approach for intra-period tax allocation, the methodology for calculating income taxes in an interim period and the recognition of deferred tax liabilities for outside basis differences. It also clarifies and simplifies other aspects of the accounting for income taxes. This update is effective for entities other than public business entities, including emerging growth companies that elected to defer compliance with new or revised financial accounting standards until a company that is not an issuer is required to comply with such standards, for annual reporting periods beginning after December 15, 2021, and interim periods within annual periods beginning after December 15, 2022. The Company is currently evaluating the impact that ASU 2019-12 will have on the financial statements and related disclosures.
| 3. | FAIR VALUE OF FINANCIAL ASSETS AND LIABILITIES |
As of December 31, 2020 and June 30, 2021, the Company’s cash equivalents consisted of money market funds, classified as Level 1 financial assets, as these assets are valued using quoted market prices in active markets without any valuation adjustment (in thousands).
| Fair Value Measurement as of December 31, 2020 |
||||||||||||||||
| Level 1 | Level 2 | Level 3 | Total | |||||||||||||
| Assets |
||||||||||||||||
| Money market funds |
$ | 50,219 | $ | — | $ | — | $ | 50,219 | ||||||||
|
|
|
|
|
|
|
|
|
|||||||||
| $ | 50,219 | $ | — | $ | — | $ | 50,219 | |||||||||
|
|
|
|
|
|
|
|
|
|||||||||
F-32
Table of Contents
| Fair Value Measurement as of June 30, 2021 |
||||||||||||||||
| Level 1 | Level 2 | Level 3 | Total | |||||||||||||
| Assets |
||||||||||||||||
| Money market funds |
$ | 137,615 | $ | — | $ | — | $ | 137,615 | ||||||||
|
|
|
|
|
|
|
|
|
|||||||||
| $ | 137,615 | $ | — | $ | — | $ | 137,615 | |||||||||
|
|
|
|
|
|
|
|
|
|||||||||
There were no transfers of assets between fair value levels during the periods presented. The carrying values of other current assets, accounts payable and accrued expenses approximate their fair values due to the short-term nature of these assets and liabilities.
| 4. | PREPAID EXPENSES AND OTHER CURRENT ASSETS |
Prepaid expenses and other current assets consist of the following (in thousands):
| December 31, 2020 |
June 30, 2021 |
|||||||
| Inventory deposits |
$ | 963 | $ | 749 | ||||
| Prepaid expenses |
1,406 | 6,772 | ||||||
| Prepaid taxes |
3,493 | — | ||||||
| Sample kits |
33 | — | ||||||
| Other prepaid expenses and current assets |
770 | 818 | ||||||
|
|
|
|
|
|||||
| $ | 6,665 | $ | 8,339 | |||||
|
|
|
|
|
|||||
| 5. | PROPERTY AND EQUIPMENT, NET |
Property and equipment, net consists of the following (in thousands):
| December 31, 2020 |
June 30, 2021 |
|||||||
| Furniture and fixtures |
$ | 808 | $ | 838 | ||||
| Office equipment |
765 | 776 | ||||||
| Machinery and equipment |
752 | 752 | ||||||
| Computer equipment |
610 | 840 | ||||||
| Software and website design |
1,704 | 2,420 | ||||||
| Leasehold improvements |
3,017 | 3,017 | ||||||
| Capital projects in progress |
312 | 360 | ||||||
|
|
|
|
|
|||||
| Total property and equipment |
7,968 | 9,003 | ||||||
| Less: accumulated depreciation and amortization |
(1,439 | ) | (2,095 | ) | ||||
|
|
|
|
|
|||||
| Property and equipment, net |
$ | 6,529 | $ | 6,908 | ||||
|
|
|
|
|
|||||
Depreciation and amortization expense of property and equipment for the three and six months ended June 30, 2020, was $0.2 million and $0.4 million, respectively. Depreciation and amortization expense of property and equipment for the three and six months ended June 30, 2021, was $0.3 million and $0.7 million, respectively.
F-33
Table of Contents
| 6. | ACCRUED EXPENSES |
Accrued expenses consist of the following (in thousands):
| December 31, 2020 |
June 30, 2021 |
|||||||
| Accrued inventory |
$ | 3,151 | $ | 4,335 | ||||
| Accrued shipping |
656 | 1,279 | ||||||
| Accrued selling expenses |
1,394 | 3,564 | ||||||
| Accrued legal expenses |
986 | 1,170 | ||||||
| Accrued marketing expenses |
102 | 2,589 | ||||||
| Credit card liabilities |
276 | 703 | ||||||
| Other accrued expenses |
117 | 1,675 | ||||||
|
|
|
|
|
|||||
| $ | 6,682 | $ | 15,315 | |||||
|
|
|
|
|
|||||
| 7. | FINANCING ARRANGEMENTS |
On September 5, 2017, the Company, as borrower, entered into a credit agreement with First Choice Bank, as lender, administrative agent and promissory note issuer for a $5.0 million revolving credit facility (the “Prior Credit Facility”). On October 5, 2018, the principal amount of the Prior Credit Facility was increased to $10.0 million. On January 7, 2019, the Company amended the Prior Credit Facility to extend the maturity date to January 12, 2022 and carved out of the Prior Credit Facility two standby letters of credit. The Company had letters of credit aggregating to $2.3 million as of December 31, 2019. Availability under the Credit Facility was $7.7 million as of December 31, 2019. On January 10, 2020, the Company amended and extended a letter of credit, increasing the aggregate of letters of credit to $2.4 million. In December 2020, the Prior Credit Facility was terminated.
On December 2, 2020, the Company, as borrower, entered into a credit agreement with JPMorgan Chase Bank, N.A. for an initial $50.0 million revolving credit facility (including capacity to issue letters of credit (the “Existing Credit Facility”). The Existing Credit Facility has a maturity date of December 2, 2025 (“Maturity Date”). Subject to certain conditions, the Existing Credit Facility also provides for an additional $25.0 million of capacity. As of June 30, 2021, the Company had letters of credit aggregating to $3.2 million outstanding under the Existing Credit Facility and available borrowings of $46.8 million. As of June 30, 2021, the Company had no outstanding borrowings under the Existing Credit Facility. Borrowings under the Existing Credit Facility are payable on the Maturity Date. Borrowings bear interest at LIBOR (with a 0.5% floor) plus 1.75%. The interest rate for undrawn amounts is 0.25%.
| 8. | COMMITMENTS AND CONTINGENCIES |
Taxes on Remote Sellers
The Company is subject to state laws or administrative practices with respect to the taxes on remote sellers. In accordance with ASC 450, Contingencies, the Company recorded $1.9 million and $1.8 million within sales tax payable on the Company’s balance sheets as of December 31, 2020 and June 30, 2021, respectively.
Operating Leases
The Company leases its office facilities and certain office equipment under non-cancelable operating leases that expire on various dates through December 2029. During the three months ended June 30, 2020 and 2021, the Company recorded rent expense of $0.5 million and $0.5 million, respectively. During the six months ended June 30, 2020 and 2021, the Company recorded rent expense of $0.9 million and $0.9 million, respectively.
F-34
Table of Contents
Future minimum lease payments under non-cancelable operating leases subsequent to June 30, 2021 are as follows (in thousands):
| 2021 |
$ | 961 | ||
| 2022 |
1,963 | |||
| 2023 |
2,023 | |||
| 2024 |
2,093 | |||
| 2025 |
2,166 | |||
| Thereafter |
9,448 | |||
|
|
|
|||
| $ | 18,654 |
Inventory Purchase Obligations
Inventory purchase obligations as of June 30, 2021 were $21.2 million. These inventory purchase obligations can be impacted by various factors, including the timing of issuing orders and the timing of the shipment of orders.
Legal Contingencies
Legal claims may arise from time to time in the normal course of business, the results of which may have a material effect on the Company’s accompanying financial statements. The Company currently has legal actions against it with respect to its litigation with Strategic Partners, Inc. The Company believes the claims are without basis or merit and intends to vigorously defend against such claims. Accordingly, an accrual for any potential liability has not been recorded.
| 9. | INCOME TAXES |
Our tax provision for interim periods is determined using an estimate of our annual effective tax rate, adjusted for discrete items arising during interim periods.
For the three months ended June 30, 2020 and June 30, 2021, the Company’s effective tax rate was 14.5% and (26.3)%, respectively. The Company’s effective tax rate differed from the U.S. statutory tax rate primarily due to state taxes, the permanent disallowance of stock-based compensation for tax purposes, excess compensation limitations and the impact of other discrete items including certain transaction expenses.
For the three months ended June 30, 2020 and June 30, 2021, the Company recorded income tax expense of $2.4 million and $8.5 million, respectively.
For the six months ended June 30, 2020 and June 30, 2021, the Company’s effective tax rate was 11.6% and (81.1)%, respectively. The Company’s effective tax rate differed from the U.S. statutory tax rate primarily due to state taxes, the permanent disallowance of stock-based compensation for tax purposes, excess compensation limitations and the impact of other discrete items including certain transaction expenses.
For the six months ended June 30, 2020 and June 30, 2021, the Company recorded income tax expense of $2.4 million and $13.0 million, respectively.
| 10. | STOCK-BASED COMPENSATION |
Amended 2016 Equity Incentive Plan
In 2016, the Company adopted the 2016 Equity Incentive Plan (as amended, the “2016 Plan”). The 2016 Plan provided for the issuance of restricted stock awards (“RSAs”), restricted stock units (“RSUs”), stock
F-35
Table of Contents
appreciation rights (“SARs”), incentive stock options, non-qualified stock options and other stock-based awards to employees and consultants of the Company and its affiliates and members of the Board of Directors of the Company (the “Board”). The number of shares of Class A common stock authorized for issuance under the 2016 Plan as of June 30, 2021 was 51,716,934. Only incentive stock options, non-qualified stock options and RSUs were granted under the 2016 Plan.
On May 18, 2021, the Board approved the termination of the 2016 Plan, effective as of the date that the 2021 Equity Incentive Plan (the “2021 Plan”) became effective. Any remaining shares of common stock available for issuance under the 2016 Plan were added to the shares of our Class A common stock reserved for issuance under the 2021 Plan. Additionally, any shares of common stock subject to awards granted under the 2016 Plan that expire unexercised or are cancelled, terminated or forfeited in any manner without issuance of shares thereunder following the effective date of the 2021 Plan will become available for issuance under the 2021 Plan.
2021 Equity Incentive Plan and 2021 Employee Stock Purchase Plan
On May 18, 2021, the Board adopted and the stockholders of the Company approved the 2021 Plan and the 2021 Employee Stock Purchase Plan (the “ESPP”).
Upon adoption, 14,592,452 shares of the Company’s Class A common stock were reserved for future issuance under the 2021 Plan, which number consists of (a) 10,197,941 shares initially available for issuance and (b) an additional 4,394,511 shares previously reserved for but unissued under the 2016 Plan on the effective date of the 2021 Plan that are now available for issuance under the 2021 Plan. The 2021 Plan authorizes the granting of RSAs, RSUs, SARs, incentive stock options, non-qualified stock options, dividend equivalents, and other stock or cash awards to employees and consultants of the Company and its subsidiaries and members of the Board.
In addition to the 2021 Plan, up to 1,605,647 shares of the Company’s Class A common stock may be issued under the ESPP, which has not yet been implemented.
All options and SARs granted under the 2021 Plan will generally expire ten years from the date of grant if not exercised. In the event of a termination of employment, any unvested portion of an award will generally be forfeited immediately. Any vested options or SARs may generally be exercised within three months, except for (i) instances of termination due to death or disability whereby any vested options may be exercised within one year and (ii) instances of termination “with cause” whereby any vested options or awards are forfeited immediately.
Shares that expire, lapse or are terminated, exchanged for or settled in cash, surrendered, repurchased or canceled under the 2021 Plan without having been exercised, or forfeited will become available for future awards under the 2021 Plan. In addition, shares of common stock that are tendered to the Company by a participant to satisfy the applicable exercise or purchase price of an award and/or to satisfy any applicable tax withholding obligation with respect to an award are added to the number of shares of common stock available for future awards. The 2021 Plan is administered by the Board with respect to awards to non-employee directors and by the Compensation Committee of the Board with respect to other participants.
As of June 30, 2021, the number of shares available for issuance under the 2021 Plan was 13,285,050.
F-36
Table of Contents
Stock Options
A summary of stock option activity under the 2016 Plan and 2021 Plan, is as follows:
| Stock Options Outstanding | ||||||||||||||||
| Number of Shares |
Weighted Average Exercise Price (per share) |
Weighted Average Remaining Contractual Term (in years) |
Aggregate Intrinsic Value (in millions) |
|||||||||||||
| Outstanding at December 31, 2020 |
39,837,195 | $ | 3.49 | 8.87 | $ | 101 | ||||||||||
| Granted |
2,893,445 | 17.37 | ||||||||||||||
| Exercised |
(649,840 | ) | 0.88 | |||||||||||||
| Forfeited |
(454,954 | ) | 1.22 | |||||||||||||
|
|
|
|
|
|||||||||||||
| Outstanding at June 30, 2021 |
41,625,846 | $ | 4.52 | 8.47 | $ | 1,897 | ||||||||||
|
|
|
|
|
|||||||||||||
The aggregate intrinsic value of stock options is calculated as the difference between the exercise price of the stock options and the fair value of the Company’s common stock for those stock options that had exercise prices lower than the fair value of the common stock as of June 30, 2021. As of June 30, 2021, the aggregate intrinsic value of stock options exercisable was $1.1 billion. The aggregate intrinsic value of stock options exercised during the six months ended June 30, 2021 was $9.3 million. There were no stock option exercises during the six months ended June 30, 2020.
The weighted-average grant date fair value per share of the Company’s stock options granted during the six months ended June 30, 2020 and 2021 was $2.83 and $9.08, respectively. The aggregate fair value of stock options vested during the six months ended June 30, 2020 and 2021 was $0.3 million and $41.6 million, respectively.
As of June 30, 2021, total unrecognized compensation cost related to unvested stock option awards was $88.4 million, to be recognized over a weighted-average period of 3.7 years.
Stock Option Modifications
During the three months ended June 30, 2021, the Board determined to accelerate the vesting of certain employee stock option awards, subject to and effective as of the closing of the Company’s IPO, and further subject to the employee’s continued service with the Company through the closing of the IPO, as described in our Prospectus. Upon the modification of the stock options, the Company determined no incremental fair value was required to be recorded as the awards would continue to vest both prior to and post modification and the modification of the stock options did not change award valuation inputs or assumptions. The Company recorded $32.8 million of expense as a result of the accelerated vesting of stock options.
Restricted Stock Awards and Restricted Stock Units
During the six months ended June 30, 2021, the Company granted 365,190 RSUs which vest upon the satisfaction of a four-year service condition (or, for RSUs granted to members of the Board, upon the earlier to occur of (i) the one-year anniversary of the grant date and (ii) the date of the next annual meeting of the Company’s stockholders following the grant date) and 50,508 RSAs which vested upon grant.
During the six months ended December 31, 2020, the Company granted 5,410,440 RSUs which vest upon the satisfaction of both a service and a performance condition. The service condition for these awards is satisfied over four years. The performance condition is satisfied upon the occurrence of a qualifying event, generally defined as a change of control transaction or an initial public offering. The performance condition for these
F-37
Table of Contents
awards was satisfied in connection with the IPO. Upon the satisfaction of the performance condition, the Company recorded $16.0 million of stock-based compensation expense related to these awards and withheld 762,359 shares of common stock, based on the IPO price of $22 per share, to satisfy the tax remittances of approximately $16.8 million.
A summary of RSA and RSU activity under the 2016 Plan and 2021 Plan is as follows:
| Number of Shares |
Weighted average grant date fair value per share |
|||||||
| Unvested restricted stock at December 31, 2020 |
5,410,440 | $ | 4.51 | |||||
| Granted |
415,698 | 31.76 | ||||||
| Vested |
(2,079,428 | ) | 5.44 | |||||
| Forfeited |
(1,975 | ) | 31.76 | |||||
|
|
|
|||||||
| Unvested restricted stock at June 30, 2021 |
3,744,735 | $ | 7.16 | |||||
|
|
|
|||||||
| 11. | EARNINGS (LOSS) PER SHARE |
Basic earnings (loss) per share (“basic EPS”) and diluted earnings (loss) per share (“diluted EPS”) attributable to common stockholders is calculated in conformity with the two-class method required for participating securities: Class A and Class B common stock. The rights of the holders of Class A and Class B common stock are identical, except with respect to voting, conversion, and transfer rights. Each share of Class A common stock is entitled to one vote per share and each share of Class B common stock is entitled to twenty votes per share. Each share of Class B common stock is convertible at any time at the option of the stockholder into one share of Class A common stock.
Basic EPS attributable to common stockholders is computed by dividing net income (loss) attributable to common stockholders by the weighted-average number of common shares outstanding during the period. For the calculation of diluted EPS, net income (loss) attributable to common stockholders for basic EPS is adjusted by the effect of dilutive securities. Diluted EPS attributable to common stockholders is computed by dividing the net income (loss) attributable to common stockholders by the weighted-average number of common shares outstanding, including all potentially dilutive common shares.
As the economic rights of Class A and Class B common stock are identical, undistributed earnings are allocated on a proportionate basis and presented on a combined basis. The following table sets forth the computation of basic and diluted EPS and a reconciliation of the weighted average number of common and common equivalent shares outstanding for the three and six months ended June 30, 2020 and June 30, 2021 (in thousands, except share and per share amounts):
| Three months ended June 30, | For the six months ended June 30, | |||||||||||||||
| 2020 | 2021 | 2020 | 2021 | |||||||||||||
| Numerator: |
||||||||||||||||
| Net income (loss) |
$ | 14,175 | $ | (40,546 | ) | $ | 18,309 | $ | (29,106 | ) | ||||||
| Denominator: |
||||||||||||||||
| Weighted-average shares—basic |
153,052,983 | 156,867,484 | 153,052,983 | 155,725,959 | ||||||||||||
| Effect of dilutive stock options |
627,659 | — | 608,873 | — | ||||||||||||
|
|
|
|
|
|
|
|
|
|||||||||
| Weighted-average shares—diluted |
153,680,642 | 156,867,484 | 153,661,856 | 155,725,959 | ||||||||||||
|
|
|
|
|
|
|
|
|
|||||||||
| Earnings per share: |
||||||||||||||||
| Basic earnings (loss) per share |
$ | 0.09 | $ | (0.26 | ) | $ | 0.12 | $ | (0.19 | ) | ||||||
| Effect of dilutive stock options |
— | — | — | — | ||||||||||||
| Diluted earnings (loss) per share |
$ | 0.09 | $ | (0.26 | ) | $ | 0.12 | $ | (0.19 | ) | ||||||
F-38
Table of Contents
The Company excluded the following weighted average common equivalent shares from the computation of diluted earnings (loss) per share for the three and six months ended June 30, 2020 and the three and six months ended June 30, 2021 because including them would have had an anti-dilutive effect:
| Three months ended June 30, | Six months ended June 30, | |||||||||||||||
| 2020 | 2021 | 2020 | 2021 | |||||||||||||
| Stock options to purchase common stock |
14,605,610 | 40,690,767 | 14,611,210 | 40,260,756 | ||||||||||||
| Restricted stock units |
5,410,440 | 4,749,957 | 5,410,440 | 5,078,374 | ||||||||||||
|
|
|
|
|
|
|
|
|
|||||||||
| 12. | EMPLOYEE BENEFIT PLAN |
The Company maintains a defined contribution 401(k) plan for the benefit of all employees who have met the eligibility requirements. Participants may contribute up to 100% of their eligible compensation, subject only to annual limitations set by the Internal Revenue Service. The Company matches 100% of participant contributions, up to the first 6% of a participant’s plan compensation. For the three months ended June 30, 2020 and 2021, the Company recorded expense for matching contributions of $0.1 million and $0.3 million respectively. For the six months ended June 30, 2020 and 2021, the Company recorded expense for matching contributions of $0.3 million and $0.5 million, respectively, within general and administrative expenses on the Company’s statements of operations and comprehensive income (loss).
| 13. | RELATED PARTY TRANSACTIONS |
Tulco, an existing stockholder, reimbursed the Company for certain of the Company’s professional fees in connection with the Company’s IPO. These reimbursements totaled $4.9 million and are recorded in due from related party on the accompanying balance sheet as of June 30, 2021. The Company received payment of the amount due from Tulco during the third quarter of 2021.
| 14. | SUBSEQUENT EVENTS |
The Company has evaluated subsequent events occurring through August 12, 2021, the date that these financial statements were originally issued, and with respect to the below subsequent event, through September 13, 2021:
On September 7, 2021, the Company entered into a credit agreement with Bank of America, N.A., providing for a revolving credit facility in an initial amount of up to $100.0 million, or the New Credit Facility, and terminated the Existing Credit Facility. The New Credit Facility will mature in September 2026. There were no outstanding borrowings under the Existing Credit Facility but letters of credit with an aggregate face amount of approximately $3.2 million were outstanding under this facility as of September 7, 2021. The letters of credit remain outstanding, but our reimbursement obligations are secured by cash collateral pledged by us to JPMorgan Chase Bank, N.A. in the amount of approximately $3.3 million. As of September 13, 2021, the Company has no outstanding borrowings under the New Credit Facility.
F-39
Table of Contents
Serious News for Serious Traders! Try StreetInsider.com Premium Free!
You May Also Be Interested In
- Figs Inc. (FIGS) PT Lowered to $4.25 at Goldman Sachs
- Flash News: OKX DeFi Launches 'zkSwap Bonus Event' Offering Users the Opportunity to Earn a Bonus APR
- Air Methods Ascend Partners with SimX to Soar to New Heights in Critical Care Education
Create E-mail Alert Related Categories
SEC FilingsSign up for StreetInsider Free!
Receive full access to all new and archived articles, unlimited portfolio tracking, e-mail alerts, custom newswires and RSS feeds - and more!
