

Form 424B3 Blackstone Real Estate
 Tweet
Tweet Share
ShareFiled Pursuant to Rule 424(b)(3)
Registration No. 333-260168
Registration No. 333-260168
BLACKSTONE REAL ESTATE INCOME TRUST, INC.
SUPPLEMENT NO. 3 DATED MAY 16, 2022
TO THE PROSPECTUS DATED FEBRUARY 25, 2022
This prospectus supplement (“Supplement”) is part of and should be read in conjunction with the prospectus of Blackstone Real Estate Income Trust, Inc., dated February 25, 2022 (as supplemented to date, the “Prospectus”). Unless otherwise defined herein, capitalized terms used in this Supplement shall have the same meanings as in the Prospectus. References herein to the "Company," "BREIT," "we," "us," or "our" refer to Blackstone Real Estate Income Trust, Inc. and its subsidiaries unless the context specifically requires otherwise.
The purposes of this Supplement are as follows:
•to provide an update to BREIT’s portfolio;
•to disclose the transaction price for each class of our common stock as of June 1, 2022;
•to disclose the calculation of our April 30, 2022 NAV per share for all share classes;
•to provide an update on the status of our current public offering (the “Offering”);
•to otherwise update the Prospectus; and
•to include our Quarterly Report on Form 10-Q for the quarter ended March 31, 2022
Portfolio Update
For the month ended April 30, 2022, BREIT’s Class S NAV per share increased $0.14, from $14.82 as of March 31, 2022 to $14.96 as of April 30, 2022.1
We believe BREIT’s portfolio is well positioned in the current environment of inflation and rising interest rates. The portfolio is oriented towards income-generating real estate concentrated in areas of high conviction with strong fundamentals. BREIT is 79% weighted to residential and industrial, sectors we believe present favorable supply/demand dynamics.2 Rising replacement costs are further constraining new supply and may support increased pricing power for existing assets. Replacement costs for industrial and residential assets have increased +126% and +27%, respectively since 2019.3
June 1, 2022 Transaction Price
The transaction price for each share class of our common stock for subscriptions accepted as of June 1, 2022 (and repurchases as of May 31, 2022) is as follows:
| Transaction Price (per share) | ||||||||
| Class S | $ | 14.9649 | ||||||
| Class I | $ | 14.9680 | ||||||
| Class T | $ | 14.7523 | ||||||
| Class D | $ | 14.6608 | ||||||
The June 1 transaction price for each of our share classes is equal to such class’s NAV per share as of April 30, 2022. A detailed calculation of the NAV per share is set forth below. The purchase price of our common stock for each share class equals the transaction price of such class, plus applicable upfront selling commissions and dealer manager fees. The repurchase price for each share class equals the transaction price of such class.
1 BREIT’s Class T NAV per share increased from $14.62 to $14.75, BREIT’s Class D NAV per share increased from $14.53 to $14.66 and Class I NAV per share increased from $14.82 to $14.97.
2 BREIT portfolio as of April 30, 2022. Sector allocation weighting is measured as the asset value of real estate investments for each sector category (Residential, Industrial, Net Lease, Hospitality, Data Centers, Self Storage, Office, Retail) divided by the total asset value of all real estate investments, excluding the value of any third-party interests in such real estate investments (“Real Estate TAV”). As of December 31, 2021, the following sectors each have subsectors comprising over 1.0% of Real Estate TAV. Residential: multifamily, single family rental, student housing, affordable housing and manufactured housing; Industrial: warehouses; and Hospitality: full service and select service hotels
3 Blackstone Proprietary Data, as of March 2022. Represents estimated percent change in the costs of new development by sector between 2019 and March 2022 and comprises land, hard costs and soft costs. Residential development cost increase reflects primarily suburban multifamily properties in the following markets: Atlanta, Charlotte, Dallas, Denver, Phoenix, Raleigh, San Bernardino, Seattle and Tampa. Industrial development cost increase reflects the following markets: Dallas, Los Angeles, Miami, New York and San Bernardino.
April 30, 2022 NAV per Share
We calculate NAV per share in accordance with the valuation guidelines that have been approved by our board of directors. Our NAV per share, which is updated as of the last calendar day of each month, is posted on our website at www.breit.com and is made available on our toll-free, automated telephone line at (844) 702-1299. Please refer to “Net Asset Value Calculation and Valuation Guidelines” in the Prospectus for how our NAV is determined. The Adviser is ultimately responsible for determining our NAV. All our property investments are appraised annually by third party appraisal firms in accordance with our valuation guidelines and such appraisals are reviewed by our independent valuation advisor. Transactions or events have occurred since April 30, 2022 that could have a material impact on our NAV per share, upon which our transaction price is based. We have included a breakdown of the components of total NAV and NAV per share for April 30, 2022 along with the immediately preceding month.
Our total NAV presented in the following tables includes the NAV of our Class S, Class I, Class T, and Class D common stockholders, as well as partnership interests of BREIT Operating Partnership held by parties other than the Company. The following table provides a breakdown of the major components of our total NAV as of April 30, 2022 ($ and shares in thousands):
| Components of NAV | April 30, 2022 | |||||||
| Investments in real estate | $ | 89,766,659 | ||||||
| Investments in real estate debt | 9,637,337 | |||||||
| Investments in unconsolidated entities | 8,489,896 | |||||||
| Cash and cash equivalents | 3,954,199 | |||||||
| Restricted cash | 2,465,473 | |||||||
| Other assets | 5,029,299 | |||||||
| Mortgage notes, term loans, and revolving credit facilities, net | (41,619,673) | |||||||
| Secured financings on investments in real estate debt | (4,650,023) | |||||||
| Subscriptions received in advance | (1,480,073) | |||||||
| Other liabilities | (2,756,248) | |||||||
| Accrued performance participation allocation | (302,462) | |||||||
| Management fee payable | (69,675) | |||||||
Accrued stockholder servicing fees(1) | (17,321) | |||||||
| Non-controlling interests in joint ventures | (2,178,655) | |||||||
| Net asset value | $ | 66,268,733 | ||||||
| Number of outstanding shares/units | 4,436,042 | |||||||
_____________
(1)Stockholder servicing fees only apply to Class S, Class T and Class D shares. For purposes of NAV we recognize the stockholder servicing fee as a reduction of NAV on a monthly basis as such fee is paid. Under accounting principles generally accepted in the United States of America (“GAAP”), we accrue the full cost of the stockholder servicing fee as an offering cost at the time we sell Class S, Class T and Class D shares. As of April 30, 2022, the Company has accrued under GAAP $1.5 billion of stockholder servicing fees payable to the Dealer Manager related to the Class S, Class T and Class D shares sold. The Dealer Manager does not retain any of these fees, all of which are retained by, or re-allowed (paid) to, participating broker-dealers.
The following table provides a breakdown of our total NAV and NAV per share/unit by class as of April 30, 2022 ($ and shares/units in thousands, except per share/unit data):
| Third-party | ||||||||||||||||||||||||||||||||||||||
| Operating | ||||||||||||||||||||||||||||||||||||||
| Class S | Class I | Class T | Class D | Partnership | ||||||||||||||||||||||||||||||||||
| NAV Per Share/Unit | Shares | Shares | Shares | Shares | Units(1) | Total | ||||||||||||||||||||||||||||||||
| Net asset value | $ | 22,143,490 | $ | 36,030,104 | $ | 1,002,141 | $ | 5,285,520 | $ | 1,807,478 | $ | 66,268,733 | ||||||||||||||||||||||||||
| Number of outstanding shares/units | 1,479,698 | 2,407,136 | 67,931 | 360,521 | 120,756 | 4,436,042 | ||||||||||||||||||||||||||||||||
NAV Per Share/Unit as of April 30, 2022 | $ | 14.9649 | $ | 14.9680 | $ | 14.7523 | $ | 14.6608 | $ | 14.9680 | ||||||||||||||||||||||||||||
_____________
(1)Includes the partnership interests of BREIT Operating Partnership held by BREIT Special Limited Partner, Class B unit holders, and other BREIT Operating Partnership interests held by parties other than the Company.
Set forth below are the weighted averages of the key assumptions in the discounted cash flow methodology used in the April 30, 2022 valuations, based on property types.
| Property Type | Discount Rate | Exit Capitalization Rate | ||||||||||||
| Residential | 6.7% | 4.9% | ||||||||||||
| Industrial | 6.2% | 5.1% | ||||||||||||
| Net Lease | 6.8% | 5.9% | ||||||||||||
| Hospitality | 9.1% | 9.1% | ||||||||||||
| Data Centers | 6.6% | 5.6% | ||||||||||||
| Self Storage | 7.0% | 5.1% | ||||||||||||
| Office | 6.6% | 4.8% | ||||||||||||
| Retail | 6.7% | 5.3% | ||||||||||||
These assumptions are determined by the Adviser, and reviewed by our independent valuation advisor. A change in these assumptions would impact the calculation of the value of our property investments. For example, assuming all other factors remain unchanged, the changes listed below would result in the following effects on our investment values:
| Residential | Industrial | Net Lease | Hospitality | Data Centers | Self Storage | Office | Retail | |||||||||||||||||||||||||||||||||||||||||||||||||
| Hypothetical | Investment | Investment | Investment | Investment | Investment | Investment | Investment | Investment | ||||||||||||||||||||||||||||||||||||||||||||||||
| Input | Change | Values | Values | Values | Values | Values | Values | Values | Values | |||||||||||||||||||||||||||||||||||||||||||||||
| Discount Rate | 0.25% decrease | +1.9% | +2.0% | +1.8% | +1.7% | +1.7% | +1.8% | +2.0% | +1.9% | |||||||||||||||||||||||||||||||||||||||||||||||
| (weighted average) | 0.25% increase | (1.9)% | (1.9)% | (1.8)% | (1.6)% | (1.6)% | (1.9)% | (1.9)% | (1.9)% | |||||||||||||||||||||||||||||||||||||||||||||||
| Exit Capitalization Rate | 0.25% decrease | +3.2% | +3.5% | +2.5% | +1.4% | +2.5% | +3.1% | +4.0% | +3.0% | |||||||||||||||||||||||||||||||||||||||||||||||
| (weighted average) | 0.25% increase | (2.9)% | (3.2)% | (2.3)% | (1.3)% | (2.3)% | (3.0)% | (3.6)% | (3.0)% | |||||||||||||||||||||||||||||||||||||||||||||||
Our total NAV presented in the following tables includes the NAV of our Class S, Class I, Class T, and Class D common stockholders, as well as partnership interests of BREIT Operating Partnership held by parties other than the Company. The following table provides a breakdown of the major components of our total NAV as of March 31, 2022 ($ and shares in thousands):
| Components of NAV | March 31, 2022 | |||||||
| Investments in real estate | $ | 87,395,224 | ||||||
| Investments in real estate debt | 9,888,596 | |||||||
| Investments in unconsolidated entities | 7,001,476 | |||||||
| Cash and cash equivalents | 3,787,636 | |||||||
| Restricted cash | 2,779,440 | |||||||
| Other assets | 5,330,588 | |||||||
| Mortgage notes, term loans, and revolving credit facilities, net | (41,233,933) | |||||||
| Secured financings on investments in real estate debt | (4,558,781) | |||||||
| Subscriptions received in advance | (1,843,583) | |||||||
| Other liabilities | (2,314,180) | |||||||
| Accrued performance participation allocation | (411,569) | |||||||
| Management fee payable | (66,688) | |||||||
Accrued stockholder servicing fees(1) | (17,064) | |||||||
| Non-controlling interests in joint ventures | (2,434,109) | |||||||
| Net asset value | $ | 63,303,053 | ||||||
| Number of outstanding shares/units | 4,278,277 | |||||||
__________
(1)Stockholder servicing fees only apply to Class S, Class T and Class D shares. For purposes of NAV we recognize the stockholder servicing fee as a reduction of NAV on a monthly basis as such fee is paid. Under GAAP, we accrue the full cost of the stockholder servicing fee as an offering cost at the time we sell Class S, Class T and Class D shares. As of March 31, 2022, the Company has accrued under GAAP $1.5 billion of stockholder servicing fees payable to the Dealer Manager related to the Class S, Class T and Class D shares sold. The Dealer Manager does not retain any of these fees, all of which are retained by, or reallowed (paid) to, participating broker-dealers.
The following table provides a breakdown of our total NAV and NAV per share/unit by class as of March 31, 2022 ($ and shares/units in thousands, except per share/unit data):
| Third-party | ||||||||||||||||||||||||||||||||||||||
| Operating | ||||||||||||||||||||||||||||||||||||||
| Class S | Class I | Class T | Class D | Partnership | ||||||||||||||||||||||||||||||||||
| NAV Per Share/Unit | Shares | Shares | Shares | Shares | Units(1) | Total | ||||||||||||||||||||||||||||||||
| Net asset value | $ | 21,144,498 | $ | 34,835,841 | $ | 950,838 | $ | 4,938,526 | $ | 1,433,350 | $ | 63,303,053 | ||||||||||||||||||||||||||
| Number of outstanding shares/units | 1,426,428 | 2,350,144 | 65,057 | 339,949 | 96,699 | 4,278,277 | ||||||||||||||||||||||||||||||||
NAV Per Share/Unit as of March 31, 2022 | $ | 14.8234 | $ | 14.8229 | $ | 14.6156 | $ | 14.5273 | $ | 14.8229 | ||||||||||||||||||||||||||||
____________
(1)Includes the partnership interests of BREIT Operating Partnership held by BREIT Special Limited Partnership, Class B unit holders, and other BREIT Operating Partnership interests held by parties other than the Company.
Status of our Current Public Offering
We are currently offering on a continuous basis up to $60.0 billion in shares of common stock, consisting of up to $48.0 billion in shares in our primary offering and up to $12.0 billion in shares pursuant to our distribution reinvestment plan. As of the date of this Supplement, we had issued and sold in the Offering (i) 231,740,223 shares of our common stock (consisting of 96,201,983 Class S Shares, 89,347,890 Class I Shares, 7,126,859 Class T Shares, and 39,063,491 Class D Shares) in the primary offering for total proceeds of $3.4 billion and (ii) 11,459,987 shares of our common stock (consisting of 5,139,300 Class S Shares, 4,777,504 Class I Shares, 253,838 Class T Shares, and 1,289,345 Class D Shares) pursuant to our distribution reinvestment plan for a total value of $0.2 billion. As of April 30, 2022, our aggregate NAV was $66.3 billion. We intend to continue selling shares in the Offering on a monthly basis.
Updates to the Prospectus
The following disclosure supersedes and replaces the fifth paragraph of the section of the Prospectus titled “Net Asset Value Calculation and Valuation Guidelines—Valuation of Real Estate Debt and Other Securities—No readily available market quotations” and all other similar disclosure in the Prospectus:
Market yield is estimated as of each quarterly valuation date based on a variety of inputs regarding the collateral asset(s) performance, local/macro real estate performance, and capital market conditions, in each case as determined in good faith by the Adviser. These factors may include, but are not limited to: purchase price/par value of such real estate debt or other difficult to value securities; debt yield, capitalization rates, loan-to-value ratio, and replacement cost of the collateral asset(s); borrower financial condition, reputation, and indications of intent (e.g., pending repayments, extensions, defaults, etc.); and known transactions or other price discovery for comparable debt investments. In the absence of collateral real estate value supporting such securities, the Adviser will consider the residual value to its securities, following repayment of any senior debt or other obligations of the collateral asset(s). For each month that the Adviser does not perform a valuation of such investments, it will review such investment to confirm that there have been no significant events that would cause a material change in value of such investment. Our independent valuation advisor will generally review the reasonableness of the valuation of our real estate debt investments without readily available market quotations upon the Adviser’s initial quarterly valuation of such investment and each month thereafter. Notwithstanding anything herein to the contrary, the Adviser may engage a third-party valuation service provider to provide valuations of loan investments, which valuations will not be reviewed by our independent valuation advisor. State Street will incorporate such valuations into our NAV, which will be reviewed and confirmed by the Adviser.
The following disclosure supersedes and replaces the fifth paragraph of the section of the Prospectus titled “Share Repurchases—Repurchase Limitations” and all other similar disclosure in the Prospectus:
Shares held by the Adviser acquired as payment of the Adviser’s management fee will not be subject to our share repurchase plan, including with respect to any repurchase limits, the Early Repurchase Deduction or the calculation of NAV. In addition, any repurchases of shares in respect of distributions on the performance participation interest will not be subject to the Early Repurchase Deduction. Notwithstanding the foregoing, we have adopted a policy in which the affiliate transaction committee must approve repurchase requests submitted by the Adviser that when combined with any shareholder repurchase requests would cause us to exceed the 2% monthly or 5% quarterly limitations on repurchases. Such approval must find that the repurchase will not impair our capital or operations and be consistent with the fiduciary duties of our directors. Stockholders who are exchanging a class of our shares for an equivalent aggregate NAV of another class of our shares will not be subject to, and will not be treated as repurchases for the calculation of, the 2% monthly or 5% quarterly limitations on repurchases and will not be subject to the Early Repurchase Deduction.
The following disclosure supersedes and replaces the second paragraph of the section of the Prospectus titled “Share Repurchases—Early Repurchase Deduction” and all other similar disclosure in the Prospectus:
The Early Repurchase Deduction will inure indirectly to the benefit of our remaining stockholders and is intended to offset the trading costs, market impact and other costs associated with short-term trading in our common stock. We may, from time to time, waive the Early Repurchase Deduction in the following circumstances (subject to the conditions described below):
•repurchases resulting from death, qualifying disability or divorce;
• in the event that a stockholder’s shares are repurchased because the stockholder has failed to maintain the $500 minimum account balance; or
•due to trade or operational error.
Quarterly Report on Form 10-Q for the Quarter Ended March 31, 2022
On May 13, 2022, we filed our Quarterly Report on Form 10-Q for the quarter ended March 31, 2022 with the Securities and Exchange Commission. The report (without exhibits) is attached to this Supplement.
UNITED STATES
SECURITIES AND EXCHANGE COMMISSION
WASHINGTON, D.C. 20549
FORM 10-Q
| ☒ | QUARTERLY REPORT PURSUANT TO SECTION 13 OR 15(d) OF THE SECURITIES EXCHANGE ACT OF 1934 | ||||
FOR THE QUARTERLY PERIOD ENDED MARCH 31, 2022
OR
| ☐ | TRANSITION REPORT PURSUANT TO SECTION 13 OR 15(d) OF THE SECURITIES EXCHANGE ACT OF 1934 | ||||
FOR THE TRANSITION PERIOD FROM TO
Commission File Number: 000-55931

Blackstone Real Estate Income Trust, Inc.
(Exact name of Registrant as specified in its charter)
| Maryland | 81-0696966 | ||||||||||||||||
| (State or other jurisdiction of incorporation or organization) | (I.R.S. Employer Identification No.) | ||||||||||||||||
| 345 Park Avenue | |||||||||||||||||
| New York | , | NY | 10154 | ||||||||||||||
| (Address of principal executive offices) | (Zip Code) | ||||||||||||||||
Registrant’s telephone number, including area code: (212) 583-5000
Securities registered pursuant to Section 12(b) of the Act: None
| Title of each class | Trading Symbol(s) | Name of each exchange on which registered | ||||||||||||
Indicate by check mark whether the registrant (1) has filed all reports required to be filed by Section 13 or 15(d) of the Securities Exchange Act of 1934 during the preceding 12 months (or for such shorter period that the registrant was required to file such reports), and (2) has been subject to such filing requirements for the past 90 days. Yes ☒ No ☐
Indicate by check mark whether the registrant has submitted electronically every Interactive Data File required to be submitted pursuant to Rule 405 of Regulation S-T (§232.405 of this chapter) during the preceding 12 months (or for such shorter period that the registrant was required to submit such files). Yes ☒ No ☐
Indicate by check mark whether the registrant is a large accelerated filer, an accelerated filer, a non-accelerated filer, smaller reporting company, or an emerging growth company. See the definitions of “large accelerated filer,” “accelerated filer,” “smaller reporting company,” and “emerging growth company” in Rule 12b-2 of the Exchange Act.
| Large accelerated filer | ☐ | Accelerated filer | ☐ | ||||||||||||||
| Non-accelerated filer | ☒ | Smaller reporting company | ☐ | ||||||||||||||
| Emerging growth company | ☐ | ||||||||||||||||
If an emerging growth company, indicate by check mark if the registrant has elected not to use the extended transition period for complying with any new or revised financial accounting standards provided pursuant to Section 13(a) of the Exchange Act. ☐
Indicate by check mark whether the registrant is a shell company (as defined in Rule 12b-2 of the Exchange Act). Yes ☐ No ☒
As of May 13, 2022, the issuer had the following shares outstanding: 1,522,783,259 shares of Class S common stock, 2,475,212,606 shares of Class I common stock, 72,033,216 shares of Class T common stock, and 378,459,720 shares of Class D common stock.
TABLE OF CONTENTS
| PART I. | ||||||||
| ITEM 1. | ||||||||
| ITEM 2. | ||||||||
| ITEM 3. | ||||||||
| ITEM 4. | ||||||||
| PART II. | ||||||||
| ITEM 1. | ||||||||
| ITEM 1A. | ||||||||
| ITEM 2. | ||||||||
| ITEM 3. | ||||||||
| ITEM 4. | ||||||||
| ITEM 5. | ||||||||
| ITEM 6. | ||||||||
PART I. FINANCIAL INFORMATION
ITEM 1. FINANCIAL STATEMENTS
Blackstone Real Estate Income Trust, Inc. Condensed Consolidated Balance Sheets (Unaudited) (in thousands, except per share data) | ||
| March 31, 2022 | December 31, 2021 | ||||||||||
| Assets | |||||||||||
| Investments in real estate, net | $ | 68,803,749 | $ | 66,941,653 | |||||||
Investments in unconsolidated entities (includes $2,340,473 and $1,613,646 at fair value as of March 31, 2022 and December 31, 2021, respectively) | 6,126,887 | 5,501,305 | |||||||||
| Investments in real estate debt | 9,888,596 | 8,995,939 | |||||||||
| Cash and cash equivalents | 3,824,779 | 989,674 | |||||||||
| Restricted cash | 2,779,440 | 2,428,907 | |||||||||
| Other assets | 6,899,249 | 6,450,733 | |||||||||
| Total assets | $ | 98,322,700 | $ | 91,308,211 | |||||||
| Liabilities and Equity | |||||||||||
| Mortgage notes, term loans, and secured revolving credit facilities, net | $ | 41,395,221 | $ | 41,327,388 | |||||||
| Secured financings of investments in real estate debt | 4,558,781 | 4,706,632 | |||||||||
| Due to affiliates | 1,951,472 | 1,309,447 | |||||||||
| Other liabilities | 4,687,576 | 4,184,148 | |||||||||
| Total liabilities | 52,593,050 | 51,527,615 | |||||||||
| Commitments and contingencies | — | — | |||||||||
| Redeemable non-controlling interests | 219,572 | 750,670 | |||||||||
| Equity | |||||||||||
Common stock — Class S shares, $0.01 par value per share, 3,000,000 shares authorized; 1,426,428 and 1,254,348 shares issued and outstanding as of March 31, 2022 and December 31, 2021, respectively | 14,264 | 12,543 | |||||||||
Common stock — Class I shares, $0.01 par value per share, 6,000,000 shares authorized; 2,350,144 and 2,086,631 shares issued and outstanding as of March 31, 2022 and December 31, 2021, respectively | 23,493 | 20,865 | |||||||||
Common stock — Class T shares, $0.01 par value per share, 500,000 shares authorized; 65,057 and 57,287 shares issued and outstanding as of March 31, 2022 and December 31, 2021, respectively | 651 | 573 | |||||||||
Common stock — Class D shares, $0.01 par value per share, 500,000 shares authorized; 339,949 and 291,087 shares issued and outstanding as of March 31, 2022 and December 31, 2021, respectively | 3,399 | 2,911 | |||||||||
| Additional paid-in capital | 48,981,309 | 42,249,094 | |||||||||
| Accumulated other comprehensive loss | (32,161) | (9,569) | |||||||||
| Accumulated deficit and cumulative distributions | (6,300,159) | (5,631,014) | |||||||||
| Total stockholders’ equity | 42,690,796 | 36,645,403 | |||||||||
| Non-controlling interests attributable to third party joint ventures | 1,680,507 | 1,744,256 | |||||||||
| Non-controlling interests attributable to BREIT OP unitholders | 1,138,775 | 640,267 | |||||||||
| Total equity | 45,510,078 | 39,029,926 | |||||||||
| Total liabilities and equity | $ | 98,322,700 | $ | 91,308,211 | |||||||
See accompanying notes to condensed consolidated financial statements.
1
Blackstone Real Estate Income Trust, Inc. Condensed Consolidated Statements of Operations (Unaudited) (in thousands, except per share data) | ||
| Three Months Ended March 31, | |||||||||||
| 2022 | 2021 | ||||||||||
| Revenues | |||||||||||
| Rental revenue | $ | 1,303,720 | $ | 652,916 | |||||||
| Hospitality revenue | 147,245 | 58,143 | |||||||||
| Other revenue | 68,100 | 22,396 | |||||||||
| Total revenues | 1,519,065 | 733,455 | |||||||||
| Expenses | |||||||||||
| Rental property operating | 566,987 | 237,705 | |||||||||
| Hospitality operating | 103,463 | 55,680 | |||||||||
| General and administrative | 13,106 | 6,960 | |||||||||
| Management fee | 189,150 | 73,095 | |||||||||
| Performance participation allocation | 411,569 | 143,215 | |||||||||
| Depreciation and amortization | 915,051 | 400,387 | |||||||||
| Total expenses | 2,199,326 | 917,042 | |||||||||
| Other income (expense) | |||||||||||
| Income from unconsolidated entities | 184,225 | 34,682 | |||||||||
| (Loss) income from investments in real estate debt | (34,044) | 239,361 | |||||||||
| Net gain on dispositions of real estate | 205,262 | 15,430 | |||||||||
| Interest expense | (306,459) | (181,532) | |||||||||
| Gain (loss) on extinguishment of debt | 1,395 | (3,416) | |||||||||
| Other income | 533,303 | 107,946 | |||||||||
| Total other income | 583,682 | 212,471 | |||||||||
| Net (loss) income | $ | (96,579) | $ | 28,884 | |||||||
| Net loss (income) attributable to non-controlling interests in third party joint ventures | $ | 44,255 | $ | (59) | |||||||
| Net loss (income) attributable to non-controlling interests in BREIT OP | 656 | (353) | |||||||||
| Net (loss) income attributable to BREIT stockholders | $ | (51,668) | $ | 28,472 | |||||||
| Net (loss) income per share of common stock — basic and diluted | $ | (0.01) | $ | 0.01 | |||||||
| Weighted-average shares of common stock outstanding, basic and diluted | 4,001,087 | 1,938,486 | |||||||||
See accompanying notes to condensed consolidated financial statements.
2
Blackstone Real Estate Income Trust, Inc. Condensed Consolidated Statements of Comprehensive Income (Loss) (Unaudited) (in thousands) | ||
| Three Months Ended March 31, | ||||||||||||||
| 2022 | 2021 | |||||||||||||
| Net (loss) income | $ | (96,579) | $ | 28,884 | ||||||||||
| Other comprehensive (loss) income: | ||||||||||||||
| Foreign currency translation losses, net | (6,592) | — | ||||||||||||
| Unrealized loss on derivatives from unconsolidated entities | (16,000) | — | ||||||||||||
| Other comprehensive (loss) income | (22,592) | — | ||||||||||||
| Comprehensive (loss) income | (119,171) | 28,884 | ||||||||||||
| Comprehensive loss (income) attributable to non-controlling interests in third party joint ventures | 44,255 | (59) | ||||||||||||
| Comprehensive loss (income) attributable to non-controlling interests in BREIT OP | 656 | (353) | ||||||||||||
| Comprehensive (loss) income attributable to BREIT stockholders | $ | (74,260) | $ | 28,472 | ||||||||||
See accompanying notes to condensed consolidated financial statements.
3
Blackstone Real Estate Income Trust, Inc. Condensed Consolidated Statements of Changes in Equity (Unaudited) (in thousands, except per share data) | ||
| Par Value | Accumulated Other Comprehensive Loss | Accumulated Deficit and Cumulative Distributions | Non- controlling Interests Attributable to Third Party Joint Ventures | Non- controlling Interests Attributable to BREIT OP Unitholders | |||||||||||||||||||||||||||||||||||||||||||||||||||||||||||||
| Common Stock Class S | Common Stock Class I | Common Stock Class T | Common Stock Class D | Additional Paid-in Capital | Total Stockholders’ Equity | Total Equity | |||||||||||||||||||||||||||||||||||||||||||||||||||||||||||
| Balance at December 31, 2021 | $ | 12,543 | $ | 20,865 | $ | 573 | $ | 2,911 | $ | 42,249,094 | $ | (9,569) | $ | (5,631,014) | $ | 36,645,403 | $ | 1,744,256 | $ | 640,267 | $ | 39,029,926 | |||||||||||||||||||||||||||||||||||||||||||
| Common stock issued | 1,699 | 3,279 | 78 | 479 | 8,000,740 | — | — | 8,006,275 | — | — | 8,006,275 | ||||||||||||||||||||||||||||||||||||||||||||||||||||||
| Offering costs | — | — | — | — | (285,297) | — | — | (285,297) | — | — | (285,297) | ||||||||||||||||||||||||||||||||||||||||||||||||||||||
| Distribution reinvestment | 74 | 116 | 4 | 18 | 307,088 | — | — | 307,300 | — | — | 307,300 | ||||||||||||||||||||||||||||||||||||||||||||||||||||||
| Common stock/units repurchased | (52) | (807) | (4) | (9) | (1,254,562) | — | — | (1,255,434) | — | (8,172) | (1,263,606) | ||||||||||||||||||||||||||||||||||||||||||||||||||||||
| Amortization of compensation awards | — | 40 | — | — | 3,977 | — | — | 4,017 | — | 5,768 | 9,785 | ||||||||||||||||||||||||||||||||||||||||||||||||||||||
Net loss ($1,195 allocated to redeemable non‑controlling interests) | — | — | — | — | — | — | (51,668) | (51,668) | (39,947) | (3,769) | (95,384) | ||||||||||||||||||||||||||||||||||||||||||||||||||||||
| Other comprehensive loss | — | — | — | — | — | (22,592) | — | (22,592) | — | — | (22,592) | ||||||||||||||||||||||||||||||||||||||||||||||||||||||
Distributions declared on common stock ($0.1662 gross per share) | — | — | — | — | — | — | (617,477) | (617,477) | — | — | (617,477) | ||||||||||||||||||||||||||||||||||||||||||||||||||||||
| Contributions from non-controlling interests | — | — | — | — | — | — | — | — | 836 | 520,160 | 520,996 | ||||||||||||||||||||||||||||||||||||||||||||||||||||||
| Distributions to and redemptions of non-controlling interests | — | — | — | — | (4,029) | — | — | (4,029) | (24,638) | (15,479) | (44,146) | ||||||||||||||||||||||||||||||||||||||||||||||||||||||
| Allocation to redeemable non-controlling interests | — | — | — | — | (35,702) | — | — | (35,702) | — | — | (35,702) | ||||||||||||||||||||||||||||||||||||||||||||||||||||||
| Balance at March 31, 2022 | $ | 14,264 | $ | 23,493 | $ | 651 | $ | 3,399 | $ | 48,981,309 | $ | (32,161) | $ | (6,300,159) | $ | 42,690,796 | $ | 1,680,507 | $ | 1,138,775 | $ | 45,510,078 | |||||||||||||||||||||||||||||||||||||||||||
| Par Value | Accumulated Other Comprehensive Loss | Accumulated Deficit and Cumulative Distributions | Non- controlling Interests Attributable to Third Party Joint Ventures | Non- controlling Interests Attributable to BREIT OP Unitholders | |||||||||||||||||||||||||||||||||||||||||||||||||||||||||||||
| Common Stock Class S | Common Stock Class I | Common Stock Class T | Common Stock Class D | Additional Paid-in Capital | Total Stockholders’ Equity | Total Equity | |||||||||||||||||||||||||||||||||||||||||||||||||||||||||||
| Balance at December 31, 2020 | $ | 7,029 | $ | 9,270 | $ | 459 | $ | 1,241 | $ | 19,059,045 | $ | — | $ | (3,224,318) | $ | 15,852,726 | $ | 143,253 | $ | 187,972 | $ | 16,183,951 | |||||||||||||||||||||||||||||||||||||||||||
| Common stock issued | 817 | 1,452 | 14 | 227 | 2,915,914 | — | — | 2,918,424 | — | — | 2,918,424 | ||||||||||||||||||||||||||||||||||||||||||||||||||||||
| Offering costs | — | — | — | — | (107,294) | — | — | (107,294) | — | — | (107,294) | ||||||||||||||||||||||||||||||||||||||||||||||||||||||
| Distribution reinvestment | 57 | 58 | 3 | 10 | 150,046 | — | — | 150,174 | — | — | 150,174 | ||||||||||||||||||||||||||||||||||||||||||||||||||||||
| Common stock/units repurchased | (68) | (354) | (5) | (8) | (507,896) | — | — | (508,331) | (129) | (1,290) | (509,750) | ||||||||||||||||||||||||||||||||||||||||||||||||||||||
| Amortization of compensation awards | — | 1 | — | — | 120 | — | — | 121 | — | 1,177 | 1,298 | ||||||||||||||||||||||||||||||||||||||||||||||||||||||
Net income ($343 loss allocated to redeemable non‑controlling interests) | — | — | — | — | — | — | 28,472 | 28,472 | 402 | 353 | 29,227 | ||||||||||||||||||||||||||||||||||||||||||||||||||||||
Distributions declared on common stock ($0.1600 gross per share) | — | — | — | — | — | — | (289,405) | (289,405) | — | — | (289,405) | ||||||||||||||||||||||||||||||||||||||||||||||||||||||
| Contributions from non-controlling interests | — | — | — | — | — | — | — | — | 2,229 | 70,316 | 72,545 | ||||||||||||||||||||||||||||||||||||||||||||||||||||||
| Distributions to and redemptions of non-controlling interests | — | — | — | — | — | — | — | — | (2,823) | (4,456) | (7,279) | ||||||||||||||||||||||||||||||||||||||||||||||||||||||
| Allocation to redeemable non-controlling interests | — | — | — | — | (2,775) | — | — | (2,775) | — | — | (2,775) | ||||||||||||||||||||||||||||||||||||||||||||||||||||||
| Balance at March 31, 2021 | $ | 7,835 | $ | 10,427 | $ | 471 | $ | 1,470 | $ | 21,507,160 | $ | — | $ | (3,485,251) | $ | 18,042,112 | $ | 142,932 | $ | 254,072 | $ | 18,439,116 | |||||||||||||||||||||||||||||||||||||||||||
See accompanying notes to condensed consolidated financial statements.
4
Blackstone Real Estate Income Trust, Inc. Condensed Consolidated Statements of Cash Flows (Unaudited) (in thousands) | ||
| Three Months Ended March 31, | |||||||||||
| 2022 | 2021 | ||||||||||
| Cash flows from operating activities: | |||||||||||
| Net (loss) income | $ | (96,579) | $ | 28,884 | |||||||
| Adjustments to reconcile net (loss) income to net cash provided by operating activities: | |||||||||||
| Management fee | 189,150 | 73,095 | |||||||||
| Performance participation allocation | 411,569 | 143,215 | |||||||||
| Depreciation and amortization | 915,051 | 400,387 | |||||||||
| Net gain on dispositions of real estate | (205,262) | (15,430) | |||||||||
| (Gain) loss on extinguishment of debt | (1,395) | 3,416 | |||||||||
| Unrealized gain on changes in fair value of financial instruments | (175,457) | (316,617) | |||||||||
| Realized (gain) loss on sale of real estate-related equity securities | (240,694) | 20,363 | |||||||||
| Income from unconsolidated entities | (184,225) | (34,682) | |||||||||
| Distributions of earnings from unconsolidated entities | 69,570 | 15,101 | |||||||||
| Other items | 17,000 | (5,945) | |||||||||
| Change in assets and liabilities: | |||||||||||
| Increase in other assets | (79,263) | (20,726) | |||||||||
| Increase in due to affiliates | 3,281 | 4,804 | |||||||||
| Increase (decrease) in other liabilities | 77 | (4,229) | |||||||||
| Net cash provided by operating activities | 622,823 | 291,636 | |||||||||
| Cash flows from investing activities: | |||||||||||
| Acquisitions of real estate | (2,221,780) | (362,345) | |||||||||
| Capital improvements to real estate | (196,224) | (61,713) | |||||||||
| Proceeds from disposition of real estate | 571,225 | 73,922 | |||||||||
| Refunds, (pre-acquisition costs/deposits) | 37,692 | (6,322) | |||||||||
| Investment in unconsolidated entities | (551,580) | (364,758) | |||||||||
| Return of capital from unconsolidated entities | 15,954 | — | |||||||||
| Purchase of investments in real estate debt | (1,483,788) | (300,888) | |||||||||
| Proceeds from sale/repayment of investments in real estate debt | 452,950 | 126,388 | |||||||||
| Purchase of real estate-related equity securities | (1,045,329) | (336,845) | |||||||||
| Proceeds from sale of real estate-related equity securities | 967,347 | — | |||||||||
| Net cash used in investing activities | (3,453,533) | (1,232,561) | |||||||||
| Cash flows from financing activities: | |||||||||||
| Proceeds from issuance of common stock | 5,952,091 | 2,327,903 | |||||||||
| Offering costs paid | (72,157) | (30,430) | |||||||||
| Subscriptions received in advance | 1,843,583 | 1,230,294 | |||||||||
| Repurchase of common stock | (965,715) | (323,611) | |||||||||
| Repurchase of management fee shares | — | (124,335) | |||||||||
| Borrowings under mortgage notes, term loans, and secured revolving credit facilities | 2,442,063 | 614,085 | |||||||||
| Repayments of mortgage notes, term loans, and secured revolving credit facilities | (2,699,283) | (957,247) | |||||||||
| Borrowings under secured financings of investments in real estate debt | 541,821 | — | |||||||||
| Repayments of secured financings of investments in real estate debt | (674,264) | (635,805) | |||||||||
| Borrowings under affiliate unsecured revolving credit facility | — | 60,000 | |||||||||
| Repayments of affiliate unsecured revolving credit facility | — | (60,000) | |||||||||
| Payment of deferred financing costs | (26,514) | (13,640) | |||||||||
| Redemption of redeemable non-controlling interest | (26,639) | (111,949) | |||||||||
| Redemption of affiliate service provider incentive compensation awards | — | (923) | |||||||||
| Contributions from non-controlling interests | 30,644 | 825 | |||||||||
| Distributions to and redemptions of non-controlling interests | (47,060) | (6,623) | |||||||||
| Distributions | (280,278) | (127,578) | |||||||||
| Net cash provided by financing activities | 6,018,292 | 1,840,966 | |||||||||
| Net change in cash and cash equivalents and restricted cash | 3,187,582 | 900,041 | |||||||||
| Cash and cash equivalents and restricted cash, beginning of year | 3,418,581 | 1,044,523 | |||||||||
| Effects of currency translation on cash, cash equivalents and restricted cash | (1,944) | — | |||||||||
| Cash and cash equivalents and restricted cash, end of year | $ | 6,604,219 | $ | 1,944,564 | |||||||
| Reconciliation of cash and cash equivalents and restricted cash to the consolidated balance sheets: | |||||||||||
| Cash and cash equivalents | $ | 3,824,779 | $ | 574,130 | |||||||
| Restricted cash | 2,779,440 | 1,370,434 | |||||||||
| Total cash and cash equivalents and restricted cash | $ | 6,604,219 | $ | 1,944,564 | |||||||
5
| Non-cash investing and financing activities: | |||||||||||
| Assumption of mortgage notes in conjunction with acquisitions of real estate | $ | 235,772 | $ | — | |||||||
| Assumption of other liabilities in conjunction with acquisitions of real estate | $ | 32,676 | $ | 2,945 | |||||||
| Issuance of BREIT OP units as consideration for acquisitions of real estate | $ | 79,577 | $ | — | |||||||
| Assumption of other liabilities in conjunction with acquisitions of investments in unconsolidated entities | $ | — | $ | 9,249 | |||||||
| Accrued pre-acquisition costs | $ | 15 | $ | — | |||||||
| Accrued capital expenditures and acquisition related costs | $ | 6,326 | $ | 7,009 | |||||||
| Accrued distributions | $ | 31,865 | $ | 11,914 | |||||||
| Accrued stockholder servicing fee due to affiliate | $ | 217,595 | $ | 78,094 | |||||||
| Redeemable non-controlling interest issued as settlement of performance participation allocation | $ | 67,233 | $ | 192,648 | |||||||
| Exchange of redeemable non-controlling interest for Class I shares | $ | 128,205 | $ | 12,246 | |||||||
| Exchange of redeemable non-controlling interest for Class I or Class B units | $ | 434,717 | $ | 68,453 | |||||||
| Allocation to redeemable non-controlling interest | $ | 35,702 | $ | 2,775 | |||||||
| Distribution reinvestment | $ | 307,300 | $ | 150,174 | |||||||
| Accrued common stock repurchases | $ | 393,509 | $ | 87,350 | |||||||
| Accrued common stock repurchases due to affiliate | $ | — | $ | 27,387 | |||||||
| Payable for unsettled investments in real estate debt | $ | 78,115 | $ | 22,974 | |||||||
See accompanying notes to condensed consolidated financial statements.
6
Blackstone Real Estate Income Trust, Inc.
Notes to Condensed Consolidated Financial Statements
(Unaudited)
1. Organization and Business Purpose
Blackstone Real Estate Income Trust, Inc. (“BREIT” or the “Company”) invests primarily in stabilized income-generating commercial real estate in the United States. To a lesser extent, the Company invests outside the U.S. and in real estate debt. The Company is the sole general partner and majority limited partner of BREIT Operating Partnership, L.P., a Delaware limited partnership (“BREIT OP”). BREIT Special Limited Partner L.P. (the “Special Limited Partner”), a wholly-owned subsidiary of Blackstone Inc. (together with its affiliates, “Blackstone”), owns a special limited partner interest in BREIT OP. Substantially all of the Company’s business is conducted through BREIT OP. The Company and BREIT OP are externally managed by BX REIT Advisors L.L.C. (the “Adviser”). The Adviser is part of the real estate group of Blackstone, a leading global investment manager. The Company was formed on November 16, 2015 as a Maryland corporation and qualifies as a real estate investment trust (“REIT”) for U.S. federal income tax purposes.
The Company registered an offering with the Securities and Exchange Commission (the “SEC”) of up to $60.0 billion in shares of common stock, consisting of up to $48.0 billion in shares in its primary offering and up to $12.0 billion in shares pursuant to its distribution reinvestment plan, which the Company began using to offer shares of its common stock in March 2022 (the “Current Offering”). As of March 31, 2022, the Company had received aggregate net proceeds of $53.3 billion from selling shares of the Company’s common stock through the Current Offering, prior offerings registered with the SEC, and in unregistered sales. The Company intends to sell any combination of four classes of shares of its common stock, with a dollar value up to the maximum aggregate amount of the Current Offering. The share classes have different upfront selling commissions, dealer manager fees and ongoing stockholder servicing fees. The Company intends to continue selling shares on a monthly basis.
As of March 31, 2022, the Company owned 3,097 properties and 23,724 single family rental homes. The Company currently operates in nine reportable segments: Residential, Industrial, Net Lease, Data Centers, Hospitality, Self Storage, Retail, and Office properties, and Investments in Real Estate Debt. Residential includes multifamily and other types of rental housing such as manufactured, student, affordable and single family rental housing, as well as senior living. Net Lease includes the real estate assets of The Bellagio Las Vegas (the “Bellagio”) and the unconsolidated interest in the MGM Grand and Mandalay Bay joint venture. Any additional unconsolidated interests are included in the respective property segment as further described in Note 4 — Investments in Unconsolidated Entities. Financial results by segment are reported in Note 15 — Segment Reporting.
2. Summary of Significant Accounting Policies
Basis of Presentation
The accompanying unaudited condensed consolidated financial statements have been prepared in accordance with accounting principles generally accepted in the United States of America (“GAAP”) for interim financial information and the instructions to Form 10-Q and Rule 10-01 of Regulation S-X. The condensed consolidated financial statements, including the condensed notes thereto, are unaudited and exclude some of the disclosures required in audited financial statements. Management believes it has made all necessary adjustments, consisting of only normal recurring items, so that the condensed consolidated financial statements are presented fairly and that estimates made in preparing the Company’s condensed consolidated financial statements are reasonable and prudent. The accompanying unaudited condensed consolidated interim financial statements should be read in conjunction with the audited consolidated financial statements included in the Company’s Annual Report on Form 10-K for the fiscal year ended December 31, 2021 filed with the SEC.
The accompanying condensed consolidated financial statements include the accounts of the Company, the Company’s subsidiaries, and joint ventures in which the Company has a controlling interest. All intercompany balances and transactions have been eliminated in consolidation.
Principles of Consolidation
The Company consolidates all entities in which it has a controlling financial interest through majority ownership or voting rights and variable interest entities whereby the Company is the primary beneficiary. In determining whether the Company has a controlling financial interest in a partially owned entity and the requirement to consolidate the accounts of that entity, the Company considers whether the entity is a variable interest entity (“VIE”) and whether it is the primary beneficiary. The Company is the primary beneficiary of a VIE when it has (i) the power to direct the most significant activities impacting the economic performance of the VIE and (ii) the obligation to absorb losses or receive benefits significant to the VIE. Entities that do not qualify as VIEs are generally considered voting interest entities (“VOEs”) and are evaluated for consolidation under the voting interest model.
7
VOEs are consolidated when the Company controls the entity through a majority voting interest or other means. When the requirements for consolidation are not met and the Company has significant influence over the operations of the entity, the investment is accounted for under the equity method of accounting. Equity method investments for which the Company has not elected a fair value option are initially recorded at cost and subsequently adjusted for the Company’s pro-rata share of net income, contributions and distributions. When the Company elects the fair value option (“FVO”), the Company records its share of net asset value of the entity and any related unrealized gains and losses.
BREIT OP and each of the Company’s joint ventures are considered to be a VIE or VOE. The Company consolidates these entities, excluding certain equity method investments, because it has the ability to direct the most significant activities of the entities such as purchases, dispositions, financings, budgets, and overall operating plans.
For consolidated joint ventures, the non-controlling partner’s share of the assets, liabilities, and operations of each joint venture is included in non-controlling interests as equity of the Company. The non-controlling partner’s interest is generally computed as the joint venture partner’s ownership percentage. Certain of the joint ventures formed by the Company provide the other partner a profits interest based on certain internal rate of return hurdles being achieved. Any profits interest due to the other partner is reported within non-controlling interests.
As of March 31, 2022, the total assets and liabilities of the Company’s consolidated VIEs, excluding BREIT OP, were $30.2 billion and $18.6 billion, respectively, compared to $28.7 billion and $17.6 billion as of December 31, 2021. Such amounts are included on the Company’s Condensed Consolidated Balance Sheets.
Certain of the Company’s joint ventures are accounted for under the equity method of accounting as the requirements for consolidation are not met. The Company has elected the FVO for certain of its equity method investments while the remaining investments are presented at historical cost. Refer to Note 4 — Investments in Unconsolidated Entities for additional details on the Company’s investments in unconsolidated entities.
Use of Estimates
The preparation of the financial statements in conformity with GAAP requires management to make estimates and assumptions that affect the reported amounts of assets and liabilities and disclosures of contingent assets and liabilities as of the balance sheet date. As the novel coronavirus (“COVID-19”) pandemic has evolved from its emergence in early 2020, so has its global impact. Many countries have re-instituted, or strongly encouraged, varying levels of quarantines and restrictions on travel and in some cases have at times limited operations of certain businesses and taken other restrictive measures designed to help slow the spread of COVID-19 and its variants. Governments and businesses have also instituted vaccine mandates and testing requirements for employees. While vaccine availability and uptake has increased, the longer-term macro-economic effects on global supply chains, inflation, labor shortages and wage increases continue to impact many industries. Moreover, with the potential for new strains of COVID-19 to emerge, governments and businesses may re-impose aggressive measures to help slow its spread in the future. For this reason, among others, as the COVID-19 pandemic continues, the potential global impacts are uncertain and difficult to assess. The Company believes the estimates and assumptions underlying these condensed consolidated financial statements are reasonable and supportable based on the information available as of March 31, 2022, however uncertainty over the ultimate impact COVID-19 will have on the global economy generally, and the Company’s business in particular, makes any estimates and assumptions as of March 31, 2022 inherently less certain than they would be absent the current and potential impacts of COVID-19. Actual results may ultimately differ materially from those estimates.
Fair Value Measurements
Under normal market conditions, the fair value of an investment is the amount that would be received to sell an asset or transfer a liability in an orderly transaction between market participants at the measurement date (i.e., the exit price). The Company uses a hierarchical framework that prioritizes and ranks the level of market price observability used in measuring investments at fair value. Market price observability is impacted by a number of factors, including the type of investment and the characteristics specific to the investment, and the state of the marketplace, including the existence and transparency of transactions between market participants. Investments with readily available actively quoted prices or for which fair value can be measured from actively quoted prices generally will have a higher degree of market price observability and a lesser degree of judgment used in measuring fair value.
Investments measured and reported at fair value are classified and disclosed in one of the following levels within the fair value hierarchy:
Level 1 — quoted prices are available in active markets for identical investments as of the measurement date. The Company does not adjust the quoted price for these investments.
8
Level 2 — quoted prices are available in markets that are not active or model inputs are based on inputs that are either directly or indirectly observable as of the measurement date.
Level 3 — pricing inputs are unobservable and include instances where there is minimal, if any, market activity for the investment. These inputs require significant judgment or estimation by management or third parties when determining fair value and generally represent anything that does not meet the criteria of Levels 1 and 2. Due to the inherent uncertainty of these estimates, these values may differ materially from the values that would have been used had a ready market for these investments existed.
Valuation of assets and liabilities measured at fair value
The Company’s investments in real estate debt are reported at fair value. As of March 31, 2022 and December 31, 2021, the Company’s investments in real estate debt, directly or indirectly, consisted of commercial mortgage-backed securities (“CMBS”) and residential mortgage-backed securities (“RMBS”), which are securities backed by one or more mortgage loans secured by real estate assets, as well as corporate bonds, term loans, mezzanine loans, and other investments in debt issued by real estate-related companies or secured by real estate assets. The Company generally determines the fair value of its investments in real estate debt by utilizing third-party pricing service providers whenever available.
In determining the fair value of a particular investment, pricing service providers may use broker-dealer quotations, reported trades or valuation estimates from their internal pricing models to determine the reported price. The pricing service providers’ internal models for securities such as real estate debt generally consider the attributes applicable to a particular class of the security (e.g., credit rating, seniority), current market data, and estimated cash flows for each security, and incorporate specific collateral performance, as applicable.
Certain of the Company’s investments in real estate debt, such as mezzanine loans and other investments, are unlikely to have readily available market quotations. In such cases, the Company will generally determine the initial value based on the acquisition price of such investment if acquired by the Company or the par value of such investment if originated by the Company. Following the initial measurement, the Company will determine fair value by utilizing or reviewing certain of the following (i) market yield data, (ii) discounted cash flow modeling, (iii) collateral asset performance, (iv) local or macro real estate performance, (v) capital market conditions, (vi) debt yield or loan-to-value ratios, and (vii) borrower financial condition and performance. Refer to Note 5 for additional details on the Company’s investments in real estate debt.
The Company’s investments in equity securities of public and private real estate-related companies are reported at fair value. In determining the fair value of public equity securities, the Company utilizes the closing price of such securities in the principal market in which the security trades (Level 1 inputs). The Company’s investment in a preferred equity security is reflected at its fair value as of March 31, 2022 (Level 2 inputs). In determining the fair value, the Company utilizes inputs such as stock volatility, discount rate, and risk-free interest rate. The Company’s investment in a private real estate company is reflected at its fair value as of March 31, 2022 (Level 3 inputs). To determine the fair value, the Company utilizes inputs such as the multiples of comparable companies and select financial statement metrics. The Company’s equity securities are recorded as a component of Other Assets on the Company’s Condensed Consolidated Balance Sheets.
The resulting unrealized gains and losses from public and private real estate-related companies are recorded as a component of Other Income (Expense) on the Company’s Condensed Consolidated Statements of Operations. During the three months ended March 31, 2022, the Company recognized $334.7 million of unrealized losses, which includes the realization of $209.3 million of unrealized gains recognized in prior periods on its investments in equity securities. During the three months ended March 31, 2021, the Company recognized $82.3 million of unrealized gains on its investments in equity securities.
The Company has elected the FVO for eight of its equity method investments and therefore, reports these investments at fair value. The Company separately values the assets and liabilities of the equity method investments. To determine the fair value of the real estate assets of the equity method investments, the Company utilizes a discounted cash flow methodology, taking into consideration various factors including discount rate and exit capitalization rate. The Company determines the fair value of the indebtedness of the equity method investment by modeling the cash flows required by the debt agreements and discounting them back to the present value using an estimated market yield. Additionally, the Company considers current market rates and conditions by evaluating similar borrowing agreements with comparable loan-to-value ratios and credit profiles. After the fair value of the assets and liabilities are determined, the Company applies its ownership interest to the net asset value and reflects this amount as its equity method investment at fair value. The inputs used in determining the Company’s equity method investments carried at fair value are considered Level 3.
The Company’s derivative financial instruments are reported at fair value and consist of foreign currency and interest rate contracts. The fair values of the Company’s foreign currency and interest rate contracts were estimated using a third-party derivative specialist, based on contractual cash flows and observable inputs comprising yield curves, foreign currency rates and credit spreads (Level 2 inputs).
9
The following table details the Company’s assets and liabilities measured at fair value on a recurring basis ($ in thousands):
| March 31, 2022 | December 31, 2021 | ||||||||||||||||||||||||||||||||||||||||||||||
| Level 1 | Level 2 | Level 3 | Total | Level 1 | Level 2 | Level 3 | Total | ||||||||||||||||||||||||||||||||||||||||
| Assets: | |||||||||||||||||||||||||||||||||||||||||||||||
| Investments in real estate debt | $ | — | $ | 8,655,731 | $ | 1,232,865 | $ | 9,888,596 | $ | — | $ | 7,755,602 | $ | 1,240,337 | $ | 8,995,939 | |||||||||||||||||||||||||||||||
| Equity securities | 2,535,019 | 439,871 | 242,836 | 3,217,726 | 2,558,952 | 442,300 | 224,408 | 3,225,660 | |||||||||||||||||||||||||||||||||||||||
| Investments in unconsolidated entities | — | — | 2,340,473 | 2,340,473 | — | — | 1,613,646 | 1,613,646 | |||||||||||||||||||||||||||||||||||||||
| Derivatives | — | 839,707 | — | 839,707 | — | 41,453 | — | 41,453 | |||||||||||||||||||||||||||||||||||||||
| Total | $ | 2,535,019 | $ | 9,935,309 | $ | 3,816,174 | $ | 16,286,502 | $ | 2,558,952 | $ | 8,239,355 | $ | 3,078,391 | $ | 13,876,698 | |||||||||||||||||||||||||||||||
| Liabilities: | |||||||||||||||||||||||||||||||||||||||||||||||
| Derivatives | $ | — | $ | 99,859 | $ | — | $ | 99,859 | $ | — | $ | 45,597 | $ | — | $ | 45,597 | |||||||||||||||||||||||||||||||
| Total | $ | — | $ | 99,859 | $ | — | $ | 99,859 | $ | — | $ | 45,597 | $ | — | $ | 45,597 | |||||||||||||||||||||||||||||||
The following table details the Company’s assets measured at fair value on a recurring basis using Level 3 inputs ($ in thousands):
| Investments in Real Estate Debt | Equity Securities | Investments in Unconsolidated Entities | Total | ||||||||||||||||||||
| Balance as of December 31, 2021 | $ | 1,240,337 | $ | 224,408 | $ | 1,613,646 | $ | 3,078,391 | |||||||||||||||
| Purchases | 1,233 | — | 528,862 | 530,095 | |||||||||||||||||||
| Sales and repayments | (3,430) | — | — | (3,430) | |||||||||||||||||||
| Distributions received | — | — | (8,894) | (8,894) | |||||||||||||||||||
| Included in net income | |||||||||||||||||||||||
| Income from unconsolidated entities measured at fair value | — | — | 206,859 | 206,859 | |||||||||||||||||||
| Realized gain included in income (loss) from investments in real estate debt | 437 | — | — | 437 | |||||||||||||||||||
| Unrealized loss included in income (loss) from investments in real estate debt | (5,712) | — | — | (5,712) | |||||||||||||||||||
| Unrealized gain included in other income (expense) | — | 18,428 | — | 18,428 | |||||||||||||||||||
| Balance as of March 31, 2022 | $ | 1,232,865 | $ | 242,836 | $ | 2,340,473 | $ | 3,816,174 | |||||||||||||||
The following tables contain the quantitative inputs and assumptions used for items categorized in Level 3 of the fair value hierarchy ($ in thousands):
| March 31, 2022 | |||||||||||||||||||||||||||||
| Fair Value | Valuation Technique | Unobservable Inputs | Weighted Average | Impact to Valuation from an Increase in Input | |||||||||||||||||||||||||
| Investments in real estate debt | $ | 1,232,865 | Discounted cash flow | Market Yield | 5.2% | Decrease | |||||||||||||||||||||||
| Investments in unconsolidated entities | $ | 1,803,051 | Discounted cash flow | Discount Rate | 6.2% | Decrease | |||||||||||||||||||||||
| Exit Capitalization Rate | 5.0% | Decrease | |||||||||||||||||||||||||||
| Weighted Average Cost of Capital | 7.1% | Decrease | |||||||||||||||||||||||||||
| $ | 537,422 | Market comparable | LTM EBITDA Multiple | 14.4x | Increase | ||||||||||||||||||||||||
| Equity securities | $ | 242,836 | Market comparable | Enterprise Value/ Forward EBITDA Multiple | 21.1x | Increase | |||||||||||||||||||||||
| December 31, 2021 | |||||||||||||||||||||||||||||
| Fair Value | Valuation Technique | Unobservable Input | Rate | Impact to Valuation from an Increase in Input | |||||||||||||||||||||||||
| Investments in real estate debt | $ | 1,240,337 | Discounted cash flow | Market Yield | 5.2% | Decrease | |||||||||||||||||||||||
| Investments in unconsolidated entities | $ | 1,613,646 | Discounted cash flow | Discount Rate | 5.9% | Decrease | |||||||||||||||||||||||
| Exit Capitalization Rate | 4.6% | Decrease | |||||||||||||||||||||||||||
| Weighted Average Cost of Capital | 9.1% | Decrease | |||||||||||||||||||||||||||
| Equity securities | $ | 224,408 | Market comparable | Enterprise Value/ Forward EBITDA Multiple | 21.1x | Increase | |||||||||||||||||||||||
10
Valuation of assets measured at fair value on a nonrecurring basis
Certain of the Company’s assets are not measured at fair value on an ongoing basis but are subject to fair value adjustments, such as when there is evidence of impairment, and therefore such assets are measured at fair value on a nonrecurring basis. The Company reviews its real estate properties for impairment each quarter and when there is an event or change in circumstances that could indicate the carrying amount of the real estate value may not be recoverable.
Valuation of liabilities not measured at fair value
As of March 31, 2022, the fair value of the Company’s mortgage notes, term loans, and secured revolving credit facilities, secured financings on investments in real estate debt, and unsecured revolving credit facilities was $181.1 million below carrying value. As of December 31, 2021, the fair value of the Company’s mortgage notes, term loans, and secured revolving credit facilities, secured financings on investments in real estate debt, and unsecured revolving credit facilities was $108.6 million above carrying value. Fair value of the Company’s indebtedness is estimated by modeling the cash flows required by the Company’s debt agreements and discounting them back to the present value using an estimated market yield. Additionally, the Company considers current market rates and conditions by evaluating similar borrowing agreements with comparable loan-to-value ratios and credit profiles. The inputs used in determining the fair value of the Company’s indebtedness are considered Level 3.
Stock-Based Compensation
The Company’s stock-based compensation consists of incentive compensation awards issued to certain employees of affiliate portfolio company service providers and certain employees of Simply Self Storage and Home Partners of America (“HPA”), both of which are indirect, wholly-owned subsidiaries of BREIT. Such awards vest over the life of the awards and stock-based compensation expense is recognized for these awards on a straight-line basis over the applicable vesting period of each award, based on the value of the awards on their grant date, as adjusted for forfeitures. The awards are subject to service periods ranging from three to four years. The vesting conditions that are based on the Company achieving of certain returns over a stated hurdle amount are considered market conditions. The achievement of returns over the stated hurdle amounts, which affect the quantity of awards that vest, is considered a performance condition. If the Company determines it is probable that the performance conditions will be met, the value of the award will be amortized over the service periods, as adjusted for forfeitures. The number of awards expected to vest is evaluated each reporting period and compensation expense is recognized for those awards for which achievement of the performance criteria is considered probable. Refer to Note 9 for additional information on the awards issued to certain employees of the affiliate portfolio companies.
The following table details the incentive compensation awards issued to certain employees of Simply Self Storage and HPA ($ in thousands):
| March 31, 2022 | ||||||||||||||||||||||||||||||||
| Plan Year | Unrecognized Compensation Cost as of December 31, 2021 | Value of Awards Issued | Amortization of Compensation Cost for the Three Months Ended March 31, 2022 | Unrecognized Compensation Cost | Remaining Amortization Period | |||||||||||||||||||||||||||
| 2021 | $ | 3,425 | $ | — | $ | (520) | $ | 2,905 | 2.8 years | |||||||||||||||||||||||
| 2022 | — | 33,173 | (4,132) | 29,041 | 2.7 years | |||||||||||||||||||||||||||
| Total | $ | 3,425 | $ | 33,173 | $ | (4,652) | $ | 31,946 | ||||||||||||||||||||||||
Recent Accounting Pronouncements
In March 2020, the FASB issued Accounting Standards Update (“ASU”) 2020-04 “Reference Rate Reform (Topic 848): Facilitation of the Effects of Reference Rate Reform on Financial Reporting.” ASU 2020-04 provides optional expedients and exceptions to GAAP requirements for modifications on debt instruments, leases, derivatives, and other contracts, related to the expected market transition from LIBOR, and certain other floating rate benchmark indices (collectively, “IBORs”) to alternative reference rates. ASU 2020-04 generally considers contract modifications related to reference rate reform to be an event that does not require contract remeasurement at the modification date nor a reassessment of a previous accounting determination. In January 2021, the FASB issued ASU 2021-01 “Reference Rate Reform (Topic 848): Scope,” or ASU 2021-01. ASU 2021-01 clarifies that the practical expedients in ASU 2020-04 apply to derivatives impacted by changes in the interest rate used for margining, discounting, or contract price alignment. The guidance in ASU 2020-04 is optional and may be elected over time, through December 31, 2022, as reference rate reform activities occur. Once ASU 2020-04 is elected, the guidance must be applied prospectively for all eligible contract modifications. The Company has not adopted any of the optional expedients or exceptions as of March 31, 2022, but will continue to evaluate the possible adoption of any such expedients or exceptions during the effective period as circumstances evolve.
11
3. Investments in Real Estate
Investments in real estate, net consisted of the following ($ in thousands):
| March 31, 2022 | December 31, 2021 | ||||||||||
| Building and building improvements | $ | 55,849,587 | $ | 53,954,920 | |||||||
| Land and land improvements | 15,044,365 | 14,652,913 | |||||||||
| Furniture, fixtures and equipment | 1,097,968 | 963,686 | |||||||||
Right of use asset - operating leases(1) | 474,841 | 461,186 | |||||||||
Right of use asset - financing leases(1) | 72,862 | 72,862 | |||||||||
| Total | 72,539,623 | 70,105,567 | |||||||||
| Accumulated depreciation and amortization | (3,735,874) | (3,163,914) | |||||||||
| Investments in real estate, net | $ | 68,803,749 | $ | 66,941,653 | |||||||
(1)Refer to Note 14 for additional details on the Company’s leases.
Acquisitions
During the three months ended March 31, 2022, the Company acquired interests in nine real estate investments for $2.5 billion, including 16 residential properties, three office properties, 11 industrial properties, and two self storage properties.
The following table details the properties acquired during the year ended March 31, 2022 ($ in thousands):
| Segments | Purchase Price(1) | Number of Transactions | Number of Properties | Sq. Ft. (in thousands)/Units/Keys | ||||||||||||||||||||||
Residential properties(2) | $ | 1,662,228 | 4 | 16 | 3,731 units | |||||||||||||||||||||
| Office properties | 699,457 | 2 | 3 | 808 sq. ft. | ||||||||||||||||||||||
Industrial properties(3) | 152,897 | 1 | 11 | 1,280 sq. ft. | ||||||||||||||||||||||
| Self storage properties | 30,968 | 2 | 2 | 123 sq. ft. | ||||||||||||||||||||||
| $ | 2,545,550 | 9 | 32 | |||||||||||||||||||||||
(1)Purchase price is inclusive of acquisition-related costs.
(2)Purchase price includes 1,035 wholly-owned single family rental homes, that are not included in the number of properties.
(3)Purchase price includes three properties classified as held for sale as of March 31, 2022.
The following table details the purchase price allocation for the properties acquired during the three months ended March 31, 2022 ($ in thousands):
| Amount | |||||
| Building and building improvements | $ | 1,912,760 | |||
| Land and land improvements | 457,729 | ||||
| Furniture, fixtures and equipment | 62,397 | ||||
| In-place lease intangibles | 134,684 | ||||
| Above-market lease intangibles | 1,570 | ||||
| Below-market lease intangibles | (30,707) | ||||
| Other | 7,117 | ||||
| Total purchase price | 2,545,550 | ||||
Assumed debt(1) | 235,772 | ||||
| Net purchase price | $ | 2,309,778 | |||
(1)Refer to Note 6 for additional details on the Company’s debt, which includes mortgage notes, term loans, and secured revolving credit facilities.
The weighted-average amortization periods for the acquired in-place lease intangibles, above-market lease intangibles, and below-market lease intangibles of the properties acquired during the three months ended March 31, 2022 were six, six, and 14 years, respectively.
12
Dispositions
The following table details the dispositions during the periods set forth below ($ in thousands):
| Three Months Ended March 31, 2022 | Three Months Ended March 31, 2021 | |||||||||||||||||||||||||||||||||||||
| Segments | Number of Properties | Net Proceeds | Net Gain | Number of Properties | Net Proceeds | Net Gain | ||||||||||||||||||||||||||||||||
Residential properties(1) | 7 | $ | 445,419 | $ | 184,031 | 4 | $ | 73,922 | $ | 15,430 | ||||||||||||||||||||||||||||
| Industrial properties | 9 | 125,806 | 21,231 | — | — | — | ||||||||||||||||||||||||||||||||
| 16 | $ | 571,225 | $ | 205,262 | 4 | $ | 73,922 | $ | 15,430 | |||||||||||||||||||||||||||||
(1)Net proceeds and net gain include 123 single family rental homes sold during the three months ended March 31, 2022 that are not included in the number of properties.
Properties Held for Sale
As of March 31, 2022, one property in the Residential segment and three properties in the Industrial segment were classified as held for sale. The held for sale assets and liabilities are included as components of Other Assets and Other Liabilities, respectively, on the Company’s Condensed Consolidated Balance Sheets.
The following table details the assets and liabilities of the Company’s properties classified as held for sale ($ in thousands):
| Assets: | March 31, 2022 | ||||
| Investments in real estate, net | $ | 27,583 | |||
| Other assets | 368 | ||||
| Total assets | $ | 27,951 | |||
| Liabilities: | |||||
| Mortgage notes, net | $ | 20,844 | |||
| Other liabilities | 643 | ||||
| Total liabilities | $ | 21,487 | |||
Impairment
The Company reviews its real estate investments for impairment each quarter and when there is an event or change in circumstances that indicates an impaired value. If the GAAP depreciated cost basis of a real estate investment exceeds the expected undiscounted future cash flows of such real estate investment, the investment is considered impaired and the GAAP depreciated cost basis is reduced to the estimated fair value of the investment. During the three months ended March 31, 2022 and 2021, the Company did not recognize any impairment charge.
13
4. Investments in Unconsolidated Entities
The Company holds investments in joint ventures that it accounts for under the equity method of accounting, as the Company’s ownership interest in each joint venture does not meet the requirements for consolidation. The joint ventures include 10,009 single family rental properties, 124 affordable housing rental properties, 533 industrial properties, 53 data center properties, six retail properties, two net lease properties and one office property. Refer to Note 2 for additional details.
The following table details the Company’s equity investments in unconsolidated entities ($ in thousands):
| Investment in Joint Venture | Segment | Number of Joint Ventures | Ownership Interest | March 31, 2022 | December 31, 2021 | |||||||||||||||||||||||||||
| Unconsolidated entities at historical cost: | ||||||||||||||||||||||||||||||||
QTS Data Centers(1) | Data Centers | 1 | 35.7% | $ | 1,338,874 | $ | 1,394,359 | |||||||||||||||||||||||||
| MGM Grand & Mandalay Bay | Net Lease | 1 | 49.9% | 823,991 | 822,736 | |||||||||||||||||||||||||||
| Residential investments | Residential | 130 | 12.2% - 52.0% | 1,024,821 | 1,074,832 | |||||||||||||||||||||||||||
Industrial investments(2) | Industrial | 7 | 10.0% - 55.0% | 502,290 | 497,491 | |||||||||||||||||||||||||||
| Retail investments | Retail | 1 | 50.0% | 96,438 | 98,241 | |||||||||||||||||||||||||||
| Total unconsolidated entities at historical cost | 140 | 3,786,414 | 3,887,659 | |||||||||||||||||||||||||||||
| Unconsolidated entities at fair value: | ||||||||||||||||||||||||||||||||
Industrial investments(3) | Industrial | 7 | 7.9% - 85.0% | 1,810,230 | 1,613,646 | |||||||||||||||||||||||||||
| Office investments | Office | 1 | 49.0% | 530,243 | — | |||||||||||||||||||||||||||
| Total unconsolidated entities at fair value | 8 | 2,340,473 | 1,613,646 | |||||||||||||||||||||||||||||
| Total | 148 | $ | 6,126,887 | $ | 5,501,305 | |||||||||||||||||||||||||||
(1)The Company along with certain Blackstone-managed investment vehicles formed a joint venture (“QTS Data Centers”) and acquired all outstanding shares of common stock of QTS Realty Trust (“QTS”).
(2)Includes $266.1 million from investments in three joint ventures formed by the Company and certain Blackstone-managed investment vehicles.
(3)Includes $1.1 billion from investments in three joint ventures formed by the Company and certain Blackstone-managed investment vehicles.
The following table details the Company’s income from unconsolidated entities ($ in thousands):
For the Three Months Ended March 31, | ||||||||||||||||||||||||||
| BREIT Income (Loss) from Unconsolidated Entities | Segment | Ownership Interest | 2022 | 2021 | ||||||||||||||||||||||
| Unconsolidated entities at historical cost: | ||||||||||||||||||||||||||
| QTS Data Centers | Data Centers | 35.7% | $ | (38,469) | $ | — | ||||||||||||||||||||
| MGM Grand & Mandalay Bay | Net Lease | 49.9% | 25,273 | 25,346 | ||||||||||||||||||||||
| Residential investments | Residential | 12.2% - 52.0% | (28,800) | — | ||||||||||||||||||||||
| Industrial investments | Industrial | 10.0% - 55.0% | 19,551 | — | ||||||||||||||||||||||
| Retail investments | Retail | 50.0% | (189) | — | ||||||||||||||||||||||
| Total unconsolidated entities at historical cost | (22,634) | 25,346 | ||||||||||||||||||||||||
| Unconsolidated entities at fair value: | ||||||||||||||||||||||||||
| Industrial investments | Industrial | 7.9% - 85.0% | 205,169 | 9,336 | ||||||||||||||||||||||
| Office investments | Office | 49.0% | 1,690 | — | ||||||||||||||||||||||
| Total unconsolidated entities at fair value | 206,859 | 9,336 | ||||||||||||||||||||||||
| Total | $ | 184,225 | $ | 34,682 | ||||||||||||||||||||||
14
5. Investments in Real Estate Debt
The following tables detail the Company’s investments in real estate debt ($ in thousands):
| March 31, 2022 | ||||||||||||||||||||||||||||||||
| Type of Security/Loan | Weighted Average Coupon(1) | Weighted Average Maturity Date(2) | Face Amount | Cost Basis | Fair Value | |||||||||||||||||||||||||||
CMBS(3) | L+3.7% | 6/3/2034 | $ | 8,084,396 | $ | 7,928,752 | $ | 7,713,748 | ||||||||||||||||||||||||
| RMBS | 4.3% | 8/27/2054 | 373,111 | 363,353 | 343,440 | |||||||||||||||||||||||||||
| Corporate bonds | 4.9% | 3/29/2030 | 236,215 | 235,385 | 226,137 | |||||||||||||||||||||||||||
| Total real estate securities | 4.0% | 2/23/2035 | 8,693,722 | 8,527,490 | 8,283,325 | |||||||||||||||||||||||||||
| Commercial real estate loans | L+4.4% | 2/8/2025 | 1,411,685 | 1,438,183 | 1,402,175 | |||||||||||||||||||||||||||
Other investments(4) | 3.7% | 7/25/2029 | 224,528 | 195,916 | 203,096 | |||||||||||||||||||||||||||
| Total investments in real estate debt | 4.1% | 8/10/2033 | $ | 10,329,935 | $ | 10,161,589 | $ | 9,888,596 | ||||||||||||||||||||||||
| December 31, 2021 | ||||||||||||||||||||||||||||||||
| Type of Security/Loan | Weighted Average Coupon(1) | Weighted Average Maturity Date(2) | Face Amount | Cost Basis | Fair Value | |||||||||||||||||||||||||||
CMBS(3) | L+3.6% | 11/13/2033 | $ | 7,176,097 | $ | 7,090,490 | $ | 7,055,276 | ||||||||||||||||||||||||
| RMBS | 3.9% | 5/24/2061 | 147,170 | 146,023 | 144,691 | |||||||||||||||||||||||||||
| Corporate bonds | 4.8% | 12/10/2028 | 135,950 | 135,952 | 136,469 | |||||||||||||||||||||||||||
| Total real estate securities | 3.7% | 4/27/2034 | 7,459,217 | 7,372,465 | 7,336,436 | |||||||||||||||||||||||||||
| Commercial real estate loans | L+4.4% | 1/19/2025 | 1,474,617 | 1,473,807 | 1,460,716 | |||||||||||||||||||||||||||
Other investments(4) | 3.7% | 7/25/2029 | 227,958 | 198,909 | 198,787 | |||||||||||||||||||||||||||
| Total investments in real estate debt | 3.8% | 9/16/2032 | $ | 9,161,792 | $ | 9,045,181 | $ | 8,995,939 | ||||||||||||||||||||||||
(1)The term “L” refers to the relevant floating benchmark rates, which include USD LIBOR, GBP LIBOR, EURIBOR, SOFR and SONIA, as applicable to each security and loan. Fixed rate CMBS and Commercial Real Estate Loans are reflected as a spread over the relevant floating benchmark rates, as of March 31, 2022 and December 31, 2021, respectively, for purposes of the weighted-averages. Weighted Average Coupon for CMBS does not include zero-coupon securities. As of March 31, 2022 and December 31, 2021, we had interest rate swaps outstanding with a notional value of $1.5 billion and $1.1 billion, respectively, that effectively converts a portion of our fixed rate investments in real estate debt to floating rates.
(2)Weighted average maturity date is based on the fully extended maturity date of the instrument.
(3)Face amount excludes interest-only securities with a notional amount of $3.4 billion as of both March 31, 2022 and December 31, 2021. In addition, CMBS includes zero-coupon securities of $215.1 million and $208.8 million as of March 31, 2022 and December 31, 2021, respectively.
(4)Includes an interest in an unconsolidated joint venture that holds investments in real estate debt.
15
The following table details the collateral type of the properties securing the Company’s investments in real estate debt ($ in thousands):
| March 31, 2022 | December 31, 2021 | |||||||||||||||||||||||||||||||||||||
Collateral(1) | Cost Basis | Fair Value | Percentage Based on Fair Value | Cost Basis | Fair Value | Percentage Based on Fair Value | ||||||||||||||||||||||||||||||||
| Industrial | $ | 3,359,594 | $ | 3,268,452 | 33% | $ | 3,058,410 | $ | 3,032,995 | 34% | ||||||||||||||||||||||||||||
| Residential | 2,678,131 | 2,639,971 | 27% | 2,328,762 | 2,358,734 | 26% | ||||||||||||||||||||||||||||||||
| Hospitality | 2,560,293 | 2,466,372 | 25% | 2,233,289 | 2,200,285 | 24% | ||||||||||||||||||||||||||||||||
| Office | 724,459 | 684,979 | 7% | 640,145 | 620,512 | 7% | ||||||||||||||||||||||||||||||||
| Other | 450,972 | 439,489 | 4% | 354,579 | 352,105 | 4% | ||||||||||||||||||||||||||||||||
| Diversified | 379,254 | 381,451 | 4% | 403,737 | 405,569 | 5% | ||||||||||||||||||||||||||||||||
| Net Lease | 8,886 | 7,882 | —% | 8,885 | 8,779 | —% | ||||||||||||||||||||||||||||||||
| Retail | — | — | —% | 17,374 | 16,960 | —% | ||||||||||||||||||||||||||||||||
| Total | $ | 10,161,589 | $ | 9,888,596 | 100% | $ | 9,045,181 | $ | 8,995,939 | 100% | ||||||||||||||||||||||||||||
(1)Residential investments in real estate debt are collateralized by various forms of rental housing including apartments and single family homes.
The following table details the credit rating of the Company’s investments in real estate debt ($ in thousands):
| March 31, 2022 | December 31, 2021 | |||||||||||||||||||||||||||||||||||||
| Credit Rating | Cost Basis | Fair Value | Percentage Based on Fair Value | Cost Basis | Fair Value | Percentage Based on Fair Value | ||||||||||||||||||||||||||||||||
| AAA | $ | 26,304 | $ | 22,750 | —% | $ | 26,192 | $ | 24,274 | —% | ||||||||||||||||||||||||||||
| AA | 628 | 1,325 | —% | 710 | 1,749 | —% | ||||||||||||||||||||||||||||||||
| A | 125,884 | 123,191 | 1% | 127,118 | 125,420 | 1% | ||||||||||||||||||||||||||||||||
| BBB | 549,911 | 537,270 | 5% | 373,061 | 369,111 | 4% | ||||||||||||||||||||||||||||||||
| BB | 2,122,421 | 2,045,884 | 21% | 1,678,565 | 1,670,560 | 19% | ||||||||||||||||||||||||||||||||
| B | 2,306,004 | 2,225,230 | 23% | 1,971,282 | 1,940,328 | 22% | ||||||||||||||||||||||||||||||||
| CCC | 24,338 | 22,728 | —% | 24,338 | 24,242 | —% | ||||||||||||||||||||||||||||||||
| Private Commercial Real Estate Loans | 1,538,922 | 1,511,111 | 15% | 1,598,701 | 1,585,738 | 18% | ||||||||||||||||||||||||||||||||
Not Rated (1) | 3,467,177 | 3,399,107 | 35% | 3,245,214 | 3,254,517 | 36% | ||||||||||||||||||||||||||||||||
| Total | $ | 10,161,589 | $ | 9,888,596 | 100% | $ | 9,045,181 | $ | 8,995,939 | 100% | ||||||||||||||||||||||||||||
(1)As of March 31, 2022, Not Rated positions represent a weighted average LTV at origination of 67.5% and are comprised primarily of 54.2% industrial and 36.7% multifamily assets.
The following table details the amounts recognized for the Company’s investments in real estate debt ($ in thousands):
| Three Months Ended March 31, | |||||||||||
| 2022 | 2021 | ||||||||||
| Interest income | $ | 97,599 | $ | 43,197 | |||||||
| Unrealized (loss) gain | (224,147) | 129,883 | |||||||||
| Realized gain | 2,384 | 2,594 | |||||||||
| Total | (124,164) | 175,674 | |||||||||
| Income from interest rate swaps and other derivatives | 83,975 | 50,579 | |||||||||
Income from secured financings of investments in real estate debt(1) | 15,408 | 13,461 | |||||||||
| Other loss | (9,263) | (353) | |||||||||
| Total (loss) income from investments in real estate debt | $ | (34,044) | $ | 239,361 | |||||||
(1)Represents unrealized and realized gains.
16
The Company’s investments in real estate debt included certain CMBS and loans collateralized by properties owned by Blackstone-advised investment vehicles. The following table details the Company’s investments in affiliated real estate debt ($ in thousands):
| Fair Value | Income (Loss) | ||||||||||||||||||||||
| Three Months Ended March 31, | |||||||||||||||||||||||
| March 31, 2022 | December 31, 2021 | 2022 | 2021 | ||||||||||||||||||||
| CMBS | $ | 2,794,020 | $ | 3,099,694 | $ | (22,627) | $ | 69,343 | |||||||||||||||
| Commercial real estate loans | 489,388 | 556,571 | (1,139) | (18,572) | |||||||||||||||||||
| Total | $ | 3,283,408 | $ | 3,656,265 | $ | (23,766) | $ | 50,771 | |||||||||||||||
For additional information regarding the Company’s investments in affiliated real estate debt, see Note 5 to the consolidated financial statements in the Company’s Annual Report on Form 10-K for the year ended December 31, 2021. The terms and conditions of such affiliated real estate debt held as of March 31, 2022 are consistent with the terms described in such Note.
Each investment in such CMBS by Blackstone and its affiliates (including the Company) represented a minority participation in any individual tranche. The Company acquired its minority participation interests from third-parties on market terms negotiated by the majority third-party investors. Blackstone and its affiliates (including the Company) will forgo all non-economic rights (including voting rights) in such CMBS as long as the Blackstone-advised investment vehicles either own the properties collateralizing, loans underlying, or have an interest in a different part of the capital structure related to such CMBS.
As of March 31, 2022 and December 31, 2021, the Company’s investments in real estate debt also included $2.0 billion and $1.4 billion, respectively, of CMBS collateralized, in part, by certain of the Company’s mortgage notes. During the three months ended March 31, 2022 and 2021, the Company recognized $28.7 million of loss and $7.0 million of income, respectively, related to such CMBS.
6. Mortgage Notes, Term Loans, and Secured Revolving Credit Facilities
The following table details the mortgage notes, term loans, and secured revolving credit facilities secured by the Company’s real estate ($ in thousands):
| March 31, 2022 | Principal Balance Outstanding | |||||||||||||||||||||||||||||||
| Indebtedness | Weighted Average Interest Rate(1) | Weighted Average Maturity Date (2)(3) | Maximum Facility Size | March 31, 2022 | December 31, 2021 | |||||||||||||||||||||||||||
| Fixed rate loans: | ||||||||||||||||||||||||||||||||
Fixed rate mortgages(4) | 3.6% | 9/25/2028 | N/A | $ | 19,387,718 | $ | 19,086,525 | |||||||||||||||||||||||||
| Variable rate loans: | ||||||||||||||||||||||||||||||||
| Variable rate mortgages and term loans | L+2.0% | 7/13/2026 | N/A | 21,107,149 | 20,004,365 | |||||||||||||||||||||||||||
| Variable rate secured revolving credit facilities | N/A | N/A | $ | 2,963,290 | — | 1,614,550 | ||||||||||||||||||||||||||
| Variable rate warehouse facilities | L+1.6% | 8/6/2027 | $ | 1,562,500 | 1,075,929 | 794,141 | ||||||||||||||||||||||||||
| Variable rate mezzanine loans | L+3.5% | 3/9/2025 | N/A | 71,100 | 71,100 | |||||||||||||||||||||||||||
| Total variable rate loans | L+1.9% | 7/31/2026 | 22,254,178 | 22,484,156 | ||||||||||||||||||||||||||||
| Total loans secured by real estate | 3.0% | 8/1/2027 | 41,641,896 | 41,570,681 | ||||||||||||||||||||||||||||
| Premium on assumed debt, net | 65,437 | 68,706 | ||||||||||||||||||||||||||||||
| Deferred financing costs, net | (312,112) | (311,999) | ||||||||||||||||||||||||||||||
| Mortgage notes, term loans, and secured revolving credit facilities, net | $ | 41,395,221 | $ | 41,327,388 | ||||||||||||||||||||||||||||
(1)The term “L” refers to the relevant floating benchmark rates, which include one-month LIBOR, three-month LIBOR, 30-day SOFR, and one-month CDOR as applicable to each loan. As of March 31, 2022, we have outstanding interest rate swaps with an aggregate notional balance of $16.6 billion that mitigate our exposure to potential future interest rates increase under our floating-rate debt.
(2)Weighted average maturity assumes maximum maturity date (including any extensions), where the Company, at its sole discretion, has one or more extension options.
(3)The majority of the Company’s mortgages contain yield or spread maintenance provisions.
(4)Includes $382.9 million and $396.3 million of loans related to our investment in affordable housing properties as of March 31, 2022 and December 31, 2021, respectively. Such loans are generally with municipalities, housing authorities, and other third parties administered through government sponsored affordable housing programs. Certain of these loans may be forgiven if specific affordable housing conditions are maintained.
17
The following table details the future principal payments due under the Company’s mortgage notes, term loans, and secured revolving credit facilities as of March 31, 2022 ($ in thousands):
| Year | Amount | |||||||
| 2022 (remaining) | $ | 320,648 | ||||||
| 2023 | 593,693 | |||||||
| 2024 | 3,217,858 | |||||||
| 2025 | 6,510,837 | |||||||
| 2026 | 14,534,786 | |||||||
| 2027 | 6,428,977 | |||||||
| Thereafter | 10,035,097 | |||||||
| Total | $ | 41,641,896 | ||||||
The Company repaid certain of its loans in conjunction with the sale of the underlying property or a refinancing during the three months ended March 31, 2022. As such, the Company incurred a realized gain on extinguishment of debt of $1.4 million and loss of $3.4 million for the three months ended March 31, 2022 and 2021, respectively. Such gains resulted primarily from the acceleration of mortgage premiums and such losses resulted from the acceleration of related deferred financing costs, prepayment penalties, and transaction costs. Both are recorded on the Company’s Condensed Consolidated Statements of Operations.
The Company is subject to various financial and operational covenants under certain of its mortgage notes, term loans, and secured revolving credit facility agreements. These covenants require the Company to maintain certain financial ratios, which include leverage, debt yield, and debt service coverage, among others. As of March 31, 2022, the Company believes it was in compliance with all of its loan covenants that could result in a default under such agreements, and with respect to the other financial ratio-based covenants, the Company has provided limited guarantees to allow the applicable collateral real estate to continue to distribute their cash flow to the Company.
7. Secured Financings of Investments in Real Estate Debt
The Company has entered into master repurchase agreements and other financing agreements with lenders to provide additional financing capacity secured by certain of its investments in real estate debt. The terms of the master repurchase agreements and other financing agreements provide the lenders the ability to determine the size and terms of the financing provided based upon the particular collateral pledged by the Company from time-to-time, and may require the Company to provide additional collateral in the form of cash, securities, or other assets if the market value of the financed investments decline.
The following tables detail the Company’s secured financings of investments in real estate debt ($ in thousands):
| March 31, 2022 | ||||||||||||||||||||||||||
| Collateral Type | Borrowings Outstanding | Collateral Assets(1) | Weighted Average Interest Rate (2) | Weighted Average Maturity Date | ||||||||||||||||||||||
| CMBS | $ | 4,212,985 | $ | 6,702,854 | L+1.0% | 3/21/2023 | ||||||||||||||||||||
| Commercial real estate loans | 180,859 | 278,244 | L+1.8% | 4/2/2024 | ||||||||||||||||||||||
| Corporate bonds | 86,585 | 126,560 | L+0.9% | 2/2/2023 | ||||||||||||||||||||||
| RMBS | 78,352 | 115,836 | L+1.0% | 3/20/2023 | ||||||||||||||||||||||
| $ | 4,558,781 | $ | 7,223,494 | L+1.0% | ||||||||||||||||||||||
| December 31, 2021 | ||||||||||||||||||||||||||
| Collateral Type | Borrowings Outstanding | Collateral Assets(1) | Weighted Average Interest Rate (2) | Weighted Average Maturity Date | ||||||||||||||||||||||
| CMBS | $ | 4,308,015 | $ | 6,604,524 | L+0.9% | 1/20/2023 | ||||||||||||||||||||
| Commercial real estate loans | 224,510 | 345,400 | L+1.8% | 4/2/2022 | ||||||||||||||||||||||
| Corporate bonds | 90,578 | 135,355 | L+0.8% | 11/17/2022 | ||||||||||||||||||||||
| RMBS | 83,529 | 125,967 | L+0.9% | 12/31/2022 | ||||||||||||||||||||||
| $ | 4,706,632 | $ | 7,211,246 | L+1.0% | ||||||||||||||||||||||
(1)Represents the fair value of the Company’s investments in real estate debt that serve as collateral.
(2)The term “L” refers to the relevant floating benchmark rates, which include USD LIBOR, EURIBOR, SOFR and SONIA, as applicable to each secured financing.
18
8. Unsecured Revolving Credit Facilities
The Company is party to an unsecured line of credit with multiple banks. The credit facility expires on February 22, 2024 and may be extended for one year. Interest under the credit facility is determined based on LIBOR plus 2.5%. As of March 31, 2022, the capacity of the unsecured line of credit was $2.0 billion. As of March 31, 2022, the Company had a $10.0 million letter of credit outstanding, which reduced the line of credit capacity of the unsecured credit facility. No such letter of credit was outstanding as of December 31, 2021. There were no outstanding borrowings on the line of credit as of March 31, 2022 and December 31, 2021.
The Company is party to an unsecured, uncommitted line of credit (the “Line of Credit”) up to a maximum amount of $75.0 million with an affiliate of Blackstone (“Lender”). The Line of Credit expires on January 22, 2023, and may be extended for up to 12 months, subject to Lender approval. The interest rate is equivalent to the then-current rate offered to the Company by a third-party lender, or, if no such rate is available, LIBOR plus 2.5%. Each advance under the Line of Credit is repayable on the earliest of (i) the expiration of the Line of Credit, (ii) Lender’s demand and (iii) the date on which the Adviser no longer acts as the Company’s investment adviser, provided that the Company will have 180 days to make such repayment in the cases of clauses (i) and (ii) and 45 days to make such repayment in the case of clause (iii). As of March 31, 2022 and December 31, 2021, the Company had no outstanding balance under the Line of Credit.
9. Related Party Transactions
Due to Affiliates
The following table details the components of due to affiliates ($ in thousands):
| March 31, 2022 | December 31, 2021 | ||||||||||
| Accrued stockholder servicing fee | $ | 1,453,187 | $ | 1,235,592 | |||||||
| Performance participation allocation | 411,569 | — | |||||||||
| Accrued management fee | 66,688 | 56,607 | |||||||||
| Accrued affiliate service provider expenses | 15,856 | 12,880 | |||||||||
| Advanced organization and offering costs | 1,534 | 2,045 | |||||||||
| Other | 2,638 | 2,323 | |||||||||
| Total | $ | 1,951,472 | $ | 1,309,447 | |||||||
Accrued Stockholder Servicing Fee
The Company accrues the full amount of the future stockholder servicing fees payable to Blackstone Securities Partners L.P. (the “Dealer Manager”), a registered broker dealer affiliated with the Adviser, for Class S, Class T, and Class D shares, up to the 8.75% of gross proceeds limit, at the time such shares are sold. The Dealer Manager has entered into agreements with the selected dealers distributing the Company’s share as part of its continuous public offering, that provide, among other things, for the re-allowance of the full amount of the selling commissions and dealer manager fee, and all or a portion of the stockholder servicing fees received by the Dealer Manager to such selected dealers.
Performance Participation Allocation
The Special Limited Partner holds a performance participation interest in BREIT OP that entitles it to receive an allocation of BREIT OP’s total return. Total return is defined as distributions paid or accrued plus the change in the Company’s Net Asset Value (“NAV”), adjusted for subscriptions and repurchases. Under the BREIT OP agreement, the annual total return will be allocated solely to the Special Limited Partner only after the other unit holders have received a total return of 5% (after recouping any loss carryforward amount) and such allocation will continue until the allocation between the Special Limited Partner and all other BREIT OP unit holders is equal to 12.5% and 87.5%, respectively. Thereafter, the Special Limited Partner will receive an allocation of 12.5% of the annual total return. The allocation of the performance participation interest is ultimately measured on a calendar year basis and will be paid quarterly in Class I or Class B units of BREIT OP or cash, at the election of the Special Limited Partner.
19
Effective March 4, 2022, following the end of each calendar quarter that is not also the end of a calendar year, the Special Limited Partner will be entitled to a performance participation allocation as described above calculated in respect of the portion of the year to date, less any performance participation allocation received with respect to prior quarters in that year (the “Quarterly Allocation”). The performance participation allocation that the Special Limited Partner is entitled to receive at the end of each calendar year will be reduced by the cumulative amount of Quarterly Allocations that year. If a Quarterly Allocation is made and at the end of a subsequent calendar quarter in the same calendar year the Special Limited Partner is entitled to less than the previously received Quarterly Allocation(s) (a “Quarterly Shortfall”), then subsequent distributions of any Quarterly Allocations or year-end Performance Allocations in that calendar year will be reduced by an amount equal to such Quarterly Shortfall, until such time as no Quarterly Shortfall remains. If all or any portion of a Quarterly Shortfall remains at the end of a calendar year following the application described in the previous sentence, distributions of any Quarterly Allocations and year-end Performance Allocations in the subsequent four calendar years will be reduced by (i) the remaining Quarterly Shortfall plus (ii) an annual rate of 5% on the remaining Quarterly Shortfall measured from the first day of the calendar year following the year in which the Quarterly Shortfall arose and compounded quarterly (collectively, the “Quarterly Shortfall Obligation”) until such time as no Quarterly Shortfall Obligation remains; provided, that the Special Limited Partner (or its affiliate) may make a full or partial cash payment to reduce the Quarterly Shortfall Obligation at any time; provided, further, that if any Quarterly Shortfall Obligation remains following such subsequent four calendar years, then the Special Limited Partner (or its affiliate) will promptly pay BREIT OP the remaining Quarterly Shortfall Obligation in cash. During the three months ended March 31, 2022, the Company recognized $411.6 million of performance participation allocation expense in the Company’s Condensed Consolidated Statements of Operations. In April 2022, the Company issued 16.1 million Class I units in BREIT OP to the Special Limited Partner as payment for $237.9 million of the performance participation allocation. The remaining amount of the performance participation allocation expense is recorded as a liability within Due to Affiliates on the Condensed Consolidated Balance Sheets. At the election of the Special Limited Partner, each Class I unit is redeemable for cash or Class I shares (on a one-for-one basis). Immediately following the issuance, upon request by the Special Limited Partner, we exchanged 16.1 million Class I units for 16.1 million Class I shares.
On December 31, 2021, the Company issued 96.4 million Class I units in BREIT OP to the Special Limited Partner as payment of the 2021 performance participation allocation. Such units were issued at the NAV per unit as of December 31, 2021. Also on December 31, 2021, and immediately following (i) the issuance of the Class I units and (ii) the record time for the December 2021 distributions on the Company’s Class I shares, 55.2 million Class I units in BREIT OP were exchanged for 55.2 million unregistered Class I shares in the Company. In January 2022, subsequent to the issuance of the Class I shares and Class I units, 4.7 million of such Class I units were exchanged for 4.7 million Class B units, 37.8 million of such Class I shares and 1.9 million of such Class I units were redeemed for $566.6 million, and 9.0 million of such units were exchanged for 9.0 million unregistered Class I shares in the Company.
In January 2021, the Company issued 15.5 million Class I units and 1.1 million Class B units in BREIT OP to the Special Limited Partner as payment of the 2020 performance participation allocation. Such units were issued at the NAV per unit as of December 31, 2021. Subsequent to the issuance of the Class I units and Class B units, 9.7 million of such units were redeemed for $111.9 million, and 1.1 million of such units were exchanged for unregistered Class I shares in the Company.
As of May 13, 2022, Blackstone and its employees, including the Company’s executive officers, owned shares of common stock of the Company and Class I and Class B units of BREIT OP in an aggregate amount of $1.5 billion (based on the NAV per share/unit as of March 31, 2022).
Accrued Management Fee
The Adviser is entitled to an annual management fee equal to 1.25% of the Company’s NAV, payable monthly, as compensation for the services it provides to the Company. The management fee can be paid, at the Adviser’s election, in cash, shares of the Company’s common stock, or BREIT OP units. To date, the Adviser has elected to receive the management fee in shares of the Company’s common stock. During the three months ended March 31, 2022 and 2021, the Company incurred management fees of $189.2 million and $73.1 million, respectively.
During the three months ended March 31, 2022 and 2021, the Company issued 8.4 million and 4.0 million unregistered Class I shares, respectively, to the Adviser as payment for management fees. The Company also had a payable of $66.7 million and $56.6 million related to the management fees as of March 31, 2022 and December 31, 2021, respectively. During April 2022, the Adviser was issued 4.5 million unregistered Class I shares as payment for the management fees accrued as of March 31, 2022. The shares issued to the Adviser for payment of the management fee were issued at the applicable NAV per share at the end of each month for which the fee was earned. During the three months ended March 31, 2021, the Adviser submitted 8.3 million Class I shares for repurchase by the Company, for a total repurchase amount of $96.9 million. The Advisor did not submit any shares for repurchase during the three months ended March 31, 2022.
20
Accrued affiliate service provider expenses and incentive compensation awards
For further details on the Company’s relationships with its affiliated service providers, see Note 9 to the consolidated financial statements in the Company’s Annual Report on Form 10-K for the year ended December 31, 2021. The Company issues incentive compensation awards to certain employees of affiliate portfolio company service providers that entitles them to receive an allocation of the Company’s total return over a certain hurdle amount, as determined by the Company. The vesting condition that is based on the Company achieving of certain returns over a hurdle amount is considered a market condition. The achievement of total returns over the hurdle amount, which affects the quantity of awards that vest, is considered a performance condition. If it is considered probable that the performance condition will be met, these awards are amortized over the four-year service period, as adjusted for forfeitures. As of March 31, 2022, the Company has determined it is probable that the performance condition will be met and has amortized the value of such awards over the applicable service period. None of Blackstone, the Adviser, or the affiliate portfolio company service providers receive any incentive compensation from the aforementioned arrangements.
The following table details the incentive compensation awards ($ in thousands):
| March 31, 2022 | ||||||||||||||||||||||||||||||||
| Plan Year | Unrecognized Compensation Cost as of December 31, 2021 | Value of Awards Issued | Amortization of Compensation Cost for the Three Months Ended March 31, 2022 | Unrecognized Compensation Cost | Remaining Amortization Period | |||||||||||||||||||||||||||
| 2019 | $ | 1,520 | $ | — | $ | (380) | $ | 1,140 | 0.8 years | |||||||||||||||||||||||
| 2020 | — | — | — | — | — | |||||||||||||||||||||||||||
| 2021 | 37,201 | — | (3,010) | 34,191 | 2.8 years | |||||||||||||||||||||||||||
| 2022 | — | 25,000 | (1,562) | 23,438 | 3.8 years | |||||||||||||||||||||||||||
| $ | 38,721 | $ | 25,000 | $ | (4,952) | $ | 58,769 | |||||||||||||||||||||||||
The following table details the amounts incurred for affiliate service providers ($ in thousands):
Affiliate Service Provider Expenses Three Months Ended March 31, | Amortization of Affiliate Service Provider Incentive Compensation Awards Three Months Ended March 31, | Transaction Support Services(1) Three Months Ended March 31, | |||||||||||||||||||||||||||||||||
| 2022 | 2021 | 2022 | 2021 | 2022 | 2021 | ||||||||||||||||||||||||||||||
| Link Industrial Properties L.L.C. | $ | 19,133 | $ | 16,128 | $ | 2,344 | $ | 417 | $ | 1,032 | $ | 243 | |||||||||||||||||||||||
| LivCor, L.L.C. | 13,978 | 10,725 | 2,218 | 382 | 1,691 | 879 | |||||||||||||||||||||||||||||
| BRE Hotels and Resorts LLC | 3,484 | 2,681 | 191 | 132 | — | — | |||||||||||||||||||||||||||||
| ShopCore Properties TRS Management LLC | 1,857 | 1,424 | 125 | 16 | — | 40 | |||||||||||||||||||||||||||||
| Revantage Corporate Services, L.L.C. | 4,832 | 653 | — | — | 5 | — | |||||||||||||||||||||||||||||
| Equity Office Management, L.L.C. | 422 | 612 | 74 | 8 | — | — | |||||||||||||||||||||||||||||
| Longview Senior Housing Advisors, LLC | 428 | — | — | — | — | — | |||||||||||||||||||||||||||||
| Total | $ | 44,134 | $ | 32,223 | $ | 4,952 | $ | 955 | $ | 2,728 | $ | 1,162 | |||||||||||||||||||||||
(1)During the three months ended March 31, 2022 and 2021, the Company paid the affiliate service providers $2.7 million and $1.2 million, respectively, for transaction support fees relating to acquisitions and dispositions, and such costs were either (i) capitalized to Investments in Real Estate or (ii) included as part of the gain (loss) on sale.
Affiliate service provider expenses and incentive compensation awards are included as a component of Rental Property Operating and Hospitality Operating expense, as applicable, in the Company’s Condensed Consolidated Statements of Operations. Transaction support service fees were capitalized to Investments in Real Estate on the Company’s Condensed Consolidated Balance Sheets. Neither Blackstone nor the Adviser receives any fees from these arrangements.
Other
As of March 31, 2022 and December 31, 2021, the Adviser had advanced $2.6 million and $2.3 million, respectively, of expenses on the Company’s behalf for general corporate expenses provided by unaffiliated third parties.
21
Affiliate Title Service Provider
During the three months ended March 31, 2022, the Company paid Lexington National Land Services $6.9 million for title services related to 20 investments and such costs were either (i) capitalized to Investments in Real Estate or (ii) recorded as deferred financing costs, which is a reduction to Mortgage Notes, Term Loans, and Secured Revolving Credit Facilities on the Condensed Consolidated Balance Sheets. For additional information regarding this affiliate relationship, see Note 9 to the consolidated financial statements in the Company’s Annual Report on Form 10-K for the year ended December 31, 2021.
Captive Insurance Company
During the three months ended March 31, 2022, the Company contributed $4.4 million of capital to the captive insurance company for insurance premiums and its pro rata share of other expenses. Of these amounts, $0.1 million was attributable to the fee paid to a Blackstone affiliate to provide oversight and management services of the captive insurance company. The capital contributed and fees paid are in place of insurance premiums and fees that would otherwise be paid to third party insurance companies. The Company contributed $0.3 million of capital to the captive insurance company during the three months ended March 31, 2021. Of these amounts, $5 thousand was attributable to the fee paid to a Blackstone affiliate to provide oversight and management services of the captive insurance company.
Other
As of March 31, 2022 and December 31, 2021, the Company had a receivable of $3.0 million and $3.9 million from LivCor, L.L.C. and such amounts are included in Other Assets on the Company’s Condensed Consolidated Balance Sheets.
10. Other Assets and Other Liabilities
The following table details the components of other assets ($ in thousands):
| March 31, 2022 | December 31, 2021 | ||||||||||
| Equity securities | $ | 3,217,726 | $ | 3,225,660 | |||||||
| Real estate intangibles, net | 1,303,510 | 1,487,436 | |||||||||
| Derivatives | 839,707 | 41,453 | |||||||||
| Receivables, net | 473,421 | 381,201 | |||||||||
| Straight-line rent receivable | 307,270 | 275,200 | |||||||||
| Single family rental homes risk retention securities | 183,646 | 233,525 | |||||||||
| Prepaid expenses | 117,356 | 151,188 | |||||||||
| Pre-acquisition costs | 115,952 | 153,659 | |||||||||
| Deferred leasing costs, net | 98,054 | 84,990 | |||||||||
| Deferred financing costs, net | 52,060 | 51,535 | |||||||||
| Held for sale assets | 27,951 | 196,244 | |||||||||
| Other | 162,596 | 168,642 | |||||||||
| Total | $ | 6,899,249 | $ | 6,450,733 | |||||||
22
The following table details the components of other liabilities ($ in thousands):
| March 31, 2022 | December 31, 2021 | ||||||||||
| Subscriptions received in advance | $ | 1,843,583 | $ | 1,746,910 | |||||||
| Stock repurchases payable | 393,594 | 100,540 | |||||||||
| Intangible liabilities, net | 301,669 | 288,643 | |||||||||
| Accounts payable and accrued expenses | 295,641 | 265,754 | |||||||||
| Distribution payable | 222,007 | 190,143 | |||||||||
| Accrued interest expense | 217,129 | 215,757 | |||||||||
| Real estate taxes payable | 204,560 | 211,063 | |||||||||
| Securitized debt obligations, net | 199,164 | 200,953 | |||||||||
| Right of use lease liability - operating leases | 190,500 | 180,453 | |||||||||
| Tenant security deposits | 183,948 | 172,308 | |||||||||
| Derivatives | 99,859 | 45,597 | |||||||||
| Payable for unsettled investments in real estate debt | 99,541 | 21,426 | |||||||||
| Prepaid rental income | 92,279 | 125,250 | |||||||||
| Right of use lease liability - financing leases | 76,054 | 75,730 | |||||||||
| Held for sale liabilities | 21,487 | 114,377 | |||||||||
| Other | 246,561 | 229,244 | |||||||||
| Total | $ | 4,687,576 | $ | 4,184,148 | |||||||
11. Intangibles
The gross carrying amount and accumulated amortization of the Company’s intangible assets and liabilities consisted of the following ($ in thousands):
| March 31, 2022 | December 31, 2021 | ||||||||||
| Intangible assets | |||||||||||
| In-place lease intangibles | $ | 1,950,226 | $ | 1,920,331 | |||||||
| Indefinite life intangibles | 104,182 | 104,182 | |||||||||
| Above-market lease intangibles | 61,302 | 60,383 | |||||||||
| Other intangibles | 75,818 | 69,634 | |||||||||
| Total intangible assets | 2,191,528 | 2,154,530 | |||||||||
| Accumulated amortization | |||||||||||
| In-place lease amortization | (844,626) | (628,163) | |||||||||
| Above-market lease amortization | (25,602) | (22,993) | |||||||||
| Other intangibles amortization | (17,790) | (15,938) | |||||||||
| Total accumulated amortization | (888,018) | (667,094) | |||||||||
| Intangible assets, net | $ | 1,303,510 | $ | 1,487,436 | |||||||
| Intangible liabilities | |||||||||||
| Below-market lease intangibles | $ | 406,162 | $ | 377,132 | |||||||
| Total intangible liabilities | 406,162 | 377,132 | |||||||||
| Accumulated amortization | |||||||||||
| Below-market lease amortization | (104,493) | (88,489) | |||||||||
| Total accumulated amortization | (104,493) | (88,489) | |||||||||
| Intangible liabilities, net | $ | 301,669 | $ | 288,643 | |||||||
23
The estimated future amortization on the Company’s intangibles for each of the next five years and thereafter as of March 31, 2022 is as follows ($ in thousands):
| In-place Lease Intangibles | Above-market Lease Intangibles | Other Intangibles | Below-market Lease Intangibles | ||||||||||||||||||||
| 2022 (remaining) | $ | 401,019 | $ | 8,370 | $ | 5,947 | $ | (49,468) | |||||||||||||||
| 2023 | 203,366 | 7,106 | 7,435 | (58,529) | |||||||||||||||||||
| 2024 | 140,136 | 5,128 | 7,149 | (49,031) | |||||||||||||||||||
| 2025 | 103,841 | 3,964 | 7,145 | (40,928) | |||||||||||||||||||
| 2026 | 79,127 | 3,210 | 7,012 | (31,825) | |||||||||||||||||||
| 2027 | 55,812 | 2,268 | 6,610 | (21,021) | |||||||||||||||||||
| Thereafter | 122,299 | 5,654 | 16,730 | (50,867) | |||||||||||||||||||
| $ | 1,105,600 | $ | 35,700 | $ | 58,028 | $ | (301,669) | ||||||||||||||||
12. Derivatives
The Company uses derivative financial instruments to minimize the risks and/or costs associated with the Company’s investments and financing transactions. The Company has not designated any of its derivative financial instruments as hedges as defined within ASC 815 – “Derivatives and Hedging”. Derivatives not designated as hedges are not speculative and are used to manage the Company’s exposure to interest rate movements, fluctuations in foreign exchange rates, and other identified risks.
The use of derivative financial instruments involves certain risks, including the risk that the counterparties to these contractual arrangements do not perform as agreed. To mitigate this risk, the Company enters into derivative financial instruments with counterparties it believes to have appropriate credit ratings and that are major financial institutions with which the Company and its affiliates may also have other financial relationships.
Interest Rate Contracts
Certain of the Company’s transactions expose the Company to interest rate risks, which include exposure to variable interest rates on certain loans secured by the Company’s real estate in addition to its secured financings of investments in real estate debt. The Company uses derivative financial instruments, which includes interest rate swaps, and may also include interest rate caps, options, floors, and other interest rate derivative contracts, to limit the Company’s exposure to the future variability of interest rates.
The following tables detail the Company’s outstanding interest rate derivatives that were non-designated hedges of interest rate risk (notional amount in thousands):
| March 31, 2022 | ||||||||||||||||||||||||||||||||
| Interest Rate Derivatives | Number of Instruments | Notional Amount | Strike | Index | Weighted Average Maturity (Years) | |||||||||||||||||||||||||||
| Interest Rate Swaps - Property debt | 31 | $ | 15,050,000 | 2.2% | LIBOR, SOFR | 7.9 | ||||||||||||||||||||||||||
| Interest Rate Caps - Property debt | 33 | $ | 14,370,196 | 2.0% | LIBOR, SOFR | 1.3 | ||||||||||||||||||||||||||
| Interest Rate Swaps - Investments in real estate debt | 75 | $ | 1,513,710 | 1.2% | LIBOR, SOFR | 4.8 | ||||||||||||||||||||||||||
| December 31, 2021 | ||||||||||||||||||||||||||||||||
| Interest Rate Derivatives | Number of Instruments | Notional Amount | Strike | Index | Weighted Average Maturity (Years) | |||||||||||||||||||||||||||
| Interest Rate Swaps - Property debt | 22 | $ | 9,500,000 | 1.3% | LIBOR | 7.0 | ||||||||||||||||||||||||||
| Interest Rate Swaps - Investments in real estate debt | 54 | $ | 1,076,210 | 1.0% | LIBOR | 4.8 | ||||||||||||||||||||||||||
Foreign Currency Forward Contracts
Certain of the Company’s international investments expose it to fluctuations in foreign currency exchange rates and interest rates. These fluctuations may impact the value of the Company’s cash receipts and payments in terms of its functional currency, the U.S. dollar. The Company uses foreign currency forward contracts to protect the value or fix the amount of certain investments or cash flows in terms of the U.S. dollar.
24
The following table details the Company’s outstanding foreign currency forward contracts that were non-designated hedges of foreign currency risk (notional amount in thousands):
| March 31, 2022 | December 31, 2021 | |||||||||||||||||||||||||
| Foreign Currency Forward Contracts | Number of Instruments | Notional Amount | Number of Instruments | Notional Amount | ||||||||||||||||||||||
| Buy USD / Sell EUR Forward | 10 | € | 550,463 | 10 | € | 552,513 | ||||||||||||||||||||
| Buy USD / Sell GBP Forward | 14 | £ | 269,462 | 7 | £ | 267,368 | ||||||||||||||||||||
| Buy EUR / Sell USD Forward | 1 | € | 13,768 | 1 | € | 5,978 | ||||||||||||||||||||
| Buy GBP / Sell USD Forward | — | £ | — | 3 | £ | 15,396 | ||||||||||||||||||||
Valuation and Financial Statement Impact
The following table details the fair value of the Company’s derivative financial instruments ($ in thousands):
Fair Value of Derivatives in an Asset(1) Position | Fair Value of Derivatives in a Liability(2) Position | ||||||||||||||||||||||
| March 31, 2022 | December 31, 2021 | March 31, 2022 | December 31, 2021 | ||||||||||||||||||||
| Interest rate derivatives | $ | 826,499 | $ | 41,123 | $ | 82,405 | $ | 38,062 | |||||||||||||||
| Foreign currency forward contracts | 13,208 | 330 | 17,454 | 7,535 | |||||||||||||||||||
| Total Derivatives | $ | 839,707 | $ | 41,453 | $ | 99,859 | $ | 45,597 | |||||||||||||||
(1)Included in Other Assets in the Company’s Condensed Consolidated Balance Sheets.
(2)Included in Other Liabilities in the Company’s Condensed Consolidated Balance Sheets.
The following table details the effect of the Company’s derivative financial instruments on the Condensed Consolidated Statements of Operations ($ in thousands):
| Type of Derivative | Realized/Unrealized Gain (Loss) | Location of Gain (Loss) Recognized in Net Income | Three Months Ended March 31, | |||||||||||||||||||||||
| 2022 | 2021 | |||||||||||||||||||||||||
| Interest Rate Swap – Property debt | Unrealized gain | (1) | $ | 635,984 | $ | 17,201 | ||||||||||||||||||||
| Interest Rate Swap – Investments in real estate debt | Realized loss | (2) | — | (14,691) | ||||||||||||||||||||||
| Interest Rate Swap – Investments in real estate debt | Unrealized gain | (2) | 59,709 | 54,422 | ||||||||||||||||||||||
| Foreign Currency Forward Contract | Realized gain (loss) | (2) | 21,344 | (4,478) | ||||||||||||||||||||||
| Foreign Currency Forward Contract | Unrealized gain | (2) | 2,922 | 15,326 | ||||||||||||||||||||||
| Interest Rate Caps - Property debt | Unrealized gain | (3) | 45,339 | — | ||||||||||||||||||||||
| $ | 765,298 | $ | 67,780 | |||||||||||||||||||||||
(1)Included in Other Income in the Company's Condensed Consolidated Statements of Operations.
(2)Included in (Loss) Income from Investments in Real Estate Debt in the Company’s Condensed Consolidated Statements of Operations.
(3)Included in Interest Expense in the Company's Condensed Consolidated Statements of Operations.
Credit-Risk Related Contingent Features
The Company has entered into agreements with certain of its derivative counterparties that contain provisions whereby if the Company were to default on any of its indebtedness, including default where repayment of the indebtedness has not been accelerated by the lender, the Company may also be declared in default under its derivative obligations. In addition, certain of the Company’s agreements with its derivative counterparties require the Company to post collateral based on a percentage of derivative notional amounts and/or to secure net liability positions.
As of March 31, 2022, the Company was in a net liability position with three of its derivative counterparties and posted collateral of $41.6 million under the derivative contracts. As of December 31, 2021, the Company was in a net liability position with one of its derivative counterparties and posted collateral of $5.1 million under the derivative contract.
25
13. Equity and Redeemable Non-controlling Interest
Authorized Capital
As of March 31, 2022, the Company had the authority to issue 10,100,000,000 shares, consisting of the following:
| Number of Shares (in thousands) | Par Value | |||||||||||||
| Preferred Stock | 100,000 | $ | 0.01 | |||||||||||
| Class S Shares | 3,000,000 | $ | 0.01 | |||||||||||
| Class I Shares | 6,000,000 | $ | 0.01 | |||||||||||
| Class T Shares | 500,000 | $ | 0.01 | |||||||||||
| Class D Shares | 500,000 | $ | 0.01 | |||||||||||
| Total | 10,100,000 | |||||||||||||
Common Stock
The following table details the movement in the Company’s outstanding shares of common stock (in thousands):
| Three Months Ended March 31, 2022 | |||||||||||||||||||||||||||||
| Class S | Class I | Class T | Class D | Total | |||||||||||||||||||||||||
| December 31, 2021 | 1,254,348 | 2,086,631 | 57,287 | 291,087 | 3,689,353 | ||||||||||||||||||||||||
| Common stock issued | 169,867 | 332,604 | 7,751 | 47,904 | 558,126 | ||||||||||||||||||||||||
| Distribution reinvestment | 7,434 | 11,560 | 365 | 1,853 | 21,212 | ||||||||||||||||||||||||
| Common stock repurchased | (5,221) | (80,651) | (346) | (895) | (87,113) | ||||||||||||||||||||||||
| March 31, 2022 | 1,426,428 | 2,350,144 | 65,057 | 339,949 | 4,181,578 | ||||||||||||||||||||||||
Share and Unit Repurchases
For the three months ended March 31, 2022, the Company repurchased shares and OP units for a total of $1.3 billion. The Company had no unfulfilled repurchase requests during the three months ended March 31, 2022.
Distributions
The Company generally intends to distribute substantially all of its taxable income, which does not necessarily equal net income as calculated in accordance with GAAP, to its stockholders each year to comply with the REIT provisions of the Internal Revenue Code.
Each class of common stock receives the same gross distribution per share. The net distribution varies for each class based on the applicable stockholder servicing fee, which is deducted from the monthly distribution per share and paid directly to the applicable distributor.
The following table details the aggregate distributions declared for each applicable class of common stock:
| Three Months Ended March 31, 2022 | |||||||||||||||||||||||
| Class S | Class I | Class T | Class D | ||||||||||||||||||||
| Aggregate gross distributions declared per share of common stock | $ | 0.1662 | $ | 0.1662 | $ | 0.1662 | $ | 0.1662 | |||||||||||||||
| Stockholder servicing fee per share of common stock | (0.0309) | — | (0.0304) | (0.0089) | |||||||||||||||||||
| Net distributions declared per share of common stock | $ | 0.1353 | $ | 0.1662 | $ | 0.1358 | $ | 0.1573 | |||||||||||||||
Redeemable Non-controlling Interest
In connection with its performance participation interest, the Special Limited Partner holds Class I units in BREIT OP. See Note 9 for further details of the Special Limited Partner’s performance participation interest. Because the Special Limited Partner has the ability to redeem its Class I units for Class I shares in the Company or cash, at the election of the Special Limited Partner, the Company has classified these Class I units as Redeemable Non-controlling Interest in mezzanine equity on the Company’s Condensed Consolidated Balance Sheets.
26
The following table details the redeemable non-controlling interest activity related to the Special Limited Partner for the three months ended March 31, 2022 and 2021 ($ in thousands):
| March 31, | |||||||||||
| 2022 | 2021 | ||||||||||
| Balance at the beginning of the year | $ | 589,900 | $ | 274 | |||||||
| Settlement of prior year performance participation allocation | — | 192,648 | |||||||||
| Repurchases | (26,639) | (111,949) | |||||||||
| Conversion to Class I and Class B units | (434,717) | (68,453) | |||||||||
| Conversion to Class I shares | (128,205) | (12,246) | |||||||||
| GAAP income allocation | (1) | — | |||||||||
| Distributions | (4) | (4) | |||||||||
| Fair value allocation | 18 | 14 | |||||||||
| Ending balance | $ | 352 | $ | 284 | |||||||
In addition to the Special Limited Partner’s interest noted above, certain of the Company’s third party joint ventures also have a redeemable non-controlling interest in such joint ventures. As of March 31, 2022 and December 31, 2021, $219.2 million and $160.8 million, respectively, related to such third party joint ventures was included in Redeemable Non-controlling Interests on the Company’s Condensed Consolidated Balance Sheets.
The Redeemable Non-controlling Interests are recorded at the greater of (i) their carrying amount, adjusted for their share of the allocation of GAAP net income (loss) and distributions, or (ii) their redemption value, which is equivalent to the fair value of such interests at the end of each measurement period. Accordingly, the Company recorded an allocation adjustment of $35.7 million and $2.8 million, during the three months ended March 31, 2022 and 2021, respectively, between Additional Paid-in Capital and Redeemable Non-controlling Interest.
14. Leases
Lessor
The Company’s rental revenue primarily consists of rent earned from operating leases at the Company’s residential, industrial, net lease, data centers, self storage, retail, and office properties. Leases at the Company’s industrial, data centers, retail, and office properties generally include a fixed base rent, and certain leases also contain a variable rent component. The variable component of the Company’s operating leases at its industrial, data centers, retail, and office properties primarily consist of the reimbursement of operating expenses such as real estate taxes, insurance, and common area maintenance costs. Rental revenue earned from leases at the Company’s residential properties primarily consist of a fixed base rent, and certain leases contain a variable component that allows for the pass-through of certain operating expenses such as utilities. Rental revenue earned from leases at the Company’s self storage properties primarily consist of a fixed base rent only.
Rental revenue from the Company’s lease at the Bellagio consists of a fixed annual rent that escalates annually throughout the term of the lease, and the tenant is generally responsible for all property-related expenses, including taxes, insurance, and maintenance. The Company assessed the classification of the Bellagio lease and determined the lease was an operating lease. The Company’s assessment included the consideration of the present value of the lease payments over the lease term and the residual value of the leased assets.
Leases at the Company’s industrial, net lease, data centers, retail, and office properties are generally longer term (greater than 12 months in length), and may contain extension and termination options at the lessee’s election. Often, these leases have annual escalations that are tied to the CPI index. Leases at the Company’s residential and self storage properties are short term in nature, generally not greater than 12 months in length.
27
The following table details the components of operating lease income from leases in which the Company is the lessor ($ in thousands):
| Three Months Ended March 31, | |||||||||||
| 2022 | 2021 | ||||||||||
| Fixed lease payments | $ | 1,212,538 | $ | 591,040 | |||||||
| Variable lease payments | 91,182 | 61,876 | |||||||||
| Rental revenue | $ | 1,303,720 | $ | 652,916 | |||||||
The following table presents the undiscounted future minimum rents the Company expects to receive for its industrial, net lease, data centers, retail, and office properties as of March 31, 2022 ($ in thousands). Leases at the Company’s residential and self storage properties are short term, generally 12 months or less, and are therefore not included.
| Year | Future Minimum Rents | |||||||
| 2022 (remaining) | $ | 1,055,157 | ||||||
| 2023 | 1,332,820 | |||||||
| 2024 | 1,183,141 | |||||||
| 2025 | 1,045,161 | |||||||
| 2026 | 924,148 | |||||||
| 2027 | 748,108 | |||||||
| Thereafter | 9,001,328 | |||||||
| Total | $ | 15,289,863 | ||||||
Lessee
Certain of the Company’s investments in real estate are subject to ground leases. The Company’s ground leases are classified as either operating leases or financing leases based on the characteristics of each lease. As of March 31, 2022, the Company had 57 ground leases classified as operating and three ground leases classified as financing. Each of the Company’s ground leases were acquired as part of the acquisition of real estate, and no incremental costs were incurred for such ground leases. The Company’s ground leases are non-cancelable, and two of the Company’s operating leases contain renewal options, one for an additional 99 year term and the other for an additional 10 year term.
The following table details the future lease payments due under the Company’s ground leases as of March 31, 2022 ($ in thousands):
| Operating Leases | Financing Leases | ||||||||||
| 2022 (remaining) | $ | 6,940 | $ | 3,041 | |||||||
| 2023 | 9,420 | 4,150 | |||||||||
| 2024 | 9,528 | 4,266 | |||||||||
| 2025 | 9,780 | 4,385 | |||||||||
| 2026 | 9,899 | 4,507 | |||||||||
| 2027 | 10,285 | 4,633 | |||||||||
| Thereafter | 1,038,666 | 564,142 | |||||||||
| Total undiscounted future lease payments | 1,094,518 | 589,124 | |||||||||
| Difference between undiscounted cash flows and discounted cash flows | (904,018) | (513,070) | |||||||||
| Total lease liability | $ | 190,500 | $ | 76,054 | |||||||
The Company utilized its incremental borrowing rate, which was between 5% and 7%, to determine its lease liabilities. As of March 31, 2022, the weighted average remaining lease term of the Company’s operating leases and financing leases was 66 years and 79 years, respectively.
Payments under the Company’s ground leases primarily contain fixed payment components that may include periodic increases based on an index or periodic fixed percentage escalations. One of the Company’s ground leases contains a variable component based on a percentage of revenue.
28
The following table details the fixed and variable components of the Company’s operating leases ($ in thousands):
| Three Months Ended March 31, | |||||||||||
| 2022 | 2021 | ||||||||||
| Fixed ground rent expense | $ | 2,269 | $ | 1,021 | |||||||
| Variable ground rent expense | 5 | — | |||||||||
| Total cash portion of ground rent expense | 2,274 | 1,021 | |||||||||
| Straight-line ground rent expense | 2,853 | 1,647 | |||||||||
| Total operating lease costs | $ | 5,127 | $ | 2,668 | |||||||
The following table details the fixed and variable components of the Company’s financing leases ($ in thousands):
| Three Months Ended March 31, | |||||||||||
| 2022 | 2021 | ||||||||||
| Interest on lease liabilities | $ | 996 | $ | 759 | |||||||
| Amortization of right-of-use assets | 324 | 247 | |||||||||
| Total financing lease costs | $ | 1,320 | $ | 1,006 | |||||||
15. Segment Reporting
The Company operates in nine reportable segments: Residential, Industrial, Net Lease, Data Centers, Hospitality, Self Storage, Retail, Office properties, and Investments in Real Estate Debt. The Company allocates resources and evaluates results based on the performance of each segment individually. The Company believes that Segment Net Operating Income is the key performance metric that captures the unique operating characteristics of each segment.
The following table details the total assets by segment ($ in thousands):
| March 31, 2022 | December 31, 2021 | ||||||||||
| Residential | $ | 44,541,991 | $ | 44,167,486 | |||||||
| Industrial | 21,284,316 | 20,898,801 | |||||||||
| Net Lease | 5,411,744 | 5,219,519 | |||||||||
| Hospitality | 3,080,965 | 3,084,271 | |||||||||
| Office | 2,688,429 | 1,232,392 | |||||||||
| Self Storage | 1,883,733 | 1,886,376 | |||||||||
| Data Centers | 1,847,478 | 1,905,660 | |||||||||
| Retail | 1,653,409 | 1,689,575 | |||||||||
| Investments in Real Estate Debt | 10,349,761 | 9,190,352 | |||||||||
| Other (Corporate) | 5,580,874 | 2,033,779 | |||||||||
| Total assets | $ | 98,322,700 | $ | 91,308,211 | |||||||
29
The following table details the financial results by segment for the three months ended March 31, 2022 ($ in thousands):
| Residential | Industrial | Net Lease | Data Centers | Hospitality | Self Storage | Retail | Office | Investments in Real Estate Debt | Total | ||||||||||||||||||||||||||||||||||||||||||||||||||
| Revenues: | |||||||||||||||||||||||||||||||||||||||||||||||||||||||||||
| Rental revenue | $ | 779,236 | $ | 340,768 | $ | 82,795 | $ | 8,181 | $ | — | $ | 45,207 | $ | 31,374 | $ | 16,159 | $ | — | $ | 1,303,720 | |||||||||||||||||||||||||||||||||||||||
| Hospitality revenue | — | — | — | — | 147,245 | — | — | — | — | 147,245 | |||||||||||||||||||||||||||||||||||||||||||||||||
| Other revenue | 54,651 | 6,135 | — | — | 2,658 | 3,138 | 507 | 1,011 | — | 68,100 | |||||||||||||||||||||||||||||||||||||||||||||||||
| Total revenues | 833,887 | 346,903 | 82,795 | 8,181 | 149,903 | 48,345 | 31,881 | 17,170 | — | 1,519,065 | |||||||||||||||||||||||||||||||||||||||||||||||||
| Expenses: | |||||||||||||||||||||||||||||||||||||||||||||||||||||||||||
| Rental property operating | 419,550 | 110,528 | 297 | 1,272 | — | 21,030 | 9,919 | 4,391 | — | 566,987 | |||||||||||||||||||||||||||||||||||||||||||||||||
| Hospitality operating | — | — | — | — | 103,463 | — | — | — | — | 103,463 | |||||||||||||||||||||||||||||||||||||||||||||||||
| Total expenses | 419,550 | 110,528 | 297 | 1,272 | 103,463 | 21,030 | 9,919 | 4,391 | — | 670,450 | |||||||||||||||||||||||||||||||||||||||||||||||||
| (Loss) income from unconsolidated entities | (28,800) | 224,720 | 25,273 | (38,469) | — | — | (189) | 1,690 | — | 184,225 | |||||||||||||||||||||||||||||||||||||||||||||||||
| Loss from investments in real estate debt | — | — | — | — | — | — | — | — | (34,044) | (34,044) | |||||||||||||||||||||||||||||||||||||||||||||||||
Loss from investments in equity securities(1) | (75,501) | (7,496) | (3,694) | — | — | — | — | (14,470) | — | (101,161) | |||||||||||||||||||||||||||||||||||||||||||||||||
| Segment net operating income (loss) | $ | 310,036 | $ | 453,599 | $ | 104,077 | $ | (31,560) | $ | 46,440 | $ | 27,315 | $ | 21,773 | $ | (1) | $ | (34,044) | $ | 897,635 | |||||||||||||||||||||||||||||||||||||||
| Depreciation and amortization | $ | (572,968) | $ | (208,366) | $ | (28,637) | $ | (3,557) | $ | (27,076) | $ | (31,332) | $ | (35,281) | $ | (7,834) | $ | — | $ | (915,051) | |||||||||||||||||||||||||||||||||||||||
| General and administrative | $ | (13,106) | |||||||||||||||||||||||||||||||||||||||||||||||||||||||||
| Management fee | (189,150) | ||||||||||||||||||||||||||||||||||||||||||||||||||||||||||
| Performance participation allocation | (411,569) | ||||||||||||||||||||||||||||||||||||||||||||||||||||||||||
| Net gain on dispositions of real estate | 205,262 | ||||||||||||||||||||||||||||||||||||||||||||||||||||||||||
| Interest expense | (306,459) | ||||||||||||||||||||||||||||||||||||||||||||||||||||||||||
| Gain on extinguishment of debt | 1,395 | ||||||||||||||||||||||||||||||||||||||||||||||||||||||||||
| Other income | 634,464 | ||||||||||||||||||||||||||||||||||||||||||||||||||||||||||
| Net loss | $ | (96,579) | |||||||||||||||||||||||||||||||||||||||||||||||||||||||||
| Net loss attributable to non-controlling interests in third party joint ventures | $ | 44,255 | |||||||||||||||||||||||||||||||||||||||||||||||||||||||||
| Net loss attributable to non-controlling interests in BREIT OP | 656 | ||||||||||||||||||||||||||||||||||||||||||||||||||||||||||
| Net loss attributable to BREIT stockholders | $ | (51,668) | |||||||||||||||||||||||||||||||||||||||||||||||||||||||||
(1) Included within other income on the Condensed Consolidated Statements of Operations.
30
The following table details the financial results by segment for the three months ended March 31, 2021 ($ in thousands):
| Residential | Industrial | Net Lease | Data Centers(1) | Hospitality | Self Storage | Retail | Office | Investments in Real Estate Debt | Total | ||||||||||||||||||||||||||||||||||||||||||||||||||
| Revenues: | |||||||||||||||||||||||||||||||||||||||||||||||||||||||||||
| Rental revenue | $ | 288,453 | $ | 220,743 | $ | 82,795 | $ | 6,017 | $ | — | $ | 30,975 | $ | 14,430 | $ | 9,503 | $ | — | $ | 652,916 | |||||||||||||||||||||||||||||||||||||||
| Hospitality revenue | — | — | — | — | 58,143 | — | — | — | — | 58,143 | |||||||||||||||||||||||||||||||||||||||||||||||||
| Other revenue | 14,064 | 3,850 | — | — | 1,676 | 1,996 | 757 | 53 | — | 22,396 | |||||||||||||||||||||||||||||||||||||||||||||||||
| Total revenues | 302,517 | 224,593 | 82,795 | 6,017 | 59,819 | 32,971 | 15,187 | 9,556 | — | 733,455 | |||||||||||||||||||||||||||||||||||||||||||||||||
| Expenses: | |||||||||||||||||||||||||||||||||||||||||||||||||||||||||||
| Rental property operating | 139,941 | 72,823 | 221 | 1,049 | — | 15,708 | 4,909 | 3,054 | — | 237,705 | |||||||||||||||||||||||||||||||||||||||||||||||||
| Hospitality operating | — | — | — | — | 55,680 | — | — | — | — | 55,680 | |||||||||||||||||||||||||||||||||||||||||||||||||
| Total expenses | 139,941 | 72,823 | 221 | 1,049 | 55,680 | 15,708 | 4,909 | 3,054 | — | 293,385 | |||||||||||||||||||||||||||||||||||||||||||||||||
| Income from unconsolidated entities | — | 9,335 | 25,347 | — | — | — | — | — | — | 34,682 | |||||||||||||||||||||||||||||||||||||||||||||||||
| Income from investments in real estate debt | — | — | — | — | — | — | — | — | 239,361 | 239,361 | |||||||||||||||||||||||||||||||||||||||||||||||||
Income from investments in equity securities(2) | 56,053 | 21,642 | 8,878 | — | — | — | — | 4,538 | — | 91,111 | |||||||||||||||||||||||||||||||||||||||||||||||||
| Segment net operating income | $ | 218,629 | $ | 182,747 | $ | 116,799 | $ | 4,968 | $ | 4,139 | $ | 17,263 | $ | 10,278 | $ | 11,040 | $ | 239,361 | $ | 805,224 | |||||||||||||||||||||||||||||||||||||||
| Depreciation and amortization | $ | (168,043) | $ | (129,370) | $ | (28,499) | $ | (2,525) | $ | (22,706) | $ | (37,751) | $ | (7,610) | $ | (3,883) | $ | — | $ | (400,387) | |||||||||||||||||||||||||||||||||||||||
| General and administrative | $ | (6,960) | |||||||||||||||||||||||||||||||||||||||||||||||||||||||||
| Management fee | (73,095) | ||||||||||||||||||||||||||||||||||||||||||||||||||||||||||
| Performance participation allocation | (143,215) | ||||||||||||||||||||||||||||||||||||||||||||||||||||||||||
| Net gain on dispositions of real estate | 15,430 | ||||||||||||||||||||||||||||||||||||||||||||||||||||||||||
| Interest expense | (181,532) | ||||||||||||||||||||||||||||||||||||||||||||||||||||||||||
| Loss on extinguishment of debt | (3,416) | ||||||||||||||||||||||||||||||||||||||||||||||||||||||||||
| Other income | 16,835 | ||||||||||||||||||||||||||||||||||||||||||||||||||||||||||
| Net income | $ | 28,884 | |||||||||||||||||||||||||||||||||||||||||||||||||||||||||
| Net income attributable to non-controlling interests in third party joint ventures | $ | (59) | |||||||||||||||||||||||||||||||||||||||||||||||||||||||||
| Net income attributable to non-controlling interests in BREIT OP | (353) | ||||||||||||||||||||||||||||||||||||||||||||||||||||||||||
| Net income attributable to BREIT stockholders | $ | 28,472 | |||||||||||||||||||||||||||||||||||||||||||||||||||||||||
(1) Previously included within the Industrial segment.
(2) Included within other income on the Condensed Consolidated Statements of Operations.
16. Commitments and Contingencies
Litigation
From time to time, the Company may be involved in various claims and legal actions arising in the ordinary course of business. As of March 31, 2022 and December 31, 2021, the Company was not involved in any material legal proceedings.
31
ITEM 2. MANAGEMENT’S DISCUSSION AND ANALYSIS OF FINANCIAL CONDITION AND RESULTS OF OPERATIONS
References herein to “Blackstone Real Estate Income Trust,” “BREIT,” the “Company,” “we,” “us,” or “our” refer to Blackstone Real Estate Income Trust, Inc. and its subsidiaries unless the context specifically requires otherwise.
The following discussion should be read in conjunction with the unaudited condensed consolidated financial statements and notes thereto appearing elsewhere in this quarterly report on Form 10-Q.
Forward-Looking Statements
This quarterly report on Form 10-Q contains forward-looking statements within the meaning of the federal securities laws and the Private Securities Litigation Reform Act of 1995. These forward-looking statements can be identified by the use of forward-looking terminology such as “may,” “will,” “expect,” “intend,” “anticipate,” “estimate,” “believe,” “continue,” “identified” or other similar words or the negatives thereof. These may include our financial projections and estimates and their underlying assumptions, statements about plans, objectives and expectations with respect to future operations, statements with respect to acquisitions, statements regarding future performance and statements regarding identified but not yet closed acquisitions. Such forward-looking statements are inherently uncertain and there are or may be important factors that could cause actual outcomes or results to differ materially from those indicated in such statements. We believe these factors also include but are not limited to those described under the section entitled “Risk Factors” in our prospectus and our Annual Report on form 10-K for the year ended December 31, 2021, and any such updated factors included in our periodic filings with the SEC, which are accessible on the SEC’s website at www.sec.gov. These factors should not be construed as exhaustive and should be read in conjunction with the other cautionary statements that are included in this document (or our prospectus and other filings). Except as otherwise required by federal securities laws, we undertake no obligation to publicly update or revise any forward-looking statements, whether as a result of new information, future developments or otherwise.
Overview
BREIT invests primarily in stabilized income-generating commercial real estate in the United States. To a lesser extent, we may invest in real estate outside the U.S. and in real estate debt. We are the sole general partner and majority limited partner of BREIT Operating Partnership L.P. (“BREIT OP”), a Delaware limited partnership, and we own substantially all of our assets through BREIT OP. We are externally managed by BX REIT Advisors L.L.C. (the “Adviser”). The Adviser is part of the real estate group of Blackstone Inc. (“Blackstone”), a leading investment manager. We currently operate our business in nine reportable segments: Residential, Industrial, Net Lease, Data Centers, Hospitality, Self Storage, Retail, and Office Properties, and Investments in Real Estate Debt. Residential includes multifamily and other types of rental housing such as manufactured, student, affordable, and single family rental housing, as well as senior living. Net Lease includes the real estate assets of The Bellagio Las Vegas (the “Bellagio”) and the Company's unconsolidated interest in the MGM Grand and Mandalay Bay joint venture. Additional unconsolidated interests are included in the respective property segment.
BREIT is a non-listed, perpetual life real estate investment trust (“REIT”) that qualifies as a REIT under the Internal Revenue Code of 1986, as amended (the “Code”) for U.S. federal income tax. We generally will not be subject to U.S. federal income taxes on our taxable income to the extent we annually distribute all of our net taxable income to stockholders and maintain our qualification as a REIT.
As of May 13, 2022, we had received net proceeds of $58.0 billion from the sale of 4.7 billion shares of our common stock in our continuous public offering and private offerings. We contributed the net proceeds to BREIT OP in exchange for a corresponding number of Class S, Class I, Class T, and Class D units. BREIT OP has primarily used the net proceeds to make investments in real estate and real estate debt and for other general corporate purposes (including to fund repurchase requests under our share repurchase plan from time to time) as further described below under “Investment Portfolio.” We intend to continue selling shares of our common stock on a monthly basis through our continuous public offering and private offerings.
32
Recent Developments
As the novel coronavirus, or COVID-19, pandemic has evolved from its emergence in early 2020, so has its global impact. Many countries have from time to time re-instituted, or strongly encouraged, varying levels of quarantines and restrictions on travel and in some cases have at times limited operations of certain businesses and taken other restrictive measures designed to help slow the spread of COVID-19 and its variants. Governments and businesses have also instituted vaccine mandates and testing requirements for employees. While vaccine availability and uptake has increased, the longer-term macro-economic effects on global supply chains, inflation, labor shortages and wage increases continue to impact many industries. Moreover, with the potential for new strains of COVID-19 to emerge, governments and businesses may re-impose aggressive measures to help slow its spread in the future. For this reason, among others, as the COVID-19 pandemic continues, the potential global impacts are uncertain and difficult to assess.
33
Q1 2022 Highlights
Operating Results:
•Declared monthly net distributions totaling $617.5 million for the three months ended March 31, 2022. The details of the average annualized distribution rates and total returns are shown in the following table:
| Class S | Class I | Class T | Class D | |||||||||||||||||||||||
Average Annualized Distribution Rate(1) | 3.7% | 4.6% | 3.8% | 4.4% | ||||||||||||||||||||||
Year-to-Date Total Return, without upfront selling commissions(2) | 4.6% | 4.8% | 4.6% | 4.7% | ||||||||||||||||||||||
Year-to-Date Total Return, assuming maximum upfront selling commissions(2) | 1.1% | N/A | 1.0% | 3.2% | ||||||||||||||||||||||
Inception-to-Date Total Return, without upfront selling commissions(2) | 12.8% | 13.7% | 13.4% | 13.8% | ||||||||||||||||||||||
Inception-to-Date Total Return, assuming maximum upfront selling commissions(2) | 12.0% | N/A | 12.6% | 13.5% | ||||||||||||||||||||||
Investment Activity:
•Acquired 16 residential, 11 industrial, three office, and two self storage properties across nine transactions as well as 1,035 wholly-owned single family homes for a total purchase price of $2.5 billion during the three months ended March 31, 2022. The acquisitions are consistent with our strategy of acquiring diversified, income-producing real estate assets concentrated in high growth markets.
•Invested $1.6 billion in real estate debt, consisting of commercial mortgage-backed securities (“CMBS”), residential mortgage-backed securities (“RMBS”), corporate bonds, term loans, and other real estate-related investments in debt during the three months ended March 31, 2022.
Capital and Financing Activity:
•Raised $8.0 billion from the sale of shares of our common stock during the three months ended March 31, 2022. Repurchased shares of our common stock from third party investors with an aggregate NAV of $0.7 billion during the three months ended March 31, 2022. We also repurchased shares of our common stock from the Special Limited Partner with an aggregate NAV of $0.6 billion.
•Increased property-level financings by $71.2 million and reduced the financings secured by our investments in real estate debt by $147.9 million during the three months ended March 31, 2022.
Current Portfolio:
•Our portfolio as of March 31, 2022 consisted of investments in real estate (91% based on fair value) and investments in real estate debt (9%).
•Our 3,097 properties(3) as of March 31, 2022 consisted primarily of Residential (51% based on fair value), Industrial (29%), and Net Lease (7%), and our portfolio of real estate was concentrated in the following regions: South (38%), West (34%), East (16%), and Midwest (11%).
•Our investments in real estate debt as of March 31, 2022 consisted of a diversified portfolio of CMBS, RMBS, and other real estate-related debt. For further details on credit rating and underlying real estate collateral, refer to “Investment Portfolio – Investments in Real Estate Debt.”
(1)The annualized distribution rate is calculated by averaging each of the three months' annualized distribution, divided by the prior month’s net asset value, which is inclusive of all fees and expenses. The Company believes the annualized distribution rate is a useful measure of our overall investment performance.
(2)Total return is calculated as the change in NAV per share during the respective periods plus any distributions per share declared in the period, and assumes any distributions are reinvested in accordance with our distribution reinvestment plan. Total return for periods greater than one year are annualized. The Company believes total return is a useful measure of the overall investment performance of our shares.
(3)Excludes 23,724 single family rental homes. Such single family rental homes are included in the fair value amounts.
34
Investment Portfolio
Portfolio Summary
The following chart allocates our investments in real estate and real estate debt based on fair value as of March 31, 2022:
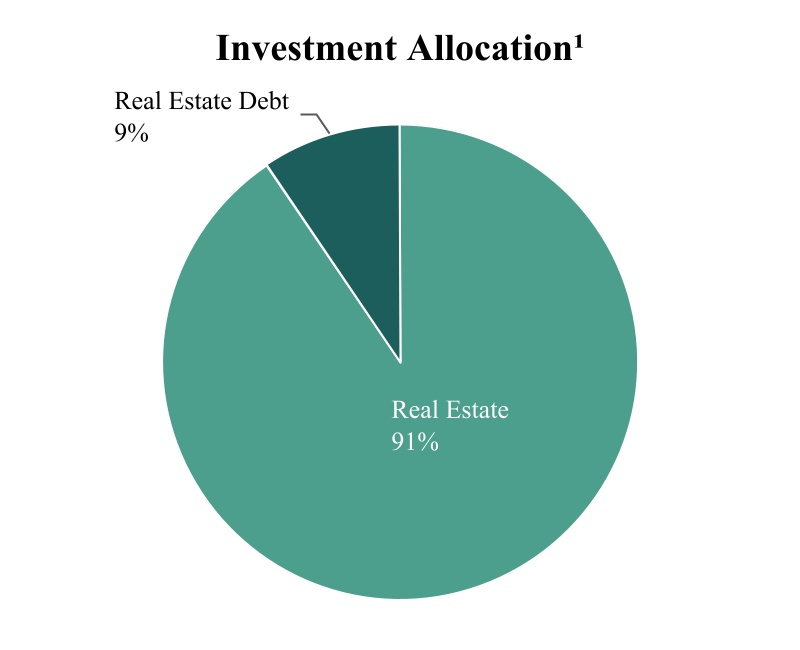
Real Estate Investments
The following charts further describe the diversification of our investments in real estate based on fair value as of March 31, 2022:

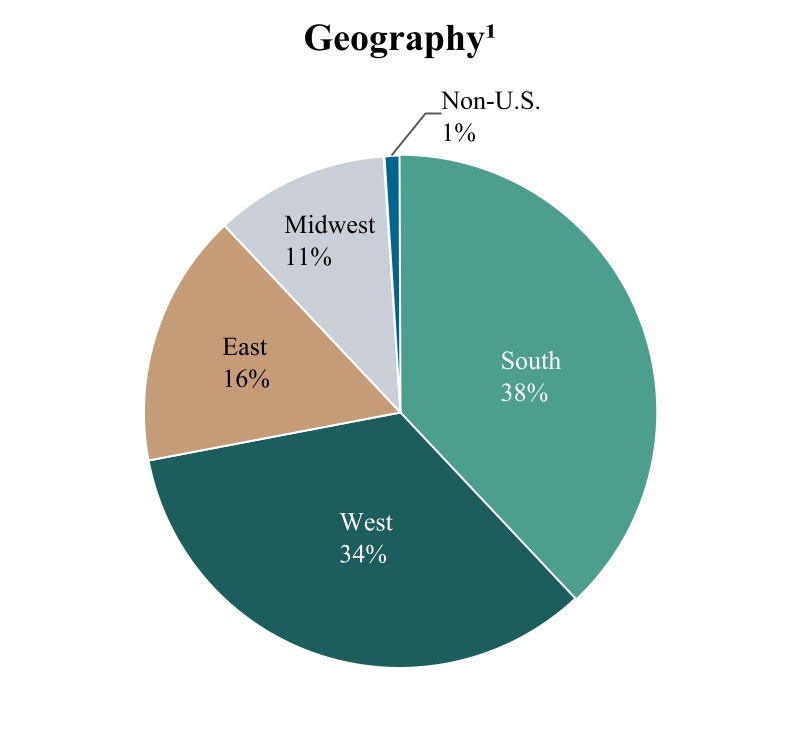
1 Geographic weighting is measured as the asset value of real estate properties, excluding the value of any third-party interests in such real estate properties, and unconsolidated investments for each geographical category against the total asset value of (i) all real estate properties, excluding the value of any third-party interests in such real estate properties, and (ii) unconsolidated investments. Property type weighting is measured as the asset value of our real estate investments for each sector category against the total asset value of all real estate investments, excluding the value of any third party interests in such real estate investments. “Real estate investments” includes our direct property investments, unconsolidated investments, and equity in public and private real estate-related companies.
35
The following map identifies the top markets of our real estate portfolio composition based on fair value as of March 31, 2022:
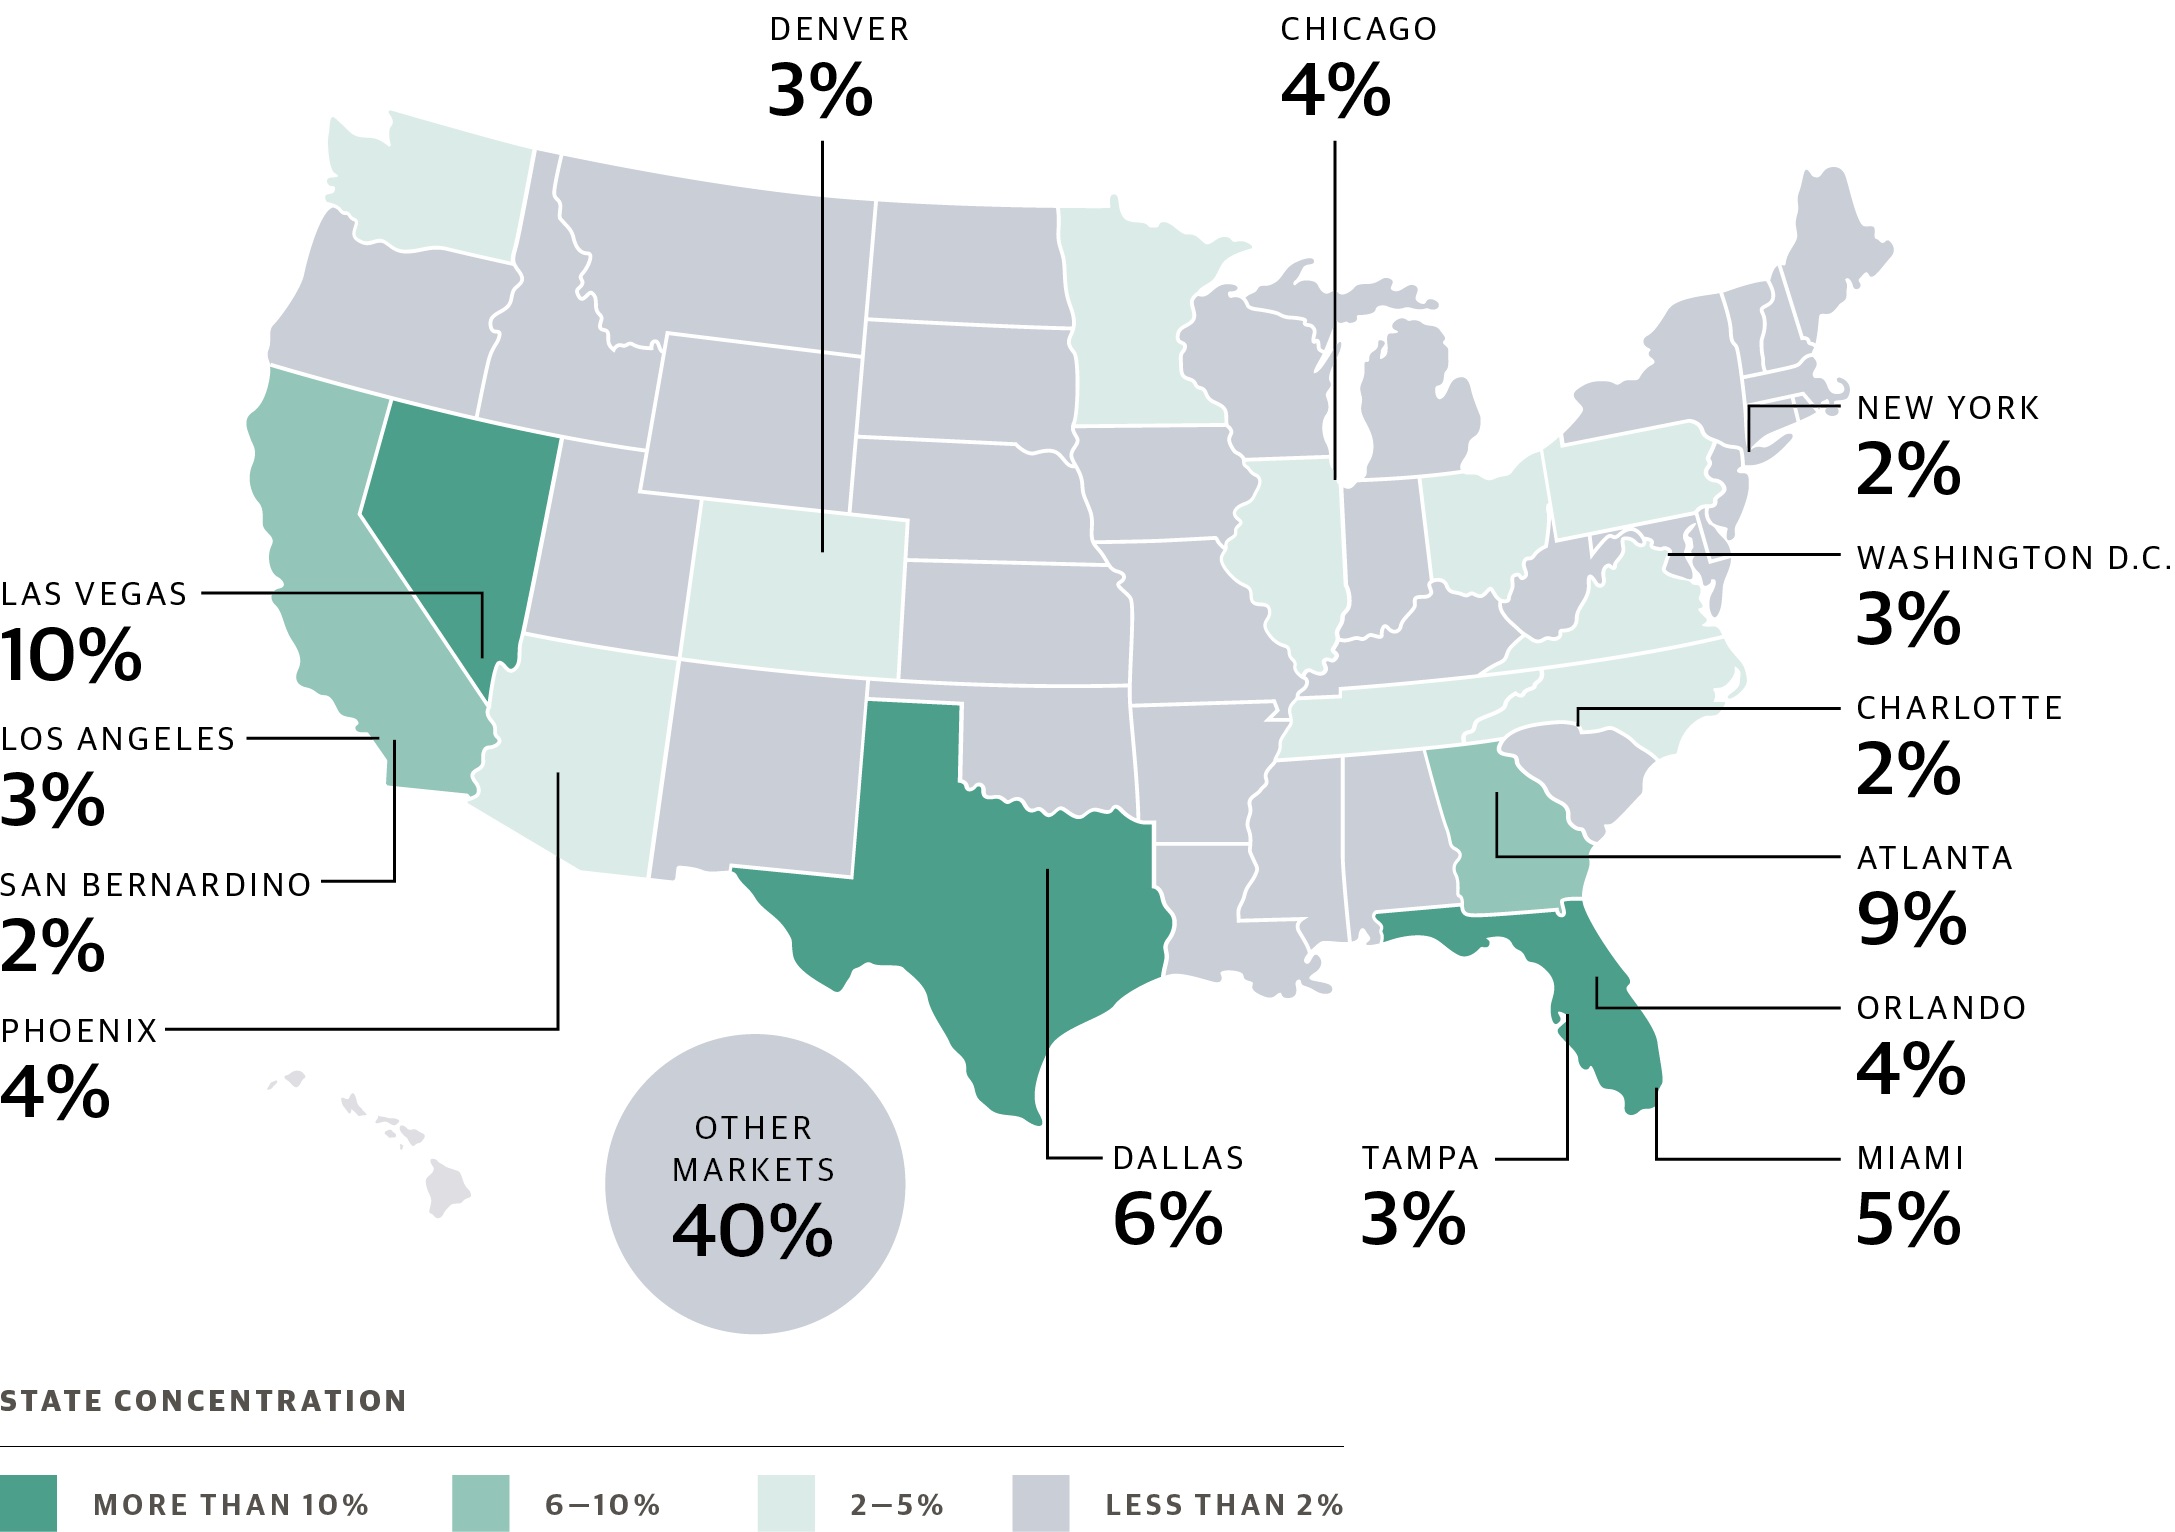
The select markets that are named represent all metropolitan statistical areas (“MSAs”) in the U.S. in which BREIT has at least a 2% portfolio concentration. BREIT is invested in additional MSAs that are not named above. Shading reflects the concentration of all real estate properties and unconsolidated investments in each state. Other Markets includes 2% of BREIT's portfolio invested in non-U.S. assets, including in Europe and Canada. Weighting is measured as the asset value of real estate properties, excluding the value of any third-party interests in such real estate properties, and unconsolidated investments for each market against the total asset value of all (i) real estate properties, excluding the value of any third-party interests in such real estate properties, and (ii) unconsolidated investments.
As of March 31, 2022, we owned a diversified portfolio of 3,097 properties and 23,724 single family rental homes concentrated in growth markets consisting of income producing assets primarily focused in Residential, Industrial, and Net Lease properties, and to a lesser extent Hospitality, Self Storage, Office, Data Centers, and Retail properties.
36
The following table provides a summary of our portfolio by segment as of March 31, 2022:
| Segment | Number of Properties(1) | Sq. Feet (in thousands)/ Units/Keys | Occupancy Rate(2) | Average Effective Annual Base Rent Per Leased Square Foot/Units/Keys(3) | Gross Asset Value(4) ($ in thousands) | Segment Revenue(5) | Percentage of Total Revenues | |||||||||||||||||||||||||||||||||||||
Residential(6) | 1,079 | 228,218 units | 94% | $14,616 | $ | 49,549,479 | $ | 840,043 | 45% | |||||||||||||||||||||||||||||||||||
| Industrial | 1,660 | 305,034 sq. ft. | 98% | $5.25 | 26,661,573 | 575,040 | 32% | |||||||||||||||||||||||||||||||||||||
| Net lease | 3 | 24,748 sq. ft. | 100% | N/A | 6,118,426 | 118,566 | 7% | |||||||||||||||||||||||||||||||||||||
| Data Centers | 64 | 11,255 sq. ft. | 100% | 13.61 | 2,422,490 | 27,434 | 2% | |||||||||||||||||||||||||||||||||||||
| Hospitality | 66 | 11,147 keys | 66% | $158.71/$104.44 | 2,898,592 | 149,903 | 8% | |||||||||||||||||||||||||||||||||||||
| Self Storage | 183 | 14,135 sq. ft. | 92% | $14.51 | 2,740,346 | 48,345 | 3% | |||||||||||||||||||||||||||||||||||||
| Office | 10 | 4,167 sq. ft. | 97% | $37.10 | 2,171,720 | 18,860 | 1% | |||||||||||||||||||||||||||||||||||||
| Retail | 32 | 5,695 sq. ft. | 95% | $22.78 | 1,834,074 | 34,028 | 2% | |||||||||||||||||||||||||||||||||||||
| Total | 3,097 | $ | 94,396,700 | $ | 1,812,219 | 100% | ||||||||||||||||||||||||||||||||||||||
(1)Residential, Industrial, Net Lease, Data Centers, Office, and Retail, include properties owned by unconsolidated entities. Single family rental homes are accounted for in residential units and are not reflected in the number of properties.
(2)For our industrial, net lease, data center, retail and office investments, occupancy includes all leased square footage as of March 31, 2022. For our multifamily, student housing and affordable housing investments, occupancy is defined as the percentage of actual rent divided by gross potential rent (defined as actual rent for occupied units and market rent for vacant units) for the three months ended March 31, 2022. For our single family rental investments, the occupancy rate includes occupied homes for the three months ended March 31, 2022. For our self storage, manufactured housing and senior living investments, the occupancy rate includes occupied square footage, occupied sites and occupied units, respectively, as of March 31, 2022. The occupancy rate for our hospitality investments includes paid occupied rooms for the 12 months ended March 31, 2022. Hospitality investments owned less than 12 months are excluded. Unconsolidated investments are excluded from occupancy calculations.
(3)For industrial, data centers, net lease, manufactured housing, self storage, retail, and office properties, average effective annual base rent represents the annualized March 31, 2022 base rent per leased square foot or unit and excludes tenant recoveries, straight-line rent, and above-market and below-market lease amortization. For multifamily and residential properties other than manufactured housing, average effective annual base rent represents the base rent for the three months ended March 31, 2022 per leased unit, and excludes tenant recoveries, straight-line rent, and above-market and below-market lease amortization. For hospitality properties, average effective annual base rent represents Average Daily Rate (“ADR”) and Revenue Per Available Room (“RevPAR”), respectively, for the 12 months ended March 31, 2022. Hospitality investments owned less than 12 months are excluded from the ADR and RevPAR calculations.
(4)Based on fair value as of March 31, 2022.
(5)Segment revenue is presented for the three months ended March 31, 2022. Residential, Industrial, Net Lease, Data Centers, Office, and Retail segment revenue includes income from unconsolidated entities, excluding our share of depreciation expense from the unconsolidated entities.
(6)Residential includes multifamily and other types of rental housing such as manufactured, student, affordable, and single family rental housing, as well as senior living. Residential units include multifamily units, affordable housing units, manufactured housing sites, student housing units, single family rental homes and senior living units.
37
Real Estate
The following table provides information regarding our real estate portfolio as of March 31, 2022:
| Segment and Investment | Number of Properties(1) | Location | Acquisition Date | Ownership Interest(2) | Sq. Feet (in thousands)/Units/Keys(1) | Occupancy Rate(3) | ||||||||||||||||||||||||||||||||
| Residential: | ||||||||||||||||||||||||||||||||||||||
| TA Multifamily Portfolio | 5 | Various | April 2017 | 100% | 2,053 units | 93% | ||||||||||||||||||||||||||||||||
| Emory Point | 1 | Atlanta, GA | May 2017 | 100% | 750 units | 95% | ||||||||||||||||||||||||||||||||
| Nevada West Multifamily | 3 | Las Vegas, NV | May 2017 | 100% | 972 units | 92% | ||||||||||||||||||||||||||||||||
| Mountain Gate & Trails Multifamily | 2 | Las Vegas, NV | June 2017 | 100% | 539 units | 94% | ||||||||||||||||||||||||||||||||
| Elysian West Multifamily | 1 | Las Vegas, NV | July 2017 | 100% | 466 units | 96% | ||||||||||||||||||||||||||||||||
| Gilbert Multifamily | 2 | Gilbert, AZ | Sept. 2017 | 90% | 748 units | 95% | ||||||||||||||||||||||||||||||||
| Domain & GreenVue Multifamily | 2 | Dallas, TX | Sept. 2017 | 100% | 803 units | 94% | ||||||||||||||||||||||||||||||||
| ACG II Multifamily | 3 | Various | Sept. 2017 | 94% | 740 units | 94% | ||||||||||||||||||||||||||||||||
| Olympus Multifamily | 3 | Jacksonville, FL | Nov. 2017 | 95% | 1,032 units | 92% | ||||||||||||||||||||||||||||||||
| Amberglen West Multifamily | 1 | Hillsboro, OR | Nov. 2017 | 100% | 396 units | 94% | ||||||||||||||||||||||||||||||||
| Aston Multifamily Portfolio | 17 | Various | Various | 100% | 3,731 units | 94% | ||||||||||||||||||||||||||||||||
| Talavera and Flamingo Multifamily | 2 | Las Vegas, NV | Dec. 2017 | 100% | 674 units | 93% | ||||||||||||||||||||||||||||||||
| Walden Pond & Montair Multifamily Portfolio | 2 | Everett, WA & Thornton, CO | Dec. 2017 | 95% | 636 units | 93% | ||||||||||||||||||||||||||||||||
| Signature at Kendall Multifamily | 1 | Miami, FL | Dec. 2017 | 100% | 546 units | 93% | ||||||||||||||||||||||||||||||||
| Blue Hills Multifamily | 1 | Boston, MA | May 2018 | 100% | 472 units | 94% | ||||||||||||||||||||||||||||||||
| Wave Multifamily Portfolio | 6 | Various | May 2018 | 100% | 2,199 units | 94% | ||||||||||||||||||||||||||||||||
| ACG III Multifamily | 2 | Gresham, OR & Turlock, CA | May 2018 | 95% | 475 units | 93% | ||||||||||||||||||||||||||||||||
| Carroll Florida Multifamily | 2 | Jacksonville & Orlando, FL | May 2018 | 100% | 716 units | 92% | ||||||||||||||||||||||||||||||||
| Solis at Flamingo | 1 | Las Vegas, NV | June 2018 | 95% | 524 units | 91% | ||||||||||||||||||||||||||||||||
| Velaire at Aspera | 1 | Phoenix, AZ | July 2018 | 100% | 286 units | 95% | ||||||||||||||||||||||||||||||||
| Coyote Multifamily Portfolio | 6 | Phoenix, AZ | Aug. 2018 | 100% | 1,752 units | 94% | ||||||||||||||||||||||||||||||||
| Avanti Apartments | 1 | Las Vegas, NV | Dec. 2018 | 100% | 414 units | 96% | ||||||||||||||||||||||||||||||||
| Gilbert Heritage Apartments | 1 | Phoenix, AZ | Feb. 2019 | 90% | 256 units | 94% | ||||||||||||||||||||||||||||||||
| Roman Multifamily Portfolio | 14 | Various | Feb. 2019 | 100% | 3,743 units | 94% | ||||||||||||||||||||||||||||||||
| Elevation Plaza Del Rio | 1 | Phoenix, AZ | April 2019 | 90% | 333 units | 96% | ||||||||||||||||||||||||||||||||
| Courtney at Universal Multifamily | 1 | Orlando, FL | April 2019 | 100% | 355 units | 92% | ||||||||||||||||||||||||||||||||
| Citymark Multifamily 2-Pack | 2 | Las Vegas, NV & Lithia Springs, GA | April 2019 | 95% | 608 units | 93% | ||||||||||||||||||||||||||||||||
| Tri-Cities Multifamily 2-Pack | 2 | Richland & Kennewick, WA | April 2019 | 95% | 428 units | 92% | ||||||||||||||||||||||||||||||||
| Raider Multifamily Portfolio | 4 | Las Vegas, NV | Various | 100% | 1,514 units | 94% | ||||||||||||||||||||||||||||||||
| Bridge II Multifamily Portfolio | 6 | Various | Various | 100% | 2,363 units | 93% | ||||||||||||||||||||||||||||||||
| Miami Doral 2-Pack | 2 | Miami, FL | May 2019 | 100% | 720 units | 96% | ||||||||||||||||||||||||||||||||
| Davis Multifamily 2-Pack | 2 | Raleigh, NC & Jacksonville, FL | May 2019 | 100% | 454 units | 93% | ||||||||||||||||||||||||||||||||
| Slate Savannah | 1 | Savannah, GA | May 2019 | 90% | 272 units | 98% | ||||||||||||||||||||||||||||||||
| Amara at MetroWest | 1 | Orlando, FL | May 2019 | 95% | 411 units | 94% | ||||||||||||||||||||||||||||||||
| Colorado 3-Pack | 3 | Denver & Fort Collins, CO | May 2019 | 100% | 855 units | 94% | ||||||||||||||||||||||||||||||||
| Edge Las Vegas | 1 | Las Vegas, NV | June 2019 | 95% | 296 units | 96% | ||||||||||||||||||||||||||||||||
| ACG IV Multifamily | 2 | Woodland, CA & Puyallup, WA | June 2019 | 95% | 606 units | 95% | ||||||||||||||||||||||||||||||||
| Perimeter Multifamily 3-Pack | 3 | Atlanta, GA | June 2019 | 100% | 691 units | 94% | ||||||||||||||||||||||||||||||||
| Anson at the Lakes | 1 | Charlotte, NC | June 2019 | 100% | 694 units | 94% | ||||||||||||||||||||||||||||||||
| San Valiente Multifamily | 1 | Phoenix, AZ | July 2019 | 95% | 604 units | 94% | ||||||||||||||||||||||||||||||||
| Edgewater at the Cove | 1 | Oregon City, OR | Aug. 2019 | 100% | 244 units | 91% | ||||||||||||||||||||||||||||||||
| Haven 124 Multifamily | 1 | Denver, CO | Sept. 2019 | 100% | 562 units | 92% | ||||||||||||||||||||||||||||||||
| Villages at McCullers Walk Multifamily | 1 | Raleigh, NC | Oct. 2019 | 100% | 412 units | 95% | ||||||||||||||||||||||||||||||||
| Canopy at Citrus Park Multifamily | 1 | Largo, FL | Oct. 2019 | 90% | 318 units | 93% | ||||||||||||||||||||||||||||||||
| Ridge Multifamily Portfolio | 4 | Las Vegas, NV | Oct. 2019 | 90% | 1,220 units | 93% | ||||||||||||||||||||||||||||||||
| Charleston on 66th Multifamily | 1 | Tampa, FL | Nov. 2019 | 95% | 258 units | 93% | ||||||||||||||||||||||||||||||||
| Evolve at Timber Creek Multifamily | 1 | Garner, NC | Nov. 2019 | 100% | 304 units | 95% | ||||||||||||||||||||||||||||||||
| Solis at Towne Center Multifamily | 1 | Glendale, AZ | Nov. 2019 | 100% | 240 units | 95% | ||||||||||||||||||||||||||||||||
| Arches at Hidden Creek Multifamily | 1 | Chandler, AZ | Nov. 2019 | 98% | 432 units | 91% | ||||||||||||||||||||||||||||||||
| Terra Multifamily | 1 | Austin, TX | Dec. 2019 | 100% | 372 units | 94% | ||||||||||||||||||||||||||||||||
| Arium Multifamily Portfolio | 5 | Various | Dec. 2019 | 100% | 1,684 units | 93% | ||||||||||||||||||||||||||||||||
| Easton Gardens Multifamily | 1 | Columbus, OH | Feb. 2020 | 95% | 1,064 units | 95% | ||||||||||||||||||||||||||||||||
| Acorn Multifamily Portfolio | 21 | Various | Feb. & May 2020 | 98% | 8,309 units | 94% | ||||||||||||||||||||||||||||||||
| Indigo West Multifamily | 1 | Orlando, FL | March 2020 | 100% | 456 units | 93% | ||||||||||||||||||||||||||||||||
| The Sixes Multifamily | 1 | Holly Springs, GA | Sept. 2020 | 100% | 340 units | 95% | ||||||||||||||||||||||||||||||||
| Park & Market Multifamily | 1 | Raleigh, NC | Oct. 2020 | 100% | 409 units | 94% | ||||||||||||||||||||||||||||||||
| Cortland Lex Multifamily | 1 | Alpharetta, GA | Oct. 2020 | 100% | 360 units | 96% | ||||||||||||||||||||||||||||||||
38
| Segment and Investment | Number of Properties(1) | Location | Acquisition Date | Ownership Interest(2) | Sq. Feet (in thousands)/Units/Keys(1) | Occupancy Rate(3) | ||||||||||||||||||||||||||||||||
| The Palmer Multifamily | 1 | Charlotte, NC | Oct. 2020 | 90% | 318 units | 95% | ||||||||||||||||||||||||||||||||
| Grizzly Multifamily Portfolio | 2 | Atlanta, GA & Nashville, TN | Oct. & Nov. 2020 | 100% | 767 units | 94% | ||||||||||||||||||||||||||||||||
| Jaguar Multifamily Portfolio | 11 | Various | Nov. & Dec. 2020 | 100% | 3,788 units | 94% | ||||||||||||||||||||||||||||||||
| Kansas City Multifamily Portfolio | 2 | Overland Park & Olathe, KS | Dec. 2020 | 100% | 620 units | 93% | ||||||||||||||||||||||||||||||||
| The View at Woodstock Multifamily | 1 | Woodstock, GA | Jan. 2021 | 100% | 320 units | 97% | ||||||||||||||||||||||||||||||||
| Southeast Multifamily Portfolio | 2 | Lebanon, TN & Sanford, FL | Feb. 2021 | 98% | 330 units | 94% | ||||||||||||||||||||||||||||||||
| Cortona South Tampa Multifamily | 1 | Tampa, FL | April 2021 | 100% | 300 units | 93% | ||||||||||||||||||||||||||||||||
| Crest at Park Central Multifamily | 1 | Dallas, TX | April 2021 | 100% | 387 units | 96% | ||||||||||||||||||||||||||||||||
| Archer & Rosery Multifamily Portfolio | 2 | Acworth, GA & Largo, FL | April & May 2021 | 100% | 539 units | 92% | ||||||||||||||||||||||||||||||||
| Encore Tessera Multifamily | 1 | Phoenix, AZ | May 2021 | 80% | 240 units | 94% | ||||||||||||||||||||||||||||||||
| Acorn 2.0 Multifamily Portfolio | 18 | Various | Various | 98% | 6,997 units | 85% | ||||||||||||||||||||||||||||||||
| Vue at Centennial Multifamily | 1 | Las Vegas, NV | June 2021 | 100% | 372 units | 95% | ||||||||||||||||||||||||||||||||
| Charlotte Multifamily Portfolio | 3 | Various | June & Aug. 2021 | 100% | 876 units | 92% | ||||||||||||||||||||||||||||||||
| Haven by Watermark Multifamily | 1 | Denver, CO | June 2021 | 100% | 206 units | 94% | ||||||||||||||||||||||||||||||||
| Legacy North Multifamily | 1 | Plano, TX | Aug. 2021 | 100% | 1,675 units | 93% | ||||||||||||||||||||||||||||||||
| The Brooke Multifamily | 1 | Atlanta, GA | Aug. 2021 | 100% | 537 units | 91% | ||||||||||||||||||||||||||||||||
| One Boynton Multifamily | 1 | Boynton Beach, FL | Aug. 2021 | 100% | 494 units | 92% | ||||||||||||||||||||||||||||||||
| Falcon Landing Multifamily | 1 | Katy, TX | Aug. 2021 | 90% | 386 units | 94% | ||||||||||||||||||||||||||||||||
| Town Lantana Multifamily | 1 | Lantana, FL | Sept. 2021 | 90% | 360 units | 94% | ||||||||||||||||||||||||||||||||
| Ring Multifamily Portfolio | 12 | Various | Sept. 2021 | 100% | 3,030 units | 94% | ||||||||||||||||||||||||||||||||
| Villages at Pecan Grove Multifamily | 1 | Holly Springs, NC | Nov. 2021 | 100% | 336 units | 94% | ||||||||||||||||||||||||||||||||
| Cielo Morrison Multifamily Portfolio | 2 | Charlotte, NC | Nov. 2021 | 90% | 419 units | 91% | ||||||||||||||||||||||||||||||||
| FiveTwo at Highland Multifamily | 1 | Austin, TX | Nov. 2021 | 90% | 390 units | 95% | ||||||||||||||||||||||||||||||||
| Roman 2.0 Multifamily Portfolio | 20 | Various | Dec. 2021 & Jan. 2022 | 100% | 6,341 units | 95% | ||||||||||||||||||||||||||||||||
| Kapilina Beach Homes Multifamily | 1 | Ewa Beach, HI | Dec. 2021 | 100% | 1,459 units | 87% | ||||||||||||||||||||||||||||||||
| SeaTac Multifamily Portfolio | 2 | Edgewood & Everett, WA | Dec. 2021 | 90% | 480 units | 93% | ||||||||||||||||||||||||||||||||
| Villages at Raleigh Beach Multifamily | 1 | Raleigh, NC | Jan. 2022 | 100% | 392 units | 94% | ||||||||||||||||||||||||||||||||
| Raider 2.0 Multifamily Portfolio | 1 | Las Vegas, NV | March 2022 | 100% | 492 units | 92% | ||||||||||||||||||||||||||||||||
| Highroads MH | 3 | Phoenix, AZ | April 2018 | 99.6% | 265 units | 97% | ||||||||||||||||||||||||||||||||
| Evergreen Minari MH | 2 | Phoenix, AZ | June 2018 | 99.6% | 115 units | 96% | ||||||||||||||||||||||||||||||||
| Southwest MH | 12 | Various | June 2018 | 99.6% | 2,568 units | 90% | ||||||||||||||||||||||||||||||||
| Hidden Springs MH | 1 | Desert Hot Springs, CA | July 2018 | 99.6% | 317 units | 85% | ||||||||||||||||||||||||||||||||
| SVPAC MH | 2 | Phoenix, AZ | July 2018 | 99.6% | 233 units | 99% | ||||||||||||||||||||||||||||||||
| Riverest MH | 1 | Tavares, FL | Dec. 2018 | 99.6% | 130 units | 95% | ||||||||||||||||||||||||||||||||
| Angler MH Portfolio | 4 | Phoenix, AZ | April 2019 | 99.6% | 770 units | 93% | ||||||||||||||||||||||||||||||||
| Florida MH 4-Pack | 4 | Various | April & July 2019 | 99.6% | 799 units | 95% | ||||||||||||||||||||||||||||||||
| Impala MH | 3 | Phoenix & Chandler, AZ | July 2019 | 99.6% | 333 units | 99% | ||||||||||||||||||||||||||||||||
| Clearwater MHC 2-Pack | 2 | Clearwater, FL | March & Aug. 2020 | 99.6% | 207 units | 97% | ||||||||||||||||||||||||||||||||
| Legacy MH Portfolio | 7 | Various | April 2020 | 99.6% | 1,896 units | 91% | ||||||||||||||||||||||||||||||||
| May Manor MH | 1 | Lakeland, FL | June 2020 | 99.6% | 297 units | 79% | ||||||||||||||||||||||||||||||||
| Royal Oaks MH | 1 | Petaluma, CA | Nov. 2020 | 99.6% | 94 units | 99% | ||||||||||||||||||||||||||||||||
| Southeast MH Portfolio | 34 | Various | Dec. 2020 | 99.6% | 7,442 units | 86% | ||||||||||||||||||||||||||||||||
| Redwood Village MH | 1 | Santa Rosa, CA | July 2021 | 99.6% | 67 units | 100% | ||||||||||||||||||||||||||||||||
| Courtly Manor MH | 1 | Hialeah, FL | Oct. 2021 | 99.6% | 525 units | 100% | ||||||||||||||||||||||||||||||||
| Crescent Valley MH | 1 | Newhall, CA | Nov. 2021 | 99.6% | 85 units | 93% | ||||||||||||||||||||||||||||||||
| EdR Student Housing Portfolio | 20 | Various | Sept. 2018 | 95% | 3,460 units | 97% | ||||||||||||||||||||||||||||||||
| Mercury 3100 Student Housing | 1 | Orlando, FL | Feb. 2021 | 100% | 228 units | 99% | ||||||||||||||||||||||||||||||||
| Signal Student Housing Portfolio | 8 | Various | Aug. 2021 | 96% | 1,749 units | 94% | ||||||||||||||||||||||||||||||||
| Standard at Fort Collins Student Housing | 1 | Fort Collins, CO | Nov. 2021 | 97% | 237 units | 97% | ||||||||||||||||||||||||||||||||
| Intel Student Housing Portfolio | 4 | Reno, NV | Various | 98% | 805 units | 99% | ||||||||||||||||||||||||||||||||
| Signal 2.0 Student Housing Portfolio | 2 | Buffalo, NY & Athens, GA | Dec. 2021 | 97% | 366 units | 98% | ||||||||||||||||||||||||||||||||
| Cardinal Student Housing Portfolio | 8 | Various | March 2022 | 98% | 1,703 units | 95% | ||||||||||||||||||||||||||||||||
| Legacy on Rio Student Housing | 1 | Austin, TX | March 2022 | 97% | 149 units | 99% | ||||||||||||||||||||||||||||||||
Home Partners of America(4) | N/A(1) | Various | Various | Various(4) | 23,724 units | 97% | ||||||||||||||||||||||||||||||||
| Quebec Independent Living Portfolio | 10 | Quebec, Canada | Aug. 2021 | 95% | 2,877 units | 81% | ||||||||||||||||||||||||||||||||
Ace Affordable Housing Portfolio(5) | 650 | Various | Dec. 2021 | Various(6) | 79,658 units | 96% | ||||||||||||||||||||||||||||||||
| Florida Affordable Housing Portfolio | 44 | Various | Various | 100% | 11,157 units | 98% | ||||||||||||||||||||||||||||||||
| Total Residential | 1,079 | 228,218 units | ||||||||||||||||||||||||||||||||||||
| Industrial: | ||||||||||||||||||||||||||||||||||||||
| Stockton Industrial Park | 1 | Stockton, CA | Feb. 2017 | 100% | 878 sq. ft. | 100% | ||||||||||||||||||||||||||||||||
39
| Segment and Investment | Number of Properties(1) | Location | Acquisition Date | Ownership Interest(2) | Sq. Feet (in thousands)/Units/Keys(1) | Occupancy Rate(3) | ||||||||||||||||||||||||||||||||
| HS Industrial Portfolio | 36 | Various | April 2017 | 100% | 5,838 sq. ft. | 97% | ||||||||||||||||||||||||||||||||
| Fairfield Industrial Portfolio | 11 | Fairfield, NJ | Sept. 2017 | 100% | 578 sq. ft. | 99% | ||||||||||||||||||||||||||||||||
| Southeast Industrial Portfolio | 5 | Various | Nov. 2017 | 100% | 1,927 sq. ft. | 100% | ||||||||||||||||||||||||||||||||
| Kraft Chicago Industrial Portfolio | 3 | Aurora, IL | Jan. 2018 | 100% | 1,693 sq. ft. | 100% | ||||||||||||||||||||||||||||||||
| Canyon Industrial Portfolio | 145 | Various | March 2018 | 100% | 20,954 sq. ft. | 98% | ||||||||||||||||||||||||||||||||
| HP Cold Storage Industrial Portfolio | 6 | Various | May 2018 | 100% | 2,259 sq. ft. | 100% | ||||||||||||||||||||||||||||||||
| Meridian Industrial Portfolio | 106 | Various | Nov. 2018 | 99% | 14,014 sq. ft. | 98% | ||||||||||||||||||||||||||||||||
| Stockton Distribution Center | 1 | Stockton, CA | Dec. 2018 | 100% | 987 sq. ft. | 100% | ||||||||||||||||||||||||||||||||
| Summit Industrial Portfolio | 8 | Atlanta, GA | Dec. 2018 | 100% | 631 sq. ft. | 95% | ||||||||||||||||||||||||||||||||
| 4500 Westport Drive | 1 | Harrisburg, PA | Jan. 2019 | 100% | 179 sq. ft. | 100% | ||||||||||||||||||||||||||||||||
| Morgan Savannah | 1 | Savannah, GA | April 2019 | 100% | 357 sq. ft. | 100% | ||||||||||||||||||||||||||||||||
| Minneapolis Industrial Portfolio | 34 | Minneapolis, MN | April 2019 | 100% | 2,459 sq. ft. | 96% | ||||||||||||||||||||||||||||||||
| Atlanta Industrial Portfolio | 61 | Atlanta, GA | May 2019 | 100% | 3,779 sq. ft. | 92% | ||||||||||||||||||||||||||||||||
| Patriot Park Industrial Portfolio | 2 | Durham, NC | Sept. 2019 | 100% | 323 sq. ft. | 100% | ||||||||||||||||||||||||||||||||
| Denali Industrial Portfolio | 18 | Various | Sept. 2019 | 100% | 4,098 sq. ft. | 100% | ||||||||||||||||||||||||||||||||
| Jupiter 12 Industrial Portfolio | 306 | Various | Sept. 2019 | 100% | 62,145 sq. ft. | 98% | ||||||||||||||||||||||||||||||||
| 2201 Main Street | 1 | San Diego, CA | Oct. 2019 | 100% | 260 sq. ft. | NA | ||||||||||||||||||||||||||||||||
| Triangle Industrial Portfolio | 37 | Greensboro, NC | Jan. 2020 | 100% | 2,783 sq. ft. | 90% | ||||||||||||||||||||||||||||||||
| Midwest Industrial Portfolio | 27 | Various | Feb. 2020 | 100% | 5,940 sq. ft. | 95% | ||||||||||||||||||||||||||||||||
| Pancal Industrial Portfolio | 12 | Various | Feb. & April 2020 | 100% | 2,109 sq. ft. | 99% | ||||||||||||||||||||||||||||||||
| Grainger Distribution Center | 1 | Jacksonville, FL | March 2020 | 100% | 297 sq. ft. | 100% | ||||||||||||||||||||||||||||||||
| Diamond Industrial | 1 | Pico Rivera, CA | Aug. 2020 | 100% | 243 sq. ft. | 100% | ||||||||||||||||||||||||||||||||
| Inland Empire Industrial Portfolio | 2 | Etiwanda & Fontana, CA | Sept. 2020 | 100% | 404 sq. ft. | 100% | ||||||||||||||||||||||||||||||||
| Shield Industrial Portfolio | 13 | Various | Dec. 2020 | 100% | 2,079 sq. ft. | 100% | ||||||||||||||||||||||||||||||||
| 7520 Georgetown Industrial | 1 | Indianapolis, IN | Dec. 2020 | 100% | 425 sq. ft. | 100% | ||||||||||||||||||||||||||||||||
WC Infill Industrial Portfolio(6) | 19 | Various | Jan. & Aug. 2021 | 85% | 2,927 sq. ft. | N/A | ||||||||||||||||||||||||||||||||
Vault Industrial Portfolio(6) | 35 | Various | Jan. 2021 | 46% | 6,587 sq. ft. | N/A | ||||||||||||||||||||||||||||||||
| Chicago Infill Industrial Portfolio | 7 | Various | Feb. 2021 | 100% | 1,058 sq. ft. | 100% | ||||||||||||||||||||||||||||||||
| Greensboro Industrial Portfolio | 19 | Various | April 2021 | 100% | 2,068 sq. ft. | 95% | ||||||||||||||||||||||||||||||||
| NW Corporate Center | 3 | El Paso, TX | July 2021 | 100% | 692 sq. ft. | 100% | ||||||||||||||||||||||||||||||||
| I-85 Southeast Industrial Portfolio | 4 | Various | July & Aug. 2021 | 100% | 739 sq. ft. | 100% | ||||||||||||||||||||||||||||||||
Alaska Industrial Portfolio(6) | 27 | Various UK | July & Oct. 2021 | 22% | 8,720 sq. ft. | N/A | ||||||||||||||||||||||||||||||||
| Stephanie Industrial Portfolio | 2 | Henderson, NV | Sept. 2021 | 100% | 338 sq. ft. | 100% | ||||||||||||||||||||||||||||||||
| Capstone Industrial Portfolio | 2 | Brooklyn Park, MN | Sept. 2021 | 100% | 219 sq. ft. | 86% | ||||||||||||||||||||||||||||||||
| Winston Industrial Portfolio | 133 | Various | Oct. 2021 | Various | 32,113 sq. ft. | 98% | ||||||||||||||||||||||||||||||||
| Tempe Industrial Center | 1 | Tempe, AZ | Oct. 2021 | 100% | 175 sq. ft. | 100% | ||||||||||||||||||||||||||||||||
| Procyon Distribution Center Industrial | 1 | Las Vegas, NV | Oct. 2021 | 100% | 122 sq. ft. | 100% | ||||||||||||||||||||||||||||||||
| Northborough Industrial Portfolio | 2 | Malborough, MA | Oct. 2021 | 100% | 600 sq. ft. | 100% | ||||||||||||||||||||||||||||||||
Coldplay Logistics Portfolio(6) | 13 | Various Germany | Oct. 2021 | 10% | 1,153 sq. ft. | N/A | ||||||||||||||||||||||||||||||||
| Canyon 2.0 Industrial Portfolio | 102 | Various | Nov. 2021 | 99% | 15,218 sq. ft. | 98% | ||||||||||||||||||||||||||||||||
| Tropical Sloane Las Vegas Industrial | 1 | Las Vegas, NV | Nov. 2021 | 100% | 171 sq. ft. | 100% | ||||||||||||||||||||||||||||||||
Explorer Industrial Portfolio(6) | 328 | Various | Nov. 2021 | 12% | 70,499 sq. ft. | N/A | ||||||||||||||||||||||||||||||||
Carrix Ports Portfolio(7) | 0 | Various | Nov. 2021 | 8% | 0 sq. ft. | N/A | ||||||||||||||||||||||||||||||||
Evergreen Industrial Portfolio(6) | 12 | Various | Dec. 2021 | 10% | 6,068 sq. ft. | N/A | ||||||||||||||||||||||||||||||||
| Maplewood Industrial | 14 | Various | Dec. 2021 | 100% | 3,169 sq. ft. | 99% | ||||||||||||||||||||||||||||||||
| Meadowland Industrial Portfolio | 3 | Las Vegas, NV | Dec. 2021 | 100% | 1,138 sq. ft. | 100% | ||||||||||||||||||||||||||||||||
| Bulldog Industrial Portfolio | 7 | Suwanee, GA | Dec. 2021 | 100% | 512 sq. ft. | 99% | ||||||||||||||||||||||||||||||||
| SLC NW Commerce Industrial | 3 | Salt Lake City, UT | Dec. 2021 | 100% | 529 sq. ft. | 52% | ||||||||||||||||||||||||||||||||
Bluefin Industrial Portfolio(6) | 70 | Various | Dec. 2021 | 23% | 10,922 sq. ft. | N/A | ||||||||||||||||||||||||||||||||
| 73 Business Center Industrial Portfolio | 1 | Greensboro, NC | Dec. 2021 | 100% | 218 sq. ft. | 100% | ||||||||||||||||||||||||||||||||
| Amhurst Industrial Portfolio | 11 | Waukegan, IL | March 2022 | 100% | 1,440 sq. ft. | 83% | ||||||||||||||||||||||||||||||||
| Total Industrial | 1,660 | 305,034 sq. ft. | ||||||||||||||||||||||||||||||||||||
| Net Lease: | ||||||||||||||||||||||||||||||||||||||
| Bellagio Net Lease | 1 | Las Vegas, NV | Nov. 2019 | 95% | 8,507 sq. ft. | 100% | ||||||||||||||||||||||||||||||||
MGM Grand Net Lease(6) | 1 | Las Vegas, NV | Feb. 2020 | 49.9% | 6,917 sq. ft. | N/A | ||||||||||||||||||||||||||||||||
Mandalay Bay Net Lease(6) | 1 | Las Vegas, NV | Feb. 2020 | 49.9% | 9,324 sq. ft. | N/A | ||||||||||||||||||||||||||||||||
| Total Net Lease | 3 | 24,748 sq. ft. | ||||||||||||||||||||||||||||||||||||
| Data Centers: | ||||||||||||||||||||||||||||||||||||||
| D.C. Powered Shell Warehouse Portfolio | 9 | Ashburn & Manassas, VA | June & Dec. 2019 | 90% | 1,471 sq. ft. | 100% | ||||||||||||||||||||||||||||||||
| Highpoint Powered Shell Portfolio | 2 | Sterling, VA | June 2021 | 100% | 430 sq. ft. | 100% | ||||||||||||||||||||||||||||||||
40
| Segment and Investment | Number of Properties(1) | Location | Acquisition Date | Ownership Interest(2) | Sq. Feet (in thousands)/Units/Keys(1) | Occupancy Rate(3) | ||||||||||||||||||||||||||||||||
QTS Data Centers(6) | 53 | Various | Aug. 2021 | 33.1% | 9,354 sq. ft. | N/A | ||||||||||||||||||||||||||||||||
| Total Data Centers | 64 | 11,255 sq. ft. | ||||||||||||||||||||||||||||||||||||
| Hospitality: | ||||||||||||||||||||||||||||||||||||||
| Hyatt Place UC Davis | 1 | Davis, CA | Jan. 2017 | 100% | 127 keys | 67% | ||||||||||||||||||||||||||||||||
| Hyatt Place San Jose Downtown | 1 | San Jose, CA | June 2017 | 100% | 240 keys | 47% | ||||||||||||||||||||||||||||||||
| Florida Select-Service 4-Pack | 4 | Tampa & Orlando, FL | July 2017 | 100% | 476 keys | 76% | ||||||||||||||||||||||||||||||||
| Hyatt House Downtown Atlanta | 1 | Atlanta, GA | Aug. 2017 | 100% | 150 keys | 68% | ||||||||||||||||||||||||||||||||
| Boston/Worcester Select-Service 3-Pack | 3 | Boston & Worcester, MA | Oct. 2017 | 100% | 374 keys | 64% | ||||||||||||||||||||||||||||||||
| Henderson Select-Service 2-Pack | 2 | Henderson, NV | May 2018 | 100% | 228 keys | 79% | ||||||||||||||||||||||||||||||||
| Orlando Select-Service 2-Pack | 2 | Orlando, FL | May 2018 | 100% | 254 keys | 87% | ||||||||||||||||||||||||||||||||
| Corporex Select Service Portfolio | 5 | Various | Aug. 2018 | 100% | 601 keys | 74% | ||||||||||||||||||||||||||||||||
| JW Marriott San Antonio Hill Country Resort | 1 | San Antonio, TX | Aug. 2018 | 100% | 1,002 keys | 54% | ||||||||||||||||||||||||||||||||
| Hampton Inn & Suites Federal Way | 1 | Seattle, WA | Oct. 2018 | 100% | 142 keys | 67% | ||||||||||||||||||||||||||||||||
| Staybridge Suites Reno | 1 | Reno, NV | Nov. 2018 | 100% | 94 keys | 80% | ||||||||||||||||||||||||||||||||
| Salt Lake City Select Service 3 Pack | 3 | Salt Lake City, UT | Nov. 2018 | 60% | 454 keys | 78% | ||||||||||||||||||||||||||||||||
| Courtyard Kona | 1 | Kailua-Kona, HI | March 2019 | 100% | 455 keys | 76% | ||||||||||||||||||||||||||||||||
| Raven Select Service Portfolio | 21 | Various | June 2019 | 100% | 2,555 keys | 68% | ||||||||||||||||||||||||||||||||
| Urban 2-Pack | 1 | Chicago, IL | July 2019 | 100% | 337 keys | 39% | ||||||||||||||||||||||||||||||||
| Hyatt Regency Atlanta | 1 | Atlanta, GA | Sept. 2019 | 100% | 1,260 keys | 49% | ||||||||||||||||||||||||||||||||
| RHW Select Service Portfolio | 9 | Various | Nov. 2019 | 100% | 923 keys | 73% | ||||||||||||||||||||||||||||||||
| Key West Select Service Portfolio | 4 | Key West, FL | Oct. 2021 | 100% | 545 keys | 93% | ||||||||||||||||||||||||||||||||
| Sunbelt Select Service Portfolio | 3 | Various | Dec. 2021 | 100% | 716 keys | 64% | ||||||||||||||||||||||||||||||||
| HGI Austin University Select Service | 1 | Austin, TX | Dec. 2021 | 100% | 214 keys | 40% | ||||||||||||||||||||||||||||||||
| Total Hospitality | 66 | 11,147 keys | ||||||||||||||||||||||||||||||||||||
| Self Storage: | ||||||||||||||||||||||||||||||||||||||
| East Coast Storage Portfolio | 21 | Various | Aug. 2019 | 98% | 1,446 sq. ft. | 92% | ||||||||||||||||||||||||||||||||
| Phoenix Storage 2-Pack | 2 | Phoenix, AZ | March 2020 | 98% | 111 sq. ft. | 93% | ||||||||||||||||||||||||||||||||
| Cactus Storage Portfolio | 18 | Various | Sept. & Oct. 2020 | 98% | 1,109 sq. ft. | 89% | ||||||||||||||||||||||||||||||||
| Caltex Storage Portfolio | 4 | Various | Nov. & Dec. 2020 | 98% | 241 sq. ft. | 87% | ||||||||||||||||||||||||||||||||
| Simply Self Storage | 102 | Various | Dec. 2020 | 100% | 8,586 sq. ft. | 92% | ||||||||||||||||||||||||||||||||
| Florida Self Storage Portfolio | 2 | Cocoa & Rockledge, FL | Dec. 2020 | 98% | 159 sq. ft. | 95% | ||||||||||||||||||||||||||||||||
| Pace Storage Portfolio | 1 | Pace, FL | Dec. 2020 | 98% | 72 sq. ft. | 92% | ||||||||||||||||||||||||||||||||
| American Harbor Self Storage | 1 | Dallas, TX | Aug. 2021 | 100% | 67 sq. ft. | 94% | ||||||||||||||||||||||||||||||||
| Flamingo Self Storage Portfolio | 6 | Various | Various | 98% | 396 sq. ft. | 92% | ||||||||||||||||||||||||||||||||
| Houston Self Storage Portfolio | 7 | Various | Oct. 2021 | 100% | 455 sq. ft. | 89% | ||||||||||||||||||||||||||||||||
| Lone Star Self Storage Portfolio | 15 | Various | Nov. 2021 | 100% | 1,210 sq. ft. | 91% | ||||||||||||||||||||||||||||||||
| Richmond Self Storage | 1 | Richmond, TX | Dec. 2021 | 100% | 86 sq. ft. | 90% | ||||||||||||||||||||||||||||||||
| CubeWise Self Storage | 1 | Fort Worth, TX | Dec. 2021 | 100% | 74 sq. ft. | 91% | ||||||||||||||||||||||||||||||||
| Benbrook Self Storage | 1 | Benbrook, TX | March 2022 | 100% | 77 sq. ft. | 95% | ||||||||||||||||||||||||||||||||
| The Park Self Storage | 1 | Arlington, WA | March 2022 | 100% | 46 sq. ft. | 90% | ||||||||||||||||||||||||||||||||
| Total Self Storage | 183 | 14,135 sq. ft. | ||||||||||||||||||||||||||||||||||||
| Retail: | ||||||||||||||||||||||||||||||||||||||
| Bakers Centre | 1 | Philadelphia, PA | March 2017 | 100% | 236 sq. ft. | 100% | ||||||||||||||||||||||||||||||||
| Plaza Del Sol Retail | 1 | Burbank, CA | Oct. 2017 | 100% | 166 sq. ft. | 83% | ||||||||||||||||||||||||||||||||
| Vista Center | 1 | Miami, FL | Aug. 2018 | 100% | 89 sq. ft. | 100% | ||||||||||||||||||||||||||||||||
| El Paseo Simi Valley | 1 | Simi Valley, CA | June 2019 | 100% | 197 sq. ft. | 78% | ||||||||||||||||||||||||||||||||
| Towne Center East | 1 | Signal Hill, CA | Sept. 2019 | 100% | 163 sq. ft. | 99% | ||||||||||||||||||||||||||||||||
| Plaza Pacoima | 1 | Pacoima, CA | Oct. 2019 | 100% | 204 sq. ft. | 100% | ||||||||||||||||||||||||||||||||
| Canarsie Plaza | 1 | Brooklyn, NY | Dec. 2019 | 100% | 274 sq. ft. | 100% | ||||||||||||||||||||||||||||||||
| SoCal Grocery Portfolio | 6 | Various | Jan. 2020 | 100% | 689 sq. ft. | 95% | ||||||||||||||||||||||||||||||||
| Northeast Tower Center | 1 | Philadelphia, PA | Aug. 2021 | 100% | 301 sq. ft. | 100% | ||||||||||||||||||||||||||||||||
Southeast Retail Portfolio(6) | 6 | Various | Oct. 2021 | 50%(5) | 1,227 sq. ft. | N/A | ||||||||||||||||||||||||||||||||
| Bingo Retail Portfolio | 12 | Various | Dec 2021 | 100% | 2,149 sq. ft. | 96% | ||||||||||||||||||||||||||||||||
| Total Retail | 32 | 5,695 sq. ft. | ||||||||||||||||||||||||||||||||||||
| Office: | ||||||||||||||||||||||||||||||||||||||
| EmeryTech Office | 1 | Emeryville, CA | Oct. 2019 | 100% | 228 sq. ft. | 95% | ||||||||||||||||||||||||||||||||
| Coleman Highline Office | 1 | San Jose, CA | Oct. 2020 | 100% | 357 sq. ft. | 100% | ||||||||||||||||||||||||||||||||
| Atlanta Tech Center Office | 1 | Atlanta, GA | May 2021 | 100% | 361 sq. ft. | 100% | ||||||||||||||||||||||||||||||||
41
| Segment and Investment | Number of Properties(1) | Location | Acquisition Date | Ownership Interest(2) | Sq. Feet (in thousands)/Units/Keys(1) | Occupancy Rate(3) | ||||||||||||||||||||||||||||||||
| Atlantic Complex Office | 3 | Toronto, Canada | Nov 2021 | 97% | 259 sq. ft. | 94% | ||||||||||||||||||||||||||||||||
One Manhattan West(6) | 1 | New York, NY | March 2022 | 49% | 2,081 sq. ft. | N/A | ||||||||||||||||||||||||||||||||
| One Culver Office | 1 | Culver City, CA | March 2022 | 90% | 395 sq. ft. | 99% | ||||||||||||||||||||||||||||||||
| Montreal Office Portfolio | 2 | Various | March 2022 | 98% | 486 sq. ft. | 95% | ||||||||||||||||||||||||||||||||
| Total Office | 10 | 4,167 sq. ft. | ||||||||||||||||||||||||||||||||||||
| Total Investments in Real Estate | 3,097 | |||||||||||||||||||||||||||||||||||||
(1)Residential includes multifamily and other types of rental housing such as manufactured, student, affordable, and single family rental housing, as well as senior living. Residential units include multifamily units, affordable housing units, manufactured housing sites, student housing units, single family rental homes and senior living units. Single family rental homes are accounted for in residential units and are not reflected in the number of properties.
(2)Certain of our joint venture agreements provide the seller or the other partner a profits interest based on achieving certain internal rate of return hurdles. Such investments are consolidated by us and any profits interest due to the other partners is reported within non-controlling interests. The table above also includes properties owned by unconsolidated entities.
(3)For our industrial, net leases, data center, retail and office investments, occupancy includes all leased square footage as of March 31, 2022. For our multifamily, student housing and affordable housing investments, occupancy is defined as the percentage of actual rent divided by gross potential rent (defined as actual rent for occupied units and market rent for vacant units) for the three months ended March 31, 2022. For our single family rental investments, the occupancy rate includes occupied homes for the three months ended March 31, 2022. For our self storage, manufactured housing and senior living investments, the occupancy rate includes occupied square footage, occupied sites and occupied units, respectively, as of March 31, 2022. The occupancy rate for our hospitality investments includes paid occupied rooms for the 12 months ended March 31, 2022. Hospitality investments owned less than 12 months are excluded. Occupancy is excluded for unconsolidated investments.
(4)Includes a 100% interest in 13,715 consolidated single family rental homes, a 27.8% interest in 9,060 unconsolidated single family rental homes, and a 12.2% interest in 949 unconsolidated single family rental homes.
(5)Includes various ownership interests in 526 consolidated affordable housing units and 124 unconsolidated affordable housing units.
(6)Investment is unconsolidated.
(7)Consists of an unconsolidated joint venture formed by the Company and certain Blackstone-managed investment vehicles invested in a logistics business.
Lease Expirations
The following schedule details the expiring leases at our consolidated industrial, net lease, data centers, retail, and office properties by annualized base rent and square footage as of March 31, 2022 ($ and square feet data in thousands). The table below excludes our residential and self-storage properties as substantially all leases at such properties expire within 12 months:
| Year | Number of Expiring Leases | Annualized Base Rent(1) | % of Total Annualized Base Rent Expiring | Square Feet | % of Total Square Feet Expiring | |||||||||||||||||||||||||||
2022 (remaining) | 475 | $ | 92,807 | 6% | 16,422 | 8% | ||||||||||||||||||||||||||
| 2023 | 615 | 156,697 | 11% | 28,296 | 14% | |||||||||||||||||||||||||||
| 2024 | 689 | 179,218 | 12% | 32,351 | 16% | |||||||||||||||||||||||||||
| 2025 | 488 | 119,929 | 8% | 20,262 | 10% | |||||||||||||||||||||||||||
| 2026 | 524 | 162,655 | 11% | 30,180 | 15% | |||||||||||||||||||||||||||
| 2027 | 383 | 140,247 | 10% | 24,870 | 12% | |||||||||||||||||||||||||||
| 2028 | 175 | 81,246 | 6% | 13,090 | 6% | |||||||||||||||||||||||||||
| 2029 | 116 | 76,245 | 5% | 9,521 | 5% | |||||||||||||||||||||||||||
| 2030 | 102 | 86,045 | 6% | 9,708 | 5% | |||||||||||||||||||||||||||
| 2031 | 61 | 25,997 | 2% | 3,266 | 2% | |||||||||||||||||||||||||||
| 2032 | 44 | 34,239 | 2% | 3,274 | 2% | |||||||||||||||||||||||||||
| Thereafter | 59 | 301,240 | 21% | 10,590 | 5% | |||||||||||||||||||||||||||
| Total | 3,731 | $ | 1,456,565 | 100% | 201,830 | 100% | ||||||||||||||||||||||||||
(1)Annualized base rent is determined from the annualized base rent per leased square foot as of March 31, 2022 and excludes tenant recoveries, straight-line rent, and above-market and below-market lease amortization.
42
Investments in Real Estate Debt
The following charts further describe the diversification of our investments in real estate debt by credit rating and collateral type, based on fair value as of March 31, 2022:
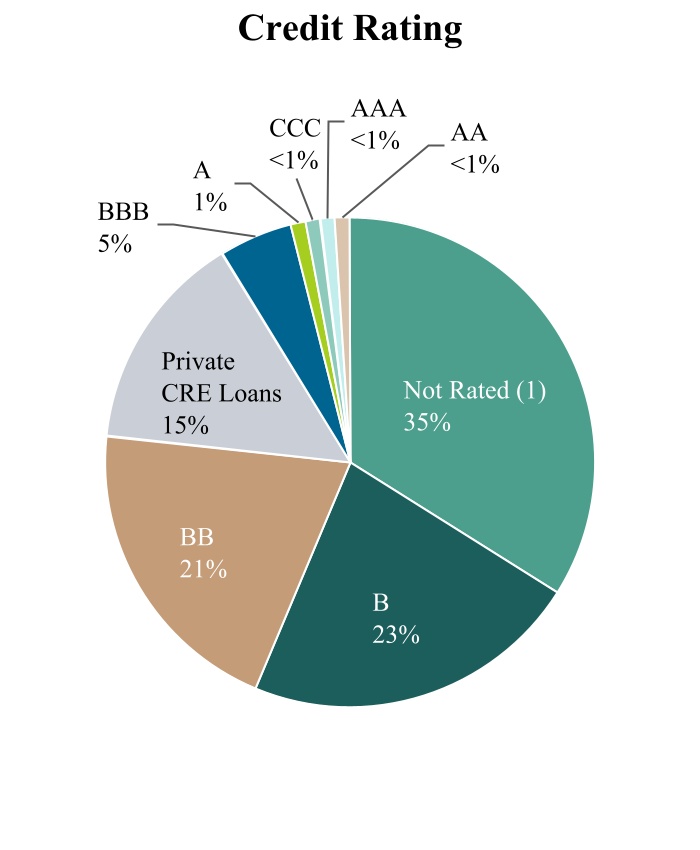
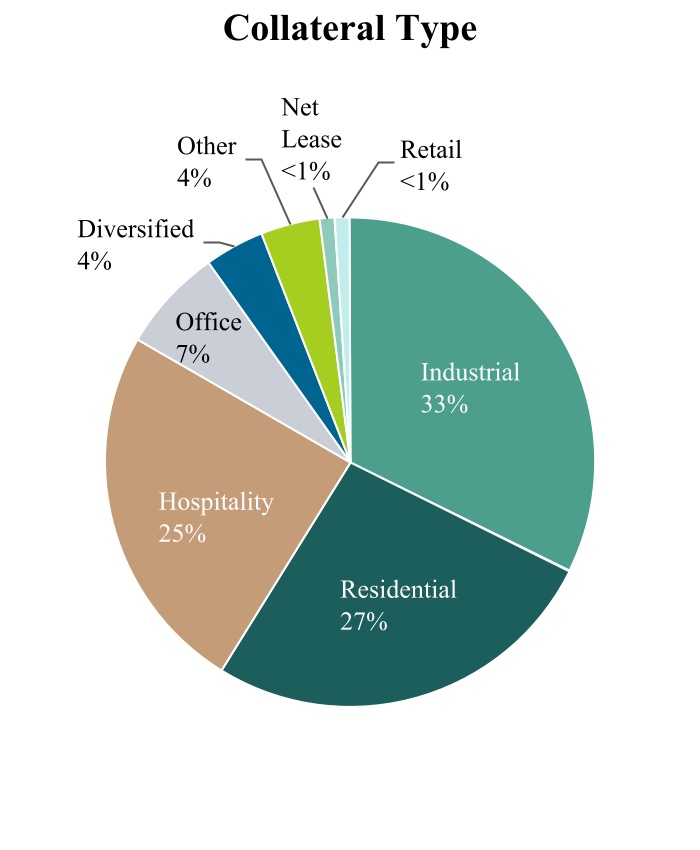
(1)Not Rated positions represent a weighted average LTV at origination of 67.5% and are comprised primarily of 54.2% industrial and 36.7% multifamily assets.
The following table details our investments in real estate debt as of March 31, 2022 ($ in thousands):
| March 31, 2022 | ||||||||||||||||||||||||||||||||
| Type of Security/Loan | Weighted Average Coupon(1) | Weighted Average Maturity Date(2) | Face Amount | Cost Basis | Fair Value | |||||||||||||||||||||||||||
CMBS(3) | L+3.7% | 6/3/2034 | $ | 8,084,396 | $ | 7,928,752 | $ | 7,713,748 | ||||||||||||||||||||||||
| Corporate bonds | 4.9% | 3/29/2030 | 236,215 | 235,385 | 226,137 | |||||||||||||||||||||||||||
| RMBS | 4.3% | 8/27/2054 | 373,111 | 363,353 | 343,440 | |||||||||||||||||||||||||||
| Total real estate securities | 4.0% | 2/23/2035 | 8,693,722 | 8,527,490 | 8,283,325 | |||||||||||||||||||||||||||
| Commercial real estate loans | L+4.4% | 2/8/2025 | 1,411,685 | 1,438,183 | 1,402,175 | |||||||||||||||||||||||||||
Other investments(4) | 3.7% | 7/25/2029 | 224,528 | 195,916 | 203,096 | |||||||||||||||||||||||||||
| Total investments in real estate debt | 4.1% | 8/10/2033 | $ | 10,329,935 | $ | 10,161,589 | $ | 9,888,596 | ||||||||||||||||||||||||
(1)The term “L” refers to the relevant floating benchmark rates, which include USD LIBOR, EURIBOR, SOFR and SONIA, as applicable to each security and loan. Fixed rate CMBS and Commercial real estate loans are reflected as a spread over the relevant floating benchmark rates as of March 31, 2022 for purposes of the weighted-averages. Weighted Average Coupon for CMBS does not include zero-coupon securities. As of March 31, 2022, we have interest rate swaps outstanding with a notional value of $1.5 billion that effectively converts a portion of our fixed rate investments in real estate debt to floating rates.
(2)Weighted average maturity date assumes maximum maturity date (including any extensions), where the Company, at its sole discretion, has one or more extension options.
(3)Face amount excludes interest-only securities with a notional amount of $3.4 billion as of March 31, 2022. In addition, CMBS includes zero-coupon securities of $215.1 million as of March 31, 2022.
(4)Includes an interest in an unconsolidated joint venture that holds investments in real estate securities.
43
Results of Operations
In the first quarter of 2022, we elected to update the consolidated results of operations disclosure to compare the operating results for the current quarter to that of the same quarter in the prior year. We believe this comparison provides a more relevant and informative representation of the changes to our results of operations, as the impacts of the COVID-19 pandemic have begun to subside, and over time as it better reflects the seasonality of our business. The following table sets forth information regarding our consolidated results of operations ($ in thousands):
| For the Three Months Ended March 31, | 2022 vs. 2021 | ||||||||||||||||
| 2022 | 2021 | $ | |||||||||||||||
| Revenues | |||||||||||||||||
| Rental revenue | $ | 1,303,720 | $ | 652,916 | $ | 650,804 | |||||||||||
| Hospitality revenue | 147,245 | 58,143 | 89,102 | ||||||||||||||
| Other revenue | 68,100 | 22,396 | 45,704 | ||||||||||||||
| Total revenues | 1,519,065 | 733,455 | 785,610 | ||||||||||||||
| Expenses | |||||||||||||||||
| Rental property operating | 566,987 | 237,705 | 329,282 | ||||||||||||||
| Hospitality operating | 103,463 | 55,680 | 47,783 | ||||||||||||||
| General and administrative | 13,106 | 6,960 | 6,146 | ||||||||||||||
| Management fee | 189,150 | 73,095 | 116,055 | ||||||||||||||
| Performance participation allocation | 411,569 | 143,215 | 268,354 | ||||||||||||||
| Depreciation and amortization | 915,051 | 400,387 | 514,664 | ||||||||||||||
| Total expenses | 2,199,326 | 917,042 | 1,282,284 | ||||||||||||||
| Other income (expense) | |||||||||||||||||
| Income from unconsolidated entities | 184,225 | 34,682 | 149,543 | ||||||||||||||
| (Loss) income from investments in real estate debt | (34,044) | 239,361 | (273,405) | ||||||||||||||
| Net gain on dispositions of real estate | 205,262 | 15,430 | 189,832 | ||||||||||||||
| Interest expense | (306,459) | (181,532) | (124,927) | ||||||||||||||
| Gain (loss) on extinguishment of debt | 1,395 | (3,416) | 4,811 | ||||||||||||||
| Other income | 533,303 | 107,946 | 425,357 | ||||||||||||||
| Total other income | 583,682 | 212,471 | 371,211 | ||||||||||||||
| Net (loss) income | $ | (96,579) | $ | 28,884 | $ | (125,463) | |||||||||||
| Net loss (income) attributable to non-controlling interests in third party joint ventures | $ | 44,255 | $ | (59) | $ | 44,314 | |||||||||||
| Net loss (income) attributable to non-controlling interests in BREIT OP | 656 | (353) | 1,009 | ||||||||||||||
| Net (loss) income attributable to BREIT stockholders | $ | (51,668) | $ | 28,472 | $ | (80,140) | |||||||||||
| Net (loss) income per share of common stock — basic and diluted | $ | (0.01) | $ | 0.01 | $ | (0.02) | |||||||||||
Rental Revenue
During the three months ended March 31, 2022, rental revenue increased $650.8 million as compared to the three months ended March 31, 2021. The increase can primarily be attributed to a $49.5 million increase in same property revenues and a $601.3 million increase in non-same property revenues due to the real estate acquisitions we made from January 1, 2021 to March 31, 2021. See Same Property Results of Operations section for further details of the increase in same property revenues.
Hospitality Revenue
During the three months ended March 31, 2022, hospitality revenue increased $89.1 million as compared to the three months ended March 31, 2021. As the economy continues to reopen and travel restrictions ease relating to the COVID-19 pandemic, we continue to see a recovery in our hospitality assets. ADR for the hotels in our same property portfolio increased from $113 to $164, while occupancy increased 26% and RevPAR increased from $56 to $102 during the three months ended March 31, 2022 compared to the three months ended March 31, 2021. See Same Property Results of Operations section for further details of the increase in same property revenues.
Other Revenue
During the three months ended March 31, 2022, other revenue increased $45.7 million as compared to the three months ended March 31, 2021. The increase can primarily be attributed to ancillary income from our affordable housing properties and asset management, property management, and acquisition fee revenue earned by us as part of managing HPA’s joint ventures during the three months ended March 31, 2022.
44
Rental Property Operating Expenses
During the three months ended March 31, 2022, rental property operating expenses increased $329.3 million as compared to the three months ended March 31, 2021. The increase can primarily be attributed to an $8.4 million increase in same property operating expenses and a $320.9 million increase in non-same property operating expenses. The non-same property operating expense increase is due to the real estate acquisitions we made from January 1, 2021 to March 31, 2022. See Same Property Results of Operations section for further details of the increase in same property operating expenses.
Hospitality Operating Expenses
During the three months ended March 31, 2022, hospitality operating expenses increased $47.8 million as compared to the three months ended March 31, 2021. The increase in hospitality operating expenses was primarily the result of increased occupancy and the resulting increased operating expenses at our hotels during the three months ended March 31, 2022.
General and Administrative Expenses
During the three months ended March 31, 2022, general and administrative expenses increased $6.1 million compared to the corresponding period in 2021. The increase was primarily due to various corporate level expenses related to the increased size of our portfolio.
Management Fee
During the three months ended March 31, 2022, the management fee increased $116.1 million compared to the corresponding period in 2021. The increase was primarily due to the $38.9 billion increase in our NAV from March 31, 2021 to March 31, 2022.
Performance Participation Allocation
During the three months ended March 31, 2022, the performance participation allocation expense increased $268.4 million compared to the corresponding period in 2021. The increase was primarily the result of our increased NAV and a higher total return for the three months ended March 31, 2022 compared to the corresponding period in 2021.
Depreciation and Amortization
During the three months ended March 31, 2022, depreciation and amortization increased $514.7 million compared to the corresponding period in 2021. The increase was primarily driven by the impact of acquisitions we made from January 1, 2021 through March 31, 2022, partially offset by (i) the impact of disposition activity as well as (ii) the full amortization of certain intangible assets.
Income from Unconsolidated Entities
During the three months ended March 31, 2022, income from unconsolidated entities increased $149.5 million compared to the corresponding period in 2021. The increase is primarily attributable to our increased acquisition activity in 2022 and an increase in the fair value of our investments in the WC Infill Industrial Portfolio and Vault Industrial Portfolio.
(Loss) Income from Investments in Real Estate Debt
During the three months ended March 31, 2022, (loss) income from investments in real estate debt decreased $273.4 million compared to the corresponding period in 2021. The decrease was primarily attributable to $354.0 million of unrealized losses on real estate debt securities, partially offset by an increase of $54.4 million in interest income from additional investments and $40.5 million of unrealized gains from derivatives.
Net Gain on Dispositions of Real Estate
During the three months ended March 31, 2022, net gain on dispositions of real estate increased $189.8 million compared to the corresponding period in 2021. During the three months ended March 31, 2022, we recorded $205.3 million of net gains from the sale of 130 residential properties, which included 123 single family rental homes, and nine industrial properties, compared to a $15.4 million net gain from the disposition of four residential properties during the corresponding period in 2021.
45
Interest Expense
During the three months ended March 31, 2022, interest expense increased $124.9 million compared to the corresponding period in 2021. The increase was primarily due to the growth in our real estate portfolio and investments in real estate debt and the related financing of such investments.
Other Income
During the three months ended March 31, 2022, other income increased $425.4 million compared to the corresponding period in 2021. The increase was primarily due to $636.0 million of unrealized gains on our interest rate swaps, $209.3 million of realized gains on our investments in equity securities, and $26.5 million of dividend income from our investments in equity securities, partially offset by $334.7 million of unrealized losses on our investments in equity securities during the three months ended March 31, 2022. During the three months ended March 31, 2021, other income primarily included $82.3 million of unrealized gains on our investments in equity securities, $17.2 million of unrealized gains on our interest rate swaps, and $8.8 million of dividend income from our investments in equity securities.
Reimbursement by the Adviser
Pursuant to the advisory agreement between us, the Adviser and BREIT OP, the Adviser will reimburse us for any expenses that cause our Total Operating Expenses in any four consecutive fiscal quarters to exceed the greater of: (i) 2% of our Average Invested Assets or (ii) 25% of our Net Income (each as defined in our charter) (the “2%/25% Limitation”).
Notwithstanding the foregoing, to the extent that our Total Operating Expenses exceed these limits and the independent directors determine that the excess expenses were justified based on unusual and nonrecurring factors that they deem sufficient, the Adviser would not be required to reimburse us.
For the three months ended March 31, 2022, our Total Operating Expenses exceeded the 2%/25% Limitation. Based upon a review of unusual and non-recurring factors, including but not limited to our unusually strong performance in 2021 and the trailing nature of the calculation, our independent directors determined that the excess expenses were justified.
46
The following table sets forth information regarding our consolidated results of operations ($ in thousands, except per share data):
| For the Three Months Ended | Change | ||||||||||||||||
| March 31, 2022 | December 31, 2021 | $ | |||||||||||||||
| Revenues | |||||||||||||||||
| Rental revenue | $ | 1,303,720 | $ | 998,705 | $ | 305,015 | |||||||||||
| Hospitality revenue | 147,245 | 124,028 | 23,217 | ||||||||||||||
| Other revenue | 68,100 | 50,991 | 17,109 | ||||||||||||||
| Total revenues | 1,519,065 | 1,173,724 | 345,341 | ||||||||||||||
| Expenses | |||||||||||||||||
| Rental property operating | 566,987 | 392,864 | 174,123 | ||||||||||||||
| Hospitality operating | 103,463 | 93,091 | 10,372 | ||||||||||||||
| General and administrative | 13,106 | 10,191 | 2,915 | ||||||||||||||
| Management fee | 189,150 | 157,147 | 32,003 | ||||||||||||||
| Performance participation allocation | 411,569 | 486,549 | (74,980) | ||||||||||||||
| Depreciation and amortization | 915,051 | 637,879 | 277,172 | ||||||||||||||
| Total expenses | 2,199,326 | 1,777,721 | 421,605 | ||||||||||||||
| Other income (expense) | |||||||||||||||||
| Income from unconsolidated entities | 184,225 | 22,825 | 161,400 | ||||||||||||||
| (Loss) income from investments in real estate debt | (34,044) | 59,121 | (93,165) | ||||||||||||||
| Net gain (loss) on dispositions of real estate | 205,262 | (5,335) | 210,597 | ||||||||||||||
| Interest expense | (306,459) | (267,734) | (38,725) | ||||||||||||||
| Gain (loss) on extinguishment of debt | 1,395 | (6,786) | 8,181 | ||||||||||||||
| Other income | 533,303 | 480,594 | 52,709 | ||||||||||||||
| Total other income | 583,682 | 282,685 | 300,997 | ||||||||||||||
| Net loss | $ | (96,579) | $ | (321,312) | $ | 224,733 | |||||||||||
| Net loss attributable to non-controlling interests in third party joint ventures | $ | 44,255 | $ | 16,940 | $ | 27,315 | |||||||||||
| Net loss attributable to non-controlling interests in BREIT OP | 656 | 3,163 | (2,507) | ||||||||||||||
| Net loss attributable to BREIT stockholders | $ | (51,668) | $ | (301,209) | $ | 249,541 | |||||||||||
| Net loss per share of common stock — basic and diluted | $ | (0.01) | $ | (0.09) | $ | 0.08 | |||||||||||
Rental Revenue
During the three months ended March 31, 2022, rental revenue increased $305.0 million as compared to the three months ended December 31, 2021. The increase can primarily be attributed to an $8.9 million increase in same property revenues and a $296.1 million increase in non-same property revenues due to the real estate acquisitions we made from October 1, 2021 to March 31, 2022. See Same Property Results of Operations section for further details of the increase in same property revenues.
Hospitality Revenue
During the three months ended March 31, 2022, hospitality revenue increased $23.2 million as compared to the three months ended December 31, 2021. As the economy continues to reopen and travel restrictions ease relating to the COVID-19 pandemic, we continue to see a recovery in our hospitality assets. ADR for the hotels in our same property portfolio increased from $144 to $164, while occupancy decreased 2% and RevPAR increased from $91 to $102 during the three months ended March 31, 2022 compared to the three months ended December 31, 2021.
Other Revenue
During the three months ended March 31, 2022, other revenue increased $17.1 million as compared to the three months ended December 31, 2021. The increase can primarily be attributed to a full quarter of ancillary income from our Ace Affordable Housing Portfolio during the three months ended March 31, 2022.
Rental Property Operating Expenses
During the three months ended March 31, 2022, rental property operating expenses increased $174.1 million as compared to the three months ended December 31, 2021. The increase can primarily be attributed to a $13.1 million increase in same property operating expenses and a $161.0 million increase in non-same property operating expenses. The non-same property operating expense increase is due to the real estate acquisitions we made during from October 1, 2021 to March 31, 2022. See Same Property Results of Operations section for further details of the decrease in same property operating expenses.
47
Hospitality Operating Expenses
During the three months ended March 31, 2022, hospitality operating expenses increased $10.4 million as compared to the three months ended December 31, 2021. The increase in hospitality operating expenses was primarily related to a full quarter of operating expenses at our properties acquired during the fourth quarter 2021.
Management Fee
During the three months ended March 31, 2022, the management fee increased $32.0 million compared to the three months ended December 31, 2021. The increase was primarily due to the $9.2 billion increase in our NAV from December 31, 2021 to March 31, 2022.
Performance Participation Allocation
During the three months ended March 31, 2022, the unrealized performance participation allocation accrual decreased $75.0 million compared to the three months ended December 31, 2021. The decrease was primarily the result of a lower total return for the three months ended March 31, 2022 compared to the three months ended December 31, 2021.
Depreciation and Amortization
During the three months ended March 31, 2022, depreciation and amortization increased $277.2 million compared to the three months ended December 31, 2021. The increase is attributable to the increase in properties within our portfolio from October 1, 2021 to March 31, 2022.
Income from Unconsolidated Entities
During the three months ended March 31, 2022, income from unconsolidated entities increased $161.4 million compared to the three months ended December 31, 2021. The increase is primarily due to an increase of $146.5 million in the fair value of our existing industrial investments, measured under the fair value option, from December 31, 2021 to March 31, 2022.
(Loss) Income from Investments in Real Estate Debt
During the three months ended March 31, 2022, (loss) income from our investments in real estate debt decreased $93.2 million compared to the three months ended December 31, 2021. The decrease was primarily attributable to $151.7 million of unrealized losses on real estate debt investments, $18.8 million of realized losses on real estate debt investments, and $18.2 million of realized losses on derivatives. This was partially offset by $85.4 million of unrealized gains on derivatives and an increase of $15.6 million in interest income from additional investments.
Net Gain (loss) on Dispositions of Real Estate
During the three months ended March 31, 2022, net gain (loss) on dispositions of real estate increased $210.6 million compared to the three months ended December 31, 2021. During the three months ended March 31, 2022, we recorded $205.3 million of net gains from the disposition of nine industrial properties and 130 residential properties, which included 123 single family rental homes, compared to $5.3 million of net losses from the disposition of 122 residential properties, which included 118 single family rental homes, during the three months ended December 31, 2021.
Interest Expense
During the three months ended March 31, 2022, interest expense increased $38.7 million compared to the three months ended December 31, 2021. The increase was primarily due to a full quarter of interest expense on financings of properties acquired during the three months ended December 31, 2021.
Other Income
During the three months ended March 31, 2022, other income increased $52.7 million compared to the three months ended December 31, 2021. The increase was primarily due to $636.0 million of unrealized gains on our interest rate swaps, $209.3 million of realized gains on our investments in equity securities, and $26.5 million of dividend income from our investments in equity securities, offset by $334.7 million of unrealized losses on our investments in equity securities during the three months ended March 31, 2022. During the three months ended December 31, 2021, other income primarily included $468.6 million of unrealized gains on our
48
investments in equity securities and $19.1 million of dividend income from our investments in equity securities, offset by $5.6 million of unrealized losses on our interest rate swaps.
Same Property Results of Operations
Net Operating Income (“NOI”) is a supplemental non-GAAP measure of our property operating results that we believe is meaningful because it enables management to evaluate the impact of occupancy, rents, leasing activity, and other controllable property operating results at our real estate. We define NOI as operating revenues less operating expenses, which exclude (i) impairment of investments in real estate, (ii) depreciation and amortization, (iii) straight-line rental income and expense, (iv) amortization of above- and below-market lease intangibles, (v) lease termination fees, (vi) property expenses not core to the operations of such properties, and (vii) other non-property related revenue and expense items such as (a) general and administrative expenses, (b) management fee, (c) performance participation allocation, (d) incentive compensation awards, (e) income (loss) from investments in real estate debt, (f) net gain (loss) on dispositions of real estate, (g) interest expense, (h) gain (loss) on extinguishment of debt, (i) other income (expense), and (j) similar adjustments for NOI attributable to non-controlling interests and unconsolidated entities.
We evaluate our consolidated results of operations on a same property basis, which allows us to analyze our property operating results excluding acquisitions and dispositions during the periods under comparison. Properties in our portfolio are considered same property if they were owned for the full periods presented, otherwise they are considered non-same property. Recently developed properties are not included in same property results until the properties have achieved stabilization for both full periods presented. Properties held for sale and properties that are being re-developed are excluded from same property results and are considered non-same property. We do not consider our investments in the real estate debt segment or equity securities to be same property.
As such, same property NOI assists in eliminating disparities in net income due to the acquisition, disposition, development, or redevelopment of properties during the periods presented, and therefore we believe it provides a more consistent performance measure for the comparison of the operating performance of the Company’s properties, which we believe is useful to investors. Our same property NOI may not be comparable to that of other REITs and should not be considered to be more relevant or accurate in evaluating our operating performance than the current GAAP methodology used to calculate our net income (loss).
For the three months ended March 31, 2022 and March 31, 2021, our same property portfolio consisted of 242 residential, 827 industrial, one net lease, nine data centers, 58 hotel, 110 self storage, 13 retail, and two office properties. For the three months ended March 31, 2022 and December 31, 2021, our same property portfolio consisted of 310 residential, 861 industrial, three net lease, 11 data centers, 58 hotel, 144 self storage, 14 retail, and three office properties.
In the first quarter of 2022, we updated our definition of NOI to exclude the impact of (i) straight-line rental income and expense, (ii) amortization of above- and below-market lease intangibles, (iii) lease termination fees, and (iv) property expenses not core to the operations of such properties, which are included in GAAP net income (loss). We do not consider these items to be directly attributable to our operations, and therefore have updated our definition of NOI to exclude such items. We also updated our calculation of same property NOI to include NOI from unconsolidated entities, once the unconsolidated entities have met the criteria to be included in same property NOI listed above, and exclude NOI attributable to non-controlling interests. Additionally, we updated our definition of stabilized occupancy for recently developed properties to be the earliest of (i) properties which have achieved 90% occupancy or (ii) 12 months after receiving a certificate of occupancy. We believe that these changes to our calculations of NOI and same property NOI result in metrics that better reflect our results of our operations. We believe this comparison provides a more relevant and informative representation of the changes to our same property results of operations over time.
49
The following table reconciles GAAP net (loss) income to same property NOI for the three months ended March 31, 2022 and 2021 ($ in thousands):
| Three Months Ended March 31, | Change | ||||||||||||||||
| 2022 | 2021 | $ | |||||||||||||||
| Net (loss) income | $ | (96,579) | $ | 28,884 | $ | (125,463) | |||||||||||
| Adjustments to reconcile to same property NOI | |||||||||||||||||
| Depreciation and amortization | 915,051 | 400,387 | 514,664 | ||||||||||||||
| Straight-line rental income and expense | (28,350) | (25,908) | (2,442) | ||||||||||||||
| Amortization of above- and below-market lease intangibles | (14,409) | (6,051) | (8,358) | ||||||||||||||
| Lease termination fees | (1,160) | (1,521) | 361 | ||||||||||||||
| Non-core property expenses | 63,834 | 34,336 | 29,498 | ||||||||||||||
| General and administrative | 13,106 | 6,960 | 6,146 | ||||||||||||||
| Management fee | 189,150 | 73,095 | 116,055 | ||||||||||||||
| Performance participation allocation | 411,569 | 143,215 | 268,354 | ||||||||||||||
Incentive compensation awards(1) | 9,604 | 1,177 | 8,427 | ||||||||||||||
| Loss (income) from investments in real estate debt | 34,044 | (239,361) | 273,405 | ||||||||||||||
| Net gain on dispositions of real estate | (205,262) | (15,430) | (189,832) | ||||||||||||||
| Interest expense | 306,459 | 181,532 | 124,927 | ||||||||||||||
| (Gain) loss on extinguishment of debt | (1,395) | 3,416 | (4,811) | ||||||||||||||
| Other income | (533,303) | (107,946) | (425,357) | ||||||||||||||
| Income from unconsolidated entities | (184,225) | (34,682) | (149,543) | ||||||||||||||
| NOI attributable to non-controlling interests in third party joint ventures | (10,770) | (7,651) | (3,119) | ||||||||||||||
| NOI from unconsolidated entities | 142,284 | 44,222 | 98,062 | ||||||||||||||
| NOI attributable to BREIT stockholders | 1,009,648 | 478,674 | 530,974 | ||||||||||||||
| Less: Non-same property NOI attributable to BREIT stockholders | 485,602 | 28,529 | 457,073 | ||||||||||||||
| Same property NOI attributable to BREIT stockholders | $ | 524,046 | $ | 450,145 | $ | 73,901 | |||||||||||
(1) Included in rental property operating and hospitality operating expense on our Condensed Consolidated Statements of Operations.
The following table details the components of same property NOI for the three months ended March 31, 2022 and 2021 ($ in thousands):
| Three Months Ended March 31, | Change | ||||||||||||||||||||||
| 2022 | 2021 | $ | % | ||||||||||||||||||||
| Same property NOI | |||||||||||||||||||||||
| Rental revenue | $ | 632,787 | $ | 583,291 | $ | 49,496 | 8% | ||||||||||||||||
| Hospitality revenue | 116,315 | 58,143 | 58,172 | 100% | |||||||||||||||||||
| Other revenue | 23,355 | 18,721 | 4,634 | 25% | |||||||||||||||||||
| Total revenues | 772,457 | 660,155 | 112,302 | 17% | |||||||||||||||||||
| Rental property operating | 193,521 | 185,107 | 8,414 | 5% | |||||||||||||||||||
| Hospitality operating | 83,612 | 54,002 | 29,610 | 55% | |||||||||||||||||||
| Total expenses | 277,133 | 239,109 | 38,024 | 16% | |||||||||||||||||||
| Same property NOI attributable to non-controlling interests in third party joint ventures | (8,665) | (7,564) | (1,101) | 15% | |||||||||||||||||||
| Consolidated same property NOI attributable to BREIT stockholders | 486,659 | 413,482 | 73,177 | 18% | |||||||||||||||||||
| Same property NOI from unconsolidated entities | 37,387 | 36,663 | 724 | 2% | |||||||||||||||||||
| Same property NOI attributable to BREIT stockholders | $ | 524,046 | $ | 450,145 | $ | 73,901 | 16% | ||||||||||||||||
50
Same Property – Rental Revenue
Same property rental revenue increased $49.5 million for the three months ended March 31, 2022 compared to the corresponding period in 2021. The increase was due to a $46.1 million increase in base rental revenue and an $8.2 million increase in tenant reimbursement income as a result of higher operating expenses. This was partially offset by a $4.8 million increase in our bad debt reserve. Our bad debt reserve represents the amount of rental revenue we anticipate we will not be able to collect from our tenants.
The following table details the changes in base rental revenue period over period ($ in thousands):
| 2022 vs. 2021 | |||||||||||||||||||||||||||||
| Three Months Ended March 31, | Change in Base Rental Revenue | Change in Occupancy Rate | Change in Average Effective Annual Base Rent Per Leased Square Foot/Unit | ||||||||||||||||||||||||||
| 2022 | 2021 | ||||||||||||||||||||||||||||
| Residential | $ | 286,989 | $ | 258,124 | $ | 28,865 | (1)% | +12% | |||||||||||||||||||||
| Industrial | 170,301 | 159,127 | 11,174 | +3% | +4% | ||||||||||||||||||||||||
| Net Lease | 63,725 | 62,475 | 1,250 | —% | +2% | ||||||||||||||||||||||||
| Self storage | 26,869 | 22,518 | 4,351 | (2)% | +21% | ||||||||||||||||||||||||
| Retail | 11,029 | 10,749 | 280 | —% | +3% | ||||||||||||||||||||||||
| Data centers | 4,739 | 4,634 | 105 | —% | +2% | ||||||||||||||||||||||||
| Office | 5,846 | 5,762 | 84 | —% | +1% | ||||||||||||||||||||||||
| Total base rental revenue | $ | 569,498 | $ | 523,389 | $ | 46,109 | |||||||||||||||||||||||
Same Property – Hospitality Revenue
Same property hospitality revenue increased $58.2 million for the three months ended March 31, 2022 compared to the corresponding period in 2021. ADR for the hotels in our same property portfolio increased from $113 to $164 while occupancy increased 26% and RevPAR increased from $56 to $102 during the three months ended March 31, 2022 compared to the three months ended March 31, 2021.
Same Property – Other Revenue
Same property other revenue increased $4.6 million for the three months ended March 31, 2022 compared to the corresponding period in 2021. The increase was primarily due to increased golf course revenues at our full service hotel in San Antonio, Texas and increased ancillary income at our residential properties during the three months ended March 31, 2022.
Same Property – Rental Property Operating Expenses
Same property rental property operating expenses increased $8.4 million during the three months ended March 31, 2022 compared to the corresponding period in 2021. The increase in rental property operating expenses for the three months ended March 31, 2022 was primarily the result of increased real estate taxes and general operating expenses at our residential properties.
Same Property – Hospitality Operating Expenses
Same property hospitality operating expenses increased $29.6 million during the three months ended March 31, 2022 compared to the corresponding period in 2021. The increase in hospitality operating expenses was primarily the result of increased operating expenses resulting from increased occupancy at our hotels during the three months ended March 31, 2022.
51
The following table reconciles GAAP net income (loss) to same property NOI for the three months ended March 31, 2022 and December 31, 2021 ($ in thousands):
| Three Months Ended | Change | ||||||||||||||||
| March 31, 2022 | December 31, 2021 | $ | |||||||||||||||
| Net loss | $ | (96,579) | $ | (321,312) | $ | 224,733 | |||||||||||
| Adjustments to reconcile to same property NOI | |||||||||||||||||
| Depreciation and amortization | 915,051 | 637,879 | 277,172 | ||||||||||||||
| Straight-line rental income and expense | (28,350) | (27,149) | (1,201) | ||||||||||||||
| Amortization of above- and below-market lease intangibles | (14,409) | (10,362) | (4,047) | ||||||||||||||
| Lease termination fees | (1,160) | (463) | (697) | ||||||||||||||
| Property non-operating expenses | 63,834 | 50,536 | 13,298 | ||||||||||||||
| General and administrative | 13,106 | 10,191 | 2,915 | ||||||||||||||
| Management fee | 189,150 | 157,147 | 32,003 | ||||||||||||||
| Performance participation allocation | 411,569 | 486,549 | (74,980) | ||||||||||||||
Incentive compensation awards(1) | 9,604 | 11,322 | (1,718) | ||||||||||||||
| Loss (income) from investments in real estate debt | 34,044 | (59,121) | 93,165 | ||||||||||||||
| Net (gain) loss on dispositions of real estate | (205,262) | 5,335 | (210,597) | ||||||||||||||
| Interest expense | 306,459 | 267,734 | 38,725 | ||||||||||||||
| (Gain) loss on extinguishment of debt | (1,395) | 6,786 | (8,181) | ||||||||||||||
| Other income | (533,303) | (480,594) | (52,709) | ||||||||||||||
| Income from unconsolidated entities | (184,225) | (22,825) | (161,400) | ||||||||||||||
| NOI attributable to non-controlling interests in third party joint ventures | (10,770) | (20,362) | 9,592 | ||||||||||||||
| NOI from unconsolidated entities | 142,284 | 115,759 | 26,525 | ||||||||||||||
| NOI attributable to BREIT stockholders | 1,009,648 | 807,050 | 202,598 | ||||||||||||||
| Less: Non-same property NOI attributable to BREIT stockholders | 340,112 | 139,328 | 200,784 | ||||||||||||||
| Same property NOI attributable to BREIT stockholders | $ | 669,536 | $ | 667,722 | $ | 1,814 | |||||||||||
(1) Included in rental property operating and hospitality operating expense on our Condensed Consolidated Statements of Operations.
The following table details the components of same property NOI for the three months ended March 31, 2022 and December 31, 2021 ($ in thousands):
| Three Months Ended | Change | |||||||||||||||||||||||||
| March 31, 2022 | December 31, 2021 | $ | % | |||||||||||||||||||||||
| Same property NOI | ||||||||||||||||||||||||||
| Rental revenue | $ | 823,804 | $ | 814,893 | $ | 8,911 | 1% | |||||||||||||||||||
| Hospitality revenue | 116,315 | 109,972 | 6,343 | 6% | ||||||||||||||||||||||
| Other revenue | 28,856 | 26,793 | 2,063 | 8% | ||||||||||||||||||||||
| Total revenues | 968,975 | 951,658 | 17,317 | 2% | ||||||||||||||||||||||
| Rental property operating | 269,488 | 256,382 | 13,106 | 5% | ||||||||||||||||||||||
| Hospitality operating | 83,612 | 81,249 | 2,363 | 3% | ||||||||||||||||||||||
| Total expenses | 353,100 | 337,631 | 15,469 | 5% | ||||||||||||||||||||||
| Same property NOI attributable to non-controlling interests in third party joint ventures | (9,715) | (9,581) | (134) | 1% | ||||||||||||||||||||||
| Consolidated same property NOI attributable to BREIT stockholders | 606,160 | 604,446 | 1,714 | —% | ||||||||||||||||||||||
| Same property NOI from unconsolidated entities | 63,376 | 63,276 | 100 | —% | ||||||||||||||||||||||
| Same property NOI attributable to BREIT stockholders | $ | 669,536 | $ | 667,722 | $ | 1,814 | —% | |||||||||||||||||||
52
Same Property – Rental Revenue
Same property rental revenue increased $8.9 million for the three months ended March 31, 2022 compared to the three months ended December 31, 2021. The increase was due to a $13.6 million increase in base rental revenue and a $6.1 million increase in tenant reimbursement income. This was partially offset by a $10.8 million increase in our bad debt reserve. Our bad debt reserve represents the amount of rental revenue we anticipate we will not be able to collect from our tenants.
The following table details the changes in base rental revenue period over period ($ in thousands):
March 31, 2022 vs. December 31, 2021 | |||||||||||||||||||||||||||||
| Three Months Ended | Change in Base Rental Revenue | Change in Occupancy Rate | Change in Average Effective Annual Base Rent Per Leased Square Foot/Unit | ||||||||||||||||||||||||||
| March 31, 2022 | December 31, 2021 | ||||||||||||||||||||||||||||
| Residential | $ | 453,422 | $ | 442,532 | $ | 10,890 | —% | +2% | |||||||||||||||||||||
| Industrial | 177,171 | 175,768 | 1,403 | —% | +1% | ||||||||||||||||||||||||
| Net Lease | 63,725 | 62,892 | 833 | —% | +1% | ||||||||||||||||||||||||
| Self storage | 35,922 | 35,662 | 260 | (1)% | +2% | ||||||||||||||||||||||||
| Retail | 12,235 | 12,154 | 81 | —% | +1% | ||||||||||||||||||||||||
| Data centers | 6,481 | 6,455 | 26 | —% | —% | ||||||||||||||||||||||||
| Office | 8,738 | 8,601 | 137 | —% | +2% | ||||||||||||||||||||||||
| Total base rental revenue | $ | 757,694 | $ | 744,064 | $ | 13,630 | |||||||||||||||||||||||
Same Property – Hospitality Revenue
Same property hospitality revenue increased $6.3 million for the three months ended March 31, 2022 compared to the three months ended December 31, 2021. ADR for the hotels in our same property portfolio increased from $144 to $164, while occupancy decreased 2% and RevPAR increased from $91 to $102 during the three months ended March 31, 2022 compared to three months ended December 31, 2021.
Same Property – Other Revenue
Same property other revenue increased $2.1 million for the three months ended March 31, 2022 compared to the three months ended December 31, 2021. The increase was primarily due to increased ancillary income at our residential and industrial properties during the three months ended March 31, 2022.
Same Property – Rental Property Operating Expenses
Same property rental property operating expenses increased $13.1 million during the three months ended March 31, 2022, compared to the three months ended December 31, 2021. The increase in rental property operating expenses for the three months ended March 31, 2022 was primarily the result of increased real estate taxes and general operating expenses at our residential and industrial properties.
Same Property – Hospitality Operating Expenses
Same property hospitality operating expenses increased $2.4 million during the three months ended March 31, 2022, compared to the three months ended December 31, 2021. The increase in hospitality operating expenses was primarily the result of increased operating expenses resulting from increased food and beverage and conference center expenses at our hotels during the three months ended March 31, 2022.
Non-same Property NOI
Due to our substantial fundraising and continued deployment of the net proceeds raised into new property acquisitions, non-same property NOI is not comparable period-over-period. We expect the non-same property NOI variance period-over-period to continue as we raise more proceeds from selling shares of our common stock and invest in additional new property acquisitions.
53
Funds from Operations, Adjusted Funds from Operations and Funds Available for Distribution
We believe funds from operations (“FFO”) is a meaningful non-GAAP supplemental measure of our operating results. Our condensed consolidated financial statements are presented using historical cost accounting which, among other things, requires depreciation of real estate investments to be calculated on a straight-line basis. As a result, our operating results imply that the value of our real estate investments have decreased over time. However, we believe that the value of our real estate investments will fluctuate over time based on market conditions and, as such, depreciation under historical cost accounting may be less informative as a measure of our performance. FFO is an operating measure defined by the National Association of Real Estate Investment Trusts (“NAREIT”) that is broadly used in the REIT industry. FFO, as defined by NAREIT and presented below, is calculated as net income or loss (computed in accordance with GAAP), excluding (i) depreciation and amortization, (ii) impairment of investments in real estate, (iii) net gains or losses from sales of real estate, and (iv) similar adjustments for non-controlling interests and unconsolidated entities.
We also believe that adjusted FFO (“AFFO”) is an additional meaningful non-GAAP supplemental measure of our operating results. AFFO further adjusts FFO to reflect the performance of our portfolio by adjusting for items we believe are not directly attributable to our operations. Our adjustments to FFO to arrive at AFFO include removing the impact of (i) straight-line rental income and expense, (ii) amortization of above- and below-market lease intangibles, (iii) amortization of mortgage premium/discount, (iv) unrealized (gains) losses from changes in fair value of financial instruments, (v) net forfeited investment deposits, (vi) amortization of restricted stock awards, (vii) the performance participation allocation to our Special Limited Partner or other incentive compensation awards that are based on our Net Asset Value, which includes unrealized gains and losses not recorded in GAAP net income (loss), and that are paid in shares or BREIT OP units, even if subsequently repurchased by us, (viii) gain or loss on involuntary conversion, (ix) amortization of deferred financing costs, (x) losses (gains) on extinguishment of debt, and (xi) similar adjustments for non-controlling interests and unconsolidated entities.
We also believe that funds available for distribution (“FAD”) is an additional meaningful non-GAAP supplemental measure of our operating results. FAD provides useful information for considering our operating results and certain other items relative to the amount of our distributions. Further, FAD is a metric, among others, that is considered by our board of directors and executive officers when determining the amount of our dividend to stockholders, and we believe is therefore meaningful to stockholders. FAD is calculated as AFFO adjusted for (i) management fees paid in shares or BREIT OP units, even if subsequently repurchased by us, (ii) realized losses (gains) on financial instruments, (iii) recurring tenant improvements, leasing commissions, and other capital expenditures, (iv) stockholder servicing fees paid during the period, and (v) similar adjustments for non-controlling interests and unconsolidated entities. FAD is not indicative of cash available to fund our cash needs and does not represent cash flows from operating activities in accordance with GAAP, as FAD is adjusted for stockholder servicing fees and recurring tenant improvements, leasing commission, and other capital expenditures, which are not considered when determining cash flows from operations. Furthermore, FAD excludes (i) adjustments for working capital items and (ii) amortization of discounts and premiums on investments in real estate debt. Cash flows from operating activities in accordance with GAAP would generally be adjusted for such items.
FFO, AFFO, and FAD should not be considered more relevant or accurate than GAAP net income (loss) in evaluating our operating performance. In addition, FFO, AFFO, and FAD should not be considered as alternatives to net income (loss) as indications of our performance or as alternatives to cash flows from operating activities as indications of our liquidity, but rather should be reviewed in conjunction with these and other GAAP measurements. Further, FFO, AFFO, and FAD are not intended to be used as liquidity measures indicative of cash flow available to fund our cash needs, including our ability to make distributions to our stockholders. In addition, our methodology for calculating AFFO and FAD may differ from the methodologies employed by other companies to calculate the same or similar supplemental performance measures, and accordingly, our reported AFFO and FAD may not be comparable to the AFFO and FAD reported by other companies.
54
The following table presents a reconciliation of net income (loss) attributable to BREIT stockholders to FFO, AFFO and FAD attributable to BREIT stockholders ($ in thousands):
| Three Months Ended March 31, | |||||||||||
| 2022 | 2021 | ||||||||||
| Net (loss) income attributable to BREIT stockholders | $ | (51,668) | $ | 28,472 | |||||||
| Adjustments to arrive at FFO: | |||||||||||
| Depreciation and amortization | 1,023,981 | 410,859 | |||||||||
| Net gain on dispositions of real estate | (201,150) | (15,430) | |||||||||
| Amount attributable to non-controlling interests for above adjustments | (63,185) | (10,291) | |||||||||
| FFO attributable to BREIT stockholders | 707,978 | 413,610 | |||||||||
| Adjustments to arrive at AFFO: | |||||||||||
| Straight-line rental income and expense | (46,684) | (40,344) | |||||||||
| Amortization of above and below-market lease intangibles | (14,940) | (5,038) | |||||||||
| Amortization of mortgage premium/discount | (1,423) | (501) | |||||||||
Unrealized gains from changes in fair value of financial instruments(1) | (380,495) | (321,621) | |||||||||
| Amortization of restricted stock awards | 181 | 121 | |||||||||
| Non-cash performance participation allocation | 411,569 | 143,215 | |||||||||
| Non-cash incentive compensation awards | 9,604 | 1,177 | |||||||||
| Amortization of deferred financing costs | 30,522 | 12,741 | |||||||||
| (Gain) loss on extinguishment of debt | (1,395) | 3,416 | |||||||||
| Amount attributable to non-controlling interests for above adjustments | (3,668) | 3,983 | |||||||||
| AFFO attributable to BREIT stockholders | 711,249 | 210,759 | |||||||||
| Adjustments to arrive at FAD: | |||||||||||
| Non-cash management fee | 189,150 | 73,095 | |||||||||
Recurring tenant improvements, leasing commissions, and other capital expenditures(2) | (75,362) | (33,113) | |||||||||
| Stockholder servicing fees | (46,955) | (20,771) | |||||||||
Realized (gains) losses on financial instruments(1) | (240,225) | 20,582 | |||||||||
| Amount attributable to non-controlling interests for above adjustments | 2,142 | (855) | |||||||||
| FAD attributable to BREIT stockholders | $ | 539,999 | $ | 249,697 | |||||||
(1)Unrealized (gains) losses from changes in fair value of financial instruments primarily relates to mark-to-market changes on our investments in real estate debt, investments in equity securities, and derivatives. Realized (gains) losses on financial instruments primarily results from the sale of our investments in real estate debt and our investments in equity securities.
(2)Recurring tenant improvements and leasing commissions are generally related to second-generation leases and other capital expenditures required to maintain our investments. Other capital expenditures exclude underwritten tenant improvements, leasing commissions and capital expenditures in conjunction with acquisitions and projects that we believe will enhance the value of our investments.
55
Net Asset Value
We calculate NAV per share in accordance with the valuation guidelines that have been approved by our board of directors. Our total NAV presented in the following tables includes the NAV of our Class S, Class I, Class T, and Class D common stock, as well as the partnership interests of BREIT OP held by parties other than the Company. The following table provides a breakdown of the major components of our NAV as of March 31, 2022 ($ and shares/units in thousands):
| Components of NAV | March 31, 2022 | |||||||
| Investments in real estate | $ | 87,395,224 | ||||||
| Investments in real estate debt | 9,888,596 | |||||||
| Investments in unconsolidated entities | 7,001,476 | |||||||
| Cash and cash equivalents | 3,787,636 | |||||||
| Restricted cash | 2,779,440 | |||||||
| Other assets | 5,330,588 | |||||||
| Mortgage notes, term loans, and revolving credit facilities, net | (41,233,933) | |||||||
| Secured financings of investments in real estate debt | (4,558,781) | |||||||
| Subscriptions received in advance | (1,843,583) | |||||||
| Other liabilities | (2,314,180) | |||||||
| Accrued performance participation allocation | (411,569) | |||||||
| Management fee payable | (66,688) | |||||||
Accrued stockholder servicing fees(1) | (17,064) | |||||||
| Non-controlling interests in joint ventures | (2,434,109) | |||||||
| Net Asset Value | $ | 63,303,053 | ||||||
| Number of outstanding shares/units | 4,278,277 | |||||||
(1)Stockholder servicing fees only apply to Class S, Class T, and Class D shares. See Reconciliation of Stockholders’ Equity and BREIT OP Partners’ Capital to NAV below for an explanation of the difference between the $17.1 million accrued for purposes of our NAV and the $1.5 billion accrued under U.S. GAAP.
The following table provides a breakdown of our total NAV and NAV per share/unit by class as of March 31, 2022 ($ and shares/units in thousands, except per share/unit data):
| NAV Per Share | Class S Shares | Class I Shares | Class T Shares | Class D Shares | Third-party Operating Partnership Units (1) | Total | ||||||||||||||||||||||||||||||||
| Monthly NAV | $ | 21,144,498 | $ | 34,835,841 | $ | 950,838 | $ | 4,938,526 | $ | 1,433,350 | $ | 63,303,053 | ||||||||||||||||||||||||||
| Number of outstanding shares/units | 1,426,428 | 2,350,144 | 65,057 | 339,949 | 96,699 | 4,278,277 | ||||||||||||||||||||||||||||||||
NAV Per Share/Unit as of March 31, 2022 | $ | 14.8234 | $ | 14.8229 | $ | 14.6156 | $ | 14.5273 | $ | 14.8229 | ||||||||||||||||||||||||||||
(1)Includes the partnership interests of BREIT OP held by the Special Limited Partner, Class B unitholders, and other BREIT OP interests held by parties other than us.
The following table details the weighted average discount rate and exit capitalization rate by property type, which are the key assumptions used in the discounted cash flow valuations as of March 31, 2022:
| Property Type | Discount Rate | Exit Capitalization Rate | ||||||||||||
| Residential | 6.7% | 4.8% | ||||||||||||
| Industrial | 6.2% | 5.1% | ||||||||||||
| Net Lease | 6.7% | 5.9% | ||||||||||||
| Hospitality | 9.1% | 9.1% | ||||||||||||
| Data Centers | 6.6% | 5.6% | ||||||||||||
| Self Storage | 7.0% | 5.1% | ||||||||||||
| Office | 6.6% | 4.7% | ||||||||||||
| Retail | 6.7% | 5.3% | ||||||||||||
56
These assumptions are determined by the Adviser and reviewed by our independent valuation advisor. A change in these assumptions would impact the calculation of the value of our property investments. For example, assuming all other factors remain unchanged, the changes listed below would result in the following effects on our investment values:
| Input | Hypothetical Change | Residential Investment Values | Industrial Investment Values | Net Lease Investment Values | Hospitality Investment Values | Data Center Investment Values | Self Storage Investment Values | Office Investment Values | Retail Investment Values | |||||||||||||||||||||||||||||||||||||||||||||||
| Discount Rate | 0.25% decrease | +1.9% | +2.0% | +1.8% | +1.7% | +1.7% | +1.8% | +2.0% | +1.9% | |||||||||||||||||||||||||||||||||||||||||||||||
| (weighted average) | 0.25% increase | (1.9)% | (1.9)% | (1.8)% | (1.6)% | (1.6)% | (1.9)% | (1.9)% | (1.9)% | |||||||||||||||||||||||||||||||||||||||||||||||
| Exit Capitalization Rate | 0.25% decrease | +3.6% | +3.5% | +2.5% | +1.4% | +2.4% | +3.1% | +4.1% | +3.0% | |||||||||||||||||||||||||||||||||||||||||||||||
| (weighted average) | 0.25% increase | (3.3)% | (3.2)% | (2.3)% | (1.3)% | (2.3)% | (3.0)% | (3.6)% | (3.0)% | |||||||||||||||||||||||||||||||||||||||||||||||
The following table reconciles stockholders’ equity and BREIT OP partners’ capital per our Condensed Consolidated Balance Sheets to our NAV ($ in thousands):
| March 31, 2022 | |||||
| Stockholders’ equity | $ | 42,690,796 | |||
| Non-controlling interests attributable to BREIT OP | 1,138,775 | ||||
| Redeemable non-controlling interest | 352 | ||||
| Total partners’ capital of BREIT OP under GAAP | 43,829,923 | ||||
| Adjustments: | |||||
| Accrued stockholder servicing fee | 1,436,123 | ||||
| Organization and offering costs | 1,534 | ||||
| Accrued affiliate incentive compensation awards | (54,905) | ||||
| Accumulated depreciation and amortization under GAAP | 5,537,578 | ||||
| Unrealized net real estate and real estate debt appreciation | 12,552,800 | ||||
| NAV | $ | 63,303,053 | |||
The following details the adjustments to reconcile GAAP stockholders’ equity and total partners’ capital of BREIT OP to our NAV:
–Accrued stockholder servicing fee represents the accrual for the cost of the stockholder servicing fee for Class S, Class T, and Class D shares. Under GAAP, we accrued the full cost of the stockholder servicing fee payable over the life of each share (assuming such share remains outstanding the length of time required to pay the maximum stockholder servicing fee) as an offering cost at the time we sold the Class S, Class T, and Class D shares. Refer to Note 2 to the consolidated financial statements in our Annual Report on Form 10-K for the year ended December 31, 2021 for further details of the GAAP treatment regarding the stockholder servicing fee. For purposes of calculating NAV, we recognize the stockholder servicing fee as a reduction of NAV on a monthly basis when such fee is paid.
–The Adviser agreed to advance certain organization and offering costs on our behalf through December 31, 2017. Such costs are reimbursed to the Adviser on a pro-rata basis over a 60 month period beginning January 1, 2018. Under GAAP, organization costs are expensed as incurred and offering costs are charged to equity as such amounts are incurred. For purposes of calculating NAV, such costs are recognized as a reduction to NAV as they are reimbursed ratably over the 60 month reimbursement period.
–Under GAAP, the affiliate incentive compensation awards are valued as of grant date and compensation expense is recognized over the service period on a straight-line basis with an offset to equity, resulting in no impact to Stockholders’ Equity. For purposes of calculating NAV, we value the awards based on performance in the applicable period and deduct such value from NAV.
–We depreciate our investments in real estate and amortize certain other assets and liabilities in accordance with GAAP. Such depreciation and amortization is not recorded for purposes of calculating our NAV.
–Our investments in real estate are presented at their depreciated cost basis in our GAAP condensed consolidated financial statements. Additionally, our mortgage notes, term loans, secured and unsecured revolving credit facilities, and repurchase agreements (“Debt”) are presented at their amortized cost basis in our consolidated GAAP financial statements. As such, any increases or decreases in the fair market value of our investments in real estate or our Debt are not included in our GAAP results. For purposes of calculating our NAV, our investments in real estate and our Debt are recorded at fair value.
57
Distributions
Beginning in March 2017, we have declared monthly distributions for each class of our common stock, which are generally paid 20 days after month-end. We have paid distributions consecutively each month since that time. Each class of our common stock received the same aggregate gross distribution of $0.1662 per share for the three months ended March 31, 2022. The net distribution varies for each class based on the applicable stockholder servicing fee, which is deducted from the monthly distribution per share and paid directly to the applicable distributor. The table below details the net distribution for each of our share classes for the three months ended March 31, 2022:
| Record Date | Class S Shares | Class I Shares | Class T Shares | Class D Shares | ||||||||||||||||||||||
| January 31, 2022 | $ | 0.0451 | $ | 0.0556 | $ | 0.0452 | $ | 0.0526 | ||||||||||||||||||
| February 28, 2022 | 0.0451 | 0.0547 | 0.0453 | 0.0519 | ||||||||||||||||||||||
| March 31, 2022 | 0.0451 | 0.0559 | 0.0453 | 0.0528 | ||||||||||||||||||||||
| Total | $ | 0.1353 | $ | 0.1662 | $ | 0.1358 | $ | 0.1573 | ||||||||||||||||||
The following tables summarize our distributions declared during the three months ended March 31, 2022 and 2021 ($ in thousands):
| Three Months Ended March 31, 2022 | Three Months Ended March 31, 2021 | ||||||||||||||||||||||
| Amount | Percentage | Amount | Percentage | ||||||||||||||||||||
| Distributions | |||||||||||||||||||||||
| Payable in cash | $ | 296,137 | 48 | % | $ | 132,790 | 46 | % | |||||||||||||||
| Reinvested in shares | 321,340 | 52 | % | 156,615 | 54 | % | |||||||||||||||||
| Total distributions | $ | 617,477 | 100 | % | $ | 289,405 | 100 | % | |||||||||||||||
| Sources of Distributions | |||||||||||||||||||||||
| Cash flows from operating activities | $ | 617,477 | 100 | % | $ | 289,405 | 100 | % | |||||||||||||||
| Offering proceeds | — | — | % | — | — | % | |||||||||||||||||
| Total sources of distributions | $ | 617,477 | 100 | % | $ | 289,405 | 100 | % | |||||||||||||||
| Cash flows from operating activities | $ | 622,823 | $ | 291,636 | |||||||||||||||||||
Funds from Operations(1) | $ | 707,978 | $ | 413,610 | |||||||||||||||||||
Adjusted Funds from Operations(1) | $ | 711,249 | $ | 210,759 | |||||||||||||||||||
Funds Available for Distribution(1) | $ | 539,999 | $ | 249,697 | |||||||||||||||||||
(1)See “Funds from Operations and Adjusted Funds from Operations and Funds Available for Distribution” above for descriptions of Funds from Operations (FFO), Adjusted Funds from Operations (AFFO), and Funds Available for Distribution (FAD), for reconciliations of them to GAAP net loss attributable to BREIT stockholders, and for considerations on how to review these metrics.
From the inception of our business on January 1, 2017 through March 31, 2022, we funded our distributions entirely from cash flows from operations.
Liquidity and Capital Resources
Liquidity
We believe we have sufficient liquidity to operate our business, with $9.3 billion of immediate liquidity as of May 2, 2022, including $5.0 billion of undrawn revolving and line of credit capacity and $4.3 billion of cash and cash equivalents. In addition to our immediate liquidity, we obtain incremental liquidity through the sale of shares of our common stock in our continuous public offering and private offerings, from which we generated $8.0 billion during the three months ended March 31, 2022. In addition, we may incur indebtedness secured by our real estate and real estate debt investments, borrow money through unsecured financings, or incur other forms of indebtedness. We may also generate incremental liquidity through the sale of our real estate and real estate debt investments. Finally, we generate liquidity through our operating cash flow, which was $622.8 million for the three months ended March 31, 2022.
58
Our primary liquidity needs are to acquire our investments, make distributions to our stockholders, fund repurchase requests of shares of our common stock pursuant to our share repurchase plan, pay operating expenses, fund capital expenditures, repay indebtedness, and pay debt service on our outstanding indebtedness. Our operating expenses include, among other things, the management fee we pay to the Adviser and the performance participation allocation that BREIT OP pays to the Special Limited Partner, both of which will impact our liquidity to the extent the Adviser or the Special Limited elect to receive such payments in cash, or subsequently redeem shares or OP units previously issued to them.
We continue to believe that our current liquidity position is sufficient to meet the need of our expected investment activity.
Capital Resources
As of March 31, 2022, our indebtedness included loans secured by our properties, master repurchase agreements and other financing agreements with lenders secured by our investments in real estate debt, and unsecured revolving credit facilities.
The following table is a summary of our indebtedness as of March 31, 2022 ($ in thousands):
| March 31, 2022 | Principal Balance as of | |||||||||||||||||||||||||||||||
| Indebtedness | Weighted Average Interest Rate(1) | Weighted Average Maturity Date(2) | Maximum Facility Size | March 31, 2022 | December 31, 2021 | |||||||||||||||||||||||||||
| Fixed rate loans secured by our properties: | ||||||||||||||||||||||||||||||||
Fixed rate mortgages(3) | 3.6% | 9/25/2028 | N/A | $ | 19,387,718 | $ | 19,086,525 | |||||||||||||||||||||||||
| Variable rate loans secured by our properties: | ||||||||||||||||||||||||||||||||
| Variable rate mortgages and term loans | L+2.0% | 7/13/2026 | N/A | 21,107,149 | 20,004,365 | |||||||||||||||||||||||||||
| Variable rate secured revolving credit facilities | N/A | N/A | $ | 2,963,290 | — | 1,614,550 | ||||||||||||||||||||||||||
| Variable rate warehouse facilities | L+1.6% | 8/6/2027 | $ | 1,562,500 | 1,075,929 | 794,141 | ||||||||||||||||||||||||||
| Variable rate mezzanine loans | L+3.5% | 3/9/2025 | N/A | 71,100 | 71,100 | |||||||||||||||||||||||||||
| Total variable rate loans | L+1.9% | 7/31/2026 | 22,254,178 | 22,484,156 | ||||||||||||||||||||||||||||
| Total loans secured by our properties | 3.0% | 8/1/2027 | $ | 41,641,896 | $ | 41,570,681 | ||||||||||||||||||||||||||
| Secured financings of investments in real estate debt: | ||||||||||||||||||||||||||||||||
Secured financings of investments in real estate debt(4) | L+1.0% | 4/4/2023 | N/A | 4,558,781 | 4,706,632 | |||||||||||||||||||||||||||
| Unsecured loans: | ||||||||||||||||||||||||||||||||
| Unsecured variable rate revolving credit facility | L+2.5% | 2/22/2024 | $ | 1,950,000 | — | — | ||||||||||||||||||||||||||
| Affiliate line of credit | L+2.5% | 1/22/2023 | 75,000 | — | — | |||||||||||||||||||||||||||
| Total unsecured loans | $ | 2,025,000 | — | — | ||||||||||||||||||||||||||||
| Total indebtedness | $ | 46,200,677 | $ | 46,277,313 | ||||||||||||||||||||||||||||
(1)The term “L” refers to the relevant floating benchmark rates, which include one-month LIBOR, three-month LIBOR, 30-day SOFR, and one-month CDOR, as applicable to each loan. As of March 31, 2022, we have outstanding interest rate swaps with an aggregate notional balance of $16.6 billion that mitigate our exposure to potential future interest rate increased under our floating-rate debt.
(2)For loans where we, at our sole discretion, have extension options, the maximum maturity date has been assumed.
(3)Includes $382.9 million of loans related to our investment in affordable housing properties. Such loans are generally with municipalities, housing authorities, and other third parties administered through government sponsored affordable housing programs. Certain of these loans may be forgiven should specific affordable housing conditions be maintained.
(4)Weighted average interest rate of L+1.0% reflects the spread over the relevant floating benchmark rates, which include USD LIBOR, EURIBOR, and SONIA, as applicable to each secured financing.
We registered with the Securities and Exchange Commission (the “SEC”), an offering of up to $60.0 billion in shares of common stock, consisting of up to $48.0 billion in shares in its primary offering and up to $12.0 billion in shares pursuant to its distribution reinvestment plan, which we began using to offer shares of our common stock in March 2022 (the “Current Offering”).
59
As of May 13, 2022, we had received net proceeds of $3.6 billion from selling an aggregate of 243,688,438 shares of our common stock in the Current Offering (consisting of 101,334,243 Class S shares, 94,482,211 Class I shares, 7,581,974 Class T shares, and 40,290,010 Class D shares).
Cash Flows
The following table provides a breakdown of the net change in our cash and cash equivalents and restricted cash ($ in thousands):
| Three Months Ended March 31, | ||||||||||||||
| 2022 | 2021 | |||||||||||||
| Cash flows provided by operating activities | $ | 622,823 | $ | 291,636 | ||||||||||
| Cash flows used in investing activities | (3,453,533) | (1,232,561) | ||||||||||||
| Cash flows provided by financing activities | 6,018,292 | 1,840,966 | ||||||||||||
| Net increase in cash and cash equivalents and restricted cash | $ | 3,187,582 | $ | 900,041 | ||||||||||
Cash flows provided by operating activities increased $0.3 billion during the three months ended March 31, 2022 compared to the corresponding period in 2021 due to increased cash flows from the operations of our investments in real estate and income on our investments in real estate debt.
Cash flows used in investing activities increased $2.2 billion during the three months ended March 31, 2022 compared to the corresponding period in 2021. The increase was primarily due to an increase of $2.0 billion in the acquisitions of and capital improvements to real estate investments, a net increase of $0.9 billion in our investments in real estate debt and an increase of $0.2 billion in investments in unconsolidated entities. This was partially offset by a decrease of $0.5 billion in proceeds from dispositions of real estate and a net decrease of $0.3 billion related to our investments in real estate-related equity securities.
Cash flows provided by financing activities increased $4.2 billion during the three months ended March 31, 2022 compared to the corresponding period in 2021. The increase was primarily due to an increase of $3.6 billion from the issuance of our common stock, an increase of $0.6 billion in subscriptions received in advance, and a decrease of $0.6 billion in repayments. This was partially offset by an increase of $0.6 billion in repurchases of common stock and an increase of $0.2 billion in distributions.
Recent Accounting Pronouncements
See Note 2 — “Summary of Significant Accounting Policies” to our condensed consolidated financial statements in this quarterly report on Form 10-Q for a discussion concerning recent accounting pronouncements.
Critical Accounting Policies
Our discussion and analysis of our financial condition and results of operations is based upon our condensed consolidated financial statements, which have been prepared in accordance with GAAP. There have been no material changes to our Critical Accounting Policies described in our annual report on Form 10-K filed with the SEC on March 11, 2022.
Commitments and Contingencies
The following table aggregates our contractual obligations and commitments with payments due subsequent to March 31, 2022 ($ in thousands).
| Obligations | Total | Less than 1 year | 1-3 years | 3-5 years | More than 5 years | |||||||||||||||||||||||||||
Indebtedness(1) | $ | 54,849,663 | $ | 5,112,406 | $ | 9,847,497 | $ | 26,894,543 | $ | 12,995,217 | ||||||||||||||||||||||
| Ground leases | 1,683,642 | 13,351 | 27,505 | 28,702 | 1,614,084 | |||||||||||||||||||||||||||
| Organizational and offering costs | 1,534 | 1,534 | — | — | — | |||||||||||||||||||||||||||
| Other | 2,398 | 2,398 | — | — | — | |||||||||||||||||||||||||||
| Total | $ | 56,537,237 | $ | 5,129,689 | $ | 9,875,002 | $ | 26,923,245 | $ | 14,609,301 | ||||||||||||||||||||||
(1)The allocation of our indebtedness includes both principal and interest payments based on the fully extended maturity date and interest rates in effect at March 31, 2022.
60
ITEM 3. QUANTITATIVE AND QUALITATIVE DISCLOSURES ABOUT MARKET RISK
We are exposed to interest rate risk with respect to our variable-rate indebtedness, whereas an increase in interest rates would directly result in higher interest expense. We seek to manage our exposure to interest rate risk by utilizing a mix of fixed and floating rate financings with staggered maturities and through interest rate hedging agreements to fix or cap a portion of our variable rate debt. As of March 31, 2022, the outstanding principal balance of our variable rate indebtedness was $26.8 billion and consisted of mortgage notes, term loans, secured and unsecured revolving credit facilities, and secured financings on investments in real estate debt.
Certain of our mortgage notes, term loans, secured and unsecured revolving credit facilities and secured financings are variable rate and indexed to one-month U.S. Dollar denominated LIBOR, three-month U.S. Dollar denominated LIBOR, three-month GBP denominated LIBOR, or three-month Euro denominated LIBOR (collectively, the “Reference Rates”). We have executed interest rate swaps with a notional amount of $16.6 billion as of March 31, 2022 to hedge the risk of increasing interest rates. For the three months ended March 31, 2022, a 10 basis point increase in each of the Reference Rates would have resulted in increased interest expense of $11.8 million, net of the impact of our interest rate swaps.
LIBOR and certain other floating rate benchmark indices to which our floating rate loans and other loan agreements are tied, including, without limitation, the Euro Interbank Offered Rate (collectively, “IBORs”), are the subject of recent national, international and regulatory guidance and proposals for reform. As of December 31, 2021, the ICE Benchmark Association, or IBA, ceased publication of all non-USD LIBOR and the one-week and two-month UDS LIBOR and, as previously announced intends to cease publication of remaining U.S. dollar LIBOR settings immediately after June 30, 2023. Further, on March 15, 2022, the Consolidated Appropriations Act of 2022, which includes the Adjustable Interest Rate (LIBOR) Act, was signed into law in the U.S. This legislation establishes a uniform benchmark replacement process for financial contracts that mature after June 30, 2023 that do not contain clearly defined or practicable fallback provisions. The legislation also creates a safe harbor that shields lenders from litigation if they choose to utilize a replacement rate recommended by the Board of Governors of the Federal Reserve. The U.S. Federal Reserve, in conjunction with the Alternative Reference Rates Committee, a steering committee comprised of large U.S. financial institutions, has identified the Secured Overnight Financing Rate (“SOFR”), a new index calculated using short-term repurchase agreements, backed by Treasury securities, as its preferred alternative rate for U.S. Dollar denominated LIBOR. Additionally market participants have started to transition to the Sterling Overnight Index Average, (“SONIA”), in line with guidance from the U.K. regulators. At this time, it is not possible to predict how markets will respond to SOFR, SONIA, or other alternative reference rates as the transition away from the LIBOR benchmarks proceeds. Despite the LIBOR transition in other markets, benchmark rate methodologies in Europe, Australia, Canada, and Switzerland have been reformed and rates such as the Euro Interbank Offered Rate (“EURIBOR”), the Stockholm Interbank Offered Rate (“STIBOR”), the Canadian Dollar Offered Rate (“CDOR”), and the Australian Bank Bill Swap Reference Rate (“BBSY”), may persist as International Organization of Securities Commissions (“IOSCO”), compliant reference rates moving forward. However, multi-rate environments may persist in these markets as regulators and working groups have suggested market participants adopt alternative reference rates. Refer to “Part I. Item 1A. Risk Factors — Risks Related to Debt Financing — Changes to, or the elimination of, LIBOR may adversely affect interest expense related to borrowings under our credit facilities and real estate-related investments” of our Annual Report on Form 10-K for the year ended December 31, 2021.
Investments in Real Estate Debt
As of March 31, 2022, we held $9.9 billion of investments in real estate debt. Our investments in real estate debt are primarily floating-rate and indexed to the Reference Rates or the SONIA, and as such, exposed to interest rate risk. Our net income will increase or decrease depending on interest rate movements. While we cannot predict factors that may or may not affect interest rates, for the three months ended March 31, 2022, a 10 basis point increase or decrease in the Reference Rates would have resulted in an increase or decrease to income from investments in real estate debt of $10.3 million.
We may also be exposed to market risk with respect to our investments in real estate debt due to changes in the fair value of our investments. We seek to manage our exposure to market risk with respect to our investments in real estate debt by making investments in real estate debt backed by different types of collateral and varying credit ratings. The fair value of our investments may fluctuate, therefore the amount we will realize upon any sale of our investments in real estate debt is unknown. However, as of March 31, 2022, a 10% change in the fair value of our investments in real estate debt would result in a change in the carrying value of our investments in real estate debt of $988.9 million.
61
ITEM 4. CONTROLS AND PROCEDURES
Evaluation of Disclosure Controls and Procedures
An evaluation of the effectiveness of the design and operation of our “disclosure controls and procedures” (as defined in Rule 13a-15(e) under the Securities Exchange Act of 1934, as amended (the “Exchange Act”)), as of the end of the period covered by this quarterly report on Form 10-Q was made under the supervision and with the participation of our management, including our Chief Executive Officer (“CEO”) and Chief Financial Officer (“CFO”). Based upon this evaluation, our CEO and CFO have concluded that as of the end of the period covered by this report our disclosure controls and procedures (a) were effective to ensure that information required to be disclosed by us in reports filed or submitted under the Exchange Act is recorded, processed, summarized and reported within the time periods specified by SEC rules and forms and (b) included, without limitation, controls and procedures designed to ensure that information required to be disclosed by us in reports filed or submitted under the Exchange Act is accumulated and communicated to our management, including our CEO and CFO, as appropriate to allow timely decisions regarding required disclosure.
Changes in Internal Controls over Financial Reporting
There have been no changes in our “internal control over financial reporting” (as defined in Rule 13a-15(f) of the Exchange Act) that occurred during the period covered by this quarterly report on Form 10-Q that have materially affected, or are reasonably likely to materially affect, our internal control over financial reporting.
62
PART II. OTHER INFORMATION
ITEM 1. LEGAL PROCEEDINGS
From time to time, we may be involved in various claims and legal actions arising in the ordinary course of business. As of March 31, 2022, we were not involved in any material legal proceedings.
ITEM 1A. RISK FACTORS
For information regarding factors that could affect our results of operations, financial condition and liquidity, see the risk factors discussed in Part I, Item 1A. “Risk Factors” in our Annual Report on Form 10-K for the year ended December 31, 2021 and under the heading “Risk Factors” in our prospectus dated February 25, 2022, as supplemented.
63
ITEM 2. UNREGISTERED SALES OF EQUITY SECURITIES AND USE OF PROCEEDS
Unregistered Sales of Equity Securities
During the three months ended March 31, 2022, we sold equity securities that were not registered under the Securities Act. As described in Note 9 to our condensed consolidated financial statements, the Adviser is entitled to an annual management fee payable monthly in cash, shares of common stock, or BREIT OP Units, in each case at the Adviser's election. For each of the three months ended March 31, 2022, the Adviser elected to receive its management fee in Class I shares, and we issued 8.4 million unregistered Class I shares to the Adviser in satisfaction of the management fee for January and February 2022. Additionally, we issued 4.5 million unregistered Class I shares to the Adviser in April 2022 in satisfaction of the March 2022 management fee.
Beginning for the quarter ended March 31, 2022, the Special Limited Partner was entitled to a quarterly performance participation allocation. As further described in Note 9 to the condensed consolidated financial statements, the performance participation allocation became payable on March 31, 2022 and in April 2022, we issued 16.1 million Class I units in BREIT OP to the Special Limited Partner as payment for $237.9 million of the performance participation allocation. At the election of the Special Limited Partner, each Class I unit is exchangeable for cash or Class I shares (on a one-for-one basis). Each issuance to the Adviser and the Special Limited Partner was made pursuant to Section 4(a)(2) of the Securities Act. Immediately following the issuance, upon the request by the Special Limited Partner, we exchanged 16.1 million Class I units for 16.1 million class I shares.
We have also sold Class I shares to feeder vehicles created primarily to hold Class I shares and offer indirect interests in such shares to non-U.S. persons. The offer and sale of Class I shares to the feeder vehicles was exempt from the registration provisions of the Securities Act, by virtue of Section 4(a)(2) and Regulation S thereunder. During the three months ended March 31, 2022, we received $1.7 billion from selling 120.7 million unregistered Class I shares to such vehicles. We intend to use the net proceeds from such sales for the purposes set forth in the prospectus for our offering and in a manner within the investment guidelines approved by our board of directors, who serve as fiduciaries to our stockholders.
Share Repurchases
Under our share repurchase plan, to the extent we choose to repurchase shares in any particular month, we will only repurchase shares as of the opening of the last calendar day of that month (each such date, a “Repurchase Date”). Repurchases will be made at the transaction price in effect on the Repurchase Date (which will generally be equal to our prior month’s NAV per share), except that shares that have not been outstanding for at least one year will be repurchased at 98% of the transaction price (an “Early Repurchase Deduction”) subject to certain limited exceptions. Settlements of share repurchases will generally be made within three business days of the Repurchase Date. The Early Repurchase Deduction will not apply to shares acquired through our distribution reinvestment plan.
The aggregate NAV of total repurchases of Class S shares, Class I shares, Class T shares and Class D shares (including repurchases at certain non-U.S. investor vehicles primarily created to hold shares of the Company, but excluding any Early Repurchase Deduction applicable to the repurchased shares) is limited to no more than 2% of our aggregate NAV per month based on the aggregate NAV of the prior month and no more than 5% of our aggregate NAV per calendar quarter based on the average of the aggregate NAV per month over the prior three months.
Should repurchase requests, in our judgment, place an undue burden on our liquidity, adversely affect our operations or risk having an adverse impact on the Company as a whole, or should we otherwise determine that investing our liquid assets in real properties or other investments rather than repurchasing our shares is in the best interests of the Company as a whole, then we may choose to repurchase fewer shares than have been requested to be repurchased, or none at all. Further, our board of directors may modify and suspend our share repurchase plan if it deems such action to be in our best interests and the best interests of our stockholders. In the event that we determine to repurchase some but not all of the shares submitted for repurchase during any month, shares repurchased at the end of the month will be repurchased on a pro rata basis. All unsatisfied repurchase requests must be resubmitted after the start of the next month or quarter, or upon the recommencement of the share repurchase plan, as applicable.
If the transaction price for the applicable month is not made available by the tenth business day prior to the last business day of the month (or is changed after such date), then no repurchase requests will be accepted for such month and stockholders who wish to have their shares repurchased the following month must resubmit their repurchase requests.
64
During the three months ended March 31, 2022, we repurchased shares of our common stock in the following amounts, which represented all of the share repurchase requests received for the same period.
| Month of: | Total Number of Shares Repurchased | Repurchases as a Percentage of NAV(2) | Average Price Paid per Share | Total Number of Shares Repurchased as Part of Publicly Announced Plans or Programs | Maximum Number of Shares Pending Repurchase Pursuant to Publicly Announced Plans or Programs(3) | |||||||||||||||||||||||||||
| January 2022 | 47,489,824 | (1) | 1.3 | % | $ | 14.29 | 47,489,824 | (1) | — | |||||||||||||||||||||||
| February 2022 | 12,952,234 | 0.3 | % | $ | 14.45 | 12,952,234 | — | |||||||||||||||||||||||||
| March 2022 | 26,669,999 | 0.7 | % | $ | 14.61 | 26,669,999 | — | |||||||||||||||||||||||||
| Total | 87,112,057 | N/M | $ | 14.41 | 87,112,057 | — | ||||||||||||||||||||||||||
(1)Includes 37,762,766 Class I shares previously issued to the Special Limited Partner upon redemption of Class I units held by the Special Limited Partner that were acquired as payment for the 2021 performance participation allocation
(2)Represents aggregate NAV of the shares repurchased under our share repurchase plan over aggregate NAV of all shares outstanding, in each case, based on the NAV as of the last calendar day of the prior month.
(3)All repurchase requests under our share repurchase plan were satisfied.
The Special Limited Partner continues to hold 23,788 Class I units in BREIT OP. The redemption of Class I units and Class B units and shares held by the Adviser acquired as payment of the Adviser’s management fee are not considered part of our share repurchase plan.
ITEM 3. DEFAULTS UPON SENIOR SECURITIES
None.
ITEM 4. MINE SAFETY DISCLOSURES
Not applicable.
ITEM 5. OTHER INFORMATION
Not applicable.
65
ITEM 6. EXHIBITS
| 101.INS | Inline XBRL Instance Document | |||||||
| 101.SCH | Inline XBRL Taxonomy Extension Schema Document | |||||||
| 101.SCH | Inline XBRL Taxonomy Extension Calculation Linkbase Document | |||||||
| 101.LAB | Inline XBRL Taxonomy Extension Label Linkbase Document | |||||||
| 101.PRE | Inline XBRL Taxonomy Extension Presentation Linkbase Document | |||||||
| 101.DEF | Inline XBRL Taxonomy Extension Definition Linkbase Document | |||||||
| 104 | Cover Page Interactive Data File (formatted as Inline XBRL and contained in Exhibit 101) | |||||||
| * | Filed herewith. | ||||
| + | This exhibit shall not be deemed “filed” for purposes of Section 18 of the Exchange Act or otherwise subject to the liability of that Section. Such exhibit shall not be deemed incorporated into any filing under the Securities Act or the Exchange Act. | ||||
The agreements and other documents filed as exhibits to this report are not intended to provide factual information or other disclosure other than with respect to the terms of the agreements or other documents themselves, and you should not rely on them for that purpose. In particular, any representations and warranties made by us in these agreements or other documents were made solely within the specific context of the relevant agreement or document and may not describe the actual state of affairs as of the date they were made or at any other time.
66
SIGNATURES
Pursuant to the requirements of the Securities Exchange Act of 1934, the registrant has duly caused this report to be signed on its behalf by the undersigned thereunto duly authorized.
| BLACKSTONE REAL ESTATE INCOME TRUST, INC. | ||||||||
| May 13, 2022 | /s/ Frank Cohen | |||||||
| Date | Frank Cohen | |||||||
| Chief Executive Officer | ||||||||
| (Principal Executive Officer) | ||||||||
| May 13, 2022 | /s/ Anthony F. Marone, Jr. | |||||||
| Date | Anthony F. Marone, Jr. | |||||||
| Chief Financial Officer and Treasurer | ||||||||
| (Principal Financial Officer) | ||||||||
| May 13, 2022 | /s/ Paul Kolodziej | |||||||
| Date | Paul Kolodziej | |||||||
| Chief Accounting Officer | ||||||||
| (Principal Accounting Officer) | ||||||||
67
Serious News for Serious Traders! Try StreetInsider.com Premium Free!
You May Also Be Interested In
- Midday movers: Meta, IBM, Caterpillar fall; Chipotle rises
- KKR Real Estate Finance Trust (KREF) Tops Q1 EPS by 4c
- KKR & Co. (KKR) to Acquire $1.64B Student Housing Portfolio from BREIT (BX)
Create E-mail Alert Related Categories
SEC FilingsSign up for StreetInsider Free!
Receive full access to all new and archived articles, unlimited portfolio tracking, e-mail alerts, custom newswires and RSS feeds - and more!
