

Form 424B3 AvePoint, Inc.
 Tweet
Tweet Share
ShareFiled Pursuant to Rule 424(b)(3)
Registration No. 333-258109
PROSPECTUS SUPPLEMENT NO. 7
(To the Prospectus dated August 9, 2021)
Up to 136,035,264 Shares of Common Stock
Up to 17,905,000 Shares of Common Stock Issuable Upon Exercise of Warrants
Up to 405,000 Warrants to Purchase Common Stock
This prospectus supplement supplements the prospectus, dated August 9, 2021 (the “Prospectus”), which forms a part of our Registration Statement on Form S-1 (No. 333-258109), as amended by that certain Post-Effective Amendment No. 1 to our Registration Statement on Form S-1 filed on April 5, 2022 and made effective on April 11, 2022. This prospectus supplement is being filed to update and supplement the information in the Prospectus with the information contained in our Quarterly Report on Form 10-Q filed with the Securities and Exchange Commission on May 16, 2022 (the “Quarterly Report”). Accordingly, we have attached the Quarterly Report to this prospectus supplement.
The Prospectus and this prospectus supplement relate to the issuance by us of an aggregate of up to 17,905,000 shares of our common stock, $0.0001 par value per share (the “Common Stock”), which consists of (i) up to 405,000 shares of Common Stock that are issuable upon the exercise of 405,000 warrants (the “Private Warrants”) originally issued in a private placement to Apex Technology Sponsor LLC (the “Sponsor”) in connection with the initial public offering of Apex Technology Acquisition Corporation (“Apex”) and (ii) up to 17,500,000 shares of Common Stock that are issuable upon the exercise of 17,500,000 warrants (the “Public Warrants” and, together with the Private Warrants, the “Warrants”) originally issued in the initial public offering of Apex.
The Prospectus and this prospectus supplement also relate to the offer and sale from time to time by the selling securityholders named in the Prospectus or their permitted transferees (the “selling securityholders”) of (i) up to 136,035,264 shares of Common Stock consisting of (a) up to 14,000,000 shares of Common Stock issued in a private placement pursuant to subscription agreements (“Subscription Agreements”) entered into on November 23, 2020, as amended, (b) up to 8,750,000 shares of Common Stock (which includes 2,916,700 Sponsor Earn-Out Shares) issued in a private placement to the Sponsor and Cantor Fitzgerald & Co in connection with the initial public offering of Apex, (c) up to 810,000 shares of Common Stock that were issued in connection with the separation of the Private Units, (d) up to 405,000 shares of Common Stock issuable upon exercise of the Private Warrants and (e) up to 112,070,264 shares of Common Stock (including up to 13,329,190 shares of Common Stock issuable pursuant to outstanding options and up to 1,912,155 shares of Common Stock issuable as Earnout Shares) pursuant to that certain Amended and Restated Registration Rights Agreement, dated July 1, 2021, between us and the selling securityholders granting such holders registration rights with respect to such shares and (ii) up to 405,000 Private Warrants.
The Common Stock and Public Warrants are listed on the Nasdaq Global Select Market (“Nasdaq”) under the symbols “AVPT” and “AVPTW,” respectively. On May 13, 2022, the last reported sales price of our Common Stock on Nasdaq was $4.79 per share and the last reported sales price of our Warrants was $0.82 per warrant.
This prospectus supplement should be read in conjunction with the Prospectus, including any amendments or supplements thereto, which is to be delivered with this prospectus supplement. This prospectus supplement is qualified by reference to the Prospectus, including any amendments or supplements thereto, except to the extent that the information in this prospectus supplement updates and supersedes the information contained therein.
This prospectus supplement is not complete without, and may not be delivered or utilized except in connection with, the Prospectus, including any amendments or supplements thereto.
We are an “emerging growth company” as defined under U.S. federal securities laws and, as such, have elected to comply with reduced public company reporting requirements. The Prospectus complies with the requirements that apply to an issuer that is an emerging growth company.
Investing in our securities involves a high degree of risk. You should review carefully the risks and uncertainties described in the section titled “Risk Factors” beginning on page 10 of the Prospectus and under similar headings in any amendments or supplements to the Prospectus.
Neither the Securities and Exchange Commission nor any state securities commission has approved or disapproved of these securities, or passed upon the accuracy or adequacy of this prospectus supplement or the Prospectus. Any representation to the contrary is a criminal offense.
Prospectus Supplement dated May 16, 2022
UNITED STATES
SECURITIES AND EXCHANGE COMMISSION
Washington, D.C. 20549
FORM 10-Q
|
☒ |
QUARTERLY REPORT PURSUANT TO SECTION 13 OR 15(d) OF THE SECURITIES EXCHANGE ACT OF 1934 |
For the quarterly period ended March 31, 2022
or
|
☐ |
TRANSITION REPORT PURSUANT TO SECTION 13 OR 15(d) OF THE SECURITIES EXCHANGE ACT OF 1934 |
For the transition period from __________ to ___________.
Commission file number: 001-39048
AvePoint, Inc.
(Exact name of registrant as specified in its charter)
|
Delaware |
83-4461709 |
|
(State or other jurisdiction of incorporation or organization) |
(I.R.S. Employer Identification No.) |
525 Washington Blvd, Suite 1400
Jersey City, NJ 07310
(Address of principal executive offices) (Zip Code)
(201) 793-1111
(Registrant’s telephone number, including area code)
Not Applicable
(Former name, former address and former fiscal year, if changed since last report).
Securities Registered Pursuant to Section 12(b) of the Act:
|
Title of each class |
Trading symbol |
Name of each exchange on which registered |
||
|
Common Stock, par value $0.0001 per share |
AVPT |
The Nasdaq Global Select Market |
||
|
Warrants, each whole warrant exercisable for one share of Common Stock at an exercise price of $11.50 per share |
AVPTW |
The Nasdaq Global Select Market |
Indicate by check mark whether the registrant: (1) has filed all reports required to be filed by Section 13 or 15(d) of the Securities Exchange Act of 1934 during the preceding 12 months (or for such shorter period that the registrant was required to file such reports), and (2) has been subject to such filing requirements for the past 90 days. Yes ☒ No ☐
Indicate by check mark whether the registrant has submitted electronically every Interactive Data File required to be submitted pursuant to Rule 405 of Regulation S-T (§232.405 of this chapter) during the preceding 12 months (or for such shorter period that the registrant was required to submit such files). Yes ☒ No ☐
Indicate by check mark whether the registrant is a large accelerated filer, an accelerated filer, a non-accelerated filer, a smaller reporting company or an emerging growth company. See the definitions of “large accelerated filer”, “accelerated filer,” “smaller reporting company” and “emerging growth company” in Rule 12b-2 of the Exchange Act.
|
Large accelerated filer ☐ |
Accelerated filer ☐ |
| Non-accelerated filer ☒ | Smaller reporting company ☒ |
| Emerging growth company ☒ |
If an emerging growth company, indicate by check mark if the registrant has elected not to use the extended transition period for complying with any new or revised financial accounting standards provided pursuant to Section 13(a) of the Exchange Act. ☐
Indicate by check mark whether the registrant is a shell company (as defined in Rule 12b-2 of the Exchange Act). Yes ☐ No ☒
As of May 16, 2022, there were 182,810,742 shares of the registrant’s common stock, par value $0.0001 per share, issued and outstanding.
AVEPOINT, INC.
FORM 10-Q
For the Fiscal Quarter Ended March 31, 2022
TABLE OF CONTENTS
This Quarterly Report on Form 10-Q (this “Quarterly Report”) includes estimates, projections, statements relating to our business plans, objectives, and expected operating results that may constitute “forward-looking statements” within the meaning of the Private Securities Litigation Reform Act of 1995, Section 27A of the Securities Act of 1933, as amended (the “Securities Act”), and Section 21E of the Securities Exchange Act of 1934, as amended (the “Exchange Act”). Forward-looking statements, as well as descriptions of the risks and uncertainties that could cause actual results and events to differ materially, may appear throughout this Quarterly Report, including in the following sections: “Management’s Discussion and Analysis of Financial Condition and Results of Operations” (Part I, Item 2 of this Quarterly Report), “Quantitative and Qualitative Disclosures about Market Risk” (Part I, Item 3 of this Quarterly Report), and “Risk Factors” (Part II, Item 1A of this Quarterly Report),.
These forward-looking statements generally are identified by the words “believe,” “project,” “expect,” “anticipate,” “estimate,” “intend,” “strategy,” “future,” “opportunity,” “plan,” “may,” “should,” “will,” “would,” “will be,” “will continue,” “will likely result,” and similar expressions. However, the absence of these words or similar expressions does not mean that a statement is not forward-looking. All statements that address operating performance, events, or developments that we expect or anticipate will occur in the future — including statements relating to volume growth, sales, earnings, and statements expressing general views about future operating results — are forward-looking statements. These forward-looking statements are, by their nature, subject to significant risks and uncertainties, and are based on the beliefs of, as well as assumptions made by and information currently available to, our management. Our management believes that these forward-looking statements are reasonable as and when made. However, caution should be taken not to place undue reliance on any such forward-looking statements because such statements speak only as of the date when made. Readers should evaluate all forward-looking statements made in the context of these risks and uncertainties. The important factors referenced above may not contain all of the factors that are important to investors.
These forward-looking statements speak only as of the date of this Quarterly Report and involve known and unknown risks, uncertainties and other important factors that may cause our actual results, performance or achievements to be materially different from any future results, performance or achievements expressed or implied by the forward-looking statements. We have based these forward-looking statements largely on our current expectations and projections about future events and financial trends that we believe may affect our business, financial condition and results of operations. These forward-looking statements include, without limitation, statements about:
|
• |
our ability to recognize the anticipated benefits of the Business Combination (as defined in this Quarterly Report), which may be affected by, among other things, competition and the ability of the combined business to grow and manage growth profitably; |
|
|
• |
costs related to the Business Combination; |
|
|
• |
our future operating or financial results; |
|
|
• |
future acquisitions, business strategy and expected capital spending; |
|
|
• |
changes in our strategy, future operations, financial position, estimated revenues and losses, projected costs, prospects and plans; |
|
|
• |
the implementation, market acceptance and success of our business model and growth strategy; |
|
|
• |
expectations and forecasts with respect to the size and growth of the cloud industry and digital transformation in general and Microsoft’s products and services in particular; |
|
|
• |
the ability of our products and services to meet customers’ compliance and regulatory needs; |
|
|
• |
our ability to compete with others in the digital transformation industry; |
|
|
• |
our ability to grow our market share; |
|
|
• |
our ability to attract and retain qualified employees and management; |
|
|
• |
our ability to adapt to changes in consumer preferences, perception and spending habits and develop and expand our product offerings and gain market acceptance of our products, including in new geographies; |
|
|
• |
developments and projections relating to our competitors and industry; |
|
|
• |
our ability to develop and maintain our brand and reputation; |
|
|
• |
developments and projections relating to our competitors and industry; |
|
|
• |
the impact of health epidemics, including the COVID-19 pandemic, on our business and the actions we may take in response thereto; |
|
|
• |
the impact of the COVID-19 pandemic on customer demands for cloud services; |
|
|
• |
unforeseen business disruptions or other impacts due to political instability, civil disobedience, terrorism, armed hostilities (including the outbreak of hostilities between Russia and Ukraine), extreme weather conditions, natural disasters, other pandemics or other calamities. |
|
|
• |
our expectations regarding our ability to obtain and maintain intellectual property protection and not infringe on the rights of others; |
|
|
• |
expectations regarding the time during which we will be an emerging growth company under the JOBS Act; |
|
|
• |
our future capital requirements and sources and uses of cash; |
|
|
• |
our ability to obtain funding for our operations and future growth; and |
|
|
• |
our business, expansion plans and opportunities. |
The foregoing list of risks is not exhaustive. Other sections of this Quarterly Report may include additional factors that could harm our business and financial performance. Moreover, we operate in an evolving environment. New risk factors and uncertainties may emerge from time to time, and it is not possible for management to predict all risk factors and uncertainties. As a result of these factors, we cannot assure you that the forward-looking statements in this Quarterly Report will prove to be accurate. Except as required by applicable law, we do not plan to publicly update or revise any forward-looking statements contained herein, whether as a result of any new information, future events, changed circumstances or otherwise, except as required by law.
Because forward-looking statements are inherently subject to risks and uncertainties, some of which cannot be predicted or quantified and some of which are beyond our control, you should not rely on these forward-looking statements as predictions of future events. Although we believe that we have a reasonable basis for each forward-looking statement contained in this Quarterly Report, the events and circumstances reflected in our forward-looking statements may not be achieved or occur and actual results could differ materially from those projected in the forward-looking statements. You should refer to the ‘‘Risk Factors’’ section of this Quarterly Report for a discussion of important factors that may cause our actual results to differ materially from those expressed or implied by our forward-looking statements.
You should read this Quarterly Report and the documents that we reference in this Quarterly Report and have filed as exhibits to the Quarterly Report, completely and with the understanding that our actual future results may be materially different from what we expect. We qualify all of our forward-looking statements by these cautionary statements.
In addition, statements that “we believe” and similar statements reflect our beliefs and opinions on the relevant subject. These statements are based upon information available to us as of the date of this Quarterly Report and while we believe such information forms a reasonable basis for such statements, such information may be limited or incomplete, and such statements should not be read to indicate that we have conducted an exhaustive inquiry into, or review of, all potentially available relevant information. These statements are inherently uncertain, and investors are cautioned not to unduly rely upon these statements.
Item 1
PART I. FINANCIAL INFORMATION.
Item 1. Financial Statements.
AvePoint, Inc. and Subsidiaries
Condensed Consolidated Balance Sheets
As of March 31, 2022 and December 31, 2021
(In thousands, except par value)
(Unaudited)
|
March 31, |
December 31, |
|||||||
|
2022 |
2021 |
|||||||
|
Assets |
||||||||
|
Current assets: |
||||||||
|
Cash and cash equivalents |
$ | 78,764 | $ | 268,217 | ||||
|
Short-term investments |
181,292 | 2,411 | ||||||
|
Accounts receivable, net of allowance of $805 and $838 at March 31, 2022 and December 31, 2021, respectively |
48,039 | 55,067 | ||||||
|
Prepaid expenses and other current assets |
7,575 | 8,461 | ||||||
|
Total current assets |
315,670 | 334,156 | ||||||
|
Property and equipment, net |
4,457 | 3,922 | ||||||
|
Goodwill and other intangible assets, net |
8,492 | — | ||||||
|
Operating lease right-of-use assets |
13,409 | — | ||||||
|
Deferred contract costs |
39,090 | 38,926 | ||||||
|
Other assets |
10,350 | 11,734 | ||||||
|
Total assets |
$ | 391,468 | $ | 388,738 | ||||
|
Liabilities, mezzanine equity, and stockholders’ equity |
||||||||
|
Current liabilities: |
||||||||
|
Accounts payable |
$ | 1,795 | $ | 1,824 | ||||
|
Accrued expenses and other liabilities |
27,277 | 35,062 | ||||||
|
Current portion of deferred revenue |
76,077 | 74,294 | ||||||
|
Total current liabilities |
105,149 | 111,180 | ||||||
|
Long-term operating lease liabilities |
10,177 | — | ||||||
|
Long-term portion of deferred revenue |
7,886 | 8,038 | ||||||
|
Earn-out shares liabilities |
12,801 | 10,012 | ||||||
|
Other non-current liabilities |
4,400 | 3,943 | ||||||
|
Total liabilities |
140,413 | 133,173 | ||||||
|
Commitments and contingencies |
||||||||
|
Mezzanine equity |
||||||||
|
Redeemable noncontrolling interest |
5,818 | 5,210 | ||||||
|
Total mezzanine equity |
5,818 | 5,210 | ||||||
|
Stockholders’ equity |
||||||||
|
Common stock, $0.0001 par value; 1,000,000 shares authorized, 182,493 and 181,822 shares issued and outstanding, at March 31, 2022 and December 31, 2021, respectively |
18 | 18 | ||||||
|
Additional paid-in capital |
634,070 | 625,056 | ||||||
|
Treasury stock |
(2,482 | ) | (1,739 | ) | ||||
|
Accumulated other comprehensive income |
598 | 2,317 | ||||||
|
Accumulated deficit |
(386,967 | ) | (375,297 | ) | ||||
|
Total stockholders’ equity |
245,237 | 250,355 | ||||||
|
Total liabilities, mezzanine equity, and stockholders’ equity |
$ | 391,468 | $ | 388,738 | ||||
See accompanying notes.
AvePoint, Inc. and Subsidiaries
Condensed Consolidated Statements of Operations
For the Three Months Ended March 31, 2022 and 2021
(In thousands, except per share amounts)
(Unaudited)
|
For the Three Months Ended |
||||||||
|
March 31, |
||||||||
|
2022 |
2021 |
|||||||
|
Revenue: |
||||||||
|
SaaS |
$ | 26,553 | $ | 18,259 | ||||
|
Term license and support |
10,202 | 8,727 | ||||||
|
Services |
8,925 | 5,916 | ||||||
|
Maintenance |
4,441 | 5,409 | ||||||
|
Perpetual license |
170 | 489 | ||||||
|
Total revenue |
50,291 | 38,800 | ||||||
|
Cost of revenue: |
||||||||
|
SaaS |
5,520 | 4,440 | ||||||
|
Term license and support |
576 | 273 | ||||||
|
Services |
8,259 | 5,585 | ||||||
|
Maintenance |
275 | 480 | ||||||
|
Total cost of revenue |
14,630 | 10,778 | ||||||
|
Gross profit |
35,661 | 28,022 | ||||||
|
Operating expenses: |
||||||||
|
Sales and marketing |
27,054 | 19,301 | ||||||
|
General and administrative |
15,542 | 10,292 | ||||||
|
Research and development |
6,402 | 4,102 | ||||||
|
Depreciation and amortization |
511 | 258 | ||||||
|
Total operating expenses |
49,509 | 33,953 | ||||||
|
Loss from operations |
(13,848 | ) | (5,931 | ) | ||||
|
Gain on earn-out and warrant liabilities |
3,267 | — | ||||||
|
Interest income, net |
14 | 13 | ||||||
|
Other expense, net |
(177 | ) | (63 | ) | ||||
|
Loss before income taxes |
(10,744 | ) | (5,981 | ) | ||||
|
Income tax expense (benefit) |
309 | (1,039 | ) | |||||
|
Net loss |
$ | (11,053 | ) | $ | (4,942 | ) | ||
|
Net income attributable to and accretion of redeemable noncontrolling interest |
(617 | ) | (397 | ) | ||||
|
Net loss attributable to AvePoint, Inc. |
$ | (11,670 | ) | $ | (5,339 | ) | ||
|
Deemed dividends on preferred stock |
— | (8,794 | ) | |||||
|
Net loss available to common shareholders |
$ | (11,670 | ) | $ | (14,133 | ) | ||
|
Loss per share: |
||||||||
|
Basic |
$ | (0.06 | ) | $ | (0.14 | ) | ||
|
Diluted |
$ | (0.06 | ) | $ | (0.14 | ) | ||
|
Shares used in computing loss per share: |
||||||||
|
Basic |
182,833 | 100,773 | ||||||
|
Diluted |
182,833 | 100,773 | ||||||
See accompanying notes.
AvePoint, Inc. and Subsidiaries
Condensed Consolidated Statements of Comprehensive Loss
For the Three Months Ended March 31, 2022 and 2021
(In thousands)
(Unaudited)
|
For the Three Months Ended |
||||||||
|
March 31, |
||||||||
|
2022 |
2021 |
|||||||
|
Net loss |
$ | (11,053 | ) | $ | (4,942 | ) | ||
|
Other comprehensive loss net of taxes |
||||||||
|
Foreign currency translation adjustments |
(1,728 | ) | (243 | ) | ||||
|
Total other comprehensive loss |
(1,728 | ) | (243 | ) | ||||
|
Total comprehensive loss |
$ | (12,781 | ) | $ | (5,185 | ) | ||
|
Comprehensive income attributable to redeemable noncontrolling interests |
(608 | ) | (397 | ) | ||||
|
Total comprehensive loss attributable to AvePoint, Inc |
$ | (13,389 | ) | $ | (5,582 | ) | ||
See accompanying notes.
AvePoint, Inc. and Subsidiaries
Condensed Consolidated Statements of Mezzanine Equity and Stockholders’ Equity (Deficiency)
For the Three Months Ended March 31, 2022 and 2021
(In thousands, except share amounts)
(Unaudited)
|
Redeemable |
Share |
Redeemable |
Total |
Accumulated |
||||||||||||||||||||||||||||||||||||||||||||||||||||
|
Convertible |
Common |
Based |
noncontrolling |
mezzanine |
Additional |
Other |
Total |
|||||||||||||||||||||||||||||||||||||||||||||||||
|
Preferred Stock (1) |
Shares |
Awards |
interest |
equity |
Common Stock (1) |
Paid-In |
Treasury Stock |
Accumulated |
Comprehensive |
Stockholders’ |
||||||||||||||||||||||||||||||||||||||||||||||
|
Shares |
Amount |
Amount |
Amount |
Amount |
Amount |
Shares |
Amount |
Capital |
Shares |
Amount |
Deficit |
Income |
Equity (Deficiency) |
|||||||||||||||||||||||||||||||||||||||||||
|
Balance, December 31, 2021 |
— | $ | — | $ | — | $ | — | $ | 5,210 | $ | 5,210 | 181,821,767 | $ | 18 | $ | 625,056 | 143,564 | $ | (1,739 | ) | $ | (375,297 | ) | $ | 2,317 | $ | 250,355 | |||||||||||||||||||||||||||||
|
Proceeds from exercise of options |
— | — | — | — | — | — | 713,810 | — | 1,036 | — | — | — | — | 1,036 | ||||||||||||||||||||||||||||||||||||||||||
|
Common stock issued upon vesting of restricted stock units |
— | — | — | — | — | — | 92,430 | — | — | — | — | — | — | — | ||||||||||||||||||||||||||||||||||||||||||
|
Stock-based compensation expense |
— | — | — | — | — | — | — | — | 8,274 | — | — | — | — | 8,274 | ||||||||||||||||||||||||||||||||||||||||||
|
Reclassification of earn-out RSUs to earn-out shares |
— | — | — | — | — | — | — | — | (296 | ) | — | — | — | — | (296 | ) | ||||||||||||||||||||||||||||||||||||||||
|
Purchase of common stock |
— | — | — | — | — | — | (135,000 | ) | — | — | 135,000 | (743 | ) | — | — | (743 | ) | |||||||||||||||||||||||||||||||||||||||
|
Comprehensive income (loss): |
— | |||||||||||||||||||||||||||||||||||||||||||||||||||||||
|
Net loss |
— | — | — | — | — | — | — | — | — | — | — | (11,053 | ) | — | (11,053 | ) | ||||||||||||||||||||||||||||||||||||||||
|
Net income attributable to and accretion of redeemable noncontrolling interest |
— | — | — | — | 617 | 617 | — | — | — | — | — | (617 | ) | — | (617 | ) | ||||||||||||||||||||||||||||||||||||||||
|
Foreign currency translation adjustment |
— | — | — | — | (9 | ) | (9 | ) | — | — | — | — | — | — | (1,719 | ) | (1,719 | ) | ||||||||||||||||||||||||||||||||||||||
|
Balance, March 31, 2022 |
— | $ | — | $ | — | $ | — | $ | 5,818 | $ | 5,818 | 182,493,007 | $ | 18 | $ | 634,070 | 278,564 | $ | (2,482 | ) | $ | (386,967 | ) | $ | 598 | $ | 245,237 | |||||||||||||||||||||||||||||
AvePoint, Inc. and Subsidiaries
Condensed Consolidated Statements of Mezzanine Equity and Stockholders’ Equity (Deficiency)
For the Three Months Ended March 31, 2022 and 2021
(In thousands, except share amounts)
(Unaudited)
|
Redeemable |
Share |
Redeemable |
Total |
Accumulated |
||||||||||||||||||||||||||||||||||||||||||||||||
|
Convertible |
Common |
Based |
noncontrolling |
mezzanine |
Additional |
Other |
Total |
|||||||||||||||||||||||||||||||||||||||||||||
|
Preferred Stock (1) |
Shares |
Awards |
interest |
equity |
Common Stock (1) |
Paid-In |
Treasury |
Accumulated |
Comprehensive |
Stockholders’ |
||||||||||||||||||||||||||||||||||||||||||
|
Shares |
Amount |
Amount |
Amount |
Amount |
Amount |
Shares |
Amount |
Capital |
Stock |
Deficit |
Income |
Equity (Deficiency) |
||||||||||||||||||||||||||||||||||||||||
|
Balance, December 31, 2020 |
42,000,592 | $ | 183,390 | $ | 25,074 | $ | 1,489 | $ | 3,061 | $ | 213,014 | 100,068,469 | $ | 12 | $ | 105,159 | $ | — | $ | (299,789 | ) | $ | 1,791 | $ | (192,827 | ) | ||||||||||||||||||||||||||
|
Reclassification of share-based awards to mezzanine equity |
— | — | — | 102 | — | 102 | — | — | (102 | ) | — | — | — | (102 | ) | |||||||||||||||||||||||||||||||||||||
|
Remeasurement of redemption value of common shares |
— | — | (183 | ) | — | — | (183 | ) | — | — | — | — | 183 | — | 183 | |||||||||||||||||||||||||||||||||||||
|
Proceeds from exercise of options |
— | — | — | — | — | — | 126,730 | — | 1,125 | — | — | — | 1,125 | |||||||||||||||||||||||||||||||||||||||
|
Stock-based compensation expense |
— | — | — | — | — | — | — | — | 2,275 | — | — | — | 2,275 | |||||||||||||||||||||||||||||||||||||||
|
Remeasurement of redemption value of convertible preferred stock |
— | 8,794 | — | — | — | 8,794 | — | — | — | — | (8,794 | ) | — | (8,794 | ) | |||||||||||||||||||||||||||||||||||||
|
Issuance of redeemable noncontrolling interest in EduTech |
— | — | — | — | 238 | 238 | — | — | 515 | — | — | — | 515 | |||||||||||||||||||||||||||||||||||||||
|
Comprehensive income: |
||||||||||||||||||||||||||||||||||||||||||||||||||||
|
Net loss |
— | — | — | — | — | — | — | — | — | — | (4,942 | ) | — | (4,942 | ) | |||||||||||||||||||||||||||||||||||||
|
Net income attributable to and accretion of redeemable noncontrolling interest |
— | — | — | — | 397 | 397 | — | — | — | — | (397 | ) | — | (397 | ) | |||||||||||||||||||||||||||||||||||||
|
Foreign currency translation adjustment |
— | — | — | — | — | — | — | — | — | — | — | (243 | ) | (243 | ) | |||||||||||||||||||||||||||||||||||||
|
Balance, March 31, 2021 |
42,000,592 | $ | 192,184 | $ | 24,891 | $ | 1,591 | $ | 3,696 | $ | 222,362 | 100,195,199 | $ | 12 | $ | 108,972 | $ | — | $ | (313,739 | ) | $ | 1,548 | $ | (203,207 | ) | ||||||||||||||||||||||||||
(1) As part of the Business Combination (as disclosed in “Note 3 — Business Combination”), all per share information has been retroactively adjusted using an exchange ratio of 8.69144 per share.
See accompanying notes.
AvePoint, Inc. and Subsidiaries
Condensed Consolidated Statements of Cash Flows
For the Three Months Ended March 31, 2022 and 2021
(In thousands)
(Unaudited)
|
For the Three Months Ended |
||||||||
|
March 31, |
||||||||
|
2022 |
2021 |
|||||||
|
Operating activities |
||||||||
|
Net loss |
$ | (11,053 | ) | $ | (4,942 | ) | ||
|
Adjustments to reconcile net loss to net cash used in operating activities: |
||||||||
|
Depreciation and amortization |
1,662 | 258 | ||||||
|
Foreign currency remeasurement loss (gain) |
194 | (71 | ) | |||||
|
Provision for doubtful accounts |
(9 | ) | (393 | ) | ||||
|
Stock-based compensation |
8,274 | 3,289 | ||||||
|
(Gain) loss on disposal of property and equipment |
(12 | ) | 1 | |||||
|
Deferred income taxes |
(9 | ) | — | |||||
|
Change in value of earn-out and warrant liabilities |
(3,252 | ) | — | |||||
|
Changes in operating assets and liabilities: |
||||||||
|
Accounts receivable and long-term unbilled receivables |
9,248 | 6,224 | ||||||
|
Prepaid expenses and other current assets |
205 | (379 | ) | |||||
|
Deferred contract costs and other assets |
(2,090 | ) | (969 | ) | ||||
|
Accounts payable, accrued expenses and other liabilities |
(11,725 | ) | (7,462 | ) | ||||
|
Deferred revenue |
2,444 | 179 | ||||||
|
Net cash used in operating activities |
(6,123 | ) | (4,265 | ) | ||||
|
Investing activities |
||||||||
|
Maturities of investments |
861 | — | ||||||
|
Purchases of investments |
(179,890 | ) | (268 | ) | ||||
|
Acquisition of I-Access, net of cash acquired |
(1,473 | ) | — | |||||
|
Purchase of property and equipment |
(969 | ) | (266 | ) | ||||
|
Net cash used in investing activities |
(181,471 | ) | (534 | ) | ||||
|
Financing activities |
||||||||
|
Payments of transaction fees |
— | (1,255 | ) | |||||
|
Purchase of common stock |
(744 | ) | — | |||||
|
Proceeds from stock option exercises |
1,036 | 1,126 | ||||||
|
Proceeds from sale of common shares of subsidiary |
— | 753 | ||||||
|
Repayments of finance leases |
(5 | ) | (7 | ) | ||||
|
Net cash provided by financing activities |
287 | 617 | ||||||
|
Effect of exchange rates on cash |
(2,146 | ) | (365 | ) | ||||
|
Net decrease in cash and cash equivalents |
(189,453 | ) | (4,547 | ) | ||||
|
Cash and cash equivalents at beginning of period |
268,217 | 69,112 | ||||||
|
Cash and cash equivalents at end of period |
$ | 78,764 | $ | 64,565 | ||||
|
Supplemental disclosures of cash flow information |
||||||||
|
Income taxes paid |
$ | 335 | $ | 304 | ||||
|
Noncash acquisition of I-Access |
$ | 5,636 | $ | — | ||||
See accompanying notes.
AvePoint, Inc. and Subsidiaries
Notes to Condensed Consolidated Financial Statements
(Unaudited)
1. Nature of Business and Organization
On July 1, 2021, pursuant to the terms of a Business Combination Agreement between, inter alia, Apex Technology Acquisition Corporation (“Apex”), a blank check company incorporated in Delaware on April 5, 2019, and AvePoint, Inc. (“Legacy AvePoint”), a New Jersey corporation incorporated on July 24, 2001 which was redomiciled as a Delaware corporation in 2006 and which was renamed "AvePoint Operations, Inc." in June 2021, Legacy AvePoint became a wholly owned subsidiary of Apex. In connection therewith, Legacy AvePoint was renamed “AvePoint US LLC” and Apex was renamed “AvePoint, Inc.” On July 26, 2021, AvePoint US LLC merged with and into AvePoint, Inc. with AvePoint, Inc. (hereinafter referred to as “AvePoint,” the “Company,” “we,” “us,” or “our”) surviving. See “Note 3 - Business Combination” (Part I, Item 1 of this Quarterly Report on Form 10-Q) for additional information.
On February 18, 2022, the Company completed the acquisition of I-Access Solutions Pte. Ltd. (“I-Access acquisition”), a Singapore-based software company established as a leading provider of SaaS solutions for corporate learning and development, by one of the Company's subsidiaries, AvePoint EduTech Pte. Ltd. Refer to “Note 3 — Business Combination” for further details.
We are a leading provider of enterprise collaboration and productivity software solutions. We develop, market, and sell our suite of software solutions and services, primarily in North America, Europe, Australia, and Asia. We provide our customers with high-performance infrastructure management, compliance, data governance, mobility and productivity, online services and software solutions consulting. We do this through our Confidence Platform, a SaaS platform that assists organizations who use M365 and more than a half dozen other cloud collaboration utilities. Our Confidence Platform, built on AOS, contains our suites of software solutions: our Control Suite, for data governance enabling collaboration services at scale, with automation and repeatable business templates; our Fidelity Suite for the preservation of data integrity as organizations undergo digital transformation projects to streamline the way they work from one collaboration system to the next; and our Resilience Suite to help organizations comply with data governance regulations, preserve business records for compliance, and ensure business continuity.
Our principal executive headquarters are located in Jersey City, New Jersey, with our operating headquarters in Richmond, Virginia and additional offices in North America, Europe, Asia, Australia and the Middle East.
2. Summary of Significant Accounting Policies
Basis of Presentation
The accompanying unaudited condensed consolidated balance sheet as of December 31, 2021, which has been derived from audited financial statements, and the unaudited interim condensed consolidated financial statements have been prepared pursuant to the rules and regulations of the Securities and Exchange Commission (the “SEC”) for interim financial information and include the accounts of the Company. Certain information and disclosures normally included in consolidated financial statements prepared in accordance with accounting principles generally accepted in the U.S. (“GAAP”) have been condensed or omitted.
In the opinion of management, these financial statements contain all material adjustments, consisting of normal recurring accruals, necessary to present fairly the financial position, results of operations and cash flows for the periods indicated. Operating results for the three months ended March 31, 2022 are not necessarily indicative of results that may be expected for any other interim period or for the year ending December 31, 2022.
These unaudited interim condensed consolidated financial statements should be read in conjunction with our audited consolidated financial statements as of December 31, 2021 and 2020 and for the years ended December 31, 2021, 2020 and 2019 and the related notes included in our most recent Annual Report on Form 10-K, which was filed with the SEC on March 31, 2022.
Recently Adopted Accounting Guidance
In February 2016, the Financial Account Standard Board (the “FASB”) issued Accounting Standards Update (“ASU”) 2016-02, Leases (“Accounting Standards Codification (“ASC”) 842”) and subsequently issued amendments to the initial guidance: ASU 2017-13, ASU 2018-10, ASU 2018-11, ASU 2018-20, ASU 2019-01, ASU 2019-10, ASU 2020-02, ASU 2020-05 and ASU 2021-05 (collectively, ASC 842). The Company adopted ASC 842 on January 1, 2022 using the modified retrospective approach and has elected not to restate comparative periods and record a cumulative-effect adjustment as of the effective date. ASC 842 requires companies to generally recognize on the balance sheet operating and finance lease liabilities and corresponding right-of-use (ROU) assets.
AvePoint, Inc. and Subsidiaries
Notes to Condensed Consolidated Financial Statements
(Unaudited)
Comparative Data
Certain amounts from prior periods which have been presented separately have been grouped to conform to the current period presentation, including:
|
• |
The reclassification of long-term unbilled receivables to be included in other assets on the condensed consolidated balance sheets as of December 31, 2021; and |
| • | The reclassification of accrued rent obligation to be included in accounts payable, accrued expenses and other liabilities on the condensed consolidated statements of cash flows for the three months ended March 31, 2021. |
Business Combination
When we consummate an acquisition, the assets acquired, and the liabilities assumed are recognized separately from goodwill at their acquisition date fair values. Goodwill as of the acquisition date is measured as the excess of the fair value of consideration transferred over the acquisition date fair value of the net identifiable assets acquired. While best estimates and assumptions are used to accurately value assets acquired and liabilities assumed at the acquisition date as well as contingent consideration, where applicable, our estimates are inherently uncertain and subject to refinement. As a result, during the measurement period, which may be up to one year from the acquisition date, we record adjustments to the assets acquired and liabilities assumed with the corresponding offset to goodwill as we obtain new information about facts and circumstances that existed as of the acquisition date that, if known, would have affected the measurement of the amounts recognized as of that date. Upon the earlier of the conclusion of the measurement period or final determination of the values of assets acquired or liabilities assumed, any subsequent adjustments are recorded in the consolidated statements of income.
Goodwill and Other Intangible Assets
Goodwill represents the excess of the fair value of consideration transferred over the fair value of net identifiable assets acquired. Other intangible assets consist of order backlog, customer relationship and acquired software and technology. Intangible assets that are not considered to have an indefinite useful life are amortized over their useful lives, which range from one year to ten years. Amortization expense for intangible assets was $0.1 million for the three months ended March 31, 2022.
We will test goodwill for impairment at least annually by performing a quantitative assessment of whether the fair value of each reporting unit or asset exceeds its carrying amount. We have one reporting unit. Goodwill is tested at this reporting unit level. This requires us to assess and make judgments regarding a variety of factors which impact the fair value of the reporting unit or asset being tested, including business plans, anticipated future cash flows, economic projections and other market data.
No other events or circumstances changed since the I-Access acquisition that would indicate that the fair value of our reporting unit is below its carrying amount. During the three months as of March 31, 2022, the goodwill had not been impaired.
Our intangible assets are subject to amortization and are amortized using the straight-line method over their estimated period of benefit, ranging from one to 10 years. We evaluate the recoverability of intangible assets periodically by taking into account events or circumstances that may warrant revised estimates of useful lives or that indicate the asset may be impaired.
Use of Estimates
The preparation of condensed consolidated financial statements in conformity with GAAP requires management to make estimates and assumptions that affect the amounts reported in our condensed consolidated financial statements and accompanying notes. We base our estimates and assumptions on historical experience and on various other assumptions that we believe are reasonable under the circumstances. The amounts of assets and liabilities reported in our condensed consolidated balance sheets and the amounts of revenue and expenses reported for each of its periods presented are affected by estimates and assumptions, which are used for, but not limited to, the accounting for revenue recognition, allowance for doubtful accounts, deferred contract costs, valuation of goodwill and other intangible assets, income taxes and related reserves, stock-based compensation, purchase price in a business combination, and earn-out liabilities. Actual results and outcomes may differ from management’s estimates and assumptions due to risks and uncertainties, including uncertainty in the current economic environment due to the outbreak of COVID-19.
Foreign Currency
The Company has foreign operations where the functional currency has been determined to be the local currency, in accordance with FASB ASC 830, Foreign Currency Matters (“ASC 830”). Adjustments resulting from translating such foreign functional currency assets and liabilities into U.S. dollars, based on current exchange rates, are recorded as a separate component of stockholders’ equity (deficiency) under the caption, accumulated other comprehensive income. Revenue and expenses are translated using average rates prevailing during the period. Transaction gains and losses arising from exchange rate fluctuations on transactions denominated in a currency other than the functional currency are included in other income (expense), net in the Company’s condensed consolidated statements of operations. Transaction gains (losses) totaled $(0.2) million and $0.1 million for the three months ended March 31, 2022 and 2021.
Cash and Cash Equivalents
The Company maintains cash with several high credit-quality financial institutions. The Company considers all investments available with original maturities of three months or less to be cash equivalents. These investments are not subject to significant market risk. The Company maintains its cash and cash equivalents in bank accounts which, at times, exceed the federally insured limits. The Company has not experienced any losses in such accounts. The Company maintains cash balances used in operations at entities based in countries which imposes regulations that limit the ability to transfer cash out of the country. As of March 31, 2022 and December 31, 2021, the Company’s cash balances at these entities were $8.1 million and $9.3 million, respectively. For purposes of the condensed consolidated statements of cash flows, cash includes all amounts in the condensed consolidated balance sheets captioned cash and cash equivalents.
Short-Term Investments
Short-term investments consist mainly U.S. treasury bills and certificate of deposits held by financial institutions which have an initial maturity of greater than three months but less than or equal to one year at period end.
Based on our intentions regarding these investments, we classify substantially all of our investments as available-for-sale. We carry these securities at fair value, and report the unrealized gains and losses, net of taxes, as a component of stockholders’ equity, except for any unrealized losses determined to be related to credit losses, which we record within non-operating income, net in the accompanying consolidated statements of operations. Substantially all of our investments are classified as current based on the nature of the investments and their availability for use in current operations.
Allowance for Doubtful Accounts
The Company evaluates the collectability of its accounts receivable based on a combination of factors. Where we are aware of circumstances that may impair a specific customer’s ability to meet its financial obligations, we record a specific allowance against amounts due. For all other customers, we recognize allowances for doubtful accounts based on the length of time the receivables are outstanding, the current business environment and its historical experience. Accounts are written off when deemed uncollectible. Recoveries of accounts receivable previously written off are recorded when received. As such, we present trade receivables at their net estimated realizable value through use of the allowance for doubtful accounts.
Deferred Contract Costs
We defer sales commissions earned by its sales force that are considered to be incremental and recoverable costs of obtaining SaaS, term license and support, service, perpetual license and maintenance contracts. We have structured commissions plans such that the commission rate paid on renewal contracts are less than those paid on the initial contract; therefore, it is determined that the renewal commissions are not commensurate with the initial commission that are deferred and amortized. We determine the estimated average customer relationship period and average renewal term utilizing a portfolio approach. Deferred costs are periodically reviewed for impairment.
Amortization of deferred contract costs of $3.0 million and $2.2 million for the three months ended March 31, 2022, and 2021, is included as a component of sales and marketing expenses in our consolidated statements of operations. Deferred contract costs recognized as a contract asset on our balance sheet was $39.1 million and $38.9 million at March 31, 2022 and December 31, 2021, respectively.
Revenue Recognition
The Company derives revenue from four primary sources: SaaS, term license and support, services, and maintenance. Services include installation services, training and other consulting services. The following table presents our revenue by source:
|
For the Three Months Ended |
||||||||
|
March 31, |
||||||||
|
2022 |
2021 |
|||||||
|
Revenue: |
||||||||
|
SaaS |
$ | 26,553 | $ | 18,259 | ||||
|
Term license and support |
10,202 | 8,727 | ||||||
|
Services |
8,925 | 5,916 | ||||||
|
Maintenance |
4,441 | 5,409 | ||||||
|
Perpetual license |
170 | 489 | ||||||
|
Total revenue |
$ | 50,291 | $ | 38,800 | ||||
Term license and perpetual license revenue recognized at point in time was $6.2 million and $6.1 million for the three months ended March 31, 2022 and 2021, respectively.
We use judgement in determining the SSP for products and services. For substantially all performance obligations except term licenses, we are able to establish the SSP based on the observable prices of products or services sold separately in comparable circumstances to similar customers. We typically establish an SSP range for our products and services which is reassessed on a periodic basis or when facts and circumstances change. Term licenses are sold only as a bundled arrangement that includes the rights to a term license and support. In determining the SSP of license and support in a term license arrangement we applied observable inputs using the value relationship between support and term license, the value relationship between support and perpetual licenses, the average economic life of our products, software renewals rates and the price of the bundled arrangement in relation to the perpetual licensing approach. Using a combination of the relative fair value method or the residual value method the SSP of the performance obligations in an arrangement was allocated to each performance obligation within a sales arrangement.
Revenue deferred as of March 31, 2022 and December 31, 2021 was $84.0 million and $82.3 million, respectively. Revenue recognized that was included in the opening deferred revenue balance was $30.2 million and $26.7 million for the three months ended March 31, 2022 and 2021, respectively.
The opening and closing balances of the Company’s accounts receivable, net, deferred revenue and deferred contract costs are as follows:
|
Accounts |
Deferred |
|||||||||||
|
receivable, |
Deferred |
contract |
||||||||||
|
net (1) |
revenue |
costs |
||||||||||
|
(in thousands) |
||||||||||||
|
Opening (January 1, 2021) |
$ | 53,749 | $ | 74,688 | $ | 31,943 | ||||||
|
Closing (December 31, 2021) |
61,335 | 82,332 | 38,926 | |||||||||
|
Increase/(decrease) |
7,586 | 7,644 | 6,983 | |||||||||
|
Opening (January 1, 2022) |
$ | 61,335 | $ | 82,332 | $ | 38,926 | ||||||
|
Closing (March 31, 2022) |
51,897 | 83,963 | 39,090 | |||||||||
|
Increase/(decrease) |
(9,438 | ) | 1,631 | 164 | ||||||||
(1) Accounts receivable, net is inclusive of accounts receivable, net of allowance for doubtful accounts, current unbilled receivables and long-term unbilled receivables.
Stock-Based Compensation
Stock-based compensation represents the cost related to stock-based awards granted to employees. To date, we have issued both stock options and restricted stock units (“RSUs”). With respect to equity-classified awards, the Company measures stock-based compensation cost at the grant date based on the estimated fair value of the award and recognizes the cost as expense ratably (net of estimated forfeitures) over the requisite service period. With respect to liability-classified awards, the Company measures stock-based compensation cost at the grant date and at each reporting period based on the estimated fair value of the award. Stock-based compensation cost is recognized ratably over the requisite service period, net of actual forfeitures in the period.
We estimate the fair value of stock options using a Black-Scholes valuation model. The Black-Scholes model requires highly subjective assumptions in order to derive the inputs necessary to the calculate the fair value of stock options. To estimate the expected term of stock options, the Company considered contractual terms of the options, including the vesting and expiration periods, as well as historical option exercise data and current market conditions to determine an estimated expected term. The Company’s historical experience is too limited to be able to reasonably estimate expected term. Expected volatility is based on historical volatility of a group of peer entities. Dividend yields are based upon historical dividend yields. Risk-free interest rates are based on the implied yields currently available on U.S. Treasury zero coupon issues with a remaining term equal to the expected term.
Income Taxes
Deferred tax assets and liabilities are recognized for the future tax consequences attributable to difference between financial statement carrying amounts of existing assets and liabilities and their respective tax basis. Deferred tax assets and liabilities are measured using enacted tax rates expected to be applied to taxable income in the years in which those temporary differences are expected to be recovered or settled.
We recognize liabilities for uncertain tax positions taken or expected to be taken in income tax returns. Accrued interest and penalties related to unrecognized tax benefits are recognized as part of the provision for income taxes. Judgment is required in determining the provision for income taxes, deferred tax assets and liabilities and unrecognize tax benefits. In determining the need for a valuation allowance, the historical and projected financial performance of the operation that is recording a net deferred tax asset is considered along with any other pertinent information.
We file income tax returns in the U.S. federal, various states and foreign jurisdictions. The tax years 2017 through 2020 are open and subject to audit by US federal, state and local authorities. The tax years 2011 through 2021 are open and subject to audit by foreign tax jurisdictions.
AvePoint, Inc. and Subsidiaries
Notes to Condensed Consolidated Financial Statements
(Unaudited)
Redeemable Noncontrolling Interest
At March 31, 2022 and December 31, 2021, the Company owned 76.09% of AvePoint EduTech Pte. Ltd. (“EduTech”).
AEPL Pte. Ltd. (“AEPL”)
As part of AEPL’s investment in EduTech, the Company granted AEPL a put option which allows AEPL to cause the Company to repurchase AEPL’s shares in EduTech at any time between December 24, 2022 and December 24, 2023 at a price equal to AEPL’s initial investment of approximately $8.3 million. Consequently, the Company records redeemable noncontrolling interest as mezzanine equity in its unaudited condensed consolidated balance sheets. At each reporting period, the Company increases the carrying amount of the redeemable noncontrolling interest by periodic accretions using the interest method so that the carrying amount will equal the redemption amount on the date that the put option becomes exercisable, and adjustments to the value are recorded as net income attributable to redeemable noncontrolling interest. At March 31, 2022 and December 31, 2021, AEPL owned 23.91% of EduTech.
I-Access Solutions Pte. Ltd. (“I-Access”)
On February 18, 2022 (the “I-Access Closing Date”), EduTech consummated its acquisition of all of the ordinary shares of I-Access, a Singapore limited company. As a result, I-Access became a wholly-owned subsidiary of EduTech. The acquisition was made pursuant to a share purchase agreement, dated as of January 31, 2022 (the “Share Purchase Agreement”), by and among EduTech and the former I-Access shareholders. At March 31, 2022, former I-Access shareholders owned 2.98% of EduTech. As of the I-Access Closing Date and March 31, 2022, the shares owned by the former I-Access shareholders were included in the contingent considerations and liability-classified, therefore no noncontrolling interest attributed. Refer to (“Note 3 — Business Combination”) for further details.
Emerging Growth Company
The Company is considered an emerging growth company. Section 102(b)(1) of the Jobs Act exempts emerging growth companies from being required to comply with new or revised financial accounting standards until private companies (that is, those that have not had a Securities Act registration statement declared effective or do not have a class of securities registered under the Exchange Act) are required to comply with the new or revised financial accounting standards. The JOBS Act provides that a company can elect to opt out of the extended transition period and comply with the requirements that apply to non-emerging growth companies but any such an election to opt out is irrevocable. The Company elects not to opt out of such extended transition period which means that when a standard is issued or revised and it has different application dates for public or private companies, the Company, as an emerging growth company, can adopt the new or revised standard at the time private companies adopt the new or revised standard.
Recent Accounting Pronouncements
In August 2020, the FASB issued ASU 2020-06, Debt — Debt with Conversion and Other Options (“ASC 470-20”) and Derivatives and Hedging — Contracts in Entity’s Own Equity (“ASC 815-40”) (“ASU 2020-06”). ASU 2020-06 simplifies the accounting for certain financial instruments with characteristics of liabilities and equity, including convertible instruments and contracts on an entity’s own equity. The ASU is part of the FASB’s simplification initiative, which aims to reduce unnecessary complexity in U.S. GAAP. The amendments in this ASU are effective for entities eligible to be smaller reporting companies for fiscal years beginning after December 15, 2023. The Company is currently evaluating the impact ASU 2020-06 will have on its consolidated financial statements.
In December 2019, the FASB issued ASU 2019-12, Income Taxes (“ASC 740”): Simplifying the Accounting for Income Taxes (ASU 2019-12), which is intended to simplify various areas related to the accounting for income taxes and improve consistent application of ASC 740. The amendments in this ASU are effective for EGC entities, which elected to take advantage of the extended transition period, for fiscal years beginning after December 15, 2021. Early adoption of the amendments is permitted, including adoption in any interim period for public business entities for periods for which financial statements have not yet been issued and all other entities for periods for which financial statements have not yet been made available for issuance. The Company is currently evaluating the impact of its pending adoption of ASU 2019-12 on its consolidated financial statements.
In January 2016, the FASB issued ASU 2016-13, Financial Instruments — Credit Losses on Financial Instruments (“ASC 326”) which replaces incurred loss methodology to estimate credit losses on financial instruments with a methodology that reflects expected credit losses. This amendment affects entities holding financial assets that are not accounted for at fair value through net income including trade receivables. Subsequently FASB issued ASU 2020-02 which deferred the adoption date. The amendments in this ASU are effective for EGC entities, which elected to take advantage of the extended transition period, for fiscal years beginning after December 15, 2022. Early application of the amendments is permitted. The Company is currently evaluating the impact of adoption of this ASU on its consolidated financial statements.
While the Company generally expects the financial records to be impacted by the requirements highlighted above, the Company cannot reasonably estimate the impact that adoption of the ASUs referenced in this announcement is expected to have on the financial statements at this time.
AvePoint, Inc. and Subsidiaries
Notes to Condensed Consolidated Financial Statements
(Unaudited)
3. Business Combination
Apex Technology Acquisition Corporation
I-Access Acquisition
On February 18, 2022 (the “I-Access Closing Date”), AvePoint EduTech Pte. Ltd. (“Edutech”) consummated its acquisition of all of the ordinary shares of I-Access Solutions Pte. Ltd., a Singapore limited company (“I-Access”). As a result, I-Access became a wholly-owned subsidiary of EduTech. The acquisition was made pursuant to a share purchase agreement, dated as of January 31, 2022 (the “Share Purchase Agreement”), by and among EduTech and the former I-Access shareholders. The Company, through its subsidiary EduTech, completed the acquisition of I-Access to further expand its SaaS solutions for corporate learning and development. The fair value of the transaction considerations totaled approximately $7.1 million, consisting of: $1.5 million in cash, and contingent consideration measured at a fair value of $5.6 million on the I-Access Closing date. The above mentioned contingent consideration (the “I-Access Contingent Consideration”) consists of:
(i) 2.96% of EduTech common shares (of those, 292,440 shares were issued on the I-Access Closing Date and 30,252 shares were held in escrow pending distribution pursuant to the Adjustment for Guaranteed Minimum Revenue (as defined below));
(ii) put option which allows sellers to cause EduTech to repurchase the shares of EduTech for approximately $5.9 million, upon 24 months from Acquisition Close Date or the occurrence of certain triggering events which are in the control of the Company; and
(iii) earnout in EduTech shares held in escrow at a fair value equal to revenue surplus above the agreed guaranteed minimum revenue amount, of up to approximately $0.7 million, or the return of EduTech shares at a fair value equal to the revenue shortfall below the agreed guaranteed minimum revenue amount, of up to approximately $0.7 million (together, the “Adjustment for Guaranteed Minimum Revenue”). In the event of a revenue shortfall, all shares held in escrow may be returned to EduTech.
Pursuant to the terms of the Share Purchase Agreement, the Adjustment for Guaranteed Minimum Revenue will be cancelled upon the removal of any individual of I-Access’s existing management with such management members’ consent. The acquisition-related costs totaled at $0.3 million and are recognized as an expense in the general and administrative item in the condensed consolidated statements of operations.
AvePoint, Inc. and Subsidiaries
Notes to Condensed Consolidated Financial Statements
(Unaudited)
The contingent consideration is liability classified and are remeasured at fair value each period. The fair value of the contingent consideration is estimated using a combination of multiple valuation methods, including discounted cash flows method, guideline public company method, and Black-Scholes option-pricing model with the following weighted-average assumptions at February 18, 2022 and March 31, 2022:
| February 18, | March 31, | |||||||
| 2022 | 2022 | |||||||
| Expected life (in years) | 2.08 | 1.97 | ||||||
| Expected volatility | 50 | % | 50 | % | ||||
| Risk-free rate | 1.23 | % | 1.86 | % | ||||
| Dividend | 0 | % | 0 | % | ||||
The contingent consideration fair value estimated on the I-Access Closing Date and March 31, 2022 was $5.6 million and $5.7 million, respectively, and is included in the earn-out shares liabilities on the condensed consolidated balance sheet. During the three months ended March 31, 2022, the change in the fair value is included in the general and administrative on the condensed consolidated statements of operations. The financial results of I-Access have been included in our condensed consolidated financial statements since the date of the acquisition. The I-Access business is reported within our reportable segment. In accordance with ASC 805-740, the Company established a deferred tax liability with an offset to goodwill in connection with the accounting for the opening balance sheet of the I-Access acquisition as a result of book-to-tax differences primarily related to the technology and software intangibles, customer relationship, and order backlog.
Since the date of the most recent balance sheet period reported, the key member of I-Access’s management was removed without consent. As a result, the Adjustment for Guaranteed Minimum Revenue was canceled and the 292,440 EduTech shares issued as consideration on the I-Access Closing Date, the 30,252 EduTech shares held in escrow, and the put option on EduTech shares, are no longer contingent and will be mezzanine classified and embedded in noncontrolling interest.
The valuation of assets acquired and liabilities assumed has not yet been finalized as of March 31, 2022. The purchase price allocation is preliminary and subject to change, including the valuation of intangible assets, income taxes, and goodwill, among other items. The amounts recognized will be finalized as the information necessary to complete the analysis is obtained, but no later than one year after the acquisition date. Finalization of the valuation during the measurement period could result in a change in the amounts recorded for the acquisition date fair value.
The following table summarizes the preliminary fair value of assets acquired and liabilities assumed as of the acquisition date:
|
Preliminary Allocation |
||||
|
(in thousands) |
||||
|
Accounts receivable, net |
$ | 429 | ||
|
Prepaid expenses and other current assets |
72 | |||
|
Property and equipment |
22 | |||
|
Goodwill |
4,862 | |||
|
Technology and software |
2,750 | |||
|
Customer relationship |
646 | |||
|
Order backlog |
263 | |||
|
Other assets |
85 | |||
|
Accrued expenses and other liabilities |
(718 | ) | ||
|
Current portion of deferred revenue |
(230 | ) | ||
|
Other non-current liabilities |
(1,072 | ) | ||
|
Total purchase consideration |
$ | 7,109 | ||
Intangible assets primarily relate to acquired technology and software, customer relationship and order backlog. The acquired definite-lived intangible assets are being amortized over an estimated useful life of: (i) 10 years for technology and software on a straight-line basis; (ii) 10 years for customer relationship on a straight-line basis; and (iii) 1 year for order backlog on a straight-line basis. The estimated fair values of identifiable intangible assets were determined using the relief from royalty method which is based on the premise that the only value that a purchaser of the assets receives is the exemption from paying a royalty for its use over its remaining useful life. Some of the significant assumptions inherent in the development of such asset valuations include revenues, royalty rate, contributory asset charges, discount rate, useful life, as well as other factors. The fair value of intangible assets as of March 31, 2022 is based on preliminary assumptions which are subject to change as we complete our valuation procedures.
AvePoint, Inc. and Subsidiaries
Notes to Condensed Consolidated Financial Statements
(Unaudited)
Goodwill and other intangible assets, net, consists of the following components:
|
March 31, |
December 31, |
|||||||
|
2022 |
2021 |
|||||||
|
(in thousands) |
||||||||
|
Goodwill |
$ | 4,875 | $ | — | ||||
|
Technology and software, net |
2,734 | — | ||||||
|
Customer relationship, net |
642 | — | ||||||
|
Order backlog, net |
241 | — | ||||||
| $ | 8,492 | $ | — | |||||
As of March 31, 2022, estimated future amortization expense for the intangible assets reflected above was as follows:
|
Year Ending December 31: |
||||
|
(in thousands) |
||||
|
2022 (nine months) |
$ | 453 | ||
|
2023 |
384 | |||
|
2024 |
340 | |||
|
2025 |
340 | |||
|
2026 |
340 | |||
|
Thereafter |
1,760 | |||
|
Total intangible assets subject to amortization |
$ | 3,617 | ||
The changes in the carrying amounts of goodwill were as follows:
|
Goodwill |
||||
|
(in thousands) |
||||
|
Balance as of December 31, 2021 |
$ | — | ||
|
I-Access acquisition |
4,862 | |||
|
Effect of foreign currency translation |
13 | |||
|
Balance as of March 31, 2022 |
$ | 4,875 | ||
The goodwill is assigned to the single reporting unit.
A summary of the balances of the Company's intangible assets as of March 31, 2022 and December 31, 2021 is presented below:
|
Gross Carrying Amount |
Accumulated Amortization |
Net Carrying Amount |
Gross Carrying Amount |
Accumulated Amortization |
Net Carrying Amount |
|||||||||||||||||||
|
March 31, |
December 31, |
|||||||||||||||||||||||
|
2022 |
2021 |
|||||||||||||||||||||||
|
(in thousands) |
(in thousands) |
|||||||||||||||||||||||
|
Technology and software, net |
$ | 2,757 | $ | (23 | ) | $ | 2,734 | $ | — | $ | — | $ | — | |||||||||||
|
Customer relationship, net |
648 | (6 | ) | 642 | — | — | — | |||||||||||||||||
|
Order backlog, net |
263 | (22 | ) | 241 | — | — | — | |||||||||||||||||
|
Total |
$ | 3,668 | $ | (51 | ) | $ | 3,617 | $ | — | $ | — | $ | — | |||||||||||
4. Concentration of Credit Risk
The Company deposits its cash with financial institutions and, at times, such balances may exceed federally insured limits. No customer accounted for more than 10% of revenue for the three months ended March 31, 2022 and 2021, and no customer made up more than 10% of accounts receivable at March 31, 2022 or December 31, 2021.
5. Accounts Receivable, Net
Accounts receivable, net, consists of the following components:
|
March 31, |
December 31, |
|||||||
|
2022 |
2021 |
|||||||
|
(in thousands) |
||||||||
|
Trade receivables |
$ | 30,811 | $ | 38,819 | ||||
|
Current unbilled receivables |
18,033 | 17,086 | ||||||
|
Allowance for doubtful accounts |
(805 | ) | (838 | ) | ||||
| $ | 48,039 | $ | 55,067 | |||||
AvePoint, Inc. and Subsidiaries
Notes to Condensed Consolidated Financial Statements
(Unaudited)
6. Line of Credit
On April 7, 2020, Legacy AvePoint entered into a loan and security agreement (the “Loan Agreement”) with HSBC Ventures Bank USA Inc. (“HSBC”), a commercial bank.
On July 1, 2021, Legacy AvePoint effected an assignment of its existing rights and obligations under the Loan Agreement to AvePoint US, LLC (which, at the time of the assignment, was a wholly-owned subsidiary of the Company) through entry into a limited consent and first amendment to the Loan Agreement (the “First Amendment,” and the Loan Agreement as amended thereby, the “First Amended Loan Agreement”) and an assignment and assumption agreement (the “First Assignment and Assumption Agreement”). In addition, the Company's Board approved the entry into a pledge agreement (the “Pledge Agreement”) and limited guaranty (the “Limited Guaranty”) in favor of HSBC, pursuant to which the Company pledged 100% of the AvePoint US, LLC equity held by it (the “Pledged Equity”) as collateral in support of the borrower’s obligations under the Amended Loan Agreement and further provided a payment guarantee to HSBC on behalf of AvePoint US, LLC equal to the value of the Pledged Equity and capped at the amount actually borrowed under the First Amended Loan Agreement.
On July 26, 2021, the Company effected a merger with AvePoint US, LLC, following the consummation of which the Company was the surviving entity (the “Rollup Merger”). In connection therewith, on July 23, 2021, the Company entered into that certain second assignment and assumption agreement (the “Second Assignment and Assumption Agreement”) by and among the Company, AvePoint US, LLC, and HSBC, pursuant to which the Company would assume AvePoint US, LLC’s obligations as borrower under the First Amended Loan Agreement as of the effective time of the Rollup Merger (the “Assumption”). The Company, the guarantors party to the Loan Agreement (the “Guarantors”), and HSBC also entered into that certain limited consent, dated as of July 23, 2021 (the “Limited Consent”), whereby HSBC consented to the Rollup Merger, the entry into the Second Assignment and Assumption Agreement, and the Assumption, and all other actions taken by or necessary or permissible to be taken by the Company, AvePoint US, LLC, or the Guarantors related thereto, whether occurring prior to, on, or after the effective time of the Rollup Merger.
On October 31, 2021, the Company entered into that certain Second Amendment (the "Second Amendment") to the First Amended Loan Agreement. The First Amended Loan Agreement as amended by the Second Amendment (the "Second Amended Loan Agreement") provides for, among other things, completion of the Post-Closing Amendments (as defined in the Limited Consent) and the removal of "Holdings" (as defined in the First Amended Loan Agreement) as a limited guarantor of the Borrower's (as defined in the First Amended Loan Agreement) obligations under the First Amended Loan Agreement and the de facto termination of the Pledge Agreement and Limited Guaranty.
The Second Amended Loan Agreement’s substantive economic terms were not amended from the original Loan Agreement, the substantive economic terms of which are described as follows: a revolving line of credit of up to $30.0 million, with an additional $20.0 million accordion feature for additional capital the Company may draw at its request. Borrowings under the line bear interest at a rate equal to LIBOR plus 3.5%. The line carries an unused fee of 0.5% per year. The proceeds of borrowings under the Second Amended Loan Agreement will be used for general corporate purposes.
The Company, on a consolidated basis with its subsidiaries, is required to maintain a specified adjusted quick ratio and minimum annual recurring revenue, tested by HSBC each quarter. Pursuant to the Second Amended Loan Agreement, the Company pledged, assigned, and granted HSBC a security interest in all shares of its subsidiaries, future proceeds, and certain assets as security for its obligations under the Second Amended Loan Agreement. The Company's line of credit under the Second Amended Loan Agreement will mature on April 7, 2023.
To date, the Company is in compliance with all covenants under the Second Amended Loan Agreement. The Company has not at any time, including as of March 31, 2022 and for the fiscal year ended December 31, 2021, borrowed under the Second Amended Loan Agreement. The descriptions of the Loan Agreement, the First Amendment, the Second Amendment, the First Amended Loan Agreement, the Second Amended Loan Agreement, the First Assignment and Assumption Agreement, the Second Assignment and Assumption Agreement, the Limited Consent, the Pledge Agreement, and the Limited Guaranty, are qualified in their entirety by the full text of the forms of such agreements, copies of which are attached as exhibits to the Company's Annual Report on Form 10-K for the fiscal year ended December 31, 2021.
7. Income Taxes
The Company had an effective tax rate of (2.88)% and 17.37% for the three months ended March 31, 2022 and 2021, respectively.
The change in effective tax rates for the three-month period ended March 31, 2022 as compared to the three-month period ended March 31, 2021 was primarily due to the mix of pre-tax income (loss) results by jurisdictions taxed at different rates or tax losses for which no benefit can be taken.
The Company continues to evaluate the realizability of its deferred tax assets on a quarterly basis and will adjust such amounts in light of changing facts and circumstances. In making such an assessment, management would consider all available positive and negative evidence, including the level of historical taxable income, future reversals of existing temporary differences, tax planning strategies, and projected future taxable income.
AvePoint, Inc. and Subsidiaries
Notes to Condensed Consolidated Financial Statements
(Unaudited)
8. Leases
The Company is obligated under various non-cancelable operating leases primarily for office space. The initial terms of the leases expire on various dates through 2030. We determine if an arrangement is a lease at inception.
Leases are classified as either operating or finance leases based on certain criteria. This classification determines the timing and presentation of expenses on the income statement, as well as the presentation of the related cash flows and balance sheet. Operating leases are recorded on the balance sheet beginning January 1, 2022 as operating lease right-of-use assets, accrued expenses and other liabilities, and long-term operating lease liabilities. The Company currently has no significant finance leases.
| (in thousands) | ||||
| Operating lease expenses | $ | 1,151 | ||
| Short-term lease expenses (1) | 814 | |||
| Variable lease cost not included in the lease liability (2) | 32 | |||
| Total lease expense | $ | 1,997 | ||
During the three months ended March 31, 2022, ROU assets obtained in exchange for new operating lease liabilities amounted to $1.0 million.
| (in thousands) | ||||
| Cash paid for amounts included in the measurement of the lease liability: | ||||
| Operating cash flows from operating leases | $ | 1,354 | ||
As of March 31, 2022, our operating leases had a weighted average remaining lease term of 5.1 years and a weighted average discount rate of 4.8%.
The maturity schedule of the operating lease liabilities as of March 31, 2022 is as follows:
|
Year Ending December 31: |
||||
|
(in thousands) |
||||
|
2022 (nine months) |
$ | 2,867 | ||
|
2023 |
4,080 | |||
|
2024 |
2,422 | |||
|
2025 |
1,882 | |||
|
2026 |
1,438 | |||
|
Thereafter |
2,960 | |||
|
Total future lease payments |
$ | 15,649 | ||
|
Less: Present value adjustment |
(1,878 | ) | ||
|
Present value of future lease payments (1) |
$ | 13,771 | ||
(1) Includes the current portion of operating lease liabilities of $3.6 million, which is reflected in accrued expenses and other liabilities in the condensed consolidated balance sheets.
During the three months ended March 31, 2021, total rent expenses amounted to $1.5 million.
The future minimum rental payments under ASC 840 for all long-term non-cancelable property leases at December 31, 2021 were as follows:
|
Year Ending December 31: |
||||
|
(in thousands) |
||||
|
2022 |
$ | 5,680 | ||
|
2023 |
3,808 | |||
|
2024 |
2,428 | |||
|
2025 |
1,840 | |||
|
2026 |
1,438 | |||
|
Thereafter |
2,960 | |||
| $ | 18,154 | |||
9. Commitments and Contingencies
Purchase Commitments
The Company has outstanding unconditional purchase commitments to procure licenses to use IT software from suppliers. These agreements are negotiated in consideration of the volume of transactions with select suppliers and the associated required transaction volumes are expected to be met through the normal course of business.
In June 2017, the Company signed an unconditional purchase commitment in the amount of $8.0 million payable based upon consumption from June 2017 to June 2020. No payments were made for the fiscal year ended 2018. For the fiscal year ended December 31, 2019 the Company made payments in the amount of $5.5 million under this agreement. The remainder of the commitment was paid in the fiscal year ended December 31, 2021.
In April 2019, the Company signed an unconditional purchase commitment related to the use of Microsoft Office 365 in the amount of $2.1 million payable in three equal installments during 2019, 2020, and 2021. In May 2020, the Company signed an unconditional purchased commitment in the amount of $22.0 million to purchase IT solutions over a three-year term. Under this agreement, payments are made upon consumption of the IT solutions and any remaining obligations due at the end of the three-year term in May 2023. Given the Company’s history of procuring similar products, it is expected that cash payments to the supplier will occur in 2021 and 2022 with any remaining amounts coming due in 2023. During the year ended December 31, 2019, the Company paid $0.7 million under the 2019 agreement. During the year ended December 31, 2020, the Company paid $0.7 million related to the 2019 agreement and $3.1 million under the 2020 agreement for a total of $3.8 million. During the year ended December 31, 2021, the Company paid the remaining $0.7 million related to the 2019 agreement and $12.1 million related to the 2020 agreement. During the three months ended March 31, 2022, the Company paid $3.9 million related to the 2020 agreement.
The Company is obligated to make $2.9 million future minimum payments under the non-cancelable terms of these contracts as of March 31, 2022.
Legal Proceedings
In the normal course of its business, the Company may be involved in various claims, negotiations and legal actions. Except for such claims that arise in the normal course of business, as of March 31, 2022, the Company was not a party to any other litigation for which a material claim is reasonably possible, probable or estimable.
Guarantees
In the normal course of business, we are seldomly required to enter into service agreements that require contingency agreements with customers in highly regulated sectors. These agreements are secured by certificates of deposits. As of March 31, 2022, letters of credit have been issued in the amount of $0.9 million, as security for the agreements. These agreements have not had a material effect on our results of operations, financial position or cash flow.
10. Earn-Out and Warrant Liabilities
Company Earn-Out Agreement
As a result of the Business Combination, the holders of Legacy AvePoint Preferred Stock, Legacy AvePoint common stock and Legacy AvePoint Options shall be issued additional shares of AvePoint's Common Stock, as follows:
| • | 1,000,000 shares of AvePoint's Common Stock, in the aggregate, if at any time from and after the Business Combination through the seventh anniversary thereof (a) AvePoint's stock price is greater than or equal to $12.50 over any 20 Trading Days within any 30 trading day period or (b) the Company consummates a subsequent transaction, which results in the stockholders of the Company having the right to exchange their shares for cash, securities or other property having a value equaling or exceeding $12.50 per share; |
| • | 1,000,000 shares of AvePoint's Common Stock, in the aggregate, if at any time from and after the Business Combination through the seventh anniversary thereof (a) AvePoint's stock price is greater than or equal to $15.00 over any 20 Trading Days within any 30 trading day period or (b) the Company consummates a subsequent transaction, which results in the stockholders of the Company having the right to exchange their shares for cash, securities or other property having a value equaling or exceeding $15.00 per share; |
| • | 1,000,000 shares of AvePoint's Common Stock, in the aggregate, if at any time from and after the Business Combination through the seventh anniversary thereof (a) AvePoint's stock price is greater than or equal to $17.50 over any 20 Trading Days within any 30 trading day period or (b) the Company consummates a subsequent transaction, which results in the stockholders of the Company having the right to exchange their shares for cash, securities or other property having a value equaling or exceeding $17.50 per share. |
The rights described above are hereafter referred to as the “Company Earn-Out Shares”. To the extent that any portion of the Company Earn-Out Shares that would otherwise be issued to a holder of options that remain unvested at the date of the milestones described above, then in lieu of issuing the applicable Company Earn-Out Shares, the Company shall instead issue an award of restricted stock units of the Company for a number of shares of AvePoint's Common Stock equal to such portion of the Company Earn-Out Shares issuable with respect to the unvested options (the “Company Earn-Out RSUs”). In evaluation of the Company Earn-Out Shares and Company Earn-Out RSUs, management determined that the Company Earn-Out Shares represent derivatives to be marked to market at each reporting period, while the Company Earn-Out RSUs represent equity under ASC 718, Compensation-Stock Compensation (“ASC 718”). Refer to “Note 12 — Stock-Based Compensation” for more information regarding the Company Earn-Out RSUs.
In order to capture the market conditions associated with the Company Earn-Out Shares, the Company applied an approach that incorporated a Monte Carlo simulation, which involved random iterations that took different future price paths over the Sponsor Earn-Out Shares’ contractual life based on the appropriate probability distributions. The fair value was determined by taking the average of the fair values under each Monte Carlo simulation trial. The Monte Carlo model requires highly subjective assumptions including the expected volatility of the price of our common stock, and the expected term of the earn-out shares. Significant increases or decreases to these inputs in isolation could result in a significantly higher or lower liability. Under this approach, the fair value of the Company Earn-Out Shares on July 1, 2021 was determined to be $29.6 million. The fair value was remeasured as of March 31, 2022 and December 31, 2021 and was determined to be $7.1 million and $10.0 million, respectively, and included in the earn-out shares liabilities in the consolidated balance sheets. As a result, during the three months ended March 31, 2022, approximately $3.2 million was recognized and included as gain on earn-out and warrant liabilities in the consolidated statements of operations. We estimated the earn-out shares fair value using a Monte Carlo model with the following significant unobservable assumptions:
|
March 31, |
||||
| 2022 | ||||
|
Term (in years) |
6.26 | |||
|
Volatility |
40.00 |
% |
||
Warrants to Acquire Common Stock
On July 1, 2021, as part of the Business Combination, the Company effectively granted 405,000 private placement warrants with a 5-year term and strike price of $11.50 per share. Management has determined that the private placements warrants are to be classified as liabilities to be marked to market at each reporting period.
The private placement warrants are held by only two parties and any transfer of the warrants to a party other than a current holder of the warrants would cause the warrants to be converted into public warrants. Consequently, the fair value of the private placement warrants is equivalent to the fair value of the public warrants described in “Note 11 — Mezzanine Equity and Stockholders’ Equity”. Under this approach, the fair value of the private placement warrants on July 1, 2021 was determined to be $1.4 million. The fair value was remeasured as of March 31, 2022 and December 31, 2021 and was determined to be $0.4 million and $0.5 million, respectively. As a result, during the three months ended March 31, 2022, $0.1 million was recognized and included as gain on earn-out and warrant liabilities in the statements of operations.
AvePoint, Inc. and Subsidiaries
Notes to Condensed Consolidated Financial Statements
(Unaudited)
11. Mezzanine Equity and Stockholders’ Equity
Prior to the Business Combination, the Company had two classes of capital stock: common stock and preferred stock. Following the Business Combination, the Company has one class of capital stock: Common Stock. The following summarizes the terms of the Company’s capital stock.
Common Stock
Pursuant to the Company’s restated Articles of Incorporation, the Company was authorized to issue up to 1,000,000,000 shares of common stock at $0.0001 par value. There were 182,493,007 and 181,821,767 shares issued and outstanding at March 31, 2022 and December 31, 2021, respectively. Each share of Common Stock is entitled to one vote. The holders of Common Stock are also entitled to receive dividends whenever funds are legally available and when declared by the Board of Directors. The Company’s Board of Directors has not declared Common Stock dividends since inception.
On July 1, 2021, as part of the Business Combination, all outstanding shares of Legacy AvePoint common stock was converted into Common Stock of AvePoint, Inc. using an exchange ratio of 8.69144 per share and options to purchase common stock of Legacy AvePoint were converted into options to purchase Common Stock of AvePoint, Inc. using an exchange ratio of 8.6914. All per share information has been retroactively adjusted for this exchange ratio.
Sponsor Earn-Out Shares
On July 1, 2021, as a result of the Business Combination, the Company modified the terms of 2,916,700 shares of Common Stock (“Sponsor Earn-Out Shares”) then held by Apex’s sponsor, such that such shares will be subject to the following vesting provisions:
| • | 100% of the Sponsor Earn-Out Shares shall vest and be released if at any time through the seventh anniversary of the Business Combination, AvePoint's stock price is greater than or equal to $15.00 (as adjusted for share splits, share capitalization, reorganizations, recapitalizations and the like) over any 20 trading days within any 30 trading day period; and |
| • | 100% of the remaining Sponsor Earn-Out Shares that have not previously vested shall vest and be released if at any time through the seventh anniversary of the Business Combination, the Company consummates a subsequent transaction. |
The Sponsor Earn-Out Shares are currently outstanding and receive all benefits of regular shares with the exception of the fact that the shares are held in escrow and restricted from transfer until the vesting conditions described above are met. Consequently, the shares are classified as equity. No Sponsor Earn-Out Shares have vested as of March 31, 2022.
Public Warrants to Acquire Common Stock
On July 1, 2021, as part of the Business Combination, the Company issued 17,500,000 public warrants with an exercise price of $11.50. Each warrant entitles the registered holder to purchase one share of AvePoint's Common Stock and the warrants are exercisable from the date of issuance through the fifth anniversary of the Business Combination. At March 31, 2022, all 17,500,000 warrants remain outstanding.
Share Repurchase Program
On March 17, 2022, the Company announced that its Board of Directors authorized a new share repurchase program (the “Share Repurchase Program”) for the Company to buy back shares of its Common Stock. Under the Share Repurchase Program, the Company has the authority to buy up to a maximum of $150 million of Common Stock shares via acquisitions in the open market or privately negotiated transactions. The Share Repurchase Program will remain open for a period of three years from the date of authorization. The Company is not obligated to make purchases of, nor is it obligated to acquire any particular amount of, Common Stock under the Share Purchase Program. The Share Repurchase Program may be suspended or discontinued at any time. During the three months ended March 31, 2022, the Company has purchased 135,000 shares at an average price of $5.49 under the Share Repurchase Program. Subsequent to date of this report, the Company has purchased an additional 945,000 shares at an average price of $4.98 under the Share Repurchase Program.
Redeemable Noncontrolling Interest
On December 24, 2020, AEPL, an unaffiliated entity, acquired a redeemable noncontrolling interest in EduTech through the contribution of $7.5 million. As of December 31, 2020, AvePoint owned a 77.78% interest in EduTech and AEPL owned a 22.22% interest in EduTech.
On February 11, 2021, AEPL acquired additional redeemable noncontrolling interest in EduTech through the contribution of $0.8 million. At the transaction closing date, AvePoint owned a 76.09% interest in EduTech and AEPL owned a 23.91% interest in EduTech. As part of AEPL’s initial and subsequent investment in EduTech, the Company granted AEPL a put option which allows AEPL to cause the Company to repurchase AEPL’s shares in EduTech at any time between December 24, 2022 and December 24, 2023 at a price equal to AEPL’s initial and subsequent investment amounts.
On February 18, 2022, EduTech consummated the acquisition of 100% of the equity in I-Access for an aggregate purchase price of approximately $7.1 million. The negotiated transaction consideration includes EduTech issuing shares and rights for shares which both also subject to a minimum revenue guarantee provision (the “MRG”), and granting the I-Access shareholders a put option which allows sellers to cause EduTech to repurchase the shares of EduTech for approximately $5.9 million, upon 24 months from Acquisition Close Date or the occurrence of certain triggering events which are in the control of the Company. Under the MRG the I-Access shareholders may earn additional shares or return shares base on a revenue surplus and shortfall outcome. As a result of the MRG, at the transaction closing date, there was no change in the interest owned by AvePoint and AEPL.
At each reporting period, the Company increases the carrying amount of the redeemable noncontrolling interest by periodic accretions using the interest method so that the carrying amount will equal the redemption amount on the date that the put option becomes exercisable. These adjustments are recorded as net income attributable to redeemable noncontrolling interest.
The rollforward of the balance of the redeemable noncontrolling interest is as follows:
|
Redeemable |
||||
|
noncontrolling |
||||
|
interest |
||||
|
(in thousands) |
||||
|
Beginning balance (December 31, 2021) |
$ | 5,210 | ||
|
Net income (loss) attributable to redeemable noncontrolling interest |
(97 | ) | ||
|
Other comprehensive income (loss) attributable to redeemable noncontrolling interest |
(9 | ) | ||
|
Adjustment to present redemption value as of March 31, 2022 |
714 | |||
|
Ending balance (March 31, 2022) |
$ | 5,818 | ||
12. Stock-Based Compensation
The Company maintains an equity incentive plan established in 2006, the 2006 Equity Incentive Plan (the “2006 Plan”). Under the 2006 Plan, the Company may grant incentive stock options, non-qualified stock options and restricted stock to eligible recipients under the Plan which include employees, directors and consultants. To date, the Company has issued only stock options and restricted stock. On January 1, 2016, the Company adopted the 2016 Equity Incentive Plan (the “2016 Plan”), which replaced, on a go forward basis, the 2006 Plan. All ungranted equity reserved for issuance and not subject to outstanding awards under the 2006 Plan were assumed by the 2016 Plan and no additional equity was to be granted under the 2006 Plan. On May 27, 2021, the Company’s board of directors approved the 2021 Equity Incentive Plan (the “2021 Plan”), which was later approved by the Company’s shareholders on June 30, 2021. On a going forward basis, all equity awards granted by the Company will be made pursuant to the 2021 Plan and no additional equity will be granted under the 2016 Plan, or, for the avoidance of doubt, the 2006 Plan. As of March 31, 2022, 41,772,571 shares remained for future issuance under the Plans. All outstanding stock awards granted under the 2006 Plan and 2016 Plan will remain subject to the terms and conditions of the 2006 Plan and 2016 Plan, respectively, and the provisions of any award agreements made thereunder.
The Company records stock-based compensation in cost of revenue, sales and marketing, general and administrative and research and development. Stock-based compensation was included in the following line items:
|
Three Months Ended March 31, |
||||||||
|
2022 |
2021 |
|||||||
|
(in thousands) |
||||||||
|
Cost of revenue |
$ | 578 | $ | 90 | ||||
|
Sales and marketing |
2,462 | 1,111 | ||||||
|
General and administrative |
4,484 | 1,991 | ||||||
|
Research and development |
750 | 97 | ||||||
|
Total stock-based compensation |
$ | 8,274 | $ | 3,289 | ||||
Stock Options
The compensation costs for stock option awards are accounted for in accordance with ASC 718. Stock options vest over a four-year period and expire on the tenth anniversary of the date of award. Certain of the Company’s stock option awards (the “Officer Awards”) included a provision that required the Company to redeem the vested portion of options at fair value in cash upon a separation of service initiated by the Company or upon death or disability of the holder. The Company determined that the redemption feature required the Officer Awards to be classified in mezzanine equity prior to the Business Combination. For share-based payment arrangements with employees, the amount presented in mezzanine equity at each balance sheet date was based on the redemption provisions of the instrument and adjusted for the proportion of consideration received in the form of employee services. The shares underlying the Officer Awards were puttable to the Company upon certain conditions, such as death or disability of the Officer Awards recipients, which the Company determined was not probable; therefore, the Company reclassified the grant-date intrinsic value to mezzanine equity as the awards vested. The Officer Awards were cancelled in 2021, concurrent with the Business Combination. In exchange for the cancellation of the Officer Awards, the Company agreed to deliver to the holders of the Officer Awards a fixed amount of shares equal to the amount of shares the holders would have received if the Officer Awards were exercised on the date of the Business Combination in a net share settlement scenario. As a result, the Company will issue 3,592,504 shares. The shares are issuable on July 1, 2022 in exchange for the cancelled Officer Awards.
AvePoint, Inc. and Subsidiaries
Notes to Condensed Consolidated Financial Statements
(Unaudited)
On March 21, 2022, the Company granted 689,409 options under the 2021 Plan. The Company estimated the grant date fair value of these stock options using a Black-Scholes option-pricing model with the following weighted-average assumptions:
| March 21, | ||||
| 2022 | ||||
| Expected life (in years) | 6.11 | |||
| Expected volatility | 45.18 | % | ||
| Risk-free rate | 2.16 | % | ||
| Dividend yield | — | |||
To estimate the expected life of stock options, the Company considered the vesting term, contractual expiration period, and market conditions. Expected volatility is based on historical volatility of a group of peer entities. Dividend yields are based upon historical dividend yields. Risk-free interest rates are based on the implied yields currently available on U.S. Treasury zero coupon issues with a remaining term equal to the expected life. Based on these inputs, the grant-date fair value was determined to be $1.9 million.
As of March 31, 2022 and December 31, 2021, there was $38.7 million and $42.7 million, respectively, in unrecognized compensation costs related to all non-vested awards.
At March 31, 2022, AvePoint had 30,436,528 options outstanding and 15,711,223 options exercisable with intrinsic values of $64.3 million and $49.8 million, respectively. During the three months ended March 31, 2022, 713,810 options were exercised, with a total intrinsic value of $2.7 million.
Restricted Stock Units
In addition to Stock Options granted under the 2006 Plan, 2016 Plan and 2021 Plan, 4,159,532 Restricted Stock Units ("RSUs") were granted under the 2021 Plan during the three months ended March 31, 2022 with a weighted-average grant date fair-value of $5.88 per RSU. The compensation costs for stock option awards are accounted for in accordance with ASC 718, Compensation-Stock Compensation. RSUs vest over a four-year period and expire on the tenth anniversary of the date of award. The RSUs are measured at the fair market value of the underlying stock at the grant date. For the three months ended March 31, 2022, the Company recorded stock-based compensation expense of $3.7 million related to the RSUs granted under the 2021 Plan. As of March 31, 2022, these was $66.6 million in unrecognized compensation costs specific to the non-vested RSUs under the 2021 Plan.
Company Earn-Out RSUs
The compensation costs for Company Earn-Out RSUs are accounted for in accordance with ASC 718. In order to capture the market conditions associated with the Company Earn-Out RSUs, the Company applied an approach that incorporated a Monte Carlo simulation, which involved random iterations that took different future price paths over the Sponsor Earn-Out RSUs’ contractual life based on the appropriate probability distributions. The fair value was determined by taking the average of the fair values under each Monte Carlo simulation trial. Under this approach, the grant-date fair value of the Company Earn-Out RSUs on July 1, 2021 was determined to be $2.5 million. The stock options underlying the Earn-Out RSUs vest over a four-year period and expire on the tenth anniversary of the date of award. If the contingent milestones of the Earn-Out RSUs are not met by the seventh anniversary of the Business Combination, the holders of the underlying stock options will not receive the Earn-Out RSUs. For the three months ended March 31, 2022, the Company recorded stock-based compensation expense of $0.2 million related to these Earn-Out RSUs.
AvePoint, Inc. and Subsidiaries
Notes to Condensed Consolidated Financial Statements
(Unaudited)
13. Financial Instruments
Fair value is defined by ASC 820, Fair Value Measurement (“ASC 820”) as the price that would be received upon selling an asset or paid to transfer a liability in an orderly transaction between market participants at the measurement date. ASC 820 establishes a three-level fair value hierarchy that prioritizes the inputs used to measure fair value. The hierarchy requires entities to maximize the use of observable inputs and minimize the use of unobservable inputs. The three levels of inputs used to measure fair value are as follows:
|
• |
Level 1 — Quoted prices (unadjusted) in active markets for identical assets or liabilities that the reporting entity can access at the measurement date. |
|
• |
Level 2 — Inputs other than quoted prices included within Level 1 that are observable for the asset or liability, either directly or indirectly. |
|
• |
Level 3 — Unobservable inputs for the asset or liability. |
|
Three Months Ended March 31, |
||||||||||||||||
|
2022 |
||||||||||||||||
|
(in thousands) |
||||||||||||||||
|
Level 1 |
Level 2 |
Level 3 |
Total |
|||||||||||||
|
Assets |
||||||||||||||||
|
Cash Equivalents: |
||||||||||||||||
|
U.S. treasury bills |
$ | — | $ | 19,939 | $ | — | $ | 19,939 | ||||||||
|
Certificate of deposits |
— | 1,756 | — | 1,756 | ||||||||||||
|
Short term investments: |
||||||||||||||||
|
U.S. treasury bills |
— | 179,743 | — | 179,743 | ||||||||||||
|
Certificate of deposits |
— | 1,548 | — | 1,548 | ||||||||||||
|
Other assets: |
||||||||||||||||
|
Certificate of deposits |
— | 186 | — | 186 | ||||||||||||
|
Total |
$ | — | $ | 203,172 | $ | — | $ | 203,172 | ||||||||
|
Liabilities: |
||||||||||||||||
|
Earn-out shares liabilities: |
||||||||||||||||
|
Earn-out shares (1) |
$ | — | $ | — | $ | 7,136 | $ | 7,136 | ||||||||
|
I-Access contingent consideration (2) |
— | — | 5,665 | 5,665 | ||||||||||||
|
Other non-current liabilities: |
||||||||||||||||
|
Warrant liabilities (1) |
— | 362 | — | 362 | ||||||||||||
|
Total |
$ | — | $ | 362 | $ | 12,801 | $ | 13,163 | ||||||||
(1) As a result of the Business Combination on July 1, 2021, the Company recorded Company Earn-Out Shares and private placement warrants as liabilities and measured at fair value each reporting period. The Company measured the Company Earn-Out Shares at fair value determined at Level 3. The Company measured the private placement warrants at fair value determined at Level 2. Refer to “Note 10 — Earn-Out and Warrant Liabilities” for further details.
(2) As a result of the Business Combination on February 18, 2022, the Company recorded I-Access contingent consideration as liabilities and measured at fair value each reporting period. The Company measured the I-Access contingent consideration at fair value determined at Level 3. Refer to “Note 3 — Business Combination” for further details.
AvePoint, Inc. and Subsidiaries
Notes to Condensed Consolidated Financial Statements
(Unaudited)
|
Year Ended December 31, |
||||||||||||||||
|
2021 |
||||||||||||||||
|
(in thousands) |
||||||||||||||||
|
Level 1 |
Level 2 |
Level 3 |
Total |
|||||||||||||
|
Assets |
||||||||||||||||
|
Cash Equivalents: |
||||||||||||||||
|
U.S. treasury bills |
$ | — | $ | 199,999 | $ | — | $ | 199,999 | ||||||||
|
Certificate of deposits |
— | 1,433 | — | 1,433 | ||||||||||||
|
Short term investments: |
||||||||||||||||
|
Certificate of deposits |
— | 2,411 | — | 2,411 | ||||||||||||
|
Other assets: |
||||||||||||||||
|
Certificate of deposits |
— | 285 | — | 285 | ||||||||||||
|
Total |
$ | — | $ | 204,128 | $ | — | $ | 204,128 | ||||||||
|
Liabilities: |
||||||||||||||||
|
Earn-out shares liabilities: |
||||||||||||||||
|
Earn-out shares (1) |
$ | — | $ | — | $ | 10,012 | $ | 10,012 | ||||||||
|
Other non-current liabilities: |
||||||||||||||||
|
Warrant liabilities (1) |
— | 458 | — | 458 | ||||||||||||
|
Total |
$ | — | $ | 458 | $ | 10,012 | $ | 10,470 | ||||||||
(1) As a result of the Business Combination on July 1, 2021, the Company recorded Company Earn-Out Shares and private placement warrants as liabilities and measured at fair value each reporting period. The Company measured the Company Earn-Out Shares at fair value determined at Level 3. The Company measured the private placement warrants at fair value determined at Level 2. Refer to “Note 10 — Earn-Out and Warrant Liabilities” for further details.
14. Segment information
The Company operates in one segment. Its products and services are sold throughout the world, through direct and indirect sales channels. The Company’s chief operating decision maker (the “CODM”) is the Chief Executive Officer. The CODM makes operating performance assessment and resource allocation decisions on a global basis. The CODM does not receive discrete financial information about asset allocation, expense allocation or profitability by product or geography.
Revenue by geography is based upon the billing address of the customer. All transfers between geographic regions have been eliminated from consolidated revenue. No customers represented greater than 10% of revenue for the three months ended March 31, 2022 and 2021. The following table sets forth revenue by geographic area:
|
Three Months Ended March 31, |
||||||||
|
2022 |
2021 |
|||||||
|
(in thousands) |
||||||||
|
Revenue: |
||||||||
|
United States |
$ | 21,709 | $ | 17,633 | ||||
|
EMEA |
15,342 | 11,191 | ||||||
|
APAC |
13,240 | 9,976 | ||||||
|
Total revenue |
$ | 50,291 | $ | 38,800 | ||||
The following table sets forth revenue generated from customers by country, based outside of the United States, and represent more than 10% of the total consolidated revenue:
|
Three Months Ended March 31, |
||||||||
|
2022 |
2021 |
|||||||
|
(in thousands) |
||||||||
|
Revenue: |
||||||||
|
Germany |
$ | 5,971 | $ | 4,726 | ||||
|
Japan |
5,895 | 4,755 | ||||||
|
Other |
16,716 | 11,686 | ||||||
AvePoint, Inc. and Subsidiaries
Notes to Condensed Consolidated Financial Statements
(Unaudited)
15. Loss Per Share
Basic loss per share available to AvePoint common shareholders (“EPS”) is computed by dividing net loss by the weighted average number of common shares outstanding for the period. In computing diluted EPS, the Company adjusts the denominator, subject to anti-dilution requirements, to include the dilution from potential shares of Common Stock resulting from outstanding share based payment awards, warrants, earn-outs and the conversion of convertible preferred shares. AvePoint applies the two-class method in calculating loss per share. AvePoint's Sponsor Earn-Out Shares described in “Note 11 — Mezzanine Equity and Stockholders’ Equity” are considered participating securities and have no contractual obligation to shares in the loss of the Company. As such, the weighted-average impact of these shares is excluded from the calculation of loss per share below. As losses were incurred during all periods presented, no earnings per share exists for the Sponsor Earn-Out Shares.
|
Three Months Ended March 31, |
||||||||
|
2022 |
2021 |
|||||||
|
(in thousands, except |
||||||||
|
per share amounts) |
||||||||
|
Loss per share available to common shareholders, excluding sponsor earn-out shareholders |
||||||||
|
Numerator: |
||||||||
|
Net loss |
$ | (11,053 | ) | $ | (4,942 | ) | ||
|
Net income attributable to redeemable noncontrolling interest |
(617 | ) | (397 | ) | ||||
|
Net loss attributable to AvePoint, Inc. |
$ | (11,670 | ) | $ | (5,339 | ) | ||
|
Deemed dividends on preferred stock |
— | (8,794 | ) | |||||
|
Total net loss available to common shareholders |
$ | (11,670 | ) | $ | (14,133 | ) | ||
|
Denominator: |
||||||||
|
Weighted average common shares outstanding |
182,833 | 100,773 | ||||||
|
Effect of dilutive securities |
— | — | ||||||
|
Weighted average diluted shares |
182,833 | 100,773 | ||||||
|
Basic loss per share available to common shareholders, excluding sponsor earn-out shareholders |
$ | (0.06 | ) | $ | (0.14 | ) | ||
|
Diluted loss per share available to common shareholders, excluding sponsor earn-out shareholders |
$ | (0.06 | ) | $ | (0.14 | ) | ||
To arrive at net loss available to common shareholders, the Company deducted net income attributable to the redeemable noncontrolling interest in EduTech and deemed dividends, which related to the redemption, extinguishment, and remeasurement of preferred stock.
For the three months ended March 31, 2022 and 2021, the Company's potentially dilutive securities were deemed to be anti-dilutive given the Company’s net loss position. As such, basic loss per share is equal to diluted loss per share for the periods presented.
The following potentially dilutive securities outstanding have been excluded from the computation of diluted weighted-average shares outstanding because such securities have an antidilutive impact due to losses reported:
|
Three Months Ended March 31, |
||||||||
|
2022 |
2021 |
|||||||
|
(in thousands) |
||||||||
|
Convertible preferred stock |
— | 42,001 | ||||||
|
Stock options |
30,437 | 33,340 | ||||||
|
Restricted stock units |
9,369 | — | ||||||
|
Warrants |
17,905 | — | ||||||
|
Company Earn-Outs |
3,000 | — | ||||||
|
Total potentially dilutive securities |
60,711 | 75,341 | ||||||
16. Related Party Transactions
The Company has entered into indemnification agreements with its executive officers and directors. These agreements, among other things, require AvePoint to indemnify its directors and executive officers to the fullest extent permitted by Delaware law, specifically the Delaware General Corporation Law (as the same exists or may hereafter be amended) for certain expenses, including attorneys’ fees, judgments, fines, and settlement amounts incurred by a director or officer in any action or proceeding arising out of their services as one of the Company’s directors or officers or any other company or enterprise to which the person provides services at the Company’s request.
17. Subsequent Events
No material subsequent events occurred since the date of the most recent balance sheet period reported.
Part I
Item 2
ITEM 2. MANAGEMENT’S DISCUSSION AND ANALYSIS OF FINANCIAL CONDITION AND RESULTS OF OPERATIONS
This Quarterly Report on Form 10-Q (this “Quarterly Report”) includes estimates, projections, statements relating to our business plans, objectives, and expected operating results that may constitute “forward-looking statements” within the meaning of the Private Securities Litigation Reform Act of 1995, Section 27A of the Securities Act of 1933, as amended (the “Securities Act”), and Section 21E of the Securities Exchange Act of 1934, as amended (the “Exchange Act”). Forward-looking statements, as well as descriptions of the risks and uncertainties that could cause actual results and events to differ materially, may appear throughout this Quarterly Report, including in this section “Management’s Discussion and Analysis of Financial Condition and Results of Operations” (Part I, Item 2 of this Quarterly Report)(“MD&A”), and the sections titled “Special Note Regarding Forward-Looking Statements,” “Quantitative and Qualitative Disclosures about Market Risk” (Part I, Item 3 of this Quarterly Report), and “Risk Factors” (Part II, Item 1A of this Quarterly Report).
The following MD&A summarizes (and is intended to help the reader understand) the significant factors affecting the consolidated operating results, financial condition, liquidity and cash flows of our Company as of and for the periods presented below. The MD&A should be read in conjunction with our Annual Report on Form 10-K for the year ended December 31, 2021 and our condensed consolidated financial statements and the related notes included elsewhere in this Quarterly Report.
First Quarter 2022 Business Highlights
|
▪ |
Grew total ARR 30% year-over-year to $167.4 million; |
|
|
▪ |
Expanded robust data protection capabilities with the introduction of ransomware detection; |
|
| ▪ | Introduced AvePoint Entrust, which manages administrative users, processes, and data insights across multi-cloud tenants, and Confide, AvePoint’s secure virtual data room workspace designed to help business users with swift and secure collaboration on confidential projects; and | |
|
▪ |
To date, repurchased 1.1 million shares under the share repurchase program at a cost of $5.5 million. |
Overview
We strive to be the catalyst of business transformation by empowering organizations with relevant technologies that are efficient, secure, and well governed. We help transform data and collaboration so users can be more productive with the latest cloud services (like Microsoft 365 ("M365")), and drive efficiency in delivery and management of those services for service providers. Our strategy is focused on supporting cloud and hybrid cloud customers and partners as they transition to and mature their cloud deployments. We do this through our Confidence Platform, a SaaS platform that assists organizations who use M365 and more than a half dozen cloud collaboration platforms. The Confidence Platform (built on “AvePoint Online Services” or "AOS") supports the collaboration of 9 million users across 7 continents with a scalable, secure, and intelligent architecture.
Part I
Item 2
Our Mission Statement
Our mission at AvePoint, Inc. (“AvePoint,” “we,” “us,” or “our”) is to help organizations collaborate with confidence across the cloud. Our goal is to be the catalyst of business transformation by empowering organizations with relevant technologies that are efficient, secure, and well governed. We help transform data and collaboration so users can be more productive with the latest cloud services (like Microsoft 365 ("M365")), and drive efficiency in delivery and management of those services for service providers.
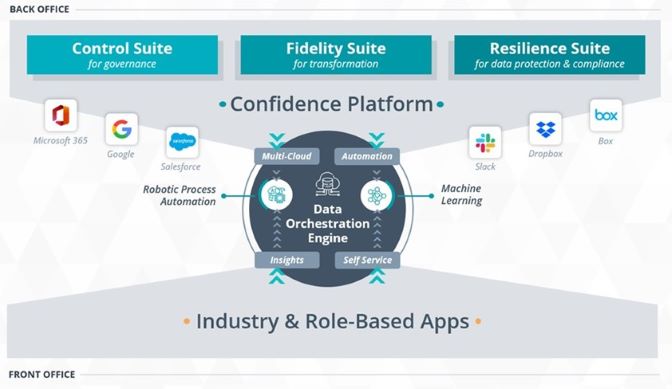
We do this through our Confidence Platform, a software-as-a-service (“SaaS”) platform that assists organizations who use M365 and more than a half dozen cloud collaboration platforms. The Confidence Platform (built on AOS) supports the collaboration of 9 million users across 7 continents with a scalable, secure, and intelligent architecture. This scalable architecture manages more than 125 PB of content, spread across 14 global data centers, with a 99.9% uptime. Our privacy and security policies are backed by industry certifications including ISO, SOC2 Type II, and FedRAMP moderate authorization. The intelligence engine driving the Confidence Platform ensures continuing value for customers by using AI to maximize relevant data, providing insights, automating operations, and enabling our Control, Fidelity, and Resilience software suites.
Part I
Item 2
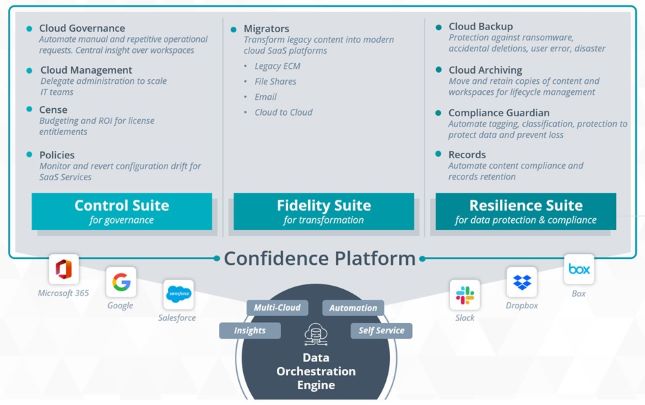
Products in our Control Suite enable IT to deliver collaboration services at scale, with automation and repeatable business templates. Business users are empowered with control over licenses, workspaces, and data owned by their departments. Our Fidelity Suite preserves data integrity as organizations undergo digital transformation projects to streamline the way they work from one collaboration system to the next. The Resilience Suite helps organizations comply with data governance regulations, preserve business records for compliance, and ensure business continuity.
Building on this Confidence Platform, we continue to pursue additional industry and role-based applications, including an application that support secure collaboration for companies undergoing mergers and acquisition activities. We will enable our Control, Fidelity, and Resilience Suites to target highly sensitive data-room projects, enabling companies to work with third parties throughout the transitions in their business. The framework established by the Confidence Platform will empower project owners with additional self-service controls, insights, and automation, while preserving compliance records.
With our solutions, organizations have the tools to enable rapid and sustainable adoption of critical applications like Microsoft Teams, which have recently been experiencing record growth in organizations large and small. Systems like M365 can now pass security audits and give teams the control they need to have confidence in their cloud investment. Security teams no longer block progress and pursuit of “work from anywhere” initiatives. With our solutions, they can have confidence in their ability to monitor, manage and govern the rapid adoption of new cloud services. Finally, organizations can use solutions to save time and money, and can decommission home-grown or point solutions that fail to provide key insights and flexible automation that drive business outcomes. The flexibility, automation, and insights of our solutions enable IT to meet business needs and deliver value.
 AGILITY
|
We value quick, informed decision-making to meet and exceed customer expectations. We subscribe to a growth mindset, which contributes to our entrepreneurial and learning spirit. |
 PASSION
|
Drive and energy are contagious here; we are not just going through the motions. We do things that are impactful and as a result, amplify our customers’ success. |
 TEAMWORK
|
We are invested in the success of our colleagues, partners, customers, and community. We do this by promoting global collaboration and taking pride in helping, sharing, mentoring, and coaching each other. |
Part I
Item 2
Key Business Metrics
Our management reviews the following key business metrics to measure our performance, identify trends affecting our business, formulate business plans, make strategic decisions, and to make informed decisions regarding the allocation of our resources. We disclose key business metrics within the MD&A and elsewhere in this Quarterly Report to enable investors to evaluate progress against our ambitions, provide transparency into performance trends, and reflect the continued evolution of our products and services. Our key business metrics are fundamentally interconnected and indicative of how customers use our products and services. However, increases or decreases in our key business metrics may not correspond with increases or decreases in our revenue.
The chart below illustrates certain of our key business metrics, each described in more detail below, as of the end of or for the periods presented. Our key business metrics are further discussed in the section titled “Notes to Condensed Consolidated Financial Statements” (Part I, Item 1 of this Quarterly Report).
|
March 31, |
||||||||
|
2022 |
2021 |
|||||||
|
Total ARR ($ in mil) |
$ | 167.4 | $ | 129.2 | ||||
|
Core TTM dollar-based net retention rate |
108 | % | 110 | % | ||||
Annual Recurring Revenue
We calculate our annual recurring revenue (“ARR”) at the end of a particular period as the annualized sum of contractually obligated Annual Contract Value (“ACV”) from SaaS, term license and support, and maintenance revenue sources, with the exception of migration products, from all customers with a contract duration exceeding three months (such customers, our “Core” customers, and such ARR, our “Core ARR”), and the product of the current month’s monthly recurring revenue (“MRR”) multiplied by twelve (to prospectively annualize SaaS and term license and support revenue). ARR also includes some recurring professional services revenue, such as recurring TAM services.
MRR is attributable to our Channel business, and MRR-contributing customers are classified as customers with a contract duration of 3 months or less. As of March 31, 2022 and March 31, 2021, our Channel business was transacting the equivalent of $11.0 million and $5.5 million in ARR, respectively, calculated as December’s MRR multiplied by twelve months. Customer contracts used in calculating MRR may or may not be extended or renewed by our customers. Growth in ARR is driven by both new business and the retention of existing business.
We believe ARR is indicative of growth in recurring revenue streams, leading to higher revenue growth in future periods. ARR should be viewed independently of revenue and deferred revenue and is not intended to be combined with, or to replace, either of those items. ARR is not a forecast and the active contracts at the end of a reporting period used in calculating ARR may or may not be extended or renewed by our customers (the same is true for those contracts used in calculating MRR, which may or may not be extended or renewed by the customer).
Core TTM Dollar-Based Net Retention Rate
We use a trailing twelve-month ("TTM") dollar-based net retention rate to evaluate our ability to maintain and expand our revenue with our customer base over time.
“Core TTM Dollar-Based Net Retention Rate” as of a period end is calculated by starting with the ARR from the cohort of all Core customers as of 12 months prior to such period end (the “Prior Period ARR”). We then calculate the ARR from these same Core customers as of the current period end (the “Current Period ARR”). Current Period ARR includes any expansion and is net of contraction or attrition over the last 12 months but excludes ARR from new customers in the current period. We then divide the total Current Period ARR by the total Prior Period ARR to arrive at the Core TTM Dollar-Based Net Retention Rate.
A Core TTM Dollar-Based Net Retention Rate greater than 100% implies positive net revenue retention. We believe this Core TTM Dollar-Based Net Retention Rate metric is indicative of our ability to grow our relationships with existing customers, and further grow ARR and revenue. Improvement in this metric is driven by improvement in both customer retention, as well as cross-sell and up-sell capabilities.
Part I
Item 2
Components of Results of Operations
|
Revenue |
We generate revenue from four primary sources: SaaS, term license and support, services, and maintenance across a variety of products.
SaaS revenue sources are generated from our cloud-based solutions. Term license and support revenue sources are similar to SaaS revenue sources with the exception that term licenses and support are generated from the sales of on-premise or hybrid licenses which include a distinct support component. Both SaaS and term license and support revenue sources are primarily billed annually, apart from our Channel business. SaaS and term license and support are generally sold per user license or based upon the amount of data protected.
Services revenue includes revenue generated from implementation, training, consulting, migration, license customization and managed services. Services revenue from implementation, training, consulting, migration, and license customization are recognized by applying a measure of progress, such as labor hours to determine the percentage of completion of each contract. These offerings are not inherently recurring in nature and as such are subject to more period-to-period volatility than other elements of our business. Services revenue from managed services are recognized ratably or on a straight-line basis over the contract term.
Maintenance revenue is a result of selling on-going support for perpetual licenses. It also includes recurring professional services such as TAM. Maintenance revenue is recognized ratably over the term of the maintenance agreement, which is typically one year.
Over time, we expect SaaS and term license and support revenue will increase as a percentage of total revenue and more closely reflect our bookings mix as it continues to focus on increasing SaaS and term license and support revenue as a key strategic priority.
|
|
|
Cost of Revenue |
Cost of SaaS and cost of term license and support consists of all direct costs to deliver and support our SaaS and term license and support products, including salaries, benefits and related expenses, allocated overhead, and third-party hosting fees related to our cloud services. We recognize these expenses as they are incurred. We expect that these costs will increase in absolute dollars but may fluctuate as a percentage of SaaS and term license and support revenue from period to period.
Cost of maintenance consists of all direct costs to support our perpetual license products, including salaries, benefits, stock-based compensation and related expenses and allocated overhead. We recognize these expenses as they are incurred. We expect that cost of maintenance revenue will decrease in absolute dollars as maintenance revenue declines but may fluctuate as a percentage of maintenance revenue.
Cost of services consists of salaries, benefits, stock-based compensation and related expenses for our services organization, allocated overhead and IT necessary to provide services for our customers. We recognize these expenses as they are incurred.
|
|
|
Gross Profit and Gross Margin |
Gross profit is revenue less cost of revenue, and gross margin is gross profit as a percentage of revenue.
Gross profit has been and will continue to be affected by various factors, including the mix of our revenue, the costs associated with third-party cloud-based hosting services for our cloud-based subscriptions, and the extent to which we expand our customer support and services organizations. We expect that our gross margin will fluctuate from period to period depending on the interplay of these various factors but should increase in the long term as our product mix continues to shift in favor of SaaS and term license and support revenue.
|
|
|
Sales and Marketing |
Sales and marketing expenses consist primarily of personnel-related expenses for sales, marketing and customer success personnel, stock-based compensation expense, sales commissions, marketing programs, travel-related expenses, and allocated overhead costs. We focus our sales and marketing efforts on creating sales leads and establishing and promoting our brand. Incremental sales commissions for new customer contracts are deferred and amortized ratably over the estimated period of our relationship with such customers. We plan to continue our investment in sales and marketing by hiring additional sales and marketing personnel, executing our go-to-market strategy globally, and building our brand awareness.
|
|
|
General and Administrative |
General and administrative expenses consist primarily of personnel-related expenses for finance, legal and compliance, human resources, and IT, stock-based compensation expense, external professional services, allocated overhead costs and other administrative functions. Our general and administrative expenses have increased as a result of operating as a public company, including costs to comply with the rules and regulations applicable to companies listed on a national securities exchange, costs related to compliance and reporting obligations pursuant to the rules and regulations of the SEC, and increased expenses for insurance, investor relations, and professional services.
|
|
|
Research and Development |
Research and development expenses consist primarily of personnel-related expenses incurred for our engineering, product and design teams, stock-based compensation expense and allocated overhead costs. We have a research and development presence in the United States, China, Singapore and Vietnam. This provides a strategic advantage, allowing us to efficiently invest in both new product development and increasing our existing product capabilities. We believe delivering expanding product functionality is critical to enhancing the success of existing customers while new product development further reinforces our breadth of software solutions.
|
|
|
Other Income (Expense) |
Other income (expense), net consists primarily of fair value adjustments on earn-out and warrant liabilities. In addition to fair value adjustment, other income (expense), net also consists of foreign currency remeasurement gains/losses partially offset by interest income on corporate funds invested in money market instruments and highly liquid short-term investments.
|
|
|
Income Taxes |
We are subject to income taxes in the U.S. (federal and state) and numerous foreign jurisdictions. Tax laws, regulations, administrative practices, principles, and interpretations in various jurisdictions may be subject to significant change, with or without notice, due to economic, political, and other conditions. The foreign jurisdictions in which we operate have different statutory tax rates than those of the United States. Accordingly, our effective tax rate could be affected by the relative proportion of foreign to domestic income, use of foreign tax credits, changes in the valuation of our deferred tax assets and liabilities, applicability of any valuation allowances, and changes in tax laws in jurisdictions in which we operate. |
Part I
Item 2
Results of Operations
The following table summarizes AvePoint’s historical consolidated statement of operations data. The period-to-period comparison of operating results is not necessarily indicative of results for future periods.
|
Three Months Ended March 31, |
||||||||
|
2022 |
2021 |
|||||||
|
(in thousands) |
||||||||
|
Total revenue |
$ | 50,291 | $ | 38,800 | ||||
|
Total cost of revenue(1) |
14,630 | 10,778 | ||||||
|
Gross profit |
35,661 | 28,022 | ||||||
|
Operating expenses: |
||||||||
|
Sales and marketing(1) |
27,054 | 19,301 | ||||||
|
General and administrative(1) |
15,542 | 10,292 | ||||||
|
Research and development(1) |
6,402 | 4,102 | ||||||
|
Depreciation and amortization |
511 | 258 | ||||||
|
Total operating expenses |
49,509 | 33,953 | ||||||
|
Loss from operations |
(13,848 | ) | (5,931 | ) | ||||
|
Other income (expense), net |
3,104 | (50 | ) | |||||
|
Loss before income taxes |
(10,744 | ) | (5,981 | ) | ||||
|
Income tax expense (benefit) |
309 | (1,039 | ) | |||||
|
Net loss |
$ | (11,053 | ) | $ | (4,942 | ) | ||
|
(1) |
Stock-based compensation for the periods was included in the following line items: |
|
Three Months Ended March 31, |
||||||||
|
2022 |
2021 |
|||||||
|
(in thousands) |
||||||||
|
Cost of revenue |
$ | 578 | $ | 90 | ||||
|
Sales and marketing |
2,462 | 1,111 | ||||||
|
General and administrative |
4,484 | 1,991 | ||||||
|
Research and development |
750 | 97 | ||||||
|
Total stock-based compensation |
$ | 8,274 | $ | 3,289 | ||||
Comparison of Three Months Ended March 31, 2022 and March 31, 2021
Revenue
The components of AvePoint’s revenue during the three months ended March 31, 2022 and 2021 were as follows:
|
Three Months Ended |
||||||||||||||||
|
March 31, |
Change |
|||||||||||||||
|
2022 |
2021 |
Amount |
% |
|||||||||||||
|
(dollars in thousands) |
||||||||||||||||
|
Revenue: |
||||||||||||||||
|
SaaS |
$ | 26,553 | $ | 18,259 | $ | 8,294 | 45.4 | % | ||||||||
|
Term license and support |
10,202 | 8,727 | 1,475 | 16.9 | % | |||||||||||
|
Services |
8,925 | 5,916 | 3,009 | 50.9 | % | |||||||||||
|
Maintenance |
4,441 | 5,409 | (968 | ) | (17.9 | )% | ||||||||||
|
Perpetual license |
170 | 489 | (319 | ) | (65.2 | )% | ||||||||||
|
Total revenue |
$ | 50,291 | $ | 38,800 | $ | 11,491 | 29.6 | % | ||||||||
Revenue increased approximately $11.5 million, or 29.6%, from $38.8 million for the three months ended March 31, 2021 to $50.3 million for the three months ended March 31, 2022, primarily as a result of an increase in SaaS, term license and support and services revenue. Revenue from AvePoint’s SaaS offerings increased $8.3 million, or 45.4%, from $18.3 million for the three months ended March 31, 2021 to $26.6 million for the three months ended March 31, 2022. Revenue from AvePoint's services offerings increased $3.0 million, or 50.9%, from $5.9 million for the three months ended March 31, 2021 to $8.9 million for the three months ended March 31, 2022. Revenue from AvePoint’s term license and support offerings increased $1.5 million, or 16.9%, from $8.7 million for the three months ended March 31, 2021 to $10.2 million for the three months ended March 31, 2022.
The increases attributable to SaaS, services and term license and support revenue were offset by a decrease in maintenance revenue, which decreased $1.0 million, or 17.9%, from $5.4 million for the three months ended March 31, 2021 to $4.4 million for the three months ended March 31, 2022.
Services revenue is derived from services offerings, which can be offered for software implementation, training, migration, customized solutions and managed services. These offerings are not inherently recurring in nature and as such are subject to more period-to-period volatility than other elements of AvePoint’s business. AvePoint’s revenue from perpetual license and maintenance offerings is expected to trend downward period over period. This is driven from multiple strategic decisions to shift away from the sale of perpetual licenses and towards SaaS and term licenses. Without material perpetual license sales, there will be limited opportunities to sell maintenance contracts to new customers. Existing customers have and will continue to transition to SaaS and term licenses, which will continue the decline in maintenance revenue.
Term license and perpetual license revenue for the three months ended March 31, 2022 and 2021 includes $6.2 million and $6.1 million of revenue recognized at a point of time, respectively.
Revenue by geographic region for the three months ended March 31, 2022 and 2021 was as follows:
|
Three Months Ended |
||||||||||||||||
|
March 31, |
Change |
|||||||||||||||
|
2022 |
2021 |
Amount |
% |
|||||||||||||
|
(dollars in thousands) |
||||||||||||||||
|
United States |
$ | 21,709 | $ | 17,633 | $ | 4,076 | 23.1 | % | ||||||||
|
EMEA |
15,342 | 11,191 | 4,151 | 37.1 | % | |||||||||||
|
APAC |
13,240 | 9,976 | 3,264 | 32.7 | % | |||||||||||
|
Total |
$ | 50,291 | $ | 38,800 | $ | 11,491 | 29.6 | % | ||||||||
From the three months ended March 31, 2021 to the three months ended March 31, 2022, North America experienced a $4.1 million increase in revenue driven by a $4.3 million increase in SaaS and term license and support, partially offset by a combined $0.4 million decrease in services, maintenance and perpetual license revenue. EMEA experienced a $4.2 million increase in revenue driven by a $3.4 million increase in SaaS and term license and support revenue and a $1.2 million increase in service revenue. This growth was, partially offset by a $0.3 million decrease in maintenance revenue and a $0.1 million decrease in perpetual license revenue. APAC experienced a $3.3 million increase in revenue driven by a $2.1 million increase in SaaS and term license and support revenue and a $1.8 million increase in services revenue, partially offset by a $0.3 million decrease in maintenance revenue and a $0.2 million decrease in perpetual license revenue. The overall decrease in maintenance and perpetual license revenue in each geography is due to AvePoint’s continued shift towards SaaS and term license and support offerings. Although services decreased in each geography due to fewer service delivery projects, services revenue is expected to fluctuate as the offerings are not inherently recurring in nature.
Cost of Revenue, Gross Profit, and Gross Margin
Cost of revenue, gross profit, and gross margin during the three months ended March 31, 2022 and 2021 were as follows:
|
Three Months Ended |
||||||||||||||||
|
March 31, |
Change |
|||||||||||||||
|
2022 |
2021 |
Amount |
% |
|||||||||||||
|
(dollars in thousands) |
||||||||||||||||
|
Cost of revenue: |
||||||||||||||||
|
SaaS |
$ | 5,520 | $ | 4,440 | $ | 1,080 | 24.3 | % | ||||||||
|
Term license and support |
576 | 273 | 303 | 111.0 | % | |||||||||||
|
Services |
8,259 | 5,585 | 2,674 | 47.9 | % | |||||||||||
|
Maintenance |
275 | 480 | (205 | ) | (42.7 | )% | ||||||||||
|
Total cost of revenue |
$ | 14,630 | $ | 10,778 | $ | 3,852 | 35.7 | % | ||||||||
|
Gross profit |
35,661 | 28,022 | 7,639 | 27.3 | % | |||||||||||
|
Gross margin |
70.9 | % | 72.2 | % | — | — | ||||||||||
|
GAAP cost of revenue |
$ | 14,630 | $ | 10,778 | $ | 3,852 | 35.7 | % | ||||||||
|
Stock-based compensation expense |
(578 | ) | (90 | ) | (488 | ) | 542.2 | % | ||||||||
|
Non-GAAP cost of revenue |
$ | 14,052 | $ | 10,688 | $ | 3,364 | 31.5 | % | ||||||||
|
Non-GAAP gross profit |
36,239 | 28,112 | 8,127 | 28.9 | % | |||||||||||
|
Non-GAAP gross margin |
72.1 | % | 72.5 | % | — | — | ||||||||||
Cost of revenue increased $3.9 million, or 35.7%, from $10.8 million for the three months ended March 31, 2021 to $14.6 million for the three months ended March 31, 2022. Stock-based compensation contributed $0.5 million of the increase.
The drivers of the remaining $3.4 million include a $1.5 million increase from higher aggregate hosting costs resulting from increased SaaS revenue, $1.4 million related to increasing people costs, and higher service costs associated with a greater number of customization services which typically incur higher costs.
Part I
Item 2
Operating Expenses
Sales and Marketing
Sales and marketing expenses during the three months ended March 31, 2022 and 2021 were as follows:
|
Three Months Ended |
||||||||||||||||
|
March 31, |
Change |
|||||||||||||||
|
2022 |
2021 |
Amount |
% |
|||||||||||||
|
(dollars in thousands) |
||||||||||||||||
|
Sales and marketing |
$ | 27,054 | $ | 19,301 | $ | 7,753 | 40.2 | % | ||||||||
|
Percentage of revenue |
53.8 | % | 49.7 | % | — | — | ||||||||||
|
GAAP sales and marketing |
$ | 27,054 | $ | 19,301 | $ | 7,753 | 40.2 | % | ||||||||
|
Stock-based compensation expense |
(2,462 | ) | (1,111 | ) | (1,351 | ) | 121.6 | % | ||||||||
|
Non-GAAP sales and marketing |
$ | 24,592 | $ | 18,190 | $ | 6,402 | 35.2 | % | ||||||||
|
Non-GAAP percentage of revenue |
48.9 | % | 46.9 | % | — | — | ||||||||||
Sales and marketing expenses increased $7.8 million, or 40.2%, from $19.3 million for the three months ended March 31, 2021 to $27.1 million for the three months ended March 31, 2022. Stock-based compensation increased the overall sales and marketing expenses, increasing by $1.4 million year over year.
The drivers of the remaining $6.4 million increase consisted of higher personnel and marketing costs. The increase in personnel costs, which made up approximately 50% of the increase, was driven by higher headcount as the Company continues to expand. The increase in marketing costs, which made up the majority of the remaining increase, was driven by media exposure and events in the first quarter of 2022.
General and Administrative
General and administrative expenses during the three months ended March 31, 2022 and 2021 were as follows:
|
Three Months Ended |
||||||||||||||||
|
March 31, |
Change |
|||||||||||||||
|
2022 |
2021 |
Amount |
% |
|||||||||||||
|
(dollars in thousands) |
||||||||||||||||
|
General and administrative |
$ | 15,542 | $ | 10,292 | $ | 5,250 | 51.0 | % | ||||||||
|
Percentage of revenue |
30.9 | % | 26.5 | % | — | — | ||||||||||
|
GAAP general and administrative |
$ | 15,542 | $ | 10,292 | $ | 5,250 | 51.0 | % | ||||||||
|
Stock-based compensation expense |
(4,484 | ) | (1,991 | ) | (2,493 | ) | 125.2 | % | ||||||||
|
Non-GAAP general and administrative |
$ | 11,058 | $ | 8,301 | $ | 2,757 | 33.2 | % | ||||||||
|
Non-GAAP percentage of revenue |
22.0 | % | 21.4 | % | — | — | ||||||||||
General and administrative expenses increased $5.3 million, or 51.0%, from $10.3 million for the three months ended March 31, 2021 to $15.5 million for the three months ended March 31, 2022. Stock-based compensation represented the primary driver of the change, contributing $2.5 million of the increase. The increase was driven by recognition of compensation expense for AvePoint's stock-based awards.
The drivers of the remaining $2.8 million increase consisted of increases in insurance, professional services and expenses related to the I-Access acquisition. The increase in personnel costs, which made up approximately 53% of the increase, was driven by higher headcount required as the Company continues to expand and due to additional need for legal, finance and administrative personnel as the Company transitioned to a publicly traded company. The increase in insurance costs, which made up approximately 27% of the increase, was driven by additional insurance coverage necessary for operating as a publicly traded company. The increase in professional service costs, which made up approximately 26% of the increase, was driven by increased consumption of compliance, legal, consulting and insurance services due to the public listing of the Company's securities as well as the I-Access acquisition. The remaining difference was driven by various general and administrative costs as the Company continues to expand its operations.
Part I
Item 2
Research and Development
Research and development expenses during the three months ended March 31, 2022 and 2021 were as follows:
|
Three Months Ended |
||||||||||||||||
|
March 31, |
Change |
|||||||||||||||
|
2022 |
2021 |
Amount |
% |
|||||||||||||
|
(dollars in thousands) |
||||||||||||||||
|
Research and development |
$ | 6,402 | $ | 4,102 | $ | 2,300 | 56.1 | % | ||||||||
|
Percentage of revenue |
12.7 | % | 10.6 | % | — | — | ||||||||||
|
GAAP research and development |
$ | 6,402 | $ | 4,102 | $ | 2,300 | 56.1 | % | ||||||||
|
Stock-based compensation expense |
(750 | ) | (97 | ) | (653 | ) | 673.2 | % | ||||||||
|
Non-GAAP research and development |
$ | 5,652 | $ | 4,005 | $ | 1,647 | 41.1 | % | ||||||||
|
Non-GAAP percentage of revenue |
11.2 | % | 10.3 | % | — | — | ||||||||||
Research and development expenses increased $2.3 million, or 56.1%, from $4.1 million for the three months ended March 31, 2021 to $6.4 million for the three months ended March 31, 2022. Stock-based compensation represented the primary driver of the change, contributing $0.7 million of the increase.
The primary driver of the remaining $1.6 million increase resulted from higher compensation costs for research and development personnel as the Company seeks to expand development of new offerings and improvements to existing offerings.
Income Tax Provision
Income tax benefit during the three months ended March 31, 2022 and 2021 was as follows:
|
Three Months Ended |
||||||||||||||||
|
March 31, |
Change |
|||||||||||||||
|
2022 |
2021 |
Amount |
% |
|||||||||||||
|
(dollars in thousands) |
||||||||||||||||
|
Income tax expense (benefit) |
$ | 309 | $ | (1,039 | ) | $ | 1,348 | (129.7 | )% | |||||||
AvePoint's income tax expense for the three months ended March 31, 2022 was $0.3 million, as compared to a tax benefit of $1.0 million for the three months ended March 31, 2021. The effective tax rate was (2.88)% for the three months ended March 31, 2022 compared to 17.37% for the three months ended March 31, 2021. The change in effective tax rates for the three-month period ended March 31, 2022 as compared to the three-month period ended March 31, 2021 was primarily due to the mix of pre-tax income (loss) results by jurisdictions taxed at different rates or tax losses for which no benefit can be taken.
In assessing the need for a valuation allowance, the Company has considered all available positive and negative evidence including its historical levels of income, expectations of future taxable income, future reversals of existing taxable temporary differences and ongoing tax planning strategies. If in the future, the Company determines that it would be able to realize the deferred tax assets, the Company may reduce its valuation allowance, which may result in income tax benefits to be recognized in the Company’s consolidated statement of operations and comprehensive loss. Based on available evidence as of March 31, 2022, there is a likelihood that a valuation allowance may be required on AvePoint’s U.S. net deferred tax assets during prospective quarters in 2022.
Certain Non-GAAP Financial Measures
We believe that, in addition to our financial results determined in accordance with GAAP, non-GAAP operating income and non-GAAP operating margin are useful in evaluating our business, results of operations, and financial condition.
Non-GAAP operating income and non-GAAP operating margin should not be considered as an alternative to operating income, operating margin or any other performance measures derived in accordance with GAAP as measures of performance. Non-GAAP operating income and non-GAAP operating margin should not be considered in isolation or as a substitute for analysis of our results as reported under GAAP.
|
Three Months Ended |
||||||||
|
March 31, |
||||||||
|
2022 |
2021 |
|||||||
|
(dollars in thousands) |
||||||||
|
Non-GAAP operating income |
$ | (5,574 | ) | $ | (2,642 | ) | ||
|
Non-GAAP operating margin |
(11.1 | )% | (6.8 | )% | ||||
Part I
Item 2
Non-GAAP Operating Income and Non-GAAP Operating Margin
Non-GAAP operating income and non-GAAP operating margin are non-GAAP financial measures that our management uses to assess our overall performance. We define non-GAAP operating income as GAAP operating loss plus stock-based compensation. We define non-GAAP operating margin as non-GAAP operating income divided by revenue. We believe non-GAAP operating income and non-GAAP operating margin provide our management and investors consistency and comparability with our past financial performance and facilitate period-to-period comparisons of operations, as these metrics eliminate the effects of stock-based compensation which has had historical volatility from period to period due to marked-to-market securities. The elimination of the effect of variability of stock-based compensation expense, which is a non-cash expense, provides a better representation as to the overall operating performance of the company. We use non-GAAP financial measures (a) to evaluate our historical and prospective financial performance and trends as well as our performance relative to our peers, (b) to set and approve spending budgets, (c) to allocate resource, (d) to measure operational profitability and the accuracy of forecasting, (e) to assess financial discipline over operational expenditures.
GAAP operating margin for the three months ended March 31, 2022 and 2021 was (27.5)% and (15.3)%, respectively. The reduction in non-GAAP operating margin was primarily attributable to the significant investment in the business through 2021 as well as increased expenses related to becoming a publicly traded company. The following table presents a reconciliation of non-GAAP operating income from the most comparable GAAP measure, operating income, for the periods presented:
|
Three Months Ended |
||||||||
|
March 31, |
||||||||
|
2022 |
2021 |
|||||||
|
Loss from operations |
$ | (13,848 | ) | $ | (5,931 | ) | ||
|
Add: |
||||||||
|
Stock-based compensation |
8,274 | 3,289 | ||||||
|
Non-GAAP operating income |
$ | (5,574 | ) | $ | (2,642 | ) | ||
|
Non-GAAP operating margin |
(11.1 | )% | (6.8 | )% | ||||
Liquidity and Capital Resources
As of March 31, 2022, we had an accumulated deficit of $387.0 million, $78.8 million in cash and cash equivalents and $181.3 million in short-term investments. Historically, we have from time to time financed our operations with proceeds from the sale of preferred stock and other equity instruments.
Our short-term liquidity needs primarily include working capital for sales and marketing, research and development, and continued innovation. Our long-term capital requirements will depend on many factors, including our growth rate, levels of revenue, the expansion of sales and marketing activities, market acceptance of our platform, the results of business initiatives, and the timing of new product introductions. Refer to “Note 9 - Commitments and Contingencies” for more information regarding the purchase commitments.
We believe that our existing cash, cash equivalents, short-term investments and, our cash flows from operating activities, and our borrowing capacity under our credit facility with HSBC Venture Bank USA Inc., described below, will be sufficient to meet our working capital and capital expenditure needs and debt service obligations for at least the next twelve months. In the future, we may attempt to raise additional capital through the sale of additional equity or debt financing. The sale of additional equity would be dilutive to our stockholders. Additional debt financing could result in increased debt service obligations and more restrictive financial and operational covenants.
We also maintain a loan and security agreement with HSBC Venture Bank USA Inc. (the "Bank") as lender for a revolving line of credit of up to $30.0 million. The line bears interest at a rate equal to LIBOR plus 3.5%. The line carries an unused fee of 0.5%. The line will mature on April 7, 2023. We are required to maintain a specified adjusted quick ratio and a minimum annual recurring revenue tested by the Bank each quarter. We pledged, assigned and granted the Bank a security interest in all shares, future proceeds and assets (except for excluded assets, including material intellectual property) as a security for the performance of the loan and security agreement obligations. As of March 31, 2022, we are in compliance with all covenants under the line and had no borrowings outstanding under the line of credit.
Cash Flows
The following table sets forth a summary of AvePoint’s cash flows for the periods indicated.
|
Three Months Ended |
||||||||
|
March 31, |
||||||||
|
2022 |
2021 |
|||||||
|
Net cash used in operating activities |
$ | (6,123 | ) | $ | (4,265 | ) | ||
|
Net cash used in investing activities |
(181,471 | ) | (534 | ) | ||||
|
Net cash provided by financing activities |
287 | 617 | ||||||
Part I
Item 2
Operating Activities
Net cash used in operating activities for the three months ended March 31, 2022 was $6.1 million, reflecting AvePoint’s net loss of $11.1 million, adjusted for non-cash items of $6.8 million and net cash outflows of $1.9 million from changes in its operating assets and liabilities. The primary drivers of non-cash items were stock-based compensation which reflects ongoing compensation partially offset by a decrease in the mark to market value of earn-out and warranty liabilities. The drivers of changes in operating assets and liabilities are seasonal in nature. These drivers are related to a decrease in accounts receivable due primarily to timing of customer invoices and decrease in prepaid expenses and other current assets primarily related to prepaid insurance in and offset by a decrease in accrued expenses primarily due to the payment of accrued bonuses and commissions.
Net cash used in operating activities for the three months ended March 31, 2021 was $4.3 million, reflecting AvePoint’s net loss of $4.9 million, adjusted for non-cash items of $3.1 million and net cash outflows of $2.5 million from changes in its operating assets and liabilities. The primary driver for non-cash items was stock-based compensation which reflects ongoing compensation charges for the entity’s equity- and liability-classified awards. The drivers of changes in operating assets and liabilities related to decreases in accounts payable and accrued expenses primarily as a result of bonus and commission payments. These decreases were partially offset by a decrease in accounts receivable due primarily to timing of payments from customers.
Investing Activities
Net cash used in investing activities for the three months ended March 31, 2022 was $181.5 million. It consisted of $179.7 million of purchases of short-term investments, $1.4 million as a result of the acquisition of I-Access, and $1.0 million of purchases of property and equipment, partially offset by $0.7 million in the maturity of short-term investments.
Net cash used in investing activities for the three months ended March 31, 2021 was $0.5 million. It consisted of $0.3 million in purchases of short-term investments and $0.2 million of purchases of property and equipment.
Financing Activities
Net cash provided by financing activities for the three months ended March 31, 2022 was $0.3 million. The primary driver of cash flows from financing activities was due to $1.0 million of proceeds from the exercising of stock options, partially offset by $0.7 million in purchases of treasury stock through the stock repurchasing program.
Net cash provided by financing activities for the three months ended March 31, 2021 was $0.6 million. It consisted primarily of proceeds from the issuance of Common Stock, partially offset by payments made for the redemption of the Company's Series B preferred stock.
Indebtedness
Credit Facility
We are the borrower under a loan and security agreement (the “Second Amended Loan Agreement”) with HSBC Ventures Bank USA Inc. (“HSBC”), a commercial bank, as the lender. See “Note 6 - Line of Credit” in Part I, Item 1 “Financial Statements” of this Quarterly Report on Form 10-Q.
The Second Amended Loan Agreement provides for a revolving line of credit of up to $30.0 million and an additional $20.0 million accordion feature for additional capital we may draw at our request. Borrowings under the line bear interest at a rate equal to LIBOR plus 3.5%. The line carries an unused fee of 0.5% per year. The proceeds of borrowings under the Second Amended Loan Agreement will be used for general corporate purposes.
Leasing Activities
We are obligated under various non-cancelable operating leases for office space. The initial terms of the leases expire on various dates through 2030. As of March 31, 2022, the commitments related to these operating leases is $15.6 million, of which $4.3 million is due in the next twelve months.
Part I
Item 2
Operating Segment Information
We operate in one segment. Our products and services are sold throughout the world, through direct and indirect sales channels. Our chief operating decision maker (the “CODM”) is our Chief Executive Officer. The CODM makes operating performance assessment and resource allocation decisions on a global basis. The CODM does not receive discrete financial information about asset allocation, expense allocation, or profitability by product or geography. See the section titled “Notes to Condensed Consolidated Financial Statements” (Part I, Item 1 of this Quarterly Report) under the sub-heading “Note 14 – Segment Information” for more information.
Critical Accounting Policies and Estimates
Preparation of these financial statements requires us to make estimates and assumptions that affect the reported amounts of assets and liabilities and the disclosure of contingent assets and liabilities. We also make estimates and assumptions on the reported revenue generated and reported expenses incurred during the reporting periods. Our estimates are based on our historical experience and on various other factors that our management believes are reasonable under the circumstances. The results of these estimates form the basis for making judgments about the carrying value of assets and liabilities that are not readily apparent from other sources. Actual results may differ from these estimates.
While our significant accounting policies are described in more detail in the section titled “Notes to Condensed Consolidated Financial Statements” (Part I, Item 1 of this Quarterly Report), we believe the following critical accounting policies and estimates are most important to understanding and evaluating our reported financial results.
Revenue Recognition
We derive revenue from four primary sources: SaaS, term license and support, services, and maintenance. Many of our contracts with customers include multiple performance obligations. Judgement is required in determining whether each performance obligation is distinct. Our products and services generally do not require a significant amount of integration or interdependency; therefore, our products and services are generally not combined. We allocate the transaction price for each contract to each performance obligation based on the relative standalone selling price (“SSP") for each performance obligation within each contract.
We use judgment in determining the SSP for products and services. For substantially all performance obligations except term licenses, we are able to establish the SSP based on the observable prices of products or services sold separately in comparable circumstances to similar customers. We typically establish an SSP range for our products and services which is reassessed on a periodic basis or when facts and circumstances change. Term licenses are sold only as a bundled arrangement that includes the rights to a term license and support. In determining the SSP of license and support in a term license arrangement we applied observable inputs using the value relationship between support and term license, the value relationship between support and perpetual licenses, the average economic life of our products, software renewals rates and the price of the bundled arrangement in relation to the perpetual licensing approach. Using a combination of the relative fair value method or the residual value method the SSP of the performance obligations in an arrangement was allocated to each performance obligation within a sales arrangement.
Impact of COVID-19 on Our Business
In the three months ended March 31, 2022 and the fiscal year ended December 31, 2021, the COVID-19 pandemic and related voluntary and government-imposed social and business restrictions have had, and will likely continue to have, a significant impact on global economic conditions, the environment in which we operate our business, and on our financial results. We have seen a strong demand for our existing products, as well as products released during the pandemic, as a result of our customers' need for security, governance, and collaboration in both remote and hybrid work settings. During the three months ended March 31, 2022, we experienced a 29.6% increase in revenue compared to the three months ended March 31, 2021.
Part I
Item 2
We believe that market volatility during the pandemic has caused organizations to accelerate their digital transformation priorities, as evidenced by increased cloud usage and demand for remote technology solutions among our customers. This transformation requires advanced technology solutions and ample automation to support new organizational realities, all of which we are in a prime position to provide. We remain focused on improving and investing in the products and services we offer to support our long-term growth while continuing to innovate and develop new products and services in response to customer needs, whether directly as a result of the COVID-19 pandemic or otherwise. Although our business has not been adversely affected by the COVID-19 pandemic, and in fact has been positively affected by, among other things, our customers’ increased focus on our ability to provide multiple core services and products as solutions to pandemic-driven obstacles, the extent of the continuing impact of COVID-19 is uncertain and will depend on numerous factors outside of our control. Refer to the section titled “Risk Factors” (Part II, Item 1A of this Quarterly Report) and the section of our Annual Report on Form 10-K for the year ended December 31, 2021 titled “Risk Factors” (Part I, Item 1A of the Annual Report) for our consideration of risks related to COVID-19.
Economic Conditions, Challenges, and Risks
The markets for software and cloud-based services are dynamic and highly competitive. Our competitors are developing new software while also deploying competing cloud-based services for consumers and businesses. Customer preferences evolve rapidly, and choices in hardware, products, and devices can and do influence how users access services in the cloud, and in some cases, the user’s choice of which suite of cloud-based services to use. We must continue to evolve and adapt over an extended time in pace with this changing environment. The investments we are making in infrastructure, research and development, marketing, and geographic expansion will continue to increase our operating costs and may decrease our operating margins.
Our success is highly dependent on our ability to attract and retain qualified employees. We hire a mix of university and industry talent worldwide. We compete for talented individuals globally by offering an exceptional working environment, broad customer reach, scale in resources, the ability to grow one’s career across many different products and businesses, and competitive compensation and benefits.
Aggregate demand for our software, services, and devices is correlated to global macroeconomic and geopolitical factors, which remain dynamic. By way of example, Russia's ongoing military action against Ukraine has created general macroeconomic uncertainty. While we have only limited and largely immaterial economic, financial, and operational exposure to Russia or Belarus (or any individuals and entities connected to Russian or Belarusian political, business, and financial organizations), we are nevertheless monitoring the developments as they unfold in order to react accordingly. The impact of the conflict on our operational and financial performance may depend on future developments that cannot be predicted; we do not, however, believe the impacts to be material at this time.
Our international operations provide a significant portion of our total revenue and expenses. Many of these revenue and expenses are denominated in currencies other than the U.S. dollar. As a result, changes in foreign exchange rates may significantly affect revenue and expenses. Refer to the section titled “Risk Factors” (Part II, Item 1A of this Quarterly Report) for a discussion of these factors and other risks.
Seasonality
Our quarterly revenue fluctuates and does not necessarily grow sequentially when measuring any one fiscal quarter’s revenue against another (e.g. comparing the fourth fiscal quarter of fiscal year 2021 against the first fiscal quarter of fiscal year 2022). Historically, our third and fourth quarters have been our highest revenue quarters, however those results are not necessarily indicative of future quarterly revenue or full year results. Higher third and fourth quarter revenue is driven primarily by increased sales resulting from our customers’ fiscal year ends. The ongoing COVID-19 pandemic may have an impact on consumer behaviors and customer activities that may result in temporary changes to and increased fluctuations in the quarterly revenue of our business. Additionally, new product and service introductions (including the timing of those introductions) can significantly impact revenue. Revenue can also be affected when consumers and customers anticipate a product introduction. Our operating expenses have generally increased sequentially due to increases in personnel in connection with the expansion of our business.
Emerging Growth Company Accounting Election
Section 102(b)(1) of the JOBS Act exempts emerging growth companies from being required to comply with new or revised financial accounting standards until private companies are required to comply with the new or revised financial accounting standards. The JOBS Act provides that a company can choose not to take advantage of the extended transition period and comply with the requirements that apply to non-emerging growth companies, and any such election to not take advantage of the extended transition period is irrevocable. We will be an emerging growth company at least until our next determination date, which is the last day of our second fiscal quarter in 2022. As a result, we have elected to avail ourselves of the extended transition period and will take advantage of the benefits of the extended transition period emerging growth company status permits. During the extended transition period, it may be difficult or impossible to compare our financial results with the financial results of another public company that complies with public company effective dates for accounting standard updates because of the potential differences in accounting standards used.
We will remain an emerging growth company under the JOBS Act until the earliest of (a) December 31, 2024, (b) the last date of our fiscal year in which we have total annual gross revenue of at least $1.07 billion, (c) the date on which we are deemed to be a “large accelerated filer” under the rules of the SEC with at least $700.0 million of outstanding securities held by non-affiliates, or (d) the date on which we have issued more than $1.0 billion in non-convertible debt securities during the previous three years. The next determination date as to whether we have satisfied the criteria set forth in the foregoing (b), (c), and (d) is the last day of our second fiscal quarter in 2022.
Recently Issued and Adopted Accounting Pronouncements
For information about recent accounting pronouncements, see “Note 2 - Summary of Significant Accounting Policies” in Part I, Item 1 “Financial Statements” of this Quarterly Report on Form 10-Q.
Part I
Item 3
Item 3. Quantitative and Qualitative Disclosures About Market Risks
We are exposed to potential economic risk from interest rates, foreign exchange rates, and concentration of credit. We have considered changes in our exposure to market risks during the three months ended March 31, 2022 and have determined that there have been no material changes to our exposure to market risks from those described in our Annual Report on Form 10-K for the year ended December 31, 2021, filed with the SEC on March 31, 2022. However, we have provided the following information to supplement or update our disclosures on our Form 10-K.
Interest Rate Risk
We had cash and cash equivalents, marketable securities, and short-term deposits of $270.6 million as of December 31, 2021. We hold cash and cash equivalents, marketable securities, and short-term deposits for working capital purposes. Our cash and cash equivalents are held in cash deposits and money market funds. Due to the short-term nature of these instruments, we believe that it does not have any material exposure to changes in the fair value of our investment portfolio due to changes in interest rates. Declines in interest rates, however, would reduce our future interest income. The effect of a hypothetical 10% change in interest rates would not have a material impact on our consolidated financial statements. As of March 31, 2022, we had no outstanding obligations under our line of credit with HSBC under the Second Amended Loan Agreement. To the extent we enter into other long-term debt arrangements in the future, we would be subject to fluctuations in interest rates which could have a material impact on our future financial condition and results of operation.
Foreign Currency Exchange Risk
Fluctuations in foreign currencies impact the amount of total assets and liabilities that we report for our foreign subsidiaries upon the translation of these amounts into U.S. Dollars. In particular, the amount of cash, cash equivalents and marketable securities that we report in U.S. Dollars for a significant portion of the cash held by these subsidiaries is subject to translation variance caused by changes in foreign currency exchange rates as of the end of each respective reporting period, the offset to which is substantially recorded to accumulated other comprehensive income on our consolidated balance sheets and is also presented as a line item in its consolidated statements of comprehensive income.
As the U.S. Dollar fluctuated against certain international currencies as of December 31, 2021, the balances that we reported in U.S. Dollars for foreign subsidiaries that hold international currencies as of December 31, 2021 increased relative to what it would have reported using a constant currency rate from December 31, 2020. As reported in our consolidated statements of cash flows, the estimated effects of exchange rate changes on our reported cash and cash equivalents balances in U.S. Dollars was a decrease of $1.2 million for the year ended December 31, 2021 and an increase of $0.9 million for the year ended December 31, 2020. If overall foreign currency exchange rates in comparison to the U.S. Dollar uniformly would have been weaker by 10% as of December 31, 2021 and December 31, 2020, the amount of cash, cash equivalents and marketable securities AvePoint would have reported in U.S. Dollars would have decreased by approximately $2.6 million and $2.9 million, respectively, assuming constant foreign currency cash, cash equivalents and marketable securities balances.
Concentration of Credit Risk
We deposit our cash with financial institutions, and, at times, such balances may exceed federally insured limits. No customer accounted for more than 10% of billings for the years ended December 31, 2021 and 2020 and no customers made up more than 10% of accounts receivable as of December 31, 2021.
Part I
Item 4
Item 4. Controls and Procedures
We maintain “disclosure controls and procedures,” as defined in Rule 13a–15(e) and Rule 15d–15(e) under the Exchange Act, that are designed to provide reasonable assurance that information required to be disclosed by us in the reports that we file or submit under the Exchange Act is recorded, processed, summarized and reported within the time periods specified in the SEC’s rules and forms. Disclosure controls and procedures include, without limitation, controls and procedures designed to provide reasonable assurance that information required to be disclosed by us in the reports that we file or submit under the Exchange Act is accumulated and communicated to our management, including our Chief Executive Officer (in his capacity as principal executive officer) and our Chief Financial Officer (in his capacity as principal financial and accounting officer), as appropriate to allow timely decisions regarding required disclosure.
Evaluation of Disclosure Controls and Procedures
Under the supervision and with the participation of our management, including our principal executive officer and principal financial and accounting officer, we conducted an evaluation of the effectiveness of our disclosure controls and procedures (as defined in Rule 13a-15(e)) under the Exchange Act, as of the end of the period covered by this Quarterly Report. Based upon that evaluation, our principal executive officer and principal financial and accounting officer concluded that our disclosure controls and procedures were not effective as of December 31, 2021 or during the three months ended March 31, 2022] due to the material weaknesses described below. Notwithstanding such material weaknesses in internal control over financial reporting, our principal executive officer and principal financial and accounting officer have concluded that our audited Consolidated Financial Statements included in this Quarterly Report present fairly, in all material respects, our financial position, results of operations, and cash flows for the periods presented in conformity with U.S. generally accepted accounting principles (“GAAP”).
Material Weaknesses in Internal Control over Financial Reporting
A material weakness is a deficiency, or combination of deficiencies, in internal control over financial reporting, such that there is a reasonable possibility that a material misstatement of a company’s annual or interim financial statements will not be prevented or detected on a timely basis. Because the control deficiencies described below could have resulted in a material misstatement of our annual or interim financial statements, we determined that these deficiencies constitute material weaknesses. Based upon the evaluation described above, our management identified the following material weaknesses in internal control over financial reporting in fiscal year 2020 which continued to exist during the three months ended March 31, 2022:
|
▪ |
the completeness and accuracy of financial accounting, reporting and disclosures; |
|
|
▪ |
the identification, review and accounting for nonroutine transactions and/or complex accounting transactions; and |
|
|
▪ |
segregation of duties with respect to the processing of financial transactions. |
Remediation of Material Weaknesses
Our management has been and continues to be committed to remediating these material weaknesses and has identified and implemented several steps to enhance our internal controls over financial reporting. We have implemented a remediation plan (the "Remediation Plan"), the actions under which coincide with and are incorporated into our overarching Sarbanes-Oxley Act of 2002 (“SOX”) compliance implementation plan. The Remediation Plan actions include, but are not limited to:
|
▪ |
the hiring of personnel with technical accounting and financial reporting experience to further enhance our ability to accurately and expediently respond to increased accounting and financial complexities and increased resource demand with respect thereto, and to aid in further identification and oversight with respect to disclosure control activities in response; |
|
|
▪ |
the engagement of external consultants in the assistance of the evaluation of complex accounting matters; |
|
|
▪ |
the establishment of formalized internal controls to review and maintain segregation of duties between appropriate control operators; and |
|
|
▪ |
the implementation of improved accounting and financial reporting procedures to enhance the completeness and accuracy of our financial accounting, reporting, and disclosures. |
We are in the process of completing our remediation plan, and we are currently testing that the newly implemented controls are operating effectively. The remaining elements of our Remediation Plan can only be accomplished over time, and we can offer no assurance that these initiatives will remediate the identified material weaknesses.
Part I
Item 4
We intend to complete the remaining portions of our Remediation Plan as promptly as possible. However, we cannot estimate how long it will take to correct any remaining material weaknesses that have not yet been remediated. Identified material weaknesses will not be considered remediated until a sustained period of time has passed to allow our management to test the design and operational effectiveness of the corrective actions pursuant to the Remediation Plan. In addition, we may discover additional material weaknesses that require additional time and resources to remediate and we may decide to take additional measures to address the material weaknesses or modify the remediation steps described above.
Changes in Internal Control Over Financial Reporting
Other than the Remediation Plan discussed above and the ongoing implementation of measures under the Remediation Plan designed to accurately maintain our financial records, enhance the flow of financial information, improve data management, and provide timely information to our management team, there have been no changes in internal control over financial reporting during the three months ended March 31, 2022 that have materially affected, or are reasonably likely to materially affect, our internal control over financial reporting. However, as we continue to implement the Remediation Plan, we will change our processes and procedures, which in turn could result in changes to our internal control over financial reporting. As such changes occur, we will evaluation quarterly whether such changes materially affect our internal control over financial reporting.
Inherent Limitations on Effectiveness of Controls
Our management, including our principal executive officer and principal financial and accounting officer, does not expect that our disclosure controls and procedures or our internal control over financial reporting will prevent or detect all errors and all fraud. A control system, no matter how well conceived and operated, can provide only reasonable, not absolute, assurance that the objectives of the control system are met. Because of the inherent limitations in all control systems, no evaluation of controls can provide absolute assurance that all control issues and instances of fraud, if any, have been detected. The design of any system of controls is also based in part upon certain assumptions about the likelihood of future events, and there can be no assurance that any design will succeed in achieving its stated goals under all potential future conditions. Over time, controls may become inadequate because of changes in conditions, or the degree of compliance with policies or procedures may deteriorate. Because of the inherent limitations in any control system, misstatements due to error or fraud may occur and not be detected.
Part II
Items 1 and 1A
In the normal course of our business, we may be involved in various claims, negotiations, and legal actions. Except for such claims that arise in the normal course of business, as of and for the fiscal quarter ended March 31, 2022, we are not a party to any material asserted, ongoing, threatened, or pending claims, suits, assessments, proceedings, or other litigation for which a material claim is reasonably possible, probable, or estimable.
Refer to the information under the section titled “Risk Factors” of our Annual Report on Form 10-K for the year ended December 31, 2021 (the “Annual Report”) under the sub-heading “Legal and Regulatory Risks” (Part I, Item 1A of the Annual Report) for information regarding the potential legal and regulatory risks (including potential legal proceedings and litigation) in which we may become involved.
Our operations and financial results are subject to various risks and uncertainties, including those described in Part I, Item 1A, “Risk Factors” in the Annual Report, which risks and uncertainties could affect our business, financial condition, results of operations, cash flows, and the trading price of our common stock. There have been no material changes to the risk factors previously disclosed in our Annual Report since its filing on March 31, 2022. We urge you to read the risk factors in the Annual Report.
Part II
Items 2, 3, 4, and 5
ITEM 2. UNREGISTERED SALES OF EQUITY SECURITIES AND USE OF PROCEEDS
During the three months ended March 31, 2022, we did not issue any shares of our Common Stock or any other equity securities without registration under the Securities Act of 1933, as amended.
(c) Issuer Purchases of Equity Securities.
On March 17, 2022, we announced that our Board of Directors authorized a new share repurchase program (the "Share Repurchase Program") for us to buy back shares of our Common Stock. Under the Share Repurchase Program, we have the authority to buy up to a maximum of $150 million of Common Stock shares via acquisitions in the open market or privately negotiated transactions. The Share Repurchase Program will remain open for a period of three years from the date of authorization. Purchases made pursuant to the Share Repurchase Program will be conducted in compliance with Exchange Act Rule 10b-18 (or pursuant to a plan implemented in response to Exchange Act Rule 10b5-1(c) for parties that frequently have access to material nonpublic information, such as our executive officers and directors) and all other applicable legal, regulatory, and internal policy requirements, including our Insider Trading Policy. We are not obligated to make purchases of, nor are we obligated to acquire any particular amount of, Common Stock under the Share Purchase Program. The Share Repurchase Program may be suspended or discontinued at any time.
The following table presents information with respect to Common Stock shares repurchased under the Share Repurchase Program during the three months ended March 31, 2022 and in the interim monthly periods from April 1, 2022 until the date of filing this Quarterly Report:
|
Period |
Total number of shares purchased(1) |
Average price paid per share(2) |
Total number of shares purchased as part of the Share Repurchase Program |
Maximum number (or approximate dollar value) of shares that may yet be purchased under the Share Repurchase Program(3) |
||||
|
March 17, 2022 - March 31, 2022 |
135,000 |
$5.4885 |
135,000 |
$149,256,352.50(4) |
||||
| April 1, 2022 - April 30, 2022 | 675,000 | $5.0671 | 810,000 | $145,822,573.50(4) | ||||
| May 1, 2022 - May 16, 2022 | 270,000 | $4.7645 | 1,080,000 | $144,530,772.00(4) |
(1) All shares reported herein were purchased pursuant to the publicly announced Share Repurchase Program.
(2) Average price paid per share includes costs associated with the repurchases
(3) The Share Repurchase Program authorizes us to purchase up to an aggregate of $150 million of our Common Stock until March 17, 2025 (three years from the date of authorization).
(4) The maximum remaining dollar value of shares that may yet be purchased under the Share Repurchase Program is reduced by the aggregate price paid for share purchases in addition to any fees, commissions, or other costs that may arise as a result of the purchase.
ITEM 3. DEFAULTS UPON SENIOR SECURITIES
None.
ITEM 4. MINE SAFETY DISCLOSURES
Not applicable.
None.
Part II
Item 6
The following exhibits are filed as part of, furnished with, or incorporated by reference into, this Quarterly Report on Form 10-Q, in each case as indicated therein.
Exhibit Index
|
Incorporated by Reference |
||||||||||||
|
Exhibit |
Description |
Schedule/ Form |
File No. |
Exhibit |
Filing Date |
Filed Herewith | ||||||
|
31.1 |
X | |||||||||||
|
31.2 |
X | |||||||||||
|
32.1** |
||||||||||||
|
32.2** |
||||||||||||
|
101.INS |
Inline XBRL Instance Document - the instance document does not appear in the Interactive Data File because its XBRL tags are embedded within the Inline XBRL document. |
X | ||||||||||
|
101.SCH |
Inline XBRL Taxonomy Extension Schema Document. |
X | ||||||||||
|
101.CAL |
Inline XBRL Taxonomy Extension Calculation Linkbase Document. |
X | ||||||||||
|
101.DEF |
Inline XBRL Taxonomy Extension Definition Linkbase Document. |
X | ||||||||||
|
101.LAB |
Inline XBRL Taxonomy Extension Labels Linkbase Document. |
X | ||||||||||
|
101.PRE |
Inline XBRL Taxonomy Extension Presentation Linkbase Document. |
X | ||||||||||
|
104.1 |
Cover Page Interactive Data File (Embedded within the Inline XBRL document and included in Exhibit 101). |
X | ||||||||||
|
|
|
|||||||||||
|
** |
Furnished herewith. Any exhibit furnished herewith (including the certifications furnished in Exhibit 32.1 and Exhibit 32.2 hereto) are deemed to accompany this Quarterly Report on Form 10-Q and will not be deemed “filed” for purposes of Section 18 of the Securities Exchange Act of 1934, as amended, except to the extent that the Registrant specifically incorporates it by reference. |
Pursuant to the requirements of the Securities Exchange Act of 1934, the registrant has duly caused this report to be signed on its behalf by the undersigned thereunto duly authorized.
| AVEPOINT, INC. | ||
|
Date: May 16, 2022 |
/s/ Tianyi Jiang |
|
|
Name: |
Tianyi Jiang |
|
|
Title: |
Chief Executive Officer (Principal Executive Officer) |
|
|
Date: May 16, 2022 |
/s/ James Caci |
|
|
Name: |
James Caci |
|
|
Title: |
Chief Financial Officer (Principal Financial and Accounting Officer) |
|
Exhibit 31.1
I, Tianyi Jiang, certify that:
|
1. |
I have reviewed this Quarterly Report on Form 10-Q of AvePoint, Inc.: |
|
2. |
Based on my knowledge, this report does not contain any untrue statement of a material fact or omit to state a material fact necessary to make the statements made, in light of the circumstances under which such statements were made, not misleading with respect to the period covered by this report; |
|
3. |
Based on my knowledge, the financial statements, and other financial information included in this report, fairly present in all material respects the financial condition, results of operations and cash flows of the registrant as of, and for, the periods presented in this report; |
|
4. |
The registrant’s other certifying officer and I are responsible for establishing and maintaining disclosure controls and procedures (as defined in Exchange Act Rules 13a-15(e) and 15d-15(e)) for the registrant and internal control over financial reporting (as defined in Exchange Act Rules 13a-15(f) and 15d-15(f)) for the registrant and have: |
|
a) |
Designed such disclosure controls and procedures, or caused such disclosure controls and procedures to be designed under our supervision, to ensure that material information relating to the registrant is made known to us by others within those entities, particularly during the period in which this report is being prepared; |
|
b) |
Designed such internal control over financial reporting, or caused such internal control over financial reporting to be designed under our supervision, to provide reasonable assurance regarding the reliability of financial reporting and the preparation of financial statements for external purposes in accordance with generally accepted accounting principles; |
|
c) |
Evaluated the effectiveness of the registrant’s disclosure controls and procedures and presented in this report our conclusions about the effectiveness of the disclosure controls and procedures, as of the end of the period covered by this report based on such evaluation; and |
|
d) |
Disclosed in this report any change in the registrant’s internal control over financial reporting that occurred during the registrant’s most recent fiscal quarter (the registrant’s fourth fiscal quarter in the case of an annual report) that has materially affected, or is reasonably likely to materially affect, the registrant’s internal control over financial reporting; and |
|
5. |
The registrant’s other certifying officer and I have disclosed, based on our most recent evaluation of internal control over financial reporting, to the registrant’s auditors and the audit committee of the registrant’s board of directors (or persons performing the equivalent functions): |
|
(a) |
All significant deficiencies and material weaknesses in the design or operation of internal control over financial reporting which are reasonably likely to adversely affect the registrant’s ability to record, process, summarize and report financial information; and |
|
(b) |
Any fraud, whether or not material, that involves management or other employees who have a significant role in the registrant’s internal control over financial reporting. |
|
Date: May 16, 2022 |
By: |
/s/ Tianyi Jiang |
||||
|
Tianyi Jiang Chief Executive Officer (Principal Executive Officer) |
Exhibit 31.2
I, James Caci, certify that:
|
1. |
I have reviewed this Quarterly Report on Form 10-Q of AvePoint, Inc.: |
|
2. |
Based on my knowledge, this report does not contain any untrue statement of a material fact or omit to state a material fact necessary to make the statements made, in light of the circumstances under which such statements were made, not misleading with respect to the period covered by this report; |
|
3. |
Based on my knowledge, the financial statements, and other financial information included in this report, fairly present in all material respects the financial condition, results of operations and cash flows of the registrant as of, and for, the periods presented in this report; |
|
4. |
The registrant’s other certifying officer and I are responsible for establishing and maintaining disclosure controls and procedures (as defined in Exchange Act Rules 13a-15(e) and 15d-15(e)) for the registrant and internal control over financial reporting (as defined in Exchange Act Rules 13a-15(f) and 15d-15(f)) for the registrant and have: |
|
a) |
Designed such disclosure controls and procedures, or caused such disclosure controls and procedures to be designed under our supervision, to ensure that material information relating to the registrant is made known to us by others within those entities, particularly during the period in which this report is being prepared; |
|
b) |
Designed such internal control over financial reporting, or caused such internal control over financial reporting to be designed under our supervision, to provide reasonable assurance regarding the reliability of financial reporting and the preparation of financial statements for external purposes in accordance with generally accepted accounting principles; |
|
c) |
Evaluated the effectiveness of the registrant’s disclosure controls and procedures and presented in this report our conclusions about the effectiveness of the disclosure controls and procedures, as of the end of the period covered by this report based on such evaluation; and |
|
d) |
Disclosed in this report any change in the registrant’s internal control over financial reporting that occurred during the registrant’s most recent fiscal quarter (the registrant’s fourth fiscal quarter in the case of an annual report) that has materially affected, or is reasonably likely to materially affect, the registrant’s internal control over financial reporting; and |
|
5. |
The registrant’s other certifying officer and I have disclosed, based on our most recent evaluation of internal control over financial reporting, to the registrant’s auditors and the audit committee of the registrant’s board of directors (or persons performing the equivalent functions): |
|
(a) |
All significant deficiencies and material weaknesses in the design or operation of internal control over financial reporting which are reasonably likely to adversely affect the registrant’s ability to record, process, summarize and report financial information; and |
|
(b) |
Any fraud, whether or not material, that involves management or other employees who have a significant role in the registrant’s internal control over financial reporting. |
|
Date: May 16, 2022 |
By: |
/s/ James Caci |
||||
|
James Caci Chief Financial Officer (Principal Financial and Accounting Officer) |
Exhibit 32.1
CERTIFICATION OF THE CHIEF EXECUTIVE OFFICER
PURSUANT TO
18 U.S.C. SECTION 1350,
AS ADOPTED PURSUANT TO
SECTION 906 OF THE SARBANES-OXLEY ACT OF 2002
Pursuant to the requirement set forth in Rule 13a-14(b) of the Securities Exchange Act of 1934, as amended, (the “Exchange Act”) and Section 1350 of Chapter 63 of Title 18 of the United States Code (18 U.S.C. §1350), Tianyi Jiang, Chief Executive Officer of AvePoint, Inc. (the “Company”) hereby certifies that, to the best of his knowledge:
|
1. |
The Company’s Quarterly Report on Form 10-Q for the three months ended March 31, 2022 (the “Report”) fully complies with the requirements of Section 13(a) or 15(d) of the Exchange Act; and |
|
2. |
To my knowledge, the information contained in the Report fairly presents, in all material respects, the financial condition and results of operations of the Company as of and for the period covered by the Report. |
|
Date: May 16, 2022 |
By: |
/s/ Tianyi Jiang |
||||
|
Tianyi Jiang |
||||||
|
Chief Executive Officer |
||||||
|
(Principal Executive Officer) |
Exhibit 32.2
CERTIFICATION OF THE CHIEF FINANCIAL OFFICER
PURSUANT TO
18 U.S.C. SECTION 1350,
AS ADOPTED PURSUANT TO
SECTION 906 OF THE SARBANES-OXLEY ACT OF 2002
Pursuant to the requirement set forth in Rule 13a-14(b) of the Securities Exchange Act of 1934, as amended, (the “Exchange Act”) and Section 1350 of Chapter 63 of Title 18 of the United States Code (18 U.S.C. §1350), Tianyi Jiang, Chief Executive Officer of AvePoint, Inc. (the “Company”) hereby certifies that, to the best of his knowledge:
|
1. |
The Company’s Quarterly Report on Form 10-Q for the three months ended March 31, 2022 (the “Report”) fully complies with the requirements of Section 13(a) or 15(d) of the Exchange Act; and |
|
2. |
To my knowledge, the information contained in the Report fairly presents, in all material respects, the financial condition and results of operations of the Company as of and for the period covered by the Report. |
|
Date: May 16, 2022 |
By: |
/s/ James Caci |
||||
|
James Caci |
||||||
|
Chief Financial Officer |
||||||
|
(Principal Financial and Accounting Officer) |
Serious News for Serious Traders! Try StreetInsider.com Premium Free!
You May Also Be Interested In
- COMPASS SELF STORAGE OPENS STATE-OF-THE-ART WINE STORAGE IN JUPITER, FLORIDA
- OffSec Names Applied Technology Academy Exclusive Black Hat USA Training Partner
- Western Funding Sustains Remarkable Growth Momentum In 2023
Create E-mail Alert Related Categories
SEC FilingsSign up for StreetInsider Free!
Receive full access to all new and archived articles, unlimited portfolio tracking, e-mail alerts, custom newswires and RSS feeds - and more!
