

Form 424B2 MORGAN STANLEY
 Tweet
Tweet Share
SharePricing Supplement No. 5,085
Registration Statement Nos. 333-250103; 333-250103-01
Dated May 16, 2022
Filed Pursuant to Rule 424(b)(2)
Morgan Stanley Finance LLC $15,181,000 Market-Linked Notes
Linked to an Equally-Weighted Basket of Eight Commodities Due May 21, 2024
Fully and Unconditionally Guaranteed by Morgan Stanley
| Investment Description |
These Market-Linked Notes (the “Notes”) are unsecured and unsubordinated debt securities issued by Morgan Stanley Finance LLC (“MSFL”) and are fully and unconditionally guaranteed by Morgan Stanley. At maturity, we will pay per Note the Principal Amount plus a Supplemental Redemption Amount, if any, based on the performance of an equally-weighted basket of physical commodities. If the Basket Performance is positive, the Supplemental Redemption Amount will equal the product of (i) the Principal Amount multiplied by (ii) the Participation Rate of 100% multiplied by (iii) the Basket Performance. The Notes are for investors who are concerned about principal risk, but seek a commodity based-return and who are willing to forgo current income in exchange for the repayment of principal at maturity plus the potential to receive a Supplemental Redemption Amount, if any. Investing in the Notes involves significant risks. The Notes do not pay interest. MSFL will repay your full Principal Amount only if you hold the Notes to maturity. The Notes are notes issued as part of MSFL’s Series A Global Medium-Term Notes program.
All payments are subject to our credit risk. If we default on our obligations, you could lose some or all of your investment. These Notes are not secured obligations and you will not have any security interest in, or otherwise have any access to, any underlying reference asset or assets.
| Features | Key Dates |
|
q Growth Potential — If the Basket Performance is positive, MSFL will repay the Principal Amount of the Notes at maturity and pay a Supplemental Redemption Amount based on the performance of the Basket. The Supplemental Redemption Amount, if any, will equal the Principal Amount multiplied by the Participation Rate multiplied by the Basket Performance. q Repayment of Principal at Maturity — If the Basket Performance is zero or negative, you will be repaid the Principal Amount of your Notes at maturity, but will not receive any return on your investment. The repayment of the Principal Amount applies only if you hold the Notes to maturity. Any payment on the Notes, including any repayment of principal, is subject to our credit risk. |
| Trade Date | May 16, 2022 |
| Original Issue Date | May 19, 2022 |
| Determination Date* | May 16, 2024 |
| Maturity Date* | May 21, 2024 |
| * Subject to adjustment for non-Trading Days or a Market Disruption Event. See “Description of Commodity-Linked Notes—General Terms of the Notes—Some Definitions—“determination date or determination dates”” in the accompanying prospectus supplement for commodity-linked notes. | |
| If the scheduled Determination Date is not a Trading Day or if a Market Disruption Event occurs on that day so that the Determination Date is postponed and falls less than two business days prior to the scheduled Maturity Date, the Maturity Date will be postponed to the second business day following that Determination Date as postponed. | |
NOTICE TO INVESTORS: YOU MAY RECEIVE ONLY YOUR PRINCIPAL AMOUNT AT MATURITY AND YOU MAY NOT RECEIVE ANY RETURN ON THE NOTES. THIS MARKET RISK IS IN ADDITION TO THE CREDIT RISK INHERENT IN PURCHASING A DEBT OBLIGATION OF OURS. YOU SHOULD NOT PURCHASE THE NOTES IF YOU DO NOT UNDERSTAND OR ARE NOT COMFORTABLE WITH THE SIGNIFICANT RISKS INVOLVED IN INVESTING IN THE NOTES. THE NOTES WILL NOT BE LISTED ON ANY SECURITIES EXCHANGE.
YOU SHOULD CAREFULLY CONSIDER THE RISKS DESCRIBED UNDER ‘‘KEY RISKS’’ BEGINNING ON PAGE 6 OF THIS PRICING SUPPLEMENT AND UNDER RISK FACTORS BEGINNING ON PAGE S-24 OF THE ACCOMPANYING PROSPECTUS SUPPLEMENT FOR COMMODITY-LINKED NOTES IN CONNECTION WITH YOUR PURCHASE OF THE NOTES. EVENTS RELATING TO ANY OF THOSE RISKS, OR OTHER RISKS AND UNCERTAINTIES, COULD ADVERSELY AFFECT THE MARKET VALUE OF, AND THE RETURN ON, YOUR NOTES. INVESTING IN THE NOTES IS NOT EQUIVALENT TO INVESTING IN THE BASKET COMMODITIES OR IN FUTURES CONTRACTS OR FORWARD CONTRACTS ON THE BASKET COMMODITIES.
| Note Offering |
These preliminary terms relate to Market-Linked Notes Linked to an Equally-Weighted Basket of Eight Commodities Due May 21, 2024. The Notes are offered at a minimum investment of $1,000, or 1 Note, and integral multiples of $1,000 in excess thereof.
| Basket Commodity | Bloomberg Ticker Symbol* | Weighting | Initial Basket Commodity Price | Participation Rate | CUSIP | ISIN |
| West Texas Intermediate light sweet crude oil futures contracts (“WTI crude oil”) | CL1 | 12.50% | $114.20 | 100% | 61773QVP1 | US61773QVP17 |
| Brent crude oil (“Brent crude oil”) | CO1 | 12.50% | $114.24 | |||
| Natural gas (“Natural gas”) | NG1 | 12.50% | $7.956 | |||
| Corn – CBOT (“corn”) | C 1 | 12.50% | 809.50¢ | |||
| Soybeans – CBOT (“soybeans”) | S 1 | 12.50% | 1,656.50¢ | |||
| Wheat – CBOT (“wheat”) | W 1 | 12.50% | 1,277.50¢ | |||
| Copper grade A (“copper”) | LOCADY | 12.50% | $9,270.00 | |||
| Zinc | LOZSDY | 12.50% | $3,583.50 |
*Bloomberg ticker symbols are being provided for reference purposes only. The Initial Basket Commodity Price was determined and the Final Basket Commodity Price for each Basket Commodity will be determined based on the values published by the relevant exchange and, notwithstanding the Bloomberg ticker symbols provided for reference purposes above, such prices (in the case of WTI crude oil, Brent crude oil, natural gas, corn, soybeans and wheat) may be based on the second nearby month futures contract, as further described under “Final Terms—Commodity Price” on page 4.
See “Additional Information about Morgan Stanley, MSFL and the Notes” on page 2. The Notes will have the terms set forth in the accompanying prospectus supplement for commodity-linked notes and prospectus and this pricing supplement.
Neither the Securities and Exchange Commission nor any other regulatory body has approved or disapproved of these Notes or passed upon the adequacy or accuracy of this pricing supplement or the accompanying prospectus supplement for commodity-linked notes and prospectus. Any representation to the contrary is a criminal offense. The Notes are not deposits or savings accounts and are not insured by the Federal Deposit Insurance Corporation or any other governmental agency or instrumentality, nor are they obligations of, or guaranteed by, a bank.
| Estimated value on the Trade Date | $953.50 per Note. See “Additional Information about Morgan Stanley, MSFL and the Notes” on page 2. | ||
| Price to Public | Underwriting Discount(1) | Proceeds to Us(2) | |
| Per Note | $1,000 | $15 | $985 |
| Total | $15,181,000 | $227,715 | $14,953,285 |
(1) UBS Financial Services Inc., acting as dealer, will receive from Morgan Stanley & Co. LLC, the agent, a fixed sales commission of $15 for each Note it sells. For more information, please see “Supplemental Plan of Distribution; Conflicts of Interest” on page 34 of this pricing supplement.
(2) See “Use of Proceeds and Hedging” on page 34.
The agent for this offering, Morgan Stanley & Co. LLC, is our affiliate and a wholly owned subsidiary of Morgan Stanley. See “Supplemental Plan of Distribution; Conflicts of Interest” beginning on page 34 of this pricing supplement. For additional information, see “Plan of Distribution (Conflicts of Interest)” in the accompanying prospectus supplement for commodity-linked notes.
| Morgan Stanley | UBS Financial Services Inc. |
| Additional Information about Morgan Stanley, MSFL and the Notes |
Morgan Stanley and MSFL have filed a registration statement (including a prospectus, as supplemented by a prospectus supplement for commodity-linked notes) with the SEC for the offering to which this communication relates. In connection with your investment, you should read the prospectus in that registration statement, the prospectus supplement for commodity-linked notes and any other documents relating to this offering that Morgan Stanley and MSFL have filed with the SEC for more complete information about Morgan Stanley, MSFL and this offering. You may get these documents for free by visiting EDGAR on the SEC website at.www.sec.gov. Alternatively, Morgan Stanley, MSFL, any underwriter or any dealer participating in this offering will arrange to send you the prospectus and the prospectus supplement for commodity-linked notes if you so request by calling toll-free 1-(800)-584-6837.
You may access the accompanying prospectus supplement for commodity-linked notes and prospectus on the SEC website at.www.sec.gov as follows:
| t | Prospectus supplement for commodity-linked notes dated November
16, 2020: https://www.sec.gov/Archives/edgar/data/895421/000095010320022219/dp140495_424b2-psclinknote.htm |
| t | Prospectus dated November 16, 2020: https://www.sec.gov/Archives/edgar/data/895421/000095010320022190/dp140485_424b2-base.htm |
References to “MSFL” refer only to MSFL, references to “Morgan Stanley,” refer only to Morgan Stanley and references to “we,” “our” and “us” refer to MSFL and Morgan Stanley collectively. In this document, the “Notes” refers to the Market-Linked Notes that are offered hereby. Also, references to the accompanying “prospectus” and “prospectus supplement for commodity-linked notes” mean the prospectus filed by MSFL and Morgan Stanley dated November 16, 2020 and the prospectus supplement for commodity-linked notes filed by MSFL and Morgan Stanley dated November 16, 2020, respectively.
You should rely only on the information incorporated by reference or provided in this pricing supplement or the accompanying prospectus supplement for commodity-linked notes and prospectus. We have not authorized anyone to provide you with different information. We are not making an offer of these Notes in any state where the offer is not permitted. You should not assume that the information in this pricing supplement or the accompanying prospectus supplement for commodity-linked notes and prospectus is accurate as of any date other than the date on the front of this document.
If the terms discussed in this pricing supplement differ from those discussed in the prospectus supplement for commodity-linked notes or prospectus, the terms contained in this pricing supplement will control.
The Issue Price of each Note is $1,000. This price includes costs associated with issuing, selling, structuring and hedging the Notes, which are borne by you, and, consequently, the estimated value of the Notes on the Trade Date is less than $1,000. We estimate that the value of each Note on the Trade Date is $953.50.
What goes into the estimated value on the Trade Date?
In valuing the Notes on the Trade Date, we take into account that the Notes comprise both a debt component and a performance-based component linked to the Basket Commodities. The estimated value of the Notes is determined using our own pricing and valuation models, market inputs and assumptions relating to the Basket Commodities, instruments based on the Basket Commodities, volatility and other factors including current and expected interest rates, as well as an interest rate related to our secondary market credit spread , which is the implied interest rate at which our conventional fixed rate debt trades in the secondary market.
What determines the economic terms of the Notes?
In determining the economic terms of the Notes, including the Participation Rate, we use an internal funding rate, which is likely to be lower than our secondary market credit spreads and therefore advantageous to us. If the issuing, selling, structuring and hedging costs borne by you were lower or if the internal funding rate were higher, one or more of the economic terms of the Notes would be more favorable to you.
What is the relationship between the estimated value on the Trade Date and the secondary market price of the Notes?
The price at which MS & Co. purchases the Notes in the secondary market, absent changes in market conditions, including those related to the Basket Commodities, may vary from, and be lower than, the estimated value on the Trade Date, because the secondary market price takes into account our secondary market credit spread as well as the bid-offer spread that MS & Co. would charge in a secondary market transaction of this type and other factors.
MS & Co. currently intends, but is not obligated, to make a market in the Notes and, if it once chooses to make a market, may cease doing so at any time.
2
| Investor Suitability | |
| The Notes may be suitable for you if: | The Notes may not be suitable for you if: |
|
¨ You fully understand the risks inherent in an investment in the Notes, including the risk of receiving little or no return on your investment.
¨ You believe that the value of the Basket will increase over the term of the Notes.
¨ You can tolerate receiving only your principal amount at maturity if the value of the Basket remains unchanged or decreases over the term of the Notes.
¨ You can tolerate fluctuations in the price of the Notes prior to maturity that may cause the market value of the Notes to decline below the price you paid for your Notes.
¨ You do not seek current income from your investment.
¨ You understand and accept the risks associated with the Basket Commodities.
¨ You are willing to hold the Notes to maturity, as set forth on the cover hereof, and accept that there may be little or no secondary market for the Notes.
¨ You are willing to assume our credit risk, and understand that if we default on our obligations you may not receive any amounts due to you including any repayment of principal. |
¨ You do not fully understand the risks inherent in an investment in the Notes, including the risk of receiving little or no return on your investment.
¨ You believe that the value of the Basket will decrease over the term of the Notes.
¨ You cannot tolerate the possibility of receiving only your principal amount at maturity if the value of the Basket remains unchanged or decreases over the term of the Notes.
¨ You cannot tolerate fluctuations in the price of the Notes prior to maturity that may cause the market value of the Notes to decline below the price you paid for your Notes.
¨ You seek current income from your investment.
¨ You do not understand or are not willing to accept the risks associated with the Basket Commodities.
¨ You are unable or unwilling to hold the Notes to maturity, as set forth on the cover hereof, or you seek an investment for which there will be an active secondary market.
¨ You are not willing or are unable to assume our credit risk for any payment on the Notes, including any repayment of principal. |
The investor suitability considerations identified above are not exhaustive. Whether or not the Notes are a suitable investment for you will depend on your individual circumstances and you should reach an investment decision only after you and your investment, legal, tax, accounting and other advisors have carefully considered the suitability of an investment in the Notes in light of your particular circumstances. You should also review carefully the sections entitled “Key Risks” beginning on page 6 of this pricing supplement and “Risk Factors” beginning on S-24 of the accompanying prospectus supplement for commodity-linked notes for risks related to an investment in the Notes. For more information about the Basket Commodities, see the information set forth under “The Basket Commodities” on page 17.
3
| Final Terms |
| Issuer | Morgan Stanley Finance LLC |
| Guarantor | Morgan Stanley |
| Issue Price (per Note) | $1,000 (1 Note) |
| Principal Amount | $1,000 per Note |
| Term | Approximately 24 months |
| Basket | The Notes are linked to an equally-weighted basket consisting of the following Basket Commodities: |
| Basket Commodity | Weighting | Initial Basket Commodity Price |
| West Texas Intermediate light sweet crude oil futures contracts (“WTI crude oil”) | 12.50% | $114.20 |
| Brent crude oil (“Brent crude oil”) | 12.50% | $114.24 |
| Natural gas (“Natural gas”) | 12.50% | $7.956 |
| Corn – CBOT (“corn”) | 12.50% | 809.50¢ |
| Soybeans – CBOT (“soybeans”) | 12.50% | 1,656.50¢ |
| Wheat – CBOT (“wheat”) | 12.50% | 1,277.50¢* |
| Copper grade A (“copper”) | 12.50% | $9,270.00 |
| Zinc | 12.50% | $3,583.50 |
| * Determined in respect of the Trade Date in accordance with “Description of Commodity-Linked Notes—General Terms of the Notes—Some Definitions—“initial commodity price”” in the accompanying prospectus supplement. | ||
| Payment at Maturity (per Note) |
MSFL will pay you a cash payment at maturity as follows: $1,000 + Supplemental Redemption Amount, if any In no event will the Payment at Maturity be less than $1,000. |
| Supplemental Redemption Amount | $1,000 × Participation Rate × Basket Performance; provided that the Supplemental Redemption Amount will not be less than zero. |
| Participation Rate | 100% |
| Basket Performance | The sum of the Commodity Performance Values of each of the Basket Commodities |
| Commodity Performance Value |
With respect to each Basket Commodity: [(Final Basket Commodity Price – Initial Basket Commodity Price) / Initial Basket Commodity Price] × Weighting |
| Initial Basket Commodity Price | The Commodity Price for the applicable Basket Commodity on the Trade Date, with the exception of wheat, as set forth under “Basket—Initial Basket Commodity Price” above. |
| Final Basket Commodity Price | The Commodity Price for the applicable Basket Commodity on the Determination Date, subject to adjustment for each Basket Commodity individually in the event of a Market Disruption Event or a non-Trading Day. |
| Determination Date | May 16, 2024, subject to adjustment for non-Trading Days or a Market Disruption Event |
| Commodity Price |
For any trading day:
WTI crude oil: the official settlement price per barrel of West Texas Intermediate light sweet crude oil on the relevant exchange of the first nearby month futures contract, stated in U.S. dollars, as made public by the relevant exchange on such date, provided that if such date falls on the last trading day of such futures contract (all pursuant to the rules of the relevant exchange), then the second nearby month futures contract on such date. |
|
Brent crude oil: the official settlement price per barrel of Brent blend crude oil on the relevant exchange of the first nearby month futures contract, stated in U.S. dollars, as made public by the relevant exchange on such date, provided that if such date falls on the last trading day of such futures contract (all pursuant to the rules of the relevant exchange), then the second nearby month futures contract on such date.
Natural gas: the official settlement price per one million British thermal units of natural gas on the relevant exchange of the first nearby month futures contract, stated in U.S. dollars, as made public by the relevant exchange on such date, provided that if such date falls on the last trading day of such futures contract (all pursuant to the rules of the relevant exchange), then the second nearby month futures contract on such date.
Corn: the official settlement price per bushel of deliverable-grade corn on the relevant exchange of the first nearby month futures contract (or, in the case of any trading day after the date of the last trade of the options contract (if there is more than one options contract, then the options contract with the latest date) pertaining to the first nearby month futures contract, the second nearby month futures contract), stated in U.S. cents, as made public by the relevant exchange on such date.
Soybeans: the official settlement price per bushel of deliverable-grade soybeans on the relevant exchange of the first nearby month futures contract (or, in the case of any trading day after the date of the last trade of the options contract (if there is more than one options contract, then the options contract with the latest date) pertaining to the first nearby month futures contract, the second nearby month futures contract), stated in U.S. cents, as made public by relevant exchange on such date.
Wheat: the official settlement price per bushel of deliverable-grade wheat on the relevant exchange of the first nearby month futures contract (or, in the case of any trading day after the date of the last trade of the options contract (if there is more than one options contract, then the options contract with the latest date) pertaining to the first nearby month futures contract, the second nearby month futures contract), stated in U.S. cents, as made public by the relevant exchange on such date.
Copper: the official cash offer price per tonne of copper grade A on the relevant exchange for the spot market, stated in U.S. dollars, as determined by the relevant exchange on such date.
Zinc: the official cash offer price per tonne of special high grade zinc on the relevant exchange for the spot market, stated in U.S. dollars, as determined by the relevant exchange on such date. | |
| Maturity Date | May 21, 2024, subject to postponement in the event of a postponement of the Determination Date. |
| CUSIP / ISIN | 61773QVP1 / US61773QVP17 |
| Calculation Agent | Morgan Stanley Capital Group Inc. (“MSCG”) |
4
| Investment Timeline |
|
Trade Date
|
The Initial Basket Commodity Price for each Basket Commodity was determined.
| |
 |
The Final Basket Commodity Price for each Basket Commodity is determined on the Determination Date and the Basket Performance is calculated.
| |
|
Maturity Date
|
MSFL will pay you a cash payment at maturity as follows:
$1,000 + Supplemental Redemption Amount, if any
In no event will the Payment at Maturity per $1,000 Principal Amount be less than $1,000
| |
Investing in the Notes involves significant risks. The Notes do not pay interest. MSFL will repay your full principal amount only if you hold the Notes to maturity. All payments are subject to our credit risk.
5
| Key Risks |
An investment in the Notes involves significant risks. The material risks that apply to the Notes are summarized here, but we urge you to also read the “Risk Factors” section in the accompanying prospectus and the accompanying prospectus supplement for commodity-linked notes. You should also consult your investment, legal, tax, accounting and other advisers in connection with your investment in the Notes.
Risks Relating to an Investment in the Notes
| ¨ | The Notes may not pay more than the Principal Amount at maturity — If the Basket Performance is less than or equal to 0%, you will receive only the Principal Amount of $1,000 for each Note you hold at maturity. As the Notes do not pay any interest, if the Basket does not appreciate sufficiently over the term of the Notes, the overall return on the Notes (the effective yield to maturity) may be less than the amount that would be paid on a conventional debt security of ours of comparable maturity. The Notes are for investors who are concerned about principal risk, but seek a commodity based-return and who are willing to forgo current income in exchange for the repayment of principal at maturity plus the potential to receive a Supplemental Redemption Amount, if any. |
| ¨ | No interest payments — MSFL will not make any interest payments with respect to the Notes. |
| ¨ | Repayment of the Principal Amount applies only at maturity — You should be willing to hold your Notes to maturity. If you are able to sell your Notes in the secondary market, you may have to sell them at a loss even if the prices of the Basket Commodities have increased from the Initial Basket Commodity Prices. You will receive the Principal Amount of the Notes from MSFL only at maturity, subject to our creditworthiness. |
| ¨ | The market price of the Notes will be influenced by many unpredictable factors — Several factors, many of which are beyond our control, will influence the value of the Notes in the secondary market and the price at which we or certain of our affiliates, including Morgan Stanley & Co. LLC (“MS & Co.”), may be willing to purchase or sell the Notes in the secondary market, including: the price of each of the Basket Commodities at any time and, in particular, on the Determination Date, the volatility (frequency and magnitude of changes in value) of each of the Basket Commodities, interest and yield rates in the market, geopolitical conditions and economic, financial, political, regulatory or judicial events that affect the Basket Commodities or commodities markets in general and which may affect the Final Basket Commodity Prices of the Basket Commodities, trends of supply and demand for the Basket Commodities, as well as the effects of speculation or any government activity that could affect the commodities markets, the time remaining until the Notes mature and any actual or anticipated changes in our credit ratings or credit spreads. In addition, the commodities markets are subject to temporary distortions or other disruptions due to various factors, including lack of liquidity, participation of speculators and government intervention. As a result, the market value of the Notes will vary and may be less than the Issue Price at any time prior to maturity. |
| ¨ | The Notes are subject to our credit risk, and any actual or anticipated changes to our credit ratings or our credit spreads may adversely affect the market value of the Notes — Investors are dependent on our ability to pay all amounts due on the Notes at maturity, and, therefore, you are subject to our credit risk and to changes in the market’s view of our creditworthiness. If we default on our obligations under the Notes, your investment would be at risk and you could lose some or all of your investment. As a result, the market value of the Notes prior to maturity will be affected by changes in the market’s view of our creditworthiness. Any actual or anticipated decline in our credit ratings or increase in our credit spreads charged by the market for taking our credit risk is likely to adversely affect the market value of the Notes. |
| ¨ | As a finance subsidiary, MSFL has no independent operations and will have no independent assets — As a finance subsidiary, MSFL has no independent operations beyond the issuance and administration of its securities and will have no independent assets available for distributions to holders of MSFL securities if they make claims in respect of such securities in a bankruptcy, resolution or similar proceeding. Accordingly, any recoveries by such holders will be limited to those available under the related guarantee by Morgan Stanley and that guarantee will rank pari passu with all other unsecured, unsubordinated obligations of Morgan Stanley. Holders will have recourse only to a single claim against Morgan Stanley and its assets under the guarantee. Holders of securities issued by MSFL should accordingly assume that in any such proceedings they would not have any priority over and should be treated pari passu with the claims of other unsecured, unsubordinated creditors of Morgan Stanley, including holders of Morgan Stanley-issued securities. |
| ¨ | The amount payable on the Notes is not linked to the price of the Basket Commodities at any time other than the Determination Date — The Final Basket Commodity Price for each Basket Commodity will be the Commodity Price for such Basket Commodity on the Determination Date, subject to postponement for non-Trading Days and certain Market Disruption Events. Even if the prices of the Basket Commodities appreciate prior to the Determination Date but then drop by the Determination Date, the Payment at Maturity will be less, and may be significantly less, than it would have been had the Payment at Maturity been linked to the price of the Basket Commodities prior to such drop. Although the actual prices of the Basket Commodities on the stated Maturity Date or at other times during the term of the Notes may be higher than |
6
the Final Basket Commodity Prices, the Payment at Maturity will be based solely on the Commodity Prices on the Determination Date.
| ¨ | The rate we are willing to pay for securities of this type, maturity and issuance size is likely to be lower than the rate implied by our secondary market credit spreads and advantageous to us. Both the lower rate and the inclusion of costs associated with issuing, selling, structuring and hedging the Notes in the Issue Price reduce the economic terms of the Notes, cause the estimated value of the Notes to be less than the Issue Price and will adversely affect secondary market prices — Assuming no change in market conditions or any other relevant factors, the prices, if any, at which dealers, including MS & Co., may be willing to purchase the Notes in secondary market transactions will likely be significantly lower than the Issue Price, because secondary market prices will exclude the issuing, selling, structuring and hedging-related costs that are included in the Issue Price and borne by you and because the secondary market prices will reflect our secondary market credit spreads and the bid-offer spread that any dealer would charge in a secondary market transaction of this type as well as other factors. |
The inclusion of the costs of issuing, selling, structuring and hedging the Notes in the Issue Price and the lower rate we are willing to pay as issuer make the economic terms of the Notes less favorable to you than they otherwise would be.
| ¨ | The estimated value of the Notes is determined by reference to our pricing and valuation models, which may differ from those of other dealers and is not a maximum or minimum secondary market price — These pricing and valuation models are proprietary and rely in part on subjective views of certain market inputs and certain assumptions about future events, which may prove to be incorrect. As a result, because there is no market-standard way to value these types of securities, our models may yield a higher estimated value of the Notes than those generated by others, including other dealers in the market, if they attempted to value the Notes. In addition, the estimated value on the Trade Date does not represent a minimum or maximum price at which dealers, including MS & Co., would be willing to purchase your Notes in the secondary market (if any exists) at any time. The value of your Notes at any time after the date of this pricing supplement will vary based on many factors that cannot be predicted with accuracy, including our creditworthiness and changes in market conditions. See also “The market price of the Notes will be influenced by many unpredictable factors” above. |
| ¨ | Investing in the Notes is not equivalent to investing in the Basket Commodities or in futures contracts or forward contracts on the Basket Commodities –- By purchasing the Notes, you do not purchase any entitlement to any of the Basket Commodities or futures contracts or forward contracts on any of the Basket Commodities. Further, by purchasing the Notes, you are taking credit risk to us and not to any counter-party to futures contracts or forward contracts on the Basket Commodities. |
| ¨ | The Notes will not be listed on any securities exchange and secondary trading may be limited — The Notes will not be listed on any securities exchange. Therefore, there may be little or no secondary market for the Notes. MS & Co. currently intends, but is not obligated, to make a market in the Notes and, if it once chooses to make a market, may cease doing so at any time. When it does make a market, it will generally do so for transactions of routine secondary market size at prices based on its estimate of the current value of the Notes, taking into account its bid/offer spread, our credit spreads, market volatility, the notional size of the proposed sale, the cost of unwinding any related hedging positions, the time remaining to maturity and the likelihood that it will be able to resell the Notes. Even if there is a secondary market, it may not provide enough liquidity to allow you to trade or sell the Notes easily. Since other broker-dealers may not participate significantly in the secondary market for the Notes, the price at which you may be able to trade your Notes is likely to depend on the price, if any, at which MS & Co. is willing to transact. If, at any time, MS & Co. were to cease making a market in the Notes, it is likely that there would be no secondary market for the Notes. Accordingly, you should be willing to hold your Notes to maturity. |
| ¨ | Hedging and trading activity by our affiliates could potentially adversely affect the value of the Notes — One or more of our affiliates and/or third-party brokers expect to carry out hedging activities related to the Notes (and to other instruments linked to the Basket Commodities), including trading in the Basket Commodities or futures contracts or forward contracts on the Basket Commodities, as well as in other instruments related or linked to the Basket Commodities. As a result, these entities may be unwinding or adjusting hedge positions during the term of the Notes, and the hedging strategy may involve greater and more frequent dynamic adjustments to the hedge as the Determination Date approaches. MSCG and some of our other affiliates also trade the Basket Commodities and other financial instruments related to the Basket Commodities on a regular basis as part of their general broker-dealer, commodity trading, proprietary trading and other businesses. Any of these hedging or trading activities on or prior to the Trade Date could potentially increase the Initial Basket Commodity Prices and, therefore, could increase the prices at or above which the Basket Commodities must close on the Determination Date before you would receive at maturity a payment that exceeds the Principal Amount of the Notes. Additionally, such hedging or trading activities during the term of the Notes, including on the Determination Date, could adversely affect the Basket Commodity Prices on the Determination Date and, accordingly, the amount of cash you will receive at maturity. |
| ¨ | Potential conflict of interest — As Calculation Agent, MSCG will determine the Initial Basket Commodity Price, the Final Basket Commodity Price and the Commodity Performance Value for each Basket Commodity, the Basket Performance, the |
7
Supplemental Redemption Amount, if any, and whether a Market Disruption Event has occurred. Additionally, the Calculation Agent will calculate the amount of cash you will receive at maturity. Moreover, certain determinations made by MSCG, in its capacity as Calculation Agent, may require it to exercise discretion and make subjective judgments, such as with respect to the occurrence or non-occurrence of Market Disruption Events or calculation of any Commodity Price in the event of a Market Disruption Event. These potentially subjective determinations may adversely affect the payout to you at maturity. For further information regarding these types of determinations, see “Payment at Maturity—Calculation Agent and Calculations” and “—Alternate Exchange Calculation in the Case of an Event of Default” and related definitions in the accompanying prospectus supplement. In addition, MS & Co. has determined the estimated value of the Notes on the Trade Date.
| ¨ | Potentially inconsistent research, opinions or recommendations by Morgan Stanley, UBS or our or their respective affiliates — Morgan Stanley, UBS and our or their respective affiliates publish research from time to time on financial markets and other matters that may influence the value of the Notes, or express opinions or provide recommendations that are inconsistent with purchasing or holding the Notes. Any research, opinions or recommendations expressed by Morgan Stanley, UBS or our or their respective affiliates may not be consistent with each other and may be modified from time to time without notice. Investors should make their own independent investigation of the merits of investing in the Notes and the Basket Commodities to which the Notes are linked. |
Risks Relating to the Basket Commodities
| ¨ | Changes in the price of one or more of the Basket Commodities may offset each other — Price movements in the Basket Commodities may not correlate with each other. At a time when the price of one Basket Commodity increases, the price of the other Basket Commodities may not increase as much, or may even decline. Therefore, in calculating the performance of the Basket Commodities on the Determination Date, increases in the price of one Basket Commodity may be moderated, or wholly offset, by lesser increases or declines in the price of the other Basket Commodities. |
| ¨ | Specific commodities’ prices are volatile and are affected by numerous factors specific to each market — Investments, such as the Notes, linked to the prices of commodities, such as the Basket Commodities, are subject to sharp fluctuations in the prices of commodities over short periods of time for a variety of factors, including the principal factors set out below: |
| ¨ | WTI crude oil. Demand for refined petroleum products by consumers, as well as by the agricultural, manufacturing and transportation industries, affects the price of crude oil. Crude oil’s end-use as a refined product is often as transport fuel, industrial fuel and in-home heating fuel. Potential for substitution in most areas exists, although considerations including relative cost often limit substitution levels. Because the precursors of demand for petroleum products are linked to economic activity, demand will tend to reflect economic conditions. Demand is also influenced by government regulations, such as environmental or consumption policies. In addition to general economic activity and demand, prices for crude oil are affected by political events, labor activity, developments in production technology such as fracking and, in particular, direct government intervention (such as embargos) or supply disruptions in major oil producing regions of the world. Such events tend to affect oil prices worldwide, regardless of the location of the event. Supply for crude oil may increase or decrease depending on many factors. These include production decisions by the Organization of the Petroleum Exporting Countries and other crude oil producers. In the event of sudden disruptions in the supplies of oil, such as those caused by war, natural events, accidents, acts of terrorism or cyberattacks, prices of oil futures contracts could become extremely volatile and unpredictable. Also, sudden and dramatic changes in the futures market may occur, for example, upon a cessation of hostilities that may exist in countries producing oil, the introduction of new or previously withheld supplies into the market or the introduction of substitute products or commodities. WTI crude oil is also subject to the risk that it has demonstrated a lack of correlation with world crude oil prices due to structural differences between the U.S. market for crude oil and the international market for crude oil. As a result, the price of WTI crude oil may be more volatile than world crude oil prices generally. |
In addition, the prices of WTI crude oil futures contracts may be near zero, zero or negative, which can occur rapidly and unexpectedly. For example, in April 2020, a collapse of demand for fuel contributed to an oversupply of crude oil that rapidly filled most available oil storage facilities. Storage shortages meant that market participants that had contracted to buy and take delivery of crude oil were at risk of default under the terms of the May 2020 NYMEX WTI crude oil futures contract. The scarcity of storage resulted in some market participants selling their futures contracts at a negative price (effectively paying another market participant to accept delivery of the crude oil referenced by the relevant contracts). As a result, for the first time in history, crude oil futures contracts traded below zero. On April 20, 2020, the last trading day before expiration of the May 2020 WTI crude oil futures contract, prices of that contract fell to negative $37.63. See “The Basket Commodities.”
| ¨ | Brent crude oil. Demand for refined petroleum products by consumers, as well as by the agricultural, manufacturing and transportation industries, affects the price of crude oil. Crude oil’s end-use as a refined product is often as transport fuel, industrial fuel and in-home heating fuel. Potential for substitution in most areas exists, although considerations including relative cost often limit substitution levels. Because the precursors of demand for petroleum products are linked to economic activity, demand will tend to reflect economic conditions. Demand is also influenced by government regulations, such as environmental or consumption policies. In addition to general economic activity and demand, |
8
prices for crude oil are affected by political events, labor activity, developments in production technology such as fracking and, in particular, direct government intervention (such as embargos) or supply disruptions in major oil producing regions of the world. Such events tend to affect oil prices worldwide, regardless of the location of the event. Supply for crude oil may increase or decrease depending on many factors. These include production decisions by the Organization of the Petroleum Exporting Countries and other crude oil producers. In the event of sudden disruptions in the supplies of oil, such as those caused by war, natural events, accidents, acts of terrorism or cyberattacks, prices of oil futures contracts could become extremely volatile and unpredictable. Also, sudden and dramatic changes in the futures market may occur, for example, upon a cessation of hostilities that may exist in countries producing oil, the introduction of new or previously withheld supplies into the market or the introduction of substitute products or commodities. The price of Brent crude oil futures has experienced very severe price fluctuations over the recent past and there can be no assurance that this extreme price volatility will not continue in the future. See “The Basket Commodities.”
| ¨ | Natural gas. Natural gas is used primarily for residential and commercial heating and in the production of electricity. Natural gas has also become an increasingly popular source of energy in the United States, both for consumers and industry. However, because natural gas can be used as a substitute for coal and oil in certain circumstances, the price of coal and oil influence the price of natural gas. The level of global industrial activity influences the demand for natural gas. The demand for natural gas has traditionally been cyclical, with higher demand during the winter months and lower demand during relatively warmer summer months. Seasonal temperatures in countries throughout the world can also heavily influence the demand for natural gas. The world’s supply of natural gas is concentrated in the former Soviet Union, the Middle East, Europe and Africa. In general, the supply of natural gas is based on competitive market forces. Inadequate supply at any one time leads to price increases, which signal to production companies the need to increase the supply of natural gas to the market. The ability of production companies to supply natural gas, however, is dependent on a number of factors. Factors that affect the short term supply of natural gas include the availability of skilled workers and equipment, permitting and well development, as well as weather and delivery disruptions (e.g., hurricanes, labor strikes and wars). In addition, production companies face more general barriers to their ability to increase the supply of natural gas, including access to land, the expansion of pipelines and the financial environment. These factors, which are not exhaustive, are interrelated and can have complex and unpredictable effects on the supply for, and the price of, natural gas. |
| ¨ | Corn. The demand for corn is in part linked to the development of industrial and energy uses for corn. This includes the use of corn in the production of ethanol. The demand for corn is also affected by the production and profitability of the pork and poultry sectors, which use corn for feed. Negative developments in those industries may lessen the demand for corn. For example, if avian flu were to have a negative effect on world poultry markets, the demand for corn might decrease. The supply of corn is dependent on many factors including weather patterns, government regulation, the price of fuel and fertilizers and the current and previous price of corn. The United States is the world’s largest supplier of corn, followed by China and Brazil. The supply of corn is particularly sensitive to weather patterns in the United States and China. In addition, technological advances could lead to increases in worldwide production of corn and corresponding decreases in the price of corn. |
| ¨ | Soybeans. Demand for soybeans is in part linked to the development of agricultural, industrial and energy uses for soybeans. In addition, prices for soybeans are affected by governmental programs and policies regarding agriculture and trade specifically, and trade, fiscal and monetary issues, more generally. Soybean prices are also affected by extrinsic factors such as weather, crop yields, natural disasters, pestilence, technological developments, wars and political and civil upheavals. Soy biodiesel, animal agriculture, vegetable oil, edible soybean oil and new industrial uses are examples of major areas that may impact worldwide soybean demand. In addition, substitution of other commodities for soybeans could also impact the price of soybeans. The supply of soybeans is particularly sensitive to weather patterns such as floods, drought and freezing conditions, planting decisions and the price of fuel, seeds and fertilizers. In addition, technological advances and scientific developments could lead to increases in worldwide production of soybeans and corresponding decreases in the price of soybeans. The United States, Argentina and Brazil are the three largest suppliers of soybean crops. |
| ¨ | Wheat. Wheat prices are primarily affected by weather and crop growing conditions generally and the global demand for and supply of grain, which are driven by global grain production, population growth and economic activity. Demand for wheat is in part linked to the development of agricultural, industrial and energy uses for wheat including the use of wheat for the production of animal feed and bioethanol, which may have a major impact on worldwide demand for wheat. In addition, prices for wheat are affected by governmental and intergovernmental programs and policies regarding trade, agriculture, and energy and, more generally, regarding fiscal and monetary issues. Wheat prices may also be influenced by or dependent on retail prices, social trends, lifestyle changes and market power. Substitution of other commodities for wheat could also impact the price of wheat. The supply of wheat is particularly sensitive to weather patterns such as floods, drought and freezing conditions, planting decisions, the price of fuel, seeds and fertilizers and the current and previous price of wheat. In addition, technological advances and scientific developments could lead to increases in worldwide production of wheat and corresponding decreases in the price of wheat. Extrinsic factors affecting wheat prices include natural disasters, pestilence, wars and political and civil upheavals. China, India and the United States are the three largest suppliers of wheat crops. |
9
| ¨ | Copper. Demand for copper is significantly influenced by the level of global industrial economic activity. Industrial sectors which are particularly important to demand for copper include the electrical and construction sectors. In recent years demand has been supported by strong consumption from newly industrializing countries due to their copper-intensive economic growth and infrastructure development. An additional, but highly volatile, component of demand is adjustments to inventory in response to changes in economic activity and/or pricing levels. There are substitutes for copper in various applications. Their availability and price will also affect demand for copper. The main sources of copper are mines in Latin America and Eastern Europe and copper is refined mainly in Latin America, Australia and Asia. The supply of copper is also affected by current and previous price levels, which will influence investment decisions in new smelters. In previous years, copper supply has been affected by strikes, financial problems and terrorist activity. It is not possible to predict the aggregate effect of all or any combination of these factors. See “The Basket Commodities.” |
| ¨ | Zinc. Demand for zinc is significantly influenced by the level of global industrial economic activity. The galvanized steel industrial sector is particularly important to demand for zinc given that the use of zinc in the manufacture of galvanized steel accounts for a significant percentage of worldwide zinc demand. The galvanized steel sector is in turn heavily dependent on the automobile and construction sectors. Growth in the production of galvanized steel will drive zinc demand. An additional, but highly volatile, component of demand is adjustments to inventory in response to changes in economic activity and/or pricing levels. The supply of zinc concentrate (the raw material) is dominated by Australia, North America and Latin America. The supply of zinc is also affected by current and previous price levels, which will influence investment decisions in new mines and smelters. |
Additionally, recently, prior to and since Russia’s further invasion of Ukraine, the prices of oil and wheat, including the prices of WTI crude oil futures contracts, Brent crude oil futures contracts and wheat futures contracts, have been volatile and increased significantly. This conflict has led to disruptions in the supply of oil and the supply of wheat and caused fluctuations in the price of oil and the price of wheat, and changing geopolitical conditions and political events in Europe, the Middle East and elsewhere are likely to cause continued volatility in the price of oil and the price of wheat. In addition, on March 8, 2022, the U.S. Government issued an executive order banning the import of Russian oil to the United States. The U.S. Congress has also passed legislation to ban imports of Russian oil. These actions, and similar governmental, regulatory or legislative actions in the United States or in other jurisdictions, including, without limitation, sanctions-related actions by the U.S. or foreign governments, could cause prices of oil futures contracts and wheat futures contracts to become even more volatile and unpredictable. Any of these developments could adversely affect the price of WTI crude oil futures, Brent crude oil futures and wheat futures, and, therefore, the value of the Notes and the Payment at Maturity.
| ¨ | Suspensions or disruptions of market trading in commodity and related futures markets may adversely affect the price of the Notes — The commodity markets are subject to temporary distortions or other disruptions due to various factors, including the lack of liquidity in the markets, the participation of speculators and government regulation and intervention. In addition, U.S. futures exchanges and some foreign exchanges have regulations that limit the amount of fluctuation in futures contract prices which may occur during a single business day. These limits are generally referred to as “daily price fluctuation limits” and the maximum or minimum price of a contract on any given day as a result of these limits is referred to as a “limit price.” Once the limit price has been reached in a particular contract, no trades may be made at a different price. Limit prices have the effect of precluding trading in a particular contract or forcing the liquidation of contracts at disadvantageous times or prices. These circumstances could adversely affect the prices of some of the Basket Commodities and, therefore, the value of the Notes. |
| ¨ | There are risks relating to the trading of metals on the London Metal Exchange — The official cash offer price of copper is determined by reference to the per unit U.S. dollar cash offer prices of contracts traded on the London Metal Exchange, which we refer to as the LME. The LME is a principals’ market which operates in a manner more closely analogous to the over-the-counter physical commodity markets than regulated futures markets. For example, there are no daily price limits on the LME, which would otherwise restrict the extent of daily fluctuations in the prices of LME contracts. In a declining market, therefore, it is possible that prices would continue to decline without limitation within a trading day or over a period of trading days. In addition, a contract may be entered into on the LME calling for delivery on any day from one day to three months following the date of such contract and for monthly delivery in any of the next 16 to 24 months (depending on the commodity) following such third month, in contrast to trading on futures exchanges, which call for delivery in stated delivery months. As a result, there may be a greater risk of a concentration of positions in LME contracts on particular delivery dates, which in turn could cause temporary aberrations in the prices of LME contracts for certain delivery dates. If such aberrations occur on any Determination Date, the per unit U.S. dollar cash offer prices used to determine the official cash offer price of copper, and consequently, your Payment at Maturity, if any, could be adversely affected. |
| ¨ | An investment linked to commodity futures contracts is not equivalent to an investment linked to the spot prices of physical commodities — The Notes have returns based on the change in price of futures contracts on WTI crude oil, Brent crude oil, natural gas, corn, soybeans and wheat, not the change in the spot price of actual physical commodities to which such futures contracts relate. The price of a futures contract reflects the expected value of the commodity upon delivery in the future, whereas the price of a physical commodity reflects the value of such commodity upon immediate delivery, which is referred to as the spot price. Several factors can result in differences between the price |
10
of a commodity futures contract and the spot price of a commodity, including the cost of storing such commodity for the length of the futures contract, interest costs related to financing the purchase of such commodity and expectations of supply and demand for such commodity. While the changes in the price of a futures contract are usually correlated with the changes in the spot price, such correlation is not exact. In some cases, the performance of a commodity futures contract can deviate significantly from the spot price performance of the related underlying commodity, especially over longer periods of time. Accordingly, investments linked to the return of commodities futures contracts may underperform similar investments that reflect the spot price return on physical commodities.
| ¨ | Differences between futures prices and the spot prices of the physical commodities which, in part, compose the Basket may decrease the amount payable at maturity — The Commodity Prices that are used to determine the Initial Basket Commodity Prices and the Final Basket Commodity Prices for the physical commodities which, in part, compose the Basket and, therefore, the Payment at Maturity on the Notes are determined by reference to the settlement prices of the first nearby month futures contract for each such commodity on the Trade Date and Determination Date, respectively, provided that if such date falls on the last trading day of such futures contract, then the second nearby month futures contract on such date, and will not therefore reflect the spot prices of such physical commodities on such dates. The market for futures contracts on the Basket Commodities has experienced periods of backwardation, in which futures prices are lower than the spot price, and periods of contango, in which futures prices are higher than the spot price. If the contract for any Basket Commodity is in contango on the Trade Date or in backwardation on the Determination Date, the Payment at Maturity payable, if any, on the Maturity Date, may be less than if the Initial Basket Commodity Price or the Final Basket Commodity Price for such Basket Commodity, respectively, were determined with reference to the spot price. |
| ¨ | Legal and regulatory changes could adversely affect the return on and value of your Notes — Futures contracts and options on futures contracts, including those related to the Basket Commodities, are subject to extensive statutes, regulations, and margin requirements. The Commodity Futures Trading Commission, commonly referred to as the “CFTC,” and the exchanges on which such futures contracts trade, are authorized to take extraordinary actions in the event of a market emergency, including, for example, the retroactive implementation of speculative position limits or higher margin requirements, the establishment of daily limits and the suspension of trading. Furthermore, certain exchanges have regulations that limit the amount of fluctuations in futures contract prices that may occur during a single five-minute trading period. These limits could adversely affect the market prices of relevant futures and options contracts and forward contracts. The regulation of commodity transactions in the U.S. is subject to ongoing modification by government and judicial action. In addition, various non-U.S. governments have expressed concern regarding the disruptive effects of speculative trading in the commodity markets and the need to regulate the derivative markets in general. The effect on the value of the Notes of any future regulatory change is impossible to predict, but could be substantial and adverse to the interests of holders of the Notes. |
For example, the Dodd-Frank Act, which was enacted on July 21, 2010, requires the CFTC to establish limits on the amount of positions that may be held by any person in certain commodity futures contracts and swaps, futures and options that are economically equivalent to such contracts. While the effects of these or other regulatory developments are difficult to predict, when adopted, such rules may have the effect of making the markets for commodities, commodity futures contracts, options on futures contracts and other related derivatives more volatile and over time potentially less liquid. Such restrictions may force market participants, including us and our affiliates, or such market participants may decide, to sell their positions in such futures contracts and other instruments subject to the limits. If this broad market selling were to occur, it would likely lead to declines, possibly significant declines, in commodity prices, in the price of such commodity futures contracts or instruments and potentially, the value of the Notes.
11
| Hypothetical Payments on the Notes at Maturity |
These examples are based on hypothetical terms. The actual terms are set forth on the cover of this pricing supplement.
The below scenario analysis and examples are provided for illustrative purposes only and are purely hypothetical. They do not purport to be representative of every possible scenario concerning increases or decreases in the price of each of the Basket Commodities relative to the respective Initial Basket Commodity Price. We cannot predict the Final Basket Commodity Price of any Basket Commodity on the Determination Date. You should not take the scenario analysis and these examples as an indication or assurance of the expected performance of the Basket Commodities. The numbers set forth in the examples below have been rounded for ease of analysis. The following scenario analysis and examples illustrate the Payment at Maturity for a $1,000 Principal Amount of Notes on a hypothetical offering of the Notes, based on the following terms:
| Investment term: | Approximately 24 months |
| Principal amount: | $1,000 |
| Participation Rate | 100% |
The table below illustrates the Payment at Maturity for a hypothetical range of Basket Performance and does not cover the complete range of possible payouts at maturity.
| Basket Performance | Principal Amount | Supplemental Redemption Amount | Payment at Maturity | Return on $1,000 Note(1) |
| 100.0% | $1,000 | $1,000 | $2,000 | 100.0% |
| 90.0% | $1,000 | $900 | $1,900 | 90.0% |
| 80.0% | $1,000 | $800 | $1,800 | 80.0% |
| 70.0% | $1,000 | $700 | $1,700 | 70.0% |
| 60.0% | $1,000 | $600 | $1,600 | 60.0% |
| 50.0% | $1,000 | $500 | $1,500 | 50.0% |
| 40.0% | $1,000 | $400 | $1,400 | 40.0% |
| 30.0% | $1,000 | $300 | $1,300 | 30.0% |
| 20.0% | $1,000 | $200 | $1,200 | 20.0% |
| 15.0% | $1,000 | $150 | $1,150 | 15.0% |
| 10.0% | $1,000 | $100 | $1,100 | 10.0% |
| 5.0% | $1,000 | $50 | $1,050 | 5.0% |
| 0.0% | $1,000 | $0 | $1,000 | 0.0% |
| -10.0% | $1,000 | $0 | $1,000 | 0.0% |
| -20.0% | $1,000 | $0 | $1,000 | 0.0% |
| -30.0% | $1,000 | $0 | $1,000 | 0.0% |
| -40.0% | $1,000 | $0 | $1,000 | 0.0% |
| -50.0% | $1,000 | $0 | $1,000 | 0.0% |
| -60.0% | $1,000 | $0 | $1,000 | 0.0% |
| -70.0% | $1,000 | $0 | $1,000 | 0.0% |
| -80.0% | $1,000 | $0 | $1,000 | 0.0% |
| -90.0% | $1,000 | $0 | $1,000 | 0.0% |
| -100.0% | $1,000 | $0 | $1,000 | 0.0% |
(1) The “Return on $1,000 Note” is the number, expressed as a percentage, that results from comparing the Payment at Maturity per $1,000 Principal Amount per Note to the purchase price of $1,000 per Note.
Basket Appreciation Example 1
Below is an example of how to calculate the Payment at Maturity if the Basket has appreciated. This example is based on the Participation Rate of 100% and the hypothetical data in the table below. The Initial Basket Commodity Prices and Final Basket Commodity Prices below are hypothetical and do not reflect the actual Initial Basket Commodity Price or Final Basket Commodity Price for any Basket Commodity. The actual Initial Basket Commodity Price of each Basket Commodity is set forth on the cover page of this pricing supplement. The numbers appearing below may have been rounded for ease of analysis. As the Basket has appreciated in value, the Basket Performance is positive and the Payment at Maturity includes a Supplemental Redemption Amount based on the performance of the Basket.
|
Basket Commodity |
Weight in Basket |
Hypothetical |
Hypothetical |
Percentage Change |
| WTI crude oil | 12.50% | $100 | $120 | 20% |
12
| Brent crude oil | 12.50% | $100 | $90 | -10% |
| Natural gas | 12.50% | $7.00 | $5.25 | -25% |
| Corn | 12.50% | 800¢ | 880¢ | 10% |
| Soybeans | 12.50% | 1,600¢ | 1,520¢ | -5% |
| Wheat | 12.50% | 1,000¢ | 1,400¢ | 40% |
| Copper | 12.50% | $10,000 | $11,000 | 10% |
| Zinc | 12.50% | $2,000 | $1,800 | -10% |
Basket Performance = sum of the products of (x) the Final Basket Commodity Price for each Basket Commodity minus the Initial Basket Commodity Price for such Basket Commodity divided by the Initial Basket Commodity Price of such Basket Commodity and (y) the Basket Commodity Weighting for such Basket Commodity:
[(final WTI crude oil price – initial WTI crude oil price) / initial WTI crude oil price] × 12.50%; plus
[(final Brent crude oil price – initial Brent crude oil price) / initial Brent crude oil price] × 12.50%; plus
[(final natural gas price – initial natural gas price) / initial natural gas price] × 12.50%; plus
[(final corn price – initial corn price) / initial corn price] × 12.50%; plus
[(final soybeans price – initial soybeans price) / initial soybeans price] × 12.50%; plus
[(final wheat price – initial wheat price) / initial wheat price] × 12.50%; plus
[(final copper price – initial copper price) / initial copper price] × 12.50%; plus
[(final zinc price – initial zinc price) / initial zinc price] × 12.50%
So, using the Final Basket Commodity Prices above:
WTI crude oil = [($120 - $100) / $100] × 12.50% = 2.50%; plus
Brent crude oil = [($90 - $100) / $100] × 12.50% = -1.25%; plus
Natural gas = [($5.25 - $7.00) / $7.00] × 12.50% = -3.125%; plus
corn = [(880¢ - 800¢) / 800¢] × 12.50% = 1.25%; plus
soybeans = [(1,520¢ - 1,600¢) / 1,600¢] × 12.50% = -0.625%; plus
wheat = [(1,400¢ - 1,000¢) / 1,000¢] × 12.50% = 5.00%; plus
copper = [($11,000 - $10,000) / $10,000] × 12.50% = 1.25%; plus
zinc = [($1,800 – $2,000) / $2,000] × 12.50% = -1.25%
which equals
Basket Performance = 3.75%
The Payment at Maturity will equal $1,000 plus the Supplemental Redemption Amount. The Supplemental Redemption Amount will equal (i) $1,000 times (ii) the Participation Rate times (iii) the Basket Performance, or:
$1,000 × 100.00% × 3.75% = $37.50
The Payment at Maturity will equal $1,000 plus the Supplemental Redemption Amount, or:
$1,000 + $37.50 = $1,037.50
Basket Appreciation Example 2
Below is an example of how to calculate the Payment at Maturity if the Basket has appreciated. This example is based on the Participation Rate of 100% and the hypothetical data in the table below. The Initial Basket Commodity Prices and Final Basket Commodity Prices below are hypothetical and do not reflect the actual Initial Basket Commodity Price or Final Basket Commodity Price for any Basket Commodity. The numbers appearing below may have been rounded for ease of analysis. In this example, although six Basket components have depreciated or remained unchanged over the term of the Notes, the appreciation of the other two components is great enough to mean that the Basket has appreciated in value. As a result, the Basket Performance is positive and the Payment at Maturity includes a Supplemental Redemption Amount based on the performance of the Basket.
|
Basket Commodity |
Weight in Basket |
Hypothetical |
Hypothetical |
Percentage Change |
| WTI crude oil | 12.50% | $100 | $95 | -5% |
13
| Brent crude oil | 12.50% | $100 | $95 | -5% |
| Natural gas | 12.50% | $7.00 | $6.65 | -5% |
| Corn | 12.50% | 800¢ | 800¢ | 0% |
| Soybeans | 12.50% | 1,600¢ | 1,520¢ | -5% |
| Wheat | 12.50% | 1,000¢ | 1,400¢ | 40% |
| Copper | 12.50% | $10,000 | $16,000 | 60% |
| Zinc | 12.50% | $2,000 | $1,800 | -10% |
Basket Performance = sum of the products of (x) the Final Basket Commodity Price for each Basket Commodity minus the Initial Basket Commodity Price for such Basket Commodity divided by the Initial Basket Commodity Price of such Basket Commodity and (y) the Basket Commodity Weighting for such Basket Commodity:
[(final WTI crude oil price – initial WTI crude oil price) / initial WTI crude oil price] × 12.50%; plus
[(final Brent crude oil price – initial Brent crude oil price) / initial Brent crude oil price] × 12.50%; plus
[(final natural gas price – initial natural gas price) / initial natural gas price] × 12.50%; plus
[(final corn price – initial corn price) / initial corn price] × 12.50%; plus
[(final soybeans price – initial soybeans price) / initial soybeans price] × 12.50%; plus
[(final wheat price – initial wheat price) / initial wheat price] × 12.50%; plus
[(final copper price – initial copper price) / initial copper price] × 12.50%; plus
[(final zinc price – initial zinc price) / initial zinc price] × 12.50%
So, using the Final Basket Commodity Prices above:
WTI crude oil = [($95 - $100) / $100] × 12.50% = -0.625%; plus
Brent crude oil = [($95 - $100) / $100] × 12.50% = -0.625%; plus
Natural gas = [($6.65 - $7.00) / $7.00] × 12.50% = -0.625%; plus
corn = [(800¢ - 800¢) / 800¢] × 12.50% = 0%; plus
soybeans = [(1,520¢ - 1,600¢) / 1,600¢] × 12.50% = -0.625%; plus
wheat = [(1,400¢ - 1,000¢) / 1,000¢] × 12.50% = 5.00%; plus
copper = [($16,000 - $10,000) / $10,000] × 12.50% = 7.50%; plus
zinc = [($1,800 – $2,000) / $2,000] × 12.50% = -1.25%
which equals
Basket Performance = 8.75%
In the above example, the Final Basket Commodity Price of each of the Basket components except for wheat and copper is lower than its respective Initial Basket Commodity Price. Accordingly, although the Final Basket Commodity Prices of 75% of the Basket Commodities (by weight) have decreased in value over their respective Initial Basket Commodity Prices, the Final Basket Commodity Prices of the other 25% (by weight) of the Basket have increased and, because they have increased significantly, their increase more than offsets the declines in the other Basket Commodities and, consequently, the Basket Performance is positive. The Payment at Maturity per Note will equal $1,000 plus the Supplemental Redemption Amount; or:
The Payment at Maturity will equal $1,000 plus the Supplemental Redemption Amount. The Supplemental Redemption Amount will equal (i) $1,000 times (ii) the Participation Rate times (iii) the Basket Performance, or:
$1,000 × 100.00% × 8.75% = $87.50
The Payment at Maturity will equal $1,000 plus the Supplemental Redemption Amount, or:
$1,000 + $87.50 = $1,087.50
Par Example
If the Basket Performance is less than or equal to 0%, the Payment at Maturity will equal only the Principal Amount. Below is an example of a scenario in which the Basket Performance is less than 0% based on the hypothetical data in the table below. The
14
Initial Basket Commodity Prices and Final Basket Commodity Prices below are hypothetical and do not reflect the actual Initial Basket Commodity Price or Final Basket Commodity Price for any Basket Commodity. The numbers appearing below may have been rounded for ease of analysis.
|
Basket Commodity |
Weight in Basket |
Hypothetical |
Hypothetical |
Percentage Change |
| WTI crude oil | 12.50% | $100 | $90 | -10% |
| Brent crude oil | 12.50% | $100 | $90 | -10% |
| Natural gas | 12.50% | $7 | $5.60 | -20% |
| Corn | 12.50% | 800¢ | 600¢ | -25% |
| Soybeans | 12.50% | 1,600¢ | 1,440¢ | -10% |
| Wheat | 12.50% | 1,000¢ | 850¢ | -15% |
| Copper | 12.50% | $10,000 | $9,000 | -10% |
| Zinc | 12.50% | $2,000 | $1,800 | -10% |
Basket Performance = sum of the products of (x) the Final Basket Commodity Price for each Basket Commodity minus the Initial Basket Commodity Price for such Basket Commodity divided by the Initial Basket Commodity Price of such Basket Commodity and (y) the Basket Commodity Weighting for such Basket Commodity:
[(final WTI crude oil price – initial WTI crude oil price) / initial WTI crude oil price] × 12.50%; plus
[(final Brent crude oil price – initial Brent crude oil price) / initial Brent crude oil price] × 12.50%; plus
[(final natural gas price – initial natural gas price) / initial natural gas price] × 12.50%; plus
[(final corn price – initial corn price) / initial corn price] × 12.50%; plus
[(final soybeans price – initial soybeans price) / initial soybeans price] × 12.50%; plus
[(final wheat price – initial wheat price) / initial wheat price] × 12.50%; plus
[(final copper price – initial copper price) / initial copper price] × 12.50%; plus
[(final zinc price – initial zinc price) / initial zinc price] × 12.50%
So, using the Final Basket Commodity Prices above:
WTI crude oil = [($90 - $100) / $100] × 12.50% = -1.25%; plus
Brent crude oil = [($90 - $100) / $100] × 12.50% = -1.25%; plus
Natural gas = [($5.60 - $7.00) / $7.00] × 12.50% = -2.50%; plus
corn = [(600¢ - 800¢) / 800¢] × 12.50% = -3.125%; plus
soybeans = [(1,440¢ - 1,600¢) / 1,600¢] × 12.50% = -1.25%; plus
wheat = [(850¢ - 1,000¢) / 1,000¢] × 12.50% = -1.875%; plus
copper = [($9,000 - $10,000) / $10,000] × 12.50% = -1.25%; plus
zinc = [($1,800 – $2,000) / $2,000] × 12.50% = -1.25%
which equals
Basket Performance = -13.75%
In the above example, the Final Basket Commodity Price of each of the Basket components is lower than its respective Initial Basket Commodity Price and the Basket Performance is negative. The Payment at Maturity will equal $1,000.
All payments are subject to our credit risk. If we default on our obligations, you could lose some or all of your investment.
15
| What Are the Tax Consequences of the Notes? |
In the opinion of our counsel, Davis Polk & Wardwell LLP, the Notes should be treated as “contingent payment debt instruments” for U.S. federal income tax purposes, as described in the section of the accompanying prospectus supplement called “United States Federal Taxation—Tax Consequences to U.S. Holders.” Under this treatment, if you are a U.S. taxable investor, you generally will be subject to annual income tax based on the “comparable yield” (as defined in the accompanying prospectus supplement) of the Notes, adjusted upward or downward to reflect the difference, if any, between the actual and projected amount of the payments on the Notes. In addition, any gain recognized by U.S. taxable investors on the sale or exchange, or at maturity, of the Notes generally will be treated as ordinary income. We have determined that the “comparable yield” for the Notes is a rate of 3.7459% per annum, compounded semi-annually. Based on the comparable yield set forth above, the “projected payment schedule” for a note (assuming an issue price of $1,000) consists of a single projected amount equal to $1,077.3354 due at maturity.
You should read the discussion under “United States Federal Taxation” in the accompanying prospectus supplement concerning the U.S. federal income tax consequences of an investment in the Notes.
The following table states the amount of interest income (without taking into account any adjustment to reflect the difference, if any, between the actual and the projected amount of the contingent payment on a note) that will be deemed to have accrued with respect to a note for each accrual period (assuming a day count convention of 30 days per month and 360 days per year), based upon the comparable yield set forth above
|
ACCRUAL PERIOD |
INTEREST INCOME DEEMED TO ACCRUE DURING ACCRUAL PERIOD (PER NOTE) |
TOTAL INTEREST INCOME DEEMED TO HAVE ACCRUED FROM ORIGINAL ISSUE DATE (PER NOTE) AS OF END OF ACCRUAL PERIOD |
|
| Original Issue Date through June 30, 2022 | $4.2662 | $4.2662 | |
| July 1, 2022 through December 31, 2022 | $18.8094 | $23.0756 | |
| January 1, 2023 through June 30, 2023 | $19.1617 | $42.2373 | |
| July 1, 2023 through December 31, 2023 | $19.5206 | $61.7579 | |
| January 1, 2024 through the Maturity Date | $15.5775 | $77.3354 | |
The comparable yield and the projected payment schedule will not be provided for any purpose other than the determination of U.S. Holders’ accruals of interest income and adjustments thereto in respect of the Notes for U.S. federal income tax purposes, and we make no representation regarding the actual amount of the payments that will be made on the Notes.
If you are a non-U.S. investor, please also read the section of the accompanying prospectus supplement called “United States Federal Taxation—Tax Consequences to Non-U.S. Holders.”
In addition, Section 871(m) of the Internal Revenue Code of 1986, as amended (the “Code”), and Treasury regulations promulgated thereunder (“Section 871(m)”) generally impose a 30% (or a lower applicable treaty rate) withholding tax on dividend equivalents paid or deemed paid to Non-U.S. Holders with respect to certain financial instruments linked to U.S. equities or indices that include U.S. equities (each, an “Underlying Security”). Because the Notes reference a basket of commodities, and neither the basket nor any of the commodities is treated for U.S. federal income tax purposes as an Underlying Security, payment on the Notes to Non-U.S. Holders should not be subject to Section 871(m).
You should consult your tax adviser regarding all aspects of the U.S. federal income tax consequences of an investment in the Notes, as well as any tax consequences arising under the laws of any state, local or non-U.S. taxing jurisdiction.
The discussion in the preceding paragraphs under “What Are the Tax Consequences of the Notes?” and the discussion contained in the section entitled “United States Federal Taxation” in the accompanying prospectus supplement, insofar as they purport to describe provisions of U.S. federal income tax laws or legal conclusions with respect thereto, constitute the full opinion of Davis Polk & Wardwell LLP regarding the material U.S. federal tax consequences of an investment in the Notes.
16
| The Basket Commodities |
Because the Basket exists solely for purposes of these Notes, historical information on the performance of the Basket does not exist for dates prior to the Trade Date for these Notes. The graph below sets forth the hypothetical performance of the Basket for the period from January 1, 2017 to May 6, 2022, assuming that the Basket was created on January 1, 2017 with the same Basket Commodities and corresponding weights in the Basket. The graph does not attempt to show your expected return on an investment in the Notes. You cannot predict the future performance of any Basket Commodity or of the Basket as a whole, or whether increases in the price of any Basket Commodity will be offset by decreases in the prices of the other Basket Commodities. The historical performance of the Basket and the degree of correlation between the price trends of the Basket Commodities (or lack thereof) should not be taken as an indication of its future performance.

17
| WTI Crude Oil |
The following table presents the published high and low prices of WTI crude oil, as well as end-of-quarter prices of WTI crude oil, for each quarter in the period from January 1, 2017 through May 13, 2022. The Commodity Price on May 13, 2022 was $110.49. The related graph sets forth the daily prices of WTI crude oil for the same time period. We obtained the prices of WTI crude oil and other information below from Bloomberg Financial Markets (Ticker Symbol: CL1), without independent verification. The actual Initial Basket Commodity Price with respect to WTI crude oil was determined as described in the “Final Terms” on page 4 rather than the prices published by Bloomberg Financial Markets, and the Bloomberg ticker symbol is provided for reference purposes only. WTI crude oil experiences periods of high volatility, and you should not take the historical values of WTI crude oil as an indication of future performance, and no assurance can be given as to the Commodity Price on the Determination Date. The prices of WTI crude oil futures contracts may be near zero, zero or negative, which can occur rapidly and unexpectedly. In April 2020, crude oil futures contracts traded below zero. See “Key Risks—Specific commodities’ prices are volatile and are affected by numerous factors specific to each market—WTI crude oil.”
| Quarter Begin | Quarter End | Quarterly High ($) | Quarterly Low ($) | Quarterly Close ($) | ||||
| 1/1/2017 | 3/31/2017 | 54.45 | 47.34 | 50.60 | ||||
| 4/1/2017 | 6/30/2017 | 53.40 | 42.53 | 46.04 | ||||
| 7/1/2017 | 9/30/2017 | 52.22 | 44.23 | 51.67 | ||||
| 10/1/2017 | 12/31/2017 | 60.42 | 49.29 | 60.42 | ||||
| 1/1/2018 | 3/31/2018 | 66.14 | 59.19 | 64.94 | ||||
| 4/1/2018 | 6/30/2018 | 74.15 | 62.06 | 74.15 | ||||
| 7/1/2018 | 9/30/2018 | 74.14 | 65.01 | 73.25 | ||||
| 10/1/2018 | 12/31/2018 | 76.41 | 42.53 | 45.41 | ||||
| 1/1/2019 | 3/31/2019 | 60.14 | 46.54 | 60.14 | ||||
| 4/1/2019 | 6/30/2019 | 66.30 | 51.14 | 58.47 | ||||
| 7/1/2019 | 9/30/2019 | 62.90 | 51.09 | 54.07 | ||||
| 10/1/2019 | 12/31/2019 | 61.72 | 52.45 | 61.06 | ||||
| 1/1/2020 | 3/31/2020 | 63.27 | 20.09 | 20.48 | ||||
| 4/1/2020 | 6/30/2020 | 40.46 | -37.63 | 39.27 | ||||
| 7/1/2020 | 9/30/2020 | 43.39 | 36.76 | 40.22 | ||||
| 10/1/2020 | 12/31/2020 | 49.10 | 35.79 | 48.52 | ||||
| 1/1/2021 | 3/31/2021 | 66.09 | 47.62 | 59.16 | ||||
| 4/1/2021 | 6/30/2021 | 74.05 | 58.65 | 73.47 | ||||
| 7/1/2021 | 9/30/2021 | 75.45 | 62.32 | 75.03 | ||||
| 10/1/2021 | 12/31/2021 | 84.65 | 65.57 | 75.21 | ||||
| 1/1/2022 | 3/31/2022 | 123.70 | 76.08 | 100.28 | ||||
| 4/1/2022 | 5/13/2022* | 110.49 | 94.29 | 110.49 |
* Available information for the indicated period includes data for less than the entire calendar quarter and accordingly, the “Quarterly High,” “Quarterly Low” and “Quarterly Close” data indicated are for this shortened period only.
18
The graph below illustrates the performance of WTI crude oil from January 1, 2017 through May 13, 2022, based on information from Bloomberg. Past performance of WTI crude oil is not indicative of the future performance of WTI crude oil.

19
| Brent Crude Oil |
The following table presents the published high and low prices of Brent crude oil, as well as end-of-quarter prices of Brent crude oil, for each quarter in the period from January 1, 2017 through May 13, 2022. The Commodity Price on May 13, 2022 was $111.55. The related graph sets forth the daily prices of Brent crude oil for the same time period. We obtained the prices of Brent crude oil and other information below from Bloomberg Financial Markets (Ticker Symbol: CO1), without independent verification. The actual Initial Basket Commodity Price with respect to Brent crude oil was determined as described in the “Final Terms” on page 4 rather than the prices published by Bloomberg Financial Markets, and the Bloomberg ticker symbol is provided for reference purposes only. Brent crude oil experiences periods of high volatility, and you should not take the historical values of Brent crude oil as an indication of future performance, and no assurance can be given as to the Commodity Price on the Determination Date.
| Quarter Begin | Quarter End | Quarterly High ($) | Quarterly Low ($) | Quarterly Close ($) | ||||
| 1/1/2017 | 3/31/2017 | 57.10 | 50.56 | 52.83 | ||||
| 4/1/2017 | 6/30/2017 | 56.23 | 44.82 | 47.92 | ||||
| 7/1/2017 | 9/30/2017 | 59.02 | 46.71 | 57.54 | ||||
| 10/1/2017 | 12/31/2017 | 67.02 | 55.62 | 66.87 | ||||
| 1/1/2018 | 3/31/2018 | 70.53 | 62.59 | 70.27 | ||||
| 4/1/2018 | 6/30/2018 | 79.80 | 67.11 | 79.44 | ||||
| 7/1/2018 | 9/30/2018 | 82.72 | 70.76 | 82.72 | ||||
| 10/1/2018 | 12/31/2018 | 86.29 | 50.47 | 53.80 | ||||
| 1/1/2019 | 3/31/2019 | 68.50 | 54.91 | 68.39 | ||||
| 4/1/2019 | 6/30/2019 | 74.57 | 59.97 | 66.55 | ||||
| 7/1/2019 | 9/30/2019 | 69.02 | 56.23 | 60.78 | ||||
| 10/1/2019 | 12/31/2019 | 68.44 | 57.69 | 66.00 | ||||
| 1/1/2020 | 3/31/2020 | 68.91 | 22.74 | 22.74 | ||||
| 4/1/2020 | 6/30/2020 | 43.08 | 19.33 | 41.15 | ||||
| 7/1/2020 | 9/30/2020 | 45.86 | 39.61 | 40.95 | ||||
| 10/1/2020 | 12/31/2020 | 52.26 | 37.46 | 51.80 | ||||
| 1/1/2021 | 3/31/2021 | 69.63 | 51.09 | 63.54 | ||||
| 4/1/2021 | 6/30/2021 | 76.18 | 62.15 | 75.13 | ||||
| 7/1/2021 | 9/30/2021 | 79.53 | 65.18 | 78.52 | ||||
| 10/1/2021 | 12/31/2021 | 86.40 | 68.87 | 77.78 | ||||
| 1/1/2022 | 3/31/2022 | 127.98 | 78.98 | 107.91 | ||||
| 4/1/2022 | 5/13/2022* | 113.16 | 98.48 | 111.55 |
* Available information for the indicated period includes data for less than the entire calendar quarter and accordingly, the “Quarterly High,” “Quarterly Low” and “Quarterly Close” data indicated are for this shortened period only.
20
The graph below illustrates the performance of Brent crude oil from January 1, 2017 through May 13, 2022, based on information from Bloomberg. Past performance of Brent crude oil is not indicative of the future performance of Brent crude oil.

21
| Natural Gas |
The following table presents the published high and low prices of natural gas, as well as end-of-quarter prices of natural gas, for each quarter in the period from January 1, 2017 through May 13, 2022. The Commodity Price on May 13, 2022 was $7.6630. The related graph sets forth the daily prices of natural gas for the same time period. We obtained the prices of natural gas and other information below from Bloomberg Financial Markets (Ticker Symbol: NG1), without independent verification. The actual Initial Basket Commodity Price with respect to natural gas was determined as described in the “Final Terms” on page 4 rather than the prices published by Bloomberg Financial Markets, and the Bloomberg ticker symbol is provided for reference purposes only. Natural gas experiences periods of high volatility, and you should not take the historical values of natural gas as an indication of future performance, and no assurance can be given as to the Commodity Price on the Determination Date.
| Quarter Begin | Quarter End | Quarterly High ($) | Quarterly Low ($) | Quarterly Close ($) | ||||
| 1/1/2017 | 3/31/2017 | 3.4190 | 2.5640 | 3.1900 | ||||
| 4/1/2017 | 6/30/2017 | 3.4240 | 2.8930 | 3.0350 | ||||
| 7/1/2017 | 9/30/2017 | 3.1460 | 2.7740 | 3.0070 | ||||
| 10/1/2017 | 12/31/2017 | 3.2130 | 2.5980 | 2.9530 | ||||
| 1/1/2018 | 3/31/2018 | 3.6310 | 2.5520 | 2.7330 | ||||
| 4/1/2018 | 6/30/2018 | 3.0220 | 2.6560 | 2.9240 | ||||
| 7/1/2018 | 9/30/2018 | 3.0820 | 2.7210 | 3.0080 | ||||
| 10/1/2018 | 12/31/2018 | 4.8370 | 2.9400 | 2.9400 | ||||
| 1/1/2019 | 3/31/2019 | 3.5910 | 2.5510 | 2.6620 | ||||
| 4/1/2019 | 6/30/2019 | 2.7080 | 2.1850 | 2.3080 | ||||
| 7/1/2019 | 9/30/2019 | 2.6810 | 2.0700 | 2.3300 | ||||
| 10/1/2019 | 12/31/2019 | 2.8620 | 2.1580 | 2.1890 | ||||
| 1/1/2020 | 3/31/2020 | 2.2020 | 1.6020 | 1.6400 | ||||
| 4/1/2020 | 6/30/2020 | 2.1340 | 1.4820 | 1.7510 | ||||
| 7/1/2020 | 9/30/2020 | 2.6570 | 1.6410 | 2.5270 | ||||
| 10/1/2020 | 12/31/2020 | 3.3540 | 2.3050 | 2.5390 | ||||
| 1/1/2021 | 3/31/2021 | 3.2190 | 2.4460 | 2.6080 | ||||
| 4/1/2021 | 6/30/2021 | 3.6500 | 2.4560 | 3.6500 | ||||
| 7/1/2021 | 9/30/2021 | 5.8670 | 3.5960 | 5.8670 | ||||
| 10/1/2021 | 12/31/2021 | 6.3120 | 3.5610 | 3.7300 | ||||
| 1/1/2022 | 3/31/2022 | 6.2650 | 3.7170 | 5.6420 | ||||
| 4/1/2022 | 5/13/2022* | 8.7830 | 5.7120 | 7.6630 |
* Available information for the indicated period includes data for less than the entire calendar quarter and accordingly, the “Quarterly High,” “Quarterly Low” and “Quarterly Close” data indicated are for this shortened period only.
22
The graph below illustrates the performance of natural gas from January 1, 2017 through May 13, 2022, based on information from Bloomberg. Past performance of natural gas is not indicative of the future performance of natural gas.

23
| Corn |
The following table presents the published high and low prices of corn, as well as end-of-quarter prices of corn, for each quarter in the period from January 1, 2017 through May 13, 2022. The Commodity Price on May 13, 2022 was 794.50¢. The related graph sets forth the daily prices of corn for the same time period. We obtained the prices of corn and other information below from Bloomberg Financial Markets (Ticker Symbol: C 1), without independent verification. The actual Initial Basket Commodity Price with respect to corn was determined as described in the “Final Terms” on page 4 rather than the prices published by Bloomberg Financial Markets, and the Bloomberg ticker symbol is provided for reference purposes only. Corn experiences periods of high volatility, and you should not take the historical values of corn as an indication of future performance, and no assurance can be given as to the Commodity Price on the Determination Date.
| Quarter Begin | Quarter End | Quarterly High (¢) | Quarterly Low (¢) | Quarterly Close (¢) | ||||
| 1/1/2017 | 3/31/2017 | 378.75 | 353.75 | 364.25 | ||||
| 4/1/2017 | 6/30/2017 | 387.75 | 356.75 | 370.50 | ||||
| 7/1/2017 | 9/30/2017 | 392.25 | 329.50 | 355.25 | ||||
| 10/1/2017 | 12/31/2017 | 353.75 | 335.75 | 350.75 | ||||
| 1/1/2018 | 3/31/2018 | 387.75 | 346.25 | 387.75 | ||||
| 4/1/2018 | 6/30/2018 | 408.50 | 345.00 | 350.25 | ||||
| 7/1/2018 | 9/30/2018 | 372.25 | 330.25 | 356.25 | ||||
| 10/1/2018 | 12/31/2018 | 385.50 | 356.00 | 375.00 | ||||
| 1/1/2019 | 3/31/2019 | 383.00 | 352.50 | 356.50 | ||||
| 4/1/2019 | 6/30/2019 | 454.75 | 342.50 | 420.25 | ||||
| 7/1/2019 | 9/30/2019 | 449.50 | 340.75 | 388.00 | ||||
| 10/1/2019 | 12/31/2019 | 397.75 | 357.75 | 387.75 | ||||
| 1/1/2020 | 3/31/2020 | 393.75 | 335.25 | 340.75 | ||||
| 4/1/2020 | 6/30/2020 | 338.50 | 302.75 | 338.50 | ||||
| 7/1/2020 | 9/30/2020 | 379.00 | 307.75 | 379.00 | ||||
| 10/1/2020 | 12/31/2020 | 484.00 | 379.50 | 484.00 | ||||
| 1/1/2021 | 3/31/2021 | 565.00 | 483.75 | 564.25 | ||||
| 4/1/2021 | 6/30/2021 | 772.75 | 553.25 | 720.00 | ||||
| 7/1/2021 | 9/30/2021 | 719.75 | 495.75 | 536.75 | ||||
| 10/1/2021 | 12/31/2021 | 614.75 | 512.25 | 593.25 | ||||
| 1/1/2022 | 3/31/2022 | 764.50 | 587.50 | 748.75 | ||||
| 4/1/2022 | 5/13/2022* | 818.25 | 735.00 | 794.50 |
* Available information for the indicated period includes data for less than the entire calendar quarter and accordingly, the “Quarterly High,” “Quarterly Low” and “Quarterly Close” data indicated are for this shortened period only.
24
The graph below illustrates the performance of corn from January 1, 2017 through May 13, 2022, based on information from Bloomberg. Past performance of corn is not indicative of the future performance of corn.
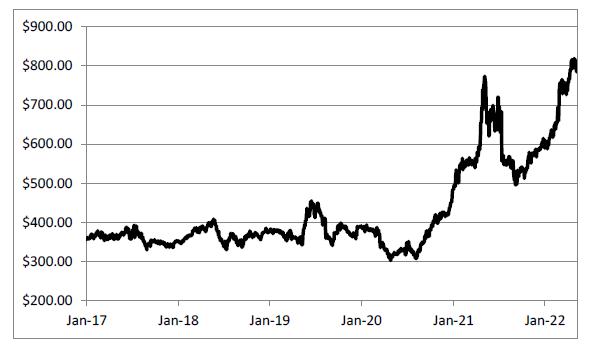
25
| Soybeans |
The following table presents the published high and low prices of soybeans, as well as end-of-quarter prices of soybeans, for each quarter in the period from January 1, 2017 through May 13, 2022. The Commodity Price on May 13, 2022 was 1,723.25¢. The related graph sets forth the daily prices of soybeans for the same time period. We obtained the prices of soybeans and other information below from Bloomberg Financial Markets (Ticker Symbol: S 1), without independent verification. The actual Initial Basket Commodity Price with respect to soybeans was determined as described in the “Final Terms” on page 4 rather than the prices published by Bloomberg Financial Markets, and the Bloomberg ticker symbol is provided for reference purposes only. Soybeans experience periods of high volatility, and you should not take the historical values of soybeans as an indication of future performance, and no assurance can be given as to the Commodity Price on the Determination Date.
| Quarter Begin | Quarter End | Quarterly High (¢) | Quarterly Low (¢) | Quarterly Close (¢) | ||||
| 1/1/2017 | 3/31/2017 | 1,075.00 | 946.00 | 946.00 | ||||
| 4/1/2017 | 6/30/2017 | 976.25 | 904.00 | 942.25 | ||||
| 7/1/2017 | 9/30/2017 | 1,025.25 | 921.75 | 968.25 | ||||
| 10/1/2017 | 12/31/2017 | 1,008.50 | 945.75 | 951.75 | ||||
| 1/1/2018 | 3/31/2018 | 1,066.75 | 940.50 | 1,044.75 | ||||
| 4/1/2018 | 6/30/2018 | 1,060.75 | 858.50 | 858.50 | ||||
| 7/1/2018 | 9/30/2018 | 903.75 | 814.00 | 845.50 | ||||
| 10/1/2018 | 12/31/2018 | 920.00 | 833.50 | 882.50 | ||||
| 1/1/2019 | 3/31/2019 | 925.25 | 877.75 | 884.25 | ||||
| 4/1/2019 | 6/30/2019 | 915.50 | 791.00 | 899.75 | ||||
| 7/1/2019 | 9/30/2019 | 906.75 | 843.25 | 906.00 | ||||
| 10/1/2019 | 12/31/2019 | 943.00 | 870.50 | 943.00 | ||||
| 1/1/2020 | 3/31/2020 | 944.25 | 821.75 | 886.00 | ||||
| 4/1/2020 | 6/30/2020 | 884.25 | 826.00 | 884.25 | ||||
| 7/1/2020 | 9/30/2020 | 1,043.50 | 870.25 | 1,023.50 | ||||
| 10/1/2020 | 12/31/2020 | 1,315.25 | 1,020.75 | 1,315.25 | ||||
| 1/1/2021 | 3/31/2021 | 1,441.25 | 1,311.75 | 1,436.75 | ||||
| 4/1/2021 | 6/30/2021 | 1,660.50 | 1,329.75 | 1,450.00 | ||||
| 7/1/2021 | 9/30/2021 | 1,467.75 | 1,256.00 | 1,256.00 | ||||
| 10/1/2021 | 12/31/2021 | 1,362.50 | 1,178.00 | 1,328.75 | ||||
| 1/1/2022 | 3/31/2022 | 1,718.75 | 1,344.00 | 1,618.25 | ||||
| 4/1/2022 | 5/13/2022* | 1,748.25 | 1,582.75 | 1,723.25 |
* Available information for the indicated period includes data for less than the entire calendar quarter and accordingly, the “Quarterly High,” “Quarterly Low” and “Quarterly Close” data indicated are for this shortened period only.
26
The graph below illustrates the performance of soybeans from January 1, 2017 through May 13, 2022, based on information from Bloomberg. Past performance of soybeans is not indicative of the future performance of soybeans.

27
| Wheat |
The following table presents the published high and low prices of wheat, as well as end-of-quarter prices of wheat, for each quarter in the period from January 1, 2017 through May 13, 2022. The Commodity Price on May 13, 2022 was 1,167.25¢.** The related graph sets forth the daily prices of wheat for the same time period. We obtained the prices of wheat and other information below from Bloomberg Financial Markets (Ticker Symbol: W 1), without independent verification. The actual Initial Basket Commodity Price with respect to wheat was determined as described in the “Final Terms” on page 4 rather than the prices published by Bloomberg Financial Markets, and the Bloomberg ticker symbol is provided for reference purposes only. Wheat experiences periods of high volatility, and you should not take the historical values of wheat as an indication of future performance, and no assurance can be given as to the Commodity Price on the Determination Date.
| Quarter Begin | Quarter End | Quarterly High (¢) | Quarterly Low (¢) | Quarterly Close (¢) | ||||
| 1/1/2017 | 3/31/2017 | 454.75 | 406.50 | 426.50 | ||||
| 4/1/2017 | 6/30/2017 | 511.00 | 402.50 | 511.00 | ||||
| 7/1/2017 | 9/30/2017 | 539.25 | 400.00 | 448.25 | ||||
| 10/1/2017 | 12/31/2017 | 448.00 | 387.25 | 427.00 | ||||
| 1/1/2018 | 3/31/2018 | 505.50 | 416.50 | 451.00 | ||||
| 4/1/2018 | 6/30/2018 | 543.00 | 446.25 | 497.50 | ||||
| 7/1/2018 | 9/30/2018 | 574.50 | 469.75 | 509.00 | ||||
| 10/1/2018 | 12/31/2018 | 535.25 | 487.25 | 503.25 | ||||
| 1/1/2019 | 3/31/2019 | 527.25 | 422.25 | 457.75 | ||||
| 4/1/2019 | 6/30/2019 | 547.50 | 418.50 | 528.00 | ||||
| 7/1/2019 | 9/30/2019 | 536.25 | 447.25 | 495.75 | ||||
| 10/1/2019 | 12/31/2019 | 558.75 | 488.75 | 558.75 | ||||
| 1/1/2020 | 3/31/2020 | 581.50 | 498.00 | 568.75 | ||||
| 4/1/2020 | 6/30/2020 | 556.50 | 474.00 | 490.00 | ||||
| 7/1/2020 | 9/30/2020 | 578.00 | 489.50 | 578.00 | ||||
| 10/1/2020 | 12/31/2020 | 640.75 | 563.75 | 640.50 | ||||
| 1/1/2021 | 3/31/2021 | 680.25 | 601.75 | 618.00 | ||||
| 4/1/2021 | 6/30/2021 | 773.50 | 611.00 | 671.50 | ||||
| 7/1/2021 | 9/30/2021 | 762.25 | 608.50 | 725.50 | ||||
| 10/1/2021 | 12/31/2021 | 856.00 | 718.75 | 770.75 | ||||
| 1/1/2022 | 3/31/2022 | 1,425.25 | 741.50 | 1,006.00 | ||||
| 4/1/2022 | 5/13/2022* | 1,174.50 | 984.50 | 1,167.25** |
* Available information for the indicated period includes data for less than the entire calendar quarter and accordingly, the “Quarterly High,” “Quarterly Low” and “Quarterly Close” data indicated are for this shortened period only.
** A Market Disruption Event with respect to wheat occurred on the Trade Date.
28
The graph below illustrates the performance of wheat from January 1, 2017 through May 13, 2022, based on information from Bloomberg. Past performance of wheat is not indicative of the future performance of wheat.

29
| Copper |
The following table presents the published high and low prices of copper, as well as end-of-quarter prices of copper, for each quarter in the period from January 1, 2017 through May 13, 2022. The Commodity Price on May 13, 2022 was $9,064.00. The related graph sets forth the daily prices of copper for the same time period. We obtained the prices of copper and other information below from Bloomberg Financial Markets (Ticker Symbol: LOCADY), without independent verification. The actual Initial Basket Commodity Price with respect to copper was determined as described in the “Final Terms” on page 4 rather than the prices published by Bloomberg Financial Markets, and the Bloomberg ticker symbol is provided for reference purposes only. Copper experiences periods of high volatility, and you should not take the historical values of copper as an indication of future performance, and no assurance can be given as to the Commodity Price on the Determination Date.
| Quarter Begin | Quarter End | Quarterly High ($) | Quarterly Low ($) | Quarterly Close ($) | ||||
| 1/1/2017 | 3/31/2017 | 6,145.00 | 5,500.50 | 5,849.00 | ||||
| 4/1/2017 | 6/30/2017 | 5,907.50 | 5,466.00 | 5,907.50 | ||||
| 7/1/2017 | 9/30/2017 | 6,904.00 | 5,780.00 | 6,485.00 | ||||
| 10/1/2017 | 12/31/2017 | 7,216.00 | 6,447.00 | 7,157.00 | ||||
| 1/1/2018 | 3/31/2018 | 7,202.50 | 6,500.00 | 6,685.00 | ||||
| 4/1/2018 | 6/30/2018 | 7,262.50 | 6,625.00 | 6,646.00 | ||||
| 7/1/2018 | 9/30/2018 | 6,595.00 | 5,823.00 | 6,180.00 | ||||
| 10/1/2018 | 12/31/2018 | 6,325.00 | 5,931.50 | 5,965.00 | ||||
| 1/1/2019 | 3/31/2019 | 6,572.00 | 5,811.00 | 6,485.00 | ||||
| 4/1/2019 | 6/30/2019 | 6,509.00 | 5,756.00 | 5,972.00 | ||||
| 7/1/2019 | 9/30/2019 | 6,066.00 | 5,537.00 | 5,728.00 | ||||
| 10/1/2019 | 12/31/2019 | 6,211.00 | 5,599.00 | 6,156.00 | ||||
| 1/1/2020 | 3/31/2020 | 6,300.50 | 4,617.50 | 4,797.00 | ||||
| 4/1/2020 | 6/30/2020 | 6,038.00 | 4,772.00 | 6,038.00 | ||||
| 7/1/2020 | 9/30/2020 | 6,837.00 | 6,016.50 | 6,610.00 | ||||
| 10/1/2020 | 12/31/2020 | 7,964.00 | 6,409.50 | 7,741.50 | ||||
| 1/1/2021 | 3/31/2021 | 9,614.50 | 7,755.50 | 8,850.50 | ||||
| 4/1/2021 | 6/30/2021 | 773.50 | 611.00 | 671.50 | ||||
| 7/1/2021 | 9/30/2021 | 9,781.00 | 8,775.50 | 9,041.00 | ||||
| 10/1/2021 | 12/31/2021 | 10,652.00 | 9,091.50 | 9,692.00 | ||||
| 1/1/2022 | 3/31/2022 | 10,730.00 | 9,565.00 | 10,337.00 | ||||
| 4/1/2022 | 5/13/2022* | 10,426.00 | 9,018.00 | 9,064.00 |
* Available information for the indicated period includes data for less than the entire calendar quarter and accordingly, the “Quarterly High,” “Quarterly Low” and “Quarterly Close” data indicated are for this shortened period only.
30
The graph below illustrates the performance of copper from January 1, 2017 through May 13, 2022, based on information from Bloomberg. Past performance of copper is not indicative of the future performance of copper.

31
| Zinc |
The following table presents the published high and low prices of zinc, as well as end-of-quarter prices of zinc, for each quarter in the period from January 1, 2017 through May 13, 2022. The Commodity Price on May 13, 2022 was $3,500.00. The related graph sets forth the daily prices of zinc for the same time period. We obtained the prices of zinc and other information below from Bloomberg Financial Markets (Ticker Symbol: LOZSDY), without independent verification. The actual Initial Basket Commodity Price with respect to zinc was determined as described in the “Final Terms” on page 4 rather than the prices published by Bloomberg Financial Markets, and the Bloomberg ticker symbol is provided for reference purposes only. Zinc experiences periods of high volatility, and you should not take the historical values of zinc as an indication of future performance, and no assurance can be given as to the Commodity Price on the Determination Date.
| Quarter Begin | Quarter End | Quarterly High ($) | Quarterly Low ($) | Quarterly Close ($) | ||||
| 1/1/2017 | 3/31/2017 | 2,971.00 | 2,530.00 | 2,782.50 | ||||
| 4/1/2017 | 6/30/2017 | 2,777.00 | 2,434.50 | 2,754.00 | ||||
| 7/1/2017 | 9/30/2017 | 3,217.00 | 2,737.00 | 3,217.00 | ||||
| 10/1/2017 | 12/31/2017 | 3,370.00 | 3,094.00 | 3,309.00 | ||||
| 1/1/2018 | 3/31/2018 | 3,618.00 | 3,215.00 | 3,332.00 | ||||
| 4/1/2018 | 6/30/2018 | 3,284.50 | 2,895.00 | 2,948.00 | ||||
| 7/1/2018 | 9/30/2018 | 2,915.00 | 2,287.00 | 2,573.00 | ||||
| 10/1/2018 | 12/31/2018 | 2,740.00 | 2,506.00 | 2,510.50 | ||||
| 1/1/2019 | 3/31/2019 | 3,000.00 | 2,462.00 | 3,000.00 | ||||
| 4/1/2019 | 6/30/2019 | 3,018.00 | 2,518.00 | 2,580.50 | ||||
| 7/1/2019 | 9/30/2019 | 2,546.00 | 2,211.00 | 2,377.00 | ||||
| 10/1/2019 | 12/31/2019 | 2,595.00 | 2,221.50 | 2,293.00 | ||||
| 1/1/2020 | 3/31/2020 | 2,466.50 | 1,773.50 | 1,867.50 | ||||
| 4/1/2020 | 6/30/2020 | 2,073.00 | 1,843.00 | 2,056.50 | ||||
| 7/1/2020 | 9/30/2020 | 2,554.00 | 2,007.50 | 2,413.00 | ||||
| 10/1/2020 | 12/31/2020 | 2,841.50 | 2,298.00 | 2,723.50 | ||||
| 1/1/2021 | 3/31/2021 | 2,894.50 | 2,539.00 | 2,795.00 | ||||
| 4/1/2021 | 6/30/2021 | 3,063.50 | 2,754.50 | 2,945.50 | ||||
| 7/1/2021 | 9/30/2021 | 3,110.00 | 2,912.00 | 3,015.00 | ||||
| 10/1/2021 | 12/31/2021 | 3,815.00 | 2,999.00 | 3,630.00 | ||||
| 1/1/2022 | 3/31/2022 | 4,260.00 | 3,535.00 | 4,260.00 | ||||
| 4/1/2022 | 5/13/2022* | 4,530.00 | 3,500.00 | 3,500.00 |
* Available information for the indicated period includes data for less than the entire calendar quarter and accordingly, the “Quarterly High,” “Quarterly Low” and “Quarterly Close” data indicated are for this shortened period only.
32
The graph below illustrates the performance of zinc from January 1, 2017 through May 13, 2022, based on information from Bloomberg. Past performance of zinc is not indicative of the future performance of zinc.

33
| Additional Terms of the Notes |
Postponement of Maturity Date
If, due to a Market Disruption Event or otherwise, the date for determining the Final Basket Commodity Price of any Basket Commodity is postponed so that it falls less than two business days prior to the scheduled Maturity Date, the Maturity Date will be postponed to the second business day following the final date by which the Final Basket Commodity Price for all Basket Commodities has been determined.
Issuer Notice to Registered Security Holders, the Trustee and the Depositary
In the event that the Maturity Date is postponed due to a Market Disruption Event with respect to any Basket Commodity on the scheduled Determination Date or otherwise, the Issuer shall give notice of such postponement and, once it has been determined, of the date to which the Maturity Date has been rescheduled (i) to each registered holder of the Notes by mailing notice of such postponement by first class mail, postage prepaid, to such registered holder’s last address as it shall appear upon the registry books, (ii) to the Trustee by facsimile confirmed by mailing such notice to the Trustee by first class mail, postage prepaid, at its New York office and (iii) to The Depository Trust Company (the “Depositary”) by telephone or facsimile, confirmed by mailing such notice to the Depositary by first class mail, postage prepaid. Any notice that is mailed to a registered holder of the Notes in the manner herein provided shall be conclusively presumed to have been duly given to such registered holder, whether or not such registered holder receives the notice. The Issuer shall give such notice as promptly as possible, and in no case later than (i) with respect to notice of postponement of the Maturity Date, the business day immediately preceding the scheduled Maturity Date, and (ii) with respect to notice of the date to which the Maturity Date has been rescheduled, the business day immediately following the actual date by which the Final Basket Commodity Price for each Basket Commodity has been determined.
The Issuer shall, or shall cause the Calculation Agent to, (i) provide written notice to the Trustee, on which notice the Trustee may conclusively rely, and to the Depositary of the amount of cash, if any, to be delivered with respect to the Notes, on or prior to 10:30 a.m. (New York City time) on the business day preceding the Maturity Date, and (ii) deliver the aggregate cash amount due with respect to the Notes, if any, to the Trustee for delivery to the Depositary, as holder of the Notes, on the Maturity Date.
| Use of Proceeds and Hedging |
The proceeds from the sale of the Notes will be used by us for general corporate purposes. We will receive, in aggregate, $1,000 per Note issued, because, when we enter into hedging transactions in order to meet our obligations under the Notes, our hedging counterparty will reimburse the cost of the Agent’s commissions. The costs of the Notes borne by you and described on page 2 above comprise the Agent’s commissions and the cost of issuing, structuring and hedging the Notes. See also “Use of Proceeds and Hedging” in the accompanying prospectus supplement for commodity-linked notes.
On or prior to the Trade Date, we expect to hedge our anticipated exposure in connection with the Notes by entering into hedging transactions with our affiliates and/or third-party brokers. We expect our hedging counterparties to take positions in any of the Basket Commodities, in futures or options contracts on any of the Basket Commodities listed on major securities markets or positions in any other available securities or instruments that they may wish to use in connection with such hedging. Such purchase activity could increase the Initial Basket Commodity Prices of the Basket Commodities and, therefore, could increase the price at or above which the Basket Commodities must close on the Determination Date before you would receive at maturity a payment that exceeds the Principal Amount of the Notes. Additionally, such hedging or trading activities during the term of the Notes, including on the Determination Date, could potentially affect whether the Basket Performance is positive and, accordingly, the amount of cash you will receive at maturity. For further information on our use of proceeds and hedging, see “Use of Proceeds and Hedging” in the accompanying prospectus supplement for commodity-linked notes.
| Supplemental Plan of Distribution; Conflicts of Interest |
MS & Co. is the agent for this offering. We have agreed to sell to MS & Co., and MS & Co. has agreed to purchase, all of the Notes at the Issue Price less the underwriting discount indicated on the cover of this document. UBS Financial Services Inc., acting as dealer, will receive from MS & Co. a fixed sales commission of $15 for each Note it sells.
MS & Co. is our affiliate and a wholly owned subsidiary of Morgan Stanley, and it and other subsidiaries of ours expect to make a profit by selling, structuring and, when applicable, hedging the Notes.
MS & Co. will conduct this offering in compliance with the requirements of FINRA Rule 5121 of the Financial Industry Regulatory Authority, Inc. (“FINRA”), regarding a FINRA member firm’s distribution of the Notes of an affiliate and related conflicts of interest. MS & Co. or any of our other affiliates may not make sales in this offering to any discretionary account.
In order to facilitate the offering of the Notes, the agent may engage in transactions that stabilize, maintain or otherwise affect the price of the Notes or of the Basket Commodities. Specifically, the agent may sell more Notes than it is obligated to purchase in connection with the offering, creating a naked short position for its own account. The agent must close out any naked short
34
position by purchasing Notes in the open market. A naked short position is more likely to be created if the agent is concerned that there may be downward pressure on the price of the Notes in the open market after pricing that could adversely affect investors who purchase in the offering. As an additional means of facilitating the offering, the agent may bid for, and purchase, the Notes or the Basket Commodities in the open market to stabilize the price of the Notes or of the Basket Commodities. Any of these activities may raise or maintain the market price of the Notes above independent market levels or prevent or retard a decline in the market price of the Notes. The agent is not required to engage in these activities, and may end any of these activities at any time. An affiliate of the agent has entered into a hedging transaction with us in connection with this offering of Notes. See “—Use of Proceeds and Hedging” above.
| Validity of the Notes |
In the opinion of Davis Polk & Wardwell LLP, as special counsel to MSFL and Morgan Stanley, when the Notes offered by this pricing supplement have been executed and issued by MSFL, authenticated by the trustee pursuant to the MSFL Senior Debt Indenture (as defined in the accompanying prospectus) and delivered against payment as contemplated herein, such Notes will be valid and binding obligations of MSFL and the related guarantee will be a valid and binding obligation of Morgan Stanley, enforceable in accordance with their terms, subject to applicable bankruptcy, insolvency and similar laws affecting creditors’ rights generally, concepts of reasonableness and equitable principles of general applicability (including, without limitation, concepts of good faith, fair dealing and the lack of bad faith), provided that such counsel expresses no opinion as to (i) the effect of fraudulent conveyance, fraudulent transfer or similar provision of applicable law on the conclusions expressed above and (ii) any provision of the MSFL Senior Debt Indenture that purports to avoid the effect of fraudulent conveyance, fraudulent transfer or similar provision of applicable law by limiting the amount of Morgan Stanley’s obligation under the related guarantee. This opinion is given as of the date hereof and is limited to the laws of the State of New York, the General Corporation Law of the State of Delaware and the Delaware Limited Liability Company Act. In addition, this opinion is subject to customary assumptions about the trustee’s authorization, execution and delivery of the MSFL Senior Debt Indenture and its authentication of the Notes and the validity, binding nature and enforceability of the MSFL Senior Debt Indenture with respect to the trustee, all as stated in the letter of such counsel dated November 16, 2020, which is Exhibit 5-a to the Registration Statement on Form S-3 filed by Morgan Stanley on November 16, 2020.
35
Exhibit 107.1
| Security Type | Security Class Title | Fee Calculation or Carry Forward Rule | Amount Registered | Proposed Maximum Offering Price Per Unit | Maximum Aggregate Offering Price | Fee Rate | Amount of Registration Fee | Carry Forward Form Type | Carry Forward File Number | Carry Forward Initial Effective Date | Filing Fee Previously Paid In Connection with Unsold Securities to be Carried Forward | |
| Fees to be Paid | Unallocated (Universal) Shelf | Basket Market-Linked Notes | 456(b) | 15,181 | $1,000 | $15,181,000 | .0000927 | $1,407.28 | - | - | - | - |
| Fees Previously Paid | - | - | - | - | - | $0 | .0000927 | $0 | - | - | - | - |
Serious News for Serious Traders! Try StreetInsider.com Premium Free!
You May Also Be Interested In
- Xiaomi's 2024 investor day will boost confidence - Morgan Stanley
- Ameriprise Financial (AMP) PT Raised to $445 at Morgan Stanley
- Orange shares down despite reporting in-line core operating profit in Q1
Create E-mail Alert Related Categories
SEC FilingsRelated Entities
Morgan StanleySign up for StreetInsider Free!
Receive full access to all new and archived articles, unlimited portfolio tracking, e-mail alerts, custom newswires and RSS feeds - and more!
