

Form 40-F ENDEAVOUR SILVER CORP For: Dec 31
 Tweet
Tweet Share
ShareUNITED STATES
SECURITIES AND EXCHANGE COMMISSION
Washington, D.C. 20549
FORM 40-F
|
☐ |
|
REGISTRATION STATEMENT PURSUANT TO SECTION 12 OF THE SECURITIES EXCHANGE ACT OF 1934 |
|
OR |
||
|
☒ |
|
ANNUAL REPORT PURSUANT TO SECTION 13(a) OR 15(d) OF THE SECURITIES EXCHANGE ACT OF 1934 |
For the fiscal year ended December 31, 2020
| Commission file number: 001-33153 |

ENDEAVOUR SILVER CORP.
(Exact Name of Registrant as Specified in its Charter)
|
British Columbia |
|
1040 |
|
N/A |
|
(Province or other jurisdiction of incorporation or organization) |
|
(Primary Standard Industrial Classification Code) |
|
(I.R.S. Employer Identification No.) |
#1130-609 Granville Street
Vancouver, British Columbia, Canada V7Y 1G5
(604) 685-9775
(Address and Telephone Number of Registrant's Principal Executive Offices)
|
DL Services Inc. Columbia Center, 701 Fifth Avenue, Suite 6100 Seattle, Washington 98104 (206) 903-8800 |
Copies to: Jason K. Brenkert Dorsey & Whitney LLP Denver, Colorado 80202-5549 (303) 629-3400 |
|
(Name, address (including zip code) and telephone number (including area code) of agent for service in the United States) |
Securities registered or to be registered pursuant to Section 12(b) of the Act:
|
Title of Each Class: |
Trading Symbol(s) |
Name of Each Exchange On Which Registered: |
|
Common Shares, no par value |
EXK |
New York Stock Exchange |
Securities registered or to be registered pursuant to Section 12(g) of the Act: None
Securities for which there is a reporting obligation pursuant to Section 15(d) of the Act: None
For annual reports, indicate by check mark the information filed with this form:
☒ Annual Information Form ☒ Audited Annual Financial Statements
Indicate the number of outstanding shares of each of the issuer's classes of capital or common stock as of the close of the period covered by the annual report: As at December 31, 2020, 157,924,708 common shares of the Registrant were issued and outstanding.
Indicate by check mark whether the Registrant (1) has filed all reports required to be filed by Section 13 or 15(d) of the Exchange Act during the preceding 12 months (or for such shorter period that the Registrant was required to file such reports) and (2) has been subject to such filing requirements for the past 90 days. ☒ Yes ☐ No
Indicate by check mark whether the registrant has submitted electronically every Interactive Data File required to be submitted pursuant to Rule 405 of Regulation S-T (§232.405 of this chapter) during the preceding 12 months (or for such shorter period that the registrant was required to submit such files). ☒ Yes ☐ No
Indicate by check mark whether the registrant is an emerging growth company as defined in Rule 12b-2 of the Exchange Act.
☐ Emerging growth company.
If an emerging growth company that prepares its financial statements in accordance with U.S. GAAP, indicate by check mark if the registrant has elected not to use the extended transition period for complying with any new or revised financial accounting standards provided pursuant to Section 13(a) of the Exchange Act. ☐
Indicate by check mark whether the registrant has filed a report on and attestation to its management's assessment of the effectiveness of its internal control over financial reporting under Section 404(b) of the Sarbanes-Oxley Act (15 U.S.C. 7262(b)) by the registered public accounting firm that prepared or issued its audit report: ☒
EXPLANATORY NOTE
Endeavour Silver Corp. (the "Company" or the "Registrant") is a Canadian issuer eligible to file its annual report pursuant to Section 13 of the Securities Exchange Act of 1934, as amended (the "Exchange Act"), on Form 40-F pursuant to the multi-jurisdictional disclosure system of the Exchange Act. The Company is a "foreign private issuer" as defined in Rule 3b-4 under the Exchange Act. Equity securities of the Company are accordingly exempt from Sections 14(a), 14(b), 14(c), 14(f) and 16 of the Exchange Act pursuant to Rule 3a12-3 thereunder.
FORWARD-LOOKING STATEMENTS
This annual report on Form 40-F and the exhibits attached hereto contain "forward-looking statements" within the meaning of the Private Securities Litigation Reform Act of 1995. Any statements that express or involve discussions with respect to predictions, expectations, beliefs, plans, projections, objectives, assumptions or future events or performance (often, but not always, using words or phrases such as "expects" or "does not expect", "is expected", "anticipates" or "does not anticipate", "plans", "estimates" or "intends", or stating that certain actions, events or results "may", "could", "would", "might" or "will" (or the negative and grammatical variations of any of these terms and similar expressions) be taken, occur or be achieved,) are not statements of historical fact and may be forward-looking statements. Such forward-looking statements concern the Company's anticipated results and developments in the Company's operations in future periods, planned exploration and development of its properties, plans related to its business and other matters that may occur in the future.
Forward looking statements are made based upon certain assumptions and other important factors that, while considered reasonable by the Company, are inherently subject to significant business economic, competitive, political and social uncertainties and contingencies. The Company has made assumptions based on many of these factors which include, without limitation, present and future business strategies, the environment in which the Company will operate in the future, including the price of silver and gold, anticipated cost and the ability to achieve goals.
Statements concerning reserves and mineral resource estimates may also be deemed to constitute forward-looking statements to the extent that they involve estimates of the mineralization that will be encountered if the Company's property is developed, and in the case of mineral reserves, such statements reflect the conclusion based on certain assumptions that a mineral deposit can be economically exploited. Forward-looking statements are subject to a variety of known and unknown risks, uncertainties and other factors which could cause actual events or results to differ from those expressed or implied by the forward-looking statements, including, without limitation:
-
risks related to precious and base metal price fluctuations;
-
risks related to fluctuations in the currency markets (particularly the Mexican peso, Canadian dollar and United States dollar);
-
uncertainty as to duration and impact of the current novel coronavirus ("COVID-19") pandemic;
-
risks related to the inherently dangerous activity of mining, including conditions or events beyond our control, and operating or technical difficulties in mineral exploration, development and mining activities;
-
uncertainty in our ability to fund the development of our mineral properties or the completion of further exploration programs;
-
uncertainty as to actual capital costs, operating costs, production and economic returns, and uncertainty that our development activities will result in profitable mining operations;
-
risks related to our reserves and mineral resource figures being estimates based on interpretations and assumptions which may result in less mineral production under actual conditions than is currently estimated and to diminishing quantities or grades of mineral reserves as properties are mined;
-
risks related to changes in governmental regulations, tax and labour laws and obtaining necessary licenses and permits;
-
risks related to our business being subject to environmental laws and regulations which may increase our costs of doing business and restrict our operations;
-
risks related to our mineral properties being subject to prior unregistered agreements, transfers, or claims and other defects in title;
-
risks relating to inadequate insurance or inability to obtain insurance;
-
risks related to our ability to successfully integrate acquisitions;
-
uncertainty in our ability to obtain necessary financing;
-
risks related to increased competition that could adversely affect our ability to attract necessary capital funding or acquire suitable producing properties for mineral exploration in the future;
-
risks related to many of our primary properties being located in Mexico, including political, economic, and regulatory instability;
-
risks related to our officers and directors becoming associated with other natural resource companies which may give rise to conflicts of interests
-
risks relating to financial instruments; and
-
risks relating to our securities
This list is not exhaustive of the factors that may affect our forward-looking statements. Some of the important risks and uncertainties that could affect forward-looking statements are described further in the exhibits attached to this annual report on Form 40-F, including in the Annual Information Form ("AIF") of the Company filed as Exhibit 99.1 to this annual report on Form 40-F and are incorporated by reference herein. Should one or more of these risks and uncertainties materialize, or should underlying assumptions prove incorrect, actual results may vary materially from those described in the forward-looking statements. The Company's forward-looking statements are based on beliefs, expectations and opinions of management on the date the statements are made and the Company does not assume any obligation to update forward-looking statements if circumstances or management's beliefs, expectations or opinions change, except as required by law. For the reasons set forth above, investors should not place undue reliance on forward-looking statements.
NOTE TO UNITED STATES READERS-
DIFFERENCES IN UNITED STATES AND CANADIAN REPORTING PRACTICES
The Company is permitted, under the multi-jurisdictional disclosure system adopted by the United States Securities and Exchange Commission (the "SEC"), to prepare this annual report on Form 40-F in accordance with Canadian disclosure requirements, which differ from those of the United States. The Company has prepared its consolidated financial statements, which are filed as Exhibit 99.2 to this annual report on Form 40-F, in accordance with International Financial Reporting Standards as issued by the International Accounting Standards Board ("IFRS") and they are not comparable to financial statements of United States companies.
MINERAL RESOURCE AND RESERVE ESTIMATES
The Company's AIF filed as Exhibit 99.1 to this annual report on Form 40-F and management's discussion and analysis for the fiscal year ended December 31, 2020 filed as Exhibit 99.3 have been prepared in accordance with the requirements of Canadian provincial securities laws, which differ from the requirements of United States securities laws.
Unless otherwise indicated, all mineral reserve and mineral resource estimates included have been prepared in accordance with Canadian National Instrument 43-101- Standards of Disclosure for Mineral Projects ("NI 43-101") and the Canadian Institute of Mining, Metallurgy and Petroleum (the "CIM") - CIM Definition Standards on Mineral Resources and Mineral Reserves, adopted by the CIM Council, as amended. NI 43-101 is an instrument developed by the Canadian Securities Administrators that establishes standards for all public disclosure an issuer makes of scientific and technical information concerning mineral projects. These definitions differ from the definitions in requirements under United States securities laws adopted by the United States Securities and Exchange Commission.
Under Canadian rules, estimates of inferred mineral resources may not form the basis of feasibility or pre-feasibility studies, except in rare cases. Investors are cautioned not to assume that all or any part of an inferred mineral resource exists or is economically or legally mineable. An "inferred mineral resource" is that part of a mineral resource for which quantity and grade or quality are estimated on the basis of limited geological evidence and sampling. Geological evidence is sufficient to imply but not verify geological and grade or quality continuity. An inferred mineral resource has a lower level of confidence than that applying to an indicated mineral resource and must not be converted to a mineral reserve. It is reasonably expected that the majority of inferred mineral resources could be upgraded to indicated mineral resources with continued exploration.
Investors are cautioned not to assume that all or any part of mineral reserves and mineral resources determined in accordance with NI 43-101 and CIM standards will qualify as, or be identical to, mineral reserves and mineral resources estimated under the standards of the SEC applicable to U.S. companies. The SEC has adopted amendments to its disclosure rules to modernize the mineral property disclosure requirements for issuers whose securities are registered with the SEC. As a foreign private issuer filing this annual report on Form 40-F with the SEC pursuant to the multi-jurisdictional disclosure system, the Company is not required to provide disclosure on its mineral properties under the SEC's new rules and will continue to provide disclosure under NI 43-101 and the CIM standards. If the Company ceases to be a foreign private issuer or lose its eligibility to file its annual report on Form 40-F pursuant to the multi-jurisdictional disclosure system, then the Company will be subject to the new SEC rules, which differ from the requirements of NI 43-101 and the CIM standards.
Accordingly, information contained in the Company's AIF filed as Exhibit 99.1 to this annual report on Form 40-F and management's discussion and analysis for the fiscal year ended December 31, 2020 filed as Exhibit 99.3 that contain descriptions of the Company's mineral deposits may not be comparable to similar information made public by U.S. companies subject to the reporting and disclosure requirements under the United States federal securities laws and the rules and regulations thereunder.
CURRENCY
Unless otherwise indicated, all dollar amounts in this annual report on Form 40-F are in United States dollars. The exchange rate of Canadian dollars into United States dollars, on December 31, 2020, based upon the closing exchange rate as quoted by the Bank of Canada, was Cdn.$1.00 = US.$0.7854.
ANNUAL INFORMATION FORM
The Company's AIF for the fiscal year ended December 31, 2020 is filed as Exhibit 99.1 to this annual report on Form 40-F and is incorporated by reference herein.
AUDITED ANNUAL FINANCIAL STATEMENTS
The audited consolidated financial statements of the Company for the years ended December 31, 2020 and 2019, including the report of the independent auditor with respect thereto, are filed as Exhibit 99.2 to this annual report on Form 40-F and are incorporated by reference herein.
MANAGEMENT'S DISCUSSION AND ANALYSIS
The Company's management's discussion and analysis for the fiscal year ended December 31, 2020 ("MD&A") is filed as Exhibit 99.3 to this annual report on Form 40-F and is incorporated by reference herein.
TAX MATTERS
Purchasing, holding, or disposing of the Company's securities may have tax consequences under the laws of the United States and Canada that are not described in this annual report on Form 40-F or the documents incorporated by reference herein.
CONTROLS AND PROCEDURES
Disclosure Controls and Procedures
At the end of the period covered by this annual report on Form 40-F for the fiscal year ended December 31, 2020, an evaluation was carried out under the supervision of, and with the participation of, the Company's management, including its Chief Executive Officer (CEO) and Chief Financial Officer (CFO), of the effectiveness of the design and operation of the Company's disclosure controls and procedures (as defined in Rule 13a-15(e) of the Exchange Act). Based upon that evaluation, the Company's CEO and CFO have concluded that the Company's disclosure controls and procedures were effective to give reasonable assurance that the information required to be disclosed by the Company in reports that it files or submits under the Exchange Act is (i) recorded, processed, summarized and reported, within the time periods specified in the SEC's rules and forms, and (ii) accumulated and communicated to management, including its principal executive and principal financial officers, or persons performing similar functions, as appropriate to allow timely decisions regarding required disclosure.
Management's Report on Internal Control over Financial Reporting
Management is responsible for establishing and maintaining adequate internal control over financial reporting, as defined in Rules 13a-15(f) of the Exchange Act. A company's internal control over financial reporting is a process designed to provide reasonable assurance regarding the reliability of financial reporting and the preparation of financial statements for external purposes in accordance with generally accepted accounting principles.
A company's internal control over financial reporting includes those policies and procedures that (i) pertain to the maintenance of records that, in reasonable detail, accurately and fairly reflect the transactions and dispositions of the assets of the company; (ii) provide reasonable assurance that transactions are recorded as necessary to permit preparation of financial statements in accordance with generally accepted accounting principles, and that receipts and expenditures of the company are being made only in accordance with authorizations of management and directors of the company; and (iii) provide reasonable assurance regarding prevention or timely detection of unauthorized acquisition, use, or disposition of the company's assets that could have a material effect on the financial statements. It should be noted that a control system, no matter how well conceived or operated, can only provide reasonable assurance, not absolute assurance, that the objectives of the control system are met.
Also, projections of any evaluation of effectiveness to future periods are subject to the risk that controls may become inadequate because of changes in conditions, or that the degree of compliance with policies and procedures may deteriorate.
Management, including the CEO and CFO, assessed the effectiveness of the Company's internal control over financial reporting as of December 31, 2020. In making this assessment, management used the criteria set forth in the Internal Control Integrated Framework (2013) issued by the Committee of Sponsoring Organizations of the Treadway Commission (COSO). Based on its assessment, management has concluded that, as of December 31, 2020, the Company's internal control over financial reporting was effective and no material weaknesses in the Company's internal control over financial reporting were discovered.
The Company is required to provide an auditor's attestation report on its internal control over financial reporting for the fiscal year ended December 31, 2020. In this annual report on Form 40-F, the Company's independent registered public accounting firm, KPMG LLP ("KPMG"), has provided its opinion as to the effectiveness of the Company's internal control over financial reporting as of December 31, 2020. KPMG has also audited the Company's financial statements included in this annual report on Form 40-F and issued a report thereon.
Auditor's Attestation Report
KPMG's attestation report on the Company's internal control over financial reporting is included in the Audited Consolidated Financial Statements filed in Exhibit 99.2 of this annual report on Form 40-F and is incorporated by reference herein.
Changes in Internal Control over Financial Reporting
There have been no changes in internal control over financial reporting that occurred during the fiscal year ended December 31, 2020 that have materially affected, or are reasonably likely to materially affect, our internal control over financial reporting.
CORPORATE GOVERNANCE
The Company's Board of Directors (the "Board of Directors") is responsible for the Company's Corporate Governance policies and has separately designated standing Compensation, Corporate Governance and Nominating, and Audit Committees. The Board of Directors has determined that all the members of the Compensation, Corporate Governance and Nominating, and Audit Committees are independent, based on the criteria for independence prescribed by section 303A.02 of the NYSE Listed Company Manual.
Compensation Committee
Compensation of the Company's CEO and all other officers is recommended by management to the Compensation Committee, established in accordance with section 303A.05 of the NYSE Listed Company Manual, for evaluation and recommendation to the Board of Directors.
The Compensation Committee develops, reviews and monitors director and executive compensation and policies. The Compensation Committee is also responsible for annually reviewing the adequacy of compensation for directors and others and the composition of compensation packages. The Company's CEO cannot be present during the Committee's deliberations or vote. The Compensation Committee is composed of four independent directors (as determined under section 303A.02 and section 303A.05 of the NYSE Listed Company Manual): Ricardo Campoy (Chair), Geoffrey Handley, Ken Pickering and Mario Szotlender. The Company's Compensation Committee Charter is available on the Company's website at www.edrsilver.com.
Corporate Governance and Nominating Committee
The Company's Corporate Governance and Nominating Committee, established in accordance with section 303A.04 of the NYSE Listed Company Manual, is tasked with (a) developing and recommending to the Board of Directors corporate governance principles applicable to the Company; (b) identifying and recommending qualified individuals for nomination to the Board of Directors; and (c) providing such assistance as the Chair of the Board of Directors, if independent, or alternatively the lead director of the Board of Directors, may require. The Corporate Governance and Nominating Committee is composed of three independent directors (as determined under Section 303A.02 of the NYSE Listed Company Manual): Geoffrey Handley (Chair), Rex McLennan, Mario Szotlender and Margaret Beck. The Corporate Governance and Nominating Committee Charter is available on the Company's website at www.edrsilver.com.
The principal corporate governance responsibilities of the Corporate Governance and Nominating Committee include the following:
a) reviewing and reassessing at least annually the adequacy of the Company's corporate governance procedures and recommending any proposed changes to the Board of Directors for approval;
b) reviewing and recommending changes to the Board of Directors of the Company's Code of Conduct and considering any requests for waivers from the Company's Code of Conduct;
c) receiving comments from all directors and reporting annually to the Board of Directors with an assessment of the Board of Director's performance to be discussed with the full Board of Directors following the end of each fiscal year.
The principal responsibilities of the Corporate Governance and Nominating Committee for selection and nomination of director nominees include the following:
a) in making recommendations to the Board of Directors regarding director nominees, the Corporate Governance and Nominating Committee shall consider the appropriate size of the Board of Directors; the competencies and skills that the Board of Directors considers to be necessary for the Board of Directors, as a whole, to possess; the competencies and skills that the Board of Directors considers each existing director to possess; the competencies and skills each new nominee will bring to the Board of Directors; and whether or not each new nominee can devote sufficient time and resources to the nominee's duties as a director of the Company;
b) developing qualification criteria for directors for recommendation to the Board of Directors and, in conjunction with the Chair of the Board of Directors (or, if the Chair is not an independent director, any lead director of the Board of Directors), the Corporate Governance and Nominating Committee shall appoint directors to the various committees of the Board of Directors;
c) having the sole authority to retain and terminate any search firm to be used to identify director candidates or any other outside advisors considered necessary to carry out its duties and to determine the terms of such retainer;
d) in conjunction with the Chair of the Board of Directors (or, if the Chair of the Board of Directors is not an independent director, any lead director of the Board of Directors), overseeing the evaluation of the Board of Directors and of the Company and making recommendations to the Board of Directors as appropriate.
AUDIT COMMITTEE
The Company's Board of Directors has a separately designated standing Audit Committee established in accordance with section 3(a)(58)(A) of the Exchange Act and section 303A.06 and 303A.07 of the NYSE Listed Company Manual. The Company's Audit Committee is comprised of:
- Rex McLennan (Chair)
- Ken Pickering
- Ricardo Campoy
- Margaret Beck
In the opinion of the Company's Board of Directors, all members of the Audit Committee are independent (as determined under Rule 10A-3 of the Exchange Act and section 303A.02 of the NYSE Listed Company Manual) and are financially literate. The members of the Audit Committee do not have fixed terms and are appointed and replaced from time to time by resolution of the Board of Directors.
The Audit Committee meets with the Company's President, the CEO, the CFO and the Company's independent auditors to review and inquire into matters affecting financial reporting, the system of internal accounting and financial controls, as well as audit procedures and audit plans. The Audit Committee also recommends to the Board of Directors which independent registered public auditing firm should be appointed by the Company. In addition, the Audit Committee reviews and recommends to the Board of Directors for approval the annual financial statements, the MD&A, and undertakes other activities required by exchanges on which the Company's securities are listed and by regulatory authorities to which the Company is held responsible. The Company's Audit Committee Charter is available on the Company's website at www.edrsilver.com.
Audit Committee Financial Expert
The Company's Board of Directors has determined that Rex McLennan qualifies as a financial expert (as defined in Item 407 (d)(5)(ii) of Regulation S-K under the Exchange Act), has financial management expertise (pursuant to section 303A.07 of the NYSE Listed Company Manual) and is independent (as determined under Exchange Act Rule 10A-3 and section 303A.02 of the NYSE Listed Company Manual).
PRINCIPAL ACCOUNTING FEES AND SERVICES - INDEPENDENT AUDITORS
The following table shows the aggregate fees billed to the Company by KPMG LLP, Chartered Professional Accountants, the Company's independent registered public auditing firm, and its affiliates in each of the last two years.
|
|
2020 |
2019 |
|
Audit Fees (1) |
$822,922 |
$625,590 |
|
Tax Fees (2) |
$0 |
$0 |
|
All other fees (3) |
$0 |
$0 |
|
Total* |
$822,922 |
$625,590 |
* All amounts are expressed in Canadian dollars
(1) The aggregate fees billed in each of the last two fiscal years for audit services by the Company's external auditor that are reasonably related to the performance of the audit or review of the Company's financial statements.
(2) The aggregate fees billed in each of the last two fiscal years for professional services rendered by the company's external auditor for tax compliance and tax advice.
(3) The aggregate fees billed in each of the last two fiscal years for products and services provided by the Company's external auditor, other than the services reported under clauses 1and 2 above.
PRE-APPROVAL OF AUDIT AND NON-AUDIT SERVICES PROVIDED BY
INDEPENDENT AUDITORS
The Audit Committee pre-approves all audit services to be provided to the Company by its independent auditors. Non-audit services that are prohibited to be provided to the Company by its independent auditors may not be pre-approved. In addition, prior to the granting of any pre-approval, the Audit Committee must be satisfied that the performance of the services in question will not compromise the independence of the independent auditors. All non-audit services performed by the Company's auditor for the fiscal year ended December 31, 2020 were pre-approved by the Audit Committee of the Company. No non-audit services were approved pursuant to the de minimis exemption to the pre-approval requirement.
OFF-BALANCE SHEET TRANSACTIONS
The Company does not have any off-balance sheet financing arrangements or relationships with unconsolidated special purpose entities.
CODE OF ETHICS
The Company has adopted a Code of Business Conduct and Ethics (the "Code") that applies to all the Company's directors, executive officers and employees, which is available on the Company's website at www.edrsilver.com and in print to any shareholder who requests it. The Code meets the requirements for a "code of ethics" within the meaning of that term in General Instruction 9(b) of Form 40-F.
All amendments to the Code, and all waivers of the Code with respect to any of the officers covered by it, will be posted on the Company's website, www.edrsilver.com within five business days of the amendment or waiver and will remain available for a twelve-month period and provided in print to any shareholder who requests them. During the fiscal year ended December 31, 2020, the Company did not substantively amend, waive or implicitly waive any provision of the Code with respect to any of the directors, executive officers or employees subject to it.
CONTRACTUAL OBLIGATIONS
The following table lists as of December 31, 2020 information with respect to the Company's known contractual obligations.
| Payments due by period (in thousands of dollars) | |||||||||||||||
| Contractual Obligations | Total | Less than 1 year | 1 - 3 years | 3 - 5 years | More than 5 years | ||||||||||
| Accounts Payable | $ | 27,764 | $ | 27,764 | $ | - | $ | - | $ | - | |||||
| Income Tax Payable | 3,038 | 3,038 | - | - | - | ||||||||||
| Loans payable | 9,672 | 3,582 | 5,598 | 492 | - | ||||||||||
| Lease liabilities | 1,094 | 173 | 287 | 247 | 387 | ||||||||||
| Operating Leases | 856 | 135 | 219 | 219 | 283 | ||||||||||
| Capital Commitments | 955 | 955 | - | - | - | ||||||||||
| Other Long-Term Liabilities(1) | 8,876 | - | 4,673 | 1,978 | 2,225 | ||||||||||
| Total | $ | 52,255 | $ | 35,647 | $ | 10,777 | $ | 2,936 | $ | 2,895 | |||||
(1) The $8.9 million of other long-term liabilities is the discounted cost estimate to settle the Company's reclamation costs of the Guanacevi mine, Bolanitos mine, El Cubo mine and El Compas mine in Mexico. These costs include land rehabilitation, decommissioning of buildings and mine facilities, on-going care and maintenance and other costs.
NOTICES PURSUANT TO REGULATION BTR
There were no notices required by Rule 104 of Regulation BTR that the Registrant sent during the year ended December 31, 2020 concerning any equity security subject to a blackout period under Rule 101 of Regulation BTR.
NYSE CORPORATE GOVERNANCE
The Company's common shares are listed on the NYSE. Sections 103.00 and 303A.11 of the NYSE Listed Company Manual permit foreign private issuers to follow home country practices in lieu of certain provisions of the NYSE Listed Company Manual. A foreign private issuer that follows home country practices in lieu of certain provision of the NYSE Listed Company Manual must disclose any significant ways in which its corporate governance practices differ from those followed by domestic companies either on the its website or in the annual report that it distributes to shareholders in the United States. A description of the significant ways in which the Company's governance practices differ from those followed by domestic companies pursuant to NYSE standards is as follows:
Shareholder Meeting Quorum Requirement: The NYSE is of the opinion that the quorum required for any meeting of shareholders should be sufficiently high to insure a representative vote. The Company's quorum requirement is set forth in its Memorandum and Articles. A quorum for a meeting of members of the Company is two persons who are, or who represent by proxy, shareholders who, in the aggregate, hold at least 5% of the shares entitled to be voted at the meeting.
Proxy Delivery Requirement: The NYSE requires the solicitation of proxies and delivery of proxy statements for all shareholder meetings, and requires that these proxies shall be solicited pursuant to a proxy statement that conforms to SEC proxy rules. The Company is a "foreign private issuer" as defined in Rule 3b-4 under the Exchange Act, and the equity securities of the Company are accordingly exempt from the proxy rules set forth in Sections 14(a), 14(b), 14(c) and 14(f) of the Exchange Act. The Company solicits proxies in accordance with applicable rules and regulations in Canada.
Shareholder Approval Requirement: The Company will follow Toronto Stock Exchange rules for shareholder approval of new issuances of its common shares. Following Toronto Stock Exchange rules, shareholder approval is required for certain issuances of shares that: (i) materially affect control of the Company; or (ii) provide consideration to insiders in aggregate of 10% or greater of the market capitalization of the listed issuer and have not been negotiated at arm's length. Shareholder approval is also required, pursuant to Toronto Stock Exchange rules, in the case of private placements: (x) for an aggregate number of listed securities issuable greater than 25% of the number of securities of the listed issuer which are outstanding, on a non-diluted basis, prior to the date of closing of the transaction if the price per security is less than the market price; or (y) that during any six month period are to insiders for listed securities or options, rights or other entitlements to listed securities greater than 10% of the number of securities of the listed issuer which are outstanding, on a non-diluted basis, prior to the date of the closing of the first private placement to an insider during the six month period.
The foregoing are consistent with the laws, customs and practices in Canada.
In addition, the Company may from time-to-time seek relief from the NYSE corporate governance requirements on specific transactions under the NYSE Listed Company Guide, in which case, the Company shall make the disclosure of such transactions available on the Company's website at www.edrsilver.com. Information contained on the Company's website is not part of this annual report on Form 40-F.
MINE SAFETY DISCLOSURE
Pursuant to Section 1503(a) of the Dodd-Frank Wall Street Reform and Consumer Protection Act of 2010 ("Dodd-Frank Act"), issuers that are operators, or that have a subsidiary that is an operator, of a coal or other mine in the United States are required to disclose in their periodic reports filed with the SEC information regarding specified health and safety violations, orders and citations, related assessments and legal actions, and mining-related fatalities under the regulation of the Federal Mine Safety and Health Administration ("MSHA") under the Federal Mine Safety and Health Act of 1977 (the "Mine Act"). During the fiscal year ended December 31, 2020, the Company had no mines in the United States subject to regulation by MSHA under the Mine Act.
UNDERTAKING
The Company undertakes to make available, in person or by telephone, representatives to respond to inquiries made by the Commission staff, and to furnish promptly, when requested to do so by the Commission staff, information relating to: the securities registered pursuant to Form 40-F; the securities in relation to which the obligation to file an annual report on Form 40-F arises; or transactions in said securities.
CONSENT TO SERVICE OF PROCESS
The Company filed an Appointment of Agent for Service of Process and Undertaking on Form F-X/A with the SEC on February 25, 2021, with respect to the class of securities in relation to which the obligation to file this annual report on Form 40-F arises. Any change to the name or address of the agent for service of process will be communicated promptly to the SEC by amendment to Form F-X/A referencing the Company's file number.
EXHIBIT INDEX
The following exhibits have been filed as part of this annual report on Form 40-F:
10
SIGNATURES
Pursuant to the requirements of the Exchange Act, the Registrant certifies that it meets all of the requirements for filing on Form 40-F and has duly caused this annual report to be signed on its behalf by the undersigned, thereto duly authorized.
ENDEAVOUR SILVER CORP.
By:__/s/ Bradford Cooke
Name: Bradford Cooke
Title: Chief Executive Officer
Date: March 1, 2021
ANNUAL INFORMATION FORM
of
ENDEAVOUR SILVER CORP.
(the "Company" or "Endeavour")
Suite 1130 - 609 Granville Street
Vancouver, British Columbia
Canada, V7Y 1G5
Phone: (604) 685-9775
Fax: (604) 685-9744
Dated as of February 25, 2021
TABLE OF CONTENTS
ITEM 1: PRELIMINARY NOTES
1.1 Incorporation of Documents by Reference
All financial information in this Annual Information Form ("AIF") has been prepared in accordance with International Financial Reporting Standards ("IFRS") as prescribed by the International Accounting Standards Board.
The information provided in the AIF is supplemented by disclosure contained in the documents listed below which are incorporated by reference into this AIF. The documents listed below are not contained within, nor attached to, this document but may be accessed at www.sedar.com or on the Company's website at www.edrsilver.com.
|
Type of Document |
Report Date / Effective Date |
Date Filed / Posted |
Document name which may be viewed at the SEDAR website at www.sedar.com |
|
NI 43-101 Technical Report: Updated Mineral Resource and Reserve Estimates for the Guanaceví Project, Durango State, Mexico |
Dated March 3, 2017 and amended March 27, 2018 (Effective date: December 31, 2016) |
April 6, 2018 |
Amended & restated technical report (NI 43-101) - English Qualification Certificate(s) and Consent(s) |
|
NI 43-101 Technical Report: Updated Mineral Resource and Reserve Estimates for the Bolañitos Project, Guanajuato State, Mexico |
Dated March 3, 2017 and amended March 27, 2018 (Effective date: December 31, 2016) |
April 6, 2018 |
Amended & restated technical report (NI 43-101) - English Qualification Certificate(s) and Consent(s) |
|
NI 43-101 Technical Report: Technical Report for the Terronera Project, Jalisco State, Mexico |
Dated July 14, 2020 (Effective date: July 31, 2020) |
August 6, 2020 |
Technical Report (NI 43-101) - English Qualification Certificate(s) and Consent(s) |
References to "the Company" or "Endeavour" are to Endeavour Silver Corp. and where applicable and as the context requires, include its subsidiaries.
1.2 Date of Information
All information in this AIF is as of December 31, 2020 unless otherwise indicated.
1.3 Forward-Looking Statements
This AIF contains "forward-looking statements" within the meaning of applicable Canadian securities legislation. Any statements that express or involve discussions with respect to predictions, expectations, beliefs, plans, projections, forecasts, objectives, assumptions or future events or performance are not statements of historical fact and may be forward-looking statements. Such forward-looking statements concern the Company's anticipated results and developments in the Company's operations in future periods, planned exploration and development of its properties, plans related to its business and other matters that may occur in the future. These statements relate to analyses and other information that are based on expectations of future performance, including silver and gold production and planned work programs.
Statements concerning reserves and mineral resource estimates may also be deemed to constitute forward-looking statements to the extent that they involve estimates of the mineralization that will be encountered if the property is developed and, in the case of mineral reserves, such statements reflect the conclusion based on certain assumptions that the mineral deposit can be economically exploited.
Forward-looking statements are made based upon certain assumptions and other important factors that, while considered reasonable by the Company, are inherently subject to significant business economic, competitive, political and social uncertainties and contingencies. The Company has made assumptions based on many of these factors which include, without limitation, present and future business strategies, the environment in which the Company will operate in the future, including the price of silver and gold, anticipated cost and the ability to achieve goals.
Forward-looking statements are subject to a variety of known and unknown risks, uncertainties and other factors which could cause actual events or results to differ from those expressed or implied by the forward-looking statements, including, without limitation:
- risks related to precious and base metal price fluctuations;
- risks related to fluctuations in the currency markets (particularly the Mexican peso, Chilean peso, Canadian dollar and United States dollar);
- uncertainty as to duration and impact of the current novel coronavirus ("COVID-19") pandemic;
- risks related to the inherently dangerous activity of mining, including conditions or events beyond our control, and operating or technical difficulties in mineral exploration, development and mining activities;
- uncertainty in our ability to fund the development of our mineral properties or the completion of further exploration programs;
- uncertainty as to actual capital costs, operating costs, production and economic returns, and uncertainty that our development activities will result in profitable mining operations;
- risks related to our reserves and mineral resource figures being estimates based on interpretations and assumptions which may result in less mineral production under actual conditions than is currently estimated and to diminishing quantities or grades of mineral reserves as properties are mined;
- risks related to changes in governmental regulations, tax and labour laws and obtaining necessary licenses and permits;
- risks related to our business being subject to environmental laws and regulations which may increase our costs of doing business and restrict our operations;
- risks related to our mineral properties being subject to prior unregistered agreements, transfers, or claims and other defects in title;
- risks relating to inadequate insurance or inability to obtain insurance;
- risks related to our ability to successfully integrate acquisitions;
- uncertainty in our ability to obtain necessary financing;
- risks related to increased competition that could adversely affect our ability to attract necessary capital funding or acquire suitable producing properties for mineral exploration in the future;
- risks related to many of our primary properties being located in Mexico, including political, economic, and regulatory instability;
- risks related to our officers and directors becoming associated with other natural resource companies which may give rise to conflicts of interests;
- risks relating to financial instruments; and
- risks relating to our securities.
This list is not exhaustive of the factors that may affect our forward-looking statements. Should one or more of these risks and uncertainties materialize, or should underlying assumptions prove incorrect, actual results may vary materially from those described in the forward-looking statements. The Company's forward-looking statements are based on beliefs, expectations and opinions of management on the date the statements are made and the Company does not assume any obligation to update forward-looking statements if circumstances or management's beliefs, expectations or opinions change, except as required by law. For the reasons set forth above, investors should not place undue reliance on forward-looking statements.
1.4 Conversion Table
All data and information is presented in metric units. In this Annual Information Form, the following conversion factors were used:
|
2.47 acres |
= |
1 hectare |
1% |
= |
10,000 ppm |
|
3.28 feet |
= |
1 metre |
0.4047 hectares |
= |
1 acre |
|
0.62 miles |
= |
1 kilometre |
0.3048 metres |
= |
1 foot |
|
0.032 ounces (troy) |
= |
1 gram |
1.609 kilometres |
= |
1 mile |
|
1.102 tons (short) |
= |
1 tonne |
31.103 grams |
= |
1 ounce (troy) |
|
0.029 ounces/ton |
= |
1 gram/tonne |
0.907 tonnes |
= |
1 ton |
|
1 ppm |
= |
1 gram/tonne |
34.286 grams/tonne |
= |
1 ounce/ton |
|
1 ounce/ton |
= |
34.286 ppm |
|
|
|
1.5 Technical Abbreviations
|
Ag |
silver |
|
m |
metres |
|
Ag Eq. |
silver equivalent |
|
NI 43-101 |
National Instrument 43-101 Standards of Disclosure for Mineral Projects |
|
Au |
gold |
|
NSR |
net smelter returns |
|
Au Eq. |
gold equivalent |
|
opt |
ounces per ton |
|
aver. |
average |
|
oz |
ounce(s) |
|
cm |
centimetres |
|
Pb |
lead |
|
g |
grams |
|
RC |
reverse circulation |
|
gpt or g/t |
grams per tonne |
|
t |
tonne |
|
ha |
hectares |
|
tpd |
tonnes per day |
|
km |
kilometres |
|
tr |
trench |
|
lb |
pound |
|
Zn |
zinc |
1.6 Currency and Exchange Rates
All dollar amounts in this AIF are expressed in U.S. dollars ("$") unless otherwise indicated. References to "Cdn.$" are to Canadian dollars.
The high, low, average and closing rates for the United States dollar in terms of Canadian dollars for each of the financial periods of the Company ended December 31, 2020, December 31, 2019 and December 31, 2018, as quoted by the Bank of Canada, were as follows:
|
|
Year ended December 31, 2020 |
Year ended December 31, 2019 |
Year ended December 31, 2018 |
|
|
|
||
|
High |
1.4496 |
1.3600 |
1.3642 |
|
Low |
1. 2718 |
1.2988 |
1.2288 |
|
Average |
1.3415 |
1.3269 |
1.2957 |
|
Closing |
1.2732 |
1.2988 |
1.3642 |
On December 31, 2020, the closing exchange rate for the United States dollar in terms of Canadian dollars, as quoted by the Bank of Canada, was U.S.$1.00 = Cdn.$1.2732 (Cdn.$1.00 = U.S.$0.7855). On February 25, 2021, the daily average exchange rate for the United States dollar in terms of Canadian dollars, as quoted by the Bank of Canada, was U.S.$1.00 = Cdn.$1.2530 (Cdn.$1.00 = U.S.$0.7981).
1.7 Classification of Mineral Reserves and Resources
In this AIF, the definitions of proven and probable mineral reserves, and measured, indicated and inferred mineral resources are those used by the Canadian provincial securities regulatory authorities and conform to the definitions utilized by the Canadian Institute of Mining, Metallurgy and Petroleum, as the CIM Definition Standards on Mineral Resources and Mineral Reserves adopted by the CIM Council, as amended.
1.8 Cautionary Note to U.S. Investors regarding Mineral Reserves and Resources
This AIF has been prepared in accordance with the requirements of Canadian provincial securities laws, which differ from the requirements of U.S. securities laws. Unless otherwise indicated, all mineral reserve and mineral resource estimates included have been prepared in accordance with Canadian National Instrument 43-101- Standards of Disclosure for Mineral Projects ("NI 43-101") and the Canadian Institute of Mining, Metallurgy and Petroleum (the "CIM") - CIM Definition Standards on Mineral Resources and Mineral Reserves, adopted by the CIM Council, as amended. NI 43-101 is an instrument developed by the Canadian Securities Administrators that establishes standards for all public disclosure an issuer makes of scientific and technical information concerning mineral projects. These definitions differ from the definitions in requirements under United States securities laws adopted by the United States Securities and Exchange Commission.
Under Canadian rules, estimates of inferred mineral resources may not form the basis of feasibility or pre-feasibility studies, except in rare cases. Investors are cautioned not to assume that all or any part of an inferred mineral resource exists or is economically or legally mineable. An "inferred mineral resource" is that part of a mineral resource for which quantity and grade or quality are estimated on the basis of limited geological evidence and sampling. Geological evidence is sufficient to imply but not verify geological and grade or quality continuity. An inferred mineral resource has a lower level of confidence than that applying to an indicated mineral resource and must not be converted to a mineral reserve. It is reasonably expected that the majority of inferred mineral resources could be upgraded to indicated mineral resources with continued exploration.
Investors are cautioned not to assume that all or any part of mineral reserves and mineral resources determined in accordance with NI 43-101 and CIM standards will qualify as, or be identical to, mineral reserves and mineral resources estimated under the standards of the SEC applicable to U.S. companies. The SEC has adopted amendments to its disclosure rules to modernize the mineral property disclosure requirements for issuers whose securities are registered with the SEC. As a foreign private issuer that files its annual report on Form 40-F with the SEC pursuant to the multi-jurisdictional disclosure system, the Company is not required to provide disclosure on its mineral properties under the SEC's new rules and will continue to provide disclosure under NI 43-101 and the CIM standards. If the Company ceases to be a foreign private issuer or lose its eligibility to file its annual report on Form 40-F pursuant to the multi-jurisdictional disclosure system, then the Company will be subject to the SEC's new rules, which differ from the requirements of NI 43-101 and the CIM standards.
Accordingly, information contained in this AIF that contain descriptions of the Corporation's mineral deposits may not be comparable to similar information made public by U.S. companies subject to the reporting and disclosure requirements under the United States federal securities laws and the rules and regulations thereunder.
ITEM 2: CORPORATE STRUCTURE
2.1 Name, Address and Incorporation
The Company was incorporated under the laws of the Province of British Columbia on March 11, 1981 under the name, "Levelland Energy & Resources Ltd". Effective August 27, 2002 the Company changed its name to "Endeavour Gold Corp.", consolidated its share capital on the basis of four old common shares for one new common share and increased its share capital to 100,000,000 common shares without par value. On September 13, 2004, the Company changed its name to "Endeavour Silver Corp.", transitioned from the Company Act (British Columbia) to the Business Corporations Act (British Columbia) and increased its authorized share capital to unlimited common shares without par value.
The Company's principal business office is located at:
Suite 1130 - 609 Granville Street
Vancouver, British Columbia
Canada, V7Y 1G5
and its registered and records office is located at:
19th Floor, 885 West Georgia Street
Vancouver, British Columbia
Canada, V6C 3H4
2.2 Subsidiaries
The Company conducts its business primarily in Mexico through subsidiary companies. The following table lists the Company's material direct and indirect subsidiaries, their jurisdiction of incorporation, and percentage owned by the Company directly, indirectly or beneficially.
|
Name of Company |
Incorporated |
Percentage owned directly or indirectly |
|
|
|
|
|
Endeavour Gold Corporation, S.A. de C.V. |
Mexico |
100% |
|
EDR Silver de Mexico S.A. de C.V. SOFOM ENR |
Mexico |
100% |
|
Minera Plata Adelante, S.A. de C.V. |
Mexico |
100% |
|
Minera Santa Cruz Garibaldi S.A. de C.V. |
Mexico |
100% |
|
Refinadora Plata Guanaceví, S.A. de C.V. |
Mexico |
100% |
|
Mina Bolañitos S.A de C.V. |
Mexico |
100% |
|
Compania Minera del Cubo S.A. de C.V. |
Mexico |
100% |
|
Minas Lupycal S.A. de C.V. |
Mexico |
100% |
|
Minera Oro Silver de Mexico S.A. de C.V. |
Mexico |
100% |
|
Terronera Precious Metals S.A. de C.V. |
Mexico |
100% |
|
Minera Plata Carina S.P.A. |
Chile |
100% |
|
Oro Silver Resources Ltd. |
British Columbia, Canada |
100% |
ITEM 3: GENERAL DEVELOPMENT OF THE BUSINESS
The Company is a Canadian mineral company engaged in the evaluation, acquisition, exploration, development and exploitation of precious metal properties in Mexico and Chile. The Company has three producing silver-gold mines in Mexico: the Guanaceví Mine in Durango acquired in 2004, the Bolañitos Mine in Guanajuato acquired in 2007 and the El Compas Mine in Zacatecas acquired in 2016. In addition to operating these three mines, the Company is advancing two exploration and development projects in Mexico: the Terronera property in Jalisco acquired in 2010 that is now in the pre-feasibility stage, and the prospective Parral properties in Chihuahua acquired in 2016.
Over the past six years, the Company has acquired and advanced three exploration projects in northern Chile: Aida project (silver), Paloma project (gold) and the Cerro Marquez project (copper-molybdenum-gold).
2020
On March 31, 2020, the Mexican government declared a national health emergency with extraordinary measures due to the COVID-19 pandemic. Numerous health precautions were decreed, including the suspension of non-essential businesses, with only essential services to remain open. At March 31, 2020, mining did not qualify as an essential service so for the protection of the Company's staff, employees, contractors and communities, the Company suspended its three mining operations in Mexico as of April 1, 2020 as mandated by the Mexican government. The Company retained essential personnel at each mine site during the suspension period to maintain safety protocols, environmental monitoring, security measures and equipment maintenance. Essential personnel followed the Company's strict COVID-19 safety protocols and non-essential employees were sent home to self-isolate and stay healthy, while continuing to receive their base pay. The suspension of activities ceased in May 2020 as mining was declared an essential business.
The Company implemented measures to minimize the risks of the COVID-19 virus, both to employees and to the business. At each site, the Company is following government health protocols and is closely monitoring the pandemic with local health authorities. The Company has posted health advisories to educate employees about the COVID-19 symptoms, best practices to avoid contracting and spreading the virus, and procedures to follow if symptoms are experienced.
As the COVID-19 global pandemic is dynamic and, given that the ultimate duration and severity of the pandemic remains uncertain, the impact on the Company's 2021 production and costs has greater uncertainty. Globally, and in Mexico, positive COVID-19 continues to spread at a significant rate, while the duration of vaccine distributions remain uncertain. A local outbreak, an impediment to supply or market logistics or change in government health orders remains a significant risk.
In April 2020, the Company filed a short form base shelf prospectus ("Base Shelf") to qualify the distribution of up to Cdn$150 million of various securities of the Company, including common shares. The distribution of such securities of the Company may be effected from time to time in one or more transactions at a fixed price or prices, which may vary with market prices prevailing at the time of sale, or at prices related to such prevailing market prices to be negotiated with purchasers and as set forth in an accompanying prospectus supplement, including transactions that are deemed to be at the market distributions. The Base Shelf also provides the Company with the ability to conduct an "At-The-Market" offering through an "At-The-Market" facility ("2020 ATM") equity distribution agreement.
On May 14, 2020, the Company entered into an ATM equity facility (the "May 2020 ATM Facility") with a syndicate of agents. Under the terms of the 2020 ATM Facility, the Company could, from time to time, sell common shares having an aggregate offering value of up to $23 million on the New York Stock Exchange. The Company determined, at its sole discretion, the timing and number of shares to be sold under the May 2020 ATM Facility.
From May 14, 2020 to August 17, 2020, the Company issued 11,640,411 common shares under the 2020 ATM Facility at an average price of $1.97 per share for gross proceeds of $23.0 million less commission of $0.6 million and deferred financing costs of $0.3 million which has been presented net of share capital. The May 2020 ATM Facility was completed in August 2020.
On October 1, 2020, the Company entered into an ATM equity facility (the "October 2020 ATM Facility") with a syndicate of agents. Under the terms of the October 2020 ATM Facility, the Company may, from time to time, sell common shares having an aggregate offering value of up to $60 million on the New York Stock Exchange. The Company determines, at its sole discretion, the timing and number of shares to be sold under the October 2020 ATM Facility during the 20 month sales agreement term. As at December 31, 2020 there have been no shares issued under this facility.
The Company completed an updated NI 43-101 Technical Report for the Terronera Project, Jalisco State Mexico dated July 31, 2020, with effect July 14, 2020 ("2020 Terronera PFS"). Endeavour management worked with Ausenco Engineering Canada Inc. (Ausenco) on the re-conceptualization and re-engineering of the project to generate the significantly improved 2020.
Subsequent to the publishing the report, the Company proceeded with recommended activities to further optimize the Terronera project and commenced a feasibility study expected to be complete in Q2 2021.
In April 2018, the Company filed a short form base shelf prospectus that qualifies the distribution of up to Cdn$150 million of common shares, debt securities, warrants or units of the Company comprising any combination of common shares and warrants (the "Securities"). The Company filed a corresponding registration statement in the United States registering the Securities under United States federal securities laws. The distribution of Securities may be effected from time to time in one or more transactions at a fixed price or prices, which may be changed, at market prices prevailing at the time of sale, or at prices related to such prevailing market prices to be negotiated with purchasers and as set forth in an accompanying prospectus supplement, including transactions that are deemed to be "At-The-Market" ("ATM") distributions.
On June 13, 2018, the Company entered into an ATM equity facility with BMO Capital Markets (the lead agent), CIBC Capital Markets, H.C. Wainwright & Co., HSBC and TD Securities (together, the "Agents"). Under the terms of this ATM facility, the Company could, from time to time, sell common stock having an aggregate offering value of up to US$35.7 million on the New York Stock Exchange. The Company determined, at its sole discretion, the timing and number of shares to be sold under the ATM facility. From January 1st to April 21st 2020, the Company issued 2,164,119 common shares under the ATM facility at an average price of $1.56 per share for gross proceeds of $3.4 million, less commissions of $76,000. The ATM program was completed in April 2020.
In total, during 2020, the Company issued 13,804,530 common shares under the combined ATM facilities at an average price of $1.91 per share for gross proceeds of $26.4 million, less commission and financing fees of $1.2 million which has been presented net of share capital.
On December 18, 2020, the Company announced that it had signed a letter agreement to sell its El Cubo Mine and related assets to VanGold Mining Corp. (“VanGold”) for $15 million in cash and share payments plus additional contingent payments. VanGold will pay $15.0 million to Endeavour for the El Cubo assets as follows:
- $0.5 million cash down-payment (received)
- $7.0 million cash on closing on or before March 17, 2021
- $5.0 million in VanGold common shares on closing - priced at Cdn$0.30 per share for a total of 21,331,058 VanGold shares representing 16.1% of VanGold's updated share capital
- $2.5 million unsecured promissory note due and payable within 12 months from closing
VanGold has also agreed to pay Endeavour up to an additional $3.0 million in contingent payments based on the following events:
- $1.0 million - upon VanGold producing 3,000,000 Silver Equivalent ounces from the El Cubo mill
- $1.0 million - if the price of gold closes at or above $2,000 per ounce for 20 consecutive days within two years after closing
- $1.0 million - if the price of gold closes at or above $2,200 per ounce for 20 consecutive days within three years after closing
Closing of the Transaction is subject to satisfaction of certain conditions including final due diligence by VanGold, financing and receipt of all requisite third party and regulatory approvals including the acceptance of the TSXV on or before March 17, 2021, failing which either VanGold or Endeavour may terminate the Agreement. If the existing tax lien on the assets is not removed on or before closing, VanGold shall be entitled to withhold from the purchase price an amount sufficient to remove the tax lien.
2019
In March 2019, the Company achieved commercial production at the El Compas mine in Zacatecas, Mexico. Since commercial production the mine approached planned throughput for remainder of 2019, while ore grades were in-line with plan.
In July 2019, the Company acquired the exploration and exploitation rights to two concessions adjacent to the Guanacevi Mine in Durango State, Mexico. Both concessions cover possible extensions of Endeavour orebodies.
The El Porvenir concession (15 hectares) sits adjacent to the operating Porvenir Norte mine and covers the up dip extension of the Porvenir Norte orebody. Endeavor had a similar exploration and exploitation right on this property between 2006 and 2008, during which time the Company conducted exploration drilling and small-scale mining.
The El Curso property (40 hectares) lies adjacent to the now closed Porvenir Cuatro mine and covers any possible northwest extension of the Porvenir Cuatro orebody. Porvenir Cuatro was previously Endeavour's highest grade mine in the district. Mining at Porvenir Cuatro ended at the boundary with the El Curso property. The current mine access ramp from Porvenir Cuatro ore body to Milache ore body crosses the entire El Curso property providing existing underground access and infrastructure to facilitate the exploration, development and production of El Curso.
The Company completed an updated NI 43-101 Technical Report for the Terronera Project, Jalisco State Mexico dated April 30, 2019, with effect February 12, 2019 ("2019 Terronera PFS"). The 2019 Terronera PFS included an additional 850,000 tonnes of reserves upgraded in 2018 from in-fill drilling compared to the 2018 Terronera PFS described below.
The Company proceeded with recommended activities to further optimize the Terronera project and improve the economics, including:
- Received final permits to develop the Terronera project
- Continued exploration of nearby veins to expand resources and extend mine life
- Continued investigation of crushing alternatives to provide the lowest cost energy requirement
- Optimization of the grinding circuits to produce an increased particle size
- Continued evaluation of power alternatives to reduce capital costs
- Exploration adit to test geotechnical structure
- Mined bulk sample for increased metallurgical testing
On November 30, 2019 the Company suspended operations at the El Cubo underground mine in Guanajuato, Mexico. All operational employees were laid off and the mine, plant and tailings facilities are currently on short term care and maintenance while management conducts an evaluation of the alternatives including final closure. During October and November 2019, the mine processed 39,206 tonnes grading 106 Ag g/t and 1.16 Au g/t producing 122,780 silver oz and 1,161 gold oz, a significant decrease from both the prior year and the previous quarter. Silver and gold production did not meet revised 2019 guidance, missing by 9% and 13%, respectively. Suspension costs are estimated to be approximately $3.5-4.0 million, primarily expensed in Q4, 2019, the bulk of which is final severance payments for most of the employees.
During the year ended December 31, 2019, the Company issued 10,717,126 common shares under the ATM facility at an average price of $2.20 per share for gross proceeds of $23.56 million, less commission of $0.53 million. During the year ended December 31, 2019, the Company also recognized $0.48 million of additional transaction costs related to the ATM financing as share issuance costs, which have been presented net of share capital. Included in the 10,717,126 shares issued under the ATM facility for the year ended December 31, 2019 are 369,488 shares that were sold by the Company at the end of 2019, for net proceeds of $0.87 million, and are reserved for issuance. Settlement of the shares occurred in the first few days of 2020.
Subsequent to December 31, 2019, the Company issued an additional 114,345 common shares under the ATM facility at an average price of $2.43 per share for gross proceeds of $0.28 million, less commission of $6,000.
2018
In April 2018, the Company filed a short form base shelf prospectus that qualifies the distribution of up to Cdn$150 million of common shares, debt securities, warrants or units of the Company comprising any combination of common shares and warrants (the "Securities"). The Company filed a corresponding registration statement in the United States registering the Securities under United States federal securities laws. The distribution of Securities may be effected from time to time in one or more transactions at a fixed price or prices, which may be changed, at market prices prevailing at the time of sale, or at prices related to such prevailing market prices to be negotiated with purchasers and as set forth in an accompanying prospectus supplement, including transactions that are deemed to be "At-The-Market" ("ATM") distributions.
On June 13, 2018, the Company entered into an ATM equity facility with BMO Capital Markets (the lead agent), CIBC Capital Markets, H.C. Wainwright & Co., HSBC and TD Securities (together, the "Agents"). Under the terms of this ATM facility, the Company may, from time to time, sell common stock having an aggregate offering value of up to $35.7 million on the New York Stock Exchange. The Company determines, at its sole discretion, the timing and number of shares to be sold under the ATM facility.
The Company completed an updated NI 43-101 Technical Report, Preliminary Feasibility Study for the Terronera Project, Jalisco State Mexico dated September 17, 2018, with effect August 7, 2018 ("2018 Terronera PFS"). The 2018 Terronera PFS estimates 4.4 million tonnes of Probable Mineral Reserves grading 239 g/t silver and 2.53 g/t gold containing 33.4 million silver ounces and 354,000 gold ounces at Terronera. This Terronera PFS has been superseded by the 2019 Terronera PFS as described above.
Initial capital expenditures are estimated to be $75.8 million, comprised of $44.3 million for plant and site infrastructure, $13.7 million for mine development, mine infrastructure and equipment, $9.7 million for owner's costs, construction camp, engineering, procurement and construction management (EPCM), and $8.1 million for contingencies
The capital for the Phase 2 expansion from 750 tpd to 1,500 tpd is estimated to be $39.2 million. The expansion consists of $14.9 million to provide sufficient power from the state power grid, $12.0 million for underground mine development, $6.1 million for plant expansion, $2.0 million for owner's costs, construction camp, and EPCM and $4.2 million in contingencies. An estimated $25.8 million will be required for sustaining capital after commissioning the mine, primarily for mine development and tailings expansion. The total Life of Mine ("LOM") capital requirements are estimated to be $140.7 million.
LOM average operating costs are estimated to be $46 per tonne for mining, $20 per tonne for processing, $8 per tonne for general and administration, and $4 in royalties for a total cost of $78 per tonne. Using Base Case metal prices of $17 per oz silver and $1,275 per oz gold (compared to $18 silver and $1260 gold in 2017), total cash costs are estimated to be $0.15 per Ag oz net of the gold by-product credit, and all-in-sustaining costs at site are estimated to be $1.36 per Ag oz over the life of the mine
The mine is expected to generate LOM revenue of $815.8 million, EBITDA of $447.7 million and total free cash flow of $193.2 million. Using a discount rate of 5%, the expected discounted net present value is $117.8 million, the expected after tax internal rate of return is 23.5% and payback of capital is 5.4 years, using the Base Case assumptions
Since publishing the 2018 Terronera PFS, the Company has further assessed, refined and optimized parts of the Study and discovered other veins with mineralization which it believes will improve the overall economics.
In 2018, due to the current short mine life at El Cubo, the Company planned and guided a reduced production rate in 2019 to approximately half its 1500 tonne per day capacity, at higher operating costs than 2018, while continuing to explore for new reserves to extend the mine life.
At El Cubo, exploration in 2018 did not replace the depleted reserves, so the Company reduced the production rate in 2019 to approximately half its 1,500 tonne per day capacity. The lower production rate resulted in higher operating costs. Accordingly, the Company initiated layoffs to reflect the lower production rate in 2019. The mine continued to run at three shifts per day but the plant moved to one shift per day. Some idled mining equipment at El Cubo was transferred to other operations. Grades were expected to be 10% lower than 2018, while recoveries were expected to remain consistent with 2018.
In 2018, El Compas received its explosives permit, which allowed the mine to accelerate the development of the main access ramp. As of December 31, 2018, a total of 2.6 kilometres had been developed underground.
Since publishing the El Compas preliminary economic assessment ("El Compas PEA"), the Company continued to optimize mining methods, the crushing circuit and grinding alternatives and was successful on a number of fronts in improving the operating metrics. The work index of the ore and the size on the motor allowed the capacity of the milling circuit to increase to 325 tpd, which allowed for the mining method to be changed to mechanized cut and fill from captive cut and fill. Mechanized cut and fill increases the mining rate but has the same cost profile as captive cut and fill previously disclosed in the El Compas PEA.
The modified plant flow sheet also allowed the Company to increase the ore grind size and produce a single concentrate, while still achieving recoveries similar to those outlined in the El Compas PEA, lowering overall power costs.
As a result of the modified mine plan and plant design and the delay in receiving the explosives permit, the total start up CAPEX was revised upwards to $11.3 million compared to the previous $10.0 million cost estimated in the El Compas PEA. However, the operational benefits of the modified plant design and increased mining rate should improve the overall economics of the project. The Company incurred $15.5 million on capital as of December 31, 2018. The additional costs included $2.2 million in additional mine development, an additional $1.3 million on the plant refurbishment and tailings dam and $0.7 million on site infrastructure. The delay in commercial production increased pre-production costs capitalized to the projects.
Mining and stockpiling of ore and commissioning of the El Compas plant was initiated in the second quarter using low grade ore. In August, based on recommendations of an independent engineering review, commissioning of the plant was temporarily halted to allow the tailings area to be modified, with improved drainage and deposition plans. The plant commissioning re-commenced in mid-October, however in late December, the ball mill pinion failed which brought plant operations to a halt. From mid-October to when the pinion failed, the plant processed 11,300 tonnes grading 4.59 g/t gold and 69 g/t silver, producing 1,096 gold ounces and 13,382 silver ounces.
Management re-commenced plant operations after a new pinion was installed in February 2019 and expected to attain commercial production in Q1, 2019.
During the year ended December 31, 2018, the Company issued 3,165,642 common shares under the ATM facility at an average price of $2.61 per share for gross proceeds of $8.3 million, less commission of $0.2 million.
3.2 Significant Acquisitions
No significant acquisitions for which disclosure is required under Part 8 of National Instrument 51-102 were completed by the Company during its most recently completed financial year.
ITEM 4: DESCRIPTION OF THE BUSINESS
4.1 General Description
Business of the Company
The Company's principal business activities are the evaluation, acquisition, exploration, development and exploitation of mineral properties. The Company produces silver and gold from its underground mines at Guanaceví, Bolañitos and El Compas, and is advancing the Terronera project in Mexico. The Company also has interests and is advancing in certain exploration properties in Mexico and in Chile.
Since 2002, the Company's business strategy has been to focus on acquiring advanced-stage silver mining properties in Mexico. Mexico, despite its long and prolific history of metal production, appears to be relatively under-explored using modern exploration techniques and offers promising geological potential for precious metals exploration and production.
The Company's Guanaceví and Bolañitos mines acquired in 2004 and 2007, respectively, demonstrate its business model of acquiring fully built and permitted silver mines that were about to close for lack of ore. By bringing the money and expertise needed to find new silver ore-bodies, Endeavour successfully re-opened and expanded these mines to develop their full potential. In 2012, the Company acquired the El Cubo silver-gold mine which came with substantial reserves and resources and in 2016 the Company acquired the El Compas gold-silver mine. The benefit of acquiring fully built and permitted mining and milling infrastructure is that, if new exploration efforts are successful, the mine development cycle from discovery to production only takes a matter of months instead of the several years normally required in the traditional mining business model.
In addition to operating the Guanaceví, Bolañitos and El Cubo mines, the Company has constructed and commissioned the El Compas mine, and is advancing its Terronera project to a construction decision. The Company is also exploring a number of other properties in both Mexico and Chile towards achieving its goal to become a premier senior producer in the silver mining sector.
The Company's business is not materially affected by intangibles such as licences, patents and trademarks, nor is it significantly affected by seasonal changes. Other than as disclosed in this AIF, the Company is not aware of any aspect of its business which may be affected in the current financial year by renegotiation or termination of contracts.
Foreign Operations
As the Company's producing mines and mineral exploration interests are principally located in Mexico, the Company's business is dependent on foreign operations. As a developing economy, operating in Mexico has certain risks. See "Risk Factors - Foreign Operations".
Employees
As at December 31, 2020, the Company had approximately 15 employees based in its Vancouver corporate office and employed through its Mexican subsidiaries over 1,100 full and part-time employees in Mexico. Consultants and contractors are also retained from time to time to assist with or conduct specific corporate activities, development and exploration programs.
Environmental Protection
The Company's environmental permit require that it reclaim certain lands it disturbs during mining operations. Significant reclamation and closure activities include land rehabilitation, decommissioning of buildings and mine facilities, ongoing care and maintenance and other costs. Although the ultimate amount of the reclamation and rehabilitation costs to be incurred cannot be predicted with certainty, the total undiscounted amount of probability weighted estimated cash flows required to settle the Company's estimated obligations is $2.5 million for the Guanaceví mine operations, $2.2 million for the Bolañitos mine operations, $5.1 million for the El Cubo mine operations and $0.2 million for the El Compas mine operations.
Community, Environmental and Corporate Safety Policies
Endeavour is focused on the development of sustainability programs for all stakeholders and understands that such programs contribute to the long-term benefit of the Company and society at large. Sustainability programs implemented by the Company range from improving the Company's safety policies and practices; supporting health programs for the Company's employees and the local communities; enhancing environmental stewardship and reclamation; sponsoring educational scholarships and job skills training programs; sponsoring community cultural events and infrastructure improvements; and supporting charitable causes.
4.2 Risk Factors
Investment in securities of the Company should be considered a speculative investment due to the high-risk nature of the Company's business and the present stage of the Company's development. The following risk factors, as well as risks currently unknown to the Company, could materially adversely affect the future business, operations and financial condition of the Company and could cause them to differ materially from the Company's current business, property or financial results, each of which could cause investors to lose part or all of their investment in the Company's securities.
Impact of COVID-19 Pandemic
The Company's business could be significantly adversely affected by the effects of a widespread global outbreak of contagious disease, including the recent outbreak of respiratory illness caused by COVID-19. The Company cannot accurately predict the impact COVID-19 will have on third parties' ability to meet their obligations with the Company, including due to uncertainties relating to the ultimate geographic spread of the virus, the severity of the disease, the duration of the outbreak, and the length of travel and quarantine restrictions imposed by governments of affected countries. In particular, the continued spread of the COVID-19 globally could materially and adversely impact the Company's business including without limitation, employee health, limitations on travel, the availability of industry experts and personnel, restrictions to planned drill programs, mining and processing operations shutdowns, and other factors that will depend on future developments beyond the Company's control. In addition, a significant outbreak of contagious diseases in the human population could result in a widespread health crisis that could adversely affect the economies and financial markets of many countries (including those in which the Company operates), resulting in an economic downturn that could negatively impact the Company's operating results and ability to raise capital.
Precious and Base Metal Price Fluctuations
The profitability of the precious metal operations in which the Company has an interest will be significantly affected by changes in the market prices of precious metals. Prices for precious metals fluctuate on a daily basis, have historically been subject to wide fluctuations and are affected by numerous factors beyond the control of the Company such as the level of interest rates, the rate of inflation, central bank transactions, world supply of the precious metals, foreign currency exchange rates, international investments, monetary systems, speculative activities, international economic conditions and political developments. The exact effect of these factors cannot be accurately predicted, but the combination of these factors may result in the Company not receiving adequate returns on invested capital or the investments retaining their respective values. Declining market prices for these metals could materially adversely affect the Company's operations and profitability.
Fluctuations in the price of consumed commodities
Prices and availability of commodities consumed or used in connection with exploration, development and mining, such as natural gas, diesel, oil, electricity, cyanide and other re-agents fluctuate and affect the costs of production at our operations. These fluctuations can be unpredictable, can occur over short periods of time and may have a materially adverse impact on our operating costs or the timing and costs of various projects. Our general policy is not to hedge our exposure to changes in prices of the commodities that we use in our business.
Foreign Exchange Rate Fluctuations
Operations in Mexico, Chile and Canada are subject to foreign currency exchange fluctuations. The Company raises its funds through equity issuances which are priced in Canadian or United States dollars, and the majority of the exploration costs of the Company are denominated in United States dollars, Mexican pesos and Chilean pesos. The Company may suffer losses due to adverse foreign currency fluctuations.
Competitive Conditions
Significant competition exists for natural resource acquisition opportunities. As a result of this competition, some of which is with large, well established mining companies with substantial capabilities and significant financial and technical resources, the Company may be unable to either compete for or acquire rights to exploit additional attractive mining properties on terms it considers acceptable. Accordingly, there can be no assurance that the Company will be able to acquire any interest in additional projects that would yield reserves or results for commercial mining operations.
Operating Hazards and Risks
Mining operations generally involve a high degree of risk, which even a combination of experience, knowledge and careful evaluation may not be able to overcome. These risks include, but are not limited to, the following: environmental hazards, industrial accidents, third party accidents, unusual or unexpected geological structures or formations, fires, power outages, labour disruptions, floods, explosions, cave-ins, land-slides, acts of God, periodic interruptions due to inclement or hazardous weather conditions, earthquakes, war, rebellion, revolution, delays in transportation, inaccessibility to property, restrictions of courts and/or government authorities, other restrictive matters beyond the reasonable control of the Company, and the inability to obtain suitable or adequate machinery, equipment or labour and other risks involved in the operation of mines.
Operations in which the Company has a direct or indirect interest will be subject to all the hazards and risks normally incidental to exploration, development and production of precious and base metals, any of which could result in work stoppages, delayed production and resultant losses, increased production costs, asset write downs, damage to or destruction of mines and other producing facilities, damage to life and property, environmental damage and possible legal liability for any or all damages. The Company may become subject to liability for pollution, cave-ins or hazards against which it cannot insure or against which it may elect not to insure. Any compensation for such liabilities may have a material, adverse effect on the Company's financial position.
Our property, business interruption and liability insurance may not provide sufficient coverage for losses related to these or other hazards. Insurance against certain risks, including certain liabilities for environmental pollution, may not be available to us or to other companies within the industry at reasonable terms or at all. In addition, our insurance coverage may not continue to be available at economically feasible premiums, or at all. Any such event could have a material adverse effect on our business.
Mining Operations
The capital costs required by the Company's projects may be significantly higher than anticipated. Capital and operating costs, production and economic returns, and other estimates contained in the Company's current technical reports, may differ significantly from those provided for in future studies and estimates and from management guidance, and there can be no assurance that the Company's actual capital and operating costs will not be higher than currently anticipated. In addition, delays to construction and exploration schedules may negatively impact the net present value and internal rates of return of the Company's mineral properties as set forth in the applicable technical report. Similarly, there can be no assurance that historical rates of production, grades of ore processed, rates of recoveries or mining cash costs will not experience fluctuations or differ significantly from current levels over the course of the mining operations conducted by the Company.
There can be no assurance that the Company will be able to continue to extend the production from its current operations through exploration and drilling programs.
Infrastructure
Mining, processing, development and exploration activities depend, to one degree or another, on adequate infrastructure. Reliable roads, bridges, power sources and water supply are important determinants, which affect capital and operating costs. The lack of availability on acceptable terms or the delay in the availability of any one or more of these items could prevent or delay exploitation or development of the Company's projects. If adequate infrastructure is not available in a timely manner, there can be no assurance that the exploitation or development of the Company's projects will be commenced or completed on a timely basis, if at all; the resulting operations will achieve the anticipated production volume, or the construction costs and ongoing operating costs associated with the exploitation and/or development of the Company's advanced projects will not be higher than anticipated. In addition, unusual or infrequent weather phenomena, sabotage, government or other interference in the maintenance or provision of such infrastructure could adversely affect the Company's operations and profitability.
Exploration and Development
There is no assurance that the Company's exploration and development programs and properties will result in the discovery, development or production of a commercially viable ore body or yield new reserves to replace or expand current reserves.
The business of exploration for minerals and mining involves a high degree of risk. Few properties that are explored are ultimately developed into producing mines. At this time, other than the mineral reserves on the Company's Guanaceví Mines Project, Bolañitos Mines Project, El Compas Mine Project and Terronera property, none of the Company's properties have any defined ore-bodies with reserves.
The economics of developing silver, gold and other mineral properties are affected by many factors including capital and operating costs, variations of the tonnage and grade of ore mined, fluctuating mineral markets, and such other factors as government regulations, including regulations relating to royalties, allowable production, importing and exporting of minerals and environmental protection. Depending on the prices of silver, gold or other minerals produced, the Company may determine that it is impractical to commence or continue commercial production.
Substantial expenditures are required to discover an ore-body, to establish reserves, to identify the appropriate metallurgical processes to extract metal from ore, and to develop the mining and processing facilities and infrastructure. The marketability of any minerals acquired or discovered may be affected by numerous factors which are beyond the Company's control and which cannot be accurately foreseen or predicted, such as market fluctuations, conditions for precious and base metals, the proximity and capacity of milling and smelting facilities, and such other factors as government regulations, including regulations relating to royalties, allowable production, importing and exporting minerals and environmental protection. In order to commence exploitation of certain properties presently held under exploration concessions, it is necessary for the Company to apply for an exploitation concession. There can be no guarantee that such a concession will be granted. Unsuccessful exploration or development programs could have a material adverse impact on the Company's operations and profitability.
Calculation of Reserves and Resources and Precious Metal Recoveries
There is a degree of uncertainty attributable to the calculation and estimation of reserves and resources and their corresponding metal grades to be mined and recovered. Until reserves or resources are actually mined and processed, the quantities of mineralization and metal grades must be considered as estimates only. Any material change in the quantity of mineral reserves, mineral resources, grades and recoveries may affect the economic viability of the Company's properties.
Decreases in the market price of silver or gold may render the mining of reserves uneconomic.
The mineral resource and reserve figures included in the AIF and the documents incorporated by reference are estimates, which are, in part, based on forward-looking information, and no assurance can be given that the indicated level of silver and gold will be produced. Factors such as metal price fluctuations, increased production costs and reduced recovery rates may render the present proven and probable reserves unprofitable to develop at a particular site or sites for periods of time. Mineral reserve and resource estimates may need to be restated to the extent that actual precious metals prices are lower than those assumed in preparing the estimates.
Replacement of Reserves and Resources
The Guanaceví, Bolañitos and El Compas mines are the Company's only current sources of mineral production. Current life-of-mine plans provide for a defined production life for mining at the Company's mines. The Company's mines have expected lives of one to four years based on current proven and probable reserves, current production levels and management's estimated conversion of resources to reserves. If the Company's mineral reserves and resources are not replaced either by the development or discovery of additional reserves and/or extension of the life-of-mine at its current operating mines or through the acquisition or development of an additional producing mine, this could have an adverse impact on the Company's future cash flows, earnings, financial performance and financial condition, including as a result of requirements to expend funds for reclamation and decommissioning.
Acquisition Strategy
As part of the Company's business strategy, it has sought and will continue to seek new mining and development opportunities in the mining industry. In pursuit of such opportunities, it may fail to select appropriate acquisition candidates, negotiate appropriate acquisition terms, conduct sufficient due diligence to determine all related liabilities or to negotiate favourable financing terms. The Company may encounter difficulties in transitioning the business, including issues with the integration of the acquired businesses or its personnel into the Company. The Company cannot assure that it can complete any acquisition or business arrangement that it pursues, or is pursuing, on favourable terms, or that any acquisitions or business arrangements completed will ultimately benefit its business.
Integration of New Acquisitions
The Company's success at completing any acquisitions will depend on a number of factors, including, but not limited to: identifying acquisitions which fit the Company's strategy; negotiating acceptable terms with the seller of the business or property to be acquired; and obtaining approval from regulatory authorities in the jurisdictions of the business or property to be acquired.
Business or property acquisitions could place increased pressure on the Company's cash flow if such acquisitions involve cash consideration or the assumption of obligations requiring cash payments. The integration of an acquired business or property with the Company's existing operations require significant expenditures of time, attention and funds. The Company may not be able to integrate the operations of a recently acquired business or restructure the Company's previously existing business operations without encountering unexpected costs, difficulties and delays. The attention required from the Company's management team may detract from the Company's day-to-day operations. Over the short-term, difficulties associated with integration could have a material adverse effect on the Company's business, operating results, financial condition and the price of the Company's common shares. In addition, the acquisition of mineral properties may subject the Company to unforeseen liabilities, including environmental liabilities.
Foreign Operations
The Company's operations are currently conducted through subsidiaries principally in Mexico and secondarily in Chile. As such, its operations are exposed to various levels of political, economic and other risks and uncertainties which could result in work stoppages, blockades of the Company's mining operations and appropriation of assets. Some of the Company's operations are located in areas where Mexican drug cartels operate. These risks and uncertainties vary from region to region and include, but are not limited to, terrorism; hostage taking; local drug gang activities; military repression; expropriation; extreme fluctuations in currency exchange rates; high rates of inflation; labour unrest; the risks of war or civil unrest; renegotiation or nullification of existing concessions, licenses, permits and contracts; illegal mining; changes in taxation policies; restrictions on foreign exchange and repatriation; and changing political conditions arising from changes in government and otherwise, currency controls and governmental regulations that favour or require the awarding of contracts to local contractors or require foreign contractors to employ citizens of, or purchase supplies from, a particular jurisdiction.
Local opposition to mine development projects could arise in Mexico, and such opposition could be violent. If the Company were to experience resistance or unrest in connection with its Mexican operations, it could have a material adverse effect on its operations and profitability. To the extent the Company acquires mineral properties in jurisdictions other than Mexico, it may be subject to similar and additional risks with respect to its operations in those jurisdictions.
Government Regulation
The Company's operations, exploration and development activities are subject to extensive foreign federal, state and local laws and regulations governing such matters as environmental protection, management and use of toxic substances and explosives, management of natural resources, health, exploration and development of mines, production and post-closure reclamation, safety and labour, mining law reform, price controls import and export laws, taxation, maintenance of claims, tenure, government royalties and expropriation of property. There is no assurance that future changes in such regulations, if any, will not adversely affect the Company's operations. The activities of the Company require licenses and permits from various governmental authorities.
The costs associated with compliance with these laws and regulations are substantial and possible future laws and regulations, changes to existing laws and regulations and more stringent enforcement of current laws and regulations by governmental authorities, could cause additional expenses, capital expenditures, restrictions on or suspensions of the Company's operations and delays in the development of its properties. Moreover, these laws and regulations may allow governmental authorities and private parties to bring lawsuits based upon damages to property and injury to persons resulting from the environmental, health and safety practices of the Company's past and current operations, or possibly even those actions of parties from whom the Company acquired its mines or properties, and could lead to the imposition of substantial fines, penalties or other civil or criminal sanctions. The Company retains competent and well trained individuals and consultants in jurisdictions in which it does business, however, even with the application of considerable skill the Company may inadvertently fail to comply with certain laws. Such events can lead to financial restatements, fines, penalties, and other material negative impacts on the Company.
Mexican Foreign Investment and Income Tax Laws
In December 2012, the Mexican government amended federal labour laws with respect to the use of service companies, subcontracting arrangements and the obligation to compensate employees with appropriate profit-sharing in Mexico. While the Company believes it is probable that these amended labour laws will not result in any material obligation or additional profit-sharing entitlements for its Mexican employees, there can be no assurance that this will continue to be the case.
Any developments or changes in such legal, regulatory or governmental requirements as described above or otherwise are beyond the control of the Company and may adversely affect its business.
Obtaining and Renewing Government Permits
In the ordinary course of business, the Company is required to obtain and renew government permits for the operation and expansion of existing operations or for the development, construction and commencement of new operations. Obtaining or renewing the necessary governmental permits is a complex and time-consuming process involving numerous jurisdictions and possibly involving public hearings and costly undertakings on the Company's part. The duration and success of the Company's efforts to obtain and renew permits are contingent upon many variables not within its control including the interpretation of applicable requirements implemented by the permitting authority.
The Company may not be able to obtain or renew permits that are necessary to its operations, or the cost to obtain or renew permits may exceed what the Company believes it can recover from a given property once in production. Any unexpected delays or costs associated with the permitting process could delay the development or impede the operation of a mine, which could adversely impact the Company's operations and profitability.
Environmental Factors
All phases of the Company's operations are subject to environmental regulation in the various jurisdictions in which it operates. Environmental legislation is evolving in a manner which will require stricter standards and enforcement, increased fines and penalties for non-compliance, more stringent environmental assessments of proposed projects and a heightened degree of responsibility for companies and their officers, directors and employees. There is no assurance that any future changes in environmental regulation will not adversely affect the Company's operations. The costs of compliance with changes in government regulations have the potential to reduce the profitability of future operations. Environmental hazards that may have been caused by previous or existing owners or operators may exist on the Company's mineral properties, but are unknown to the Company at present.
Title to Assets
Although the Company has or will receive title opinions for any properties in which it has a material interest, there is no guarantee that title to such properties will not be challenged or impugned. The Company has not conducted surveys of the claims in which it holds direct or indirect interests and, therefore, the precise area and location of such claims may be in doubt. The Company's claims may be subject to prior unregistered agreements or transfers or native land claims and title may be affected by unidentified or unknown defects.
The Company has conducted as thorough an investigation as possible on the title of properties that it has acquired or will be acquiring to be certain that there are no other claims or agreements that could affect its title to the concessions or claims. If title to the Company's properties is disputed, it may result in the Company paying substantial costs to settle the dispute or clear title and could result in the loss of the property, which events may affect the economic viability of the Company.
Employee Recruitment and Retention
Recruiting and retaining qualified personnel is critical to the Company's success. The Company is dependent on the services of key executives including the Company's Chief Executive Officer, President, Chief Financial Officer and other highly skilled and experienced executives and personnel focused on managing the Company's interests. The number of persons skilled in acquisition, exploration, development and operation of mining properties are limited and competition for such persons is intense. As the Company's business activity grows, the Company will require additional key financial, administrative and mining personnel as well as additional operations staff. We could experience increases in our recruiting and training costs and decreases in our operating efficiency, productivity and profit margins. If we are not able to attract, hire and retain qualified personnel, the efficiency of our operations could be impaired, which could have an adverse impact on the Company's future cash flows, earnings, financial performance and financial condition.
Potential Conflicts of Interest
The directors and officers of the Company may serve as directors and/or officers of other public and private companies, and may devote a portion of their time to manage other business interests. This may result in certain conflicts of interest.
To the extent that such other companies may participate in ventures in which the Company is also participating, such directors and officers of the Company may have a conflict of interest. The laws of British Columbia, Canada, require the directors and officers to act honestly, in good faith, and in the best interests of the Company and its shareholders. However, in conflict of interest situations, directors and officers of the Company may owe the same duty to another company and will need to balance the competing obligations and liabilities of their actions.
There is no assurance that the needs of the Company will receive priority in all cases. From time to time, several companies may participate together in the acquisition, exploration and development of natural resource properties, thereby allowing these companies to: (i) participate in larger properties and programs; (ii) acquire an interest in a greater number of properties and programs; and (iii) reduce their financial exposure to any one property or program. A particular company may assign, at its cost, all or a portion of its interests in a particular program to another affiliated company due to the financial position of the company making the assignment.
In determining whether or not the Company will participate in a particular program and the interest therein to be acquired by it, it is expected that the directors and officers of the Company will primarily consider the degree of risk to which the Company may be exposed and its financial position at that time.
Third Party Reliance
The Company's rights to acquire interests in certain mineral properties have been granted by third parties who themselves may hold only an option to acquire such properties. As a result, the Company may have no direct contractual relationship with the underlying property holder.
Absolute Assurance on Financial Statements
We prepare our financial reports in accordance with accounting policies and methods prescribed by IFRS. In the preparation of financial reports, management may need to rely upon assumptions, make estimates or use their best judgment in determining the financial condition or results of operations of the Company. Significant accounting details are described in more detail in the notes to our annual consolidated financial statements for the year ended December 31, 2020. In order to have a reasonable level of assurance that financial transactions are properly authorized, assets are safeguarded against unauthorized or improper use and transactions are properly recorded and reported, we have implemented and continue to analyze our internal control systems for financial reporting. Although we believe our financial reporting and financial statements are prepared with reasonable safeguards to ensure reliability, we cannot provide absolute assurance in that regard.
Economic Conditions for Mining
A decline in the market price for precious metal commodities was experienced from 2013 until the middle of 2020, when prices began increasing to prices more consistent with early 2013. These macro-economic events negatively affected the mining and minerals sectors in general, and the Company's market capitalization was significantly reduced over this period. Any sudden or rapid destabilization of global economic conditions could impact the Company's ability to obtain equity or debt financing in the future on terms favorable to the Company or at all. In such an event, the Company's operations and financial condition could be adversely impacted.
The Company assesses on a quarterly basis the carrying values of its mineral properties. Should market conditions and commodity prices worsen and persist in a worsened state for a prolonged period of time, an impairment of the Company's miner properties may be required.
Substantial Volatility of Share Price
The market prices for the securities of mining companies, including our own, have historically been highly volatile. The market has from time to time experienced significant price and volume fluctuations that are unrelated to the operating performance of any particular company. In addition, because of the nature of our business, certain factors such as our announcements and the public's reaction, our operating performance and the performance of competitors and other similar companies, fluctuations in the market prices of our resources, government regulations, changes in earnings estimates or recommendations by research analysts who track our securities or securities of other companies in the resource sector, general market conditions, announcements relating to litigation, the arrival or departure of key personnel and the risk factors described in this AIF can have an adverse impact on the market price of the Company's common shares.
Any negative change in the public's perception of Endeavour's prospects could cause the price of our securities, including the price of our common shares, to decrease dramatically. Furthermore, any negative change in the public's perception of the prospects of mining companies in general could depress the price of our securities, including the price of our common shares, regardless of our results. Following declines in the market price of a company's securities, securities class-action litigation is often instituted. Litigation of this type, if instituted, could result in substantial costs and a diversion of our management's attention and resources.
Need for additional financing
The Company's current cash and cash-flows may not be sufficient to pursue additional exploration, development or discovery of additional reserves, extension to life-of-mines or new acquisitions and, the Company may require additional financing. Additional financing may not be available on acceptable terms, if at all. The Company may need additional financing by way of private or public offerings of equity or debt or the sale of project or property interests in order to have sufficient working capital for its business objectives, as well as for general working capital purposes.
The success and the pricing of any such capital raising and/or debt financing will be dependent upon the prevailing market conditions at that time. There can be no assurance that financing will be available to the Company or, if it is available, that it will be offered on acceptable terms. If additional financing is raised through the issuance of equity or convertible debt securities of the Company, this may negatively impact the price of the Company's common shares and could result in dilution to shareholders and the interests of shareholders in the net assets of the Company may be diluted.
Differences in U.S. and Canadian reporting of mineral reserves and resources
This AIF has been prepared in accordance with the requirements of Canadian provincial securities laws, which differ from the requirements of U.S. securities laws. Unless otherwise indicated, all mineral reserve and mineral resource estimates included have been prepared in accordance with Canadian National Instrument 43-101- Standards of Disclosure for Mineral Projects ("NI 43-101") and the Canadian Institute of Mining, Metallurgy and Petroleum (the "CIM") - CIM Definition Standards on Mineral Resources and Mineral Reserves, adopted by the CIM Council, as amended. NI 43-101 is an instrument developed by the Canadian Securities Administrators that establishes standards for all public disclosure an issuer makes of scientific and technical information concerning mineral projects. These definitions differ from the definitions in requirements under United States securities laws adopted by the United States Securities and Exchange Commission.
Under Canadian rules, estimates of inferred mineral resources may not form the basis of feasibility or pre-feasibility studies, except in rare cases. Investors are cautioned not to assume that all or any part of an inferred mineral resource exists or is economically or legally mineable. An "inferred mineral resource" is that part of a mineral resource for which quantity and grade or quality are estimated on the basis of limited geological evidence and sampling. Geological evidence is sufficient to imply but not verify geological and grade or quality continuity. An inferred mineral resource has a lower level of confidence than that applying to an indicated mineral resource and must not be converted to a mineral reserve. It is reasonably expected that the majority of inferred mineral resources could be upgraded to indicated mineral resources with continued exploration.
Investors are cautioned not to assume that all or any part of mineral reserves and mineral resources determined in accordance with NI 43-101 and CIM standards will qualify as, or be identical to, mineral reserves and mineral resources estimated under the standards of the SEC applicable to U.S. companies. The SEC has adopted amendments to its disclosure rules to modernize the mineral property disclosure requirements for issuers whose securities are registered with the SEC. As a foreign private issuer that files its annual report on Form 40-F with the SEC pursuant to the multi-jurisdictional disclosure system, the Company is not required to provide disclosure on its mineral properties under the SEC's new rules and will continue to provide disclosure under NI 43-101 and the CIM standards. If the Company ceases to be a foreign private issuer or lose its eligibility to file its annual report on Form 40-F pursuant to the multi-jurisdictional disclosure system, then the Company will be subject to the SEC's new rules, which differ from the requirements of NI 43-101 and the CIM standards.
Accordingly, information contained in this AIF that contain descriptions of the Corporation's mineral deposits may not be comparable to similar information made public by U.S. companies subject to the reporting and disclosure requirements under the United States federal securities laws and the rules and regulations thereunder.
Material weaknesses in the internal control over financial reporting
The Company documented and tested, during its most recent fiscal year, its internal control procedures in order to satisfy the requirements of Section 404 of the U.S. Sarbanes-Oxley Act ("SOX") which requires an annual assessment by management of the effectiveness of the Company's internal control over financial reporting and an attestation report by the Company's independent auditor addressing this assessment. The Company may fail to achieve and maintain the adequacy of its internal control over financial reporting as such standards are modified, supplemented, or amended from time to time, and the Company may not be able to ensure that it can conclude on an ongoing basis that it has effective internal control over financial reporting in accordance with Section 404 of SOX. The Company's failure to satisfy the requirements of Section 404 of SOX on an ongoing, timely basis could result in the loss of investor confidence in the reliability of the Company's financial statements, which in turn could harm the business and negatively affect the trading price of the Company's common shares. In addition, any failure to implement required new or improved controls, or difficulties encountered in their implementation, could harm the Company's operating results or cause us to fail to meet reporting obligations.
Future acquisitions of companies may also provide the Company with challenges in implementing the required processes, procedures and controls in its acquired operations. Acquired companies may not have disclosure controls and procedures or internal control over financial reporting that are as thorough or effective as those required by securities laws currently applicable to the Company.
No evaluation can provide complete assurance that the internal control over financial reporting will detect or uncover all failures of persons within the Company to disclose material information required to be reported. The effectiveness of the Company's controls and procedures could also be limited by simple errors or faulty judgments. In addition, as the Company expands, the challenges involved in implementing appropriate internal control over financial reporting will increase and will require that it continue to improve the internal control over financial reporting. Although the Company intends to devote substantial time and incur substantial costs, as necessary, to ensure ongoing compliance, it cannot be certain that it will be successful in complying with Section 404 of SOX.
As a "foreign private issuer", the Company is exempt from Section 14 proxy rules and Section 16 of the Securities Exchange Act of 1934
The Company is a "foreign private issuer" as defined in Rule 3b-4 under the United States Securities Exchange Act of 1934, as amended (the "U.S. Exchange Act"). Equity securities of the Company are accordingly exempt from Sections 14(a), 14(b), 14(c), 14(f) and 16 of the U.S. Exchange Act pursuant to Rule 3a12-3 of the U.S. Exchange Act. Therefore, the Company is not required to file a Schedule 14A proxy statement in relation to the annual meeting of shareholders. The submission of proxy and annual meeting of shareholder information on Form 6-K may result in shareholders having less complete and timely information in connection with shareholder actions. The exemption from Section 16 rules regarding reports of beneficial ownership and purchases and sales of common shares by insiders and restrictions on insider trading in our securities may result in shareholders having less data and there being fewer restrictions on insiders' activities in our securities.
Lack of Dividends
The Company has never declared or paid any dividends on the common shares. Endeavour intends, for the foreseeable future, to retain its future earnings, if any, to finance its exploration activities and further development and the expansion of the business. The payment of future dividends, if any, will be reviewed periodically by the Board of Directors of Endeavour and will depend upon, among other things, conditions then existing including earnings, financial conditions, cash on hand, financial requirements to fund our exploration activities, development and growth, and other factors that the Board may consider appropriate in the circumstances.
Claims Under U.S. Securities Laws
The enforcement by investors of civil liabilities under the federal securities laws of the United States may be affected adversely by the fact that the Company is incorporated under the laws of British Columbia, Canada, that the independent chartered public accountants who have audited the Company's financial statements and some or all of the Company's directors and officers may be residents of Canada or elsewhere, and that all or a substantial portion of the Company's assets and said persons are located outside the United States. As a result, it may be difficult for holders of the Company's common shares to effect service of process within the United States upon people who are not residents of the United States or to realize in the United States upon judgments of courts of the United States predicated upon civil liabilities under the federal securities laws of the United States.
Financial Instruments
From time to time, the Company may use certain financial instruments to manage the risks associated with changes in silver prices, interest rates and foreign currency exchange rates. The use of financial instruments involves certain inherent risks including, among other things: (i) credit risk, the risk of default on amounts owing to the Company by the counterparties with which Company has entered into such transaction; (ii) market liquidity risk, the risk that the Company has entered into a position that cannot be closed out quickly, either by liquidating such financial instrument or by establishing an offsetting position; and (iii) unrealized mark-to-market risk, the risk that, in respect of certain financial instruments, an adverse change in market prices for commodities, currencies or interest rates will result in the Company incurring an unrealized mark-to-market loss in respect of such derivative products.
Financial Reporting Standards
The Company prepares its financial reports in accordance with IFRS. In preparation of financial reports, management may need to rely upon assumptions, make estimates or use their best judgment in determining the financial condition of the Company. Significant accounting policies are described in more detail in the Company's audited financial statements. In order to have a reasonable level of assurance that financial transactions are properly authorized, assets are safeguarded against unauthorized or improper use, and transactions are properly recorded and reported, the Company has implemented and continues to analyze its internal control systems for financial reporting. Although the Company believes its financial reporting and financial statements are prepared with reasonable safeguards to ensure reliability, the Company cannot provide absolute assurance.
Changes in Climate Conditions
A number of governments have introduced or are moving to introduce climate change legislation and treaties at the international, national, state/provincial and local levels. Regulation relating to emission levels (such as carbon taxes) and energy efficiency is becoming more stringent. If the current regulatory trend continues, this may result in increased costs at some or all of the Company's operations. In addition, the physical risks of climate change may also have an adverse effect on the Company's operations. Extreme weather events have the potential to disrupt operations at the Company's mines and may require the Company to make additional expenditures to mitigate the impact of such events. Extended disruptions to supply lines could result in interruption to production.
Anti-Corruption and Anti-Bribery Laws
The Company's operations are governed by, and involve interactions with, various levels of government in foreign countries. The Company is required to comply with anti‐corruption and anti‐bribery laws, including the Corruption of Foreign Public Officials Act (Canada) and the Foreign Corrupt Practices Act (US) and similar laws in México. In recent years, there has been a general increase in both the frequency of enforcement and the severity of penalties under such laws, resulting in greater scrutiny and punishment to companies convicted of violating anti‐corruption and anti‐bribery laws. A company may be found liable for violations by not only its employees, but also by its contractors and third party agents. The Company's internal procedures and programs may not always be effective in ensuring that it, its employees, contractors or third party agents will comply strictly with all such applicable laws. If the Company becomes subject to an enforcement action or is found to be in violation of such laws, this may have a material adverse effect on the Company's reputation, result in significant penalties or sanctions, and have a material adverse effect on the Company's operations.
Compliance with Canada's Extractive Sector Transparency Measures Act
The Extractive Sector Transparency Measures Act (Canada) ("ESTMA") requires public disclosure of certain payments to governments by companies engaged in the commercial development of minerals which are publicly listed in Canada. Mandatory annual reporting is required for extractive companies with respect to payments made to foreign and domestic governments, including aboriginal groups.
ESTMA reporting on the payments of any taxes, royalties, fees, production entitlements, bonuses, dividends, infrastructure reporting or structuring payments to avoid reporting. If the Company becomes subject to an enforcement action or is in violation of ESTMA, this may result in significant penalties or sanctions which may also have a material adverse effect on the Company's reputation.
Information Systems and Cyber Security
Our operations depend, in part, upon information technology systems. Our information technology systems are subject to disruption, damage or failure from a number of sources, including, but not limited to, hacking, computer viruses, security breaches, natural disasters, power loss, vandalism, theft and defects in design. Any of these and other events could result in information technology systems failures, operational delays, production downtimes, destruction or corruption of data, security breaches or other manipulation or improper use of our data, systems and networks, any of which could have adverse effects on our reputation, business, results of operations, financial condition and share price.
Our risk and exposure to these matters cannot be fully mitigated because of, among other things, the evolving nature of these threats. As a result, cyber security and the continued development and enhancement of controls, processes and practices designed to protect our systems, computers, software, data and networks from attack, damage or unauthorized access remain a priority. As cyber threats continue to evolve, we may be required to expend additional resources to continue to modify or enhance protective measures or to investigate and remediate any security vulnerabilities.
4.3 Asset-Backed Securities Outstanding
The Company has not issued any asset-backed securities.
4.4 Mineral Projects
Summary of Mineral Reserves and Mineral Resources Estimates
The following tables summarize as at December 31, 2020 the Company's estimated Mineral Reserves and Mineral Resources on its material mineral properties, all of which are wholly owned. Information in the following tables and the notes thereto are extracted from the respective technical reports on the material properties referred to under the description of each property below.
Silver-Gold Proven and Probable Mineral Reserves
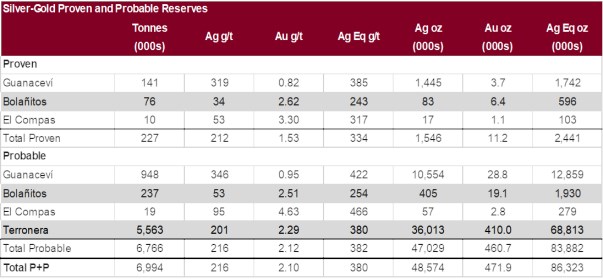
Silver-Gold Measured and Indicated Mineral Resources

Silver-Gold Inferred Mineral Resources
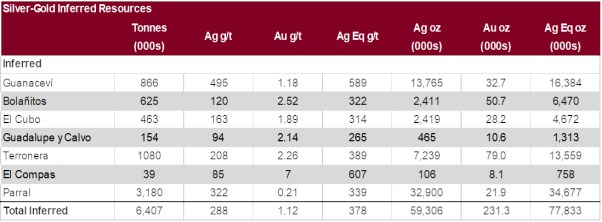
Silver-Gold-Lead-Zinc Mineral Resources

Notes to Reserves and Resource Tables
Notes:
1. Mineral Resources are not Mineral Reserves and do not have demonstrated economic viability. There is no certainty that any or all part of the Mineral Resources will be converted into Mineral Reserves.
2. The Inferred Mineral Resource in this estimate has a lower level of confidence than that applied to an Indicated Mineral Resource and must not be converted to a Mineral Reserve. It is reasonably expected that the majority of the Inferred Mineral Resource could be upgraded to an Indicated Mineral Resource with continued exploration.
3. The Mineral Resources in this estimate were calculated using the Canadian Institute of Mining, Metallurgy and Petroleum (CIM), CIM Standards on Mineral Resources and Reserves, Definitions and Guidelines prepared by the CIM Standing Committee on Reserve Definitions and adopted by CIM Council.
4. Mineral Resources are exclusive of and in addition to Mineral Reserves.
5. Guanacevi Mineral Resource and Mineral Reserve cut-off grades are based on a 225 g/t silver equivalent for Santa Cruz Sur of Guanacevi and 222 g/t silver equivalent for Santa Cruz, 237 g/t silver equivalent for Milache and 280 g/t silver equivalent for Ocampo and Porvenir Norte of Guanaceví; Metallurgical recoveries were 84.6% silver and 85.7% gold for Guanaceví. The cutoff grade applied for resource calculation at the regional polymetallic projects at Guanacevi (Noche Buena and Buena Fe) is 200g/t silver equivalent. The silver equivalent is based on the calculated NSR for each element based on the following price assumptions US$16.29/oz for silver, US$1,195/oz for gold, US$0.82/lb for lead and US$0.90/lb for zinc.
6. Bolañitos, Mineral Resource and Mineral Reserve cut-off grades are based on 181 g/t silver equivalent for Lucero Ramp, Belen and Veta Madre, 173 g/t silver equivalent for La Luz Ramp and 181 g/t silver equivalent for San Miguel ramp area. Metallurgical recoveries were 84.7% silver and 88.9% gold for Bolañitos
7. El Cubo Mineral Resource and Mineral Reserve cut-off grades are based on a 202 g/t silver equivalent for Area II (that comprises Dolores Mine) of El Cubo and 223 g/t silver equivalent for Areas I&IV (that comprise Santa Cecilia and San Nicolas Mines) of El Cubo. Metallurgical recoveries were 87.0% silver and 86.7% gold for El Cubo.
8. El Compas Mineral Resource and Mineral Reserve cut-off grades are based on a 3.67 g/t gold equivalent. Metallurgical recoveries were 67.0% silver and 82.0% gold for El Compas
9. Mineral Resource cut-off grades for Terronera was 150 g/t silver equivalent and the Mineral Reserve cut-off grades for Terronera and La Luz Deposits were 160 g/t and 216 g/t silver equivalent respectively.
10. Mineral Resource and Mineral Reserve cut-off grades are based on a 100 g/t silver equivalent for Guadalupe y Calvo.
11. Parral Mineral Resources are estimated at a cut-off grade of 130 g/t AgEq for Palmilla, Veta Colorada, and San Patricio, 200 g/t Ag for Sierra Plata, and an NSR cut-off value of US$55/t for El Cometa. The NSR and AgEq values are based on estimated metallurgical recoveries, assumed metal prices and smelter terms, which include payable factors, treatment charges, penalties, and refining charges. Metal price assumptions were: US$17/oz Ag, US$1,275/oz Au, US$1.15/lb Zn, and US$1.00/lb Pb. A minimum mining width of 1.5 m was used for Sierra Plata, and 1.75 m for all other veins.
12. Calicanto Mineral Resources are estimated at a cut-off value of US$200 VIT (value in-situ) for Calicanto, Santa Fe and Misie veins areas. The VIT values are based on metal price assumptions of US$23.98/oz Ag, US$1,815/oz Au, US$3.5/lb Cu, US$0.94/lb Pb, and US$1.25/lb Zn. A minimum mining width of 1.0 m was used.
13. Mining recoveries of 93% were applied for Guanaceví, Bolañitos and El Compas, 88% for El Cubo and 95% for Terronera for Mineral Reserve Estimate calculations. Minimum mining widths were 0.8 metres for Mineral Reserve Estimate calculations.
14. Dilution factors for Mineral Reserve Estimate calculations averaged 34.7% for Guanaceví, 34% for Bolañitos and 35.7% for El Compas, and 10% for Terronera. For current operations dilution factors are based on vein width diluted to width of drive for lateral sill preparation (generally >30%) and internal stope dilution calculations and external dilution factors of 15% for cut and fill mining and 30% for long hole mining.
15. Silver equivalent grades and ounces are based on a 80:1 silver:gold ratio and calculated including only silver and gold.
16. Probable Mineral Reserves for Terronera includes the Terronera and La Luz Deposits.
17. Inferred Mineral Resources for Terronera includes the Terronera, La Luz and Real Alto Area.
18. Indicated and Inferred Silver-Gold Mineral Resources for "Parral" includes the Colorada, Palmilla and San Patricio areas.
19. The Veta Colorada structure (Parral) does not contain gold on an economic scale.
20. Price assumptions for Guanaceví, Bolañitos, El Cubo and El Compas are US$16.51/oz for silver, US$1,465/oz for gold.
21. Price assumptions for Terronera are US$17/oz for silver, US$1,275/oz for gold.
22. Price assumptions for Parral are US$15/oz for silver, US$1,275/oz for gold.
23. Figures in tables are rounded to reflect estimate precision; small differences generated by rounding are not material to the estimates.
24. See "Cautionary Note to U.S. Investors concerning Estimates of Mineral Reserves and Measured, Indicated and Inferred Mineral Resources".
Guanacevi Mines Project, Durango State, Mexico
The following summary of the Guanaceví Mines Project is extracted from a technical report titled "National Instrument 43-101 Technical Report: Updated Mineral Resource and Reserve Estimates for the Guanaceví Project, Durango State, Mexico" prepared by Hard Rock Consulting LLC, with an effective date of December 31, 2016 and dated March 3, 2017 and amended March 27, 2018. The complete report can be viewed on SEDAR at www.sedar.com. The technical report is incorporated by reference in its entirety into this AIF.
Executive Summary
Introduction
Hard Rock Consulting, LLC ("HRC") was retained by Endeavour Silver Corp. ("EDR") to complete an independent technical audit and to update the mineral resource and reserve estimates for the Guanaceví Project (the "Project") located in Durango State, Mexico. This report presents the results of HRC's efforts, and is intended to fulfill the Standards of Disclosure for Mineral Projects according to Canadian National Instrument 43-101 ("NI 43-101").
This report was prepared in accordance with the requirements and guidelines set forth in Companion Policy 43-101CP and Form 43-101F1 (June 2011), and the mineral resources and reserves presented herein are classified according to Canadian Institute of Mining, Metallurgy and Petroleum ("CIM") Definition Standards - For Mineral Resources and Mineral Reserves, prepared by the CIM Standing Committee on Reserve Definitions and adopted by CIM Council on May 10, 2014. The mineral resource and mineral reserve estimates reported here are based on all available technical data and information as of December 31, 2016.
Property Description and Ownership
The Guanaceví Project is located in the northwest portion of the Mexican state of Durango, approximately 3.6 km west of the town of Guanaceví and 260 km northwest of the capital city of Durango. The approximate geographic center of the Project is 105°58'20"W longitude and 25°54'47"N latitude. At present, the Project is comprised of 51 mineral concessions for a total property area of 4,171.5546 ha.
EDR controls the Guanaceví Project through its 100% owned Mexican subsidiary, Endeavour Gold Corporation S.A. de C.V. (Endeavour Gold). Endeavour Gold holds the project through its two 100% owned subsidiaries, Minera Plata Adelante S.A. de C.V. (Minera Plata Adelante) and Refinadora Plata Guanaceví S.A. de C.V. (Refinadora Plata Guanaceví).
Geology and Mineralization
The Guanaceví silver-gold district hosts classic, high-grade silver-gold, epithermal vein deposits characterized by low sulphidation mineralization and adularia-sericite alteration. The Guanaceví veins are typical of most other epithermal silver-gold vein deposits in Mexico in that they are primarily hosted in the Tertiary Lower Volcanic series of andesite flows, pyroclastics and epiclastics, overlain by the Upper Volcanic series of rhyolite pyroclastics and ignimbrites. Evidence is accumulating in the Guanaceví mining district that the mineralization is closely associated with a pulse of silicic eruptions that either signaled the end of Lower Volcanic Sequence magmatism or the onset of Upper Volcanic Sequence activity.
Mineralization at Guanaceví occurs in association with an epithermal low sulphidation, quartz-carbonate, fracture-filling vein hosted by a structure trending approximately N45°W, dipping 55° southwest. The Santa Cruz vein is the principal host of silver and gold mineralization at Guanaceví, and is located on the west side of the horst of the Guanaceví Formation. The mineralized vein is part of a major fault system that trends northwest and principally places the Guanaceví Formation in the footwall against andesite and/or rhyolite in the hanging wall. The fault and vein comprise a structural system referred to locally as the Santa Cruz vein structure or Santa Cruz vein fault. The Santa Cruz vein itself has been traced for 5 km along trend, and averages approximately 3.0 m in width. High-grade mineralization in the system is not continuous, but occurs in steeply northwest-raking shoots up to 200 m in strike length. A secondary mineralized vein is located sub-parallel and subjacent to the Santa Cruz vein, in the footwall, and while less continuous is economically significant in the Porvenir Dos and North Porvenir portions of the Project.
Status of Exploration
In 2016, EDR spent US $1,297,698 (including property holding costs) on exploration activities, primarily at the Porvenir and Santa Cruz mines. Surface and underground drilling programs were carried out at both mine localities, totaling 6,985 m in 30 holes, with a total of 3,070 samples submitted for assay. Regional field exploration was conducted over several concessions peripheral to the Guanaceví Project, and included collection and analysis of 323 rock samples.
Since acquisition of the Guanaceví Project in 2004, and prior to the 2016 exploration season, EDR had completed 690 diamond drill holes totaling 191,116 m and 22 reverse circulation drill holes totaling 2,977 m on the entire Guanaceví Mines Project. Of this total, approximately 147,718 m of diamond drilling in 504 holes were completed on the Santa Cruz vein structure. Holes were drilled from both surface and underground drill stations, and 54,799 samples were collected and submitted for assay.
Development and Operations
Conventional cut and fill mining or by long hole stope methods are employed at Guanaceví. Cut and fill stopes are generally 15m long and 5m high, and long hole stopes are 15m long and 20m high. Access to the stoping areas is provided by a series of primary and secondary ramps located in the footwall. The ramps have grades from minus 15% to plus 12%, with plus or minus 12% as standard. The cross-cuts are 4 m by 4 m for the primary ramps and 3.5 m by 3.5 m for the secondary ramps.
In the upper parts of the mine, stope access is by short (10m to 40m) cross-cuts from the ramp to the vein/stope. These cross-cuts are generally 3.5m by 3.5m in cross-section and are usually driven down at minus 18% to intersect with the stope. As the stope advances up-dip on the vein, the back is taken down the cross-cuts to maintain access until the cross-cut reaches a maximum inclination of 15%. In the lower parts of the mine (below the water table) stope access is by 90m long cross-cuts to the vein/stope. The cross-cuts are generally 3.0m by 3.5m in cross-section and are driven at plus 1% to intersect the stope (for water drainage). As the stope advances up-dip on the vein, the back is taken down in these cross-cuts to maintain access until the cross-cut reaches a maximum inclination of plus 15%.
Mining in the stopes is done with jackleg drills. Back cuts are taken 2m to 2.5m high via vertical up-hole drilling or by breasting. The broken material is mucked out using scooptrams (2 yard or 3.5 yard depending on vein width). Waste fill from mine development is placed in the stope by the same scooptrams to within 2 m to 2.5 m of the back. When the vein is less than minimum mining width, the footwall is slashed to provide adequate width. This slashing is done during the fill cycle and the slashed material remains in the stope as fill.
In 2016, the total ore production was approximately 19% from the Porvenir North mine, 74% from the Santa Cruz mine and 7% from Porvenir 4.
The production from the Porvenir North mine was distributed in three main areas of the mine (Upper Porvenir North, Deep Porvenir North and Central Porvenir North). The area of Upper Porvenir North, provided 34% of production from the mine. The stopes that contributed the most in this area were the R-3122, 3123-R and R-3124. In Deep Porvenir North, production was from the R-3133 and R-3134 stopes which represented 8% of the production. Central Porvenir North produced the most tonnage providing 39% of the total production. Stopes that contributed from this were the R-3145-2, R-3146-2, R-3149 and R-3150. The development from Porvenir North produced 15% of production from the mine. In the Upper Porvenir North mine development was from the S-3117, S-3122 and S-3123 levels. In Central Porvenir North mine development was from the S-3149, 3150-S and S-3157 levels.
In the Santa Cruz mine, the main ramp development was advanced to the 3359 and 3360 levels. During 2016 continued side ramps were developed to enter the main vein at the southern end of mine. Lateral ramps were developed from the ramp on the 4118, R-3348, 3349-R, R-3350 and R-3351 levels. Historic workings on level 13 were also opened to extract remnant ore zones. Production from stopes concentrated on the R-3352, R-3353, R-3354, R-3356, 3357-R and R-3359 stoping levels with R-3352 being the largest contributor. These stopes presented approximately 80% of the total production from Santa Cruz during 2016. Development ore represented approximately 7% of the total production.
In the Porvenir 4 mine development concentrated on the 3508 and 3509 ramps. Production from the mine was mainly from the S-3507, S-3508 and B S-3509 levels. Ore from these stopes represented approximately 24% of ore generated from the mine. Stope production concentrated on the R-3506, R-3507, R-3508, R-3508 B INT B Y R-3509 stopes.
As of December 31, 2016, the Guanaceví mines project had a roster of 546 employees and an additional 387 contractors. The mine operates on two 10-hour shifts, 7 days a week, whereas the mill operates on a 24/7 schedule.
Mineral Resource Estimate
Resource geologist Zachary J. Black, SME-RM, of HRC is responsible for the mineral resource estimate presented in this report. Mr. Black is a Qualified Person as defined by NI 43-101, and is independent of EDR. The mineral resources reported herein are classified as Measured, Indicated and Inferred according to CIM Definition Standards.
HRC estimated the mineral resource for the Guanaceví Project based on drillhole data constrained by geologic vein boundaries with an Inverse Distance Weighted ("ID") algorithm. Datamine Studio RM® V1.0.73.0 ("Datamine") software was used to complete the resource estimate in conjunction with Leapfrog Geo® V.3.0.0 ("Leapfrog"), which was used to produce the geologic model. The metals of interest at Guanaceví are gold and silver.
The Guanaceví mineral resource is comprised of 22 individual veins. The veins are further subdivided by area and modeling method. The mineral resources have been estimated using either a Vertical Longitudinal Projection (VLP) polygonal method (4 veins) or as 3-dimensional ("3D") block model (18 veins).
The resources based on the 2D polygonal methods are estimated by using a fixed distance VLP from sample points. The VLPs are created by projecting vein geology and underground workings onto a vertical 2D long section. The 2D estimates were classified based on the distance to the nearest sample. Measured mineral resources are the area of the defined resource blocks within 10 meters of a sample. Indicated mineral resources are the area of the defined resource blocks within 20 meters of a sample. Inferred mineral resources are those blocks greater than 20 meters from a sample and have a value for estimated silver.
HRC constructed the 3D vein models using Leapfrog. Eighteen veins were modeled using a linear interpolation methodology and sample intervals. Cross-sections orthogonal to the strike of the vein were used to select intervals from drillholes representing the vein material. Level sections were used to select vein material from channel samples. Points representing the hanging wall and footwall contacts were extracted by the software to interpolate hanging wall and footwall surfaces. These surfaces were used to delineate each vein solid. The surfaces were evaluated in 3-dimensions to ensure that both the down dip and along strike continuity was maintained throughout the model. Veins were clipped against younger veins, topography, and the concession boundaries.
The mineral resource estimate includes all analytical data obtained as of December 31, 2016. Mineral resources are not mineral reserves and may be materially affected by environmental, permitting, legal, socio-economic, political, or other factors. Mineral resources are reported above a silver equivalent grade of 198 gpt, assuming a silver price of $16.29 per ounce. HRC used a cutoff grade to test for reasonable prospects for economic extraction.
The mineral resources for the Guanaceví mine as of December 31, 2016, are summarized in Table 1-1. The resources are exclusive of the mineral reserves.
Table 1-1 Mineral Resource Estimate, Effective Date December 31, 2016
|
Classification |
Tonnes |
Silver Equivalent |
Silver |
Gold |
||
|
g/t |
g/t |
oz. |
g/t |
oz. |
||
|
Measured |
69,000 |
284 |
248 |
550,300 |
0.47 |
1,000 |
|
Indicated |
2,271,000 |
351 |
296 |
21,595,600 |
0.72 |
52,800 |
|
Measured +Indicated |
2,340,000 |
349 |
295 |
22,145,900 |
0.71 |
53,800 |
|
Inferred |
638,000 |
441 |
379 |
7,769,400 |
0.82 |
16,900 |
1. Measured, Indicated and Inferred resource cut-off grades were 198 g/t silver equivalent at Guanaceví.
2. Mineral resources are not mineral reserves and do not have demonstrated economic viability. There is no certainty that all or any part of the mineral resources estimated will be converted into mineral reserves.
3. Metallurgical recoveries were 82.5% silver and 85.4% gold.
4. Silver equivalents are based on a 75:1 silver: gold ratio
5. Price assumptions are $16.29 per ounce for silver and $1,195 per ounce for gold for resource cutoff calculations.
6. Mineral resources are estimated exclusive of and in addition to mineral reserves.
Mineral Reserve Estimate
Mr. Jeff Choquette, P.E., MMSA-QP, of HRC is responsible for the mineral reserve estimate presented in this report. Mr. Choquette is Qualified Person as defined by NI 43-101 and is independent of EDR. The mineral reserve estimate for EDR's Guanaceví Project has an effective date of December 31st, 2016. The mineral reserve estimate includes the Santa Cruz and Porvenir Norte areas of the mine and the ore stockpiles at the mill site. Stope designs for reporting the mineral reserves were created utilizing the updated resources and cutoffs established for 2016. All the stopes are within readily accessible areas of the active mining areas. Ore is processed in the on-site mill, leaching circuit and Merrill Crowe process capable of processing 1,300 tpd.
HRC utilized Datamine's Mineable Shape Optimizer ("MSO") program to generate the stopes for the reserve mine plan. The MSO stope designs are then used to design stopes on levels along with the required development for the final mine plans. The stopes were created based solely on Measured and Indicated resources above the calculated cutoff, which have demonstrated to be economically viable; therefore, Measured and Indicated mineral resources within the stopes have been converted to Proven and Probable mineral reserves as defined by CIM. Inferred mineral resources are classified as waste. Dilution is applied to Measured and Indicated resource blocks depending on the mining method chosen.
The mining breakeven cut-off grade, which includes internal stope dilution, was utilized in Datamine's MSO to generate the stope designs for defining the reserves. The cut-off is stated as silver equivalent since the ratio between gold and silver is variable and both commodities are sold. The average cut-off grade used for the Guanaceví property is 198 g/t Ag equivalent. Silver equivalent grade is calculated as the silver grade + (gold grade * 75), taking into account gold and silver prices and expected mill recoveries.
Mineral reserves are derived from Measured and Indicated resources after applying the economic parameters as stated above, and utilizing Datamine's MSO program to generate stope designs for the reserve mine plan. The Guanaceví Project mineral reserves are derived and classified according to the following criteria:
- Proven mineral reserves are the economically mineable part of the Measured resource for which mining and processing / metallurgy information and other relevant factors demonstrate that economic extraction is feasible. For Guanaceví Project, this applies to blocks located within approximately 10m of existing development and for which EDR has a mine plan in place.
- Probable mineral reserves are those Measured or Indicated mineral resource blocks which are considered economic and for which EDR has a mine plan in place. For the Guanaceví mine project, this is applicable to blocks located a maximum of 35m either vertically or horizontally from development with one exception in the main lower Santa Cruz vein the maximum distance to development was extended to 110m as this area is currently being developed.
The Proven and Probable mineral reserves for the Guanaceví mine as of December 31, 2016 are summarized in Table 1-2. The reserves are exclusive of the mineral resources reported in Section 14 of this report.
Table 1-2 Mineral Reserve Estimate
|
Classification |
Tonnes (t x 1,000) |
AgEq g/t |
Ag g/t |
Ag (oz) * 1,000 |
Au g/t |
Au (oz) * 1,000 |
% Dilution |
|
Proven |
86.5 |
284 |
247 |
686.2 |
0.49 |
1.37 |
26% |
|
Probable |
508.2 |
311 |
262 |
4,285.20 |
0.64 |
10.48 |
30% |
|
Total Proven and Probable Reserves |
594.7 |
307 |
260 |
4,971.40 |
0.62 |
11.84 |
29% |
1. Reserve cut-off grades are based on a 198 g/t silver equivalent.
2. Metallurgical Recoveries were 82.5% silver and 85.4% gold.
3. Mining Recoveries of 95% were applied.
4. Minimum mining widths were 1.4 meters.
5. Dilution factors averaged 29%. Dilution factors are calculated based on internal stope dilution calculations and external dilution factors of 15% for cut and fill and 30% for long hole.
6. Silver equivalents are based on a 75:1 silver:gold ratio.
7. Price assumptions are $16.29 per ounce for silver and $1,195 per ounce for gold.
8. Mineral resources are estimated exclusive of and in addition to mineral reserves.
9. Figures in table are rounded to reflect estimate precision; small differences generated by rounding are not material to estimates.
Conclusions and Recommendations
The QP considers the Guanaceví resource and reserve estimates presented here to conform with the requirements and guidelines set forth in Companion Policy 43-101CP and Form 43-101F1 (June 2011), and the mineral resources and reserves presented herein are classified according to Canadian Institute of Mining, Metallurgy and Petroleum ("CIM") Definition Standards - For Mineral Resources and Mineral Reserves, prepared by the CIM Standing Committee on Reserve Definitions and adopted by CIM Council on May 10, 2014. These resources and reserves form the basis for EDR's ongoing mining operations at the Guanaceví Mines Project.
The QP is unaware of any significant technical, legal, environmental or political considerations which would have an adverse effect on the extraction and processing of the resources and reserves located at the Guanaceví Mines Project. Mineral resources which have not been converted to mineral reserves, and do not demonstrate economic viability shall remain mineral resources. There is no certainty that all or any part of the mineral resources estimated will be converted into mineral reserves.
The QP considers that the mineral concessions in the Guanaceví mining district controlled by EDR continue to be highly prospective both along strike and down dip of the existing mineralization.
EDR's Guanaceví Mines Project has an extensive mining history with well-known silver and gold bearing vein systems. Ongoing exploration has continued to demonstrate the potential for the discovery of additional resources at thep project and within the district surrounding the mine. Since EDR took control of the Guanaceví mines Property, new mining areas have enabled EDR to increase production by providing additional sources of mill feed. EDR's operation management teams continue to search for improvements in efficiency, lowering costs and researching and applying low-cost mining techniques.
2017 exploration budgets for Guanaceví are approved for 8,000 meters of drilling. The approved budget for this drilling is estimated at US $1,200,000 for the year.
HRC recommends that the continuation of the conversion of all resources into reserves from 2D polygons to 3D block models be continued. During 2015 and 2016, considerable progress was made in this regard. Additional modeling efforts should be made to define the mineralized brecciated areas as they have been an import source of economic material encountered in the current operation, and could provide additional tonnage to support the mine plan.
Currently EDR utilizes the exploration drilling and chip and muck samples in their resource and reserve calculations. HRC recommends that future efforts focus on constructing block models for resource and reserve reporting utilizing only the exploration and underground drilling results. The chip and muck samples should be used to develop the production model. This will help in keeping data densities consistent in each modeling effort and allow another level into the reconciliation process to compare modeling results.
Although the reconciliations conducted by EDR show good comparisons on planned values versus actual values the reconciliation process should be improved to include the estimated tonnes and grade from the resource models. By comparing the LOM plan on a monthly basis to the plant production the actual physical location of the material mined may be different in the plan versus the actual area that was mined. Due to the many faces that are mined during a day this can only be completed on an average monthly basis to account for the blending of this material at the mill. The monthly surveyed as mined areas should be created and saved on a monthly basis for reporting the modeled tonnes for each month. The combination of the 3D block models and 2D and polygonal reserves makes this process difficult but considerable progress has been made during the last year to get all resources and reserves into 3D block models. The model predicted results versus actuals can then be used to determine if dilution factors need to be adjusted or perhaps the resource modeling parameters may require adjustment if there are large variances. On a yearly basis, the mill production should be reconciled to the final concentrate shipments and resulting adjustment factors should be explained and reported.
Guanaceví Mines Project 2020 Company Update
Exploration Update
In 2017, the Company spent $1.4 million (including property holding costs) on exploration activities, mainly on underground drilling, conducted at the Porvenir and Santa Cruz Mines. The underground drilling program included a total of 6,794 metres in 29 holes, with a total of 2,995 samples submitted for assay. Field exploration activities were carried out over numerous concessions peripheral to the Guanaceví Project, and included the collection and analysis of 157 rock samples.
In 2018, the Company spent $0.7 million (including property holding costs) on exploration activities, mainly on underground drilling conducted at the Porvenir, Santa Cruz and Milache Mines. The underground drilling program included a total of 5,691 metres in 24 holes.
In 2019, the Company spent $0.8 million (including property holding costs) on exploration activities, mainly on underground drilling conducted at the Porvenir, Santa Cruz and Milache Mines. The underground drilling program included a total of 6,525 metres in 32 holes.
The holes intersected high grades over mineable widths to extend the three orebodies outside of the current mine plans. Drilling highlights in the Porvenir Norte orebody include 251 g/t silver and 0.93 g/t gold for 325 g\t silver equivalent over a 3.0 metre true width. Drilling highlights in the Santa Cruz orebody include two intersections in parallel veins, 2,175 g/t silver and 2.93 g/t gold for 2,409 g/t Ag Eq over a 1.0 metre true width; and 579 g/t silver and 0.78 g/t gold for 642 g/t AgEq over 3.9 metres in hole UG-75.
On July 5, 2019, the Company acquired a 10 year right to explore and exploit the El Porvenir and El Curso concessions from Ocampo Mining SA de CV ("Ocampo"), a subsidiary of Grupo Frisco. The Company is required to meet certain minimum production targets from the properties, subject to various terms and conditions and pay Ocampo a fixed per tonne production payment plus a floating net smelter return royalty based on the spot silver price.
The El Porvenir concession sits adjacent to the Porvenir Norte mine and covers 15 hectares including the projected extension of the Porvenir Norte orebody. The Company had a similar exploration and exploitation right on this property between 2006 and 2008, during which time the Company conducted exploration drilling and small-scale mining.
The El Curso property lies adjacent to the now closed Porvenir Cuatro mine and covers 40 hectares including the northwest extension of the Porvenir Cuatro orebody. Porvenir Cuatro was previously Guanaceví's highest grade mine in the district where mining ended in 2018 at the boundary with the El Curso property. The current mine access ramp from Porvenir Cuatro to Milache crosses the entire El Curso property and provides existing underground access and infrastructure to facilitate the exploration, development and production of El Curso.
Drilling of the El Curso concession commenced late in Q3, 2019 intersecting the mineralized vein, an extension of the historical Porvenir Cuatro ore body. Drilling highlights from the first ten drill holes include 1,182 g/t silver and 3.07 g/t gold for 1,427 g/t silver equivalent over a 5.1 metre true width and defines a 200 metres long x 200 metres deep northwest extension of the high grade Porvenir Cuatro orebody.
In 2020, the Company spent $0.8 million drilling 7,240 metres in 22 holes to extend and delineate the northwest extension of Porvenir Cuatro ore body on the El Curso concession. The extension measure over 600 metres long and 400 metres deep and still open at depth.
For 2021, management has approved a $2.0 million exploration budget for Guanaceví district, including 11,500 metres of underground drilling. The main objective is to determine the extension to depth of the Santa Cruz vein in the Milache ore body and continued extension along strike and to depth of the Porvenir Cuatro body.
Mineral Resource Estimation
The estimation of the mineral resource for the Guanaceví mining operation is based on drill hole data constrained by geologic vein boundaries. Both, exploration and production data are used for modelling estimation and classification. The interpolation is assessed through Ordinary Kriging algorithm. The channel composite database cut-off date for mineral resource estimation was August 31, 2020. The exploration database cut-off date for mineral resource estimation was December 15, 2020.
The Company used criteria of distance from composites and the number of samples to classify the mineral resources into measured, indicated, inferred. Measured mineral resources are those blocks with at least 16 composites, laying within a distanced no greater than 15 metres. Indicated mineral resources are these blocks estimated by at least 4 composites laying no farther than 25 metres from samples. Inferred mineral resources are those blocks, which distance to borehole composites and channel samples is greater than 50 metres.
Mineral Resources stated as at 31 of December 2020
|
Resource Classification |
Tonnes |
Silver g/t |
Gold g/t |
Silver oz |
Gold oz |
|
|
|
|
|
|
|
|
Measured |
95,000 |
405 |
0.88 |
1,240,000 |
2,700 |
|
Indicated |
566,000 |
331 |
0.85 |
6,603,000 |
14,900 |
|
Total Measured & Indicated |
661,000 |
369 |
0.83 |
7,843,000 |
17,600 |
|
|
|
|
|
|
|
|
Total Inferred |
866,000 |
495 |
1.18 |
13,765,000 |
32,700 |
|
|
|
|
|
|
|
Notes for mineral resource estimation
1. Mineral resources are not mineral reserves and do not have demonstrated economic viability. There is no certainty that any or all part of the mineral resources will be converted into mineral reserves.
2. Mineral resources are exclusive of and in addition to mineral reserves
3. Guanaceví Mineral Resource and Mineral Reserve cut-off grades are based on a 225 g/t silver equivalent for Santa Cruz Sur of Guanaceví, 222 g/t silver equivalent for Santa Cruz, 237 g/t silver equivalent for Milache of Guanaceví and 280 g/t silver equivalent for Porvenir Norte and the El Curso concession of Guanacevi;
4. Dilution factor and Mining recovery for Mineral Resources are not applied.
5. Price assumptions are $16.51 per ounce for silver and $1,465 per ounce for gold
Mineral Reserve Estimation
The mineral reserve estimate includes the Santa Cruz, Porvenir Norte, Milache and Porvenir Cuatro areas of the mine.
The mining breakeven cut-off grade includes internal stope dilution and was utilized to generate the stope designs for defining the reserves. The cut-off is stated as silver equivalent since the ratio between gold and silver is variable and both commodities are sold. Silver equivalent grade is calculated as the silver grade plus (gold grade multiplied by 80), taking into account gold and silver prices and expected mill recoveries.
Mineral reserves are derived from Measured and Indicated resources after applying the economic parameters as stated below, while utilizing Vulcan software to generate stope designs for the reserve mine plan. The Guanaceví Project mineral reserves are derived and classified according to the following criteria:
- Proven mineral reserves are the economically mineable part of the Measured resource for which mining and processing / metallurgy information and other relevant factors demonstrate that economic extraction is feasible. For Guanaceví Project, this applies to blocks located within approximately 15 metres of existing development and for which EDR has a mine plan in place.
- Probable mineral reserves are those Measured or Indicated mineral resource blocks which are considered economic and for which EDR has a mine plan in place. For the Guanaceví mine project, this is applicable to blocks located a maximum of 25 metres to 35 metres either vertically or horizontally from development and the drill holes data.
Mineral Reserves stated as at 31 of December 2020
|
Resource Classification |
Tonnes |
Silver g/t |
Gold g/t |
Silver oz |
Gold oz |
|
|
|
|
|
|
|
|
Proven |
141,000 |
319 |
0.82 |
1,445,000 |
3,700 |
|
Probable |
948,000 |
346 |
0.95 |
10,554,000 |
28,800 |
|
Total Proven & Probable |
1,089,000 |
343 |
0.93 |
11,999,000 |
32,500 |
|
|
|
|
|
|
|
Notes for mineral reserve estimation
1. Guanaceví Mineral Resource and Mineral Reserve cut-off grades are based on a 225 g/t silver equivalent for Santa Cruz Sur of Guanaceví, 222 g/t silver equivalent for Santa Cruz, 237 g/t silver equivalent for Milache of Guanaceví and 280 g/t silver equivalent for Porvenir Norte and the El Curso concession of Guanacevi;
2. Guanaceví Metallurgical Recoveries are 84.6% silver and 85.7% gold
3. Mining recoveries of 93% were applied for mineral reserve estimate calculations
4. Minimum mining widths are 0.8 meters for mineral reserve estimate calculations
5. Dilution factor is 34.7%, the dilution factors are calculated based on estimates of internal dilution of cameras and external empirical factor dilution.
6. Price assumptions are $16.51 per ounce for silver and $1,465 per ounce for gold
Bolañitos Mines Project (formerly the Guanajuato Mines Project), Guanajuato State, Mexico
The following summary of the Bolañitos Mines Project is extracted from the technical report titled "National Instrument 43-101 Technical Report: Updated Mineral Resource and Reserve Estimates for the Bolañitos Project, Guanajuato State, Mexico" prepared by Hard Rock Consulting LLC, with an effective date of December 31, 2016 and dated March 3, 2017 and amended March 27, 2018. The complete report can be viewed on SEDAR at www.sedar.com. The technical report is incorporated by reference in its entirety into this AIF.
Executive Summary
Introduction
Hard Rock Consulting, LLC ("HRC") was retained by Endeavour Silver Corp. ("EDR") to complete an independent technical audit and to update the mineral resource and reserve estimates for the Bolañitos Project (the "Project") located in Guanajuato State, Mexico. This report presents the results of HRC's efforts, and is intended to fulfill the Standards of Disclosure for Mineral Projects according to Canadian National Instrument 43-101 ("NI 43-101"). This report was prepared in accordance with the requirements and guidelines set forth in Companion Policy 43-101CP and Form 43-101F1 (June 2011), and the mineral resources and reserves presented herein are classified according to Canadian Institute of Mining, Metallurgy and Petroleum ("CIM") Definition Standards - For Mineral Resources and Mineral Reserves, prepared by the CIM Standing Committee on Reserve Definitions and adopted by CIM Council on May 10, 2014. The mineral resource and mineral reserve estimates reported here are based on all available technical data and information as of December 31, 2016.
Property Description and Ownership
In 2007, EDR acquired the Bolañitos mine from Industrias Peñoles S.A. de C.V. (Peñoles), the owner at the time, and Minas de la Luz, S.A. de C.V. (Minas de la Luz), the operator at the time. The acquisition included the Mina Cebada, Mina Bolañitos, Mina Golondrinas and Mina Asunción (as well as a few other currently closed mines). Minas de la Luz continued as the operator of the mines until June, 2007, when EDR assumed control. The Mina Asunción is very close to the Mina Bolañitos and the two are currently connected underground.
The Bolañitos Project is located in the state of Guanajuato, Mexico. The mine consists of three operating mines: the Bolañitos, Lucero, and Asuncion mines, which are located near the town of La Luz, about 12 km to the northeast of Guanajuato. All of the mines are readily accessed by paved and gravel roads. EDR also owns the inactive Cebada mine, located about 5 km north of the city of Guanajuato, and the inactive Golondrinas mine, which is 3.5 km to the southwest of Cebada.
Geology and Mineralization
The Bolañitos mine is located in eastern part of the Guanajuato mining district, in the southeastern portion of the Sierra de Guanajuato, which is an anticlinal structure about 100 km long and 20 km wide. Bolañitos is located on the northeast side of this structure where typical primary bedding textures dip 10° to 20° to the north-northeast. Economic mineralization at Bolañitos is known to extend as much as 250 m vertically from 2300 m to 2050 m elevation with the exception of the La Luz vein that extends 400 m vertically from 2300 m to 1900 m.
The Guanajuato mining district is characterized by classic, high grade silver-gold, epithermal vein deposits with low sulfidation mineralization and adularia-sericite alteration. Veins in the Guanajuato district are typical of most epithermal silver-gold vein deposits in Mexico with respect to the volcanic or sedimentary host rocks and the paragenesis and tenor of mineralization. The Guanajuato mining district hosts three major mineralized fault systems, the La Luz, Veta Madre and Sierra systems.
Of the geological formations associated with the Guanajuato district, only the Esperanza and La Luz Formations occur in the Bolañitos mine area with mineralization residing primarily within the La Luz Formation. Mineralization is known to dissipate at the contact with the Esperanza Formation.
The Veta Madre historically was the most productive vein in the Guanajuato district, and is by far the most continuous, having been traced on the surface for nearly 25 km. The vein dips from 35° to 55º to the southwest with measured displacement of around 1,200m near the Las Torres mine and 1,700 m near La Valenciana mine. The most productive veins at Bolañitos strike parallel to the Veta Madre system.
Bolañitos mineralization is directly related to faulting. Mineralization occurs as open-space fillings in fracture zones or impregnations in locally porous wall rock. Veins which formed in relatively open spaces are the main targets for mining.
Mineralized veins at Bolañitos consist of the classic banded and brecciated epithermal variety. Silver occurs primarily in dark sulfide-rich bands within the veins, with little mineralization within the wall rocks. The major metallic minerals reported include pyrite, argentite, electrum and ruby silver, as well as some galena and sphalerite, generally deeper in the veins. Mineralization is generally associated with phyllic (sericite) and silicification alteration which forms haloes around the mineralizing structures. The vein textures are attributed to the brittle fracturing-healing cycle of the fault-hosted veins during and/or after faulting.
Economic concentrations of precious metals are present in "shoots" distributed vertically and laterally between non-mineralized segments of the veins. Overall, the style of mineralization is pinch-and-swell with some flexures resulting in closures and others generating wide sigmoidal breccia zones.
Status of Exploration
In 2016, EDR spent US $240,249 (including property holding costs) on exploration activities, including drilling, at the Bolañitos Project. The target areas explored at the Bolañitos Project in 2016 included:
-
Bolañitos North (La Luz-San Antonio de los Tiros),
-
La Loba Margaritas, and
-
Bolañitos South (San Cayetano and Emma)
A combined total of 9 drillholes were completed in the Bolañitos North (4 holes) and Bolañitos South (5 holes) areas for a total of 2,528 meters. Geological mapping and surface sampling was conducted in all three of the areas explored.
Mineral Resource Estimate
Resource geologist Zachary J. Black, SME-RM, of HRC is responsible for the mineral resource estimate presented here. Mr. Black is a Qualified Person as defined by NI 43-101, and is independent of EDR. EDR estimated the mineral resource for the Bolañitos mine Project based on drill hole data constrained by geologic vein boundaries under the direct supervision of HRC. Datamine Studio RM® V1.0.73.0 ("Datamine") software was used to audit the resource estimate in conjunction with Leapfrog Geo® V.3.0.0 ("Leapfrog"), which was used to produce a geologic model. The metals of interest at Bolañitos are gold and silver.
The Bolañitos mineral resource is comprised of 21 individual veins. The veins are further subdivided into areas and modeling method. The mineral resources have been estimated using either a Vertical Longitudinal Projection (VLP) polygonal method (9 veins) or as 3-dimensional ("3D") block model (12 veins). The 3D models have been split into 2 areas based on the vein location within the deposit.
The resources based on the 2D polygonal methods are estimated by using a fixed distance Vertical Longitudinal Projection (VLP) from sample points. The VLPs are created by projecting vein geology and underground workings onto a vertical 2D long section. Resource blocks are constructed on the VLP based on the sample locations in the plane of the projection. EDR geologists review the data for sample trends and delineate areas with similar characteristics along the sample lines. The areas are then grouped based on mining requirements and the average grades and thicknesses of the samples are tabulated for each block. Resource volumes are calculated from the delineated area and the horizontal thickness of the vein, as recorded in the sample database. The volume and density are used to determine the overall resource tonnage for each area, and the grades are reported as a length weighted average of the samples inside each resource block.
HRC validated the vein models provided by EDR using Leapfrog. Ten veins were modeled by EDR using a series of cross-sectional interpretations. The sectional interpretations are based primarily on composite intercepts and are used to construct 3D vein solids in Vulcan. Cross-sections orthogonal to the strike of the vein and level plan sections were used to insure sample selections for compositing were contained within the modeled veins. HRC confirmed the areas reported in EDR resource sheets loading AutoCAD® long VLP's provided by EDR into ArcGIS® software, and tracing the perimeter of the resource blocks and measuring the area with the built-in measuring tool. The dip of the vein and true thickness are known variables.
The mineral resource estimate for the Bolañitos Project as of December 31st, 2016, is summarized in Table 1-1. The mineral resources are exclusive of the mineral reserves.
Table 1-1 Mineral Resource Estimate, Effective Date December 31st, 2016
|
Classification |
Tonnes |
Silver Equivalent |
Silver |
Gold |
||
|
g/t |
g/t |
oz |
g/t |
oz |
||
|
Measured |
89,000 |
329 |
150 |
427,600 |
2.29 |
6,500 |
|
Indicated |
698,000 |
325 |
162 |
3,630,300 |
2.04 |
45,800 |
|
Measured + Indicated |
787,000 |
325 |
161 |
4,057,900 |
2.07 |
52,300 |
|
Inferred |
1,150,000 |
330 |
153 |
5,674,700 |
2.29 |
84,800 |
1. Measured, Indicated and Inferred resource cut-off grades were 162 g/t silver equivalent at Bolañitos.
2. Mineral resources are not mineral reserves and do not have demonstrated economic viability. There is no certainty that all or any part of the mineral resources estimated will be converted into mineral reserves.
3. Metallurgical recoveries were 79.6% silver and 84.5% gold.
4. Silver equivalents are based on a 75:1 silver:gold ratio
5. Price assumptions are $16.29 per ounce for silver and $1,195 per ounce for gold for resource cutoff calculations.
6. Mineral resources are estimated exclusive of and in addition to mineral reserves.
Mineral Reserve Estimate
Mr. Jeff Choquette, P.E., MMSA QP Member, of HRC is responsible for the mineral reserve estimate presented in this report. Mr. Choquette is Qualified Person as defined by NI 43-101 and is independent of EDR. The reserve calculation for the Bolañitos Project was completed in accordance with NI 43-101 and has an effective date of December 31st, 2016. Stope designs for reporting the reserves were created utilizing the updated resources and cutoffs established for 2016. All of the stopes are within readily accessible areas of the active mining areas. Ore is processed in the on-site mill and floatation process capable of processing 1,600 tpd.
HRC utilized Datamine's MSO (Mineable shape optimizer) program to generate the stopes for the reserve mine plan. The stopes were created based solely on Measured and Indicated resources above the calculated cutoff, which have demonstrated to be economically viable; therefore, Measured and Indicated mineral resources within the stopes have been converted to Proven and Probable mineral reserves as defined by CIM. Inferred mineral resources are classified as waste. Dilution is applied to Measured and Indicated resource blocks depending on the mining method chosen.
The mining breakeven cut-off grade, which includes internal stope dilution, was utilized in Datamine's MSO to generate the stope designs for defining the reserves. The cut-off is stated as silver equivalent since the ratio between gold and silver is variable and both commodities are sold. The average cut-off grade used for the Bolañitos property is 162 g/t Ag equivalent. Silver equivalent grade is calculated as the silver grade + (gold grade * 75), taking into account gold and silver prices and expected mill recoveries.
Mineral reserves are derived from Measured and Indicated resources after applying the economic parameters as previously stated, and utilizing Datamine's MSO program to generate stope designs for the reserve mine plan. The Bolañitos Project mineral reserves are derived and classified according to the following criteria:
- Proven mineral reserves are the economically mineable part of the Measured resource for which mining and processing / metallurgy information and other relevant factors demonstrate that economic extraction is feasible. For Bolañitos Project, this applies to blocks located within approximately 10m of existing development and for which EDR has a mine plan in place.
- Probable mineral reserves are those Measured or Indicated mineral resource blocks which are considered economic and for which EDR has a mine plan in place. For the Bolañitos mine project, this is applicable to blocks located a maximum of 35m either vertically or horizontally from development.
The Proven and Probable mineral reserves for the Bolañitos Project as of December 31, 2016 are summarized in Table 1-2. The reserves are exclusive of the mineral resources reported in Section 14 of this report.
Table 1-2 Mineral Reserve Estimate
|
Classification |
Tonnes (t x 1,000) |
AgEq g/t |
Ag g/t |
Ag (oz) * 1,000 |
Au g/t |
Au (oz) * 1,000 |
% Dilution |
|
Proven |
157.2 |
311 |
90 |
456.7 |
2.84 |
14.34 |
21% |
|
Probable |
238.2 |
245 |
104 |
798.3 |
1.81 |
13.82 |
20% |
|
Total Proven and Probable Reserves |
395.4 |
271 |
99 |
1255.0 |
2.22 |
28.17 |
21% |
1. Reserve cut-off grades are based on a 162 g/t silver equivalent.
2. Metallurgical Recoveries were 79.6% silver and 84.5% gold.
3. Mining Recoveries of 95% were applied.
4. Minimum mining widths were 0.8 meters.
5. Dilution factors averaged 21.0%. Dilution factors are calculated based on internal stope dilution calculations and external dilution factors of 15% for cut and fill and 30% for long hole.
6. Silver equivalents are based on a 75:1 silver:gold ratio.
7. Price assumptions are $16.29 per ounce for silver and $1,195 per ounce for gold.
8. Mineral resources are estimated exclusive of and in addition to mineral reserves.
9. Figures in table are rounded to reflect estimate precision; small differences generated by rounding are not material to estimates.
Conclusions and Recommendations
The QP considers the Bolañitos mineral resource and reserve estimates presented herein to conform with the requirements and guidelines set forth in Companion Policy 43-101CP and Form 43-101F1 (June 2011), and the mineral resources and reserves presented herein are classified according to Canadian Institute of Mining, Metallurgy and Petroleum ("CIM") Definition Standards - For Mineral Resources and Mineral Reserves, prepared by the CIM Standing Committee on Reserve Definitions and adopted by CIM Council on May 10, 2014. These mineral resources and reserves form the basis for EDR's ongoing mining operations at the Bolañitos Mines Project.
The QP is unaware of any significant technical, legal, environmental or political considerations which would have an adverse effect on the extraction and processing of the resources and reserves located at the Bolañitos Mines Project. Mineral resources which have not been converted to mineral reserves, and do not demonstrate economic viability shall remain mineral resources. There is no certainty that all or any part of the mineral resources estimated will be converted into mineral reserves.
The QP considers that the mineral concessions in the Bolañitos mining district controlled by EDR continue to be highly prospective both along strike and down dip of the existing mineralization.
EDR's Bolañitos Mines Project has an extensive mining history with well-known silver and gold bearing vein systems. Ongoing exploration has continued to demonstrate the potential for the discovery of additional resources at the project and within the district surrounding the mine. Outside of the currently known reserve/resource areas, the mineral exploration potential for the Bolañitos Project is considered to be very good. Parts of the known vein splays beyond the historically mined areas also represent good exploration targets for additional resource tonnage.
Since EDR took control of the Bolañitos Mines Project, new mining areas have enabled EDR to increase production by providing additional sources of mill feed. EDR's operation management teams continue to search for improvements in efficiency, lowering costs and researching and applying low-cost mining techniques.
In 2017, EDR will conduct a surface drilling program in the Bolañitos South and Bolañitos North areas. The planned program included 6,000 meters of drilling at an estimated cost of $900,000.
HRC recommends that the process of converting mineral resources into reserves from 2D polygons to 3D block models be continued. During the last couple of years, considerable progress has been made on this process with only nine veins remaining to be converted to 3D. Additional modeling efforts should be made to define the mineralized brecciated areas as they have been an important source of economic material encountered in the current operation, and could provide additional tonnage to support the mine plan.
EDR currently utilizes the exploration drilling and chip and muck samples in their resource and reserve calculations. HRC recommends that future efforts focus on constructing block models for resource and reserve reporting utilizing only the exploration and underground drilling results. The chip and muck samples should be used to develop the production model. This will help keep data densities consistent in each modeling effort and will provide another level in the reconciliation process to compare modeling results.
Although the reconciliations conducted by EDR show good comparison between planned versus actual values, the reconciliation process should be improved to include the estimated tonnes and grade from the resource models. Because the LOM plan is compared to the plant production on a monthly basis, the actual physical location of the material mined may be different than the planned location. Due to the many stopes that are mined during a day this can only be completed on an average monthly basis due to blending of stope material into the mill. The monthly surveyed as mined areas should be created into triangulation solids and saved on a monthly basis for reporting the modeled tonnes for each month. The combination of the 3D block models and 2D and polygonal reserves makes this process difficult but considerable progress has been made during the last year to get all resources and reserves into 3D block models. The model-predicted results versus actual can then be used to determine if dilution factors need to be adjusted, or perhaps the resource modeling parameters may require adjustment if there are large variances. The mill production should be reconciled to the final concentrate shipments on a yearly basis, and resulting adjustment factors should be explained and reported.
Bolañitos Mines Project 2020 Company Update
Exploration Update
In 2017, the Company spent $0.8 million on exploration activities, including surface and underground drilling at the Bolañitos Project. Surface drilling was conducted at the Bolañitos South (San Cayetano) and Siglo XX Targets, totalling 3,442 metres in 12 drill holes. The underground drilling program focused on the La Luz and Plateros veins, a total of 17 drill holes were completed with 3,866 metres.
In 2018, the Company spent $0.7 million on exploration activities, including surface and underground drilling at the Bolañitos Project. Surface drilling was conducted at the San Miguel, Herradura and Belen targets totalling 4,197 metres in 23 drill holes. The underground drilling program focused on the La Luz and Plateros veins, a total of 45 drill holes were completed with 9,945 metres.
In 2019, the Company spent $0.8 million completing 8,671 metres in 54 drill holes testing extensions of current ore bodies. Drilling intersected high grades over mineable widths in the Plateros, San Miguel and Bolañitos Norte veins which are expected to extend the mine life. Drilling highlights in the San Miguel vein just north of the Bolanitos plant include 58 g/t silver and 22.1 g/t gold for 1827 g/t silver equivalent over a 3.5 metre true width. New high-grade vein mineralization has now been delineated over a 250 metre length by 130 metre depth below and northwest of the old San Miguel mine workings, still open to the northwest. Drilling highlights in the Plateros vein just west of the Bolanitos plant include 108 g/t silver and 4.25 g/t gold for 448 g/t Ag Eq over a 2.3 metre true width. New high-grade vein mineralization has now been delineated over a 250 metre length by 120 metre depth below the Plateros mine workings where Endeavour is currently mining, still open at depth and to the southeast.
The recently discovered San Miguel vein, which is interpreted to be a northern splay of the Bolañitos vein is included in the 2020 mine plan.
In 2020, the Company spent $0.7 million to drill 10,505 metres in 37 holes targeting the San Miguel, Melladito vein and San Bernabe vein splays. The Company intersected significant mineralization with ore grades over mineable widths, located about 300 metres from current and historic mine workings. Drill holes BN-40, 42, 57 extend the Melladito vein mineralization further to the north and at depth, drill holes 50, 52, 58 extend the Melladito vein mineralization further to the east and near surface to possibly connect with the San Pablo mine workings, and drill holes 45, 47 extend the Melladito vein mineralization another 200 metres north on the other side of the San Ramon and Providencia shafts. The Melladito mineralized zone now measures up to 200 m long by more than 250 m deep, still open at depth and to the north.
Three holes drilled along the San Bernabe vein system highlighted by hole BN-59 which returned 7.91 gpt gold and 12 gpt silver over a 2.7 m true width.
In 2021, the Company plans to conduct a 11,500 metre underground drill program focused on the Plateros, San Miguel and Melladito veins for budgeted to cost $1.9 million.
Mineral resources estimation
The channel composite database cut-off date for mineral resource estimation was August 31, 2020. The exploration database cut-off date for mineral resource estimation was October 31, 2020.
The Company used criteria of distance from composites and the number of samples to classify the mineral resources into measured, indicated, inferred. Measured mineral resources are those blocks with at least 16 composites, laying within a distanced no greater than 15 metres. Indicated mineral resources are these blocks estimated by at least 4 composites laying no farther than 25 metres from samples. Inferred mineral resources are those blocks, which distance to borehole composites and channel samples is greater than 50 metres.
Mineral resources stated as at 31 of December 2020
|
Resource Classification |
Tonnes |
Silver g/t |
Gold g/t |
Silver oz |
Gold oz |
|
|
|
|
|
|
|
|
Measured |
35,000 |
76 |
2.37 |
85,000 |
2,600 |
|
Indicated |
433,000 |
166 |
2.27 |
2,314,000 |
31,600 |
|
Total Measured & Indicated |
468,000 |
159 |
2.27 |
2,399,000 |
34,200 |
|
|
|
|
|
|
|
|
Total Inferred |
625,000 |
120 |
2.52 |
2,411,000 |
50,700 |
|
|
|
|
|
|
|
Notes for mineral resource estimation
1. Mineral resources are not mineral reserves and do not have demonstrated economic viability. There is no certainty that any or all part of the mineral resources will be converted into mineral reserves.
2. Mineral resources are exclusive of and in addition to mineral reserves
3. Bolañitos Mineral Resource and Mineral Reserve cut-off grades are based on a 181 g/t silver equivalent for the Lucero ramp, Belen and Veta Madre, 173 g/t for the La Luz ramp and 181 g/t for San Miguel ramp area of Bolanitos.
4. Dilution factor and Mining recovery for Mineral Resources are not applied.
5. Price assumptions are $16.51 per ounce for silver and $1,465 per ounce for gold
Mineral reserves estimation
The reserve calculation for the Bolañitos mining operation was completed with an effective date of December 31st, 2020.
The mining breakeven cut-off grade, which includes internal stope dilution, was utilized to generate the stope designs for defining the reserves. The cut-off is stated as silver equivalent since the ratio between gold and silver is variable and both commodities are sold. The average cut-off grade used for the Bolañitos Mineral Resource and Mineral Reserve cut-off grades are based on a 181 g/t silver equivalent for the Lucero ramp, Belen and Veta Madre, 173 g/t for the La Luz ramp and 181 g/t for San Miguel ramp area of Bolanitos. Silver equivalent grade is calculated as the silver grade in addition to gold grade multiplied by 80, taking into account gold and silver prices and expected mill recoveries.
Mineral reserves are derived from Measured and Indicated resources after applying the economic parameters as previously stated, and utilizing program to generate stope designs for the reserve mine plan. The Bolañitos mineral reserves are derived and classified according to the following criteria:
- Proven mineral reserves are the economically mineable part of the measured resource for which mining and processing / metallurgy information and other relevant factors demonstrate that economic extraction is feasible. For Bolañitos Project, this applies to blocks located within approximately 15m of existing development and for which Endeavour has a mine plan in place.
- Probable mineral reserves are those Measured or Indicated mineral resource blocks which are considered economic and for which Endeavour has a mine plan in place. For the Bolañitos mine project, this is applicable to blocks located a maximum of 25 metres to 35 metres either vertically or horizontally from development and the drill holes data.
Mineral reserves stated as at 31 of December 2020
|
Resource Classification |
Tonnes |
Silver g/t |
Gold g/t |
Silver oz |
Gold oz |
|
|
|
|
|
|
|
|
Proven |
76,000 |
34 |
2.62 |
83,000 |
6,400 |
|
Probable |
237,000 |
53 |
2.51 |
405,000 |
19,100 |
|
Total Proven & Probable |
313,000 |
49 |
2.53 |
488,000 |
25,500 |
|
|
|
|
|
|
|
Notes for mineral reserve estimation
1. Bolañitos Mineral Resource and Mineral Reserve cut-off grades are based on a 181 g/t silver equivalent for the Lucero ramp, Belen and Veta Madre, 173 g/t for the La Luz ramp and 181 g/t for San Miguel ramp area of Bolanitos.
2. Bolañitos Metallurgical Recoveries are 84.7% silver and 88.9% gold
3. Mining recoveries of 93% were applied for mineral reserve estimate calculations
4. Minimum mining widths are 0.8 metres for mineral reserve estimate calculations
5. Dilution factor is 34%, the dilution factors are calculated based on estimates of internal dilution of cameras and external empirical factors dilution.
6. Price assumptions are $16.51 per ounce for silver and $1,465 per ounce for gold
Terronera Project, Jalisco State, Mexico
On August 6, 2020, the Company filed the technical report titled "Endeavour Silver Corp, Terronera Project, Jalisco State, Mexico" ("2020 Terronera PFS") prepared by Ausenco Engineering Canada Inc. dated July 31, 2020 with an effective date of July14, 2020. The complete report can be viewed on SEDAR at www.sedar.com. The technical report is incorporated by reference in its entirety into this AIF.
Executive Summary
1.1 Overview
Ausenco Engineering Canada Inc. (Ausenco) prepared the Technical Report (the Report) for Endeavour Silver Corp. (Endeavour Silver) to summarise the results of an updated pre-feasibility study (UPFS) on the Terronera Silver Gold Project (the Terronera Project).
In this Report, the term San Sebastián Property refers to the entire area covered by the mining concessions. The term Terronera Project refers to an area within the mining concession and separate surface lands on which the current exploration programs, Mineral Resource and Mineral Reserve estimates are located.
1.2 Property Description and Location
The Terronera Project is located in San Sebastian, a historic silver mining district in Mexico. The property consists of two deposits: Terronera and La Luz. The site is located, approximately 160 km west of Guadalajara and 50 km northeast of Puerto Vallarta, Jalisco State, Mexico and is accessed by paved state highways and maintained all-weather gravel roads. The exploration project was acquired in 2010, the first discovery was made in 2012.

Source: Terronera NI43-101 Technical Report, April 30, 2019
Figure 1-1 Terronera Project Location Map
1.3 Accessibility, Climate, Local Resources, Infrastructure & Physiography
The project is located in Jalisco State, in the town of San Sebastián del Oeste which is at an elevation of 1,480 m above sea level. The surrounding area is mountainous and heavily forested, mainly with pine trees. The surrounding valleys are occupied by cattle ranches, corn fields and coffee plantations. The weather is predominantly humid in the winter and dry and warm during the spring. The mean annual temperature is 18°C, with a maximum of 25.6°C and a minimum of 11.7°C. The wettest months are June through September.

Source: Terronera NI43-101 Technical Report, April 30, 2019
Figure 1-2 View of the Town of San Sebastián from Bufa
1.4 History
San Sebastián del Oeste is a silver and gold mining town founded in 1605 during the Spanish colonial period. By 1785, more than 25 mines and a number of smelters had been established in the district and, during the peak mining period, the area was considered one of the principal sources of gold, silver and copper for New Spain. The main mines in the district included Real de Oxtotipan, Los Reyes, Santa Gertrudis, Terronera and La Quiteria. As of 2013, the La Quiteria Mine was still active and mined by Minera Cimarrón S.A. de C.V., a private mining company.
Historic exploration performed on the San Sebastian Property is summarized in Table 1-1.
Table 1-1 Summary of Historic Exploration on the San Sebastian Property
|
Year |
Company |
Exploration |
|
1921 |
Various, unknown |
After the Mexican Revolution, intermittent small scale mining took place in the areas of Santiago de Los Pinos, Los Reyes and Navidad. All of these areas are currently inactive. |
|
1979 |
Consejo de Recursos Minerales |
Regional and local semi-detailed mapping and exploration activity. |
|
1985 |
Compañía Minera Bolaños, S.A. |
Prospecting activities in the areas of Los Reyes and Santiago de Los Pinos. This work eventually ended and many of the concessions were allowed to elapse. |
|
Late 1980s |
IMMSA |
Exploration begins in Sebastián del Oeste district. |
|
1992 - 1995 |
IMMSA |
Detailed geological mapping and sampling of outcropping structures including the La Quiteria, San Augustin and Los Reyes veins, as well as other veins of secondary importance. IMMSA assayed more than 200 rock samples from many of the old mines. |
|
1995 - 2010 |
IMMSA |
An initial program of 17 widely-spaced diamond drill holes was completed, mainly at the Terronera Vein. Drilling succeeded in intersecting widespread silver- gold mineralization generally ranging up to 1 g/t gold and from 50 to 150 g/t silver over 2 to 6 m widths. Drilling was suspended and quantification of mineral resources was not undertaken. |
|
2010 |
Endeavour Silver / IMMSA |
Endeavour Silver acquires option to purchase San Sebastián properties from IMMSA. |
|
2010 |
Endeavour Silver |
Data compilation, geological mapping, rock chip and soil sampling. |
|
2011 |
Endeavour Silver |
Geological mapping, rock chip sampling, topographic surveying. Core drilling (36 holes; 7,688.25 m). Resource estimate. |
|
2012 |
Endeavour Silver |
Core drilling (32 holes; 13,237.1 m). Updated resource estimate. |
|
2013 |
Endeavour Silver |
Geological mapping, trenching, rock chip and trench sampling. Core drilling (30 holes; 8,573.5 m). Updated resource estimate. |
|
2014 |
Endeavour Silver |
Geological mapping, trenching, rock chip and trench sampling. Core drilling (27 holes; 8,204.20 m). |
|
2015 |
Endeavour Silver |
Geological mapping, trenching, soil and trench sampling. Core drilling (27 holes; 6,133 m. Updated resource estimate. Preliminary economic assessment. |
|
2016 |
Endeavour Silver |
Reconnaissance exploration, rock chip and soil sampling. Core drilling (19 holes; 5,670 m). |
|
2017 |
Endeavour Silver |
Geological mapping, trenching, rock chip and trench sampling. Core drilling (47 holes; 2,252 m). Updated resource estimate. Pre-feasibility study. First-time declaration of Mineral Reserves. |
|
2018 |
Endeavour Silver |
Core drilling (39 holes; 18,774 m). Updated resource estimate. |
|
2019 |
Endeavour Silver |
Updates to mine design and production schedule from 2017 pre-feasibility study |
|
2020 |
Endeavour Silver |
UPFS |
1.5 Geology and Mineralization
The San Sebastián region cover a classic, low sulphidation, epithermal vein system in four mineralized vein sub-districts named Los Reyes, Santiago de Los Pinos, San Sebastián and Real de Oxtotipan. Each sub-district consists of a cluster of quartz (calcite, barite) veins mineralized with sulphide minerals (pyrite, argentite, galena and sphalerite). Each vein cluster spans approximately 3 km x 3 km in area. In total, more than 50 small mines were developed historically on at least 20 separate veins.
The San Sebastián veins tend to be large and can host high grade silver-gold mineralized deposits. For example, the La Quiteria Vein ranges up to 15 m thick, and the Santa Quiteria Mine averages about 280 g/t silver (Ag) and 0.5 g/t gold (Au) over a 3 m to 4 m width. This high-grade mineralized zone appears to extend into the San Sebastián Properties both along strike and immediately down dip.
1.6 Deposit Types
The San Sebastián del Oeste silver-gold district comprises classic, high grade silver-gold, epithermal vein deposits, characterized by low-sulphidation mineralization and adularia-sericite alteration. The veins are typical of most other epithermal silver-gold vein deposits in Mexico in that they are primarily hosted in volcanic flows, pyroclastic and epiclastic rocks, or sedimentary sequences of mainly shale and their metamorphic counterparts.
Low-sulphidation epithermal veins in Mexico typically have a well-defined, sub horizontal ore horizon about 300 m to 500 m in vertical extent where the bonanza grade mineralization shoots have been deposited due to boiling of the hydrothermal fluids. Neither the top nor the bottom of the mineralized horizons at the Terronera Project have yet been established precisely.
1.7 Exploration
In 2010, Endeavour Silver commenced exploration activities on the Terronera Project. Initial work included data compilation, field mapping, and sampling. Surface mapping was completed on the Real Alto in the southern part of the Project. A soil geochemistry survey was conducted over the Real Alto zone.
Mapping and sampling of structures in the Santiago de Los Pinos area, including La Luz, Los Reyes, El Alcribil, El Orconcito, El Padre, El Izote, La Plomosa, Tierras, Coloradas, Los Cuates, La Yesquilla, and La Ermita Areas, were conducted, as well as mapping and sampling of the Terronera Vein near the town of San Sebastián del Oeste.
2012 exploration activities focused on surface sampling at the Quiteria West (Los Leones and La Cueva), Terronera and La Zavala areas.
In 2013, Endeavour Silver conducted geological mapping, trenching and sampling at the Terronera Project. Mapping mainly focused on the projection south of the Terronera Vein, La Zavala Vein, the Quiteria West structures, and some samples were collected at the extension east of the Real Vein at the Real Alto area.
Exploration activities in 2014 were mainly conducted at the Quiteria West and Terronera NW areas, including sampling at the Terronera, Lupillo, El Salto and La Cascada Mines located over the Terronera Vein and the Resoyadero, La Tapada 2, Otates, Tajo los Cables, El Toro, ZP3, Copales, Mina 03, Mina 04 and Cotete areas/mines at the Quiteria. A West Vein trenching program was also conducted over the projection of the Quiteria West (east and west parts) and Terronera (northwest part) Veins. Regional geological mapping around the Terronera Project was undertaken.
In 2015, Endeavour Silver conducted geological mapping, trenching and a soil geochemical survey at the Terronera Project. Mapping included the Terronera North, La Zavala, El Fraile, El Padre, SE part of Quiteria-Democrata and La Ermita areas. The trenching program was conducted over the Democrata and La Luz veins. The soil geochemical survey was conducted to find the possible east extension of the Democrata and Quiteria veins, while simultaneously conducting geological mapping. Regional exploration continued in concessions located around the Terronera Project.
In 2017, geological mapping, trenching and sampling was conducted at the Terronera Project with the objective of determining the importance of structures located within the Endeavour Silver concessions in order to be considered drilling targets. The analyzed structures include: Terronera NW, Quiteria West, Los Espinos-Guardarraya, El Jabalí, El Fraile, Vista Hermosa, La Escondida, El Armadillo, La Atrevida, Miguel, Santana, Peña Gorda and Los Tablones.
1.8 Drilling
Endeavour Silver conducted the first drill program at the Real Alto (Real, Animas-Los Negros, Escurana and Tajo veins) and Quiteria West Targets in 2011. In 2012, the surface drilling program continued at Real Alto and a single deep drill hole was drilled at Quiteria West.
The drilling program over the Terronera Vein was conducted from early 2012 to the end of 2016, the structure has been tested with 149 drill holes totalling 43,526 m. Additionally seven drill holes were completed at the Terronera North area (2,783 m).
In 2016, exploration activities focused on the definition and evaluation of new drilling targets around the Terronera Project and near the future Mine Operations. Nine drilling objectives were tested, including La Luz.
Between 2011 and 2016, Endeavour Silver had drilled 70,885 m in 248 diamond drill holes over the entire Terronera Project. Holes were drilled from surface and 22,351 samples have been collected and submitted for analysis.
During 2017, a total of 12,252 m drilled in 47 drill holes, mainly conducted at La Luz (to date a total of 41 drill holes have been completed over the structure totalling 9,796 m of drilling), with the objective to add Mineral Resources to the Terronera Project. Eight other structures were also tested (El Muro, Los Espinos, Los Reyes, El Fraile, Vista Hermosa, La Escondida, La Atrevida and Quiteria West). The 2017 drilling program included 2,308 samples.
During 2018, a total of 18,774 m drilled in 39 surface diamond drill holes, were advanced on the Terronera vein including 3,007 samples collected and submitted for analysis
In 2018, Endeavour Silver engaged Knight Piésold Ltd. (KP) to provide geomechanical and hydrogeological support for the proposed underground mine over the La Luz vein of the Terronera Project.
The investigation program consisted of geomechanical drill holes with core orientation and detailed geomechanical logging, a hydrogeological packer testing at approximately 30 m intervals, and a nested vibrating wire piezometer installation.
Three drill holes were completed by the end of 2018, totalling 575 m, and one more drill hole for 215 m was completed in early 2019.
1.9 Sample Preparation, Analyses and Security
Since September, 2014 sampling has coincided with core recovery. Drilling is subject to daily scrutiny and coordination by Endeavour Silver's geologists.
The core storage facilities at Terronera are located at a permanent structure located at the town of Santiago de Los Pinos in the Project area.
All of Endeavour Silver's samples of rock and drill core are bagged and tagged at the Terronera Project warehouse and shipped to the ALS-Chemex (ALS) preparation facility in Guadalajara, Mexico. After preparation, the samples are shipped to the ALS laboratory in Vancouver, Canada, for analysis.
A QA/QC program of blanks, duplicates, reference standards and check assays has been instituted by Endeavour Silver to monitor the integrity of assay results. Drilling on the Terronera Project included a QA/QC program.
A total of 3,007 samples, including control samples, were submitted during Endeavour Silver's surface drilling program at Terronera from March 2018 through August 2018. A total of 148 pulps were also submitted for check assaying.
1.10 Data Verification
P&E conducted verification of the drill hole assay database by comparison of the database entries with the assay certificates, which were sent to P&E in digital format directly from the ALS.
Assay data from June 2016 through August 2018 were verified for the Terronera Project. For the La Luz Deposit, 97.5% of the constrained drilling assay data were checked for both Au and Ag, against the ALS laboratory certificates. No errors were identified in the database. For the Terronera deposit, 97.4% of the constrained drilling assay data for the holes drilled since 2016 were checked for both Au and Ag, against the ALS laboratory certificates. No errors were identified in the database.
Mr. Burga, P.Geo., most recently visited the Terronera Project in January and October of 2018. In January, 2018, he collected twelve core samples from 10 drill holes from the La Luz Vein area, and three core samples from two drill holes from the Terronera Vein area. For the October, 2018 trip, Mr. Burga collected 10 core samples from nine drill holes from the Terronera Vein area. P&E submitted the samples independently and compared them to the sample values obtained by Endeavour Silver.
Based upon the evaluation of the QA/QC program undertaken by Endeavour Silver and P&E's due diligence sampling, it is P&E's opinion that the results are acceptable for use in the current Mineral Resource Estimate.
1.11 Mineral Processing and Metallurgical Testing
There have been a number of testwork phases conducted between 2017 and 2020. The 2017-2019 work programs were supervised by Process Engineering LLC. The 2020 testwork was supervised by Ausenco.
The previous PFS Update for the Terronera Project was completed in February 2019, which was supported by all testwork conducted from 2017-2019. The 2019 study included a program of locked and open cycle flotation testing completed by ALS Metallurgy at its metallurgical testing facility in Kamloops, B.C. As part of the 2020 UPFS, additional metallurgical tests were conducted at the same ALS Metallurgy facility using retained samples from the 2019 PFS testwork.
The metallurgical testing conducted by ALS from 2017-2019 included evaluation of the flotation parameters for one composite representing an average grade (gold and silver grades) of the deposit as well as three variability composite samples representing low, medium and high-grade materials identified in the deposit.
The following lists the samples that were evaluated in the historical metallurgical test program:
• TR2015 - 1 Average Grade
• TR2016 - 03 Low Grade
• TR2016 - 01 Medium Grade
• TR2016 - 02 High Grade
The 2017-2019 metallurgical test program provided a Bond Ball Mill Work Index (BWi) for four samples (501, 502, 503 and 504 shown in Table 0-4) from various areas of the deposit. Each sample was tested at a closed size of 100 mesh. In addition, the Bond Ball mill work index was determined for the original average grade composite sample (TR 2015-1) at a closed size of 100 and 200 mesh. The BWi results obtained in previous test program are summarized in Table 1-2.
Table 1-2 Bond Ball Mill Work Index Test Results
|
Sample |
BWi @100 mesh (kWh/t) |
|
501 |
15.82 |
|
502 |
16.98 |
|
503 |
16.73 |
|
504 |
17.65 |
|
TR 2015-1 |
17.36 |
|
Sample |
BWi @200 mesh (kWh/t) |
|
TR 2015-1 |
17.28 |
Some of the samples listed in Table 0-4 were submitted to Hazen Research for additional comminution testing. The samples were subjected to SMC testing, Bond rod mill work index (RWi), Bond abrasion index (Ai), and Bond impact work index testing (CWi), the results of which are provided in Table 1-3.
Table 1-3 Comminution Testing Results
|
RWi (kWh/t) |
Ai (g) |
CWi (kWh/t) |
SCSE (kWh/t) |
|
17.2 |
1.0916 |
8.3 |
9.85 |
Note: SCSE = standard circuit specific energy
The 2019 PFS comminution testing indicated that the material would be classified as hard and highly abrasive.
Pocock Industrial (Pocock) conducted solids liquid separation (SLS) tests on two samples (Flotation Tails and Flotation Concentrate materials) in the year 2016. The testwork was managed by Process Engineering LLC.
Pressure filtration tests examined the effect of cake thickness, and air-dry duration on production rate, and filter cake moisture for the thickened materials. The samples were tested at the solids concentrations expected in the plant.
Summary of the testwork is provided in Table 1-4.
Table 1-4 Summary of Fully Automatic Membrane Type Filter Press
|
Material |
Feed |
Sizing |
Cake |
Design |
Total Cycle |
Volumetric |
Area Basis |
|
Thickened Flotation Tails |
67.0% |
0.797 |
40 |
12.0% |
9.0 |
167.29 |
2.92 |
|
Thickened Flotation Concentrate |
63.5% |
0.638 |
40 |
15.2% |
13.39 |
140.46 |
2.45 |
As part of the UPFS, additional metallurgical testing was completed to support design of the comminution and flotation circuits.The 2020 testwork was completed using the following composite samples: Terronera MC1, Terronera MC2, High S MC, and Low S MC, which were formed based on spatial and sulphur grades. No additional comminution testing was completed as part of the 2020 program. It is anticipated that additional testwork will be completed in the feasibility phase of the project to confirm the results achieved from 2017-2019 and further define the variability of the ore across the deposit.
Primary grind vs recovery tests were completed as part of the 2019/2020 testwork to compare the rougher flotation stage recoveries at three different grind sizes of 80% passing of 70 to 135 μm. The rougher flotation recovery benefits of silver/gold outweigh grinding mill capital and operating cost savings at 70 μm. Thus, the primary grind size of 70 μm was chosen as the basis of design for the 2020 UPFS.
Cleaner flotation circuit confirmation tests were conducted to examine the possibility of removing the regrind mill and reduction of cleaner circuit stages to achieve the minimum target silver grade of 4,500 g/t in the final concentrate. Two cleaner circuit locked cycle tests (LCT), using low- and high-grade samples, achieved concentrate silver grades higher than 4,500 g/t without the aid of a regrind mill. The lower feed grade sample still required two stages of cleaners to achieve the minimum silver target concentrate grade.
. In the current study, additional flotation tests were performed to analyze the grind size versus precious metal recovery with the objective of lowering the operating and capital costs by increasing the flotation feed size. Cleaner confirmation tests were done resulting in the removal of the regrind mill from the process design. Two composite samples tests representing low, and high-grade materials were examined. Each composite sample was subjected to rougher flotation testing at three different grind sizes including 80% passing 70, 104 and 130 μm (for high grade) and 80% passing 76, 103 and 135 μm (for low grade).
Deleterious elements detected in the ICP scan conducted on the final concentrate product in the 2017-2019 test programs indicated that Trace amounts of deleterious elements such as arsenic, cadmium, chromium, mercury and antimony were detected that may affect the marketability and price of the final concentrate product. Presence of clay may affect the recovery. Thus, further flotation studies need to be conducted on variability samples to understand the impact of such elements on the metallurgical performance and final concentrate produced.The 2020 testwork resulted in an average Ag recovery of 84.9% and Au recovery of 82.3% with a grind size P80 of 70 μm. The 2017-201,9 and 2020 metallurgical testwork results formed the basis of the 2020 UPFS process design, using the additional metallurgical testing to define primary grind size and flotation circuit design parameters, as well as develop new recovery models.
The process flow sheet includes a three-stage crushing circuit followed by closed grinding circuit with a flash flotation cell to achieve a flotation feed grind size of 80% passing 70 μm.
1.12 Mineral Resource Estimate
Mineral Resources are reported in accordance with the Canadian Institute of Mining, Metallurgy and Petroleum (CIM) Definition Standards for Mineral Resources (May 2014; the 2014 CIM Definition Standards).
The Mineral Resource estimate was not updated for the UPFS. The Mineral Resource estimate is based on the2019 PFS report from P&E in April 2019. The effective date of the Mineral Resource estimate is February 1, 2019.
The cut-off grade selected for the February 1, 2019 Mineral Resource estimate was 150 g/t silver equivalent (AgEq). A summary of the Mineral Resource estimate for the Terronera deposit is presented in Table 1-5.
Table 1-5 Terronera Mineral Resource Estimate at a Cut-Off Grade of 150 g/t AgEq(1-6)
|
Classification |
Tonnes (kt) |
Ag (g/t) |
Contained Ag (koz) |
Au (g/t) |
Contained Au (koz) |
AgEq (g/t) |
Contained (koz) |
|
Indicated |
5,275 |
227.2 |
38,537 |
2.35 |
398 |
403.4 |
68,416 |
|
Inferred |
1,022 |
212.2 |
6,970 |
1.70 |
56 |
339.8 |
11,161 |
1. Mineral Resources which are not Mineral Reserves do not have demonstrated economic viability. The estimate of Mineral Resources may be materially affected by environmental, permitting, legal, title, taxation, socio-political, marketing, or other relevant issues.
1. The Inferred Mineral Resource in this estimate has a lower level of confidence than that applied to an Indicated Mineral Resource and must not be converted to a Mineral Reserve. It is reasonably expected that the majority of the Inferred Mineral Resource could be upgraded to an Indicated Mineral Resource with continued exploration.
2. The Mineral Resources in this Updated Technical Report were estimated using the CIM Definition Standards for Mineral Resources and Mineral Reserves.
3. AgEq g/t = Ag g/t + (Au g/t x 75).
4. Historical mined areas were depleted from the Terronera Vein wireframe and Mineral Resource model.
5. Mineral Resources are inclusive of Mineral Reserves.
A summary of the La Luz Mineral Resource estimate at a cut-off grade of 150 g/t AgEq is presented in Table 1-6.
Table 1-6 La Luz Mineral Resource Estimate at a Cut-Off Grade of 150 g/t AgEq(1-5)
|
Classification |
Tonnes (kt) |
Ag (g/t) |
Contained Ag (koz) |
Au (g/t) |
Contained Au (koz) |
AgEq (g/t) |
Contained (koz) |
|
Indicated |
126 |
192 |
779 |
13.60 |
55 |
1,212 |
4,904 |
|
Inferred |
58 |
145 |
269 |
12.15 |
23 |
1,060 |
1,994 |
1. Mineral Resources which are not Mineral Reserves do not have demonstrated economic viability. The estimate of Mineral Resources may be materially affected by environmental, permitting, legal, title, taxation, sociopolitical, marketing, or other relevant issues.
2. The Inferred Mineral Resource in this estimate has a lower level of confidence than that applied to an Indicated Mineral Resource and must not be converted to a Mineral Reserve. It is reasonably expected that the majority of the Inferred Mineral Resource could be upgraded to an Indicated Mineral Resource with continued exploration.
3. The Mineral Resources in this Updated Technical Report were estimated using the Canadian Institute of Mining, Metallurgy and Petroleum (CIM), CIM Standards on Mineral Resources and Reserves, Definitions and Guidelines prepared by the CIM Standing Committee on Reserve Definitions and adopted by the CIM Council.
4. AgEq g/t = Ag g/t + (Au g/t x 75).
5. Mineral Resources are inclusive of Mineral Reserves.
1.13 Mineral Reserve Estimate
Mineral Reserves are reported in accordance with the Canadian Institute of Mining, Metallurgy and Petroleum (CIM) Definition Standards for Mineral Reserves (May 2014; the 2014 CIM Definition Standards).
A summary of the Terronera and La Luz Probable Mineral Reserve estimate is given in Table 1-7.
Table 1-7 Terronera and La Luz Probable Mineral Reserve(1-5)
|
Deposit |
Tonnes |
Au (g/t) |
Ag (g/t) |
AgEq |
Au (koz) |
Ag (koz) |
AgEq (koz) |
|
Terronera |
5,356 |
2.08 |
205 |
367 |
358 |
35,268 |
63,160 |
|
La Luz |
207 |
7.87 |
112 |
725 |
52 |
745 |
4,828 |
|
Combined |
5,563 |
2,29 |
201 |
380 |
410 |
36,013 |
67,988 |
1. The Qualified Person for the estimate is Michael Petrina, P.Eng., who is an employee of Moose Mountain Technical Services. Mineral Reserves have an effective date of March 23, 2020.
2. Mineral Reserves are reported using the 2014 CIM Definition Standards.
3. Mineral Reserves are reported using a silver equivalency (AgEq) cut-off formula AgEq g/t = Ag g/t + (Au g/t x 77.94). Depending on mining method the AgEq cut-off can range from 175 g/t AgEq to 230 g/t AgEq. Inputs to the AgEq determination included: metal prices of US$1,325/oz Au, and US$17.00/oz Ag; metallurgical recovery of 79.8% for gold and 84.9% for silver; payability in concentrate of 98.0% for gold and 97.5% for silver; consideration of refining (US$6/oz), tailings (US$110.00/dmt), transport (US$37.06/dmt), sales (US$5.00/dmt), and concentrate (US$3.48/dmt) costs; transport losses (0.2%), royalties (2% NSR and 0.5% Government); and As penalties payable in the concentrate of US$6.00/dmt. Historically mined areas were depleted from the Terronera wireframe.
1.14 Mining Methods
The underground operations at Terronera and La Luz mines will both be accessed via ramps. In the case of Terronera, the ramp accesses will connect to the deposit via:
• A main haulage drift from the north with the portal approximately 200m from the mill. The ramp will access the deposit at the 1,250m level near the western end of the deposit M1 (see Figure 1-3)
• The West ramp with portal location at the 1,480m elevation for early access to the western blocks of the deposit, as well as early access to the 1,380m elevation footwall access drift
• The M9 ramp, located at the 1,527m elevation for early access to the central and eastern portions of the deposit.
In the case of La Luz, the ramp will connect roughly central to the deposit near the bottom of the upper M7 block (see Figure 1-4). Ore from both the Terronera and La Luz deposits will be transported via 30-t low profile haul truck to surface. Terronera has a haulage way for transporting ore from underground directly to a stockpile in front of the process plant area, whereas all material from La Luz deposit is envisioned to be hauled entirely by contractor truck to the same stockpile area.
Mechanized cut and fill and longhole retreat mining will be used for production at the Terronera deposit, and longhole retreat and resue cut and fill mining will be used for production at La Luz deposit. Both deposits will use backfill comprising either cemented or non-cemented rock fill or later in the mine life, cemented or non-cemented quarry rock fill. Cement contents will vary from 4% to 8% by mass as required.
Development at both deposits will begin at the same time, the first day of month 8 of Year -2. The La Luz deposit will be mined as quickly as possible and will provide mill feed to an off-site mill, whilst the Terronera deposit is being brought into production.
Until the Terronera process plant is complete at the end of Year -1, Month 12, ore from the La Luz deposit will be processed offsite at Endeavour Silver's Bolañitos process plant. Production from La Luz will average roughly 240 tpd over its life, with the Terronera deposit's production ramping up to 1,600 tpd across the year spanning Year 1, Month 7 through to Year 3. Month 1. Production will remain at a total 1,600 tpd across both deposits until Year 9. Month 10, when it will gradually decline to roughly 1.270 tpd by the end of mine life at the end of Year 10.

Source: Moose Mountain, June 2020
Figure 1-3 Terronera Deposit Longitudinal Projection

Source: Moose Mountain, June 2020
Figure 1-4 La Luz Deposit Longitudinal Projection
1.15 Recovery Methods
The Terronera mill will be a 1,600 tpd mill which will process run-of-mine (ROM) material from both the La Luz and Terronera mines.
Production of ore from La Luz mine will start approximately 14 months before completion of Terronera mill. During this period, ore from La Luz will be trucked to Endeavour Silver's Bolanitas mill, located approximately 500 kms away and the ore will be processed under a toll milling arrangement. Production from Terronera mine will begin five months before the start of Terronera mill. During the ramp up period, ore from Terronera mine will be stockpiled until an inventory of 70,000 t is built. After commissioning of the Terronera mill, ore from both La Luz and Terronera mines will be blended and processed at Terronera mill achieving a production rate of 1,600 tpd within three months.
The bulk of the testwork was completed on Terronera ore as it is the most significant component of the feed to the mill. Limited testwork was conducted on La Luz ores; however, the available results show higher recoveries than those for Terronera ores, and thus the Terronera material has been used as the basis of the design.
The key process design criteria for the mill are listed in Table 1-8.
Table 1-8 Key Process Design Criteria for the Mill
|
Design Parameter |
Units |
Value |
|
Plant Throughput |
t/d |
1600 |
|
Gold Head Grade |
g/t |
2.1 |
|
Silver Head Grade |
g/t |
204 |
|
Crushing Availability |
% |
65 |
|
Mill Availability |
% |
92 |
|
Bond Crusher Work Index (CWi) |
kWh/t |
18.0 |
|
Bond Ball Mill Work Index (BWi) |
kWh/t |
17.2 |
|
Bond Rod Mill Work Index (RWi) |
kWh/t |
17.3 |
|
Axb |
- |
38.9 |
|
Abrasion Index (Ai) |
G |
0.50 |
|
Material Specific Gravity |
t/m3 |
2.61 |
|
Moisture |
% |
4 |
|
Plant Silver Recovery |
% |
84.0 |
|
Plant Gold Recovery |
% |
83.1 |
|
ROM F100 |
mm |
500 |
|
Primary Cyclone P80 |
µm |
70 |
Design of the beneficiation plant at Terronera is based on three-stage crushing and single-stage grinding to a target particle size of 80% passing 70 μm. Ground ores will be treated by flash flotation and conventional flotation with two stages of cleaning. On the basis of the testwork, overall recoveries of 84.9% for silver and 82.3% for gold are anticipated for the life-of-mine (LOM) ore. Precious metal values will be recovered into a flotation concentrate that may be sold in the open market. Flotation tailings are filtered; and stored on surface in a tailings storage facility (TSF).
The plan of operation for the Terronera mill is to achieve the design capacity production rate of 1,600 tpd over a three-month ramp-up period. At this design throughput the LOM for the Project is estimated at 10 years.
The ROM material will be transported to a coarse material storage patio with haul trucks. The crushing circuit is designed to process 1,600 dry tpd in 16 hours of operation. The beneficiation plant will operate continuously 365 days per annum. The beneficiation plant availability is assumed to be 92%. The bulk density of the ROM material is anticipated to be 2.61 t/m3 with average moisture content of 4%. The beneficiation plant will produce a precious metal bearing concentrate as final product.
The processing methodology selected consists of the following processing circuits:
• Stock pile (2,000 t capacity)
• Crushing plant (three stage - closed circuit - 1,600 tpd capacity)
• Fine ore storage (1,600 t capacity)
• Primary grinding (1,600 tpd capacity)
• Flotation (1,600 tpd capacity)
• Flash flotation
• Roughers
• First and second cleaners
• Final concentrate sedimentation and filtration (1,600 tpd capacity)
• Final concentrate storage and shipping (1,600 tpd capacity)
• Tailings sedimentation (1,600 tpd capacity)
• Reclaimed and fresh water systems
• Dry tailings filter plant
• Dry stack TSF.
An overall process flow diagram showing the unit operations in the selected process flowsheet is presented in Figure 1-5.

Source: Ausenco, June 2020
Figure 1-5 Overall Process Flow Sheet
1.16 Project Infrastructure
The overall site plan in Figure 1-6 shows the location of the proposed major project facilities, such as Terronera and La Luz mines, process plant, TSF, waste rock facilities, power plant, access road, and accommodations camp.

Source: Ausenco, June 2020
Figure 1-6 Map of Proposed Mine Surface Facilities Layout
1.16.1 Access
Existing infrastructure consists of a public access road that connects Puerto Vallarta with the local communities and the Terronera Project site area. The internal existing road will be upgraded to standard driving width. The roads inside the plant area will generally be 6 m wide, made of bulk earthworks pads to ensure drainage. New accesses will be built for infrastructure areas.
1.16.2 Power
The total power requirement at Terronera site is estimated at 4.85 MW for the entire site and an additional 1 MW for the camp (operating load). Power to the entire site, except for the camp, will be supplied through an onsite power generation plant, which comprises both LNG and solar power generation facilities. Power to the camp will be supplied by a power line connected to the local utility.
1.16.3 Tailings Storage Facility
The TSF will store filtered tailings, or "drystack" tailings, to minimize downstream contamination risk and to maximize geotechnical stability in the seismically active coastal area of western Mexico. The location of the TSF is shown in the over site layout in Figure 1-6.
The proposed TSF will be constructed with filter tailings produced by a filter plant that will be located uphill from the TSF. Filter tailings will be transported to the TSF area by 12 m3 haul trucks that will transport the filtered tailings approximately 0.5 km along a proposed newly constructed haul road. A staging area will be provided at the filter plant location, from which the filtered tailings will be loaded onto haul trucks. The filtered material will be dumped and compacted with dozers. The TSF design will accommodate approximately 3.9 million m3 (5.8 million tonnes) of compacted filtered tailings over a 10-year mine life based upon the production rate of 1,600 tpd.
1.16.4 Accommodation
A construction camp will be established near the site to provide accommodation, meals, and ancillary services for construction and operations personnel. The construction camp will be built in a way such that the same camp will be transformed and used as a permanent camp when the mine operations start. The camp is designed for a peak capacity of 400 personnel. The camp will be located in the town of Santiago de los Pinos and is expected that several employees and contractors will be residing in other neighbouring towns.
1.16.5 Buildings
Ancillary buildings necessary to support the Terronera Project include the following: administration building, warehouse/maintenance workshop, mine portal trailer for tagin-tagout, truckshop, first aid station, main gatehouse, fuel station, explosives storage facility, and metallurgical laboratory.
1.16.6 Water Management
The fresh/fire water tank will have a live volume of 50 m3 and will be situated in the process plant next to the concentrate thickener. The fresh/fire water tank will collect and store excess water from the mine or from ground water. This tank water will be the main supply of process water and potable water for the site. Potable water will be treated before consumption. The freshwater requirement is estimated at 15.6 m3/hr which will be supplied through underground ground water.
Diversion channel structures will collect and divert non-contact water to minimize the need for storage of contact water derived from runoff in the tailings and waste rock storage areas. Contact water from these structures will be collected into three ponds (one for each facility), allow for the sediments to settle and monitor water quality before discharging into the local streams or reusing in the process.
1.17 Market Studies and Contracts
Endeavour Silver produces a silver concentrate from its currently operating mines, which is shipped to third parties for further refining before being sold. To a large extent, silver concentrate is sold at the spot price. Endeavour Silver's hedge policy does not allow the Company to enter into long-term hedge contracts or forward sales.
At the Report effective date, Endeavour Silver had not conducted any market studies, since gold and silver are widely traded in world markets and Endeavour Silver can rely on marketing information for similar products from its other operations. Endeavour Silver has no contracts or agreements for mining, smelting, refining, transportation, handling or sales that are outside normal or generally accepted practices within the mining industry. It is expected that any contracts or sales for the Terronera Project would also be within industry norms.
1.18 Environmental Studies, Permitting, and Social or Community Impact
Endeavour Silver submitted a Manifest of Environmental Impact (MIA) to the Mexico environmental permitting authority known as SEMARNAT (Secretaria de Medio Ambiente y Recursos Naturales) in December, 2013. A SEMARNAT permit for the Terronera Project was issued in October, 2014 for a 500 tpd project. In February, 2017 a modified MIA application was issued by SEMARNAT to expand the proposed process rate to up to 1,500 tpd and to establish a future proposed tailings facility to store filtered dry tailings.
The proposed design in this study is based on a 1,600 tpd production rate. A modified MIA application will be submitted as per the revised design. The Terronera Project is designed to comply with the environmental regulations and standards in place in México. The proposed future mining infrastructure and supporting facilities are designed to minimize the impact to the natural environment.
Mexican law requires that an environmental monitoring program of surface and ground water, creek sediments, soil, air, vegetation and wildlife conditions be implemented. The current SEMARNAT regulatory objective is to limit transmission of contaminants such that pre-mining environmental conditions are maintained downstream of the permitted mine perimeter. This program will be required before and during proposed future mining operations and after mine closure.
1.19 Capital and Operating Costs
1.19.1 Capital Cost
The estimate conforms to Class 4 guidelines for a PFS-level estimate with an accuracy range between -20% to +30% according to AACE International.
Table 0-11 provides a summary of the estimate for overall initial capital cost. The costs are expressed in Q2 2020 United States dollars (US$) and include all costs related to the project such as mining, site preparation, process plant, tailings facility, camps, Owners' costs, spares, first fills, buildings, roadworks, and off-site infrastructure.
Table 1-9 Summary of Terronera Capital Cost Estimate
|
WBS 1 |
WBS Description |
Cost (US$M) |
% of Total |
|
1000 |
Mining |
43.9 |
44.3% |
|
2000 |
Tailings Management Facility |
3.4 |
3.4% |
|
3000 |
Ore Crushing & Handling |
4.7 |
4.8% |
|
4000 |
Mineral Processing Plant |
11.0 |
11.1% |
|
5000 |
On-Site Infrastructure |
9.8 |
9.9% |
|
6000 |
Off-Site Infrastructure |
0.0 |
0.0% |
|
|
Total Direct Costs |
72.8 |
73.5% |
|
7000 |
Project Indirects |
10.4 |
10.5% |
|
9000 |
Owner Costs |
5.8 |
5.8% |
|
10000 |
Contingency |
10.0 |
10.1% |
|
|
Total Indirect Costs |
26.2 |
26.5% |
|
|
Project Total |
99.1 |
100.0% |
The estimate is based on an engineering, procurement and construction management (EPCM) execution approach, as outlined in Section 24.
The following parameters and qualifications were considered:
• No allowance has been made for exchange rate fluctuations
• There is no escalation added to the estimate
• A growth allowance was included
• Data for the estimates have been obtained from numerous sources, including:
o Mine schedules
o PFS engineering design
o Topographical information obtained from the site survey
o Geotechnical investigations
o Budgetary equipment quotes
o Budgetary unit costs from local contractors for civil, concrete, steel, electrical, and mechanical works
o Data from similar recently completed studies and projects.
Major cost categories (permanent equipment, material purchase, installation, subcontracts, indirect costs, and Owner's costs) were identified and analysed. A contingency percentage of was allocated to each of these categories on a line-item basis based on the accuracy of the data. An overall contingency amount was derived in this fashion.
1.19.2 Operating Cost
The operating cost estimate was developed to have an accuracy of ±25%. The estimate includes mining, processing, general and administration (G&A), and TSF costs. Table 1-10 summarizes the total average annual operating costs.
Table 1-10 Average Annual Operating Costs (US$)
|
Summary |
Average Annual Costs (US$) |
Unit Costs (US$ / t) |
Percentage % |
|
Processing |
9,888,700 |
17.8 |
25 |
|
Mining |
24,832,100 |
44.6 |
64 |
|
TSF |
826,500 |
1.5 |
2 |
|
G&A |
3,424,300 |
6.2 |
9 |
|
Total |
38,971,600 |
70.1 |
100 |
1.20 Economic Analysis
An economic model was developed to estimate annual pre-tax and post-tax cash flows and sensitivities of the project based on a 5% discount rate. It must be noted that tax estimates involve complex variables that can only be accurately calculated during operations and, as such, the after-tax results are approximations. A sensitivity analysis was performed to assess the impact of variations in metal prices, initial capital cost, total operating cost, and discount rate.
The results of the economic analyses discussed represent forward-looking information as defined under Canadian securities law. The results depend on inputs that are subject to a number of known and unknown risks, uncertainties, and other factors that may cause actual results to differ materially from those presented herein.
1.20.1 Financial Model Parameters
A base case gold price of US$1,419/oz and silver price of US$15.97 based on two-year trailing averages as of 8th July, 2020 were used. The forecasts are meant to reflect the average metal price expectation over the life of the project. No price inflation or escalation factors were considered. Commodity prices can be volatile, and there is the potential for deviation from the forecast.
The economic analysis was performed using the following assumptions:
• Construction starting March 1, 2022
• All construction costs capitalised in Year -2
• Commercial production starting (effectively) on September 1, 2023
• Mine life of 10 years
• Cost estimates in constant Q2 2020 US dollars with no inflation or escalation
• 100% ownership with 2% royalty to IMMSA and 0.5% to Mexican government
• Capital costs funded with 100% equity (no financing costs assumed)
• All cash flows discounted to March 1, 2022
• Silver and gold are assumed to be sold in the same year it is produced
• No contractual arrangements for refining currently exist.
The Project has been evaluated on an after-tax basis to provide an approximate value of the potential economics. The tax model was compiled by Endeavour Silver with assistance from third-party taxation experts. The calculations are based on the tax regime as of 8th July, 2020.
1.20.2 Economic Analysis
The economic analysis was performed assuming a 5% discount rate. The pre-tax NPV discounted at 5% is US$205 M; the internal rate of return IRR is 37.6%; and payback period is 2.3 years. On a post-tax basis, the NPV discounted at 5% is US$137.1 M; the IRR is 30.0%; and the payback period is 2.7 years. A summary of project economics is shown graphically in Figure 1-7 and listed in Table 1-11.
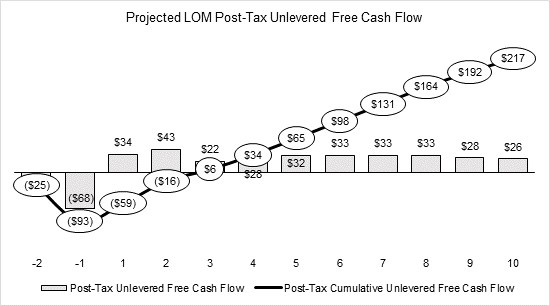
Figure 1-7 Project Economics Graph
Table 1-11 Summary of Project Economics
|
General |
LOM Total / Avg. |
|
Gold Price (US$ / oz) |
1,419 |
|
Silver Price (US$ / oz) |
15.97 |
|
Mine Life (Years) |
10 |
|
Total Mill Feed (kt) |
5,563 |
|
Production |
LOM Total / Avg. |
|
Mill Head Grade Au (g / t) |
2.29 |
|
Mill Recovery Au (%) |
82.3 |
|
Total Recovered Ounces Au (koz) |
336.9 |
|
Average Annual Production Au (koz) |
33.7 |
|
Mill Head Grade Ag (g / t) |
201.1 |
|
Mill Recovery Ag (%) |
84.9 |
|
Total Recovered Ounces Ag (koz) |
30,602 |
|
Average Annual Production Ag (koz) |
3,060 |
|
Average Ag Eq. Grade (g/t) |
404 |
|
Operating Cost |
LOM Total / Avg. |
|
Mining (US$ / t Milled) |
35.6 |
|
Mining Lease (US$ / t Milled) |
8.2 |
|
Processing (US$ / t Milled) |
17.8 |
|
G&A (US$ / t Milled) |
6.2 |
|
Capital Cost |
LOM Total / Avg. |
|
Initial Capex (US$M) |
99.1 |
|
Sustaining Capex (US$M) |
60.4 |
|
Closure Cost net of Salvage (US$M) |
2.0 |
|
Pre-Tax Financial |
LOM Total / Avg. |
|
NPV (5%) (US$M) |
205 |
|
IRR (%) |
37.6 |
|
Payback (Years) |
2.3 |
|
Post-Tax Financial |
LOM Total / Avg. |
|
NPV (5%) (US$M) |
137 |
|
IRR (%) |
30.0 |
|
Payback (Years) |
2.7 |
|
Cash Cost (Net by-product per silver oz) |
0.004 |
|
All-in Sustaining Cost per Ag ounce |
8.96 |
1.20.3 Sensitivity Analysis
A sensitivity analysis was conducted on the base case pre-tax and post-tax NPV and IRR of the Project, using the following variables: metal prices, initial capex, total operating cost, feed grade and discount rate. The analysis concludes that the project is most sensitive to revenue attributes such as gold and silver price, followed by operating cost and capital cost.Source: Ausenco, July 2020
Figure 1-8 shows the project's pre-tax sensitivity and Source: Ausenco, July 2020
Figure 1-9 shows the project's post-tax sensitivity.
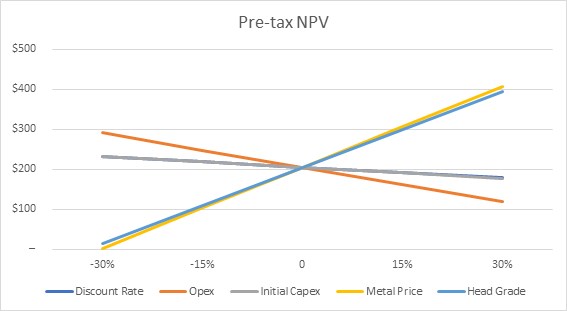

Source: Ausenco, July 2020
Figure 1-8 Pre-Tax Sensitivity


Source: Ausenco, July 2020
Figure 1-9 Post-Tax Sensitivity
At current spot prices, the after tax NPV and IRR are most sensitive to metal prices and least sensitive to initial capex and has approximately equal exposure to silver and gold prices. This information is shown in Table 1.12 and 1.13
Table 1-12 Sensitivity to Metal Prices
|
Gold Price |
Silver Price |
After Tax NPV (US$M) |
After Tax IRR |
|
1,200 |
12.00 |
49.8 |
14.2% |
|
1,400 |
14.00 |
107.8 |
24.2% |
|
Base Case |
Base Case |
137.1 |
30.0% |
|
1,600 |
16.00 |
164.5 |
34.9% |
|
1,800 |
18.00 |
220.9 |
44.4% |
|
2,000 |
20.00 |
277.3 |
53.9% |
Table 1-13 Sensitivity to CAPEX
|
Movement |
OPEX NPV (US$M) |
OPEX IRR |
Movement |
CAPEX NPV (US$M) |
CAPEX IRR |
|
-20% |
173.2 |
36.2% |
-20% |
150.4 |
38.1% |
|
-10% |
155.2 |
33.1% |
-10% |
143.8 |
33.6% |
|
Base Case |
137.1 |
30.0% |
Base Case |
137.1 |
30.0% |
|
10% |
118.9 |
26.7% |
10% |
130.4 |
26.9% |
|
20% |
100.7 |
23.4% |
20% |
123.7 |
24.3% |
1.21 Conclusions and Recommendations
1.21.1 Overall
The financial analysis of this UPFS demonstrates that the Terronera Project has robust economics to develop the project through feasibility and detailed engineering. Estimated costs for completing work recommended in Table 1-14.
Table 1-14 Budget Estimate for Completing the Recommended Work
|
Program Component |
Cost Estimate ($M) |
|
Exploratory Drilling |
0.25 |
|
Mining - Mineral Resource and Reserve Estimate Updates |
0.5 |
|
Geomechanical Studies |
0.25 |
|
Site Geotechnical Studies |
0.20 |
|
Metallurgical Testing |
0.5 |
|
Hydrogeological Study |
0.15 |
|
TSF - Advance the design to construction level |
0.15 |
|
Environmental baseline studies and Social programs |
1.0 |
|
Optimization Studies |
0.3 |
|
Engineering Studies |
1.5 |
|
Total Cost |
4.80 |
1.21.2 Exploration
1.21.2.1 Drilling
Endeavour Silver should continue with the company's infill and exploratory drill program strategies. Infill drilling should be orientated to investigate the continuity of silver-gold mineralisation both along strike and at depth to improve and further validate the confidence in the geological models being used for the deposits. Infill drilling should be considered to increase the volume and tonnage of the current deposits and advance the deposit knowledge toward higher levels of mineral resource classification.
Exploratory drilling should be used in collaboration with geophysical interpretations to test for mineralisation and potential expansion of both Terronera and La Luz deposits.
1.21.3 Mineral Resource Estimations
Based on the work completed for the Mineral Resource estimate, it is recommended that future Mineral Resource estimations further refine the constraining mineralised domains. Endeavour Silver should consider redefining the cut-off grade due to the low-cost mining method adopted and increase in metal prices.
1.21.4 Mineral Reserve and Mining Methods
The following recommendations are made for future mining studies:
• Explore opportunities to increase project value via reductions in planned mining loss and dilution and various ore control strategies:
o Explore impacts to the mine plan of re-blocking resource model
o Explore converting to a block percentage model and applying a manual dilution skin to mineralisation zones; further definition of mineralisation boundaries would be required to execute this strategy
o Explore the impacts of applying ore sorting technologies between the mine and mill
o Further work on comparing mining methods to evaluate costs versus ounces recovered
• Conduct additional hydrogeological fieldwork, including Packer testing, piezometer installation, and development of a 3D hydrogeological model for each deposit
• Execution of the following geotechnical work programs:
o Targeted geotechnical drilling at Terronera and La Luz deposits to increase data confidence for feasibility level engineering
o Ground-truthing of possible major structures
o Additional geomechanical testing leading to an updated Rock Mass Model
o Update the geotechnical models and perform advanced numerical modelling
o Geotechnical analysis of the foundations identified for Terronera and La Luz should be carried out to ensure suitability of site selections presented in this study
• Drill and blast testing to be carried out by drilling vendors and local explosives suppliers by analysing local rock types and conditions to assess the achievable drill penetration rates, optimal explosives mix and target powder factor for use in this operation
• Blasting for improved mine to mill performance can be optimised in future studies. Increased fragmentation can increase the grind capacity in the mill
• Further engagement with potential mining contractors, obtaining updated quotations for services
• Updates to detailed designs of the mines, infrastructure and external haul roads based on information gathered in the above studies
• Explore opportunities to increase project value via alternative deposit development strategies.
1.21.5 Metallurgical Testwork
A full feasibility study level metallurgical testwork program incorporating testwork on major lithological characterisation samples, variability samples, and production composite samples from both Terronera and La Luz deposits is recommended to provide further definition across the resource. Drill cores are available on site for the testwork and the sample selection program is currently in progress. Key recommendations include:
• Ore competency - Given the limited dataset for ore competency, additional JK Tech SMC tests (Axb) are recommended to be conducted over a range of rock types and spatial zones to define distribution and variability of ore competency; PQ core is recommended
• Ore hardness - RWi, BWi index tests should be conducted to define ore hardness distribution and variability
• Abrasion Index - Tests should be conducted to redefine the abrasion index
• Further testwork to optimize the grinding circuit
• Grade-recovery relationship - Flotation testing of additional samples at various grind sizes should be conducted to determine grade-recovery relationship
• Preconcentration - Evaluate preconcentration opportunities such as ore sorting to reduce operating costs and decrease cut-off grades
• Solid-liquid separation - Finalise the tailings deposition route based on optimised flowsheet conditions.
1.21.6 Recovery Methods
The following activities are recommended to support design of the processing plant beyond the UPFS and into the feasibility study:
• Geotechnical site investigations should be carried out at the preferred process plant site locations to characterise the foundation conditions associated with the proposed buildings
• Material flowability testwork should be completed to further develop the crushing and stockpile circuit design.
1.21.7 Site Infrastructure
The following activities are recommended to support the design of the site infrastructure beyond the UPFS and into the feasibility study:
• Geotechnical site investigations should be carried out at the preferred surface infrastructure site locations to characterise the foundation conditions associated with the proposed buildings
• The access road to site should be further analysed, reviewed and engineered, culminating in a detailed work package to be tendered to local contractors
• Alternate sources of power supply should be considered to decrease the footprint and earthworks required
• Conduct studies to define the source of water and requirements for water treatment.
1.21.8 Water Management
The following activities are recommended to support the design of the water management systems beyond the UPFS and into the feasibility study:
• Progress design of de-centralised water management in each complex consisting of sedimentation ponds, berms, drainage ditches and outlet channels
• Maintain adequate component waterbody setbacks to account for regulatory buffers and water management infrastructure
• Identify opportunities to enhance sedimentation pond volumes at select locations
• Continue geochemical testing and assessment of acid rock drainage/metals leaching (ARD/ML) to further refine parameters of potential concern
• Additional hydrogeological data should be collected to accurately estimate the underground pumping requirements
• Conduct a site-wide water balance and develop water disposal strategy to meet the environmental regulations.
1.21.9 Tailings Management Facility
The following activities are recommended to support the design of the tailings storage facility (TSF) beyond the PFS:
• Optimize TMF area design to minimize waste rock use and maximize its availability for underground mine backfill
• Conduct a materials handling conceptual tradeoff study between conveying and trucking options, and advance to feasibility level design the selected tailings transport option
• Consider additional land acquisition to optimize the TMF geometric design and allow for potential storage expansion.
1.21.10 Environmental, Permitting & Community Relations
A revised EIA application should be submitted to the Mexican environmental permitting authority.
El Compas Mine
The 3,990 hectare El Compas property is located in the southern portion of the state of Zacatecas, Mexico. The El Compas mine comprises a mine site to the south of Zacatecas city and a leased plant located 20km away north of the city. The state of Zacatecas constructed the La Plata processing plant in 2013 to service local small miners in the area. The plant operated for 13 months before closing in October, 2014. The plant is leased to Endeavour Silver on the basis it will accept up to 20% of the feed for the plant on a toll basis from local small miners.
The Zacatecas mining district is located at the transition of the Sierra Madre Occidental and Mesa Central physiographic provinces in north-central Mexico and is marked by the north-west striking Rio Santa Maria fault system. The district covers a belt of Tertiary aged epithermal vein deposits that contain silver, gold and base metals including copper, lead and zinc. The dominant structural features that localize mineralization are of Tertiary age, and are interpreted to be related to the development of a volcanic center with subsequent caldera development and north-westerly trending basin-and-range structures. The veins at El Compas strike predominantly north and north-west and are hosted partly in volcanic and sedimentary rocks of the Chilitos formation and partly in overlying volcanic rocks of the La Virgen formation. The Compas and Orito veins have the characteristics of a low sulfidation epithermal vein system. They occur in a region characterised by numerous, high silver-grade intermediate sulfidation epithermal vein systems.
El Compas achieved commercial production during Q1, 2019 and currently employees close to 200 people and engages over 50 contractors. The current defined resource at the El Compas mine is sufficient to support mining until mid-2021 and brownfields exploration has returned encouraging results on the Calicanto property within the district. There remains significant exploration opportunities and potential to consolidate resources within the Zacatecas district. Management is reviewing alternative mine plans to ensure positive free cash flow in 2021 and strategic alternatives for the asset. As a result of expected mine closure in mid-2021, El Compas is no longer considered by the Company to be a material property.
Parral Properties
In October 2016, the Company acquired a 100% interest in the Parral properties located in the historic silver mining district of Hidalgo de Parral in southern Chihuahua state, Mexico. SGM, the Mexican Geological Survey, estimates historic production of approximately 250 million ounces of silver from this district. The properties cover 3,432 hectares, across three large properties, Veta Colorada, La Pamilla and San Patricio. These properties are accessible by paved highway and a well maintained gravel road only five kilometres north of the city of Hidalgo Del Parral. The area has excellent infrastructure including grid power, water, labour, services and three nearby 500 tonne-per-day plants.
In 2019, the Company completed 25 surface and underground drill holes in the Sierra Plata mine on the Veta Colorada vein system. The Veta Colorada (including the Sierra Plata and El Verde mines) was a past producing mining operation owned by Grupo Mexico that closed in 1991 due to the low silver price. The Veta Colorada is a major silver vein structure that ranges from 1 to 30 metres thick (average 5-10 metres), was mined on 7 levels down to 300 metre depths below surface in places and has been traced for 7 kilometres.
Endeavour has drilled 6 surface and 19 underground drill holes to test an area 600 metres long by 500 metres deep in and around the Sierra Plata mine workings. Every hole intersected strong silver mineralization, mostly adjacent to old workings, indicating that historic mining focused on very high silver grades and left behind significant high grade silver mineralization. Surface drilling highlights include 346 g/t silver over 9.6 metres true width. Underground drilling highlights include 332 g/t silver over 13.1 metres true width and 308 g/t silver over 11.6 metres true width. Several drill holes intersected two mineralized zones, the Veta Colorada and the HW Veta Colorada in the hanging wall, with a total true width of mineralization up to 16.5 metres.
Endeavour sampled 3 blocks on level 7 to test an area 250 metres long by 25 metres vertically within the north part of the Sierra Plata mine. Channel sampling highlights include 2 samples exceeding 1,000 g/t such as 1,705 g/t silver over 0.55 metres true width and 1,480 g/t silver over 0.95 metres true width. The full width of the vein is not exposed in many of the mine workings so the sampling results are only partly indicative of the silver mineralization.
The current resource estimate consists of an Indicated Mineral Resource of 433,000 tonnes grading 271 gpt silver for an estimated 3.8 million silver ounces and an Inferred Mineral Resource of 3,160,000 tonnes grading 324 gpt silver and 0.21 gpt gold for an estimated 33.0 million silver ounces and 21,800 gold ounces.
ITEM 5: DIVIDENDS
5.1 Dividends
The Company has not declared any dividends during the past three fiscal years ended December 31, 2019. The Company otherwise has no present intention of paying dividends on its common shares as it anticipates that all available funds will be invested to finance further acquisition, exploration and development of its mineral properties.
ITEM 6: DESCRIPTION OF CAPITAL STRUCTURE
6.1 General Description of Capital Structure
The Company's authorized share capital is comprised of an unlimited number of common shares without par value. All common shares of the Company rank equally as to voting rights, dividends and participation in the distribution of assets upon dissolution, liquidation or winding-up and in all other respects. Each share carries one vote per share at meetings of the shareholders of the Company.
The following table provides a summary concerning the Company's share capital as of December 31, 2020:
|
|
December 31, 2020 |
|
Authorized share capital |
Unlimited number of common shares without par value |
|
Number of shares issued and outstanding |
157,924,708 common shares without par value |
As at February 25, 2021, the Company has 159,150,601 common shares issued and outstanding.
6.2 Constraints
The Company is not aware of any constraints imposed on the ownership of its securities to ensure that the Company has a required level of Canadian ownership.
6.3 Ratings
The Company is not aware of any ratings, including provisional ratings, from rating organizations for the Company's securities that are outstanding and continue in effect.
ITEM 7: MARKET FOR SECURITIES
7.1 Trading Price and Volume
The Company's common shares are listed for trading on the Toronto Stock Exchange ("TSX") under the symbol "EDR" and on the New York Stock Exchange ("NYSE") under the symbol "EXK".
The following table sets forth the price ranges and volume traded of the common shares of the Company for each month in 2020 on the TSX, the Canadian marketplace on which the greatest volume of trading or quotation for the common shares generally occurs.
|
Month |
High |
Low |
Volume Traded |
|
December 2020 |
6.69 |
4.32 |
10,601,372 |
|
November 2020 |
5.49 |
4.04 |
9,871,444 |
|
October 2020 |
4.91 |
4.00 |
10,056,394 |
|
September 2020 |
5.77 |
4.20 |
17,929,426 |
|
August 2020 |
6.30 |
4.65 |
23,974,366 |
|
July 2020 |
6.40 |
2.99 |
30,000,048 |
|
June 2020 |
3.12 |
2.41 |
11,249,967 |
|
May 2020 |
2.84 |
1.89 |
13,169,955 |
|
April 2020 |
2.51 |
1.68 |
10,855,140 |
|
March 2020 |
2.48 |
1.30 |
12,931,754 |
|
February 2020 |
2.81 |
1.94 |
4,902,116 |
|
January 2020 |
3.20 |
2.63 |
3,943,472 |
The following table sets forth the price ranges and volume traded of the common shares of the Company for each month in 2020 as reported by the NYSE. The data includes common shares sold through the NYSE in connection with the 2020 ATM Offering and common shares sold through certain quotation systems in the United States.
|
Month |
High |
Low |
Volume Traded |
|
December 2020 |
5.24 |
3.40 |
68,563,540 |
|
November 2020 |
4.22 |
3.10 |
47,538,297 |
|
October 2020 |
3.74 |
2.98 |
50,449,983 |
|
September 2020 |
4.40 |
3.13 |
88,663,706 |
|
August 2020 |
4.79 |
3.51 |
115,006,002 |
|
July 2020 |
4.79 |
2.13 |
184,410,217 |
|
June 2020 |
2.30 |
1.76 |
81,115,701 |
|
May 2020 |
2.05 |
1.35 |
71,558,784 |
|
April 2020 |
1.82 |
1.18 |
50,419,889 |
|
March 2020 |
1.85 |
0.99 |
58,871,964 |
|
February 2020 |
2.12 |
1.44 |
47,324,601 |
|
January 2020 |
2.47 |
2.00 |
44,707,122 |
ITEM 8: ESCROWED SECURITIES
8.1 Escrowed Securities
To the Company's knowledge, as at December 31, 2020, there were no escrowed common shares of the Company or common shares of the Company subject to contractual restriction on transfer.
ITEM 9: DIRECTORS AND OFFICERS
9.1 Name, Occupation and Security Holding
The following is a list of the current directors and executive officers of the Company, their province/state and country of residence, their current positions with the Company and their principal occupations during the five preceding years. Each director is elected to serve until the next annual general meeting of shareholders or until his successor is elected or appointed, or unless his office is earlier vacated under any of the relevant provisions of the articles of the Company or the Business Corporations Act (British Columbia).
|
Name and |
Position |
Date of |
Principal Occupation During Five |
|
Bradford J. Cooke |
Director and Chief Executive Officer |
July 25, 2002 |
Chief Executive Officer of Endeavour |
|
Mario D. Szotlender(1)(2)(4) |
Director |
July 25, 2002 |
Independent Consultant and Director of several public mineral exploration and mining companies |
|
Name and |
Position |
Date of |
Principal Occupation During Five |
|
Geoffrey Handley(1)(2) |
Director and Chairman |
June 14, 2006 |
Independent Director of public mineral exploration and mining companies |
|
Rex McLennan(2)(3)(4) |
Director |
June 14, 2007 |
Independent Director of public mineral exploration and mining companies |
|
Ricardo Campoy(1)(3) |
Director |
July 9, 2010 |
Managing Director, Capstone Headwaters MB |
|
Ken Pickering(1)(3)(4) |
Director |
August 20, 2012 |
Independent Director of several public mineral exploration and mining companies |
|
Margaret Beck (2)(3) |
Director |
May 7, 2019 |
Retired since January 2019, Vice President Finance Minerals Australia, BHP Billiton from April 2016 to January 2019, VP Finance Iron Ore, BHP Billiton from October 2013 to March 2016. |
|
Donald Gray |
Chief Operating Officer |
N/A |
Chief Operating Officer of Endeavour since September 2020 and Chief Operating Officer of Continental Gold Inc from June 2015 to March 2020 |
|
Daniel Dickson |
Chief Financial Officer |
N/A |
Chief Financial Officer of Endeavour |
|
Luis Castro |
Vice President, Exploration |
N/A |
Vice President, Exploration of Endeavour |
|
Nicholas Shakesby |
Vice President, Operations, Mexico |
N/A |
Vice President, Operations, Mexico of Endeavour since October 2018; |
|
Dale Mah |
Vice President of Corporate Development |
N/A |
Vice President of Corporate Development of Endeavour since June 2016; Vice President, Geology, Quintana Resources Capital from April 2014 to May 2016 |
|
Christine West |
Vice President, Controller |
N/A |
Controller of Endeavour since January 2008; Appointed Vice President Controller of Endeavour March 2017 |
|
Bernard Poznanski |
Corporate Secretary |
N/A |
Lawyer, Koffman Kalef LLP, Business Lawyers |
(1) Member of Compensation Committee and Member
(2) Member of Corporate Governance and Nominating Committee
(3) Member of Audit Committee
(4) Member of Sustainability Committee
As at February 25, 2021, the directors and executive officers of the Company as a group beneficially owned, or controlled or directed, directly or indirectly, an aggregate of 1,098,371 common shares of the Company, representing approximately 0.7% of the issued and outstanding common shares of the Company.
9.2 Cease Trade Orders, Bankruptcies, Penalties or Sanctions
Other than as disclosed herein, no director or executive officer of the Company is, as at the date of this AIF, or has been, within the ten years preceding the date of this AIF, a director, chief executive officer or chief financial officer of any company (including the Company) that:
(a) was subject to a cease trade or similar order or an order that denied the relevant company access to any exemption under securities legislation, that was in effect for a period of more than 30 consecutive days, when such order was issued while the person was acting in the capacity of a director, chief executive officer or chief financial officer of the relevant company, or
(b) was subject to a cease trade or similar order or an order that denied the relevant company access to any exemption under securities legislation, that was in effect for a period of more than 30 consecutive days, that was issued after such person ceased to be a director, chief executive officer or chief financial officer of the relevant company, and which resulted from an event that occurred while the person was acting in the capacity of a director, chief executive officer or chief financial officer of the relevant company.
Ricardo Campoy is Chairman and a director of General Moly, Inc. (“General Moly”) and held such positions on November 20, 2020 when the Ontario Securities Commission issued a cease trade order (“CTO”) in respect of the securities of General Moly as a result of General Moly’s failure to file by the filing deadline its interim financial statements for the quarter ended September 30, 2020, the related management’s discussion and analysis, and the required related certifications. The CTO is applicable in all jurisdictions in Canada in which General Moly is a reporting issuer with certain exemptions for beneficial holders of General Moly’s securities. The CTO is currently still in effect.
Mario Szotlender is a director of Fortuna Silver Mines Inc. ("Fortuna") and was a director of Fortuna when a management cease trade order was issued by the BCSC on April 3, 2017 against the CEO and CFO of Fortuna in connection with Fortuna's failure to timely file financial statements, related management discussion and analysis and an annual information form for its financial year ended December 31, 2016. Fortuna reported that the delay in the filing of these documents was due to pending resolution of a regulatory review of certain of the Company's filings by the United States Securities and Exchange Commission. On May 25, 2017, the BCSC revoked this management cease trade order after Fortuna filed the required records.
Other than as disclosed herein, no director or executive officer of the Company or any shareholder holding a sufficient number of common shares of the Company to affect materially the control of the Company:
(a) is, as at the date of this AIF, or has been, within the ten years preceding the date of this AIF, a director or executive officer of any company (including the Company) that, while that person was acting in that capacity, or within a year of that person ceasing to act in that capacity, became bankrupt, made a proposal under any legislation relating to bankruptcy or insolvency or was subject to or instituted any proceedings, arrangement or compromise with creditors or had a receiver, receiver manager or trustee appointed to hold its assets,
(b) has, within the ten years preceding the date of this AIF, become bankrupt, made a proposal under any legislation relating to bankruptcy or insolvency, or become subject to or instituted any proceedings, arrangement or compromise with creditors, or had a receiver, receiver manager or trustee appointed to hold the assets of that person,
(c) has been subject to any penalties or sanctions imposed by a court relating to securities legislation or by a securities regulatory authority or has entered into a settlement agreement with a securities regulatory authority, or
(d) has been subject to any other penalties or sanctions imposed by a court or regulatory body that would likely be considered important to a reasonable investor in making an investment decision regarding the Company.
Ricardo Campoy is Chairman and a director of General Moly and held such positions on November 18, 2020 when General Moly filed a voluntary petition under Chapter 11 of the United States Bankruptcy Code in the United States Bankruptcy Court for the District of Colorado (the “Bankruptcy Court”). General Moly has announced that it is operating its business as a “debtor-in-possession” and has filed a Plan of Reorganization and Disclosure Statement with the Bankruptcy Court. General Moly announced on October 1, 2020 that NYSE American had suspended the trading of General Moly’s common stock. The OTC Pink Open Market in the United States also halted trading in General Moly’s common stock on November 17, 2020. The TSX delisted General Moly’s common stock effective at the close of market on December 29, 2020.
Geoffrey Handley was a director of Mirabela Nickel Limited ("Mirabela") until January 11, 2014. On February 25, 2014, within a year of Mr. Handley ceasing to be a director, Mirabela announced that it had entered into a legally binding plan support agreement ("PSA") which established a framework for a proposed recapitalization of Mirabela, subject to certain terms and conditions, as well as the appointment of certain persons of KordaMentha, a restructuring firm, as joint and several voluntary administrators under the Australian Corporations Act 2001. Mirabela also announced that, under the PSA, the proposed recapitalization was to be effected through a recapitalization and restructuring plan to be implemented through a deed of company arrangement in Australia and an extrajudicial reorganization proceeding to be filed by Mirabela Brazil before the competent Brazilian court. Trading in securities of Mirabela on the Australian Securities Exchange was suspended from October 7, 2013 to June 30, 2014.
9.3 Conflicts of Interest
The Company's directors and officers may serve as directors or officers of other companies or have significant shareholdings in other resource companies and, to the extent that such other companies may participate in ventures in which the Company may participate, the directors of the Company may have a conflict of interest in negotiating and concluding terms respecting the extent of such participation. In the event that such a conflict of interest arises at a meeting of the Company's directors, a director who has such a conflict will abstain from voting for or against the approval of such participation or such terms. From time to time several companies may participate in the acquisition, exploration and development of natural resource properties thereby allowing for their participation in larger programs, permitting involvement in a greater number of programs and reducing financial exposure in respect of any one program. It may also occur that a particular company will assign all or a portion of its interest in a particular program to another of these companies due to the financial position of the company making the assignment. In accordance with the laws of British Columbia, the directors of the Company are required to act honestly, in good faith and in the best interests of the Company. In determining whether or not the Company will participate in a particular program and the interest therein to be acquired by it, the directors will primarily consider the degree of risk to which the Company may be exposed and its financial position at the time.
The directors and officers of the Company are aware of the existence of laws governing the accountability of directors and officers for corporate opportunity and requiring disclosure by the directors of conflicts of interest and the Company will rely upon such laws in respect of any directors' and officers' conflicts of interest in or in respect of any breaches of duty by any of its directors and officers. All such conflicts will be disclosed by such directors or officers in accordance with the Business Corporations Act (British Columbia) and they will govern themselves in respect thereof to the best of their ability in accordance with the obligations imposed upon them by law.
To the best of its knowledge, the Company is not aware of any such conflicts of interest.
ITEM 10: PROMOTERS
Since January 1, 2019 no person or company has acted as a promoter of the Company.
ITEM 11: LEGAL PROCEEDINGS
11.1 Legal Proceedings
Other than discussed below, there are no material legal proceedings in the Company's last fiscal year to which the Company is a party or to which any of its property is subject, and there are no such proceedings known to the Company to be contemplated.
Minera Santa Cruz y Garibaldi SA de CV ("MSCG"), a subsidiary of the Company, received a MXN 238 million assessment on October 12, 2010 by Mexican fiscal authorities for failure to provide the appropriate support for certain expense deductions taken in MSCG's 2006 tax return, failure to provide appropriate support for loans made to MSCG from affiliated companies, and deemed an unrecorded distribution of dividends to shareholders, among other individually immaterial items. MSCG immediately initiated a Nullity action and filed an administrative attachment to dispute the assessment.
In June 2015, the Superior Court ruled in favour of MSCG on a number of the matters under appeal; however, the Superior Court ruled against MSCG for failure to provide appropriate support for certain deductions taken in MSCG's 2006 tax return. In June 2016, the Company received a MXN 122.9 million ($6.2 million) tax assessment based on the June 2015 ruling. The 2016 tax assessment is comprised of MXN 41.8 million in taxes owed ($2.1 million), MXN 17.7 million ($0.9 million) in inflationary charges, MXN 40.4 million ($2.0 million) in interest and MXN 23.0 million ($1.2 million) in penalties. The 2016 tax assessment was issued for failure to provide the appropriate support for certain expense deductions taken in MSCG's 2006 tax return and failure to provide appropriate support for loans made to MSCG from affiliated companies and includes interest and penalties. If MSCG agrees to pay the tax assessment, or a lesser settled amount, it is eligible to apply for forgiveness of 100% of the penalties and 50% of the interest.
The Company filed an appeal against the June 2016 tax assessment on the basis that certain items rejected by the courts were included in the new tax assessment and a number of deficiencies exist within the assessment. Since issuance of the assessment interest charges of MXN 9.1 million ($0.5 million) and inflationary charges of MXN 13.7 million ($0.7 million) has accumulated.
Included in the Company's consolidated financial statements, are net assets of $595,000, including $42,000 in cash, held by MSCG. Following the Tax Court's rulings, MSCG is in discussions with the tax authorities with regards to the shortfall of assets within MSCG to settle its estimated tax liability. An alternative settlement option would be to transfer the shares and assets of MSCG to the tax authorities. As of December 30, 2016, the Company recognized an allowance for transferring the shares and assets of MSCG amounting to $595,000. The Company is currently assessing MSCG's settlement options based on ongoing court proceedings and discussion with the tax authorities. The Company continues to assess that it is probable its appeal should prevail, and the maximum estimated exposure is the amount of the above allowance.
Compania Minera Del Cubo SA de CV ("Cubo"), a subsidiary of the Company, received an MXN 58.5 million (US $2.9 million) assessment in 2019 by Mexican fiscal authorities for failure to provide the appropriate support for depreciation deductions taken in the Cubo 2016 tax return and denied deductions of certain suppliers. The tax assessment consists of MXN 24.1 million ($1.2 million) for taxes, MXN 21.0 million ($1.1 million) for penalties, 10.4 million ($0.5 million) for interest and MXN 3.0 million ($0.1 million) for inflation. At the time of the tax assessment the Cubo entity had and continues to have sufficient loss carry forwards which would be applied against the assessed difference of taxable income. The Mexican tax authorities did not consider these losses in the assessment.
Due to the denial of certain suppliers for income tax purposes, in the Cubo assessment the invoices are deemed ineligible for refunds of IVA paid on the invoices. The assessment includes MXN 14.7 million ($0.7 million) for re-payment of IVA (value added taxes) refunded on these supplier payments. In the Company's judgement the suppliers and invoices meet the necessary requirements to be deductible for income tax purposes and the recovery of IVA.
The Company has filed an administrative appeal related to the 2016 Cubo Tax assessment. Cubo has provided a lien on certain El Cubo mining concessions during the appeal process. Since issuance of the assessment interest charges of MXN 9.9 million ($0.5 million) and inflationary charges of MXN 1.6 million ($0.1 million) has accumulated. The Company continues to assess that it is probable its appeal should prevail, and no provision is required in respect of the Cubo assessment.
11.2 Regulatory Actions
During the year ended December 31, 2020, there were no penalties or sanctions imposed against the Company by a court relating to securities legislation or by a securities regulatory authority and there were no settlement agreements that the Company entered into before a court relating to securities legislation or with a securities regulatory authority. Except as described in item 11.1, there are no other penalties or sanctions imposed by a court or regulatory body against the Company that would likely be considered important to a reasonable investor in making an investment decision.
ITEM 12: INTEREST OF MANAGEMENT AND OTHERS IN MATERIAL TRANSACTIONS
12.1 Interest of Management and Others in Material Transactions
None of the following persons or companies has had any material interest, direct or indirect in any transaction since January 1, 2018 that has materially affected or is reasonably expected to materially affect the Company:
(a) a director or executive officer of the Company;
(b) a person or company that beneficially owns, or controls or directs, directly or indirectly more than 10% of any class or series of the outstanding voting securities of the Company; and
(c) an associate or affiliate of any of the persons or companies referred to in the above paragraphs (a) or (b).
The Company's directors and officers may serve as directors or officers of other public resource companies or have significant shareholdings in other public resource companies and, to the extent that such other companies may participate in ventures in which the Company may participate, the directors of the Company may have a conflict of interest in negotiating and concluding terms respecting the extent of such participation. The interests of these companies may differ from time to time. See "Risk Factors - Potential Conflicts of Interest" and "Conflicts of Interest"
ITEM 13: TRANSFER AGENT AND REGISTRAR
13.1 Transfer Agent and Registrar
The transfer agent and registrar for the common shares of the Company is Computershare Investor Services Inc. at its principal offices in Vancouver, British Columbia and Toronto, Ontario.
ITEM 14: MATERIAL CONTRACTS
14.1 Material Contracts
Other than noted below, there are no contracts that are material to the Company that were entered into during the financial year ended December 31, 2020 or prior thereto but which are still in effect, other than contracts entered into in the ordinary course of business of the Company:
(a) Sales Agreement dated October 1, 2020 among the Company, BMO Capital Markets Corp. and others relating to the October 2020 ATM Facility.
(b) Sales Agreement dated May 14, 2020 among the Company, BMO Capital Markets Corp. and others relating to the May 2020 ATM Facility.
ITEM 15: INTERESTS OF EXPERTS
15.1 Names of Experts
The Qualified Persons who completed the reserves and resources estimate for the Guanaceví Project are Zachary J. Black, SME-RM, Jeffery W. Choquette, P.E. and Jennifer J. Brown, SME-RM, of Hard Rock Consulting. They are the authors of the report "National Instrument 43-101 Technical Report: Updated Mineral Resource and Reserve Estimates for the Guanaceví Project, Durango State, Mexico" dated March 3, 2017 and amended March 27, 2018 (effective date of December 31, 2016) filed on SEDAR.
The Qualified Persons who completed the reserves and resources for the Bolañitos Mines Project are Zachary J. Black, SME-RM, Jeffery W. Choquette, P.E. and Jennifer J. Brown, SME-RM, of Hard Rock Consulting. They are the authors of the report "National Instrument 43-101 Technical Report: Updated Mineral Resource and Reserve Estimates for the Bolañitos Project, Guanajuato State, Mexico" dated March 3, 2017 and amended March 27, 2018 (effective date of December 31, 2016) filed on SEDAR.
The Mineral Reserve Estimate for Terronera in the technical report titled "Endeavour Silver Corp, Terronera Project, Jalisco State, Mexico" effective July 31, 2020 were undertaken by Independent Qualified Persons from Ausenco Engineering Canada Inc - Robin Kalanchey, P.Eng., P&E Mining Consulting - Eugene Puritch, P.Eng. FEC. CET, David Burga P.Geo., Yungang Wu, P.Geo., Wood Engineering - Humberto Preciado, P.E., Eugenio Iasillo P.E., JDS Mining - Mike Levy P.E., P.Eng., Moose Mountain - Mike Petrina P.Eng..
Dale Mah, P.Geo., Vice President Corporate Development of Endeavour, is the Qualified Person who reviewed and approved the technical information contained in Updated Company Mineral Reserve and Resource Estimates of the Guanaceví Mine, the Bolañitos Mine, the El Cubo Mine, the El Compas Mine, Parral project and the Guadalupe y Calvo exploration project.
15.2 Interests of Experts
KPMG LLP is the auditor of the Company and has confirmed with respect to the Company that it is independent within the meaning of the relevant rules and related interpretations prescribed by the relevant professional bodies in Canada and any applicable legislation or regulations under all relevant United States professional and regulatory standards.
To the best of the Company's knowledge, other than Mr. Mah, the other experts named in Item 15.1 did not have any registered or beneficial interest, direct or indirect, in any securities or other property of the Company when the experts prepared their respective reports or afterwards, nor will they receive any such interest. Mr. Mah holds, directly or indirectly, options to acquire 89,400 common shares of the Company and 131,000 performance share units (each convertible into common shares of the Company).
ITEM 16: ADDITIONAL INFORMATION
16.1 Additional Information
Additional information relating to the Company may be found on SEDAR at www.sedar.com. Additional information, including directors' and officers' remuneration and indebtedness, principal holders of the Company's securities and securities authorized for issuance under equity compensation plans, if applicable, is contained in the Company's Information Circular for its most recent Annual General Meeting of shareholders held on May 12, 2020. Additional financial information is also provided in the Company's financial statements and management's discussion and analysis for its most recently completed financial year ended December 31, 2020.
16.2 Audit Committee
1. The Audit Committee's Charter
National Instrument 52-110 - Audit Committees ("NI 52-110") requires every issuer to disclose certain information concerning the constitution of its audit committee and its relationship with its independent auditor, as set forth below. A copy of the Company's Audit Committee Charter is set out in Schedule "A" to this AIF.
2. Composition of the Audit Committee
The Company's audit committee is comprised of four directors, as set forth below:
|
Rex McLennan |
Ricardo Campoy |
Ken Pickering |
Margaret Beck |
As defined in NI 52-110, Rex McLennan, Ken Pickering, Ricardo Campoy and Margaret Beck are "independent" directors. The Company therefore meets the requirement in NI 52-110 that all audit committee members be independent directors.
All of the members of the audit committee are financially literate.
3. Relevant Education and Experience
Rex McLennan - Mr. McLennan holds a Master of Business Administration degree (Finance & Accounting) from McGill University and a Bachelor of Science degree (Mathematics & Economics) from the University of British Columbia. Mr. McLennan has an ICD.D designation with the Canadian Institute of Corporate Directors. Mr. McLennan was a past Chief Financial Officer of Viterra Inc., a major global agricultural commodity company, and from 1997 to 2005, he was the Executive Vice President and Chief Financial Officer of Placer Dome Inc., a major global mining company. In his earlier career in the oil and gas industry he held positions of increasing responsibility in business planning, finance and treasury for Imperial Oil, a publicly traded Canadian subsidiary of Exxon Corporation. Note to draft: update for new position.
Ricardo Campoy - Mr. Campoy has a Bachelor of Science in Mine Engineering from the Colorado School of Mines and a Master of International Management (Finance) from the American Graduate School of International Management. Mr. Campoy has over 30 years of experience as a mine engineer, investment banker and financial advisor for the resource industry, financial institutions and investment funds.
Ken Pickering - Mr. Pickering is a professional engineer and mining executive with more than 45 years of experience working in the natural resource sector building and managing major mining operations in Canada, Chile, Australia, Peru and the United States.
Margaret Beck - Ms. Beck has a Bachelor of Science in Business Administration, Accounting from the University of Arizona, Tucson and has over 30 years of experience in the mining industry. Prior to retirement, Ms. Beck ascended the ranks with global conglomerate BHP, at different levels of the organization including executive, regional and operational levels across four countries. Ms. Beck held multiple senior executive positions with BHP including Vice President Finance Minerals Australia, Vice President Finance Iron Ore, Vice President Finance Mineral Exploration and Vice President Finance Base Metals.
4. Reliance on Certain Exemptions
At no time since the commencement of the Company's most recently completed financial year has the Company relied on the following exemptions or provisions under NI 52-110:
(a) the exemption in section 2.4 (De Minimis Non-audit Services),
(b) the exemption in section 3.2 (Initial Public Offerings),
(c) the exemption in subsection 3.3(2) (Controlled Companies)
(d) the exemption in section 3.4 (Events Outside Control of Member),
(e) the exemption in section 3.5 (Death, Disability or Resignation of Audit Committee Member), or
(f) the exemption in section 3.6 (Temporary Exemption for Limited and Exceptional Circumstances)
(g) section 3.8 (Acquisition of Financial Literacy),
(h) an exemption from NI 52-110, in whole or in part, granted under Part 8 (Exemptions).
5. Audit Committee Oversight
At no time since the commencement of the Company's most recently completed financial year has a recommendation of the audit committee to nominate or compensate an external auditor not been adopted by the Board of Directors.
6. Pre-Approval Policies and Procedures
The audit committee has not adopted specific policies and procedures for the engagement of non-audit services. Subject to the requirements of NI 52-110, the engagement of non-audit services is considered by the Company's Board of Directors and, where applicable, by the audit committee, on a case-by-case basis.
7. External Auditor Service Fees (By Category)
Set forth below are details of certain service fees paid to the Company's external auditor in each of the last two fiscal years for audit services:
|
Financial Year End |
Audit Fees(1) |
Audit-related |
Tax Fees(3) |
All Other Fees(4) |
|
December 31, 2020 |
Cdn.$822,922 |
Nil |
Nil |
Nil |
|
December 31, 2019 |
Cdn.$625,590 |
Nil |
Nil |
Nil |
(1) Relates to fees for audit services.
(2) Relates to fees for assurance and related services by the Company's external auditor that are reasonably related to the performance of the audit or review of the Company's financial statements and are not reported under "Audit Fees".
(3) Relates to fees for professional services rendered by the Company's external auditor for tax compliance, tax advice, and tax planning.
(4) Relates to fees for products and services provided by the Company's external auditor other than the services reported under the other categories.
SCHEDULE "A"
AUDIT COMMITTEE CHARTER
(revised November, 2020)
This Audit Committee Charter has been approved by the Board of Directors (the "Board") of Endeavour Silver Corp. (the "Company") as of the date set out above.
Purpose of Audit Committee
The Audit Committee has oversight responsibility for the adequacy and effectiveness of the Company's internal control and management information systems, including:
1. Oversight of senior management and the external auditor relating to:
(a) maintaining necessary books, records and accounts to accurately and fairly reflect the Company's transactions for financial accounting and reporting process to shareholders and regulatory bodies;
(b) maintaining effective internal control over financial reporting, including adequate control environment and processes for assessing the risk of material misstatements in the financial statements and for detecting control weaknesses or fraud;
(c) financial and controls audit process, review and audit finding reports and other matters that may arise.
The Committee shall have the authority to:
(a) engage independent counsel and other advisors as it determines necessary to carry out its duties;
(b) set and pay the compensation for any advisors employed by the Committee;
(c) communicate directly with the internal and external auditors of the Company, or any persons of the Company as needed.
The Audit Committee provides assurance to the board that processes, controls and procedures are operating effectively, thus enabling the company to assume the necessary risks to successfully operate the business and meet objectives.
Meetings
The Committee will meet at least quarterly, with additional meetings as deemed necessary by the Committee. It is the responsibility of the Chair of the Committee to schedule all meetings of the Committee and provide the Committee with a written notice and agenda for all meetings. The Chair of the Committee shall report to the Board after each Committee meeting, including recommendations on any specific decisions or actions the Board should consider.
The Committee may invite external or internal advisor(s), including any member of the management team or other person, to attend part or all of any meetings of the Committee to make presentations, participate in discussions, or provide information and assistance to the Committee as required.
The Committee may call upon and have access to resources for additional information or advice, including engaging external consultants. The Committee shall have unrestricted access to employees and records of the Company to the fullest extent permitted by law and is authorized to take advice from external parties as appropriate at the Company's expense.
Composition
The Committee shall consist of a minimum of three directors of the Company, all of whom are "independent" within the meaning of National Instrument 52-110 - Audit Committees in Canada, subject to any further applicable requirements under United States securities laws and regulations and the policies of the New York Stock Exchange. The Committee shall be appointed annually by the Board immediately following the Annual General Meeting of the Company. Each member of the Committee shall be financially literate, meaning that each member must be able to read and understand financial statements that present a breadth and level of complexity of accounting issues that are generally comparable to the breadth and complexity of the issues that can reasonably be expected to be raised by the Company's financial statements. One member of the Committee must have accounting and financial expertise, meaning that the member possesses financial or accounting credentials or has experience in finance or accounting.
Committee Responsibilities and Duties
The Committee's duty is to monitor and oversee the operations of management and the external auditor. Management is responsible for establishing and following the Company's internal controls and financial reporting processes and for compliance with applicable laws and policies. The external auditor is responsible for performing an independent audit of the Company's financial statements in accordance with generally accepted auditing standards, and for issuing its report on the statements. The Committee should review and evaluate this Charter on an annual basis.
The specific duties of the Committee are as follows:
1. Management Oversight:
(a) Review and evaluate the Company's processes for identifying, analyzing and managing financial risks that may prevent the Company from achieving its objectives;
(b) Review and evaluate the Company's internal controls, as established by management;
(c) Review and evaluate the status and adequacy of internal information systems and security;
(d) Meet with the external auditor at least once a year in the absence of management;
(e) Request the external auditor's assessment of the Company's financial and accounting personnel;
(f) Review and evaluate the adequacy of the Company's procedures and practices relating to currency exchange rates;
2. External Auditor Oversight
(a) Recommend to the Board the selection and, where applicable, the replacement of the external auditor to be appointed or nominated annually for shareholder approval;
(b) Recommend to the Board the compensation to be paid to the external auditor;
(c) Review and evaluate the external auditor's process for identifying and responding to key audit and internal control risks;
(d) Review the scope and approach of the annual audit;
(e) Inform the external auditor of the Committee's expectations;
(f) Meet with management at least once a year in the absence of the external auditor;
3. Review the independence of the external auditor on an annual basis;
(a) Review with the external auditor both the acceptability and the quality of the Company's financial reporting standards;
(b) Resolve any disagreements between management and the external auditor regarding financial reporting;
(c) Review and pre-approve all audit and audit-related services and the fees and other compensation related thereto, and any non-audit services, provided by the Company's external auditor. The authority to pre-approve non-audit services may be delegated by the Committee to one or more independent members of the Committee, provided that such pre-approval must be presented to the Committee's first scheduled meeting following such pre-approval. Pre-approval of non-audit services is satisfied if:
(i) the aggregate amount of all the non-audit services that were not pre-approved is reasonably expected to constitute no more than 5% of the total amount of fees paid by the Company and subsidiaries to the Company's external auditor during the fiscal year in which the services are provided;
(ii) the Company or a subsidiary did not recognize the services as non-audit services at the time of the engagement; and
(iii) the services are promptly brought to the attention of the Committee and approved, prior to completion of the audit, by the Committee or by one or more of its members to whom authority to grant such approvals has been delegated by the Committee; and
(d) Confirm with the external auditor that the external auditor is ultimately accountable to the Board and the Committee, as representatives of the shareholders.
4. Financial Reporting Oversight
(a) Review with management and the external auditor the Company's annual and interim financial statements, management's discussion and analysis, any annual and interim profit or loss press releases and any reports or other financial information to be submitted to any governmental and/or regulatory body, or the public, including any certification, report, opinion, or review rendered by the external auditor, for the purpose of approval or recommending their approval to the Board prior to their filing, issue or publication;
(b) Ensure that adequate procedures are in place for the review of the Company's public disclosure of financial information extracted or derived from the Company's financial statements (other than the public disclosure referred to in (a) above), as well as review any financial information and earnings guidance provided to analysts and rating agencies, and periodically assess the adequacy of those procedures; and
(c) Discuss with the external auditor the quality and the acceptability of the International Financial Reporting Standards applied by management.
5. "Whistleblower" Procedures
(a) Establish procedures for the receipt, retention and treatment of complaints received by the Company regarding accounting, internal accounting controls, or auditing matters; and
(b) Establish procedures for the confidential, anonymous submission by employees of the Company of concerns regarding questionable accounting or auditing matters.

MANAGEMENT'S RESPONSIBILITY FOR FINANCIAL REPORTING
The accompanying consolidated financial statements of Endeavour Silver Corp. ("the Company") have been prepared by management in accordance with International Financial Reporting Standards (IFRS), and within the framework of the significant accounting policies disclosed in the notes to these consolidated financial statements.
Management, under the supervision and participation of the Chief Executive Officer and the Chief Financial Officer, have a process in place to evaluate disclosure controls and procedures and internal control over financial reporting as required by Canadian and United States securities regulations. We, as CEO and CFO, will certify our annual filings with Canadian Securities Administrators and the US Securities and Exchange Commission, as required in Canada by Multilateral Instrument 52-109 and in the United States as required by the Securities Exchange Act of 1934, respectively.
The Board of Directors is responsible for ensuring that management fulfills its responsibilities for financial reporting and is ultimately responsible for reviewing and approving the consolidated financial statements. The Board carries out its responsibility principally through its Audit Committee, which is independent from management.
The Audit Committee of the Board of Directors meets with management to review the consolidated financial statements and related financial reporting matters prior to submitting the consolidated financial statements to the Board of Directors for approval. The Audit Committee reviews the consolidated financial statements and management discussion and analysis; considers the report of the external auditor; assesses the adequacy of internal controls, including management's assessment; examines the fees and expenses for audit services; and recommends to the Board the independent auditors for appointment by the shareholders. The independent auditors have full and free access to the Audit Committee and meet with it to discuss the audit work, financial reporting matters and our internal control over financial reporting. The Audit Committee is appointed by the Board of Directors and all of its members are independent directors.
March 1, 2021
| /s/ Bradford Cooke | /s/ Dan Dickson |
| _____________________________________ | _____________________________________ |
| Chief Executive Officer | Chief Financial Officer |
|
|
||
|
KPMG LLP Chartered Professional Accountants PO Box 10426 777 Dunsmuir Street Vancouver BC V7Y 1K3 Canada |
Telephone (604) 691-3000 Fax (604) 691-3031 Internet www.kpmg.ca |
|

Report of Independent Registered Public Accounting Firm
To the Shareholders and Board of Directors of Endeavour Silver Corp
Opinion on the Consolidated Financial Statements
We have audited the accompanying consolidated statements of financial position of Endeavour Silver Corporation (the Company) as of December 31, 2020 and December 31, 2019, the related consolidated statements of comprehensive earnings (loss), cash flows, and changes in shareholders’ equity for each of the years in the two-year period ended December 31, 2020, and the related notes (collectively, the consolidated financial statements). In our opinion, the consolidated financial statements present fairly, in all material respects, the financial position of the Company as of December 31, 2020 and 2019, and its financial performance and its cash flows for each of the years in the two‑year period ended December 31, 2020, in conformity with International Financial Reporting Standards as issued by the International Accounting Standards Board.
We also have audited, in accordance with the standards of the Public Company Accounting Oversight Board (United States) (PCAOB), the Company’s internal control over financial reporting as of December 31, 2020, based on criteria established in Internal Control – Integrated Framework (2013) issued by the Committee of Sponsoring Organizations of the Treadway Commission”, and our report dated February 25, 2021 expressed an unqualified opinion on the effectiveness of the Company’s internal control over financial reporting.
Basis for Opinion
These consolidated financial statements are the responsibility of the Company’s management. Our responsibility is to express an opinion on these consolidated financial statements based on our audits. We are a public accounting firm registered with the PCAOB and are required to be independent with respect to the Company in accordance with the U.S. federal securities laws and the applicable rules and regulations of the Securities and Exchange Commission and the PCAOB.
We conducted our audits in accordance with the standards of the PCAOB. Those standards require that we plan and perform the audit to obtain reasonable assurance about whether the consolidated financial statements are free of material misstatement, whether due to error or fraud. Our audits included performing procedures to assess the risks of material misstatement of the consolidated financial statements, whether due to error or fraud, and performing procedures that respond to those risks. Such procedures included examining, on a test basis, evidence regarding the amounts and disclosures in the consolidated financial statements. Our audits also included evaluating the accounting principles used and significant estimates made by management, as well as evaluating the overall presentation of the consolidated financial statements. We believe that our audits provide a reasonable basis for our opinion.
© 2021 KPMG LLP, an Ontario limited liability partnership and a member firm of the KPMG global organization of independent member firms affiliated with KPMG International Limited, a private English company limited by guarantee. All rights reserved.

Endeavour Silver Corp
Page 2
Critical Audit Matter
The critical audit matter communicated below is a matter arising from the current period audit of the consolidated financial statements that was communicated or required to be communicated to the Audit Committee and that: (1) relates to accounts or disclosures that are material to the consolidated financial statements and (2) involved our especially challenging, subjective, or complex judgments. The communication of the critical audit matter does not alter in any way our opinion on the consolidated financial statements, taken as a whole, and we are not, by communicating the critical audit matter below, providing a separate opinion on the critical audit matter or on the accounts or disclosures to which it relates.
Recoverability of deferred tax assets
As discussed in notes 3(m) and 23(b) to the consolidated financial statements, the Company recognized deferred tax assets of $12,753 thousand as at December 31, 2020 relating to temporary differences and tax loss carryforwards in Mexico. The recoverability of these deferred tax assets is dependent on the generation of future taxable income. The Company uses forecasts of future taxable income based on forecasted cash flows in order to assess the probability that the deferred tax assets will be realized.
We identified the assessment of the recoverability of deferred tax assets as a critical audit matter. The assessment of the recoverability of deferred tax assets involved subjective and complex auditor judgment because the forecast of future taxable income is complex and judgmental, and is based on significant assumptions, which include future commodity pricing, production data and operating and capital costs and the application of existing tax laws and regulations.
The primary procedures we performed to address this critical audit matter included the following. We evaluated the design and tested the operating effectiveness of certain internal controls over the Company’s assessment of the recoverability of deferred tax assets, including controls over the assumptions and judgments used in the forecast of future taxable income. To assess the Company’s ability to estimate future taxable income, we compared the Company’s previous forecasts to actual results. To assess the Company’s estimate of future taxable income, we evaluated key assumptions used in the forecasts, including by comparing (1) future commodity prices to third party forecasts, and (2) future gold and silver production data and operating and capital costs to historical data, board approved budgets and life of mine plans. We performed a sensitivity analysis over the future commodity prices and production data to assess their impact on the Company’s determination that the deferred tax assets were realizable. We involved income tax professionals with specialized skills and knowledge in assessing the Company’s application of tax laws and regulations in Mexico.
//s// KPMG LLP
Chartered Professional Accountants
We have served as the Company’s auditor since 1994.
Vancouver, Canada
February 25, 2021
|
|
|
|
|
KPMG LLP Chartered Professional Accountants PO Box 10426 777 Dunsmuir Street Vancouver BC V7Y 1K3 Canada
|
Telephone (604) 691-3000 Fax (604) 691-3031 Internet www.kpmg.ca |
|
Report of Independent Registered Public Accounting Firm
To the Shareholders and Board of Directors of Endeavour Silver Corp
Opinion on Internal Control over Financial Reporting
We have audited Endeavour Silver Corp’s (the Company) internal control over financial reporting as of December 31, 2020, based on criteria established in Internal Control – Integrated Framework (2013) issued by the Committee of Sponsoring Organizations of the Treadway Commission. In our opinion, the Company maintained, in all material respects, effective internal control over financial reporting as of December 31, 2020, based on criteria established in Internal Control – Integrated Framework (2013) issued by the Committee of Sponsoring Organizations of the Treadway Commission.
We also have audited, in accordance with the standards of the Public Company Accounting Oversight Board (United States) (PCAOB), the consolidated statements of financial position of the Company as of December 31, 2020 and December 31, 2019, the related consolidated statements of comprehensive earnings (loss), cash flows, and changes in shareholders’ equity for each of the years in the two-year period ended December 31, 2020, and the related notes (collectively, the consolidated financial statements), and our report dated February 25, 2021 expressed an unqualified opinion on those consolidated financial statements.
Basis for Opinion
The Company’s management is responsible for maintaining effective internal control over financial reporting and for its assessment of the effectiveness of internal control over financial reporting, included in “Management’s Discussion and Analysis – Internal Controls over Financial Reporting”. Our responsibility is to express an opinion on the Company’s internal control over financial reporting based on our audit. We are a public accounting firm registered with the PCAOB and are required to be independent with respect to the Company in accordance with the U.S. federal securities laws and the applicable rules and regulations of the Securities and Exchange Commission and the PCAOB.
We conducted our audit in accordance with the standards of the PCAOB. Those standards require that we plan and perform the audit to obtain reasonable assurance about whether effective internal control over financial reporting was maintained in all material respects. Our audit of internal control over financial reporting included obtaining an understanding of internal control over financial reporting, assessing the risk that a material weakness exists, and testing and evaluating the design and operating effectiveness of internal control based on the assessed risk. Our audit also included performing such other procedures as we considered necessary in the circumstances. We believe that our audit provides a reasonable basis for our opinion.
© 2021 KPMG LLP, an Ontario limited liability partnership and a member firm of the KPMG global organization of independent member firms affiliated with KPMG International Limited, a private English company limited by guarantee. All rights reserved.

Endeavour Silver Corp
Page 2
Definition and Limitations of Internal Control over Financial Reporting
A company’s internal control over financial reporting is a process designed to provide reasonable assurance regarding the reliability of financial reporting and the preparation of financial statements for external purposes in accordance with generally accepted accounting principles. A company’s internal control over financial reporting includes those policies and procedures that (1) pertain to the maintenance of records that, in reasonable detail, accurately and fairly reflect the transactions and dispositions of the assets of the company; (2) provide reasonable assurance that transactions are recorded as necessary to permit preparation of financial statements in accordance with generally accepted accounting principles, and that receipts and expenditures of the company are being made only in accordance with authorizations of management and directors of the company; and (3) provide reasonable assurance regarding prevention or timely detection of unauthorized acquisition, use, or disposition of the company’s assets that could have a material effect on the financial statements.
Because of its inherent limitations, internal control over financial reporting may not prevent or detect misstatements. Also, projections of any evaluation of effectiveness to future periods are subject to the risk that controls may become inadequate because of changes in conditions, or that the degree of compliance with the policies or procedures may deteriorate.
//s// KPMG LLP
Chartered Professional Accountants
Vancouver, Canada
February 25, 2021
ENDEAVOUR SILVER CORP.
CONSOLIDATED STATEMENTS OF FINANCIAL POSITION
(expressed in thousands of US dollars)
| December 31, | December 31, | ||||||
| Notes | 2020 | 2019 | |||||
| ASSETS | |||||||
| Current assets | |||||||
| Cash and cash equivalents | $ | 61,083 | $ | 23,368 | |||
| Other investments | 4 | 4,767 | 69 | ||||
| Accounts and other receivable | 5 | 20,144 | 18,572 | ||||
| Income tax receivable | 52 | 4,378 | |||||
| Inventories | 6 | 16,640 | 13,589 | ||||
| Prepaid expenses | 2,284 | 3,302 | |||||
| Total current assets | 104,970 | 63,278 | |||||
| Non-current deposits | 591 | 606 | |||||
| Deferred financing costs | 15(b) | 294 | - | ||||
| Non-current IVA receivable | 5 | 2,676 | 2,048 | ||||
| Deferred income tax asset | 23 | 12,753 | 7,136 | ||||
| Intangible assets | 8 | 492 | 975 | ||||
| Right-of-use leased assets | 9 | 861 | 1,337 | ||||
| Mineral properties, plant and equipment | 10, 11 | 87,955 | 88,333 | ||||
| Total assets | $ | 210,592 | $ | 163,713 | |||
| LIABILITIES AND SHAREHOLDERS' EQUITY | |||||||
| Current liabilities | |||||||
| Accounts payable and accrued liabilities | $ | 27,764 | $ | 19,775 | |||
| Income taxes payable | 3,038 | 1,947 | |||||
| Loans payable | 12 | 3,578 | 2,958 | ||||
| Lease liabilities | 13 | 173 | 164 | ||||
| Total current liabilities | 34,553 | 24,844 | |||||
| Loans payable | 12 | 6,094 | 5,917 | ||||
| Lease liabilities | 13 | 921 | 1,074 | ||||
| Provision for reclamation and rehabilitation | 14 | 8,876 | 8,403 | ||||
| Deferred income tax liability | 23 | 1,077 | 682 | ||||
| Total liabilities | 51,521 | 40,920 | |||||
| Shareholders' equity | |||||||
| Common shares, unlimited shares authorized, no par value, issued and outstanding 157,924,708 shares (Dec 31, 2019 - 141,668,178 shares) |
Page 9 | 517,711 | 482,170 | ||||
| Contributed surplus | Page 9 | 9,662 | 11,482 | ||||
| Retained earnings (deficit) | (368,302 | ) | (370,859 | ) | |||
| Total shareholders' equity | 159,071 | 122,793 | |||||
| Total liabilities and shareholders' equity | $ | 210,592 | $ | 163,713 |
Commitments and contingencies (Notes 10, 12, 13, 14, 23 and 24)
Subsequent events (Notes 10(d),10(e), 10(h) and 15(c))
The accompanying notes are an integral part of these consolidated financial statements.
Approved on behalf of the Board:
| /s/ Rex McLennan | /s/ Bradford Cooke | |
| Director | Director |
ENDEAVOUR SILVER CORP.
CONSOLIDATED STATEMENTS OF COMPREHENSIVE EARNINGS (LOSS)
(expressed in thousands of US dollars, except for shares and per share amounts)
| Years ended | |||||||
| December 31, | December 31, | ||||||
| Notes | 2020 | 2019 | |||||
| Revenue | 16 | $ | 138,461 | $ | 117,421 | ||
| Cost of sales: | |||||||
| Direct production costs | 74,101 | 100,482 | |||||
| Royalties | 10 (a)(b)(d) | 8,154 | 2,034 | ||||
| Share-based payments | 15 (c)(d) | 330 | 195 | ||||
| Depreciation, depletion and amortization | 28,136 | 31,495 | |||||
| Write down of inventory to net realizable value | 6 | 405 | 576 | ||||
| 111,126 | 134,782 | ||||||
| Mine operating earnings (loss) | 27,335 | (17,361 | ) | ||||
| Expenses: | |||||||
| Exploration | 17 | 9,756 | 12,001 | ||||
| General and administrative | 18 | 12,715 | 9,980 | ||||
| Care and maintenance costs | 19 | 5,233 | - | ||||
| Impairment of non-current assets, net | 11 | 424 | - | ||||
| Severance costs | - | 4,589 | |||||
| 28,128 | 26,570 | ||||||
| Operating earnings (loss) | (793 | ) | (43,931 | ) | |||
| Finance costs | 20 | 1,357 | 602 | ||||
| Other income (expense): | |||||||
| Write off of IVA receivable | - | (151 | ) | ||||
| Foreign exchange | (1,553 | ) | 101 | ||||
| Investment and other | 2,649 | 579 | |||||
| 1,096 | 529 | ||||||
| Earnings (loss) before income taxes | (1,054 | ) | (44,004 | ) | |||
| Income tax expense (recovery): | |||||||
| Current income tax expense | 23 | 2,993 | 2,702 | ||||
| Deferred income tax expense (recovery) | 23 | (5,206 | ) | 1,360 | |||
| (2,213 | ) | 4,062 | |||||
| Net earnings (loss) and comprehensive earnings (loss) for the year | $ | 1,159 | $ | (48,066 | ) | ||
| Basic earnings (loss) per share based on net earnings | $ | 0.01 | $ | (0.36 | ) | ||
| Diluted earnings (loss) per share based on net earnings | 15(g) | $ | 0.01 | $ | (0.36 | ) | |
| Basic weighted average number of shares outstanding | 150,901,598 | 135,367,129 | |||||
| Diluted weighted average number of shares outstanding | 15(g) | 154,039,714 | 135,367,129 | ||||
The accompanying notes are an integral part of these consolidated financial statements.
ENDEAVOUR SILVER CORP.
CONSOLIDATED STATEMENTS OF CHANGES IN SHAREHOLDERS' EQUITY
(expressed in thousands of US dollars, except share amounts)
| Note | Number of shares | Share Capital | Contributed Surplus | Retained Earnings (Deficit) | Total Shareholders' Equity | |||||||||||
| Balance at December 31, 2018 | 130,781,052 | $ | 459,109 | $ | 9,676 | $ | (324,005 | ) | $ | 144,780 | ||||||
| Public equity offerings, net of issuance costs | 15 (b) | 10,717,126 | 22,541 | - | - | 22,541 | ||||||||||
| Exercise of options | 15 (c) | 170,000 | 520 | (177 | ) | - | 343 | |||||||||
| Share-based compensation | 15 (c)(d) | - | - | 3,195 | - | 3,195 | ||||||||||
| Expiry and forfeiture of options | 15 (c) | - | - | (1,212 | ) | 1,212 | - | |||||||||
| Earnings (loss) for the year | - | - | - | (48,066 | ) | (48,066 | ) | |||||||||
| Balance at December 31, 2019 | 141,668,178 | $ | 482,170 | $ | 11,482 | $ | (370,859 | ) | $ | 122,793 | ||||||
| Public equity offerings, net of issuance costs | 15 (b) | 13,804,530 | 25,206 | 25,206 | ||||||||||||
| Exercise of options | 15 (c) | 2,452,000 | 10,335 | (3,425 | ) | 6,910 | ||||||||||
| Share-based compensation | 15 (c)(d) | 3,003 | 3,003 | |||||||||||||
| Expiry and forfeiture of options | 15 (c) | (875 | ) | 875 | - | |||||||||||
| Expiry and forfeiture of performance share units | 15 (c) | (523 | ) | 523 | - | |||||||||||
| Earnings (loss) for the year | 1,159 | 1,159 | ||||||||||||||
| Balance at December 31, 2020 | 157,924,708 | $ | 517,711 | $ | 9,662 | $ | (368,302 | ) | $ | 159,071 | ||||||
The accompanying notes are an integral part of these consolidated financial statements.
ENDEAVOUR SILVER CORP.
CONSOLIDATED STATEMENTS OF CASH FLOWS
(expressed in thousands of US dollars)
| Years ended | |||||||
| December 31, | December 31, | ||||||
| Notes | 2020 | 2019 | |||||
| Operating activities | |||||||
| Net earnings (loss) for the year | $ | 1,159 | $ | (48,066 | ) | ||
| Items not affecting cash: | |||||||
| Share-based compensation | 15(c)(d) | 3,003 | 3,195 | ||||
| Depreciation, depletion and amortization | 8,9,10 | 28,863 | 32,050 | ||||
| Impairment of non-current assets, net | 11 | 424 | - | ||||
| Deferred income tax expense (recovery) | 23 | (5,206 | ) | 2,358 | |||
| Unrealized foreign exchange loss (gain) | (1,032 | ) | (100 | ) | |||
| Finance costs | 20 | 1,357 | 602 | ||||
| Write off of IVA receivable | - | 151 | |||||
| Write off of mineral properties | - | 45 | |||||
| Write down of warehouse inventory | - | 233 | |||||
| Write down of inventory to net realizable value | 6 | 405 | 576 | ||||
| Loss on asset disposal | 86 | 43 | |||||
| Loss (gain) on other investments | 4 | (233 | ) | 19 | |||
| Net changes in non-cash working capital | 21 | 10,138 | (684 | ) | |||
| Cash from (used in) operating activities | 38,964 | (9,578 | ) | ||||
| Investing activites | |||||||
| Proceeds on disposal of property, plant and equipment | 190 | 11 | |||||
| Mineral property, plant and equipment expenditures | 10 | (25,539 | ) | (21,519 | ) | ||
| Intangible asset expenditures | - | (280 | ) | ||||
| Purchase of short term investments | (5,497 | ) | - | ||||
| Proceeds from disposal of marketable securities | 1,032 | - | |||||
| Redemption of (investment in) non-current deposits | - | 3 | |||||
| Cash used in investing activities | (29,814 | ) | (21,785 | ) | |||
| Financing activities | |||||||
| Repayment of loans payable | 12 | (3,229 | ) | (1,343 | ) | ||
| Repayment of lease liabities | 13 | (183 | ) | (247 | ) | ||
| Interest paid | 12,13 | (918 | ) | (391 | ) | ||
| Public equity offerings | 15(b) | 26,367 | 23,557 | ||||
| Exercise of options | 15(c) | 6,910 | 343 | ||||
| Share issuance costs | 15(b) | (1,112 | ) | (716 | ) | ||
| Deferred financing costs | (294 | ) | - | ||||
| Cash from (used in) financing activites | 27,541 | 21,203 | |||||
| Effect of exchange rate change on cash and cash equivalents | 1,024 | 152 | |||||
| Increase (decrease) in cash and cash equivalents | 36,691 | (10,160 | ) | ||||
| Cash and cash equivalents, beginning of the year | 23,368 | 33,376 | |||||
| Cash and cash equivalents, end of the year | $ | 61,083 | $ | 23,368 | |||
The accompanying notes are an integral part of these consolidated financial statements.
|
ENDEAVOUR SILVER CORP. |
1. CORPORATE INFORMATION
Endeavour Silver Corp. (the "Company" or "Endeavour Silver") is a corporation governed by the Business Corporations Act (British Columbia). The Company is engaged in silver mining in Mexico and related activities including acquisition, exploration, development, extraction, processing, refining and reclamation. The Company is also engaged in exploration activities in Chile. The address of the registered office is #1130 - 609 Granville Street, Vancouver, B.C., V7Y 1G5.
2. BASIS OF PRESENTATION
These consolidated financial statements have been prepared in accordance with and using accounting policies in full compliance with International Financial Reporting Standards ("IFRS") as issued by the International Accounting Standards Board ("IASB") and Interpretations of the International Financial Reporting Interpretations Committee ("IFRIC"), effective for the Company's year ended December 31, 2020.
The Board of Directors approved the consolidated financial statements for issue on February 25, 2021.
The preparation of consolidated financial statements requires management to make judgments, estimates and assumptions that affect the application of accounting policies and the reported amounts of assets, liabilities, income and expenses. Actual results may differ from these estimates.
On March 31, 2020, the Mexican government declared a national health emergency with extraordinary measures due to the COVID 19 pandemic. Numerous health precautions were decreed, including the suspension of non essential businesses, with only essential services to remain open. As at March 31, 2020 mining did not qualify as an essential service so for the protection of the Company's staff, employees, contractors and communities, the Company suspended its three mining operations in Mexico as of April 1, 2020 as mandated by the Mexican government. The Company retained essential personnel at each mine site during the suspension period to maintain safety protocols, environmental monitoring, security measures and equipment maintenance. Non essential employees were sent home to self-isolate and stay healthy, while continuing to receive their base pay. The suspension of activities ceased in May 2020, when mining was declared an essential business by the Mexican government.
The Company implemented plans to minimize the risks of the COVID-19 virus, both to employees and to the business. At each site, Endeavour is following government health protocols and is closely monitoring the pandemic with local health authorities. The Company has posted health advisories to educate employees about the COVID-19 symptoms, best practices to avoid contracting and spreading the virus, and procedures to follow if symptoms are experienced.
The Company's long term business could be significantly adversely affected by the effects of the COVID 19 pandemic. The Company cannot accurately predict the impact COVID 19 will have on third parties' ability to meet their obligations with the Company, including due to uncertainties relating to the ultimate geographic spread of the virus, the severity of the disease, the duration of the outbreak, and the length of travel and quarantine restrictions imposed by governments of affected countries. In particular, the continued spread of COVID 19 globally could materially and adversely impact the Company's business including without limitation, employee health, limitations on travel, the availability of industry experts and personnel, on-going restrictions to mining and processing operations and drill programs, and other factors that will depend on future developments beyond the Company's control. In addition, the COVID-19 pandemic could adversely affect the economies and financial markets of many countries (including those in which the Company operates), resulting in an economic downturn that could negatively impact the Company's operating results and ability to raise capital. As of December 31, 2020, the Company held $61.1 million in cash and $70.4 million in working capital, the COVID-19 global pandemic is dynamic and given COVID-19 virus cases continue to rise at a significant rate across Mexico and globally, any future restrictions could have a material effect on the Company's financial position. Management believes there is sufficient working capital to meet the Company's current obligations, however the ultimate duration and severity of the COVID-19 pandemic is uncertain and could impact the financial liquidity of the Company. The Company may be required to raise additional funds through future debt or equity financings in order to carry out its business plans.
These consolidated financial statements are presented in the Company's functional currency of US dollars and include the accounts of the Company and its wholly owned subsidiaries: Endeavour Management Corp., Endeavour Gold Corporation S.A. de C.V., EDR Silver de Mexico S.A. de C.V. SOFOM , Minera Santa Cruz Y Garibaldi S.A de C.V., Metalurgica Guanaceví S.A. de C.V., Minera Plata Adelante S.A. de C.V., Refinadora Plata Guanaceví S.A. de C. V., Minas Bolañitos S. A. de C.V., Guanaceví Mining Services S.A. de C.V., Recursos Humanos Guanaceví S.A. de C.V., Recursos Villalpando S.A. de C.V., Servicios Administrativos Varal S.A. de C.V., Minera Plata Carina SPA, MXRT Holding Ltd., Compania Minera del Cubo S.A. de C.V., Minas Lupycal S.A. de C.V., Metales Interamericanos S.A. de C.V., Oro Silver Resources Ltd., Minera Oro Silver de Mexico S.A. de C.V. and Terronera Precious Metals S.A. de C.V. All intercompany transactions and balances have been eliminated upon consolidation of these subsidiaries.
|
ENDEAVOUR SILVER CORP. |
3. SIGNIFICANT ACCOUNTING POLICIES
The accounting policies below have been applied consistently to all years presented and by all subsidiaries in the group and no material accounting standards were adopted during the year. The Company has changed its presentation of concentrate treatment and refining costs of sales to presenting as a reduction in revenue. The prior period amounts have also been reclassified.
(a) Currency Translation
The functional and reporting currency of the Company and its subsidiaries is the US dollar. Transactions in currencies other than an entity's functional currency are recorded at the rates of exchange prevailing on the transaction dates. Monetary assets and liabilities that are denominated in foreign currencies are translated at the rates prevailing at each reporting date. Non-monetary assets and liabilities denominated in foreign currencies that are measured at fair value are retranslated to the functional currency at the exchange rate at the date the fair value was determined. Non-monetary items that are measured in terms of historical costs in a foreign currency are not retranslated. Foreign currency translation differences are recognized in profit or loss.
(b) Use of estimates and judgments
The preparation of consolidated financial statements in conformity with IFRS requires management to make judgments, estimates and assumptions that affect the application of accounting policies, the reported amounts of assets and liabilities and disclosure of contingent assets and liabilities at the date of the financial statements and the reported amounts of revenues and expenses during the reporting period.
These estimates and judgments are based on management's knowledge of the relevant facts and circumstances at the time, having regard to prior experience, and are continually evaluated. Revisions to accounting estimates are recognized in the period in which the estimates are revised and in any future periods affected. Actual results could differ materially from those estimates.
Significant areas requiring the use of management judgment relate to the determination of mineralized reserves and resources, plant and equipment useful lives, estimating the fair values of financial instruments and derivatives, impairment of non-current assets, reclamation and rehabilitation provisions, recognition of deferred tax assets, valuations in business combinations and assumptions used in determining the fair value of share-based compensation.
Significant areas requiring the use of management estimates relate to the valuation of accounts receivable, inventory, mineral property, plant and equipment, impairment of non-current assets, provision for reclamation and rehabilitation, share capital and income taxes.
Critical judgments and estimates in applying policies that have the most significant effect on the amounts recognized in the consolidated financial statements include the following:
Determination of ore reserves and resources
Judgments about the amount of product that can be economically and legally extracted from the Company's properties are made by management using a range of geological, technical and economic factors, history of conversion of mineral deposits to proven and probable reserves as well as data regarding quantities, grades, production techniques, recovery rates, production costs, commodity prices and exchange rates. This process may require complex and difficult geological judgments to interpret the data. The Company uses qualified persons (as defined by the Canadian Securities Administrator's National Instrument 43-101) to compile this data.
Changes in the judgments surrounding reserves and resources may impact the carrying value of mineral properties, plant and equipment (Note 10), reclamation and rehabilitation provisions (Note 14), recognition of deferred income tax amounts (Note 23), and depreciation, depletion and amortization (Note 8,9,10).
Estimating the quantity and /or grade of reserves and resources requires the size, shape and depth of ore bodies or fields to be determined by analyzing geological data such as drilling samples. Following this, the quantity of ore that can be extracted in an economical manner is calculated using data regarding the life of mine plans and forecast sales prices (based on current and long-term historical average price trends). Changes in estimates can be the result of estimated future production differing from previous forecasts of future production, expansion of mineable ore through exploration activities, differences between estimated and actual costs of mining and differences in the commodity price used in the estimation of mineable ore.
|
ENDEAVOUR SILVER CORP. |
Review of asset carrying values and assessment of impairment (accounting policy Note 3h)
Management applies significant judgment in assessing each cash-generating unit and assets for the existence of indicators of impairment or impairment reversal at the reporting date. Internal and external factors are considered in assessing whether indicators are present that would necessitate impairment testing. Significant assumptions regarding commodity prices, operating costs, capital expenditures and discount rates are used in determining whether there are any indicators of impairment. These assumptions are reviewed regularly by senior management and compared, when applicable, to relevant market consensus views.
If an indicator of impairment ore reversal exists, the asset's recoverable amount is estimated. The recoverable amount is the greater of fair value less costs of disposal and value in use. The determination of fair value less costs of disposal and value in use requires management to make estimates and assumptions about expected production and sales volumes, metal prices, ore tonnage and grades, recoveries, operating costs, future capital expenditures and appropriate discount rate for future cash flows. The estimates and assumptions are subject to risk and uncertainty, and as such there is the possibility that changes in circumstances will alter these projections, which may impact the recoverable amount of the assets. In such circumstances, some or all of the carrying value of the assets may be further impaired or the impairment charge reduced with the impact recorded in profit or loss.
Achievement of commercial production (accounting policy Note 3g).
Once a mine reaches the operating levels intended by management, depreciation of capitalized costs begins. Significant judgment is required to determine when certain of the Company's assets reach this level. Management considers several factors including: completion of a reasonable period of commissioning; consistent operating results achieved at a pre-determined level of design capacity and indications exist that this level will continue; mineral recoveries at or near expected levels; and the transfer of operations from development personnel to operational personnel has been completed.
Estimation of the amount and timing of reclamation and rehabilitation costs (accounting policy Note 3j)
Accounting for restoration requires management to make estimates of the future costs the Company will incur to complete the reclamation and rehabilitation work required to comply with existing laws, regulations and agreements in place at each mining operation and any environmental and social principles the Company is in compliance with. The calculation of the present value of these costs also includes assumptions regarding the timing of reclamation and rehabilitation work, applicable risk-free interest rate for discounting those future cash flows, inflation and foreign exchange rates and assumptions relating to probabilities of alternative estimates of future cash flows. Actual costs incurred may differ from those amounts estimated. Also, future changes to environmental laws and regulations could increase the extent of reclamation and rehabilitation work required to be performed by the Company. Increase in future costs could materially impact the amounts charged to operations for reclamation and rehabilitation.
Taxes (Note 23)
Judgment is required in determining the recognition and measurement of deferred income tax assets and liabilities on the balance sheet. In the normal course of business, the Company is subject to assessment by taxation authorities in various jurisdictions. These authorities may have different interpretations of tax legislation or tax agreements than those applied by the Company in computing current and deferred income taxes. These different interpretations may alter the timing or amounts of taxable income or deductions.
Final taxes payable and receivable are dependent on many factors, including outcomes of tax litigation and resolution of disputes. The resolution of these uncertainties may result in adjustments to the Company's tax assets and liabilities.
Management assesses the likelihood and timing of taxable earnings in future periods in recognizing deferred income tax assets. Estimates of future taxable income are based on forecasted cash flows using life of mine projections and the application of existing tax laws in each jurisdiction.
To the extent that future cash flows and taxable income differ significantly from estimates, the ability of the Company to realize the net deferred income tax assets recorded at the balance sheet date could be impacted. In addition, future changes to tax laws could limit the ability of the Company to obtain tax deductions in future periods from deferred income tax assets. Deferred income tax assets are disclosed in Note 23.
Inventory (Note 6)
In valuing inventories at the lower of cost and net realizable value, the Company makes estimates in determining the net realizable price and in quantifying the contained metal in finished goods and work in progress.
|
ENDEAVOUR SILVER CORP. |
(c) Cash and cash equivalents
Cash and cash equivalents consist of deposits in banks and highly liquid investments with an original maturity at the date of the purchase of no more than ninety days, or that are readily convertible into cash.
(d) Marketable securities
Marketable securities include investments in shares of companies and other investments capable of reasonably prompt liquidation. Share investments are measured at fair value through profit and loss and carried at fair value. Unrealized gains and losses are recognized in profit or loss.
(e) Inventories
Work-in-process inventories, including ore stockpiles, are valued at the lower of production cost and net realizable value, after an allowance for further processing costs. Finished goods inventory, characterized as doré bars or concentrate, is valued at the lower of production cost and net realizable value. Materials and supplies are valued at the lower of cost and replacement cost. Similar inventories within the consolidated group are measured using the same method, and the reversal of previous write-downs to net realizable value is required when there is a subsequent increase in the value of inventories.
(f) Intangible assets
Intangible assets are initially recognized at cost if acquired externally, or at fair value if acquired as part of a business combination and have a useful life of greater than one year. Intangible assets which have finite useful lives are measured at cost less accumulated amortization and accumulated impairment. Intangible assets that are assessed as having a finite useful life are amortized over their useful life on a straight-line basis from the date they become available for use and are tested for impairment if indications exist that they may be impaired. The useful life is determined using the period of the underlying contract or the period over which the intangible asset can be expected to be used.
(g) Mineral properties, plant and equipment
Mineral properties, plant and equipment are stated at cost less accumulated depreciation, depletion and accumulated impairment losses. The cost of mineral properties, plant and equipment items consists of the purchase price, any costs directly attributable to bringing the asset to the location and condition necessary for its intended use and an initial estimate of the costs of dismantling and removing the item and restoring the site on which it is located. Mineral properties include direct costs of acquiring properties (including option payments) and costs incurred directly in the development of properties once the technical feasibility and commercial viability has been established.
Development costs relating to specific properties are capitalized once management determines a property will be developed. A development decision is made based upon consideration of project economics, including future metal prices, reserves and resources, and estimated operating and capital costs. Capitalization of costs incurred, and proceeds received from the sale of goods produced during the testing phase ceases when the property is capable of operating at levels intended by management.
Exploration and evaluation costs are those costs required to acquire a mineral property and determine commercial feasibility. These costs include costs to establish an initial mineral resource and determine whether inferred mineral resources can be upgraded to measured and indicated mineral resources and whether measured and indicated mineral resources can be converted to proven and probable reserves. The Company recognizes acquisition costs for exploration and evaluation properties as assets when acquired as part of a business combination or asset purchase. All other exploration and evaluation costs are expensed as incurred until the technical feasibility and commercial viability of the property has been established and a development decision has been made.
Capitalized exploration and evaluation costs for a project are classified as such until the project demonstrates technical feasibility and commercial viability. Upon demonstrating technical feasibility and commercial viability, and subject to an impairment analysis, capitalized exploration and evaluation costs are transferred to mineral property costs within mineral properties, plant and equipment. Technical feasibility and commercial viability generally coincide with the establishment of proven and probable reserves; however, this determination may be impacted by management's assessment of certain modifying factors.
Where an item of plant and equipment comprises major components with different useful lives, the components are accounted for as separate items of plant and equipment and amortized separately over their useful lives.
|
ENDEAVOUR SILVER CORP. |
Plant and equipment are recorded at cost and amortized using either the straight-line method at rates varying from 5% to 30% annually or amortized on a units of production method, based on proven and probable reserves. The accumulated costs of mineral properties that are developed to the stage of commercial production are amortized using the units of production method, based on proven and probable reserves (as defined by National Instrument 43-101).
The Company conducts an annual assessment of the residual balances, useful lives and depreciation methods being used for mineral properties, plant and equipment and any changes arising from the assessment are applied by the Company prospectively.
(h) Impairment of Non-Current Assets
The Company's tangible assets are reviewed for indications of impairment or reversal of a previous impairment at each financial statement date. If an indicator of impairment or reversal exists, the asset's recoverable amount is estimated. An impairment loss is recognized when the carrying amount of an asset, or its cash-generating unit, exceeds its recoverable amount. A cash-generating unit is the smallest identifiable group of assets that generates cash flows that are largely independent of the cash flows from other assets or groups of assets. Impairment losses are recognized in profit and loss for the period.
The recoverable amount is the greater of fair value less costs of disposal and value in use. In assessing value in use, the estimated future cash flows are discounted to their present value using a pre-tax discount rate that reflects current market assessments of the time value of money and the risks specific to the asset. For an asset that does not generate largely independent cash inflows, the recoverable amount is determined for the cash-generating unit to which the asset belongs.
An impairment loss is reversed if there is an indication that there has been a change in the estimates used to determine the recoverable amount. An impairment loss is reversed only to the extent that the asset's carrying amount does not exceed the carrying amount that would have been determined, net of depreciation or amortization, if no impairment loss had been recognized.
Management periodically reviews the carrying values of its exploration and evaluation assets with internal and external mining related professionals. A decision to abandon, reduce or expand a specific project is based upon many factors including general and specific assessments of reserves, forecast future metal prices, forecast future costs of exploring, developing and operating a producing mine, expiration term and ongoing expense of maintaining leased mineral properties and the general likelihood that the Company will continue exploration. The Company does not set a pre-determined holding period for properties with unproven reserves. However, properties which have not demonstrated suitable mineral concentrations at the conclusion of each phase of an exploration program are re-evaluated to determine if future exploration is warranted and their carrying values are recoverable.
If any area of interest is abandoned or it is determined that its carrying value cannot be supported by future production or sale, the related costs are recognized in profit or loss in the period of abandonment or determination that the carrying value exceeds its fair value. The amounts recorded as mineral properties represent costs incurred to date and do not necessarily reflect present or future values.
(i) Leases
Effective January 1, 2019, at inception of a contract, the Company assesses whether a contract is or contains a lease. A contract is or contains a lease if the contract conveys the right to control the use of an identified asset for a period of time in exchange for consideration. The Company recognizes a right-of-use asset and a lease liability at the lease commencement date. The right-of use asset is initially measured at cost, which is composed of:
- The amount of the initial measurement of the lease liability
- Any lease payments made at or before the commencement date
- Any indirect costs incurred
- An estimate of costs to dismantle and remove the underlying asset or to restore the site on which the asset is located
- Less any incentives received from the lessor
The right-of-use asset is depreciated using the straight-line method from the commencement date to the earlier of the end of the useful life of the right-of-use asset or the end of the lease term. Estimated useful lives of right-of-use assets are determined on the same basis as those of property and equipment.
|
ENDEAVOUR SILVER CORP. |
The lease liability is initially measured at the present value of the lease payments that are not paid at the commencement date, discounted using the interest rate implicit in the lease or if that rate cannot be readily determined, the Company's incremental borrowing rate. Lease payments included in the measurement of the lease liability are composed of:
- Fixed payments, including in-substance fixed payments
- Variable lease payments that depend on an index or rate, initially measured using the index or rate as at the commencement date
- Amounts expected to be payable under a residual value guarantee; and
- The exercise price under a purchase option that the Company is reasonably certain to exercise, lease payments in an optional renewal period if the Company is reasonably certain to exercise an extension option, and penalties for early termination of a lease unless the Company is reasonably certain not to terminate early.
The lease payments exclude variable payments which are dependent on external factors other than an index or a rate. These variable payments are recognized directly in profit or loss. The lease liability is remeasured when there is a change in future lease payments arising from a change in an index or rate, if there is a change in the Company's estimated amount expected to be payable under a residual value guarantee, or if the Company changes its assessment of whether it will exercise a purchase, extension or termination option. When the lease liability is remeasured in this way, a corresponding adjustment is made to the carrying amount of the right-of-use asset or is recorded in profit or loss if the carrying amount of the right-of-use asset has been reduced to zero.
The Company has elected not to recognize right-of-use assets and lease liabilities for short-term leases that have a lease term of 12 months or less and leases of low-value assets. The lease payments associated with these leases are expensed on a straight-line basis over the lease term.
(j) Provision for Reclamation and Rehabilitation
The Company recognizes provisions for statutory, contractual, constructive or legal obligations associated with the decommissioning and reclamation of mineral properties, plant and equipment, when those obligations result from the acquisition, construction, development or normal operation of the assets. A liability is recognized at the time environmental disturbance occurs and the resulting costs are capitalized to the corresponding asset. The provision for reclamation and rehabilitation obligations is estimated using expected cash flows based on engineering and environmental reports prepared by third-party industry specialists and is discounted at a pre-tax rate specific to the liability. The capitalized amount is amortized on the same basis as the related asset.
In subsequent periods, the liability is adjusted for any changes in the amount or timing of the estimated future cash costs, changes in the discount or inflation rates and for the accretion of discounted underlying future cash flows. The unwinding of the effect of discounting the provision is recorded as a finance cost in profit or loss for the period.
(k) Revenue recognition
Revenue is generated from the sale of refined silver and gold or from the sale of these metals contained in doré or concentrate. Revenue for doré is recorded in the consolidated statement of comprehensive income gross of treatment and refining costs paid to counterparties under the terms of the sales agreements. Revenue for concentrate is recorded in the consolidated statement of comprehensive income net of treatment and refining costs paid to counterparties under the terms of the sales agreements. Revenue is recognized when control of the metal is transferred to the customer in an amount that reflects the consideration the Company expects to receive in exchange for the metals. In determining whether the Company has satisfied its performance obligation, it considers the indicators of the transfer of control, which include but are not limited to, whether: the Company has a present right to payment; the customer has a legal title to the asset; the Company has transferred physical possession of the asset to the customer; and the customer controls the risks and rewards of ownership of the asset.
Revenue from metals in doré
The refiners who receive doré from the Company refine the materials on the Company's behalf. The refiners transfer the refined product to our customers according to the Company's instructions. Refined metals are sold at spot prices with sales proceeds collected upon or within several days of the completion of the sales transaction. Revenue from sale of doré is recognized at the time a metal sale is executed and the Company has irrevocably directed the refiner to deliver the refined metal to the customer.
|
ENDEAVOUR SILVER CORP. |
Revenue from metals in concentrate
Metals in concentrate are sold under pricing arrangements where final prices are determined by market prices subsequent to the date of sale. Revenue from the sale of concentrates is provisionally priced at the date control transfers. On transfer, the Company recognizes revenue on a provisional basis based on current prices and at each period end, re-estimated prices based on forward market prices for the estimated month of settlement. The final selling price is subject to movements in metal prices up to the final settlement date. Revenue is initially recognized based on the estimated mineral content then adjusted to final settlement adjustments. Final settlement periods range from two to six months after delivery of the product.
Variations between the sales price recorded at the initial recognition date and the actual final sales price at the settlement date, caused by changes in market metal prices, results in an embedded derivative in the related trade accounts receivable. For each reporting period until final settlement, forward market prices are used to record revenue. The embedded derivative is recorded at fair value each period until final settlement occurs, with changes in fair value classified as an adjustment to revenue.
(l) Share-based payments
The Company has a share option plan and performance share unit plan which are described in Note 15(c) and Note 15(d) respectively. Equity-settled share-based payment awards to employees are measured by reference to the fair value of the equity instruments granted and are charged over the vesting period using the graded vesting method. The amount recognized as an expense is adjusted to reflect the actual number of share options for which the related service and vesting conditions are met. Equity-settled share-based payment awards to non-employees are measured at the fair value of the goods or services received as the goods or services are received, unless that fair value cannot be measured reliably, in which case they are measured by reference to the fair value of the equity instrument. The offset is credited to contributed surplus. Consideration received on the exercise of stock options is recorded as share capital and the related contributed surplus is transferred to share capital. For those options that expire or are forfeited after vesting, the amount previously recorded in contributed surplus is transferred to deficit.
Share-based compensation expense relating to cash-settled awards, including deferred share units and share appreciation rights which are described in Note 15(e) and Note 15(f), is recognized over the vesting period of the units based on the fair market value of the units. As these awards will be settled in cash, the expense and liability are adjusted each reporting period for changes in the fair value.
(m) Income taxes
Income tax expense (recovery) comprises current and deferred tax. It is recognized in profit or loss except to the extent that it relates to a business combination, or items recognized directly in equity or other comprehensive income.
Current tax comprises the expected tax payable or receivable on the taxable income or loss for the year and any adjustments to the tax payable or receivable in respect of previous years. The amount of current tax payable or receivable is the is the best estimate of the tax amount expected to be paid or received that reflects uncertainty relate to income taxes, if any. It is measured using tax rates enacted or substantively enacted at the reporting date. Current tax also includes any tax arising from dividends.
The Company follows the asset and liability method of accounting for deferred income taxes. Under this method, deferred tax assets and liabilities are recognized for the future tax consequences attributable to differences between the financial statement carrying amounts of existing assets and liabilities and their respective tax bases, and tax losses carried forward. Deferred tax assets and liabilities are measured using substantively enacted or enacted tax rates expected to apply to taxable income in the years in which those temporary differences are expected to be recovered or settled. The effect on deferred tax assets and liabilities of a change in tax rates is recognized in profit or loss in the period that includes the substantive enactment date. Deferred tax assets are recognized to the extent their recovery is considered probable based on their term to expiry and estimates of future taxable income. Deferred tax assets are reviewed at each reporting date and are reduced to the extent that it is no longer probable that the related tax benefit will be realized; such reductions are reversed when the probability of future taxable profits improve.
|
ENDEAVOUR SILVER CORP. |
(n) Earnings per share
Basic earnings per share is computed by dividing the net earnings (loss) available to common shareholders by the weighted average number of shares outstanding during the period. For all periods presented, net earnings available to common shareholders equals the reported net earnings. The Company uses the treasury stock method for calculating diluted earnings per share. Under the treasury stock method, the weighted average number of common shares outstanding used for the calculation of diluted earnings per share assumes that the proceeds to be received on the exercise of dilutive share options and warrants are used to repurchase common shares at the average market price during the year.
(o) Business combinations
On a business combination, the acquisition method of accounting is used, whereby the purchase consideration is allocated to the identifiable assets, liabilities and contingent liabilities (identifiable net assets) based on fair value at the date of acquisition. When the cost of acquisition exceeds the fair values attributable to the Company's share of identifiable net assets, the difference is treated as purchased goodwill. If the fair value attributable to the Company's share of the identifiable net assets exceeds the cost of acquisition, the difference is immediately recognized in the profit or loss. Incremental costs related to acquisitions are expensed as incurred.
Determination of the fair value of assets acquired and liabilities assumed and resulting goodwill, if any, requires that management make estimates based on the information provided by the acquiree. Changes to the provisional values of assets acquired and liabilities assumed, deferred income taxes and resulting goodwill, if any, will be adjusted when the final measurements are determined (within one year of the acquisition date).
When purchase consideration is contingent on future events, the initial cost of the acquisition recorded includes an estimate of the fair value of the contingent amounts expected to be payable in the future. Changes to the estimated fair value of contingent consideration subsequent to the acquisition date are recorded in profit or loss.
(p) Financial Instruments
The Company recognizes financial assets and financial liabilities on the date the Company becomes party to the contractual provisions of the instruments. On initial recognition, all financial assets and financial liabilities are recorded at fair value, net of attributable transaction costs, except for financial assets and liabilities classified as fair value through profit and loss ("FVTPL"). Transaction costs of financial assets and liabilities classified as FVTPL are expensed in the period in which they are incurred. A financial asset is derecognized either when the Company has transferred substantially all the risks and rewards of ownership of the financial assets or when cash flows expire. A financial liability is derecognized when the obligation specified in the contract is discharged, cancelled or expired.
On initial recognition, the Company classifies and measures financial assets as either fair value through profit and loss ("FVTPL"), fair value through other comprehensive income ("FVTOCI") or amortized cost. Subsequent measurement of financial assets depends on the classifications of such assets. The basis of classification depends on an entity's business model and the contractual cash flows of the financial asset.
Amortized cost
Financial assets that meet the following conditions are measured subsequently at amortized cost:
- The financial asset is held within a business model whose objective is to hold financial assets in order to collect contractual cash flows, and
- The contractual terms of the financial asset provide cash flows on specified dates that are solely payments of principal and interest on the principal amount outstanding
The amortized cost of a financial asset is the amount at which the financial asset is measured at initial recognition minus the principal repayments, plus the cumulative amortization using the effective interest method of any difference between the initial amount and the maturity amount, adjusted for any loss allowance. Interest income is recognized using the effective interest method.
Fair value through other comprehensive income
Financial assets that meet the following conditions are measured subsequently at amortized cost:
- The financial asset is held within a business model whose objective is achieved by both collecting the contractual cash flows and selling financial assets, and
- The contractual terms of the financial asset give rise on specified dates to cash flows that are solely payments of principal and interest on the principal amount outstanding
|
ENDEAVOUR SILVER CORP. |
Investments in equity instruments at FVTOCI are initially recognized at fair value. Subsequently, they are measured at fair value, with gains and losses arising from changes from initial recognition recognized in OCI. Designation at FVTOCI is not permitted if the equity investment is held for trading or if it is contingent consideration recognized by an acquirer in a business combination.
Fair value through profit and loss
By default, all other financial assets are measured at FVTPL.
The Company, at initial recognition, may also irrevocably designate a financial asset as measured at FVTPL if doing so eliminates or significantly reduces a measurement or recognition inconsistency that would otherwise arise from measuring assets or liabilities or recognizing the gains or losses on them on a different basis. Financial assets measured at FVTPL are measured at fair value at the end of each reporting period, with any fair value gains or losses recognized in profit or loss to the extent that they are not part of a designated hedging relationship. Determination of fair value is further described in Note 24.
Financial liabilities and equity
Debt and equity instruments are classified as either financial liabilities or as equity in accordance with the substance of the contractual arrangement and the definitions of a financial liability and an equity instrument. An equity instrument is any contract that evidences a residual interest in the assets of the Company after deducting all its liabilities. Equity instruments issued by the Company are measured at the proceeds received, net of direct issue costs.
Financial liabilities that are not contingent consideration of an acquirer in a business combination, held for trading or designated as FVTPL, are measured at amortized cost using the effective interest method.
The Company's financial instruments are recognized as:
|
|
|
|
|
|
|
Assets |
|
|
Cash and cash equivalents |
Amortized cost |
|
Trade and other receivables (other than derivatives) |
Amortized cost |
|
Trade receivables (derivative component) |
FVTPL |
|
Other investments |
FVTPL |
|
|
|
|
Liabilities |
|
|
Accounts payable and accrued liabilities |
Amortized cost |
|
Loans payable |
Amortized cost |
|
Performance share units and Deferred share units |
FVTPL |
(q) Accounting standards issued not yet adopted during the year
On May 14, 2020, the International Accounting Standard Board (IASB) published a narrow scope amendment to IAS 16 Property, Plant and Equipment - Proceeds before Intended Use. The amendment prohibits deducting from the cost of property, plant and equipment amounts received from selling items produced while preparing the asset for its intended use. Instead, amounts received will be recognized as sales proceeds and the related costs in profit or loss. The effective date is for annual periods beginning on or after January 1, 2022. The Company is assessing the effect of the narrow scope amendment on its consolidated financial statements.
On August 27, 2020, the IASB published "Interest Rate Benchmark Reform - Phase 2" with amendments that address issues that might affect financial reporting after the reform of an interest rate benchmark, including its replacement with alternative benchmark rates. The amendments are effective for annual periods beginning on or after January 1, 2021, with earlier application permitted. The Company does not anticipate that the adoption will have a material impact on its consolidated financial statements as the Company is not engaged in hedging activities and as at December 31, 2021 only had $2.0 million in equipment loans whose terms will require a replacement with an alternative benchmark rate.
|
ENDEAVOUR SILVER CORP. |
4. OTHER INVESTMENTS
| December 31 | December 31 | |||||
| 2020 | 2019 | |||||
| Balance at beginning of the year | $ | 69 | $ | 41 | ||
| Investment in marketable securities, at cost | 5,497 | - | ||||
| Disposals | (862 | ) | - | |||
| Unrealized gain (loss) on marketable securities | 63 | 28 | ||||
| Balance at end of the year | $ | 4,767 | $ | 69 |
The Company holds $4,270 in marketable securities that are classified as Level 1 and $497 in marketable securities that are classified as Level 2 in the fair value hierarchy (Note 24) and are classified as financial assets measured at FVTPL. The fair values of Level 1 marketable securities are determined based on a market approach reflecting the closing price of each particular security at the reporting date. The closing price is a quoted market price obtained from the exchange that is the principal active market for the particular security, being the market with the greatest volume and level of activity for the assets. For Level 2 marketable securities, where there is not yet an active market for the securities as a listing on an exchange is pending, the fair value is determined based on the most recent observable transaction for those securities. Changes in fair value of marketable securities are recognized in profit or loss.
5. ACCOUNTS AND OTHER RECEIVABLES
| December 31 | December 31 | ||||||
| Note | 2020 | 2019 | |||||
| Trade receivables (1) | $ | 8,755 | $ | 6,722 | |||
| IVA receivables (2) | 9,666 | 10,572 | |||||
| Other receivables | 1,721 | 1,277 | |||||
| Due from related parties | 8 | 2 | 1 | ||||
| $ | 20,144 | $ | 18,572 |
(1) The trade receivables consist of receivables from provisional silver and gold sales from the Bolañitos, and El Compas mines. The fair value of receivables arising from concentrate sales contracts that contain provisional pricing mechanisms is determined using the appropriate quoted forward price on the measurement date from the exchange that is the principal active market for the particular metal. As such, these receivables, which meet the definition of an embedded derivative, are classified within Level 2 of the fair value hierarchy (Note 24).
(2) The Company's Mexican subsidiaries pay value added tax, Impuesto al Valor Agregado ("IVA"), on the purchase and sale of goods and services. The net amount paid is recoverable but is subject to review and assessment by the tax authorities. The Company regularly files the required IVA returns and all supporting documentation with the tax authorities, however, the Company has been advised that certain IVA amounts receivable from the tax authorities are being withheld pending completion of the authorities' audit of certain of the Company's third-party suppliers. Under Mexican law the Company has legal rights to those IVA refunds and the results of the third-party audits should have no impact on refunds. A smaller portion of IVA refund requests are from time to time improperly denied based on the alleged lack of compliance of certain formal requirements and information returns by the Company's third-party suppliers. The Company takes necessary legal action on the delayed refunds as well as any improperly denied refunds.
These delays and denials have occurred within Compania Minera del Cubo ("El Cubo") and Refinadora Plata Guanaceví S.A. de C.V. ("Guanaceví,"). At December 31, 2020, El Cubo holds $978 and Guanaceví holds $7,714 in IVA receivables which the Company and its advisors have determined to be recoverable from tax authorities (December 31, 2019 - $3,810 and $6,628 respectively). The Company is in regular contact with the tax authorities in respect of its IVA filings and believes the full amount of its IVA receivables will ultimately be received; however, the timing of recovery of these amounts and the nature and extent of any adjustments to the Company's IVA receivables remains uncertain.
As at December 31, 2020, the total IVA receivable of $12,342 (December 31, 2019 - $12,620) has been allocated between the current portion of $9,666, which is included in accounts receivable, and a non-current portion of $2,676 (December 31, 2019 - $10,572 and $2,048 respectively). The non-current portion is composed of El Cubo and Guanacevi of $347 and $1,475 respectively, which are currently under appeal and are unlikely to be received in 2021. The remaining $854 is IVA receivable for Terronera, which will not become recoverable until Terronera recognizes revenue for tax purposes.
|
ENDEAVOUR SILVER CORP. |
6. INVENTORIES
| December 31 | December 31 | |||||
| 2020 | 2019 | |||||
| Warehouse inventory | $ | 8,717 | $ | 8,342 | ||
| Stockpile inventory(1) | 3,982 | 2,477 | ||||
| Finished Goods inventory(2) | 3,580 | 2,313 | ||||
| Work in process inventory | 361 | 457 | ||||
| $ | 16,640 | $ | 13,589 |
(1) The stockpile inventory balance at December 31, 2020 is net of a write down to net realizable value of $254 for stockpile inventory held at the El Compas mine.
(2) The finished goods inventory balance at December 31, 2020 is net of a write down to net realizable value of $151 for finished goods inventory held at the El Compas mine.
7. RELATED PARTY TRANSACTIONS
The Company shares common administrative services and office space with a company related by virtue of a common director and from time to time will incur third party costs on behalf of related parties on a full cost recovery basis. The charges for these costs totaled $4 for the year ended December 31, 2020 (December 31, 2019 - $8). The Company has a $2 net receivable related to these costs as of December 31, 2020 (December 31, 2019 - $1).
The Company was charged $255 for legal services for the year ended December 31, 2020 by a legal firm in which the Company's corporate secretary is a partner (December 31, 2019 - $215). The Company has $26 payable to the legal firm as at December 31, 2020 (December 31, 2019 - $33).
Key management personnel
The key management of the Company comprises executive and non-executive directors, members of executive management and the Company's corporate secretary. Compensation of key management personnel was as follows:
| December 31 | December 31 | |||||
| 2020 | 2019 | |||||
| Salaries and short-term employee benefits | $ | 2,712 | $ | 2,624 | ||
| Non-executive director's fees | 185 | 82 | ||||
| Non-executive director's deferred share units | 4,251 | 731 | ||||
| Share-based payments | 2,713 | 2,836 | ||||
| $ | 9,861 | $ | 6,273 |
The non-executive directors' deferred share units are cash settled. The recognized expense includes the fair value of new issuances of deferred share units during the period and the change in fair value of all outstanding deferred share units during the reporting period. During the year ended December 31, 2020, the Company granted 376,814 (December 31, 2019 - 237,109) deferred share units with a fair value of $603 (December 31, 2019 - $539) at the date of grant. At December 31, 2020, there were 1,266,199 cash settled deferred share units outstanding with a fair value of $6,389 (December 31, 2019 - 889,385 outstanding with a market value of $2,138).
The amount disclosed for share-based payments is the expense for the year calculated in accordance with IFRS 2, Share-based payments for share options and performance share units (Notes 15(c) and (d)). The fair values of these share-based payments are recognized as an expense over the vesting period of the award. Therefore, the compensation expense in the current year comprises a portion of current year awards and those of preceding years that vested within the current year.
|
ENDEAVOUR SILVER CORP. |
8. INTANGIBLE ASSETS
| December 31, | December 31, | |||||
| 2020 | 2019 | |||||
| Balance, beginning of the year | $ | 975 | $ | - | ||
| Additions | - | 1,518 | ||||
| Amortization | (483 | ) | (543 | ) | ||
| Balance end of the year | $ | 492 | $ | 975 |
Intangible assets represent computer software licenses, which are being amortized over their underlying contractual period of three years. The expense has been included in depreciation, depletion and amortization expense in profit or loss.
9. RIGHT-OF-USE LEASED ASSETS
The Company has entered into operating leases to use certain buildings and equipment for its operations. Upon adoption of IFRS 16, which became effective January 1, 2019 (see Note 3(i)), the Company was required to recognize right-of-use assets representing its right to use these underlying leased assets over the lease term.
A right-of-use asset is initially measured at cost, equivalent to its obligation recognized for payments over the term of the respective leases, and subsequently measured at cost less accumulated depreciation and impairment losses.
The following table presents the right-of-use assets for the Company:
| Note | Office premises |
Plant | Vehicles | Total right-of-use assets |
|||||||||
| Balance at adoption on January 1, 2019 | $ | 1,091 | $ | 656 | $ | 88 | $ | 1,835 | |||||
| Additions | 8 | - | 8 | ||||||||||
| Adjustments | (22 | ) | (22 | ) | |||||||||
| Transfers to mineral property, plant and equipment | (43 | ) | (43 | ) | |||||||||
| Depreciation | (181 | ) | (215 | ) | (45 | ) | $ | (441 | ) | ||||
| Balance December 31, 2019 | $ | 918 | $ | 419 | $ | - | $ | 1,337 | |||||
| Additions | 28 | - | 28 | ||||||||||
| Adjustments | 3 | 3 | |||||||||||
| Depreciation | (197 | ) | (310 | ) | - | $ | (507 | ) | |||||
| Balance December 31, 2020 | $ | 752 | $ | 109 | $ | - | $ | 861 |
|
ENDEAVOUR SILVER CORP. |
10. MINERAL PROPERTIES, PLANT AND EQUIPMENT
(a) Mineral properties, plant and equipment comprise:
| Mineral | Machinery & | Transport & | ||||||||||||||||
| properties | Plant | equipment | Building | office equipment | Total | |||||||||||||
| Cost | ||||||||||||||||||
| Balance at December 31, 2018 | 516,227 | 102,501 | 66,255 | 12,344 | 12,234 | 709,561 | ||||||||||||
| Additions | 18,040 | 1,509 | 10,292 | 612 | 1,101 | 31,554 | ||||||||||||
| Disposals | (45 | ) | - | (71 | ) | - | - | (116 | ) | |||||||||
| Balance at December 31, 2019 | $ | 534,222 | $ | 104,010 | $ | 76,476 | $ | 12,956 | $ | 13,335 | $ | 740,999 | ||||||
| Additions | 18,656 | 2,506 | 7,762 | 358 | 808 | 30,090 | ||||||||||||
| Disposals | - | (71 | ) | (3,235 | ) | - | (1,366 | ) | (4,672 | ) | ||||||||
| Balance at December 31, 2020 | $ | 552,878 | $ | 106,445 | $ | 81,003 | $ | 13,314 | $ | 12,777 | $ | 766,417 | ||||||
| Accumulated amortization and impairment | ||||||||||||||||||
| Balance at December 31, 2018 | 465,901 | 88,498 | 47,813 | 9,674 | 8,898 | 620,784 | ||||||||||||
| Amortization | 23,862 | 3,698 | 2,970 | 186 | 1,184 | 31,900 | ||||||||||||
| Disposals | - | - | (18 | ) | - | - | (18 | ) | ||||||||||
| Balance at December 31, 2019 | $ | 489,763 | $ | 92,196 | $ | 50,765 | $ | 9,860 | $ | 10,082 | $ | 652,666 | ||||||
| Amortization | 18,676 | 4,472 | 4,471 | 306 | 1,286 | 29,211 | ||||||||||||
| Impairments, net | 1,896 | (1,782 | ) | 310 | - | - | 424 | |||||||||||
| Disposals | - | (71 | ) | (2,424 | ) | - | (1,344 | ) | (3,839 | ) | ||||||||
| Balance at December 31, 2020 | $ | 510,335 | $ | 94,815 | $ | 53,122 | $ | 10,166 | $ | 10,024 | $ | 678,462 | ||||||
| Net book value | ||||||||||||||||||
| At December 31, 2019 | $ | 44,459 | $ | 11,814 | $ | 25,711 | $ | 3,096 | $ | 3,253 | $ | 88,333 | ||||||
| At December 31, 2020 | $ | 42,543 | $ | 11,630 | $ | 27,881 | $ | 3,148 | $ | 2,753 | $ | 87,955 | ||||||
Included in Mineral properties is $14,504 in acquisition costs for exploration and evaluation properties (December 31, 2019 - $12,619).
The Company's Mexican operations are subject to an Environmental Royalty Tax of 0.5% of gross sales and in 2020, the Company recognized $692 in royalty expense for the Environmental Royalty (2019 - $631).
As of December 31, 2020, the Company has $955 committed to capital equipment purchases.
(b) Guanaceví, Mexico
In 2005, the Company acquired mining properties and related assets to the Guanaceví silver-gold mines located in the state of Durango, Mexico. Certain concessions in the district retained a 3% net proceeds royalty on future production. In 2020, the Company had no royalty expense on these properties (2019 - $473).
These properties and subsequently acquired property concessions in the Guanaceví district are maintained with nominal property tax payments to the Mexican government.
On July 5, 2019, the Company acquired a 10 year right to explore and exploit the El Porvenir and El Curso properties from Ocampo Mining S.A. de C.V. ("Ocampo"). The Company has agreed to meet certain minimum production targets from the properties, subject to various terms and conditions, and pay Ocampo a $12 dollar fixed per tonne production payment plus a floating net smelter return ("NSR") royalty based on the spot silver price as follows:
• 4% NSR when the silver price obtained is less than or equal to $15 dollars per oz
• 9% NSR when the silver price obtained is greater than $15 dollars and up to $20 dollars per oz
• 13% NSR when the silver price obtained is greater than $20 dollars and up to $25 dollars per oz
• 16% NSR when the silver obtained is greater than $25 dollars per oz
Both properties cover extensions of the Guanaceví ore bodies with the El Porvenir concession adjacent to the Company's operating Porvenir Norte mine and the El Curso concession adjacent to the Company's Porvenir Cuatro mine. In 2020, the Company expensed $6,989 in per tonne production charges and royalties on these properties (2019 - $704).
|
ENDEAVOUR SILVER CORP. |
(c) Bolañitos, Mexico
In 2007, the Company acquired the exploitation contracts, mining properties and related assets to the Bolañitos silver-gold mines located in the northern parts of the Guanajuato and La Luz silver districts in the state of Guanajuato, Mexico.
The Company holds various property concessions in the Guanajuato District that it maintains with nominal property tax payments to the Mexican government.
(d) El Compas, Mexico
In 2016, the Company issued 2,147,239 common shares to Canarc Resource Corp. ("Canarc"), a related party company, and assumed Canarc's obligation to pay an aggregate of 165 troy ounces of gold (paid) to Marlin Gold Mining Ltd to acquire a 100% interest in Canarc's wholly owned subsidiary, Oro Silver Resources Ltd., which owns the El Compas project through its wholly owned Mexican subsidiary, Minera Oro Silver de Mexico SA de CV ("Minera Oro Silver").
The 3,990 hectare El Compas project located in Zacatecas, Mexico includes 28 concessions fully permitted for mining with 22 concessions subject to a 1.5% net smelter return royalty and six concessions subject to a 3.0% net smelter return royalty. In 2020, the Company expensed $473 in royalties on these properties (2019 - $226).
Minera Oro Silver also holds a five-year lease, renewable in 2021 for an additional five years, on a 500 tonne per day ore processing plant located in Zacatecas, Mexico for a total annual lease cost of 1,632,000 Mexican Pesos (approximately $90), adjusted annually for inflation. At acquisition, the plant was not operational and required significant capital investment to restore to an operational state. During 2018, the Company refurbished and commenced commissioning of the processing plant with commercial production achieved in Q1, 2019. Subsequent to December 31, 2020, the Company renewed the plant lease.
Acquisition of Veta Grande Properties
On April 24, 2017, the Company entered into a definitive agreement with Impact Silver Corp. ("Impact Silver") to acquire a 100% interest in Impact Silver's Veta Grande properties, located in the Zacatecas state, Mexico ("the agreement"). On June 5, 2017, Endeavour paid $500 through the issuance of 154,321 common shares.
Acquisition of Calicanto Properties
On July 21, 2016, the Company entered into a definitive agreement with Compania Minera Estrella de Plata SA de CV. ("Compania Minera Estrella") to acquire a 100% interest, subject to a 3% NSR, in Compania Minera Estrella's Calicanto properties, located in the Zacatecas state, Mexico. On February 1, 2017, Endeavour completed the purchase with a payment of $400 and in 2018 exercised an option to purchase the 3% NSR for $45.
On September 8, 2017, the Company entered into a concession division agreement with Capstone Mining Corp. ("Capstone") whereby the Company has the right to explore and mine for precious metals above 2,000 metres above sea level on Capstone’s Toro del Cobre concessions, which is adjacent to Calicanto. In return, the Company has granted Capstone the right to explore and mine for base metals below the elevation of 2,000 metres above sea level. Capstone has granted the Company a 1% NSR on all Capstone base metal production from on Endeavour property and Endeavour has granted Capstone a 1% NSR on all Endeavour precious metal production on Capstone property.
(e) El Cubo, Mexico
In 2012, the Company acquired the exploitation contracts, mining properties and related assets to the El Cubo silver-gold mine located in the northern parts of the Guanajuato and La Luz silver districts in the state of Guanajuato, Mexico. The Company suspended mining operations at El Cubo on November 30, 2019 and the mine remains on care and maintenance.
On December 15, 2020, the Company signed a binding letter agreement to sell its El Cubo mine and related assets to VanGold Mining Corp. ("VanGold") for $15.0 million in cash and share payments plus additional contingency payments.
VanGold will pay $15.0 million for the El Cubo assets as follows:
- $0.5 million cash down-payment (received)
- $7.0 million cash on closing on or before March 17, 2021
- $5.0 million in VanGold common shares on closing - priced at CDN$0.30 per share for a total of 21,331,058 shares of VanGold
- $2.5 million in an unsecured promissory note due and payable within 12 months from closing
|
ENDEAVOUR SILVER CORP. |
VanGold has also agreed to pay the Company up to an additional $3.0 million in contingent payments based on the following events:
- $1.0 million upon VanGold producing 3.0 million silver equivalent ounces from the El Cubo mill
- $1.0 million if the price of gold closes at or above US$2,000 dollars per ounce for 20 consecutive days within two years after closing
- $1.0 million if the price of gold closes at or above US$2,200 dollars per ounce for 20 consecutive days within two years after closing
Closing of the sale is subject to satisfaction of certain conditions including final due diligence by VanGold, financing and receipt of all requisite third party and regulatory approvals, including the acceptance of the TSXV on or before March 17, 2021, failing which either VanGold or the Company may terminate the agreement. If the tax lien on the assets (note 23(a)) is not removed on or before closing, VanGold shall be intitled to withhold from the purchase price an amount sufficient to remove the tax lien.
(f) Terronera, Mexico
In February 2013, the Company acquired a 100% interest in the Terronera project, located in Jalisco, Mexico. The Company is required to pay a 2% NSR royalty on any production from the Terronera properties.
On September 23, 2020, the Company entered into an option agreement to acquire a 100% interest in the La Sanguijuela property, located adjacent to the existing Terronera properties. The agreement requires payments totaling $550 over a four-year period with the Company required to pay a 2% NSR on any production from the property.
These properties and subsequently acquired property concessions in the Terronera district are maintained with nominal property tax payments to the Mexican government.
(g) Acquisition of Parral Properties
On September 13, 2016, the Company entered into a definitive agreement with Silver Standard Resources Inc. ("Silver Standard") to acquire a 100% interest in Silver Standard's Parral properties, located in the historic silver mining district of Hidalgo de Parral in southern Chihuahua state, Mexico. On October 31, 2016, Endeavour paid $5,300 through the issuance of 1,198,083 common shares.
In addition, the Company committed to spending $2,000 (completed in 2018) in exploration on two of the properties (the San Patricio and La Palmilla properties) over the two-year period following the closing of the transaction. Silver Standard will also retain a 1% net smelter returns royalty on production from the San Patricio and La Palmilla properties.
(h) Guadalupe Y Calvo, Mexico
In 2012, the Company acquired the Guadalupe Y Calvo exploration project in Chihuahua, Mexico.
In 2014, the Company acquired the La Bufa exploration property, which is adjacent to the Guadalupe y Calvo exploration property in Chihuahua, Mexico. The property is subject to a 2% net smelter return royalty on mineral production.
Subsequent to December 31, 2020, the Company granted an option to purchase the Guadalupe Y Calvo project to Ridgestone Mining Inc. ("Ridgestone") whereby Ridgestone has the right to acquire a 100% interest in the project through payments totaling $1.5 million over a 4 year period, issuing $1.75 million in shares, plus a requirement to spend $0.75 million in exploration expenditures. The Company will retain a 2% NSR with a provision for Ridgestone to buy back the 2% NSR for $2.0 million prior to the commencement of commercial production.
These properties and subsequently acquired property concessions acquired by the Company in the district are maintained with nominal property tax payments to the Mexican government.
|
ENDEAVOUR SILVER CORP. |
(i) Exploration projects, Chile
Cerro Marquez - Las Palcas
In October 2016, the Company entered into an option agreement with Minera Cerro Marquez to acquire 100% interest in the Las Palcas project in Santiago, Chile for a total of $2.5 million to be paid over a four year period with the final payment of $2.3 million due in October 2020. The interest is subject to a net smelter return ("NSR") royalty of 2% with the Company entitled purchase the royalty for $1.2 million for each 1% of the NSR. In October 2020, the Company signed an addendum agreement and paid $0.2 to defer the final payment to October 2021. The addendum also extended by one year the Company's commitment to spend $1.5 million on exploration expenses in the property within forty-eight months from the date of the option agreement.
Aida Properties
In July 2018, the Company entered into an option agreement to acquire 100% interest in the Aida properties: Patricia II, Patricia III and SLM Ignacia located in Chile for a total of $3.2 million to be paid over a five year period. The properties are subject to a 2% NSR with the right to buy the NSR for each of the properties for $2.0 million. Payments totaling $0.4 million for 2018 and 2019 have been made but the 2020 payment has been postponed until the Company receives certain permits.
Paloma Properties
In December 2018, the Company signed an option agreement to acquire up to a 70% interest in the Paloma project in Antofagasta province, Chile. The Company can acquire its initial 51% interest by paying $0.75 million and spending $5.0 million over five years with the final payment due in 2023, followed by a second option to acquire 70% by completing a Preliminary Economic Assessment and a Preliminary Feasibility Study. The property is subject to a 2% NSR.
(j) Mineral property contingencies
The Company has entered into other non-material option agreements on exploration properties in Mexico and Chile.
Management believes the Company has diligently investigated rights of ownership of all its mineral properties to a level which is acceptable by prevailing industry standards with respect to the current stage of development of each property in which it has an interest and, to the best of its knowledge, all agreements relating to such ownership rights are in good standing. However, all properties may be subject to prior claims, agreements or transfers, and rights of ownership may be affected by undetected defects.
11. IMPAIRMENT OF NON-CURRENT ASSETS
The recoverable amounts of the Company's CGUs, which include mining properties, plant and equipment are determined at the end of each reporting period, if impairment indicators are identified. In previous years, commodity price declines, changes in tax legislation and a reduction in reserves and resources led the Company to determine there were impairment indicators and assessed the recoverable amounts of its CGUs. The recoverable amounts were based on each CGUs future cash flows expected to be derived from the Company's mining properties and represent each CGUs value in use. The cash flows were determined based on the life-of-mine after-tax cash flow forecast which incorporates management's best estimates of future metal prices, production based on current estimates of recoverable reserves and resources, exploration potential, future operating costs and non-expansionary capital expenditures discounted at risk adjusted rates based on the CGUs weighted average cost of capital.
At December 31, 2020, the Company recognized a $2,576 reversal of a previous impairment of the Guanaceví Mine. An increase in the reserve and resource estimate and increase in precious metal prices were considered to be indicators of an impairment reversal. The updated Guanaceví mine plan, with updated assumptions and estimates, calculated on a discounted cash flow basis using a 6.1% discount rate, resulted in significantly higher cash flows compared to the Company's previous estimates. Accordingly, the Company reversed the 2013 Guanaceví CGU impairment, limited to the carrying amount had no impairment been recognized in prior periods, net of depletion and amortization which would have been recognized in prior periods.
At December 31, 2020, the Company recognizes an impairment of the El Compas Mine Project. A decrease in the resource estimate as at December 31, 2020 was considered to be an indicator of an impairment. The carrying value related to the El Compas CGU, excluding working capital and reclamation provision, was $5,972 which was greater than its estimated recoverable amount of $2,972, calculated on a discounted cash flow basis using a 6.1% discount rate. The Company considers use of its internal discounted cash flow economic models as a proxy for the calculation of fair value in use. Based on the above assessment, the Company recorded an impairment charge related to the El Compas CGU of $3,000.
|
ENDEAVOUR SILVER CORP. |
The recoverable amounts of the Guanaceví and El Compas mines were determined based on their value in use, estimated utilizing a discounted cash flow model using a 6.1% discount rate. Assumptions used to determine the recoverable amounts of the CGUs include metal prices, changes in the amount of recoverable reserves and resources, production costs, future capital expenditures and discount rates. The discounted cash flow models are a Level 3 measurement in the fair value hierarchy.
For a discounted cash flow model, any modest decrease in any one key assumption in isolation could cause the estimated recoverable amount to be less than or equal to the net carrying value.
12. LOANS PAYABLE
| December 31, | December 31, | |||||
| 2020 | 2019 | |||||
| Balance at the beginning of the year | $ | 8,875 | $ | - | ||
| Net proceeds from software and equipment financing | 4,010 | 10,218 | ||||
| Finance cost | 834 | 301 | ||||
| Repayments of principal | (3,229 | ) | (1,343 | ) | ||
| Repayments of finance costs | (834 | ) | (301 | ) | ||
| Effects of movements in exchange rates | 16 | - | ||||
| Balance at the end of the year | $ | 9,672 | $ | 8,875 | ||
| Statements of Financial Position Presentation | ||||||
| Current loans payable | $ | 3,578 | $ | 2,958 | ||
| Non-Current loans payable | 6,094 | 5,917 | ||||
| Total | $ | 9,672 | $ | 8,875 |
The Company has entered into financing arrangements for software licenses totaling $1,086 and equipment totaling $13,142, with terms ranging from 1 year to 4 years. The agreements require either monthly or quarterly payments of principal and interest with a weighted-average interest rate of 7.8%.
The equipment financing is secured by the underlying equipment purchased and is subject to various covenants and as at December 31, 2020 the Company was in compliance with these covenants. As at December 31, 2020, the net book value of equipment includes $12.3 million (December 31, 2019 - $9.2 million) of equipment pledged as security for the equipment financing.
13. LEASE LIABILITIES
The Company leases office space and the El Compas plant. These leases are for periods of five to ten years. Certain leases include an option to renew the lease after the end of the contract term and/ or provide for payments that are indexed to local inflation rates.
The following table presents the lease obligations of the Company:
| December 31, | December 31, | |||||
| 2020 | 2019 | |||||
| Balance at the beginning of the year | $ | 1,238 | $ | 1,422 | ||
| Additions | 31 | 8 | ||||
| Interest | 84 | 93 | ||||
| Payments | (267 | ) | (339 | ) | ||
| Effects of movement in exchange rates | 8 | 54 | ||||
| Balance at the end of the year | 1,094 | 1,238 | ||||
| Less: Current portion | (173 | ) | (164 | ) | ||
| Non-Current Lease Liabilities | $ | 921 | $ | 1,074 |
|
ENDEAVOUR SILVER CORP. |
The following table presents lease liability maturity - contractual undiscounted cash flows for the Company:
| December 31, | December 31 | |||||
| 2020 | 2019 | |||||
| Less than one year | $ | 238 | $ | 240 | ||
| One to five years | 653 | 724 | ||||
| More than five years | 425 | 586 | ||||
| Total at the end of the year | $ | 1,316 | $ | 1,550 |
The following amounts have been recognized in Profit or Loss:
| Year ended | Year ended | |||||
| December 31, 2020 | December 31, 2019 | |||||
| Interest on lease liabilities | $ | (84 | ) | $ | (93 | ) |
| Expenses related to short-term leases | $ | (388 | ) | $ | (668 | ) |
As at December 31, 2020, the lease liabilities have a weighted-average interest rate of 7.3%. For the year ended December 31, 2020, the Company recognized $84 in interest expense on the lease liabilities (December 31, 2019 - $93) and $388 related to short term rentals, primarily for rented mining equipment and employee housing (December 31, 2019 - $668).
14. PROVISION FOR RECLAMATION AND REHABILITATION
The Company's environmental permit requires that it reclaim certain land it disturbs during mining operations. Significant reclamation and closure activities include land rehabilitation, decommissioning of buildings and mine facilities, ongoing care and maintenance and other costs. Although the ultimate amount of the reclamation and rehabilitation costs to be incurred cannot be predicted with certainty, the total undiscounted amount of probability weighted estimated cash flows required to settle the Company's estimated obligations is $2,555 for the Guanaceví mine, $2,174 for the Bolañitos mine, $5,132 for the El Cubo mine and $167 for the El Compas development project.
The timing of cash flows has been estimated based on the mine lives using current reserves and the present value of the probability weighted future cash flows. The model assumes a risk-free rate specific to the liability of 2.25% for Guanaceví and Bolañitos, and 6.2% for El Cubo and El Compas and with an estimated inflation rate of 2.0% for Guanaceví and Bolañitos and 4.0% for El Cubo and El Compas.
Changes to the reclamation and rehabilitation provision balance during the year are as follows:
| Guanaceví | Bolañitos | El Cubo | El Compas | Total | |||||||||||
| Balance at December 31, 2018 | $ | 2,129 | $ | 1,804 | $ | 4,148 | $ | 114 | $ | 8,195 | |||||
| Accretion | 53 | 44 | 101 | 10 | 208 | ||||||||||
| Disturbance incurred during the year | - | - | - | - | - | ||||||||||
| Balance at December 31, 2019 | $ | 2,182 | $ | 1,848 | $ | 4,249 | $ | 124 | $ | 8,403 | |||||
| Accretion | 39 | 30 | 296 | 9 | 374 | ||||||||||
| Disturbance incurred during the year | - | 99 | - | - | 99 | ||||||||||
| Balance at December 31, 2020 | $ | 2,221 | $ | 1,977 | $ | 4,545 | $ | 133 | $ | 8,876 |
|
ENDEAVOUR SILVER CORP. |
15. SHARE CAPITAL
(a) Management of Capital
The Company considers the items included in the consolidated statement of changes in equity as capital. The Company's objective when managing capital is to safeguard its ability to continue as a going concern, so that it can continue to provide returns for shareholders and benefits for other stakeholders. The Company manages the capital structure and makes adjustments to it in light of changes in economic conditions and the risk characteristics of the underlying assets. In order to maintain or adjust the capital structure, the Company may issue new shares through private placements, convertible debentures, asset acquisitions or return capital to shareholders. As at December 31, 2020, the Company is not subject to externally imposed capital requirements.
(b) Public Offerings
In April 2018, the Company filed a short form base shelf prospectus that qualified for the distribution of up to CAN$150 million of common shares, debt securities, warrants or units of the Company comprising any combination of common shares and warrants (the "Securities") over a 25 month period. The Company filed a corresponding registration statement in the United States registering the Securities under United States federal securities laws. The distribution of Securities could be effected from time to time in one or more transactions at a fixed price or prices, which could be changed, at market prices prevailing at the time of sale, or at prices related to such prevailing market prices to be negotiated with purchasers and as set forth in an accompanying prospectus supplement, including transactions that are "At-The-Market" ("ATM") distributions.
On June 13, 2018, the Company entered into an ATM equity facility with BMO Capital Markets (the lead agent), CIBC Capital Markets, H.C. Wainwright & Co., HSBC and TD Securities (together, the "Agents"). Under the terms of this ATM facility, the Company could, from time to time, sell common stock having an aggregate offering value of up to $35.7 million on the New York Stock Exchange. The Company determined, at its sole discretion, the timing and number of shares to be sold under the ATM facility.
During the year ended December 31, 2019, the Company issued 10,717,126 common shares under this ATM facility at an average price of $2.20 per share for gross proceeds of $23,557, less commission of $530. From January 1, 2020 to April 21, 2020, the Company issued the final 2,164,119 common shares under this ATM facility at an average price of $1.56 per share for gross proceeds of $3,367, less commission of $76. From January 1, 2020 to April 21, 2020, the Company also recognized $147 of additional transaction costs related to this ATM financing as share issuance costs, which have been presented net of share capital (year ended December 31, 2019 - $484).
In April 2020 the Company filed a short form base shelf prospectus that qualifies for the distribution of up to CAN$150 million of common shares, debt securities, warrants or units of the Company comprising any combination of common shares and warrants (the "Securities") over a 25 month period. The Company filed a corresponding registration statement in the United States registering the Securities under United States federal securities laws. The distribution of Securities may be effected from time to time in one or more transactions at a fixed price or prices, which may be changed, at market prices prevailing at the time of sale, or at prices related to such prevailing market prices to be negotiated with purchasers and as set forth in an accompanying prospectus supplement, including transactions that are ATM distributions.
On May 14, 2020, the Company entered into an ATM equity facility with BMO Capital Markets (the lead agent), CIBC Capital Markets, H.C. Wainwright & Co., TD Securities, Roth Capital Partners, B. Riley FBR, Inc. and A.G.P./Alliance Global Partners (together, the "Agents"). Under the terms of this ATM facility, the Company could, from time to time, sell common stock having an aggregate offering value of up to $23 million on the New York Stock Exchange. The Company determined, at its sole discretion, the timing and number of shares to be sold under the ATM facility.
From May 14, 2020 to September 30, 2020, the Company issued 11,640,411 common shares under this ATM facility at an average price of $1.98 per share for gross proceeds of $23,000, less commission of $564 and recognized $374 of transaction costs related to this ATM financing as share issuance costs, which have been presented net of share capital.
In total, during the year ended December 31, 2020, the Company issued 13,804,530 common shares under the combined ATM facilities at an average price of $1.91 per share for gross proceeds of $26,367, less commission of $640 and recognized $521 of transaction costs related to the ATM financings as share issuance costs, which have been presented net of share capital.
|
ENDEAVOUR SILVER CORP. |
On October 1, 2020, the Company entered into an ATM equity facility with BMO Capital Markets (the lead agent), CIBC Capital Markets, H.C. Wainwright & Co. LLC, TD Securities Inc., Roth Capital Partners, LLC, B. Riley Securities Inc. and A.G.P./Alliance Global Partners (together, the “Agents”). Under the terms of this ATM facility, the Company can, from time to time, sell common stock having an aggregate offering value of up to $60 million on the New York Stock Exchange. The Company will determine, at its sole discretion, the timing and number of shares to be sold under the ATM facility and as at December 31, 2020 no common shares have been issued under this Facility. There is $0.3 million in deferred financing costs related to this facility.
(c) Purchase Options
Options to purchase common shares have been granted to directors, officers, employees and consultants pursuant to the Company's current stock option plan, approved by the Company's shareholders in fiscal 2009 and re-ratified in 2018, at exercise prices determined by reference to the market value on the date of grant. The stock option plan allows for, with approval by the Board, granting of options to its directors, officers, employees and consultants to acquire up to 7.0% of the issued and outstanding shares at any time.
The following table summarizes the status of the Company's stock option plan and changes during the 2020 and 2019 years:
| Expressed in Canadian dollars | Year Ended | Year Ended | ||||||||||
| December 31, 2020 | December 31, 2019 | |||||||||||
| Number of shares |
Weighted average exercise price |
Number of shares | Weighted average exercise price | |||||||||
| Outstanding, beginning of the year | 6,923,000 | $ | 3.74 | 5,987,800 | $ | 3.96 | ||||||
| Granted | 2,490,000 | $ | 2.22 | 1,759,000 | $ | 3.22 | ||||||
| Exercised | (2,452,000 | ) | $ | 3.71 | (170,000 | ) | $ | 2.65 | ||||
| Expired and forfeited | (982,700 | ) | $ | 2.73 | (653,800 | ) | $ | 4.58 | ||||
| Outstanding, end of the year | 5,978,300 | $ | 3.29 | 6,923,000 | $ | 3.74 | ||||||
| Options exercisable at the end of the year | 4,174,700 | $ | 3.67 | 5,614,300 | $ | 3.84 | ||||||
During the year ended December 31, 2020, the weighted-average share price at the date of exercise was CAN$5.56 (December 31, 2019 - CAN$3.24)
Subsequent to December 31, 2020, and additional 1,225,893 common shares were issued on the exercise of 1,493,900 options, with a weighted average exercise price of CAN$3.85 and a weighted average share price at the date of exercise of CAN$7.41.
The following table summarizes the information about stock options outstanding at December 31, 2020:
| Expressed in Canadian dollars | |||||
| Options Outstanding | Options exercisable | ||||
| Number | Weighted Average | Weighted Average | Number Exercisable |
Weighted Average | |
| Outstanding | Remaining | ||||
| Price | as at | Contractual Life | Exercise | as at | Exercise |
| Intervals | December 31, 2020 | (Number of Years) | Price | December 31, 2020 | Price |
| $2.00 - $2.99 | 2,090,600 | 4.2 | $2.15 | 657,600 | $2.16 |
| $3.00 - $3.99 | 1,896,200 | 2.9 | $3.44 | 1,573,600 | $3.49 |
| $4.00 - $4.99 | 1,931,500 | 0.9 | $4.31 | 1,931,500 | $4.31 |
| $5.00 - $5.99 | 60,000 | 4.7 | $5.60 | 12,000 | $5.60 |
| 5,978,300 | 2.7 | $3.29 | 4,174,700 | $3.67 | |
During the year ended December 31, 2020, the Company recognized share-based compensation expense of $1,787 (December 31, 2019 - $2,171) based on the fair value of the vested portion of options granted in the current and prior years.
The weighted-average fair values of stock options granted and the assumptions used to calculate the related compensation expense have been estimated using the Black-Scholes Option Pricing Model with the following assumptions:
|
|
Year Ended |
Year Ended |
|
Weighted-average fair value of option in CAN$ |
$1.02 |
$1.57 |
|
Risk-free interest rate |
1.08% |
1.75% |
|
Expected dividend yield |
0% |
0% |
|
Expected stock price volatility |
61% |
64% |
|
Expected option life in years |
3.82 |
3.83 |
|
ENDEAVOUR SILVER CORP. |
Option pricing models require the input of highly subjective assumptions. The expected life of the options considered such factors as the average length of time similar option grants in the past have remained outstanding prior to exercise, expiry or cancellation and the vesting period of options granted. Volatility was estimated based on average daily volatility based on historical share price observations over the expected term of the option grant. Changes in the subjective input assumptions can materially affect the estimated fair value of the options. The Company amortizes the fair value of stock options on a graded basis over the respective vesting period of each tranche of stock options awarded. As at December 31, 2020, the unvested share option expense not yet recognized was $637 (December 31, 2019 - $524) which is expected to be recognized over the next 21 months.
(d) Performance Share Units Plan
The Company has a Performance Share Unit ("PSU") plan whereby performance share units may be granted to employees of the Company. Under the PSU plan, vested PSUs are redeemable, at the election of the Board of Directors in its discretion, for Common Shares , a cash payment equal to the market value of a Common Share as of the redemption date, or a combination of cash and Common Shares. The PSUs granted are subject to a performance payout multiplier between 0% and 200% based on the Company's total shareholder return at the end of a three-year period, relative to the Company's total shareholder return peer group. The maximum number of common shares authorized for issuance from treasury under the PSU plan is 2,000,000.
| Year Ended | Year Ended | |||||
| December 31, 2020 | December 31, 2019 | |||||
| Number of units | Number of units | |||||
| Outstanding, beginning of year | 1,219,000 | 616,000 | ||||
| Granted | 882,000 | 603,000 | ||||
| Cancelled | (296,000 | ) | - | |||
| Outstanding, end of period | 1,805,000 | 1,219,000 |
There were 882,000 PSUs granted during the year ended December 31, 2020 (December 31, 2019 - 603,000). The PSUs vest at the end of a three-year period if certain pre-determined performance and vesting criteria are achieved. Performance criteria is based on the Company's share price performance relative to a representative group of other mining companies. 388,000 PSUs vest on May 3, 2021, 535,000 PSUs vest on March 3, 2022 and 882,000 PSUs vest on March 1, 2023.
During the year ended December 31, 2020, the Company recognized share-based compensation expense of $1,216 related to the PSUs (December 31, 2019 -$1,024).
(e) Deferred Share Units
The Company has a Deferred Share Unit ("DSU") plan whereby deferred share units may be granted to independent directors of the Company in lieu of compensation in cash or share purchase options. The DSUs vest immediately and are redeemable for cash based on the market value of the units at the time of a director's retirement.
| Expressed in Canadian dollars | Year Ended | Year Ended | ||||||||||
| December 31, 2020 | December 31, 2019 | |||||||||||
| Number of units |
Weighted Average Grant Price | Number of units |
Weighted Average Grant Price | |||||||||
| Outstanding, beginning of year | 889,385 | $ | 3.36 | 652,276 | $ | 3.48 | ||||||
| Granted | 376,814 | $ | 2.16 | 237,109 | $ | 3.02 | ||||||
| Redeemed | - | - | - | - | ||||||||
| Outstanding, end of period | 1,266,199 | $ | 3.00 | 889,385 | $ | 3.36 | ||||||
| Fair value at period end | 1,266,199 | $ | 6.43 | 889,385 | $ | 3.13 | ||||||
During the year ended December 31, 2020, the Company recognized an expense on director's compensation related to DSUs, which is included in general and administrative salaries, wages and benefits, of $4,251 (December 31, 2019 - $731) based on the fair value of new grants and the change in the fair value of the DSUs granted in the current and prior years. As of December 31, 2020, there are 1,266,199 deferred share units outstanding (December 31, 2019 - 889,385) with a fair market value of $6,389 (December 31, 2019 - $2,138) recognized in accounts payable and accrued liabilities.
|
ENDEAVOUR SILVER CORP. |
(f) Share Appreciation Rights
As part of the Company's bonus program, the Company may grant share appreciation rights ("SARs") to its employees in Mexico and Chile. The SARs are subject to vesting conditions and, when exercised, constitute a cash bonus based on the value of the appreciation of the Company's common shares between the SARs grant date and the exercise date.
| Year Ended | Year Ended | |||||||||||
| December 31, 2020 | December 31, 2019 | |||||||||||
| Number of units |
Weighted Average Grant Price | Number of units |
Weighted Average Grant Price | |||||||||
| Outstanding, beginning of year | 312,000 | $ | 3.30 | 694,000 | $ | 3.99 | ||||||
| Exercised | - | - | - | - | ||||||||
| Cancelled | (312,000 | ) | $ | 3.30 | (382,000 | ) | $ | 4.55 | ||||
| Outstanding, end of period | - | $ | 0.00 | 312,000 | $ | 3.30 | ||||||
| Exercisable at the end of the period | - | $ | 0.00 | 312,000 | $ | 3.30 | ||||||
During the year ended December 31, 2020, the Company recognized an expense recovery related to SARs, which is included in operation and exploration salaries, wages and benefits, of $47 (December 31, 2019 -$25) based on the change in the fair value of the SARs granted in prior years. As of December 31, 2020, there are no SARs outstanding (December 31, 2019 - 312,000) with a fair market value of $nil (December 31, 2019 - $47).
The SARs were valued using an option pricing model, which requires the input of highly subjective assumptions. The expected life of the SARs considered such factors as the average length of time similar grants in the past have remained outstanding prior to exercise, expiry or cancellation and the vesting period of SARs granted. Volatility was estimated based on average daily volatility based on historical share price observations over the expected term of the SAR grant. Changes in the subjective input assumptions can materially affect the estimated fair value of the SARs. The Company amortized the fair value of SARs on a graded basis over the respective vesting period of each tranche of SARs awarded.
(g) Diluted Earnings per Share
| Year Ended | ||||||
| December 31, | December 31, | |||||
| 2020 | 2019 | |||||
| Net earnings (loss) | $ | 1,159 | $ | (48,066 | ) | |
| Basic weighted average number of shares outstanding | 150,901,598 | 135,367,129 | ||||
| Effect of dilutive securities: | ||||||
| Stock options | 1,333,116 | - | ||||
| Performance share units | 1,805,000 | - | ||||
| Diluted weighted average number of share outstanding | 154,039,714 | 135,367,129 | ||||
| Diluted earnings (loss) per share | $ | 0.01 | $ | (0.36 | ) | |
As of December 31, 2020, there are 4,645,184 anti-dilutive stock options (December 31, 2019 - 6,789,075 stock options).
16. REVENUE
| Year Ended | ||||||
| December 31, | December 31, | |||||
| 2020 | 2019 | |||||
| Silver Sales (1) | $ | 74,733 | $ | 66,054 | ||
| Gold Sales (1) | 65,554 | 55,670 | ||||
| Less: smelting and refining costs | (1,826 | ) | (4,303 | ) | ||
| Revenue | $ | 138,461 | $ | 117,421 | ||
(1) Changes in fair value from provisional pricing in the period are included in silver and gold sales.
|
ENDEAVOUR SILVER CORP. |
| Year Ended | |||||||
| December 31, | December 31, | ||||||
| Revenue by product | 2020 | 2019 | |||||
| Concentrate sales | $ | 54,264 | $ | 71,916 | |||
| Provisional pricing adjustments | 1,238 | 806 | |||||
| Total revenue from concentrate sales | 55,502 | 72,722 | |||||
| Refined metal sales | 82,959 | 44,699 | |||||
| Total revenue | $ | 138,461 | $ | 117,421 | |||
Provisional pricing adjustments on sales of concentrate consist of provisional and final pricing adjustments made prior to the finalization of the sales contract. The Company's sales contracts are provisionally priced with provisional pricing periods lasting typically one to three months with provisional pricing adjustments recorded to revenue as market prices vary. As at December 31, 2020, a 10% change to the underlying metals prices would result in a change in revenue and accounts receivable of $716 (December 31, 2019 - $1,081) based on the total quantities of metals in sales contracts for which the provisional pricing periods were not yet closed.
17. EXPLORATION
| December 31 | December 31 | |||||
| 2020 | 2019 | |||||
| Depreciation and depletion | $ | 311 | $ | 238 | ||
| Share-based compensation | 184 | 554 | ||||
| Salaries, wages and benefits | 2,918 | 3,201 | ||||
| Direct exploration expenditures | 6,343 | 8,008 | ||||
| $ | 9,756 | $ | 12,001 |
18. GENERAL AND ADMINISTRATIVE
| December 31 | December 31 | |||||
| 2020 | 2019 | |||||
| Depreciation and depletion | $ | 202 | $ | 317 | ||
| Share-based compensation | 2,489 | 2,446 | ||||
| Salaries, wages and benefits | 7,249 | 3,344 | ||||
| Direct general and administrative | 2,775 | 3,873 | ||||
| $ | 12,715 | $ | 9,980 |
Salaries, wages and benefits includes a $4,251 expense of directors' deferred share units for the year ended December 31, 2020 (December 31, 2019 -$731) (See Note 15(e)).
19. CARE AND MAINTENANCE
| December 31, | |||
| 2020 | |||
| Depreciation and depletion | $ | 214 | |
| Salaries, wages and benefits | 2,473 | ||
| Direct general and administrative | 2,546 | ||
| $ | 5,233 |
In November 2019, the Company suspended mining operations at the El Cubo mine. The mine has remained on care and maintenace and for the year ended December 31, 2020, the Company recognized an expense of $3,010.
|
ENDEAVOUR SILVER CORP. |
On March 31, 2020, the Mexican government declared a national health emergency with extraordinary measures due to the COVID 19 pandemic, which included the suspension of non essential businesses, at which time mining was not considered to be essential. As of April 1, 2020 the Company temporarily suspended operations at the Guanacevi, Bolañitos and El Compas mines. The suspension of activities ceased in May 2020, when mining was declared an essential business. The Company recognized care and maintenance expense totaling $886 for the Guanacevi mine, $832 for the Bolañitos mine and $505 for El Compas mine during the suspension period.
20. FINANCE COSTS
| December 31 | December 31 | ||||||
| Note | 2020 | 2019 | |||||
| Accretion on provision for reclamation and rehabilitation | 14 | $ | 374 | $ | 208 | ||
| Interest on loans | 12 | 834 | 301 | ||||
| Interest on lease liabilities | 13 | 84 | 93 | ||||
| Other financing costs | 65 | - | |||||
| $ | 1,357 | $ | 602 |
21. SUPPLEMENTAL DISCLOSURE WITH RESPECT TO CASH FLOWS
| Year ended | ||||||
| December 31, | December 31, | |||||
| 2020 | 2019 | |||||
| Net changes in non-cash working capital: | ||||||
| Accounts receivable | $ | (2,200 | ) | $ | 391 | |
| Income tax receivable | 4,326 | 1,209 | ||||
| Inventories | (2,003 | ) | 511 | |||
| Prepaid expenses | 969 | (598 | ) | |||
| Accounts payable and accrued liabilities | 7,955 | (94 | ) | |||
| Income taxes payable | 1,091 | (2,103 | ) | |||
| $ | 10,138 | $ | (684 | ) | ||
| Non-cash financing and investing activities: | ||||||
| Reclamation included in mineral property, plant and equipment | $ | 99 | $ | - | ||
| Fair value of exercised options allocated to share capital | $ | 3,425 | $ | 177 | ||
| Fair value of capital assets acquired under finance leases | $ | 28 | $ | - | ||
| Other cash disbursements: | ||||||
| Income taxes paid | $ | 1,643 | $ | 3,439 | ||
| Special mining duty paid | $ | - | $ | 1,670 | ||
|
ENDEAVOUR SILVER CORP. |
22. SEGMENT DISCLOSURES
The Company's operating segments are based on internal management reports that are reviewed by the Company's executives (the chief operating decision makers) in assessing performance. The Company has three operating mining segments which are located in Mexico, Guanaceví, Bolañitos, and El Compas, the El Cubo mine which is on care and maintenance, as well as Exploration and Corporate segments. The Exploration segment consists of projects in the exploration and evaluation phases in Mexico and Chile. Exploration projects that are in the local district surrounding a mine are included in the mine's segment
| December 31, 2020 | |||||||||||||||||||||
| Corporate | Exploration | Guanaceví | Bolanitos | El Compas | El Cubo | Total | |||||||||||||||
| Cash and cash equivalents | $ | 23,370 | $ | 489 | $ | 25,456 | $ | 6,069 | $ | 4,579 | $ | 1,120 | $ | 61,083 | |||||||
| Other Investments | 4,767 | - | - | - | - | - | 4,767 | ||||||||||||||
| Accounts and other receivables | 1,475 | 184 | 6,573 | 9,321 | 1,949 | 642 | 20,144 | ||||||||||||||
| Income tax receivable | - | 5 | 15 | 12 | - | 20 | 52 | ||||||||||||||
| Inventories | - | - | 9,252 | 4,645 | 2,461 | 282 | 16,640 | ||||||||||||||
| Prepaid expenses | 1,095 | 122 | 731 | 202 | 20 | 114 | 2,284 | ||||||||||||||
| Non-current deposits | 76 | - | 306 | 135 | - | 74 | 591 | ||||||||||||||
| Deferred financing costs | 294 | - | - | - | - | - | 294 | ||||||||||||||
| Non-current IVA receivable | - | 854 | 1,475 | - | - | 347 | 2,676 | ||||||||||||||
| Deferred income tax asset | - | - | 9,445 | 3,308 | - | - | 12,753 | ||||||||||||||
| Intangible assets | 11 | 88 | 134 | 135 | 78 | 46 | 492 | ||||||||||||||
| Right-of-use leased assets | 649 | - | - | 105 | 107 | - | 861 | ||||||||||||||
| Mineral property, plant and equipment | 309 | 16,104 | 40,386 | 24,445 | 3,584 | 3,127 | 87,955 | ||||||||||||||
| Total assets | $ | 32,046 | $ | 17,846 | $ | 93,773 | $ | 48,377 | $ | 12,778 | $ | 5,772 | $ | 210,592 | |||||||
| Accounts payable and accrued liabilities | $ | 11,008 | $ | 802 | $ | 10,547 | $ | 3,809 | $ | 1,018 | $ | 580 | $ | 27,764 | |||||||
| Income taxes payable | 4 | - | 2,367 | 667 | - | - | 3,038 | ||||||||||||||
| Loans payable | 439 | - | 3,105 | 6,128 | - | - | 9,672 | ||||||||||||||
| Lease obligations | 982 | - | - | 112 | - | - | 1,094 | ||||||||||||||
| Provision for reclamation and rehabilitation | - | - | 2,221 | 1,978 | 132 | 4,545 | 8,876 | ||||||||||||||
| Deferred income tax liability | - | - | 798 | 279 | - | - | 1,077 | ||||||||||||||
| Total liabilities | $ | 12,433 | $ | 802 | $ | 19,038 | $ | 12,973 | $ | 1,150 | $ | 5,125 | $ | 51,521 | |||||||
| December 31, 2019 | |||||||||||||||||||||
| Corporate | Exploration | Guanaceví | Bolanitos | El Compas | El Cubo | Total | |||||||||||||||
| Cash and cash equivalents | $ | 13,065 | $ | 855 | $ | 7,372 | $ | 1,700 | $ | 353 | $ | 23 | $ | 23,368 | |||||||
| Other Investments | 69 | - | - | - | - | - | 69 | ||||||||||||||
| Accounts receivables | 1,068 | 2,568 | 4,574 | 6,999 | 4,819 | 2,922 | 22,950 | ||||||||||||||
| Inventories | - | - | 7,441 | 2,426 | 2,094 | 1,628 | 13,589 | ||||||||||||||
| Prepaid expenses | 905 | 1,029 | 619 | 572 | 25 | 152 | 3,302 | ||||||||||||||
| Non-current deposits | 76 | - | 305 | 151 | - | 74 | 606 | ||||||||||||||
| Non-current IVA receivable | - | 355 | 824 | - | - | 869 | 2,048 | ||||||||||||||
| Deferred income tax asset | - | - | 2,837 | 4,299 | - | - | 7,136 | ||||||||||||||
| Intangible assets | 28 | 160 | 269 | 224 | 137 | 157 | 975 | ||||||||||||||
| Right-of-use leased assets | 745 | - | - | 175 | 417 | - | 1,337 | ||||||||||||||
| Mineral property, plant and equipment | 380 | 13,064 | 34,006 | 19,757 | 17,106 | 4,020 | 88,333 | ||||||||||||||
| Total assets | $ | 16,336 | $ | 18,031 | $ | 58,247 | $ | 36,303 | $ | 24,951 | $ | 9,845 | $ | 163,713 | |||||||
| Accounts payable and accrued liabilities | $ | 6,729 | $ | 855 | $ | 7,079 | $ | 2,872 | $ | 1,403 | $ | 837 | $ | 19,775 | |||||||
| Income taxes payable | 368 | - | 696 | 840 | - | 43 | 1,947 | ||||||||||||||
| Loans payable | 774 | - | 2,058 | 6,043 | 8,875 | ||||||||||||||||
| Lease obligations | 1,050 | - | - | 188 | - | - | 1,238 | ||||||||||||||
| Provision for reclamation and rehabilitation | - | - | 2,182 | 1,848 | 124 | 4,249 | 8,403 | ||||||||||||||
| Deferred income tax liability | - | - | - | 513 | 169 | - | 682 | ||||||||||||||
| Total liabilities | $ | 8,921 | $ | 855 | $ | 12,015 | $ | 12,304 | $ | 1,696 | $ | 5,129 | $ | 40,920 | |||||||
|
ENDEAVOUR SILVER CORP. |
| Corporate | Exploration | Guanaceví | Bolanitos | El Compas | El Cubo | Total | |||||||||||||||
| Year ended December 31, 2020 | |||||||||||||||||||||
| Silver revenue | $ | - | $ | - | $ | 65,501 | $ | 7,471 | $ | 1,761 | $ | - | $ | 74,733 | |||||||
| Gold revenue | - | - | 17,458 | 33,970 | 14,126 | - | $ | 65,554 | |||||||||||||
| Less: smelting and refining costs | - | - | - | (1,393 | ) | (433 | ) | - | $ | (1,826 | ) | ||||||||||
| Total revenue | $ | - | $ | - | $ | 82,959 | $ | 40,048 | $ | 15,454 | $ | - | $ | 138,461 | |||||||
| Salaries, wages and benefits: | |||||||||||||||||||||
| mining | $ | - | $ | - | $ | 5,825 | $ | 3,660 | $ | 1,430 | $ | - | $ | 10,915 | |||||||
| processing | - | - | 1,846 | 1,275 | 916 | - | 4,037 | ||||||||||||||
| administrative | - | - | 2,721 | 2,434 | 1,142 | - | 6,297 | ||||||||||||||
| stock based compensation | - | - | 114 | 108 | 108 | - | 330 | ||||||||||||||
| change in inventory | - | - | (239 | ) | (172 | ) | (219 | ) | - | (630 | ) | ||||||||||
| Total salaries, wages and benefits | - | - | 10,267 | 7,305 | 3,377 | - | 20,949 | ||||||||||||||
| Direct costs: | |||||||||||||||||||||
| mining | - | - | 18,324 | 9,108 | 3,914 | - | 31,346 | ||||||||||||||
| processing | - | - | 9,549 | 3,427 | 2,204 | - | 15,180 | ||||||||||||||
| administrative | - | - | 3,461 | 2,484 | 1,835 | - | 7,780 | ||||||||||||||
| change in inventory | - | - | (794 | ) | (420 | ) | 390 | - | (824 | ) | |||||||||||
| Total direct production costs | - | - | 30,540 | 14,599 | 8,343 | - | 53,482 | ||||||||||||||
| Depreciation and depletion: | |||||||||||||||||||||
| depreciation and depletion | - | - | 9,223 | 9,341 | 10,793 | - | 29,357 | ||||||||||||||
| change in inventory | - | - | (438 | ) | (394 | ) | (389 | ) | - | (1,221 | ) | ||||||||||
| Total depreciation and depletion | - | - | 8,785 | 8,947 | 10,404 | - | 28,136 | ||||||||||||||
| Royalties | - | - | 7,407 | 197 | 550 | - | 8,154 | ||||||||||||||
| Write down of inventory to NRV | - | - | - | - | 405 | - | 405 | ||||||||||||||
| Total cost of sales | $ | - | $ | - | $ | 56,999 | $ | 31,048 | $ | 23,079 | $ | - | $ | 111,126 | |||||||
| Care and maintenance costs | - | - | 886 | 832 | 504 | 3,011 | 5,233 | ||||||||||||||
| Impairment (impairment reversal) | - | - | (2,576 | ) | - | 3,000 | - | 424 | |||||||||||||
| Earnings (loss) before taxes | $ | (12,976 | ) | $ | (9,756 | ) | $ | 27,650 | $ | 8,168 | $ | (11,129 | ) | $ | (3,011 | ) | $ | (1,054 | ) | ||
| Current income tax expense (recovery) | - | - | 2,007 | 918 | 68 | - | 2,993 | ||||||||||||||
| Deferred income tax expense (recovery) | - | - | (5,811 | ) | 774 | (169 | ) | - | (5,206 | ) | |||||||||||
| Total income tax expense (recovery) | - | - | (3,804 | ) | 1,692 | (101 | ) | - | (2,213 | ) | |||||||||||
| Net earnings (loss) | $ | (12,976 | ) | $ | (9,756 | ) | $ | 31,454 | $ | 6,476 | $ | (11,028 | ) | $ | (3,011 | ) | $ | 1,159 | |||
Costs associated with the suspension of operation activities due to COVID-19 have been recognized as care and maintenance costs.
The Exploration segment included $1,799 of costs incurred in Chile for the year ended December 31, 2020 (December 31, 2019 - $2,957).
|
ENDEAVOUR SILVER CORP. |
| Corporate | Exploration | Guanaceví | Bolanitos | El Compas | El Cubo | Total | |||||||||||||||
| Year ended December 31, 2019 | |||||||||||||||||||||
| Silver revenue | $ | - | $ | - | $ | 36,062 | $ | 10,707 | $ | 1,743 | $ | 17,542 | 66,054 | ||||||||
| Gold revenue | - | - | 8,638 | 21,703 | 10,589 | 14,740 | 55,670 | ||||||||||||||
| Less: smelting and refining costs | - | - | - | (1,981 | ) | (413 | ) | (1,909 | ) | (4,303 | ) | ||||||||||
| Total revenue | $ | - | $ | - | $ | 44,700 | $ | 30,429 | $ | 11,919 | $ | 30,373 | $ | 117,421 | |||||||
| Salaries, wages and benefits: | |||||||||||||||||||||
| mining | $ | - | $ | - | $ | 7,331 | $ | 4,871 | $ | 468 | $ | 5,945 | $ | 18,615 | |||||||
| processing | - | - | 1,764 | 1,151 | 566 | 1,301 | 4,782 | ||||||||||||||
| administrative | - | - | 2,871 | 1,993 | 1,073 | 2,254 | 8,191 | ||||||||||||||
| stock based compensation | - | - | 49 | 49 | 48 | 49 | 195 | ||||||||||||||
| change in inventory | - | - | (318 | ) | 414 | 53 | 192 | 341 | |||||||||||||
| Total salaries, wages and benefits | - | - | 11,697 | 8,478 | 2,208 | 9,741 | 32,124 | ||||||||||||||
| Direct costs: | |||||||||||||||||||||
| mining | - | - | 20,649 | 9,715 | 4,857 | 9,873 | 45,094 | ||||||||||||||
| processing | - | - | 7,843 | 3,384 | 1,763 | 2,942 | 15,932 | ||||||||||||||
| administrative | - | - | 2,699 | 1,308 | 672 | 2,402 | 7,081 | ||||||||||||||
| change in inventory | - | - | (861 | ) | 906 | 92 | 309 | 446 | |||||||||||||
| Total direct production costs | - | - | 30,330 | 15,313 | 7,384 | 15,526 | 68,553 | ||||||||||||||
| Depreciation and depletion: | |||||||||||||||||||||
| depreciation and depletion | - | - | 13,869 | 3,609 | 6,835 | 6,960 | 31,273 | ||||||||||||||
| change in inventory | - | - | 227 | 22 | (213 | ) | 186 | 222 | |||||||||||||
| Total depreciation and depletion | - | - | 14,096 | 3,631 | 6,622 | 7,146 | 31,495 | ||||||||||||||
| Royalties | - | - | 1,410 | 181 | 291 | 152 | 2,034 | ||||||||||||||
| Write down of inventory to NRV | - | - | - | - | 576 | - | 576 | ||||||||||||||
| Total cost of sales | $ | - | $ | - | $ | 57,533 | $ | 27,603 | $ | 17,081 | $ | 32,565 | $ | 134,782 | |||||||
| Severance costs | - | - | - | - | - | 4,589 | 4,589 | ||||||||||||||
| Earnings (loss) before taxes | $ | (10,053 | ) | $ | (12,001 | ) | $ | (12,833 | ) | $ | 2,826 | $ | (5,162 | ) | $ | (6,781 | ) | $ | (44,004 | ) | |
| Current income tax expense (recovery) | - | - | 551 | 1,879 | 137 | 135 | 2,702 | ||||||||||||||
| Deferred income tax expense (recovery) | - | - | 3,779 | (3,170 | ) | (130 | ) | 881 | 1,360 | ||||||||||||
| Total income tax expense (recovery) | - | - | 4,330 | (1,291 | ) | 7 | 1,016 | 4,062 | |||||||||||||
| Net earnings (loss) | $ | (10,053 | ) | $ | (12,001 | ) | $ | (17,163 | ) | $ | 4,117 | $ | (5,169 | ) | $ | (7,797 | ) | $ | (48,066 | ) | |
The prior period direct processing costs and total revenue have been presented to reflect a change to present revenue net of concentrate smelting and refining costs.
|
ENDEAVOUR SILVER CORP. |
23. INCOME TAXES
(a) Tax Assessments
Minera Santa Cruz y Garibaldi SA de CV ("MSCG"), a subsidiary of the Company, received a MXN 238 million assessment on October 12, 2010 by Mexican fiscal authorities for failure to provide the appropriate support for certain expense deductions taken in MSCG's 2006 tax return, failure to provide appropriate support for loans made to MSCG from affiliated companies, and deemed an unrecorded distribution of dividends to shareholders, among other individually immaterial items. MSCG immediately initiated a Nullity action and filed an administrative attachment to dispute the assessment.
In June 2015, the Superior Court ruled in favour of MSCG on a number of the matters under appeal; however, the Superior Court ruled against MSCG for failure to provide appropriate support for certain deductions taken in MSCG's 2006 tax return. In June 2016, the Company received a MXN 122.9 million ($6,200) tax assessment based on the June 2015 ruling. The 2016 tax assessment comprised of MXN 41.8 million owed ($2,100) in taxes, MXN 17.7 million ($900) in inflationary charges, MXN 40.4 million ($2,000) in interest and MXN 23.0 million ($1,200) in penalties. The 2016 tax assessment was issued for failure to provide the appropriate support for certain expense deductions taken in MSCG's 2006 tax return and failure to provide appropriate support for loans made to MSCG from affiliated companies. The MXN 122.9 million assessment includes interest and penalties. If MSCG agrees to pay the tax assessment, or a lesser settled amount, it is eligible to apply for forgiveness of 100% of the penalties and 50% of the interest.
The Company filed an appeal against the June 2016 tax assessment on the basis certain items rejected by the courts were included in the new tax assessment, and a number of deficiencies exist within the assessment. Since issuance of the assessment interest charges of MXN 9.1 million ($500) and inflationary charges of MXN 13.7 million ($700) has accumulated.
Included in the Company's consolidated financial statements, are net assets of $595, including $42 in cash, held by MSCG. Following the Tax Court's rulings, MSCG is in discussions with the tax authorities with regards to the shortfall of assets within MSCG to settle its estimated tax liability. An alternative settlement option would be to transfer the shares and assets of MSCG to the tax authorities. As of December 31, 2020, the Company's income tax payable includes an allowance for transferring the shares and assets of MSCG amounting to $595. The Company continues to assess MSCG's settlement options based on on-going court proceedings and discussion with the tax authorities. The Company continues to assess that it is probable that its appeal should prevail, and the maximum estimated exposure is the amount of the above allowance.
Compania Minera Del Cubo SA de CV ("Cubo"), a subsidiary of the Company, received a MXN 58.5 million ($2,900) assessment in 2019 by Mexican fiscal authorities for alleged failure to provide the appropriate support for depreciation deductions taken in the Cubo 2016 tax return and denied eligibility of deductions of certain suppliers. The tax assessment consists of MXN 24.1 million ($1,200) for taxes, MXN 21.0 million ($1,100) for penalties, MXN 10.4 million ($500) for interest and MXN 3.0 million ($100) for inflation. At the time of the tax assessment the Cubo entity had and continues to have sufficient loss carry forwards which would be applied against the assessed difference of taxable income. The Mexican tax authorities did not consider these losses in the assessment.
Due to the denial of certain suppliers for income tax purposes in the Cubo assessment, the invoices from these suppliers have been assessed as ineligible for refunds of IVA paid on the invoices. The assessment includes MXN 14.7 million ($700) for re-payment of IVA (value added taxes) refunded on these supplier payments. In the Company's judgement the suppliers and invoices meet the necessary requirements to be deductible for income tax purposes and the recovery of IVA.
The Company has filed an administrative appeal related to the 2016 Cubo Tax assessment. Cubo has provided a lien on certain El Cubo mining concessions during the appeal process. Since issuance of the assessment interest charges of MXN 9.9 million ($500) and inflationary charges of MXN 1.6 million ($100) has accumulated. The Company continues to assess that it is probable that its appeal will prevail, and no provision is required in respect of the Cubo assessment.
|
ENDEAVOUR SILVER CORP. |
(b) Deferred Income Tax Assets and Liabilities
| Mexico operations | December 31, | December 31, | ||||
| Deferred tax derived from income tax | 2020 | 2019 | ||||
| Deferred income tax assets: | ||||||
| Tax loss carryforwards | $ | 18,412 | $ | 7,648 | ||
| Working capital | 2,354 | 2,149 | ||||
| Deferred income tax liabilities: | ||||||
| Inventories | (1,875 | ) | (1,326 | ) | ||
| Mineral properties, plant and equipment | (6,138 | ) | (1,335 | ) | ||
| Other | ||||||
| Deferred income tax assets (liabilities), net | $ | 12,753 | $ | 7,136 |
| Mexico operations | December 31, | December 31, | ||||
| Deferred tax derived from special mining duty | 2020 | 2019 | ||||
| Deferred income tax liabilities: | ||||||
| Working capital | (230 | ) | - | |||
| Mineral properties, plant and equipment | (624 | ) | (169 | ) | ||
| Other | (223 | ) | (513 | ) | ||
| Deferred income tax assets (liabilities), net | $ | (1,077 | ) | $ | (682 | ) |
Prior year assets and liabilities have been reclassified.
(c) Income Tax Expense
| December 31, | December 31, | |||||
| 2020 | 2019 | |||||
| Current income tax expense (recovery): | ||||||
| Current income tax expense in respect of current year | $ | 1,053 | $ | 2,901 | ||
| Special mining duty | 1,989 | - | ||||
| Adjustments recognized in the current year in relation to prior years | (49 | ) | (199 | ) | ||
| Deferred income tax expense (recovery): | ||||||
| Deferred tax expense recognized in the current year | 5,498 | 3,353 | ||||
| Special mining duty | 1,646 | (1,425 | ) | |||
| Adjustments recognized in the current year in relation to prior years | (12,350 | ) | (568 | ) | ||
| Total income tax expense (recovery) | $ | (2,213 | ) | $ | 4,062 |
|
ENDEAVOUR SILVER CORP. |
The reconciliation of the income tax provision computed at statutory tax rates to the reported income tax provision is as follows:
| December 31, | December 31, | |||||
| 2020 | 2019 | |||||
| Canadian statutory tax rates | 27.00% | 27.00% | ||||
| Income tax expense computed at Canadian statutory rates | $ | (284 | ) | $ | (11,881 | ) |
| Foreign tax rates different from statutory rate | 256 | (4,831 | ) | |||
| Change in tax rates | - | - | ||||
| Withholding taxes, net of tax credits | 9 | 664 | ||||
| Stock-based compensation | 478 | 586 | ||||
| Foreign exchange | (153 | ) | 2,985 | |||
| Inflationary adjustment | 755 | 2,404 | ||||
| Other non-deductible items | 1,451 | 2,493 | ||||
| Adjustments recognized in the current year in relation to prior years | 92 | (568 | ) | |||
| Current year losses not recognized | 3,990 | 13,331 | ||||
| Special mining duty Mexican tax | 3,634 | (1,121 | ) | |||
| Recognition of previously unrecognized losses | (12,441 | ) | - | |||
| Income tax expense | $ | (2,213 | ) | $ | 4,062 |
(d) Unrecognized Deferred Tax Assets
Management believes that sufficient uncertainty exists regarding the realization of certain deferred tax assets such that they have not been fully recognized. The tax benefits not recognized reflect management's assessment regarding the future realization of Canadian, Chilean and certain Mexican tax assets and estimates of future earnings and taxable income in these jurisdictions as of December 31, 2020. When circumstances cause a change in management's judgement about the recoverability of deferred tax assets, the impact of the change will be reflected in current income.
| Loss Carry Forward | December 31, | December 31, | |||||
| Expiry | 2020 | 2019 | |||||
| Unrecognized Mexico tax loss carry forward | 2021-2030 | $ | 129,680 | $ | 131,032 | ||
| Unrecognized Canada tax loss carry forward | 2025-2030 | 6,752 | $ | 3,155 | |||
| Unrecognized Chile tax loss carry forward | 2021-2030 | 13,817 | $ | 11,989 | |||
| Capital losses | 12,561 | $ | 12,296 | ||||
| Reclamation provision | 7,016 | 6,635 | |||||
| Exploration pools | 6,172 | - | |||||
| Other Canada temporary differences | 13,918 | 8,399 |
|
ENDEAVOUR SILVER CORP. |
24. FINANCIAL INSTRUMENTS AND FAIR VALUE MEASUREMENTS
(a) Financial assets and liabilities
As at December 31, 2020, the carrying and fair values of the Company's financial instruments by category are as follows:
| Fair value through profit or loss | Amortized cost |
Carrying value |
Fair value | |||||||||
| $ | $ | $ | $ | |||||||||
| Financial assets: | ||||||||||||
| Cash and cash equivalents | - | 61,083 | 61,083 | 61,083 | ||||||||
| Other Investments | 4,767 | - | 4,767 | 4,767 | ||||||||
| Trade and other receivables | 8,755 | 11,389 | 20,144 | 20,144 | ||||||||
| Total financial assets | 13,522 | 72,472 | 85,994 | 85,994 | ||||||||
| Financial liabilities: | ||||||||||||
| Accounts payable and accrued liabilites | 6,389 | 21,375 | 27,764 | 27,764 | ||||||||
| Loans payable | - | 9,672 | 9,672 | 9,672 | ||||||||
| Total financial liabilities | 6,389 | 31,047 | 37,436 | 37,436 |
Fair value measurements
Fair value hierarchy
Fair value is the price that would be received to sell an asset or paid to transfer a liability in an orderly transaction between market participants at the measurement date. The fair value hierarchy establishes three levels to classify the inputs to valuation techniques used to measure fair value. Level 1 inputs are quoted prices (unadjusted) in active markets for identical assets or liabilities. Level 2 inputs are quoted prices in markets that are not active, quoted prices for similar assets or liabilities in active markets, inputs other than quoted prices that are observable for the asset or liability (for example, interest rate and yield curves observable at commonly quoted intervals, forward pricing curves used to value currency and commodity contracts and volatility measurements used to value option contracts), or inputs that are derived principally from or corroborated by observable market data or other means. Level 3 inputs are unobservable (supported by little or no market activity). The fair value hierarchy gives the highest priority to Level 1 inputs and the lowest priority to Level 3 inputs.
Level 1:
Other investments are comprised of marketable securities. When there is an active market are determined based on a market approach reflecting the closing price of each particular security at the reporting date. The closing price is a quoted market price obtained from the exchange that is the principal active market for the particular security. As a result, $4,270 of these financial assets have been included in Level 1 of the fair value hierarchy.
Deferred share units are determined based on a market approach reflecting the Company's closing share price.
Level 2:
The Company determines the fair value of the embedded derivatives related to its trade receivables based on the quoted closing price obtained from the silver and gold metal exchanges.
Other investments are comprised of marketable securities. When there is not an active market as a listing on an exchange is pending, the fair value is determined based on the most recently observable transaction for those securities. As a result, $497 of these financial assets have been included in Level 2 of the fair value hierarchy.
Level 3:
The Company has no assets or liabilities included in Level 3 of the fair value hierarchy
There were no transfers between levels 1, 2 and 3 during the year ended December 31, 2020.
|
ENDEAVOUR SILVER CORP. |
Assets and liabilities as at December 31, 2020 measured at fair value on a recurring basis include:
| Total | Level 1 | Level 2 | Level 3 | |||||||||
| $ | $ | $ | $ | |||||||||
| Financial assets: | ||||||||||||
| Investments | 4,767 | 4,270 | 497 | - | ||||||||
| Trade and other receivables | 20,144 | 11,389 | 8,755 | - | ||||||||
| Total financial assets | 24,911 | 15,659 | 9,252 | - | ||||||||
| Financial liabilities: | ||||||||||||
| Deferred share units | 6,389 | 6,389 | - | - | ||||||||
| Total financial liabilities | 6,389 | 6,389 | - | - |
(b) Financial Instrument Risk Exposure and Risk Management
The Company is exposed in varying degrees to a variety of financial instrument related risks. The Board approves and monitors the risk management process. The types of risk exposure and the manner in which such exposures are managed is outlined as follows:
Credit Risk
The Company is exposed to credit risk on its bank accounts and accounts receivable. Credit risk exposure on bank accounts is limited through maintaining the Company's balances with high-credit quality financial institutions, maintaining investment policies, assessing institutional exposure and continual discussion with external advisors. Value added tax ("IVA") receivables are generated on the purchase of supplies and services to produce silver and gold, which are refundable from the Mexican government. Trade receivables are generated on the sale of concentrate inventory to reputable metal traders.
The carrying amount of financial assets represents the Company's maximum credit exposure.
Below is an aged analysis of the Company's receivables:
| Carrying | Gross | Carrying | Gross | |||||||||
| amount | impairment | amount | impairment | |||||||||
| December 31, 2020 | December 31, 2019 | |||||||||||
| Less than 1 month | $ | 10,629 | $ | - | $ | 10,048 | $ | - | ||||
| 1 to 3 months | 7,491 | - | 4,083 | - | ||||||||
| 4 to 6 months | 239 | - | 1,109 | - | ||||||||
| Over 6 months | 4,512 | - | 9,758 | 151 | ||||||||
| Total accounts receivable | $ | 22,871 | $ | - | $ | 24,998 | $ | 151 | ||||
At December 31, 2020, 75% of the receivables that were outstanding greater than one month were comprised of IVA and tax receivables in Mexico (December 31, 2019 - 93%) and 23% of the receivables outstanding greater than one month are pending finalizations of concentrate sales.
At December 31, 2020, an impairment loss of $nil relates to IVA receivable claims from prior years written off during the year (December 31, 2019 - $151).
Liquidity Risk
Liquidity risk is the risk that the Company will not be able to meet its financial obligations as they come due. We manage our liquidity risk by continually monitoring forecasted and actual cash flows. We have in place a planning and budgeting process to help determine the funds required to support our normal operating requirement and development plans. We aim to maintain sufficient liquidity to meet our short term business requirements, taking into account our anticipated cash flows from operations, our holdings of cash and cash equivalents, and our committed and anticipated liabilities.
|
ENDEAVOUR SILVER CORP. |
The following table summarizes the remaining contractual maturities of the Company's financial liabilities and operating and capital commitments at December 31, 2020:
| Less than | 1 to 3 | 4 to 5 | Over 5 | ||||||||||||
| 1 year | years | years | years | Total | |||||||||||
| $ | $ | $ | $ | $ | |||||||||||
| Accounts payable and accrued liabilities | 27,764 | 27,764 | |||||||||||||
| Income taxes payable | 3,038 | 3,038 | |||||||||||||
| Loans payable | 3,582 | 5,598 | 492 | 9,672 | |||||||||||
| Lease liabilities | 173 | 287 | 247 | 387 | 1,094 | ||||||||||
| Provision for reclamation and rehabilitation | - | 4,673 | 1,978 | 2,225 | 8,876 | ||||||||||
| Capital expenditure commitments | 955 | 955 | |||||||||||||
| Operating leases | 135 | 219 | 219 | 283 | 856 | ||||||||||
| Total contractual obligations | 35,647 | 10,777 | 2,936 | 2,895 | 52,255 |
Market Risk
Significant market related risks to which the Company is exposed consist of foreign currency risk, commodity price risk and equity price risk.
Foreign Currency Risk - The Company's operations in Mexico and Canada make it subject to foreign currency fluctuations. Certain of the Company's operating expenses are incurred in Mexican pesos and Canadian dollars, therefore the fluctuation of the US dollar in relation to these currencies will consequently have an impact on the profitability of the Company and may also affect the value of the Company's assets and the amount of shareholders' equity. The Company has not entered into any agreements or purchased any instruments to hedge possible currency risks.
The US dollar equivalents of financial assets and liabilities denominated in currencies other than the US dollar as at December 31st are as follows:
| December 31, 2020 | December 31, 2019 | |||||||||||
| Canadian Dollar | Mexican Peso | Canadian Dollar | Mexican Peso | |||||||||
| Financial assets | $ | 9,383 | $ | 18,920 | $ | 923 | $ | 21,301 | ||||
| Financial liabilities | (8,512 | ) | (14,036 | ) | (3,562 | ) | (12,098 | ) | ||||
| Net financial assets (liabilities) | $ | 871 | $ | 4,884 | $ | (2,639 | ) | $ | 9,203 | |||
Of the financial assets listed above, $3,192 (2019 - $25) represents cash and cash equivalents held in Canadian dollars and $4,590 (2019 - $3,140) represents cash held in Mexican Pesos. The remaining cash balance is held in US dollars.
As at December 31, 2020, with other variables unchanged, a 5% strengthening of the US dollar against the Canadian dollar would reduce net earnings by $41 due to these financial assets and liabilities.
As at December 31, 2020, with other variables unchanged, a 5% strengthening of the US dollar against the Mexican peso would decrease net earnings by $233 due to these financial assets and liabilities.
Commodity Price Risk - Gold and silver prices have historically fluctuated significantly and are affected by numerous factors outside of the Company's control, including, but not limited to, industrial and retail demand, central bank lending, forward sales by producers and speculators, levels of worldwide production, short-term changes in supply and demand due to speculative hedging activities and certain other factors. The Company has not engaged in any hedging activities, other than short-term metal derivative transactions less than 90 days, to reduce its exposure to commodity price risk. Revenue from the sale of concentrates is based on prevailing market prices which is subject to adjustment upon final settlement. For each reporting period until final settlement, estimates of metal prices are used to record sales. At December 31, 2020 there are 43,026 ounces of silver and 3,179 ounces of gold which do not have a final settlement price and the estimated revenues have been recognized at current market prices. As at December 31, 2020, with other variables unchanged, a 10% decrease in the market value of silver and gold would result in a reduction of revenue of $716.
|
ENDEAVOUR SILVER CORP. |
| HEAD OFFICE | Suite #1130, 609 Granville Street |
| Vancouver, BC, Canada V7Y 1G5 | |
|
Telephone: (604) 685-9775 1-877-685-9775 Facsimile: (604) 685-9744 Website: www.edrsilver.com |
|
| DIRECTORS | Geoff Handley Margaret Beck Ricardo Campoy Bradford Cooke Rex McLennan Kenneth Pickering Mario Szotlender |
| OFFICERS |
Bradford Cooke - Chief Executive Officer Donald Gray - Chief Operating Officer Dan Dickson - Chief Financial Officer Nicholas Shakesby - Vice President, Operations Luis Castro - Vice-President, Exploration Dale Mah - Vice-President, Corporate Development Christine West - Vice-President, Controller Bernard Poznanski - Corporate Secretary |
| REGISTRAR AND TRANSFER AGENT |
Computershare Trust Company of Canada 3rd Floor - 510 Burrard Street Vancouver, BC, V6C 3B9 |
| AUDITORS |
KPMG LLP 777 Dunsmuir Street Vancouver, BC, V7Y 1K3 |
| SOLICITORS |
Koffman Kalef LLP 19th Floor - 885 West Georgia Street Vancouver, BC, V6C 3H4 |
| SHARES LISTED |
Toronto Stock Exchange Trading Symbol - EDR New York Stock Exchange Trading Symbol - EXK |
MANAGEMENT'S DISCUSSION AND ANALYSIS
FOR THE YEAR ENDED DECEMBER 31, 2020This Management Discussion and Analysis ("MD&A") should be read in conjunction with the consolidated financial statements of Endeavour Silver Corp. ("Endeavour" or "the Company") for the year ended December 31, 2020 and the related notes contained therein, which were prepared in accordance with International Financial Reporting Standards ("IFRS") as issued by the International Accounting Standards Board ("IASB"). The Company uses certain non-IFRS financial measures in this MD&A as described under "Non-IFRS Measures". Additional information relating to the Company, including the most recent Annual Information Form (the "Annual Information Form"), is available on SEDAR at www.sedar.com, and the Company's most recent annual report on Form 40-F has been filed with the U.S. Securities and Exchange Commission (the "SEC"). This MD&A contains "forward-looking statements" that are subject to risk factors set out in a cautionary note contained herein. All dollar ($) amounts are expressed in United States ("$.") dollars and tabular amounts are expressed in thousands of U.S. dollars unless Canadian dollars (CAN$) are indicated otherwise indicated. This MD&A is dated as of February 25, 2021 and all information contained is current as of February 25, 2021 unless otherwise stated.
Cautionary Note to U.S. Investors Regarding Mineral Reserves and Resources
This Management Discussion and Analysis has been prepared in accordance with the requirements of Canadian provincial securities laws, which differ from the requirements of U.S. securities laws. Unless otherwise indicated, all mineral reserve and mineral resource estimates included have been prepared in accordance with Canadian National Instrument 43-101- Standards of Disclosure for Mineral Projects ("NI 43-101") and the Canadian Institute of Mining, Metallurgy and Petroleum (the "CIM") - CIM Definition Standards on Mineral Resources and Mineral Reserves, adopted by the CIM Council, as amended. NI 43-101 is an instrument developed by the Canadian Securities Administrators that establishes standards for all public disclosure an issuer makes of scientific and technical information concerning mineral projects. These definitions differ from the definitions in requirements under United States securities laws adopted by the United States Securities and Exchange Commission.
Under Canadian rules, estimates of inferred mineral resources may not form the basis of feasibility or pre-feasibility studies, except in rare cases. Investors are cautioned not to assume that all or any part of an inferred mineral resource exists or is economically or legally mineable. An "inferred mineral resource" is that part of a mineral resource for which quantity and grade or quality are estimated on the basis of limited geological evidence and sampling. Geological evidence is sufficient to imply but not verify geological and grade or quality continuity. An inferred mineral resource has a lower level of confidence than that applying to an indicated mineral resource and must not be converted to a mineral reserve. It is reasonably expected that the majority of inferred mineral resources could be upgraded to indicated mineral resources with continued exploration.
Investors are cautioned not to assume that all or any part of mineral reserves and mineral resources determined in accordance with NI 43-101 and CIM standards will qualify as, or be identical to, mineral reserves and mineral resources estimated under the standards of the SEC applicable to U.S. companies. The SEC has adopted amendments to its disclosure rules to modernize the mineral property disclosure requirements for issuers whose securities are registered with the SEC. As a foreign private issuer that files its annual report on Form 40-F with the SEC pursuant to the multi-jurisdictional disclosure system, the Company is not required to provide disclosure on its mineral properties under the SEC's new rules and will continue to provide disclosure under NI 43-101 and the CIM standards. If the Company ceases to be a foreign private issuer or lose its eligibility to file its annual report on Form 40-F pursuant to the multi-jurisdictional disclosure system, then the Company will be subject to the SEC's new rules, which differ from the requirements of NI 43-101 and the CIM standards.
Accordingly, information contained in this Management Discussion and Analysis that contain descriptions of the Corporation's mineral deposits may not be comparable to similar information made public by U.S. companies subject to the reporting and disclosure requirements under the United States federal securities laws and the rules and regulations thereunder.
Forward-Looking Statements
This MD&A contains "forward-looking statements" within the meaning of the U.S. Securities Litigation Reform Act of 1995, as amended and "forward-looking information" within the meaning of applicable Canadian securities legislation. Such forward-looking statements and information include, but are not limited to, statements regarding Endeavour's anticipated performance in 2021, including silver and gold production, financial results, timing and expenditures to develop new silver mines and mineralized zones, silver and gold grades and recoveries, cash costs per ounce, capital expenditures and sustaining capital and the impact of the COVID 19 pandemic on operations. Forward-looking statements are frequently characterized by words such as "plan", "expect", "forecast", "project", "intend", "believe", "anticipate", "outlook" and other similar words, or statements that certain events or conditions "may" or "will" occur. Forward- looking statements are based on the opinions and estimates of management at the dates the statements are made, and are subject to a variety of risks and uncertainties and other factors that could cause actual events or results to differ materially from those projected in the forward-looking statements.
The Company does not intend to, and does not assume any obligation to, update such forward-looking statements or information, other than as required by applicable law. Forward-looking statements or information involve known and unknown risks, uncertainties and other factors and are based on assumptions that may cause the actual results, level of activity, performance or achievements of the Company and its operations to be materially different from those expressed or implied by such statements. Such factors and assumptions include, among others: the ultimate impact of the COVID 19 pandemic on operations and results, fluctuations in the prices of silver and gold, fluctuations in the currency markets (particularly the Mexican peso, Chilean peso, Canadian dollar and U.S. dollar); changes in national and local governments, legislation, taxation, controls, regulations and political or economic developments in Canada and Mexico; operating or technical difficulties in mineral exploration, development and mining activities; risks and hazards of mineral exploration, development and mining (including, but not limited to environmental hazards, industrial accidents, unusual or unexpected geological conditions, pressures, cave-ins and flooding); inadequate insurance, or inability to obtain insurance; availability of and costs associated with mining inputs and labour; the speculative nature of mineral exploration and development, diminishing quantities or grades of mineral reserves as properties are mined; the ability to successfully integrate acquisitions; risks in obtaining necessary licenses and permits, and challenges to the Company's title to properties; as well as those factors described under "Risk Factors" in the Company's Annual Information Form. Although the Company has attempted to identify important factors that could cause actual results to differ materially from those contained in forward-looking statements or information, there may be other factors that cause results to be materially different from those anticipated, described, estimated, assessed or intended. There can be no assurance that any forward-looking statements or information will prove to be accurate as actual results and future events could differ materially from those anticipated in such statements or information. Accordingly, readers should not place undue reliance on forward-looking statements or information.
Qualified Person
The scientific and technical information contained in this MD&A relating to the Company's mines and mineral projects has been reviewed and approved by Dale Mah, B.Sc., P.Geo., Vice President Corporate Development of Endeavour, a Qualified Person within the meaning of NI 43-101.
OPERATING HIGHLIGHTS
|
Three Months Ended December 31 |
2020 Highlights |
Year Ended December 31 | ||||
|
2020 |
2019 |
% Change |
2020 |
2019 | % Change | |
| Production | ||||||
|
1,117,289 |
939,511 |
19% |
Silver ounces produced |
3,513,767 |
4,018,735 |
(13%) |
|
12,586 |
9,578 |
31% |
Gold ounces produced |
37,139 |
38,907 |
(5%) |
|
1,108,848 |
923,540 |
20% |
Payable silver ounces produced |
3,482,094 |
3,951,923 |
(12%) |
|
12,314 |
9,397 |
31% |
Payable gold ounces produced |
36,392 |
38,003 |
(4%) |
|
2,124,169 |
1,705,751 |
25% |
Silver equivalent ounces produced(1) |
6,484,887 |
7,131,295 |
(9%) |
|
6.83 |
13.63 |
(50%) |
Cash costs per silver ounce(2)(3) |
5.55 |
12.85 |
(57%) |
|
14.58 |
20.43 |
(29%) |
Total production costs per ounce(2)(4) |
14.01 |
20.73 |
(32%) |
|
18.52 |
23.20 |
(20%) |
All-in sustaining costs per ounce(2)(5) |
17.59 |
21.19 |
(17%) |
|
237,389 |
236,531 |
0% |
Processed tonnes |
757,160 |
954,886 |
(21%) |
|
105.07 |
110.64 |
(5%) |
Direct operating costs per tonne(2)(6) |
101.17 |
107.96 |
(6%) |
|
129.66 |
113.47 |
14% |
Direct costs per tonne(2)(6) |
114.57 |
110.09 |
4% |
|
14.83 |
15.19 |
(2%) |
Silver co-product cash costs(7) |
12.97 |
14.18 |
(9%) |
|
1,129 |
1,312 |
(14%) |
Gold co-product cash costs(7) |
1,109 |
1,238 |
(10%) |
|
Financial |
|
|
|
|||
|
60.7 |
33.5 |
81% |
Revenue(11) ($ millions) |
138.4 |
117.4 |
18% |
|
1,419,037 |
1,050,157 |
35% |
Silver ounces sold |
3,460,638 |
4,054,652 |
(15%) |
|
13,850 |
10,803 |
28% |
Gold ounces sold |
35,519 |
39,151 |
(9%) |
|
24.76 |
17.45 |
42% |
Realized silver price per ounce |
21.60 |
16.29 |
33% |
|
1,885 |
1,507 |
25% |
Realized gold price per ounce |
1,846 |
1,422 |
30% |
|
19.9 |
(17.9) |
211% |
Net earnings (loss) ($ millions) |
1.2 |
(48.1) |
102% |
|
20.8 |
(3.8) |
649% |
Mine operating earnings (loss) ($ millions) |
27.3 |
(17.4) |
257% |
|
30.2 |
4.9 |
519% |
Mine operating cash flow ($ millions)(8) |
56.2 |
14.9 |
277% |
|
21.6 |
(7.9) |
375% |
Operating cash flow before working capital changes(9) |
28.8 |
(8.9) |
424% |
|
24.3 |
(4.8) |
603% |
Earnings before ITDA(10 ) ($ millions) |
29.4 |
(11.1) |
364% |
|
70.4 |
38.4 |
83% |
Working capital ($ millions) |
70.4 |
38.4 |
83% |
|
Shareholders |
|
|
|
|||
|
0.13 |
(0.13) |
199% |
Earnings (loss) per share – basic |
0.01 |
(0.36) |
103% |
|
0.14 |
(0.06) |
250% |
Operating cash flow before working capital changes per share(9) |
0.19 |
(0.07) |
600% |
|
157,536,658 |
140,054,885 |
12% |
Weighted average shares outstanding |
150,901,598 |
135,367,129 |
11% |
(1) Silver equivalents are calculated using an 80:1 (Ag/Au) ratio.
(2) The Company reports non-IFRS measures which include cash costs net of by-product revenue on a payable silver basis, total production costs per ounce, all-in sustaining costs per ounce, direct production costs per tonne, silver co-product cash costs and gold co-product cash costs in order to manage and evaluate operating performance at each of the Company's mines. These measures, some established by the Silver Institute (Production Cost Standards, June 2011), are widely used in the silver mining industry as a benchmark for performance, but do not have a standardized meaning. These measures are reported on a production basis. See Reconciliations to IFRS beginning on page 20.
(3) Cash costs net of by-product revenue per payable silver ounce include mining, processing (including smelting, refining, transportation and selling costs), and direct overhead, net of gold credits. See Reconciliation to IFRS on pages 21 & 23.
(4) Total production costs per ounce include mining, processing (including smelting, refining, transportation and selling costs), direct overhead, amortization, depletion and amortization at the operation sites net of by product revenues. See Reconciliation to IFRS on pages 21 & 22.
(5) All-in sustaining cost per ounce include mining, processing (including smelting, refining, transportation and selling costs), direct overhead, corporate general and administration, on-site exploration, share-based compensation, reclamation and sustaining capital net of gold credits. See Reconciliation to IFRS on pages 23 & 24.
(6) Direct operating costs per tonne include mining, processing (including smelting, refining, transportation and selling costs) and direct overhead at the operation sites. Direct cost per tonne include all direct operating costs, royalties and special mining duty. See Reconciliation to IFRS on pages 21 & 22.
(7) Silver co-product cash cost and gold co-product cash cost include mining, processing (including smelting, refining, transportation and selling costs), and direct overhead allocated on pro-rated basis of realized metal value. See Reconciliation to IFRS on pages 24 and 25.
(8) Mine operating cash flow is calculated by adding back amortization, depletion, inventory write-downs and share-based compensation to mine operating earnings. Mine operating earnings and mine operating cash flow are before taxes. See Reconciliation to IFRS on page 20.
(9) See Reconciliation to IFRS on pages 20 and 21 for the reconciliation of operating cash flow before working capital changes and for the operating cash flow before working capital changes per share.
(10) See Reconciliation of Earnings before interest, taxes, depreciation and amortization on page 21.
(11) The Company changed its presentation of concentrate treatment and refining costs of sales to presenting as a reduction in revenue effective Q1 2020. The prior period revenue has been reclassified.
The above highlights are key measures used by management, however they should not be the sole measures used in determining the performance of the Company's operations.
HISTORY AND STRATEGY
The Company is engaged in silver mining in Mexico and related activities including property acquisition, exploration, development, mineral extraction, processing, refining and reclamation. The Company is also engaged in exploration activities in Chile. Since 2002, the Company's business strategy has been to focus on acquiring advanced-stage silver mining properties in Mexico. Mexico, despite its long and prolific history of metal production, appears to be relatively under-explored using modern exploration techniques and offers promising geological potential for precious metals exploration and production.
The Company's Guanaceví and Bolañitos mines acquired in 2004 and 2007, respectively, demonstrate its business model of acquiring fully built and permitted silver mines that were about to close for lack of ore. By bringing the money and expertise needed to find new silver ore-bodies, the Company successfully re-opened and expanded these mines to develop their full potential. The benefit of acquiring fully built and permitted mining and milling infrastructure is that, if new exploration efforts are successful, the mine development cycle from discovery to production only takes a matter of months instead of the several years normally required in the traditional mining business model.
In addition to operating the Guanaceví and Bolañitos mines, the Company commissioned the El Compas mine in March 2019. The Company is advancing the Terronera development project and several exploration projects in order to achieve its goal to become a premier senior producer in the silver mining sector. In 2012, the Company acquired the El Cubo silver-gold mine located in Guanajuato, Mexico, which operated until November 2019.
The Company has historically funded its acquisition, exploration and development activities through equity financings, debt facilities and convertible debentures. In recent years, the Company has financed most of its acquisition, exploration, development and operating activities from production cash flows, treasury and equity financings. The Company may choose to undertake equity, debt, convertible debt or other financings, on an as-needed basis, in order to facilitate its growth.
On March 31, 2020, the Mexican government declared a national health emergency with extraordinary measures due to the COVID-19 pandemic. Numerous health precautions were decreed, including the suspension of non-essential businesses, with only essential services to remain open. At March 31, 2020, mining did not qualify as an essential service so for the protection of the Company's staff, employees, contractors and communities, the Company suspended its three mining operations in Mexico as of April 1, 2020 as mandated by the Mexican government. The Company retained essential personnel at each mine site during the suspension period to maintain safety protocols, environmental monitoring, security measures and equipment maintenance. Essential personnel followed the Company's strict COVID-19 safety protocols and non-essential employees were sent home to self-isolate and stay healthy, while continuing to receive their base pay. The suspension of activities ceased in May 2020 as mining was declared an essential business.
The Company implemented measures to minimize the risks of the COVID-19 virus, both to employees and to the business. At each site, the Company is following government health protocols and is closely monitoring the pandemic with local health authorities. The Company has posted health advisories to educate employees about the COVID-19 symptoms, best practices to avoid contracting and spreading the virus, and procedures to follow if symptoms are experienced.
As the COVID-19 global pandemic is dynamic and, given that the ultimate duration and severity of the pandemic remains uncertain, the impact on the Company's 2021 production and costs has greater uncertainty. Globally, and in Mexico, positive COVID-19 continues to spread at a significant rate, while the duration of vaccine distributions remain uncertain. A local outbreak, an impediment to supply or market logistics or change in government health orders remains a significant risk.
The Company's long-term business could be significantly adversely affected by the on-going effects the COVID-19 pandemic. The Company cannot accurately predict the impact COVID-19 will have on third parties' ability to meet their obligations with the Company, including due to uncertainties relating to the ultimate geographic spread of the virus, the severity of the disease, the duration of the outbreak, the duration of vaccine distribution and the length of travel and quarantine restrictions imposed by governments of affected countries.
In particular, the continued spread of COVID-19 globally could materially and adversely impact the Company's business including without limitation, employee health, limitations on travel, the availability of industry experts and personnel, on-going restrictions to mining and processing operations and drill programs, and other factors that will depend on future developments beyond the Company's control. In addition, the COVID 19 pandemic could adversely affect the economies and financial markets of many countries (including those in which the Company operates), resulting in an economic downturn that could negatively impact the Company's operating results and ability to raise capital.
As of December 31, 2020, the Company held $61.1 million in cash and $70.4 million in working capital. Management believes there is sufficient working capital to meet the Company's current obligations, however the ultimate duration and severity of the COVID pandemic remains uncertain and could impact the financial liquidity of the Company.
REVIEW OF OPERATING RESULTS
The Company operates the Guanaceví, Bolañitos and El Compas mine, the last of which attained commercial production in March 2019. The Company suspended mining operations at the El Cubo mine on November 30, 2019 due to exhaustion of reserves.
Consolidated Production Results for the Three Months and Years Ended December 31, 2020 and 2019
|
Three Months Ended December 31 |
CONSOLIDATED |
Year Ended December 31 |
||||
|
2020 |
2019 |
% Change |
|
2020 |
2019 |
% Change |
|
237,389 |
236,531 |
0% |
Ore tonnes processed |
757,160 |
954,886 |
(21%) |
|
169 |
140 |
21% |
Average silver grade (gpt) |
167 |
149 |
12% |
|
86.8 |
88.3 |
(2%) |
Silver recovery (%) |
86.5 |
88.0 |
(2%) |
|
1,117,289 |
939,511 |
19% |
Total silver ounces produced |
3,513,767 |
4,018,735 |
(13%) |
|
1,108,848 |
923,540 |
20% |
Payable silver ounces produced |
3,482,094 |
3,951,923 |
(12%) |
|
1.90 |
1.53 |
24% |
Average gold grade (gpt) |
1.78 |
1.50 |
18% |
|
87.0 |
82.2 |
6% |
Gold recovery (%) |
85.9 |
84.7 |
1% |
|
12,586 |
9,578 |
31% |
Total gold ounces produced |
37,139 |
38,907 |
(5%) |
|
12,314 |
9,397 |
31% |
Payable gold ounces produced |
36,392 |
38,003 |
(4%) |
|
2,124,169 |
1,705,751 |
25% |
Silver equivalent ounces produced(1) |
6,484,887 |
7,131,295 |
(9%) |
|
6.83 |
13.63 |
(50%) |
Cash costs per silver ounce(2)(3) |
5.55 |
12.85 |
(57%) |
|
14.58 |
20.43 |
(29%) |
Total production costs per ounce(2)(4) |
14.01 |
20.73 |
(32%) |
|
18.52 |
23.20 |
(20%) |
All in sustaining cost per ounce (2)(5) |
17.59 |
21.19 |
(17%) |
|
105.07 |
110.64 |
(5%) |
Direct operating costs per tonne(2)(6) |
101.17 |
107.96 |
(6%) |
|
129.66 |
113.47 |
14% |
Direct costs per tonne(2)(6) |
114.57 |
110.09 |
4% |
|
14.83 |
15.19 |
(2%) |
Silver co-product cash costs(7) |
12.97 |
14.18 |
(9%) |
|
1,129 |
1,312 |
(14%) |
Gold co-product cash costs(7) |
1,109 |
1,238 |
(10%) |
(1) Silver equivalents are calculated using an 80:1 (Ag/Au) ratio.
(2) The Company reports non-IFRS measures which include cash costs net of by-product revenue on a payable silver basis, total production costs per ounce, all-in sustaining costs per ounce, direct production costs per tonne, silver co-product cash costs and gold co-product cash costs in order to manage and evaluate operating performance at each of the Company's mines. These measures, some established by the Silver Institute (Production Cost Standards, June 2011), are widely used in the silver mining industry as a benchmark for performance, but do not have a standardized meaning. These measures are reported on a production basis. See Reconciliations to IFRS on page 20.
(3) Cash costs net of by-product revenue per payable silver ounce include mining, processing (including smelting, refining, transportation and selling costs), and direct overhead, net of gold credits. See Reconciliation to IFRS on pages 21 & 23.
(4) Total production costs per ounce include mining, processing (including smelting, refining, transportation and selling costs), direct overhead, amortization, depletion and amortization at the operation sites net of by product revenues. See Reconciliation to IFRS on pages 21 & 23.
(5) All-in sustaining costs per ounce include mining, processing (including smelting, refining, transportation and selling costs), direct overhead, corporate general and administration, on-site exploration, share-based compensation, reclamation and sustaining capital net of gold credits. See Reconciliation to IFRS on pages 23 & 24.
(6) Direct operating costs per tonne include mining, processing (including smelting, refining, transportation and selling costs) and direct overhead at the operation sites. Direct cost per tonne include all direct operating costs, royalties and special mining duty. See Reconciliation to IFRS on pages 21 & 22.
(7) Silver co-product cash cost and gold co-product cash cost include mining, processing (including smelting, refining, transportation and selling costs), and direct overhead allocated on pro-rated basis of realized metal value. See Reconciliation to IFRS on pages 24 & 25.

(1) Silver equivalents are calculated using an 80:1 (Ag/Au) ratio.
Consolidated Production
Three months ended December 31, 2020 (compared to the three months ended December 31, 2019)
Consolidated silver production during Q4, 2020 was 1,117,289 ounces (oz), an increase of 19% compared to 939,511 oz in Q4, 2019, and gold production was 12,586 oz, an increase of 31% compared to 9,578 oz in Q4, 2019. Plant throughput was 237,389 tonnes at average grades of 169 grams per tonne (gpt) silver and 1.90 gpt gold, with the throughput tonnes similar to 236,531 tonnes grading 140 gpt silver and 1.53 gpt gold in Q4, 2019. Consolidated silver production in Q4, 2020 was significantly higher than Q4, 2019 due to the higher ore grades primarily from the Guanaceví mine, partially offset by lower in silver grade ore at Bolañitos. Mining the new, higher grade orebodies at Guanaceví resulted in higher mine output and higher ore grades.
Excluding El Cubo, which ceased operations in Q4, 2019, Q4, 2020 production increased significantly due to the improved plant throughput and ore grades at Guanaceví and improved throughput at Bolañitos.
Year ended December 31, 2020 (compared to the year ended December 31, 2019)
Consolidated silver production during 2020 was 3,513,767 oz, a decrease of 13% compared to 4,018,735 oz in 2019, and gold production was 37,139 oz, a decrease of 5% compared to 38,907 oz. Plant throughput was 757,160 tonnes at average grades of 167 gpt silver and 1.78 gpt gold, a 21% reduction compared to 954,886 tonnes grading 149 gpt silver and 1.50 gpt gold in 2019. Consolidated silver and gold production were lower than 2019 due to the suspension of mining activities in April and part of May due to the COVID-19 pandemic and the suspension of operations at the El Cubo mine, related to lack of ore, in November 2019.
Excluding El Cubo, 2020 production was higher despite the suspension of activities. Improved performance at Guanaceví and production from El Compas, which declared commercial production in late March 2019, were partially offset by the lower silver production from Bolañitos.
The Company's 2020 full year production met original guidance notwithstanding the government mandated two-month suspension of operations due to the pandemic. The Company withdrew its 2020 production guidance in early April due to the COVID-19 pandemic and the temporary shutdown mandated by the Mexican government and chose not to issue revised guidance when production was resumed at the end of May due to continued uncertainty caused by the ongoing pandemic. Despite the temporary shutdown in Q2, 2020, annual silver production exceeded the high range of original guidance by 1%, gold production missed the low range by 2% and silver equivalent production achieved the mid-point of the original 2020 production guidance.
Consolidated Operating Costs
Three months ended December 31, 2020 (compared to the three months ended December 31, 2019)
Direct production costs per tonne in Q4, 2020 increased 14%, to $129.66 compared with Q4, 2019 despite improved productivity at Guanaceví and Bolañitos. Costs on a per tonne basis increased due to higher royalty and purchased toll ore at the Guanaceví operation offset by lower costs incurred at the Bolanitos and El Compas operations. Direct operating costs per tonne, which excludes royalties and special mining duties was $105.07 per tonne compared to $110.64 in Q4, 2019.
Consolidated cash costs per oz, net of by-product credits (a non-IFRS measure and a standard of the Silver Institute) decreased 50% to $6.83. The cash cost decrease was driven by higher ore grades, a higher proportion of gold production, and rising gold price, which increased 25% compared to the same period ended in 2019. Royalties and special mining duty amounted to $5.27 per consolidated ounce, compared to $0.72 per consolidated ounce in Q4, 2019.
On a co-product cash costs basis silver cost per ounce was relatively flat compared to the Q4, 2019. Silver co-product cash costs fell 2% to $14.83 per ounce, while gold co-product costs fell 14% to $1,129 per ounce. The 2020 productivity improvements and higher ore grades were offset by higher royalty and special mining duty costs primarily at the Guanaceví mine. Gold co-product cash costs decreased to a greater extent as gold ore grades increased 24% and gold recoveries improved 6%.
All-in sustaining costs decreased 20% to $18.52 per oz in Q4, 2020 as a result of lower operating costs offset by higher corporate general and administrative costs and increased capital expenditures to accelerate mine development to improve daily mine output. General and administrative costs increased due to mark to market effects of deferred share units.
A Company-wide review of operations in 2019 identified several deficiencies in the operating performance. As a result, management initiated multiple remedial measures including changes of mine-site management and mining contractors, changes to shift and contractor supervision, renting used mining equipment, leasing new mining equipment and reducing the work force.
The goal of these remedial actions was to improve safety, improve productivity, reduce operating costs and generate free cash flow. Management notes that the remedial actions had a positive impact on mine operating performance with the benefit of these initiatives realized in 2020. The results of these improvements were moderated by increased health protocols and new government restrictions related to the COVID 19 global pandemic. Additionally, the increased precious metal prices increased royalty costs in Q4, 2020, muting the positive impact these initiatives have had on costs. The consolidated royalty expense increased $3.5 million and special mining duty increased $1.7 million compared to Q4, 2019.
Year ended December 31, 2020 (compared to the year ended December 31, 2019)
Direct production costs per tonne in 2020 increased 4%, to $114.57 compared with 2019 due to higher royalties, special mining duties and toll ore purchases offset by improved productivity at the Guanaceví and Bolañitos operation, the depreciation of the Mexican Peso and the exclusion of the El Cubo operation, which suspended activities in Q4, 2019. Direct operating costs per tonne, which excludes royalties and special mining duties was $101.17 per tonne compared to $108.49 in 2019.
Consolidated cash costs per oz, net of by-product credits decreased 57% to $5.55 primarily due to higher ore grades and higher a realized gold price that increased the by-product credit compared to 2019. All-in sustaining cost decreased 17% to $17.59 per oz in 2020 as a result of lower operating costs offset by higher corporate general and administrative costs and increased capital expenditures to accelerate mine development. The cash portion of general and administrative costs increased $3.0 million primarily due to a $3.6 million expense related the mark to market of deferred share units.
On a co-product cash costs basis, both silver and gold cost per ounce improved compared to 2019. Silver co-product cash costs fell 9%, while gold co-product costs fell 10% to $12.97 per ounce and $1,109 per ounce respectively. The improvement was driven by items as described for direct production costs and the higher grade ore.
The Company retained essential personnel at its operations during the suspension period to maintain safety protocols, environmental monitoring, security measures and day-to-day maintenance. Non-essential employees were sent home to self-isolate and continued to receive their base pay. From April 1st until the May re-starts, $2.2 million of costs were incurred related to the suspension of operations and were allocated to care and maintenance expenses and excluded from mine operating costs or the corresponding metrics.
A Company-wide review of operations in 2019 identified several deficiencies in the operating performance. As a result, management initiated multiple remedial measures including changes of mine-site management and mining contractors, changes to shift and contractor supervision, renting used mining equipment, leasing new mining equipment and reducing the work force.
The goal of these remedial actions was to improve safety, improve productivity, reduce operating costs and generate free cash flow. Management notes that the remedial actions had a positive impact on mine operating performance with the benefit of these initiatives realized in 2020. The results of these improvements were moderated by the additional costs and inefficiencies from suspension and the re-start of mining activities in Q2, 2020 as well as increased health protocols and new government restrictions related to the COVID 19 global pandemic. Additionally, the increased precious metal prices increased royalty costs in 2020, muting the positive impact these initiatives have had on cost metrics. At Guanaceví, the royalty costs increased $6.0 million and special mining duty increased $1.6 million compared to 2019.
GUANACEVÍ OPERATIONS
The Guanaceví operation is currently producing from three underground silver-gold mines along a five kilometre length of the prolific Santa Cruz vein. Guanaceví provides steady employment to over 500 people and engages over 400 contractors. Guanaceví mine production operated below plant capacity due to the operational issues in 2019. The development of two new orebodies, Milache and SCS and the acquisition of the Ocampo concession rights have provided sufficient ore and flexibility to increase mine output and to reach designed plant capacity. The Company successfully drilled the projected extensions of the previously mined Porvenir Cuatro and Porvenir ore bodies onto the Ocampo concessions. The Company commenced mining from the Porvenir Cuatro extension (P4E) and the Porvenir extension (PNE) late in 2019 and has steadily increased mine output throughout 2020.
During 2019, the Company acquired a 10 year right to explore and exploit the El Porvenir and El Curso concessions from Ocampo Mining SA de CV ("Ocampo"), a subsidiary of Grupo Frisco. The Company agreed to meet certain minimum production targets from the properties, subject to various terms and conditions and pay Ocampo a $12 fixed per tonne production payment plus a floating net smelter return royalty based on the spot silver price. The Company pays a 4% royalty on sales below $15.00 per ounce, 9% above $15.00 per ounce 13% above $20.00 per silver ounce, and a maximum 16% above $25 per silver ounce, based on then current realized prices.
Production Results for the Three Months and Years Ended December 31, 2020 and 2019
|
Three Months Ended December 31 |
GUANACEVÍ |
Year Ended December 31 |
||||
|
2020 |
2019 |
% Change |
|
2020 |
2019 |
% Change |
|
106,425 |
92,323 |
15% |
Ore tonnes processed |
346,679 |
322,988 |
7% |
|
331 |
252 |
31% |
Average silver grade (g/ t) |
314 |
234 |
34% |
|
87.6 |
90.0 |
(3%) |
Silver recovery (%) |
87.7 |
90.6 |
(3%) |
|
991,697 |
673,559 |
47% |
Total silver ounces produced |
3,071,075 |
2,202,592 |
39% |
|
988,722 |
671,051 |
47% |
Payable silver ounces produced |
3,061,982 |
2,196,475 |
39% |
|
1.01 |
0.75 |
35% |
Average gold grade (g/ t) |
0.96 |
0.65 |
48% |
|
92.5 |
91.0 |
2% |
Gold recovery (%) |
91.7 |
90.2 |
2% |
|
3,198 |
2,025 |
58% |
Total gold ounces produced |
9,814 |
6,087 |
61% |
|
3,188 |
2,027 |
57% |
Payable gold ounces produced |
9,786 |
6,081 |
61% |
|
1,247,537 |
835,559 |
49% |
Silver equivalent ounces produced(1) |
3,856,195 |
2,689,552 |
43% |
|
13.21 |
13.54 |
(2%) |
Cash costs per silver ounce(2)(3) |
10.44 |
15.87 |
(34%) |
|
15.52 |
16.83 |
(8%) |
Total production costs per ounce(2)(4) |
13.36 |
22.15 |
(40%) |
|
19.67 |
19.48 |
1% |
All in sustaining cost per ounce (2)(5) |
17.14 |
22.86 |
(25%) |
|
129.91 |
123.70 |
5% |
Direct operating costs per tonne(2)(6) |
117.38 |
130.78 |
(10%) |
|
179.34 |
131.56 |
36% |
Direct costs per tonne(2)(6) |
143.46 |
135.14 |
6% |
|
15.45 |
14.32 |
8% |
Silver co-product cash costs(7) |
12.72 |
15.97 |
(20%) |
|
1,176 |
1,236 |
(5%) |
Gold co-product cash costs(7) |
1,087 |
1,394 |
(22%) |
(1) Silver equivalents are calculated using an 80:1 (Ag/Au) ratio.
(2) The Company reports non-IFRS measures which include cash costs net of by-product revenue on a payable silver basis, total production costs per ounce, all-in sustaining costs per ounce and direct production costs per tonne, in order to manage and evaluate operating performance at each of the Company's mines. These measures, some established by the Silver Institute (Production Cost Standards, June 2011), are widely used in the silver mining industry as a benchmark for performance, but do not have a standardized meaning. These measures are reported on a production basis. See Reconciliation to IFRS on page 20.
(3) Cash costs net of by-product revenue per payable silver ounce include mining, processing (including smelting, refining, transportation and selling costs), and direct overhead, net of gold credits. See Reconciliation to IFRS on pages 21 & 22.
(4) Total production costs per ounce include mining, processing (including smelting, refining, transportation and selling costs), direct overhead, amortization, depletion and amortization at the operation sites net of by product revenues. See Reconciliation to IFRS on pages 21 & 22.
(5) All-in sustaining cost per ounce include mining, processing (including smelting, refining, transportation and selling costs), direct overhead, corporate general and administration, on-site exploration, share-based compensation, reclamation and sustaining capital net of gold credits. See Reconciliation to IFRS on pages 23 & 25.
(6) Direct operating costs per tonne include mining, processing (including smelting, refining, transportation and selling costs) and direct overhead at the operation sites. Direct cost per tonne include all direct operating costs, royalties and special mining duty. See Reconciliation to IFRS on pages 21 & 22.
(7) Silver co-product cash cost and gold co-product cash cost include mining, processing (including smelting, refining, transportation and selling costs), and direct overhead allocated on pro-rated basis of realized metal value. See Reconciliation to IFRS on pages 21 & 22.
Guanaceví Production Results
Three months ended December 31, 2020 (compared to the three months ended December 31, 2019)
Silver production at the Guanaceví mine during Q4, 2020 was 991,697 oz, an increase of 47% compared to 673,559 oz in Q4, 2019, and gold production was 3,198 oz, an increase of 58% compared to 2,025 oz in Q4, 2019. Plant throughput was 106,425 tonnes at average grades of 331 gpt silver and 1.01 gpt gold, compared to 92,323 tonnes grading 252 gpt silver and 0.75 gpt gold in Q4, 2019, a 15% increase in plant throughput. Mining the new, higher grade El Curso, Milache and SCS orebodies resulted in higher mine output, higher ore grades and ultimately, significantly higher silver and gold production compared to Q4, 2019.
Year ended December 31, 2020 (compared to the year ended December 31, 2019)
Silver production at the Guanaceví mine for year ended December 31, 2020 was 3,071,075 oz, an increase of 39% compared to 2,202,592 oz and gold production was 9,814 oz, an increase of 61% compared to 6,087 oz in 2019, despite the operations being temporarily suspended for April and part of May. Plant throughput was 346,679 tonnes at average grades of 314 gpt silver and 0.96 gpt gold, compared to 322,988 tonnes grading 234 gpt silver and 0.65 gpt gold for 2019. Metal production increased compared to 2019 primarily due to higher ore grades and 7% increase in throughput. Mine output and ore grades increased as a result of operational changes and increased access to the higher grade ores in the Milache, SCS and Porvenir Cuatro Extension (P4E) orebodies. These areas replaced production from the lower grade Porvenir Norte and Santa Cruz orebodies, which are now closed.
Management guided 2020 production at the Guanaceví mine to range from 2.4 to 2.7 million oz silver and 6,000 to 7,000 oz gold prior to the withdrawal of guidance on April 2, 2020. The Company withdrew its 2020 production guidance in early April due to the COVID-19 pandemic and the temporary shutdown mandated by the Mexican government and chose not to issue revised guidance when production was resumed at the end of May due to continued uncertainty caused by the ongoing pandemic. The Guanacevi mine significantly exceeded the withdrawn guidance notwithstanding the government mandated two-month suspension of operations due to the pandemic. Higher grade ores compared to plan in the SCS and P4E orebodies was the primary factor for exceeding original guidance.
Guanaceví Operating Costs
Three months ended December 31, 2020 (compared to the three months ended December 31, 2019)
Direct production costs per tonne for the three months ended December 31, 2020 increased 36% to $179.34 compared with the same period in 2019. Mining, processing and indirect costs improved on per tonne basis compared to prior year, however royalties paid for ore mined from the Porvenir Cuatro extension increased substantially, a higher proportion of third party ore was purchased and improved profitability resulted in special mining duties paid to the government. Increased production from the Porvenir Cuatro extension with rising precious metal prices resulted in $4.2 million of royalty costs, a $3.5 million increase compared to the same period in 2019. The higher price environment has resulted in increased ore available for purchase from toll miners within the district. During Q4, 2020 15% of tonnes processed were purchased from local miners at total cost of $2.0 million. At current prices, the ore purchased is more expensive than ore mined by the Company, however numerous peripheral benefits resulted in the decision to purchase a higher proportion of local ore, with the excess mined ore stockpiled in the quarter. The improved profitability of the operations resulted in $1.1 million Mexico special mining duty during Q4, 2020 compared to nil in Q4, 2019 which are included in cost per tonne and ounce metrics. Direct operating costs per tonne, which excludes royalties and special mining duties was $129.91 per tonne compared to $123.70 in Q4, 2019.
Cash costs per oz, net of by-product credits (a non-IFRS measure and a standard of the Silver Institute) were $13.21, 2% lower due to higher metal grades and a higher gold credit, offset by the higher costs per tonne described above. Similarly, all-in sustaining cost was relatively flat, increasing 1% to $19.67 per oz for the three months ended December 31, 2020. Lower operating costs on a per ounce basis were offset by higher general and administration costs and capital expenditures compared to the same period in 2019. On an absolute basis, capital expenditures increased as new ore bodies continued to be developed, and higher allocation of increased general and administrative costs further offset the operational gains. General and administrative costs increased due to the effect of the mark to market of deferred share units.
Year ended December 31, 2020 (compared to the year ended December 31, 2019)
Direct production costs per tonne for the year ended December 31, 2020 increased 6% compared with 2019. Operating costs improved on per tonne basis compared to prior year, however royalties paid for ore mined from the Porvenir Cuatro extension increased substantially, a higher proportion of third party ore was purchased and improved profitability resulted in special mining duties paid to the government. Increased production from the Porvenir Cuatro extension with rising precious metal prices resulted in $7.4 million of royalty costs, a $6.0 million increase compared to the same period in 2019. The higher price environment has resulted in increased ore available for purchase from toll miners within the district. During 2020 12% of tonnes processed were purchased from local miners compared to 6% in 2019.
At current prices, the ore purchased is more expensive than ore mined by the Company, however numerous peripheral benefits resulted in the decision to purchase a higher proportion of local ore, with the excess mined ore stockpiled. The improved profitability of the operations resulted in $1.6 million Mexico special mining duty during 2020 compared to nil in 2019 which are included in cost per tonne and ounce metrics. Direct operating costs per tonne, which excludes royalties and special mining duties was $117.38 per tonne compared to $130.78 in Q4, 2019.
Cash costs per oz, net of by-product credits were $10.44, 34% lower 2019, despite the higher direct cost per tonne, as significantly higher metal grades and higher gold credit reduced this cost metric. Similarly, all-in sustaining costs fell 25% to $17.14 per oz for 2020. The decrease in cash costs per ounce was the primary driver of the lower all in sustaining costs, which were offset by a larger allocation of increased general and administration expenses compared to the same period in 2019. Consolidated general and administrative costs increased $3.0 million primarily due to a $3.6 million mark to market expense of deferred share units, amounting to a $2.2 million allocation increase to Guanacevi production costs.
The Company retained essential personnel at Guanaceví during the suspension period to maintain safety protocols, environmental monitoring, security measures and day-to-day maintenance. Non-essential employees were sent home to self-isolate and continued to receive their base pay. These costs incurred from April 1st to early May totaled $0.9 million and were allocated to care and maintenance expenses and excluded from mine operating costs and the corresponding metrics.
BOLAÑITOS OPERATIONS
The Bolañitos operation encompasses three underground silver-gold mines and a flotation plant. Bolañitos provides steady employment for over 360 people and engages over 260 contractors.
Production Results for the Three Months and Years Ended December 31, 2020 and 2019
|
Three Months Ended December 31 |
BOLAÑITOS |
Year Ended December 31 |
||||
|
2020 |
2019 |
% Change |
|
2020 |
2019 |
% Change |
|
107,332 |
82,147 |
31% |
Ore tonnes processed |
331,174 |
316,708 |
5% |
|
34 |
51 |
(33%) |
Average silver grade (g/ t) |
40 |
73 |
(45%) |
|
84.7 |
81.6 |
4% |
Silver recovery (%) |
83.0 |
84.1 |
(1%) |
|
99,417 |
109,963 |
(10%) |
Total silver ounces produced |
353,318 |
624,942 |
(43%) |
|
94,526 |
103,348 |
(9%) |
Payable silver ounces produced |
333,293 |
603,903 |
(45%) |
|
2.22 |
1.81 |
23% |
Average gold grade (g/ t) |
2.02 |
1.69 |
20% |
|
88.2 |
85.5 |
3% |
Gold recovery (%) |
88.2 |
85.9 |
3% |
|
6,754 |
4,088 |
65% |
Total gold ounces produced |
18,963 |
14,779 |
28% |
|
6,551 |
4,008 |
63% |
Payable gold ounces produced |
18,429 |
14,380 |
28% |
|
639,737 |
437,003 |
46% |
Silver equivalent ounces produced (1) |
1,870,358 |
1,807,262 |
3% |
|
(44.56) |
4.82 |
(1,025%) |
Cash costs per silver ounce(2)(3) |
(32.11) |
6.72 |
(578%) |
|
(15.50) |
14.44 |
(207%) |
Total production costs per ounce(2)(4) |
(4.76) |
12.78 |
(137%) |
|
16.98 |
38.38 |
(56%) |
All in sustaining cost per ounce (2)(5) |
23.53 |
25.11 |
(6%) |
|
71.88 |
79.89 |
(10%) |
Direct operating costs per tonne(2)(6) |
70.11 |
77.31 |
(9%) |
|
75.82 |
80.66 |
(6%) |
Direct costs per tonne(2)(6) |
71.78 |
77.88 |
(8%) |
|
13.26 |
14.31 |
(7%) |
Silver co-product cash costs(7) |
12.04 |
12.88 |
(7%) |
|
1,010 |
1,236 |
(18%) |
Gold co-product cash costs(7) |
1,029 |
1,124 |
(8%) |
(1) Silver equivalents are calculated using an 80:1 (Ag/Au) ratio.
(2) The Company reports non-IFRS measures which include cash costs net of by-product revenue on a payable silver basis, total production costs per ounce, all-in sustaining costs per ounce and direct production costs per tonne, in order to manage and evaluate operating performance at each of the Company's mines. These measures, some established by the Silver Institute (Production Cost Standards, June 2011), are widely used in the silver mining industry as a benchmark for performance, but do not have a standardized meaning. These measures are reported on a production basis. See Reconciliation to IFRS on page 20.
(3) Cash costs net of by-product revenue per payable silver ounce include mining, processing (including smelting, refining, transportation and selling costs), and direct overhead, net of gold credits. See Reconciliation to IFRS on pages 21 & 22.
(4) Total production costs per ounce include mining, processing (including smelting, refining, transportation and selling costs), direct overhead, amortization, depletion and amortization at the operation sites net of by product revenues. See Reconciliation to IFRS on pages 21 & 22.
(5) All-in sustaining cost per ounce include mining, processing (including smelting, refining, transportation and selling costs), direct overhead, corporate general and administration, on-site exploration, share-based compensation, reclamation and sustaining capital net of gold credits. See Reconciliation to IFRS on pages 23 & 25.
(6) Direct operating costs per tonne include mining, processing (including smelting, refining, transportation and selling costs) and direct overhead at the operation sites. Direct cost per tonne include all direct operating costs, royalties and special mining duty. See Reconciliation to IFRS on pages 21 & 22.
(7) Silver co-product cash cost and gold co-product cash cost include mining, processing (including smelting, refining, transportation and selling costs), and direct overhead allocated on pro-rated basis of realized metal value. See Reconciliation to IFRS on pages 24 & 25.
Bolañitos Production Results
Three months ended December 31, 2020 (compared to the three months ended December 31, 2019)
Silver production at the Bolañitos mine was 99,417 oz in Q4, 2020, a decrease of 10% compared to 109,963 oz in Q4, 2019, and gold production was 6,754 oz in Q4, 2020, an increase of 65% compared to 4,088 oz in Q4, 2019. Plant throughput in Q4, 2020 was 107,332 tonnes at average grades of 34 gpt silver and 2.22 gpt gold, compared to 82,147 tonnes grading 51 gpt silver and 1.81 gpt gold in Q4, 2019. Since 2019, management has focused to increase mine development, replaced its mining fleet and increased workforce training to improve throughput to expected capacity of the operation. These initiatives resulted in the improved throughput compared to Q4, 2019. Normal variations of the ore body have resulted in ore with higher gold grade and lower silver grade compared to Q4, 2019.
Year ended December 31, 2020 (compared to the year ended December 31, 2019)
Silver production at the Bolañitos mine was 353,318 oz for 2020, a decrease of 43% compared to 624,942 oz in 2019, and gold production was 18,963 oz for 2020, an increase of 28% compared to 14,779 oz in 2019. Plant throughput was 331,174 tonnes at average grades of 40 gpt silver and 2.02 gpt gold, compared to 316,708 tonnes grading 73 gpt silver and 1.69 gpt gold for the same period in 2019. Throughput was higher compared to 2019 despite the suspension of mining activities under the Mexican health decree. Since 2019, mine management has focused to increase mine development, replaced its mining fleet and increased workforce training to improve throughput to expected capacity of the operation. These initiatives resulted in a gradual improvement of daily throughput over fiscal 2020 and exceeded plan in Q4, 2020. Ore was mined in areas with lower silver grades compared to historical grades, while gold grades are similar to historical grades and plan. The development of the San Miguel vein, which was behind plan, was expected to provide higher silver grade material during 2020. Production from the San Miguel vein is expected to increase in 2021.
Management guided 2020 production at the Bolañitos mine to range from 0.5 to 0.6 million oz silver and 22,000 to 25,000 oz gold prior to the withdrawal of guidance on April 2, 2020. The Company withdrew its 2020 production guidance in early April due to the COVID-19 pandemic and the temporary shutdown mandated by the Mexican government and chose not to issue revised guidance when production was resumed at the end of May due to continued uncertainty caused by the ongoing pandemic. On a pro-rated basis, the Bolañitos mine throughput was slightly below plan, while gold production would have met the low range of the guided production. Silver production would have missed the low range of the guided production due to the lower silver grades mined than anticipated.
Bolañitos Operating Costs
Three months ended December 31, 2020 (compared to the three months ended December 31, 2019)
Direct production costs per tonne in the three month period ended December 31, 2020 decreased 6% to $75.82 per tonne due to operational improvements, including lower costs gained from new mobile equipment offset by increased special mining duties. The significantly lower silver grades resulted in lower silver production, while cash costs net of by-product credits (which is a non-IFRS measure and a standard of the Silver Institute), were negative $44.56 per oz of payable silver in Q4, 2020 compared to positive $4.82 per oz in Q4, 2019. The higher proportion of gold production, and rising gold price which increased 41% compared to the same period 2019, were the primary drivers in the lower cash cost metric.
On a co-product cash costs basis, both silver and gold cost per ounce improved compared to Q4, 2019. Silver co-product cash costs fell 7%, while gold co-product costs fell 18% to $13.26 per ounce and $1,010 per ounce respectively. The improvement was primarily driven by the lower direct costs per tonne, the variation in ore grades and improved recoveries.
All-in sustaining costs (also a non-IFRS measure) decreased in Q4, 2020 to $16.98 per oz due to the improved operating costs. The improved operating costs were partially offset by higher capital expenditures and higher general and administrative costs in Q4, 2020 compared to Q4, 2019. The Company continues to focus on mine development to improve stope access and provide flexibility for future periods. General and administrative costs increased due to mark to market deferred share units.
Year ended December 31, 2020 (compared to the year ended December 31, 2019)
Direct production costs per tonne for 2020 decreased 8% to $71.78 per tonne due to operational improvements, including lower maintenance costs incurred from new mobile equipment offset by the additional costs required for the re-start of operating activities in May. Silver cash costs net of by-product credits (which is a non-IFRS measure and a standard of the Silver Institute), were negative $32.11 per oz of payable silver in 2020 compared to positive $6.72 per oz in 2019. The higher proportion of gold production, and rising gold price which increased 27% compared to 2019, were the primary drivers in the lower cash cost net of by-product credits metric.
On a co-product cash costs basis, silver cost per ounce improved compared to 2019. Silver co-product cash costs fell 7% to $12.04 as lower direct costs per tonne were offset by lower silver grade ore compared to prior period. Gold co-product costs decreased 8% to $1,029 per ounce primarily due to the lower direct costs per tonne and a 20% increase of ore gold grade.
All-in sustaining costs (also a non-IFRS measure) were $23.53 per oz, a 6% decrease compared to 2019. The lower operating costs were partially offset by increased capital expenditures and higher general and administration cost allocation in 2020 compared to 2019. The Company invested in new mine equipment to improve fleet operating costs and equipment availability and increase mine development in 2020 to improve stope access and provide operating flexibility. Consolidated general and administrative costs increased $3.0 million primarily due to a $3.6 million mark to market expense of deferred share units, amounting to a $1.0 million allocation increase to Bolanitos production costs.
The Company retained essential personnel at Bolañitos during the suspension period to maintain safety protocols, environmental monitoring, security measures and day-to-day maintenance. Non-essential employees were sent home to self-isolate and continued to receive their base pay. These costs incurred from April 1st to late May totaled $0.8 million and were allocated to care and maintenance expenses and not included in operating costs or the corresponding metrics.
EL COMPAS OPERATIONS
The El Compas operation is a small but high grade, permitted gold-silver mine with a small leased flotation plant in the historic silver mining district of Zacatecas, with good exploration potential to expand resources and scale up production. There is also potential for the Company to acquire other properties in the area to consolidate resources and exploration targets in the district. El Compas has a nominal plant capacity of 250 tonnes per day.
El Compas currently employs close to 200 people and engages over 50 contractors and achieved commercial production during Q1, 2019. The current resource is sufficient to support mining until mid-2021, and brownfields exploration has returned encouraging results on the Calicanto property. Management is reviewing alternative mine plans to ensure positive free cash flow in 2021.
Production Results for the Three Months and Years Ended December 31, 2020 and 2019
|
Three Months Ended December 31 |
El Compas |
Year Ended December 31 |
||||
|
2020 |
2019 |
% Change |
|
2020 |
2019 |
% Change |
|
23,632 |
22,855 |
3% |
Ore tonnes processed |
79,307 |
69,772 |
14% |
|
50 |
65 |
(23%) |
Average silver grade (g/ t) |
53 |
75 |
(29%) |
|
68.9 |
70.2 |
(2%) |
Silver recovery (%) |
66.1 |
62.0 |
7% |
|
26,175 |
33,518 |
(22%) |
Total silver ounces produced |
89,374 |
104,377 |
(14%) |
|
25,600 |
31,941 |
(20%) |
Payable silver ounces produced |
86,819 |
100,243 |
(13%) |
|
4.41 |
4.33 |
2% |
Average gold grade (g/ t) |
4.32 |
4.37 |
(1%) |
|
78.6 |
72.2 |
9% |
Gold recovery (%) |
75.9 |
77.3 |
(2%) |
|
2,634 |
2,298 |
15% |
Total gold ounces produced |
8,362 |
7,577 |
10% |
|
2,575 |
2,193 |
17% |
Payable gold ounces produced |
8,177 |
7,342 |
11% |
|
236,895 |
217,358 |
9% |
Silver equivalent ounces produced(1) |
758,334 |
710,537 |
7% |
|
(50.04) |
10.90 |
(559%) |
Cash costs per silver ounce(2)(3) |
(22.51) |
(7.74) |
(191%) |
|
89.45 |
52.82 |
69% |
Total production costs per ounce(2)(4) |
109.10 |
58.70 |
86% |
|
(20.19) |
47.68 |
(142%) |
All in sustaining cost per ounce (2)(5) |
10.98 |
27.49 |
(60%) |
|
143.96 |
154.58 |
(7%) |
Direct operating costs per tonne(2)(6) |
160.04 |
139.53 |
15% |
|
150.52 |
160.01 |
(6%) |
Direct costs per tonne(2)(6) |
166.97 |
143.70 |
16% |
|
15.69 |
15.76 |
(0%) |
Silver co-product cash costs(7) |
16.47 |
13.09 |
26% |
|
1,194 |
1,361 |
(12%) |
Gold co-product cash costs(7) |
1,408 |
1,143 |
23% |
(1) Silver equivalents are calculated using an 80:1 (Ag/Au) ratio.
(2) The Company reports non-IFRS measures which include cash costs net of by-products on a payable silver basis, total production costs per ounce, all-in sustaining costs per ounce and direct production costs per tonne, in order to manage and evaluate operating performance at each of the Company's mines. These measures, some established by the Silver Institute (Production Cost Standards, June 2011), are widely used in the silver mining industry as a benchmark for performance, but do not have a standardized meaning. These measures are reported on a production basis. See Reconciliation to IFRS on page 20.
(3) Cash costs net of by-product revenue per payable silver ounce include mining, processing (including smelting, refining, transportation and selling costs), and direct overhead, net of gold credits. See Reconciliation to IFRS on pages 21 & 22.
(4) Total production costs per ounce include mining, processing (including smelting, refining, transportation and selling costs), direct overhead, amortization, depletion and amortization at the operation sites net of by product revenues. See Reconciliation to IFRS on pages 21 & 22.
(5) All-in sustaining cost per ounce include mining, processing (including smelting, refining, transportation and selling costs), direct overhead, corporate general and administration, on-site exploration, share-based compensation, reclamation and sustaining capital net of gold credits. See Reconciliation to IFRS on pages 23 & 24.
(6) Direct operating costs per tonne include mining, processing (including smelting, refining, transportation and selling costs) and direct overhead at the operation sites. Direct cost per tonne include all direct operating costs, royalties and special mining duty. See Reconciliation to IFRS on pages 21 & 22.
(7) Silver co-product cash cost and gold co-product cash cost include mining, processing (including smelting, refining, transportation and selling costs), and direct overhead allocated on pro-rated basis of realized metal value. See Reconciliation to IFRS on pages 24 & 25.
El Compas Production Results
Three months ended December 31, 2020 (compared to the three months ended December 31, 2019)
Silver production at the El Compas mine was 26,175 oz in Q4, 2020, a decrease of 22% compared to 33,518 oz in Q4, 2019 and gold production was 2,634 oz in Q4, 2020, an increase of 15% compared to 2,298 in Q4, 2019. Plant throughput in Q4, 2020 was 23,632 tonnes at average grades of 50 gpt silver and 4.41 gpt gold compared to 22,855 tonnes at average grades of 65 gpt silver and 4.33 gpt gold. El Compas silver grades were lower than Q4, 2019 due to variations in the ore body.
Year ended December 31, 2020 (compared to the year ended December 31, 2019)
Silver production at the El Compas mine was 89,374 oz and gold production was 8,362 oz in 2020. Plant throughput in 2020 was 79,307 tonnes at average grades of 53 gpt silver and 4.32 gpt gold.
As commercial production was declared March 15, 2019, the 2019 comparative period does not include a full year of production. During the period from March 15, 2019 to December 31, 2019 silver production at the El Compas mine was 104,377 oz and gold production was 7,577 oz with plant throughput of 69,772 tonnes at average grades of 75 gpt silver and 4.37 gpt gold during this period in 2019. Similarly, due to the Mexican health decree 2020 does not include a full year of production. Throughput was lower than planned due to the suspension of mining activities under the Mexican health decree. El Compas production was close to plan prior to the suspension with higher throughput offset by lower grades. Management replaced the mining contractor with new mine employees in March 2020 and adjusted the mining methods to reduce dilution and costs going forward. Management finished replacing the mining contractor with new employees in June 2020, but dilution remains a continuing focus for improvement.
Management guided 2020 production at the El Compas mine to range from 0.1 to 0.2 million oz silver and 10,000 to 12,000 oz gold prior to the withdrawal of guidance on April 2, 2020. The Company withdrew its 2020 production guidance in early April due to the COVID-19 pandemic and the temporary shutdown mandated by the Mexican government and chose not to issue revised guidance when production was resumed at the end of May due to continued uncertainty caused by the ongoing pandemic. On a pro-rated basis, the El Compas mine throughput was slightly above plan, while metal production would have met the low range of the guided production.
El Compas Operating Costs
Three months ended December 31, 2019
Direct production costs were $150.52 per tonne in Q4, 2020, a 6% decrease from Q4, 2019. On re-start of the mine in May, the Company invested in employee training to improve dilution and grade control. Silver cash costs net of by-product credits (which is a non-IFRS measure and a standard of the Silver Institute), were negative $50.04 per oz of payable silver in Q4, 2020 compared to $10.90 per oz in Q4, 2019. The lower costs per tonne and rising gold prices which increased 41% were the primary drivers in the lower cash cost metric offset by lower silver grades compared to 2019.
On a co-product cash costs basis, both silver and gold cost per ounce improved compared to the Q4, 2019. Silver co-product cash costs decreased minimally, while gold co-product costs fell 12% to $15.69 per ounce and $1,194 per ounce respectively. The improved costs were driven by the lower operating costs on a per tonne basis, offset by the lower silver grade ore.
All-in sustaining costs (also a non-IFRS measure) decreased in Q4, 2020 to negative $20.19 per oz due compared to $47.68 per ounce over the same period ended in 2019. The lower all-in sustaining costs is a function of the lower operating costs and lower capital expenditures on mine development compared to 2019.
The Company retained essential personnel at El Compas during the suspension period to maintain safety protocols, environmental monitoring, security measures and day-to-day maintenance.
Non-essential employees were sent home to self-isolate and continued to receive their base pay. These costs incurred from April 1st to late May totalled $0.5 million and were allocated to care and maintenance expenses and excluded from mine operating costs or the corresponding metrics.
Year ended December 31, 2020 (compared to the year ended December 31, 2019)
Direct production costs were $166.97 per tonne in 2020, an increase from 2019 due to inefficiencies during the transition from replacing mine contractors with employees and expensed development expenditures in 2020. Silver cash costs net of by-product credits (which is a non-IFRS measure and a standard of the Silver Institute), were negative $22.51 per oz of payable silver in 2020 compared to negative $7.74 per oz in 2019. The higher operating costs and lower silver grades were offset by a gold credit from the higher realized gold price, which increased by 27% compared to 2019.
Similarly, on a co-product cash costs basis, silver and gold cash cost per ounce increased compared to 2019. Silver co-product cash costs increased 26% due to the higher direct costs per tonne and lower silver grade ore partially offset by improved silver recoveries. Gold co-product cash costs increased 23% primarily due to the higher direct costs per tonne.
All-in sustaining costs (also a non-IFRS measure) decreased in 2020 to $10.98 per oz primarily due to the reduced capital expenditures offset by increased brownfield exploration expenditures to extend mine life and higher general and administrative costs in 2020 compared to 2019. Consolidated general and administrative costs increased $3.0 million primarily due to a $3.6 million mark to market expense of deferred share units, amounting to a $0.4 million allocation increase to El Compas production costs.
EL CUBO OPERATIONS
The El Cubo operation includes two previously operating underground silver-gold mines and a flotation plant. which employed over 350 people and engaged over 200 contractors until the suspension of operations at the end of November 2019 as the mineral reserves had been exhausted. The mine, plant and tailings facilities are on care and maintenance.
Company management and contract personnel continue to maintain the security of the mine, plant and tailings facilities. For the year ended December 31, 2020 the Company incurred $2.4 million in legal, administrative and care and maintenance expenses with an additional $0.4 million in severance costs and $0.2 million in building and office depreciation.
The Company maintains a security team, administrative staff, maintenance group and environmental staff. In Q4, 2020 the Company incurred $0.4 million in costs. During the second half of the year, there was a significant increase of illegal mining activity within the area requiring additional security and legal costs.
On December 15, 2020, the Company signed a binding letter agreement to sell its El Cubo mine and related assets to VanGold Mining Corp. ("VanGold") for $15.0 million in cash and share payments plus additional contingency payments.
- VanGold will pay $15.0 million for the El Cubo assets as follows:
- $0.5 million cash down-payment (received)
- $7.0 million cash on closing on or before March 17, 2021
- $5.0 million in VanGold common shares on closing - priced at CDN$0.30 per share for a total of 21,331,058 shares of VanGold
- $2.5 million in an unsecured promissory note due and payable within 12 months from closing.
VanGold has also agreed to pay the Company up to an additional $3.0 million in contingent payments based on the following events:
- $1.0 million upon VanGold producing 3.0 million silver equivalent ounces from the El Cubo mill
- $1.0 million if the price of gold closes at or above US$2,000 dollars per ounce for 20 consecutive days within two years after closing
- $1.0 million if the price of gold closes at or above US$2,200 dollars per ounce for 20 consecutive days within two years after closing.
Closing of the sale is subject to satisfaction of certain conditions including final due diligence by VanGold, financing and receipt of all requisite third party and regulatory approvals, including the acceptance of the TSXV on or before March 17, 2021, failing which either VanGold or the Company may terminate the agreement. If the tax lien on the assets is not removed on or before closing, VanGold shall be entitled to withhold from the purchase price an amount sufficient to remove the tax lien.
DEVELOPMENT ACTIVITIES
Terronera Project
The Terronera project, located 40 kilometres northeast of Puerto Vallarta in the state of Jalisco, Mexico, features a high-grade silver-gold mineral resource in the Terronera vein, which is now over 1,400 metres long, 400 metres deep, 3 to 16 metres thick, and remains open along strike to the southeast and down dip.
In 2020, the Company engaged an external consultant to update a previous Preliminary Feasibility Study based on updated information gathered in 2019 and 2020. In Q3, 2020 the Company completed an updated summary of the project's economics and published the NI 43-101 Technical Report ("2020 PFS").
The 2020 PFS included significant changes to the operations plan, capital and operating costs compared to the previous study and, as a result, project economics improved with higher certainty on a number of assumptions. The external consultant reviewed all aspects of the previous studies, while further cost-benefit initiatives will continue to be evaluated.
The 2020 PFS base case assumes a two-year trailing average silver price of $15.97 per oz and a gold price of $1,419 per oz. At base case prices, the improved economics estimates a net present value (NPV) of $137 million at a 5% discount rate, internal rate of return (IRR) of 30.0%, and payback period of 2.7 years. Initial capital expenditures are estimated to be $99 million with life of mine capital expenditures estimated to be $60 million. The 10 year life of mine is estimated to produce an average of 3 million silver oz and 32,800 gold ounces per year generating $315 million pre-tax, $217 million after-tax, free cash flow over the life of the project.
Endeavour plans to complete a Feasibility Study in 2021 at an estimated cost of $1.8 million. During the completion of the Feasibility Study, the Company will evaluate a number of opportunities to further enhance the value of the project, including exploration drilling to expand the known resources and to test multiple veins within the district. Additionally, the Company has defined an engineering, procurement and construction strategy and is strategizing commencement of various early work items. An engineering team is being assembled and a $7.3 million budget has been approved for sourcing equipment and machinery and early work items, including camp construction and known earthworks.
In Q4, 2020 the Company expanded the footprint of the project, to 20,128 hectares through the acquisition of two adjacent groups of mineral concessions, La Sanguijuela and Cerro Gordo, covering multiple mineralized vein structures. The mineralized vein structures on these properties are highly prospective and have never been previously drilled.
EXPLORATION RESULTS
In 2020, the Company initially planned to spend $5.4 million drilling 18,500 metres of core on brownfields projects, greenfields exploration and development engineering across its portfolio of mines and properties. At the three operating mines, 10,500 metres of core drilling were planned at a cost of $2.0 million to replace reserves and expand resources. During Q3, 2020 management approved an additional 9,500 drill metres to follow up on positive results at all three operations for an estimated cost of $1.7 million.
On the exploration and development projects, expenditures of $3.4 million were planned to fund 8,000 metres of core drilling, advance engineering studies at Terronera and Parral, and drill the Paloma gold project in Chile, where initial exploration results were positive. During the government suspension of activities, staff continued with mapping, sampling and interpretations across the Company project portfolio, with drill programs re-starting in September. Management approved an additional $1.0 million for 6,500 drill metres to test a prospective target adjacent to the Terronera project. The programs are expected to be completed in Q1, 2021.
At Guanaceví the Company drilled 7,240 metres in 22 holes to test the extension of the Porvenir Cuatro and Milache ore bodies. Drilling confirmed expectations and intersected significant mineralization with similar ore grades and vein widths as the 2019 intersections.
At Bolañitos the Company drilled 10,505 metres in 37 holes to target the Melladito vein and vein splays. The Company intersected significant mineralization with ore grades over mineable widths, located about 300 metres from current and historic mine workings. Management has planned further drilling and commenced the development of a crosscut to the newly discovered zones.
At El Compas the Company drilled 9,415 metres in 40 holes to targeting extensions of the Compas vein system and regional targets. The Company has intersected mineralization west of the current workings and outlined a 600,000 tonne resource on the Calicanto concessions north of the El Compas plant.
At Parral the Company mined 2,000 tonnes for a bulk sample metallurgical testing. Drilling is on hold due to COVID restrictions within the area.
In Chile, the Company commenced drilling on the Paloma properties targeting a bulk tonnage, sulfidation epithermal deposit relate to intrusive domes or the tops of porphyry systems. Assays and interpretation results are pending. Due to COVID restrictions drilling commenced later than planned and the program continued into Q1, 2021.
RESERVES AND RESOURCES
Proven and Probable silver Mineral Reserves increased year on year by 11%, while Proven and Probable gold Mineral Reserves decreased by 1%. Mineral Reserves are estimated to be 48.6 million oz silver and 472,000 oz gold. On a silver equivalent basis, Mineral Reserves total 86.3 million oz using a silver to gold ratio of 80:1. The increased Mineral Reserves are mainly due significant delineation of new reserves and resources at Guanacevi, while the conversion of Mineral Resources at each operation through continued mine development offset 2020 production.
Measured and Indicated Mineral Resources for silver decreased by 11% to 25.9 million oz and Measured and Indicated Mineral Resources for gold decreased by 2% to 222,500 oz gold. Silver equivalent Measured and Indicated Mineral Resources declined 8% to 43.7 million oz due mainly to reserve and resource reductions at Bolañitos and Compas and conversion of resources to reserves through mine development.
2020 Mineral Reserve and Resource Estimate Highlights (Compared to December 31, 2019)
- Silver Proven and Probable Mineral Reserves increased 11% to 48.6 million ounces (oz)
- Gold Proven and Probable Mineral Reserves decreased 1% to 472,000 oz
- Silver equivalent Proven and Probable Mineral Reserves of 86.3 million oz (80:1 silver:gold ratio)
- Silver Measured and Indicated Mineral Resources decreased 11% to 25.9 million oz
- Gold Measured and Indicated Mineral Resources decreased 2% to 222,500 oz
- Silver equivalent Measured and Indicated Mineral Resources of 43.7 million oz
- Silver Inferred Mineral Resources increased 6% to 64.4 million oz
- Gold Inferred Mineral Resources decreased 1% to 283,800 oz
- Silver equivalent Inferred Mineral Resources of 87.1 million oz
Mineral Reserve and Resource estimates are based on pricing assumptions of $16.51 per ounce of silver and $1,465 per ounce of gold at Guanaceví, Bolañitos and El Compas, $17.00 per ounce of silver and $1,275 per ounce of gold at Terronera and $15.00 per ounce of silver and $1,275 per ounce of gold at Parral.
Note to U.S Investors: Mineral reserve and resources are as defined by Canadian securities laws. See "Cautionary Note to U.S. Investors Regarding Mineral Reserves and Resources".
CONSOLIDATED FINANCIAL RESULTS
Three months ended December 31, 2020 (compared to the three months ended December 31, 2019)
In Q4, 2020, the Company's mine operating earnings was $20.8 million (Q4, 2019: mine operating loss $3.8 million) on net revenue of $60.7 million (Q4, 2019: $33.5 million) with cost of sales of $39.9 million (Q4, 2019: $37.3 million).
In Q4, 2020, the Company had operating earnings of $12.0 million (Q4, 2019: operating loss $14.7 million) after exploration costs of $4.1 million (Q4, 2019: $4.7 million) and general and administrative costs of $3.9 million (Q4, 2019: $2.6 million), care and maintenance expense for the El Cubo operation of $0.4 million and net impairments and impairment reversals of $0.4 million related the estimate value in use of the Guanacevi and El Compas operations. The operating loss for Q4, 2019 included a severance expense of $3.5 million related to the suspension of operations at El Cubo at the end of 2019.
The income before taxes for Q4, 2020 was $14.8 million (Q4, 2019: loss before taxes $13.5 million) after finance costs of $0.3 million (Q4, 2019: $0.2 million), a foreign exchange gain of $1.8 million (Q4, 2019: $0.8 million) and investment and interest income of $1.3 million (Q4, 2019: $0.7 million). The Q4, 2019 income included a write-off of IVA receivable of $0.1 million. The Company realized net income for the period of $20.0 million (Q4, 2019: net loss of $17.9 million) after an income tax recovery of $5.2 million (Q4, 2019: income tax expense of $4.4 million).
Net revenue of $60.7 million in Q4, 2020, net of $0.5 million of smelting and refining costs, increased by 81% compared to $33.5 million, net of $1.1 million of smelting and refining costs. Gross sales of $61.2 million in Q4, 2020 represented a 77% increase over the $34.6 million for the same period in 2019. There was an 35% increase in silver ounces sold and a 41% increase in the realized silver price resulting in a 92% increase to silver sales. There was a 28% increase in gold ounces sold with a 25% increase in realized gold prices resulting in a 61% increase in gold sales. During the period, the Company sold 1,419,037 oz silver and 13,850 oz gold, for realized prices of $24.76 and $1,885 per oz respectively, compared to sales of 1,050,157 oz silver and 10,803 oz gold, for realized prices of $17.45 and $1,507 per oz, respectively, in the same period of 2019. For the three months ended December 31, 2020, the realized prices of silver were relatively similar average London spot prices. During the same period, Silver and gold spot prices averaged $24.41 and $1,877, respectively.
The Company decreased its finished goods silver and gold inventory to 116,484 oz and 1,459 oz, respectively at December 31, 2020 compared to 462,674 oz silver and 2,995 oz gold at September 30, 2020. The cost allocated to these finished goods was $3.6 million at December 31, 2020, compared to $6.0 million at September 30, 2020. At December 31, 2020, the finished goods inventory fair market value was $5.8 million, compared to $15.7 million at September 30, 2020.
Cost of sales for Q4, 2020 was $39.9 million, an increase of 7% over the cost of sales of $37.3 million for the same period of 2019. The slight increase in cost of sales was primarily related to significantly higher royalty costs offset by improved productivity at the Guanaceví and Bolañitos operations. Royalties increased 374% to $4.4 million due to higher realized prices and the increased mining of the high grade El Curso property at the Guanacevi operation which is subject to the significantly higher royalty rates.
Exploration expenses decreased in Q4, 2020 to $4.1 million from $4.7 million for the same period of 2019 based on timing of drill programs. General and administrative expenses increased to $3.9 million in Q4, 2020 compared to $2.6 million for the same period of 2019, primarily due to mark-to-market fluctuations for director's deferred share units which comparatively increased costs by $2.0 million.
The Company incurred a foreign exchange gain of $1.8 million in Q4, 2020 compared to a foreign exchange gain of $0.8 million in Q4, 2019 due to the slight recovery of the Mexican Peso in the quarter, which resulted in higher valuations of peso denominated tax receivables and cash balances. The Company incurred $0.3 million in finance charges primarily related to mobile equipment purchased in 2019 and early 2020 compared to $0.2 million in the same period in 2019. The Company recognized $1.3 million in investment and other income compared to $0.7 in Q4, 2019 with the majority of the other income derived from interest received on IVA collections
There was an income tax recovery of $5.2 million in Q4, 2020 compared to an income tax expense of $4.4 million in Q4, 2019. The $5.2 million tax recovery is comprised of $1.9 million in current income tax expense (Q4, 2019: $1.3 million) and $7.1 million in deferred income tax recovery (Q4, 2019: deferred income tax expense of $3.1 million). The current income tax expense consists of $1.4 million of special mining duty taxes and $0.5 million of income taxes. In 2019, the Company did not pay special mining duty due the losses generated at the operations. The deferred income tax recovery of $7.1 million is primarily due recognition loss carry forwards as the future profitability of the Guanacevi operation has significantly increased with the recent increase in reserve estimates.
Year ended December 31, 2020 (compared to the year ended December 31, 2019)
For the year ended December 31, 2020, the Company's mine operating earnings were $27.3 million (2019: mine operating loss of $17.4 million) on net revenue of $138.4 million (2019: $117.4 million) with cost of sales of $111.1 million (2019: $134.8 million).
The Company had an operating loss of $0.8 million (2019: $44.0 million) after exploration costs of $9.8 million (2019: $12.0 million), general and administrative costs of $12.7 million (2019: $10.0 million) care and maintenance expense for the shutdown of the El Cubo operation of $3.0 million and $2.2 million in care and maintenance costs related to the temporary suspension of the Guanaceví, Bolañitos and El Compas operations due to COVID-19 in Q2, 2020. In 2020, the operating loss included impairments and impairments reversals of non-current assets of $0.4 million related the value in use estimates of the Guanacevi and El Compas operation. The operating loss for 2019 included a severance expense of $4.6 million related to the suspension of operations at El Cubo at the end of 2019.
The loss before taxes was $1.0 million (2019: $44.0 million) after finance costs of $1.3 million (2019: $0.6 million), a foreign exchange loss of $1.5 million (2019: foreign exchange gain of $0.1 million) and investment and other income of $2.6 million (2019: $0.6 million). The loss before taxes for 2019 included a $0.1 million write off of IVA receivable. The Company realized net earnings for the period of $1.2 million (2019: net loss of $48.1 million) after an income tax recovery of $2.2 million (2019: income tax expense of $4.1 million).
Net revenue of $138.4 million in 2020, net of $1.8 million of smelting and refining costs, increased 18% compared to $117.4 million, net of $4.3 million of smelting and refining costs for 2019. Gross sales of $140.2 million for 2020 represented a 15% increase over gross sales of $121.7 million for 2019. There was a 15% decrease in silver ounces sold offset by a 33% increase in the realized silver price resulting in 13% increase silver sales. There was a 9% decrease in gold ounces sold with a 30% increase in realized gold prices resulting in 18% increase in gold sales. During the period, the Company sold 3,460,638 oz silver and 35,519 oz gold, for realized prices of $21.60 and $1,846 per oz respectively, compared to sales of 4,054,652 oz silver and 39,151 oz gold, for realized prices of $16.29 and $1,422 per oz, respectively, in the same period of 2019. The realized prices of silver was 5% above the average silver spot price and the realized prices of gold exceeded the years average spot price by 4%. The higher realized prices compared to average was due to the timing of sales. Silver and gold spot prices averaged $20.53 and $1,771 during 2020, respectively.
The Company increased its finished goods silver and gold inventory to 116,484 oz and 1,459 oz, respectively at December 31, 2020 compared to 95,028 oz silver and 587 oz gold at December 31, 2019. The cost allocated to these finished goods was $3.6 million at December 31, 2020, compared to $2.3 million at December 31, 2019. At December 31, 2020, the finished goods inventory fair market value was $5.8 million, compared to the fair value of $2.6 million at December 31, 2019.
Cost of sales for 2020 was $111.1 million, a decrease of 18% over the cost of sales of $134.8 million for 2019. The 18% decrease in cost of sales was primarily related to the 21% decrease in tonnes processed and the deprecation of the Mexican Peso while cost cutting and efficiency measures implemented during 2019 were offset by inefficiencies of the suspension and re-start of activities due to COVID-19 and higher royalty expense with the rising prices. Royalties increased 301% to $8.2 million due to higher realized prices and the increased mining of the high grade El Curso property at the Guanacevi operation which is subject to the significantly higher royalty rates.
Exploration expenses decreased 18% to $9.8 million from $12.0 million for the same period of 2019 as Mexican health decree resulted in a month and half of suspension of all activities. General and administrative expenses increased 27% to $12.7 million compared to $10.0 million for the same period of 2019 primarily due to recognition of mark-to-market fluctuations for director's deferred share units which comparatively increased costs by $3.5 million.
The Company recorded a foreign exchange loss of $1.5 million in 2020 compared to a foreign exchange gain of $0.1 million in 2019, due to the depreciation of the Mexican Peso which resulted in lower valuations of peso denominated tax receivables and cash balances. The Company incurred $1.3 million in finance charges primarily related to mobile equipment financed late 2019 and early 2020 compared to $0.6 million in 2019. The Company recognized $2.6 million in investment and other income compared to $0.6 million in other expenses in 2019. The other income was primarily generated from cash balances and interest generated from prolonged value added taxes refunds.
There was an income tax recovery of $2.2 million in 2020 compared to an income tax expense of $4.1 million in 2019. The $2.2 million tax recovery is comprised of $3.0 million in current income tax expense (2019: $2.7 million) and $5.2 million in deferred income tax recovery (2019: $1.4 million deferred income tax expense).
The current income tax expense consists of $2.0 million of special mining duty taxes and $1.0 million of income taxes. In 2019, the Company did not pay special mining duty due the losses generated at the operations. The deferred income tax recovery of $5.2 million is primarily due recognition loss carry forwards as the future profitability of the Guanacevi operation has significantly increased with the recent increase in reserve estimates.
The recoverable amounts of the Company's cash-generating units (CGUs), which include mining properties, plant and equipment are determined at the end of each reporting period, if impairment indicators are identified. In previous years, commodity price declines led the Company to determine there were impairment indicators and assessed the recoverable amounts of its CGUs. The recoverable amounts were based on each CGUs future cash flows expected to be derived from the Company's mining properties and represent each CGU's value in use. The cash flows were determined based on the life-of-mine after-tax cash flow forecast which incorporates management's best estimates of future metal prices, production based on current estimates of recoverable reserves and resources, exploration potential, future operating costs and non-expansionary capital expenditures discounted at risk adjusted rates based on the CGUs weighted average cost of capital.
At December 31, 2020, the Company recognized a $2.6 million reversal of a previous impairment of the Guanaceví Mine. The significant increase in the resource estimate and increase in precious metal prices were considered to be indicators of an impairment reversal. The updated Guanaceví mine plan with updated assumptions and estimates resulted in significantly higher cash flows compared with the Company's previous estimates and accordingly reversed the 2013 Guanaceví CGU impairment, limited to the carrying amount had no impairment been recognized in prior periods, net of depletion and amortization which would have been recognized in prior periods.
At December 31, 2020, the significant decrease in the El Compas resource estimate was considered to be an indicator of an impairment and the Company recognized an impairment of the El Compas Mine. The Company recorded an impairment charge related to the El Compas CGU of $3.0 million.
The recoverable amounts of the Guanaceví and El Compas mines were determined based on its value in use, estimated utilizing a discounted cash flow model. The projected cash flows used are significantly affected by changes in assumptions to metal prices, changes in the amount of recoverable reserves and resources, production cost estimates, future capital expenditures and discount rates. The discounted cash flow models are a Level 3 measurement in the fair value hierarchy.
SELECTED ANNUAL INFORMATION
| Expressed in thousands US dollars | Year ended December 31 | ||||||||
| except per share amounts | 2020 | 2019 | 2018 | ||||||
| Net revenue | $ | 138,461 | $ | 117,421 | $ | 145,518 | |||
| Net earnings (loss) | 1,159 | (48,066 | ) | (12,439 | ) | ||||
| Basic earnings (loss) per share | 0.01 | (0.36 | ) | (0.10 | ) | ||||
| Diluted earnings (loss) per share | 0.01 | (0.36 | ) | (0.10 | ) | ||||
| Dividends per share | - | - | - | ||||||
| Total assets | 210,592 | 163,713 | 177,047 | ||||||
| Total long-term liabilities | 16,968 | 16,076 | 8,747 | ||||||
NON-IFRS MEASURES
Mine operating cash flow before taxes is a non-IFRS measure that does not have a standardized meaning prescribed by IFRS and therefore may not be comparable to similar measures presented by other issuers. Mine operating cash flow is calculated as revenue minus direct production costs and royalties. Mine operating cash flow is used by management to assess the performance of the mine operations, excluding corporate and exploration activities and is provided to investors as a measure of the Company's operating performance.
| Expressed in thousands US dollars | Three Months Ended December 31 | Year Ended December 31 | ||||||||||
| 2020 | 2019 | 2020 | 2019 | |||||||||
| Mine operating earnings (loss) | $ | 20,814 | ($3,791 | ) | $ | 27,335 | ($17,361 | ) | ||||
| Share-based compensation | 60 | 37 | 330 | 195 | ||||||||
| Amortization and depletion | 8,919 | 8,055 | 28,136 | 31,495 | ||||||||
| Write down of inventory to net realizable value | 405 | 576 | 405 | 576 | ||||||||
| Mine operating cash flow before taxes | $ | 30,198 | $ | 4,877 | $ | 56,206 | $ | 14,905 | ||||
Operating cash flow before working capital changes per share is a non-IFRS measure that does not have a standardized meaning prescribed by IFRS and therefore may not be comparable to similar measures presented by other issuers. Operating cash flow per share is calculated by dividing cash from operating activities by the weighted average shares outstanding. Operating cash flow per share is used by management to assess operating performance irrespective of working capital changes and is provided to investors as a measure of the Company's operating performance.
| Expressed in thousands US dollars | Three Months Ended December 31 | Year Ended December 31 | ||||||||||
| 2020 | 2019 | 2020 | 2019 | |||||||||
| Cash from (used in) operating activities | $ | 26,650 | $ | 4,657 | $ | 38,964 | ($9,578 | ) | ||||
| Net changes in non-cash working capital | 5,028 | 12,529 | 10,138 | ($684 | ) | |||||||
| Operating cash flow before working capital adjustments | $ | 21,622 | ($7,872 | ) | $ | 28,826 | ($8,894 | ) | ||||
Operating cash flow before working capital changes per share is a non-IFRS measure that does not have a standardized meaning prescribed by IFRS and therefore may not be comparable to similar measures presented by other issuers. Operating cash flow per share is calculated by dividing cash from operating activities by the weighted average shares outstanding. Operating cash flow per share is used by management to assess operating performance irrespective of working capital changes and is provided to investors as a measure of the Company's operating performance.
| Expressed in thousands US dollars | Three Months Ended December 31 | Year Ended December 31 | ||||||||||
| except for share numbers and per share amounts | 2020 | 2019 | 2020 | 2019 | ||||||||
| Operating cash flow before working capital adjustments | $ | 21,622 | ($7,872 | ) | $ | 28,826 | ($8,894 | ) | ||||
| Basic weighted average shares outstanding | 157,536,658 | 140,054,885 | 150,901,598 | 135,367,129 | ||||||||
| Operating cash flow before working capital changes per share | $ | 0.14 | ($0.06 | ) | $ | 0.19 | ($0.07 | ) | ||||
EBITDA is a non-IFRS financial measure, which excludes the following from net earnings:
- Income tax expense;
- Finance costs;
- Amortization and depletion
Adjusted EBITDA excludes the following additional items from EBITDA
- Share based compensation;
- Non-recurring write offs
Management believes EBITDA is a valuable indicator of the Company's ability to generate liquidity by producing operating cash flow to fund working capital needs, service debt obligations, and fund capital expenditures. Management uses EBITDA for this purpose. EBITDA is also frequently used by investors and analysts for valuation purposes whereby EBITDA is multiplied by a factor or "EBITDA multiple" based on an observed or inferred relationship between EBITDA and market values to determine the approximate total enterprise value of a Company.
EBITDA is intended to provide additional information to investors and analysts. It does not have any standardized definition under IFRS and should not be considered in isolation or as a substitute for measures of operating performance prepared in accordance with IFRS. EBITDA excludes the impact of cash costs of financing activities and taxes, and the effects of changes in operating working capital balances, and therefore is not necessarily indicative of operating profit or cash flow from operations as determined by IFRS. Other companies may calculate EBITDA and Adjusted EBITDA differently.
| Expressed in thousands US dollars | Three Months Ended December 31 | Year Ended December 31 | ||||||||||
| 2020 | 2019 | 20 20 | 2019 | |||||||||
| Net earnings (loss) for the period | $ | 19,923 | ($17,897 | ) | $ | 1,159 | ($48,066 | ) | ||||
| Depreciation and depletion – cost of sales | 8,919 | 8,055 | 28,136 | 31,495 | ||||||||
| Depreciation and depletion – exploration | 28 | 59 | 311 | 238 | ||||||||
| Depreciation and depletion – general & administration | 49 | 80 | 202 | 317 | ||||||||
| Depreciation and depletion – care & maintenance | (31 | ) | - | 214 | - | |||||||
| Depreciation and depletion – inventory write down | 231 | 236 | 231 | 236 | ||||||||
| Finance costs | 332 | 230 | 1,357 | 602 | ||||||||
| Current income tax expense | 1,937 | 1,308 | 2,993 | 2,702 | ||||||||
| Deferred income tax expense (recovery) | (7,112 | ) | 3,100 | (5,206 | ) | 1,360 | ||||||
| EBITDA | $ | 24,276 | ($4,829 | ) | $ | 29,397 | ($11,116 | ) | ||||
| Share based compensation | 617 | 582 | 3,003 | 3,195 | ||||||||
| Impairment of non-current assets, net of tax | 424 | - | 424 | - | ||||||||
| Adjusted EBITDA | $ | 25,317 | ($4,247 | ) | $ | 32,824 | ($7,921 | ) | ||||
Cash costs per silver ounce, total production costs per ounce, direct operating costs per tonne and direct production costs per tonne are measures developed by precious metals companies in an effort to provide a comparable standard; however, there can be no assurance that the Company's reporting of these non-IFRS measures are similar to those reported by other mining companies. Cash costs per ounce, production costs per ounce and direct production costs per tonne are measures used by the Company to manage and evaluate operating performance at each of the Company's operating mining units. They are widely reported in the silver mining industry as a benchmark for performance, but do not have a standardized meaning and are disclosed in addition to IFRS measures. The following tables provide a detailed reconciliation of these measures to the Company's cost of sales, as reported in its consolidated financial statements.
| Expressed in thousands US dollars | Three Months Ended December 31, 2020 | Three Months Ended December 31, 2019 | ||||||||||||||||||||||||||||
| Guanaceví | Bolañitos | El Compas | El Cubo | Total | Guanaceví | Bolañitos | El Compas | El Cubo | Total | |||||||||||||||||||||
| Direct costs per financial statements | $ | 15,635 | $ | 7,420 | $ | 3,060 | $ | - | $ | 26,115 | $ | 12,366 | $ | 6,980 | $ | 4,011 | $ | 5,111 | $ | 28,468 | ||||||||||
| Smelting and refining costs included in net revenue | - | 380 | 111 | - | 491 | - | 968 | 91 | - | 1,059 | ||||||||||||||||||||
| Opening finished goods | (3,318 | ) | (335 | ) | (585 | ) | - | (4,238 | ) | (2,455 | ) | (1,604 | ) | (347 | ) | (458 | ) | (4,864 | ) | |||||||||||
| Finished goods NRV adjustment | - | - | 174 | - | 174 | - | - | (391 | ) | - | (391 | ) | ||||||||||||||||||
| Closing finished goods | 1,509 | 250 | 642 | - | 2,401 | 1,509 | 219 | 169 | - | 1,897 | ||||||||||||||||||||
| Direct operating costs | 13,826 | 7,715 | 3,402 | - | 24,943 | 11,420 | 6,563 | 3,533 | 4,653 | 26,169 | ||||||||||||||||||||
| Royalties | 4,210 | 69 | 155 | - | 4,434 | 726 | 63 | 124 | 22 | 935 | ||||||||||||||||||||
| Special mining duty (1) | 1,050 | 354 | - | - | 1,404 | - | - | - | (265 | ) | (265 | ) | ||||||||||||||||||
| Direct costs | 19,086 | 8,138 | 3,557 | - | 30,781 | 12,146 | 6,626 | 3,657 | 4,410 | 26,839 | ||||||||||||||||||||
| By-product gold sales | (8,998 | ) | (12,327 | ) | (4,784 | ) | - | (26,109 | ) | (3,281 | ) | (7,312 | ) | (3,604 | ) | (2,085 | ) | (16,282 | ) | |||||||||||
| Opening gold inventory fair market value | 3,712 | 723 | 1,229 | - | 5,664 | 658 | 1,428 | 508 | 332 | 2,926 | ||||||||||||||||||||
| Closing gold inventory fair market value | (735 | ) | (746 | ) | (1,283 | ) | - | (2,764 | ) | (437 | ) | (244 | ) | (213 | ) | - | (894 | ) | ||||||||||||
| Cash costs net of by-product | 13,065 | (4,212 | ) | (1,281 | ) | - | 7,572 | 9,086 | 498 | 348 | 2,657 | 12,589 | ||||||||||||||||||
| Amortization and depletion | 2,850 | 2,779 | 3,290 | - | 8,919 | 2,650 | 1,235 | 1,617 | 1,824 | 7,326 | ||||||||||||||||||||
| Share-based compensation | 16 | 22 | 22 | - | 60 | 8 | 10 | 9 | 10 | 37 | ||||||||||||||||||||
| Opening finished goods depletion | (855 | ) | (158 | ) | (776 | ) | - | (1,789 | ) | (699 | ) | (294 | ) | (277 | ) | (103 | ) | (1,373 | ) | |||||||||||
| NRV depreciation cost adjustment | - | - | 231 | - | 231 | - | - | (131 | ) | - | (131 | ) | ||||||||||||||||||
| Closing finished goods depletion | 271 | 104 | 804 | - | 1,179 | 252 | 43 | 121 | - | 416 | ||||||||||||||||||||
| Total production costs | $ | 15,347 | ($1,465 | ) | $ | 2,290 | $ | - | $ | 16,172 | $ | 11,297 | $ | 1,492 | $ | 1,687 | $ | 4,388 | $ | 18,864 | ||||||||||
| Three Months Ended December 31, 2020 | Three Months Ended December 31, 2019 | |||||||||||||||||||||||||||||
| Guanaceví | Bolañitos | El Compas | El Cubo | Total | Guanaceví | Bolañitos | El Compas | El Cubo | Total | |||||||||||||||||||||
| Throughput tonnes | 106,425 | 107,332 | 23,632 | - | 237,389 | 92,323 | 82,147 | 22,855 | 39,206 | 236,531 | ||||||||||||||||||||
| Payable silver ounces | 988,722 | 94,526 | 25,600 | - | 1,108,848 | 671,051 | 103,348 | 31,941 | 117,200 | 923,540 | ||||||||||||||||||||
| Cash costs per silver ounce | $ | 13.21 | ($44.56 | ) | ($50.04 | ) | - | $ | 6.83 | $ | 13.54 | $ | 4.82 | $ | 10.90 | $ | 22.67 | $ | 13.63 | |||||||||||
| Total production costs per oz | $ | 15.52 | ($15.50 | ) | $ | 89.45 | - | $ | 14.58 | $ | 16.83 | $ | 14.44 | $ | 52.82 | $ | 37.44 | $ | 20.43 | |||||||||||
| Direct operating costs per tonne | $ | 129.91 | $ | 71.88 | $ | 143.96 | - | $ | 105.07 | $ | 123.70 | $ | 79.89 | $ | 154.58 | $ | 118.68 | $ | 110.64 | |||||||||||
| Direct costs per tonne | $ | 179.34 | $ | 75.82 | $ | 150.52 | - | $ | 129.66 | $ | 131.56 | $ | 80.66 | $ | 160.01 | $ | 112.48 | $ | 113.47 | |||||||||||
| Expressed in thousands US dollars | Year Ended December 31, 2020 | Year Ended December 31, 2019 | ||||||||||||||||||||||||||||
| Guanaceví | Bolañitos | El Compas | El Cubo | Total | Guanaceví | Bolañitos | El Compas | El Cubo | Total | |||||||||||||||||||||
| Direct costs per financial statements | $ | 40,693 | $ | 21,796 | $ | 11,612 | $ | - | $ | 74,101 | $ | 41,978 | $ | 23,742 | $ | 9,544 | $ | 25,218 | $ | 100,482 | ||||||||||
| Smelting and refining costs included in net revenue | - | 1,393 | 433 | - | 1,826 | - | 1,981 | 413 | 1,909 | 4,303 | ||||||||||||||||||||
| Opening finished goods | (1,509 | ) | (219 | ) | (169 | ) | - | (1,897 | ) | (1,247 | ) | (1,457 | ) | - | (502 | ) | (3,206 | ) | ||||||||||||
| Finished goods NRV adjustment | - | - | 174 | - | 174 | - | - | (391 | ) | - | (391 | ) | ||||||||||||||||||
| Closing finished goods | 1,509 | 250 | 642 | - | 2,401 | 1,509 | 219 | 169 | - | 1,897 | ||||||||||||||||||||
| Direct operating costs | 40,693 | 23,220 | 12,692 | - | 76,605 | 42,240 | 24,485 | 9,735 | 26,625 | 103,085 | ||||||||||||||||||||
| Royalties | 7,407 | 197 | 550 | - | 8,154 | 1,410 | 181 | 291 | 152 | 2,034 | ||||||||||||||||||||
| Special mining duty (1) | 1,635 | 354 | - | - | 1,989 | - | - | - | - | 0 | ||||||||||||||||||||
| Direct costs | 49,735 | 23,771 | 13,242 | - | 86,748 | 43,650 | 24,666 | 10,026 | 26,777 | 105,119 | ||||||||||||||||||||
| By-product gold sales | (17,458 | ) | (33,970 | ) | (14,126 | ) | - | (65,554 | ) | (8,638 | ) | (21,703 | ) | (10,589 | ) | (14,740 | ) | (55,670 | ) | |||||||||||
| Opening gold inventory fair market value | 437 | 244 | 213 | - | 894 | 279 | 1,341 | - | 604 | 2,224 | ||||||||||||||||||||
| Closing gold inventory fair market value | (735 | ) | (746 | ) | (1,283 | ) | - | (2,764 | ) | (437 | ) | (244 | ) | (213 | ) | - | (894 | ) | ||||||||||||
| Cash costs net of by-product | 31,979 | (10,701 | ) | (1,954 | ) | - | 19,324 | 34,854 | 4,060 | (776 | ) | 12,641 | 50,779 | |||||||||||||||||
| Amortization and depletion | 8,785 | 8,947 | 10,404 | - | 28,136 | 14,096 | 3,631 | 6,622 | 7,146 | 31,495 | ||||||||||||||||||||
| Share-based compensation | 114 | 108 | 108 | - | 330 | 49 | 49 | 48 | 49 | 195 | ||||||||||||||||||||
| Opening finished goods depletion | (252 | ) | (43 | ) | (121 | ) | - | (416 | ) | (597 | ) | (64 | ) | - | (186 | ) | (847 | ) | ||||||||||||
| NRV depreciation cost adjustment | - | - | 231 | - | 231 | - | - | (131 | ) | - | (131 | ) | ||||||||||||||||||
| Closing finished goods depletion | 271 | 104 | 804 | - | 1,179 | 252 | 43 | 121 | - | 416 | ||||||||||||||||||||
| Total production costs | $ | 40,897 | ($1,585 | ) | $ | 9,472 | $ | - | $ | 48,784 | $ | 48,654 | $ | 7,719 | $ | 5,884 | $ | 19,650 | $ | 81,907 | ||||||||||
| Year Ended December 31, 2020 | Year Ended December 31, 2019 | |||||||||||||||||||||||||||||
| Guanaceví | Bolañitos | El Compas | El Cubo | Total | Guanaceví | Bolañitos | El Compas | El Cubo | Total | |||||||||||||||||||||
| Throughput tonnes | 346,679 | 331,174 | 79,307 | - | 757,160 | 322,988 | 316,708 | 69,772 | 245,418 | 954,886 | ||||||||||||||||||||
| Payable silver ounces | 3,061,982 | 333,293 | 86,819 | - | 3,482,094 | 2,196,475 | 603,903 | 100,243 | 1,051,302 | 3,951,923 | ||||||||||||||||||||
| Cash costs per silver ounce | $ | 10.44 | ($32.11 | ) | ($22.51 | ) | - | $ | 5.55 | $ | 15.87 | $ | 6.72 | ($7.74 | ) | $ | 12.02 | $ | 12.85 | |||||||||||
| Total production costs per ounce | $ | 13.36 | ($4.76 | ) | $ | 109.10 | - | $ | 14.01 | $ | 22.15 | $ | 12.78 | $ | 58.70 | $ | 18.69 | $ | 20.73 | |||||||||||
| Direct operating costs per tonne | $ | 117.38 | $ | 70.11 | $ | 160.04 | - | $ | 101.17 | $ | 130.78 | $ | 77.31 | $ | 139.53 | $ | 108.49 | $ | 107.96 | |||||||||||
| Direct costs per tonne | $ | 143.46 | $ | 71.78 | $ | 166.97 | - | $ | 114.57 | $ | 135.14 | $ | 77.88 | $ | 143.70 | $ | 109.11 | $ | 110.09 | |||||||||||
| Expressed in thousands US dollars | Year Ended December 31, 2020 | Year Ended December 31, 2019 | ||||||||||||||||||||||||||||
| Guanaceví | Bolañitos | El Compas | El Cubo | Total | Guanaceví | Bolañitos | El Compas | El Cubo | Total | |||||||||||||||||||||
| Closing finished goods | 1,509 | 250 | 642 | - | 2,401 | 1,509 | 219 | 169 | - | 1,897 | ||||||||||||||||||||
| Closing finished goods depletion | 271 | 104 | 804 | - | 1,179 | 252 | 43 | 121 | - | 416 | ||||||||||||||||||||
| Finished goods inventory | $ | 1,780 | $ | 354 | $ | 1,446 | - | $ | 3,580 | $ | 1,761 | $ | 262 | $ | 290 | - | $ | 2,313 | ||||||||||||
(1) Special mining duty is an EBITDA royalty tax presented as a current income tax in accordance with IFRS.
All-in sustaining costs per ounce and all-in costs per ounce are measures developed by the World Gold Council (and used as a standard of the Silver Institute) in an effort to provide a comparable standard within the precious metal industry; however, there can be no assurance that the Company's reporting of these non-IFRS measures are similar to those reported by other mining companies. These measures are used by the Company to manage and evaluate operating performance at each of the Company's operating mining units and consolidated group, and are widely reported in the silver mining industry as a benchmark for performance, but do not have a standardized meaning and are disclosed in addition to IFRS measures. The following tables provide a detailed reconciliation of these measures to the Company's cost of sales, as reported in the Company's consolidated financial statements.
| Expressed in thousands US dollars | Three Months Ended December 31, 2020 | Three Months Ended December 31, 2019 | ||||||||||||||||||||||||||||
| Guanaceví | Bolañitos | El Compas | El Cubo | Total | Guanaceví | Bolañitos | El Compas | El Cubo | Total | |||||||||||||||||||||
| Cash costs net of by-product | $ | 13,065 | ($4,212 | ) | ($1,281 | ) | - | $ | 7,572 | $ | 9,086 | $ | 498 | $ | 348 | $ | 2,657 | $ | 12,589 | |||||||||||
| Operations stock based compensation | 16 | 22 | 22 | - | 60 | 8 | 10 | 9 | 10 | 37 | ||||||||||||||||||||
| Corporate general and administrative | 1,972 | 1,009 | 375 | - | 3,356 | 884 | 476 | 230 | 270 | 1,860 | ||||||||||||||||||||
| Corporate stock based compensation | 274 | 149 | 50 | - | 473 | 237 | 113 | 61 | 28 | 439 | ||||||||||||||||||||
| Reclamation - amortization/ accretion | 10 | 8 | 2 | - | 20 | 13 | 11 | 3 | 25 | 52 | ||||||||||||||||||||
| Mine site expensed exploration | 246 | 199 | 284 | - | 729 | 312 | 240 | 200 | - | 752 | ||||||||||||||||||||
| Intangible payments | 30 | 30 | 31 | - | 91 | - | - | - | - | - | ||||||||||||||||||||
| Equipment loan payments | 315 | 650 | - | - | 965 | - | - | - | - | - | ||||||||||||||||||||
| Capital expenditures sustaining | 3,519 | 3,750 | - | - | 7,269 | 2,533 | 2,619 | 672 | (129 | ) | 5,695 | |||||||||||||||||||
| All In Sustaining Costs | $ | 19,447 | $ | 1,605 | ($517 | ) | $ | - | $ | 20,535 | $ | 13,073 | $ | 3,967 | $ | 1,523 | $ | 2,861 | $ | 21,424 | ||||||||||
| Growth exploration | 3,198 | 4,372 | ||||||||||||||||||||||||||||
| Growth capital expenditures | (678 | ) | 94 | |||||||||||||||||||||||||||
| All In Costs | $ | 23,055 | $ | 25,890 | ||||||||||||||||||||||||||
| Three Months Ended December 31, 2020 | Three Months Ended December 31, 2019 | |||||||||||||||||||||||||||||
| Guanaceví | Bolañitos | El Compas | El Cubo | Total | Guanaceví | Bolañitos | El Compas | El Cubo | Total | |||||||||||||||||||||
| Throughput tonnes | 106,425 | 107,332 | 23,632 | - | 237,389 | 92,323 | 82,147 | 22,855 | 39,206 | 236,531 | ||||||||||||||||||||
| Payable silver ounces | 988,722 | 94,526 | 25,600 | - | 1,108,848 | 671,051 | 103,348 | 31,941 | 117,200 | 923,540 | ||||||||||||||||||||
| Silver equivalent production (ounces) | 1,247,537 | 639,737 | 236,895 | - | 2,124,169 | 835,559 | 437,003 | 217,358 | 215,831 | 1,705,751 | ||||||||||||||||||||
| Sustaining cost per ounce | $ | 19.67 | $ | 16.98 | ($20.19 | ) | - | 18.52 | $ | 19.48 | $ | 38.38 | $ | 4768 | $ | 24.40 | $ | 23.20 | ||||||||||||
| All In costs per ounce | 20.79 | $ | 28.03 | |||||||||||||||||||||||||||
| Expressed in thousands US dollars | Year Ended December 31, 2020 | Year Ended December 31, 2019 | ||||||||||||||||||||||||||||
| Guanaceví | Bolañitos | El Compas | El Cubo | Total | Guanaceví | Bolañitos | El Compas | El Cubo | Total | |||||||||||||||||||||
| Cash costs net of by-product | $ | 31,979 | ($10,701 | ) | ($1,954 | ) | - | $ | 19,324 | $ | 34,854 | $ | 4,060 | ($776 | ) | $ | 12,641 | $ | 50,779 | |||||||||||
| Operations stock based compensation | 114 | 108 | 108 | - | 330 | 49 | 49 | 48 | 49 | 195 | ||||||||||||||||||||
| Corporate general and administrative | 5,961 | 2,891 | 1,172 | - | 10,024 | 2,643 | 1,776 | 698 | 1,890 | 7,007 | ||||||||||||||||||||
| Corporate stock based compensation | 1,480 | 718 | 291 | - | 2,489 | 923 | 620 | 244 | 660 | 2,447 | ||||||||||||||||||||
| Reclamation - amortization/ accretion | 39 | 30 | 9 | - | 78 | 53 | 44 | 10 | 101 | 208 | ||||||||||||||||||||
| Mine site expensed exploration | 839 | 707 | 1,115 | - | 2,661 | 830 | 820 | 394 | 256 | 2,300 | ||||||||||||||||||||
| Intangible payments | 117 | 117 | 117 | - | 351 | - | - | - | - | - | ||||||||||||||||||||
| Equipment loan payments | 839 | 2,039 | - | - | 2,878 | - | - | - | - | - | ||||||||||||||||||||
| Capital expenditures sustaining | 11,103 | 11,933 | 95 | - | 23,131 | 10,864 | 7,798 | 2,138 | 10 | 20,810 | ||||||||||||||||||||
| All In Sustaining Costs | $ | 52,471 | $ | 7,842 | $ | 953 | $ | - | $ | 61,266 | $ | 50,216 | $ | 15,167 | $ | 2,756 | $ | 15,607 | $ | 83,746 | ||||||||||
| Growth exploration | 6,600 | 9,463 | ||||||||||||||||||||||||||||
| Growth capital expenditures | 2,408 | 989 | ||||||||||||||||||||||||||||
| All In Costs | $ | 70,274 | $ | 94,198 | ||||||||||||||||||||||||||
| Year Ended December 31, 2020 | Year Ended December 31, 2019 | |||||||||||||||||||||||||||||
| Guanaceví | Bolañitos | El Compas | El Cubo | Total | Guanaceví | Bolañitos | El Compas | El Cubo | Total | |||||||||||||||||||||
| Throughput tonnes | 346,679 | 331,174 | 79,307 | - | 757,160 | 322,988 | 316,708 | 69,772 | 245,418 | 954,886 | ||||||||||||||||||||
| Payable silver ounces | 3,061,982 | 333,293 | 86,819 | - | 3,482,094 | 2,196,475 | 603,903 | 100,243 | 1,051,302 | 3,951,923 | ||||||||||||||||||||
| Silver equivalent production (ounces) | 3,856,195 | 1,870,358 | 758,334 | - | 6,484,887 | 2,689,552 | 1,807,262 | 710,537 | 1,923,944 | 7,131,295 | ||||||||||||||||||||
| Sustaining cost per ounce | $ | 17.14 | $ | 23.53 | $ | 10.98 | - | $ | 17.59 | $ | 22.86 | $ | 25.11 | $ | 27.49 | $ | 14.85 | $ | 21.19 | |||||||||||
| All In costs per ounce | $ | 20.18 | $ | 23.84 | ||||||||||||||||||||||||||
| Expressed in thousands US dollars | Three Months Ended December 31 | Year Ended December 31 | ||||||||||
| 2020 | 2019 | 2020 | 2019 | |||||||||
| Capital expenditures sustaining | $ | 7,269 | $ | 5,695 | $ | 23,131 | $ | 20,810 | ||||
| Growth capital expenditures | (678 | ) | 94 | 2,408 | 989 | |||||||
| Property, plant and equipment expenditures | $ | 6,591 | $ | 5,789 | $ | 25,539 | $ | 21,799 | ||||
| Expressed in thousands US dollars | Three Months Ended December 31 | Year Ended December 31 | ||||||||||
| 2020 | 2019 | 2020 | 2019 | |||||||||
| Mine site expensed exploration | $ | 729 | $ | 752 | $ | 2,661 | $ | 2,300 | ||||
| Growth exploration | 3,198 | 3,818 | 6,600 | 8,909 | ||||||||
| Exploration expenditures | $ | 3,927 | $ | 4,570 | $ | 9,261 | $ | 11,209 | ||||
| Exploration depreciation and depletion | 28 | 59 | 311 | 238 | ||||||||
| Exploration share-based compensation | 84 | 107 | 184 | 554 | ||||||||
| Exploration expense | $ | 4,039 | $ | 4,736 | $ | 9,756 | $ | 12,001 | ||||
Silver co-product cash costs and gold co-product cash costs are measures used by the Company to manage and evaluate operating performance at each of the Company's operating mining units and consolidated group, but do not have a standardized meaning and are disclosed in addition to IFRS measures. The following tables provide a detailed reconciliation of these measures to the Company's cost of sales, as reported in its consolidated financial statements.
| Expressed in thousands US dollars | Three Months Ended December 31, 2020 | Three Months Ended December 31, 2019 | ||||||||||||||||||||||||||||
| Guanaceví | Bolañitos | El Compas | El Cubo | Total | Guanaceví | Bolañitos | El Compas | El Cubo | Total | |||||||||||||||||||||
| Direct costs per financial statements | $ | 15,635 | $ | 7,420 | $ | 3,060 | $ | - | $ | 26,115 | $ | 12,366 | $ | 6,980 | $ | 4,011 | $ | 5,111 | $ | 28,468 | ||||||||||
| Smelting and refining costs included in net revenue | - | 380 | 111 | - | 491 | - | 968 | 91 | - | 1,059 | ||||||||||||||||||||
| Royalties | 4,210 | 69 | 155 | - | 4,434 | 726 | 63 | 124 | 22 | 935 | ||||||||||||||||||||
| Special mining duty (1) | 1,050 | 354 | - | - | 1,404 | - | - | - | (265 | ) | (265 | ) | ||||||||||||||||||
| Opening finished goods | (3,318 | ) | (335 | ) | (585 | ) | - | (4,238 | ) | (2,455 | ) | (1,604 | ) | (347 | ) | (458 | ) | (4,864 | ) | |||||||||||
| Finished goods NRV adjustment | - | - | 174 | - | 174 | - | - | (391 | ) | - | (391 | ) | ||||||||||||||||||
| Closing finished goods | 1,509 | 250 | 642 | - | 2,401 | 1,509 | 219 | 169 | - | 1,897 | ||||||||||||||||||||
| Direct production costs | 19,086 | 8,138 | 3,557 | $ | - | 30,781 | 12,146 | 6,626 | 3,657 | 4,410 | 26,839 | |||||||||||||||||||
| Three Months Ended December 31, 2020 | Three Months Ended December 31, 2019 | |||||||||||||||||||||||||||||
| Guanaceví | Bolañitos | El Compas | El Cubo | Total | Guanaceví | Bolañitos | El Compas | El Cubo | Total | |||||||||||||||||||||
| Silver production (ounces) | 991,697 | 99,417 | 26,175 | - | 1,117,289 | 673,559 | 109,963 | 33,518 | 122,471 | 939,511 | ||||||||||||||||||||
| Average realized silver price ($) | 24.76 | 24.76 | 24.76 | - | 24.76 | 17.45 | 17.45 | 17.45 | 17.45 | 17.45 | ||||||||||||||||||||
| Silver value ($) | 24,554,418 | 2,461,565 | 648,093 | - | 27,664,076 | 11,753,605 | 1,918,854 | 584,889 | 2,137,119 | 16,394,467 | ||||||||||||||||||||
| Gold production (ounces) | 3,198 | 6,754 | 2,634 | - | 12,586 | 2,025 | 4,088 | 2,298 | 1,167 | 9,578 | ||||||||||||||||||||
| Average realized gold price ($) | 1,885 | 1,885 | 1,885 | - | 1,885 | 1,507 | 1,507 | 1,507 | 1,507 | 1,507 | ||||||||||||||||||||
| Gold value ($) | 6,028,230 | 12,731,290 | 4,965,090 | - | 23,724,610 | 3,051,675 | 6,160,616 | 3,463,086 | 1,758,669 | 14,434,046 | ||||||||||||||||||||
| Total metal value ($) | 30,582,648 | 15,192,855 | 5,613,183 | - | 51,388,686 | 14,805,280 | 8,079,470 | 4,047,975 | 3,895,788 | 30,828,513 | ||||||||||||||||||||
| Pro-rated silver costs (%) | 80% | 16% | 12% | - | 54% | 79% | 24% | 14% | 55% | 53% | ||||||||||||||||||||
| Pro-rated gold costs (%) | 20% | 84% | 88% | - | 46% | 21% | 76% | 86% | 45% | 47% | ||||||||||||||||||||
| Pro-rated silver costs ($) | 15,324 | 1,319 | 411 | - | 16,570 | 9,642 | 1,574 | 528 | 2,419 | 14,273 | ||||||||||||||||||||
| Pro-rated gold costs ($) | 3,762 | 6,819 | 3,146 | - | 14,211 | 2,504 | 5,052 | 3,129 | 1,991 | 12,566 | ||||||||||||||||||||
| Silver co-product cash costs | $ | 15.45 | $ | 13.26 | $ | 15.69 | - | $ | 14.83 | $ | 14.32 | $ | 14.31 | $ | 15.76 | $ | 19.75 | $ | 15.19 | |||||||||||
| Gold co-product cash costs | $ | 1,176 | $ | 1,010 | $ | 1,194 | - | $ | 1,129 | $ | 1,236 | $ | 1,236 | $ | 1,361 | $ | 1,706 | $ | 1,312 | |||||||||||
| Expressed in thousands US dollars | Year Ended December 31, 2020 | Year Ended December 31, 2019 | ||||||||||||||||||||||||||||
| Guanaceví | Bolañitos | El Compas | El Cubo | Total | Guanaceví | Bolañitos | El Compas | El Cubo | Total | |||||||||||||||||||||
| Direct costs per financial statements | $ | 40,693 | $ | 21,796 | $ | 11,612 | $ | - | $ | 74,101 | $ | 41,978 | $ | 23,742 | $ | 9,544 | $ | 25,218 | $ | 100,482 | ||||||||||
| Smelting and refining costs included in net revenue | - | $ | 1,393 | $ | 433 | - | $ | 1,826 | - | 1,981 | 413 | 1,909 | 4,303 | |||||||||||||||||
| Royalties | 7,407 | 197 | 550 | - | 8,154 | 1,410 | 181 | 291 | 152 | 2,034 | ||||||||||||||||||||
| Special mining duty (1) | 1,635 | 354 | - | - | 1,989 | - | - | - | - | - | ||||||||||||||||||||
| Opening finished goods | (1,509 | ) | (219 | ) | (169 | ) | - | (1,897 | ) | (1,247 | ) | (1,457 | ) | - | (502 | ) | (3,206 | ) | ||||||||||||
| Finished goods NRV adjustment | - | - | 174 | - | 174 | - | - | (391 | ) | - | (391 | ) | ||||||||||||||||||
| Closing finished goods | 1,509 | 250 | 642 | - | 2,401 | 1,509 | 219 | 169 | - | 1,897 | ||||||||||||||||||||
| Direct production costs | 49,735 | 23,771 | 13,242 | $ | - | 86,748 | 43,650 | 24,666 | 10,026 | 26,777 | 105,119 | |||||||||||||||||||
| Year Ended December 31, 2020 | Year Ended December 31, 2019 | |||||||||||||||||||||||||||||
| Guanaceví | Bolañitos | El Compas | El Cubo | Total | Guanaceví | Bolañitos | El Compas | El Cubo | Total | |||||||||||||||||||||
| Silver production (ounces) | 3,071,075 | 353,318 | 89,374 | - | 3,513,767 | 2,202,592 | 624,942 | 104,377 | 1,086,824 | 4,018,735 | ||||||||||||||||||||
| Average realized silver price ($) | 21.60 | 21.60 | 21.60 | - | 21.60 | 16.29 | 16.29 | 16.29 | 16.29 | 16.29 | ||||||||||||||||||||
| Silver value ($) | 66,335,220 | 7,631,669 | 1,930,478 | - | 75,897,367 | 35,880,224 | 10,180,305 | 1,700,301 | 17,704,363 | 65,465,193 | ||||||||||||||||||||
| Gold production (ounces) | 9,814 | 18,963 | 8,362 | - | 37,139 | 6,087 | 14,779 | 7,577 | 10,464 | 38,907 | ||||||||||||||||||||
| Average realized gold price ($) | 1,846 | 1,846 | 1,846 | - | 1,846 | 1,422 | 1,422 | 1,422 | 1,422 | 1,422 | ||||||||||||||||||||
| Gold value ($) | 18,116,644 | 35,005,698 | 15,436,252 | - | 68,558,594 | 8,655,714 | 21,015,738 | 10,774,494 | 14,879,808 | 55,325,754 | ||||||||||||||||||||
| Total metal value ($) | 84,451,864 | 42,637,367 | 17,366,730 | - | 144,455,961 | 44,535,938 | 31,196,043 | 12,474,795 | 32,584,171 | 120,790,947 | ||||||||||||||||||||
| Pro-rated silver costs (%) | 79% | 18% | 11% | - | 53% | 81% | 33% | 14% | 54% | 54% | ||||||||||||||||||||
| Pro-rated gold costs (%) | 21% | 82% | 89% | - | 47% | 19% | 67% | 86% | 46% | 46% | ||||||||||||||||||||
| Pro-rated silver costs ($) | 39,066 | 4,255 | 1,472 | - | 45,578 | 35,166 | 8,049 | 1,367 | 14,549 | 56,971 | ||||||||||||||||||||
| Pro-rated gold costs ($) | 10,669 | 19,516 | 11,770 | - | 41,170 | 8,484 | 16,617 | 8,659 | 12,228 | 48,148 | ||||||||||||||||||||
| Silver co-product cash costs | $ | 12.72 | $ | 12.04 | $ | 16.47 | - | $ | 12.97 | $ | 15.97 | $ | 12.88 | $ | 13.09 | $ | 13.39 | $ | 14.18 | |||||||||||
| Gold co-product cash costs | $ | 1,087 | $ | 1,029 | $ | 1,408 | - | $ | 1,109 | $ | 1,394 | $ | 1,124 | $ | 1,143 | $ | 1,169 | $ | 1,238 | |||||||||||
(1) Special mining duty is an EBITDA royalty tax presented as a current income tax in accordance with IFRS.
QUARTERLY RESULTS AND TRENDS
The following table presents selected financial information for each of the most recent eight quarters:
|
Table in thousands of U.S. dollars except for share |
2020 |
2019 |
||||||
|
numbers and per share amounts |
Q4 |
Q3 |
Q2 |
Q1 |
Q4 |
Q3 |
Q2 |
Q1 |
|
|
||||||||
|
Gross Sales |
$61,238 |
$36,148 |
$20,529 |
$22,372 |
$34,610 |
$28,589 |
$29,382 |
$29,143 |
|
Smelting and refining costs included in net revenue |
491 |
562 |
328 |
445 |
1,145 |
947 |
1,089 |
1,122 |
|
Direct costs |
26,115 |
18,682 |
11,962 |
17,342 |
27,653 |
21,329 |
26,215 |
25,285 |
|
Royalties |
4,434 |
2,029 |
834 |
857 |
935 |
446 |
336 |
317 |
|
Mine operating cash flow before taxes |
30,198 |
14,875 |
7,405 |
3,728 |
4,877 |
5,867 |
1,742 |
2,419 |
|
Share-based compensation |
60 |
87 |
92 |
91 |
37 |
50 |
53 |
55 |
|
Amortization and depletion |
8,919 |
8,497 |
4,197 |
6,523 |
8,055 |
7,531 |
7,794 |
8,115 |
|
Write down on inventory |
405 |
- |
- |
|
576 |
- |
- |
- |
|
Mine operating earnings (loss) |
$20,814 |
$6,291 |
$3,116 |
($2,886) |
($3,791) |
($1,714) |
($6,105) |
($5,751) |
|
Basic earnings (loss) per share |
$0.13 |
$0.00 |
($0.02) |
($0.11) |
($0.13) |
($0.05) |
($0.08) |
($0.10) |
|
Diluted earnings (loss) per share |
$0.13 |
$0.00 |
($0.02) |
($0.11) |
($0.13) |
($0.05) |
($0.08) |
($0.10) |
|
Weighted shares outstanding |
157,536,658 |
156,265,280 |
147,862,393 |
141,810,208 |
140,054,885 |
137,739,857 |
132,158,891 |
131,395,790 |
|
Net earnings (loss) |
$19,923 |
$451 |
($3,289) |
($15,926) |
($17,897) |
($6,768) |
($10,123) |
($13,278) |
|
Amortization and depletion |
8,965 |
8,296 |
4,213 |
6,268 |
8,194 |
7,194 |
7,314 |
7,227 |
|
Finance costs |
332 |
359 |
356 |
310 |
230 |
177 |
103 |
92 |
|
Current income tax |
1,937 |
595 |
195 |
266 |
1,308 |
512 |
184 |
698 |
|
Deferred income tax |
(7,112) |
556 |
(514) |
1,864 |
3,100 |
(567) |
(823) |
(350) |
|
NRV cost adjustment |
231 |
375 |
246 |
500 |
236 |
478 |
644 |
999 |
|
EBITDA |
$24,276 |
$10,632 |
$1,207 |
($6,718) |
($4,829) |
$1,026 |
($2,701) |
($4,612) |
*For Q4, 2020 and Q4, 2019 write downs on inventory at period end have been shown as a separate line item in the above reconciliation. For prior periods, it has been included as components of direct costs and amortization and depletion.
The following table presents selected production information for each of the most recent eight quarters:
|
Highlights |
2020 |
2019 |
||||||
|
|
Q4 |
Q3 |
Q2 |
Q1 |
Q4 |
Q3 |
Q2 |
Q1 |
|
Processed tonnes |
237,389 |
206,324 |
114,120 |
199,327 |
236,531 |
234,196 |
237,640 |
246,519 |
|
Guanaceví |
106,425 |
83,816 |
62,231 |
94,207 |
92,323 |
78,517 |
75,591 |
76,557 |
|
Bolañitos |
107,332 |
98,945 |
41,680 |
83,217 |
82,147 |
71,541 |
76,386 |
86,634 |
|
El Compas |
23,632 |
23,563 |
10,209 |
21,903 |
22,855 |
21,885 |
21,242 |
3,790 |
|
El Cubo |
- |
- |
- |
- |
39,206 |
62,253 |
64,421 |
79,538 |
|
Silver ounces |
1,117,289 |
942,274 |
596,545 |
857,659 |
939,511 |
948,547 |
1,059,322 |
1,071,355 |
|
Guanaceví |
991,697 |
806,917 |
527,347 |
745,114 |
673,559 |
533,923 |
536,966 |
458,144 |
|
Bolañitos |
99,417 |
112,094 |
55,682 |
86,125 |
109,963 |
147,078 |
171,891 |
196,010 |
|
El Compas |
26,175 |
23,263 |
13,516 |
26,420 |
33,518 |
43,634 |
24,007 |
3,218 |
|
El Cubo |
- |
- |
- |
- |
122,471 |
223,912 |
326,458 |
413,983 |
|
Silver grade |
169 |
162 |
188 |
155 |
140 |
144 |
157 |
154 |
|
Guanaceví |
331 |
336 |
304 |
280 |
252 |
232 |
242 |
206 |
|
Bolañitos |
34 |
42 |
47 |
40 |
51 |
77 |
78 |
86 |
|
El Compas |
50 |
48 |
60 |
58 |
65 |
90 |
72 |
61 |
|
El Cubo |
- |
- |
- |
- |
106 |
128 |
178 |
183 |
|
Silver recovery |
86.8 |
87.6 |
86.3 |
86.1 |
88.3 |
87.6 |
88.5 |
87.7 |
|
Guanaceví |
87.6 |
89.1 |
86.7 |
87.9 |
90.0 |
91.2 |
91.3 |
90.4 |
|
Bolañitos |
84.7 |
83.9 |
88.4 |
80.5 |
81.6 |
83.0 |
89.7 |
81.8 |
|
El Compas |
68.9 |
64.0 |
68.6 |
64.7 |
70.2 |
68.9 |
48.8 |
43.3 |
|
El Cubo |
- |
- |
- |
- |
91.7 |
87.4 |
88.6 |
88.5 |
|
Gold ounces |
12,586 |
10,260 |
5,817 |
8,476 |
9,578 |
9,716 |
9,558 |
10,055 |
|
Guanaceví |
3,198 |
2,342 |
1,847 |
2,427 |
2,025 |
1,557 |
1,367 |
1,138 |
|
Bolañitos |
6,754 |
5,779 |
2,508 |
3,922 |
4,088 |
3,226 |
3,035 |
4,430 |
|
El Compas |
2,634 |
2,139 |
1,462 |
2,127 |
2,298 |
2,699 |
2,238 |
342 |
|
El Cubo |
- |
- |
- |
- |
1,167 |
2,234 |
2,918 |
4,145 |
|
Gold grade |
1.90 |
1.82 |
1.84 |
1.57 |
1.53 |
1.49 |
1.51 |
1.45 |
|
Guanaceví |
1.01 |
0.95 |
1.05 |
0.87 |
0.75 |
0.67 |
0.62 |
0.52 |
|
Bolañitos |
2.22 |
2.04 |
2.10 |
1.71 |
1.81 |
1.62 |
1.49 |
1.82 |
|
El Compas |
4.41 |
3.98 |
5.55 |
4.02 |
4.33 |
4.56 |
4.35 |
3.66 |
|
El Cubo |
- |
- |
- |
- |
1.16 |
1.29 |
1.63 |
1.84 |
|
Gold recovery |
87.0 |
85.0 |
86.3 |
84.4 |
82.2 |
86.7 |
83.0 |
87.4 |
|
Guanaceví |
92.5 |
91.5 |
87.9 |
92.1 |
91.0 |
92.1 |
90.7 |
88.9 |
|
Bolañitos |
88.2 |
89.1 |
89.1 |
85.7 |
85.5 |
86.6 |
82.9 |
87.4 |
|
El Compas |
78.6 |
70.9 |
80.3 |
75.1 |
72.2 |
84.1 |
75.3 |
76.8 |
|
El Cubo |
- |
- |
- |
- |
79.8 |
86.5 |
86.4 |
88.1 |
|
Cash costs per oz (1) |
$6.83 |
$3.69 |
$2.78 |
$7.85 |
$13.63 |
$11.51 |
$13.67 |
$12.55 |
|
Guanaceví |
$13.21 |
$9.64 |
$8.48 |
$9.01 |
$13.54 |
$12.83 |
$17.37 |
$21.06 |
|
Bolañitos |
($44.56) |
($40.89) |
($30.20) |
($7.32) |
$4.82 |
$8.13 |
$11.56 |
$2.43 |
|
El Compas |
($50.04) |
$0.44 |
($96.83) |
$22.10 |
$10.90 |
($25.37) |
($1.52) |
($5.59) |
|
El Cubo |
- |
- |
- |
- |
$22.67 |
$17.67 |
$9.63 |
$7.72 |
|
AISC per oz (1) |
$18.52 |
$17.48 |
$14.91 |
$18.38 |
$23.20 |
$21.53 |
$20.90 |
$19.37 |
|
Guanaceví |
$19.67 |
$17.76 |
$15.00 |
$14.61 |
$19.48 |
$20.99 |
$24.94 |
$27.56 |
|
Bolañitos |
$16.98 |
$10.51 |
$29.79 |
$44.17 |
$38.38 |
$29.90 |
$22.64 |
$16.36 |
|
El Compas |
($20.19) |
$40.39 |
($48.25) |
$45.98 |
$47.68 |
$3.46 |
$43.62 |
$18.55 |
|
El Cubo |
- |
- |
- |
- |
$24.41 |
$20.77 |
$11.47 |
$11.43 |
|
Direct costs per tonne (1) |
$129.66 |
$112.37 |
$109.74 |
$101.63 |
$113.47 |
$106.76 |
$114.40 |
$105.84 |
|
Guanaceví |
$179.34 |
$146.26 |
$126.13 |
$111.89 |
$131.56 |
$116.20 |
$148.84 |
$145.37 |
|
Bolañitos |
$75.82 |
$67.82 |
$77.02 |
$68.65 |
$80.66 |
$81.03 |
$79.90 |
$70.87 |
|
El Compas |
$150.52 |
$178.92 |
$143.50 |
$182.81 |
$160.01 |
$137.99 |
$138.03 |
$110.03 |
|
El Cubo |
- |
- |
- |
- |
$112.48 |
$113.44 |
$107.09 |
$105.69 |
(1) Cash cost per oz, AISC per oz and Direct costs per tonne are not-IFRS measures.
Key Economic Trends
Precious Metal Price Trends
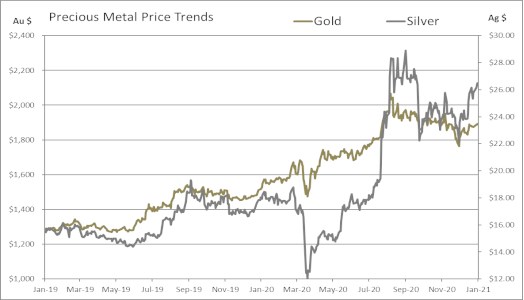
The prices of silver and gold are the largest single factor in determining profitability and cash flow from operations. The financial performance of the Company has been, and is expected to continue to be, closely linked to the prices of silver and gold.
During the year ended December 31, 2020, the average price of silver was $20.53 per ounce, with silver trading between $12.01 and $28.89 per ounce based on the London Fix silver price. This compares to an average of $16.20 per ounce for the year ended December 31, 2019, with a low of $14.37 and a high of $19.31 per ounce. For the year ended December 31, 2020, the Company realized an average price of $21.60 per silver ounce compared with $16.29 for the year ended December 31, 2019.
During the year ended December 31, 2020, the average price of gold was $1,771 per ounce, with gold trading between $1,474 and $2,067 per ounce based on the London Fix PM gold price. This compares to an average of $1,393 per ounce during the year ended December 31, 2019, with a low of $1,270 and a high of $1,546 per ounce. During the year ended December 31, 2020, the Company realized an average price of $1,846 per ounce compared with $1,422 for the year ended December 31, 2019.
Uncertainty surrounding tariff and trade discussions, the results of the US elections, signals of US economic slowdown and rising geopolitical risk renewed interest in precious metals in 2019. The impact of measures to combat the spread of COVID-19 on global economy resulted in significant volatility in the financial markets, including the gold and silver market in March 2020. Gold prices increased on an anticipated global economic recession and government financial stimulus announced to aid the economic recovery. During March 2020, silver prices capitulated on expectations of a global recession with the expectation of reduced industrial demand, then subsequently significantly rebounded as investment demand increased due to the monetary aspects of silver. The on-going risks and uncertainties from the COVID-19 pandemic has led to further government stimulus and ultimately further investment demand for gold and silver.
Currency Fluctuations
The Company's operations are located in Mexico and therefore a significant portion of operating costs and capital expenditures are denominated in Mexican pesos. The Company's corporate activities are based in Vancouver, Canada with the significant portion of these expenditures being denominated in Canadian dollars. Generally, as the U.S. dollar strengthens, these currencies weaken, and as the U.S. dollar weakens, these currencies strengthen.
During the year ended December 31, 2020, the Mexican peso was relatively flat until a significant decrease in oil prices followed by the COVID-19 crisis in March 2020 when the Mexican Peso significantly depreciated against the U.S. dollar, as funds flowed to safe haven markets and assets. Subsequently, the Mexican peso gradually appreciated against the U.S. dollar back to levels slightly lower than pre-crisis levels as investment risk was re-established.
During 2020, the average foreign exchange rate was $21.48 Mexican pesos per U.S. dollar, with the peso trading within a range of $18.53 to $25.00. This compares to a relatively flat 2019, with an average of $19.24 during the corresponding period of 2019, with a range of $18.73 to $20.14 Mexican pesos per U.S. dollar. During the year ended December 31, 2019, the Mexican peso remained relatively stable relative to the U.S. dollar, although volatility occurred throughout the year.
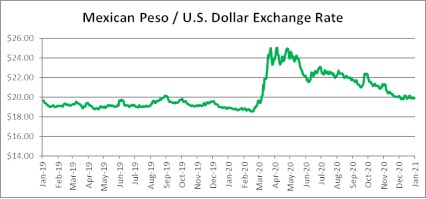
During the year ended December 31, 2020, the Canadian dollar was flat until a significant decrease in oil prices and then the COVID-19 crisis in March 2020 when the Canadian dollar significantly depreciated against the U.S. dollar as funds invested in safe haven markets and assets. Subsequently, the Canadian dollar gradually appreciated against the U.S. dollar back to levels slightly lower than pre-crisis levels as investment risk was re-established. During the period, the average foreign exchange rate was $1.3409 Canadian dollars per U.S. dollar, with the Canadian dollar trading within a range of $1.272 to $1.453. This compares to an average of $1.327 during 2019, with a range of $1.302 to $1.364 Canadian dollars per U.S. dollar during 2019.

Cost Trends

The Company's profitability is subject to industry wide cost pressures on development and operating costs with respect to labour, energy, consumables and capital expenditures. Underground mining is labour intensive and approximately 33% of the Company's production costs are directly tied to labour. In order to mitigate the impact of higher labour and consumable costs, the Company focuses on continuous improvement by promoting more efficient use of materials and supplies and by pursuing more advantageous pricing while increasing performance and without compromising operational integrity. Mining, processing and indirect costs improved on per tonne basis compared to prior year, however royalties paid for ore mined from the Porvenir Cuatro extension increased substantially, a higher proportion of third party ore was purchased and improved profitability resulted in special mining duties paid to the government.
ANNUAL OUTLOOK
The Company has implemented plans to minimize the risks of the COVID-19 virus, both to employees and to the business. The Mexican government declared mining as an essential business, however in Mexico positive COVID-19 cases continue at a significant rate and to date the infection rate has yet to flatten. A local outbreak, an impediment to supply or market logistics or change in government health orders remains a significant risk. The mines are operating under strict safety protocols with the expectations of operating near throughput capacity. At each site, the Company is following government health protocols and is closely monitoring the pandemic with local health authorities. The Company has posted health advisories to educate employees about the COVID-19 symptoms, best practices to avoid contracting and spreading the virus, and procedures to follow if symptoms are experienced.
As the COVID-19 global pandemic is dynamic, the ultimate duration and severity of the pandemic remains uncertain. The pandemic can have a material impact on the Company's 2021 production and cost estimates.
Production
In 2021, silver production is expected to range from 3.6 to 4.3 million oz and gold production is anticipated be in the 31,000 to 35,500 oz range. Silver equivalent production is forecasted to total 6.1-7.1 million oz using an 80:1 silver:gold ratio.
|
Mine |
Ag (M oz) |
Au (K oz) |
Ag Eq (M oz) |
Tonnes/Day (tpd) |
|
Guanaceví |
3.1-3.7 |
8.0-10.0 |
3.7-4.5 |
1,100-1,200 |
|
Bolañitos |
0.4-0.5 |
21.0-23.0 |
2.1-2.3 |
1,100-1,200 |
|
El Compas |
0.1-0.1 |
2.0-2.5 |
0.2-0.2 |
200-250 |
|
Total |
3.6-4.3 |
31.0-35.5 |
6.1-7.1 |
2,400-2,650 |
At Guanaceví, production will range between 1000 tpd to 1200 tpd and average 1100 tpd from the Milache, SCS and P4E orebodies. A significant portion of production will be mined from the Porvenir Cuatro extension on the El Curso concessions. The El Curso concessions were leased from a third party with no upfront costs but with significant royalty payments on production. As a result, the cash cost per ounce will increase in 2021, although direct operating costs per tonne should be similar to 2020.
At Bolañitos, production will range between 1000 tpd to 1200 tpd and average 1,050 tpd from the Plateros-La Luz, Lucero-Karina and Bolañitos-San Miguel vein systems. Ore grades are expected to be similar to 2020 mined grades and the cash cost per oz and direct cost per tonne should be similar to 2020.
At El Compas, production is forecast to continue into Q2, 2021 from the El Compas mine. New resources discovered in the Calicanto and Misie veins on the Calicanto property are currently being evaluated for possible addition to the mine plan.
Sustaining Capital Investments
In 2021, Endeavour plans to invest $32.8 million on capital projects, mainly as sustaining capital at the three operating mines, including $2.0 million in growth capital to maintain the exploration concessions and cover corporate infrastructure. At current metal prices, the sustaining capital investments should be covered by operating cash flow.
At Guanacevi, $16.7 million will be invested on capital projects, the largest of which is the development of 6.8 kilometres (km) of mine access at the Milache, SCS and the P4E orebodies for an estimated $7.2 million. The additional $9.5 million will go to upgrade the mining fleet, support site infrastructure, and expand the tailings dam.
At Bolañitos, $14.1 million will be invested on capital projects, including $7.8 million for 5.3 km of mine development to access reserves and resources in the Plateros-La Luz, Lucero-Karina and Bolañitos-San Miguel vein systems. The additional $5.9 million will go to upgrade the mining fleet, support site infrastructure, raise the tailings dam and commence a new portal for the Belen resources.
At El Compas, management is evaluating new areas for future production on the Calicanto concessions and below the current working areas of the Orito vein.
|
Mine |
Other |
Sustaining |
Growth |
Total |
|
| Mine |
Development |
Capital |
Capital |
Capital |
Capital |
|
Guanaceví |
$7.2 million |
$9.5 million |
$16.7 million |
- |
$16.7 million |
|
Bolañitos |
$8.7 million |
$5.4 million |
$14.1 million |
- |
$14.1 million |
|
Corporate |
- |
- |
- |
$2.0 million |
$ 2.0 million |
|
Total |
$15.9 million |
$14.9 million |
$30.8 million |
$2.0 million |
$32.8 million |
Operating Costs
Cash costs, net of gold by-product credits, are expected to be $7.00-8.00 per oz of silver produced in 2021. Consolidated cash costs on a co-product basis are anticipated to be $13.00-$14.00 per oz silver and $1,000-$1,100 per oz gold.
All-in sustaining costs, net of gold by-product credits, in accordance with the World Gold Council standard, are estimated to be $19.00-$20.00 per oz of silver produced. When non-cash items such as stock-based compensation are excluded, AISC are forecast to be in the $18.00-$19.00 range.
Direct operating costs are estimated to be in the range of $105-$115 per tonne, including royalties and special mining duties, which are both expected to be significantly higher in 2021 compared to 2020.
Management has used a $22 per oz silver price, $1,760 per oz gold price, and 20:1 Mexican peso per US dollar exchange rate for its 2021 cost forecasts.
Development Investment and Expenditures
At Terronera, the feasibility study is currently being prepared which will include the results of additional engineering studies and revised cost estimates at a cost of $1.0 million in 2021. Management has approved a $9.0 million budget to complete the feasibility study, expand the project team, prepare for site-prep and source long lead items required to commence development upon completion of the feasibility study. Following the completion of the feasibility study and board approval, management will release a revised program and budget for the project.
Exploration Expenditures
In 2021, the Company plans to spend $10.2 million drilling 50,000 metres of core on brownfields projects, greenfields exploration and development engineering across its portfolio of mines and properties. At the Guanacevi and Bolanitos operating mines, 11,500 metres of core drilling are planned at a cost of $2.0 million and $1.9 million. respectively to replace reserves and expand resources.
On the exploration and development projects, expenditures of $6.3 million are planned to fund 27,000 metres of core drilling at the Terronera project to test multiple regional targets, the Parral project to continue drilling the San Patricio and Veta Colorado vein systems and the Paloma project in Chile. The Company is currently permitting of the Cerro Marquez and Aida projects and will continue to map and sample to prioritize targets for drilling.
|
Project |
2021 Activity |
Drill Metres |
Expenditures |
|
Guanaceví |
Drilling |
11,500 |
$2.0 million |
|
Bolañitos |
Drilling |
11,500 |
$1.9 million |
|
Parral |
Drilling/Economic Study |
8,000 |
$2.0 million |
|
Chile - Paloma |
Drilling |
3,000 |
$1.2 million |
|
Chile - Other |
Evaluation |
- |
$0.6 million |
|
Terronera |
PFS/Development |
16,000 |
$ 2.5 million |
|
Total |
|
50,000 |
$10.2 million |
LIQUIDITY AND CAPITAL RESOURCES
Cash and cash equivalents increased from $23.4 million at December 31, 2019 to $61.1 million at December 31, 2020. The Company had working capital of $70.4 million at December 31, 2020 (December 31, 2019 - $38.4 million). The $32.0 million increase in working capital is primarily due to net equity raise of $25.3 million, $6.9 million from proceeds of exercised options and cash flow generated by the operations offset by $25.5 million investment in mineral property, plant and equipment and $3.2 million loan repayments.
Operating activities generated $39.0 million during 2020 compared to using $9.6 million in 2019. The significant non-cash adjustments to the net earnings of $1.2 million were amortization and depletion of $28.9 million, share-based compensation of $3.0 million, a deferred income tax recovery of $5.2 million, finance costs of $1.3 million, a write down of inventory to net realizable value of $0.4 million, net impairment of non-current assets of $0.4 million and a change in non-cash working capital of $10.1 million. The change in non-cash working capital was primarily due to a collection of tax refunds, an increase in accounts payable, including $3.6 million mark-to-market fluctuations for director's deferred share units offset by a significant amount of stockpiled ore and reduction of trade receivables.
The Company's Mexican subsidiaries pay IVA, Impuesto al Valor Agregado ("IVA"), on the purchase and sale of goods and services. The net amount paid is recoverable but is subject to review and assessment by the tax authorities. The Company regularly files the required IVA returns and all supporting documentation with the tax authorities, however, the Company has been advised that certain IVA amounts receivable from the tax authorities are being withheld pending completion of the authorities' audit of certain of the Company's third-party suppliers. Under Mexican law the Company has legal rights to those IVA refunds and the results of the third-party audits should have no impact on refunds. A smaller portion of IVA refund requests are from time to time improperly denied based on the alleged lack of compliance of certain formal requirements and information returns by the Company's third-party suppliers. The Company takes necessary legal action on the delayed refunds as well as any improperly denied refunds.
The Company is in regular contact with the tax authorities in respect of its IVA filings and believes that the full amount of its IVA receivables will ultimately be received; however, the timing of recovery of these amounts and the nature and extent of any adjustments to the Company's IVA receivables remains uncertain
Investing activities during the year used $29.8 million compared to $21.8 million in 2019. The investments in 2020 were primarily for sustaining capital at existing operations, while for the comparable period in 2019 capital expenditures pertained to sustaining capital at the existing operations and the construction of the El Compas operation. The Company has accelerated mine development at both Guanaceví and Bolañitos beginning in 2019 and extending into 2020 to provide sufficient access to ore in new ore bodies. The Company made a net investment in marketable securities of $4.5 million during Q4, 2020.
Capital additions totaled $30.1 million in property, plant and equipment for the year ended December 31, 2020, including financed mobile equipment, as follows:
At Guanaceví, the Company invested $13.0 million, with $8.4 million spent on 6.5 kilometres of mine development and acquired $3.0 million of mobile equipment, of which $1.9 million was financed to accelerate mine development. The Company continued to invest on upgrades for the plant and surrounding infrastructure, including $0.9 million on crusher upgrades, mine site improvements and the tailings facility, $0.5 million was spent on office and building infrastructure and $0.2 million on new light vehicles.
At Bolañitos, the Company invested $14.2 million, with $9.1 million spent on 8.2 kilometres of mine development and acquired $4.6 million of mobile equipment, of which $2.1 million was financed to accelerate mine development, $0.2 million on plant, $0.2 million was on light vehicles and $0.1 million office and IT equipment.
Exploration incurred $1.0 million in holding costs and acquisition of concessions, the Terronera development project acquired a ball mill for $2.0 million, El Compas incurred $0.1 million in equipment, while the Bolañitos and El Cubo operations sold used equipment resulting in $0.2 million in proceeds and in a $0.1 million loss in the period.
Financing activities for the 2020 increased cash by $27.5 million, compared to increasing cash by $21.2 million in 2019. During 2020, the Company received gross proceeds through an at-the-market financing of $26.4 million, paid $1.1 million in share issue costs, received $6.9 million on the exercise of employee options and paid $4.6 million in interest and principal repayments on loans and leases. By comparison, during the same period in 2019, the Company raised gross proceeds of $23.6 million, received $0.3 million on the exercise of employee options, paid $0.7 million in share issue costs and paid $1.6 million in interest and principal repayments on loans and lease.
In April 2018, the Company filed a short form base shelf prospectus (the "Base Shelf") to qualify for the distribution of up to CAD$150 million of common shares, warrants or units of the Company comprising any combination of common shares and warrants ("Securities"). The distribution of Securities could be effected from time to time in one or more transactions at a fixed price or prices, which could be changed with market prices prevailing at the time of sale, or at prices related to such prevailing market prices to be negotiated with purchasers and as set forth in an accompanying prospectus supplement, including transactions that are deemed to be at the market distributions. The Base Shelf also provided the Company with the ability to conduct an "At-The-Market" offering through an "At-The-Market" facility ("2018 ATM") equity distribution agreement.
On June 13, 2018, the Company entered into an ATM equity facility with BMO Capital Markets (the lead agent), CIBC Capital Markets, H.C. Wainwright & Co., HSBC and TD Securities (together, the "Agents"). Under the terms of this ATM facility, the Company could, from time to time, sell common stock having an aggregate offering value of up to $35.7 million on the New York Stock Exchange. The Company determined, at its sole discretion, the timing and number of shares to be sold under the ATM facility. From January 1st to April 21st 2020, the Company issued 2,164,119 common shares under the ATM facility at an average price of $1.56 per share for gross proceeds of $3.4 million, less commissions of $76 thousand. The ATM program was completed in April 2020.
In April 2020, the Company filed a short form base shelf prospectus to qualify the distribution of up to CAD$150 million of various securities of the Company, including common shares. The distribution of such securities of the Company may be effected from time to time in one or more transactions at a fixed price or prices, which may vary with market prices prevailing at the time of sale, or at prices related to such prevailing market prices to be negotiated with purchasers and as set forth in an accompanying prospectus supplement, including transactions that are deemed to be at the market distributions. The Base Shelf also provides the Company with the ability to conduct an "At-The-Market" offering through an "At-The-Market" facility ("2020 ATM") equity distribution agreement.
On May 14, 2020, the Company entered into an ATM equity facility (the "May 2020 ATM Facility") with a syndicate of agents. Under the terms of the 2020 ATM Facility, the Company could, from time to time, sell common shares having an aggregate offering value of up to $23 million on the New York Stock Exchange. The Company determined, at its sole discretion, the timing and number of shares to be sold under the May 2020 ATM Facility.
From May 14, 2020 to August 17, 2020, the Company issued 11,640,411 common shares under the 2020 ATM Facility at an average price of $1.97 per share for gross proceeds of $23.0 million less commission of $0.6 million and deferred financing costs of $0.3 million which has been presented net of share capital. The ATM program was completed in August 2020.
In total, during 2020, the Company issued 13,804,530 common shares under the combined ATM facilities at an average price of $1.91 per share for gross proceeds of $26.4 million, less commission and financing fees of $1.2 million which has been presented net of share capital.
The purpose of the 2018 and May 2020 ATM Facilities net proceeds were to advance the exploration and development of the Terronera Project and to add to the Company's working capital.
For the 2018 ATM Facility, completed in April 2020, the net proceeds were used as follows:
| Use of proceeds | |||
| Net proceeds received | $ | 34,405 | |
| Advancement of Terronera Project | (10,380 | ) | |
| Allocated to working capital | $ | 24,025 |
For the May 2020 ATM Facility, completed in August 2020, the net proceeds were used as follows:
| Use of proceeds | |||
| Net proceeds received | $ | 22,399 | |
| Advancement of Terronera Project | (2,563 | ) | |
| Allocated to working capital | $ | 19,836 |
On October 1, 2020, the Company entered into an ATM equity facility (the "October 2020 ATM Facility") with a syndicate of agents. Under the terms of the October 2020 ATM Facility, the Company may, from time to time, sell common shares having an aggregate offering value of up to $60 million on the New York Stock Exchange. The Company determines, at its sole discretion, the timing and number of shares to be sold under the October 2020 ATM Facility during the 20 month sales agreement term. As at December 31, 2020 there have been no shares issued under this facility.
Management of the Company believes that operating cash flow and existing working capital will be sufficient to cover 2021 capital requirements and commitments. The Company is assessing financing alternatives, including equity or debt or a combination of both to fund future growth, including the development of the Terronera project.
As at December 31, 2020, the Company's issued share capital was $517.7 million, representing 157,924,708 common shares, and the Company had options outstanding to purchase 5,978,300 common shares with a weighted average exercise price of CAD$3.29.
Contingencies
Minera Santa Cruz y Garibaldi SA de CV ("MSCG"), a subsidiary of the Company, received a MXN 238 million assessment on October 12, 2010 by Mexican fiscal authorities for failure to provide the appropriate support for certain expense deductions taken in MSCG's 2006 tax return, failure to provide appropriate support for loans made to MSCG from affiliated companies, and deemed an unrecorded distribution of dividends to shareholders, among other individually immaterial items. MSCG immediately initiated a Nullity action and filed an administrative attachment to dispute the assessment.
In June 2015, the Superior Court ruled in favour of MSCG on a number of the matters under appeal; however, the Superior Court ruled against MSCG for failure to provide appropriate support for certain deductions taken in MSCG's 2006 tax return. In June 2016, the Company received a MXN 122.9 million ($6.2 million) tax assessment based on the June 2015 ruling. The 2016 tax assessment comprised of MXN 41.8 million in taxes owed ($2.1 million), MXN 17.7 million ($0.9 million) in inflationary charges, MXN 40.4 million ($2.0 million) in interest and MXN 23.0 million ($1.2 million) in penalties. The 2016 tax assessment was issued for failure to provide the appropriate support for certain expense deductions taken in MSCG's 2006 tax return, failure to provide appropriate support for loans made to MSCG from affiliated companies. If MSCG agrees to pay the tax assessment, or a lesser settled amount, it is eligible to apply for forgiveness of 100% of the penalties and 50% of the interest.
The Company filed an appeal against the June 2016 tax assessment on the basis that certain items rejected by the courts were included in the new tax assessment and a number of deficiencies exist within the assessment. Since issuance of the assessment interest charges of MXN 9.1 million ($0.5 million) and inflationary charges of MXN 13.7 million ($0.7 million) has accumulated.
Included in the Company's consolidated financial statements, are net assets of $595,000, including $42,000 in cash, held by MSCG. Following the Tax Court's rulings, MSCG has been in discussions with the tax authorities with regards to the shortfall of assets within MSCG to settle its estimated tax liability. An alternative settlement option would be to transfer the shares and assets of MSCG to the tax authorities. The Company recognized an allowance for transferring the shares and assets of MSCG amounting to $595,000 in a prior year. The Company is currently assessing MSCG's settlement options based on ongoing court proceedings and discussion with the tax authorities. The Company continues to assess that it is probable its appeal should prevail, and the maximum estimated exposure is the amount of the above allowance.
Compania Minera Del Cubo SA de CV ("Cubo"), a subsidiary of the Company, received an MXN 58.5 million (US $2.9 million) assessment in 2019 by Mexican fiscal authorities for failure to provide the appropriate support for depreciation deductions taken in the Cubo 2016 tax return and denied deductions of certain suppliers. The tax assessment consists of MXN 24.1 million ($1.2 million) for taxes, MXN 21.0 million ($1.1 million) for penalties, 10.4 million ($0.5 million) for interest and MXN 3.0 million ($0.1 million) for inflation. At the time of the tax assessment the Cubo entity had and continues to have sufficient loss carry forwards which would be applied against the assessed difference of taxable income. The Mexican tax authorities did not consider these losses in the assessment.
Due to the denial of certain suppliers for income tax purposes in the Cubo assessment, the invoices from these suppliers have been assessed as ineligible for refunds of IVA paid on the invoices. The assessment includes MXN 14.7 million ($0.7 million) for re-payment of IVA (value added taxes) refunded on these supplier payments. In the Company's judgement the suppliers and invoices meet the necessary requirements to be deductible for income tax purposes and the recovery of IVA.
The Company has filed an administrative appeal related to the 2016 Cubo Tax assessment. Cubo has provided a lien on certain El Cubo mining concessions during the appeal process. Since issuance of the assessment interest charges of MXN 9.9 million ($0.5 million) and inflationary charges of MXN 1.6 million ($0.1 million) has accumulated. The Company continues to assess that it is probable that its appeal will prevail, and no provision is required in respect of the Cubo assessment.
The Company is required to use judgement to determine certain tax treatments in calculating income tax expense and IVA recoverable. A number of these judgements are subject to various uncertainties. From time to time, Mexican authorities may improperly apply, re-interpret legislation or disregard precedents and it is possible that of these uncertainties may be resolved unfavorably for the Company.
Capital Requirements
As of December 31, 2020, the Company held $61.1 million in cash and $70.4 million in working capital. The duration and severity of the global COVID-19 pandemic could have a material impact on the Company's liquidity. The Mexican government declared mining as an essential business, however in Mexico positive COVID-19 cases continue at a significant rate and to date, the infection rate has not declined. A local outbreak, an impediment to supply or market logistics or change in government health orders remains a significant risk. The mines are operating under strict safety protocols with the expectations of operating near throughput capacity.
The Company may be required to raise additional funds through future debt or equity financings in order to carry out its business plans. The Company will continue to monitor capital markets, economic conditions, the COVID-19 global pandemic and assess its short term and long term capital needs.
See Annual Outlook on page 31 for discussion on planned capital and exploration expenditures.
Contractual Obligations
The Company had the following undiscounted contractual obligations at December 31, 2020:
| Payments due by period (in thousands of dollars) | |||||||||||||||
| Contractual Obligations | Total | Less than 1 year |
1 - 3 years | 3 - 5 years | More than 5 years |
||||||||||
| Capital asset purchases | $ | 955 | $ | 955 | $ | - | $ | - | $ | - | |||||
| Loans payable | 10,782 | 4,181 | 6,098 | 503 | - | ||||||||||
| Lease liabilities | 1,316 | 238 | 334 | 320 | 424 | ||||||||||
| Other contracts | 856 | 135 | 219 | 219 | 283 | ||||||||||
| Other Long-Term Liabilities | 10,028 | - | 5,299 | 2,174 | 2,555 | ||||||||||
| Total | $ | 23,937 | $ | 5,509 | $ | 11,950 | $ | 3,216 | $ | 3,262 |
Transactions with Related Parties
The Company shares common administrative services and office space with Aztec Metals Corp., which is considered a related party company by virtue of Bradford Cooke, the Company's Chief Executive Officer, being a common director. From time to time, Endeavour incurs third-party costs on behalf of related parties, which are charged on a full cost recovery basis. The charges for these costs totaled $1,000 and $4,000 for the three and twelve months ended December 31, 2020 respectively (December 31, 2019 - $2,000 and $8,000 respectively). The Company had a $2,000 net receivable related to administration costs outstanding as at December 31, 2020 (December 31, 2019 - $1,000).
The Company was charged $49,000 and $255,000 for legal services for the three and twelve months ended December 31, 2020 respectively by a firm in which the Company's corporate secretary is a partner (December 31, 2019 - $68,000 and $215,000 respectively). The Company has $26,000 payable to the legal firm as at December 31, 2020 (December 31, 2019 - $33,000).
Financial Instruments and fair value measurements
As at December 31, 2020 and 2019, the carrying and fair values of Endeavour's financial instruments by category were as follows:
| As at December 31, 2020 | As at December 31, 2019 | |||||||||||
| Expressed in thousands US dollars | Carrying | Estimated | Carrying | Estimated | ||||||||
| value | Fair value | value | Fair value | |||||||||
| Financial assets: | ||||||||||||
| Cash and cash equivalents | $ | 61,083 | $ | 61,083 | $ | 23,368 | $ | 23,368 | ||||
| Other investments | 4,767 | 4,767 | 69 | 69 | ||||||||
| Trade receivables | 8,755 | 8,755 | 6,722 | 6,722 | ||||||||
| Other receivables | 11,389 | 11,389 | 1,278 | 1,278 | ||||||||
| Total financial assets | $ | 85,994 | $ | 85,994 | $ | 31,437 | $ | 31,437 | ||||
| Financial liabilities: | ||||||||||||
| Accounts payable and accrued liabiities | $ | 27,764 | $ | 27,764 | $ | 19,775 | $ | 19,775 | ||||
| Loans payable | 9,672 | 9,672 | 8,875 | 8,875 | ||||||||
| Total financial liabilities | $ | 37,436 | $ | 37,436 | $ | 28,650 | $ | 28,650 | ||||
Fair value measurements
Fair value hierarchy:
Fair value is the price that would be received to sell an asset or paid to transfer a liability in an orderly transaction between market participants at the measurement date. The fair value hierarchy establishes three levels to classify the inputs to valuation techniques used to measure fair value. Level 1 inputs are quoted prices (unadjusted) in active markets for identical assets or liabilities. Level 2 inputs are quoted prices in markets that are not active, quoted prices for similar assets or liabilities in active markets, inputs other than quoted prices that are observable for the asset or liability (for example, interest rate and yield curves observable at commonly quoted intervals, forward pricing curves used to value currency and commodity contracts and volatility measurements used to value option contracts), or inputs that are derived principally from or corroborated by observable market data or other means. Level 3 inputs are unobservable (supported by no or little market activity). The fair value hierarchy gives the highest priority to Level 1 inputs and the lowest priority to Level 3 inputs.
Assets and liabilities as at December 31, 2020 that measured at fair value on a recurring basis include:
| Expressed in thousands US dollars | Fair value through profit or loss |
Amortized cost |
Carrying value |
Estimated Fair value |
||||||||
| Financial assets: | ||||||||||||
| Cash and cash equivalents | $ | - | $ | 61,083 | $ | 61,083 | $ | 61,083 | ||||
| Other investments | 4,767 | - | 4,767 | 4,767 | ||||||||
| Trade receivables | 8,755 | - | 8,755 | 8,755 | ||||||||
| Other receivables | - | 11,389 | 11,389 | 11,389 | ||||||||
| Total financial assets | $ | 13,522 | $ | 72,472 | $ | 85,994 | $ | 85,994 | ||||
| Financial liabilities: | ||||||||||||
| Accounts payable and accrued liabiities | $ | 6,389 | $ | 21,375 | $ | 27,764 | $ | 27,764 | ||||
| Loans payable | - | 9,672 | 9,672 | 9,672 | ||||||||
| Total financial liabilities | $ | 6,389 | $ | 31,047 | $ | 37,436 | $ | 37,436 |
Other investments
The Company holds marketable securities classified as Level 1 and Level 2 in the fair value hierarchy. The fair values of Level 1 investments are determined based on a market approach reflecting the closing price of each particular security at the reporting date. The closing price is a quoted market price obtained from the stock exchange that is the principal active market for the particular security, being the market with the greatest volume and level of activity for the assets. For Level 2 investments, where there is not yet an active market for the securities as a listing on an exchange is pending, the fair value is determined based on the most recent observable transaction for those securities. Changes in fair value on available for sale marketable securities are recognized in income or loss.
Trade receivables
The trade receivables consist of receivables from provisional silver and gold sales from the Bolañitos, El Cubo and El Compas mines. The fair value of receivables arising from concentrate sales contracts that contain provisional pricing mechanisms is determined using the appropriate quoted closing price on the measurement date from the exchange that is the principal active market for the particular metal. As such, these receivables, which meet the definition of an embedded derivative, are classified within Level 2 of the fair value hierarchy.
Deferred share units
The Company has a Deferred Share Unit ("DSU") plan whereby deferred share units may be granted to independent directors of the Company in lieu of compensation in cash or stock options. The DSUs vest immediately and are redeemable for cash based on the market value of the units at the time of a director's retirement. The DSUs are classified as Level 1 in the fair value hierarchy. The liability is determined based on a market approach reflecting the closing price of the Company's common shares at the reporting date. Changes in fair value are recognized in general and administrative salaries, wages and benefits.
Share appreciation rights
As part of the Company's bonus program, the Company grants share appreciation rights ("SARs") to its employees in Mexico and Chile. The SARs are subject to vesting conditions and, when exercised, constitute a cash bonus based on the value of the appreciation of the Company's common shares between the SARS grant date and the exercise date.
The SARs are classified as Level 2 in the fair value hierarchy. The liability is valued using a Black-Scholes option pricing model. Changes in fair value are recognized in salaries, wages and benefits.
Financial Instrument Risk Exposure and Risk Management
The Company is exposed in varying degrees to a variety of financial instrument related risks. The Board approves and monitors the risk management process. The types of risk exposure and the way in which such exposure is managed is provided as follows:
Credit Risk
The Company is exposed to credit risk on its bank accounts and accounts receivable. Credit risk exposure on bank accounts is limited through maintaining the Company's balances with high-credit quality financial institutions, maintaining investment policies, assessing institutional exposure and continual discussion with external advisors. Value added tax receivables are generated on the purchase of supplies and services to produce silver, which are refundable from the Mexican government. Trade receivables are generated on the sale of concentrate inventory to reputable metal traders.
Liquidity Risk
Liquidity risk is the risk that the Company will not be able to meet its financial obligations as they come due. We manage our liquidity risk by continually monitoring forecasted and actual cash flows. We have in place a planning and budgeting process to help determine the funds required to support our normal operating requirement and development plans. We aim to maintain sufficient liquidity to meet our short term business requirements, taking into account our anticipated cash flows from operations, our holdings of cash and cash equivalents, and our committed and anticipated liabilities.
The Company's Mexican subsidiaries pay value added tax, IVA, on the purchase and sale of goods and services. The net amount paid is recoverable but is subject to review and assessment by the tax authorities. The Company regularly files the required IVA returns and all supporting documentation with the tax authorities, however, the Company has been advised that certain IVA amounts receivable from the tax authorities are being withheld pending completion of the authorities' audit of certain of the Company's third-party suppliers. Under Mexican law the Company has legal rights to those IVA refunds and the results of the third-party audits should have no impact on refunds. A smaller portion of IVA refund requests are from time to time improperly denied based on the alleged lack of compliance of certain formal requirements and information returns by the Company's third-party suppliers. The Company takes necessary legal action on the delayed refunds as well as any improperly denied refunds.
The Company is in regular contact with the tax authorities in respect of its IVA filings and believes that the full amount of its IVA receivables will ultimately be received; however, the timing of recovery of these amounts and the nature and extent of any adjustments to the Company's IVA receivables remains uncertain.
Market Risk
The significant market risk exposures to which the Company is exposed are foreign currency risk, interest rate risk, and commodity price risk.
Foreign Currency Risk - The Company's operations in Mexico and Canada make it subject to foreign currency fluctuations. Certain of the Company's operating expenses are incurred in Mexican pesos and Canadian dollars; therefore, the fluctuation of the U.S. dollar in relation to these currencies will consequently have an impact upon the profitability of the Company and may also affect the value of the Company's assets and the amount of shareholders' equity. The Company has not entered into any agreements or purchased any instruments to hedge possible currency risks.
Interest Rate Risk - In respect of financial assets, the Company's policy is to invest cash at floating rates of interest and cash reserves are to be maintained in cash equivalents in order to maintain liquidity. Fluctuations in interest rates impact the value of cash equivalents. As at December 31, 2020 the Company has $2.0 million in equipment loans with interest rates that are linked to Libor and with other variables unchanged, a 1% increase in the Libor rate would result in an additional interest expense of $0.1 million.
Commodity Price Risk - Gold and silver prices have historically fluctuated significantly and are affected by numerous factors outside of the Company's control, including, but not limited to, industrial and retail demand, central bank lending, forward sales by producers and speculators, levels of worldwide production, short-term changes in supply and demand because of speculative hedging activities and certain other factors. The Company has not engaged in any hedging activities, other than short-term metal derivative transactions less than 90 days, to reduce its exposure to commodity price risk. At December 31, 2020, there are 43,026 oz of silver and 3,179 oz of gold, which do not have a final settlement price and the estimated revenues have been recognized at current market prices. As at December 31, 2020, with other variables unchanged, a 10% decrease in the market value of silver and gold would result in a reduction of revenue of $0.7 million.
Outstanding Share Data
As of February 24, 2021, the Company had the following securities issued and outstanding:
- 159,150,601common shares
- 4,484,400 common shares issuable under stock options with a weighted average exercise price of CAD$3.11 per share expiring between May 26, 2021 and September 15, 2025.
The Company considers the items included in the consolidated statement of shareholders' equity as capital. The Company's objective when managing capital is to safeguard its ability to continue as a going concern so that it can continue to provide returns for shareholders and benefits for other stakeholders. The Company manages the capital structure and makes adjustments to it in light of changes in economic conditions and the risk characteristics of the underlying assets. In order to maintain or adjust the capital structure, the Company may issue new shares through private placements, prospectus offerings, convertible debentures, asset acquisitions or return capital to shareholders. The Company is not subject to externally imposed capital requirements.
CHANGES IN ACCOUNTING POLICIES AND CRITICAL ACCOUNTING ESTIMATES
Accounting standards adopted during the period:
The accounting policies applied in the Company's annual audited consolidated financial statements as at and for the year ended December 31, 2020 are the same as those applied in the Company's annual audited consolidated financial statements as at and for the year ended December 31, 2019 except that the Company has changed its presentation of concentrate treatment and refining costs of sales to presenting as a reduction in revenue. The prior period amounts have also been reclassified.
The following amendment to accounting standards has been issued but not yet adopted in the financial statements:
On May 14, 2020, the IASB published a narrow scope amendment to IAS 16 Property, Plant and Equipment - Proceeds before Intended Use. The amendment prohibits deducting from the cost of property, plant and equipment amounts received from selling items produced while preparing the asset for its intended use. Instead, amounts received will be recognized as sales proceeds and the related costs in profit or loss. The effective date is for annual periods beginning on or after January 1, 2022. The Company is assessing the effect of the narrow scope amendment on its consolidated financial statements.
On August 27, 2020, the IASB published "Interest Rate Benchmark Reform - Phase 2" with amendments that address issues that might affect financial reporting after the reform of an interest rate benchmark, including its replacement with alternative benchmark rates. The amendments are effective for annual periods beginning on or after January 1, 2021, with earlier application permitted. The Company does not anticipate that the adoption will have a material impact on its consolidated financial statements as the Company is not engaged in hedging activities and as at December 31, 2021 only had $2.0 million in equipment loans whose terms will require a replacement with an alternative benchmark rate.
Critical Accounting Estimates
The preparation of financial statements requires the Company to make estimates that affect the reported amounts of assets and liabilities and disclosure of contingent assets and liabilities at the date of the financial statements and the reported amounts of revenues and expenses during the reporting period. Significant areas requiring the use of management judgment relate to the determination of mineralized reserves and resources, plant and equipment lives, estimating the fair values of financial instruments and derivatives, impairment of non-current assets, reclamation and rehabilitation provisions, recognition of deferred tax assets, and assumptions used in determining the fair value of share-based compensation.
Determination of ore reserves and resources
Judgments about the amount of product that can be economically and legally extracted from the Company's properties are made by management using a range of geological, technical and economic factors, history of conversion of mineral deposits to proven and probable reserves as well as data regarding quantities, grades, production techniques, recovery rates, production costs, commodity prices and exchange rates. This process may require complex and difficult geological judgments to interpret the data. The Company uses qualified persons (as defined by the Canadian Securities Administrator's National Instrument 43-101) to compile this data.
Changes in the judgments surrounding reserves and resources may impact the carrying value of mineral properties, plant and equipment, reclamation and rehabilitation provisions, recognition of deferred income tax amounts, and depreciation and depletion.
Estimating the quantity and /or grade of reserves and resources requires the size, shape and depth of ore bodies or fields to be determined by analyzing geological data such as drilling samples. Following this, the quantity of ore that can be extracted in an economical manner is calculated using data regarding the life of mine plans and forecast sales prices (based on current and long-term historical average price trends). Changes in estimates can be the result of estimated future production differing from previous forecasts of future production, expansion of mineable ore through exploration activities, differences between estimated and actual costs of mining and differences in the commodity price used in the estimation of mineable ore.
Review of asset carrying values and assessment of impairment
Management applies significant judgment in assessing each cash-generating unit and assets for the existence of indicators of impairment or impairment reversal at the reporting date. Internal and external factors are considered in assessing whether indicators are present that would necessitate impairment testing. Significant assumptions regarding commodity prices, operating costs, capital expenditures and discount rates are used in determining whether there are any indicators of impairment. These assumptions are reviewed regularly by senior management and compared, when applicable, to relevant market consensus views.
If an indicator of impairment or reversal exists, the asset's recoverable amount is estimated. The recoverable amount is the greater of fair value less costs of disposal and value in use. The determination of fair value less costs of disposal and value in use requires management to make estimates and assumptions about expected production and sales volumes, metal prices, ore tonnage and grades, recoveries, operating costs, future capital expenditures and appropriate discount rate for future cash flows. The estimates and assumptions are subject to risk and uncertainty, and as such there is the possibility that changes in circumstances will alter these projections, which may impact the recoverable amount of the assets. In such circumstances, some or all of the carrying value of the assets may be further impaired or the impairment charge reduced with the impact recorded in profit or loss.
In 2013 and 2015, the Company determined there were several indicators of potential impairment of its producing mineral properties which included the sustained decline in precious metal prices, changes in tax legislation and a reduction in reserves and resources. The recoverable amounts were based on each CGUs future cash flows expected to be derived from the Company's mining properties and represent each CGUs fair value in use. The cash flows were determined based on the life-of-mine after tax cash flow estimate which incorporate management's best estimates of future metal prices, production based on estimates of recoverable reserves and resources, exploration potential, future operating costs and non-expansionary capital expenditures.
At December 31, 2020, the Company recognized a $2,6 million reversal of a previous impairment of the Guanaceví Mine. An increase in the reserve and resource estimate and increase in precious metal prices were considered to be indicators of an impairment reversal. The updated Guanaceví mine plan, with updated assumptions and estimates, resulted in significantly higher cash flows, using a 6.1% discount rate, compared to the Company's previous estimates. Accordingly, the Company reversed the 2013 Guanaceví CGU impairment, limited to the carrying amount had no impairment been recognized in prior periods, net of depletion and amortization which would have been recognized in prior periods.
At December 31, 2020, the Company recognizes an impairment of the El Compas Mine Project. A decrease in the resource estimate as at December 31, 2020 was considered to be an indicator of an impairment. The carrying value related to the El Compas CGU, excluding working capital and reclamation provision, was $6.0 million which was greater than its estimated recoverable amount of $3.0 million, calculated on a discounted cash flow basis using a 6.1% discount rate. The Company considers use of its internal discounted cash flow economic models as a proxy for the calculation of fair value in use. Based on the above assessment, the Company recorded an impairment charge related to the El Compas CGU of $3.0 million.
If an area of interest is abandoned or it is determined that its carrying value cannot be supported by future production or sale, the related costs are charged against operations in the period of abandonment or determination that the carrying value exceeds its fair value. The amounts recorded as mineral properties represent costs incurred to date and do not necessarily reflect present or future values.
Achievement of commercial production
Once a mine reaches the operating levels intended by management, deprecation of capitalized costs begins. Significant judgement is required to determine when certain of the Company's assets reach this level. Management considers several factors including: completion of a reasonable period of commissioning; consistent operating results achieved at a pre-determined level of design capacity and indications exist that his level will continue; mineral recoveries at or near expected levels; and the transfer of operations from development personnel to operational personnel has been completed.
Estimation of the amount and timing of reclamation and rehabilitation costs
Accounting for restoration requires management to make estimates of the future costs the Company will incur to complete the reclamation and rehabilitation work required to comply with existing laws, regulations and agreements in place at each mining operation and any environmental and social principles the Company is in compliance with. The calculation of the present value of these costs also includes assumptions regarding the timing of reclamation and rehabilitation work, applicable risk-free interest rate for discounting those future cash flows, inflation and foreign exchange rates and assumptions relating to probabilities of alternative estimates of future cash flows. Actual costs incurred may differ from those amounts estimated. Also, future changes to environmental laws and regulations could increase the extent of reclamation and rehabilitation work required to be performed by the Company. Increase in future costs could materially impact the amounts charged to operations for reclamation and rehabilitation.
Deferred Income Taxes
The Company follows the asset and liability method of accounting for income taxes. Under this method, future tax assets and liabilities are recognized for the future tax consequences attributable to differences between the financial statement carrying amounts of existing assets and liabilities and their respective tax bases, and losses carried forward. Future tax assets and liabilities are measured using substantively enacted or enacted tax rates expected to apply to taxable income in the years in which those temporary differences are expected to be recovered or settled. The effect on future tax assets and liabilities of a change in tax rates is recognized in income in the period that includes the substantive enactment date. Future tax assets are recognized to the extent that they are considered more likely than not to be realized.
Judgement is required in determining the recognition and measurement of deferred income tax assets and liabilities on the balance sheet. In the normal course of business, the Company is subject to assessment by taxation authorities in various jurisdictions. These authorities may have different interpretations of tax legislation or tax agreements than those applied by the Company in computing current and deferred income taxes. These different interpretations may alter the timing or amounts of taxable income or deductions.
Final taxes payable and receivable are dependent on many factors, including outcomes of tax litigation and resolution of disputes. The resolution of these uncertainties may result in adjustments to the Company's tax assets and liabilities.
Management assesses the likelihood and timing of taxable earnings in future periods in recognizing deferred income tax assets. Estimates of future taxable income is based on forecasted cash flows using life of mine projections and the application of existing tax laws in each jurisdiction.
To the extent that future cash flows and taxable income differ significantly from estimates, the ability of the Company to realize the net deferred income tax assets recorded at the balance sheet date could be impacted. In addition, future changes to tax laws could limit the ability of the Company to obtain tax deductions in future periods from deferred income tax assets.
Inventory
In valuing inventories at the lower of cost and net realizable value, the Company makes estimates in determining the net realizable price and in quantifying the contained metal in finished goods and work in progress.
Share-based Compensation
The Company has a stock option plan and records all share-based compensation for options using the fair value method. The fair value of each option award is estimated on the date of the grant using the Black-Scholes option pricing model, with expected volatility based on historical volatility of the Endeavour common shares. The Company uses historical data to estimate the term of the option and the risk-free rate for the expected term of the option is based on the Government of Canada yield curve in effect at the time of the grant.
As part of the Company's bonus program, the Company may from time to time grant share appreciation rights ("SARs") to its employees in Mexico and Chile. The SARs are subject to vesting conditions and, when vested, constitute a cash bonus based on the value of the appreciation of the Company's common shares between the SARs grant date and vesting. The fair value of each SAR award is estimated on the grant date using the Black-Scholes option pricing model, with expected volatility based on historical volatility of the Endeavour common shares. The Company uses historical data to estimate the term of the option and the risk-free rate for the expected term of the option is based on the Government of Canada yield curve in effect at the time of the grant.
The Company has a Performance Share Unit ("PSU") plan whereby performance share units may be granted to employees of the Company. Under the PSU plan, vested PSUs are redeemable, at the election of the Board of Directors in its discretion, for Common Shares , a cash payment equal to the market value of a Common Share as of the redemption date, or a combination of cash and Common Shares. The PSUs granted are subject to a performance payout multiplier between 0% and 200% based on the Company's total shareholder return at the end of a three-year period, relative to the Company's total shareholder return peer group.
Business Combinations
On the acquisition of a business, the acquisition method of accounting is used, whereby the purchase consideration is allocated to the identifiable assets, liabilities and contingent liabilities (identifiable net assets) on the basis of fair value at the date of acquisition. When the cost of acquisition exceeds the fair values attributable to the Company's share of identifiable net assets, the difference is treated as purchased goodwill, which is not amortized but is reviewed for impairment annually or more frequently where there is an indication of impairment. If the fair value attributable to the Company's share of the identifiable net assets exceeds the cost of acquisition, the difference is immediately recognized in profit or loss. Incremental costs related to acquisitions are expensed as incurred.
Determination of the fair value of assets acquired and liabilities assumed and the resulting goodwill, if any, requires that management make estimates based on the information provided by the acquiree. Changes to the provisional values of assets acquired and liabilities assumed, deferred income taxes and resulting goodwill, if any, will be adjusted when the final measurements are determined (within one year of acquisition date).
When purchase consideration is contingent on future events, the initial cost of the acquisition recorded includes an estimate of the fair value of the contingent amounts expected to be payable in the future. When the fair value of contingent consideration as at the date of acquisition is finalized, before the end of the 12 month measurement period, the adjustment is allocated to the identifiable assets acquired and liabilities assumed. Changes to the estimated fair value of contingent consideration subsequent to the acquisition date are recorded in profit or loss.
RISKS AND UNCERTAINTIES
Besides the risks discussed elsewhere in this MD&A, the following are risks and uncertainties that have affected the Company's financial statements or future performance or that may affect them in the future. See "Risk Factors" in the Company's Annual Information Form for other risks affecting the Company generally.
Impact of COVID-19 Pandemic
The Company's business could be significantly adversely affected by the effects of a widespread global outbreak of contagious disease, including the recent outbreak of respiratory illness caused by COVID-19. The Company cannot accurately predict the impact COVID-19 will have on third parties' ability to meet their obligations with the Company, including due to uncertainties relating to the ultimate geographic spread of the virus, the severity of the disease, the duration of the outbreak, and the length of travel and quarantine restrictions imposed by governments of affected countries. In particular, the continued spread of the COVID-19 globally could materially and adversely impact the Company's business including without limitation, employee health, limitations on travel, the availability of industry experts and personnel, restrictions to planned drill programs, mining and processing operations shutdowns, and other factors that will depend on future developments beyond the Company's control. In addition, a significant outbreak of contagious diseases in the human population could result in a widespread health crisis that could adversely affect the economies and financial markets of many countries (including those in which the Company operates), resulting in an economic downturn that could negatively impact the Company's operating results and ability to raise capital.
Precious and Base Metal Price Fluctuations
The profitability of the precious metals operations in which the Company has an interest is significantly affected by changes in the market prices of precious metals. Prices for precious metals fluctuate on a daily basis, have historically been subject to wide fluctuations and are affected by numerous factors beyond the control of the Company such as the level of interest rates, the rate of inflation, central bank transactions, world supply of the precious metals, foreign currency exchange rates, international investments, monetary systems, speculative activities, international economic conditions and political developments. The exact effect of these factors cannot be accurately predicted, but the combination of these factors may result in the Company not receiving adequate returns on invested capital or the investments retaining their respective values. Declining market prices for these metals could materially adversely affect the Company's operations and profitability.
Fluctuations in the price of consumed commodities
Prices and availability of commodities consumed or used in connection with exploration, development and mining, such as natural gas, diesel, oil, electricity, cyanide and other re-agents fluctuate affecting the costs of production at the Company's operations. These fluctuations can be unpredictable, can occur over short periods of time and may have a materially adverse impact on the Company's operating costs or the timing and costs of various projects. The Company's general policy is not to hedge its exposure to changes in prices of the commodities used in its business.
Foreign Exchange Rate Fluctuations
Operations in Mexico, Chile and Canada are subject to foreign currency exchange fluctuations. The Company raises its funds through equity issuances which are generally priced in Canadian dollars or U.S. dollars, and the majority of the exploration costs of the Company are denominated in U.S. dollars, Chilean pesos and Mexican pesos. The Company may suffer losses due to adverse foreign currency fluctuations.
Operating Hazards and Risks
Mining operations generally involve a high degree of risk, which even a combination of experience, knowledge and careful evaluation may not be able to overcome. Operations in which the Company has a direct or indirect interest will be subject to all the hazards and risks normally incidental to exploration, development and production of precious and base metals, any of which could result in work stoppages, delayed production and resultant losses, increased production costs, asset write downs, damage to or destruction of mines and other producing facilities, damage to life and property, environmental damage and possible legal liability for any or all damages. The Company may become subject to liability for pollution, cave-ins or hazards against which it cannot insure or against which it may elect not to insure. Any compensation for such liabilities may have a material, adverse effect on the Company's financial position. The Company's property, business interruption and liability insurance may not provide sufficient coverage for losses related to these or other hazards. Insurance against certain risks, including certain liabilities for environmental pollution, may not be available to us or to other companies within the industry at reasonable terms or at all. In addition, the Company's insurance coverage may not continue to be available at economically feasible premiums, or at all. Any such event could have a material adverse effect on the Company's business.
Mining Operations
The capital costs required by the Company's projects may be significantly higher than anticipated. Capital and operating costs, production and economic returns, and other estimates contained in the Company's current technical reports, may differ significantly from those provided for in future studies and estimates and from management guidance, and there can be no assurance that the Company's actual capital and operating costs will not be higher than currently anticipated. In addition, delays to construction and exploration schedules may negatively impact the net present value and internal rates of return of the Company's mineral properties as set forth in the applicable technical report. Similarly, there can be no assurance that historical rates of production, grades of ore processed, rates of recoveries or mining cash costs will not experience fluctuations or differ significantly from current levels over the course of the mining operations conducted by the Company. In addition, there can be no assurance that the Company will be able to continue to extend the production from its current operations through exploration and drilling programs.
Infrastructure
Mining, processing, development and exploration activities depend, to one degree or another, on adequate infrastructure. Reliable roads, bridges, power sources and water supply are important determinants, which affect capital and operating costs. The lack of availability on acceptable terms or the delay in the availability of any one or more of these items could prevent or delay exploitation or development of the Company's projects. If adequate infrastructure is not available in a timely manner, there can be no assurance that the exploitation or development of the Company's projects will be commenced or completed on a timely basis, if at all; the resulting operations will achieve the anticipated production volume, or the construction costs and ongoing operating costs associated with the exploitation and/or development of the Company's advanced projects will not be higher than anticipated. In addition, unusual or infrequent weather phenomena, sabotage, government or other interference in the maintenance or provision of such infrastructure could adversely affect the Company's operations and profitability.
Exploration and Development
There is no assurance that the Company's exploration and development programs and properties will result in the discovery, development or production of a commercially viable ore body or yield new reserves to replace or expand current reserves. The economics of developing silver, gold and other mineral properties are affected by many factors, including capital and operating costs, variations of the tonnage and grade of ore mined, fluctuating mineral markets, and such other factors as government regulations, including regulations relating to royalties, allowable production, importing and exporting of minerals and environmental protection. Depending on the prices of silver, gold or other minerals produced, the Company may determine that it is impractical to commence or continue commercial production.
The marketability of any minerals acquired or discovered may be affected by numerous factors which are beyond the Company's control and which cannot be accurately foreseen or predicted, such as market fluctuations, conditions for precious and base metals, the proximity and capacity of milling and smelting facilities, and such other factors as government regulations, including regulations relating to royalties, allowable production, importing and exporting minerals and environmental protection. In order to commence exploitation of certain properties presently held under exploration concessions, it is necessary for the Company to apply for an exploitation concession.
There can be no guarantee that such a concession will be granted. Unsuccessful exploration or development programs could have a material adverse impact on the Company's operations and profitability.
Calculation of Reserves and Resources and Precious Metal Recoveries
There is a degree of uncertainty attributable to the calculation and estimation of reserves and resources and their corresponding metal grades to be mined and recovered. Until reserves or resources are actually mined and processed, the quantities of mineralization and metal grades must be considered as estimates only. Any material change in the quantity of mineral reserves, mineral resources, grades and recoveries may affect the economic viability of the Company's properties.
Replacement of Reserves and Resources
The Guanaceví, Bolañitos and El Compas mines are the Company's current sources of production. Current life-of-mine plans provide for a defined production life for mining at the Company's mines. The mines have expected lives of one to four years based on current proven and probable reserves and production levels. If the Company's mineral reserves and resources are not replaced either by the development or discovery of additional reserves and/or extension of the life-of-mine at its current operating mines or through the acquisition or development of an additional producing mine, this could have an adverse impact on the Company's future cash flows, earnings, financial performance and financial condition, including as a result of requirements to expend funds for reclamation and decommissioning.
Economic Conditions for Mining
A decline in the market price for precious metal commodities was experienced from 2013 until the middle of 2020, when prices began increasing to prices more consistent with early 2013. These macro-economic events negatively affected the mining and minerals sectors in general, and the Company's market capitalization was significantly reduced over this period. Any sudden or rapid destabilization of global economic conditions could impact the Company's ability to obtain equity or debt financing in the future on terms favorable to the Company or at all. In such an event, the Company's operations and financial condition could be adversely impacted.
The Company assesses on a quarterly basis the carrying values of its mineral properties. Should market conditions and commodity prices worsen and persist in a worsened state for a prolonged period of time, an impairment of the Company's mineral properties may be required.
Integration of New Acquisitions
The positive effect on the Company's results arising from past and future acquisitions depends on a variety of factors, including, but not limited to: assimilating the operations of an acquired business or property in a timely and efficient manner including the existing work force, union arrangements and existing contracts; maintaining the Company's financial and strategic focus while integrating the acquired business or property; implementing uniform standards, controls, procedures and policies at the acquired business, as appropriate; and to the extent that the Company makes an acquisition outside of markets in which it has previously operated, conducting and managing operations in a new operating environment and under a new regulatory regime where it has no direct experience.
Past and future business or property acquisitions could place increased pressure on the Company's cash flow if such acquisitions involve cash consideration or the assumption of obligations requiring cash payments. The integration of the Company's existing operations with any acquired business will require significant expenditures of time, attention and funds. Achievement of the benefits expected from consolidation would require the Company to incur significant costs in connection with, among other things, implementing financial and planning systems.
The Company may not be able to integrate the operations of a recently acquired business or restructure the Company's previously existing business operations without encountering difficulties and delays. In addition, this integration may require significant attention from the Company's management team, which may detract attention from the Company's day-to-day operations. Over the short-term, difficulties associated with integration could have a material adverse effect on the Company's business, operating results, financial condition and the price of the Company's common shares. In addition, the acquisition of mineral properties may subject the Company to unforeseen liabilities, including environmental liabilities.
Foreign Operations
The Company's operations are currently conducted through subsidiaries principally in Mexico and secondarily in Chile and, as such, its operations are exposed to various levels of political, economic and other risks and uncertainties which could result in work stoppages, blockades of the Company's mining operations and appropriation of assets. Some of the Company's operations are located in areas where Mexican drug cartels operate. These risks and uncertainties vary from region to region and include, but are not limited to, terrorism; hostage taking; local drug gang activities; military repression; expropriation; extreme fluctuations in currency exchange rates; high rates of inflation; labour unrest; the risks of war or civil unrest; renegotiation or nullification of existing concessions, licenses, permits and contracts; illegal mining; changes in taxation policies; restrictions on foreign exchange and repatriation; and changing political conditions arising from changes in government and otherwise, currency controls and governmental regulations that favour or require the awarding of contracts to local contractors or require foreign contractors to employ citizens of, or purchase supplies from, a particular jurisdiction.
Local opposition to mine development projects could arise in Mexico, and such opposition could be violent. There can be no assurance that such local opposition will not arise with respect to the Company's Mexican operations. If the Company were to experience resistance or unrest in connection with its Mexican operations, it could have a material adverse effect on its operations and profitability. To the extent the Company acquires mineral properties in other jurisdictions; it may be subject to similar and additional risks with respect to its operations in those jurisdictions.
Government Regulation
The Company's operations, exploration and development activities are subject to extensive foreign federal, state and local laws and regulations governing such matters as environmental protection, management and use of toxic substances and explosives, management of natural resources, health, exploration and development of mines, production and post-closure reclamation, safety and labour, mining law reform, price controls import and export laws, taxation, maintenance of claims, tenure, government royalties and expropriation of property. The activities of the Company require licenses and permits from various governmental authorities. The costs associated with compliance with these laws and regulations are substantial and possible future laws and regulations, changes to existing laws and regulations and more stringent enforcement of current laws and regulations by governmental authorities, could cause additional expenses, capital expenditures, restrictions on or suspensions of the Company's operations and delays in the development of its properties. Moreover, these laws and regulations may allow governmental authorities and private parties to bring lawsuits based upon damages to property and injury to persons resulting from the environmental, health and safety practices of the Company's past and current operations, or possibly even those actions of parties from whom the Company acquired its mines or properties, and could lead to the imposition of substantial fines, penalties or other civil or criminal sanctions. The Company retains competent and well trained individuals and consultants in jurisdictions in which it does business, however, even with the application of considerable skill the Company may inadvertently fail to comply with certain laws. Such events can lead to financial restatements, fines, penalties, and other material negative impacts on the Company.
Mexican Tax Assessments
As disclosed under "Contingencies", one subsidiary of the Company in Mexico has received a tax assessment from Mexican fiscal authorities. The Company filed an appeal against the June 2016 tax assessment on the basis certain items rejected by the courts were included in the new tax assessment, while a number of deficiencies exist within the assessment. If the Company is unsuccessful this could negatively impact the Company's financial position and create difficulties for the Company in dealing with Mexican fiscal authorities in the future.
Included in the Company's consolidated financial statements, are net assets of $595,000, including $42,000 in cash, held by MSCG. Following the Tax Court's rulings, MSCG is in discussions with the tax authorities with regards to the shortfall of assets within MSCG to settle its estimated tax liability. An alternative settlement option would be to transfer the shares and assets of MSCG to the tax authorities. The Company recognized an allowance for transferring the shares and assets of MSCG amounting to $595,000. The Company is assessing MSCG's settlement options based on on-going court proceedings and discussion with the tax authorities. The Company continues to assess that it is probable that its appeal should prevail and the maximum estimated exposure is the amount of the above allowance.
Compania Minera Del Cubo SA de CV ("Cubo"), a subsidiary of the Company, received a MXN 58.5 million ($2.9 million) assessment in 2019 by Mexican fiscal authorities for alleged failure to provide the appropriate support for depreciation deductions taken in the Cubo 2016 tax return and denied eligibility of deductions of certain suppliers. The tax assessment consists of MXN 24.1 million ($1.2 million) for taxes, MXN 21.0 million ($1.1 million) for penalties, MXN 10.4 million ($0.5 million) for interest and MXN 3.0 million ($0.1 million) for inflation. At the time of the tax assessment the Cubo entity had and continues to have sufficient loss carry forwards which would be applied against the assessed difference of taxable income. The Mexican tax authorities did not consider these losses in the assessment.
Due to the denial of certain suppliers for income tax purposes in the Cubo assessment, the invoices from these suppliers have been assessed as ineligible for refunds of IVA paid on the invoices. The assessment includes MXN 14.7 million ($0.7 million) for re-payment of IVA (value added taxes) refunded on these supplier payments. In the Company's judgement the suppliers and invoices meet the necessary requirements to be deductible for income tax purposes and the recovery of IVA.
The Company has filed an administrative appeal related to the 2016 Cubo Tax assessment. Cubo has provided a lien on certain El Cubo mining concession during the appeal process. Since issuance of the assessment interest charges of MXN 9.9 million ($500 thousand) and inflationary charges of MXN 1.6 million ($100 thousand) has accumulated. The Company continues to assess that it is probable that its appeal will prevail, and no provision is required in respect of the Cubo assessment.
Obtaining and Renewing of Government Permits
In the ordinary course of business, the Company is required to obtain and renew government permits for the operation and expansion of existing operations or for the development, construction and commencement of new operations. Obtaining or renewing the necessary governmental permits is a complex and time-consuming process involving numerous jurisdictions and possibly involving public hearings and costly undertakings on the Company's part. Any unexpected delays or costs associated with the permitting process could delay the development or impede the operation of a mine, which could adversely impact the Company's operations and profitability.
Environmental Factors
All phases of the Company's operations are subject to environmental regulation in the various jurisdictions in which it operates. Environmental legislation is evolving in a manner which will require stricter standards and enforcement, increased fines and penalties for non-compliance, more stringent environmental assessments of proposed projects and a heightened degree of responsibility for companies and their officers, directors and employees. The costs of compliance with changes in government regulations have the potential to reduce the profitability of future operations. Environmental hazards that may have been caused by previous or existing owners or operators may exist on the Company's mineral properties but are unknown to the Company at present.
Title to Assets
Although the Company obtains title opinions for material properties in which it has a material interest, there is no guarantee that title to such properties will not be challenged or impugned. If title to the Company's properties is disputed, it may result in the Company paying substantial costs to settle the dispute or clear title and could result in the loss of the property, which events may affect the economic viability of the Company.
Employee Recruitment and Retention
Recruiting and retaining qualified personnel is critical to the Company's success. As the Company's business activity grows, the Company will require additional key financial, administrative and mining personnel as well as additional operations staff. The Company could experience increases in recruiting and training costs and decreases in operating efficiency, productivity and profit margins. If the Company is not able to attract, hire and retain qualified personnel, the efficiency of the operations could be impaired, which could have an adverse impact on the Company's future cash flows, earnings, financial performance and financial condition.
Assurance on Financial Statements
The Company prepares the financial reports in accordance with accounting policies and methods prescribed by IFRS. In the preparation of financial reports, management may need to rely upon assumptions, make estimates or use their best judgment in determining the financial condition of the Company. Significant accounting policies and practices are described in more detail in the notes to the annual consolidated financial statements for the year ended December 31, 2020. In order to have a reasonable level of assurance that financial transactions are properly authorized, assets are safeguarded against unauthorized or improper use and transactions are properly recorded and reported, the Company has implemented and continues to analyze the internal control systems for financial reporting.
Changes in Climate Conditions
A number of governments have introduced or are moving to introduce climate change legislation and treaties at the international, national, state/provincial and local levels. Regulation relating to emission levels (such as carbon taxes) and energy efficiency is becoming more stringent. If the current regulatory trend continues, this may result in increased costs at some or all of the Company's operations. In addition, the physical risks of climate change may also have an adverse effect on the Company's operations. Extreme weather events have the potential to disrupt operations at the Company's mines and may require the Company to make additional expenditures to mitigate the impact of such events. Extended disruptions to supply lines could result in interruption to production.
Anti-Corruption and Anti-Bribery Laws
The Company's operations are governed by, and involve interactions with, various levels of government in foreign countries. The Company is required to comply with anti‐corruption and anti‐bribery laws, including the Corruption of Foreign Public Officials Act (Canada) and the Foreign Corrupt Practices Act (US) and similar laws in México. In recent years, there has been a general increase in both the frequency of enforcement and the severity of penalties under such laws, resulting in greater scrutiny and punishment to companies convicted of violating anti‐corruption and anti‐bribery laws. A company may be found liable for violations by not only its employees, but also by its contractors and third-party agents. The Company's internal procedures and programs may not always be effective in ensuring that it, its employees, contractors or third-party agents will comply strictly with all such applicable laws. If the Company becomes subject to an enforcement action or is found to be in violation of such laws, this may have a material adverse effect on the Company's reputation, result in significant penalties or sanctions, and have a material adverse effect on the Company's operations.
Compliance with Canada's Extractive Sector Transparency Measures Act
The Extractive Sector Transparency Measures Act (Canada) ("ESTMA") requires public disclosure of certain payments to governments by companies engaged in the commercial development of minerals which are publicly listed in Canada. Mandatory annual reporting is required for extractive companies with respect to payments made to foreign and domestic governments, including aboriginal groups. ESTMA requires reporting on the payments of any taxes, royalties, fees, production entitlements, bonuses, dividends, infrastructure reporting or structuring payments to avoid reporting. If the Company becomes subject to an enforcement action or is in violation of ESTMA, this may result in significant penalties or sanctions which may also have a material adverse effect on the Company's reputation.
Claims under U.S. Securities Laws
The enforcement by investors of civil liabilities under the federal securities laws of the United States may be affected adversely by the fact that the Company is incorporated under the laws of British Columbia, Canada, that the independent registered chartered professional accountants who have audited the Company's financial statements and some or all of the Company's directors and officers may be residents of Canada or elsewhere, and that all or a substantial portion of the Company's assets and said persons are located outside the United States. As a result, it may be difficult for holders of the Company's common shares to effect service of process within the United States upon people who are not residents of the United States or to realize in the United States upon judgments of courts of the United States predicated upon civil liabilities under the federal securities laws of the United States.
Information Systems and Cyber Security
The Company's operations depend, in part, upon information technology systems. The Company's information technology systems are subject to disruption, damage or failure from a number of sources, including, but not limited to, hacking, computer viruses, security breaches, natural disasters, power loss, vandalism, theft and defects in design. Any of these and other events could result in information technology systems failures, operational delays, production downtimes, destruction or corruption of data, security breaches or other manipulation or improper use of our data, systems and networks, any of which could have adverse effects on the Company's reputation, business, results of operations, financial condition and share price.
The Company's risk and exposure to these matters cannot be fully mitigated because of, among other things, the evolving nature of these threats. As a result, cyber security and the continued development and enhancement of controls, processes and practices designed to protect the Company's systems, computers, software, data and networks from attack, damage or unauthorized access remain a priority. As cyber threats continue to evolve, the Company may be required to expend additional resources to continue to modify or enhance protective measures or to investigate and remediate any security vulnerabilities.
CONTROLS AND PROCEDURES
The Company's officers and management are responsible for establishing and maintaining disclosure controls and procedures for the Company. Disclosure controls and procedures are designed to provide reasonable assurance that material information required to be disclosed by the Company under securities legislation is recorded, processed, summarized and reported within the applicable time periods and to ensure that required information is gathered and communicated to the Company's management, including the Chief Executive Officer (CEO) and Chief Financial Officer (CFO) as is appropriate to permit timely decisions regarding public disclosure. There are inherent limitations to the effectiveness of any system of disclosure controls and procedures. Accordingly, even effective disclosure controls and procedures can only provide reasonable assurance of achieving their control objectives.
At the end of the period covered by this MD&A, management, including the CEO and CFO, conducted an evaluation of the effectiveness of the Company's disclosure controls and procedures pursuant to National Instrument 52-109 "Certification of Disclosure in Issuers Annual and Interim Filings" ("NI 52-109") and Rule 13a -15(b) of the U.S. Securities Exchange Act of 1934, as amended (the "U.S. Exchange Act"). Based upon that evaluation, the Company's CEO and CFO have concluded that, as of the end of the period covered by this MD&A, the Company's disclosure controls and procedures were effective to give reasonable assurance that the information required to be disclosed by the Company in reports that it files or submits is (i) recorded, processed, summarized and reported, within the time periods specified under applicable securities legislation in Canada and in the U.S. Securities and Exchange Commission's rules and forms, and (ii) accumulated and communicated to management, including its principal executive and principal financial officers, or persons performing similar functions, as appropriate to allow timely decisions regarding required disclosure.
Management's Report on Internal Controls over Financial Reporting
Management is responsible for establishing and maintaining adequate internal control over financial reporting (as defined in NI 52-109 and in Rules 13a-15(f) of the U.S. Exchange Act). A company's internal control over financial reporting is a process designed to provide reasonable assurance regarding the reliability of financial reporting and the preparation of financial statements for external purposes in accordance with applicable generally accepted accounting principles.
A company's internal control over financial reporting includes those policies and procedures that (i) pertain to the maintenance of records that, in reasonable detail, accurately and fairly reflect the transactions and dispositions of the assets of the company; (ii) provide reasonable assurance that transactions are recorded as necessary to permit preparation of financial statements in accordance with generally accepted accounting principles, and that receipts and expenditures of the company are being made only in accordance with authorizations of management and directors of the company; and (iii) provide reasonable assurance regarding prevention or timely detection of unauthorized acquisition, use, or disposition of the company's assets that could have a material effect on the financial statements. It should be noted that a control system, no matter how well conceived or operated, can only provide reasonable assurance, not absolute assurance, that the objectives of the control system are met. Also, projections of any evaluation of effectiveness to future periods are subject to the risk that controls may become inadequate because of changes in conditions, or that the degree of compliance with policies and procedures may deteriorate.
Management of the Company, including the CEO and CFO, assessed the effectiveness of the Company's internal control over financial reporting as of December 31, 2020. In making this assessment, management used the criteria set forth in the Internal Control Integrated Framework (2013) issued by the Committee of Sponsoring Organizations of the Treadway Commission (COSO). Based on its assessment, management has concluded that, as of December 31, 2020, the Company's internal control over financial reporting is effective. Also, management determined that there were no material weaknesses in the Company's internal control over financial reporting as at December 31, 2020.
Changes in Internal Control over Financial Reporting
Management, including the CEO and CFO, have evaluated the Company's internal controls over financial reporting to determine whether any changes occurred during the period that have materially affected, or are reasonably likely to materially affect, the Company's internal controls over financial reporting.
There have been no changes in internal control over financial reporting that occurred during the fiscal year ended December 31, 2020 that have materially affected, or are reasonably likely to materially affect, the Company's internal control over financial reporting.
Exhibit 99.4
CERTIFICATION
I, Bradford Cooke, certify that:
1. I have reviewed this annual report on Form 40-F of Endeavour Silver Corp.;
2. Based on my knowledge, this report does not contain any untrue statement of a material fact or omit to state a material fact necessary to make the statements made, in light of the circumstances under which such statements were made, not misleading with respect to the period covered by this report;
3. Based on my knowledge, the financial statements, and other financial information included in this report, fairly present in all material respects the financial condition, results of operations and cash flows of the issuer as of, and for, the periods presented in this report;
4. The issuer’s other certifying officer(s) and I are responsible for establishing and maintaining disclosure controls and procedures (as defined in Exchange Act Rules 13a-15(e) and 15d-15(e)) and internal controls over financial reporting (as defined in Exchange Act Rules 13a-15(f) and 15d-5(f) for the issuer and have:
(a) Designed such disclosure controls and procedures, or caused such disclosure controls and procedures to be designed under our supervision, to ensure that material information relating to the issuer, including its consolidated subsidiaries, is made known to us by others within those entities, particularly during the period in which this report is being prepared;
(b) Designed such internal control over financial reporting, or caused such internal control over financial reporting to be designed under our supervision, to provide reasonable assurance regarding the reliability of financial reporting and the preparation of financial statements for external purposes in accordance with generally accepted accounting principles;
(c) Evaluated the effectiveness of the issuer’s disclosure controls and procedures and presented in this report our conclusions about the effectiveness of the disclosure controls and procedures, as of the end of the period covered by this report based on such evaluation; and
(d) Disclosed in this report any change in the issuer’s internal control over financial reporting that occurred during the period covered by the annual report that has materially affected, or is reasonably likely to materially affect, the issuer’s internal control over financial reporting; and
5. The issuer’s other certifying officer(s) and I have disclosed, based on our most recent evaluation of internal control over financial reporting, to the issuer’s auditors and the audit committee of the issuer’s board of directors (or persons performing the equivalent functions):
(a) All significant deficiencies and material weaknesses in the design or operation of internal control over financial reporting which are reasonably likely to adversely affect the issuer’s ability to record, process, summarize and report financial information; and
(b) Any fraud, whether or not material, that involves management or other employees who have a significant role in the issuer’s internal control over financial reporting.
|
Date: March 1, 2021 |
By: /s/ Bradford Cooke |
|
Bradford Cooke Chief Executive Officer (Principal Executive Officer) |
Exhibit 99.5
CERTIFICATION
I, Dan Dickson, certify that:
1. I have reviewed this annual report on Form 40-F of Endeavour Silver Corp.;
2. Based on my knowledge, this report does not contain any untrue statement of a material fact or omit to state a material fact necessary to make the statements made, in light of the circumstances under which such statements were made, not misleading with respect to the period covered by this report;
3. Based on my knowledge, the financial statements, and other financial information included in this report, fairly present in all material respects the financial condition, results of operations and cash flows of the issuer as of, and for, the periods presented in this report;
4. The issuer’s other certifying officer(s) and I are responsible for establishing and maintaining disclosure controls and procedures (as defined in Exchange Act Rules 13a-15(e) and 15d-15(e)) and internal controls over financial reporting (as defined in Exchange Act Rules 13a-15(f) and 15d-5(f) for the issuer and have:
(a) Designed such disclosure controls and procedures, or caused such disclosure controls and procedures to be designed under our supervision, to ensure that material information relating to the issuer, including its consolidated subsidiaries, is made known to us by others within those entities, particularly during the period in which this report is being prepared;
(b) Designed such internal control over financial reporting, or caused such internal control over financial reporting to be designed under our supervision, to provide reasonable assurance regarding the reliability of financial reporting and the preparation of financial statements for external purposes in accordance with generally accepted accounting principles;
(c) Evaluated the effectiveness of the issuer’s disclosure controls and procedures and presented in this report our conclusions about the effectiveness of the disclosure controls and procedures, as of the end of the period covered by this report based on such evaluation; and
(d) Disclosed in this report any change in the issuer’s internal control over financial reporting that occurred during the period covered by the annual report that has materially affected, or is reasonably likely to materially affect, the issuer’s internal control over financial reporting; and
5. The issuer’s other certifying officer(s) and I have disclosed, based on our most recent evaluation of internal control over financial reporting, to the issuer’s auditors and the audit committee of the issuer’s board of directors (or persons performing the equivalent functions):
(a) All significant deficiencies and material weaknesses in the design or operation of internal control over financial reporting which are reasonably likely to adversely affect the issuer’s ability to record, process, summarize and report financial information; and
(b) Any fraud, whether or not material, that involves management or other employees who have a significant role in the issuer’s internal control over financial reporting.
|
Date: March 1, 2021 |
By: /s/ Dan Dickson |
|
Dan Dickson Chief Financial Officer (Principal Financial and Accounting Officer) |
Exhibit 99.6
CERTIFICATION PURSUANT TO
18 U.S.C. §1350,
AS ADOPTED PURSUANT TO
SECTION 906 OF THE SARBANES-OXLEY ACT OF 2002
In connection with the annual report of Endeavour Silver Corp. (the “Company”) on Form 40-F for the period ended December 31, 2020 as filed with the Securities and Exchange Commission on the date hereof (the “Report”), I, Bradford Cooke, Chief Executive Officer of the Company, certify, pursuant to 18 U.S.C. §1350, as adopted pursuant to Section 906 of the Sarbanes-Oxley Act of 2002, that:
(1) The Report fully complies with the requirements of Section 13(a) or 15(d) of the Securities Exchange Act of 1934; and
(2) The information contained in this Report fairly presents, in all material respects, the financial condition and results of operations of the Company.
|
March 1, 2021 |
/s/ Bradford Cooke |
|
|
Bradford Cooke |
|
|
Chief Executive Officer |
|
|
(Principal Executive Officer) |
A signed original of this written statement required by Section 906 has been provided to Endeavour Silver Corp. and will be retained by Endeavour Silver Corp. and furnished to the Securities and Exchange Commission or its staff upon request.
Exhibit 99.7
CERTIFICATION PURSUANT TO
18 U.S.C. §1350,
AS ADOPTED PURSUANT TO
SECTION 906 OF THE SARBANES-OXLEY ACT OF 2002
In connection with the annual report of Endeavour Silver Corp. (the “Company”) on Form 40-F for the period ended December 31, 2020 as filed with the Securities and Exchange Commission on the date hereof (the “Report”), I, Dan Dickson, Chief Financial Officer of the Company, certify, pursuant to 18 U.S.C. §1350, as adopted pursuant to Section
906 of the Sarbanes-Oxley Act of 2002, that:
(1) The Report fully complies with the requirements of Section 13(a) or 15(d) of the Securities Exchange Act of 1934; and
(2) The information contained in this Report fairly presents, in all material respects, the financial condition and results of operations of the Company.
|
March 1, 2021 |
/s/ Dan Dickson |
|
|
Dan Dickson |
|
|
Chief Financial Officer |
|
|
(Principal Financial and Accounting Officer) |
A signed original of this written statement required by Section 906 has been provided to Endeavour Silver Corp. and will be retained by Endeavour Silver Corp. and furnished to the Securities and Exchange Commission or its staff upon request.

CONSENT of AUTHOR
|
TO: |
British Columbia Securities Commission |
|
|
Alberta Securities Commission |
|
|
Financial and Consumer Affairs Authority of Saskatchewan |
|
|
The Manitoba Securities Commission |
|
|
Ontario Securities Commission |
|
|
Autorité des marchés financiers (Quebec) |
|
|
Financial and Consumer Services Commission (New Brunswick) |
|
|
Nova Scotia Securities Commission |
|
|
The Office of the Superintendent of Securities (Prince Edward Island) |
|
|
Office of the Superintendent of Securities (Newfoundland & Labrador) |
|
|
U.S. Securities and Exchange Commission |
Dears Sirs/Mesdames:
Reference is made to the Technical Report titled “Endeavour Silver Corp Terronera Project NI 43-101 Technical Report” effective July 14, 2020 and dated July 31, 2020 (the “Technical Report”) prepared for Endeavour Silver Corp. (the “Company”).
I consent to any extracts from or a summary of the Technical Report contained in, or incorporated by reference in the Company’s Annual Information Form dated as of February 25, 2021, the Company’s Short Form Base Shelf Prospectus dated April 27, 2020 and the Prospectus Supplement dated October 1, 2020 thereto, the Annual Report of the Company on Form 40-F for the fiscal year ended December 31, 2020 and the Registration Statement on Form F-10 (File No. 333-237625) of the Company (collectively, the “Disclosure Documents”).
The undersigned hereby consents to:
(a) being named directly or indirectly in the Disclosure Documents; and
(b) the use of the Technical Report and to extracts from or a summary of the Technical Report in the Disclosure Documents or incorporated by reference therein.
The undersigned hereby confirms that:
(i) the undersigned has read the Disclosure Documents, including the extracts from or a summary of the Technical Report in the Disclosure Documents or incorporated by reference therein;
(ii) the undersigned has no reason to believe that there are any misrepresentations in the information contained in the Disclosure Documents or incorporated by reference therein that is derived from the Technical Report or that is within the undersigned’s knowledge as a result of the services performed by the undersigned in connection with the Technical Report; and
(iii) the Disclosure Documents fairly and accurately represent the information in the sections of the Technical Report for which I am responsible.
Dated this 25th day of February 2021
/s/ HUMBERTO PRECIADO
____________________
Humberto Preciado, P.E.
2
CONSENT of AUTHOR
|
TO: |
British Columbia Securities Commission |
|
|
Alberta Securities Commission |
|
|
Financial and Consumer Affairs Authority of Saskatchewan |
|
|
The Manitoba Securities Commission |
|
|
Ontario Securities Commission |
|
|
Autorité des marchés financiers (Quebec) |
|
|
Financial and Consumer Services Commission (New Brunswick) |
|
|
Nova Scotia Securities Commission |
|
|
The Office of the Superintendent of Securities (Prince Edward Island) |
|
|
Office of the Superintendent of Securities (Newfoundland & Labrador) |
|
|
U.S. Securities and Exchange Commission |
Dears Sirs/Mesdames:
Reference is made to the Technical Report titled “Endeavour Silver Corp Terronera Project NI 43-101 Technical Report” effective July 14, 2020 and dated July 31, 2020 (the “Technical Report”) prepared for Endeavour Silver Corp. (the “Company”).
I consent to any extracts from or a summary of the Technical Report contained in, or incorporated by reference in the Company’s Annual Information Form dated as of February 25, 2021, the Company’s Short Form Base Shelf Prospectus dated April 27, 2020 and the Prospectus Supplement dated October 1, 2020 thereto, the Annual Report of the Company on Form 40-F for the fiscal year ended December 31, 2020 and the Registration Statement on Form F-10 (File No. 333-237625) of the Company (collectively, the “Disclosure Documents”).
The undersigned hereby consents to:
(a) being named directly or indirectly in the Disclosure Documents; and
(b) the use of the Technical Report and to extracts from or a summary of the Technical Report in the Disclosure Documents or incorporated by reference therein.
The undersigned hereby confirms that:
(i) the undersigned has read the Disclosure Documents, including the extracts from or a summary of the Technical Report in the Disclosure Documents or incorporated by reference therein;
(ii) the undersigned has no reason to believe that there are any misrepresentations in the information contained in the Disclosure Documents or incorporated by reference therein that is derived from the
Technical Report or that is within the undersigned’s knowledge as a result of the services performed by the undersigned in connection with the Technical Report; and
(iii) the Disclosure Documents fairly and accurately represent the information in the sections of the Technical Report for which I am responsible.
Dated this 25h day of February 2021
“signature” {signed and sealed}

____________________
Michael Petrina
2

201 County Court Blvd., Suite 304, Brampton, Ontario, L6W 4L2
Ph: 905-595-0575 Fax: 905-595-0578 www.peconsulting.ca
CONSENT OF DAVID BURGA
|
TO: |
British Columbia Securities Commission |
|
|
Alberta Securities Commission |
|
|
Financial and Consumer Affairs Authority of Saskatchewan |
|
|
The Manitoba Securities Commission |
|
|
Ontario Securities Commission |
|
|
Autorité des marchés financiers (Quebec) |
|
|
Financial and Consumer Services Commission (New Brunswick) |
|
|
Nova Scotia Securities Commission |
|
|
The Office of the Superintendent of Securities (Prince Edward Island) |
|
|
Office of the Superintendent of Securities (Newfoundland & Labrador) |
|
|
U.S. Securities and Exchange Commission |
Dears Sirs/Mesdames:
Reference is made to the Technical Report titled “Endeavour Silver Corp Terronera Project NI 43-101 Technical Report” effective July 14, 2020 and dated July 31, 2020 (the “Technical Report”) prepared for Endeavour Silver Corp. (the “Company”).
I consent to any extracts from or a summary of the Technical Report contained in, or incorporated by reference in the Company’s Annual Information Form dated as of February 25, 2021, the Company’s Short Form Base Shelf Prospectus dated April 27, 2020 and the Prospectus Supplement dated October 1, 2020 thereto, the Annual Report of the Company on Form 40-F for the fiscal year ended December 31, 2020 and the Registration Statement on Form F-10 (File No. 333-237625) of the Company (collectively, the “Disclosure Documents”).
The undersigned hereby consents to:
(a) being named directly or indirectly in the Disclosure Documents; and
(b) the use of the Technical Report and to extracts from or a summary of the Technical Report in the Disclosure Documents or incorporated by reference therein.
The undersigned hereby confirms that:
(i) the undersigned has read the Disclosure Documents, including the extracts from or a summary of the Technical Report in the Disclosure Documents or incorporated by reference therein;
(ii) the undersigned has no reason to believe that there are any misrepresentations in the information contained in the Disclosure Documents or incorporated by reference therein that is derived from the Technical Report or that is within the undersigned’s knowledge as a result of the services performed by the undersigned in connection with the Technical Report; and
(iii) the Disclosure Documents fairly and accurately represent the information in the sections of the Technical Report for which I am responsible.
Dated this 25h day of February 2021

David Burga, P.Geo,
Associate Geologist
P&E Mining Consultants Inc.

201 County Court Blvd., Suite 304, Brampton, Ontario, L6W 4L2
Ph: 905-595-0575 Fax: 905-595-0578 www.peconsulting.ca
CONSENT OF EUGENE PURITCH
|
TO: |
British Columbia Securities Commission |
|
|
Alberta Securities Commission |
|
|
Financial and Consumer Affairs Authority of Saskatchewan |
|
|
The Manitoba Securities Commission |
|
|
Ontario Securities Commission |
|
|
Autorité des marchés financiers (Quebec) |
|
|
Financial and Consumer Services Commission (New Brunswick) |
|
|
Nova Scotia Securities Commission |
|
|
The Office of the Superintendent of Securities (Prince Edward Island) |
|
|
Office of the Superintendent of Securities (Newfoundland & Labrador) |
|
|
U.S. Securities and Exchange Commission |
Dears Sirs/Mesdames:
Reference is made to the Technical Report titled “Endeavour Silver Corp Terronera Project NI 43-101 Technical Report” effective July 14, 2020 and dated July 31, 2020 (the “Technical Report”) prepared for Endeavour Silver Corp. (the “Company”).
I consent to any extracts from or a summary of the Technical Report contained in, or incorporated by reference in the Company’s Annual Information Form dated as of February 25, 2021, the Company’s Short Form Base Shelf Prospectus dated April 27, 2020 and the Prospectus Supplement dated October 1, 2020 thereto, the Annual Report of the Company on Form 40-F for the fiscal year ended December 31, 2020 and the Registration Statement on Form F-10 (File No. 333-237625) of the Company (collectively, the “Disclosure Documents”).
The undersigned hereby consents to:
(a) being named directly or indirectly in the Disclosure Documents; and
(b) the use of the Technical Report and to extracts from or a summary of the Technical Report in the Disclosure Documents or incorporated by reference therein.
The undersigned hereby confirms that:
(i) the undersigned has read the Disclosure Documents, including the extracts from or a summary of the Technical Report in the Disclosure Documents or incorporated by reference therein;
(ii) the undersigned has no reason to believe that there are any misrepresentations in the information contained in the Disclosure Documents or incorporated by reference therein that is derived from the Technical Report or that is within the undersigned’s knowledge as a result of the services performed by the undersigned in connection with the Technical Report; and
(iii) the Disclosure Documents fairly and accurately represent the information in the sections of the Technical Report for which I am responsible.
Dated this 25h day of February 2021

Eugene Puritch, P.Eng., FEC, CET
President
P&E Mining Consultants Inc.

201 County Court Blvd., Suite 304, Brampton, Ontario, L6W 4L2
Ph: 905-595-0575 Fax: 905-595-0578 www.peconsulting.ca
CONSENT OF YUNGANG WU
|
TO: |
British Columbia Securities Commission |
|
|
Alberta Securities Commission |
|
|
Financial and Consumer Affairs Authority of Saskatchewan |
|
|
The Manitoba Securities Commission |
|
|
Ontario Securities Commission |
|
|
Autorité des marchés financiers (Quebec) |
|
|
Financial and Consumer Services Commission (New Brunswick) |
|
|
Nova Scotia Securities Commission |
|
|
The Office of the Superintendent of Securities (Prince Edward Island) |
|
|
Office of the Superintendent of Securities (Newfoundland & Labrador) |
|
|
U.S. Securities and Exchange Commission |
Dears Sirs/Mesdames:
Reference is made to the Technical Report titled “Endeavour Silver Corp Terronera Project NI 43-101 Technical Report” effective July 14, 2020 and dated July 31, 2020 (the “Technical Report”) prepared for Endeavour Silver Corp. (the “Company”).
I consent to any extracts from or a summary of the Technical Report contained in, or incorporated by reference in the Company’s Annual Information Form dated as of February 25, 2021, the Company’s Short Form Base Shelf Prospectus dated April 27, 2020 and the Prospectus Supplement dated October 1, 2020 thereto, the Annual Report of the Company on Form 40-F for the fiscal year ended December 31, 2020 and the Registration Statement on Form F-10 (File No. 333-237625) of the Company (collectively, the “Disclosure Documents”).
The undersigned hereby consents to:
(a) being named directly or indirectly in the Disclosure Documents; and
(b) the use of the Technical Report and to extracts from or a summary of the Technical Report in the Disclosure Documents or incorporated by reference therein.
The undersigned hereby confirms that:
(i) the undersigned has read the Disclosure Documents, including the extracts from or a summary of the Technical Report in the Disclosure Documents or incorporated by reference therein;
(ii) the undersigned has no reason to believe that there are any misrepresentations in the information contained in the Disclosure Documents or incorporated by reference therein that is derived from the Technical Report or that is within the undersigned’s knowledge as a result of the services performed by the undersigned in connection with the Technical Report; and
(iii) the Disclosure Documents fairly and accurately represent the information in the sections of the Technical Report for which I am responsible.
Dated this 25h day of February 2021

Yungang Wu, P.Geo,
Associate Geologist
P&E Mining Consultants Inc.

CONSENT of AUTHOR
|
TO: |
British Columbia Securities Commission |
|
|
Alberta Securities Commission |
|
|
Financial and Consumer Affairs Authority of Saskatchewan |
|
|
The Manitoba Securities Commission |
|
|
Ontario Securities Commission |
|
|
Autorité des marchés financiers (Quebec) |
|
|
Financial and Consumer Services Commission (New Brunswick) |
|
|
Nova Scotia Securities Commission |
|
|
The Office of the Superintendent of Securities (Prince Edward Island) |
|
|
Office of the Superintendent of Securities (Newfoundland & Labrador) |
|
|
U.S. Securities and Exchange Commission |
Dears Sirs/Mesdames:
Reference is made to the Technical Report titled “Endeavour Silver Corp Terronera Project NI 43-101 Technical Report” effective July 14, 2020 and dated July 31, 2020 (the “Technical Report”) prepared for Endeavour Silver Corp. (the “Company”).
I consent to any extracts from or a summary of the Technical Report contained in, or incorporated by reference in the Company’s Annual Information Form dated as of February 25, 2021, the Company’s Short Form Base Shelf Prospectus dated April 27, 2020 and the Prospectus Supplement dated October 1, 2020 thereto, the Annual Report of the Company on Form 40-F for the fiscal year ended December 31, 2020 and the Registration Statement on Form F-10 (File No. 333-237625) of the Company (collectively, the “Disclosure Documents”).
The undersigned hereby consents to:
(a) being named directly or indirectly in the Disclosure Documents; and
(b) the use of the Technical Report and to extracts from or a summary of the Technical Report in the Disclosure Documents or incorporated by reference therein.
The undersigned hereby confirms that:
(i) the undersigned has read the Disclosure Documents, including the extracts from or a summary of the Technical Report in the Disclosure Documents or incorporated by reference therein;
(ii) the undersigned has no reason to believe that there are any misrepresentations in the information contained in the Disclosure Documents or incorporated by reference therein that is derived from the Technical Report or that is within the undersigned’s knowledge as a result of the services performed by the undersigned in connection with the Technical Report; and
(iii) the Disclosure Documents fairly and accurately represent the information in the sections of the Technical Report for which I am responsible.
Dated this 25h day of February 2021
[original signed and sealed “Michael Levy”]
Michael Levy
2
CONSENT of AUTHOR
TO: British Columbia Securities Commission
Alberta Securities Commission
Financial and Consumer Affairs Authority of Saskatchewan The Manitoba Securities Commission
Ontario Securities Commission
Autorité des marchés financiers (Quebec)
Financial and Consumer Services Commission (New Brunswick) Nova Scotia Securities Commission
The Office of the Superintendent of Securities (Prince Edward Island) Office of the Superintendent of Securities (Newfoundland & Labrador) U.S. Securities and Exchange Commission
Dears Sirs/Mesdames:
Reference is to the Technical Report titled “Amended National Instrument 43-101 Technical Report: Updated Mineral Resource and Reserve Estimates for the Bolanitos Project, Guanajuato State, Mexico” effective December 31, 2016, dated March 3, 2017 and amended March 27, 2018 (the “Technical Report”) prepared for Endeavour Silver Corp. (the “Company”).
I consent to any extracts from or a summary of the Technical Report contained in, or incorporated by reference in the Company’s Annual Information Form dated as of February 25, 2021, the Company’s Short Form Base Shelf Prospectus dated April 27, 2020 and the Prospectus Supplement dated October 1, 2020 thereto, the Annual Report of the Company on Form 40-F for the fiscal year ended December 31, 2020 and the Registration Statement on Form F-10 (File No. 333-237625) of the Company (collectively, the “Disclosure Documents”).
The undersigned hereby consents to:
(a) being named directly or indirectly in the Disclosure Documents; and
(b) the use of the Technical Report and to extracts from or a summary of the Technical Report in the Disclosure Documents or incorporated by reference therein.
The undersigned hereby confirms that:
(i) the undersigned has read the Disclosure Documents, including the extracts from or a summary of the Technical Report in the Disclosure Documents or incorporated by reference therein;
(ii) the undersigned has no reason to believe that there are any misrepresentations in the information contained in the Disclosure Documents or incorporated by reference therein that is derived from the Technical Report or that is within the undersigned’s knowledge as a result of the services performed by the undersigned in connection with the Technical Report; and
(iii) the Disclosure Documents fairly and accurately represent the information in the sections of the Technical Report for which I am responsible.
Dated the 25th day of February, 2021
“signature” {signed and sealed}

____________________
Zachary J. Black, SME-RM
2
CONSENT of AUTHOR
TO: British Columbia Securities Commission
Alberta Securities Commission
Financial and Consumer Affairs Authority of Saskatchewan The Manitoba Securities Commission
Ontario Securities Commission
Autorité des marchés financiers (Quebec)
Financial and Consumer Services Commission (New Brunswick) Nova Scotia Securities Commission
The Office of the Superintendent of Securities (Prince Edward Island) Office of the Superintendent of Securities (Newfoundland & Labrador) U.S. Securities and Exchange Commission
Dears Sirs/Mesdames:
Reference is to the Technical Report titled “Amended National Instrument 43-101 Technical Report: Updated Mineral Resource and Reserve Estimates for the Guanacevi Project, Durango State, Mexico” effective December 31, 2016, dated March 3, 2017 and amended March 27, 2018 (the “Technical Report”) prepared for Endeavour Silver Corp. (the “Company”).
I consent to any extracts from or a summary of the Technical Report contained in, or incorporated by reference in the Company’s Annual Information Form dated as of February 25, 2021, the Company’s Short Form Base Shelf Prospectus dated April 27, 2020 and the Prospectus Supplement dated October 1, 2020 thereto, the Annual Report of the Company on Form 40-F for the fiscal year ended December 31, 2020 and the Registration Statement on Form F-10 (File No. 333-237625) of the Company (collectively, the “Disclosure Documents”).
The undersigned hereby consents to:
(a) being named directly or indirectly in the Disclosure Documents; and
(b) the use of the Technical Report and to extracts from or a summary of the Technical Report in the Disclosure Documents or incorporated by reference therein.
The undersigned hereby confirms that:
(i) the undersigned has read the Disclosure Documents, including the extracts from or a summary of the Technical Report in the Disclosure Documents or incorporated by reference therein;
(ii) the undersigned has no reason to believe that there are any misrepresentations in the information contained in the Disclosure Documents or incorporated by reference therein that is derived from the Technical Report or that is within the undersigned’s knowledge as a result of the services performed by the undersigned in connection with the Technical Report; and
(iii) the Disclosure Documents fairly and accurately represent the information in the sections of the Technical Report for which I am responsible.
Dated the 25th day of February, 2021
“signature” {signed and sealed}

____________________
Zachary J. Black, SME-RM
2
CONSENT of AUTHOR
TO: British Columbia Securities Commission
Alberta Securities Commission
Financial and Consumer Affairs Authority of Saskatchewan The Manitoba Securities Commission
Ontario Securities Commission
Autorité des marchés financiers (Quebec)
Financial and Consumer Services Commission (New Brunswick) Nova Scotia Securities Commission
The Office of the Superintendent of Securities (Prince Edward Island) Office of the Superintendent of Securities (Newfoundland & Labrador) U.S. Securities and Exchange Commission
Dears Sirs/Mesdames:
Reference is to the Technical Report titled “Amended National Instrument 43-101 Technical Report: Updated Mineral Resource and Reserve Estimates for the Bolanitos Project, Guanajuato State, Mexico” effective December 31, 2016, dated March 3, 2017 and amended March 27, 2018 (the “Technical Report”) prepared for Endeavour Silver Corp. (the “Company”).
I consent to any extracts from or a summary of the Technical Report contained in, or incorporated by reference in the Company’s Annual Information Form dated as of February 25, 2021, the Company’s Short Form Base Shelf Prospectus dated April 27, 2020 and the Prospectus Supplement dated October 1, 2020 thereto, the Annual Report of the Company on Form 40-F for the fiscal year ended December 31, 2020 and the Registration Statement on Form F-10 (File No. 333-237625) of the Company (collectively, the “Disclosure Documents”).
The undersigned hereby consents to:
(a) being named directly or indirectly in the Disclosure Documents; and
(b) the use of the Technical Report and to extracts from or a summary of the Technical Report in the Disclosure Documents or incorporated by reference therein.
The undersigned hereby confirms that:
(i) the undersigned has read the Disclosure Documents, including the extracts from or a summary of the Technical Report in the Disclosure Documents or incorporated by reference therein;
(ii) the undersigned has no reason to believe that there are any misrepresentations in the information contained in the Disclosure Documents or incorporated by reference therein that is derived from the Technical Report or that is within the undersigned’s knowledge as a result of the services performed by the undersigned in connection with the Technical Report; and
(iii) the Disclosure Documents fairly and accurately represent the information in the sections of the Technical Report for which I am responsible.
Dated the 25th day of February, 2021
“signature” {signed and sealed}

____________________
Jennifer J. Brown, SME-RM
2
CONSENT of AUTHOR
TO: British Columbia Securities Commission
Alberta Securities Commission
Financial and Consumer Affairs Authority of Saskatchewan The Manitoba Securities Commission
Ontario Securities Commission
Autorité des marchés financiers (Quebec)
Financial and Consumer Services Commission (New Brunswick) Nova Scotia Securities Commission
The Office of the Superintendent of Securities (Prince Edward Island) Office of the Superintendent of Securities (Newfoundland & Labrador) U.S. Securities and Exchange Commission
Dears Sirs/Mesdames:
Reference is to the Technical Report titled “Amended National Instrument 43-101 Technical Report: Updated Mineral Resource and Reserve Estimates for the Guanacevi Project, Durango State, Mexico” effective December 31, 2016, dated March 3, 2017 and amended March 27, 2018 (the “Technical Report”) prepared for Endeavour Silver Corp. (the “Company”).
I consent to any extracts from or a summary of the Technical Report contained in, or incorporated by reference in the Company’s Annual Information Form dated as of February 25, 2021, the Company’s Short Form Base Shelf Prospectus dated April 27, 2020 and the Prospectus Supplement dated October 1, 2020 thereto, the Annual Report of the Company on Form 40-F for the fiscal year ended December 31, 2020 and the Registration Statement on Form F-10 (File No. 333-237625) of the Company (collectively, the “Disclosure Documents”).
The undersigned hereby consents to:
(a) being named directly or indirectly in the Disclosure Documents; and
(b) the use of the Technical Report and to extracts from or a summary of the Technical Report in the Disclosure Documents or incorporated by reference therein.
The undersigned hereby confirms that:
(i) the undersigned has read the Disclosure Documents, including the extracts from or a summary of the Technical Report in the Disclosure Documents or incorporated by reference therein;
(ii) the undersigned has no reason to believe that there are any misrepresentations in the information contained in the Disclosure Documents or incorporated by reference therein that is derived from the Technical Report or that is within the undersigned’s knowledge as a result of the services performed by the undersigned in connection with the Technical Report; and
(iii) the Disclosure Documents fairly and accurately represent the information in the sections of the Technical Report for which I am responsible.
Dated the 25th day of February, 2021
“signature” {signed and sealed}

____________________
Jennifer J. Brown, SME-RM
2
CONSENT of AUTHOR
TO: British Columbia Securities Commission
Alberta Securities Commission
Financial and Consumer Affairs Authority of Saskatchewan The Manitoba Securities Commission
Ontario Securities Commission
Autorité des marchés financiers (Quebec)
Financial and Consumer Services Commission (New Brunswick) Nova Scotia Securities Commission
The Office of the Superintendent of Securities (Prince Edward Island) Office of the Superintendent of Securities (Newfoundland & Labrador) U.S. Securities and Exchange Commission
Dears Sirs/Mesdames:
Reference is to the Technical Report titled “Amended National Instrument 43-101 Technical Report: Updated Mineral Resource and Reserve Estimates for the Bolanitos Project, Guanajuato State, Mexico” effective December 31, 2016, dated March 3, 2017 and amended March 27, 2018 (the “Technical Report”) prepared for Endeavour Silver Corp. (the “Company”).
I consent to any extracts from or a summary of the Technical Report contained in, or incorporated by reference in the Company’s Annual Information Form dated as of February 25, 2021, the Company’s Short Form Base Shelf Prospectus dated April 27, 2020 and the Prospectus Supplement dated October 1, 2020 thereto, the Annual Report of the Company on Form 40-F for the fiscal year ended December 31, 2020 and the Registration Statement on Form F-10 (File No. 333-237625) of the Company (collectively, the “Disclosure Documents”).
The undersigned hereby consents to:
(a) being named directly or indirectly in the Disclosure Documents; and
(b) the use of the Technical Report and to extracts from or a summary of the Technical Report in the Disclosure Documents or incorporated by reference therein.
The undersigned hereby confirms that:
(i) the undersigned has read the Disclosure Documents, including the extracts from or a summary of the Technical Report in the Disclosure Documents or incorporated by reference therein;
(ii) the undersigned has no reason to believe that there are any misrepresentations in the information contained in the Disclosure Documents or incorporated by reference therein that is derived from the Technical Report or that is within the undersigned’s knowledge as a result of the services performed by the undersigned in connection with the Technical Report; and
(iii) the Disclosure Documents fairly and accurately represent the information in the sections of the Technical Report for which I am responsible.
Dated the 25th day of February, 2021
“signature” {signed and sealed}

____________________
Jeffery Choquette, PE
2
CONSENT of AUTHOR
TO: British Columbia Securities Commission
Alberta Securities Commission
Financial and Consumer Affairs Authority of Saskatchewan The Manitoba Securities Commission
Ontario Securities Commission
Autorité des marchés financiers (Quebec)
Financial and Consumer Services Commission (New Brunswick) Nova Scotia Securities Commission
The Office of the Superintendent of Securities (Prince Edward Island) Office of the Superintendent of Securities (Newfoundland & Labrador) U.S. Securities and Exchange Commission
Dears Sirs/Mesdames:
Reference is to the Technical Report titled “Amended National Instrument 43-101 Technical Report: Updated Mineral Resource and Reserve Estimates for the Guanacevi Project, Durango State, Mexico” effective December 31, 2016, dated March 3, 2017 and amended March 27, 2018 (the “Technical Report”) prepared for Endeavour Silver Corp. (the “Company”).
I consent to any extracts from or a summary of the Technical Report contained in, or incorporated by reference in the Company’s Annual Information Form dated as of February 25, 2021, the Company’s Short Form Base Shelf Prospectus dated April 27, 2020 and the Prospectus Supplement dated October 1, 2020 thereto, the Annual Report of the Company on Form 40-F for the fiscal year ended December 31, 2020 and the Registration Statement on Form F-10 (File No. 333-237625) of the Company (collectively, the “Disclosure Documents”).
The undersigned hereby consents to:
(a) being named directly or indirectly in the Disclosure Documents; and
(b) the use of the Technical Report and to extracts from or a summary of the Technical Report in the Disclosure Documents or incorporated by reference therein.
The undersigned hereby confirms that:
(i) the undersigned has read the Disclosure Documents, including the extracts from or a summary of the Technical Report in the Disclosure Documents or incorporated by reference therein;
(ii) the undersigned has no reason to believe that there are any misrepresentations in the information contained in the Disclosure Documents or incorporated by reference therein that is derived from the Technical Report or that is within the undersigned’s knowledge as a result of the services performed by the undersigned in connection with the Technical Report; and
(iii) the Disclosure Documents fairly and accurately represent the information in the sections of the Technical Report for which I am responsible.
Dated the 25th day of February, 2021
“signature” {signed and sealed}

____________________
Jeffery Choquette, MMSA-RM
2
CONSENT of AUTHOR
TO: British Columbia Securities Commission
Alberta Securities Commission
Financial and Consumer Affairs Authority of Saskatchewan
The Manitoba Securities Commission
Ontario Securities Commission
Autorité des marchés financiers (Quebec)
Financial and Consumer Services Commission (New Brunswick)
Nova Scotia Securities Commission
The Office of the Superintendent of Securities (Prince Edward Island)
Office of the Superintendent of Securities (Newfoundland & Labrador)
U.S. Securities and Exchange Commission
Dears Sirs/Mesdames:
I consent to the Updated Internal Mineral Reserve and Resource Estimates of the Guanacevi Mine, the Bolanitos Mine, the El Cubo Mine, the El Compas Mine, and the disclosure of the Parral Exploration Project and the Guadalupe y Calvo Exploration Project and related information contained in, or incorporated by reference in, the Annual Information Form dated February 25, 2020, the Company’s Short Form Base Shelf Prospectus dated April 27, 2020 and the Prospectus Supplement dated October 1, 2020 thereto, the Annual Report of the Company on Form 40-F for the fiscal year ended December 31, 2020, the Registration Statement on Form F-10 (File No. 333- 237625) of Endeavour Silver Corp. (collectively the “Disclosure Documents”).
The undersigned hereby consents to:
(a) being named directly or indirectly in the Disclosure Documents; and The undersigned hereby confirms that:
(i) the undersigned has read the Disclosure Documents, including Updated Internal Mineral Reserve and Resource Estimate of the Guanacevi Mine, the Bolanitos Mine, the El Cubo Mine, El Compas Mine, and disclosure of the Parral Exploration Project and the Guadalupe y Calvo Exploration Project in the Disclosure Documents or incorporated by reference therein;
(ii) the undersigned has no reason to believe that there are any misrepresentations in the information contained in the Disclosure Documents.;
Dated this 25th day of February, 2021
“signature” {signed}
_____________________________________
Dale Mah, P.Geo,
Endeavour Silver Corp.
|
KPMG LLP |
Telephone |
(604) 691-3000 |
|
Chartered Professional Accountants |
Fax |
(604) 691-3031 |
|
PO Box 10426 777 Dunsmuir Street |
Internet |
www.kpmg.ca |
|
Vancouver BC V7Y 1K3 |
|
|
|
Canada |
|
|
Consent of Independent Registered Public Accounting Firm
The Board of Directors
Endeavour Silver Corp.
We, KPMG LLP, consent to the use of:
• our Report of Independent Registered Public Accounting Firm dated February 25, 2021, addressed to the shareholders and board of directors of Endeavour Silver Corp. (the “Company”), on the consolidated financial statements of the Company which are comprised of the consolidated statements of financial position of the Company as of December 31, 2020 and 2019, the related consolidated statements of comprehensive earnings (loss), changes in shareholders’ equity and cash flows for each of the years then ended, and the related notes; and
• our Report of Independent Registered Public Accounting Firm dated February 25, 2021 on the effectiveness of internal controls over financial reporting as of December 31, 2020,
each of which is included in this annual report on Form 40-F of the Company for the year ended December 31, 2020.
We also consent to the incorporation by reference of such reports in the Registration Statement (No. 333-237625) on Form F-10 of Endeavour Silver Corp.
/s/ KPMG LLP
Chartered Professional Accountants
March 1, 2021
Vancouver, Canada
© 2021 KPMG LLP, an Ontario limited liability partnership and a member firm of the KPMG global organization of independent member firms affiliated with KPMG International Limited, a private English company limited by guarantee. All rights reserved.
Serious News for Serious Traders! Try StreetInsider.com Premium Free!
You May Also Be Interested In
- Latest From CEO.CA's Inside the Boardroom: Insights From Across The Mining Sector
- Black Construction Awarded Three Projects in Diego Garcia Totaling $54.5 Million
- Loar Announces Pricing of Initial Public Offering
Create E-mail Alert Related Categories
SEC FilingsSign up for StreetInsider Free!
Receive full access to all new and archived articles, unlimited portfolio tracking, e-mail alerts, custom newswires and RSS feeds - and more!
