

Form 18-K/A QUEBEC For: Mar 31
 Tweet
Tweet Share
ShareFORM 18-K/A
For Foreign Governments and Political Subdivisions Thereof
SECURITIES AND EXCHANGE COMMISSION
Washington, D.C. 20549
AMENDMENT NO. 2
to
ANNUAL REPORT
of
QUÉBEC
(Name of Registrant)
Date of end of last fiscal year: March 31, 2022
SECURITIES REGISTERED*
(As of close of fiscal year)
| Amounts as to | Names of | |
| Title of issue | which registration | exchanges on |
| is effective | which registered | |
| N/A | N/A | N/A |
Name and address of person authorized to receive notices and communications from the Securities and Exchange Commission:
Martine Hébert
Délégation générale du Québec
One Rockefeller Plaza
26th Floor
New York, N.Y. 10020-2102
Copies to:
| Catherine M. Clarkin | Alain Bélanger |
| Sullivan & Cromwell LLP | Ministère des Finances du Québec |
| 125 Broad Street | 390, boulevard Charest Est |
| New York, N.Y. 10004-2498 | Québec, Québec, G1K 3H4, Canada |
* The Registrant is filing this Annual Report on a voluntary basis.
The undersigned registrant hereby amends its Annual Report on Form 18-K for the fiscal year ended March 31, 2022 (the “Annual Report”) as follows:
The following additional exhibit is hereby added to the Annual Report:
Exhibit:
Pursuant to the requirements of the Securities Exchange Act of 1934, the registrant has duly caused this Amendment no. 2 to be signed on its behalf by its authorized agent.
QUÉBEC
| By: | /s/ Alain Bélanger | |
| Name: | Alain Bélanger | |
| Title: | Assistant Deputy Minister |
Date: July 5, 2022
2
Exhibit 99.3
![]()
| Note to the reader: preliminary results for 2021-2022
The Monthly Report on Financial Transactions provides an overview of the Québec government’s monthly financial results. It is produced to increase the transparency of public finances and to provide regular monitoring of the achievement of the budgetary balance target for the fiscal year. The financial information presented in this report is unaudited and is based on the accounting policies used in the government’s annual financial statements.(1) In March 2020, the World Health Organization declared a COVID-19 pandemic. The pandemic and the measures implemented to deal with it are having significant impacts, in particular on the Québec government’s financial situation. The results published as at June 30, 2022 for the fiscal year ending March 31, 2022 are preliminary. These results will be revised to reflect additional information obtained up to the closing of the consolidated financial statements. Final results will be presented in the Public Accounts 2021-2022. |
| SUMMARY OF CONSOLIDATED RESULTS | ||||||||||||||||
| (unaudited data, millions of dollars) | ||||||||||||||||
| March | April to March | |||||||||||||||
| 2021 | 2022 | Change | 2020-2021 | 2021-2022 | Change | Change (%) | ||||||||||
| Own-source revenue | 9 432 | 12 232 | 2 800 | 91 868 | 110 251 | 18 383 | 20.0 | |||||||||
| Federal transfers | 4 366 | 3 324 | –1 042 | 30 716 | 29 141 | –1 575 | –5.1 | |||||||||
| Consolidated revenue | 13 798 | 15 556 | 1 758 | 122 584 | 139 392 | 16 808 | 13.7 | |||||||||
| Portfolio expenditures(2) | –14 980 | –18 443 | –3 463 | –119 121 | –127 450 | –8 329 | 7.0 | |||||||||
| Debt service | –875 | –815 | 60 | –7 689 | –8 619 | –930 | 12.1 | |||||||||
| Consolidated expenditure | –15 855 | –19 258 | –3 403 | –126 810 | –136 069 | –9 259 | 7.3 | |||||||||
| SURPLUS (DEFICIT)(3) | –2 057 | –3 702 | –1 645 | –4 226 | 3 323 | 7 549 | — | |||||||||
| BALANCED BUDGET ACT | ||||||||||||||||
| Deposits of dedicated revenues in the Generations Fund | –401 | –532 | –131 | –3 313 | –3 617 | –304 | — | |||||||||
| Change in application of the accounting standard respecting transfer payments | — | — | — | –3 221 | (4) | — | 3 221 | — | ||||||||
| BUDGETARY BALANCE BEFORE USE OF THE STABILIZATION RESERVE | –2 458 | –4 234 | –1 776 | –10 760 | (5) | –294 | 10 466 | — | ||||||||
1
 REVISION OF THE BUDGET BALANCE IN 2021-2022 SINCE THE MARCH 2022 BUDGET
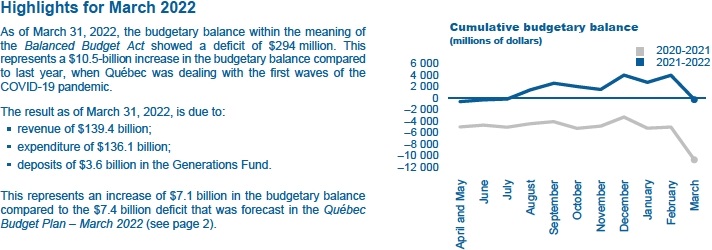
According to the data presented in the Québec Budget Plan - March 2022, a budgetary deficit of $7.4 billion was expected for the entire 2021-2022 fiscal year, before use of the stabilization reserve.
Preliminary results as at March 31, 2022 show a deficit of $294 million. This $7.1 billion upward revision to the budget balance comes primarily from:
-
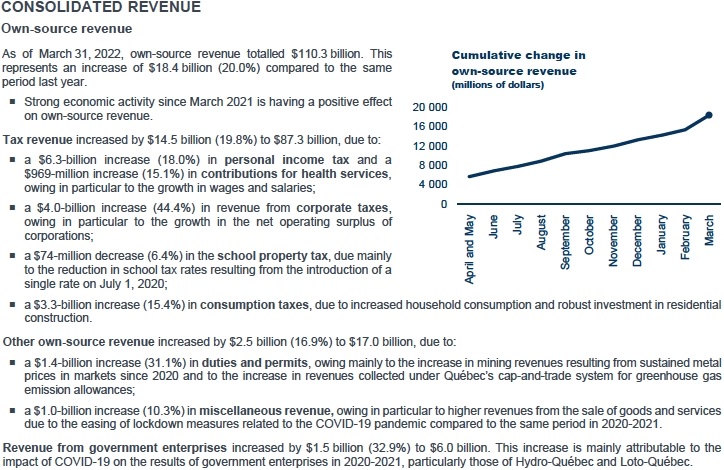
a $3.9-billion increase in own-source revenue excluding those of government enterprises, including:
-
$2.2 billion in personal income tax, an increase due in particular to the level of source deductions and capital gains reported on tax returns for the 2021 taxation year being higher than expected,
-
$943 million in corporate taxes due to higher net operating surplus of corporations in 2021;
-
a $473-million increase in revenues from government enterprises, mainly due to Hydro-Québec’s results;
-
a $406-million decrease in revenues from federal transfers, mainly due to the slower pace of completion of federally funded infrastructure projects;
-
lower-than-expected portfolio expenditures of $3.5 billion, including:
-
$490 million in the Santé et Services sociaux portfolio, mainly due to lower-than-expected compensation costs projected in the 2022-2023 budget,
-
$428 million in the Éducation portfolio, mainly due to lower-than-expected expenditures in school service centres,
-
$385 million in the Enseignement supérieur portfolio, due in part to lower-than-anticipated CEGEP spending and cost of the loans and grants program,
-
$459 million in the Économie et Innovation portfolio, in particular due to lower-than-expected spending by the Economic Development Fund,
-
$401 million in the Travail, Emploi et Solidarité sociale portfolio, mainly due to a decrease in the number of people receiving social assistance and the lower-than-expected costs of certain refundable tax credits;
-
a $178-million increase in debt service expenses due to higher interest rates;
-
a $160-million increase in deposits of dedicated revenues to the Generations Fund.
The detailed revisions are presented in Appendix 1.
| CHANGE OF 2021-2022 RESULTS SINCE THE MARCH 2022 BUDGET | ||
| (millions of dollars) | ||
| BUDGETARY BALANCE BEFORE THE USE OF THE STABILIZATION RESERVE – MARCH 2022 BUDGET | –7 354 | |
| Change since the budget | ||
|
Own-source revenue excluding revenue from government enterprises |
3 864 | |
|
Revenue from government enterprises |
473 | |
|
Federal transfers |
–406 | |
|
Portfolio expenditures |
3 467 | |
|
Debt service |
–178 | |
|
Deposits of dedicated revenues in the Generations Fund |
–160 | |
|
Total change |
7 060 | |
| BUDGETARY BALANCE BEFORE THE USE OF THE STABILIZATION RESERVE – PRELIMINARY RESULTS | –294 |
2
| OWN-SOURCE REVENUE | ||||||||||||||||
| (unaudited data, millions of dollars) | ||||||||||||||||
| March | April to March | |||||||||||||||
| 2021 | 2022 | Change | 2020-2021 | 2021-2022 | Change | Change (%) | ||||||||||
| Income and property taxes | ||||||||||||||||
|
Personal income tax |
3 181 | 5 456 | 2 275 | 34 999 | 41 285 | 6 286 | 18.0 | |||||||||
|
Contributions for health services |
690 | 662 | –28 | 6 398 | 7 367 | 969 | 15.1 | |||||||||
|
Corporate taxes |
1 483 | 1 584 | 101 | 8 951 | 12 927 | 3 976 | 44.4 | |||||||||
|
School property tax |
85 | 91 | 6 | 1 155 | 1 081 | –74 | –6.4 | |||||||||
| Consumption taxes | 2 076 | 1 857 | –219 | 21 377 | 24 673 | 3 296 | 15.4 | |||||||||
| Tax revenue | 7 515 | 9 650 | 2 135 | 72 880 | 87 333 | 14 453 | 19.8 | |||||||||
| Duties and permits | 579 | 722 | 143 | 4 613 | 6 049 | 1 436 | 31.1 | |||||||||
| Miscellaneous revenue | 529 | 1 119 | 590 | 9 884 | 10 902 | 1 018 | 10.3 | |||||||||
| Other own-source revenue | 1 108 | 1 841 | 733 | 14 497 | 16 951 | 2 454 | 16.9 | |||||||||
| Total own-source revenue excluding revenue from government enterprises | 8 623 | 11 491 | 2 868 | 87 377 | 104 284 | 16 907 | 19.3 | |||||||||
| Revenue from government enterprises | 809 | 741 | –68 | 4 491 | 5 967 | 1 476 | 32.9 | |||||||||
| TOTAL | 9 432 | 12 232 | 2 800 | 91 868 | 110 251 | 18 383 | 20.0 | |||||||||
3

| FEDERAL TRANSFERS | ||||||||||||||||
| (unaudited data, millions of dollars) | ||||||||||||||||
| March | April to March | |||||||||||||||
| 2021 | 2022 | Change | 2020-2021 | 2021-2022 | Change | Change (%) | ||||||||||
| Equalization | 1 105 | 1 094 | –11 | 13 253 | 13 119 | –134 | –1.0 | |||||||||
| Health transfers | 567 | 866 | 299 | 6 800 | 8 244 | 1 444 | 21.2 | |||||||||
| Transfers for post-secondary education and other social programs | 132 | 116 | –16 | 1 590 | 1 555 | –35 | –2.2 | |||||||||
| Other programs | 2 562 | 1 248 | –1 314 | 9 073 | 6 223 | –2 850 | –31.4 | |||||||||
| TOTAL | 4 366 | 3 324 | –1 042 | 30 716 | 29 141 | –1 575 | –5.1 | |||||||||
4

Expenditure in the Éducation portfolio increased by $991 million (5.9%) to $17.8 billion. This increase is explained, in particular, by the reopening of educational institutions, which were temporarily closed in the spring of 2020 due to the COVID-19 pandemic.
Expenditure in the Enseignement supérieur portfolio increased by $227 million (2.7%) to $8.7 billion. This growth is due in part to the resumption of some activities that were limited in 2020-2021 in higher education institutions.
Expenditure in other portfolios increased by $4.2 billion (10.9%) to $43.1 billion, due in particular to:
-
a $3.8-billion increase in expenditure in the Travail, Emploi et Solidarité sociale portfolio, mainly due to the one-time cost of living allowance announced in the Québec Budget Plan - March 2022 and the extraordinary cost of living allowance announced in the
Update on Québec’s Economic and Financial Situation - Fall 2021; -
a $640-million increase in expenditure in the Famille portfolio, mainly due to the increase in the refundable tax credit for childcare expenses announced in the Update on Québec’s Economic and Financial Situation - Fall 2021;
-
a $379-million decrease in expenditure in the Affaires municipales et Habitation portfolio, mainly due to one-time financial assistance in 2020-2021 under the Safe Restart Agreement to support municipalities in the context of the pandemic.
Debt service expenditure increased by $930 million (12.1%) to $8.6 billion. This increase is mainly due to the rise in interest rates.
| CONSOLIDATED EXPENDITURES BY PORTFOLIO(6) | ||||||||||||||||
| (unaudited data, millions of dollars) | ||||||||||||||||
| March | April to March | |||||||||||||||
| 2021 | (7) | 2022 | Change | 2020-2021(7) | 2021-2022 | Change | Change (%) | |||||||||
| Santé et Services sociaux | 6 298 | 6 067 | –231 | 54 862 | 57 736 | 2 874 | 5.2 | |||||||||
| Éducation | 1 993 | 1 998 | 5 | 16 849 | 17 840 | 991 | 5.9 | |||||||||
| Enseignement supérieur | 853 | 712 | –141 | 8 521 | 8 748 | 227 | 2.7 | |||||||||
| Other portfolios(8) | 5 836 | 9 666 | 3 830 | 38 889 | 43 126 | 4 237 | 10.9 | |||||||||
| Portfolio expenditures | 14 980 | 18 443 | 3 463 | 119 121 | 127 450 | 8 329 | 7.0 | |||||||||
| Debt service | 875 | 815 | –60 | 7 689 | 8 619 | 930 | 12.1 | |||||||||
| TOTAL | 15 855 | 19 258 | 3 403 | 126 810 | 136 069 | 9 259 | 7.3 | |||||||||
5
NET FINANCIAL SURPLUSES OR REQUIREMENTS
| Composition of net financial surpluses or requirements
The government’s revenue and expenditure are established on an accrual basis of accounting. Revenue is recognized when earned and expenditure when incurred, regardless of when receipts and disbursements occur. Net financial surpluses (requirements), on the other hand, consist of the difference between receipts and disbursements resulting from government activities. To meet its net financial requirements, the government uses a variety of financing sources, including cash and borrowings. The various items for net financial requirements represent net receipts and disbursements generated by the government’s loans, interests in its enterprises, fixed assets and other investments, by retirement plans and other employee future benefits, as well as by other accounts. This last item includes the payment of accounts payable and the collection of accounts receivable. Deposits in the Generations Fund also result in financial requirements. |
As of March 31, 2022, net financial requirements amount to $9.8 billion and are due to:
-
the $3.3-billion surplus resulting from the difference between government revenue and expenditure;
-
the $4.6-billion financial requirements for investments, loans and advances, due primarily to an increase in short-term investments of $1.3 billion as part of overall cash management, increased investments by the Economic Development Fund and Financement Québec, as well as growth in the consolidation value of government enterprises;(9)
-
the $5.1-billion financial requirements related to government capital investments, mainly due to investments of $9.7 billion, offset by amortization expenses of $4.6 billion;(9)
-
the $2.9-billion financial requirements related to retirement plans and other employee future benefits liabilities, resulting from the payment of government employee benefits of $6.7 billion, partially offset by the net cost of plans of $3.8 billion;(9)
-
the $3.1-billion financial surplus from other accounts;(10)
-
the $3.6-billion financial requirements generated by deposits in the Generations Fund.
| NET FINANCIAL SURPLUSES OR REQUIREMENTS | ||||
| (unaudited data, millions of dollars) | ||||
| April to March | ||||
| 2020-2021 | 2021-2022 | |||
| SURPLUS (DEFICIT)(3) | –4 226 | 3 323 | ||
| Non-budgetary transactions | ||||
| Investments, loans and advances | –6 309 | –4 584 | ||
| Capital investments | –4 351 | –5 142 | ||
| Retirement plans and other employee future benefits | –2 705 | –2 876 | ||
| Other accounts(10) | 757 | 3 134 | ||
| Deposits in the Generations Fund | –3 313 | –3 617 | ||
| Total non-budgetary transactions | –15 921 | –13 085 | ||
| NET FINANCIAL SURPLUSES (REQUIREMENTS) | –20 147 | –9 762 | ||
6
APPENDIX 1: BUDGET FORECASTS – CHANGE SINCE THE MARCH 2022 BUDGET
| CHANGE OF 2021-2022 RESULTS SINCE THE MARCH 2022 BUDGET | ||||||||||
| (millions of dollars) | ||||||||||
| Preliminary results | ||||||||||
| March 2022 budget (11) | at March 31, 2022 | |||||||||
| $ million | % Change | (12) | Adjustments | $ million | % Change(12) | |||||
| CONSOLIDATED REVENUE | ||||||||||
| Income and property taxes | ||||||||||
|
Personal income tax |
39 094 | 11.7 | 2 191 | 41 285 | 18.0 | |||||
|
Contributions for health services |
7 017 | 9.7 | 350 | 7 367 | 15.1 | |||||
|
Corporate taxes |
11 984 | 33.9 | 943 | 12 927 | 44.4 | |||||
|
School property tax |
1 080 | –6.6 | 1 | 1 081 | –6.5 | |||||
| Consumption taxes | 24 536 | 14.8 | 137 | 24 673 | 15.4 | |||||
| Tax revenue | 83 711 | 14.9 | 3 622 | 87 333 | 19.8 | |||||
| Duties and permits | 5 685 | 23.2 | 364 | 6 049 | 31.1 | |||||
| Miscellaneous revenue | 11 024 | 11.5 | –122 | 10 902 | 10.3 | |||||
| Other own-source revenue | 16 709 | 15.3 | 242 | 16 951 | 16.9 | |||||
| Total own-source revenue excluding | ||||||||||
| revenue from government enterprises | 100 420 | 14.9 | 3 864 | 104 284 | 19.3 | |||||
| Revenue from government enterprises | 5 494 | 22.3 | 473 | 5 967 | 32.9 | |||||
| Total own-source revenue | 105 914 | 15.3 | 4 337 | 110 251 | 20.0 | |||||
| Federal transfers | 29 547 | –3.8 | –406 | 29 141 | –5.1 | |||||
| Total consolidated revenue | 135 461 | 10.5 | 3 931 | 139 392 | 13.7 | |||||
| CONSOLIDATED EXPENDITURE | ||||||||||
| Santé et Services sociaux | –58 226 | 6.4 | 490 | –57 736 | 5.2 | |||||
| Éducation | –18 268 | 7.9 | 428 | –17 840 | 5.9 | |||||
| Enseignement supérieur | –9 133 | 9.6 | 385 | –8 748 | 2.7 | |||||
| Other portfolios(8) | –45 290 | 15.8 | 2 164 | –43 126 | 10.9 | |||||
| Portfolio expenditures | –130 917 | 9.9 | 3 467 | –127 450 | 7.0 | |||||
| Debt service | –8 441 | 9.8 | –178 | –8 619 | 12.1 | |||||
| Total consolidated expenditure | –139 358 | 9.9 | 3 289 | –136 069 | 7.3 | |||||
| SURPLUS (DEFICIT)(3) | –3 897 | — | 7 220 | 3 323 | — | |||||
| BALANCED BUDGET ACT | ||||||||||
| Deposits of dedicated revenues in the Generations Fund | –3 457 | — | –160 | –3 617 | — | |||||
| BUDGETARY BALANCE BEFORE USE OF THE STABILIZATION RESERVE | –7 354 | — | 7 060 | –294 | — | |||||
| Use of the stabilization reserve | 1 221 | — | –927 | 294 | — | |||||
| BUDGETARY BALANCE(13) | –6 133 | — | 6 133 | — | — | |||||
7
APPENDIX 2: EXPENDITURES BY MISSION
Government expenditures are broken down into five public service missions. This breakdown of the government’s expenditures into its main areas of activity is a stable indicator over time because it is usually not influenced by Cabinet shuffles. Moreover, since this breakdown is also used in public accounts, its presentation in the Monthly Report on Financial Transactions allows for a better monitoring of actual results over the course of the year.
The public service missions are:
-
Health and Social Services, which consists primarily of the activities of the health and social services network and the programs administered by the Régie de l’assurance maladie du Québec;
-
Education and Culture, which consists primarily of the activities of the education networks, student financial assistance, programs in the culture sector and immigration-related programs;
-
Economy and Environment, which primarily includes programs related to economic development, employment assistance measures, international relations, the environment and infrastructure support;
-
Support for Individuals and Families, which includes, in particular, last-resort financial assistance, assistance measures for families and seniors, and certain legal aid measures;
-
Administration and Justice, which consists mainly of the activities of legislature, central bodies and public security, as well as administrative programs.
| CONSOLIDATED EXPENDITURES BY MISSION EXCLUDING DEBT SERVICE | |||||||||
| (unaudited data, millions of dollars) | |||||||||
| March | April to March | ||||||||
| 2021 | (7) | 2022 | 2020-2021(7) | 2021-2022 | |||||
| Health and Social Services | 6 149 | 5 964 | 53 476 | 56 597 | |||||
| Education and Culture | 3 040 | 2 935 | 26 576 | 27 754 | |||||
| Economy and Environment | 4 712 | 5 164 | 18 544 | 19 386 | |||||
| Support for Individuals and Families | 622 | 4 086 | 11 063 | 15 555 | |||||
| Administration and Justice | 457 | 294 | 9 462 | 8 158 | |||||
| TOTAL | 14 980 | 18 443 | 119 121 | 127 450 | |||||
8
Consolidated financial information
Consolidated results include the results of all entities that are part of the government’s reporting entity, i.e., that are under its control. To determine consolidated results, the government eliminates transactions carried out between entities in the reporting entity. Additional information on the government’s financial organization and the funding of public services can be found on pages 14 to 19 of the document titled “Processus et documentation budgétaires : une reddition de comptes sur les finances publiques de l’État” (in French only).
Change in the application of the accounting standard respecting transfer payments
The Québec government contributes to the funding of public infrastructure owned by third parties. In most cases, funding is provided through annual transfers paid according to a schedule that corresponds to the rate of repayment of the loans contracted by the recipients to carry out the projects.
For these infrastructure projects, the government changed the application of PS 3410, Transfer payments, to account for transfer expenditures based on the period of completion of eligible work by transfer recipients. Previously, transfer expenditures were recorded at the rate of disbursements authorized by Parliament and the balance of funded work was reported in contractual obligations. This change results in more timely recognition of transfer expenditures in the government’s consolidated financial statements.
In this monthly report, the estimated impact of this change has been accounted for retroactively and is included in the consolidated expenditures. The Public Accounts 2020-2021 present the final impact of the application of the accounting standard, including on the government’s accumulated deficit as at March 31, 2021.
Notes
| (1) |
A summary of the government’s accounting policies can be found on pages 74 to 77 of Volume 1 of the Public Accounts 2020-2021. |
| (2) |
Portfolio expenditures include the impact of the change in the application of the accounting standard respecting transfer payments. |
| (3) |
Balance as defined in the Public Accounts. |
| (4) |
In accordance with the Balanced Budget Act, the budgetary balance has been determined by taking into account the amounts included in the accumulated deficit as at April 1, 2020, relating to fiscal years 2015-2016 to 2019-2020 as a result of the change in application of the accounting standard respecting transfer payments. The provisions of this Act did not apply for fiscal years 2009-2010 through 2014-2015. |
| (5) |
Excluding the effect of the change in application of the accounting standard respecting transfer payments of $3.2 billion, the budgetary balance representing the result of operations for the fiscal year ended March 31, 2021, is a deficit of $7.5 billion. |
| (6) |
Consolidated expenditures by mission are presented in Appendix 2. |
| (7) |
Certain expenditures were reclassified between portfolios and between missions to take into account the transition to the 2021-2022 budgetary structure. |
| (8) |
Other portfolios include inter-portfolio eliminations resulting from the elimination of reciprocal transactions between entities in different portfolios. |
| (9) |
These items, which are included in the government’s budgetary surplus (deficit), are eliminated in non-budgetary transactions because they have no effect on cash flow. |
| (10) |
The financial surpluses or requirements pertaining to other accounts can vary significantly from one month to the next, in particular according to the time when the government collects or disburses funds related to its activities. For example, when the last day of the month is not a business day, QST remittances are collected at the beginning of the following month, such that the equivalent of two months’ remittances can be collected in a given month. |
| (11) |
The presentation of the budgetary information in this monthly report is consistent with that of the financial framework as published in the Québec Budget Plan – March 2022. |
| (12) |
This is the annual change compared to results in 2020-2021. |
| (13) |
Budgetary balance within the meaning of the Balanced Budget Act. |
| For more information, contact the Direction des communications of the Ministère des Finances at 418-528-7382. | |
| The report is also available on the Ministère des Finances website: www.finances.gouv.qc.ca. |
9
Serious News for Serious Traders! Try StreetInsider.com Premium Free!
You May Also Be Interested In
- Inspiring graduation story: First-Generation and Legacy student George Fakes heads to Medical School
- ERVIN COHEN & JESSUP PARTNER RECOGNIZED AS TOP LAWYER IN LOS ANGELES
- Levine Leichtman Capital Partners Sells Tropical Smoothie Cafe
Create E-mail Alert Related Categories
SEC FilingsSign up for StreetInsider Free!
Receive full access to all new and archived articles, unlimited portfolio tracking, e-mail alerts, custom newswires and RSS feeds - and more!
