

Form 10-Q UNIT CORP For: Jun 30
 Tweet
Tweet Share
ShareSECURITIES AND EXCHANGE COMMISSION
Washington, D.C. 20549
Form 10-Q
OF THE SECURITIES EXCHANGE ACT OF 1934
For the quarterly period ended June 30, 2022
OR
OF THE SECURITIES EXCHANGE ACT OF 1934
For the transition period from to
Commission File Number 1-9260

(Exact name of registrant as specified in its charter)
| (State or other jurisdiction of incorporation) | (I.R.S. Employer Identification No.) | ||||
| (Address of principal executive offices) | (Zip Code) | |||||||||||||
(Registrant’s telephone number, including area code)
None
(Former name, former address and former fiscal year,
if changed since last report)
Securities registered pursuant to Section 12(b) of the Act:
| Title of each class | Trading Symbol(s) | Name of each exchange on which registered | ||||||
| N/A | ||||||||
Indicate by check mark whether the registrant (1) has filed all reports required to be filed by Section 13 or 15(d) of the Securities Exchange Act of 1934 during the preceding 12 months (or for such shorter period that the registrant was required to file such reports), and (2) has been subject to such filing requirements for the past 90 days. Yes ☐ No ☒ *
* Effective January 1, 2021, the registrant’s obligation to file reports under Section 15(d) of the Securities Exchange Act of 1934 was automatically suspended.
Indicate by check mark whether the registrant has submitted electronically every Interactive Data File required to be submitted pursuant to Rule 405 of Regulation S-T (§232.405 of this chapter) during the preceding 12 months (or for such shorter period that the registrant was required to submit such files). Yes ☒ No ☐
Indicate by check mark whether the registrant is a large accelerated filer, an accelerated filer, a non-accelerated filer, a smaller reporting company, or an emerging growth company. See the definitions of “large accelerated filer,” “accelerated filer,” “smaller reporting company,” and "emerging growth company" in Rule 12b-2 of the Exchange Act.
Large accelerated filer ☐ Accelerated filer ☐ Non-accelerated filer ☒
Smaller reporting company ☒ Emerging growth company ☐
If an emerging growth company, indicate by check mark if the registrant has elected not to use the extended transition period for complying with any new or revised financial accounting standards provided pursuant to Section 13(a) of the Exchange Act. ☐
Indicate by check mark whether the registrant has filed all documents and reports required to be filed by Section 12, 13 or 15(d) of the Securities Exchange Act of 1934 subsequent to the distribution of securities under a plan confirmed by a court. Yes ☒ No ☐
Indicate by check mark whether the registrant is a shell company (as defined in Rule 12b-2 of the Exchange Act). Yes ☐ No ☒
As of August 11, 2022, 9,779,903 shares of the registrant's common stock were outstanding.
TABLE OF CONTENTS
| Page Number | ||||||||
| Item 1. | ||||||||
| Item 2. | ||||||||
| Item 3. | ||||||||
| Item 4. | ||||||||
| Item 1. | ||||||||
| Item 1A. | ||||||||
| Item 2. | ||||||||
| Item 3. | ||||||||
| Item 4. | ||||||||
| Item 5. | ||||||||
| Item 6. | ||||||||
1
Forward-Looking Statements
This report contains “forward-looking statements” – meaning, statements related to future events within the meaning of Section 27A of the Securities Act of 1933, as amended, and Section 21E of the Securities Exchange Act of 1934, as amended. All statements, other than statements of historical facts, included or incorporated by reference in this document that address activities, events or developments we expect or anticipate will or may occur, are forward-looking statements. The words “believes,” “intends,” “expects,” “anticipates,” “projects,” “estimates,” “predicts,” and similar expressions are used to identify forward-looking statements. This report modifies and supersedes documents filed by us before this report. In addition, certain information we file with the United States Securities and Exchange Commission (SEC) will automatically update and supersede information in this report.
Forward-looking statements are not guarantees of performance. They involve risks, uncertainties, and assumptions. Future actions, conditions or events, and future results may differ materially from those expressed in our forward-looking statements. Many factors that will determine these results are beyond our ability to control or accurately predict. Specific factors that could cause actual results to differ from those in our forward-looking statements include:
•the amount and nature of our future capital expenditures and how we expect to fund our capital expenditures;
•prices for oil, NGLs, and natural gas;
•demand for oil, NGLs, and natural gas;
•our exploration and drilling prospects;
•the estimates of our proved oil, NGLs, and natural gas reserves;
•oil, NGLs, and natural gas reserve potential;
•development and infill drilling potential;
•expansion and other development trends in the oil and natural gas industry;
•our business strategy;
•our plans to maintain or increase the production of oil, NGLs, and natural gas;
•our ability to utilize the benefits of net operating losses and other deferred tax assets against potential future taxable income;
•the number of gathering systems and processing plants our mid-stream investment may plan to construct or acquire;
•volumes and prices for the natural gas our mid-stream investment gathers and processes;
•expansion and growth of our business and operations;
•demand for our drilling rigs and the rates we charge for the rigs;
•our belief that the outcome of our legal proceedings will not materially affect our financial results;
•our ability to timely secure third-party services used in completing our wells;
•our mid-stream investment's ability to transport or convey our oil, NGLs, or natural gas production to existing pipeline systems;
•the impact of federal and state legislative and regulatory actions affecting our costs and increasing operating restrictions or delays and other adverse impacts on our business;
•the possibility of security threats, including terrorist attacks and cybersecurity breaches, against or otherwise affecting our facilities and systems;
•any projected production guidelines we may issue;
•our anticipated capital budgets;
•our financial condition and liquidity;
•the number of wells our oil and natural gas segment plans to drill; and
•our estimates of any ceiling test write-downs or other potential asset impairments we may have to record in future periods.
2
These statements are based on our assumptions and analyses considering our experience and our perception of historical trends, current conditions, expected future developments, and other factors we believe are appropriate in the circumstances. Whether actual results and developments will meet our expectations and predictions is subject to risks and uncertainties, any one or combination of which could cause our actual results to differ materially from our expectations and predictions. Some of these risks and uncertainties are:
•the risk factors discussed in this document and the documents (if any) we incorporate by reference;
•general economic, market, or business conditions;
•the availability and nature of (or lack of) business opportunities we pursue;
•demand for our land drilling services;
•changes in laws and regulations;
•changes in the current geopolitical situation, such as the current conflict occurring between Russia and Ukraine;
•risks relating to financing, including restrictions in our debt agreements and availability and cost of credit;
•risks associated with future weather conditions;
•decreases or increases in commodity prices;
•the amount and terms of our debt;
•future compliance with covenants under our credit agreements;
•pandemics, epidemics, outbreaks, or other public health events, such as COVID-19; and
•other factors, most of which are beyond our control.
You should not construe this list to be exhaustive. We believe the forward-looking statements in this report are reasonable. However, there is no assurance that the actions, events, or results expressed in forward-looking statements will occur, or if any of them do, of their timing or what impact they will have on our results of operations or financial condition. Because of these uncertainties, you should not put undue reliance on any forward-looking statements. Except as required by law, we disclaim any obligation to update forward-looking information and to release publicly the results of any future revisions we may make to forward-looking statements to reflect events or circumstances after this document to reflect incorrect assumptions or unanticipated events.
Additional discussion of factors that may affect our forward-looking statements appear elsewhere in this report, including in Item 1A “Risk Factors,” Item 2 “Management’s Discussion and Analysis of Financial Condition and Results of Operations,” and Item 3 "Quantitative and Qualitative Disclosures About Market Risk - Commodity Price Risk.”
3
PART I. FINANCIAL INFORMATION
Item 1. Financial Statements
UNIT CORPORATION AND SUBSIDIARIES
CONDENSED CONSOLIDATED BALANCE SHEETS (UNAUDITED)
| June 30, 2022 | December 31, 2021 | ||||||||||
| (In thousands) | |||||||||||
| ASSETS | |||||||||||
| Current assets: | |||||||||||
| Cash and cash equivalents | $ | $ | |||||||||
Accounts receivable, net of allowance for credit losses of $ | |||||||||||
| Prepaid expenses and other | |||||||||||
| Total current assets | |||||||||||
| Property and equipment: | |||||||||||
| Oil and natural gas properties, on the full cost method: | |||||||||||
| Proved properties | |||||||||||
| Unproved properties not being amortized | |||||||||||
| Drilling equipment | |||||||||||
| Gas gathering and processing equipment | |||||||||||
| Transportation equipment | |||||||||||
| Other | |||||||||||
| Less accumulated depreciation, depletion, amortization, and impairment | |||||||||||
| Net property and equipment | |||||||||||
| Equity method investment (Note 15) | |||||||||||
| Right of use asset (Note 14) | |||||||||||
| Other assets | |||||||||||
Total assets (1) | $ | $ | |||||||||
1.Unit Corporation no longer consolidates the balance sheet of Superior Pipeline Company, L.L.C. (Superior) as of June 30, 2022, as discussed in Note 2 - Summary Of Significant Accounting Policies and Note 15 - Superior Investment. Unit Corporation's consolidated total assets as of December 31, 2021 included current and long-term assets of Superior of $61.1 million and $229.5 million, respectively, which can only be used to settle obligations of Superior. Unit Corporation's consolidated cash and cash equivalents of $64.1 million as of December 31, 2021 included $17.2 million held by Superior.
The accompanying notes are an integral part of these
unaudited condensed consolidated financial statements.
4
UNIT CORPORATION AND SUBSIDIARIES
CONDENSED CONSOLIDATED BALANCE SHEETS (UNAUDITED) - CONTINUED
| June 30, 2022 | December 31, 2021 | ||||||||||
| (In thousands) | |||||||||||
| LIABILITIES AND SHAREHOLDERS’ EQUITY | |||||||||||
| Current liabilities: | |||||||||||
| Accounts payable | $ | $ | |||||||||
| Accrued liabilities (Note 8) | |||||||||||
| Current operating lease liability (Note 14) | |||||||||||
| Current derivative liabilities (Note 12) | |||||||||||
| Warrant liability (Note 12) | |||||||||||
| Current portion of other long-term liabilities (Note 9) | |||||||||||
| Total current liabilities | |||||||||||
| Long-term debt (Note 9) | |||||||||||
| Non-current derivative liabilities (Note 12) | |||||||||||
| Operating lease liability (Note 14) | |||||||||||
| Other long-term liabilities (Note 9) | |||||||||||
| Commitments and contingencies (Note 16) | |||||||||||
| Shareholders’ equity: | |||||||||||
Preferred stock, $ | |||||||||||
Common stock, $ | |||||||||||
| Treasury stock (Note 5) | ( | ( | |||||||||
| Capital in excess of par value | |||||||||||
| Retained earnings | |||||||||||
| Total shareholders’ equity attributable to Unit Corporation | |||||||||||
| Non-controlling interests in consolidated subsidiaries | |||||||||||
| Total shareholders' equity | |||||||||||
Total liabilities and shareholders’ equity (1) | $ | $ | |||||||||
1.Unit Corporation no longer consolidates the balance sheet of Superior as of June 30, 2022, as discussed in Note 2 - Summary Of Significant Accounting Policies and Note 15 - Superior Investment. Unit Corporation's consolidated total liabilities as of December 31, 2021 included current and long-term liabilities of Superior of $42.3 million and $21.2 million, respectively. All of Unit Corporation's consolidated long-term debt of $19.2 million as of December 31, 2021 was held by Superior.
The accompanying notes are an integral part of these
unaudited condensed consolidated financial statements.
5
UNIT CORPORATION AND SUBSIDIARIES
CONDENSED CONSOLIDATED STATEMENTS OF OPERATIONS (UNAUDITED)
| Three Months Ended June 30, | Six Months Ended June 30, 2022 | ||||||||||||||||||||||
| 2022 | 2021 | 2022 | 2021 | ||||||||||||||||||||
| (In thousands except per share amounts) | |||||||||||||||||||||||
| Revenues: | |||||||||||||||||||||||
| Oil and natural gas | $ | $ | $ | $ | |||||||||||||||||||
| Contract drilling | |||||||||||||||||||||||
| Gas gathering and processing | |||||||||||||||||||||||
| Total revenues | |||||||||||||||||||||||
| Expenses: | |||||||||||||||||||||||
| Operating costs: | |||||||||||||||||||||||
| Oil and natural gas | |||||||||||||||||||||||
| Contract drilling | |||||||||||||||||||||||
| Gas gathering and processing | |||||||||||||||||||||||
| Total operating costs | |||||||||||||||||||||||
| Depreciation, depletion, and amortization | |||||||||||||||||||||||
| General and administrative | |||||||||||||||||||||||
| Gain on disposition of assets (Note 4) | ( | ( | ( | ( | |||||||||||||||||||
| Total operating expenses | |||||||||||||||||||||||
| Income from operations | |||||||||||||||||||||||
| Other income (expense): | |||||||||||||||||||||||
| Interest, net | ( | ( | ( | ( | |||||||||||||||||||
| Gain (loss) on derivatives (Note 12) | ( | ( | ( | ||||||||||||||||||||
| Gain (loss) on change in fair value of warrants (Note 12) | ( | ( | ( | ||||||||||||||||||||
| Loss on deconsolidation of Superior (Note 15) | ( | ||||||||||||||||||||||
| Reorganization items, net | ( | ( | ( | ( | |||||||||||||||||||
| Other, net | ( | ( | |||||||||||||||||||||
| Total other income (expense) | ( | ( | ( | ||||||||||||||||||||
| Income (loss) before income taxes | ( | ( | |||||||||||||||||||||
| Income tax expense (benefit): | |||||||||||||||||||||||
| Current | |||||||||||||||||||||||
| Deferred | |||||||||||||||||||||||
| Total income taxes | |||||||||||||||||||||||
| Net income (loss) | ( | ( | |||||||||||||||||||||
| Net income (loss) attributable to non-controlling interest (Note 15) | ( | ||||||||||||||||||||||
| Net income (loss) attributable to Unit Corporation | $ | $ | ( | $ | $ | ( | |||||||||||||||||
| Net income (loss) attributable to Unit Corporation per common share (Note 7): | |||||||||||||||||||||||
| Basic | $ | $ | ( | $ | $ | ( | |||||||||||||||||
| Diluted | $ | $ | ( | $ | $ | ( | |||||||||||||||||
The accompanying notes are an integral part of these
unaudited condensed consolidated financial statements.
6
UNIT CORPORATION AND SUBSIDIARIES
CONDENSED CONSOLIDATED STATEMENTS OF CHANGES IN SHAREHOLDERS’ EQUITY (UNAUDITED)
| Shareholders' Equity Attributable to Unit Corporation | |||||||||||||||||||||||||||||||||||
| Common Stock | Treasury Stock | Capital in Excess of Par Value | Retained Earnings (Deficit) | Non-controlling Interest in Consolidated Subsidiaries | Total | ||||||||||||||||||||||||||||||
| (In thousands) | |||||||||||||||||||||||||||||||||||
| Balances as of December 31, 2021 | $ | $ | ( | $ | $ | $ | $ | ||||||||||||||||||||||||||||
| Net loss | — | — | — | ( | ( | ( | |||||||||||||||||||||||||||||
| Distributions to non-controlling interests | — | — | — | — | ( | ( | |||||||||||||||||||||||||||||
| Deconsolidation of Superior | — | — | — | — | ( | ( | |||||||||||||||||||||||||||||
| Activity in stock-based compensation plans | — | — | — | — | |||||||||||||||||||||||||||||||
| Balances as of March 31, 2022 | $ | $ | ( | $ | $ | ( | $ | $ | |||||||||||||||||||||||||||
| Net income | — | — | — | — | |||||||||||||||||||||||||||||||
| Activity in stock-based compensation plans | — | — | — | — | |||||||||||||||||||||||||||||||
| Repurchases of common stock | — | ( | — | — | — | ( | |||||||||||||||||||||||||||||
| Warrant liability reclassification | — | — | — | — | |||||||||||||||||||||||||||||||
| Balances as of June 30, 2022 | $ | $ | ( | $ | $ | $ | $ | ||||||||||||||||||||||||||||
| Shareholders' Equity Attributable to Unit Corporation | |||||||||||||||||||||||||||||||||||
| Common Stock | Treasury Stock | Capital in Excess of Par Value | Retained Earnings (Deficit) | Non-controlling Interest in Consolidated Subsidiaries | Total | ||||||||||||||||||||||||||||||
| (In thousands) | |||||||||||||||||||||||||||||||||||
| Balances as of December 31, 2020 | $ | $ | $ | $ | ( | $ | $ | ||||||||||||||||||||||||||||
| Net income (loss) | — | — | — | ( | ( | ||||||||||||||||||||||||||||||
| Activity in stock-based compensation plans | — | — | — | ||||||||||||||||||||||||||||||||
| Balances as of March 31, 2021 | $ | $ | $ | $ | ( | $ | $ | ||||||||||||||||||||||||||||
| Net income (loss) | — | — | — | ( | ( | ||||||||||||||||||||||||||||||
| Activity in stock-based compensation plans | — | — | — | ||||||||||||||||||||||||||||||||
| Distributions to non-controlling interests | — | — | — | — | ( | ( | |||||||||||||||||||||||||||||
| Repurchases of common stock | — | ( | — | — | — | ( | |||||||||||||||||||||||||||||
| Balances as of June 30, 2021 | $ | $ | ( | $ | $ | ( | $ | $ | |||||||||||||||||||||||||||
The accompanying notes are an integral part of these
unaudited condensed consolidated financial statements.
7
UNIT CORPORATION AND SUBSIDIARIES
CONDENSED CONSOLIDATED STATEMENTS OF CASH FLOWS (UNAUDITED)
| Six Months Ended June 30, 2022 | |||||||||||
| 2022 | 2021 | ||||||||||
| (In thousands) | |||||||||||
| OPERATING ACTIVITIES: | |||||||||||
| Net income (loss) | $ | $ | ( | ||||||||
| Adjustments to reconcile net income (loss) to net cash provided by operating activities: | |||||||||||
| Depreciation, depletion and amortization | |||||||||||
| Loss on derivatives (Note 12) | |||||||||||
| Cash payments on derivatives settled (Note 12) | ( | ( | |||||||||
| Loss on change in fair value of warrants (Note 12) | |||||||||||
| Loss on deconsolidation of Superior (Note 15) | |||||||||||
| Gain on disposition of assets (Note 4) | ( | ( | |||||||||
| Stock-based compensation plans (Note 6) | |||||||||||
| Change in credit loss reserve | ( | ||||||||||
| ARO liability accretion (Note 10) | |||||||||||
| Contract assets and liabilities, net (Note 3) | |||||||||||
| Noncash reorganization items | ( | ||||||||||
| Other, net | ( | ( | |||||||||
| Changes in operating assets and liabilities increasing (decreasing) cash: | |||||||||||
| Accounts receivable | ( | ( | |||||||||
| Prepaid expenses and other | |||||||||||
| Accounts payable | ( | ||||||||||
| Accrued liabilities | ( | ||||||||||
| Income taxes | ( | ||||||||||
| Contract advances | ( | ( | |||||||||
| Net change in operating assets and liabilities | ( | ( | |||||||||
| Net cash provided by operating activities | |||||||||||
| INVESTING ACTIVITIES: | |||||||||||
| Capital expenditures | ( | ( | |||||||||
| Deconsolidation of Superior cash and cash equivalents (Note 15) | ( | ||||||||||
| Proceeds from disposition of property and equipment (Note 4) | |||||||||||
| Net cash provided by (used in) investing activities | ( | ||||||||||
| FINANCING ACTIVITIES: | |||||||||||
| Borrowings under line of credit (Note 9) | |||||||||||
| Payments under line of credit (Note 9) | ( | ||||||||||
| Net payments on finance leases (Note 14) | ( | ||||||||||
| Distributions to non-controlling interests (Note 15) | ( | ( | |||||||||
| Repurchases of common stock (Note 5) | ( | ( | |||||||||
| Bank overdrafts | |||||||||||
| Net cash used in financing activities | ( | ( | |||||||||
| Net increase (decrease) in cash and cash equivalents | ( | ||||||||||
| Cash and cash equivalents, beginning of period | |||||||||||
| Cash and cash equivalents, end of period | $ | $ | |||||||||
The accompanying notes are an integral part of these
unaudited condensed consolidated financial statements.
8
UNIT CORPORATION AND SUBSIDIARIES
CONDENSED CONSOLIDATED STATEMENTS OF CASH FLOWS (UNAUDITED) - CONTINUED
| Six Months Ended June 30, 2022 | |||||||||||
| 2022 | 2021 | ||||||||||
| (In thousands) | |||||||||||
| Supplemental disclosure of cash flow information: | |||||||||||
| Cash paid (received) for: | |||||||||||
| Interest paid | $ | $ | |||||||||
| Income taxes | ( | ||||||||||
| Reorganization items | |||||||||||
| Changes in accounts payable and accrued liabilities related to purchases of property and equipment | ( | ( | |||||||||
| Non-cash (additions) reductions to oil and natural gas properties related to asset retirement obligations | ( | ||||||||||
| Non-cash trade of property and equipment | |||||||||||
The accompanying notes are an integral part of these
unaudited condensed consolidated financial statements.
9
UNIT CORPORATION AND SUBSIDIARIES
NOTES TO UNAUDITED CONDENSED CONSOLIDATED FINANCIAL STATEMENTS
NOTE 1 – ORGANIZATION AND BUSINESS
Unless the context clearly indicates otherwise, references in this report to “Unit”, “company”, “we”, “our”, “us”, or like terms refer to Unit Corporation or, as appropriate, one or more of its subsidiaries. References to our mid-stream segment refer to Superior Pipeline Company, L.L.C. (Superior) of which we own 50 %.
We are primarily engaged in the development, acquisition, and production of oil and natural gas properties, the land contract drilling of natural gas and oil wells, and the buying, selling, gathering, processing, and treating of natural gas. Our operations are all in the United States and are organized in the following three reporting segments: (1) Oil and Natural Gas, (2) Contract Drilling, and (3) Mid-Stream.
Oil and Natural Gas. Carried out by our subsidiary, Unit Petroleum Company (UPC), we develop, acquire, and produce oil and natural gas properties for our own account. Our producing oil and natural gas properties, unproved properties, and related assets are primarily located in Oklahoma and Texas, and to a lesser extent, in Arkansas, Kansas, Louisiana, and North Dakota.
Contract Drilling. Carried out by our subsidiary, Unit Drilling Company (UDC), we drill onshore oil and natural gas wells for a wide range of other oil and natural gas companies as well as for our own account. Our drilling operations are primarily located in Oklahoma, Texas, New Mexico, Wyoming, and North Dakota.
Mid-Stream. Carried out by Superior of which we own 50 %, buys, sells, gathers, transports, processes, and treats natural gas for UPC and for third parties. Mid-Stream operations are primarily located in Oklahoma, Texas, Kansas, Pennsylvania, and West Virginia.
NOTE 2 – SUMMARY OF SIGNIFICANT ACCOUNTING POLICIES
Basis of Presentation
These interim financial statements are unaudited and have been prepared pursuant to the rules and regulations of the Securities and Exchange Commission (SEC) regarding interim financial reporting. Certain disclosures have been condensed or omitted from these financial statements. Accordingly, they do not include all of the information and notes required by accounting principles generally accepted in the United States (GAAP) for complete consolidated financial statements, and should be read in conjunction with the audited consolidated financial statements and notes thereto for the year ended December 31, 2021 included in the company’s Annual Report on Form 10-K as filed with the SEC on March 31, 2022.
In the opinion of management, the unaudited condensed consolidated financial statements are fairly stated and contain all normal recurring adjustments (including the elimination of all intercompany transactions). Our financial statements are prepared in conformity with GAAP, which requires us to make certain estimates and assumptions that may affect the amounts reported in our unaudited condensed consolidated financial statements and notes. Actual results may differ from those estimates. The results for interim periods are not necessarily indicative of annual results. The company evaluates subsequent events through the date the financial statements are issued.
The unaudited condensed consolidated financial statements include the accounts of Unit Corporation and its subsidiaries. We consolidated the financial position, operating results, and cash flows of Superior prior to March 1, 2022, on which date the Master Services and Operating Agreement (MSA) was amended and restated, with the result that we no longer consolidate Superior's financial position, operating results, and cash flows during periods subsequent to March 1, 2022. Accordingly, the unaudited condensed consolidated financial statements and notes reflect Superior activity on a consolidated basis for the two months prior to March 1, 2022. See Note 15 – Superior Investment for more information on the Superior investment and consolidation conclusions. All intercompany transactions and accounts between consolidated entities have been eliminated, including activity between Unit and Superior during the two months prior to March 1, 2022. Intercompany transactions and accounts between Unit and Superior subsequent to March 1, 2022 are not eliminated.
10
During second quarter 2021, management identified errors in our inter-segment eliminations presentation between oil and natural gas revenues and gas gathering and processing revenues as well as between gas gathering and processing operating costs and general and administrative expenses. The impacts of the errors were not material to any of our prior period financial statements and the current year impacts on the three months ended March 31, 2021 were corrected with a one-time adjustment in the three months ended June 30, 2021. As a result, during the three months ended June 30, 2021, oil and natural gas revenues were decreased by $8.6 million with a corresponding increase to gas gathering and processing revenues while general and administrative expenses were increased by $0.9 million with a corresponding decrease to gas gathering and processing operating costs.
Also during second quarter 2021, management identified separate errors in our prior period accrual of oil and natural gas revenues as well as oil and natural gas operating costs. The impacts of the errors were not material to any of our prior period financial statements and the errors were corrected with a one-time adjustment in the three months ended June 30, 2021. As a result, during the three months ended June 30, 2021, oil and natural gas revenues were increased by $3.9 million and oil and natural gas operating costs were decreased by $3.4 million.
Certain amounts in this report for prior periods have been reclassified to conform to current year presentation. There was no impact from these reclassifications to consolidated net income/(loss) or shareholders' equity.
Recent Accounting Pronouncements
Reference Rate Reform (Topic 848)—Facilitation of the Effects of Reference Rate Reform on Financial Reporting. The FASB issued ASU 2020-04 and ASU 2021-01 which provide and clarify optional expedients and exceptions for applying generally accepted accounting principles to contract modifications, subject to meeting certain criteria, that reference LIBOR or another reference rate expected to be discontinued. The amendments within these ASUs will be in effect for a limited time beginning March 12, 2020, and an entity may elect to apply the amendments prospectively through December 31, 2022. In April 2022, the FASB proposed to defer the effective date to December 31, 2024, but a final ruling has not been issued. We have not yet elected to use the optional guidance and continue to evaluate the options provided by ASU 2020-04 and ASU 2021-01.
NOTE 3 – REVENUE FROM CONTRACTS WITH CUSTOMERS
Our revenue streams are reported under three segments: oil and natural gas, contract drilling, and mid-stream which is consistent with how we report our segment revenue in Note 19 – Industry Segment Information. Revenue from the oil and natural gas segment is from sales of our oil and natural gas production. Revenue from the contract drilling segment comes from contracting with upstream companies to drill an agreed-on number of wells or provide drilling rigs and services over an agreed-on period. Revenues from the mid-stream segment are generated from the fees earned for gas gathering and processing services provided to a customer or by selling of hydrocarbons to other mid-stream companies.
Oil and Natural Gas Revenue
Typical types of revenue contracts entered into by our oil and gas segment are Oil Sales Contracts, North American Energy Standards Board (NAESB) Contracts, Gas Gathering and Processing Agreements, and revenues earned as the non-operated party with the operator serving as an agent on our behalf under joint operating agreements. Consideration received is variable and settled monthly while contract terms can range from a single month or evergreen to terms of a decade or more. Revenues from oil and natural gas sales are recognized when the customer obtains control of the sold product which typically occurs at the point of delivery to the customer.
Certain costs, as either a deduction from revenue or as an expense, are determined based on when control of the commodity is transferred to our customer, which would affect our total revenue recognized, but will not affect gross profit. For example, gathering, processing and transportation costs are included as part of the contract price with the customer on transfer of control of the commodity are included in the transaction price, while costs incurred while we are in control of the commodity represent operating costs.
11
Contract Drilling Revenue
Contract drilling revenues and expenses are primarily recognized as services are performed and collection is reasonably assured. Payments for mobilization and demobilization activities do not relate to a distinct good or service within the contract and are deferred for ratable recognition when material. Costs incurred to relocate rigs and other drilling equipment to areas in which a contract has not been secured are expensed as incurred and any reimbursements received for out-of-pocket expenses are recorded as both revenues and direct costs.
Most of our drilling contracts have a term of one year or less and the remaining performance obligations under the contracts without a fixed term are not material.
Mid-Stream Revenue
The typical revenue contracts used by this segment are gas gathering and processing agreements as well as product sales. Superior recognizes sales revenue at the point in time when control transfers to the purchaser, typically at a specified delivery point, based on the contractually agreed upon fixed or index-based price received. Contracts for gas gathering and processing services may include terms for demand fees or shortfall fees. Demand fees or shortfall fees exist in arrangements where a customer agrees to pay a fixed fee for a contractually agreed upon pipeline capacity or shortfall fees for any minimum volumes not utilized, which create performance obligations for each individual period of reservation. Revenue for these fees is recognized once the services have been completed, the customer no longer has access to the contracted capacity, or the likelihood of the customer exercising all or a portion of their remaining rights becomes remote.
Contract Assets and Liabilities
The table below shows the changes in our contract asset and contract liability balances during periods presented:
| Classification on the unaudited condensed consolidated balance sheets | June 30, 2022 | December 31, 2021 | Change | ||||||||||||||||||||
| (In thousands) | |||||||||||||||||||||||
| Assets | |||||||||||||||||||||||
| Current contract assets | Prepaid expenses and other | $ | $ | $ | ( | ||||||||||||||||||
| Non-current contract assets | Other assets | ||||||||||||||||||||||
| Total contract assets | $ | $ | $ | ( | |||||||||||||||||||
| Liabilities | |||||||||||||||||||||||
| Current contract liabilities | Current portion of other long-term liabilities | $ | $ | $ | ( | ||||||||||||||||||
| Non-current contract liabilities | Other long-term liabilities | ( | |||||||||||||||||||||
| Total contract liabilities | ( | ||||||||||||||||||||||
| Contract assets (liabilities), net | $ | ( | $ | ( | $ | ||||||||||||||||||
12
NOTE 4 – DIVESTITURES
Oil and Natural Gas
The company initiated an asset divestiture program at the beginning of 2021 to sell certain non-core oil and gas properties and reserves (the “Divestiture Program”). On October 4, 2021, the company announced that it was expanding the Divestiture Program to include the potential sale of additional properties, including up to all of UPC’s oil and gas properties and reserves, and on January 20, 2022, the company announced that it had retained a financial advisor and launched the process. On June 10, 2022, the company announced that it had ended its engagement with the financial advisor and terminated the process. During the process, the Company entered into an agreement to sell its Texas Gulf Coast oil and gas properties.
On July 1, 2022, the company closed on the sale of certain wells and related leases near the Texas Gulf Coast for cash proceeds of $43.7 million, subject to customary post-closing adjustments based on an effective date of April 1, 2022. These proceeds will reduce the net book value of our full cost pool with no gain or loss recognized as the sale did not result in a significant alteration of the full cost pool.
On March 8, 2022, the company closed on the sale of certain non-core wells and related leases located near the Oklahoma Panhandle for cash proceeds of $4.1 million net of customary closing and post-closing adjustments based on an effective date of December 1, 2021. These proceeds reduced the net book value of our full cost pool with no gain or loss recognized as the sale did not result in a significant alteration of the full cost pool.
On May 6, 2021, the company closed on the sale of substantially all of our wells and the leases related thereto located in Reno and Stafford Counties, Kansas for proceeds of $7.1 million, excluding post-closing adjustments. These proceeds reduced the net book value of our full cost pool with no gain or loss recognized as the sale did not result in a significant alteration of the full cost pool.
Net proceeds for the sale of other non-core oil and natural gas assets totaled $1.9 million and $2.7 million during the three months ended June 30, 2022 and 2021, respectively, and $2.3 million and $4.4 million during the six months ended June 30, 2022 and 2021, respectively. These proceeds reduced the net book value of our full cost pool with no gain or loss recognized as the sales did not result in a significant alteration of the full cost pool.
Contract Drilling
Proceeds for the sale of non-core contract drilling assets totaled $4.2 million and $1.9 million during the three months ended June 30, 2022 and 2021, respectively, and $6.4 million and $3.9 million during the six months ended June 30, 2022 and 2021, respectively. These proceeds resulted in net gains of $2.0 million and $1.6 million during the three months ended June 30, 2022 and 2021, respectively, and $4.2 million and $2.1 million during the six months ended June 30, 2022 and 2021, respectively. The net gains are presented within gain on disposition of assets in the unaudited condensed consolidated statements of operations.
NOTE 5 – CAPITAL STOCK
Stock Repurchases
In June 2021, we repurchased an aggregate of 600,000 shares of our common stock from the Lenders (as defined in Note 9 - Long-Term Debt And Other Long-Term Liabilities) which received these shares as an exit fee during our reorganization. The Lenders were paid $15.00 per share for their respective shares, for an aggregate cash purchase price of $9.0 million.
In June 2021, the company's board of directors (the Board) authorized repurchasing up to $25.0 million of the company’s outstanding common stock. The Board subsequently authorized increases to the authorized repurchases up to $50.0 million in October 2021 and then up to $100.0 million in June 2022. The repurchases will be made through open market purchases, privately negotiated transactions, or other available means. The company has no obligation to repurchase any shares under the repurchase program and may suspend or discontinue it at any time without prior notice. As of June 30, 2022, we had repurchased a total of 1,519,392 shares under the repurchase program at an average share price of $36.00 for an aggregate purchase price of $54.7 million. Subsequent to June 30, 2022, we have repurchased an additional 75,000 shares under the repurchase program for an aggregate purchase price of $3.8 million.
During the year ended December 31, 2021, we also repurchased 78,000 shares in a privately negotiated transaction at a share price of $19.07 which were not part of the repurchase program.
13
The cumulative number of shares repurchased as of June 30, 2022 totaled 2,197,392 . The cash purchase price and any direct acquisition costs are reflected as treasury stock on the unaudited condensed consolidated balance sheets as of June 30, 2022.
Warrants
Each holder of Unit common stock outstanding (Old Common Stock) before the September 3, 2020 emergence from bankruptcy (Emergence Date) that did not opt out of the release under the Chapter 11 plan of reorganization filed with the bankruptcy court on June 9, 2020 is entitled to receive 0.03460447 warrants for every share of Old Common Stock owned. Each warrant is exercisable for one share of common stock, subject to adjustment as provided in the Warrant Agreement. The warrants expire on the earliest of (i) September 3, 2027, (ii) consummation of a Cash Sale (as defined in the Warrant Agreement), or (iii) the consummation of a liquidation, dissolution or winding up of the company. As of June 30, 2022, the company had issued 1,822,203 warrants.
Among other provisions, the Warrant Agreement outlines potential adjustments to the warrants if certain events occur, including (i) stock dividends payable in shares of common stock or stock splits, (ii) reverse stock splits or similar combination events, (iii) Liquidity Events (as defined in the Warrant Agreement), and (iv) other events not explicitly contemplated which may have an adverse impact to the intent and purpose of the warrants as set forth in the Plan, provided, however, the warrants will not be adjusted for (a) any issuances of securities in connection with a merger, share exchange, asset acquisition, stock purchase, recapitalization, reorganization or other similar business combination, (b) the issuance of any securities by Unit on or after the Effective Date (as defined in the Plan) pursuant to the Plan or upon the issuance of shares of common stock upon the exercise of such securities, (c) the issuance of any shares of common stock pursuant to the exercise of the warrants, (d) the issuance of shares of common stock pursuant to any management stock option incentive or similar plan, (e) a dividend or distribution to holders of common stock of cash, property, or securities (other than common stock), and/or (f) any change in the par value of the common stock.
Pursuant to the terms of the Warrant Agreement, the company determined the initial exercise price of the warrants to be $63.74 . On April 7, 2022, the company delivered notice of the initial exercise price to the Warrant Agent and the warrants became exercisable for shares of the company’s common stock. On or about April 25, 2022, the warrants began trading over-the-counter under the symbol "UNTCW".
See Note 12 - Derivatives for more information on how the warrants are treated in our unaudited condensed consolidated financial statements.
NOTE 6 – STOCK-BASED COMPENSATION
14
The table below summarizes the stock-based compensation expense activity recognized during the following periods:
| Three Months Ended June 30, | Six Months Ended June 30, | ||||||||||||||||||||||
| 2022 | 2021 | 2022 | 2021 | ||||||||||||||||||||
| (In thousands) | |||||||||||||||||||||||
| Recognized stock compensation expense | $ | $ | $ | $ | |||||||||||||||||||
Capitalized stock compensation cost for our oil and natural gas properties | |||||||||||||||||||||||
| Tax benefit on stock-based compensation | $ | $ | $ | $ | |||||||||||||||||||
The tables below summarize the activity pertaining to nonvested RSUs during the three and six months ended June 30, 2022 and 2021:
| Three Months Ended June 30, | |||||||||||||||||||||||
| 2022 | 2021 | ||||||||||||||||||||||
Number of Shares | Weighted Average Grant Date Fair Value | Number of Shares | Weighted Average Grant Date Fair Value | ||||||||||||||||||||
| Nonvested RSUs, beginning of period | $ | $ | |||||||||||||||||||||
| Granted | |||||||||||||||||||||||
| Vested | ( | ||||||||||||||||||||||
| Forfeited | |||||||||||||||||||||||
| Nonvested RSUs, end of period | $ | $ | |||||||||||||||||||||
| Six Months Ended June 30, | |||||||||||||||||||||||
| 2022 | 2021 | ||||||||||||||||||||||
Number of Shares | Weighted Average Grant Date Fair Value | Number of Shares | Weighted Average Grant Date Fair Value | ||||||||||||||||||||
| Nonvested RSUs, beginning of period | $ | $ | |||||||||||||||||||||
Granted (1) | |||||||||||||||||||||||
| Vested | ( | ||||||||||||||||||||||
| Forfeited | |||||||||||||||||||||||
Nonvested RSUs, end of period (2) | $ | $ | |||||||||||||||||||||
1.RSUs granted in January 2022 had an aggregate grant date fair value of $0.2 million and vest equally each month for thirty months . RSUs granted in April 2021 had an aggregate grant date fair value of $1.4 million and vest 25
2.The aggregate compensation cost related to nonvested RSUs not yet recognized as of June 30, 2022 was $5.6 million with a weighted average remaining service period of 1.3 years.
15
The tables below summarize the activity pertaining to outstanding stock options during the three and six months ended June 30, 2022 and 2021:
| Three Months Ended June 30, | |||||||||||||||||||||||
| 2022 | 2021 | ||||||||||||||||||||||
Number of Shares | Weighted Average Exercise Price | Number of Shares | Weighted Average Exercise Price | ||||||||||||||||||||
| Outstanding stock options, beginning of period | $ | $ | |||||||||||||||||||||
| Granted | |||||||||||||||||||||||
| Exercised | |||||||||||||||||||||||
| Forfeited or expired | |||||||||||||||||||||||
| Outstanding stock options, end of period | $ | $ | |||||||||||||||||||||
| Six Months Ended June 30, | |||||||||||||||||||||||
| 2022 | 2021 | ||||||||||||||||||||||
Number of Shares | Weighted Average Exercise Price | Number of Shares | Weighted Average Exercise Price | ||||||||||||||||||||
| Outstanding stock options, beginning of period | $ | $ | |||||||||||||||||||||
Granted (1) | |||||||||||||||||||||||
| Exercised | |||||||||||||||||||||||
| Forfeited or expired | |||||||||||||||||||||||
Outstanding stock options, end of period (2) | $ | $ | |||||||||||||||||||||
1.Stock options granted in January 2022 had an aggregate grant date fair value of $0.1 million and 100% vest on the first anniversary of the grant date.
NOTE 7 – EARNINGS (LOSS) PER SHARE
The tables below show the calculation of loss per share attributable to Unit Corporation using the treasury stock method for the periods indicated:
| Earnings (Loss) (Numerator) | Weighted Shares (Denominator) | Per-Share Amount | ||||||||||||||||||
| (In thousands except per share amounts) | ||||||||||||||||||||
| Three months ended June 30, 2022 | ||||||||||||||||||||
| Basic earnings attributable to Unit Corporation per common share | $ | $ | ||||||||||||||||||
Effect of dilutive restricted stock units and stock options (1) | ( | |||||||||||||||||||
| Diluted earnings attributable to Unit Corporation per common share | $ | $ | ||||||||||||||||||
| Three months ended June 30, 2021 | ||||||||||||||||||||
| Basic loss attributable to Unit Corporation per common share | $ | ( | $ | ( | ||||||||||||||||
Effect of dilutive restricted stock units (2) | ||||||||||||||||||||
| Diluted loss attributable to Unit Corporation per common share | $ | ( | $ | ( | ||||||||||||||||
1.The diluted earnings per share calculation for the three months ended June 30, 2022 excludes the effects related to 1,822,203 average outstanding warrants with a $63.74 exercise price because their inclusion would be antidilutive.
2.The diluted loss per share calculation for the three months ended June 30, 2021 excludes the effect related to 77,863 average outstanding restricted stock units because their inclusion would be antidilutive.
16
| Earnings (Loss) (Numerator) | Weighted Shares (Denominator) | Per-Share Amount | ||||||||||||||||||
| (In thousands except per share amounts) | ||||||||||||||||||||
| Six months ended June 30, 2022 | ||||||||||||||||||||
| Basic earnings attributable to Unit Corporation per common share | $ | $ | ||||||||||||||||||
Effect of dilutive restricted stock units and stock options (1) | ( | |||||||||||||||||||
| Diluted earnings attributable to Unit Corporation per common share | $ | $ | ||||||||||||||||||
| Six months ended June 30, 2021 | ||||||||||||||||||||
| Basic loss attributable to Unit Corporation per common share | $ | ( | $ | ( | ||||||||||||||||
Effect of dilutive restricted stock units (2) | ||||||||||||||||||||
| Diluted loss attributable to Unit Corporation per common share | $ | ( | $ | ( | ||||||||||||||||
1.The diluted earnings per share calculation for the six months ended June 30, 2022 excludes the effects related to 361,418 average outstanding stock options with a $45.00 exercise price and 1,822,203 average outstanding warrants with a $63.74 exercise price because their inclusion would be antidilutive.
2.The diluted loss per share calculation for the six months ended June 30, 2021 excludes the effect related to 39,147 average outstanding restricted stock units because their inclusion would be antidilutive.
NOTE 8 – ACCRUED LIABILITIES
The table below provides detail on our accrued liabilities as of the dates indicated:
| June 30, 2022 | December 31, 2021 | |||||||||||||
| (In thousands) | ||||||||||||||
| Employee costs | $ | $ | ||||||||||||
| Lease operating expenses | ||||||||||||||
| Capital expenditures | ||||||||||||||
| Taxes | ||||||||||||||
| Interest payable | ||||||||||||||
| Other | ||||||||||||||
| Total accrued liabilities | $ | $ | ||||||||||||
NOTE 9 – LONG-TERM DEBT AND OTHER LONG-TERM LIABILITIES
Long-Term Debt
The table below provides detail on our outstanding long-term debt as of the dates indicated:
| June 30, 2022 | December 31, 2021 | |||||||||||||
| (In thousands) | ||||||||||||||
| Long-term debt: | ||||||||||||||
| Exit credit agreement | $ | $ | ||||||||||||
Superior credit agreement (1) | $ | |||||||||||||
1.Unit Corporation no longer consolidates the balance sheet of Superior as of June 30, 2022, as discussed in Note 2 - Summary Of Significant Accounting Policies and Note 15 - Superior Investment.
Exit Credit Agreement. On the Effective Date, under the terms of the Plan, the company entered into an amended and restated credit agreement (the Exit credit agreement), providing for a $140.0 million senior secured revolving credit facility (RBL Facility) and a $40.0 million senior secured term loan facility, among (i) the company, UDC, and UPC (together, the Borrowers), (ii) the guarantors party thereto, including the company and all of its subsidiaries existing as of the Effective Date (other than Superior and its subsidiaries), (iii) the lenders party thereto from time to time (Lenders), and (iv) BOKF, NA dba Bank of Oklahoma as administrative agent and collateral agent (in such capacity, the Administrative Agent).
17
On April 6, 2021, the company finalized the first amendment to the Exit credit agreement. Under the first amendment, the company reaffirmed its borrowing base of $140.0 million of the RBL Facility, amended certain financial covenants, and received less restrictive terms, among others, as it relates to the disposition of assets and the use of proceeds from those dispositions.
On July 27, 2021, the company finalized the second amendment to the Exit credit agreement. Under the second amendment, the company obtained confirmation that the Term Loan had been paid in full prior to the amendment date and received one-time waivers related to the disposition of assets.
On October 19, 2021, the company finalized the third amendment to the Exit credit agreement. Under the third amendment, the company requested, and was granted, a reduction in the RBL Facility borrowing base from $140.0 million to $80.0 million in addition to less restrictive terms as it relates to capital expenditures, required hedges, and the use of proceeds from the disposition of certain assets, while also amending certain financial covenants.
On March 30, 2022, the RBL Facility borrowing base of $80.0 million was reaffirmed.
On July 1, 2022, the RBL Facility borrowing base was automatically reduced to $31.3 million as a result of closing the Texas Gulf Coast properties sale discussed in Note 4 - Divestitures.
The maturity date of borrowings under this Exit credit agreement is March 1, 2024 . Revolving Loans and Term Loans (each as defined in the Exit credit agreement) may be Eurodollar Loans or ABR Loans (each as defined in the Exit credit agreement). Revolving Loans that are Eurodollar Loans will bear interest at a rate per annum equal to the Adjusted LIBO Rate (as defined in the Exit credit agreement) for the applicable interest period plus 525 basis points. Revolving Loans that are ABR Loans will bear interest at a rate per annum equal to the Alternate Base Rate (as defined in the Exit credit agreement) plus 425 basis points. Term Loans that are Eurodollar Loans will bear interest at a rate per annum equal to the Adjusted LIBO Rate for the applicable interest period plus 625 basis points. Term Loans that are ABR Loans will bear interest at a rate per annum equal to the Alternate Base Rate plus 525 basis points.
The Exit credit agreement requires the company to comply with certain financial ratios, including a covenant that the company will not permit the Net Leverage Ratio (as defined in the Exit credit agreement) as of the last day of the fiscal quarters ended (i) December 31, 2020 and March 31, 2021, to be greater than 4.00 to 1.00, (ii) June 30, 2021 and September 30, 2021, to be greater than 3.75 to 1.00, and (iii) December 31, 2021 and any fiscal quarter thereafter, to be greater than 3.25 to 1.00. In addition, beginning with the fiscal quarter ended December 31, 2020, the company may not (a) permit the Current Ratio (as defined in the Exit credit agreement) as of the last day of any fiscal quarter to be less than 1.00 to 1.00 or (b) permit the Interest Coverage Ratio (as defined in the Exit credit agreement) as of the last day of any fiscal quarter to be less than 2.50 to 1.00. The Exit credit agreement also contains provisions, among others, that limit certain capital expenditures, and require certain hedging activities. The Exit credit agreement further requires the company to provide quarterly financial statements within 45 days after the end of each of the first three quarters of each fiscal year and annual financial statements within 90 days after the end of each fiscal year. As of June 30, 2022, Unit was in compliance with these covenants.
The Exit credit agreement is secured by first-priority liens on substantially all of the personal and real property assets of the Borrowers and the Guarantors, including the company’s ownership interests in Superior.
As of June 30, 2022, we had no long-term borrowings and $2.4 million of letters of credit outstanding under the Exit credit agreement.
Superior Credit Agreement. On May 10, 2018, Superior entered into a five-year , $200.0 million senior secured revolving credit facility with an option to increase the credit amount up to $250.0 million, subject to certain conditions (Superior credit agreement). The amounts borrowed under the Superior credit agreement bore annual interest at a rate, at Superior’s option, equal to (a) LIBOR plus the applicable margin of 2.00 % to 3.25 % or (b) the alternate base rate (greater of (i) the federal funds rate plus 0.5 %, (ii) the prime rate, and (iii) the Thirty-Day LIBOR Rate (as defined in the Superior credit agreement)) plus the applicable margin of 1.00 % to 2.25 %.
The Superior credit agreement required that Superior maintain a Consolidated EBITDA to interest expense ratio for the most-recently ended rolling four quarters of at least 2.50 to 1.00 , and a funded debt to Consolidated EBITDA ratio of not greater than 4.00 to 1.00 . The agreement also contained several customary covenants that restrict (subject to certain exceptions) Superior’s ability to incur additional indebtedness, create additional liens on its assets, make investments, pay distributions, sign sale and leaseback transactions, engage in certain transactions with affiliates, engage in mergers or consolidations, sign hedging arrangements, and acquire or dispose of assets. Superior was in compliance with these covenants as of June 30, 2022.
18
On April 29, 2022, Superior entered into an Amended and Restated Credit Agreement for a four-year , $135.0 million senior secured revolving credit facility with an option to increase the credit amount up to $200.0 million, subject to certain conditions (Amended Superior credit agreement). The amounts borrowed under the Amended Superior credit agreement bear annual interest at a rate, at Superior’s option, equal to (a) SOFR plus the applicable margin of 2.75 % to 3.75 % or (b) the alternate base rate (greater of (i) the federal funds rate plus 0.5 %, (ii) the prime rate, and (iii) SOFR plus 0.10 %). The obligations under the Amended Superior credit agreement are secured by, among other things, mortgage liens on certain of Superior’s processing plants and gathering systems. Unit is not a party to and does not guarantee the Amended Superior credit agreement.
The Amended Superior credit agreement requires that Superior maintain a Consolidated EBITDA to interest expense ratio for the most-recently ended rolling four quarters of at least 2.50 to 1.00 , and a funded debt to Consolidated EBITDA ratio of not greater than 3.50 to 1.00 . Additionally, the Amended Superior credit agreement contains a number of customary covenants that, among other things, restrict (subject to certain exceptions) Superior’s ability to incur additional indebtedness, create additional liens on its assets, make investments, pay distributions, enter into sale and leaseback transactions, engage in certain transactions with affiliates, engage in mergers or consolidations, enter into hedging arrangements, and acquire or dispose of assets.
Other Long-Term Liabilities
The table below provides detail on our other long-term liabilities as of the dates indicated:
| June 30, 2022 | December 31, 2021 | |||||||||||||
| (In thousands) | ||||||||||||||
| Asset retirement obligation (ARO) liability | $ | $ | ||||||||||||
| Workers’ compensation | ||||||||||||||
| Contract liability | ||||||||||||||
| Separation benefit plans | ||||||||||||||
| Gas balancing liability | ||||||||||||||
| Less: current portion | ||||||||||||||
| Total other long-term liabilities | $ | $ | ||||||||||||
NOTE 10 – ASSET RETIREMENT OBLIGATIONS
19
| Six Months Ended June 30, | |||||||||||
| 2022 | 2021 | ||||||||||
| (In thousands) | |||||||||||
| ARO liability, beginning of period | $ | $ | |||||||||
| Accretion of discount | |||||||||||
| Liability incurred | |||||||||||
| Liability settled | ( | ( | |||||||||
| Liability sold | ( | ( | |||||||||
Revision of estimates (1) | ( | ||||||||||
| ARO liability, end of period | |||||||||||
| Less: current portion | |||||||||||
| Total long-term ARO | $ | $ | |||||||||
NOTE 11 – WORKERS' COMPENSATION
We are liable for workers' compensation benefits for traumatic injuries through our self-insured program to provide income replacement and medical treatment for work-related traumatic injury claims as required by applicable state laws. Workers' compensation laws also compensate survivors of workers who suffer employment related deaths. Our liability for traumatic injury claims is the estimated present value of current workers' compensation benefits, based on our actuarial estimates. Our actuarial calculations are based on a blend of actuarial projection methods and numerous assumptions including claim development patterns, mortality, medical costs and interest rates.
The following table summarizes activity for our workers' compensation liability during the periods indicated:
| Six Months Ended June 30, | |||||||||||
| 2022 | 2021 | ||||||||||
| (In thousands) | |||||||||||
| Workers' compensation liability, beginning of period | $ | $ | |||||||||
| Claims and valuation adjustments | ( | ||||||||||
| Payments | ( | ( | |||||||||
| Workers' compensation liability, end of period | |||||||||||
| Less: current portion | |||||||||||
| Long-term workers' compensation liability | $ | $ | |||||||||
Our workers' compensation liability above is presented on a gross basis and does not include our expected receivables on our insurance policy. Our receivables for traumatic injury claims under these policies as of June 30, 2022 and December 31, 2021 are $3.8 million and $4.0 million, respectively, and are included in other assets on our unaudited condensed consolidated balance sheets.
20
NOTE 12 – DERIVATIVES
Commodity Derivatives
We have entered into various types of derivative transactions covering some of our projected natural gas, NGLs, and oil production. These transactions are intended to reduce our exposure to market price volatility by setting the price(s) we will receive for that production. Our decisions on the price(s), type, and quantity of our production subject to a derivative contract are based, in part, on our view of current and future market conditions as well as certain requirements stipulated in the Exit credit agreement. Our commodity derivative transactions consisted of the following types of hedges as of June 30, 2022:
•Swaps. We receive or pay a fixed price for the commodity and pay or receive a floating market price to the counterparty. The fixed-price payment and the floating-price payment are netted, resulting in a net amount due to or from the counterparty.
•Collars. A collar contains a fixed floor price (put) and a ceiling price (call). If the market price exceeds the call strike price or falls below the put strike price, we receive the fixed price and pay the market price. If the market price is between the call and the put strike price, no payments are due from either party.
We do not engage in derivative transactions for speculative purposes and have not designated any of our hedges for hedge accounting purposes. We are not required to post any cash collateral with our counterparties and no collateral has been posted as of June 30, 2022.
The following non-designated commodity hedges were outstanding as of June 30, 2022:
| Term | Commodity | Contracted Volume | Weighted Average Fixed Price for Swaps | Contracted Market | ||||||||||||||||||||||
| Jul'22 - Dec'22 | Natural gas - swap | $ | IF - NYMEX (HH) | |||||||||||||||||||||||
| Jul'22 - Feb'23 | Natural gas - swap | $ | IF - NYMEX (HH) | |||||||||||||||||||||||
| Jan'23 - Dec'23 | Natural gas - swap | $ | IF - NYMEX (HH) | |||||||||||||||||||||||
| Jul'22 - Dec'22 | Natural gas - collar | $ | IF - NYMEX (HH) | |||||||||||||||||||||||
| Jul'22 - Dec'22 | Crude oil - swap | $ | WTI - NYMEX | |||||||||||||||||||||||
| Jul'22 - Dec'22 | Crude oil - swap | $ | WTI - NYMEX | |||||||||||||||||||||||
| Jan'23 - Feb'23 | Crude oil - swap | $ | WTI - NYMEX | |||||||||||||||||||||||
| Jan'23 - Dec'23 | Crude oil - swap | $ | WTI - NYMEX | |||||||||||||||||||||||
Warrants
Prior to the determination of the initial exercise price, we recognized the fair value of the warrants as a derivative liability on our unaudited condensed consolidated balance sheets with changes in the liability reported as gain (loss) on change in fair value of warrants in our unaudited condensed consolidated statements of operations. On April 7, 2022, the company delivered notice of the initial $63.74 exercise price resulting in the warrants meeting the definition of an equity instrument. Accordingly, we recognized the change in the fair value of the warrant liability in our unaudited condensed consolidated statements of operations and reclassified the $49.1 million warrant liability to capital in excess of par value on the unaudited condensed consolidated balance sheets as of April 7, 2022. The warrants will continue to be reported as capital in excess of par and are no longer subject to future fair value adjustments.
21
The following tables present the recognized derivative assets and liabilities on our unaudited condensed consolidated balance sheets:
| Balances as of June 30, 2022 | ||||||||||||||||||||||||||
| Balance Sheet Classification | Presented Gross | Effects of Netting | Presented Net | |||||||||||||||||||||||
| (In thousands) | ||||||||||||||||||||||||||
| Assets: | ||||||||||||||||||||||||||
| Current Commodity Derivatives | Current derivative assets | $ | $ | ( | $ | |||||||||||||||||||||
| Long-term Commodity Derivatives | Non-current derivative assets | |||||||||||||||||||||||||
| Total derivative assets | $ | $ | ( | $ | ||||||||||||||||||||||
| Liabilities: | ||||||||||||||||||||||||||
| Current Commodity Derivatives | Current derivative liabilities | $ | $ | ( | $ | |||||||||||||||||||||
| Long-term Commodity Derivatives | Non-current derivative liabilities | |||||||||||||||||||||||||
| Total derivative liabilities | $ | $ | ( | $ | ||||||||||||||||||||||
| Balances as of December 31, 2021 | ||||||||||||||||||||||||||
| Balance Sheet Classification | Presented Gross | Effects of Netting | Presented Net | |||||||||||||||||||||||
| (In thousands) | ||||||||||||||||||||||||||
| Liabilities: | ||||||||||||||||||||||||||
| Current Commodity Derivatives | Current derivative liabilities | $ | $ | $ | ||||||||||||||||||||||
| Long-term Commodity Derivatives | Non-current derivative liabilities | |||||||||||||||||||||||||
| Warrant Liability | Warrant liability | |||||||||||||||||||||||||
| Total derivative liabilities | $ | $ | $ | |||||||||||||||||||||||
The following table shows the activity related to derivative instruments in the unaudited condensed consolidated statements of operations for the periods indicated:
| Three Months Ended June 30, | Six Months Ended June 30, | ||||||||||||||||||||||
| 2022 | 2021 | 2022 | 2021 | ||||||||||||||||||||
| (In thousands) | |||||||||||||||||||||||
| Gain (loss) on derivatives | $ | $ | ( | $ | ( | $ | ( | ||||||||||||||||
| Cash settlements paid on commodity derivatives | ( | ( | ( | ( | |||||||||||||||||||
| Gain (loss) on derivatives less cash settlements paid on commodity derivatives | $ | $ | ( | $ | ( | $ | ( | ||||||||||||||||
| Gain (loss) on change in fair value of warrants | $ | $ | ( | $ | ( | $ | ( | ||||||||||||||||
NOTE 13 – FAIR VALUE MEASUREMENTS
This disclosure of the estimated fair value of financial instruments is made under accounting guidance for financial instruments. We have determined the estimated fair values by using market information and certain valuation methodologies. Considerable judgment is required in interpreting market data to develop the estimates of fair value. Using different market assumptions or valuation methodologies may have a material effect on our estimated fair value amounts.
The inputs available determine the valuation technique that we use to measure the fair value of the assets and liabilities presented in our unaudited condensed consolidated financial statements. Fair value measurements are categorized into one of three different levels depending on the observability of the inputs used in the measurement. The levels are summarized as follows:
22
•Level 1—observable inputs such as quoted prices in active markets for identical assets and liabilities.
•Level 2—other observable pricing inputs, such as quoted prices in inactive markets, or other inputs that are either directly or indirectly observable as of the reporting date, including inputs that are derived from or corroborated by observable market data.
•Level 3—generally unobservable inputs which are developed based on the best information available and may include our own internal data or estimates about how market participants would value such assets and liabilities.
Recurring Fair Value Measurements
The following tables set forth our recurring fair value measurements by level:
| Balances as of June 30, 2022 | ||||||||||||||||||||||||||
| Level 1 | Level 2 | Level 3 | Total | |||||||||||||||||||||||
| (In thousands) | ||||||||||||||||||||||||||
| Financial liabilities: | ||||||||||||||||||||||||||
| Commodity derivative liabilities | $ | $ | $ | $ | ||||||||||||||||||||||
| $ | $ | $ | $ | |||||||||||||||||||||||
| Balances as of December 31, 2021 | ||||||||||||||||||||||||||
| Level 1 | Level 2 | Level 3 | Total | |||||||||||||||||||||||
| (In thousands) | ||||||||||||||||||||||||||
| Financial liabilities: | ||||||||||||||||||||||||||
| Commodity derivative liabilities | $ | $ | $ | $ | ||||||||||||||||||||||
| Warrant liability | ||||||||||||||||||||||||||
| $ | $ | $ | $ | |||||||||||||||||||||||
The carrying values on the unaudited condensed consolidated balance sheets for cash and cash equivalents, accounts receivable, accounts payable, other current assets, and current liabilities approximate their fair value because of their short-term nature. The following methods and assumptions were used to estimate the fair values of the assets and liabilities in the table above. There were no transfers between Level 2 and Level 3 financial liabilities.
Commodity Derivatives. We measure the fair values of our crude oil and natural gas swaps and collars using estimated discounted cash flow calculations based on the NYMEX futures index. We consider these Level 2 measurements within the fair value hierarchy as the inputs in the model are substantially observable over the term of the commodity derivative contract and there is a wide availability of quoted market prices for similar commodity derivative contracts.
We determined that the non-performance risk regarding our commodity derivative counterparties was immaterial based on our valuation at June 30, 2022.
Warrant Liability. We use the Black-Scholes option pricing model to measure the fair value of the warrants. Key inputs for the Black-Scholes model include the stock price, exercise price, expected term, risk-free rate, volatility, and dividend yield. We consider this a Level 3 measurement within the fair value hierarchy as estimated volatility is generally unobservable and requires management's estimation.
23
The following table summarizes the activity of our recurring Level 3 fair value measurements during the periods presented:
| Three Months Ended June 30, | Six Months Ended June 30, | ||||||||||||||||||||||
| 2022 | 2021 | 2022 | 2021 | ||||||||||||||||||||
| (In thousands) | |||||||||||||||||||||||
| Beginning of period | $ | $ | $ | $ | |||||||||||||||||||
| (Gain) loss on change in warrant liability | ( | ||||||||||||||||||||||
| Reclassification of warrant liability to capital in excess of par value | ( | ( | |||||||||||||||||||||
| End of period | $ | $ | $ | $ | |||||||||||||||||||
Nonrecurring Fair Value Measurements
ARO. The initial measurement of ARO at fair value is calculated using discounted cash flow techniques and based on internal estimates of future retirement costs associated with property and equipment. Significant Level 3 inputs used in the calculation of AROs include plugging costs and remaining reserve lives. A summary of the company’s ARO activity is presented in Note 10 – Asset Retirement Obligations.
Stock-Based Compensation. We use the Black-Scholes option pricing model to estimate the fair value of stock option grants while the value of our restricted stock grants is based on the grant date closing stock price. Key assumptions for the Black-Scholes models include the stock price, exercise price, expected term, risk-free rate, volatility, and dividend yield. We consider this a Level 3 measurement within the fair value hierarchy as estimated volatility is generally unobservable and requires management's estimation.
See Note 15 - Superior Investment for discussion on the estimated fair value of our retained equity method investment in Superior as of March 1, 2022.
24
NOTE 14 – LEASES
Operating Leases. We are a lessee through noncancellable lease agreements for property and equipment consisting primarily of office space, land, vehicles, and equipment used in both our operations and administrative functions.
The following table sets forth the maturities, weighted average remaining lease term, and weighted average discount rate of our operating lease liabilities as of June 30, 2022:
| Amount | |||||
| (In thousands) | |||||
| Ending June 30, | |||||
| 2022 | $ | ||||
| 2023 | |||||
| 2024 | |||||
| 2025 | |||||
| 2026 | |||||
| 2027 and beyond | |||||
| Total future payments | |||||
| Less: Interest | |||||
| Present value of future minimum operating lease payments | |||||
| Less: Current portion | |||||
| Total long-term operating lease payments | $ | ||||
| Weighted average remaining lease term (years) | |||||
Weighted average discount rate (1) | % | ||||
1.Our weighted average discount rates represent the rate implicit in the lease or our incremental borrowing rate for a term equal to the remaining term of the lease.
Finance Leases. During 2014, Superior entered into finance lease agreements for 20 compressors with initial terms of seven years and an option to purchase the assets at 10 % of their then fair market value at the end of the term. These finance leases were discounted using annual rates of 4.0 % and the underlying assets were included in gas gathering and processing equipment. Superior purchased the leased assets for $3.0 million in May 2021.
25
The following table shows information about our lease assets and liabilities on our unaudited condensed consolidated balance sheets:
| Classification on the unaudited condensed consolidated balance sheets | June 30, 2022 | December 31, 2021 | ||||||||||||||||||
| (In thousands) | ||||||||||||||||||||
| Assets | ||||||||||||||||||||
| Operating lease right of use assets | Right of use assets | $ | $ | |||||||||||||||||
| Total right of use assets | $ | $ | ||||||||||||||||||
| Liabilities | ||||||||||||||||||||
| Current liabilities: | ||||||||||||||||||||
| Operating lease liabilities | Current operating lease liabilities | $ | $ | |||||||||||||||||
| Non-current liabilities: | ||||||||||||||||||||
| Operating lease liabilities | Operating lease liabilities | |||||||||||||||||||
| Total lease liabilities | $ | $ | ||||||||||||||||||
The following table shows certain information related to the lease costs for our finance and operating leases for the periods indicated:
| Three Months Ended June 30, | Six Months Ended June 30, | ||||||||||||||||||||||
| 2022 | 2021 | 2022 | 2021 | ||||||||||||||||||||
| (In thousands) | |||||||||||||||||||||||
| Components of total lease cost: | |||||||||||||||||||||||
| Amortization of finance leased assets | $ | $ | $ | $ | |||||||||||||||||||
| Interest on finance lease liabilities | |||||||||||||||||||||||
| Operating lease cost | |||||||||||||||||||||||
Short-term lease cost (1) | |||||||||||||||||||||||
| Variable lease cost | |||||||||||||||||||||||
| Total lease cost | $ | $ | $ | $ | |||||||||||||||||||
1.Short-term lease cost includes amounts capitalized related to our oil and natural gas segment of $0.7 million and $0.1 million during the three months ended June 30, 2022 and 2021, respectively, and $1.2 million and $0.2 million during the six months ended June 30, 2022 and 2021, respectively.
The following table shows supplemental cash flow information related to leases for the periods indicated:
| Six Months Ended June 30, | |||||||||||
| 2022 | 2021 | ||||||||||
| (In thousands) | |||||||||||
| Cash payments made on operating leases | $ | $ | |||||||||
| Cash payments made on finance leases | $ | $ | |||||||||
| Lease liabilities recognized in exchange for new operating lease right of use assets | $ | $ | |||||||||
26
NOTE 15 – SUPERIOR INVESTMENT
On April 3, 2018 , we sold 50 % of the ownership interest in Superior to SP Investor Holdings, LLC (SP Investor), a holding company jointly owned by OPTrust, and funds managed and/or advised by Partners Group, a global private markets investment manager. Superior is governed and managed under the Amended and Restated Limited Liability Company Agreement (Agreement) and Amended and Restated Master Services and Operating Agreement (MSA). The MSA was between our wholly-owned subsidiary, SPC Midstream Operating, L.L.C. (the Operator), and Superior. As the Operator, we provided services, such as operations and maintenance support, accounting, legal, and human resources to Superior for a monthly service fee of $0.3 million. Superior's creditors have no recourse to our general credit. Unit is not a party to and does not guarantee Superior's credit agreement. The obligations under Superior's credit agreement are secured by, among other things, mortgage liens on certain of Superior’s processing plants and gathering systems.
Distributions. The Agreement specifies how future distributions are to be allocated among Unit Corporation and SP Investor (the Members). Distributions from Available Cash (as defined in the Agreement) were generally split evenly between the Members prior to December 31, 2021, when the three-year period for Unit's commitment to spend $150.0 million (Drilling Commitment Amount) to drill wells in the Granite Wash/Buffalo Wallow area ended. The total amount spent by Unit towards the Drilling Commitment Amount was $24.6 million. Accordingly, SP Investor will receive 100% of Available Cash distributions related to periods subsequent to December 31, 2021 until the $72.7 million Drilling Commitment Adjustment Amount (as defined in the Agreement) is satisfied.
Superior paid cash distributions of $9.5 million to each of the Members in January 2022 representing Available Cash generated during the three months ended December 31, 2021, and paid distributions to SP Investor of $10.5 million in April 2022 representing Available Cash generated during the three months ended March 31, 2022 and $13.9 million in July 2022 representing Available Cash generated during the three months ended June 30, 2022. The distributions paid to SP Investor in July 2022 reduced the remaining Drilling Commitment Adjustment Amount to $48.2 million.
Distributions paid by Superior during the three and six months ended June 30, 2021 totaled $24.7
Sale Event. After April 1, 2023, either Member may initiate a sale process of Superior to a third-party or a liquidation of Superior's assets (Sale Event). In a Sale Event, the Agreement generally requires cumulative distributions to SP Investor in excess of its original $300.0 million investment sufficient to provide SP Investor a 7 % internal rate of return on its capital contributions to Superior before any liquidation distribution is made to Unit. As of June 30, 2022, liquidation distributions paid first to SP Investor of $353.7 million would be required for SP Investor to reach its 7 % Liquidation IRR Hurdle at which point Unit would then be entitled to receive up to $353.7 million of the remaining liquidation distributions to satisfy Unit's 7 % Liquidation IRR Hurdle with any remaining liquidation distributions paid as outlined within the Agreement.
Consolidation. From April 3, 2018 to March 1, 2022, we treated Superior as a variable interest entity (VIE) because the equity holders as a group (Unit Corporation and SP Investor) lacked the power to control without the Operator. The Agreement and MSA gave us the power to direct the activities that most significantly affect Superior's operating performance through common control of the Operator. Accordingly, Unit was considered the primary beneficiary and consolidated the financial position, operating results, and cash flows of Superior.
Effective March 1, 2022, the employees of the Operator were transferred to Superior and the MSA was amended and restated to remove the operating services the Operator was providing to Superior. There was no change to the monthly service fee for shared services. The power to direct the activities that most significantly affect Superior's operating performance is now shared by the equity holders (Unit Corporation and SP Investor) rather than held by the Operator. Superior no longer qualifies as a VIE subsequent to these amendments and we no longer consolidate the financial position, operating results, and cash flows of Superior as of, and subsequent to, March 1, 2022.
We subsequently account for our investment in Superior as an equity method investment using the hypothetical liquidation book value (HLBV) method, which is a balance sheet approach that calculates the change in the hypothetical amount Unit and SP Investor would be entitled to receive if Superior were liquidated at book value at the end of each period, adjusted for any contributions made and distributions received during the period. We recognized no equity earnings from our investment in Superior during the three and six months ended June 30, 2022.
27
Estimated Fair Value of Equity Method Investment in Superior. As of the Effective Date, in conjunction with fresh start accounting under ASC Topic 852, Reorganizations, the estimated fair value of the net equity attributable to Unit's ownership interest in Superior was $14.8 million. Since then, Unit has received cumulative distributions from Superior of $32.6 million, which were recognized as net income attributable to Unit under the HLBV method. As of March 1, 2022, upon deconsolidation of Superior, the fair value of our retained equity method investment in Superior was estimated at $1.7 million. To estimate this fair value, we simulated paths for Superior's total equity value through the potential sales process initiation date using a Geometric Brownian Motion. The expected value (i.e., average of all simulations) of each security class was then discounted to present value using the relevant risk-free rate. The simulations reflect forecasted future cash distributions as impacted by the Drilling Commitment Adjustment Amount described above, as well as the future liquidation preference of each investor in a potential Sale Event also as described above. We consider this a Level 3 measurement within the fair value hierarchy as the discounted simulation models require the use of significant unobservable inputs.
We recognized a $13.1 million loss on deconsolidation during the three months ended March 31, 2022 as the difference between the $1.7 million estimated fair value of our retained equity method investment in Superior as of March 1, 2022 and Superior's net equity attributable to Unit's ownership interest prior to deconsolidation.
28
Superior Balance Sheet Disclosure. The amounts below reflect the Superior balance sheet accounts, without elimination of intercompany receivables from and payables to Unit, consolidated in our unaudited condensed consolidated balance sheets as of December 31, 2021 which was the last reporting date as of which we consolidated the financial position of Superior:
| December 31, 2021 | |||||
| (In thousands) | |||||
| Current assets: | |||||
| Cash and cash equivalents | $ | ||||
| Accounts receivable | |||||
| Prepaid expenses and other | |||||
| Total current assets | |||||
| Property and equipment: | |||||
| Gas gathering and processing equipment | |||||
| Transportation equipment | |||||
| Less accumulated depreciation, depletion, amortization, and impairment | |||||
| Net property and equipment | |||||
| Right of use asset | |||||
| Other assets | |||||
| Total assets | $ | ||||
| Current liabilities: | |||||
| Accounts payable | $ | ||||
| Accrued liabilities | |||||
| Current operating lease liability | |||||
| Current portion of other long-term liabilities | |||||
| Total current liabilities | |||||
| Long-term debt | |||||
| Operating lease liability | |||||
| Total liabilities | $ | ||||
Affiliate Activity. UPC's oil and natural gas revenues with Superior totaled $19.5 million and $9.3 million during the three months ended June 30, 2022 and 2021, respectively, and $35.8 million and $17.9 million during the six months ended June 30, 2022 and 2021, respectively. UPC's gas gathering and processing expenses with Superior totaled $0.8 million and $0.9 million during the three months ended June 30, 2022 and 2021, respectively, and $1.6 million and $1.7 million during the six months ended June 30, 2022 and 2021, respectively. Portions of this activity was eliminated for the periods during which Superior was consolidated by Unit.
NOTE 16 – COMMITMENTS AND CONTINGENCIES
Environmental
We manage our exposure to environmental liabilities on properties to be acquired by identifying existing problems and assessing the potential liability. We also conduct periodic reviews, on a company-wide basis, to identify changes in our environmental risk profile. These reviews evaluate whether there is a probable liability, its amount, and the likelihood that the liability will be incurred. Any potential liability is determined by considering, among other matters, incremental direct costs of any likely remediation and the proportionate cost of employees expected to devote significant time directly to any possible remediation effort. As it relates to evaluations of purchased properties, depending on the extent of an identified environmental problem, we may exclude a property from the acquisition, require the seller to remediate the property to our satisfaction, or agree to assume liability for the remediation of the property.
29
We have not historically experienced significant environmental liability while being a contract driller since the greatest portion of that risk is borne by the operator. Any liabilities we have incurred have been small and were resolved while the drilling rig was on the location. Those costs were in the direct cost of drilling the well.
Litigation
The company is subject to litigation and claims arising in the ordinary course of business which may include environmental, health and safety matters, commercial disputes with customers, or more routine employment related claims. The company accrues for such items when a liability is both probable and the amount can be reasonably estimated. As new information becomes available or because of legal or administrative rulings in similar matters or a change in applicable law, the company's conclusions regarding the probability of outcomes and the amount of estimated loss, if any, may change. Although we are insured against various risks, there is no assurance that the nature and amount of that insurance will be adequate, in every case, to indemnify us against liabilities arising from future legal proceedings.
In February 2021, UPC finalized a settlement agreement for $2.1 million related to a well drilled in Beaver County, Oklahoma during 2013. Certain operational issues arose and one of the working interest owners in the well filed a lawsuit claiming that UPC’s actions violated its duties under the joint operating agreement and caused damages to the owners in the well. The case went to trial in January 2019 and the jury issued a verdict in favor of the working interest owner, awarding $2.4 million in damages, including pre- and post-judgment interest. UPC appealed the verdict and finalized the settlement agreement while the case was pending review in the Oklahoma Court of Civil Appeals.
NOTE 17 – INCOME TAXES
For the three and six months ended June 30, 2022 and 2021, respectively, the company’s effective income tax rate was 0.0 21.0 % primarily due to changes in, and continued need of, our full valuation allowance, changes in the warrant liability valuation, and state income taxes.
We concluded that it is more likely than not that the net deferred tax asset will not be realized and has recorded a full valuation allowance, reducing the net deferred tax asset to zero. We maintained this conclusion as of June 30, 2022 and December 31, 2021. We will continue to evaluate whether the valuation allowance is needed in future reporting periods and it will remain until we can conclude that the net deferred tax assets are more likely than not to be realized. Future events or new evidence which may lead us to conclude that it is more likely than not its net deferred tax assets will be realized include, but are not limited to, cumulative historical pre-tax earnings, sustained significant improvements in commodity prices, a sustained significant increase in rig utilization and/or rates, a material and sizable asset acquisition or disposition, and taxable events that could result from one or more future potential transactions. The valuation allowance does not prohibit the company from utilizing the tax attributes if the company recognizes taxable income. As long as we continue to conclude that the valuation allowance against the net deferred tax assets is necessary, the company will not have significant deferred income tax expense or benefit.
NOTE 18 – TRANSACTIONS WITH RELATED PARTIES
One current director, Robert Anderson, also serves as an executive with GBK Corporation, a holding company with numerous energy and industry subsidiaries and affiliates, including Kaiser Francis Oil Company. The company in the ordinary course of business, made payments for working interests, joint interest billings, and product purchases to, and received payments for working interests, drilling services, and joint interest billings from, Kaiser Francis Oil Company. Payments made to Kaiser Francis Oil Company totaled $0.7 million and $0.6 million while payments received totaled $3.6 million and $0.3 million during the three months ended June 30, 2022 and 2021, respectively, and payments made to Kaiser Francis Oil Company totaled $4.2 million and $1.0 million while payments received totaled $7.5 million and $1.3 million during the six months ended June 30, 2022 and 2021, respectively.
30
NOTE 19 – INDUSTRY SEGMENT INFORMATION
We have three main business segments offering different products and services within the energy industry:
•Oil and natural gas - the oil and natural gas segment is engaged in the acquisition, development, and production of oil, NGLs, and natural gas properties.
•Contract drilling - the contract drilling segment is engaged in the land contract drilling of oil and natural gas wells.
•Mid-Stream - the mid-stream segment buys, sells, gathers, processes, and treats natural gas and NGLs for third parties and for our own account. We presently own 50% of this subsidiary, and subsequent to the deconsolidation of Superior as of March 1, 2022 (as discussed in Note 2 - Summary Of Significant Accounting Policies and Note 15 - Superior Investment), we will continue to include our equity method investment in Superior and related earnings in our mid-stream segment.
We evaluate each consolidated segment’s performance based on its operating income, which is defined as operating revenues less operating expenses and depreciation, depletion, amortization, and impairment. We have no oil and natural gas production or other operations outside the United States.
The following tables provide certain information about the operations of each of our segments:
| Three Months Ended June 30, 2022 | ||||||||||||||||||||||||||||||||||||||
| Oil and Natural Gas | Contract Drilling | Mid-Stream | Corporate and Other | Eliminations | Total Consolidated | |||||||||||||||||||||||||||||||||
| (In thousands) | ||||||||||||||||||||||||||||||||||||||
Revenues: (1) | ||||||||||||||||||||||||||||||||||||||
| Oil and natural gas | $ | $ | $ | $ | $ | $ | ||||||||||||||||||||||||||||||||
| Contract drilling | ||||||||||||||||||||||||||||||||||||||
| Total revenues | ||||||||||||||||||||||||||||||||||||||
| Expenses: | ||||||||||||||||||||||||||||||||||||||
| Operating costs: | ||||||||||||||||||||||||||||||||||||||
| Oil and natural gas | ||||||||||||||||||||||||||||||||||||||
| Contract drilling | ||||||||||||||||||||||||||||||||||||||
Total operating costs | ||||||||||||||||||||||||||||||||||||||
Depreciation, depletion, and amortization | ||||||||||||||||||||||||||||||||||||||
| Total expenses | ||||||||||||||||||||||||||||||||||||||
General and administrative | ||||||||||||||||||||||||||||||||||||||
| Gain on disposition of assets | ( | ( | ( | |||||||||||||||||||||||||||||||||||
| Income (loss) from operations | ( | |||||||||||||||||||||||||||||||||||||
| Gain on derivatives | ||||||||||||||||||||||||||||||||||||||
| Gain on change in fair value of warrants | ||||||||||||||||||||||||||||||||||||||
| Reorganization items, net | ( | ( | ||||||||||||||||||||||||||||||||||||
| Interest, net | ( | ( | ||||||||||||||||||||||||||||||||||||
| Other | ||||||||||||||||||||||||||||||||||||||
| Income before income taxes | $ | $ | $ | $ | $ | $ | ||||||||||||||||||||||||||||||||
1.The revenues for oil and natural gas occur at a point in time. The revenues for contract drilling and gas gathering and processing occur over time.
31
| Three Months Ended June 30, 2021 | ||||||||||||||||||||||||||||||||||||||
| Oil and Natural Gas | Contract Drilling | Mid-Stream | Corporate and Other | Eliminations | Total Consolidated | |||||||||||||||||||||||||||||||||
| (In thousands) | ||||||||||||||||||||||||||||||||||||||
Revenues: (1) | ||||||||||||||||||||||||||||||||||||||
| Oil and natural gas | $ | $ | $ | $ | $ | ( | $ | |||||||||||||||||||||||||||||||
| Contract drilling | ||||||||||||||||||||||||||||||||||||||
| Gas gathering and processing | ||||||||||||||||||||||||||||||||||||||
| Total revenues | ( | |||||||||||||||||||||||||||||||||||||
| Expenses: | ||||||||||||||||||||||||||||||||||||||
| Operating costs: | ||||||||||||||||||||||||||||||||||||||
| Oil and natural gas | ( | |||||||||||||||||||||||||||||||||||||
| Contract drilling | ||||||||||||||||||||||||||||||||||||||
| Gas gathering and processing | ( | |||||||||||||||||||||||||||||||||||||
Total operating costs | ( | |||||||||||||||||||||||||||||||||||||
Depreciation, depletion, and amortization | ||||||||||||||||||||||||||||||||||||||
| Total expenses | ( | |||||||||||||||||||||||||||||||||||||
General and administrative | ||||||||||||||||||||||||||||||||||||||
| Gain on disposition of assets | ( | ( | ( | ( | ||||||||||||||||||||||||||||||||||
| Income (loss) from operations | ( | |||||||||||||||||||||||||||||||||||||
| Loss on derivatives | ( | ( | ||||||||||||||||||||||||||||||||||||
| Loss on change in fair value of warrants | ( | ( | ||||||||||||||||||||||||||||||||||||
| Reorganization items, net | ( | ( | ||||||||||||||||||||||||||||||||||||
| Interest, net | ( | ( | ||||||||||||||||||||||||||||||||||||
| Other | ( | ( | ( | |||||||||||||||||||||||||||||||||||
| Income (loss) before income taxes | $ | $ | $ | $ | ( | $ | $ | ( | ||||||||||||||||||||||||||||||
1.The revenues for oil and natural gas occur at a point in time. The revenues for contract drilling and gas gathering and processing occur over time.
32
| Six Months Ended June 30, 2022 | ||||||||||||||||||||||||||||||||||||||
| Oil and Natural Gas | Contract Drilling | Mid-Stream (2) | Corporate and Other | Eliminations (2) | Total Consolidated | |||||||||||||||||||||||||||||||||
| (In thousands) | ||||||||||||||||||||||||||||||||||||||
Revenues: (1) | ||||||||||||||||||||||||||||||||||||||
| Oil and natural gas | $ | $ | $ | $ | $ | ( | $ | |||||||||||||||||||||||||||||||
| Contract drilling | ||||||||||||||||||||||||||||||||||||||
| Gas gathering and processing | ( | |||||||||||||||||||||||||||||||||||||
| Total revenues | ( | |||||||||||||||||||||||||||||||||||||
| Expenses: | ||||||||||||||||||||||||||||||||||||||
| Operating costs: | ||||||||||||||||||||||||||||||||||||||
| Oil and natural gas | ( | |||||||||||||||||||||||||||||||||||||
| Contract drilling | ||||||||||||||||||||||||||||||||||||||
| Gas gathering and processing | ( | |||||||||||||||||||||||||||||||||||||
Total operating costs | ( | |||||||||||||||||||||||||||||||||||||
Depreciation, depletion, and amortization | ||||||||||||||||||||||||||||||||||||||
| Impairment | ||||||||||||||||||||||||||||||||||||||
| Total expenses | ( | |||||||||||||||||||||||||||||||||||||
General and administrative | ||||||||||||||||||||||||||||||||||||||
| (Gain) loss on disposition of assets | ( | ( | ( | |||||||||||||||||||||||||||||||||||
| Income (loss) from operations | ( | |||||||||||||||||||||||||||||||||||||
| Loss on derivatives | ( | ( | ||||||||||||||||||||||||||||||||||||
| Loss on change in fair value of warrants | ( | ( | ||||||||||||||||||||||||||||||||||||
| Loss on deconsolidation of Superior | ( | ( | ||||||||||||||||||||||||||||||||||||
| Reorganization items, net | ( | ( | ||||||||||||||||||||||||||||||||||||
| Interest, net | ( | ( | ( | |||||||||||||||||||||||||||||||||||
| Other | ||||||||||||||||||||||||||||||||||||||
| Income (loss) before income taxes | $ | $ | $ | $ | ( | $ | $ | |||||||||||||||||||||||||||||||
1.The revenues for oil and natural gas occur at a point in time. The revenues for contract drilling and gas gathering and processing occur over time.
2.Includes Superior activity for the two months prior to the March 1, 2022 deconsolidation, as discussed in Note 2 - Summary Of Significant Accounting Policies and Note 15 - Superior Investment.
33
| Six Months Ended June 30, 2021 | ||||||||||||||||||||||||||||||||||||||
| Oil and Natural Gas | Contract Drilling | Mid-Stream | Corporate and Other | Eliminations | Total Consolidated | |||||||||||||||||||||||||||||||||
| (In thousands) | ||||||||||||||||||||||||||||||||||||||
Revenues: (1) | ||||||||||||||||||||||||||||||||||||||
| Oil and natural gas | $ | $ | $ | $ | $ | ( | $ | |||||||||||||||||||||||||||||||
| Contract drilling | ||||||||||||||||||||||||||||||||||||||
| Gas gathering and processing | ( | |||||||||||||||||||||||||||||||||||||
| Total revenues | ( | |||||||||||||||||||||||||||||||||||||
| Expenses: | ||||||||||||||||||||||||||||||||||||||
| Operating costs: | ||||||||||||||||||||||||||||||||||||||
| Oil and natural gas | ( | |||||||||||||||||||||||||||||||||||||
| Contract drilling | ||||||||||||||||||||||||||||||||||||||
| Gas gathering and processing | ( | |||||||||||||||||||||||||||||||||||||
Total operating costs | ( | |||||||||||||||||||||||||||||||||||||
Depreciation, depletion, and amortization | ||||||||||||||||||||||||||||||||||||||
| Impairment | ||||||||||||||||||||||||||||||||||||||
| Total expenses | ( | |||||||||||||||||||||||||||||||||||||
| Loss on abandonment of assets | ||||||||||||||||||||||||||||||||||||||
General and administrative | ||||||||||||||||||||||||||||||||||||||
| (Gain) loss on disposition of assets | ( | ( | ( | ( | ||||||||||||||||||||||||||||||||||
| Income (loss) from operations | ( | |||||||||||||||||||||||||||||||||||||
| Loss on derivatives | ( | ( | ||||||||||||||||||||||||||||||||||||
| Loss on change in fair value of warrants | ( | ( | ||||||||||||||||||||||||||||||||||||
| Reorganization items, net | ( | ( | ||||||||||||||||||||||||||||||||||||
| Interest, net | ( | ( | ( | |||||||||||||||||||||||||||||||||||
| Other | ( | ( | ( | |||||||||||||||||||||||||||||||||||
| Income (loss) before income taxes | $ | $ | $ | $ | ( | $ | $ | ( | ||||||||||||||||||||||||||||||
1.The revenues for oil and natural gas occur at a point in time. The revenues for contract drilling and gas gathering and processing occur over time.
34
Item 2. Management’s Discussion and Analysis of Financial Condition and Results of Operations
Introduction
The following discussion should be read together with the condensed consolidated financial statements included in Item 1 of Part I of this report and in Item 8 of our 2021 Form 10-K filed with the SEC on March 31, 2022.
We operate, manage, and analyze the results of our operations through our three principal business segments:
•Oil and Natural Gas – carried out by our subsidiary UPC. This segment produces, develops, and acquires oil and natural gas properties for our own account.
•Contract Drilling – carried out by our subsidiary UDC. This segment contracts to drill onshore oil and natural gas wells for others and for our oil and natural gas segment.
•Mid-Stream – carried out by Superior and its subsidiaries. This segment buys, sells, gathers, processes, and treats natural gas and NGLs for third parties and for our own account. We hold a 50% investment in Superior.
Oil and Natural Gas
In our oil and natural gas segment, we are optimizing production and converting non-producing reserves to producing with selective drilling activities. We also anticipate continuing to hedge a portion of our future production depending on future market pricing among other factors.
Contract Drilling
In our contract drilling segment, we are focused on maintaining utilization of our BOSS and SCR drilling rigs in a safe and efficient manner. All 14 of our BOSS drilling rigs are currently operating in addition to three of our SCR drilling rigs. We continue to evaluate opportunities to place one or more of our four non-operating SCR drilling rigs back in service.
Mid-Stream
In our mid-stream segment, Superior is focused on continuing to generate predictable free cash flows with limited exposure to commodity prices in addition to seeking business development opportunities in its core areas utilizing the Superior credit agreement (which Unit is not a party to and does not guarantee) or other financing sources that are available to it. We hold a 50% investment in Superior, and subsequent to the deconsolidation of Superior as of March 1, 2022, we report our ownership interest as an equity method investment. The following discussion of financial condition and results of operations pertaining to our mid-stream segment as of the second quarter of 2022 relates to the two months of consolidated results prior to deconsolidation as of March 1, 2022.
Recent Developments
Commodity Price Environment and COVID-19 Pandemic
Our success depends, among other things, on prices we receive for our oil and natural gas production, the demand for oil, natural gas, and NGLs, and the demand for our drilling rigs which influences the amounts we can charge for those drilling rigs. While our operations are all within the United States, events outside the United States affect us and our industry, including political and economic uncertainty as well as geopolitical activity.
We are continuously monitoring the current and potential impacts of the COVID-19 pandemic, including any new variants, on our business. This includes how it has and may continue to impact our operations, financial results, liquidity, customers, employees, and vendors as new COVID-19 variants may have undetermined impacts to our business. In response to the pandemic, we have implemented various measures to ensure we are conducting our business in a safe and secure manner.
35
During the last two years commodity prices have been volatile, and the outlook for future oil and gas prices remains uncertain and subject to many factors. The following chart reflects the significant fluctuations in the historical prices for oil and natural gas:
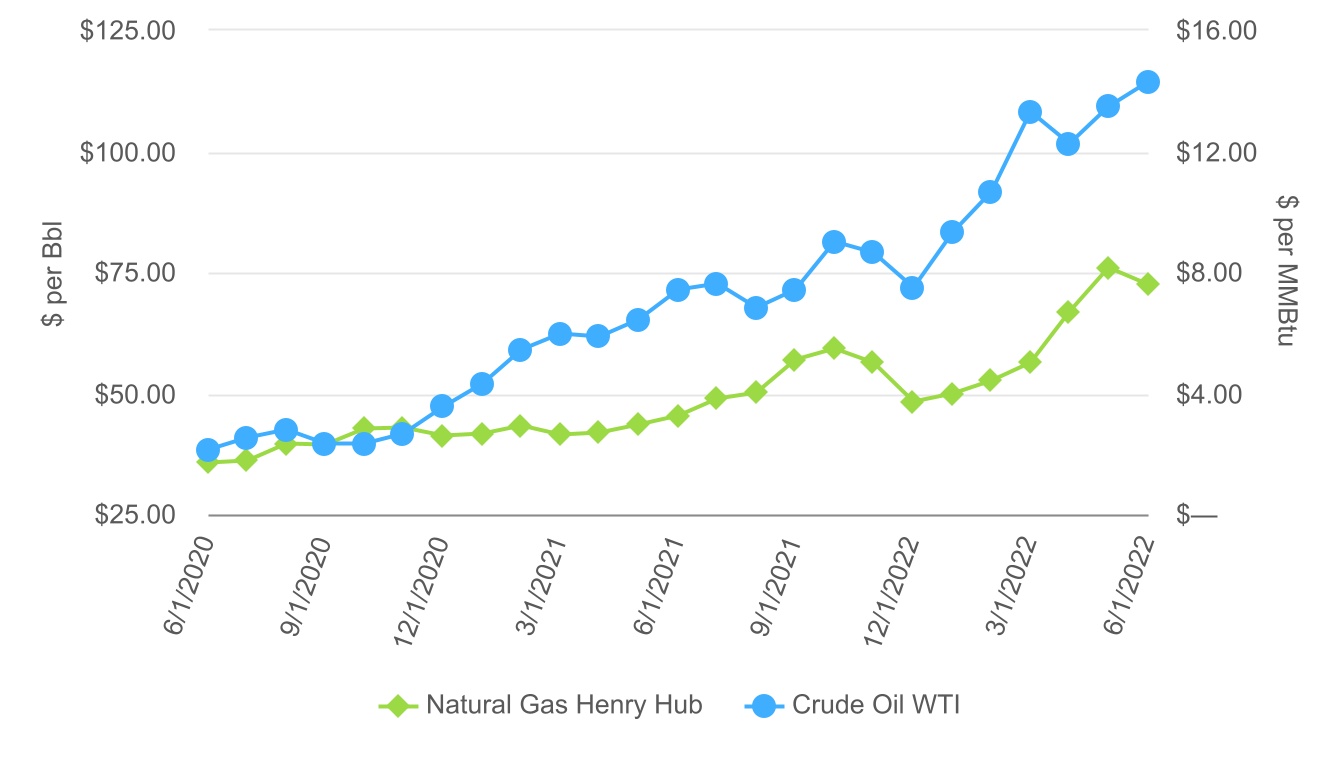
The following chart reflects the significant fluctuations in the prices for NGLs:
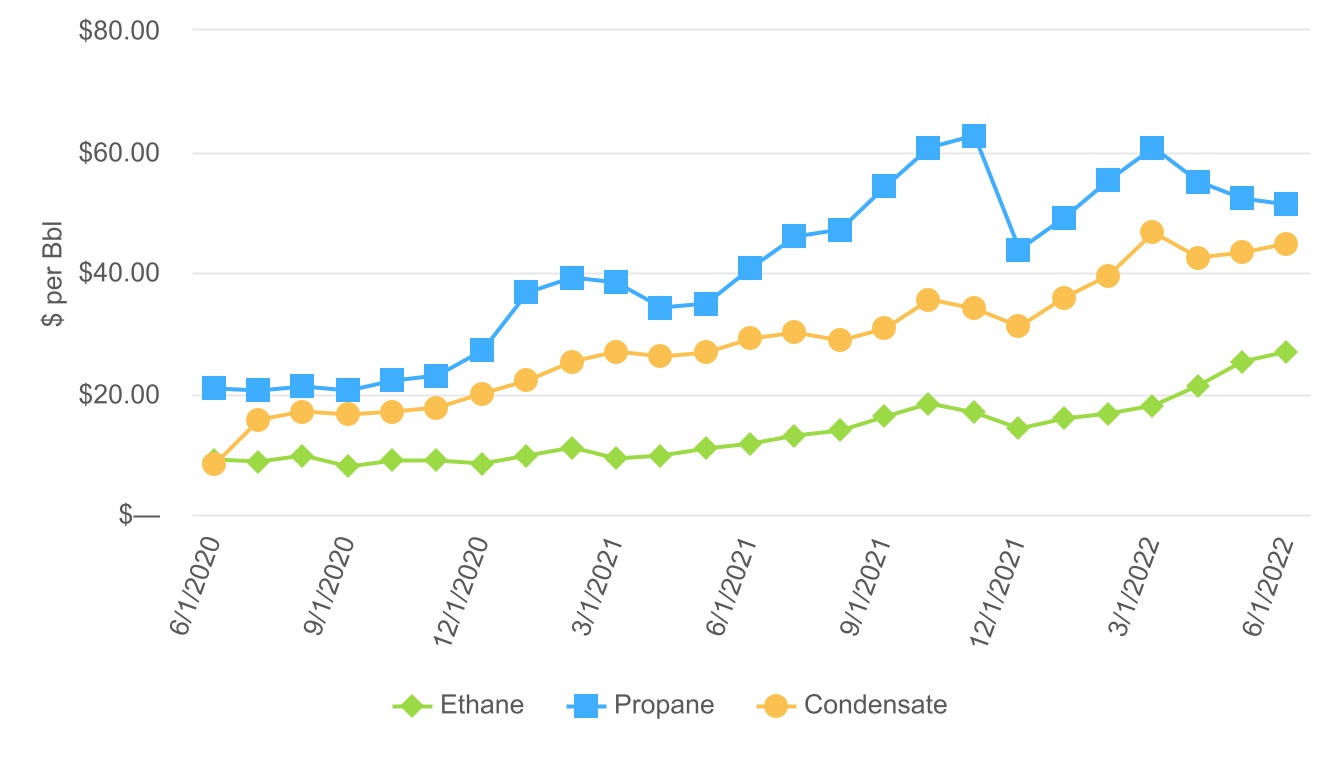
1.NGL prices reflect the monthly average Mont Belvieu price.
36
Stock Repurchases
In June 2021, we repurchased an aggregate of 600,000 shares of our common stock from the Lenders (as defined in Note 9 - Long-Term Debt and Other Long-Term Liabilities) which received these shares as an exit fee during our reorganization. The Lenders were paid $15.00 per share for their respective shares, for an aggregate cash purchase price of $9.0 million.
In June 2021, the company's board of directors (the Board) authorized repurchasing up to $25.0 million of the company’s outstanding common stock. The Board subsequently authorized increases to the authorized repurchases up to $50.0 million in October 2021 and then up to $100.0 million in June 2022. The repurchases will be made through open market purchases, privately negotiated transactions, or other available means. The company has no obligation to repurchase any shares under the repurchase program and may suspend or discontinue it at any time without prior notice. As of June 30, 2022, we had repurchased a total of 1,519,392 shares under the repurchase program at an average share price of $36.00 for an aggregate purchase price of $54.7 million. Subsequent to June 30, 2022, we have repurchased an additional 75,000 shares under the repurchase program for an aggregate purchase price of $3.8 million.
During the year ended December 31, 2021, we also repurchased 78,000 shares in a privately negotiated transaction at a share price of $19.07 which were not part of the repurchase program.
The cumulative number of shares repurchased as of June 30, 2022 totaled 2,197,392.
Superior MSA and LLCA amendments
Effective March 1, 2022, the employees of the Operator were transferred to Superior and the MSA was amended and restated to remove the operating services the Operator was providing to Superior. There was no change to the monthly service fee for shared services. We no longer consolidate the financial position, operating results, and cash flows of Superior as of, and subsequent to, March 1, 2022. We recognized a $13.1 million loss on deconsolidation during the six months ended June 30, 2022 as the difference between the $1.7 million estimated fair value of our retained equity method investment in Superior as of March 1, 2022 and Superior's net equity attributable to Unit's ownership interest prior to deconsolidation. We subsequently account for our investment in Superior as an equity method investment using the hypothetical liquidation book value (HLBV) method which is a balance sheet approach that calculates the change in the hypothetical amount Unit and SP Investor would be entitled to receive if Superior were liquidated at book value at the end of each period, adjusted for any contributions made and distributions received during the period.
Warrants
Each holder of Unit common stock outstanding (Old Common Stock) before the September 3, 2020 emergence from bankruptcy (Emergence Date) that did not opt out of the release under the Chapter 11 plan of reorganization filed with the bankruptcy court on June 9, 2020 is entitled to receive 0.03460447 warrants for every share of Old Common Stock owned. Each warrant is exercisable for one share of company common stock, subject to adjustment as provided in the Warrant Agreement. The warrants expire on the earliest of (i) September 3, 2027, (ii) consummation of a Cash Sale (as defined in the Warrant Agreement), or (iii) the consummation of a liquidation, dissolution or winding up of the company. As of June 30, 2022, the company has issued 1,822,203 warrants. See Note 5 - Capital Stock for additional discussion on warrant provisions.
Pursuant to the terms of the Warrant Agreement, the company determined the initial exercise price of the warrants to be $63.74. On April 7, 2022, the company delivered notice of the initial exercise price to the Warrant Agent and the warrants became exercisable for shares of the company’s common stock. On or about April 25, 2022, the warrants began trading over-the-counter under the symbol "UNTCW".
Financial Condition and Liquidity
Summary
Our near-term and long-term financial condition and liquidity primarily depend on the cash flow from our operations and credit agreement borrowings. The principal factors determining our cash flow from operations are:
•the amount of natural gas, oil, and NGLs we produce;
•the prices we receive for our natural gas, oil, and NGLs production;
•the utilization of our drilling rigs and the rates we receive for those drilling rigs; and
37
•the fees and margins that Superior obtains from its natural gas gathering and processing contracts.
We expect that cash and cash equivalents, cash flow from operations, and available borrowing capacity under the Exit credit agreement will be adequate to support our working capital, capital expenditures, potential dividend distributions, discretionary stock repurchases, and other cash requirements for at least the next 12 months and we are not aware of any indications that they will not be adequate for the foreseeable periods thereafter.
The table below summarizes cash flow activity during the periods indicated:
| Six Months Ended June 30, | Percent Change (1) | ||||||||||||||||
| 2022 | 2021 | ||||||||||||||||
| (In thousands except percentages) | |||||||||||||||||
| Net cash provided by operating activities | $ | 88,125 | $ | 73,965 | 19 | % | |||||||||||
| Net cash provided by (used in) investing activities | (13,882) | 7,605 | NM | ||||||||||||||
| Net cash used in financing activities | (22,755) | (87,295) | 74 | % | |||||||||||||
| Net increase (decrease) in cash and cash equivalents | $ | 51,488 | $ | (5,725) | |||||||||||||
1.NM - A percentage calculation is not meaningful due to a zero-value denominator or a percentage change greater than 200.
Cash Flows from Operating Activities
Our operating cash flow is primarily influenced by the prices we receive for our oil, NGLs, and natural gas production, the volume of oil, NGLs, and natural gas we produce, settlements of commodity derivative contracts, third-party utilization of our drilling rigs and Superior's mid-stream services, and the rates charged for those drilling and mid-stream services. Our cash flows from operating activities are also affected by changes in working capital.
Net cash provided by operating activities during the first six months of 2022 increased by $14.2 million as compared to the first six months of 2021 primarily due to increased operating profit from our oil and natural gas and contract drilling segments, partially offset by higher payments on derivative settlements, net changes in operating assets and liabilities related to the timing of cash receipts and disbursements, and lower operating profit from our mid-stream segment reflecting the March 1, 2022 deconsolidation of Superior.
Cash Flows from Investing Activities
We anticipate using a portion of our free cash flows for capital expenditures related to our development and production of oil, NGLs, and natural gas.
Net cash provided by (used in) investing activities decreased by $21.5 million during the first six months of 2022 compared to the first six months of 2021 primarily due to the deconsolidation of Superior's cash and cash equivalents, higher capital expenditures, and lower proceeds received from the disposition of non-core assets.
Cash Flows from Financing Activities
Net cash used in financing activities decreased by $64.5 million for the first six months of 2022 compared to the first six months of 2021 primarily due to the absence of net payments on credit agreements and finance leases as well as lower distributions made by Superior to non-controlling interests, partially offset by higher repurchases of common stock. A portion of future cash flows and cash and cash equivalents may be used for future shareholder return activities, including stock repurchases and cash distributions.
As of June 30, 2022, we had unrestricted cash and cash equivalents totaling $115.6 million and no outstanding borrowings under the Exit credit agreement.
38
The following table summarizes certain financial condition and liquidity information as of the dates identified below:
| June 30, 2022 | June 30, 2021 | ||||||||||
| (In thousands) | |||||||||||
| Working capital | $ | 79,799 | $ | (38,200) | |||||||
| Current portion of long-term debt | $ | — | $ | — | |||||||
| Long-term debt | $ | — | $ | 35,000 | |||||||
| Shareholders’ equity attributable to Unit Corporation | $ | 260,368 | $ | 155,562 | |||||||
Working Capital
Our working capital balance typically fluctuates due to the timing of our trade accounts receivable and accounts payable, and the fluctuation in current assets and liabilities associated with the fair values of our derivative positions. We had positive working capital of $79.8 million and negative working capital of $38.2 million as of June 30, 2022 and 2021, respectively. The increase in working capital is primarily due to increases in cash and cash equivalents and accounts receivable, net as well as the absence of the warrant liability and lower accrued liabilities and payables, partially offset by higher current commodity derivative liabilities. Our commodity derivative contracts decreased working capital by $48.8 million as of June 30, 2022 and decreased working capital by $38.0 million as of June 30, 2021.
Credit Agreements
Exit Credit Agreement. On the Effective Date, under the terms of the Plan, the company entered into an amended and restated credit agreement (the Exit credit agreement), providing for a $140.0 million senior secured revolving credit facility (RBL Facility) and a $40.0 million senior secured term loan facility, among (i) the company, UDC, and UPC (together, the Borrowers), (ii) the guarantors party thereto, including the company and all of its subsidiaries existing as of the Effective Date (other than Superior Pipeline Company, L.L.C. and its subsidiaries), (iii) the lenders party thereto from time to time (Lenders), and (iv) BOKF, NA dba Bank of Oklahoma as administrative agent and collateral agent (in such capacity, the Administrative Agent). The maturity date of borrowings under this Exit credit agreement is March 1, 2024.
Our Exit credit agreement is primarily used for working capital purposes as it limits the amount that can be borrowed for capital expenditures. These limitations restrict future capital projects using the Exit credit agreement. The Exit credit agreement also requires that proceeds from the disposition of certain assets be used to repay amounts outstanding.
On April 6, 2021, the company finalized the first amendment to the Exit credit agreement. Under the first amendment, the company reaffirmed its borrowing base of $140.0 million of the RBL, amended certain financial covenants, and received less restrictive terms, among others, as it relates to the disposition of assets and the use of proceeds from those dispositions.
On July 27, 2021, the company finalized the second amendment to the Exit credit agreement. Under the second amendment, the company obtained confirmation that the Term Loan had been paid in full prior to the amendment date and received one-time waivers related to the disposition of assets.
On October 19, 2021, the company finalized the third amendment to the Exit credit agreement. Under the third amendment, the company requested, and was granted, a reduction in the RBL borrowing base from $140.0 million to $80.0 million in addition to less restrictive terms as it relates to capital expenditures, required hedges, and the use of proceeds from the disposition of certain assets, while also amending certain financial covenants.
On March 30, 2022, the RBL Facility borrowing base of $80.0 million was reaffirmed.
On July 1, 2022, the RBL Facility borrowing base was automatically reduced to $31.3 million as a result of closing the Texas Gulf Coast properties sale discussed in Note 4 - Divestitures.
Superior Credit Agreement. On May 10, 2018, Superior signed a five-year, $200.0 million senior secured revolving credit facility with an option to increase the credit amount up to $250.0 million, subject to certain conditions (Superior credit agreement). On April 29, 2022, Superior entered into an Amended and Restated Credit Agreement for a four-year, $135.0 million senior secured revolving credit facility with an option to increase the credit amount up to $200.0 million, subject to certain conditions (Amended Superior credit agreement).
39
Capital Requirements
Oil and Natural Gas Segment Dispositions, Acquisitions, and Capital Expenditures. Most of our capital expenditures for this segment are discretionary and directed toward growth. Our decisions to increase our oil, NGLs, and natural gas reserves through acquisitions or through drilling depends on the prevailing or expected market conditions, potential return on investment, future drilling potential, and opportunities to obtain financing, which provide us flexibility in deciding when and if to incur these costs. We participated in the completion of 16 gross wells (0.64 net wells) drilled by other operators during the first six months of 2022 compared to 10 gross wells (0.77 net wells) during the first six months of 2021.
Capital expenditures including oil and gas properties on the full cost method for the first six months of 2022 by this segment totaled $9.2 million, excluding a $1.4 million increase in the ARO liability, compared to $5.9 million, excluding a $1.1 million reduction in the ARO liability, during the first six months of 2021.
On July 1, 2022, the company closed on the sale of certain wells and related leases near the Texas Gulf Coast for cash proceeds of $43.7 million, subject to customary post-closing adjustments based on an effective date of April 1, 2022. These proceeds will reduce the net book value of our full cost pool with no gain or loss recognized as the sale did not result in a significant alteration of the full cost pool.
On March 8, 2022, the company closed on the sale of certain non-core wells and related leases located near the Oklahoma Panhandle for cash proceeds of $4.1 million net of customary closing and post-closing adjustments based on an effective date of December 1, 2021. These proceeds reduced the net book value of our full cost pool with no gain or loss recognized as the sale did not result in a significant alteration of the full cost pool.
On May 6, 2021, the company closed on the sale of substantially all of our wells and the leases related thereto located in Reno and Stafford Counties, Kansas for proceeds of $7.1 million, excluding post-closing adjustments. These proceeds reduced the net book value of our full cost pool with no gain or loss recognized as the sale did not result in a significant alteration of the full cost pool.
Net proceeds for the sale of other non-core oil and natural gas assets totaled $2.3 million and $4.4 million during the six months ended June 30, 2022 and 2021, respectively. These proceeds reduced the net book value of our full cost pool with no gain or loss recognized as the sales did not result in a significant alteration of the full cost pool.
Contract Drilling Segment Dispositions, Acquisitions, and Capital Expenditures. Near term capital expenditures are expected to primarily be for maintenance capital on operating drilling rigs. We also continue to pursue the disposal or sale of our non-core, idle drilling rig fleet. Contract drilling capital expenditures totaled $4.2 million during the first six months of 2022 compared to $0.5 million during the first six months of 2021.
We sold non-core contract drilling assets for proceeds of $6.4 million and $3.9 million during the six months ended June 30, 2022 and 2021, respectively. These proceeds resulted in net gains of $4.2 million and $2.1 million during the six months ended June 30, 2022 and 2021, respectively.
Mid-Stream Dispositions, Acquisitions, and Capital Expenditures. Superior incurred $1.2 million in consolidated capital expenditures during the first six months of 2022 compared to $4.1 million during the first six months of 2021.
40
Derivative Activities
Commodity Derivatives. Our commodity derivatives are intended to reduce our exposure to price volatility and manage price risks. Our decision on the type and quantity of our production and the price(s) of our derivative(s) is based, in part, on our view of current and future market conditions. As of June 30, 2022, based on our second quarter 2022 average daily production, the approximated percentages of our production under derivative contracts are as follows:
| 2022 | 2023 | ||||||||||
| Daily oil production | 86% | 45% | |||||||||
| Daily natural gas production | 75% | 36% | |||||||||
Using derivative instruments involves the risk that the counterparties cannot meet the financial terms of the transactions. We considered this non-performance risk regarding our counterparties and our own non-performance risk in our derivative valuation at June 30, 2022 and determined there was no material risk at that time. The fair value of the net liabilities we had with Bank of Oklahoma, our only commodity derivative counterparty, was $66.1 million as of June 30, 2022.
Warrants. Prior to the determination of the initial exercise price, we recognized the fair value of the warrants as a derivative liability on our unaudited condensed consolidated balance sheets with changes in the liability reported as gain (loss) on change in fair value of warrants in our unaudited condensed consolidated statements of operations. On April 7, 2022, the company delivered notice of the initial $63.74 exercise price resulting in the warrants meeting the definition of an equity instrument. Accordingly, we recognized the change in the fair value of the warrant liability in our unaudited condensed consolidated statements of operations and reclassified the $49.1 million warrant liability to capital in excess of par value on the unaudited condensed consolidated balance sheets as of April 7, 2022. The warrants will continue to be reported as capital in excess of par and are no longer subject to future fair value adjustments. On or about April 25, 2022, the warrants began trading over-the-counter under the symbol "UNTCW".
Below is the effect of derivative instruments on the unaudited condensed consolidated statements of operations for the periods indicated:
| Three Months Ended June 30, | Six Months Ended June 30, | ||||||||||||||||||||||
| 2022 | 2021 | 2022 | 2021 | ||||||||||||||||||||
| (In thousands) | |||||||||||||||||||||||
| Gain (loss) on derivatives | $ | 2,609 | $ | (42,400) | $ | (61,467) | $ | (65,231) | |||||||||||||||
| Cash settlements paid on commodity derivatives | (32,884) | (6,403) | (54,123) | (9,707) | |||||||||||||||||||
| Gain (loss) on derivatives less cash settlements paid on commodity derivatives | $ | 35,493 | $ | (35,997) | $ | (7,344) | $ | (55,524) | |||||||||||||||
| Gain (loss) on change in fair value of warrants | $ | 7,289 | $ | (3,574) | $ | (29,323) | $ | (3,574) | |||||||||||||||
41
Results of Operations
Three months ended June 30, 2022 versus three months ended June 30, 2021
Provided below is a comparison of selected operating and financial data:
| Three Months Ended June 30, | Change | Percent Change (1) | |||||||||||||||||||||
| 2022 | 2021 | ||||||||||||||||||||||
| (In thousands unless otherwise specified) | |||||||||||||||||||||||
| Total revenue, before inter-segment eliminations | $ | 134,538 | $ | 144,160 | $ | (9,622) | (7) | % | |||||||||||||||
| Total revenue, after inter-segment eliminations | $ | 134,554 | $ | 134,057 | $ | 497 | — | % | |||||||||||||||
| Net income (loss) | $ | 80,093 | $ | (10,115) | $ | 90,208 | NM | ||||||||||||||||
| Net income (loss) attributable to non-controlling interest | $ | — | $ | 2,879 | $ | (2,879) | (100) | % | |||||||||||||||
| Net income (loss) attributable to Unit Corporation | $ | 80,093 | $ | (12,994) | $ | 93,087 | NM | ||||||||||||||||
| Oil and Natural Gas: | |||||||||||||||||||||||
| Revenue, before inter-segment eliminations | $ | 100,896 | $ | 59,776 | $ | 41,120 | 69 | % | |||||||||||||||
| Operating costs, before inter-segment eliminations | $ | 27,603 | $ | 16,350 | $ | 11,253 | 69 | % | |||||||||||||||
| Average oil price (Bbl) | $ | 56.28 | $ | 48.38 | $ | 7.90 | 16 | % | |||||||||||||||
| Average oil price excluding derivatives (Bbl) | $ | 110.29 | $ | 64.38 | $ | 45.91 | 71 | % | |||||||||||||||
| Average NGLs price (Bbl) | $ | 34.72 | $ | 17.95 | $ | 16.77 | 93 | % | |||||||||||||||
| Average NGLs price excluding derivatives (Bbl) | $ | 34.72 | $ | 17.95 | $ | 16.77 | 93 | % | |||||||||||||||
| Average natural gas price (Mcf) | $ | 4.24 | $ | 2.98 | $ | 1.26 | 42 | % | |||||||||||||||
| Average natural gas price excluding derivatives (Mcf) | $ | 6.62 | $ | 3.00 | $ | 3.62 | 121 | % | |||||||||||||||
| Oil production (MBbls) | 309 | 389 | (80) | (21) | % | ||||||||||||||||||
| NGL production (MBbls) | 620 | 662 | (42) | (6) | % | ||||||||||||||||||
| Natural gas production (MMcf) | 6,821 | 7,543 | (722) | (10) | % | ||||||||||||||||||
| Contract Drilling: | |||||||||||||||||||||||
| Revenue, before inter-segment eliminations | $ | 33,642 | $ | 18,061 | $ | 15,581 | 86 | % | |||||||||||||||
| Operating costs, before inter-segment eliminations | $ | 25,763 | $ | 14,080 | $ | 11,683 | 83 | % | |||||||||||||||
| Average number of drilling rigs in use | 16.3 | 10.0 | 6.3 | 63 | % | ||||||||||||||||||
| Total drilling rigs available for use at the end of the period | 21 | 21 | — | — | % | ||||||||||||||||||
| Average dayrate on daywork contracts - BOSS Rigs | $ | 21,955 | $ | 20,063 | $ | 1,892 | 9 | % | |||||||||||||||
| Average dayrate on daywork contracts - SCR Rigs | $ | 18,217 | $ | 14,034 | $ | 4,183 | 30 | % | |||||||||||||||
Mid-Stream: (2) | |||||||||||||||||||||||
| Revenue, before inter-segment eliminations | $ | — | $ | 66,323 | $ | (66,323) | (100) | % | |||||||||||||||
| Operating costs, before inter-segment eliminations | $ | — | $ | 55,176 | $ | (55,176) | (100) | % | |||||||||||||||
| Corporate and Other: | |||||||||||||||||||||||
| General and administrative expense, before inter-segment eliminations | $ | 7,421 | $ | 4,871 | $ | 2,550 | 52 | % | |||||||||||||||
| Other income (expense): | |||||||||||||||||||||||
| Interest expense, net | $ | (97) | $ | (487) | $ | 390 | (80) | % | |||||||||||||||
| Reorganization items, net | $ | (39) | $ | (1,852) | $ | 1,813 | (98) | % | |||||||||||||||
| Gain (loss) on derivatives | $ | 2,609 | $ | (42,400) | $ | 45,009 | 106 | % | |||||||||||||||
| Gain (loss) on change in fair value of warrants | $ | 7,289 | $ | (3,574) | $ | 10,863 | NM | ||||||||||||||||
| Income tax benefit | $ | — | $ | — | $ | — | — | % | |||||||||||||||
| Average interest rate on long-term debt outstanding | — | % | 6.5 | % | (6.5) | % | (100) | % | |||||||||||||||
| Average long-term debt outstanding | $ | — | $ | 62,646 | $ | (62,646) | (100) | % | |||||||||||||||
1.NM – A percentage calculation is not meaningful due to a zero-value denominator or a percentage change greater than 200.
2.Absence of mid-stream activity during the three months ended June 30, 2022 reflects the March 1, 2022 deconsolidation of Superior.
42
Oil and Natural Gas
Oil and natural gas revenues increased $41.1 million or 69% during the second quarter of 2022 as compared to the second quarter of 2021 primarily due to higher commodity prices, partially offset by lower production volumes. Including derivatives settled, average oil prices increased 16% to $56.28 per barrel, average natural gas prices increased 42% to $4.24 per Mcf, and NGLs prices increased 93% to $34.72 per barrel. Oil production decreased 21%, natural gas production decreased 10%, and NGLs production decreased 6%. The decrease in volumes was due to normal well production declines and divestitures of producing properties which have not been offset by new drilling or acquisitions.
Oil and natural gas operating costs increased $11.3 million or 69% between the comparative second quarters of 2022 and 2021 primarily due to increased production taxes on higher revenues, employee separation benefits, and lease operating expenses.
Contract Drilling
Drilling revenues increased $15.6 million or 86% during the second quarter of 2022 compared to the second quarter of 2021 primarily due to an increase in the average number of rigs in use from 10.0 in the second quarter of 2021 to 16.3 in the second quarter of 2022 as well as increases to the average dayrates on daywork contracts of 9% and 30% on BOSS rigs and SCR rigs, respectively.
Drilling operating costs increased $11.7 million or 83% between the comparative second quarters of 2022 and 2021 primarily due to an increase in the average number of operating rigs as well as $2.3 million of transportation and start up costs associated with bringing stacked rigs back into service.
Mid-Stream
Our mid-stream revenues decreased $66.3 million or 100% during the second quarter of 2022 as compared to the second quarter of 2021 due to the absence of activity as a result of the March 1, 2022 deconsolidation of Superior.
Operating costs decreased $55.2 million or 100% during the second quarter of 2022 compared to the second quarter of 2021 due to the absence of activity as a result of the March 1, 2022 deconsolidation of Superior.
General and Administrative
Corporate general and administrative expenses increased $2.6 million or 52% during the second quarter of 2022 compared to the second quarter of 2021 primarily due to employee separation benefits.
Interest Expense, Net
Interest expense, net decreased $0.4 million between the comparative second quarters of 2022 and 2021 primarily due to a 100% decrease in average long-term debt outstanding. Our average debt outstanding decreased $62.6 million during the second quarter of 2022 compared to the second quarter of 2021 primarily due to payments made under the Exit credit agreement and the deconsolidation of Superior's outstanding long-term debt.
Reorganization Items, Net
Reorganization items, net represent any of the expenses, gains, and losses incurred subsequent to and as a direct result of the Chapter 11 proceedings.
Gain (Loss) on Derivatives
The $45.0 million favorable change in gain (loss) on derivatives between the comparative second quarters of 2022 and 2021 is primarily due to favorable pricing changes on unsettled commodity derivative positions and new commodity derivative positions executed during the second quarter of 2022, partially offset by higher settlement payments driven by higher average pricing.
43
Loss on Change in Fair Value of Warrants
The $10.9 million favorable change in gain (loss) on change in fair value of warrants between the comparative second quarters of 2022 and 2021 is primarily due to changes in the underlying assumptions used to estimate the fair value, including entity value, volatility, duration to exercise, and other inputs.
Income Tax Benefit
We did not record an income tax benefit during the second quarter of 2022 or during the second quarter of 2021 due to the company's full valuation allowance against our net deferred tax asset.
44
Six months ended June 30, 2022 versus six months ended June 30, 2021
Provided below is a comparison of selected operating and financial data:
| Six Months Ended June 30, | Change | Percent Change (1) | |||||||||||||||||||||
| 2022 | 2021 | ||||||||||||||||||||||
| (In thousands unless otherwise specified) | |||||||||||||||||||||||
| Total revenue, before inter-segment eliminations | $ | 334,200 | $ | 274,468 | $ | 59,732 | 22 | % | |||||||||||||||
| Total revenue, after inter-segment eliminations | $ | 322,919 | $ | 254,954 | $ | 67,965 | 27 | % | |||||||||||||||
| Net income (loss) | $ | 27,388 | $ | (10,706) | $ | 38,094 | NM | ||||||||||||||||
| Net income (loss) attributable to non-controlling interest | $ | (5,828) | $ | 4,225 | $ | (10,053) | NM | ||||||||||||||||
| Net income (loss) attributable to Unit Corporation | $ | 33,216 | $ | (14,931) | $ | 48,147 | NM | ||||||||||||||||
| Oil and Natural Gas: | |||||||||||||||||||||||
| Revenue, before inter-segment eliminations | $ | 188,478 | $ | 114,801 | $ | 73,677 | 64 | % | |||||||||||||||
| Operating costs, before inter-segment eliminations | $ | 51,603 | $ | 36,343 | $ | 15,260 | 42 | % | |||||||||||||||
| Average oil price (Bbl) | $ | 58.23 | $ | 47.82 | $ | 10.41 | 22 | % | |||||||||||||||
| Average oil price excluding derivatives (Bbl) | $ | 100.03 | $ | 60.12 | $ | 39.91 | 66 | % | |||||||||||||||
| Average NGLs price (Bbl) | $ | 33.82 | $ | 17.95 | $ | 15.87 | 88 | % | |||||||||||||||
| Average NGLs price excluding derivatives (Bbl) | $ | 33.82 | $ | 17.95 | $ | 15.87 | 88 | % | |||||||||||||||
| Average natural gas price (Mcf) | $ | 3.78 | $ | 2.87 | $ | 0.91 | 32 | % | |||||||||||||||
| Average natural gas price excluding derivatives (Mcf) | $ | 5.60 | $ | 2.86 | $ | 2.74 | 96 | % | |||||||||||||||
| Oil production (MBbls) | 714 | 801 | (87) | (11) | % | ||||||||||||||||||
| NGL production (MBbls) | 1,233 | 1,303 | (70) | (5) | % | ||||||||||||||||||
| Natural gas production (MMcf) | 13,336 | 14,946 | (1,610) | (11) | % | ||||||||||||||||||
| Contract Drilling: | |||||||||||||||||||||||
| Revenue, before inter-segment eliminations | $ | 62,524 | $ | 33,735 | $ | 28,789 | 85 | % | |||||||||||||||
| Operating costs, before inter-segment eliminations | $ | 52,000 | $ | 25,951 | $ | 26,049 | 100 | % | |||||||||||||||
| Average number of drilling rigs in use | 15.9 | 9.7 | 6.2 | 64 | % | ||||||||||||||||||
| Total drilling rigs available for use at the end of the period | 21 | 21 | — | — | % | ||||||||||||||||||
| Average dayrate on daywork contracts - BOSS Rigs | $ | 21,344 | $ | 20,197 | $ | 1,147 | 6 | % | |||||||||||||||
| Average dayrate on daywork contracts - SCR Rigs | $ | 17,119 | $ | 13,651 | $ | 3,468 | 25 | % | |||||||||||||||
Mid-Stream: (2) | |||||||||||||||||||||||
| Revenue, before inter-segment eliminations | $ | 83,198 | $ | 125,932 | $ | (42,734) | (34) | % | |||||||||||||||
| Operating costs, before inter-segment eliminations | $ | 73,711 | $ | 104,286 | $ | (30,575) | (29) | % | |||||||||||||||
| Gas gathered--Mcf/day | 348,859 | 296,396 | 52,463 | 18 | % | ||||||||||||||||||
| Gas processed--Mcf/day | 146,368 | 124,285 | 22,083 | 18 | % | ||||||||||||||||||
| Gas liquids sold--gallons/day | 456,700 | 425,277 | 31,423 | 7 | % | ||||||||||||||||||
| Corporate and Other: | |||||||||||||||||||||||
| General and administrative expense, before inter-segment eliminations | $ | 13,336 | $ | 11,160 | $ | 2,176 | 19 | % | |||||||||||||||
| Other income (expense): | |||||||||||||||||||||||
| Interest expense, net | $ | (371) | $ | (2,777) | $ | 2,406 | (87) | % | |||||||||||||||
| Reorganization items, net | $ | (42) | $ | (2,988) | $ | 2,946 | 99 | % | |||||||||||||||
| Loss on derivatives | $ | (61,467) | $ | (65,231) | $ | 3,764 | 6 | % | |||||||||||||||
| Loss on change in fair value of warrants | $ | (29,323) | $ | (3,574) | $ | (25,749) | NM | ||||||||||||||||
| Loss on deconsolidation of Superior | $ | (13,141) | $ | — | $ | (13,141) | — | % | |||||||||||||||
| Income tax benefit | $ | — | $ | — | $ | — | — | % | |||||||||||||||
| Average interest rate on long-term debt outstanding | 2.2 | % | 6.7 | % | (4.5) | % | (68) | % | |||||||||||||||
| Average long-term debt outstanding | $ | 6,338 | $ | 77,852 | $ | (71,514) | (92) | % | |||||||||||||||
1.NM – A percentage calculation is not meaningful due to a zero-value denominator or a percentage change greater than 200.
2.Mid-Stream activity and metrics shown in this table for the six months ended June 30, 2022 reflect Superior activity on a consolidated basis for the two months prior to March 1, 2022.
45
Oil and Natural Gas
Oil and natural gas revenues increased $73.7 million or 64% during the first six months of 2022 as compared to the first six months of 2021 primarily due to higher commodity prices, partially offset by lower production volumes. Including derivatives settled, average oil prices increased 22% to $58.23 per barrel, average natural gas prices increased 32% to $3.78 per Mcf, and NGLs prices increased 88% to $33.82 per barrel. Oil production decreased 11%, natural gas production decreased 11%, and NGLs production decreased 5%. The decrease in volumes was due to normal well production declines and divestitures of producing properties which have not been offset by new drilling or acquisitions.
Oil and natural gas operating costs increased $15.3 million or 42% between the comparative first six months of 2022 and 2021 primarily due to increased production taxes on higher revenues, higher lease operating expenses, and employee separation benefits.
Contract Drilling
Drilling revenues increased $28.8 million or 85% during the first six months of 2022 compared to the first six months of 2021 primarily due to an increase in the average number of rigs in use from 9.7 during the first six months of 2021 to 15.9 during the first six months of 2022 as well as increases to the average dayrates on daywork contracts of 6% and 25% on BOSS rigs and SCR rigs, respectively.
Drilling operating costs increased $26.0 million or 100% between the comparative first six months of 2022 and 2021 primarily due to an increase in the average number of operating rigs as well as $6.6 million of transportation and start up costs associated with bringing stacked rigs back into service.
Mid-Stream
Our mid-stream revenues decreased $42.7 million or 34% during the first six months of 2022 as compared to the first six months of 2021 primarily due to the absence of activity subsequent to March 1, 2022 as a result of the deconsolidation of Superior, partially offset by higher gas, NGL, and condensate prices as well as higher volumes during the consolidated period. Gas processed volumes per day increased 18% while gas gathered volumes per day increased 18% between the comparative first six months of 2022 and 2021 primarily due to connecting new wells as well as new volumes from the processing plant and gathering system acquired in November 2021.
Operating costs decreased $30.6 million or 29% during the first six months of 2022 compared to the first six months of 2021 primarily due to the absence of activity subsequent to March 1, 2022 as a result of the deconsolidation of Superior, partially offset by higher gas, NGL, and condensate prices as well as higher purchase volumes related to the processing plant and gathering system acquired in November 2021.
General and Administrative
Corporate general and administrative expenses increased $2.2 million or 19% during the first six months of 2022 as compared to the first six months of 2021 primarily due to employee separation benefits.
Interest Expense, Net
Interest expense, net decreased $2.4 million between the comparative first six months of 2022 and 2021 primarily due to a 92% decrease in average long-term debt outstanding and a decrease in the average interest rate from 6.7% during the first six months of 2021 to 2.2% during the first six months of 2022. Our average debt outstanding decreased $71.5 million during the first six months of 2022 compared to the first six months of 2021 primarily due to payments made under the Exit credit agreement and the deconsolidation of Superior's outstanding long-term debt, partially offset by borrowings under the Superior credit agreement prior to deconsolidation.
Reorganization Items, Net
Reorganization items, net represent any of the expenses, gains, and losses incurred subsequent to and as a direct result of the Chapter 11 proceedings.
46
Gain (Loss) on Derivatives
The $3.8 million favorable change in gain (loss) on derivatives between the comparative first six months of 2022 and 2021 is primarily due to less unfavorable pricing changes on unsettled commodity derivative positions and new commodity derivative positions executed during the second quarter of 2022, partially offset by higher settlement payments driven by higher average pricing.
Loss on Change in Fair Value of Warrants
The $25.7 million unfavorable change in loss on change in fair value of warrants between the comparative second quarters of 2022 and 2021 is primarily due to changes in the underlying assumptions used to estimate the fair value, including entity value, volatility, duration to exercise, and other inputs.
Loss on Deconsolidation of Superior
Loss on deconsolidation of $13.1 million during the first six months of 2022 represents the loss recognized on the March 1, 2022 deconsolidation of Superior.
Income Tax Benefit
We did not record an income tax benefit during first six months of 2022 or during the first six months of 2021 due to the company's full valuation allowance against our net deferred tax asset.
Item 3. Quantitative and Qualitative Disclosures About Market Risk
Our operations are exposed to market risks primarily because of changes in commodity prices and interest rates.
Commodity Price Risk. Our major market risk exposure is in the prices we receive for our oil, NGLs, and natural gas production. These prices are primarily driven by the prevailing worldwide price for crude oil and market prices applicable to our NGLs and natural gas production. Historically, these prices have fluctuated and we expect this to continue. The prices for oil, NGLs, and natural gas also affect the demand for our drilling rigs and the amount we can charge for the use of our drilling rigs. Based on our first six months of 2022 production, a $0.10 per Mcf change in what we are paid for our natural gas production, without the effect of hedging, would result in a corresponding $0.2 million per month ($2.6 million annualized) change in our pre-tax operating cash flow. A $1.00 per barrel change in our oil price, without the effect of hedging, would have a $0.1 million per month ($1.4 million annualized) change in our pre-tax operating cash flow and a $1.00 per barrel change in our NGLs prices, without the effect of hedging, would have a $0.2 million per month ($2.5 million annualized) change in our pre-tax operating cash flow.
We use derivative transactions to manage the risk associated with price volatility. Our decisions regarding the amount and prices at which we choose to enter into a contract for certain of our products is based, in part, on our view of current and future market conditions. The transactions we use include financial price swaps under which we will receive a fixed price for our production and pay a variable market price to the contract counterparty. We do not hold or issue derivative instruments for speculative trading purposes.
47
As of June 30, 2022, we had the following commodity derivatives outstanding:
| Term | Commodity | Contracted Volume | Weighted Average Fixed Price for Swaps | Contracted Market | ||||||||||||||||||||||
| Jul'22 - Dec'22 | Natural gas - swap | 5,000 MMBtu/day | $2.61 | IF - NYMEX (HH) | ||||||||||||||||||||||
| Jul'22 - Feb'23 | Natural gas - swap | 18,765 MMBtu/day | $9.14 | IF - NYMEX (HH) | ||||||||||||||||||||||
| Jan'23 - Dec'23 | Natural gas - swap | 22,000 MMBtu/day | $2.46 | IF - NYMEX (HH) | ||||||||||||||||||||||
| Jul'22 - Dec'22 | Natural gas - collar | 35,000 MMBtu/day | $2.50 - $2.68 | IF - NYMEX (HH) | ||||||||||||||||||||||
| Jul'22 - Dec'22 | Crude oil - swap | 2,300 Bbl/day | $42.25 | WTI - NYMEX | ||||||||||||||||||||||
| Jul'22 - Dec'22 | Crude oil - swap | 596 Bbl/day | $103.98 | WTI - NYMEX | ||||||||||||||||||||||
| Jan'23 - Feb'23 | Crude oil - swap | 1,339 Bbl/day | $95.40 | WTI - NYMEX | ||||||||||||||||||||||
| Jan'23 - Dec'23 | Crude oil - swap | 1,300 Bbl/day | $43.60 | WTI - NYMEX | ||||||||||||||||||||||
Interest Rate Risk. Our interest rate exposure relates to our long-term debt under our Exit credit agreement as its borrowings carry variable interest rates. We had no outstanding borrowings under this facility as of June 30, 2022. See Note 9 – Long-Term Debt and Other Long-Term Liabilities for more information on the Exit credit agreement.
Item 4. Controls and Procedures
Our management, including our Chief Executive Officer (CEO) and Chief Financial Officer (CFO), does not expect that our disclosure controls and procedures (as defined in Rules 13a - 15(e) and 15d - 15(e) of the Securities Exchange Act of 1934, as amended (the Exchange Act)) (Disclosure Controls) or our internal control over financial reporting (as defined in Rules 13a - 15(f) and 15d - 15(f) of the Exchange Act) will prevent or detect all errors and all fraud. A control system, no matter how well designed and operated, can provide only reasonable, not absolute, assurance that the objectives of the control system are met. Further, the design of a control system must reflect the fact that there are resource constraints, and the benefits of controls must be considered relative to their costs. Because of the inherent limitations in all control systems, no evaluation of controls can provide absolute assurance that all control issues and instances of fraud, if any, within the company have been detected. These inherent limitations include the realities that judgments in decision-making can be faulty, and that breakdowns can occur because of a simple error or mistake. Additionally, controls can be circumvented by the individual acts of some persons, by collusion of two or more people, or by management override of the controls. The design of any system of controls also is based in part on certain assumptions about the likelihood of future events, and there is no assurance that any design will succeed in achieving its stated goals under all potential future conditions. Because of the inherent limitations in a cost-effective control system, misstatements due to an error or fraud may occur and not be detected. We monitor our Disclosure Controls and internal control over financial reporting and make modifications as necessary; our intent in this regard is that the Disclosure Controls and internal control over financial reporting will be modified as systems change, and conditions warrant.
Evaluation of Disclosure Controls and Procedures. As of the end of the period covered by this report, we carried out an evaluation, under the supervision and with the participation of our management, including our CEO and CFO, of the effectiveness of the design and operation of our disclosure controls and procedures under Exchange Act Rule 13a-15. Based on that evaluation, our CEO and CFO concluded that our disclosure controls and procedures were effective as of June 30, 2022.
Changes in Internal Controls. There were no changes in our internal control over financial reporting during the quarter ended June 30, 2022, that materially affected, or are reasonably likely to materially affect, our internal control over financial reporting.
48
PART II. OTHER INFORMATION
Item 1. Legal Proceedings
For further information about the outstanding legal proceedings, please see Note 16 – Commitments And Contingencies.
Item 1A. Risk Factors
In addition to the other information set forth in this quarterly report, you should carefully consider the factors discussed below, if any, and in Part I, “Item 1A. Risk Factors” in our Annual Report on Form 10-K for the year ended December 31, 2021, which could materially affect our business, financial condition, or future results. The risks described in our Annual Report on Form 10-K are not the only risks facing our company. Additional risks and uncertainties not currently known to us or that we currently deem to be immaterial also may materially adversely affect our business, financial condition, and/or operating results.
There have been no material changes to the risk factors disclosed in Item 1A in our Form 10-K for the year ended December 31, 2021.
Item 2. Unregistered Sales of Equity Securities and Use of Proceeds
In June 2021, we repurchased an aggregate of 600,000 shares of our common stock from the Lenders (as defined in Note 9 - Long-Term Debt and Other Long-Term Liabilities) which received these shares as an exit fee during our reorganization. The Lenders were paid $15.00 per share for their respective shares, for an aggregate cash purchase price of $9.0 million.
In June 2021, the company's board of directors (the Board) authorized repurchasing up to $25.0 million of the company’s outstanding common stock. The Board subsequently authorized increases to the authorized repurchases up to $50.0 million in October 2021 and then up to $100.0 million in June 2022. The repurchases will be made through open market purchases, privately negotiated transactions, or other available means. The company has no obligation to repurchase any shares under the repurchase program and may suspend or discontinue it at any time without prior notice. As of June 30, 2022, we had repurchased a total of 1,519,392 shares under the repurchase program at an average share price of $36.00 for an aggregate purchase price of $54.7 million. Subsequent to June 30, 2022, we have repurchased an additional 75,000 shares under the repurchase program for an aggregate purchase price of $3.8 million.
During the year ended December 31, 2021, we also repurchased 78,000 shares in a privately negotiated transaction at a share price of $19.07 which were not part of the repurchase program.
The cumulative number of shares repurchased as of June 30, 2022 totaled 2,197,392. The cash purchase price and any direct acquisition costs are reflected as treasury stock on the unaudited condensed consolidated balance sheets as of June 30, 2022.
The table below shows share repurchase activity for the three months ended June 30, 2022:
| Period | Total number of shares purchased | Average price paid per share | Total number of shares purchased as part of publicly announced program | Approximate dollar value of shares that may yet be purchased under the program (1) | ||||||||||
| (in thousands) | ||||||||||||||
| April 1, 2022 through April 30, 2022 | — | $ | — | — | $ | 8,570 | ||||||||
| May 1, 2022 through May 31, 2022 | — | $ | — | — | $ | 8,570 | ||||||||
| June 1, 2022 through June 30, 2022 | 247,429 | $ | 53.63 | 247,429 | $ | 45,300 | ||||||||
1.Reflects the June 2022 increase to authorized repurchases from $50.0 million to $100.0 million.
Item 3. Defaults Upon Senior Securities
Not applicable.
49
Item 4. Mine Safety Disclosures
Not applicable.
Item 5. Other Information
Not applicable.
Item 6. Exhibits
Exhibits:
| 31.1 | |||||
| 31.2 | |||||
| 32 | |||||
| 101.INS | XBRL Instance Document. | ||||
| 101.SCH | XBRL Taxonomy Extension Schema Document. | ||||
| 101.CAL | XBRL Taxonomy Extension Calculation Linkbase Document. | ||||
| 101.DEF | XBRL Taxonomy Extension Definition Linkbase Document. | ||||
| 101.LAB | XBRL Taxonomy Extension Labels Linkbase Document. | ||||
| 101.PRE | XBRL Taxonomy Extension Presentation Linkbase Document. | ||||
| 104 | Cover Page Interactive Data File. The cover page interactive data file does not appear in the interactive data file because its XBRL tags are embedded within the inline XBRL document (contained in Exhibit 101). | ||||
50
SIGNATURES
Pursuant to the requirements of the Securities Exchange Act of 1934, the Registrant has duly caused this report to be signed on its behalf by the undersigned thereunto duly authorized.
| Unit Corporation | ||||||||
| Date: | August 11, 2022 | By: /s/ Philip B. Smith | ||||||
| PHILIP B. SMITH | ||||||||
| President and Chief Executive Officer | ||||||||
| Date: | August 11, 2022 | By: /s/ Thomas D. Sell | ||||||
| THOMAS D. SELL | ||||||||
| Chief Financial Officer | ||||||||
51
Exhibit 31.1
302 CERTIFICATIONS
I, Philip B. Smith, certify that:
1.I have reviewed this quarterly report on Form 10-Q of Unit Corporation;
2.Based on my knowledge, this report does not contain any untrue statement of a material fact or omit to state a material fact necessary to make the statements made, in light of the circumstances under which such statements were made, not misleading with respect to the period covered by this report;
3.Based on my knowledge, the financial statements, and other financial information included in this report, fairly present in all material respects the financial condition, results of operations and cash flows of the registrant as of, and for, the periods presented in this report;
4.The registrant's other certifying officer(s) and I are responsible for establishing and maintaining disclosure controls and procedures (as defined in Exchange Act Rules 13a-15(e) and 15d-15(e)) and internal control over financial reporting (as defined in Exchange Act Rules 13a-15(f) and 15d-15(f)) for the registrant and have:
a.Designed such disclosure controls and procedures, or caused such disclosure controls and procedures to be designed under our supervision, to ensure that material information relating to the registrant, including its consolidated subsidiaries, is made known to us by others within those entities, particularly during the period in which this report is being prepared;
b.Designed such internal control over financial reporting, or caused such internal control over financial reporting to be designed under our supervision, to provide reasonable assurance regarding the reliability of financial reporting and the preparation of financial statements for external purposes is accordance with generally accepted accounting principles;
c.Evaluated the effectiveness of the registrant's disclosure controls and procedures and presented in this report our conclusions about the effectiveness of the disclosure controls and procedures, as of the end of the period covered by this report based on such evaluation; and
d.Disclosed in this report any change in the registrant's internal control over financial reporting that occurred during the registrant's most recent fiscal quarter (the registrant's fourth fiscal quarter in the case of an annual report) that has materially affected, or is reasonably likely to materially affect, the registrant's internal control over financial reporting; and
5.The registrant's other certifying officer(s) and I have disclosed, based on our most recent evaluation of internal control over financial reporting, to the registrant's auditors and the audit committee of the registrant's board of directors (or persons performing the equivalent functions):
a.All significant deficiencies and material weaknesses in the design or operation of internal control over financial reporting which are reasonably likely to adversely affect the registrant's ability to record, process, summarize and report financial information; and
b.Any fraud, whether or not material, that involves management or other employees who have a significant role in the registrant's internal control over financial reporting.
Date: August 11, 2022
| /s/ Philip B. Smith | ||
| PHILIP B. SMITH | ||
| President and Chief Executive Officer | ||
Exhibit 31.2
302 CERTIFICATIONS
I, Thomas D. Sell, certify that:
1.I have reviewed this quarterly report on Form 10-Q of Unit Corporation;
2.Based on my knowledge, this report does not contain any untrue statement of a material fact or omit to state a material fact necessary to make the statements made, in light of the circumstances under which such statements were made, not misleading with respect to the period covered by this report;
3.Based on my knowledge, the financial statements, and other financial information included in this report, fairly present in all material respects the financial condition, results of operations and cash flows of the registrant as of, and for, the periods presented in this report;
4.The registrant's other certifying officer(s) and I are responsible for establishing and maintaining disclosure controls and procedures (as defined in Exchange Act Rules 13a-15(e) and 15d-15(e)) and internal control over financial reporting (as defined in Exchange Act Rules 13a-15(f) and 15d-15(f)) for the registrant and have:
a.Designed such disclosure controls and procedures, or caused such disclosure controls and procedures to be designed under our supervision, to ensure that material information relating to the registrant, including its consolidated subsidiaries, is made known to us by others within those entities, particularly during the period in which this report is being prepared;
b.Designed such internal control over financial reporting, or caused such internal control over financial reporting to be designed under our supervision, to provide reasonable assurance regarding the reliability of financial reporting and the preparation of financial statements for external purposes is accordance with generally accepted accounting principles;
c.Evaluated the effectiveness of the registrant's disclosure controls and procedures and presented in this report our conclusions about the effectiveness of the disclosure controls and procedures, as of the end of the period covered by this report based on such evaluation; and
d.Disclosed in this report any change in the registrant's internal control over financial reporting that occurred during the registrant's most recent fiscal quarter (the registrant's fourth fiscal quarter in the case of an annual report) that has materially affected, or is reasonably likely to materially affect, the registrant's internal control over financial reporting; and
5.The registrant's other certifying officer(s) and I have disclosed, based on our most recent evaluation of internal control over financial reporting, to the registrant's auditors and the audit committee of the registrant's board of directors (or persons performing the equivalent functions):
a.All significant deficiencies and material weaknesses in the design or operation of internal control over financial reporting which are reasonably likely to adversely affect the registrant's ability to record, process, summarize and report financial information; and
b.Any fraud, whether or not material, that involves management or other employees who have a significant role in the registrant's internal control over financial reporting.
Date: August 11, 2022
| /s/ Thomas D. Sell | ||
| THOMAS D. SELL | ||
| Chief Financial Officer | ||
Exhibit 32
CERTIFICATION
PURSUANT TO SECTION 906 OF THE SARBANES-OXLEY ACT OF 2002
(SUBSECTIONS (A) AND (B) OF SECTION 1350, CHAPTER 63 OF TITLE 18, UNITED
STATES CODE)
Pursuant to section 906 of the Sarbanes-Oxley Act of 2002 (subsections (a) and (b) of section 1350, chapter 63 of title 18, United States Code), each of the undersigned officers of Unit Corporation a Delaware corporation (the "Company"), does hereby certify, to such officer's knowledge, that:
The Quarterly Report on Form 10-Q for the quarter ended June 30, 2022 (the "Form 10-Q") of the Company fully complies with the requirements of section 13(a) or 15(d) of the Securities Exchange Act of 1934 and information contained in the Form 10-Q fairly presents, in all material respects, the financial condition and results of operations of the Company as of June 30, 2022 and December 31, 2021, and for the three and six months ended June 30, 2022 and 2021, respectively.
Dated: August 11, 2022
By: /s/ Philip B. Smith | ||
| Philip B. Smith | ||
| President and Chief Executive Officer | ||
Dated: August 11, 2022
By: /s/ Thomas D. Sell | ||
| Thomas D. Sell | ||
| Chief Financial Officer | ||
The foregoing certification is being furnished solely pursuant to section 906 of the Sarbanes-Oxley Act of 2002 (subsections (a) and (b) of section 1350, chapter 63 of title 18, United States Code) and is not being filed as part of the Form 10-Q or as a separate disclosure document.
A signed original of this written statement required by Section 906 of the Sarbanes-Oxley Act of 2002 has been provided to Unit Corporation and will be retained by Unit Corporation and furnished to the Securities and Exchange Commission or its staff on request.
Serious News for Serious Traders! Try StreetInsider.com Premium Free!
You May Also Be Interested In
- Jessica Holmes Launches the 2024 Defeat Depression Campaign to Encourage Canada-Wide Participation
- Sisecam’s $1.1 Billion Eurobond Issues Receive Over $3.5 Billion in Demand
- Audience Intelligence Company Tunnl Announces Reach & Frequency, Linear TV Measurement Solution
Create E-mail Alert Related Categories
SEC FilingsSign up for StreetInsider Free!
Receive full access to all new and archived articles, unlimited portfolio tracking, e-mail alerts, custom newswires and RSS feeds - and more!
