

Form 10-Q Summit Materials, LLC For: Apr 02 Filed by: Summit Materials, Inc.
 Tweet
Tweet Share
ShareUNITED STATES
SECURITIES AND EXCHANGE COMMISSION
Washington, D.C. 20549
FORM | |||||
(Mark One) | |||||||||||
| QUARTERLY REPORT PURSUANT TO SECTION 13 OR 15(d) OF THE SECURITIES EXCHANGE ACT OF 1934 | |||||||||||
For the quarterly period ended April 2, 2022
OR
| TRANSITION REPORT PURSUANT TO SECTION 13 OR 15(d) OF THE SECURITIES EXCHANGE ACT OF 1934 | |||||
For the transition period from to
Commission file numbers:
(Exact name of registrants as specified in their charters) | ||
| (State or other jurisdiction of incorporation or organization) | (I.R.S. Employer Identification No.) | |||||||
| (Zip Code) | ||||||||
| (Address of principal executive offices) | ||||||||
Registrants’ telephone number, including area code: (303 ) 893-0012
Not Applicable
(Former name, former address and former fiscal year, if changed since last report)
| Securities registered pursuant to Section 12(b) of the Act: | ||||||||||||||
| Title of each class | Trading symbol(s) | Name of each exchange on which registered | ||||||||||||
| Indicate by check mark whether the registrant (1) has filed all reports required to be filed by Section 13 or 15(d) of the Securities Exchange Act of 1934 during the preceding 12 months (or for such shorter period that the registrant was required to file such reports), and (2) has been subject to such filing requirements for the past 90 days. | ||||||||||||||||||||||||||||||||
| Summit Materials, Inc. | ☒ | No | ☐ | Summit Materials, LLC | ☒ | No | ☐ | |||||||||||||||||||||||||
| Indicate by check mark whether the registrant has submitted electronically every Interactive Data File required to be submitted pursuant to Rule 405 of Regulation S‑T (§232.405 of this chapter) during the preceding 12 months (or for such shorter period that the registrant was required to submit such files). | ||||||||||||||||||||||||||||||||
| Summit Materials, Inc. | ☒ | No | ☐ | Summit Materials, LLC | ☒ | No | ☐ | |||||||||||||||||||||||||
| Indicate by check mark whether the registrant is a large accelerated filer, an accelerated filer, a non-accelerated filer, a smaller reporting company, or an emerging growth company. See the definitions of “large accelerated filer,” “accelerated filer,” “smaller reporting company” and “emerging growth company” in Rule 12b-2 of the Exchange Act. | ||||||||||||||||||||||||||||||||
| Summit Materials, Inc. | ||||||||||||||||||||||||||||||||
| ☒ | Accelerated filer | ☐ | ||||||||||||||||||||||||||||||
| Non-accelerated filer | ☐ | Smaller reporting company | ||||||||||||||||||||||||||||||
| Emerging growth company | ||||||||||||||||||||||||||||||||
| If an emerging growth company, indicate by check mark if the registrant has elected not to use the extended transition period for complying with any new or revised financial accounting standards provided pursuant to Section 13(a) of the Exchange Act. | ☐ | |||||||||||||||||||||||||||||||
| Summit Materials, LLC | ||||||||||||||||||||||||||||||||
| Large accelerated filer | ☐ | Accelerated filer | ☐ | |||||||||||||||||||||||||||||
| ☒ | Smaller reporting company | |||||||||||||||||||||||||||||||
| Emerging growth company | ||||||||||||||||||||||||||||||||
| If an emerging growth company, indicate by check mark if the registrant has elected not to use the extended transition period for complying with any new or revised financial accounting standards provided pursuant to Section 13(a) of the Exchange Act. | ☐ | |||||||||||||||||||||||||||||||
| Indicate by check mark whether the registrant is a shell company (as defined in Rule 12b-2 of the Exchange Act). | ||||||||||||||||||||||||||||||||
| Summit Materials, Inc. | Yes | ☐ | No | Summit Materials, LLC | Yes | ☐ | No | |||||||||||||||||||||||||
As of May 2, 2022, the number of shares of Summit Materials, Inc.’s outstanding Class A and Class B common stock, par value $0.01 per share for each class, was 118,099,723 and 99 , respectively.
As of May 2, 2022, 100% of Summit Materials, LLC’s outstanding limited liability company interests were held by Summit Materials Intermediate Holdings, LLC, its sole member and an indirect subsidiary of Summit Materials, Inc.
EXPLANATORY NOTE
This quarterly report on Form 10-Q (this “report”) is a combined quarterly report being filed separately by two registrants: Summit Materials, Inc. and Summit Materials, LLC. Each registrant hereto is filing on its own behalf all of the information contained in this report that relates to such registrant. Each registrant hereto is not filing any information that does not relate to such registrant, and therefore makes no representation as to any such information. We believe that combining the quarterly reports on Form 10-Q of Summit Materials, Inc. and Summit Materials, LLC into this single report eliminates duplicative and potentially confusing disclosure and provides a more streamlined presentation since a substantial amount of the disclosure applies to both registrants.
Unless stated otherwise or the context requires otherwise, references to “Summit Inc.” mean Summit Materials, Inc., a Delaware corporation, and references to “Summit LLC” mean Summit Materials, LLC, a Delaware limited liability company. The references to Summit Inc. and Summit LLC are used in cases where it is important to distinguish between them. We use the terms “we,” “our,” “us” or “the Company” to refer to Summit Inc. and Summit LLC together with their respective subsidiaries, unless otherwise noted or the context otherwise requires.
Summit Inc. was formed on September 23, 2014 to be a holding company. As of April 2, 2022, its sole material asset was a 98.9% economic interest in Summit Materials Holdings L.P., a Delaware limited partnership (“Summit Holdings”). Summit Inc. has 100% of the voting rights of Summit Holdings, which is the indirect parent of Summit LLC. Summit LLC is a co-issuer of our outstanding 6 1/2 % senior notes due 2027 (“2027 Notes”) and our 5 1/4% senior notes due 2029 (“2029 Notes” and collectively with the 2027 Notes, the “Senior Notes”). Summit Inc.’s only revenue for the three months ended April 2, 2022 was that generated by Summit LLC and its consolidated subsidiaries. Summit Inc. controls all of the business and affairs of Summit Holdings and, in turn, Summit LLC.
CAUTIONARY NOTE REGARDING FORWARD-LOOKING STATEMENTS
This report includes “forward-looking statements” within the meaning of the federal securities laws, which involve risks and uncertainties. Forward-looking statements include all statements that do not relate solely to historical or current facts, and you can identify forward-looking statements because they contain words such as “believes,” “expects,” “may,” “will,” “should,” “seeks,” “intends,” “trends,” “plans,” “estimates,” “projects” or “anticipates” or similar expressions that concern our strategy, plans, expectations or intentions. All statements made relating to our estimated and projected earnings, margins, costs, expenditures, cash flows, growth rates and financial results are forward-looking statements. These forward-looking statements are subject to risks, uncertainties and other factors that may cause our actual results, performance or achievements to be materially different from future results, performance or achievements expressed or implied by such forward-looking statements. We derive many of our forward-looking statements from our operating budgets and forecasts, which are based upon many detailed assumptions. While we believe that our assumptions are reasonable, it is very difficult to predict the effect of known factors, and, of course, it is impossible to anticipate all factors that could affect our actual results. In light of the significant uncertainties inherent in the forward-looking statements included herein, the inclusion of such information should not be regarded as a representation by us or any other person that the results or conditions described in such statements or our objectives and plans will be realized. Important factors could affect our results and could cause results to differ materially from those expressed in our forward-looking statements, including but not limited to the factors discussed in the section entitled “Risk Factors” in Summit Inc.’s Annual Report on Form 10-K for the fiscal year ended January 1, 2022 (the “Annual Report”), as filed with the Securities and Exchange Commission (the “SEC”), any factors discussed in the section entitled “Risk Factors” of this report and the following:
•our dependence on the construction industry and the strength of the economies in which we operate;
•the cyclical nature of our industry;
•risks related to weather and seasonality;
•risks associated with our capital-intensive business;
•competition within our local markets;
•our ability to execute on our acquisition and portfolio optimization strategy, successfully integrate acquisitions with our existing operations and retain key employees of acquired businesses;
•our dependence on securing and permitting aggregate reserves in strategically located areas;
•the impact of the coronavirus (“COVID-19”) pandemic, and responses to it, including vaccine mandates, or any similar crisis, on our business;
•declines in public infrastructure construction and delays or reductions in governmental funding, including the funding by transportation authorities and other state agencies particularly if such are not augmented by federal funding or if the federal government fails to act on a highway infrastructure bill;
•our reliance on private investment in infrastructure, which may be adversely affected by periods of economic stagnation and recession;
•environmental, health, safety and climate change laws or governmental requirements or policies concerning zoning and land use;
•costs associated with pending and future litigation;
•rising prices for, or more limited availability of, commodities, labor and other production and delivery inputs as a result of inflation, supply chain challenges, geopolitical events or otherwise;
•conditions in the credit markets;
•our ability to accurately estimate the overall risks, requirements or costs when we bid on or negotiate contracts that are ultimately awarded to us;
•material costs and losses as a result of claims that our products do not meet regulatory requirements or contractual specifications;
•cancellation of a significant number of contracts or our disqualification from bidding for new contracts;
•special hazards related to our operations that may cause personal injury or property damage not covered by insurance;
•unexpected factors affecting self-insurance claims and reserve estimates;
•our current level of indebtedness, including our exposure to variable interest rate risk;
•our dependence on senior management team, and our ability to retain and attract other qualified personnel;
•supply constraints or significant price fluctuations in the electricity and petroleum-based resources that we use, including diesel and liquid asphalt;
•climate change and climate change legislation or other regulations;
•unexpected operational difficulties;
•interruptions in our information technology systems and infrastructure, including cybersecurity and data leakage risks; and
•potential labor disputes, strikes, other forms of work stoppage or other union activities.
All subsequent written and oral forward-looking statements attributable to us, or persons acting on our behalf, are expressly qualified in their entirety by these cautionary statements.
Any forward-looking statement that we make herein speaks only as of the date of this report. We undertake no obligation to publicly update or revise any forward-looking statement as a result of new information, future events or otherwise, except as required by law.
CERTAIN DEFINITIONS
As used in this report, unless otherwise noted or the context otherwise requires:
•“EBITDA” refers to net income (loss) before interest expense (income), income tax expense (benefit) and depreciation, depletion and amortization;
•“Finance Corp.” refers to Summit Materials Finance Corp., an indirect wholly-owned subsidiary of Summit LLC and the co-issuer of the Senior Notes;
•“LP Units” refers to the Class A limited partnership units of Summit Holdings; and
•“TRA” refers to a tax receivable agreement between Summit Inc. and certain current and former holders of LP Units and their permitted assignees.
Corporate Structure
The following chart summarizes our organizational structure, equity ownership and our principal indebtedness as of April 2, 2022. This chart is provided for illustrative purposes only and does not show all of our legal entities or all obligations of such entities.
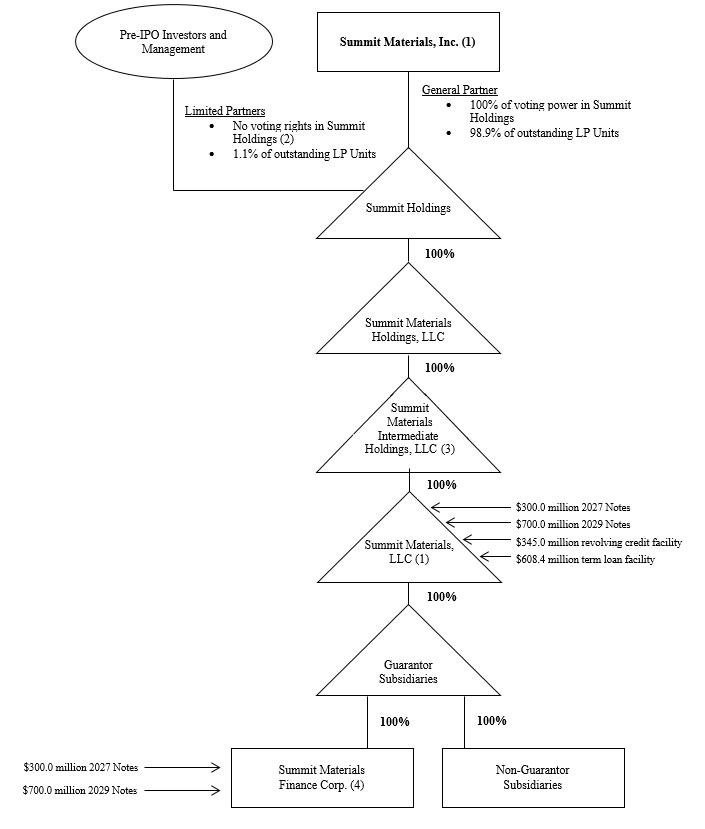
(1)SEC registrant.
(2)The shares of Class B Common Stock are currently held by pre-IPO investors, including certain members of management or their family trusts that directly hold LP Units. A holder of Class B Common Stock is entitled, without regard to the number of shares of Class B Common Stock held by such holder, to a number of votes that is equal to the aggregate number of LP Units held by such holder.
(3)Guarantor under the senior secured credit facilities, but not the Senior Notes.
(4)Summit LLC and Finance Corp are the issuers of the Senior Notes and Summit LLC is the borrower under our senior secured credit facilities. Finance Corp. was formed solely for the purpose of serving as co-issuer or guarantor of certain indebtedness, including the Senior Notes. Finance Corp. does not and will not have operations of any kind and does not and will not have revenue or assets other than as may be incidental to its activities as a co-issuer or guarantor of certain indebtedness.
SUMMIT MATERIALS, INC.
SUMMIT MATERIALS, LLC
FORM 10-Q
TABLE OF CONTENTS
| Page No. | ||||||||
PART I—Financial Information | ||||||||
PART II — Other Information | ||||||||
PART I—FINANCIAL INFORMATION
ITEM 1. FINANCIAL STATEMENTS
SUMMIT MATERIALS, INC. AND SUBSIDIARIES
Consolidated Balance Sheets
(In thousands, except share and per share amounts)
| April 2, 2022 | January 1, 2022 | ||||||||||
| (unaudited) | (audited) | ||||||||||
| Assets | |||||||||||
| Current assets: | |||||||||||
| Cash and cash equivalents | $ | $ | |||||||||
| Accounts receivable, net | |||||||||||
| Costs and estimated earnings in excess of billings | |||||||||||
| Inventories | |||||||||||
| Other current assets | |||||||||||
| Current assets held for sale | |||||||||||
| Total current assets | |||||||||||
Property, plant and equipment, less accumulated depreciation, depletion and amortization (April 2, 2022 - $ | |||||||||||
| Goodwill | |||||||||||
Intangible assets, less accumulated amortization (April 2, 2022 - $ | |||||||||||
Deferred tax assets, less valuation allowance (April 2, 2022 - $ | |||||||||||
| Operating lease right-of-use assets | |||||||||||
| Other assets | |||||||||||
| Noncurrent assets held for sale | |||||||||||
| Total assets | $ | $ | |||||||||
| Liabilities and Stockholders’ Equity | |||||||||||
| Current liabilities: | |||||||||||
| Current portion of debt | $ | $ | |||||||||
| Current portion of acquisition-related liabilities | |||||||||||
| Accounts payable | |||||||||||
| Accrued expenses | |||||||||||
| Current operating lease liabilities | |||||||||||
| Billings in excess of costs and estimated earnings | |||||||||||
| Current liabilities held for sale | |||||||||||
| Total current liabilities | |||||||||||
| Long-term debt | |||||||||||
| Acquisition-related liabilities | |||||||||||
| Tax receivable agreement liability | |||||||||||
| Noncurrent operating lease liabilities | |||||||||||
| Other noncurrent liabilities | |||||||||||
| Noncurrent liabilities held for sale | |||||||||||
| Total liabilities | |||||||||||
| Commitments and contingencies (see note 12) | |||||||||||
| Stockholders’ equity: | |||||||||||
Class A common stock, par value $ | |||||||||||
Class B common stock, par value $ | |||||||||||
| Additional paid-in capital | |||||||||||
| Accumulated earnings | |||||||||||
| Accumulated other comprehensive income | |||||||||||
| Stockholders’ equity | |||||||||||
| Noncontrolling interest in Summit Holdings | |||||||||||
| Total stockholders’ equity | |||||||||||
| Total liabilities and stockholders’ equity | $ | $ | |||||||||
See notes to unaudited consolidated financial statements.
1
SUMMIT MATERIALS, INC. AND SUBSIDIARIES
Unaudited Consolidated Statements of Operations
(In thousands, except share and per share amounts)
| Three months ended | |||||||||||
| April 2, 2022 | April 3, 2021 | ||||||||||
| Revenue: | |||||||||||
| Product | $ | $ | |||||||||
| Service | |||||||||||
| Net revenue | |||||||||||
| Delivery and subcontract revenue | |||||||||||
| Total revenue | |||||||||||
| Cost of revenue (excluding items shown separately below): | |||||||||||
| Product | |||||||||||
| Service | |||||||||||
| Net cost of revenue | |||||||||||
| Delivery and subcontract cost | |||||||||||
| Total cost of revenue | |||||||||||
| General and administrative expenses | |||||||||||
| Depreciation, depletion, amortization and accretion | |||||||||||
| Gain on sale of property, plant and equipment | ( | ( | |||||||||
| Operating loss | ( | ( | |||||||||
| Interest expense | |||||||||||
| Gain on sale of businesses | ( | ( | |||||||||
| Other income, net | ( | ( | |||||||||
| Loss from operations before taxes | ( | ( | |||||||||
| Income tax benefit | ( | ( | |||||||||
| Net loss | ( | ( | |||||||||
| Net loss attributable to Summit Holdings | ( | ( | |||||||||
| Net loss attributable to Summit Inc. | $ | ( | $ | ( | |||||||
| Loss per share of Class A common stock: | |||||||||||
| Basic | $ | ( | $ | ( | |||||||
| Diluted | $ | ( | $ | ( | |||||||
| Weighted average shares of Class A common stock: | |||||||||||
| Basic | |||||||||||
| Diluted | |||||||||||
See notes to unaudited consolidated financial statements.
2
SUMMIT MATERIALS, INC. AND SUBSIDIARIES
Unaudited Consolidated Statements of Comprehensive Income
(In thousands)
| Three months ended | |||||||||||
| April 2, 2022 | April 3, 2021 | ||||||||||
| Net loss | $ | ( | $ | ( | |||||||
| Other comprehensive income (loss): | |||||||||||
| Foreign currency translation adjustment | |||||||||||
| Less tax effect of other comprehensive loss items | ( | ( | |||||||||
| Other comprehensive income | |||||||||||
| Comprehensive loss | ( | ( | |||||||||
| Less comprehensive loss attributable to Summit Holdings | ( | ( | |||||||||
| Comprehensive loss attributable to Summit Inc. | $ | ( | $ | ( | |||||||
See notes to unaudited consolidated financial statements.
3
SUMMIT MATERIALS, INC. AND SUBSIDIARIES
Unaudited Consolidated Statements of Cash Flows
(In thousands)
| Three months ended | |||||||||||
| April 2, 2022 | April 3, 2021 | ||||||||||
| Cash flows from operating activities: | |||||||||||
| Net loss | $ | ( | $ | ( | |||||||
| Adjustments to reconcile net income to net cash provided by operating activities: | |||||||||||
| Depreciation, depletion, amortization and accretion | |||||||||||
| Share-based compensation expense | |||||||||||
| Net gain on asset and business disposals | ( | ( | |||||||||
| Change in deferred tax asset, net | ( | ( | |||||||||
| Other | ( | ||||||||||
| Decrease (increase) in operating assets, net of acquisitions and dispositions: | |||||||||||
| Accounts receivable, net | |||||||||||
| Inventories | ( | ( | |||||||||
| Costs and estimated earnings in excess of billings | ( | ( | |||||||||
| Other current assets | ( | ( | |||||||||
| Other assets | |||||||||||
| (Decrease) increase in operating liabilities, net of acquisitions and dispositions: | |||||||||||
| Accounts payable | |||||||||||
| Accrued expenses | ( | ( | |||||||||
| Billings in excess of costs and estimated earnings | ( | ||||||||||
| Tax receivable agreement liability | |||||||||||
| Other liabilities | ( | ( | |||||||||
| Net cash used in operating activities | ( | ( | |||||||||
| Cash flows from investing activities: | |||||||||||
| Purchases of property, plant and equipment | ( | ( | |||||||||
| Proceeds from the sale of property, plant and equipment | |||||||||||
| Proceeds from sale of businesses | |||||||||||
| Other | ( | ( | |||||||||
| Net cash used in investing activities | ( | ( | |||||||||
| Cash flows from financing activities: | |||||||||||
| Payments on debt | ( | ( | |||||||||
| Payments on acquisition-related liabilities | ( | ( | |||||||||
| Repurchases of common stock | ( | ||||||||||
| Proceeds from stock option exercises | |||||||||||
| Other | ( | ( | |||||||||
| Net cash used in financing activities | ( | ( | |||||||||
| Impact of foreign currency on cash | |||||||||||
| Net decrease in cash | ( | ( | |||||||||
| Cash and cash equivalents—beginning of period | |||||||||||
| Cash and cash equivalents—end of period | $ | $ | |||||||||
See notes to unaudited consolidated financial statements.
4
SUMMIT MATERIALS, INC. AND SUBSIDIARIES
Unaudited Consolidated Statements of Changes in Stockholders’ Equity
(In thousands, except share amounts)
| Summit Materials, Inc. | |||||||||||||||||||||||||||||||||||||||||||||||||||||
| Accumulated | |||||||||||||||||||||||||||||||||||||||||||||||||||||
| Other | Class A | Class B | Additional | Noncontrolling | Total | ||||||||||||||||||||||||||||||||||||||||||||||||
| Accumulated | Comprehensive | Common Stock | Common Stock | Paid-in | Interest in | Stockholders’ | |||||||||||||||||||||||||||||||||||||||||||||||
| Earnings | income | Shares | Dollars | Shares | Dollars | Capital | Summit Holdings | Equity | |||||||||||||||||||||||||||||||||||||||||||||
| Balance - January 1, 2022 | $ | $ | $ | $ | $ | $ | $ | ||||||||||||||||||||||||||||||||||||||||||||||
| Net loss | ( | — | — | — | — | — | — | ( | ( | ||||||||||||||||||||||||||||||||||||||||||||
| Other comprehensive income, net of tax | — | — | — | — | — | — | |||||||||||||||||||||||||||||||||||||||||||||||
| Stock option exercises | — | — | — | — | — | ||||||||||||||||||||||||||||||||||||||||||||||||
| Share-based compensation | — | — | — | — | — | — | — | ||||||||||||||||||||||||||||||||||||||||||||||
| Repurchases of common stock | ( | — | ( | ( | — | — | ( | ( | |||||||||||||||||||||||||||||||||||||||||||||
| Shares redeemed to settle taxes and other | — | — | — | — | ( | ( | ( | ||||||||||||||||||||||||||||||||||||||||||||||
| Balance - April 2, 2022 | $ | $ | $ | $ | $ | $ | $ | ||||||||||||||||||||||||||||||||||||||||||||||
| Balance — January 2, 2021 | $ | $ | $ | $ | $ | $ | $ | ||||||||||||||||||||||||||||||||||||||||||||||
| Net loss | ( | — | — | — | — | — | — | ( | ( | ||||||||||||||||||||||||||||||||||||||||||||
| LP Unit exchanges | — | — | — | — | ( | ||||||||||||||||||||||||||||||||||||||||||||||||
| Other comprehensive income, net of tax | — | — | — | — | — | — | |||||||||||||||||||||||||||||||||||||||||||||||
| Stock option exercises | — | — | — | — | — | ||||||||||||||||||||||||||||||||||||||||||||||||
| Share-based compensation | — | — | — | — | — | — | — | ||||||||||||||||||||||||||||||||||||||||||||||
| Shares redeemed to settle taxes and other | — | — | — | — | ( | — | ( | ||||||||||||||||||||||||||||||||||||||||||||||
| Balance — April 3, 2021 | $ | $ | $ | $ | $ | $ | $ | ||||||||||||||||||||||||||||||||||||||||||||||
See notes to unaudited consolidated financial statements.
5
SUMMIT MATERIALS, INC.
NOTES TO UNAUDITED CONSOLIDATED FINANCIAL STATEMENTS
(Dollars in tables in thousands, except per share amounts or otherwise noted)
1.SUMMARY OF ORGANIZATION AND SIGNIFICANT ACCOUNTING POLICIES
Summit Materials, Inc. (“Summit Inc.” and, together with its subsidiaries, “Summit,” “we,” “us,” “our” or the “Company”) is a vertically-integrated construction materials company. The Company is engaged in the production and sale of aggregates, cement, ready-mix concrete, asphalt paving mix and concrete products and owns and operates quarries, sand and gravel pits, two cement plants, cement distribution terminals, ready-mix concrete plants, asphalt plants and landfill sites. It is also engaged in paving and related services. The Company’s three
Substantially all of the Company’s construction materials, products and services are produced, consumed and performed outdoors, primarily in the spring, summer and fall. Seasonal changes and other weather-related conditions can affect the production and sales volumes of its products and delivery of services. Therefore, the financial results for any interim period are typically not indicative of the results expected for the full year. Furthermore, the Company’s sales and earnings are sensitive to national, regional and local economic conditions, weather conditions and to cyclical changes in construction spending, among other factors.
Summit Inc. is a holding corporation operating and controlling all of the business and affairs of Summit Materials Holdings L.P. (“Summit Holdings”) and its subsidiaries, and through Summit Holdings conducts its business. Summit Inc. owns the majority of the partnership interests of Summit Holdings (see Note 9, Stockholders’ Equity). Summit Materials, LLC (“Summit LLC”), an indirect wholly owned subsidiary of Summit Holdings, conducts the majority of our operations. Summit Materials Finance Corp. (“Summit Finance”), an indirect wholly owned subsidiary of Summit LLC, has jointly issued our Senior Notes as described below.
Basis of Presentation—These unaudited consolidated financial statements were prepared in accordance with U.S. generally accepted accounting principles (“U.S. GAAP”) for interim financial information, without audit, pursuant to the rules and regulations of the Securities and Exchange Commission (“SEC”). Certain information and footnote disclosures typically included in financial statements prepared in accordance with U.S. GAAP have been condensed or omitted pursuant to such rules and regulations. These unaudited consolidated financial statements should be read in conjunction with the Company's audited consolidated financial statements and the notes thereto as of and for the year ended January 1, 2022. The Company continues to follow the accounting policies set forth in those audited consolidated financial statements.
Management believes that these consolidated interim financial statements include all adjustments, normal and recurring in nature, that are necessary to present fairly the financial position of the Company as of April 2, 2022, the results of operations for the three months ended April 2, 2022 and April 3, 2021 and cash flows for the three months ended April 2, 2022 and April 3, 2021.
Principles of Consolidation—The consolidated financial statements include the accounts of Summit Inc. and its majority owned subsidiaries. All intercompany balances and transactions have been eliminated.
For a summary of the changes in Summit Inc.’s ownership of Summit Holdings, see Note 9, Stockholders’ Equity.
6
Revenue Recognition—We earn revenue from the sale of products, which primarily include aggregates, cement, ready-mix concrete and asphalt, but also include concrete products, and from the provision of services, which are primarily paving and related services.
Products: Revenue for product sales is recognized when evidence of an arrangement exists and when control passes, which generally is when the product is shipped.
Services: We earn revenue from the provision of services, which are primarily paving and related services, which are typically calculated using monthly progress based on the percentage of completion or a customer’s engineer review of progress.
The majority of our construction service contracts are completed within one year, but may occasionally extend beyond this time frame. The majority of our construction service contracts are for work that occurs mostly during the spring, summer and fall. We generally measure progress toward completion on long-term paving and related services contracts based on the proportion of costs incurred to date relative to total estimated costs at completion.
2.ACQUISITIONS, DISPOSITIONS, GOODWILL AND INTANGIBLES
The Company has completed numerous acquisitions since its formation, which have been financed through a combination of debt and equity funding and available cash. The operations of each acquisition have been included in the Company’s consolidated results of operations since the respective closing dates of the acquisitions. The Company measures all assets acquired and liabilities assumed at their acquisition-date fair value. Goodwill acquired during a business combination has an indefinite life and is not amortized.
Changes in the carrying amount of goodwill, by reportable segment, from January 1, 2022 to April 2, 2022 are summarized as follows:
| West | East | Cement | Total | ||||||||||||||||||||
| Balance—January 1, 2022 | $ | $ | $ | $ | |||||||||||||||||||
| Dispositions (1) | ( | ( | |||||||||||||||||||||
| Foreign currency translation adjustments | |||||||||||||||||||||||
| Goodwill allocated to assets held for sale | ( | ( | |||||||||||||||||||||
| Balance—April 2, 2022 | $ | $ | $ | $ | |||||||||||||||||||
_______________________________________________________________________
(1) Reflects goodwill derecognition from dispositions completed during the three months ended April 2, 2022.
7
The Company’s intangible assets subject to amortization are primarily composed of operating permits, mineral lease agreements and reserve rights. Operating permits relate to permitting and zoning rights acquired outside of a business combination. The assets related to mineral lease agreements reflect the submarket royalty rates paid under agreements, primarily for extracting aggregates. The values were determined as of the respective acquisition dates by a comparison of market-royalty rates. The reserve rights relate to aggregate reserves to which the Company has certain rights of ownership, but does not own the reserves. The intangible assets are amortized on a straight-line basis over the lives of the leases or permits. The following table shows intangible assets by type and in total:
| April 2, 2022 | January 1, 2022 | ||||||||||||||||||||||||||||||||||
| Gross Carrying Amount | Accumulated Amortization | Net Carrying Amount | Gross Carrying Amount | Accumulated Amortization | Net Carrying Amount | ||||||||||||||||||||||||||||||
| Operating permits | $ | $ | ( | $ | $ | $ | ( | $ | |||||||||||||||||||||||||||
| Mineral leases | ( | ( | |||||||||||||||||||||||||||||||||
| Reserve rights | ( | ( | |||||||||||||||||||||||||||||||||
| Other | ( | ( | |||||||||||||||||||||||||||||||||
| Total intangible assets | $ | $ | ( | $ | $ | $ | ( | $ | |||||||||||||||||||||||||||
Amortization expense totaled $0.9 million and $1.0 million for the three months ended April 2, 2022 and April 3, 2021, respectively. The estimated amortization expense for the intangible assets for each of the five years subsequent to April 2, 2022 is as follows:
| 2022 (nine months) | $ | ||||
| 2023 | |||||
| 2024 | |||||
| 2025 | |||||
| 2026 | |||||
| 2027 | |||||
| Thereafter | |||||
| Total | $ | ||||
In the first quarter of 2022, as part of the Company's strategy to rationalize assets, the Company sold one business in the East segment, resulting in cash proceeds of $47.8 million and a total gain on disposition of $14.2 million.
As of April 2, 2022, the Company has operations in the East Segment that are classified as assets held for sale. Asset and liabilities held for sale as of April 2, 2022 and January 1, 2022 were as follows:
8
| April 2, 2022 | January 1, 2022 | |||||||||||||
| Cash and cash equivalents | $ | $ | ||||||||||||
| Accounts receivable, net | ||||||||||||||
| Costs and estimated earnings in excess of billings | ||||||||||||||
| Inventories | ||||||||||||||
| Other current assets | ||||||||||||||
| Total current assets held for sale | $ | $ | ||||||||||||
| Property, plant and equipment, net | $ | $ | ||||||||||||
| Goodwill | ||||||||||||||
| Intangible assets, net | ||||||||||||||
| Operating lease right-of-use assets | ||||||||||||||
| Other assets | ||||||||||||||
| Total noncurrent assets held for sale | $ | $ | ||||||||||||
| Accounts payable | $ | $ | ||||||||||||
| Accrued expenses | ||||||||||||||
| Current operating lease liabilities | ||||||||||||||
| Billings in excess of costs and estimated earnings | ||||||||||||||
| Total current liabilities held for sale | $ | $ | ||||||||||||
| Noncurrent operating lease liabilities | $ | $ | ||||||||||||
| Other noncurrent liabilities | ||||||||||||||
| Total noncurrent liabilities held for sale | $ | $ | ||||||||||||
The above stated amounts classified as held for sale have been excluded from the tables shown in Note 2 - Intangible Assets, Note 3 - Accounts Receivable, net, Note 4 - Inventories, Note 5 - Accrued Expenses and Note 11 - Leases.
3.REVENUE RECOGNITION
We derive our revenue predominantly by selling construction materials, products and providing paving and related services. Construction materials consist of aggregates and cement. Products consist of related downstream products, including ready-mix concrete, asphalt paving mix and concrete products. Paving and related service revenue is generated primarily from the asphalt paving services that we provide.
Revenue by product for the three months ended April 2, 2022 and April 3, 2021 is as follows:
| Three months ended | |||||||||||
| April 2, 2022 | April 3, 2021 | ||||||||||
| Revenue by product*: | |||||||||||
| Aggregates | $ | $ | |||||||||
| Cement | |||||||||||
| Ready-mix concrete | |||||||||||
| Asphalt | |||||||||||
| Paving and related services | |||||||||||
| Other | |||||||||||
| Total revenue | $ | $ | |||||||||
*Revenue from liquid asphalt terminals is included in asphalt revenue.
9
| April 2, 2022 | January 1, 2022 | ||||||||||
| Trade accounts receivable | $ | $ | |||||||||
| Construction contract receivables | |||||||||||
| Retention receivables | |||||||||||
| Receivables from related parties | |||||||||||
| Accounts receivable | |||||||||||
| Less: Allowance for doubtful accounts | ( | ( | |||||||||
| Accounts receivable, net | $ | $ | |||||||||
Retention receivables are amounts earned by the Company but held by customers until paving and related service contracts and projects are near completion or fully completed. Amounts are generally billed and collected within one year .
4.INVENTORIES
Inventories consisted of the following as of April 2, 2022 and January 1, 2022:
| April 2, 2022 | January 1, 2022 | ||||||||||
| Aggregate stockpiles | $ | $ | |||||||||
| Finished goods | |||||||||||
| Work in process | |||||||||||
| Raw materials | |||||||||||
| Total | $ | $ | |||||||||
5.ACCRUED EXPENSES
Accrued expenses consisted of the following as of April 2, 2022 and January 1, 2022:
| April 2, 2022 | January 1, 2022 | ||||||||||
| Interest | $ | $ | |||||||||
| Payroll and benefits | |||||||||||
| Finance lease obligations | |||||||||||
| Insurance | |||||||||||
| Non-income taxes | |||||||||||
| Deferred asset purchase payments | |||||||||||
| Professional fees | |||||||||||
| Other (1) | |||||||||||
| Total | $ | $ | |||||||||
(1)Consists primarily of current portion of asset retirement obligations and miscellaneous accruals.
6.DEBT
Debt consisted of the following as of April 2, 2022 and January 1, 2022:
| April 2, 2022 | January 1, 2022 | ||||||||||
| Term Loan, due 2024: | |||||||||||
$ | $ | $ | |||||||||
61⁄2% Senior Notes, due 2027 | |||||||||||
51⁄4% Senior Notes, due 2029 | |||||||||||
| Total | |||||||||||
| Current portion of long-term debt | |||||||||||
| Long-term debt | $ | $ | |||||||||
10
The contractual payments of long-term debt, including current maturities, for the five years subsequent to April 2, 2022, are as follows:
| 2022 (nine months) | $ | ||||
| 2023 | |||||
| 2024 | |||||
| 2025 | |||||
| 2026 | |||||
| 2027 | |||||
| Thereafter | |||||
| Total | |||||
| Less: Original issue net discount | ( | ||||
| Less: Capitalized loan costs | ( | ||||
| Total debt | $ | ||||
Senior Notes— On August 11, 2020, Summit LLC and Summit Finance (together, the “Issuers”) issued $700.0 million in aggregate principal amount of 5.250 % senior notes due January 15, 2029 (the “2029 Notes”). The 2029 Notes were issued at 100.0 % of their par value with proceeds of $690.4 million, net of related fees and expenses. The 2029 Notes were issued under an indenture dated August 11, 2020 (the "2020 Indenture"). The 2020 Indenture contains covenants limiting, among other things, Summit LLC and its restricted subsidiaries’ ability to incur additional indebtedness or issue certain preferred shares, pay dividends, redeem stock or make other distributions, make certain investments, sell or transfer certain assets, create liens, consolidate, merge, sell or otherwise dispose of all or substantially all of its assets, enter into certain transactions with affiliates, and designate subsidiaries as unrestricted subsidiaries. The 2020 Indenture also contains customary events of default. Interest on the 2029 Notes is payable semi-annually on January 15 and July 15 of each year commencing on January 15, 2021.
On March 15, 2019, the Issuers issued $300.0 million in aggregate principal amount of 6.500 % senior notes due March 15, 2027 (the “2027 Notes”). The 2027 Notes were issued at 100.0 % of their par value with proceeds of $296.3 million, net of related fees and expenses. The 2027 Notes were issued under an indenture dated March 25, 2019, the terms of which are generally consistent with the 2020 Indenture. Interest on the 2027 Notes is payable semi-annually on March 15 and September 15 of each year commencing on September 15, 2019.
As of April 2, 2022 and January 1, 2022, the Company was in compliance with all covenants under the applicable indentures.
Senior Secured Credit Facilities— Summit LLC has credit facilities that provide for term loans in an aggregate amount of $650.0 million and revolving credit commitments in an aggregate amount of $345.0 million (the “Senior Secured Credit Facilities”). Under the Senior Secured Credit Facilities, required principal repayments of 0.25 % of the refinanced aggregate amount of term debt are due on the last business day of each March, June, September and December commencing with the March 2018 payment. The unpaid principal balance is due in full on the maturity date, which is November 21, 2024.
The revolving credit facility bears interest per annum equal to, at Summit LLC’s option, either (i) a base rate determined by reference to the highest of (a) the federal funds rate plus 0.50 %, (b) the prime rate of Bank of America, N.A. and (c) LIBOR plus 1.00 %, plus an applicable margin of 2.00 % for base rate loans or (ii) a LIBOR rate determined by reference to Reuters prior to the interest period relevant to such borrowing adjusted for certain additional costs plus an applicable margin of 3.00 % for LIBOR rate loans. The maturity date with respect to revolving credit commitments under the revolving credit facility is February 25, 2024.
There were no 324.6 million remaining as of April 2, 2022, which is net of $20.4 million of outstanding letters of credit. The outstanding letters of credit are renewed annually and support required bonding on construction projects, large leases, workers compensation claims and the Company’s insurance liabilities.
Summit LLC’s Consolidated First Lien Net Leverage Ratio, as such term is defined in the Credit Agreement, should be no greater than 4.75 :1.0 as of each quarter-end. As of April 2, 2022 and January 1, 2022, Summit LLC was in compliance with all financial covenants.
11
Summit LLC’s wholly-owned domestic subsidiary companies, subject to certain exclusions and exceptions, are named as subsidiary guarantors of the Senior Notes and the Senior Secured Credit Facilities. In addition, Summit LLC has pledged substantially all of its assets as collateral, subject to certain exclusions and exceptions, for the Senior Secured Credit Facilities.
The following table presents the activity for the deferred financing fees for the three months ended April 2, 2022 and April 3, 2021:
| Deferred financing fees | |||||
| Balance—January 1, 2022 | $ | ||||
| Amortization | ( | ||||
| Balance—April 2, 2022 | $ | ||||
| Balance—January 2, 2021 | $ | ||||
| Amortization | ( | ||||
| Balance—April 3, 2021 | $ | ||||
Other—On January 15, 2015, the Company’s wholly-owned subsidiary in British Columbia, Canada entered into an agreement with HSBC Bank Canada for a (i) $6.0 million Canadian dollar (“CAD”) revolving credit commitment to be used for operating activities that bears interest per annum equal to the bank’s prime rate plus 0.20 %, (ii) $0.5 million CAD revolving credit commitment to be used for capital equipment that bears interest per annum at the bank’s prime rate plus 0.90 % and (iii) $0.3 million CAD revolving credit commitment to provide guarantees on behalf of that subsidiary. There were no
7.INCOME TAXES
Summit Inc.’s tax provision includes its proportional share of Summit Holdings’ tax attributes. Summit Holdings’ subsidiaries are primarily limited liability companies but do include certain entities organized as C corporations and a Canadian subsidiary. The tax attributes related to the limited liability companies are passed on to Summit Holdings and then to its partners, including Summit Inc. The tax attributes associated with the C corporation and Canadian subsidiaries are fully reflected in the Company’s accounts.
Our income tax benefit was $4.7 million in the three months ended April 2, 2022 and our income tax benefit was $5.4 million in the three months ended April 3, 2021. The effective tax rate for Summit Inc. differs from the federal statutory tax rate primarily due to (1) state taxes, (2) tax depletion expense in excess of the expense recorded under U.S. GAAP, (3) basis differences in assets divested, (4) the minority interest in the Summit Holdings partnership that is allocated outside of the Company and (5) various other items such as limitations on meals and entertainment, certain stock compensation and other costs.
As of April 2, 2022 and January 1, 2022, Summit Inc. had a valuation allowance of $1.7
Tax Receivable Agreement—The Company is party to a TRA with certain current and former holders of LP Units that provides for the payment by Summit Inc. to exchanging holders of LP Units of 85 % of the benefits, if any, that Summit Inc. actually realizes (or, under certain circumstances such as an early termination of the TRA, is deemed to realize) as a result of increases in the tax basis of tangible and intangible assets of Summit Holdings and certain other tax benefits related to entering into the TRA, including tax benefits attributable to payments under the TRA.
In the three months ended April 2, 2022, there were no LP Units acquired by Summit Inc. in exchange for an equal number of newly-issued shares of Summit Inc.’s Class A common stock. As of April 2, 2022 and January 1, 2022, we had recorded $326.5 million and $326.5 million of TRA liability, respectively.
Tax Distributions – The holders of Summit Holdings’ LP Units, including Summit Inc., incur U.S. federal, state and local income taxes on their share of any taxable income of Summit Holdings. The limited partnership agreement of Summit
12
8.EARNINGS PER SHARE
Basic earnings per share is computed by dividing net earnings by the weighted average common shares outstanding and diluted net earnings is computed by dividing net earnings, adjusted for changes in the earnings allocated to Summit Inc. as a result of the assumed conversion of LP Units, by the weighted-average common shares outstanding assuming dilution.
The following table shows the calculation of basic and diluted earnings per share:
| Three months ended | |||||||||||
| April 2, 2022 | April 3, 2021 | ||||||||||
| Net loss attributable to Summit Inc. | $ | ( | $ | ( | |||||||
| Weighted average shares of Class A stock outstanding | |||||||||||
| Add: Nonvested restricted stock awards of retirement eligible shares | |||||||||||
| Weighted average shares outstanding | |||||||||||
| Basic loss per share | $ | ( | $ | ( | |||||||
| Diluted net loss attributable to Summit Inc. | $ | ( | $ | ( | |||||||
| Weighted average shares outstanding | |||||||||||
| Add: weighted average of LP Units | |||||||||||
| Add: stock options | |||||||||||
| Add: warrants | |||||||||||
| Add: restricted stock units | |||||||||||
| Add: performance stock units | |||||||||||
| Weighted average dilutive shares outstanding | |||||||||||
| Diluted loss per share | $ | ( | $ | ( | |||||||
Excluded from the above calculations were the shares noted below as they were antidilutive:
| Three months ended | |||||||||||
| April 2, 2022 | April 3, 2021 | ||||||||||
| Antidilutive shares: | |||||||||||
| LP Units | |||||||||||
| Time-vesting stock options | |||||||||||
| Warrants | |||||||||||
| Time-vesting restricted stock units | |||||||||||
| Market-based restricted stock units | |||||||||||
9.STOCKHOLDERS’ EQUITY
During 2021, certain limited partners of Summit Holdings exchanged their LP Units for shares of Class A common stock of Summit Inc.
In March 2022, our Board of Directors authorized a share repurchase program, whereby we can repurchase up to $250 million of our Class A common stock. During the first quarter of 2022, we repurchased 1.5 million shares of Class A common stock for $47.5 million. These shares were retired upon purchase.
13
| Summit Inc. Shares (Class A) | LP Units | Total | Summit Inc. Ownership Percentage | ||||||||||||||||||||
| Balance — January 1, 2022 | % | ||||||||||||||||||||||
| Stock option exercises | — | ||||||||||||||||||||||
| Repurchases of common stock | ( | — | ( | ||||||||||||||||||||
| Other equity transactions | — | ||||||||||||||||||||||
| Balance — April 2, 2022 | % | ||||||||||||||||||||||
| Balance — January 2, 2021 | % | ||||||||||||||||||||||
| Exchanges during period | ( | ||||||||||||||||||||||
| Stock option exercises | — | ||||||||||||||||||||||
| Other equity transactions | — | ||||||||||||||||||||||
| Balance — April 3, 2021 | % | ||||||||||||||||||||||
Summit Inc. is Summit Holdings’ primary beneficiary and thus consolidates Summit Holdings in its consolidated financial statements with a corresponding noncontrolling interest reclassification, which was 1.1 % and 1.1 % as of April 2, 2022 and January 1, 2022, respectively.
Accumulated other comprehensive income (loss) —The changes in each component of accumulated other comprehensive income (loss) consisted of the following:
| Change in retirement plans | Foreign currency translation adjustments | Accumulated other comprehensive income (loss) | |||||||||||||||
| Balance — January 1, 2022 | $ | $ | $ | ||||||||||||||
| Foreign currency translation adjustment, net of tax | — | ||||||||||||||||
| Balance — April 2, 2022 | $ | $ | $ | ||||||||||||||
| Balance — January 2, 2021 | $ | $ | $ | ||||||||||||||
| Foreign currency translation adjustment, net of tax | — | ||||||||||||||||
| Balance — April 3, 2021 | $ | $ | $ | ||||||||||||||
10.SUPPLEMENTAL CASH FLOW INFORMATION
Supplemental cash flow information is as follows:
| Three months ended | |||||||||||
| April 2, 2022 | April 3, 2021 | ||||||||||
| Cash payments: | |||||||||||
| Interest | $ | $ | |||||||||
| Payments for income taxes, net | |||||||||||
| Operating cash payments on operating leases | |||||||||||
| Operating cash payments on finance leases | |||||||||||
| Finance cash payments on finance leases | |||||||||||
| Non cash financing activities: | |||||||||||
| Right of use assets obtained in exchange for operating lease obligations | $ | $ | |||||||||
| Right of use assets obtained in exchange for finance leases obligations | |||||||||||
| Exchange of LP Units to shares of Class A common stock | |||||||||||
14
11.LEASES
15
| Three months ended | |||||||||||
| April 2, 2022 | April 3, 2021 | ||||||||||
| Operating lease cost | $ | $ | |||||||||
| Variable lease cost | |||||||||||
| Short-term lease cost | |||||||||||
| Financing lease cost: | |||||||||||
| Amortization of right-of-use assets | |||||||||||
| Interest on lease liabilities | |||||||||||
| Total lease cost | $ | $ | |||||||||
| April 2, 2022 | January 1, 2022 | ||||||||||
| Supplemental balance sheet information related to leases: | |||||||||||
| Operating leases: | |||||||||||
| Operating lease right-of-use assets | $ | $ | |||||||||
| Current operating lease liabilities | $ | $ | |||||||||
| Noncurrent operating lease liabilities | |||||||||||
| Total operating lease liabilities | $ | $ | |||||||||
| Finance leases: | |||||||||||
| Property and equipment, gross | $ | $ | |||||||||
| Less accumulated depreciation | ( | ( | |||||||||
| $ | $ | ||||||||||
| Current finance lease liabilities | $ | $ | |||||||||
| Long-term finance lease liabilities | |||||||||||
| Total finance lease liabilities | $ | $ | |||||||||
| Weighted average remaining lease term (years): | |||||||||||
| Operating leases | |||||||||||
| Finance lease | |||||||||||
| Weighted average discount rate: | |||||||||||
| Operating leases | % | % | |||||||||
| Finance leases | % | % | |||||||||
Maturities of lease liabilities, as of April 2, 2022, were as follows: | |||||||||||
| Operating Leases | Finance Leases | ||||||||||
| 2022 (nine months) | $ | $ | |||||||||
| 2023 | |||||||||||
| 2024 | |||||||||||
| 2025 | |||||||||||
| 2026 | |||||||||||
| 2027 | |||||||||||
| Thereafter | |||||||||||
| Total lease payments | |||||||||||
| Less imputed interest | ( | ( | |||||||||
| Present value of lease payments | $ | $ | |||||||||
12.COMMITMENTS AND CONTINGENCIES
The Company is party to certain legal actions arising from the ordinary course of business activities. Accruals are recorded when the outcome is probable and can be reasonably estimated. While the ultimate results of claims and litigation cannot be predicted with certainty, management expects that the ultimate resolution of all current pending or threatened claims and
16
litigation will not have a material effect on the Company’s consolidated financial position, results of operations or liquidity. The Company records legal fees as incurred.
In March 2018, we were notified of an investigation by the Canadian Competition Bureau (the “CCB”) into pricing practices by certain asphalt paving contractors in British Columbia, including Winvan Paving, Ltd. (“Winvan”). We believe the investigation is focused on time periods prior to our April 2017 acquisition of Winvan and we are cooperating with the CCB. Although we currently do not believe this matter will have a material adverse effect on our business, financial condition or results of operations, we are currently not able to predict the ultimate outcome or cost of the investigation.
Environmental Remediation and Site Restoration —The Company’s operations are subject to and affected by federal, state, provincial and local laws and regulations relating to the environment, health and safety and other regulatory matters. These operations require environmental operating permits, which are subject to modification, renewal and revocation. The Company regularly monitors and reviews its operations, procedures and policies for compliance with these laws and regulations. Despite these compliance efforts, risk of environmental liability is inherent in the operation of the Company’s business, as it is with other companies engaged in similar businesses and there can be no assurance that environmental liabilities or noncompliance will not have a material adverse effect on the Company’s consolidated financial condition, results of operations or liquidity.
The Company has asset retirement obligations arising from regulatory and contractual requirements to perform reclamation activities at the time certain quarries and landfills are closed. As of April 2, 2022 and January 1, 2022, $37.0 million and $37.7 million, respectively, were included in other noncurrent liabilities on the consolidated balance sheets and $4.3 million and $7.4 million, respectively, were included in accrued expenses for future reclamation costs. The total undiscounted anticipated costs for site reclamation as of April 2, 2022 and January 1, 2022 were $107.6 million and $112.4 million, respectively.
Other—The Company is obligated under various firm purchase commitments for certain raw materials and services that are in the ordinary course of business. Management does not expect any significant changes in the market value of these goods and services during the commitment period that would have a material adverse effect on the financial condition, results of operations and cash flows of the Company. The terms of the purchase commitments generally approximate one year .
13.FAIR VALUE
Fair Value Measurements—Certain acquisitions made by the Company require the payment of contingent amounts of purchase consideration. These payments are contingent on specified operating results being achieved in periods subsequent to the acquisition and will only be made if earn-out thresholds are achieved. Contingent consideration obligations are measured at fair value each reporting period. Any adjustments to fair value are recognized in earnings in the period identified.
The fair value of contingent consideration as of April 2, 2022 and January 1, 2022 was:
| April 2, 2022 | January 1, 2022 | ||||||||||
| Current portion of acquisition-related liabilities and Accrued expenses: | |||||||||||
| Contingent consideration | $ | $ | |||||||||
| Acquisition-related liabilities and Other noncurrent liabilities: | |||||||||||
| Contingent consideration | $ | $ | |||||||||
The fair value of contingent consideration was based on unobservable, or Level 3, inputs, including projected probability-weighted cash payments and a 9.5 % discount rate, which reflects a market discount rate. Changes in fair value may occur as a result of a change in actual or projected cash payments, the probability weightings applied by the Company to projected payments or a change in the discount rate. Significant increases or decreases in any of these inputs in isolation could result in a lower, or higher, fair value measurement. There were no
Financial Instruments—The Company’s financial instruments include debt and certain acquisition-related liabilities (deferred consideration and noncompete obligations). The carrying value and fair value of these financial instruments as of April 2, 2022 and January 1, 2022 was:
17
| April 2, 2022 | January 1, 2022 | ||||||||||||||||||||||
| Fair Value | Carrying Value | Fair Value | Carrying Value | ||||||||||||||||||||
| Level 1 | |||||||||||||||||||||||
| Long-term debt(1) | $ | $ | $ | $ | |||||||||||||||||||
| Level 3 | |||||||||||||||||||||||
| Current portion of deferred consideration and noncompete obligations(2) | |||||||||||||||||||||||
| Long term portion of deferred consideration and noncompete obligations(3) | |||||||||||||||||||||||
(1)$6.4
(2)Included in current portion of acquisition-related liabilities on the consolidated balance sheets.
(3)Included in acquisition-related liabilities on the consolidated balance sheets.
The fair value of debt was determined based on observable, or Level 2, inputs, such as interest rates, bond yields and quoted prices in inactive markets. The fair values of the deferred consideration and noncompete obligations were determined based on unobservable, or Level 3, inputs, including the cash payment terms in the purchase agreements and a discount rate reflecting the Company’s credit risk. The discount rate used is generally consistent with that used when the obligations were initially recorded.
Securities with a maturity of three months or less are considered cash equivalents and the fair value of these assets approximates their carrying value.
14.SEGMENT INFORMATION
The Company has three
The operating results of each segment are regularly reviewed and evaluated by the Chief Executive Officer, our Company’s Chief Operating Decision Maker (“CODM”). The CODM primarily evaluates the performance of the Company’s segments and allocates resources to them based on a segment profit metric that we call Adjusted EBITDA, which is computed as earnings from operations before interest, taxes, depreciation, depletion, amortization, accretion, and share-based compensation, as well as various other non-recurring, non-cash amounts. Beginning with the first quarter of 2021, the Company no longer adjusts for transaction costs, as those costs are recurring cash payments, and are included in general and administrative expenses.
The West and East segments have several subsidiaries that are engaged in various activities including quarry mining, aggregate production and contracting. The Cement segment is engaged in the production of Portland cement. Assets employed by each segment include assets directly identified with those operations. Corporate assets consist primarily of cash, property, plant and equipment for corporate operations and other assets not directly identifiable with a reportable business segment. The accounting policies applicable to each segment are consistent with those used in the consolidated financial statements.
The following tables display selected financial data for the Company’s reportable business segments as of April 2, 2022 and January 1, 2022 and for the three months ended April 2, 2022 and April 3, 2021:
| Three months ended | |||||||||||
| April 2, 2022 | April 3, 2021 | ||||||||||
| Revenue*: | |||||||||||
| West | $ | $ | |||||||||
| East | |||||||||||
| Cement | |||||||||||
| Total revenue | $ | $ | |||||||||
*Intercompany sales are immaterial and the presentation above only reflects sales to external customers.
18
| Three months ended | |||||||||||
| April 2, 2022 | April 3, 2021 | ||||||||||
| Loss from operations before taxes | $ | ( | $ | ( | |||||||
| Interest expense | |||||||||||
| Depreciation, depletion and amortization | |||||||||||
| Accretion | |||||||||||
| Gain on sale of businesses | ( | ( | |||||||||
| Non-cash compensation | |||||||||||
| Other | |||||||||||
| Total Adjusted EBITDA | $ | $ | |||||||||
| Total Adjusted EBITDA by Segment: | |||||||||||
| West | $ | $ | |||||||||
| East | |||||||||||
| Cement | ( | ||||||||||
| Corporate and other | ( | ( | |||||||||
| Total Adjusted EBITDA | $ | $ | |||||||||
| Three months ended | |||||||||||
| April 2, 2022 | April 3, 2021 | ||||||||||
| Purchases of property, plant and equipment | |||||||||||
| West | $ | $ | |||||||||
| East | |||||||||||
| Cement | |||||||||||
| Total reportable segments | |||||||||||
| Corporate and other | |||||||||||
| Total purchases of property, plant and equipment | $ | $ | |||||||||
| Three months ended | |||||||||||
| April 2, 2022 | April 3, 2021 | ||||||||||
| Depreciation, depletion, amortization and accretion: | |||||||||||
| West | $ | $ | |||||||||
| East | |||||||||||
| Cement | |||||||||||
| Total reportable segments | |||||||||||
| Corporate and other | |||||||||||
| Total depreciation, depletion, amortization and accretion | $ | $ | |||||||||
| April 2, 2022 | January 1, 2022 | ||||||||||
| Total assets: | |||||||||||
| West | $ | $ | |||||||||
| East | |||||||||||
| Cement | |||||||||||
| Total reportable segments | |||||||||||
| Corporate and other | |||||||||||
| Total | $ | $ | |||||||||
19
SUMMIT MATERIALS, LLC AND SUBSIDIARIES
UNAUDITED CONSOLIDATED FINANCIAL STATEMENTS
The unaudited consolidated financial statements and notes thereto for Summit Materials, LLC and subsidiaries are included as Exhibit 99.1 to this Quarterly Report on Form 10-Q and are incorporated by reference herein.
ITEM 2. MANAGEMENT’S DISCUSSION AND ANALYSIS OF FINANCIAL CONDITION AND RESULTS OF OPERATIONS
This Management’s Discussion and Analysis of Financial Condition and Results of Operations is intended to assist in understanding and assessing the trends and significant changes in our results of operations and financial condition. Historical results may not be indicative of future performance. Forward-looking statements reflect our current views about future events, are based on assumptions and are subject to known and unknown risks and uncertainties that could cause actual results to differ materially from those contemplated by these statements. Factors that may cause differences between actual results and those contemplated by forward-looking statements include, but are not limited to, those discussed in the section entitled “Risk Factors” in the Annual Report, and factors discussed in the section entitled “Cautionary Note Regarding Forward-Looking Statements.” This Management’s Discussion and Analysis of Financial Condition and Results of Operations should be read in conjunction with our consolidated interim financial statements and the related notes and other information included in this report.
Overview
Summit’s vision is to be the most socially responsible, integrated construction materials solution provider, collaborating with stakeholders to deliver differentiated innovations and solve our customers’ challenges. Within our markets, we strive to be a market leader by offering customers a single-source provider for construction materials and related downstream products through our vertical integration. Our materials include aggregates, which we supply across the United States, and in British Columbia, Canada, and cement, which we supply to surrounding states along the Mississippi River from Minnesota to Louisiana. In addition to supplying aggregates to customers, we use a portion of our materials internally to produce ready-mix concrete and asphalt paving mix, which may be sold externally or used in our paving and related services businesses. Our vertical integration creates opportunities to increase aggregates volumes, optimize margin at each stage of production and provide customers with efficiency gains, convenience and reliability, which we believe gives us a competitive advantage.
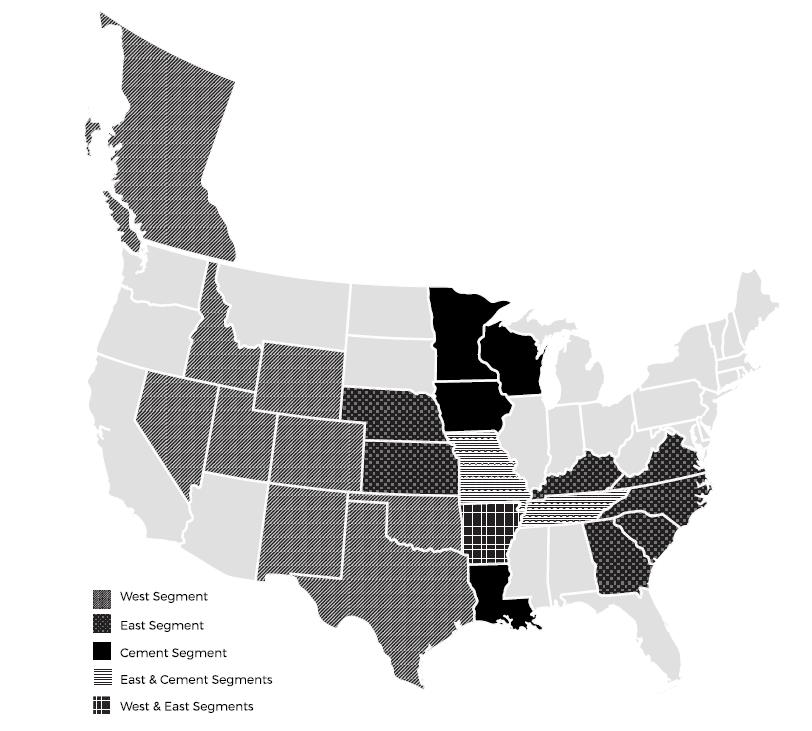
We are organized into 11 operating companies that make up our three distinct operating segments: West, East and Cement, which are also our reporting segments. We operate in 21 U.S. states and in British Columbia, Canada and currently have assets in 21 U.S. states and in British Columbia, Canada. As of April 2, 2022, the Company has operations in the East Segment that are classified as assets held for sale. The map below illustrates our geographic footprint.
20
Business Trends and Conditions
The U.S. construction materials industry is composed of four primary sectors: aggregates; cement; ready-mix concrete; and asphalt paving mix. Each of these materials is widely used in most forms of construction activity. Participants in these sectors typically range from small, privately-held companies focused on a single material, product or market to publicly traded multinational corporations that offer a wide array of construction materials and services. Competition is constrained in part by the distance materials can be transported efficiently, resulting in predominantly local or regional operations. Due to the lack of product differentiation, competition for all of our products is predominantly based on price and, to a lesser extent, quality of products and service. As a result, the prices we charge our customers are not likely to be materially different from the prices charged by other producers in the same markets. Accordingly, our profitability is generally dependent on the level of demand for our materials and products and our ability to control operating costs. We continue to monitor supply chain issues, as well as inflationary pressures on our raw material inputs as well as labor costs.
Our revenue is derived from multiple end-use markets including public infrastructure construction and private residential and nonresidential construction. Public infrastructure includes spending by federal, state, provincial and local governments for roads, highways, bridges, airports and other infrastructure projects. Public infrastructure projects have historically been a relatively stable portion of state and federal budgets. Residential and nonresidential construction consists of new construction and repair and remodel markets. Any economic stagnation or decline, which could vary by local region and market, could affect our results of operations. Our sales and earnings are sensitive to national, regional and local economic conditions and particularly to cyclical changes in construction spending, especially in the private sector. From a macroeconomic view, we continue to see positive indicators for highway obligations. While rising interest rates and inflation have not yet
21
impacted housing starts, we are monitoring that activity closely. Rising interest rates and inflation may also impact our non-residential construction activity in the future.
Transportation infrastructure projects, driven by both federal and state funding programs, represent a significant share of the U.S. construction materials market. Federal funds are allocated to the states, which are required to match a portion of the federal funds they receive. Federal highway spending uses funds predominantly from the Federal Highway Trust Fund, which derives its revenue from taxes on diesel fuel, gasoline and other user fees. The dependability of federal funding allows state departments of transportation to plan for their long-term highway construction and maintenance needs. The Infrastructure Investment and Jobs Act ("IIJA") was signed into law on November 15, 2021. The IIJA provides $1.2 trillion in funding over five years from 2022 through 2026, including $550 billion in new investments for all modes of transportation, water, power and energy, environment remediation, public lands, broadband and resilience.
In 2021, approximately 64% of our revenue was derived from the private construction market, and the remaining revenue from the public markets. We believe residential activity in our key markets will continue to be a driver for volumes in future periods. Funding for public infrastructure projects as been announced as a high priority for the federal government in 2021, but no action has been taken to date.
In addition to federal funding, state, county and local agencies provide highway construction and maintenance funding. Our four largest states by revenue, Texas, Utah, Kansas and Missouri, represented approximately 23%, 15%, 12% and 9%, respectively, of our total revenue in 2021. The following is a summary of key funding initiatives in those states:
•The Texas Department of Transportation (“TXDOT”) updated its fiscal year 2022 lettings estimate to $10.0 billion up from $8.4 billion in fiscal year 2021 and $7.5 billion in fiscal year 2020. Longer term, TXDOT has indicated a target of $8 billion per year in total state and local lettings.
•The state of Utah anticipates transportation funding of approximately $1.8 billion in 2022.
•The state of Kansas anticipates approximately $2.2 billion for 2022 for transportation funding.
•The state of Missouri anticipates transportation funding of approximately $3.2 billion in 2022.
Use and consumption of our products fluctuate due to seasonality. Nearly all of the products used by us, and by our customers, in the private construction and public infrastructure industries are used outdoors. Our highway operations and production and distribution facilities are also located outdoors. Therefore, seasonal changes and other weather-related conditions, in particular extended rainy and cold weather in the spring and fall, as well as major weather events such as hurricanes, tornadoes, tropical storms, heavy snows and flooding, can adversely affect our business and operations through a decline in both the use of our products and demand for our services. In addition, construction materials production and shipment levels follow activity in the construction industry, which typically occurs in the spring, summer and fall. Warmer and drier weather during the second and third quarters of our fiscal year typically result in higher activity and revenue levels during those quarters. The first quarter of our fiscal year typically has lower levels of activity due to weather conditions, and the third quarter of our fiscal year typically has the highest levels of activity.
We are subject to commodity price risk with respect to price changes in liquid asphalt and energy, including fossil fuels and electricity for aggregates, cement, ready-mix concrete and asphalt paving mix production, natural gas for hot mix asphalt production and diesel fuel for distribution vehicles and production related mobile equipment. Liquid asphalt escalator provisions in most of our private and commercial contracts limit our exposure to price fluctuations in this commodity. We often obtain similar escalators on public infrastructure contracts. In addition, we enter into various firm purchase commitments, with terms generally less than one year, for certain raw materials, including diesel fuel.
Backlog
Our products are generally delivered upon receipt of orders or requests from customers, or shortly thereafter. Accordingly, the backlog associated with product sales is converted into revenue within a relatively short period of time. Inventory for products is generally maintained in sufficient quantities to meet rapid delivery requirements of customers. Therefore, a period-over-period increase or decrease of backlog does not necessarily result in an improvement or a deterioration of our business. Our backlog includes only those products and projects for which we have obtained a purchase order or a signed contract with the customer and does not include products purchased and sold or services awarded and provided within the period.
22
Financial Highlights
The principal factors in evaluating our financial condition and operating results as of and for the three months ended April 2, 2022 as compared to the three months ended April 3, 2021, and certain other highlights include:
•Net revenue decreased $6.0 million in the three months ended April 2, 2022, primarily resulting from divestitures completed in 2021, partially offset by increases in average sales prices.
•Our operating loss increased $9.2 million in the three months ended April 2, 2022, as increases in our cost structure and higher repair and maintenance costs exceeded the increases in average sales prices, mitigated by a decrease in depreciation, depletion, amortization and accretion expenses.
•In the three months ended April 2, 2022, average sales price increased 4.8% in aggregates, 10.1% in cement, 7.3% in ready-mix concrete and 10.2% in asphalt.
•In the three months ended April 2, 2022, sales volume decreased 0.8% in aggregates, 7.2% in ready-mix concrete and 45.1% in asphalt, offset by a 0.3% increase in cement.
•In the three months ended April 2, 2022, the Company sold one business in the East segment, resulting in cash proceeds of $47.8 million and a total gain on disposition of $14.2 million.
•In March 2022, the Company repurchased $47.5 million of our Class A common stock.
Results of Operations
The following discussion of our results of operations is focused on the key financial measures we use to evaluate the performance of our business from both a consolidated and operating segment perspective. Operating income and margins are discussed in terms of changes in volume, pricing and mix of revenue source (i.e., type of product, sales or service revenue). We focus on operating margin, which we define as operating income as a percentage of net revenue, as a key metric when assessing the performance of the business, as we believe that analyzing changes in costs in relation to changes in revenue provides more meaningful insight into the results of operations than examining costs in isolation.
Operating income reflects our profit from operations after taking into consideration cost of revenue, general and administrative expenses, depreciation, depletion, amortization and accretion and gain on sale of property, plant and equipment. Cost of revenue generally increases ratably with revenue, as labor, transportation costs and subcontractor costs are recorded in cost of revenue. As organic volumes increase, we expect our general and administrative costs as a percentage of revenue to decrease. General and administrative expenses as a percentage of revenue vary throughout the year due to the seasonality of our business.
Consolidated Results of Operations
The table below sets forth our consolidated results of operations for the three months ended April 2, 2022 and April 3, 2021.
| Three months ended | |||||||||||
| April 2, 2022 | April 3, 2021 | ||||||||||
| ($ in thousands) | |||||||||||
| Net revenue | $ | 392,495 | $ | 398,481 | |||||||
| Delivery and subcontract revenue | 28,452 | 29,363 | |||||||||
| Total revenue | 420,947 | 427,844 | |||||||||
| Cost of revenue (excluding items shown separately below) | 353,380 | 346,694 | |||||||||
| General and administrative expenses | 51,924 | 51,642 | |||||||||
| Depreciation, depletion, amortization and accretion | 51,193 | 56,336 | |||||||||
| Gain on sale of property, plant and equipment | (1,255) | (1,769) | |||||||||
| Operating loss | (34,295) | (25,059) | |||||||||
| Interest expense | 20,149 | 24,186 | |||||||||
| Gain on sale of businesses | (14,205) | (15,668) | |||||||||
| Other income, net | (696) | (4,889) | |||||||||
| Loss from operations before taxes | (39,543) | (28,688) | |||||||||
| Income tax benefit | (4,743) | (5,443) | |||||||||
| Net loss | $ | (34,800) | $ | (23,245) | |||||||
23
Three months ended April 2, 2022 compared to the three months ended April 3, 2021
| Three months ended | |||||||||||||||||||||||
| ($ in thousands) | April 2, 2022 | April 3, 2021 | Variance | ||||||||||||||||||||
| Net revenue | $ | 392,495 | $ | 398,481 | $ | (5,986) | (1.5) | % | |||||||||||||||
| Operating loss | (34,295) | (25,059) | (9,236) | (36.9) | % | ||||||||||||||||||
| Operating margin percentage | (8.7) | % | (6.3) | % | |||||||||||||||||||
| Adjusted EBITDA (1) | $ | 23,263 | $ | 41,734 | $ | (18,471) | (44.3) | % | |||||||||||||||
| Adjusted EBITDA Margin (1) | 5.9 | % | 10.5 | % | |||||||||||||||||||
(1)Adjusted EBITDA and Adjusted EBITDA Margin are non-GAAP measures that we find helpful in monitoring the performance of our business. See "Non-GAAP Performance Measures" below for a reconciliation of Adjusted EBITDA to net income, which is the most directly comparable GAAP measure.
Net revenue decreased $6.0 million in the three months ended April 2, 2022, primarily resulting from organic volume decline in our ready-mix concrete and asphalt operations due to our divestiture program. Of the decrease in net revenue, $9.0 million was from decreased sales of products and $7.4 million from decreased service revenue, partially offset by $10.4 million from increased sales of materials. Our organic volumes declined 1.5%, 7.2% and 45.1% in aggregates, ready-mix concrete and asphalt, respectively, offset by a 0.3% increase in cement. The organic volume decreases for aggregates, ready-mix and asphalt were primarily attributable to our divestiture program. We had organic price growth in our aggregate, cement, ready-mix and asphalt lines of business of 5.0%, 10.1%, 7.3% and 10.2%, respectively, during the first three months of 2022.
Operating loss increased by $9.2 million in the first three months of 2022 as compared to the first three months of 2021, primarily as increases in our cost structure exceeded the increases in average sales prices, as well as the timing of repair and maintenance expenditures and certain stripping activities, unplanned downtime at a few of our locations, mitigated by a decrease of $5.1 million in depreciation, depletion, amortization and accretion expense primarily due to divestitures completed in 2021.
Our operating margin percentage for the three months ended April 2, 2022 decreased from (6.3)% to (8.7)%, from the comparable period a year ago, due to the factors noted above. Adjusted EBITDA, as defined in "Non-GAAP Performance Measures" below, decreased $18.5 million in the three months ended April 2, 2022, due to the factors noted above.
As a vertically-integrated company, we include intercompany sales from materials to products and from products to services when assessing the operating results of our business. We refer to revenue inclusive of intercompany sales as gross revenue. These intercompany transactions are eliminated in the consolidated financial statements. Gross revenue by product was as follows:
| Three months ended | |||||||||||||||||||||||
| ($ in thousands) | April 2, 2022 | April 3, 2021 | Variance | ||||||||||||||||||||
| Revenue by product*: | |||||||||||||||||||||||
| Aggregates | $ | 149,426 | $ | 143,794 | $ | 5,632 | 3.9 | % | |||||||||||||||
| Cement | 43,806 | 39,703 | 4,103 | 10.3 | % | ||||||||||||||||||
| Ready-mix concrete | 157,602 | 158,336 | (734) | (0.5) | % | ||||||||||||||||||
| Asphalt | 17,501 | 31,225 | (13,724) | (44.0) | % | ||||||||||||||||||
| Paving and related services | 40,337 | 61,808 | (21,471) | (34.7) | % | ||||||||||||||||||
| Other | 12,275 | (7,022) | 19,297 | 274.8 | % | ||||||||||||||||||
| Total revenue | $ | 420,947 | $ | 427,844 | $ | (6,897) | (1.6) | % | |||||||||||||||
*Revenue by product includes intercompany and intracompany sales transferred at market value. The elimination of intracompany transactions is included in Other. Revenue from the liquid asphalt terminals is included in asphalt revenue.
Detail of our volumes and average selling prices by product in the three months ended April 2, 2022 and April 3, 2021 were as follows:
24
| Three months ended | |||||||||||||||||||||||||||||||||||
| April 2, 2022 | April 3, 2021 | ||||||||||||||||||||||||||||||||||
| Volume(1) | Volume(1) | Percentage Change in | |||||||||||||||||||||||||||||||||
| (in thousands) | Pricing(2) | (in thousands) | Pricing(2) | Volume | Pricing | ||||||||||||||||||||||||||||||
| Aggregates | 13,402 | $ | 11.15 | 13,509 | $ | 10.64 | (0.8) | % | 4.8 | % | |||||||||||||||||||||||||
| Cement | 341 | 128.42 | 340 | 116.69 | 0.3 | % | 10.1 | % | |||||||||||||||||||||||||||
| Ready-mix concrete | 1,241 | 127.00 | 1,338 | 118.31 | (7.2) | % | 7.3 | % | |||||||||||||||||||||||||||
| Asphalt | 260 | 66.15 | 474 | 60.01 | (45.1) | % | 10.2 | % | |||||||||||||||||||||||||||
(1)Volumes are shown in tons for aggregates, cement and asphalt and in cubic yards for ready-mix concrete.
(2)Pricing is shown on a per ton basis for aggregates, cement and asphalt and on a per cubic yard basis for ready-mix concrete.
Revenue from aggregates increased $5.6 million in the three months ended April 2, 2022. In the first three months of 2022, we had solid increases in organic aggregate volumes in most of our markets, which were offset by volume decreases in certain markets due to divestitures in 2021. Aggregate average sales price of $11.15 per ton increased 4.8% in the first three months of 2022 as compared to the first three months of 2021, due to our focus on increasing prices in the current inflationary environment. We have continued, and expect to continue increasing prices to stay ahead of inflationary pressures.
Revenue from cement increased $4.1 million in the three months ended April 2, 2022. In the three months ended April 2, 2022, organic cement volumes increased 0.3% and organic cement average sales prices increased 10.1%, as compared to the same period in the prior year.
Revenue from ready-mix concrete decreased $0.7 million in the three months ended April 2, 2022. In the three months ended April 2, 2022, our ready-mix volumes decreased 7.2% and our average sales prices increased 7.3%. In the three months ended April 2, 2022, our volume decrease occurred primarily in our Kansas and north Texas markets due to weather, while our price increases were in all of our markets.
Revenue from asphalt decreased $13.7 million in the three months ended April 2, 2022, primarily due to the divestiture of our paving business in Texas in May 2021. In the first three months of 2022, organic pricing increased 10.2%, with strong pricing gains in the Virginia and Intermountain West geographies. In the first three months of 2022, organic volumes decreased 45.1% mainly due to the divestiture noted above.
Other Financial Information
Interest expense
In September 2021, we redeemed all $300.0 million 5.125% Senior Notes due 2025 using existing cash on hand. As a result, interest expense in the three months ended April 2, 2022 is less than it was in the first three months of 2021.
Gain (Loss) on Sale of business
We continue to make progress on our strategy to divest certain businesses through portfolio optimization. In the first three months of 2022, as well as in the first three months of 2021, we sold one business in the East segment in each year, resulting in cash proceeds of $47.8 million and a net gain on disposition of $14.2 million in 2022, and cash proceeds of $33.1 million and a net gain on disposition of $15.7 million in 2021.
Income Tax Expense
Our income tax benefit was $4.7 million in the three months ended April 2, 2022 and our income tax benefit was $5.4 million in the three months ended April 3, 2021. The effective tax rate for Summit Inc. differs from the federal statutory tax rate primarily due to (1) state taxes, (2) tax depletion expense in excess of the expense recorded under U.S. GAAP, (3) basis differences in assets divested, (4) the minority interest in the Summit Holdings partnership that is allocated outside of the Company and (5) various other items such as limitations on meals and entertainment, certain stock compensation and other costs.
25
The ultimate realization of deferred tax assets is dependent upon the generation of future taxable income during the periods in which those temporary differences become deductible, as well as consideration of tax-planning strategies we may seek to utilize net operating loss carryforwards that begin to expire in 2030.
As of April 2, 2022 and January 1, 2022, Summit Inc. had a valuation allowance of $1.7 million, which relates to certain deferred tax assets in taxable entities where realization is not more likely than not.
Segment results of operations
West Segment
| Three months ended | |||||||||||||||||||||||
| ($ in thousands) | April 2, 2022 | April 3, 2021 | Variance | ||||||||||||||||||||
| Net revenue | $ | 236,002 | $ | 234,744 | $ | 1,258 | 0.5 | % | |||||||||||||||
| Operating income | 7,992 | 15,057 | (7,065) | (46.9) | % | ||||||||||||||||||
| Operating margin percentage | 3.4 | % | 6.4 | % | |||||||||||||||||||
| Adjusted EBITDA (1) | $ | 32,692 | $ | 40,648 | $ | (7,956) | (19.6) | % | |||||||||||||||
| Adjusted EBITDA Margin (1) | 13.9 | % | 17.3 | % | |||||||||||||||||||
(1)Adjusted EBITDA and Adjusted EBITDA Margin are non-GAAP measures that we find helpful in monitoring the performance of our business. See "Non-GAAP Performance Measures" below for a reconciliation of Adjusted EBITDA to net income, which is the most directly comparable GAAP measure.
Net revenue in the West segment increased $1.3 million in the three months ended April 2, 2022, as increases in net revenues in aggregates and ready-mix concrete outpaced a decrease in asphalt and paving revenues due to a divestiture in the second quarter of 2021. Organic aggregate volumes increased 3.9% in the first three months of 2022 as compared to the first three months of 2021, and organic aggregates average sales prices increased 3.7%, primarily due to strong demand in our Texas, as well as in our Intermountain West geography and increased projects in British Columbia. Organic ready-mix concrete volumes decreased 0.9% and our organic ready-mix concrete average sales prices increased 7.0%. Organic ready-mix volumes were strong in 2022 in south Texas which were offset by slightly lower volumes in the Intermountain Region. Residential construction activity remains strong, particularly in the Houston and Salt Lake City areas, two of our largest metro areas where we operate. We continue to monitor that activity given recent increases in mortgage rates and other inflationary concerns.
The West segment’s operating income decreased $7.1 million in the three months ended April 2, 2022. Adjusted EBITDA decreased $8.0 million and Adjusted EBITDA Margin decreased to 13.9% from 17.3% in the three months ended April 2, 2022. The decreases in operating income and Adjusted EBITDA for the first quarter of 2022 occurred primarily due to higher sub-contractor costs, as well as increased repair and maintenance and fuel costs. The operating margin percentage in the West segment decreased in the three months ended April 2, 2022 due to the aggregate product mix in Texas as well as the other factors noted above.
Gross revenue by product/ service was as follows:
| Three months ended | |||||||||||||||||||||||
| ($ in thousands) | April 2, 2022 | April 3, 2021 | Variance | ||||||||||||||||||||
| Revenue by product*: | |||||||||||||||||||||||
| Aggregates | $ | 77,782 | $ | 72,138 | $ | 5,644 | 7.8 | % | |||||||||||||||
| Ready-mix concrete | 134,591 | 126,986 | 7,605 | 6.0 | % | ||||||||||||||||||
| Asphalt | 13,600 | 27,688 | (14,088) | (50.9) | % | ||||||||||||||||||
| Paving and related services | 32,503 | 46,889 | (14,386) | (30.7) | % | ||||||||||||||||||
| Other | (6,244) | (22,568) | 16,324 | 72.3 | % | ||||||||||||||||||
| Total revenue | $ | 252,232 | $ | 251,133 | $ | 1,099 | 0.4 | % | |||||||||||||||
*Revenue by product includes intercompany and intracompany sales transferred at market value. The elimination of intracompany transactions is included in “Other.” Revenue from the liquid asphalt terminals is included in asphalt revenue.
The West segment’s percent changes in sales volumes and pricing in the three months ended April 2, 2022 from the three months ended April 3, 2021 were as follows:
26
| Three months ended | |||||||||||
| Percentage Change in | |||||||||||
| Volume | Pricing | ||||||||||
| Aggregates | 3.9 | % | 3.7 | % | |||||||
| Ready-mix concrete | (0.9) | % | 7.0 | % | |||||||
| Asphalt | (50.7) | % | 10.3 | % | |||||||
Revenue from aggregates in the West segment increased $5.6 million in the three months ended April 2, 2022, due to an increase in aggregates sales volumes and prices. In the three months ended April 2, 2022, aggregate volumes increased 3.9%, primarily due to strong volumes in Texas as well as in the Intermountain West markets. Aggregates pricing for the three months ended April 2, 2022 increased 3.7% when compared to the same period in 2021 due to prices increases in all our markets.
Revenue from ready-mix concrete in the West segment increased $7.6 million in the three months ended April 2, 2022. For the three months ended April 2, 2022, organic ready-mix concrete prices increased 7.0%. For the three months ended April 2, 2022, our ready-mix concrete organic volumes decreased 0.9% as strong volume increases in south Texas were offset by declines in the Intermountain West geographies.
In May 2021, we divested our paving business in South Texas, which reduced our volumes and revenues subsequent to the closing date. Revenue from asphalt in the West segment decreased $14.1 million in the three months ended April 2, 2022. For the three months ended April 2, 2022, asphalt volumes decreased 50.7%. Average sales prices for asphalt increased 10.3% in the three months ended April 2, 2022. Revenue for paving and related services in the West segment decreased by $14.4 million in the three months ended April 2, 2022.
Prior to eliminations of intercompany transactions, the net effect of volume and pricing changes on gross revenue in the three months ended April 2, 2022 was approximately $(2.9) million and $3.8 million, respectively.
East Segment
| Three months ended | |||||||||||||||||||||||
| ($ in thousands) | April 2, 2022 | April 3, 2021 | Variance | ||||||||||||||||||||
| Net revenue | $ | 110,268 | $ | 123,068 | $ | (12,800) | (10.4) | % | |||||||||||||||
| Operating loss | (10,727) | (10,374) | (353) | (3.4) | % | ||||||||||||||||||
| Operating margin percentage | (9.7) | % | (8.4) | % | |||||||||||||||||||
| Adjusted EBITDA (1) | $ | 8,136 | $ | 11,745 | $ | (3,609) | (30.7) | % | |||||||||||||||
| Adjusted EBITDA Margin (1) | 7.4 | % | 9.5 | % | |||||||||||||||||||
(1)Adjusted EBITDA and Adjusted EBITDA Margin are non-GAAP measures that we find helpful in monitoring the performance of our business. See "Non-GAAP Performance Measures" below for a reconciliation of Adjusted EBITDA to net income, which is the most directly comparable GAAP measure.
Net revenue in the East segment decreased $12.8 million in the three months ended April 2, 2022, as compared to the same period a year ago, as the decreases in ready-mix concrete and paving and related services exceeded an increase in asphalt revenues. Operating loss increased $0.4 million in the three months ended April 2, 2022, as increases in our cost of revenue exceeded our increases in average sales prices. Adjusted EBITDA decreased $3.6 million in the three months ended April 2, 2022 and Adjusted EBITDA Margin decreased to 7.4% from 9.5% in the three months ended April 2, 2022, as compared to the same period a year ago.
Operating margin percentage for the three months ended April 2, 2022 decreased to (9.7)% from (8.4)%, from the comparable period a year ago, due to the items noted above.
Gross revenue by product/ service was as follows:
27
| Three months ended | |||||||||||||||||||||||
| ($ in thousands) | April 2, 2022 | April 3, 2021 | Variance | ||||||||||||||||||||
| Revenue by product*: | |||||||||||||||||||||||
| Aggregates | $ | 71,644 | $ | 71,656 | $ | (12) | — | % | |||||||||||||||
| Ready-mix concrete | 23,011 | 31,350 | (8,339) | (26.6) | % | ||||||||||||||||||
| Asphalt | 3,901 | 3,537 | 364 | 10.3 | % | ||||||||||||||||||
| Paving and related services | 7,834 | 14,919 | (7,085) | (47.5) | % | ||||||||||||||||||
| Other | 16,100 | 14,580 | 1,520 | 10.4 | % | ||||||||||||||||||
| Total revenue | $ | 122,490 | $ | 136,042 | $ | (13,552) | (10.0) | % | |||||||||||||||
*Revenue by product includes intercompany and intracompany sales transferred at market value. The elimination of intracompany transactions is included in Other. Revenue from the liquid asphalt terminals is included in asphalt revenue.
The East segment’s percent changes in sales volumes and pricing in the three months ended April 2, 2022 from the three months ended April 3, 2021 were as follows:
| Three months ended | |||||||||||
| Percentage Change in | |||||||||||
| Volume | Pricing | ||||||||||
| Aggregates | (6.5) | % | 7.0 | % | |||||||
| Ready-mix concrete | (32.5) | % | 8.9 | % | |||||||
| Asphalt | (8.1) | % | 14.5 | % | |||||||
Revenue from aggregates in the East segment remained flat in the three months ended April 2, 2022 as compared to the same period a year ago. Aggregate volumes in the first three months of 2022 decreased 6.5% primarily due to our divestiture program, partially offset by organic growth in our Georgia operations. Aggregates organic pricing increased 7.7% in the three months ended April 2, 2022, as compared to the same period a year ago.
Revenue from ready-mix concrete in the East segment decreased $8.3 million in the three months ended April 2, 2022, as compared to the same period in 2021, as our realized price increases of 8.9% were not enough to overcome a 32.5% volume decrease primarily due to divestitures and lower volumes in Kansas impacted by weather conditions.
Revenue from asphalt increased $0.4 million in the three months ended April 2, 2022, when compared to the same period in 2021. The increase was mainly attributable to higher volumes in Kentucky. Asphalt pricing increased 14.5% in the three months ended April 2, 2022, due to product mix and asphalt mix design. Paving and related service revenue decreased $7.1 million in the three months ended April 2, 2022, primarily due to the items noted above.
Prior to eliminations of intercompany transactions, the net effect of volume and pricing changes on gross revenue in the three months ended April 2, 2022 was approximately $(17.6) million and $9.6 million, respectively.
Cement Segment
| Three months ended | |||||||||||||||||||||||
| ($ in thousands) | April 2, 2022 | April 3, 2021 | Variance | ||||||||||||||||||||
| Net revenue | $ | 46,225 | $ | 40,669 | $ | 5,556 | 13.7 | % | |||||||||||||||
| Operating loss | (13,506) | (10,046) | (3,460) | (34.4) | % | ||||||||||||||||||
| Operating margin percentage | (29.2) | % | (24.7) | % | |||||||||||||||||||
| Adjusted EBITDA (1) | $ | (5,819) | $ | 2,499 | $ | (8,318) | (332.9) | % | |||||||||||||||
| Adjusted EBITDA Margin (1) | (12.6) | % | 6.1 | % | |||||||||||||||||||
(1)Adjusted EBITDA and Adjusted EBITDA Margin are non-GAAP measures that we find helpful in monitoring the performance of our business. See "Non-GAAP Performance Measures" below for a reconciliation of Adjusted EBITDA to net income, which is the most directly comparable GAAP measure.
Net revenue in the Cement segment increased $5.6 million primarily due to an average price increase of 10.1% coupled with increased organic cement volumes of 0.3% in the three months ended April 2, 2022. Our Green America Recycling facility, which provides alternative fuel for one of our plants, is now operational; however, the facility was not operational in the first quarter of 2021, after its prolonged shutdown due to an explosion in April 2020.
28
Operating loss increased $3.5 million during the three months ended April 2, 2022. Adjusted EBITDA decreased $8.3 million and Adjusted EBITDA Margin decreased to (12.6)% from 6.1% in the three months ended April 2, 2022. In the first quarter of 2022, our repair and maintenance costs were also elevated over the comparable prior period. In the first quarter of 2021, we received $1.2 million in insurance proceeds relative to property, plant and equipment that was destroyed in the recycling plant explosion that occurred in April 2020, which was recorded as gain on sale of assets. In addition, we received $4.3 million in business interruption insurance proceeds in the first quarter of 2021, which was recorded as other income.
Operating margin percentage for the three months ended April 2, 2022 decreased to (29.2)% from (24.7)%, from the comparable period a year ago. The decreased operating margin for the three months ended April 2, 2022 was primarily due to increased levels of repair and maintenance costs, as well as the impact of selling more imported tons of cement in 2022 than in 2021. We expect to import cement throughout the duration of 2022 to keep pace with demand. Production levels in the first three months of 2022 were less than the comparable period in 2021.
Gross revenue by product was as follows:
| Three months ended | |||||||||||||||||||||||
| ($ in thousands) | April 2, 2022 | April 3, 2021 | Variance | ||||||||||||||||||||
| Revenue by product*: | |||||||||||||||||||||||
| Cement | $ | 43,806 | $ | 39,703 | $ | 4,103 | 10.3 | % | |||||||||||||||
| Other | 2,419 | 966 | 1,453 | 150.4 | % | ||||||||||||||||||
| Total revenue | $ | 46,225 | $ | 40,669 | $ | 5,556 | 13.7 | % | |||||||||||||||
*Revenue by product includes intercompany and intracompany sales transferred at market value. Revenue from waste processing and the elimination of intracompany transactions is included in Other.
The Cement segment’s percent changes in sales volumes and pricing in the three months ended April 2, 2022 from the three months ended April 3, 2021 were as follows:
| Three months ended | |||||||||||
| Percentage Change in | |||||||||||
| Volume | Pricing | ||||||||||
| Cement | 0.3 | % | 10.1 | % | |||||||
Revenue from cement increased $4.1 million in the three months ended April 2, 2022 due to organic cement pricing gains of 10.1%, supplemented by a volume increase of 0.3%.
Liquidity and Capital Resources
Our primary sources of liquidity include cash on-hand, cash provided by operations, amounts available for borrowing under our senior secured credit facilities and capital-raising activities in the debt and capital markets. In addition to our current sources of liquidity, we have access to liquidity through public offerings of shares of our Class A common stock. To facilitate such offerings, in January 2020, we filed a shelf registration statement with the SEC that will expire in January 2023. The amount of Class A common stock to be issued pursuant to this shelf registration statement was not specified when it was filed and there is no specific limit on the amount we may issue. The specifics of any future offerings, along with the use of the proceeds thereof, will be described in detail in a prospectus supplement, or other offering materials, at the time of any offering.
As of April 2, 2022, we had $287.4 million in cash and cash equivalents and $472.8 million of working capital compared to $381.0 million and $560.5 million, respectively, at January 1, 2022. Working capital is calculated as current assets less current liabilities. There were no restricted cash balances as of April 2, 2022 or January 1, 2022. We had no outstanding borrowings on our senior secured revolving credit facility, which had borrowing capacity of $324.6 million as of April 2, 2022, which is net of $20.4 million of outstanding letters of credit and is fully available to us within the terms and covenant requirements of our credit agreement governing the senior secured credit facilities (the “Credit Agreement”).
In March 2022, our Board of Directors authorized a share repurchase program, whereby we can repurchase up to $250.0 million of our Class A common stock. During the first quarter of 2022, we repurchased 1.5 million shares of Class A common stock for $47.5 million. As of April 2, 2022, approximately $202.5 million remained available for share repurchases under the share repurchase program.
29
Given the seasonality of our business, we typically experience significant fluctuations in working capital needs and balances throughout the year. Our working capital requirements generally increase during the first half of the year as we build up inventory and focus on repair and maintenance and other set-up costs for the upcoming season. Working capital levels then decrease as the construction season winds down and we enter the winter months, which is when we see significant inflows of cash from the collection of receivables.
As of April 2, 2022 and January 1, 2022, our long-term borrowings totaled $1.6 billion for which we incurred $17.7 million of interest expense for the three months ended April 2, 2022, and $21.2 million for the three months ended April 3, 2021. We expect that normal operating cash flow will be sufficient to fund our seasonal working capital needs. We had no outstanding borrowings on the revolving credit facility as of April 2, 2022.
We believe we have access to sufficient financial resources from our liquidity sources to fund our business and operations, including contractual obligations, capital expenditures and debt service obligations, for at least the next twelve months. Our growth strategy contemplates future acquisitions for which we believe we have sufficient access to capital. We also plan to divest of certain dilutive businesses as we rationalize our portfolio, which will also generate additional capital. As of April 2, 2022, we reclassified an operating unit in the East region as held for sale. We expect to close on the transaction in the second quarter of 2022.
We and our affiliates may from time to time purchase our outstanding debt through open market purchases, privately negotiated transactions or otherwise. Purchases or retirement of debt, if any, will depend on prevailing market conditions, liquidity requirements, contractual restrictions and other factors. The amounts involved may be material.
Indebtedness
Please refer to the notes to the consolidated interim financial statements for detailed information about our long-term debt, scheduled maturities of long-term debt and affirmative and negative covenants, including the maximum allowable consolidated first lien net leverage ratio. As of April 2, 2022, we were in compliance with all debt covenants. At April 2, 2022 and January 1, 2022, $1.6 billion of total debt was outstanding under our respective debt agreements.
Cash Flows
The following table summarizes our net cash used in or provided by operating, investing and financing activities and our capital expenditures in the three months ended April 2, 2022 and April 3, 2021:
| Summit Inc. | |||||||||||
| ($ in thousands) | April 2, 2022 | April 3, 2021 | |||||||||
| Net cash provided by (used in): | |||||||||||
| Operating activities | $ | (16,713) | $ | (21,318) | |||||||
| Investing activities | (9,371) | (34,500) | |||||||||
| Financing activities | (67,662) | (2,762) | |||||||||
Operating activities
During the three months ended April 2, 2022, cash used in operating activities was $16.7 million primarily as a result of:
•Net loss of $34.8 million, decreased by non-cash expenses, including $54.8 million of depreciation, depletion, amortization and accretion expense and $5.4 million of share-based compensation, offset by the net gain on asset and business disposals of $15.7 million.
•Billed and unbilled accounts receivable decreased by $29.4 million in the first three months of 2022 as a result of the seasonality of our business. The majority of our sales occur in the spring, summer and fall and we typically incur an increase in accounts receivable (net billed and unbilled) during the second and third quarters of each year. This amount is typically converted to cash in the fourth and first quarters. Our inventory levels decreased during the second quarter as business activity increased during the quarter.
•The timing of payments associated with accounts payable and accrued expenses of cash, which is consistent with the seasonality of our business whereby we build-up inventory levels and incur repairs and maintenance costs to ready the business for increased sales volumes in the summer and fall. These costs are typically incurred in the
30
first half of the year and paid by year-end. In addition, we made $31.8 million of interest payments in the three months ended April 2, 2022.
During the three months ended April 3, 2021, cash used in operating activities was $21.3 million primarily as a result of:
•Net loss of $23.2 million, decreased by non-cash expenses, including $59.1 million of depreciation, depletion, amortization and accretion expense and $5.4 million of share-based compensation, offset by the gain on sale of a business and other assets of $16.0 million.
•Billed and unbilled accounts receivable increased by $3.5 million in the first three months of 2021 as a result of the seasonality of our business. The majority of our sales occur in the spring, summer and fall and we typically incur an increase in accounts receivable (net billed and unbilled) during the second and third quarters of each year. This amount is typically converted to cash in the fourth and first quarters. Our inventory levels also increased during the first quarter as we prepared for the increase in activity over the warmer months.
•The timing of payments associated with accounts payable and accrued expenses of cash, which is consistent with the seasonality of our business whereby we build-up inventory levels and incur repairs and maintenance costs to ready the business for increased sales volumes in the summer and fall. These costs are typically incurred in the first half of the year and paid by year-end. In addition, we made $29.5 million of interest payments in the three months ended April 3, 2021.
Investing activities
During the three months ended April 2, 2022, cash used for investing activities was $9.4 million, of which $57.8 million was invested in capital expenditures, which was partially offset by $47.8 million of proceeds from the sale of a business in the East segment, as well as $1.4 million of proceeds from asset sales.
During the three months ended April 3, 2021, cash used for investing activities was $34.5 million, of which $69.8 million was invested in capital expenditures, which was partially offset by $2.7 million of proceeds from asset sales. Additionally, in February 2021 we received $33.1 million of proceeds from the sale of a business in the East segment.
Financing activities
During the three months ended April 2, 2022, cash used in financing activities was $67.7 million. We made $7.6 million of payments on debt, $11.4 million payments on acquisition-related liabilities and used $47.5 million to repurchase shares of Class A common stock.
During three months ended April 3, 2021, cash used in financing activities was $2.8 million. We received $15.9 million of proceeds from stock option exercises, which was offset by $8.1 million payments on acquisition-related liabilities and $10.2 million of payments on debt.
Cash paid for capital expenditures
We paid cash of approximately $57.8 million in capital expenditures in the three months ended April 2, 2022 compared to $69.8 million in the three months ended April 3, 2021.
We currently estimate that we will invest between $270 million to $290 million inclusive of spend associated with greenfield projects. The timing of our greenfield expenditures is dependent upon the timing of when permits may be issued. We expect to fund our capital expenditure program through cash on hand, cash from operations, and outside financing arrangements including our revolving credit facility.
Tax Receivable Agreement
When the Company purchases LP Units for cash or LP Units are exchanged for shares of Class A common stock, this results in increases in the Company’s share of the tax basis of the tangible and intangible assets of Summit Holdings. These increases in tax basis may increase, for tax purposes, depreciation and amortization deductions and therefore reduce the amount of tax that Summit Inc. would otherwise be required to pay in the future. In connection with our initial public offering, we entered into a TRA with the holders of the LP Units that provides for the payment by Summit Inc. to exchanging holders of LP Units of 85% of the benefits, if any, that Summit Inc. actually realizes (or, under certain circumstances such as an early
31
termination of the TRA is deemed to realize) as a result of these increases in tax basis and certain other tax benefits related to entering into the TRA, including tax benefits attributable to payments under the TRA. The increases in tax basis as a result of an exchange of LP Units for shares of Class A common stock, as well as the amount and timing of any payments under the TRA, are difficult to accurately estimate, as they will vary depending upon a number of factors, including the timing of the exchanges, the price of our Class A common stock at the time of the exchange, the extent to which the exchanges are taxable, the amount and timing of our income and the effective tax rate.
We anticipate funding payments under the TRA from cash flows from operations, available cash and available borrowings under our Senior Secured Revolving Credit Facilities. As of April 2, 2022, we had accrued $326.5 million as TRA liability in our consolidated financial statements. We do not expect significant payments on our TRA liability to occur within the next twelve months.
Based upon a $30.81 per share price of our Class A common stock, the closing price of our stock on the last trading day of the three months ended April 2, 2022, and a contractually defined discount rate of 3.17%, we estimate that if Summit Inc. were to exercise its right to terminate the TRA, the aggregate amount required to settle the TRA would be approximately $282.2 million. Estimating the amount and the timing of payments that may be made under the TRA is by its nature difficult and imprecise, insofar as the amounts payable depends on a variety of factors, including, but not limited to, the timing of future exchanges, our stock price at the date of the exchange and the timing of the generation of future taxable income. The increases in tax basis as a result of an exchange, as well as the amount and timing of any payments under the TRA, will vary depending on a variety of factors.
Commitments and contingencies
We are party to certain legal actions arising from the ordinary course of business activities. Accruals are recorded when the outcome is probable and can be reasonably estimated. While the ultimate results of claims and litigation cannot be predicted with certainty, management expects that the ultimate resolution of all pending or threatened claims and litigation will not have a material effect on our consolidated financial position, results of operations or liquidity. We record legal fees as incurred.
Environmental Remediation—Our operations are subject to and affected by federal, state, provincial and local laws and regulations relating to the environment, health and safety and other regulatory matters. These operations require environmental operating permits, which are subject to modification, renewal and revocation. We regularly monitor and review its operations, procedures and policies for compliance with these laws and regulations. Despite these compliance efforts, risk of environmental liability is inherent in the operation of our business, as it is with other companies engaged in similar businesses and there can be no assurance that environmental liabilities and noncompliance will not have a material adverse effect on our consolidated financial condition, results of operations or liquidity.
Other—We are obligated under various firm purchase commitments for certain raw materials and services that are in the ordinary course of business. Management does not expect any significant changes in the market value of these goods and services during the commitment period that would have a material adverse effect on the financial condition, results of operations, and cash flows of the Company. The terms of the purchase commitments generally approximate one year.
Off-Balance sheet arrangements
As of April 2, 2022, we had no material off-balance sheet arrangements.
Non-GAAP Performance Measures
We evaluate our operating performance using metrics that we refer to as “Adjusted EBITDA,” “Adjusted EBITDA Margin,” “Adjusted Cash Gross Profit” and “Adjusted Cash Gross Profit Margin” which are not defined by U.S. GAAP and should not be considered as an alternative to earnings measures defined by U.S. GAAP. We define Adjusted EBITDA as EBITDA, adjusted to exclude accretion, loss on debt financings, gain on sale of business, non-cash compensation and certain other non-cash and non-operating items. Beginning with the first quarter of 2021, the Company no longer adjusts for transaction costs, as those costs are recurring cash payments and included in general and administrative expenses. We define Adjusted EBITDA Margin as Adjusted EBITDA divided by net revenue. We define Adjusted Cash Gross Profit as operating income before general and administrative expenses, depreciation, depletion, amortization and accretion and Adjusted Cash Gross Profit Margin as Adjusted Cash Gross Profit as a percentage of net revenue.
32
We present Adjusted EBITDA, Adjusted EBITDA Margin, Adjusted Cash Gross Profit and Adjusted Cash Gross Profit Margin for the convenience of investment professionals who use such metrics in their analyses. The investment community often uses these metrics to assess the operating performance of a company’s business and to provide a consistent comparison of performance from period to period. We use these metrics, among others, to assess the operating performance of our individual segments and the consolidated company.
Non-GAAP financial measures are not standardized; therefore, it may not be possible to compare such financial measures with other companies’ non-GAAP financial measures having the same or similar names. We strongly encourage investors to review our consolidated financial statements in their entirety and not rely on any single financial measure.
The tables below reconcile our net income (loss) to EBITDA and Adjusted EBITDA, present Adjusted EBITDA by segment and reconcile operating income to Adjusted Cash Gross Profit for the periods indicated:
| Reconciliation of Net Income (Loss) to Adjusted EBITDA | Three months ended April 2, 2022 | ||||||||||||||||||||||||||||
| by Segment | West | East | Cement | Corporate | Consolidated | ||||||||||||||||||||||||
| ($ in thousands) | |||||||||||||||||||||||||||||
| Net income (loss) | $ | 11,901 | $ | 7,366 | $ | (8,431) | $ | (45,636) | $ | (34,800) | |||||||||||||||||||
| Interest (income) expense (1) | (3,970) | (3,451) | (4,962) | 32,532 | 20,149 | ||||||||||||||||||||||||
| Income tax expense (benefit) | 176 | (106) | — | (4,813) | (4,743) | ||||||||||||||||||||||||
| Depreciation, depletion and amortization | 24,348 | 17,884 | 7,498 | 749 | 50,479 | ||||||||||||||||||||||||
| EBITDA | $ | 32,455 | $ | 21,693 | $ | (5,895) | $ | (17,168) | $ | 31,085 | |||||||||||||||||||
| Accretion | 227 | 411 | 76 | — | 714 | ||||||||||||||||||||||||
| Gain on sale of businesses | — | (14,205) | — | — | (14,205) | ||||||||||||||||||||||||
| Non-cash compensation | — | — | — | 5,422 | 5,422 | ||||||||||||||||||||||||
| Other | 10 | 237 | — | — | 247 | ||||||||||||||||||||||||
| Adjusted EBITDA | $ | 32,692 | $ | 8,136 | $ | (5,819) | $ | (11,746) | $ | 23,263 | |||||||||||||||||||
| Reconciliation of Net Income (Loss) to Adjusted EBITDA | Three months ended April 3, 2021 | ||||||||||||||||||||||||||||
| by Segment | West | East | Cement | Corporate | Consolidated | ||||||||||||||||||||||||
| ($ in thousands) | |||||||||||||||||||||||||||||
| Net income (loss) | $ | 17,436 | $ | 6,969 | $ | (1,605) | $ | (46,045) | $ | (23,245) | |||||||||||||||||||
| Interest (income) expense (1) | (2,032) | (1,720) | (4,045) | 31,983 | 24,186 | ||||||||||||||||||||||||
| Income tax expense (benefit) | 186 | (66) | — | (5,563) | (5,443) | ||||||||||||||||||||||||
| Depreciation, depletion and amortization | 24,924 | 21,474 | 8,068 | 1,104 | 55,570 | ||||||||||||||||||||||||
| EBITDA | $ | 40,514 | $ | 26,657 | $ | 2,418 | $ | (18,521) | $ | 51,068 | |||||||||||||||||||
| Accretion | 216 | 469 | 81 | — | 766 | ||||||||||||||||||||||||
| Gain on sale of business | — | (15,668) | — | — | (15,668) | ||||||||||||||||||||||||
| Non-cash compensation | — | — | — | 5,363 | 5,363 | ||||||||||||||||||||||||
| Other | (82) | 287 | — | — | 205 | ||||||||||||||||||||||||
| Adjusted EBITDA | $ | 40,648 | $ | 11,745 | $ | 2,499 | $ | (13,158) | $ | 41,734 | |||||||||||||||||||
| Reconciliation of Working Capital | April 2, 2022 | January 1, 2022 | |||||||||
| ($ in thousands) | |||||||||||
| Total current assets | $ | 777,840 | $ | 869,610 | |||||||
| Less total current liabilities | (305,071) | (309,070) | |||||||||
| Working capital | $ | 472,769 | $ | 560,540 | |||||||
33
| Three months ended | |||||||||||
| Reconciliation of Operating Loss to Adjusted Cash Gross Profit | April 2, 2022 | April 3, 2021 | |||||||||
| ($ in thousands) | |||||||||||
| Operating loss | $ | (34,295) | $ | (25,059) | |||||||
| General and administrative expenses | 51,924 | 51,642 | |||||||||
| Depreciation, depletion, amortization and accretion | 51,193 | 56,336 | |||||||||
| Gain on sale of property, plant and equipment | (1,255) | (1,769) | |||||||||
| Adjusted Cash Gross Profit (exclusive of items shown separately) | $ | 67,567 | $ | 81,150 | |||||||
| Adjusted Cash Gross Profit Margin (exclusive of items shown separately) (1) | 17.2 | % | 20.4 | % | |||||||
(1)Adjusted Cash Gross Profit Margin, which we define as Adjusted Cash Gross Profit as a percentage of net revenue.
Critical Accounting Policies and Estimates
Our management’s discussion and analysis of our financial condition and results of operations is based on our consolidated financial statements, which have been prepared in accordance with U.S. GAAP. The preparation of these consolidated financial statements requires management to make estimates and assumptions that affect the reported amounts of assets and liabilities, disclosure of contingent assets and liabilities at the date of the consolidated financial statements and the reported amounts of revenue and expenses during the reported period.
Please refer to “Critical Accounting Policies and Estimates” described in “Part II. Item 7. Management’s Discussion and Analysis of our Financial Condition and Results of Operations” of our annual report on Form 10-K filed with the SEC on February 24, 2022, from which there have been no material changes.
ITEM 3. QUANTITATIVE AND QUALITATIVE DISCLOSURES ABOUT MARKET RISK
We are exposed to certain market risks arising from transactions that are entered into in the normal course of business. Our operations are highly dependent upon the interest rate-sensitive construction industry as well as the general economic environment. Consequently, these marketplaces could experience lower levels of economic activity in an environment of rising interest rates or escalating costs. For a discussion of quantitative and qualitative disclosures about market risk, please refer to the Annual Report from which our exposure to market risk has not materially changed.
ITEM 4. CONTROLS AND PROCEDURES
Disclosure Controls and Procedures
Summit Inc.
Summit Inc. maintains disclosure controls and procedures (as such term is defined in Rules 13a-15(e) and 15d-15(e) under the Securities Exchange Act of 1934, as amended (the “Exchange Act”)), that are designed to ensure that information required to be disclosed in Summit Inc.’s reports under the Exchange Act, is recorded, processed, summarized and reported within the time periods specified in the SEC’s rules and forms, and that such information is accumulated and communicated to Summit Inc.’s management, including its Chief Executive Officer and Chief Financial Officer, as appropriate, to allow timely decisions regarding required disclosure. Any controls and procedures, no matter how well designed and operated, can provide only reasonable, not absolute, assurance of achieving the desired control objectives. Summit Inc.’s management, with the participation of its Chief Executive Officer and Chief Financial Officer, has evaluated the effectiveness of Summit Inc.’s disclosure controls and procedures as of April 2, 2022. Based upon that evaluation, Summit Inc.’s Chief Executive Officer and Chief Financial Officer concluded that, as of April 2, 2022, Summit Inc.’s disclosure controls and procedures were effective to accomplish their objectives at the reasonable assurance level.
Summit LLC
Summit LLC maintains disclosure controls and procedures (as such term is defined in Rules 13a-15(e) and 15d-15(e) under the Exchange Act) that are designed to ensure that information required to be disclosed in Summit LLC’s reports under the Exchange Act, is recorded, processed, summarized and reported within the time periods specified in the SEC’s rules and forms, and that such information is accumulated and communicated to Summit LLC’s management, including its Chief Executive Officer and Chief Financial Officer, as appropriate, to allow timely decisions regarding required disclosure. Any
34
controls and procedures, no matter how well designed and operated, can provide only reasonable, not absolute, assurance of achieving the desired control objectives. Summit LLC’s management, with the participation of its Chief Executive Officer and Chief Financial Officer, has evaluated the effectiveness of Summit LLC’s disclosure controls and procedures as of April 2, 2022. Based upon that evaluation, Summit LLC’s Chief Executive Officer and Chief Financial Officer concluded that, as of April 2, 2022, Summit LLC’s disclosure controls and procedures were effective to accomplish their objectives at the reasonable assurance level.
Changes in Internal Control over Financial Reporting
Summit Inc.
There was no change in Summit Inc.’s internal control over financial reporting (as such term is defined in Rules 13a-15(f) and 15d-15(f) under the Exchange Act) that occurred during its last fiscal quarter that has materially affected, or is reasonably likely to materially affect, Summit Inc.’s internal control over financial reporting.
Summit LLC
There was no change in Summit LLC’s internal control over financial reporting (as such term is defined in Rules 13a-15(f) and 15d-15(f) under the Exchange Act) that occurred during its last fiscal quarter that has materially affected, or is reasonably likely to materially affect, Summit LLC’s internal control over financial reporting.
35
PART II—OTHER INFORMATION
ITEM 1. LEGAL PROCEEDINGS
The information set forth under Note 12, "Commitments and Contingencies," to Summit Inc.’s unaudited consolidated financial statements is incorporated herein by reference.
ITEM 1A. RISK FACTORS
In addition to the other information set forth in this report, you should carefully consider the factors discussed in the section entitled “Risk Factors” in the Annual Report, which could materially affect the Company’s business, financial condition, operating results or liquidity or future results. The risks described in the Annual Report are not the only risks facing the Company. Additional risks and uncertainties not currently known to the Company or that it currently deems to be immaterial also may materially adversely affect its results of operations, financial condition or liquidity. There have been no material changes to the risk factors disclosed in the Annual Report.
ITEM 2. UNREGISTERED SALES OF EQUITY SECURITIES AND USE OF PROCEEDS
Purchases of our equity securities during the quarter ended April 2, 2022 were as follows:
| Period | Total Number of Shares Purchased | Average Price Paid per Share | Total Number of Shares Purchased as Part of Publicly Announced Program (1) | Approximate Dollar Value of Shares That May Yet Be Purchased Under the Program (2) | ||||||||||||||||||||||
| ($ in thousands, except per share amounts) | ||||||||||||||||||||||||||
| February 27, 2022 - April 2, 2022 | 1,506,878 | $ | 31.53 | 1,506,878 | $ | 202,488 | ||||||||||||||||||||
| Total | 1,506,878 | $ | 31.53 | 1,506,878 | $ | 202,488 | ||||||||||||||||||||
(1)On March 2, 2022, we announced that our Board of Directors authorized the repurchase of up to $250.0 million of our Class A common stock. Under the repurchase program, repurchases may be made from time to time in open market transactions, in privately negotiated transactions or otherwise. The timing and the actual numbers repurchased will depend on a variety of factors, including legal requirements, price and economic and market conditions. The repurchase program may be changed, suspended or discontinued at any time and does not have a specified expiration date.
(2)The remaining $202.5 million in the table represents the amount available to repurchase shares under our share repurchase program as of April 2, 2022.
All share repurchases were made using available cash.
ITEM 3. DEFAULTS UPON SENIOR SECURITIES
None.
ITEM 4. MINE SAFETY DISCLOSURES
The information concerning mine safety violations and other regulatory matters required by Section 1503(a) of the Dodd-Frank Wall Street Reform and Consumer Protection Act and Item 104 of Regulation S-K (17 CFR 229.104) is included in Exhibit 95.1 to this report.
ITEM 5. OTHER INFORMATION
None.
36
ITEM 6. EXHIBITS
| 3.1 | |||||
| 3.2 | |||||
| 3.3 | |||||
| 3.4 | |||||
| 31.1* | |||||
| 31.2* | |||||
| 31.3* | |||||
| 31.4* | |||||
| 32.1** | |||||
| 32.2** | |||||
| 32.3** | |||||
| 32.4** | |||||
| 95.1* | |||||
| 99.1* | |||||
| 101.INS* | Inline XBRL Instance Document - the instance document does not appear in the interactive data file because XBRL tags are embedded within the inline XBRL document | ||||
| 101.SCH* | Inline XBRL Taxonomy Extension Schema Document | ||||
| 101.CAL* | Inline XBRL Taxonomy Extension Calculation Linkbase Document | ||||
| 101.DEF* | Inline XBRL Taxonomy Extension Definition Linkbase Document | ||||
| 101.LAB* | Inline XBRL Taxonomy Extension Label Linkbase Document | ||||
| 101.PRE* | Inline XBRL Taxonomy Extension Presentation Linkbase Document | ||||
| 104.1* | Cover Page from the Company’s Quarterly Report on Form 10-Q for the quarter ended April 2, 2022, formatted in Inline XBRL (and contained in Exhibit 101). | ||||
* Filed herewith
** Furnished herewith
† Indicates management contract or compensatory plan or arrangement
The agreements and other documents filed as exhibits to this report are not intended to provide factual information or other disclosure other than with respect to the terms of the agreements or other documents themselves, and you should not rely on them other than for that purpose. In particular, any representations and warranties made by us in these agreements or other documents were made solely within the specific context of the relevant agreement or document and may not describe the actual state of affairs as of the date they were made or at any other time.
37
SIGNATURES
Pursuant to the requirements of the Securities Exchange Act of 1934, the registrants have duly caused this report to be signed on their behalf by the undersigned thereunto duly authorized.
| SUMMIT MATERIALS, INC. | ||||||||
| SUMMIT MATERIALS, LLC | ||||||||
| Date: May 5, 2022 | By: | /s/ Anne P. Noonan | ||||||
| Anne P. Noonan | ||||||||
| Chief Executive Officer | ||||||||
| (Principal Executive Officer) | ||||||||
| Date: May 5, 2022 | By: | /s/ Brian J. Harris | ||||||
| Brian J. Harris | ||||||||
| Chief Financial Officer | ||||||||
| (Principal Financial and Accounting Officer) | ||||||||
38
Serious News for Serious Traders! Try StreetInsider.com Premium Free!
You May Also Be Interested In
- Micron Technology (MU) stock rises on report of over $6 bln in CHIPS Act grants
- Tarkett launches non-PVC resilient flooring collection with superior performance
- Auburn's McCrary Institute and Oak Ridge National Laboratory to Partner on First Regional Cybersecurity Center to Protect the Nation's Electricity Grid
Create E-mail Alert Related Categories
SEC FilingsSign up for StreetInsider Free!
Receive full access to all new and archived articles, unlimited portfolio tracking, e-mail alerts, custom newswires and RSS feeds - and more!
