

Form 10-Q Shepherd's Finance, LLC For: Jun 30
 Tweet
Tweet Share
Share
UNITED STATES
SECURITIES AND EXCHANGE COMMISSION
WASHINGTON, DC 20549
FORM
For
the Quarterly Period Ended
or
For the Transition Period From to
Commission
File Number
(Exact name of registrant as specified on its charter)
| (State or other jurisdiction of | (I.R.S. Employer | |
| Incorporation or organization) | Identification No.) |
(Address of principal executive offices)
(
(Registrant’s telephone number including area code)
Securities registered pursuant to Section 12(b) of the Act:
| Title of Each Class | Trading Symbol(s) | Name of Each Exchange on Which Registered | ||
| None | None | None |
Indicate
by check mark whether the registrant (1) has filed all reports required to be filed by section 13 or 15(d) of the Securities Exchange
Act of 1934 during the preceding 12 months (or for such shorter period that the registrant was required to file such reports) and (2)
has been subject to such filing requirements for the past 90 days.
Indicate
by check mark whether the registrant has submitted electronically every Interactive Data File required to be submitted pursuant to Rule
405 of Regulation S-T (§232.405 of this chapter) during the preceding 12 months (or for such shorter period that the registrant
was required to submit such files).
Indicate by check mark whether the registrant is a large accelerated filer, an accelerated filer, a non-accelerated filer, smaller reporting company, or an emerging growth company. See the definitions of “large accelerated filer,” “accelerated filer,” “smaller reporting company,” and “emerging growth company” in Rule 12b-2 of the Exchange Act.
| Large accelerated filer | ☐ | Accelerated filer | ☐ | |
| ☒ | Smaller reporting company | |||
| Emerging growth company |
If
an emerging growth company, indicate by check mark if the registrant has elected not to use the extended transition period for complying
with any new or revised financial accounting standards provided pursuant to Section 13(a) of the Exchange Act.
Indicate
by check mark whether the registrant is a shell company (as defined in Rule 12b-2 of the Exchange Act). Yes ☐
FORM 10-Q
SHEPHERD’S FINANCE, LLC
TABLE OF CONTENTS
| 2 |
CAUTIONARY NOTE REGARDING FORWARD-LOOKING STATEMENTS
Certain statements contained in this Form 10-Q of Shepherd’s Finance, LLC, other than historical facts, may be considered forward-looking statements within the meaning of the federal securities laws. Words such as “may,” “will,” “expect,” “anticipate,” “believe,” “estimate,” “continue,” “predict,” or other similar words identify forward-looking statements. Forward-looking statements appear in a number of places in this report, including without limitation, “Management’s Discussion and Analysis of Financial Condition and Results of Operations,” and include statements regarding our intent, belief or current expectation about, among other things, trends affecting the markets in which we operate, our business, financial condition and growth strategies.
Although we believe that the expectations reflected in these forward-looking statements are based on reasonable assumptions, forward-looking statements are not guarantees of future performance and involve risks and uncertainties. These risks and uncertainties include, but are not limited to: uncertainties relating to the effects of COVID-19; the length of the COVID-19 pandemic and severity of such outbreak nationally and across the globe; the pace of recovery following the COVID-19 pandemic; general economic uncertainty in key global markets and a worsening of global economic conditions or low levels of economic growth; the rate and the pace of economic recovery following economic downturns; and those other risks described in other risk factors as outlined in our Registration Statement on Form S-1, as amended, and our Annual Report on Form 10-K. Actual results may differ materially from those predicted in the forward-looking statements as a result of various factors, including but not limited to those set forth in the “Risk Factors” section of our Registration Statement on Form S-1, as amended, and our Annual Report on Form 10-K. For further information regarding risks and uncertainties associated with our business, and important factors that could cause our actual results to vary materially from those expressed or implied in such forward-looking statements, please refer to the factors set forth in the “Management’s Discussion and Analysis of Financial Condition and Results of Operations” and “Risk Factors” sections of the documents we file from time to time with the U.S. Securities and Exchange Commission, including, but not limited to, our Annual Report on Form 10-K for the year ended December 31, 2021.
When considering forward-looking statements, you should keep these risk factors, as well as the other cautionary statements in this report and in our Annual Report on Form 10-K for the year ended December 31, 2021 in mind. You should not place undue reliance on any forward-looking statement. We are not obligated to update forward-looking statements.
| 3 |
PART I – FINANCIAL INFORMATION
ITEM 1. FINANCIAL STATEMENTS
Shepherd’s Finance, LLC
Interim Condensed Consolidated Balance Sheets
| (in thousands of dollars) | June 30, 2022 | December 31, 2021 | ||||||
| (Unaudited) | ||||||||
| Assets | ||||||||
| Cash and cash equivalents | $ | $ | ||||||
| Accrued interest receivable | ||||||||
| Loans receivable, net | ||||||||
| Real estate investments | ||||||||
| Foreclosed assets, net | ||||||||
| Premises and equipment | ||||||||
| Other assets | ||||||||
| Total assets | $ | $ | ||||||
| Liabilities and Members’ Capital | ||||||||
| Customer interest escrow | $ | $ | ||||||
| Accounts payable and accrued expenses | ||||||||
| Accrued interest payable | ||||||||
| Notes payable secured, net of deferred financing costs | ||||||||
| Notes payable unsecured, net of deferred financing costs | ||||||||
| Due to preferred equity member | ||||||||
| Total liabilities | $ | $ | ||||||
| Commitments and Contingencies (Note 10) | ||||||||
| Redeemable Preferred Equity | ||||||||
| Series C preferred equity | $ | $ | ||||||
| Members’ Capital | ||||||||
| Series B preferred equity | ||||||||
| Class A common equity | ( | ) | ||||||
| Members’ capital | $ | $ | ||||||
| Total liabilities, redeemable preferred equity and members’ capital | $ | $ | ||||||
The accompanying notes are an integral part of these interim condensed consolidated financial statements.
| 4 |
Shepherd’s Finance, LLC
Interim Condensed Consolidated Statements of Operations - Unaudited
For the Three and Six Months ended June 30, 2022 and 2021
| Three Months Ended | Six Months Ended | |||||||||||||||
| June 30, | June 30, | |||||||||||||||
| (in thousands of dollars) | 2022 | 2021 | 2022 | 2021 | ||||||||||||
| Interest Income | ||||||||||||||||
| Interest and fee income on loans | $ | $ | $ | $ | ||||||||||||
| Interest expense: | ||||||||||||||||
| Interest related to secured borrowings | ||||||||||||||||
| Interest related to unsecured borrowings | ||||||||||||||||
| Interest expense | ||||||||||||||||
| Net interest income | ||||||||||||||||
| Less: Loan loss provision | ||||||||||||||||
| Net interest income after loan loss provision | ||||||||||||||||
| Non-Interest Income | ||||||||||||||||
| Gain on extinguishment of debt | ||||||||||||||||
| Gain on sale of foreclosed assets | ||||||||||||||||
| Total non-interest income | ||||||||||||||||
| Income | ||||||||||||||||
| Non-Interest Expense | ||||||||||||||||
| Selling, general and administrative | ||||||||||||||||
| Depreciation and amortization | ||||||||||||||||
| Loss on sale of foreclosed assets | ||||||||||||||||
| Impairment loss on foreclosed assets | ||||||||||||||||
| Total non-interest expense | ||||||||||||||||
| Net Income (Loss) | $ | $ | $ | $ | ( | ) | ||||||||||
| Earned distribution to preferred equity holders | ||||||||||||||||
| Net income (loss) attributable to common equity holders | $ | $ | ( | ) | $ | $ | ( | ) | ||||||||
The accompanying notes are an integral part of these interim condensed consolidated financial statements.
| 5 |
Shepherd’s Finance, LLC
Interim Condensed Consolidated Statements of Changes in Members’ Capital – Unaudited
For the Six and Three Months Ended June 30, 2022 and 2021
For the Six Months Ended June 30, 2022 and 2021
| (in thousands of dollars) | 2022 | 2021 | ||||||
| Members’ capital, beginning balance, December 31 | $ | $ | ||||||
| Net income (loss) less distributions to Series C preferred equity holders of $ | ( | ) | ||||||
| Contributions from Series B preferred equity holders | ||||||||
| Earned distributions to Series B preferred equity holders | ( | ) | ||||||
| Distributions to common equity holders | ( | ) | ||||||
| Members’ capital, ending balance, June 30 | $ | $ | ||||||
The accompanying notes are an integral part of the interim condensed consolidated financial statements.
For the Three Months Ended June 30, 2022 and 2021
| (in thousands of dollars) | 2022 | 2021 | ||||||
| Members’ capital, beginning balance, March 31 | $ | $ | ||||||
| Net loss less distributions to Series C preferred equity holders of $ | ( | ) | ||||||
| Contributions from Series B preferred equity holders | ||||||||
| Earned distributions to Series B preferred equity holders | ( | ) | ||||||
| Distributions to common equity holders | ( | ) | ||||||
| Members’ capital, ending balance, June 30 | $ | $ | ||||||
The accompanying notes are an integral part of the interim condensed consolidated financial statements.
| 6 |
Shepherd’s Finance, LLC
Interim Condensed Consolidated Statements of Cash Flows - Unaudited
For the Six Months Ended June 30, 2022 and 2021
Six Months Ended June 30, | ||||||||
| (in thousands of dollars) | 2022 | 2021 | ||||||
| Cash flows from operations | ||||||||
| Net income (loss) | $ | $ | ( | ) | ||||
| Adjustments to reconcile net income (loss) to net cash provided by operating activities | ||||||||
| Amortization of deferred financing costs | ||||||||
| Provision for loan losses | ||||||||
| Change in loan origination fees, net | ||||||||
| Gain on sale of foreclosed assets | ( | ) | ( | ) | ||||
| Loss on sale of foreclosed assets | ||||||||
| Impairment and loss on foreclosed assets | ||||||||
| Depreciation and amortization | ||||||||
| Gain on extinguishment of debt | ( | ) | ||||||
| Net change in operating assets and liabilities: | ||||||||
| Other assets | ( | ) | ( | ) | ||||
| Accrued interest receivable | ||||||||
| Customer interest escrow | ( | ) | ||||||
| Accrued interest payable | ||||||||
| Accounts payable and accrued expenses | ||||||||
| Net cash provided by operating activities | ||||||||
| Cash flows from investing activities | ||||||||
| Loan originations and principal collections, net | ( | ) | ( | ) | ||||
| Investment in foreclosed assets | ( | ) | ( | ) | ||||
| Additions for construction in real estate investments | ( | ) | ( | ) | ||||
| Deposits for construction in real estate investments | ||||||||
| Proceeds from the sale of real estate investments | ||||||||
| Proceeds from the sale of foreclosed assets | ||||||||
| Net cash (used in) provided by investing activities | ( | ) | ||||||
| Cash flows from financing activities | ||||||||
| Contributions from preferred B equity holders | ||||||||
| Contributions from preferred C equity holders | ||||||||
| Distributions to preferred equity holders | ( | ) | ( | ) | ||||
| Distributions to common equity holders | ( | ) | ||||||
| Proceeds from secured notes payable | ||||||||
| Repayments of secured notes payable | ( | ) | ( | ) | ||||
| Proceeds from unsecured notes payable | ||||||||
| Redemptions/repayments of unsecured notes payable | ( | ) | ( | ) | ||||
| Proceeds from PPP Loan and EIDL Advance | ||||||||
| Deferred financing costs paid | ( | ) | ( | ) | ||||
| Net cash provided by (used in) financing activities | ( | ) | ||||||
| Net (decrease) increase in cash and cash equivalents | ( | ) | ||||||
| Cash and cash equivalents | ||||||||
| Beginning of period | ||||||||
| End of period | $ | $ | ||||||
| Supplemental disclosure of cash flow information | ||||||||
| Cash paid for interest | $ | $ | ||||||
| Non-cash investing and financing activities | ||||||||
| Earned by Series B preferred equity holders but not distributed to customer interest escrow | $ | $ | ||||||
| Earned by Series B preferred equity holders and distributed to customer interest escrow | $ | $ | ||||||
| Earned but not paid distributions of Series C preferred equity holders | $ | $ | ||||||
| Secured transferred to unsecured notes payable | $ | $ | ||||||
| Foreclosure of assets transferred from loans receivable, net | $ | $ | ||||||
| Foreclosure of assets transferred to loans receivable, net | $ | $ | ||||||
| Accrued interest payable transferred to unsecured notes payable | $ | $ | ||||||
| EIDL advance forgiveness in reduction of debt | $ | $ | ||||||
The accompanying notes are an integral part of these interim condensed consolidated financial statements.
| 7 |
Shepherd’s Finance, LLC
Notes to Interim Condensed Consolidated Financial Statements (unaudited)
Information presented throughout these notes to the interim condensed consolidated financial statements (unaudited) is in thousands of dollars.
1. Description of Business and Basis of Presentation
Description of Business
Shepherd’s Finance, LLC and subsidiary (the “Company”) was originally formed as a Pennsylvania limited liability company on May 10, 2007. The Company is the sole member of a consolidating subsidiary, Shepherd’s Stable Investments, LLC. The Company operates pursuant to its Second Amended and Restated Limited Liability Company Agreement, as amended, by and among Daniel M. Wallach and the other members of the Company effective as of March 16, 2017, and as subsequently amended.
The Company extends commercial loans to residential homebuilders (in 21 states as of June 30, 2022) to:
| ● | construct single family homes, | |
| ● | develop undeveloped land into residential building lots, and | |
| ● | purchase older homes and then rehabilitate the home for sale. |
Basis of Presentation
The accompanying unaudited interim condensed consolidated financial statements for the period ended June 30, 2022 have been prepared in accordance with accounting principles generally accepted in the United States of America (“U.S. GAAP”) for interim financial information, the instructions to Form 10-Q and Article 8 of Regulation S-X. The accompanying condensed consolidated balance sheet as of December 31, 2021 has been derived from audited consolidated financial statements. While certain information and disclosures normally included in financial statements prepared in accordance with U.S. GAAP have been condensed or omitted pursuant to the rules and regulations of the Securities and Exchange Commission (“SEC”), management believes that the disclosures herein are adequate to make the unaudited interim condensed consolidated information presented not misleading. In the opinion of management, the unaudited interim condensed consolidated financial statements reflect all adjustments necessary for a fair presentation of the consolidated financial position, results of operations, and cash flows for the periods presented. Such adjustments are of a normal, recurring nature. The consolidated results of operations for any interim period are not necessarily indicative of results expected for the fiscal year ending December 31, 2022. These unaudited interim condensed consolidated financial statements should be read in conjunction with the 2021 consolidated financial statements and notes thereto (the “2021 Financial Statements”) included in the Company’s Annual Report on Form 10-K for the year ended December 31, 2021 (the “2021 Form 10-K”). The accounting policies followed by the Company are set forth in Note 2 – Summary of Significant Accounting Policies in the 2021 Financial Statements.
Accounting Standards to be Adopted
Financial Accounting Standards Board (“FASB”) Accounting Standards Update (“ASU”) 2016-13, “Financial Instruments-Credit Losses: Measurement of Credit Losses on Financial Instruments.” The amendments in ASU 2016-13 introduce a new current expected credit loss (“CECL”) model for certain financial assets, including mortgage loans and reinsurance receivables. The new model will not apply to debt securities classified as available-for-sale. For assets within the scope of the new model, an entity will recognize as an allowance against earnings its estimate of the contractual cash flows not expected to be collected on day one of the asset’s acquisition. The allowance may be reversed through earnings if a security recovers in value. This differs from the current impairment model, which requires recognition of credit losses when they have been incurred and recognizes a security’s subsequent recovery in value in other comprehensive income. ASU 2016-13 also makes targeted changes to the current impairment model for available-for-sale debt securities, which comprise the majority of the Company’s invested assets. Similar to the CECL model, credit loss impairments will be recorded in an allowance against earnings that may be reversed for subsequent recoveries in value. The amendments in ASU 2016-13, along with related amendments in ASU 2018-19, “Codification Improvements to Topic 326, Financial Instruments-Credit Losses,” are effective for annual and interim periods beginning after December 15, 2019 on a modified retrospective basis. For smaller reporting companies, the effective date for annual and interim periods is January 1, 2023. The Company is reviewing its policies and processes to ensure compliance with the requirements in ASU 2016-13.
| 8 |
Reclassifications
Certain reclassifications have been made to the prior period’s financial statements and disclosures to conform to the current period’s presentation.
2. Fair Value
The Company had no financial instruments measured at fair value on a recurring basis as of June 30, 2022 and December 31, 2021.
The following tables present the balances of non-financial instruments measured at fair value on a non-recurring basis as of June 30, 2022 and December 31, 2021.
| June 30, 2022 | Quoted Prices in Active Markets for Identical | Significant Other Observable | Significant Unobservable | |||||||||||||||||
| Carrying | Estimated | Assets | Inputs | Inputs | ||||||||||||||||
| Amount | Fair Value | Level 1 | Level 2 | Level 3 | ||||||||||||||||
| Foreclosed assets | $ | $ | $ | $ | $ | |||||||||||||||
| Impaired loans due to COVID-19, net | ||||||||||||||||||||
| Other impaired loans, net | ||||||||||||||||||||
| Total | $ | $ | $ | $ | $ | |||||||||||||||
| December 31, 2021 | Quoted Prices in Active Markets for Identical | Significant Other Observable | Significant Unobservable | |||||||||||||||||
| Carrying | Estimated | Assets | Inputs | Inputs | ||||||||||||||||
| Amount | Fair Value | Level 1 | Level 2 | Level 3 | ||||||||||||||||
| Foreclosed assets | $ | $ | $ | $ | $ | |||||||||||||||
| Impaired loans due to COVID-19, net | ||||||||||||||||||||
| Other impaired loans, net | ||||||||||||||||||||
| Total | $ | $ | $ | $ | $ | |||||||||||||||
The table below is a summary of fair value estimates for financial instruments:
| June 30, 2022 | December 31, 2021 | |||||||||||||||
| Carrying | Estimated | Carrying | Estimated | |||||||||||||
| Amount | Fair Value | Amount | Fair Value | |||||||||||||
| Financial Assets | ||||||||||||||||
| Cash and cash equivalents | $ | $ | $ | $ | ||||||||||||
| Loan receivable, net | ||||||||||||||||
| Accrued interest on loans | ||||||||||||||||
| Financial Liabilities | ||||||||||||||||
| Customer interest escrow | ||||||||||||||||
| Notes payable secured, net | ||||||||||||||||
| Notes payable unsecured, net | ||||||||||||||||
| Accrued interest payable | ||||||||||||||||
| 9 |
3. Financing Receivables
Financing receivables are comprised of the following as of June 30, 2022 and December 31, 2021:
| June 30, 2022 | December 31, 2021 | |||||||
| Loans receivable, gross | $ | $ | ||||||
| Less: Deferred loan fees | ( | ) | ( | ) | ||||
| Less: Deposits | ( | ) | ( | ) | ||||
| Plus: Deferred origination costs | ||||||||
| Less: Allowance for loan losses | ( | ) | ( | ) | ||||
| Loans receivable, net | $ | $ | ||||||
The
allowance for loan losses at June 30, 2022 was $
As
of December 31, 2021 the allowance for loan losses was $
During
the six months ended June 30, 2022 and year ended December 31, 2021, we incurred $
Commercial Construction and Development Loans
Construction Loan Portfolio Summary
The following is a summary of the loan portfolio to builders for home construction loans as of June 30, 2022 and December 31, 2021:
| Year | Number of States | Number of Borrowers | Number of Loans | Value of Collateral(1) | Commitment Amount | Gross Amount Outstanding | Loan to Value Ratio(2)(3) | Loan Fee | ||||||||||||||||||||||||||
| 2022 | $ | | $ | $ | | % | % | |||||||||||||||||||||||||||
| 2021 | $ | $ | $ | % | % | |||||||||||||||||||||||||||||
| (1) | |
| (2) | |
| (3) |
| 10 |
Real Estate Development Loan Portfolio Summary
The following is a summary of our loan portfolio to builders for land development as of June 30, 2022 and December 31, 2021:
| Year | Number of States | Number of Borrowers | Number of Loans | Gross Value of Collateral(1) | Commitment Amount(2) | Gross Amount Outstanding | Loan to Value Ratio(3)(4) | Interest Spread | ||||||||||||||||||||||||
| 2022 | $ | | $ | $ | | % | ||||||||||||||||||||||||||
| 2021 | $ | $ | $ | % | ||||||||||||||||||||||||||||
| (1) | |
| (2) | |
| (3) | |
| (4) |
Credit Quality Information
The following tables present credit-related information at the “class” level in accordance with FASB Accounting Standard Codification 310-10-50, “Disclosures about the Credit Quality of Finance Receivables and the Allowance for Credit Losses.” See our 2021 Form 10-K, as filed with the SEC, for more information.
Gross finance receivables – By risk rating:
| June 30, 2022 | December 31, 2021 | |||||||
| Pass | $ | $ | ||||||
| Special mention | ||||||||
| Classified – accruing | ||||||||
| Classified – nonaccrual | ||||||||
| Total | $ | $ | ||||||
Finance Receivables – Method of impairment calculation:
| June 30, 2022 | December 31, 2021 | |||||||
| Performing loans evaluated individually | $ | $ | ||||||
| Performing loans evaluated collectively | ||||||||
| Non-performing loans without a specific reserve | ||||||||
| Non-performing loans with a specific reserve | ||||||||
| Total evaluated collectively for loan losses | $ | $ | ||||||
As June 30, 2022 and December 31, 2021, there were no loans acquired with deteriorated credit quality.
| 11 |
Impaired Loans
The following is a summary of our impaired non-accrual commercial construction loans as of June 30, 2022 and December 31, 2021.
| June 30, 2022 | December 31, 2021 | |||||||
| Unpaid principal balance (contractual obligation from customer) | $ | $ | ||||||
| Charge-offs and payments applied | ( | ) | ( | ) | ||||
| Gross value before related allowance | ||||||||
| Related allowance | ( | ) | ( | ) | ||||
| Value after allowance | $ | $ | ||||||
Concentrations
Financial instruments that potentially subject the Company to concentrations of credit risk consist principally of loans receivable. Our concentration risks for our top three customers listed by geographic real estate market are summarized in the table below:
| June 30, 2022 | December 31, 2021 | |||||||||||
| Percent of | Percent of | |||||||||||
| Borrower | Loan | Borrower | Loan | |||||||||
| City | Commitments | City | Commitments | |||||||||
| Highest concentration risk | % | % | ||||||||||
| Second highest concentration risk | % | % | ||||||||||
| Third highest concentration risk | % | % | ||||||||||
4. Real Estate Investment Assets
The following table is a roll forward of real estate investment assets:
Six Months Ended June 30, 2022 | Year Ended December 31, 2021 | Six Months Ended June 30, 2021 | ||||||||||
| Beginning balance | $ | $ | $ | |||||||||
| Deposits from real estate investments | ( | ) | ( | ) | ||||||||
| Proceeds from the sale of real estate investments | ( | ) | ||||||||||
| Additions for construction/development | ||||||||||||
| Ending balance | $ | $ | $ | |||||||||
| 12 |
5. Foreclosed Assets
The following table is a roll forward of foreclosed assets:
Six Months Ended June 30, 2022 | Year Ended December 31, 2021 | Six Months Ended June 30, 2021 | ||||||||||
| Beginning balance | $ | $ | $ | |||||||||
| Transfers (to) from loan receivables, net | ( | ) | ||||||||||
| Additions for construction/development | ||||||||||||
| Sale proceeds | ( | ) | ( | ) | ( | ) | ||||||
| Loss on foreclosure | ( | ) | ||||||||||
| Loss on sale of foreclosed assets | ( | ) | ( | ) | ||||||||
| Gain on foreclosure | ||||||||||||
| Gain on sale of foreclosed assets | ||||||||||||
| Impairment loss on foreclosed assets | ( | ) | ( | ) | ||||||||
| Ending balance | $ | $ | $ | |||||||||
6. Borrowings
The following table displays our borrowings and a ranking of priority:
Priority Rank | June 30, 2022 | December 31, 2021 | ||||||||
| Borrowing Source | ||||||||||
| Purchase and sale agreements and other secured borrowings | 1 | $ | $ | |||||||
| Secured lines of credit from affiliates | 2 | |||||||||
| Unsecured line of credit (senior) | 3 | |||||||||
| Other unsecured debt (senior subordinated) | 4 | |||||||||
| Unsecured Notes through our public offering, gross | 5 | |||||||||
| Other unsecured debt (subordinated) | 5 | |||||||||
| Other unsecured debt (junior subordinated) | 6 | |||||||||
| Total | $ | $ | ||||||||
The following table shows the maturity of outstanding debt as of June 30, 2022:
| Year Maturing | Total Amount Maturing | Public Offering | Other Unsecured | Secured Borrowings | ||||||||||||
| 2022 | $ | $ | $ | $ | ||||||||||||
| 2023 | ||||||||||||||||
| 2024 | ||||||||||||||||
| 2025 | ||||||||||||||||
| 2026 and thereafter | ||||||||||||||||
| Total | $ | $ | $ | $ | ||||||||||||
Secured Borrowings
Lines of Credit
As
of June 30, 2022 and December 31, 2021, the Company had $
None of our lines of credit have given us notice of nonrenewal during the second quarter or first six months of 2022, and the lines will continue to automatically renew unless notice of nonrenewal is given by a lender.
| 13 |
Secured Deferred Financing Costs
The
Company had secured deferred financing costs of $
Borrowings secured by loan assets are summarized below:
| June 30, 2022 | December 31, 2021 | |||||||||||||||
Book Value of Loans which Served as Collateral | Due from Shepherd’s Finance to Loan Purchaser or Lender | Book Value of Loans which Served as Collateral | Due from Shepherd’s Finance to Loan Purchaser or Lender | |||||||||||||
| Loan Purchaser | ||||||||||||||||
| Builder Finance | $ | $ | $ | $ | ||||||||||||
| S.K. Funding | ||||||||||||||||
| Lender | ||||||||||||||||
| Shuman | ||||||||||||||||
| Jeff Eppinger | ||||||||||||||||
| R. Scott Summers | ||||||||||||||||
| John C. Solomon | ||||||||||||||||
| Judith Y. Swanson | ||||||||||||||||
| Total | $ | $ | $ | $ | ||||||||||||
Unsecured Borrowings
Unsecured Notes through the Public Offering (“Notes Program”)
The
effective interest rate on borrowings through our Notes Program at June 30, 2022 and December 31, 2021 was
Six Months Ended June 30, 2022 | Year Ended December 31, 2021 | Six Months Ended June 30, 2021 | ||||||||||
| Gross Notes outstanding, beginning of period | $ | $ | $ | |||||||||
| Notes issued | ||||||||||||
| Note repayments / redemptions | ( | ) | ( | ) | ( | ) | ||||||
| Gross Notes outstanding, end of period | $ | $ | $ | |||||||||
| Less deferred financing costs, net | ( | ) | ( | ) | ( | ) | ||||||
| Notes outstanding, net | $ | $ | $ | |||||||||
| 14 |
The following is a roll forward of deferred financing costs:
Six Months Ended June 30, 2022 | Year Ended December 31, 2021 | Six Months Ended June 30, 2021 | ||||||||||
| Deferred financing costs, beginning balance | $ | $ | $ | |||||||||
| Additions | ||||||||||||
| Deferred financing costs, ending balance | ||||||||||||
| Less accumulated amortization | ( | ) | ( | ) | ( | ) | ||||||
| Deferred financing costs, net | $ | $ | $ | |||||||||
The following is a roll forward of the accumulated amortization of deferred financing costs:
Six Months Ended June 30, 2022 | Year Ended December 31, 2021 | Six Months Ended June 30, 2021 | ||||||||||
| Accumulated amortization, beginning balance | $ | $ | $ | |||||||||
| Additions | ||||||||||||
| Accumulated amortization, ending balance | $ | $ | $ | |||||||||
Other Unsecured Debts
Our other unsecured debts are detailed below:
| Principal Amount Outstanding as of | ||||||||||||||
| Loan | Maturity Date | Interest Rate(1) | June 30, 2022 | December 31, 2021 | ||||||||||
| Unsecured Note with Seven Kings Holdings, Inc. | % | $ | $ | |||||||||||
| Unsecured Line of Credit from Swanson | % | |||||||||||||
| Unsecured Line of Credit from Builder Finance, Inc. | % | |||||||||||||
| Subordinated Promissory Note | % | |||||||||||||
| Subordinated Promissory Note | % | |||||||||||||
| Subordinated Promissory Note | % | |||||||||||||
| Subordinated Promissory Note | % | |||||||||||||
| Subordinated Promissory Note | % | |||||||||||||
| Subordinated Promissory Note | % | |||||||||||||
| Subordinated Promissory Note | % | |||||||||||||
| Subordinated Promissory Note | % | |||||||||||||
| Subordinated Promissory Note | % | |||||||||||||
| Subordinated Promissory Note | % | |||||||||||||
| Subordinated Promissory Note | % | |||||||||||||
| Subordinated Promissory Note | % | |||||||||||||
| Subordinated Promissory Note | % | |||||||||||||
| Subordinated Promissory Note | % | |||||||||||||
| Subordinated Promissory Note | % | |||||||||||||
| Subordinated Promissory Note | % | |||||||||||||
| Subordinated Promissory Note | % | |||||||||||||
| Subordinated Promissory Note | % | |||||||||||||
| Subordinated Promissory Note | % | |||||||||||||
| Senior Subordinated Promissory Note | % | |||||||||||||
| Senior Subordinated Promissory Note | % | |||||||||||||
| Senior Subordinated Promissory Note | % | |||||||||||||
| Junior Subordinated Promissory Note | % | |||||||||||||
| $ | $ | |||||||||||||
| (1) |
| (2) |
| (3) |
| (4) |
| 15 |
7. Redeemable Preferred Equity
The following is a roll forward of our Series C cumulative preferred equity (“Series C Preferred Units”):
Six Months Ended June 30, 2022 | Year Ended December 31, 2021 | Six Months Ended June 30, 2021 | ||||||||||
| Beginning balance | $ | $ | $ | |||||||||
| Additions from new investment | ||||||||||||
| Distributions | ( | ) | ( | ) | ( | ) | ||||||
| Additions from reinvestments | ||||||||||||
| Ending balance | $ | $ | $ | |||||||||
The following table shows the earliest redemption options for investors in our Series C Preferred Units as of June 30, 2022:
| Year Maturing | Total Amount Redeemable | |||
| 2024 | $ | |||
| 2025 | ||||
| 2026 | ||||
| 2027 | ||||
| 2028 | ||||
| Total | $ | |||
8. Members’ Capital
There
are currently two classes of equity units outstanding that the Company classifies as Members’ Capital: Class A common units (“Class
A Common Units”) and Series B cumulative preferred units (“Series B Preferred Units”). As of June 30, 2022, the Class
A Common Units are held by eight members, all of whom have no personal liability. All Class A common members have voting rights in proportion
to their capital account. There were
The
Series B Preferred Units were issued to the Hoskins Group through a reduction in a loan issued by the Hoskins Group to the Company. In
December 2015, the Hoskins Group agreed to purchase
9. Related Party Transactions
As
of June 30, 2022, the Company had $
During
the six months ended June 30, 2022, Mr. Myrick originated one loan for approximately $
As
of December 31, 2021, the Company serviced two loans originated by Mr. Myrick for which it received a
10. Commitments and Contingencies
Unfunded
commitments to extend credit, which have similar collateral, credit risk, and market risk to our outstanding loans, were $
| 16 |
11. Selected Quarterly Condensed Consolidated Financial Data (Unaudited)
Summarized unaudited quarterly condensed consolidated financial data for the quarters of 2022 and 2021 are as follows:
| Quarter 2 | Quarter 1 | Quarter 4 | Quarter 3 | Quarter 2 | Quarter 1 | |||||||||||||||||||
| 2022 | 2022 | 2021 | 2021 | 2021 | 2021 | |||||||||||||||||||
| Net interest income | $ | $ | $ | $ | $ | $ | ||||||||||||||||||
| Loan loss provision | ||||||||||||||||||||||||
| Net interest income after loan loss provision | ||||||||||||||||||||||||
| Gain on sale of foreclosed assets | ||||||||||||||||||||||||
| Gain on foreclosure of assets | ||||||||||||||||||||||||
| Gain on extinguishment of debt | ||||||||||||||||||||||||
| SG&A expense | ||||||||||||||||||||||||
| Depreciation and amortization | ||||||||||||||||||||||||
| Loss on sale of foreclosed assets | ||||||||||||||||||||||||
| Loss on foreclosure of assets | ||||||||||||||||||||||||
| Impairment loss on foreclosed assets | ||||||||||||||||||||||||
| Net income (loss) | $ | $ | $ | $ | $ | $ | ( | ) | ||||||||||||||||
12. Non-Interest Expense Detail
The following table displays our selling, general and administrative (“SG&A”) expenses:
For the Six Months Ended June 30, | ||||||||
| 2022 | 2021 | |||||||
| Selling, general and administrative expenses | ||||||||
| Legal and accounting | $ | $ | ||||||
| Salaries and related expenses | ||||||||
| Board related expenses | ||||||||
| Advertising | ||||||||
| Rent and utilities | ||||||||
| Loan and foreclosed asset expenses | ||||||||
| Travel | ||||||||
| Other | ||||||||
| Total SG&A | $ | $ | ||||||
13. Subsequent Events
Management of the Company has evaluated subsequent events through August 15, 2022, the date these interim condensed consolidated financial statements were issued.
| 17 |
ITEM 2. MANAGEMENT’S DISCUSSION AND ANALYSIS OF FINANCIAL CONDITION AND RESULTS OF OPERATIONS
(All dollar [$] amounts shown in thousands.)
The following Management’s Discussion and Analysis of Financial Condition and Results of Operations should be read in conjunction with our interim condensed consolidated financial statements and the notes thereto contained elsewhere in this report. The following Management’s Discussion and Analysis of Financial Condition and Results of Operations should also be read in conjunction with our audited annual consolidated financial statements and related notes and other consolidated financial data (the “2021 Financial Statements”) included in the Company’s Annual Report on Form 10-K for the year ended December 31, 2021 (the “2021 Form 10-K”). See also “Cautionary Note Regarding Forward-Looking Statements” preceding Part I.
Overview
During the quarter and six months ended June 30, 2022, the Company continued to focus on the reduction of non-interest earning assets. As of June 30, 2022, loans classified as non-accrual were 14 or $6,701 compared to 23 or $9,526 as of December 31, 2021. In addition, as of June 30, 2022, we had two foreclosed assets or $865 compared to five or $2,724 as of December 31, 2021.
The Company continues to lose interest income on assets that do not accrue interest. During the quarter and six months ended June 30, 2022, the estimated loss on interest income related to impaired and foreclosed assets was $265 and $607, respectively. Looking ahead, we expect this to decrease as we continue to sell our remaining foreclosed assets and impaired loans in 2022.
While the Company continues to face risks as it relates to the economy and the homebuilding industry, management has decided to focus on the following during 2022:
| 1. | Decrease the amount of non-interest-bearing assets, which includes cash, our foreclosed assets, real estate assets and classified non-accrual loans or impaired loans receivables. | |
| 2. | Increase loan originations. | |
| 3. | Maintain liquidity to fund new loan originations and completion of construction costs for existing loans. | |
| 4. | Lower our cost of funds (to maintain a competitive market level). | |
| 5. | Raise margin beyond the elimination of nonperforming assets. |
We anticipate that for the last two quarters of 2022, the housing market in most of the areas in which we do business will decline due to the impact of current economic conditions. While markets will probably weaken compared to where they were as of June 30, 2022, we anticipate losses incurred in principal related to COVID-19 will not continue, and the lower interest income due to nonperforming assets will continue to decrease in the remainder of 2022 as compared to the same periods in 2021. Short term interest rates as well as mortgage interest rates are expected to continue to rise. A continued rise in short term rates is likely to benefit the company as our competitors’ rates will rise faster than ours making us more competitive, but a continued rise in long term interest rates may negatively impact the housing industry as a whole, and therefore us.
We had $54,085 and $46,943 in loan assets, net as of June 30, 2022 and December 31, 2021, respectively. In addition, as of June 30, 2022, we had 226 commercial construction and 20 development loans with 60 borrowers in 21 states.
Net cash provided by operations increased $1,256 for the six months ended June 30, 2022 as compared to the same period of 2021. Our increase in operating cash flow was due primarily to net income and customer interest escrow. As of June 30, 2022, customer interest escrow included $500 for a Pennsylvania development loan.
| 18 |
Critical Accounting Estimates
To assist in evaluating our interim condensed consolidated financial statements, we describe below the critical accounting estimates that we use. We consider an accounting estimate to be critical if: (1) the accounting estimate requires us to make assumptions about matters that were highly uncertain at the time the accounting estimate was made, and (2) changes in the estimate that are reasonably likely to occur from period to period, or use of different estimates that we reasonably could have used, would have a material impact on our consolidated financial condition or results of operations. See our 2021 Form 10-K, as filed with the SEC, for more information on our critical accounting estimates. No material changes to our critical accounting estimates have occurred since December 31, 2021 unless listed below.
Loan Losses
Fair value of collateral has the potential to impact the calculation of the loan loss provision (the amount we have expensed over time in anticipation of loan losses we have not yet realized). Specifically, relevant to the allowance for loan loss reserve is the fair value of the underlying collateral supporting the outstanding loan balances. Fair value measurements are an exit price, representing the amount that would be received to sell an asset or paid to transfer a liability in an orderly transaction between market participants. Due to a rapidly changing economic market, an erratic housing market, the various methods that could be used to develop fair value estimates, and the various assumptions that could be used, determining the collateral’s fair value requires significant judgment.
| June 30, 2022 | ||||
| Loan Loss | ||||
| Provision | ||||
| Change in Fair Value Assumption | Higher/(Lower) | |||
| Increasing fair value of the real estate collateral by 35%* | $ | - | ||
| Decreasing fair value of the real estate collateral by 35%** | $ | 3,105 | ||
* Increases in the fair value of the real estate collateral do not impact the loan loss provision, as the value generally is not “written up.”
** Assumes the loans were nonperforming and a book amount of the loans outstanding of $54,085.
Foreclosed Assets
The fair value of real estate will impact our foreclosed asset value, which is recorded at 100% of fair value (after selling costs are deducted).
| June 30, 2022 | ||||
| Foreclosed | ||||
| Assets | ||||
| Change in Fair Value Assumption | Higher/(Lower) | |||
| Increasing fair value of the foreclosed asset by 35%* | $ | - | ||
| Decreasing fair value of the foreclosed asset by 35%** | $ | 303 | ||
* Increases in the fair value of the foreclosed assets do not impact the carrying value, as the value generally is not “written up.” Those gains would be recognized at the sale of the asset.
** Assumes a book amount of the foreclosed assets of $865.
| 19 |
Results of Operation
Interest Spread
The following table displays a comparison of our interest income, expense, fees, and spread:
| Three Months Ended | Six Months Ended | |||||||||||||||||||||||||||||||
| June 30, | June 30, | |||||||||||||||||||||||||||||||
| 2022 | 2021 | 2022 | 2021 | |||||||||||||||||||||||||||||
| Interest Income | * | * | * | * | ||||||||||||||||||||||||||||
| Estimated interest income | $ | 1,969 | 13 | % | $ | 1,531 | 12 | % | $ | 3,780 | 13 | % | $ | 3,039 | 12 | % | ||||||||||||||||
| Estimated unearned interest income due to COVID-19 | (166 | ) | (1 | )% | (227 | ) | (2 | )% | (353 | ) | (1 | )% | (494 | ) | (2 | )% | ||||||||||||||||
| Interest income on loans | $ | 1,803 | 12 | % | $ | 1,304 | 10 | % | $ | 3,427 | 12 | % | $ | 2,545 | 10 | % | ||||||||||||||||
| Fee income on loans | 871 | 6 | % | 870 | 7 | % | 1,788 | 6 | % | 1,598 | 6 | % | ||||||||||||||||||||
| Deferred loan fees | (158 | ) | (1 | )% | (230 | ) | (2 | )% | (338 | ) | (1 | )% | (421 | ) | (1 | )% | ||||||||||||||||
| Fee income on loans, net | 713 | 5 | % | 640 | 5 | % | 1,450 | 5 | % | 1,177 | 5 | % | ||||||||||||||||||||
| Interest and fee income on loans | 2,516 | 17 | % | 1,944 | 15 | % | 4,877 | 17 | % | 3,722 | 15 | % | ||||||||||||||||||||
| Interest expense unsecured | 664 | 4 | % | 762 | 6 | % | 1,333 | 4 | % | 1,531 | 6 | % | ||||||||||||||||||||
| Interest expense secured | 526 | 3 | % | 518 | 4 | % | 1,043 | 3 | % | 1,075 | 5 | % | ||||||||||||||||||||
| Amortization offering costs | 59 | 1 | % | 39 | - | % | 122 | 1 | % | 80 | - | % | ||||||||||||||||||||
| Interest expense | 1,249 | 8 | % | 1,319 | 10 | % | 2,498 | 8 | % | 2,686 | 11 | % | ||||||||||||||||||||
| Net interest income (spread) | 1,267 | 9 | % | 625 | 5 | % | 2,379 | 9 | % | 1,036 | 4 | % | ||||||||||||||||||||
| Weighted average outstanding loan asset balance | $ | 57,025 | $ | 50,222 | $ | 56,082 | $ | 50,247 | ||||||||||||||||||||||||
*Annualized amount as percentage of weighted average outstanding gross loan balance
There are three main components that can impact our interest spread:
● Difference between the interest rate received (on our loan assets) and the interest rate paid (on our borrowings). The loans we have originated have interest rates which are based on our cost of funds, with a minimum cost of funds of 7%. For most loans, the margin is fixed at 3%; however, for our development loans the margin is generally fixed at 7%. This component is also impacted by the lending of money with no interest cost (our equity).
Interest income on loans increased to 13% for both the quarter and six months ended June 30, 2022 compared to 12% for the same periods of the prior year. Interest expense decreased to 8% for both the quarter and six months ended June 30, 2022 compared to 10% and 11% for the same periods of the prior year. The decrease in the interest expense is due to the lowered effective interest rate of 8.90% for the period ended June 30, 2022 compared to 9.90% for the same period of the prior year. We reduced the balance of higher rate secured debt during the period ended June 30, 2022 compared to the same period of 2021.
We anticipate our standard margin to be 3% on all future construction loans and generally 7% on all development loans which yields a blended margin of approximately 3.6%. In July 2022 we changed our pricing model to decrease by 0.5% our pricing on all new construction loans during their first year, and increase pricing by 2.5% on those loans at all times after that. This pricing change is anticipated to lower profit in the remaining two quarters of 2022 by approximately $18 and in the first two quarters of 2023 by $54, however we anticipate that by the fourth quarter of 2023 the pricing change will increase our profitability. If all currently owned construction loans were currently using this pricing, our profitability would increase by $425 per year.
● Fee income. Our construction loan fee is 5% on the amount we commit to lend, which is amortized over the expected life of each loan. In addition, our development loans typically do not recognize a loan fee. When loans terminate before their expected maturity, the remaining fee is recognized at the termination of the loan. During the quarter and six months ended June 30, 2022 and 2021, fee income, net was 5%.
● Amount of nonperforming assets. Generally, two types of nonperforming assets negatively affect our interest spread: loans not paying interest and foreclosed assets.
| 20 |
As of June 30, 2022 and 2021, construction and development loans which did not accrue interest was $6,701 and $7,614, respectively.
Foreclosed assets do not provide a monthly interest return. As of June 30, 2022 and 2021, foreclosed assets were $865 and $2,724, respectively, which resulted in a negative impact to our interest spread in both years.
The amount of nonperforming assets is expected to decrease over the next quarter as we continue to liquidate nonperforming assets.
Loan Loss Provision
Loan loss provision (expense throughout the year) was $134 and $45 for the quarters ended June 30, 2022 and 2021, respectively. For the six months ended June 30, 2022 and 2021, loan loss expense was $208 and $259, respectively.
The allowance for loan losses at June 30, 2022 was $2,068 which primarily consisted of $232 for loans without specific reserves, $216 for loans with specific reserves and $1,620 for loans with specific reserves due to the impact of COVID-19.
As of December 31, 2021 the allowance for loan losses was $2,048 which primarily consisted of $163 for loans without specific reserves, $342 for loans with specific reserves, $60 for special mention loans and $1,483 for loans with specific reserves due to the impact of COVID-19.
During the six months ended June 30, 2022 and year ended December 31, 2021, we incurred $188 and $509 in direct charge offs, respectively.
Non-Interest Income
Gain on Sale of Foreclosed Assets
During the quarter ended June 30, 2022 and 2021, we recognized $101 and $13, respectively, as a gain on the sale of foreclosed assets. We sold two and one foreclosed assets which resulted in a gain on the sale for the quarters ended June 30, 2022 and 2021, respectively.
Gain on the sale of foreclosed assets was $101 for both six months ended June 30, 2022 and 2021. We sold two and five foreclosed assets which resulted in a gain on the sale for the six months ended June 30, 2022 and 2021, respectively.
Gain on the Extinguishment of Debt
During April 2020, the Company received a grant under the Economic Injury Disaster Loan Emergency Advance (the “EIDL Advance”) for $10 which was used for payroll and other certain operating expenses.
In February 2021, the full EIDL Advance or $10 and accrued interest were forgiven by the U.S. Small Business Administration.
| 21 |
Non-Interest Expense
Selling, General and Administrative (“SG&A”) Expenses
The following table displays our SG&A expenses:
Three Months Ended June 30, | Six Months Ended June 30, | |||||||||||||||
| 2022 | 2021 | 2022 | 2021 | |||||||||||||
| Legal and accounting | $ | 33 | $ | 23 | $ | 153 | $ | 126 | ||||||||
| Salaries and related expenses | 389 | 119 | 789 | 328 | ||||||||||||
| Board related expenses | 25 | 25 | 50 | 50 | ||||||||||||
| Advertising | 42 | 52 | 62 | 61 | ||||||||||||
| Rent and utilities | 28 | 13 | 43 | 22 | ||||||||||||
| Loan and foreclosed asset expenses | 109 | 124 | 142 | 237 | ||||||||||||
| Travel | 38 | 36 | 78 | 60 | ||||||||||||
| Other | 49 | 46 | 93 | 91 | ||||||||||||
| Total SG&A | $ | 713 | $ | 438 | $ | 1,410 | $ | 975 | ||||||||
Our SG&A expense increased $275 and $435 for the quarter and six months ended June 30, 2022, respectively, compared to the same periods of 2021, due primarily to salaries and related expense, partially offset by decreases in loan and foreclosed asset expenses. Salaries and related expenses increased $270 and $461 for the quarter and six months ended June 30, 2022, respectively, due primarily to:
| ● | Profit share expense was $127 and $195 for the quarter and six months ended June 30, 2022, respectively. No profit share expense was recognized during the same periods of the prior year; and | |
| ● | Employee retention credit was $96 for both the quarter and six months ended June 30, 2021. No employee retention credits were recognized in 2022. |
Loss on the Sale of Foreclosed Assets
During the quarters ended June 30, 2022 and 2021, we recognized $0 and $51, respectively, as a loss on the sale of foreclosed assets. During the six months ended June 30, 2022 and 2021, we recognized $0 and $69, respectively, as a loss on the sale of foreclosed assets.
Impairment Loss on Foreclosed Assets
During the quarter and six months ended June 30, 2022 no impairment loss on foreclosed assets were recognized. During the quarter and six months ended June 30, 2021, impairment loss on foreclosed assets was $0 and $10, respectively.
Consolidated Financial Position
Loans Receivable
Commercial Loans – Construction Loan Portfolio Summary
We anticipate that the aggregate balance of our construction loan portfolio will increase during the third quarter of 2022 because: 1) Payoffs are slowing as builders sales are slowing some, 2) housing starts are down which should reduce competition between builders for labor and should allow for faster construction which will initially increase the balances, and 3) we had strong originations in the first two quarters of 2022 and those loans will be growing in balance during the third quarter.
| 22 |
The following is a summary of our loan portfolio to builders for home construction loans as of June 30, 2022:
| State | Number of Borrowers | Number of Loans | Value of Collateral(1) | Commitment Amount | Amount Outstanding | Loan to Value Ratio(2) | Loan Fee | |||||||||||||||||||||
| Arizona | 1 | 2 | $ | 767 | $ | 537 | $ | 93 | 70 | % | 5 | % | ||||||||||||||||
| Connecticut | 2 | 4 | 1,659 | 1,210 | 987 | 73 | % | 5 | % | |||||||||||||||||||
| Delaware | 1 | 6 | 7,865 | 3,255 | 2,372 | 41 | % | 5 | % | |||||||||||||||||||
| Florida | 18 | 98 | 35,176 | 26,057 | 16,881 | 74 | % | 5 | % | |||||||||||||||||||
| Georgia | 5 | 7 | 3,590 | 2,020 | 1,068 | 56 | % | 5 | % | |||||||||||||||||||
| Illinois | 2 | 2 | 1,890 | 1,199 | 897 | 63 | % | 5 | % | |||||||||||||||||||
| Indiana | 1 | 1 | 624 | 437 | 426 | 70 | % | 5 | % | |||||||||||||||||||
| Louisiana | 2 | 4 | 935 | 623 | 390 | 67 | % | 5 | % | |||||||||||||||||||
| Michigan | 2 | 5 | 1,443 | 1,138 | 1.072 | 79 | % | 5 | % | |||||||||||||||||||
| New Jersey | 1 | 5 | 2,687 | 2,259 | 2,233 | 84 | % | 5 | % | |||||||||||||||||||
| New York | 1 | 2 | 1,265 | 878 | 793 | 69 | % | 5 | % | |||||||||||||||||||
| North Carolina | 6 | 14 | 6,544 | 3,940 | 1,897 | 60 | % | 5 | % | |||||||||||||||||||
| Ohio | 2 | 9 | 3,086 | 2,132 | 1,640 | 69 | % | 5 | % | |||||||||||||||||||
| Oregon | 1 | 1 | 550 | 385 | 304 | 70 | % | 5 | % | |||||||||||||||||||
| Pennsylvania | 1 | 25 | 28,361 | 17,923 | 11,931 | 63 | % | 5 | % | |||||||||||||||||||
| South Carolina | 8 | 22 | 5,905 | 4,274 | 2,527 | 72 | % | 5 | % | |||||||||||||||||||
| Tennessee | 2 | 2 | 965 | 583 | 282 | 60 | % | 5 | % | |||||||||||||||||||
| Texas | 1 | 4 | 2,548 | 1,659 | 1,126 | 65 | % | 5 | % | |||||||||||||||||||
| Utah | 1 | 3 | 1,522 | 1,156 | 856 | 76 | % | 5 | % | |||||||||||||||||||
| Virginia | 1 | 1 | 297 | 195 | 97 | 66 | % | 5 | % | |||||||||||||||||||
| Washington | 1 | 9 | 5,270 | 3,418 | 1,538 | 65 | % | 5 | % | |||||||||||||||||||
| Total | 60 | 226 | $ | 112,949 | $ | 75,278 | $ | 49,410 | 67 | %(3) | 5 | % | ||||||||||||||||
| (1) | The value is determined by the appraised value. | |
| (2) | The loan to value ratio is calculated by taking the commitment amount and dividing by the appraised value. | |
| (3) | Represents the weighted average loan to value ratio of the loans. |
The following is a summary of our loan portfolio to builders for home construction loans as of December 31, 2021:
(All dollar [$] amounts shown in table in thousands.)
| State | Number of Borrowers | Number of Loans | Value of Collateral(1) | Commitment Amount | Gross Amount Outstanding | Loan to Value Ratio(2) | Loan Fee | |||||||||||||||||||||
| Arizona | 2 | 3 | $ | 995 | $ | 697 | $ | 390 | 70 | % | 5 | % | ||||||||||||||||
| Connecticut | 2 | 4 | 1,535 | 1,084 | 719 | 71 | % | 5 | % | |||||||||||||||||||
| Delaware | 1 | 6 | 5,960 | 2,387 | 1,817 | 40 | % | 5 | % | |||||||||||||||||||
| Florida | 18 | 88 | 28,922 | 21,787 | 13,649 | 75 | % | 5 | % | |||||||||||||||||||
| Georgia | 2 | 2 | 1,130 | 631 | 366 | 56 | % | 5 | % | |||||||||||||||||||
| Illinois | 2 | 2 | 1,890 | 1,199 | 627 | 63 | % | 5 | % | |||||||||||||||||||
| Indiana | 1 | 1 | 624 | 436 | 347 | 70 | % | 5 | % | |||||||||||||||||||
| Louisiana | 2 | 3 | 590 | 387 | 125 | 66 | % | 5 | % | |||||||||||||||||||
| Michigan | 2 | 12 | 3,431 | 2,586 | 2,299 | 75 | % | 5 | % | |||||||||||||||||||
| New Jersey | 1 | 7 | 2,382 | 1,910 | 1,664 | 80 | % | 5 | % | |||||||||||||||||||
| New York | 1 | 1 | 525 | 378 | 305 | 72 | % | 5 | % | |||||||||||||||||||
| North Carolina | 8 | 14 | 7,141 | 4,349 | 2,105 | 61 | % | 5 | % | |||||||||||||||||||
| Ohio | 2 | 9 | 2,929 | 2,132 | 1,105 | 73 | % | 5 | % | |||||||||||||||||||
| Oregon | 2 | 2 | 923 | 646 | 440 | 70 | % | 5 | % | |||||||||||||||||||
| Pennsylvania | 2 | 20 | 21,867 | 13,487 | 10,078 | 62 | % | 5 | % | |||||||||||||||||||
| South Carolina | 10 | 32 | 8,353 | 5,793 | 3,579 | 69 | % | 5 | % | |||||||||||||||||||
| Tennessee | 2 | 2 | 940 | 582 | 319 | 62 | % | 5 | % | |||||||||||||||||||
| Texas | 2 | 5 | 2,873 | 1,750 | 549 | 61 | % | 5 | % | |||||||||||||||||||
| Virginia | 3 | 3 | 1,140 | 765 | 519 | 67 | % | 5 | % | |||||||||||||||||||
| Washington | 1 | 8 | 4,785 | 3,022 | 2,104 | 63 | % | 5 | % | |||||||||||||||||||
| Total | 66 | 224 | $ | 98,935 | $ | 66,008 | $ | 43,106 | 67 | %(3) | 5 | % | ||||||||||||||||
| (1) | The value is determined by the appraised value. | |
| (2) | The loan to value ratio is calculated by taking the commitment amount and dividing by the appraised value. | |
| (3) | Represents the weighted average loan to value ratio of the loans. |
| 23 |
Commercial Loans – Real Estate Development Loan Portfolio Summary
The following is a summary of our loan portfolio to builders for land development as of June 30, 2022:
| States | Number of Borrowers | Number of Loans | Value of Collateral(1) | Commitment Amount(2) | Gross Amount Outstanding | Loan to Value Ratio(3) | Interest Spread | |||||||||||||||||||||
| Pennsylvania | 1 | 5 | $ | 16,572 | $ | 8,500 | $ | 6,674 | 40 | % | varies | |||||||||||||||||
| Connecticut | 1 | 1 | 250 | 180 | 213 | 85 | % | 7 | % | |||||||||||||||||||
| Delaware | 1 | 1 | 543 | 147 | 147 | 27 | % | 7 | % | |||||||||||||||||||
| Florida | 4 | 4 | 778 | 1,195 | 438 | 56 | % | 7 | % | |||||||||||||||||||
| New Jersey | 1 | 2 | 100 | 52 | 51 | 51 | % | 7 | % | |||||||||||||||||||
| Georgia | 1 | 1 | - | 24 | 24 | 100 | % | 7 | % | |||||||||||||||||||
| Texas | 1 | 1 | - | 125 | (28 | ) | 100 | % | 7 | % | ||||||||||||||||||
| Michigan | 1 | 1 | 53 | 32 | 32 | 60 | % | 7 | % | |||||||||||||||||||
| South Carolina | 3 | 4 | 1,407 | 1,386 | 1,387 | 99 | % | 7 | % | |||||||||||||||||||
| Total | 14 | 20 | $ | 19,703 | $ | 11,641 | $ | 8,938 | 45 | %(4) | 7 | % | ||||||||||||||||
| (1) | The value is determined by the appraised value adjusted for remaining costs to be paid and third-party mortgage balances. Part of this collateral is $1,860 of preferred equity in our Company. In the event of a foreclosure on the property securing these loans, the portion of our collateral that is preferred equity in our Company might be difficult to sell, which could impact our ability to eliminate the loan balance. | |
| (2) | The commitment amount does not include unfunded letters of credit. | |
| (3) | The loan to value ratio is calculated by taking the outstanding amount and dividing by the appraised value calculated as described above. | |
| (4) | Represents the weighted average loan to value ratio of the loans. |
The following is a summary of our loan portfolio to builders for land development as of December 31, 2021:
(All dollar [$] amounts shown in table in thousands.)
| States | Number of Borrowers | Number of Loans | Value of Collateral(1) | Commitment Amount(2) | Gross Amount Outstanding | Loan to Value Ratio(3) | Interest Spread | |||||||||||||||||||||
| Pennsylvania | 1 | 4 | $ | 9,312 | $ | 6,500 | $ | 6,103 | 66 | % | varies | |||||||||||||||||
| Florida | 5 | 5 | 816 | 1,297 | 611 | 75 | % | 7 | % | |||||||||||||||||||
| Texas | 1 | 1 | 70 | 125 | 77 | 110 | % | 7 | % | |||||||||||||||||||
| Connecticut | 1 | 1 | 350 | 180 | 180 | 51 | % | 7 | % | |||||||||||||||||||
| Delaware | 1 | 1 | 543 | 147 | 147 | 27 | % | 7 | % | |||||||||||||||||||
| South Carolina | 3 | 3 | 1,373 | 846 | 539 | 39 | % | 7 | % | |||||||||||||||||||
| Total | 12 | 15 | $ | 12,464 | $ | 9,095 | $ | 7,657 | 61 | %(4) | 7 | % | ||||||||||||||||
| (1) | The value is determined by the appraised value adjusted for remaining costs to be paid and third-party mortgage balances. Part of this collateral is $1,720 of preferred equity in our Company. In the event of a foreclosure on the property securing these loans, the portion of our collateral that is preferred equity in our Company might be difficult to sell, which could impact our ability to eliminate the loan balance. |
| 24 |
| (2) | The commitment amount does not include unfunded letters of credit. |
| (3) | The loan to value ratio is calculated by taking the outstanding amount and dividing by the appraised value calculated as described above. |
| (4) | Represents the weighted average loan to value ratio of the loans. |
Combined Loan Portfolio Summary
Financing receivables are comprised of the following as of June 30, 2022 and December 31, 2021:
| June 30, 2022 | December 31, 2021 | |||||||
| Loans receivable, gross | $ | 58,348 | $ | 50,763 | ||||
| Less: Deferred loan fees | (1,609 | ) | (1,143 | ) | ||||
| Less: Deposits | (909 | ) | (934 | ) | ||||
| Plus: Deferred origination costs | 323 | 305 | ||||||
| Less: Allowance for loan losses | (2,068 | ) | (2,048 | ) | ||||
| Loans receivable, net | $ | 54,085 | $ | 46,943 | ||||
The following is a roll forward of combined loans:
Six Months Ended June 30, 2022 | Year Ended December 31, 2021 | Six Months Ended June 30, 2021 | ||||||||||
| Beginning balance | $ | 46,943 | $ | 46,405 | $ | 46,405 | ||||||
| Originations and modifications | 29,474 | 45,395 | 21,776 | |||||||||
| Principal collections | (23,803 | ) | (44,290 | ) | (23,171 | ) | ||||||
| Transferred from (to) foreclosed assets | 1,017 | (791 | ) | (274 | ) | |||||||
| Change in builder deposit | 26 | 403 | 60 | |||||||||
| Change in the allowance for loan losses | (20 | ) | (80 | ) | 249 | |||||||
| Change in loan fees, net | 448 | (99 | ) | 488 | ||||||||
| Ending balance | $ | 54,085 | $ | 46,943 | $ | 45,533 | ||||||
Finance Receivables – By risk rating:
| June 30, 2022 | December 31, 2021 | |||||||
| Pass | $ | 50,904 | $ | 38,893 | ||||
| Special mention | 743 | 2,344 | ||||||
| Classified – accruing | – | – | ||||||
| Classified – nonaccrual | 6,701 | 9,526 | ||||||
| Total | $ | 58,348 | $ | 50,763 | ||||
| 25 |
Finance Receivables – Method of impairment calculation:
| June 30, 2022 | December 31, 2021 | |||||||
| Performing loans evaluated individually | $ | 18,605 | $ | 16,495 | ||||
| Performing loans evaluated collectively | 33,042 | 24,742 | ||||||
| Non-performing loans without a specific reserve | 796 | 596 | ||||||
| Non-performing loans with a specific reserve | 5,905 | 8,930 | ||||||
| Total evaluated collectively for loan losses | $ | 58,348 | $ | 50,763 | ||||
At June 30, 2022 and December 31, 2021, there were no loans acquired with deteriorated credit quality.
Impaired Loans
The following is a summary of our impaired non-accrual (non-performing) commercial construction loans as of June 30, 2022 and December 31, 2021.
| June 30, 2022 | December 31, 2021 | |||||||
| Unpaid principal balance (contractual obligation from customer) | $ | 6,889 | $ | 10,035 | ||||
| Charge-offs and payments applied | (188 | ) | (509 | ) | ||||
| Gross value before related allowance | 6,701 | 9,526 | ||||||
| Related allowance | (1,835 | ) | (1,825 | ) | ||||
| Value after allowance | $ | 4,866 | $ | 7,701 | ||||
Below is an aging schedule of loans receivable as of June 30, 2022, on a recency basis:
No. Loans | Unpaid Balances | % | ||||||||||
| Current loans (current accounts and accounts on which more than 50% of an original contract payment was made in the last 59 days) | 232 | $ | 51,647 | 88 | % | |||||||
| 60-89 days | - | - | - | % | ||||||||
| 90-179 days | 4 | 788 | 2 | % | ||||||||
| 180-269 days | 4 | 742 | 2 | % | ||||||||
| >270 days | 6 | 5,171 | 8 | % | ||||||||
| Subtotal | 246 | $ | 58,348 | 100 | % | |||||||
| Interest only accounts (Accounts on which interest, deferment, extension and/or default charges were received in the last 60 days) | - | $ | - | - | % | |||||||
| Partial Payment accounts (Accounts on which the total received in the last 60 days was less than 50% of the original contractual monthly payment. “Total received” to include interest on simple interest accounts, as well as late charges on deferment charges on pre-computed accounts.) | - | $ | - | - | % | |||||||
| Total | 246 | $ | 58,348 | 100 | % | |||||||
| 26 |
Below is an aging schedule of loans receivable as of December 31, 2021, on a recency basis:
No. Loans | Unpaid Balances | % | ||||||||||
| Current loans (current accounts and accounts on which more than 50% of an original contract payment was made in the last 59 days) | 216 | $ | 41,238 | 81.2 | % | |||||||
| 60-89 days | 1 | 203 | 0.4 | % | ||||||||
| 90-179 days | 10 | 2,058 | 4.1 | % | ||||||||
| 180-269 days | 1 | 392 | 0.8 | % | ||||||||
| >270 days | 11 | 6,872 | 13.5 | % | ||||||||
| Subtotal | 239 | $ | 50,763 | 100 | % | |||||||
| Interest only accounts (Accounts on which interest, deferment, extension and/or default charges were received in the last 60 days) | - | $ | - | - | % | |||||||
| Partial Payment accounts (Accounts on which the total received in the last 60 days was less than 50% of the original contractual monthly payment. “Total received” to include interest on simple interest accounts, as well as late charges on deferment charges on pre-computed accounts.) | - | $ | - | - | % | |||||||
| Total | 239 | $ | 50,763 | 100 | % | |||||||
Below is an aging schedule of loans receivable as of June 30, 2022, on a contractual basis:
No. Loans | Unpaid Balances | % | ||||||||||
| Contractual Terms - All current Direct Loans and Sales Finance Contracts with installments past due less than 60 days from due date. | 232 | $ | 51,647 | 88 | % | |||||||
| 60-89 days | - | - | - | % | ||||||||
| 90-179 days | 4 | 788 | 2 | % | ||||||||
| 180-269 days | 4 | 742 | 2 | % | ||||||||
| >270 days | 6 | 5,171 | 8 | % | ||||||||
| Subtotal | 246 | $ | 58,348 | 100 | % | |||||||
| Interest only accounts (Accounts on which interest, deferment, extension and/or default charges were received in the last 60 days) | - | $ | - | - | % | |||||||
| Partial Payment accounts (Accounts on which the total received in the last 60 days was less than 50% of the original contractual monthly payment. “Total received” to include interest on simple interest accounts, as well as late charges on deferment charges on pre-computed accounts.) | - | $ | - | - | % | |||||||
| Total | 246 | $ | 58,348 | 100 | % | |||||||
| 27 |
Below is an aging schedule of loans receivable as of December 31, 2021, on a contractual basis:
No. Loans | Unpaid Balances | % | ||||||||||
| Contractual Terms - All current Direct Loans and Sales Finance Contracts with installments past due less than 60 days from due date. | 216 | $ | 41,238 | 81.2 | % | |||||||
| 60-89 days | 1 | 203 | 0.4 | % | ||||||||
| 90-179 days | 10 | 2,058 | 4.1 | % | ||||||||
| 180-269 days | 1 | 392 | 0.8 | % | ||||||||
| >270 days | 11 | 6,872 | 13.5 | % | ||||||||
| Subtotal | 239 | $ | 50,763 | 100 | % | |||||||
| Interest only accounts (Accounts on which interest, deferment, extension and/or default charges were received in the last 60 days) | - | $ | - | - | % | |||||||
| Partial Payment accounts (Accounts on which the total received in the last 60 days was less than 50% of the original contractual monthly payment. “Total received” to include interest on simple interest accounts, as well as late charges on deferment charges on pre-computed accounts.) | - | $ | - | - | % | |||||||
| Total | 239 | $ | 50,763 | 100 | % | |||||||
Foreclosed Assets
Below is a roll forward of foreclosed assets:
Six Months Ended June 30, 2022 | Year Ended December 31, 2021 | Six Months Ended June 30, 2021 | ||||||||||
| Beginning balance | $ | 2,724 | $ | 4,449 | $ | 4,449 | ||||||
| Transfers (to) from loan receivables, net | (1,017 | ) | 791 | 274 | ||||||||
| Additions for construction/development | 153 | 818 | 439 | |||||||||
| Sale proceeds | (1,096 | ) | (3,418 | ) | (2,119 | ) | ||||||
| Loss on foreclosure | - | (47 | ) | - | ||||||||
| Loss on sale of foreclosed assets | - | (92 | ) | (69 | ) | |||||||
| Gain on foreclosure | - | 67 | - | |||||||||
| Gain on sale of foreclosed assets | 101 | 166 | 101 | |||||||||
| Impairment loss on foreclosed assets | - | (10 | ) | (10 | ) | |||||||
| Ending balance | $ | 865 | $ | 2,724 | $ | 3,065 | ||||||
During the quarter and six months ended June 30, 2022 and 2021, we sold two and three foreclosed assets and two and 12 foreclosed assets, respectively. In addition, we transferred one asset from foreclosed assets to loans receivable, net during the six months ended June 30, 2022. We transferred one loan receivable to foreclosed assets during the six months ended June 30, 2021.
| 28 |
Customer Interest Escrow
Below is a roll forward of interest escrow:
Six Months Ended June 30, 2022 | Year Ended December 31, 2021 | Six Months Ended June 30, 2020 | ||||||||||
| Beginning balance | $ | 479 | $ | 510 | $ | 510 | ||||||
| Preferred equity dividends | 87 | 230 | 106 | |||||||||
| Additions from Pennsylvania loans | 1,085 | 513 | 297 | |||||||||
| Additions from other loans | 204 | 720 | 488 | |||||||||
| Interest, fees, principal or repaid to borrower | (796 | ) | (1,494 | ) | (874 | ) | ||||||
| Ending balance | $ | 1,059 | $ | 479 | $ | 527 | ||||||
Related Party Borrowings
As of June 30, 2022, the Company had $1,250, $250, and $656 available to borrow against the line of credit from Daniel M. Wallach (our Chief Executive Officer and chairman of the board of managers) and his wife, the line of credit from the 2007 Daniel M. Wallach Legacy Trust, and the line of credit from William Myrick (our Executive Vice President), respectively. A more detailed description is included in Note 7 to the 2021 Financial Statements. These borrowings are included in notes payable secured, net of deferred financing costs on the interim condensed consolidated balance sheet.
During the six months ended June 30, 2022, Mr. Myrick originated one loan for approximately $24 and the Company services the loan and in return received a 5% loan fee. In addition, $653 was borrowed against the Myrick LOC to fund construction on the three loans originated by Mr. Myrick. During the quarter ended June 30, 2022, an additional $138 was added to the Myrick LOC.
As of December 31, 2021, the Company serviced two loans originated by Mr. Myrick for which it received a 5% loan fee and borrowed $141 against the Myrick LOC to originate and fund construction on the two such loans.
Secured Borrowings
Lines of Credit
As of June 30, 2022 and December 31, 2021, the Company had $344 and $859 borrowed against its lines of credit from affiliates, respectively, which have a total limit of $2,500.
None of our lines of credit have given us notice of nonrenewal during the second quarter of 2022, and the lines will continue to automatically renew unless notice of nonrenewal is given by a lender.
Secured Deferred Financing Costs
The Company had secured deferred financing costs of $7 and $8 as of June 30, 2022 and December 31, 2021, respectively.
Summary
The borrowings secured by loan assets are summarized below:
| June 30, 2022 | December 31, 2021 | |||||||||||||||
Book Value of Loans which Served as Collateral | Due from Shepherd’s Finance to Loan Purchaser or Lender | Book Value of Loans which Served as Collateral | Due from Shepherd’s Finance to Loan Purchaser or Lender | |||||||||||||
| Loan Purchaser | ||||||||||||||||
| Builder Finance | $ | 6,771 | $ | 4,905 | $ | 4,847 | $ | 2,969 | ||||||||
| S.K. Funding | 10,873 | 6,300 | 8,084 | 5,500 | ||||||||||||
| Lender | ||||||||||||||||
| Shuman | 527 | 125 | 566 | 125 | ||||||||||||
| Jeff Eppinger | 3,586 | 1,500 | 3,328 | 1,500 | ||||||||||||
| R. Scott Summers | 1,606 | 847 | 1,475 | 847 | ||||||||||||
| John C. Solomon | 993 | 563 | 1,139 | 563 | ||||||||||||
| Judith Y. Swanson | 11,009 | 7,000 | 9,803 | 6,841 | ||||||||||||
| Total | $ | 35,365 | $ | 21,240 | $ | 29,242 | $ | 18,345 | ||||||||
| 29 |
Unsecured Borrowings
Unsecured Notes through the Public Offering (“Notes Program”)
The effective interest rate on borrowings through our Notes Program at June 30, 2022 and December 31, 2021 was 8.90% and 9.28%, respectively, not including the amortization of deferred financing costs. We generally offer four durations at any given time, ranging from 12 to 48 months from the date of issuance. There are limited rights of early redemption. Our 36-month Note has a mandatory early redemption option, subject to certain conditions. The following table shows the roll forward of our Notes Program:
Six Months Ended June 30, 2022 | Year Ended December 31, 2021 | Six Months Ended June 30, 2021 | ||||||||||
| Gross Notes outstanding, beginning of period | $ | 20,636 | $ | 21,482 | $ | 21,482 | ||||||
| Notes issued | 1,303 | 7,876 | 6,330 | |||||||||
| Note repayments / redemptions | (1,590 | ) | (8,722 | ) | (6,213 | ) | ||||||
| Gross Notes outstanding, end of period | $ | 20,349 | $ | 20,636 | $ | 21,599 | ||||||
| Less deferred financing costs, net | (383 | ) | (367 | ) | (407 | ) | ||||||
| Notes outstanding, net | $ | 19,966 | $ | 20,269 | $ | 21,192 | ||||||
The following is a roll forward of deferred financing costs:
Six Months Ended June 30, 2022 | Year Ended December 31, 2021 | Six Months Ended June 30, 2021 | ||||||||||
| Deferred financing costs, beginning balance | $ | 1,061 | $ | 942 | $ | 942 | ||||||
| Additions | 138 | 119 | 71 | |||||||||
| Deferred financing costs, ending balance | 1,199 | 1,061 | 1,013 | |||||||||
| Less accumulated amortization | (816 | ) | (694 | ) | (606 | ) | ||||||
| Deferred financing costs, net | $ | 383 | $ | 367 | $ | 407 | ||||||
| 30 |
The following is a roll forward of the accumulated amortization of deferred financing costs:
Six Months Ended June 30, 2022 | Year Ended December 31, 2021 | Six Months Ended June 30, 2021 | ||||||||||
| Accumulated amortization, beginning balance | $ | 694 | $ | 526 | $ | 526 | ||||||
| Additions | 122 | 168 | 80 | |||||||||
| Accumulated amortization, ending balance | $ | 816 | $ | 694 | $ | 606 | ||||||
Other Unsecured Debts
Our other unsecured debts are detailed below:
| Principal Amount Outstanding as of | ||||||||||||||
| Loan | Maturity Date | Interest Rate(1) | June 30, 2022 | December 31, 2021 | ||||||||||
| Unsecured Note with Seven Kings Holdings, Inc. | Demand(2) | 9.5 | % | $ | 500 | $ | 500 | |||||||
| Unsecured Line of Credit from Swanson | July 2022 | 10.0 | % | - | 159 | |||||||||
| Unsecured Line of Credit from Builder Finance, Inc. | January 2023 | 10.0 | % | 750 | 750 | |||||||||
| Subordinated Promissory Note | April 2024 | 10.0 | % | 100 | 100 | |||||||||
| Subordinated Promissory Note | August 2022 | 11.0 | % | 200 | 200 | |||||||||
| Subordinated Promissory Note | February 2023 | 10.0 | % | 600 | 600 | |||||||||
| Subordinated Promissory Note | June 2023 | 10.0 | % | 400 | 400 | |||||||||
| Subordinated Promissory Note | March 2024 | 9.75 | % | 500 | - | |||||||||
| Subordinated Promissory Note | December 2022 | 5.0 | % | 3 | 3 | |||||||||
| Subordinated Promissory Note | December 2023 | 11.0 | % | 20 | 20 | |||||||||
| Subordinated Promissory Note | February 2024 | 11.0 | % | 20 | 20 | |||||||||
| Subordinated Promissory Note | January 2025 | 10.0 | % | 15 | 15 | |||||||||
| Subordinated Promissory Note | January 2026 | 8.0 | % | 10 | - | |||||||||
| Subordinated Promissory Note | November 2023 | 9.5 | % | 200 | 200 | |||||||||
| Subordinated Promissory Note | October 2024 | 10.0 | % | 700 | 700 | |||||||||
| Subordinated Promissory Note | December 2024 | 10.0 | % | 100 | 100 | |||||||||
| Subordinated Promissory Note | April 2025 | 10.0 | % | 202 | 202 | |||||||||
| Subordinated Promissory Note | July 2023 | 8.0 | % | 100 | 100 | |||||||||
| Subordinated Promissory Note | July 2024 | 5.0 | % | - | 1,500 | |||||||||
| Subordinated Promissory Note | September 2023 | 7.0 | % | 94 | 94 | |||||||||
| Subordinated Promissory Note | October 2023 | 7.0 | % | 100 | 100 | |||||||||
| Subordinated Promissory Note | December 2025 | 8.0 | % | 180 | 180 | |||||||||
| Senior Subordinated Promissory Note | March 2026(3) | 10.0 | % | - | 334 | |||||||||
| Senior Subordinated Promissory Note | March 2026(3) | 8.0 | % | 375 | - | |||||||||
| Senior Subordinated Promissory Note | October 2024(4) | 1.0 | % | 720 | 720 | |||||||||
| Junior Subordinated Promissory Note | October 2024(4) | 20.0 | % | 447 | 447 | |||||||||
| $ | 6,336 | $ | 7,444 | |||||||||||
| (1) | Interest rate per annum, based upon actual days outstanding and a 365/366-day year. |
| 31 |
| (2) | Due six months after lender gives notice. |
| (3) | Lender may require us to repay $20 of principal and all unpaid interest with 10 days’ notice. |
| (4) | These notes were issued to the same holder and, when calculated together, yield a blended return of 10% per annum. |
Redeemable Preferred Equity and Members’ Capital
We strive to maintain a reasonable (about 15%) balance between (1) redeemable preferred equity plus members’ capital and (2) total assets. The ratio of redeemable preferred equity plus members’ capital to total assets was 14% as of June 30, 2022 and December 31, 2021. We anticipate this ratio to increase as more earnings are retained in 2022 and some additional preferred equity may be added.
Priority of Borrowings
The following table displays our borrowings and a ranking of priority. The lower the number, the higher the priority.
Priority Rank | June 30, 2022 | December 31, 2021 | ||||||||||
| Borrowing Source | ||||||||||||
| Purchase and sale agreements and other secured borrowings | 1 | $ | 22,051 | $ | 19,165 | |||||||
| Secured lines of credit from affiliates | 2 | 344 | 859 | |||||||||
| Unsecured line of credit (senior) | 3 | 1,250 | 1,250 | |||||||||
| Other unsecured debt (senior subordinated) | 4 | 1,094 | 1,053 | |||||||||
| Unsecured Notes through our public offering, gross | 5 | 20,349 | 20,636 | |||||||||
| Other unsecured debt (subordinated) | 5 | 3,545 | 4,693 | |||||||||
| Other unsecured debt (junior subordinated) | 6 | 447 | 447 | |||||||||
| Total | $ | 49,080 | $ | 48,103 | ||||||||
Liquidity and Capital Resources
Our primary liquidity management objective is to meet expected cash flow needs while continuing to service our business and customers. We had 246 and 239 combined loans outstanding as of June 30, 2022 and December 31, 2021, respectively. Gross loans receivable totaled $58,348 and $50,763 as of June 30, 2022 and December 31, 2021, respectively. Our unfunded commitments to extend credit, which have similar collateral, credit and market risk to our outstanding loans, were $25,869 and $22,902 as June 30, 2022 and December 31, 2021, respectively.
| 32 |
We anticipate an increase in our gross loan receivables over the 12 months subsequent to June 30, 2022 by directly increasing originations to new and existing customers, and a slowing in payoffs due to housing market cooling.
To fund our combined loans, we rely on secured debt, unsecured debt, equity and cash which are described in the following table:
| Source of Liquidity | As of June 30, 2022 | As of December 31, 2021 | ||||||
| Secured debt, net of deferred financing costs | $ | 22,388 | $ | 20,016 | ||||
| Unsecured debt, net of deferred financing costs | 26,302 | 27,713 | ||||||
| Equity* | 7,409 | 6,604 | ||||||
| Cash | 1,126 | 3,735 | ||||||
*Equity includes Members’ Capital and Redeemable Preferred Equity.
As of June 30, 2022 and December 31, 2021, cash was $1,126 and $3,735, respectively.
Secured debt, net of deferred financing costs increased $2,372 to $22,388 as of June 30, 2022 compared to $20,016 for the year ended December 31, 2021 which was primarily related to borrowings on our purchase and sale agreements. We anticipate secured debt to increase as our loan receivable balances increase.
Unsecured debt, net of deferred financing costs decreased $1,411 to $26,302 as of June 30, 2022 compared to $27,713 for the year ended December 31, 2021. The decrease in unsecured debt primarily related to repayment of unsecured notes at maturity, those notes sold outside of our Notes Program.
Equity increased $805 to $7,409 as of June 30, 2022 compared to $6,604 for the year ended December 31, 2021. The increase was due primarily to earned but not paid distributions of Series C preferred equity holders. In addition, investments in Series C increased $200.
We anticipate an increase in our equity during the 12 months subsequent to June 30, 2022, through retaining earnings. If we are not able to increase our equity through retained earnings, we will rely more heavily on raising additional funds through the Notes Program.
The total amount of our debt maturing through year ending December 31, 2022 is $25,564, which consists of secured borrowings of $21,592 and unsecured borrowings of $3,972.
Secured borrowings maturing through the year ending December 31, 2022 primarily consists of loan purchase and sale agreements with two loan purchasers (Builder Finance and S. K. Funding) and six lenders. These secured borrowings are listed as maturing over the next 12 months due to their related demand loan collateral. The following are secured facilities listed as maturing in 2022 with actual maturity and renewal dates:
| ● | Swanson – $7,000 due October 2023 and automatically renews unless notice given; | |
| ● | Shuman – $125 due July 2023 and automatically renews unless notice is given; | |
| ● | S. K. Funding – $4,500 due January 2023 and automatically renews unless notice is given; | |
| ● | S. K. Funding – $1,800 of the total due January 2023 and automatically renews unless notice is given; | |
| ● | Builder Finance, Inc – $4,905 with no expiration date; | |
| ● | New LOC Agreements - $2,909 due generally with one-month notice and six months to reduce principal balance to zero; | |
| ● | Myrick LOC - $344 due upon demand; and | |
| ● | Mortgage Payable – $10 due monthly. |
| 33 |
Unsecured borrowings due by December 31, 2022 consist of Notes issued pursuant to the Notes Program and other unsecured debt of $3,269 and $703, respectively. To the extent that Notes issued pursuant to the Notes Program are not reinvested upon maturity, we will be required to fund the maturities, which we anticipate funding through the issuance of new Notes in our Notes Program. Historically, approximately 74% of our Note holders reinvest upon maturity. The 36 month Note in our Notes program has a mandatory early redemption option, subject to certain conditions. As of June 30, 2022, outstanding 36-month Notes totaled $385. Our other unsecured debt historically renews. For more information on other unsecured borrowings, see Note 7 – Borrowings. If other unsecured borrowings are not renewed in the future, we anticipate funding such maturities through investments in our Notes Program.
Summary
We have the funding available to address the loans we have today, including our unfunded commitments. We anticipate growing our assets through the net sources and uses (12-month liquidity) listed above as well as future capital increases from debt, redeemable preferred equity, and regular equity. Our expectation to grow loan asset balances is subject to changes due to changes in demand, competition, and the economy. Although our secured debt is almost entirely listed as currently due because of the underlying collateral being demand notes, the vast majority of our secured debt is either contractually set to automatically renew unless notice is given or, in the case of purchase and sale agreements, has no end date as to when the purchasers will not purchase new loans (although they are never required to purchase additional loans).
Inflation, Interest Rates, and Housing Starts
Since we are in the housing industry, we are affected by factors that impact that industry. Housing starts impact our customers’ ability to sell their homes. Faster sales generally mean higher effective interest rates for us, as the recognition of fees we charge is spread over a shorter period. Slower sales generally mean lower effective interest rates for us. Slower sales also are likely to increase the default rate we experience.
Housing inflation has a positive impact on our operations. When we lend initially, we are lending a percentage of a home’s expected value, based on historical sales. If those estimates prove to be low (in an inflationary market), the percentage we loaned of the value actually decreases, reducing potential losses on defaulted loans. The opposite is true in a deflationary housing price market. It is our opinion that values are well above average in many of the housing markets in the U.S. today, and our lending against these values is having more risk than prior years. In some of our markets, prices of sold homes are dropping. This is both because some homes are selling for less and because the average home selling is smaller (more affordable).
Interest rates have several impacts on our business. First, rates affect housing (starts, home size, etc.). High long-term interest rates may decrease housing starts, having the effects listed above. We can see this impact now as housing starts recently dropped by 20%. Higher interest rates will also affect our investors. We believe that there will be a spread between the rate our Notes yield to our investors and the rates the same investors could get on deposits at FDIC insured institutions. We also believe that the spread may need to widen if these rates rise. For instance, if we pay 7% above average CD rates when CDs are paying 0.5%, when CDs are paying 3%, we may have to have a larger than 7% difference. This may cause our lending rates, which are based on our cost of funds, to be uncompetitive. While the prime rate and fed funds rate have increased significantly in 2022, the CD rates, while increasing, have not increased as much. High interest rates may also increase builder defaults, as interest payments may become a higher portion of operating costs for the builder. Below is a chart showing three-year U.S. treasury rates and 30-year fixed mortgage rates. The U.S. treasury rates, are used by us here to approximate CD rates, however in the current environment, this is less accurate than in most years. Both the short- and long-term interest rates have risen slightly but are generally low historically.
| 34 |
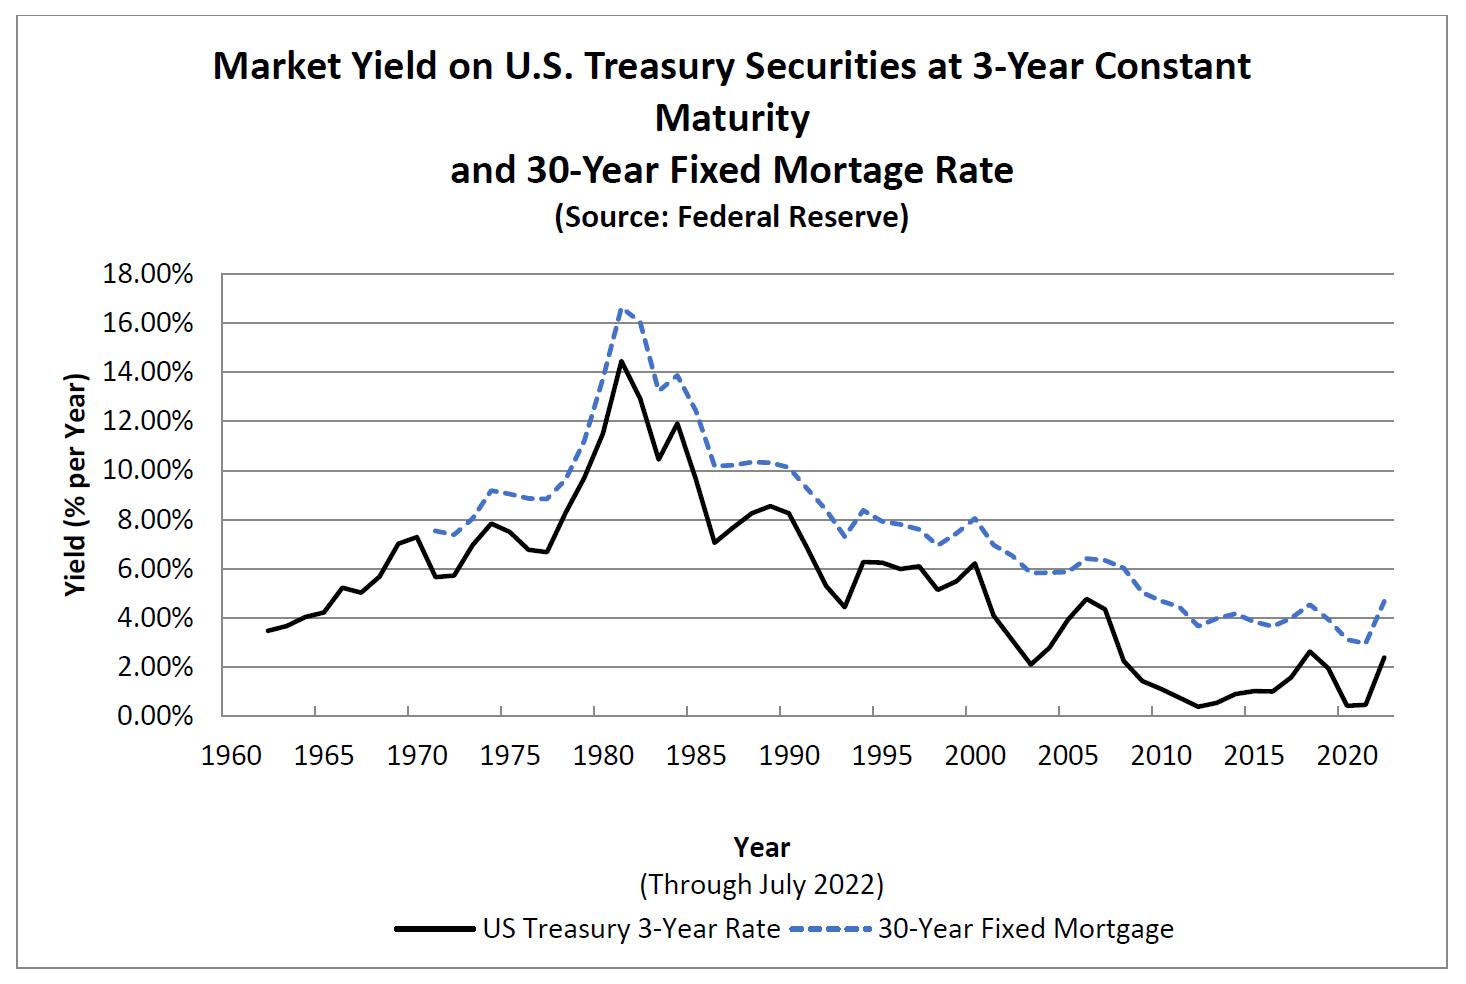
Housing prices are also generally correlated with housing starts, so that increases in housing starts usually coincide with increases in housing values, and the reverse is generally true. Below is a graph showing single family housing starts from 2000 through today.
| 35 |

Source: U.S. Census Bureau
To date, changes in housing starts, CD rates, and inflation have not had a material impact on our business.
Off-Balance Sheet Arrangements
As of June 30, 2022 and December 31, 2021, other than unfunded loan commitments, we had no off-balance sheet transactions, nor do we currently have any such arrangements or obligations.
ITEM 3. QUANTITATIVE AND QUALITATIVE DISCLOSURE ABOUT MARKET RISK
We are a smaller reporting company as defined by Rule 12b-2 of the Securities Exchange Act of 1934 and are not required to provide the information under this item.
ITEM 4. CONTROLS AND PROCEDURES
Disclosure Controls and Procedures
As of the end of the period covered by this report, management, including our Chief Executive Officer (our principal executive officer) and Chief Financial Officer (our principal financial officer) evaluated the effectiveness of the design and operation of our disclosure controls and procedures. Based upon, and as of the date of, the evaluation, our Chief Executive Officer and Chief Financial Officer concluded that the disclosure controls and procedures were effective as of the end of the period covered by this report to ensure that information required to be disclosed in the reports we file and submit under the Securities Exchange Act of 1934, as amended (the “Exchange Act”), is recorded, processed, summarized and reported as and when required. Disclosure controls and procedures include, without limitation, controls and procedures designed to ensure that information required to be disclosed by us in the reports we file and submit under the Exchange Act is accumulated and communicated to our management, including our Chief Executive Officer and Chief Financial Officer, as appropriate to allow timely decisions regarding required disclosure.
Internal Control over Financial Reporting
There has been no change in our internal controls over financial reporting during the quarter ended June 30, 2022 that has materially affected, or is reasonably likely to materially affect, our internal controls over financial reporting.
| 36 |
PART II - OTHER INFORMATION
ITEM 1. LEGAL PROCEEDINGS
None.
ITEM 1A. RISK FACTORS
Not applicable.
ITEM 2. UNREGISTERED SALES OF EQUITY SECURITIES AND USE OF PROCEEDS
| (a) | Reinvestments in Partial Series C Cumulative Preferred Units | |
| Investors in the Series C cumulative preferred units (“Series C Preferred Units”) may elect to reinvest their distributions in additional Series C Preferred Units (the “Series C Reinvestment Program”). Pursuant to the Series C Reinvestment Program, we issued the following Series C Preferred Units during the quarter ended June 30, 2022: |
| Owner | Units | Amount | ||||||
| Daniel M. and Joyce S. Wallach | 0.5633505 | $ | 56,335.05 | |||||
| Gregory L. Sheldon and Madeline M. Sheldon | 0.1971088 | 19,710.88 | ||||||
| BLDR, LLC | 0.1822608 | 18,226.08 | ||||||
| Schultz Family Living Trust | 0.0453396 | 4,533.96 | ||||||
| Fernando Ascencio and Lorraine Carol Ascencio | 0.0848307 | 8,483.07 | ||||||
| Mark and Tris Ann Garboski | 0.1707196 | 17,071.96 | ||||||
| Total | 1.2436100 | $ | 124,361.00 | |||||
| The proceeds received from the sales of the partial Series C Preferred Units in these transactions were used for the funding of construction loans. The transactions in Series C Preferred Units described above were effected in private transactions exempt from the registration requirements of the Securities Act under Section 4(a)(2) of the Securities Act. The transactions described above did not involve any public offering, were made without general solicitation or advertising, and the buyer represented to us that he/she/it is an “accredited investor” within the meaning of Rule 501 of Regulation D promulgated under the Securities Act, with access to all relevant information necessary to evaluate the investment in the Series C Preferred Units. | ||
| (b) | We registered up to $70,000 in Fixed Rate Subordinated Notes (“Notes”) in our current public offering, which is our third public offering of Notes (SEC File No. 333-224557, effective March 22, 2019). As of June 30, 2022, we had issued $36,087 in Notes pursuant to our current public offering. As of June 30, 2022, we incurred expenses of $662 in connection with the issuance and distribution of the Notes in our current public offering, which were paid to third parties. These expenses were not for underwriters or discounts, but were for advertising, printing, and professional services. Net offering proceeds as of June 30, 2022 were $35,425 all of which was used to increase loan balances. | |
| (c) | None. |
ITEM 3. DEFAULTS UPON SENIOR SECURITIES
None.
| 37 |
ITEM 4. MINE SAFETY DISCLOSURES
Not applicable.
ITEM 5. OTHER INFORMATION
| (a) | During the quarter ended June 30, 2022, there was no information required to be disclosed in a report on Form 8-K which was not disclosed in a report on Form 8-K. | |
| (b) | During the quarter ended June 30, 2022, there were no material changes to the procedures by which members may recommend nominees to our board of managers. |
ITEM 6. EXHIBITS
The exhibits required to be filed with this report are set forth on the Exhibit Index hereto and incorporated by reference herein.
EXHIBIT INDEX
The following exhibits are included in this report on Form 10-Q for the period ended June 30, 2022 (and are numbered in accordance with Item 601 of Regulation S-K).
| 38 |
| 31.2* | Certification of Principal Financial Officer, pursuant to Section 302 of the Sarbanes-Oxley Act of 2002 | |
| 32.1* | Certification of Principal Executive Officer, pursuant to 18 U.S.C. Section 1350, as created by Section 906 of the Sarbanes-Oxley Act of 2002 | |
| 32.2* | Certification of Principal Financial Officer, pursuant to 18 U.S.C. Section 1350, as created by Section 906 of the Sarbanes-Oxley Act of 2002 | |
| 101.INS** | Inline XBRL Instance Document | |
| 101.SCH** | Inline XBRL Schema Document | |
| 101.CAL** | Inline XBRL Calculation Linkbase Document | |
| 101.DEF** | Inline XBRL Definition Linkbase Document | |
| 101.LAB** | Inline XBRL Labels Linkbase Document | |
| 101.PRE** | Inline XBRL Presentation Linkbase Document | |
| 104 | Inline XBRL Cover Page Interactive Data File |
* Filed herewith.
** Pursuant to Regulation 406T of Regulation S-T, these Interactive Data Files are deemed not filed or part of a registration statement or prospectus for purpose of Section 11 or 12 of the Securities Act of 1933, as amended, or Section 18 of the Securities Exchange Act of 1934, as amended, and are otherwise not subject to liability.
| 39 |
SIGNATURES
Pursuant to the requirements of the Securities Exchange Act of 1934, the Registrant has duly caused this report to be signed on its behalf by the undersigned thereunto duly authorized.
SHEPHERD’S FINANCE, LLC (Registrant) | ||
| Dated: August 15, 2022 | By: | /s/ Catherine Loftin |
| Catherine Loftin | ||
| Chief Financial Officer | ||
| 40 |
EXHIBIT 31.1
CERTIFICATION OF PRINCIPAL EXECUTIVE OFFICER
Pursuant to Section 302 of the Sarbanes-Oxley Act of 2002
I, Daniel M. Wallach, certify that:
| 1. | I have reviewed this Quarterly Report on Form 10-Q of Shepherd’s Finance, LLC; | ||
| 2. | Based on my knowledge, this report does not contain any untrue statement of a material fact or omit to state a material fact necessary to make the statements made, in light of the circumstances under which such statements were made, not misleading with respect to the period covered by this report; | ||
| 3. | Based on my knowledge, the financial statements, and other financial information included in this report, fairly present in all material respects the financial condition, results of operations and cash flows of the registrant as of, and for, the periods presented in this report; | ||
| 4. | The registrant’s other certifying officer and I are responsible for establishing and maintaining disclosure controls and procedures (as defined in Exchange Act Rules 13a-15(e) and 15d-15(e)) and internal control over financial reporting (as defined in Exchange Act Rules 13a-15(f) and 15d-15(f)) for the registrant and have: | ||
| a. | Designed such disclosure controls and procedures, or caused such disclosure controls and procedures to be designed under our supervision, to ensure that material information relating to the registrant, including its consolidated subsidiaries, is made known to us by others within those entities, particularly during the period in which this report is being prepared; | ||
| b. | Designed such internal control over financial reporting, or caused such internal control over financial reporting to be designed under our supervision, to provide reasonable assurance regarding the reliability of financial reporting and the preparation of financial statements for external purposes in accordance with generally accepted accounting principles; | ||
| c. | Evaluated the effectiveness of the registrant’s disclosure controls and procedures and presented in this report our conclusions about the effectiveness of the disclosure controls and procedures, as of the end of the period covered by this report based on such evaluation; and | ||
| d. | Disclosed in this report any change in the registrant’s internal control over financial reporting that occurred during the registrant’s most recent fiscal quarter (the registrant’s fourth fiscal quarter in the case of an annual report) that has materially affected, or is reasonably likely to materially affect, the registrant’s internal control over financial reporting; and | ||
| 5. | The registrant’s other certifying officer and I have disclosed, based on our most recent evaluation of internal control over financial reporting, to the registrant’s auditors and the audit committee of registrant’s board of directors (or persons performing the equivalent functions): | ||
| a. | All significant deficiencies and material weaknesses in the design or operation of internal control over financial reporting which are reasonably likely to adversely affect the registrant’s ability to record, process, summarize and report financial information; and | ||
| b. | Any fraud, whether or not material, that involves management or other employees who have a significant role in the registrant’s internal control over financial reporting. | ||
| Dated: August 15, 2022 | By: | /s/ Daniel M. Wallach |
| Daniel M. Wallach | ||
| Chief Executive Officer and Manager | ||
| (Principal Executive Officer) |
EXHIBIT 31.2
CERTIFICATION OF PRINCIPAL FINANCIAL OFFICER
Pursuant to Section 302 of the Sarbanes-Oxley Act of 2002
I, Catherine Loftin, certify that:
| 1. | I have reviewed this Quarterly Report on Form 10-Q of Shepherd’s Finance, LLC; | ||
| 2. | Based on my knowledge, this report does not contain any untrue statement of a material fact or omit to state a material fact necessary to make the statements made, in light of the circumstances under which such statements were made, not misleading with respect to the period covered by this report; | ||
| 3. | Based on my knowledge, the financial statements, and other financial information included in this report, fairly present in all material respects the financial condition, results of operations and cash flows of the registrant as of, and for, the periods presented in this report; | ||
| 4. | The registrant’s other certifying officer and I are responsible for establishing and maintaining disclosure controls and procedures (as defined in Exchange Act Rules 13a-15(e) and 15d-15(e)) and internal control over financial reporting (as defined in Exchange Act Rules 13a-15(f) and 15d-15(f)) for the registrant and have: | ||
| a. | Designed such disclosure controls and procedures, or caused such disclosure controls and procedures to be designed under our supervision, to ensure that material information relating to the registrant, including its consolidated subsidiaries, is made known to us by others within those entities, particularly during the period in which this report is being prepared; | ||
| b. | Designed such internal control over financial reporting, or caused such internal control over financial reporting to be designed under our supervision, to provide reasonable assurance regarding the reliability of financial reporting and the preparation of financial statements for external purposes in accordance with generally accepted accounting principles; | ||
| c. | Evaluated the effectiveness of the registrant’s disclosure controls and procedures and presented in this report our conclusions about the effectiveness of the disclosure controls and procedures, as of the end of the period covered by this report based on such evaluation; and | ||
| d. | Disclosed in this report any change in the registrant’s internal control over financial reporting that occurred during the registrant’s most recent fiscal quarter (the registrant’s fourth fiscal quarter in the case of an annual report) that has materially affected, or is reasonably likely to materially affect, the registrant’s internal control over financial reporting; and | ||
| 5. | The registrant’s other certifying officer and I have disclosed, based on our most recent evaluation of internal control over financial reporting, to the registrant’s auditors and the audit committee of registrant’s board of directors (or persons performing the equivalent functions): | ||
| a. | All significant deficiencies and material weaknesses in the design or operation of internal control over financial reporting which are reasonably likely to adversely affect the registrant’s ability to record, process, summarize and report financial information; and | ||
| b. | Any fraud, whether or not material, that involves management or other employees who have a significant role in the registrant’s internal control over financial reporting. | ||
| Dated: August 15, 2022 | By: | /s/ Catherine Loftin |
| Catherine Loftin | ||
| Chief Financial Officer | ||
| (Principal Financial and Accounting Officer) |
EXHIBIT 32.1
CERTIFICATION OF PRINCIPAL EXECUTIVE OFFICER
Pursuant to Section 906 of the Sarbanes-Oxley Act of 2002
Pursuant to 18 U.S.C. § 1350, as created by Section 906 of the Sarbanes-Oxley Act of 2002, the undersigned officer of Shepherd’s Finance, LLC (the “Company”), in connection with the Company’s Quarterly Report on Form 10-Q for the period ended June 30, 2022 (the “Report”) hereby certifies, to his knowledge, that:
| (i) | the Report fully complies with the requirements of Section 13(a) or Section 15(d) of the Securities Exchange Act of 1934, as amended; and | |
| (ii) | the information contained in the Report fairly presents, in all material respects, the financial condition and results of operations of the Company. |
| Dated: August 15, 2022 | By: | /s/ Daniel M. Wallach |
| Daniel M. Wallach | ||
| Chief Executive Officer and Manager | ||
| (Principal Executive Officer) |
EXHIBIT 32.2
CERTIFICATION OF PRINCIPAL FINANCIAL OFFICER
Pursuant to Section 906 of the Sarbanes-Oxley Act of 2002
Pursuant to 18 U.S.C. § 1350, as created by Section 906 of the Sarbanes-Oxley Act of 2002, the undersigned officer of Shepherd’s Finance, LLC (the “Company”), in connection with the Company’s Quarterly Report on Form 10-Q for the period ended June 30, 2022 (the “Report”) hereby certifies, to her knowledge, that:
| (i) | the Report fully complies with the requirements of Section 13(a) or Section 15(d) of the Securities Exchange Act of 1934, as amended; and | |
| (ii) | the information contained in the Report fairly presents, in all material respects, the financial condition and results of operations of the Company. |
| Dated: August 15, 2022 | By: | /s/ Catherine Loftin |
| Catherine Loftin | ||
| Chief Financial Officer | ||
| (Principal Financial and Accounting Officer) |
Serious News for Serious Traders! Try StreetInsider.com Premium Free!
You May Also Be Interested In
- Alameda Health System Needs Immediate Assistance with Patient Identification
- ROSEN, A TRUSTED AND LEADING LAW FIRM, Encourages Plug Power Inc. Investors to Secure Counsel Before Important Deadline in Securities Class Action – PLUG
- EVe Mobility Acquisition Corp Receives NYSE Notice Regarding Late Filing of Annual Report on Form 10-K
Create E-mail Alert Related Categories
SEC FilingsSign up for StreetInsider Free!
Receive full access to all new and archived articles, unlimited portfolio tracking, e-mail alerts, custom newswires and RSS feeds - and more!
