

Form 10-Q SALISBURY BANCORP, INC. For: Jun 30
 Tweet
Tweet Share
Share
SECURITIES AND EXCHANGE COMMISSION
Washington, D.C. 20549
FORM
(Mark One)
| QUARTERLY REPORT PURSUANT TO SECTION 13 OR 15(d) OF THE SECURITIES EXCHANGE ACT OF 1934 |
For
the
OR
| TRANSITION REPORT PURSUANT TO SECTION 13 OR 15(d) OF THE SECURITIES EXCHANGE ACT OF 1934 |
FOR THE TRANSITION PERIOD FROM ________ TO ________
Commission
file number
(Exact name of registrant as specified in its charter)
| (State or other jurisdiction | (I.R.S. Employer |
| of incorporation or organization) | Identification No.) |
| (Address of principal executive offices) | (Zip code) |
(
(Registrant's telephone number, including area code)
| Title of Each Class | Trading Symbol(s) | Name of Each Exchange on Which Registered |
Indicate by check mark whether the registrant (1) has filed all reports required to be filed by Section 13 or 15(d) of the Securities Exchange Act of 1934 during the preceding 12 months (or for such shorter period that the registrant was required to file such reports), and (2) has been subject to such filing requirements for the past 90 days.
Indicate by check mark whether the registrant has submitted electronically and posted on its corporate Website, if any, every Interactive Data File required to be submitted and posted pursuant to Rule 405 of Regulation S-T (§232.405) during the preceding 12 months (or for such shorter period that the registrant was required to submit such files).
Indicate by check mark whether the registrant is a large accelerated filer, an accelerated filer, a non-accelerated filer, a smaller reporting company, or an emerging growth company. See the definitions of “large accelerated filer”, “accelerated filer”, “smaller reporting company”, and “emerging growth company” in Rule 12b-2 of the Exchange Act).
| Large accelerated filer ☐ | Accelerated filer ☐ |
| Smaller reporting company | |
| Emerging growth
company | |
If
an emerging growth company, indicate by check mark if the registrant has elected not to use the extended transition period for complying
with any new or revised financial accounting standards provided pursuant to Section 13(a) of the Exchange Act. ☐Indicate
by check mark whether the registrant is a shell company (as defined in Rule 12b-2 of the Exchange Act). Yes ☐
The number of shares of Common Stock outstanding as of August 3, 2022 is .
TABLE OF CONTENTS
| Page | |||
| PART I. | FINANCIAL INFORMATION | 3 | |
| CONSOLIDATED BALANCE SHEETS AS OF JUNE 30, 2022 (unaudited) AND DECEMBER 31,2021 | 3 | ||
| CONSOLIDATED STATEMENTS OF INCOME FOR THE THREE AND SIX MONTH PERIODS ENDED JUNE 30, 2022 AND 2021 (unaudited) | 4 | ||
| CONSOLIDATED STATEMENTS OF COMPREHENSIVE (LOSS) INCOME FOR THE THREE AND SIX MONTH PERIODS ENDED JUNE 30, 2022 and 2021 (unaudited) | 5 | ||
| CONSOLIDATED STATEMENTS OF CHANGES IN SHAREHOLDERS' EQUITY FOR THE THREE AND SIX MONTH PERIODS ENDED JUNE 30, 2022 and 2021 (unaudited) | 5 | ||
| CONSOLIDATED STATEMENTS OF CASH FLOWS FOR THE SIX MONTH PERIODS ENDED JUNE 30, 2022 and 2021 (unaudited) | 7 | ||
| NOTES TO UNAUDITED CONSOLIDATED FINANCIAL STATEMENTS | 9 | ||
| Item 2. | MANAGEMENT'S DISCUSSION AND ANALYSIS OF FINANCIAL CONDITION AND RESULTS OF OPERATIONS | 28 | |
| Item 3. | QUANTITATIVE AND QUALITATIVE DISCLOSURES ABOUT MARKET RISK | 42 | |
| Item 4. | CONTROLS AND PROCEDURES | 43 | |
| PART II. | OTHER INFORMATION | 43 | |
| Item 1. | LEGAL PROCEEDINGS | 43 | |
| Item 1A. | RISK FACTORS | 43 | |
| Item 2. | UNREGISTERED SALES OF EQUITY SECURITIES AND USE OF PROCEEDS | 43 | |
| Item 3. | DEFAULTS UPON SENIOR SECURITIES | 43 | |
| Item 4. | MINE SAFETY DISCLOSURES | 43 | |
| Item 5. | OTHER INFORMATION | 43 | |
| Item 6. | EXHIBITS | 44 | |
| SIGNATURES | 44 | ||
PART I - FINANCIAL INFORMATION
Salisbury Bancorp, Inc. and Subsidiary
CONSOLIDATED BALANCE SHEETS (unaudited)
| (in thousands, except share data) | June 30, 2022 | December 31, 2021 | ||||||
| ASSETS | (unaudited) | |||||||
| Cash and due from banks | $ | $ | ||||||
| Interest bearing demand deposits with other banks | ||||||||
| Total cash and cash equivalents | ||||||||
| Interest bearing Time Deposits with Financial Institutions | ||||||||
| Securities | ||||||||
| Available-for-sale at fair value | ||||||||
| Mutual funds at fair value | ||||||||
| Federal Home Loan Bank of Boston stock at cost | ||||||||
| Loans held-for-sale | ||||||||
| Loans
receivable, net (allowance for loan losses: $ | ||||||||
| Bank premises and equipment, net | ||||||||
| Goodwill | ||||||||
| Intangible
assets (net of accumulated amortization: $ | ||||||||
| Accrued interest receivable | ||||||||
| Cash surrender value of life insurance policies | ||||||||
| Deferred taxes | ||||||||
| Other assets | ||||||||
| Total Assets | $ | $ | ||||||
| LIABILITIES and SHAREHOLDERS' EQUITY | ||||||||
| Deposits | ||||||||
| Demand (non-interest bearing) | $ | $ | ||||||
| Demand (interest bearing) | ||||||||
| Money market | ||||||||
| Savings and other | ||||||||
| Certificates of deposit | ||||||||
| Total deposits | ||||||||
| Repurchase agreements | ||||||||
| Federal Home Loan Bank of Boston advances | ||||||||
| Subordinated debt | ||||||||
| Note payable | ||||||||
| Finance lease obligations | ||||||||
| Accrued interest and other liabilities | ||||||||
| Total Liabilities | ||||||||
| Shareholders' Equity 1 | ||||||||
| Common stock - $ per share par value | ||||||||
| Authorized: ; | ||||||||
| Issued: and | ||||||||
| Outstanding: and | ||||||||
| Unearned compensation – restricted stock awards | ( | ) | ( | ) | ||||
| Paid-in capital | ||||||||
| Retained earnings | ||||||||
| Accumulated other comprehensive (loss) income, net | ( | ) | ||||||
| Total Shareholders' Equity | ||||||||
| Total Liabilities and Shareholders' Equity | $ | $ |
The accompanying notes are an integral part of these unaudited consolidated financial statements.
1 The number of authorized, issued and outstanding shares has been adjusted to reflect the two-for-one forward stock split effective on June 30, 2022.
| 3 |
Salisbury Bancorp, Inc. and Subsidiary
CONSOLIDATED STATEMENTS OF INCOME (unaudited)
| Three months ended | Six months ended | |||||||||||||||
| Periods ended June 30, (in thousands, except per share amounts) | 2022 | 2021 | 2022 | 2021 | ||||||||||||
| Interest and dividend income | ||||||||||||||||
| Interest and fees on loans | $ | $ | $ | $ | ||||||||||||
| Interest on debt securities | ||||||||||||||||
| Taxable | ||||||||||||||||
| Tax exempt | ||||||||||||||||
| Other interest and dividends | ||||||||||||||||
| Total interest and dividend income | ||||||||||||||||
| Interest expense | ||||||||||||||||
| Deposits | ||||||||||||||||
| Repurchase agreements | ||||||||||||||||
| Finance lease | ||||||||||||||||
| Note payable | ||||||||||||||||
| Subordinated debt | ||||||||||||||||
| Federal Home Loan Bank of Boston advances | ||||||||||||||||
| Total interest expense | ||||||||||||||||
| Net interest and dividend income | ||||||||||||||||
| Provision (release) for loan losses | ( | ) | ( | ) | ||||||||||||
| Net interest and dividend income after provision (release) for loan losses | ||||||||||||||||
| Non-interest income | ||||||||||||||||
| Trust and wealth advisory | ||||||||||||||||
| Service charges and fees | ||||||||||||||||
| Mortgage banking activities, net | ||||||||||||||||
| (Losses) gains on mutual fund | ( | ) | ( | ) | ( | ) | ||||||||||
| (Losses) gains on sales and calls of available -for-sale securities, net | ( | ) | ( | ) | ( | ) | ||||||||||
| BOLI income and gains | ||||||||||||||||
| Other | ||||||||||||||||
| Total non-interest income | ||||||||||||||||
| Non-interest expense | ||||||||||||||||
| Salaries | ||||||||||||||||
| Employee benefits | ||||||||||||||||
| Premises and equipment | ||||||||||||||||
| Information processing and services | ||||||||||||||||
| Professional fees | ||||||||||||||||
| Collections, OREO, and loan related | ||||||||||||||||
| FDIC insurance | ||||||||||||||||
| Marketing and community support | ||||||||||||||||
| Amortization of intangibles | ||||||||||||||||
| Other | ||||||||||||||||
| Total non-interest expense | ||||||||||||||||
| Income before income taxes | ||||||||||||||||
| Income tax provision | ||||||||||||||||
| Net income | $ | $ | $ | $ | ||||||||||||
| Net income available to common shareholders | $ | $ | $ | $ | ||||||||||||
| Basic earnings per common share 1 | $ | $ | $ | $ | ||||||||||||
| Diluted earnings per common share 1 | $ | $ | $ | $ | ||||||||||||
| Common dividends per share 1 | $ | $ | $ | $ | ||||||||||||
The accompanying notes are an integral part of these unaudited consolidated financial statements.
1 Per share amounts for all periods have been adjusted to reflect the two-for-one forward stock split effective on June 30, 2022.
| 4 |
Salisbury Bancorp, Inc. and Subsidiary
CONSOLIDATED STATEMENTS OF COMPREHENSIVE (LOSS) INCOME (unaudited)
| Three months ended | Six months ended | |||||||||||||||
| Periods ended June 30, (in thousands) | 2022 | 2021 | 2022 | 2021 | ||||||||||||
| Net income | $ | $ | $ | $ | ||||||||||||
| Other comprehensive (loss) income | ||||||||||||||||
| Net unrealized (losses) gains on securities available-for-sale | ( | ) | ( | ) | ( | ) | ||||||||||
| Reclassification of net realized losses (gains) in net income 1 | ( | ) | ||||||||||||||
| Unrealized (losses) gains on securities available-for-sale | ( | ) | ( | ) | ( | ) | ||||||||||
| Income tax benefit (expense) | ( | ) | ||||||||||||||
| Unrealized (losses) gains on securities available-for-sale, net of tax | ( | ) | ( | ) | ( | ) | ||||||||||
| Comprehensive (loss) income | $ | ( | ) | $ | $ | ( | ) | $ | ||||||||
1 Reclassification adjustments include realized security gains and losses. The gains and losses have been reclassified out of accumulated other comprehensive (loss) income and have affected certain lines in the consolidated statements of income as follows: The pre-tax amount is reflected as sales and calls of available for sale securities, net, the tax effect is included in the income tax provision and the after-tax amount is included in net income. The net tax effect for the three months ending June 30, 2022 and 2021 are $9 thousand and $2 thousand, respectively. The net tax effect for the six-month periods ending June 30, 2022 and 2021 are ($35) thousand and $2 thousand, respectively.
Salisbury Bancorp, Inc. and Subsidiary
CONSOLIDATED STATEMENTS OF CHANGES IN SHAREHOLDERS' EQUITY (unaudited)
| Three months ended June
30,
(dollars in thousands) | Common Stock | Paid-in | Retained | Unearned compensation restricted stock | Accumulated other comprehensive | Total shareholders' | ||||||||||||||||||||||
| Shares1 | Amount | Capital | Earnings | awards | (loss) income | equity | ||||||||||||||||||||||
| Balances at March 31, 2021 | $ | $ | $ | $ | ( | ) | $ | $ | ||||||||||||||||||||
| Net income | — | |||||||||||||||||||||||||||
| Other comprehensive income, net of tax | — | |||||||||||||||||||||||||||
| Common stock dividends declared | — | ( | ) | ( | ) | |||||||||||||||||||||||
| Issuance of restricted stock awards | ( | ) | ||||||||||||||||||||||||||
| Issuance of director’s restricted stock awards | ( | ) | ||||||||||||||||||||||||||
| Stock based compensation-restricted stock awards | — | |||||||||||||||||||||||||||
| Balances at June 30, 2021 | $ | $ | $ | $ | ( | ) | $ | $ | ||||||||||||||||||||
| Balances at March 31, 2022 | $ | $ | $ | $ | ( | ) | $ | ( | ) | $ | ||||||||||||||||||
| Net income | — | |||||||||||||||||||||||||||
| Other comprehensive loss, net of tax | — | ( | ) | ( | ) | |||||||||||||||||||||||
| Common stock dividends declared | — | ( | ) | ( | ) | |||||||||||||||||||||||
| Stock options exercised | ||||||||||||||||||||||||||||
| Issuance of director’s restricted stock awards | ( | ) | ||||||||||||||||||||||||||
| Transfer due to 2-for-1 forward stock split | — | ( | ) | |||||||||||||||||||||||||
| Stock based compensation-restricted stock awards | — | |||||||||||||||||||||||||||
| Balances at June 30, 2022 | $ | $ | $ | $ | ( | ) | $ | ( | ) | $ | ||||||||||||||||||
The accompanying notes are an integral part of these unaudited consolidated financial statements.
1 The number of shares for all periods have been adjusted to reflect the two-for-one forward stock split effective on June 30, 2022.
| 5 |
| Six months ended June
30,
(dollars in thousands) | Common Stock | Paid-in | Retained | Unearned compensation restricted stock | Accumulated other comprehensive | Total shareholders' | ||||||||||||||||||||||
| Shares1 | Amount | Capital | Earnings | awards | (loss) income | equity | ||||||||||||||||||||||
| Balances at December 31, 2020 | $ | $ | $ | $ | ( | ) | $ | $ | ||||||||||||||||||||
| Net income | — | |||||||||||||||||||||||||||
| Other comprehensive loss, net of tax | — | ( | ) | ( | ) | |||||||||||||||||||||||
| Common stock dividends declared | — | ( | ) | ( | ) | |||||||||||||||||||||||
| Issuance of restricted stock awards | ( | ) | ||||||||||||||||||||||||||
| Stock options exercised | ||||||||||||||||||||||||||||
| Issuance of director’s restricted stock awards Stock based compensation-restricted | ( | ) | ||||||||||||||||||||||||||
| Stock based compensation-restricted stock awards | — | |||||||||||||||||||||||||||
| Balances at June 30, 2021 | $ | $ | $ | $ | ( | ) | $ | $ | ||||||||||||||||||||
| Balances at December 31, 2021 | $ | $ | $ | $ | ( | ) | $ | $ | ||||||||||||||||||||
| Net income | — | |||||||||||||||||||||||||||
| Other comprehensive loss, net of tax | — | ( | ) | ( | ) | |||||||||||||||||||||||
| Common stock dividends declared | — | ( | ) | ( | ) | |||||||||||||||||||||||
| Issuance of restricted stock awards | ( | ) | ||||||||||||||||||||||||||
| Issuance of performance based stock awards | ( | ) | ( | ) | ||||||||||||||||||||||||
| Stock options exercised | ||||||||||||||||||||||||||||
| Issuance of director’s restricted stock awards | ( | ) | ||||||||||||||||||||||||||
| Transfer due to 2-for-1 forward stock split | — | ( | ) | |||||||||||||||||||||||||
| Stock based compensation-restricted stock awards | — | |||||||||||||||||||||||||||
| Balances at June 30, 2022 | $ | $ | $ | $ | ( | ) | $ | ( | ) | $ | ||||||||||||||||||
The accompanying notes are an integral part of these unaudited consolidated financial statements.
1 The number of shares for all periods have been adjusted to reflect the two-for-one forward stock split effective on June 30, 2022.
| 6 |
Salisbury Bancorp, Inc. and Subsidiary
CONSOLIDATED STATEMENTS OF CASH FLOWS (unaudited)
| Six months ended June 30, (in thousands) | 2022 | 2021 | ||||||
| Operating Activities | ||||||||
| Net income | $ | $ | ||||||
| Adjustments to reconcile net income to net cash provided by operating activities | ||||||||
| Amortization(accretion) and depreciation | ||||||||
| Securities | ||||||||
| Bank premises and equipment | ||||||||
| Core deposit intangible | ||||||||
| Modification fees on Federal Home Loan Bank of Boston advances | ||||||||
| Subordinated debt issuance costs | ||||||||
| Mortgage servicing rights | ||||||||
| (Gain) loss on sales and calls of securities available-for-sale, net | ( | ) | ||||||
| Loss on mutual funds | ||||||||
| Gain on sales of loans, excluding capitalized servicing rights | ( | ) | ( | ) | ||||
| Loss (gain) on sale of disposed assets | ( | ) | ||||||
| Provision (release) for loan losses | ( | ) | ||||||
| Proceeds from loans sold | ||||||||
| Loans originated for sale | ( | ) | ( | ) | ||||
| (Increase) decrease in deferred loan origination fees and costs, net | ( | ) | ||||||
| Increase in mortgage servicing rights originated | ( | ) | ( | ) | ||||
| Decrease in mortgage impairment charge | ( | ) | ||||||
| Decrease in interest receivable | ||||||||
| Decrease in deferred tax benefit | ||||||||
| Decrease (increase) in prepaid expenses | ( | ) | ||||||
| Increase in cash surrender value of life insurance policies | ( | ) | ( | ) | ||||
| Decrease in income tax receivable | ||||||||
| (Increase) decrease in other assets | ( | ) | ||||||
| Increase in income taxes payable | ||||||||
| Decrease in accrued expenses | ( | ) | ( | ) | ||||
| Decrease in interest payable | ( | ) | ( | ) | ||||
| Increase in other liabilities | ||||||||
| Stock based compensation-restricted stock awards | ||||||||
| Net cash provided by operating activities | $ | $ | ||||||
| Investing Activities | ||||||||
| Net redemptions of Federal Home Loan Bank of Boston stock | ||||||||
| Purchases of securities available-for-sale | ( | ) | ( | ) | ||||
| Proceeds from sales of securities available-for-sale | ||||||||
| Proceeds from calls of securities available-for-sale | ||||||||
| Proceeds from maturities of securities available-for-sale | ||||||||
| Reinvestment/purchase of mutual funds | ( | ) | ( | ) | ||||
| Loan originations and principal collections, net | ( | ) | ( | ) | ||||
| Recoveries of loans previously charged off | ||||||||
| Proceeds from life insurance | ||||||||
| Proceeds from sales of disposed assets | ||||||||
| Capital expenditures | ( | ) | ( | ) | ||||
| Net cash utilized by investing activities | $ | ( | ) | $ | ( | ) |
The accompanying notes are an integral part of these unaudited consolidated financial statements.
| 7 |
Salisbury Bancorp, Inc. and Subsidiary
CONSOLIDATED STATEMENTS OF CASH FLOWS (Continued)
| Six months ended June 30, (in thousands) | 2022 | 2021 | ||||||
| Financing Activities | ||||||||
| (Decrease) increase in deposit transaction accounts, net | $ | ( | ) | $ | ||||
| Increase in time deposits, net | ||||||||
| Increase in securities sold under agreements to repurchase, net | ||||||||
| Payments Federal Home Loan Bank of Boston advances | ( | ) | ||||||
| Principal payments on amortizing FHLB advances | ( | ) | ( | ) | ||||
| Issuance of Subordinated debt, net of issuance costs | ||||||||
| Repayment of Subordinated debt | ( | ) | ||||||
| Principal payments on note payable | ( | ) | ( | ) | ||||
| Decrease in finance lease obligation | ( | ) | ( | ) | ||||
| Stock options exercised | ||||||||
| Net settlement of restricted stock units | ( | ) | ||||||
| Common stock dividends paid | ( | ) | ( | ) | ||||
| Net cash (utilized) provided by financing activities | ( | ) | ||||||
| Net (decrease) increase in cash and cash equivalents | ( | ) | ||||||
| Cash and cash equivalents, beginning of period | ||||||||
| Cash and cash equivalents, end of period | $ | $ | ||||||
| Cash paid during period | ||||||||
| Interest | $ | $ | ||||||
| Income taxes | ||||||||
| Non-cash supplemental | ||||||||
| Available for Sale Security Due from Broker | $ | $ | ||||||
| Fixed Asset | ||||||||
| Finance lease liability | ( | ) | ||||||
| Loans transferred to Loans Held for Sale |
The accompanying
notes are an integral part of these unaudited consolidated financial statements.
| 8 |
Salisbury Bancorp, Inc. and Subsidiary
NOTES TO UNAUDITED CONSOLIDATED FINANCIAL STATEMENTS
NOTE 1 - BASIS OF PRESENTATION
The interim (unaudited) consolidated financial statements of Salisbury Bancorp, Inc. ("Salisbury") include those of Salisbury and its wholly owned subsidiary, Salisbury Bank and Trust Company (the "Bank"). In the opinion of management, the interim unaudited consolidated financial statements include all adjustments (consisting of normal recurring adjustments) necessary to present fairly the consolidated financial position of Salisbury and the consolidated statements of income, comprehensive income, changes in shareholders’ equity and cash flows for the interim periods presented.
The financial statements have been prepared in accordance with accounting principles generally accepted in the United States of America (GAAP). In preparing the financial statements, management is required to make extensive use of estimates and assumptions that affect the reported amounts of assets and liabilities as of the date of the balance sheet, and revenues and expenses for the period. Actual results could differ significantly from those estimates. Material estimates that are particularly susceptible to significant change in the near term relate to the determination of the allowance for loan losses and unrealized gains and losses related to available-for-sale securities.
Salisbury increased the number of issued and authorized common shares and effected a two-for-one forward stock split of the Company’s common stock on June 30, 2022. The par value of common stock was not adjusted as a result of the forward stock split. All share and per share amounts in the financial statements and notes thereto have been retroactively adjusted for all periods presented to give effect to this forward stock split.
Certain financial information, which is normally included in financial statements prepared in accordance with generally accepted accounting principles, but which is not required for interim reporting purposes, has been condensed or omitted. Operating results for the interim period ended June 30, 2022 are not necessarily indicative of the results that may be expected for the year ending December 31, 2022. The accompanying condensed financial statements should be read in conjunction with the financial statements and notes thereto included in Salisbury's 2021 Annual Report on Form 10-K for the year ended December 31, 2021.
The allowance for loan losses is a significant accounting policy and is presented in the Notes to Consolidated Financial Statements and in Management’s Discussion and Analysis. Management has identified the determination of the allowance for loan losses to be the accounting area that requires the most subjective judgments, and as such could be most subject to revision as new information becomes available.
Recent Accounting Pronouncements
In June 2016, the Financial Accounting Standards Board (FASB) issued Accounting Standards Update (ASU) 2016-13, “Financial Instruments – Credit Losses (Topic 326): Measurement of Credit Losses on Financial Instruments,” which adds a new Topic 326 to the Codification and removes the thresholds that companies apply to measure credit losses on financial instruments measured at amortized cost, such as loans, receivables, and held-to-maturity debt securities. Under current U.S. GAAP, companies generally recognize credit losses when it is probable that the loss has been incurred. The revised guidance removes all recognition thresholds and requires companies to recognize an allowance for credit losses for the difference between the amortized cost basis of a financial instrument and the amount of amortized cost that the company expects to collect over the instrument’s contractual life. ASU 2016-13 also amends the credit loss measurement guidance for available-for-sale debt securities and beneficial interests in securitized financial assets. In April 2019, the FASB issued ASU 2019-04 which clarifies the treatment of accrued interest when measuring credit losses. Entities may: (1) measure the allowance for credit losses on accrued interest receivable balances separately from other components of the amortized cost basis of associated financial assets; (2) make various accounting policy elections regarding the treatment of accrued interest receivable; or (3) elect a practical expedient to disclose separately the total amount of accrued interest included in the amortized cost basis as a single balance to meet certain disclosure requirements. ASU 2019-04 also clarifies that expected recoveries of amounts previously written off and expected to be written off should be included in the valuation account and should not exceed the aggregate of amounts previously written off and expected to be written off by the entity. In addition, for collateral dependent financial assets, the amendments clarify that an allowance for credit losses that is added to the amortized cost basis of the financial asset(s) should not exceed amounts previously written off. In November 2019, the FASB issued ASU 2019-10, which delayed the effective date of ASU 2016-13 to fiscal years beginning after December 15, 2022 for smaller reporting companies, although early adoption is permitted. Salisbury meets the definition of a smaller reporting company. In November 2019, the FASB issued ASU 2019-11, “Codification Improvements to Topic 326, Financial Instruments – Credit Losses” which clarifies or addresses specific issues about certain aspects of the amendments in ASU 2016-13. The amendments in ASU 2019-11 clarify the following: (1) The allowance for credit losses (ACL) for purchased financial assets with credit deterioration should include expected recoveries of amounts previously written off and expected to be written off by the entity and should not exceed the aggregate of amounts of the amortized cost basis previously written off and expected to be written off by an entity. In addition, the amendments clarify that when a method other than a discounted cash flow method is used to estimate expected credit losses, expected recoveries should not include any amounts that result in an acceleration of the noncredit discount. An entity may include increases in expected cashflows after acquisition; (2) Transition relief will be provided by permitting entities an accounting policy election to adjust the effective interest rate on existing troubled debt restructurings using prepayment assumptions on the date of adoption of Topic 326 rather than the prepayment assumptions in effect immediately before the restructuring; (3) Disclosure relief will be extended for accrued interest receivable balances to additional relevant disclosures involving amortized cost basis; (4) An entity should assess whether it reasonably expects the borrower will be able to continually replenish collateral securing the financial asset to apply the practical expedient. The amendments clarify that an entity applying the practical expedient should estimate expected credit losses for any difference between the amount of the amortized cost basis that is greater than the fair value of the collateral securing the financial asset (that is, the unsecured portion of the amortized cost basis). An entity may determine that the expectation of nonpayment for the amount of the amortized cost basis equal to the fair value of the collateral securing the financial asset is zero. In March 2022, the FASB issued ASU 2022-02, which clarifies the treatment of accrued interest when measuring credit losses. The amendments in this Update eliminate the TDR recognition and measurement guidance and, instead, require that an entity evaluate (consistent with the accounting for other loan modifications) whether the modification represents a new loan or a continuation of an existing loan. The amendments enhance existing disclosure requirements and introduce new requirements related to certain modifications of receivables made to borrowers experiencing financial difficulty. For public business entities, the amendments in this Update require that an entity disclose current-period gross write-offs by year of origination for financing receivables and net investment in leases within the scope of Subtopic 326-20.
| 9 |
Upon adoption, Salisbury will apply the standards’ provisions as a cumulative effect adjustment to retained earnings as of the first reporting period in which the guidance is effective. Salisbury anticipates that the adoption of ASU 2016-13 and related updates will impact the consolidated financial statements as it relates to the balance in the allowance for loan losses. Salisbury has engaged a third-party software vendor to model the allowance for loan losses in conformance with this ASU. Salisbury will continue to refine this model and assess the impact to its consolidated financial statements.
The Bank is working towards the completion of its ACL methodology. To estimate the ACL for loans and off-balance sheet credit exposures, such as unfunded loan commitments, Salisbury will utilize a discounted cash flow model that contains additional assumptions to calculate credit losses over the estimated life of financial assets and off-balance sheet credit exposures and will include the impact of forecasted economic conditions. The estimate is expected to include a one-year reasonable and supportable forecast period and thereafter a one-year reversion period to the historical mean of its macroeconomic assumption. The estimate will also include qualitative factors that may not be reflected in quantitatively derived results to ensure that the ACL reflects a reasonable estimate of current expected credit losses.
The Bank is currently refining various ACL assumptions and running parallel calculations on a monthly basis. Salisbury estimates that under the CECL framework, the ACL would be $13.6 million compared with the allowance for loan losses of $13.7 million reported on the consolidated balance sheet at June 30, 2022. In addition, Salisbury estimates that the ACL for unfunded commitments would be approximately $1.2 million compared with the allowance of $0.2 million recorded on its consolidated balance sheet as of June 30, 2022. Salisbury will continue to refine its ACL methodology prior to implementation of CECL on January 1, 2023. In addition, the estimated ACL and allowance for unfunded commitments under both the Incurred Loss method and CECL will be affected by various factors, which include but are not limited to, changes in the composition and balance of Salisbury’s loan portfolio and unfunded commitments, changes to internal risk ratings of borrowers, changes to the risk-profile of the loan portfolio, changes in various macro-economic indicators, the impact of COVID-19 and geo-political events on the business environment, and other factors.
Based on the credit quality of Salisbury’s existing available for sale debt securities portfolio, which primarily consists of obligations of U.S. government agency and U.S. government-sponsored enterprise securities, including mortgage-backed securities, Salisbury does not expect the adoption of ASU 2016-13, as it relates to debt securities, to be significant. For available for sale debt securities with unrealized losses, credit losses will be recognized as an allowance rather than a reduction in the amortized cost of the securities. As a result, improvements to estimated credit losses will be recognized immediately in earnings rather than as interest income over time.
In January 2021, the FASB issued ASU 2021-01, “Reference Rate Reform (Topic 848).” In response to the risk of cessation of the London Interbank Offered Rate (LIBOR) as a reference rate, this ASU clarifies the scope of Topic 848 so that derivatives affected by this transition are explicitly eligible for certain optional expedients and exceptions in Topic 848. An entity may elect to apply the amendments in this ASU on a full retrospective basis as of any date from the beginning interim period that includes or is subsequent to March 12, 2020 or on a prospective basis to new modifications from any date within an interim period that includes or is subsequent to the date of the issuance of a final Update, up to the date that the financial statements are available to be issued. The transition from LIBOR is not expected to have a material impact on Salisbury’s Consolidated Financial Statements.
In March 2022, the FASB issued ASU 2022-01, “Derivatives and Hedging (Topic 815) Fair Value Hedging – Portfolio Layer Method.” The amendments in this update clarified the following: (1) The current last-of-layer method that permits only one hedged layer has been expanded to allow multiple hedged layers of a single closed portfolio. To reflect that expansion, the last-of-layer method is renamed the portfolio layer method; (2) The scope of the portfolio layer method has been expanded to include non-pre-payable financial assets; (3) Eligible hedging instruments in a single-layer hedge may include spot-starting or forward-starting constant-notional swaps, or spot-or forward-starting amortizing-notional swaps and that the number of hedged layers (that is, single or multiple) corresponds with the number of hedges designated; (4) Additional guidance is provided on the accounting for and disclosure of hedge basis adjustments that are applicable to the portfolio layer method whether a single hedged layer or multiple hedged layers are designated; and (5) How hedge basis adjustments should be considered when determining credit losses for the assets included in the closed portfolio. The amendments in this ASU are effective for fiscal years beginning after December 15, 2022, and interim periods within those fiscal years. Early adoption is permitted for any entity that has adopted the amendments in ASU 2017-12 for the corresponding period. Salisbury does not expect the implementation of ASU 2022-01 to have a material impact on its consolidated financial statements.
| 10 |
NOTE 2 - SECURITIES
The composition of securities is as follows:
| (in thousands) | Amortized cost basis | Gross un-realized gains | Gross un-realized losses | Fair value | ||||||||||||
| June 30, 2022 | ||||||||||||||||
| Available-for-sale | ||||||||||||||||
| U.S. Treasury | $ | $ | $ | $ | ||||||||||||
| U.S. Government Agency notes | ||||||||||||||||
| Municipal bonds | ||||||||||||||||
| Mortgage-backed securities: | ||||||||||||||||
| U.S. Government agencies and U.S. Government - sponsored enterprises | ||||||||||||||||
| Collateralized mortgage obligations: | ||||||||||||||||
| U.S. Government agencies | ||||||||||||||||
| Corporate bonds | ||||||||||||||||
| Total securities available-for-sale | $ | $ | $ | $ | ||||||||||||
| Mutual fund | $ | |||||||||||||||
| Non-marketable securities | ||||||||||||||||
| Federal Home Loan Bank of Boston stock | $ | $ | $ | $ |
| (in thousands) | Amortized cost basis | Gross un-realized gains | Gross un-realized losses | Fair value | ||||||||||||
| December 31, 2021 | ||||||||||||||||
| Available-for-sale | ||||||||||||||||
| U.S. Treasury | $ | $ | $ | $ | ||||||||||||
| U.S. Government Agency notes | ||||||||||||||||
| Municipal bonds | ||||||||||||||||
| Mortgage-backed securities: | ||||||||||||||||
| U.S. Government agencies and U.S. Government- sponsored enterprises | ||||||||||||||||
| Collateralized mortgage obligations: | ||||||||||||||||
| U.S. Government agencies | ||||||||||||||||
| Corporate bonds | ||||||||||||||||
| Total securities available-for-sale | $ | $ | $ | $ | ||||||||||||
| Mutual fund | $ | |||||||||||||||
| Non-marketable securities | ||||||||||||||||
| Federal Home Loan Bank of Boston stock | $ | $ | $ | $ |
Salisbury sold
$
The following table summarizes the aggregate fair value and gross unrealized loss of securities that have been in a continuous unrealized loss position as of the date presented:
| Less than 12 Months | 12 Months or Longer | Total | ||||||||||||||||||||||
| June 30, 2022 (in thousands) | Fair value | Unrealized losses | Fair value | Unrealized losses | Fair value | Unrealized losses | ||||||||||||||||||
| Available-for-sale | ||||||||||||||||||||||||
| U.S. Treasury | $ | $ | $ | $ | $ | $ | ||||||||||||||||||
| U.S. Government Agency notes | ||||||||||||||||||||||||
| Municipal bonds | ||||||||||||||||||||||||
| Mortgage- backed securities: | ||||||||||||||||||||||||
| U.S. Government agencies and U.S. Government- sponsored enterprises | ||||||||||||||||||||||||
| Collateralized mortgage obligations: | ||||||||||||||||||||||||
| U.S. Government agencies | ||||||||||||||||||||||||
| Corporate bonds | ||||||||||||||||||||||||
| Total temporarily impaired securities | $ | $ | $ | $ | $ | $ | ||||||||||||||||||
| 11 |
| Less than 12 Months | 12 Months or Longer | Total | ||||||||||||||||||||||
| December 31, 2021 (in thousands) | Fair value | Unrealized losses | Fair value | Unrealized losses | Fair value | Unrealized losses | ||||||||||||||||||
| Available-for-sale | ||||||||||||||||||||||||
| U.S. Treasury | $ | $ | $ | $ | $ | $ | ||||||||||||||||||
| U.S. Government Agency notes | ||||||||||||||||||||||||
| Municipal bonds | ||||||||||||||||||||||||
| Mortgage-backed securities: | ||||||||||||||||||||||||
| U.S. Government agencies and U.S. Government- sponsored enterprises | ||||||||||||||||||||||||
| Collateralized mortgage obligations | 11,554 | 185 | — | — | 11,554 | 185 | ||||||||||||||||||
| Corporate bonds | ||||||||||||||||||||||||
| Total temporarily impaired securities | $ | $ | $ | $ | $ | $ | ||||||||||||||||||
The table below presents the amortized cost, fair value and tax equivalent yield of securities, by maturity. Debt securities issued by U.S. Government agencies (SBA securities), MBS, and CMOS are disclosed separately in the table below as these securities may prepay prior to the scheduled contractual maturity dates.
| June 30, 2022 (in thousands) | Maturity | Amortized cost | Fair value | Yield(1) | ||||||||||
| U.S. Treasury | After 1 year but within 5 years | $ | $ | % | ||||||||||
| After 5 year but within 10 years | ||||||||||||||
| Total | ||||||||||||||
| U.S. Government Agency notes | After 1 year but within 5 years | |||||||||||||
| After 5 year but within 10 years | ||||||||||||||
| Total | ||||||||||||||
| Municipal bonds | After 1 year but within 5 years | |||||||||||||
| After 5 year but within 10 years | ||||||||||||||
| After 10 years but within 15 years | ||||||||||||||
| After 15 years | ||||||||||||||
| Total | ||||||||||||||
| Mortgage-backed securities and Collateralized mortgage obligations | Securities not due at a single maturity date | |||||||||||||
| Total | ||||||||||||||
| Corporate bonds | After 5 years but within 10 years | |||||||||||||
| Total | ||||||||||||||
| Securities available-for-sale | $ | $ | % | |||||||||||
(1) Yield is based on amortized cost.
Salisbury evaluates debt securities for OTTI where the fair value of a security is less than its amortized cost basis at the balance sheet date. As part of this process, Salisbury considers whether it has the intent to sell each debt security and whether it is more likely than not that it will be required to sell the security before its anticipated recovery. If either of these conditions is met, Salisbury recognizes an OTTI charge to earnings equal to the entire difference between the security’s amortized cost basis and its fair value at the balance sheet date. For securities that meet neither of these conditions, an analysis is performed to determine if any of these securities are at risk for OTTI.
The following summarizes, by security type, the basis for evaluating if the applicable securities were OTTI at June 30, 2022.
U.S. Treasury notes: The contractual cash flows are guaranteed by the U.S. government. Ten securities had unrealized losses at June 30, 2022, which approximated 8.20% of their amortized cost. Changes in fair values are a function of changes in investment spreads and interest rate movements and not changes in credit quality since time of purchase. Management expects to recover the entire amortized cost basis of these securities. Furthermore, Salisbury evaluates these securities for strategic fit and may reduce its position in these securities, although it is not more likely than not that Salisbury will be required to sell these securities before recovery of their cost basis, which may be maturity, and does not intend to sell these securities. Management evaluated the impairment status of these debt securities, and concluded that the gross unrealized losses were temporary in nature. Therefore, management does not consider these investments to be other-than temporarily impaired at June 30, 2022.
U.S. Government Agency notes: The contractual cash flows are guaranteed by the U.S. government. Twenty-three securities had unrealized losses at June 30, 2022, which approximated 6.59% of their amortized cost. Changes in fair values are a function of changes in investment spreads and interest rate movements and not changes in credit quality since time of purchase. Management expects to recover the entire amortized cost basis of these securities. Furthermore, Salisbury evaluates these securities for strategic fit and may reduce its position in these securities, although it is not more likely than not that Salisbury will be required to sell these securities before recovery of their cost basis, which may be maturity, and does not intend to sell these securities. Management evaluated the impairment status of these debt securities and concluded that the gross unrealized losses were temporary in nature. Therefore, management does not consider these investments to be other-than temporarily impaired at June 30, 2022.
Municipal bonds: Salisbury performed a detailed analysis of the municipal bond portfolio. Sixty-five securities had unrealized losses at June 30, 2022, which approximated 13.05% of their amortized cost. Management believes the unrealized loss position is attributable to interest rate and spread movements and not changes in credit quality. Management expects to recover the entire amortized cost basis of these securities. Furthermore, Salisbury evaluates these securities for strategic fit and may reduce its position in these securities, although it is not more likely than not that Salisbury will be required to sell these securities before recovery of their cost basis, which may be maturity, and does not intend to sell these securities. Management evaluated the impairment status of these debt securities, and concluded that the gross unrealized losses were temporary in nature. Therefore, management does not consider these investments to be other-than temporarily impaired at June 30, 2022.
| 12 |
U.S. Government agency and U.S. Government-sponsored mortgage-backed securities and collateralized mortgage obligations: The contractual cash flows are guaranteed by U.S. government agencies and U.S. government-sponsored enterprises. Ninety securities had unrealized losses at June 30, 2022, which approximated 8.28% of their amortized cost. Changes in fair values are a function of changes in investment spreads and interest rate movements and not changes in credit quality. Management expects to recover the entire amortized cost basis of these securities. Furthermore, Salisbury evaluates these securities for strategic fit and may reduce its position in these securities, although it is not more likely than not that Salisbury will be required to sell these securities before recovery of their cost basis, which may be maturity, and does not intend to sell these securities. Therefore, management does not consider these investments to be other-than-temporarily impaired at June 30, 2022.
Corporate bonds: Salisbury regularly monitors and analyzes its corporate bond portfolio for credit quality. Ten securities had unrealized losses at June 30, 2022, which approximated 4.20% of their amortized cost. Management believes the unrealized loss position is attributable to interest rate and spread movements and not changes in credit quality. Management expects to recover the entire amortized cost basis of these securities. Furthermore, Salisbury evaluates these securities for strategic fit and may reduce its position in these securities, although it is not more likely than not that Salisbury will be required to sell these securities before recovery of their cost basis, which may be maturity, and does not intend to sell these securities. Management evaluated the impairment status of these debt securities, and concluded that the gross unrealized losses were temporary in nature. Therefore, management does not consider these investments to be other-than temporarily impaired at June 30, 2022.
The Federal Home Loan Bank of Boston (FHLBB) is a cooperative that provides services, including funding in the form of advances, to its member banking institutions. As a requirement of membership, the Bank must own a minimum amount of FHLBB stock, calculated periodically based primarily on its level of borrowings from the FHLBB. No market exists for shares of the FHLBB and therefore, they are carried at par value. FHLBB stock may be redeemed at par value five years following termination of FHLBB membership, subject to limitations which may be imposed by the FHLBB or its regulator, the Federal Housing Finance Board, to maintain capital adequacy of the FHLBB. While the Bank currently has no intentions to terminate its FHLBB membership, the ability to redeem its investment in FHLBB stock would be subject to the conditions imposed by the FHLBB. Based on the capital adequacy and the liquidity position of the FHLBB, management believes there is no impairment related to the carrying amount of the Bank’s FHLBB stock as of June 30, 2022. Deterioration of the FHLBB’s capital levels may require the Bank to deem its restricted investment in FHLBB stock to be OTTI. If evidence of impairment exists in the future, the FHLBB stock would reflect fair value using either observable or unobservable inputs. The Bank will continue to monitor its investment in FHLBB stock.
NOTE 3 – LOANS
The composition of loans receivable and loans held-for-sale is as follows:
| (In thousands) | June 30, 2022 | December 31, 2021 | ||||||
| Residential 1-4 family | $ | $ | ||||||
| Residential 5+ multifamily | ||||||||
| Construction of residential 1-4 family | ||||||||
| Home equity lines of credit | ||||||||
| Residential real estate | ||||||||
| Commercial | ||||||||
| Construction of commercial | ||||||||
| Commercial real estate | ||||||||
| Farm land | ||||||||
| Vacant land | ||||||||
| Real estate secured | ||||||||
| Commercial and industrial ex PPP Loans | ||||||||
| PPP Loans | ||||||||
| Total Commercial and industrial | ||||||||
| Municipal | ||||||||
| Consumer | ||||||||
| Loans receivable, gross | ||||||||
| Deferred loan origination costs, net | ||||||||
| Allowance for loan losses | ( | ) | ( | ) | ||||
| Loans receivable, net | $ | $ | ||||||
| Loans held-for-sale | ||||||||
| Residential 1-4 family | $ | $ |
Salisbury has entered into loan participation agreements with other banks and transferred a portion of its originated loans to the participating banks. Transferred amounts are accounted for as sales and excluded from Salisbury’s loans receivable. Salisbury and its participating lenders share ratably in any gains or losses that may result from a borrower’s lack of compliance with contractual terms of the loan. Salisbury services the loans on behalf of the participating lenders and, as such, collects cash payments from the borrowers, remits payments (net of servicing fees) to participating lenders and disburses required escrow funds to relevant parties.
Salisbury also has entered into loan participation agreements with other banks and purchased a portion of the other banks’ originated loans. Purchased amounts are accounted for as loans without recourse to the originating bank. Salisbury and its originating lenders share ratably in any gains or losses that may result from a borrower’s lack of compliance with contractual terms of the loan. The originating banks service the loans on behalf of the participating lenders and, as such, collect cash payments from the borrowers, remit payments (net of servicing fees) to participating lenders and disburse required escrow funds to relevant parties.
At June 30,
2022 and December 31, 2021, Salisbury serviced commercial loans for other banks under loan participation agreements totaling $
| 13 |
Concentrations of Credit Risk
Salisbury's loans consist primarily of residential and commercial real estate loans located principally in Litchfield County, Connecticut; Dutchess, Orange and Ulster Counties, New York; and Berkshire County, Massachusetts, which constitute Salisbury's service area. Salisbury offers a broad range of loan and credit facilities to borrowers in its service area, including residential mortgage loans, commercial real estate loans, construction loans, working capital loans, equipment loans, and a variety of consumer loans, including home equity lines of credit, installment loans and collateral loans. All residential and commercial mortgage loans are collateralized by first or second mortgages on real estate. The ability of single family residential and consumer borrowers to honor their repayment commitments is generally dependent on the level of overall economic activity within the market area and real estate values. The ability of commercial borrowers to honor their repayment commitments is dependent on the general economy as well as the health of the real estate economic sector in Salisbury’s market area.
Salisbury’s commercial loan portfolio is comprised of loans to diverse industries, several of which are subject to operating challenges due to the COVID-19 virus pandemic (“virus”). Approximately 40% of the Bank’s commercial loan portfolio are to entities who operate rental properties, which include commercial strip malls, smaller rental units as well as multi-unit dwellings. Approximately 10% of the Bank’s commercial loans are to entities in the hospitality industry, which includes hotels, bed & breakfast inns and restaurants. Approximately 9% of the Bank’s commercial loans are to educational institutions and approximately 5% of Salisbury’s commercial loans are to entertainment and recreation related businesses, which include camps and amusement parks. Salisbury’s commercial real estate exposure as a percentage of the Bank’s total risk-based capital, which represents Tier 1 plus Tier 2 capital, was approximately 187% as of June 30, 2022 and 179% at December 31, 2021 compared to the regulatory monitoring guideline of 300%.
Salisbury’s commercial loan exposure is mitigated by a variety of factors including the personal liquidity of the borrower, real estate and/or non-real estate collateral, U.S. Department of Agriculture or Small Business Administration (“SBA”) guarantees, loan payment deferrals and economic stimulus loans from the U.S. government as a result of the virus, and other factors. Due to the COVID-19 pandemic, the Bank may experience higher loan payment delinquencies and higher loan charge-offs, which could warrant increased provisions for loan losses.
At June 30,
2022 Salisbury had gross PPP loan balances of $
Credit Quality
Salisbury uses credit risk ratings as part of its determination of the allowance for loan losses. Credit risk ratings categorize loans by common financial and structural characteristics that measure the credit strength of a borrower. The rating model has eight risk rating grades, with each grade corresponding to a progressively greater risk of default. Grades 1 through 4 are considered not criticized and are aggregated as pass rated, and 5 through 8 are criticized as defined by the regulatory agencies. Risk ratings are assigned to differentiate risk within the portfolio and are reviewed on an ongoing basis and revised, if needed, to reflect changes in the borrowers' current financial position and outlook, risk profiles and the related collateral and structural positions. Salisbury sold approximately $3.7 million of non-performing and under-performing loans during the six-month period ended June 30, 2022 to further manage the Bank’s credit risk proactively.
Loans rated as "special mention" (5) possess credit deficiencies or potential weaknesses deserving management’s close attention that if left uncorrected may result in deterioration of the repayment prospects for the loans at some future date.
Loans rated as "substandard" (6) are loans where the Bank’s position is clearly not protected adequately by borrower current net worth or payment capacity. These loans have well defined weaknesses based on objective evidence and include loans where future losses to the Bank may result if deficiencies are not corrected, and loans where the primary source of repayment such as income is diminished, and the Bank must rely on sale of collateral or other secondary sources of collection.
Loans rated "doubtful" (7) have the same weaknesses as substandard loans with the added characteristic that the weakness makes collection or liquidation in full, given current facts, conditions, and values, to be highly improbable. The possibility of loss is high, but due to certain important and reasonably specific pending factors, which may work to strengthen the loan, its reclassification as an estimated loss is deferred until its exact status can be determined.
Loans classified as "loss" (8) are considered uncollectible and of such little value that continuance as Bank assets is unwarranted. This classification does not mean that the loan has absolutely no recovery or salvage value, but rather, it is not practical or desirable to defer writing off this loan even though partial recovery may be made in the future.
Management actively reviews and tests its credit risk ratings against actual experience and engages an independent third-party to annually validate its assignment of credit risk ratings. In addition, the Bank’s loan portfolio is examined periodically by its regulatory agencies, the FDIC and the CTDOB.
| 14 |
The composition of loans receivable by risk rating grade is presented in the table below. The decrease in substandard loans from year end 2021 primarily reflected management’s upgrade of the internal risk rating on approximately $17 million of loans that were mostly related to the hospitality and entertainment and recreation industries. These loans were previously downgraded due to concerns over COVID-19 but the businesses have since demonstrated a return to pre-pandemic levels of activity and liquidity.
| (in thousands) | Pass | Special mention | Substandard | Doubtful | Loss | Total | ||||||||||||||||||
| June 30, 2022 | ||||||||||||||||||||||||
| Residential 1-4 family | $ | $ | $ | $ | $ | $ | ||||||||||||||||||
| Residential 5+ multifamily | ||||||||||||||||||||||||
| Construction of residential 1-4 family | ||||||||||||||||||||||||
| Home equity lines of credit | ||||||||||||||||||||||||
| Residential real estate | ||||||||||||||||||||||||
| Commercial | ||||||||||||||||||||||||
| Construction of commercial | ||||||||||||||||||||||||
| Commercial real estate | ||||||||||||||||||||||||
| Farm land | ||||||||||||||||||||||||
| Vacant land | ||||||||||||||||||||||||
| Real estate secured | ||||||||||||||||||||||||
| Commercial and industrial | ||||||||||||||||||||||||
| Municipal | ||||||||||||||||||||||||
| Consumer | ||||||||||||||||||||||||
| Loans receivable, gross | $ | $ | $ | $ | $ | $ | ||||||||||||||||||
| (in thousands) | Pass | Special mention | Substandard | Doubtful | Loss | Total | ||||||||||||||||||
| December 31, 2021 | ||||||||||||||||||||||||
| Residential 1-4 family | $ | $ | $ | $ | $ | $ | ||||||||||||||||||
| Residential 5+ multifamily | ||||||||||||||||||||||||
| Construction of residential 1-4 family | ||||||||||||||||||||||||
| Home equity lines of credit | ||||||||||||||||||||||||
| Residential real estate | ||||||||||||||||||||||||
| Commercial | ||||||||||||||||||||||||
| Construction of commercial | ||||||||||||||||||||||||
| Commercial real estate | ||||||||||||||||||||||||
| Farm land | ||||||||||||||||||||||||
| Vacant land | ||||||||||||||||||||||||
| Real estate secured | ||||||||||||||||||||||||
| Commercial and industrial | ||||||||||||||||||||||||
| Municipal | ||||||||||||||||||||||||
| Consumer | ||||||||||||||||||||||||
| Loans receivable, gross | $ | $ | $ | $ | $ | $ | ||||||||||||||||||
The composition of loans receivable by delinquency status is as follows:
| Past due | ||||||||||||||||||||||||||||||||
| 180 | 30 | Accruing | ||||||||||||||||||||||||||||||
| (in thousands) | days | days | 90 days | |||||||||||||||||||||||||||||
| 30-59 | 60-89 | 90-179 | and | and | and | Non- | ||||||||||||||||||||||||||
| Current | days | days | days | over | over | over | accrual | |||||||||||||||||||||||||
| June 30, 2022 | ||||||||||||||||||||||||||||||||
| Residential 1-4 family | $ | $ | $ | $ | $ | $ | $ | $ | ||||||||||||||||||||||||
| Residential 5+ multifamily | ||||||||||||||||||||||||||||||||
| Construction of residential 1-4 family | ||||||||||||||||||||||||||||||||
| Home equity lines of credit | ||||||||||||||||||||||||||||||||
| Residential real estate | ||||||||||||||||||||||||||||||||
| Commercial | ||||||||||||||||||||||||||||||||
| Construction of commercial | ||||||||||||||||||||||||||||||||
| Commercial real estate | ||||||||||||||||||||||||||||||||
| Farm land | ||||||||||||||||||||||||||||||||
| Vacant land | ||||||||||||||||||||||||||||||||
| Real estate secured | ||||||||||||||||||||||||||||||||
| Commercial and industrial | ||||||||||||||||||||||||||||||||
| Municipal | ||||||||||||||||||||||||||||||||
| Consumer | ||||||||||||||||||||||||||||||||
| Loans receivable, gross | $ | $ | $ | $ | $ | $ | $ | $ | ||||||||||||||||||||||||
| 15 |
| Past due | ||||||||||||||||||||||||||||||||
| 180 | 30 | Accruing | ||||||||||||||||||||||||||||||
| (in thousands) | days | days | 90 days | |||||||||||||||||||||||||||||
| 30-59 | 60-89 | 90-179 | and | and | and | Non- | ||||||||||||||||||||||||||
| Current | days | days | days | over | over | over | accrual | |||||||||||||||||||||||||
| December 31, 2021 | ||||||||||||||||||||||||||||||||
| Residential 1-4 family | $ | $ | $ | $ | $ | $ | $ | $ | ||||||||||||||||||||||||
| Residential 5+ multifamily | ||||||||||||||||||||||||||||||||
| Construction of residential 1-4 family | ||||||||||||||||||||||||||||||||
| Home equity lines of credit | ||||||||||||||||||||||||||||||||
| Residential real estate | ||||||||||||||||||||||||||||||||
| Commercial | ||||||||||||||||||||||||||||||||
| Construction of commercial | ||||||||||||||||||||||||||||||||
| Commercial real estate | ||||||||||||||||||||||||||||||||
| Farm land | ||||||||||||||||||||||||||||||||
| Vacant land | ||||||||||||||||||||||||||||||||
| Real estate secured | ||||||||||||||||||||||||||||||||
| Commercial and industrial | ||||||||||||||||||||||||||||||||
| Municipal | ||||||||||||||||||||||||||||||||
| Consumer | ||||||||||||||||||||||||||||||||
| Loans receivable, gross | $ | $ | $ | $ | $ | $ | $ | $ | ||||||||||||||||||||||||
Troubled Debt Restructurings (TDRs)
There were no troubled debt restructurings during the second quarter of 2022 or second quarter of 2021 or for the six months ended June 30, 2022 and June 30, 2021, respectively.
Allowance for Loan Losses
Changes in the allowance for loan losses are as follows:
| Three months ended June 30, 2022 | Three months ended June 30, 2021 | |||||||||||||||||||||||||||||||||||||||
| Beginning balance | Provision (Benefit) | Charge- offs | Reco- veries | Ending balance | Beginning balance | Provision (Benefit) | Charge- offs | Reco- veries | Ending balance | |||||||||||||||||||||||||||||||
| Residential 1-4 family | $ | $ | $ | ( | ) | $ | $ | $ | $ | ( | ) | $ | ( | ) | $ | $ | ||||||||||||||||||||||||
| Residential 5+ multifamily | ( | ) | ||||||||||||||||||||||||||||||||||||||
| Construction of residential 1-4 family | ||||||||||||||||||||||||||||||||||||||||
| Home equity lines of credit | ( | ) | ( | ) | ||||||||||||||||||||||||||||||||||||
| Residential real estate | ( | ) | ( | ) | ( | ) | ||||||||||||||||||||||||||||||||||
| Commercial | ( | ) | ( | ) | ||||||||||||||||||||||||||||||||||||
| Construction of commercial | ( | ) | ( | ) | ||||||||||||||||||||||||||||||||||||
| Commercial real estate | ( | ) | ( | ) | ( | ) | ( | ) | ||||||||||||||||||||||||||||||||
| Farm land | ( | ) | ||||||||||||||||||||||||||||||||||||||
| Vacant land | ( | ) | ( | ) | ||||||||||||||||||||||||||||||||||||
| Real estate secured | ( | ) | ( | ) | ( | ) | ||||||||||||||||||||||||||||||||||
| Commercial and industrial | ( | ) | ( | ) | ||||||||||||||||||||||||||||||||||||
| Municipal | ( | ) | ||||||||||||||||||||||||||||||||||||||
| Consumer | ( | ) | ( | ) | ||||||||||||||||||||||||||||||||||||
| Unallocated | ( | ) | ||||||||||||||||||||||||||||||||||||||
| Totals | $ | $ | $ | ( | ) | $ | $ | $ | $ | ( | ) | $ | ( | ) | $ | $ | ||||||||||||||||||||||||
| 16 |
| Six months ended June 30, 2022 | Six months ended June 30, 2021 | |||||||||||||||||||||||||||||||||||||||
| Beginning balance | Provision (Benefit) | Charge- offs | Reco- veries | Ending balance | Beginning balance | Provision (Benefit) | Charge- offs | Reco- veries | Ending balance | |||||||||||||||||||||||||||||||
| Residential 1-4 family | $ | $ | $ | ( | ) | $ | $ | $ | $ | ( | ) | $ | ( | ) | $ | $ | ||||||||||||||||||||||||
| Residential 5+ multifamily | ( | ) | ( | ) | ||||||||||||||||||||||||||||||||||||
| Construction of residential 1-4 family | ||||||||||||||||||||||||||||||||||||||||
| Home equity lines of credit | ( | ) | ( | ) | ||||||||||||||||||||||||||||||||||||
| Residential real estate | ( | ) | ( | ) | ( | ) | ||||||||||||||||||||||||||||||||||
| Commercial | ( | ) | ( | ) | ( | ) | ||||||||||||||||||||||||||||||||||
| Construction of commercial | ( | ) | ( | ) | ||||||||||||||||||||||||||||||||||||
| Commercial real estate | ( | ) | ( | ) | ( | ) | ( | ) | ||||||||||||||||||||||||||||||||
| Farm land | ( | ) | ||||||||||||||||||||||||||||||||||||||
| Vacant land | ( | ) | ||||||||||||||||||||||||||||||||||||||
| Real estate secured | ( | ) | ( | ) | ( | ) | ||||||||||||||||||||||||||||||||||
| Commercial and industrial | ( | ) | ( | ) | ( | ) | ||||||||||||||||||||||||||||||||||
| Municipal | ( | ) | ||||||||||||||||||||||||||||||||||||||
| Consumer | ( | ) | ( | ) | ( | ) | ||||||||||||||||||||||||||||||||||
| Unallocated | ( | ) | ||||||||||||||||||||||||||||||||||||||
| Totals | $ | $ | $ | ( | ) | $ | $ | $ | $ | ( | ) | $ | ( | ) | $ | $ | ||||||||||||||||||||||||
The composition of loans receivable and the allowance for loan losses is as follows:
| (in thousands) | Collectively evaluated | Individually evaluated | Total portfolio | |||||||||||||||||||||
| Loans | Allowance | Loans | Allowance | Loans | Allowance | |||||||||||||||||||
| June 30, 2022 | ||||||||||||||||||||||||
| Residential 1-4 family | $ | $ | $ | $ | $ | $ | ||||||||||||||||||
| Residential 5+ multifamily | ||||||||||||||||||||||||
| Construction of residential 1-4 family | ||||||||||||||||||||||||
| Home equity lines of credit | ||||||||||||||||||||||||
| Residential real estate | ||||||||||||||||||||||||
| Commercial | ||||||||||||||||||||||||
| Construction of commercial | ||||||||||||||||||||||||
| Commercial real estate | ||||||||||||||||||||||||
| Farm land | ||||||||||||||||||||||||
| Vacant land | ||||||||||||||||||||||||
| Real estate secured | ||||||||||||||||||||||||
| Commercial and industrial | ||||||||||||||||||||||||
| Municipal | ||||||||||||||||||||||||
| Consumer | ||||||||||||||||||||||||
| Unallocated allowance | ||||||||||||||||||||||||
| Totals | $ | $ | $ | $ | $ | $ | ||||||||||||||||||
| (in thousands) | Collectively evaluated | Individually evaluated | Total portfolio | |||||||||||||||||||||
| Loans | Allowance | Loans | Allowance | Loans | Allowance | |||||||||||||||||||
| December 31, 2021 | ||||||||||||||||||||||||
| Residential 1-4 family | $ | $ | $ | $ | $ | $ | ||||||||||||||||||
| Residential 5+ multifamily | ||||||||||||||||||||||||
| Construction of residential 1-4 family | ||||||||||||||||||||||||
| Home equity lines of credit | ||||||||||||||||||||||||
| Residential real estate | ||||||||||||||||||||||||
| Commercial | ||||||||||||||||||||||||
| Construction of commercial | ||||||||||||||||||||||||
| Commercial real estate | ||||||||||||||||||||||||
| Farm land | ||||||||||||||||||||||||
| Vacant land | ||||||||||||||||||||||||
| Real estate secured | ||||||||||||||||||||||||
| Commercial and industrial | ||||||||||||||||||||||||
| Municipal | ||||||||||||||||||||||||
| Consumer | ||||||||||||||||||||||||
| Unallocated allowance | ||||||||||||||||||||||||
| Totals | $ | $ | $ | $ | $ | $ | ||||||||||||||||||
| 17 |
The credit quality segments of loans receivable and the allowance for loan losses are as follows:
| June 30, 2022 (in thousands) | Collectively evaluated | Individually evaluated | Total portfolio | |||||||||||||||||||||
| Loans | Allowance | Loans | Allowance | Loans | Allowance | |||||||||||||||||||
| Performing loans | $ | $ | $ | $ | $ | $ | ||||||||||||||||||
| Potential problem loans 1 | ||||||||||||||||||||||||
| Impaired loans | ||||||||||||||||||||||||
| Unallocated allowance | ||||||||||||||||||||||||
| Totals | $ | $ | $ | $ | $ | $ | ||||||||||||||||||
| December 31, 2021 (in thousands) | Collectively evaluated | Individually evaluated | Total portfolio | |||||||||||||||||||||
| Loans | Allowance | Loans | Allowance | Loans | Allowance | |||||||||||||||||||
| Performing loans | $ | $ | $ | $ | $ | $ | ||||||||||||||||||
| Potential problem loans 1 | ||||||||||||||||||||||||
| Impaired loans | ||||||||||||||||||||||||
| Unallocated allowance | ||||||||||||||||||||||||
| Totals | $ | $ | $ | $ | $ | $ | ||||||||||||||||||
1 Potential problem loans consist of performing loans that have been assigned a substandard credit risk rating and are not classified as impaired.
A specific valuation allowance is established for the impairment amount of each impaired loan, calculated using the present value of expected cash flows or fair value of collateral, in accordance with the most likely means of recovery. Certain data with respect to loans individually evaluated for impairment is as follows:
| Impaired loans with specific allowance | Impaired loans with no specific allowance | |||||||||||||||||||||||||||||||||||
| (in thousands) | Loan balance | Specific | Income | Loan balance | Income | |||||||||||||||||||||||||||||||
| Recorded Investment | Note | Average | allowance | recognized | Recorded Investment | Note | Average | recognized | ||||||||||||||||||||||||||||
| June 30, 2022 | ||||||||||||||||||||||||||||||||||||
| Residential | $ | $ | $ | $ | $ | $ | $ | $ | $ | |||||||||||||||||||||||||||
| Home equity lines of credit | ||||||||||||||||||||||||||||||||||||
| Residential real estate | ||||||||||||||||||||||||||||||||||||
| Commercial | ||||||||||||||||||||||||||||||||||||
| Construction of commercial | ||||||||||||||||||||||||||||||||||||
| Farm land | ||||||||||||||||||||||||||||||||||||
| Vacant land | ||||||||||||||||||||||||||||||||||||
| Real estate secured | ||||||||||||||||||||||||||||||||||||
| Commercial and industrial | ||||||||||||||||||||||||||||||||||||
| Consumer | ||||||||||||||||||||||||||||||||||||
| Totals | $ | $ | $ | $ | $ | $ | $ | $ | $ | |||||||||||||||||||||||||||
Note: The income recognized is for the six-month period ended June 30, 2022.
| Impaired loans with specific allowance | Impaired loans with no specific allowance | |||||||||||||||||||||||||||||||||||
| (in thousands) | Loan balance | Specific | Income | Loan balance | Income | |||||||||||||||||||||||||||||||
| Recorded Investment | Note | Average | allowance | recognized | Recorded Investment | Note | Average | recognized | ||||||||||||||||||||||||||||
| June 30, 2021 | ||||||||||||||||||||||||||||||||||||
| Residential | $ | $ | $ | $ | $ | $ | $ | $ | $ | |||||||||||||||||||||||||||
| Home equity lines of credit | ||||||||||||||||||||||||||||||||||||
| Residential real estate | ||||||||||||||||||||||||||||||||||||
| Commercial | ||||||||||||||||||||||||||||||||||||
| Construction of commercial | ||||||||||||||||||||||||||||||||||||
| Farm land | ||||||||||||||||||||||||||||||||||||
| Vacant land | ||||||||||||||||||||||||||||||||||||
| Real estate secured | ||||||||||||||||||||||||||||||||||||
| Commercial and industrial | ||||||||||||||||||||||||||||||||||||
| Consumer | ||||||||||||||||||||||||||||||||||||
| Totals | $ | $ | $ | $ | $ | $ | $ | $ | $ | |||||||||||||||||||||||||||
Note: The income recognized is for the six-month period ended June 30, 2021.
| 18 |
Certain data with respect to loans individually evaluated for impairment is as follows as of and for the year ended December 31, 2021:
| Impaired loans with specific allowance | Impaired loans with no specific allowance | |||||||||||||||||||||||||||||||||||
| (in thousands) | Loan balance | Specific | Income | Loan balance | Income | |||||||||||||||||||||||||||||||
| Recorded Investment | Note | Average | allowance | recognized | Recorded Investment | Note | Average | recognized | ||||||||||||||||||||||||||||
| December 31, 2021 | ||||||||||||||||||||||||||||||||||||
| Residential | $ | $ | $ | $ | $ | $ | $ | $ | $ | |||||||||||||||||||||||||||
| Home equity lines of credit | ||||||||||||||||||||||||||||||||||||
| Residential real estate | ||||||||||||||||||||||||||||||||||||
| Commercial | ||||||||||||||||||||||||||||||||||||
| Construction of commercial | ||||||||||||||||||||||||||||||||||||
| Farm land | ||||||||||||||||||||||||||||||||||||
| Vacant land | ||||||||||||||||||||||||||||||||||||
| Real estate secured | ||||||||||||||||||||||||||||||||||||
| Commercial and industrial | ||||||||||||||||||||||||||||||||||||
| Consumer | ||||||||||||||||||||||||||||||||||||
| Totals | $ | $ | $ | $ | $ | $ | $ | $ | $ | |||||||||||||||||||||||||||
NOTE 4 – LEASES
The Bank leases facilities and equipment with various expiration dates. The facilities leases have varying renewal options, generally require fixed annual rent, and provide that real estate taxes, insurance, and maintenance expenses are to be paid by Salisbury. The following table provides the assets and liabilities as of June 30, 2022 and December 31, 2021, as well as the costs of operating and financial leases, which are included in the Bank’s consolidated income statement for the six months ended June 30, 2022 and 2021.
| ($ in thousands, except lease term and discount rate) | Classification | June 30, 2022 | December 31, 2021 | |||||||
| Assets | ||||||||||
| Operating | Other assets | $ | $ | |||||||
| Finance | Bank premises and equipment 1 | |||||||||
| Total Leased Assets | $ | $ | ||||||||
| Liabilities | ||||||||||
| Operating | Other liabilities | $ | $ | |||||||
| Finance | Finance lease | |||||||||
| Total lease liabilities | $ | $ | ||||||||
| 1 Net
of accumulated depreciation of $ | ||||||||||
| Lease cost | Classification | Six months ended | Three months ended | |||||||
| June 30, 2022 | June 30, 2022 | |||||||||
| Operating leases | Premises and equipment | $ | $ | |||||||
| Finance leases: | ||||||||||
| Amortization of leased assets | Premises and equipment | |||||||||
| Interest on finance leases | Interest expense | |||||||||
| Total lease cost | $ | $ | ||||||||
| Lease cost | Classification | Six months ended | Three months ended | |||||||
| June 30, 2021 | June 30, 2021 | |||||||||
| Operating leases | Premises and equipment | $ | $ | |||||||
| Finance leases: | ||||||||||
| Amortization of leased assets | Premises and equipment | |||||||||
| Interest on finance leases | Interest expense | |||||||||
| Total lease cost | $ | $ | ||||||||
| Weighted Average Remaining Lease Term | June 30, 2022 | December 31, 2021 | ||||||||
| Operating leases | ||||||||||
| Financing leases | ||||||||||
| Weighted Average Discount Rate 1 | ||||||||||
| Operating leases | % | % | ||||||||
| Financing leases | % | % | ||||||||
| 1 Salisbury uses the FHLBB five-year Advance rate as the discount rate, as its leases do not provide an implicit rate. | ||||||||||
| 19 |
The following is a schedule by years of the present value of the net minimum lease payments as of June 30, 2022.
| Future minimum lease payments (in thousands) | Operating Leases | Finance Leases | ||||||||
| 2022 | $ | $ | ||||||||
| 2023 | ||||||||||
| 2024 | ||||||||||
| 2025 | ||||||||||
| 2026 | ||||||||||
| Thereafter | ||||||||||
| Total future minimum lease payments | ||||||||||
| Less amount representing interest | ( | ) | ( | ) | ||||||
| Total present value of net future minimum lease payments | $ | $ | ||||||||
NOTE 5 - MORTGAGE SERVICING RIGHTS
| (in thousands) | June 30, 2022 | December 31, 2021 | ||||||
| Residential mortgage loans serviced for others | $ | $ | ||||||
| Fair value of mortgage servicing rights |
Changes in mortgage servicing rights are as follows:
| Three months ended | Six months ended | |||||||||||||||
| Periods ended June 30, (in thousands) | 2022 | 2021 | 2022 | 2021 | ||||||||||||
| Mortgage Servicing Rights | ||||||||||||||||
| Balance, beginning of period | $ | $ | $ | $ | ||||||||||||
| Originated | ||||||||||||||||
| Amortization (1) | ( | ) | ( | ) | ( | ) | ( | ) | ||||||||
| Balance, end of period | $ | $ | $ | $ | ||||||||||||
| Valuation Allowance | ||||||||||||||||
| Balance, beginning of period | ( | ) | ||||||||||||||
| Decrease in impairment reserve (1) | ||||||||||||||||
| Balance, end of period | ||||||||||||||||
| Mortgage servicing rights, net | $ | $ | $ | $ | ||||||||||||
| (1) | Amortization expense and changes in the impairment reserve are recorded in mortgage banking activities, net. |
NOTE 6 - PLEDGED ASSETS
The following securities and loans were pledged to secure public and trust deposits, securities sold under agreements to repurchase, FHLBB advances and credit facilities available.
| (in thousands) | June 30, 2022 | December 31, 2021 | ||||||
| Securities available-for-sale (at fair value) | $ | $ | ||||||
| Loans receivable (at book value) | ||||||||
| Total pledged assets | $ | $ |
At June 30, 2022, securities were pledged as follows: $
NOTE 7 – DERIVATIVES AND HEDGING ACTIVITIES
Risk Management Objective of Using Derivatives
Salisbury is exposed to certain risk arising from both its business operations and economic conditions. The Bank principally manages its exposures to a wide variety of business and operational risks through management of its core business activities. The Bank manages economic risks, including interest rate, liquidity, and credit risk primarily by managing the amount, sources, and duration of its assets and liabilities and the use of derivative financial instruments. Specifically, the Bank enters into derivative financial instruments to manage exposures that arise from business activities that result in the receipt or payment of future known and uncertain cash amounts, the value of which are determined by interest rates. The Bank uses derivative financial instruments to manage differences in the amount, timing, and duration of the Bank’s known or expected cash receipts and its known or expected cash payments principally related to its portfolio of loans to first-time home buyers.
Fair Value Hedges of Interest Rate Risk
The Company is exposed to changes in the fair value of certain pools of its pre-payable fixed-rate assets due to changes in benchmark interest rates. Salisbury uses interest rate swaps to manage its exposure to changes in fair value on these instruments attributable to changes in the designated benchmark interest rate, Federal Funds. Interest rate swaps designated as fair value hedges involve the payment of fixed-rate amounts to a counterparty in exchange for Salisbury receiving variable-rate payments over the life of the agreements without the exchange of the underlying notional amount.
For derivatives designated and that qualify as fair value hedges, the gain or loss on the derivative as well as the offsetting loss or gain on the hedged item attributable to the hedged risk are recognized in interest income.
| 20 |
As of June 30, 2022 and December 30, 2021, the following amounts were recorded on the balance sheet related to cumulative basis adjustment for fair value hedges:
| Line Item in the Statement of Financial Position in Which the Hedged Item is Included | Carrying Amount of the Hedged Assets/(Liabilities) | Cumulative Amount of Fair Value Hedging Adjustment Included in the Carrying Amount of the Hedged Assets/(Liabilities) | ||||||||||||||
| (in thousands) | June 30, 2022 | December 31, 2021 | June 30, 2022 | December 31, 2021 | ||||||||||||
| Loans receivable(1) | $ | $ | $ | ( | ) | $ | ( | ) | ||||||||
| Total | $ | $ | $ | ( | ) | $ | ( | ) | ||||||||
| (1) | These amounts include the amortized
cost basis of closed portfolios used in designated hedging relationships in which the hedged item is the last layer expected to be remaining
at the end of the hedging relationship. At June 30, 2022, the amortized cost basis of the closed portfolios used in these hedging relationships
was $ |
The table below presents the fair value of Salisbury’s derivative financial instrument and its classification on the Balance Sheet as of June 30, 2022 and December 31, 2021.
| As of June 30, 2022 | As of December 31, 2021 | |||||||||||||||
| (in thousands) | Notional Amount | Balance Sheet Location | Fair Value | Balance Sheet Location | Fair Value | |||||||||||
| Derivatives designated as hedge instruments | ||||||||||||||||
| Interest Rate Products | $ | Other assets | $ | Other Assets | $ | |||||||||||
| Total Derivatives designated as hedge instruments | $ | $ | ||||||||||||||
The table below presents the effect of the Company’s derivative financial instruments on the Income Statement for the three and six months ended June 30, 2022 and June 30, 2021.
| | | |||||||||||||||
| Three
months ended June 30, 2022 | Six
months ended June 30, 2022 | |||||||||||||||
| (in thousands) | Interest
Income | Interest
Expense | Interest
Income | Interest
Expense | ||||||||||||
| Total amounts of interest income and expense line items presented in the income statement in which the effects of fair value or cash flow hedges are recorded | $ | $ | $ | $ | ||||||||||||
| Gain or (loss) on fair value hedging relationships in Subtopic 815-20 | ||||||||||||||||
| Interest contracts | ||||||||||||||||
| Hedged items | ( | ) | ||||||||||||||
| Derivatives designated as hedging instruments | $ | $ | $ | $ | ||||||||||||
| | | |||||||||||||||
| Three
months ended June 30, 2021 | Six
months ended June 30, 2021 | |||||||||||||||
| (in thousands) | Interest
Income | Interest
Expense | Interest
Income | Interest
Expense | ||||||||||||
| Total amounts of interest income and expense line items presented in the income statement in which the effects of fair value or cash flow hedges are recorded | $ | $ | $ | $ | ||||||||||||
| Gain or (loss) on fair value hedging relationships in Subtopic 815-20 | ||||||||||||||||
| Interest contracts | ||||||||||||||||
| Hedged items | ( | ) | ( | ) | ||||||||||||
| Derivatives designated as hedging instruments | $ | $ | $ | $ | ||||||||||||
Credit-Risk Related Contingent Features
Salisbury has an agreement with its derivative counterparty that contains a provision that provides that if the Bank defaults on any of its indebtedness, including default where repayment of the indebtedness has not been accelerated by the lender, then the Bank could also be declared in default on its derivative obligations.
The agreement also contains a provision where if the Bank fails to maintain its status as a well / adequate capitalized institution, then Salisbury could be required to post cash or certain marketable securities issued by the U.S. Treasury or U.S. Government-sponsored enterprises as collateral. The minimum amount that Salisbury would have to post as collateral is $250 thousand.
As of June 30, 2022, the fair value of the derivative was $49 thousand in a net asset position, which includes accrued interest but excludes any adjustment for nonperformance risk, related to these agreements. As of June 30, 2022, Salisbury has not posted any collateral related to these agreements.
| 21 |
Salisbury defines unvested share-based payment awards that contain non-forfeitable rights to dividends as participating securities that are included in computing earnings per share (EPS) using the two-class method.
The two-class method is an earnings allocation formula that determines earnings per share for each share of common stock and participating securities according to dividends declared and participation rights in undistributed earnings. Under this method, all earnings (distributed and undistributed) are allocated to common shares and participating securities based on their respective rights to receive dividends. Basic EPS excludes dilution and is computed by dividing income allocated to common stockholders by the weighted-average number of common shares outstanding for the period. Diluted EPS reflects the potential dilution that could occur if securities or other contracts to issue common stock were exercised or converted into common stock or resulted in the issuance of common stock that then shared in the earnings of the entity.
The following table sets forth the computation of earnings per share (basic and diluted) for the periods indicated. All per share data has been adjusted to reflect the two-for-one forward common share split, which was effective on June 30, 2022.
| Three months ended | Six months ended | |||||||||||||||
| Periods ended June 30, (in thousands, except per share data) | 2022 | 2021 | 2022 | 2021 | ||||||||||||
| Net income | $ | $ | $ | $ | ||||||||||||
| Less: Undistributed earnings allocated to participating securities | ( | ) | ( | ) | ( | ) | ( | ) | ||||||||
| Net income allocated to common stock | $ | $ | $ | $ | ||||||||||||
| Weighted-average common shares issued | ||||||||||||||||
| Less: Unvested restricted stock awards | ( | ) | ( | ) | ( | ) | ( | ) | ||||||||
| Weighted average common shares outstanding used to calculate basic earnings per common share | ||||||||||||||||
| Add: Dilutive effect of stock options | ||||||||||||||||
| Weighted-average common shares outstanding used to calculate diluted earnings per common share | ||||||||||||||||
| Earnings per common share (basic) | $ | $ | $ | $ | ||||||||||||
| Earnings per common share (diluted) | $ | $ | $ | $ | ||||||||||||
NOTE 9 – SHAREHOLDERS’ EQUITY
Capital Requirements
The Company and the Bank are subject to various regulatory capital requirements administered by the federal banking agencies. Failure to meet minimum capital requirements can initiate certain mandatory and possibly additional discretionary actions by the regulators that, if undertaken, could have a direct material effect on the Bank's financial statements. Under capital adequacy guidelines and the regulatory framework for prompt corrective action, the Bank must meet specific guidelines that involve quantitative measures of its assets, liabilities, and certain off-balance sheet items as calculated under regulatory accounting practices. The Bank's capital amounts and classification are also subject to qualitative judgments by the regulators about components, risk weightings, and other factors.
The Bank became subject to capital regulations adopted by the Board of Governors of the Federal Reserve System (FRB) and the FDIC, which implemented the Basel III regulatory capital reforms and the changes required by the Dodd-Frank Act. The required minimum regulatory capital ratios to which the Bank is subject, and the minimum ratios required for the Bank to be categorized as “well capitalized” under the prompt corrective action framework are noted in the table below. In addition, the regulations established a capital conservation buffer of 2.5% effective January 1, 2019. Failure to maintain the capital conservation buffer will limit the ability of the Company and the Bank to pay discretionary bonuses and dividends. At June 30, 2022, the Bank exceeded the minimum requirement for the capital conservation buffer. As of June 30, 2022, the most recent notification from the Federal Deposit Insurance Corporation categorized the Bank as well capitalized under the regulatory framework for prompt corrective action. There are no conditions or events since that notification that management believes have changed that categorization.
On March 31, 2021, Salisbury issued $
As of June 30, 2022, Salisbury had not repurchased any of its common shares pursuant to the Common Stock Repurchase Plan approved by the Board of Directors in March 2022.
| 22 |
The Bank’s risk-weighted assets at June 30, 2022 and December
31, 2021 were $
| Actual | Minimum Capital Required For Capital Adequacy | Minimum Capital Required For Capital Adequacy Plus Required Capital Conservation Buffer | Minimum To Be Well Capitalized Under Prompt Corrective Action Provisions | |||||||||||||||||||||||||||||
| (dollars in thousands) | Amount | Ratio | Amount | Ratio | Amount | Ratio | Amount | Ratio | ||||||||||||||||||||||||
June 30, 2022 | ||||||||||||||||||||||||||||||||
| Total Capital (to risk-weighted assets) | $ | % | $ | % | $ | % | $ | % | ||||||||||||||||||||||||
| Tier 1 Capital (to risk-weighted assets) | ||||||||||||||||||||||||||||||||
| Common Equity Tier 1 Capital (to risk-weighted assets) | ||||||||||||||||||||||||||||||||
| Tier 1 Capital (to average assets) | $ | $ | $ | $ | ||||||||||||||||||||||||||||
December 31, 2021 | ||||||||||||||||||||||||||||||||
| Total Capital (to risk-weighted assets) | $ | % | $ | % | $ | % | $ | % | ||||||||||||||||||||||||
| Tier 1 Capital (to risk-weighted assets) | ||||||||||||||||||||||||||||||||
| Common Equity Tier 1 Capital (to risk-weighted assets) | ||||||||||||||||||||||||||||||||
| Tier 1 Capital (to average assets) | $ | $ | $ | $ | ||||||||||||||||||||||||||||
Restrictions on Cash Dividends to Common Shareholders
Salisbury's ability to pay cash dividends is substantially dependent on the Bank's ability to pay cash dividends to Salisbury. There are certain restrictions on the payment of cash dividends and other payments by the Bank to Salisbury. Under Connecticut law, the Bank cannot declare a cash dividend except from net profits, defined as the remainder of all earnings from current operations. The total of all cash dividends declared by the Bank in any calendar year shall not, unless specifically approved by the Banking Commissioner, exceed the total of its net profits of that year combined with its retained net profits of the preceding two years.
FRB Supervisory Letter SR 09-4, February 24, 2009, revised July 24, 2020, notes that, as a general matter, the Board of Directors of a Bank Holding Company (“BHC”) should inform the Federal Reserve and should eliminate, defer, or significantly reduce dividends if (1) net income available to shareholders for the past four quarters, net of dividends previously paid during that period, is not sufficient to fully fund the dividends; (2) the prospective rate of earnings retention is not consistent with capital needs and overall current and prospective financial condition; or (3) the BHC will not meet, or is in danger of not meeting, its minimum regulatory capital adequacy ratios. Moreover, a BHC should inform the Federal Reserve reasonably in advance of declaring or paying a dividend that exceeds earnings for the period (e.g., quarter) for which the dividend is being paid or that could result in a material adverse change to the BHC capital structure.
NOTE 10 – BENEFITS
401(k)
Salisbury’s 401(k) Plan expense was $
ESOP
Salisbury offers
an ESOP to eligible employees. Under the Plan, Salisbury may make discretionary contributions to the Plan. Discretionary contributions
vest in full upon six years and reflect the following schedule of qualified service: 20% after the second year, 20% per year
thereafter, vesting at 100% after six full years of service. Salisbury’s ESOP expense was $
Other Retirement Plans
Salisbury
adopted ASC 715-60, “Compensation - Retirement Benefits - Defined Benefit Plans - Other Postretirement" and recognized a liability
for Salisbury’s future postretirement benefit obligations under endorsement split-dollar life insurance arrangements. The total
liability for the arrangements included in other liabilities was $
A Non-Qualified Deferred Compensation Plan (the "Plan") was adopted effective January 1, 2013. This Plan was adopted by the Bank for the benefit of certain key employees ("Executive" or "Executives") who have been selected and approved by the Bank to participate in this Plan and who have evidenced their participation by execution of a Non-Qualified Deferred Compensation Plan Participation Agreement ("Participation Agreement") in a form provided by the Bank. This Plan is intended to comply with Internal Revenue Code ("Code") Section 409A and any regulatory or other guidance issued under such Section. In 2021 and 2020, the Bank awarded seven (7) Executives with discretionary contributions to the plan.
| 23 |
On December 27, 2021, the Board of Directors of Salisbury Bank and Trust Company executed the Salisbury Bank and Trust Company Amended and Restated Non-Qualified Deferred Compensation Plan (the “Plan”), effective as of January 1, 2022. The Plan permits the Board to select certain key employees of the Bank to participate in the Plan, provided that such employees also evidence their participation by execution of a Participation Agreement. Before amendment and restatement, the Plan provided solely for discretionary bank contributions to selected participant’s accounts. The participation agreement sets forth the vesting terms of the discretionary contributions and the “benefit age” at which a participant could retire with a fully vested benefit. The participation agreement also sets forth how a participant’s benefit would be distributed (i.e., in a lump sum or in annual installments over a period of up to 10 years, as selected by the participant). Until distribution, a participant’s account would earn interest as of the last day of the plan year at the highest certificate of deposit rate for that year, compounded annually. The participant’s benefits under the Plan are subject to the vesting schedule set forth in the participant’s participation agreement. Notwithstanding the vesting schedule, the participant’s account balance will become automatically 100% vested upon involuntary termination without cause, death, disability or a change in control.
The amended and restated Plan allows
participant deferrals and provides greater flexibility in participant elections and investment options. The amended and restated
Plan also provides additional distribution options, including distributions in the event of an unforeseeable emergency and on the
occurrence of a specified date before separation from service, and allows a participant to elect for each year’s contributions
the manner in which such distributions will be paid. Installment distributions can be made in monthly, quarterly or annual
installments. Payment of benefits under the Plan, other than benefits payable as a result of base salary deferrals, are conditioned
on the participant’s covenant to comply with non-compete, non-solicitation and non-disclosure provisions for a period of one
year following the participant’s separation from service. The Bank has established a grantor trust to hold the assets of the
Plan. Until distributed, the assets of the Plan are not legally owned by the participants. In second quarter 2022, Salisbury
contributed $
Management Agreements: Salisbury or the Bank has entered into various management agreements with its named executive officers (“NEOs”), including a severance agreement with Mr. Cantele, President and Chief Executive Officer, a change in control agreement with Mr. Albero, Executive Vice President and Chief Financial Officer, and a severance agreement with Mr. Davies, President of the New York Region and Chief Lending Officer. In addition to these agreements, Salisbury has change in control agreements or a severance agreement, with change in control provisions, with ten other executives with payouts ranging from 0.5 to 1.0 times base salary, annual cash bonus and other benefits. Such agreements, and their subsequent amendments, are designed to allow Salisbury to retain the services of the designated executives while reducing, to the extent possible, unnecessary disruptions to Salisbury’s operations.
NOTE 11 – LONG TERM INCENTIVE PLANS
Restricted stock
Restricted stock expense was $
In second quarter 2022, Salisbury granted a total
of shares of restricted stock to certain employees and Directors pursuant to its 2017 Long Term Incentive Plan. The fair value
of the stock at grant date was approximately $
Performance-based restricted stock units
On March 29, 2019, the Compensation Committee granted performance-based restricted stock units (RSU) pursuant to the 2017 Long-Term Incentive Plan to further align compensation with the Bank’s performance. This RSU plan replaced the Bank’s Phantom Stock Appreciation Units plan (Phantom). Salisbury paid out the final tranche of these awards in January 2021. The performance goal for awards granted under the RSU plan in 2019 was based on the increase in the Bank’s tangible book value by $3.50 per share over the performance period for threshold performance. The vesting ranged from 75% of target for achieving threshold performance, to 100% of target for achieving target payout performance ($5.00 increase in tangible book value per share) to 150% of target for achieving in excess of target payout performance This tranche of awards vested in second quarter 2022 at 150% for achieving tangible book value per share growth in excess of target payout performance. The vesting of these awards occurred prior to June 30, 2022 and was not affected by the two-for-one forward stock split.
On July 29, 2020, the Compensation Committee granted
an additional
On June 23, 2021, the Compensation Committee granted
an additional
| 24 |
On February 28, 2022, the Compensation Committee
granted an additional
The fair value of the awards granted under the
RSU plan at the grant date was $
Short Term Incentive Plan (STIP)
Salisbury
offers a short-term discretionary compensation plan to eligible employees on an annual basis. Under this incentive plan, Salisbury
may reward employees with cash compensation if certain pre-determined Bank and individual performance goals have been achieved. The STIP
expense, which is included in compensation expenses, totaled $
Options
Salisbury issued stock options in conjunction with its acquisition of Riverside Bank in 2014. In second quarter 2022, a former Riverside employee exercised stock options at $ per share and in the second quarter 2021, no stock options were exercised. A former Riverside Bank executive exercised and stock options at $ per share in second quarter 2022 and 2021, respectively.
NOTE 12 – FAIR VALUE OF ASSETS AND LIABILITIES
Salisbury uses fair value measurements to record fair value adjustments to certain assets and liabilities and to determine fair value disclosures. Securities available-for-sale and the CRA mutual fund are recorded at fair value on a recurring basis. Additionally, from time to time, other assets are recorded at fair value on a nonrecurring basis, such as loans held for sale, collateral dependent impaired loans, property acquired through foreclosure or repossession and mortgage servicing rights. These nonrecurring fair value adjustments typically involve the application of lower-of-cost-or-market accounting or write-downs of individual assets.
Salisbury adopted ASC 820-10, “Fair Value Measurement - Overall,” which provides a framework for measuring fair value under generally accepted accounting principles. This guidance permitted Salisbury the irrevocable option to elect fair value for the initial and subsequent measurement for certain financial assets and liabilities on a contract-by-contract basis. Salisbury did not elect fair value treatment for any financial assets or liabilities upon adoption.
In accordance with ASC 820-10, Salisbury groups its financial assets and financial liabilities measured at fair value in three levels based on the markets in which the assets and liabilities are traded and the reliability of the assumptions used to determine fair value.
GAAP specifies a hierarchy of valuation techniques based on whether the types of valuation information (“inputs”) are observable or unobservable. Observable inputs reflect market data obtained from independent sources, while unobservable inputs reflect Salisbury’s market assumptions. These two types of inputs have created the following fair value hierarchy:
| • | Level 1. Quoted prices in active markets for identical assets. Valuations for assets and liabilities traded in active exchange markets, such as the New York Stock Exchange Valuations are obtained from readily available pricing sources for market transactions involving identical assets or liabilities. |
| • | Level 2. Significant other observable inputs. Valuations for assets and liabilities traded in less active dealer or broker markets. Valuations are obtained from third party pricing services for identical or comparable assets or liabilities. |
| • | Level 3. Significant unobservable inputs. Valuations for assets and liabilities that are derived from other methodologies, including option pricing models, discounted cash flow models and similar techniques, are not based on market exchange, dealer, or broker traded transactions. Level 3 valuations incorporate certain assumptions and projections in determining the fair value assigned to such assets and liabilities. |
| 25 |
The following is a description of valuation methodologies for assets recorded at fair value, including the general classification of such assets and liabilities pursuant to the valuation hierarchy.
| • | Securities available-for-sale and the CRA mutual fund. Securities available-for-sale and the CRA mutual fund are recorded at fair value on a recurring basis. Level 1 securities include exchange-traded equity securities. Level 2 securities include debt securities with quoted prices, which are traded less frequently than exchange-traded instruments, whose value is determined using matrix pricing with inputs that are observable in the market or can be derived principally from or corroborated by observable market data. This category generally includes obligations of the U.S. Treasury and U.S. government-sponsored enterprises, mortgage-backed securities, collateralized mortgage obligations, municipal bonds, SBA bonds, corporate bonds and certain preferred equities. Level 3 is for positions that are not traded in active markets or are subject to transfer restrictions, valuations are adjusted to reflect illiquidity and/or non-transferability, and such adjustments are generally based on available market evidence. In the absence of such evidence, management’s best estimate is used. Subsequent to inception, management only changes level 3 inputs and assumptions when corroborated by evidence such as transactions in similar instruments, completed or pending third-party transactions in the underlying investment or comparable entities, subsequent rounds of financing, recapitalization and other transactions across the capital structure, offerings in the equity or debt markets, and changes in financial ratios or cash flows. |
| • | Derivative financial instruments. The fair value of the interest rate swap is determined using the market standard methodology of netting the discounted future fixed cash receipts (or payments) and the discounted expected variable cash payments (or receipts). The variable cash payments (or receipts) are based on an expectation of future interest rates (forward curves) derived from observable market interest rate curves. |
| • | Collateral dependent loans that are deemed to be impaired are valued based upon the fair value of the underlying collateral less costs to sell. Such collateral primarily consists of real estate and, to a lesser extent, other business assets. Management may adjust appraised values to reflect estimated market value declines or apply other discounts to appraised values resulting from its knowledge of the property. Internal valuations are utilized to determine the fair value of other business assets. Collateral dependent impaired loans are categorized as Level 3. |
| • | Other real estate owned acquired through foreclosure or repossession is adjusted to fair value less costs to sell upon transfer out of loans. Subsequently, it is carried at the lower of carrying value or fair value less costs to sell. Fair value is generally based upon independent market prices or appraised values of the collateral. Management adjusts appraised values to reflect estimated market value declines or apply other discounts to appraised values for unobservable factors resulting from its knowledge of the property, and such property is categorized as Level 3. |
Assets measured at fair value are as follows:
| Fair Value Measurements Using | Assets at | |||||||||||||||
| (in thousands) | Level 1 | Level 2 | Level 3 | fair value | ||||||||||||
| June 30, 2022 | ||||||||||||||||
| Assets at fair value on a recurring basis | ||||||||||||||||
| U.S. Treasury | $ | $ | $ | $ | ||||||||||||
| U.S. Government Agency notes | ||||||||||||||||
| Municipal bonds | ||||||||||||||||
| Mortgage-backed securities: | ||||||||||||||||
| U.S. Government agencies and U.S. Government-sponsored enterprises | ||||||||||||||||
| Collateralized mortgage obligations: | ||||||||||||||||
| U.S. Government agencies | ||||||||||||||||
| Corporate bonds | ||||||||||||||||
| Securities available-for-sale | $ | $ | $ | $ | ||||||||||||
| Mutual funds | ||||||||||||||||
| Derivative financial instruments | ||||||||||||||||
| December 31, 2021 | ||||||||||||||||
| Assets at fair value on a recurring basis | ||||||||||||||||
| U.S. Treasury | $ | $ | $ | $ | ||||||||||||
| U.S. Government Agency notes | ||||||||||||||||
| Municipal bonds | ||||||||||||||||
| Mortgage-backed securities: | ||||||||||||||||
| U.S. Government agencies and U.S. Government-sponsored enterprises | ||||||||||||||||
| Collateralized mortgage obligations: | ||||||||||||||||
| U.S. Government agencies | ||||||||||||||||
| Corporate bonds | ||||||||||||||||
| Securities available-for-sale | $ | $ | $ | $ | ||||||||||||
| Mutual fund | ||||||||||||||||
| Derivative financial instruments | ||||||||||||||||
| Assets at fair value on a non-recurring basis | ||||||||||||||||
| Assets held for sale 1 | $ | $ | $ | $ |
1 Prior to December 31, 2021, the Bank entered into an agreement with a third party to sell the building that housed its Poughkeepsie, New York retail branch and relocate the branch to leased space nearby. This sale was completed in January 2022. At June 30, 2022, Salisbury did not have any assets measured at fair value on a non-recurring basis.
| 26 |
Carrying values and estimated fair values of financial instruments are as follows:
| (in thousands) | Carrying | Estimated | Fair value measurements using | |||||||||||||||||
| value | fair value | Level 1 | Level 2 | Level 3 | ||||||||||||||||
| June 30, 2022 | ||||||||||||||||||||
| Financial Assets | ||||||||||||||||||||
| Cash and cash equivalents | $ | $ | $ | $ | $ | |||||||||||||||
| Interest bearing time deposits with financial institutions | ||||||||||||||||||||
| Securities available-for-sale, net | ||||||||||||||||||||
| Mutual funds | ||||||||||||||||||||
| Federal Home Loan Bank of Boston stock | ||||||||||||||||||||
| Loans held-for-sale | ||||||||||||||||||||
| Loans receivable, net | ||||||||||||||||||||
| Accrued interest receivable | ||||||||||||||||||||
| Cash surrender value of life insurance policies | ||||||||||||||||||||
| Derivative financial instruments | ||||||||||||||||||||
| Financial Liabilities | ||||||||||||||||||||
| Demand (non-interest-bearing) | $ | $ | $ | $ | $ | |||||||||||||||
| Demand (interest-bearing) | ||||||||||||||||||||
| Money market | ||||||||||||||||||||
| Savings and other | ||||||||||||||||||||
| Certificates of deposit | ||||||||||||||||||||
| Deposits | ||||||||||||||||||||
| Repurchase agreements | ||||||||||||||||||||
| FHLBB advances | ||||||||||||||||||||
| Subordinated debt | ||||||||||||||||||||
| Note payable | ||||||||||||||||||||
| Finance lease obligation | ||||||||||||||||||||
| Accrued interest payable | ||||||||||||||||||||
| December 31, 2021 | ||||||||||||||||||||
| Financial Assets | ||||||||||||||||||||
| Cash and cash equivalents | $ | $ | $ | $ | $ | |||||||||||||||
| Interest bearing time deposits with financial institutions | ||||||||||||||||||||
| Securities available-for-sale | ||||||||||||||||||||
| Mutual funds | ||||||||||||||||||||
| Federal Home Loan Bank of Boston stock | ||||||||||||||||||||
| Loans held-for-sale | ||||||||||||||||||||
| Loans receivable, net | ||||||||||||||||||||
| Accrued interest receivable | ||||||||||||||||||||
| Cash surrender value of life insurance policies | ||||||||||||||||||||
| Derivative financial instruments | ||||||||||||||||||||
| Financial Liabilities | ||||||||||||||||||||
| Demand (non-interest-bearing) | $ | $ | $ | $ | $ | |||||||||||||||
| Demand (interest-bearing) | ||||||||||||||||||||
| Money market | ||||||||||||||||||||
| Savings and other | ||||||||||||||||||||
| Certificates of deposit | ||||||||||||||||||||
| Deposits | ||||||||||||||||||||
| Repurchase agreements | ||||||||||||||||||||
| FHLBB advances | ||||||||||||||||||||
| Subordinated debt | ||||||||||||||||||||
| Note payable | ||||||||||||||||||||
| Finance lease liability | ||||||||||||||||||||
| Accrued interest payable | ||||||||||||||||||||
The carrying amounts of financial instruments shown in the above table are included in the consolidated balance sheets under the indicated captions or are included in accrued interest and other liabilities.
NOTE 13 – SUBSEQUENT EVENTS
On July 20, 2022 the Board of Directors of Salisbury approved a quarterly cash dividend of $ per common share is payable on August 26, 2022 to shareholders of record as of August 12, 2022.
In July 2022, Salisbury management discovered that the Bank’s trust department terminated a trust account in May 2020 and distributed approximately $1.0 million that should have been retained in continuance of the trust account. Salisbury is currently evaluating the Company’s potential financial exposure. At this time, management believes that Salisbury’s exposure is not yet known or knowable and could potentially range from zero to approximately $1.0 million depending upon the facts and circumstances and the scope of Salisbury’s insurance coverage. Salisbury has engaged legal counsel to advise the Company with respect to the proper actions to be taken to address this matter.
| 27 |
| Item 2. | MANAGEMENT'S DISCUSSION AND ANALYSIS OF FINANCIAL CONDITION AND RESULTS OF OPERATIONS |
Management's Discussion and Analysis of Financial Condition and Results of Operations of Salisbury Bancorp, Inc. (“Salisbury” or the “Company”) and its subsidiary should be read in conjunction with Salisbury's Annual Report on Form 10-K for the year ended December 31, 2021. Readers should also review other disclosures Salisbury files from time to time with the Securities and Exchange Commission (the “SEC”).
BUSINESS
Salisbury Bancorp, Inc., a Connecticut corporation, formed in 1998, is the bank holding company for Salisbury Bank and Trust Company (the "Bank"), a Connecticut-chartered and Federal Deposit Insurance Corporation (the "FDIC") insured commercial bank headquartered in Lakeville, Connecticut. Salisbury’s common stock is traded on the NASDAQ Capital Market under the symbol “SAL.” Salisbury's principal business consists of its operation and control of the business of the Bank.
The Bank, formed in 1848, currently provides commercial banking, consumer financing, retail banking and trust and wealth advisory services through a network of fourteen banking offices and ten ATMs located in: Litchfield County, Connecticut; Dutchess, Orange and Ulster Counties, New York; and Berkshire County, Massachusetts and through its internet website (salisburybank.com).
Critical Accounting Policies and Estimates
Salisbury’s consolidated financial statements follow GAAP as applied to the banking industry in which it operates. Application of these principles requires management to make estimates, assumptions and judgments that affect the amounts reported in the financial statements. These estimates, assumptions and judgments are based on information available as of the date of the financial statements; accordingly, as this information changes, the financial statements could reflect different estimates, assumptions and judgments and as such have a greater possibility of producing results that could be materially different than originally reported. Estimates, assumptions and judgments are necessary when assets and liabilities are required to be recorded at fair value, when a decline in the value of an asset not carried at fair value warrants an impairment write-down or valuation reserve to be established, or when an asset or liability needs to be recorded contingent upon a future event.
Salisbury’s significant accounting policies are presented in Note 1 of Notes to Consolidated Financial Statements, which, along with this Management’s Discussion and Analysis, provide information on how significant assets are valued in the financial statements and how those values are determined. Management believes that the following accounting estimates are the most critical to aid in fully understanding and evaluating Salisbury’s reported financial results, and they require management’s most difficult, subjective or complex judgments, resulting from the need to make estimates about the effect of matters that are inherently uncertain.
Allowance for Loan Losses
The allowance for loan losses represents management’s estimate of credit losses inherent in the loan portfolio. Determining the amount of the allowance for loan losses is considered a critical accounting estimate because it requires significant judgment and the use of estimates related to the amount and timing of expected future cash flows on impaired loans, estimated losses on pools of homogeneous loans based on historical loss experience, and consideration of current economic trends and conditions, all of which may be susceptible to significant change. The loan portfolio also represents the largest asset type on the balance sheet. A discussion of the factors driving changes in the amount of the allowance for loan losses is included in the “Provision and Allowance for Loan Losses” section of Management’s Discussion and Analysis.
FINANCIAL CONDITION
Securities and Short-Term Funds
The fair market value of Salisbury’s investment portfolio increased $1.0 million from year end 2021 to $205.7 million at June 30, 2022. The fair market value included net unrealized pre-tax losses of $18.4 million at June 30, 2022 compared with net unrealized pre-tax gains of $1.0 million at December 31, 2021. The net unrealized losses reflected the sharp increase in market interest rates that has occurred in the last six months. Cash and cash equivalents (non-time interest-bearing deposits with other banks, money market funds and federal funds sold) decreased $103.9 million, or 59.2%, to $71.5 million at June 30, 2022. This decrease was driven by record loan growth and normal customer activity during the six-month period ended June 30, 2022.
Salisbury evaluates securities for OTTI when the fair value of a security is less than its amortized cost basis at the balance sheet date. As part of this process, Salisbury considers its intent to sell each debt security and whether it is more likely than not that it will be required to sell the security before its anticipated recovery. If either of these conditions is met, Salisbury recognizes an OTTI charge to earnings equal to the entire difference between the security’s amortized cost basis and its fair value at the balance sheet date. For securities that meet neither of these conditions, an analysis is performed to determine if any of these securities are at risk for OTTI. Salisbury evaluates securities for strategic fit and may reduce its position in securities, although it is not more likely than not that Salisbury will be required to sell securities before recovery of their cost basis, which may be maturity. Management does not consider any of its securities to be OTTI at June 30, 2022.
Loans
Net loans receivable increased $69.0 million, or 6.5%, to $1.14 billion at June 30, 2022, compared with $1.07 billion at December 31, 2021. PPP loan balances declined from $25.6 million at December 31, 2021 to $2.9 million at June 30, 2022 due to the forgiveness of such loans by the SBA. Excluding PPP loans, net loans receivable increased by a record $91.7 million, or 8.8%, compared with December 31, 2021. The increase in net loans receivable was broad-based and reflected growth in residential, consumer, commercial and commercial & industrial loans. Commercial and industrial loan growth for second quarter 2022 included the purchase of two syndicated loans, which aggregated $6.8 million. The allowance for loan losses increased by $0.7 million from December 2021 primarily due to significant loan growth, management’s current assessment of certain qualitative and environmental factors and charge-off activity during the six-month period ending June 30, 2022.
| 28 |
Asset Quality
During the first six months of 2022, overall asset quality continued to improve. Non-performing assets of $4.2 million, or 0.37% of gross loans receivable were essentially unchanged from year end 2021 and total impaired and potential problem loans declined $18.9 million from $32.8 million, or 3.04% of gross loans receivable to $13.9 million, or 1.2% of gross loans receivable at June 30, 2022. The decrease in the balance from year end 2021 primarily reflected management’s upgrade of the internal risk rating on loans to businesses in the hospitality and entertainment and recreation industries, which were previously downgraded due to concerns over COVID-19. Such businesses have demonstrated a return to pre-pandemic levels of activity and liquidity. As of June 30, 2022, Salisbury did not have any outstanding loan payment deferrals and the Bank had approximately $3 million of PPP loans on its balance sheet compared with approximately $26 million at December 31, 2021.
Salisbury has cooperative relationships with the vast majority of its non-performing loan customers. Substantially all non-performing loans are collateralized with real estate and the repayment of such loans is largely dependent on the return of such loans to performing status or the liquidation of the underlying real estate collateral. Salisbury pursues the resolution of all non-performing loans through collections, restructures, voluntary liquidation of collateral by the borrower and, where necessary, legal action. When attempts to work with a customer to return a loan to performing status, including restructuring the loan, are unsuccessful, Salisbury will initiate appropriate legal action seeking to acquire property by deed in lieu of foreclosure or through foreclosure, or to liquidate business assets.
Past Due Loans
Loans past due 30 days or more decreased $1.5 million for the six months ended June 30, 2022 to $1.1 million, or 0.10% of gross loans receivable compared with $2.6 million, or 0.24% of gross loans receivable at December 31, 2021. The decline in past due loans from year end 2021 primarily reflected the sale and or charge-off of non-performing loans during the six-month period ending June 30, 2022.
The components of loans past due 30 days or greater are as follows:
| (in thousands) | June 30, 2022 | December 31, 2021 | ||||||
| Past due 30-59 days | $ | 754 | $ | 751 | ||||
| Past due 60-89 days | 247 | 590 | ||||||
| Past due 90-179 days | 69 | 1 | ||||||
| Past due 180 days and over | 11 | 10 | ||||||
| Accruing loans | 1,081 | 1,352 | ||||||
| Past due 30-59 days | — | 14 | ||||||
| Past due 60-89 days | — | — | ||||||
| Past due 90-179 days | — | 63 | ||||||
| Past due 180 days and over | 15 | 1,213 | ||||||
| Non-accrual loans | 15 | 1,290 | ||||||
| Total loans past due 30 days or greater | $ | 1,096 | $ | 2,642 |
Credit Risk Ratings
Salisbury assigns credit risk ratings to loans receivable in order to manage credit risk and to determine the allowance for loan losses. Credit risk ratings categorize loans by common financial and structural characteristics that measure the credit strength of a borrower. Salisbury’s rating model has eight risk rating grades, with each grade corresponding to a progressively greater risk of default. Grades 1 through 4 are pass ratings and 5 through 8 are ratings (special mention, substandard, doubtful, and loss) defined by the bank's regulatory agencies, the FDIC and CTDOB. Risk ratings are assigned to differentiate risk within the portfolio and are reviewed on an ongoing basis and revised, if needed, to reflect changes in the borrowers' current financial position and outlook, risk profiles and the related collateral and structural positions.
| · | Loans risk rated as "special mention" (5) possess credit deficiencies or potential weaknesses deserving management’s close attention that if left uncorrected may result in deterioration of the repayment prospects for the loans at some future date. |
| · | Loans risk rated as "substandard" (6) are loans where the Bank’s position is clearly not protected adequately by borrower current net worth or payment capacity. These loans have well defined weaknesses based on objective evidence and include loans where future losses to the Bank may result if deficiencies are not corrected, and loans where the primary source of repayment such as income is diminished and the Bank must rely on sale of collateral or other secondary sources of collection. |
| · | Loans risk rated as "doubtful" (7) have the same weaknesses as substandard loans with the added characteristic that the weakness makes collection or liquidation in full, given current facts, conditions, and values, to be highly improbable. The possibility of loss is high, but due to certain important and reasonably specific pending factors, which may work to strengthen the loan, its reclassification as an estimated loss is deferred until its exact status can be determined. |
| · | Loans risk rated as "loss" (8) are considered uncollectible and of such little value that continuance as Bank assets is unwarranted. This classification does not mean that the loan has absolutely no recovery or salvage value, but rather, it is not practical or desirable to defer writing off this loan even though partial recovery may be made in the future. |
Management actively reviews and tests its credit risk ratings against actual experience and engages an independent third-party to annually validate its assignment of credit risk ratings. In addition, the Bank’s loan portfolio and risk ratings are examined annually on a rotating basis by its two primary regulatory agencies, the FDIC and CTDOB.
| 29 |
Credit Quality Segments
Salisbury categorizes loans receivable into the following credit quality segments:
| · | Impaired loans consist of all non-accrual loans and troubled debt restructured loans, and represent loans for which it is probable that Salisbury will not be able to collect all principal and interest amounts due according to the contractual terms of the loan agreements. |
| · | Non-accrual loans, a sub-set of impaired loans, are loans for which the accrual of interest has been discontinued because, in the opinion of management, full collection of principal or interest is unlikely. |
| · | Non-performing loans consist of non-accrual loans, and accruing loans past due 90 days and over that are well collateralized, in the process of collection and where full collection of principal and interest is reasonably assured. Non-performing assets consist of non-performing loans plus real estate acquired in settlement of loans. |
| · | Troubled debt restructured loans are loans for which concessions such as reduction of interest rates, other than normal market rate adjustments, or deferral of principal or interest payments, extension of maturity dates, or reduction of principal balance or accrued interest, have been granted due to a borrower’s financial condition. Loan restructuring is employed when management believes the granting of a concession will increase the probability of the full or partial collection of principal and interest. |
| · | Potential problem loans consist of performing loans that have been assigned a substandard credit risk rating and are not classified as impaired. |
Impaired Loans
Impaired loans include all modified loans classified as troubled debt restructurings (TDRs) and loans on non-accrual status. The components of impaired loans are as follows:
| (in thousands) | June 30, 2022 | December 31, 2021 | ||||||
| Non-accrual loans, excluding troubled debt restructured loans | $ | 4,080 | $ | 2,838 | ||||
| Non-accrual troubled debt restructured loans | 69 | 1,350 | ||||||
| Accruing troubled debt restructured loans | 3,012 | 3,609 | ||||||
| Total impaired loans | $ | 7,161 | $ | 7,797 |
Non-Performing Assets
Non-performing assets of $4.2 million, or 0.28% of total assets at June 30, 2022, were essentially unchanged from December 31, 2021, and decreased $1.3 million from $5.5 million, or 0.39% of total assets, at June 30, 2021. Non-performing assets at June 30, 2022 included a residential real estate loan of approximately $1.5 million on a property that was sold in July 2022. The components of non-performing assets are as follows:
| (in thousands) | June 30, 2022 | December 31, 2021 | ||||||
| Residential 1-4 family | $ | 2,450 | $ | 750 | ||||
| Residential 5+ multifamily | — | 861 | ||||||
| Home equity lines of credit | — | 21 | ||||||
| Commercial | 1,228 | 1,924 | ||||||
| Farm land | 409 | 432 | ||||||
| Vacant land | — | — | ||||||
| Real estate secured | 4,087 | 3,988 | ||||||
| Commercial and industrial | 62 | 200 | ||||||
| Consumer | — | — | ||||||
| Non-accrual loans | 4,149 | 4,188 | ||||||
| Accruing loans past due 90 days and over | 80 | 11 | ||||||
| Non-performing loans | 4,229 | 4,199 | ||||||
| Foreclosed assets | — | — | ||||||
| Non-performing assets | $ | 4,229 | $ | 4,199 |
The past due status of non-performing loans is as follows:
| (in thousands) | June 30, 2022 | December 31, 2021 | ||||||
| Current | $ | 4,134 | $ | 2,898 | ||||
| Past due 30-59 days | — | 14 | ||||||
| Past due 60-89 days | — | — | ||||||
| Past due 90-179 days | 69 | 64 | ||||||
| Past due 180 days and over | 26 | 1,223 | ||||||
| Total non-performing loans | $ | 4,229 | $ | 4,199 |
At June 30, 2022, 97.75% of non-performing
loans were current with respect to loan payments, compared with 69.02% at December 31, 2021.
| 30 |
Troubled Debt Restructured Loans
Troubled debt restructured loans declined during the first six months of 2022 to $3.1 million, or 0.27% of gross loans receivable at June 30, 2022, compared to $5.0 million, or 0.46% of gross loans receivable at December 31, 2021. The decline in the balance of troubled debt restructured loans since year end 2021 primarily reflected the sale or charge-off of $1.6 million of certain residential and commercial loans, an internal risk rating upgrade of a $0.2 million residential loan and $0.1 million of amortization.
The components of troubled debt restructured loans are as follows:
| (in thousands) | June 30, 2022 | December 31, 2021 | ||||||
| Residential 1-4 family | $ | 1,504 | $ | 1,824 | ||||
| Residential 5+ multifamily | 80 | 87 | ||||||
| Commercial | 1,355 | 1,622 | ||||||
| Real estate secured | 2,939 | 3,533 | ||||||
| Commercial and industrial | 73 | 76 | ||||||
| Accruing troubled debt restructured loans | 3,012 | 3,609 | ||||||
| Residential 1-4 family | 69 | 256 | ||||||
| Residential 5+ multifamily | — | 861 | ||||||
| Commercial | — | 233 | ||||||
| Real estate secured | $ | 69 | $ | 1,350 | ||||
| Non-accrual troubled debt restructured loans | 69 | 1,350 | ||||||
| Troubled debt restructured loans | $ | 3,081 | $ | 4,959 |
The past due status of troubled debt restructured loans is as follows:
| (in thousands) | June 30, 2022 | December 31, 2021 | ||||||
| Current | $ | 2,976 | $ | 3,540 | ||||
| Past due 30-59 days | 36 | 37 | ||||||
| Past due 60-89 days | — | 32 | ||||||
| Accruing troubled debt restructured loans | 3,012 | 3,609 | ||||||
| Current | 69 | 414 | ||||||
| Past due 180 days and over | — | 936 | ||||||
| Non-accrual troubled debt restructured loans | 69 | 1,350 | ||||||
| Total troubled debt restructured loans | $ | 3,081 | $ | 4,959 |
At June 30, 2022, 98.83% of troubled
debt restructured loans were current with respect to loan payments, as compared with 79.73% at December 31, 2021.
Potential Problem Loans
Potential problem loans consist of performing loans that have been assigned a substandard credit risk rating and are not classified as impaired. Potential problem loans decreased $18.2 million to $6.8 million, or 0.59% of gross loans receivable at June 30, 2022, compared with $25.0 million, or 2.32% of gross loans receivable at December 31, 2021. The decrease in potential problem loans from year end 2021 primarily reflected management’s upgrade of the internal risk rating on approximately $17 million of loans that were mostly related to the hospitality and entertainment and recreation industries. These loans were previously downgraded due to concerns over COVID-19 but the businesses have since demonstrated a return to pre-pandemic levels of activity and liquidity.
The components of potential problem loans are as follows:
| (in thousands) | June 30, 2022 | December 31, 2021 | ||||||
| Residential 1-4 family | $ | 869 | $ | 999 | ||||
| Residential 5+ multifamily | — | 709 | ||||||
| Home equity lines of credit | — | — | ||||||
| Residential real estate | 869 | 1,708 | ||||||
| Commercial | 4,203 | 20,998 | ||||||
| Construction of commercial | — | — | ||||||
| Commercial real estate | 4,203 | 20,998 | ||||||
| Farm land | — | — | ||||||
| Real estate secured | 5,072 | 22,706 | ||||||
| Commercial and industrial | 1,696 | 2,310 | ||||||
| Consumer | — | — | ||||||
| Total potential problem loans | $ | 6,768 | $ | 25,016 |
The past due status of potential problem loans is as follows:
| (in thousands) | June 30, 2022 | December 31, 2021 | ||||||
| Current | $ | 6,746 | $ | 24,977 | ||||
| Past due 30-59 days | — | 23 | ||||||
| Past due 60-89 days | 22 | 16 | ||||||
| Past due 90-179 days | — | — | ||||||
| Total potential problem loans | $ | 6,768 | $ | 25,016 |
| 31 |
At June 30, 2022, 99.67% of potential problem loans were current with respect to loan payments, as compared with 99.84% at December 31, 2021. Management cannot predict the extent to which economic or other factors may impact such borrowers’ future payment capacity, and there can be no assurance that such loans will not be placed on nonaccrual status, restructured, or require increased provisions for loan losses.
Deposits and Borrowings
Deposits decreased $19.7 million, or 1.5%, during the first six months of 2022 to $1.32 billion at June 30, 2022, compared with $1.34 billion at December 31, 2021. The decrease primarily reflected normal business activity. Deposit balances at second quarter 2022 included $15.0 million which Salisbury received on June 29, 2022 from a wholesale source to fund loan growth during the quarter. These funds were included in a money market account at June 30, 2022. Retail repurchase agreements increased $5.1 million during 2022 to $16.6 million at June 30, 2022, compared with $11.4 million at December 31, 2021.
The distribution of average total deposits by account type is as follows:
| June 30, 2022 | December 31, 2021 | |||||||||||||||||||||||
| (in thousands) | Average Balance | Percent | Weighted Average Interest Rate | Average Balance | Percent | Weighted Average Interest Rate | ||||||||||||||||||
| Demand deposits | $ | 381,796 | 29.71 | % | 0.00 | % | $ | 366,953 | 29.28 | % | 0.00 | % | ||||||||||||
| Interest-bearing checking accounts | 229,625 | 17.87 | 0.19 | 224,763 | 17.93 | 0.19 | ||||||||||||||||||
| Money market savings | 299,870 | 23.34 | 0.21 | 315,469 | 25.17 | 0.17 | ||||||||||||||||||
| Regular savings accounts | 236,728 | 18.42 | 0.16 | 215,300 | 17.18 | 0.11 | ||||||||||||||||||
| Certificates of deposit (CD’s)1 | 137,034 | 10.66 | 0.63 | 130,879 | 10.44 | 0.72 | ||||||||||||||||||
| Total deposits | $ | 1,285,053 | 100.00 | % | 0.18 | % | $ | 1,253,364 | 100.00 | % | 0.17 | % | ||||||||||||
1CD’s included brokered certificates of deposit of $35.0 million at June 30, 2022 and $7.9 million at December 31, 2021.
The classification of certificates of deposit by interest rates is as follows:
| Interest rates | June 30, 2022 | December 31, 2021 | ||||||
| Less than 1.00% | $ | 128,848 | $ | 97,099 | ||||
| 1.00% to 1.99% | 15,964 | 14,919 | ||||||
| 2.00% to 2.99% | 8,540 | 6,493 | ||||||
| 3.00% to 3.99% | — | 498 | ||||||
| Total | $ | 153,352 | $ | 119,009 |
The distribution of certificates of deposit by interest rate and maturity is as follows:
| At June 30, 2022 | ||||||||||||||||||||||||
| Interest rates | Less Than or Equal to One Year | More Than One to Two Years | More Than Two to Three Years | More Than Three Years | Total | Percent of Total | ||||||||||||||||||
| Less than 1.00% | $ | 105,194 | $ | 13,184 | $ | 4,591 | $ | 5,879 | $ | 128,848 | 84.02 | % | ||||||||||||
| 1.00% to 1.99% | 9,306 | 3,552 | 3,106 | — | 15,964 | 10.41 | % | |||||||||||||||||
| 2.00% to 2.99% | 168 | 5,875 | 2,497 | — | 8,540 | 5.57 | % | |||||||||||||||||
| 3.00% to 3.99% | — | — | — | — | — | 0.00 | % | |||||||||||||||||
| Total | $ | 114,668 | $ | 22,611 | $ | 10,194 | $ | 5,879 | $ | 153,352 | 100.00 | % | ||||||||||||
Scheduled maturities of time certificates of deposit in denominations of $100,000 or more are as follows:
| June 30, 2022 (in thousands) | Within
3 months | 3-6 months | 6-12 months | Over
1 year | Total | |||||||||||||||
| Certificates of deposit $100,000 and over | $ | 56,090 | $ | 19,533 | $ | 11,064 | $ | 22,591 | $ | 109,278 | ||||||||||
Salisbury did not have any outstanding FHLBB advances at June 30, 2022 compared with an outstanding balance of $7.7 million at December 31, 2021. Salisbury has an Irrevocable Letter of Credit Reimbursement Agreements with the FHLBB, whereby upon the Bank’s request an irrevocable letter of credit is issued to secure municipal and certain other transactional deposit accounts. These letters of credit are secured primarily by residential mortgage loans. The amount of funds available from the FHLBB to the Bank is reduced by any letters of credit outstanding. At June 30, 2022, $20.0 million of letters of credit were outstanding.
Liquidity
Salisbury manages its liquidity position to ensure that there is sufficient funding availability at all times to meet both anticipated and unanticipated deposit withdrawals, loan originations and advances, securities purchases and other operating cash outflows. Salisbury's primary sources of liquidity are principal payments and maturities of securities and loans, short-term borrowings through repurchase agreements and FHLBB advances, net deposit growth and funds provided by operations. Liquidity can also be provided through sales of loans and available-for-sale securities. At June 30, 2022, Salisbury’s excess borrowing capacity at FHLBB was approximately $253.0 million. Salisbury maintains access to multiple sources of liquidity, including wholesale funding. An increase in funding costs could have an adverse impact on Salisbury’s net interest margin. If a deterioration in economic conditions or other factors cause depositors to withdraw their funds, Salisbury could become more dependent on more expensive sources of funding.
| 32 |
Operating activities for the six-month period ended June 30, 2022 provided net cash of $15.4 million. Investing activities utilized net cash of $95.1 million principally from $52.2 million of purchases of available-for-sale securities and mutual funds, $73.4 million of net loan originations and principal collections, and $0.6 million of capital expenditures, partly offset by proceeds of $9.4 million from calls and maturities of available-for-sale securities and proceeds of $22.0 million from the sale of available-for-sale-securities. Financing activities utilized net cash of $24.2 million principally due to a decrease of deposit transaction accounts of $54.0 million, the repayment of FHLBB term advances of $6.0 million, the repayment of FHLBB amortizing term advances of $1.7 million and the payment of common stock dividends of $1.8 million, partially offset by an increase in time deposits of $34.3 million and a $5.1 million increase in repurchase agreements
At June 30, 2022, Salisbury had outstanding commitments to fund new loan originations of $63.0 million and unused lines of credit of $246.6 million. Salisbury believes that these commitments can be met in the normal course of business. Salisbury believes that its liquidity sources will continue to provide funding sufficient to support operating activities, loan originations and commitments, and deposit withdrawals.
RESULTS OF OPERATIONS
For the three-month periods ended June 30, 2022 and 2021
OVERVIEW
On June 30, 2022, Salisbury effected a two-for-one forward stock split of its outstanding shares. As a result, all share and per share metrics included herein have been adjusted to reflect this event. Net income allocated to common shareholders was $3.8 million, or $0.67 per basic earnings per common share, for the second quarter ended June 30, 2022 (second quarter 2022), compared with $4.3 million, or $0.76 per basic common share, for the second quarter ended June 30, 2021 (second quarter 2021), and $3.5 million, or $0.62 per basic common share, for the first quarter ended March 31, 2022 (first quarter 2022).
Net Interest Income
Tax equivalent net interest income for the second quarter 2022 increased $1.3 million, or 1.4%, versus second quarter 2021. Average earning assets increased $20.3 million, or 1.5%, versus second quarter 2021. Average total interest bearing deposits increased slightly compared with second quarter 2021. Average loan balances for second quarter 2022 included an average PPP loan balance of $8.8 million compared with $80.4 million for second quarter 2021. The net interest margin for the second quarter 2022 was 3.15% compared with 2.82% for the second quarter 2021. Excluding PPP loans, the net interest margin for the second quarter 2022 was approximately 3.10% compared with 2.76% for second quarter 2021. The increase in net interest margin in second quarter 2022 primarily reflected a $59.7 million, or 5.7%, increase in average loan balances earning an average yield of 3.81% and a reduction in short term fund balances of $126.2 million, or 69.8%, earning an average yield of 0.73%, and a decrease in subordinated debt interest expense compared to 2021, which included approximately $180 thousand for interest expense as amortized costs on subordinated debt that Salisbury had issued in 2015 and fully redeemed in May of 2021.
The following table sets forth the components of Salisbury's fully tax-equivalent (“FTE”) net interest income and yields on average interest-earning assets and interest-bearing liabilities.
| Three months ended June 30, | Average Balance | Income / Expense | Average Yield / Rate | |||||||||||||||||||||
| (dollars in thousands) | 2022 | 2021 | 2022 | 2021 | 2022 | 2021 | ||||||||||||||||||
| Loans (a)(d) | $ | 1,112,120 | $ | 1,052,381 | $ | 10,693 | $ | 10,015 | 3.81 | % | 3.78 | % | ||||||||||||
| Securities (c)(d) | 225,458 | 138,164 | 1,117 | 720 | 1.98 | 2.08 | ||||||||||||||||||
| FHLBB stock | 1,221 | 1,830 | 10 | 11 | 3.20 | 2.41 | ||||||||||||||||||
| Short term funds (b) | 54,553 | 180,716 | 98 | 50 | 0.73 | 0.11 | ||||||||||||||||||
| Total interest-earning assets | 1,393,352 | 1,373,091 | 11,918 | 10,796 | 3.40 | 3.13 | ||||||||||||||||||
| Other assets | 61,790 | 70,447 | ||||||||||||||||||||||
| Total assets | $ | 1,455,142 | $ | 1,443,538 | ||||||||||||||||||||
| Interest-bearing demand deposits | $ | 229,625 | $ | 227,623 | 108 | 117 | 0.19 | 0.21 | ||||||||||||||||
| Money market accounts | 299,870 | 315,665 | 156 | 138 | 0.21 | 0.18 | ||||||||||||||||||
| Savings and other | 236,728 | 212,253 | 97 | 59 | 0.16 | 0.11 | ||||||||||||||||||
| Certificates of deposit | 137,034 | 147,103 | 216 | 252 | 0.63 | 0.69 | ||||||||||||||||||
| Total interest-bearing deposits | 903,257 | 902,644 | 577 | 566 | 0.26 | 0.25 | ||||||||||||||||||
| Repurchase agreements | 10,216 | 12,010 | 4 | 4 | 0.15 | 0.15 | ||||||||||||||||||
| Finance lease | 5,283 | 2,751 | 41 | 36 | 3.09 | 5.26 | ||||||||||||||||||
| Note payable | 153 | 192 | 2 | 3 | 6.13 | 6.09 | ||||||||||||||||||
| Subordinated Debt (net of issuance costs) | 24,494 | 30,789 | 233 | 415 | 3.80 | 5.39 | ||||||||||||||||||
| FHLBB advances | — | 10,576 | — | 33 | — | 1.21 | ||||||||||||||||||
| Total interest-bearing liabilities | 943,403 | 958,962 | 857 | 1,057 | 0.36 | 0.44 | ||||||||||||||||||
| Demand deposits | 376,694 | 348,561 | ||||||||||||||||||||||
| Other liabilities | 6,258 | 6,786 | ||||||||||||||||||||||
| Shareholders’ equity | 128,787 | 129,229 | ||||||||||||||||||||||
| Total liabilities & shareholders’ equity | $ | 1,455,142 | $ | 1,443,538 | ||||||||||||||||||||
| Net interest income (d) | $ | 11,061 | $ | 9,739 | ||||||||||||||||||||
| Spread on interest-bearing funds | 3.03 | 2.69 | ||||||||||||||||||||||
| Net interest margin (e) | 3.15 | 2.82 | ||||||||||||||||||||||
| (a) | Includes non-accrual loans. |
| (b) | Includes interest-bearing deposits in other banks and federal funds sold. |
| (c) | Average balances of securities are based on cost. |
| (d) | Includes tax exempt income benefit of $187,000 and $174,000, respectively, for 2022 and 2021 on tax-exempt securities and loans whose income and yields are calculated on a tax-equivalent basis. The income benefit reflected the U.S. federal statutory tax rate of 21.0% for 2022 and 2021. |
| (e) | Net interest income divided by average interest-earning assets. |
| 33 |
The following table sets forth the changes in FTE interest due to volume and rate.
| Three months ended June 30, (in thousands) | 2022 versus 2021 | |||||||||||
| Change in interest due to | Volume | Rate | Net | |||||||||
| Loans | $ | 608 | $ | 70 | $ | 678 | ||||||
| Securities | 442 | (45 | ) | 397 | ||||||||
| FHLBB stock | (4 | ) | 3 | (1 | ) | |||||||
| Short term funds | (134 | ) | 182 | 48 | ||||||||
| Interest-earning assets | 912 | 210 | 1,122 | |||||||||
| Deposits | (1 | ) | 12 | 11 | ||||||||
| Repurchase agreements | — | — | — | |||||||||
| Finance lease | 27 | (22 | ) | 5 | ||||||||
| Note payable | (1 | ) | — | (1 | ) | |||||||
| Subordinated Debt | (72 | ) | (110 | ) | (182 | ) | ||||||
| FHLBB advances | (17 | ) | (16 | ) | (33 | ) | ||||||
| Interest-bearing liabilities | (64 | ) | (136 | ) | (200 | ) | ||||||
| Net change in net interest income | $ | 976 | $ | 346 | $ | 1,322 | ||||||
Interest Income
Tax equivalent interest income increased $1.1 million, or 10.4%, to $11.9 million for second quarter 2022 as compared with $10.8 million in second quarter 2021. Loan income as compared to second quarter 2021 increased $678 thousand, or 6.8%, primarily due to a $59.7 million, or 5.67%, increase in average loan balances and a 3 basis point increase in the average loan yield. Tax equivalent securities income increased $397 thousand, or 55.1%, for second quarter 2022 as compared with second quarter 2021, primarily due to a $87.2 million, or 63.1%, increase in average volume, partly offset by a 10 basis point decrease in average yield. Income on short-term funds as compared to second quarter 2021 increased $48 thousand, or 96.0%, primarily due to a 62 basis point increase in the average short-term funds yield, partly offset by a $126.2 million, or 69.8%, decrease in average balance.
Interest Expense
Interest expense decreased $200 thousand, or 18.9%, to $0.9 million for second quarter 2022 as compared with $1.1 million in second quarter 2021. Interest on deposit accounts increased slightly from second quarter 2021. Interest expense on subordinated debt decreased $182 thousand, or 43.9%, as the second quarter 2021 included approximately $180 thousand for interest and the amortization of issuance costs on subordinated debt, which Salisbury issued in 2015 and fully redeemed in May 2021.
Provision and Allowance for Loan Losses
The allowance for loan losses was $13.7 million at June 30, 2022 compared with $13.0 million at December 31, 2021. The provision for loan loss expense for second quarter 2022 was $1.1 million compared with a provision of $363 thousand for first quarter 2022 and a provision release of $1.1 million for second quarter 2021. The provision expense for second quarter 2022 reflected record quarterly loan growth and adjustments to qualitative factors due to the uncertain macro-economic environment. The provision expense for second quarter 2022 also reflected a release of credit reserves of $0.6 million due to management’s upgrade of the internal risk rating on certain loans related to the hospitality industry. Net loan charge-offs (recoveries) were $312 thousand for the second quarter 2022, $410 thousand for first quarter 2022 and $103 thousand for the second quarter 2021. Charge-offs for second quarter 2022 primarily related to a discrete commercial loan.
As a result of these factors, reserve coverage, as measured by the ratio of the allowance for loan losses to gross loans excluding PPP loans, was 1.20% for the second quarter 2022, versus 1.21% for first quarter 2022 and 1.29% for the second quarter 2021. Similarly, reserve coverage, as measured by the ratio of the allowance for loan losses to non-performing loans was 324% for the second quarter of 2022, versus 467% for the first quarter of 2022 and 229% for the second quarter of 2021.
The following table details the principal categories of credit quality ratios:
| Three months ended June 30, | 2022 | 2021 | ||||||
| Net charge-offs (recoveries) to average loans receivable, gross | 0.03 | % | 0.01 | % | ||||
| Non-performing loans to loans receivable, gross | 0.37 | 0.53 | ||||||
| Accruing loans past due 30-89 days to loans receivable, gross | 0.09 | 0.13 | ||||||
| Allowance for loan losses to loans receivable, gross | 1.19 | 1.22 | ||||||
| Allowance for loan losses to non-performing loans | 324.03 | 229.42 | ||||||
| Non-performing assets to total assets | 0.28 | 0.39 |
Non-performing
loans (non-accrual loans plus accruing loans past-due 90 days or more) were $4.2 million or 0.37% of gross loans receivable at June 30,
2022 as compared to $5.5 million, or 0.53%, at June 30, 2021. Accruing loans past due 30-89 days decreased $0.4 million to $1.0 million,
or 0.09% of gross loans receivable at June 30, 2022 from $1.4 million, or 0.13% of gross loans receivable, at June 30, 2021. See “Financial
Condition – Loan Credit Quality” above for further discussion and analysis.
The allowance for loan losses represents management’s estimate of the probable credit losses inherent in the loan portfolio as of the reporting date. The allowance is increased by provisions charged to earnings and by recoveries of amounts previously charged off, and is reduced by loan charge-offs. Loan charge-offs are recognized when management determines a loan, or portion of a loan, to be uncollectible. The allowance for loan losses is computed by segregating the portfolio into three components: (1) loans collectively evaluated for impairment: general loss allocation factors for non-impaired loans are segmented into pools of loans based on similar risk characteristics such as loan product, collateral type and loan-to-value, loan risk rating, historical loss experience, delinquency factors and other similar economic indicators, (2) loans individually evaluated for impairment: individual loss allocations for loans deemed to be impaired based on discounted cash flows or collateral value, and (3) unallocated: general loss allocations for other environmental factors.
| 34 |
Impaired loans and certain potential problem loans, when warranted, are individually evaluated for impairment. Impairment is measured for each individual loan, or for a borrower’s aggregate loan exposure, using either the fair value of the collateral, less estimated costs to sell if the loan is collateral dependent, or the present value of expected future cash flows discounted at the loan’s effective interest rate. A specific allowance is generally established when the collateral value or discounted cash flows of the loan is lower than the carrying value of that loan.
The component of the allowance for loan losses for loans collectively evaluated for impairment is estimated by stratifying loans into segments and credit risk ratings and then applying management's general loss allocation factors. The general loss allocation factors are based on expected loss experience adjusted for historical loss experience and other qualitative factors, including levels or trends in delinquencies; trends in volume and terms of loans; effects of changes in risk selection and underwriting standards and other changes in lending policies, procedures and practices; experience/ability/depth of lending management and staff; and national and local economic trends and conditions. The qualitative factors are determined based on the various risk characteristics of each loan segment and are risk-weighted such that higher risk loans generally have a higher reserve percentage.
The unallocated component of the allowance is maintained to cover uncertainties that could affect management’s estimate of probable losses. It reflects the margin of imprecision inherent in the underlying assumptions used in the methodologies for estimating allocated and general reserves in the portfolio. Additionally, reserves are established for off balance sheet exposures.
Determining the adequacy of the allowance and reserves at any given period is difficult, particularly during deteriorating or uncertain economic periods, and management must make estimates using assumptions and information that are often subjective and changing rapidly. The review of credit exposure related to loans is a continuing event in light of a changing economy and the dynamics of the banking and regulatory environment. Should the economic climate deteriorate, borrowers could experience difficulty and the level of non-performing loans, charge-offs and delinquencies could rise, requiring increased provisions and reserves. In management's judgment, Salisbury remains adequately reserved both against total loans and non-performing loans at June 30, 2022.
Management’s loan risk rating assignments, loss percentages and specific reserves are subjected annually to an independent credit review by an external firm. In addition, the Bank is examined annually on a rotational basis by one of its two primary regulatory agencies, the FDIC and CTDOB. As an integral part of their examination process, the FDIC and CTDOB review the adequacy and methodology of the Bank's credit risk ratings and allowance for loan losses.
Non-Interest Income
The following table details the principal categories of non-interest income.
| Three months ended June 30, (dollars in thousands) | 2022 | 2021 | 2022 vs. 2021 | |||||||||||||
| Trust and wealth advisory | $ | 1,293 | $ | 1,254 | $ | 39 | 3.1 | % | ||||||||
| Service charges and fees | 1,723 | 1,374 | 349 | 25.4 | ||||||||||||
| Mortgage banking activities, net | 77 | 196 | (119 | ) | (60.7 | ) | ||||||||||
| (Losses) gains on mutual fund | (30 | ) | 3 | (33 | ) | N/A | ||||||||||
| (Losses) gains on available-for-sale securities, net | (45 | ) | (9 | ) | (36 | ) | 400.0 | |||||||||
| BOLI income and gains | 252 | 125 | 127 | 101.6 | ||||||||||||
| Other | 27 | 28 | (1 | ) | (3.6 | ) | ||||||||||
| Total non-interest income | $ | 3,297 | $ | 2,971 | $ | 326 | 11.0 | % | ||||||||
Non-interest income increased $326 thousand, or 11.0% in the second quarter 2022 versus second quarter 2021. Trust and wealth advisory revenues increased $39 thousand versus second quarter 2021. Assets under administration were $1.3 billion at June 30, 2022 compared with $1.0 billion at March 31, 2022 and $970.3 million at June 30, 2021. Discretionary assets under administration of $546.5 million at June 30, 2022 decreased from $625.3 million at March 31, 2022 and $614.3 million at June 30, 2021. Non-discretionary assets under administration of $714.7 million increased from $423.9 million at first quarter 2022 and increased from $356.0 million in second quarter 2021. The increase in non-discretionary assets from the comparative quarters primarily reflected a higher valuation of certain partnership assets for an existing client relationship. The trust and wealth business records only a nominal annual fee on this relationship.
Service charges and fees increased $349 thousand versus second quarter 2021 primarily due to non-recurring loan prepayment fees of $425 thousand as well as higher interchange and deposit fees. Second quarter 2022 income from mortgage sales and servicing decreased $119 thousand due to lower sales volume. Mortgage sales to FHLB Boston in second quarter 2022 were $2.0 million compared with $7.1 million for second quarter 2021. Mortgage banking activities, net for first quarter 2022 also included a pre-tax gain of $239 thousand on the sale of $3.4 million of non-performing and under-performing commercial and residential loans.
Non-interest income for second quarter 2022 included a pre-tax loss of $45 thousand on the sale of available-for-sale securities (“AFS”) compared with $9 thousand in second quarter 2021. BOLI income for second quarter 2022 included a non-recurring non-taxable gain of $89 thousand related to proceeds receivable due to the death of a former covered employee.
| 35 |
Non-Interest Expense
The following table details the principal categories of non-interest expense.
| Three months ended June 30, (dollars in thousands) | 2022 | 2021 | 2022 vs. 2021 | |||||||||||||
| Salaries | $ | 3,657 | $ | 3,403 | $ | 254 | 7.5 | % | ||||||||
| Employee benefits | 1,288 | 1,356 | (68 | ) | (5.0 | ) | ||||||||||
| Premises and equipment | 973 | 1,019 | (46 | ) | (4.5 | ) | ||||||||||
| Information processing and services | 702 | 628 | 74 | 11.8 | ||||||||||||
| Professional fees | 821 | 644 | 177 | 27.5 | ||||||||||||
| Collections, OREO, and loan related | 116 | 113 | 3 | 2.7 | ||||||||||||
| FDIC insurance | 122 | 80 | 42 | 52.5 | ||||||||||||
| Marketing and community support | 262 | 214 | 48 | 22.4 | ||||||||||||
| Amortization of intangibles | 50 | 65 | (15 | ) | (23.1 | ) | ||||||||||
| Other | 541 | 564 | (23 | ) | (4.1 | ) | ||||||||||
| Total non-interest expense | $ | 8,532 | $ | 8,086 | $ | 446 | 5.5 | % | ||||||||
Non-interest expense for second quarter 2022 increased $446 thousand versus second quarter 2021. Total compensation expense increased $186 thousand versus the second quarter 2021. The increase from the comparative quarters primarily reflected higher salary expense, partially offset by lower benefits expense. Deferred loan origination expenses in second quarter 2022 declined $57 thousand versus second quarter 2021. Premises and equipment expense decreased $46 thousand versus second quarter 2021 primarily due to decreased depreciation expense and software maintenance. Information processing and services expense increased $74 thousand versus second quarter 2021 primarily due to higher ATM network processing fees, core data processing and website expenses. Professional fees increased $177 thousand versus second quarter 2021 primarily due to higher consulting, legal expenses and investment management fees. Marketing and community support expense increased $48 thousand versus second quarter 2021 primarily due to timing of current marketing campaigns and contributions. The decrease in other expenses of $23 thousand primarily reflected fraud insurance recovery. During second quarter 2022, Salisbury recovered approximately $50 thousand related to fraud losses recorded in first quarter 2022.
Income Taxes
The effective income tax rates for second quarter 2022 and second quarter 2021 were 15.3% and 21.2%, respectively. Generally, fluctuations in the effective tax rate result from changes in the mix of taxable and tax-exempt income. The tax provision for second quarter 2022 included a non-recurring credit of $63 thousand to adjust for an over statement of the Bank’s 2021 tax liability to New York state. The lower tax rate in second quarter 2022 also reflected a higher mix of tax-exempt income from municipal bonds and tax advantaged loans as well as the BOLI proceeds receivable noted above. Additionally, Salisbury’s effective tax rate is generally less than the federal statutory rate due to holdings of tax-exempt municipal bonds and loans as well as bank owned life insurance.
Salisbury did not incur Connecticut income tax in 2022 (to date) or 2021, other than minimum state income tax, as a result of a Connecticut law that permits banks to shelter certain mortgage income from the Connecticut corporation business tax through the use of a special purpose entity called a Passive Investment Company or PIC. In 2004, Salisbury availed itself of this benefit by forming a PIC, SBT Mortgage Service Corporation. Salisbury's income tax provision reflects the full impact of the Connecticut legislation. Salisbury does not expect to pay other than minimum state income tax in the foreseeable future unless there is a change in Connecticut tax law.
For the six-month periods ended June 30, 2022 and 2021
Overview
Net income allocated to common shareholders was $7.3 million, or $1.29 basic earnings per common share, for the six-month period ended June 30, 2022 (six-month period 2022), compared with $8.7 million, or $1.56 basic earnings per common share, for the six-month period ended June 30, 2021 (six month period 2021). The reduction in net income allocated to common shareholders for the six-month period in 2022 primarily reflected a higher provision for loan losses and higher non-interest expenses, which were partially offset by higher net interest and non-interest income.
Net Interest Income
Tax equivalent net interest income for the six-month period 2022 of $21.5 million increased $1.3 million, or 6.3%, versus the six-month period 2021. Average earning assets of $1.4 billion at June 30, 2022 increased $87.0 million, or 6.6%, versus the six-month period 2021. Average total interest bearing deposits of $0.9 million increased $41.8 million, or 4.8%, versus the six-month period 2021. The net interest margin of 3.05% decreased 1 basis point compared with the six-month period 2021. Excluding PPP loans, the net interest margin for the six-month period ended June 30, 2022 was approximately 2.98% compared with 2.94% for the same period in 2021.
| 36 |
The following table sets forth the components of Salisbury's fully tax-equivalent (“FTE”) net interest and dividend income and yields on average interest-earning assets and interest-bearing liabilities.
| Six months ended June 30, | Average Balance | Income / Expense | Average Yield / Rate | |||||||||||||||||||||
| (dollars in thousands) | 2022 | 2021 | 2022 | 2021 | 2022 | 2021 | ||||||||||||||||||
| Loans (a)(d) | $ | 1,095,955 | $ | 1,052,020 | $ | 20,971 | $ | 20,605 | 3.80 | % | 3.90 | % | ||||||||||||
| Securities (c)(d) | 216,847 | 120,710 | 2,079 | 1,360 | 1.92 | 2.25 | ||||||||||||||||||
| FHLBB stock | 1,327 | 1,889 | 17 | 20 | 2.58 | 2.13 | ||||||||||||||||||
| Short term funds (b) | 88,813 | 141,278 | 146 | 76 | 0.33 | 0.11 | ||||||||||||||||||
| Total earning assets | 1,402,942 | 1,315,897 | 23,213 | 22,061 | 3.29 | 3.34 | ||||||||||||||||||
| Other assets | 68,256 | 70,848 | ||||||||||||||||||||||
| Total assets | $ | 1,471,198 | $ | 1,386,745 | ||||||||||||||||||||
| Interest-bearing demand deposits | $ | 231,037 | $ | 223,049 | 207 | 223 | 0.18 | 0.20 | ||||||||||||||||
| Money market accounts | 310,475 | 302,290 | 283 | 267 | 0.18 | 0.18 | ||||||||||||||||||
| Savings and other | 234,920 | 204,930 | 160 | 115 | 0.14 | 0.11 | ||||||||||||||||||
| Certificates of deposit | 134,063 | 138,402 | 405 | 516 | 0.61 | 0.75 | ||||||||||||||||||
| Total interest-bearing deposits | 910,495 | 868,671 | 1,055 | 1,121 | 0.23 | 0.26 | ||||||||||||||||||
| Repurchase agreements | 8,689 | 10,241 | 6 | 8 | 0.15 | 0.15 | ||||||||||||||||||
| Finance lease | 5,190 | 2,787 | 82 | 69 | 3.16 | 4.93 | ||||||||||||||||||
| Note payable | 158 | 196 | 5 | 6 | 6.13 | 6.14 | ||||||||||||||||||
| Subordinated Debt (net of issuance costs) | 24,488 | 20,529 | 466 | 534 | 3.81 | 5.20 | ||||||||||||||||||
| FHLBB advances | 1,479 | 11,197 | 55 | 65 | 7.46 | 1.17 | ||||||||||||||||||
| Total interest-bearing liabilities | 950,499 | 913,621 | 1,669 | 1,803 | 0.35 | 0.40 | ||||||||||||||||||
| Demand deposits | 381,731 | 338,486 | ||||||||||||||||||||||
| Other liabilities | 6,675 | 6,851 | ||||||||||||||||||||||
| Shareholders’ equity | 132,293 | 127,787 | ||||||||||||||||||||||
| Total liabilities & shareholders’ equity | $ | 1,471,198 | $ | 1,386,745 | ||||||||||||||||||||
| Net interest income (d) | $ | 21,544 | $ | 20,258 | ||||||||||||||||||||
| Spread on interest-bearing funds | 2.94 | 2.95 | ||||||||||||||||||||||
| Net interest margin (e) | 3.05 | 3.06 | ||||||||||||||||||||||
| (a) | Includes non-accrual loans. |
| (b) | Includes interest-bearing deposits in other banks and federal funds sold. |
| (c) | Average balances of securities are based on cost. |
| (d) | Includes tax exempt income benefit of $364,000 and $343,000, respectively for 2022 and 2021 on tax-exempt securities and loans whose income and yields are calculated on a tax-equivalent basis. The income benefit reflected the U.S. federal statutory tax rate of 21.0% for 2022 and 2021. |
| (e) | Net interest income divided by average interest-earning assets. |
The following table sets forth the changes in FTE interest due to volume and rate.
| Six months ended June 30, (in thousands) | 2022 versus 2021 | |||||||||||
| Change in interest due to | Volume | Rate | Net | |||||||||
| Loans | $ | 1,440 | $ | (1,074 | ) | $ | 366 | |||||
| Securities | 1,276 | (557 | ) | 719 | ||||||||
| FHLBB stock | (10 | ) | 7 | (3 | ) | |||||||
| Short term funds | (183 | ) | 253 | 70 | ||||||||
| Interest-earning assets | 2,523 | (1,371 | ) | 1,152 | ||||||||
| Deposits | 201 | (267 | ) | (66 | ) | |||||||
| Repurchase agreements | (2 | ) | — | (2 | ) | |||||||
| Finance lease | 84 | (71 | ) | 13 | ||||||||
| Note payable | (1 | ) | — | (1 | ) | |||||||
| Subordinated Debt | 245 | (313 | ) | (68 | ) | |||||||
| FHLBB advances | (409 | ) | 399 | (10 | ) | |||||||
| Interest-bearing liabilities | 118 | (252 | ) | (134 | ) | |||||||
| Net change in net interest income | $ | 2,405 | $ | (1,119 | ) | $ | 1,286 | |||||
Interest Income
Tax equivalent interest income of $23.2 million for the six-month period ended June 30, 2022 increased $1.2 million, or 5.2%, from $22.1 million for the six-month period ended June 30, 2021. Loan income, as compared to the six months of 2021, increased $366 thousand, or 1.8%, primarily due to a $43.9 million, or 4.1%, increase in average loan balances, which was partly offset by a 10 basis point decrease in the average yield. Tax equivalent securities income increased $719 thousand, or 52.9%, for the six-month period 2022 as compared with the six-month period 2021, primarily due to a $96.1 million, or 79.6%, increase in average balances, which was partly offset by a 33 basis point decrease in average yield. Income on short-term funds as compared to six-month period 2021 increased $70 thousand, or 92.1%, primarily due to a $52.5 million, or 37.1%, decrease in average balances, partly offset by a 22 basis point increase in the average short-term funds yields.
| 37 |
Interest Expense
Interest expense decreased $134 thousand, or 7.4%, to $1.7 million for the six-month period 2022 compared with $1.8 million for the six-month period 2021. Interest on deposit accounts decreased $66 thousand, or 5.9%, as a result of a 3 basis point reduction in the average deposit rate, which was partly offset by an increase in the average total deposit balance of $41.8 million compared with the six-month period 2021. Interest expense on subordinated debt for the six-month period 2021 included approximately $180 thousand for interest and the amortization of issuance costs on $10.0 million of subordinated debt, which Salisbury issued in 2015 and fully redeemed in May 2021. In March 2021, Salisbury issued $25.0 million of subordinated debt at a coupon of 3.5%.
Provision and Allowance for Loan Losses
A provision of $1.5 million was recorded for the six-month period ended June 30, 2022 compared to a net credit reserve release of $0.9 million for the six-month period ended June 30, 2021. Net loan charge-offs were $722 thousand and $129 thousand for the respective periods. The provision expense for six-month period of 2022 reflected significant loan growth and adjustments to qualitative factors due to the uncertain macro-economic environment. The provision expense for quarter 2022 also reflected a release of credit reserves of $0.6 million due to management’s upgrade of the internal risk rating on certain loans related to the hospitality and entertainment and recreation industries. In 2021 management reduced credit reserves as a result of an improvement in the business environment in Salisbury’s market areas due to the rollout out of vaccinations and the lifting of COVID-19 restrictions.
Charge-off’s for the six-month period in 2022 included a write-down of $374 thousand in first quarter 2022 to reduce the carrying value on $3.8 million of non-performing and under-performing residential and commercial loans, which Salisbury sold during the quarter, to the initial bid prices. The proceeds from the sale of these loans subsequently increased by approximately $239 thousand due to higher final bids. This increase was recorded as a pre-tax gain on sale in Salisbury’s consolidated statement of income in first quarter 2022. In second quarter 2022, Salisbury charged off $312 thousand, which primarily related to a discrete commercial loan.
Reserve coverage at June 30, 2022, as measured by the ratio of allowance for loan losses to gross loans, at 1.19%, compares with 1.22% a year ago at June 30, 2021. Excluding PPP loans, the reserve coverage ratio was 1.20% for June 30, 2022 compared with 1.29% for June 30, 2021. Management will continue to evaluate credit risk in the loan portfolio to ensure a commensurate level of loan loss reserves. A resurgence of the pandemic or a deterioration in economic conditions due to high inflation and rising interest rates, which results in loan payment delinquencies, may subsequently necessitate an increase in loan loss reserves.
Non-interest income
The following table details the principal categories of non-interest income.
| Six months ended June 30, (dollars in thousands) | 2022 | 2021 | 2022 vs. 2021 | |||||||||||||
| Trust and wealth advisory | $ | 2,533 | $ | 2,399 | $ | 134 | 5.6 | % | ||||||||
| Service charges and fees | 2,861 | 2,325 | 536 | 23.1 | ||||||||||||
| Mortgage banking activities, net | 432 | 804 | (372 | ) | (46.3 | ) | ||||||||||
| (Losses) gains on mutual fund | (72 | ) | (14 | ) | (58 | ) | 414.3 | |||||||||
| (Losses) gains on sales and calls of available -for-sale securities, net | 165 | (9 | ) | 174 | N/A | |||||||||||
| BOLI income and gains | 414 | 251 | 163 | 64.9 | ||||||||||||
| Other | 57 | 57 | 0 | 0.0 | ||||||||||||
| Total non-interest income | $ | 6,390 | $ | 5,813 | $ | 577 | 9.9 | % | ||||||||
Non-interest income for the six-month period ended June 30, 2022 increased $577 thousand versus the same period in 2021. Trust and wealth advisory revenues increased $134 thousand mainly due to higher asset-based fees. Service charges and fees increased $536 thousand during the six-month period ended June 30, 2022. The increase primarily reflected loan prepayment fees recorded in second quarter 2022 as well as higher deposit fees. Income from sales of mortgage loans decreased $372 thousand due to decreased gains on sales of fixed rate residential mortgage loans to FHLB Boston. Mortgage loan sales totaled $7.5 million for the six-month period ended June 30, 2022 compared with $28.5 million for the six-month period ended June 30, 2021. The six-month periods ended June 30, 2022 and 2021 included mortgage servicing amortization of $78 thousand and $131 thousand, respectively. BOLI income for the six-month period ended June 30, 2022 included a non-recurring non-taxable gain of $89 thousand related to proceeds receivable due to the death of a former covered employee.
Non-interest expense
The following table details the principal categories of non-interest expense.
| Six months ended June 30, (dollars in thousands) | 2022 | 2021 | 2022 vs. 2021 | |||||||||||||
| Salaries | $ | 7,135 | $ | 6,304 | $ | 831 | 13.2 | % | ||||||||
| Employee benefits | 2,565 | 2,668 | (103 | ) | (3.9 | ) | ||||||||||
| Premises and equipment | 2,086 | 1,973 | 113 | 5.7 | ||||||||||||
| Information processing and services | 1,387 | 1,193 | 194 | 16.3 | ||||||||||||
| Professional fees | 1,609 | 1,355 | 254 | 18.7 | ||||||||||||
| Collections, OREO, and loan related | 232 | 197 | 35 | 17.8 | ||||||||||||
| FDIC insurance | 293 | 225 | 68 | 30.2 | ||||||||||||
| Marketing and community support | 447 | 296 | 151 | 51.0 | ||||||||||||
| Amortization of intangibles | 104 | 137 | (33 | ) | (24.1 | ) | ||||||||||
| Other | 1,328 | 999 | 329 | 32.9 | ||||||||||||
| Non-interest expense | $ | 17,186 | $ | 15,347 | $ | 1,839 | 12.0 | % | ||||||||
| 38 |
Non-interest expense for the six-month period ended June 30, 2022 increased $1.8 million versus the same period in 2021. Salaries increased $831 thousand due to higher base salaries and production accruals. Benefits decreased $103 thousand primarily due one-time health insurance credit recorded in 2022. Premises and equipment increased $113 thousand primarily due to higher lease, utilities expense and software maintenance partially offset by maintenance and repair expense. Information processing and services increased $194 thousand mainly due to higher core data processing costs, website and ATM and debit card network fees. Professional fees increased $254 thousand versus the six-month period 2021 primarily due to higher consulting, investment management and legal costs partially offset by lower audit and exam expenses. Collections, OREO and loan related expense increased $35 thousand primarily on higher appraisal and litigation costs and higher mortgage taxes. Marketing and community support increased $151 thousand primarily due to brand refresh incentives and additional marketing campaigns and contributions. Other expenses increased $329 thousand primarily due to two isolated instances of debit card or check cashing net fraud-related losses aggregating $200 thousand incurred in 2022.
Income taxes
The effective income tax rates for the six-month periods ended June 30, 2022 and June 30, 2021 were 16.9% and 21.4%, respectively. Generally, fluctuations in the effective tax rate result from changes in the mix of taxable and tax-exempt income. The tax provision for the six-month period of 2022 included a non-recurring credit of $63 thousand to adjust for an over statement of the Bank’s 2021 tax liability to New York state. The lower tax rate in 2022 also reflected a higher mix of tax-exempt income from municipal bonds and tax advantaged loans as well as the BOLI proceeds receivable noted above. Additionally, Salisbury’s effective tax rate is generally less than the federal statutory rate due to holdings of tax-exempt municipal bonds and loans as well as bank owned life insurance.
Salisbury did not incur Connecticut income tax in 2022 (to date) or 2021, other than minimum state income tax, as a result of a Connecticut law that permits banks to shelter certain mortgage income from the Connecticut corporation business tax through the use of a special purpose entity called a Passive Investment Company or PIC. In 2004, Salisbury availed itself of this benefit by forming a PIC, SBT Mortgage Service Corporation. Salisbury's income tax provision reflects the full impact of the Connecticut legislation. Salisbury does not expect to pay other than minimum Connecticut state income tax in the foreseeable future unless there is a change in Connecticut tax law.
CAPITAL RESOURCES
Shareholders’ Equity
Shareholders’ equity decreased $9.3 million in six months to $127.3 million at June 30, 2022 as unrealized after-tax losses in the available-for-sale securities (“AFS”) portfolio of $15.4 million and common stock dividends paid of $1.8 million were partially offset by net income of $7.4 million and issued stock and stock-based compensation totaling of $0.5 million. The unrealized losses in the AFS portfolio, which reflected the sharp increase in market interest rates during first six months of 2022, reduced both book value and tangible book value at June 30, 2022. Book value per common share of $22.01 at June 30, 2022 decreased $0.55 from first quarter 2022 and decreased $1.00 from second quarter 2021. Tangible book value per common share of $19.57 at June 30, 2022 decreased $0.53 from first quarter 2022 and decreased $0.93 from second quarter 2021.
Capital Requirements
Under current regulatory definitions, the Bank meets all capital adequacy requirements to which it is subject and the Bank is considered to be well-capitalized. As a result, the Bank pays lower federal deposit insurance premiums than those banks that are not “well-capitalized.” Requirements for classification as a well-capitalized institution and for minimum capital adequacy along with the Bank's regulatory capital ratios are as follows:
| June 30, 2022 | December 31, 2021 | |||||||
| Total Capital (to risk-weighted assets) | 13.28 | % | 14.08 | % | ||||
| Tier 1 Capital (to risk-weighted assets) | 12.13 | 12.87 | ||||||
| Common Equity Tier 1 Capital (to risk-weighted assets) | 12.13 | 12.87 | ||||||
| Tier 1 Capital (to average assets) | 10.04 | 9.42 | ||||||
A well-capitalized institution, which is the
highest capital category for an institution as defined by the Prompt Corrective Action regulations issued by the FDIC and the FRB, is
one which maintains a Total Risk-Based ratio of 10% or above, a Tier 1 Risk-Based ratio of 8% or above, a Common Equity Tier 1 ratio of
6.5% or above, and a Leverage ratio of 5% or above, and is not subject to any written order, written agreement, capital directive, or
prompt corrective action directive to meet and maintain a specific capital level. Maintaining strong capital is essential to Salisbury
and the Bank’s safety and soundness. However, the effective management of capital resources requires generating attractive returns
on equity to build value for shareholders while maintaining appropriate levels of capital to fund growth, meet regulatory requirements
and be consistent with prudent industry practices.
The FRB’s final rules implementing the Basel Committee on Banking Supervision’s capital guidelines for bank holding companies and their bank subsidiaries include a common equity Tier 1 capital to risk-weighted assets minimum ratio of 4.5%, a minimum ratio of Tier 1 capital to risk-weighted assets of 6.0%, require a minimum ratio of Total capital to risk-weighted assets of 8.0%, and require a minimum Tier 1 leverage ratio of 4.0%. A capital conservation buffer, comprised of common equity Tier 1 capital, is also established above the regulatory minimum capital requirements. This capital conservation buffer began phasing in January 1, 2016 at 0.625% of risk-weighted assets and increased each subsequent year by an additional 0.625% until it reached its final level of 2.50% on January 1, 2019. Strict eligibility criteria for regulatory capital instruments were also implemented under the final rules.
As of June 30, 2022, the Company and the Bank met each of their capital requirements and the most recent notification from the FDIC categorized the Bank as “well-capitalized.” There are no conditions or events since that notification that management believes have changed the Bank’s category.
| 39 |
On September 17, 2019, the Office of the Comptroller of the Currency, the FRB and the FDIC published its final rule establishing a “Community Bank Leverage Ratio” (“CBLR”) that simplifies capital requirements for certain community banking organizations with less than $10 billion in total consolidated assets (such as the Bank). Under the final rule, depository institutions and their holding companies that meet certain criteria (generally, those with limited amounts of off-balance sheet exposures, trading assets and liabilities, mortgage servicing assets, and temporary difference deferred tax assets) (“qualifying community banking organizations”) may elect to report the components of its Tier 1 leverage ratio as a measure of capital adequacy. A qualifying community banking organization with a CBLR of greater than 9% that “elects to use the CBLR framework” will not be subject to other risk-based and leverage capital requirements and will be considered to have met the “well-capitalized” ratio requirements for purposes of the agencies’ Prompt Corrective Action (“PCA”) framework. Under the final rule, if a bank that has opted to use the CBLR framework subsequently fails to satisfy one or more of the qualifying criteria but continues to report a leverage ratio of greater than 8 %, the bank may continue to use the framework and will be deemed “well capitalized” for a grace period of up to two quarters. A qualifying community banking organization will be required to comply with the generally applicable capital rule and file the relevant regulatory reports if the banking organization: (1) is unable to restore compliance with all qualifying criteria during the two-quarter grace period (including achieving compliance with the greater than 9% leverage ratio requirement); (2) reports a leverage ratio of 8% or less; or (3) ceases to satisfy the qualifying criteria due to consummation of a merger transaction. The final rule became effective on January 1, 2020. The Bank would qualify for the CBLR methodology and would also be considered to be well capitalized if it elected to utilize such methodology. The Bank continues to evaluate the benefits of transitioning to this simplified methodology for assessing capital adequacy.
Stock Repurchase Plan
On March 23, 2022 Salisbury announced that its Board of Directors has renewed its share repurchase program that was established in March 2021. The share repurchase program provides for the potential repurchase of Salisbury’s common stock in amounts up to an aggregate of five percent (5%) of the outstanding shares of Salisbury’s common stock from time to time over a period of the next twelve (12) months through privately negotiated transactions and/or market purchases at appropriate prices, subject to price and market conditions on terms determined to be in the best interests of Salisbury. However, there is no assurance that Salisbury will complete repurchases of 5% of its outstanding shares over the next twelve (12) months. Salisbury did not repurchase any shares during the six-month period ended June 30, 2022.
Stock Split
At Salisbury’s annual shareholder meeting on May 18, 2022, shareholders approved a recommendation by Salisbury’s Board of Directors to amend Salisbury’s Certificate of Incorporation to increase Salisbury’s authorized shares of Common Stock from 5,000,000 to 10,000,000 shares. On June 30, 2022, Salisbury’s Board implemented a two for one forward split of the shares of the Company’s Common Stock as a means of enhancing the liquidity and marketability of the Company’s securities in the best interests of shareholders.
Subordinated Debt
On March 31, 2021 Salisbury completed a private placement of $25.0 million in aggregate principal amount of Fixed to Floating Rate Subordinated Notes due 2031 (the “Notes”) to various accredited investors. The Notes have a maturity date of March 31, 2031 and bear interest at an annual rate of 3.50% per annum, from and including the closing date to, but excluding March 31, 2026 or the earlier redemption date, payable quarterly in arrears. From and including March 31, 2026 to, but excluding the maturity date or earlier redemption date, the rate will be a floating per annum rate expected to be equal to the then current three-month SOFR plus 280 basis points, provided, however, that in the event three-month SOFR is less than zero, three-month term SOFR shall be deemed to be zero, payable quarterly in arrears. On May 28, 2021, Salisbury redeemed in full the $10.0 million of subordinated debt issued in 2015.
Dividends
Salisbury paid $1.8 million in common stock dividends during the six-month period ended June 30, 2022. On July 22, 2022, the Board of Directors of Salisbury approved a quarterly cash dividend of $0.16 per common share is payable on August 26, 2022 to shareholders of record as of August 12, 2022.
Common stock dividends, when declared, will generally be paid the last Friday of February, May, August and November, although Salisbury is not obligated to pay dividends on those dates or at any other time.
Salisbury's ability to pay cash dividends is dependent on the Bank's ability to pay cash dividends to Salisbury. There are certain restrictions on the payment of cash dividends and other payments by the Bank to Salisbury. Under Connecticut law, the Bank cannot declare a cash dividend except from net profits, defined as the remainder of all earnings from current operations. The total of all cash dividends declared by the Bank in any calendar year shall not, unless specifically approved by the Banking Commissioner, exceed the total of its net profits of that year combined with its retained net profits of the preceding two years.
FRB Supervisory Letter SR 09-4, February 24, 2009, revised December 31, 2015, states that, as a general matter, the Board of Directors of a Bank Holding Company (“BHC”) should inform the Federal Reserve and should eliminate, defer, or significantly reduce dividends if (1) net income available to shareholders for the past four quarters, net of dividends previously paid during that period, is not sufficient to fully fund the dividends; (2) the prospective rate of earnings retention is not consistent with capital needs and overall current and prospective financial condition; or (3) the BHC will not meet, or is in danger of not meeting, its minimum regulatory capital adequacy ratios. Moreover, a BHC should inform the Federal Reserve reasonably in advance of declaring or paying a dividend that exceeds earnings for the period (e.g., quarter) for which the dividend is being paid or that could result in a material adverse change to the BHC capital position.
Salisbury believes that the payment of common stock cash dividends is appropriate, provided that such payment considers Salisbury's capital needs, asset quality, and overall financial condition and does not adversely affect the financial stability of Salisbury or the Bank. The continued payment of common stock cash dividends by Salisbury will be dependent on Salisbury's future core earnings, financial condition and capital needs, regulatory restrictions, and other factors deemed relevant by the Board of Directors of Salisbury.
| 40 |
IMPACT OF INFLATION AND CHANGING PRICES
Salisbury’s consolidated financial statements and related notes thereto presented elsewhere in this Form 10-Q are prepared in conformity with GAAP, which require the measurement of financial condition and operating results in terms of historical dollars without considering changes in the relative purchasing power of money, over time, due to inflation. Unlike some other types of companies, the financial nature of Salisbury’s consolidated financial statements is more clearly affected by changes in interest rates than by inflation. Interest rates do not necessarily fluctuate in the same direction or in the same magnitude as the prices of goods and services. There is no precise method, however, to measure the effects of inflation on Salisbury’s consolidated financial statements. Accordingly, any examination or analysis of the financial statements should take into consideration the possible effects of inflation. Although not a material factor in recent years, inflation could impact earnings in future periods.
FORWARD-LOOKING STATEMENTS
This Form 10-Q and future filings made by Salisbury with the Securities and Exchange Commission, as well as other filings, reports and press releases made or issued by Salisbury and the Bank, and oral statements made by executive officers of Salisbury and the Bank, may include forward-looking statements relating to such matters as:
| (a) | assumptions concerning future economic and business conditions and their effect on the economy in general and on the markets in which Salisbury and the Bank do business; and |
| (b) | expectations for revenues and earnings for Salisbury and the Bank. |
Such forward-looking statements are based on assumptions rather than historical or current facts and, therefore, are inherently uncertain and subject to risk. For those statements, Salisbury claims the protection of the safe harbor for forward-looking statements contained in the Private Securities Litigation Reform Act of 1995.
Salisbury notes that a variety of factors could cause the actual results or experience to differ materially from the anticipated results or other expectations described or implied by such forward-looking statements. The risks and uncertainties that may affect the operation, performance, development and results of Salisbury’s and the Bank’s business include the following:
| (a) | the risk of adverse changes in business conditions in the banking industry generally and in the specific markets in which the Bank operates; |
| (b) | changes in the legislative and regulatory environment that negatively impacts Salisbury and the Bank through increased operating expenses; |
| (c) | increased competition from other financial and non-financial institutions; |
| (d) | the impact of technological advances and cybersecurity matters; |
| (e) | interest rate fluctuations; |
| (f) | the effect of the COVID-19 pandemic on Salisbury, the communities served by the Bank, the State of Connecticut and the United States, related to the economy and overall financial stability; |
| (g) | the risk of adverse changes in business conditions due to geo-political tensions; |
| (h) | government and regulatory responses to the COVID-19 pandemic; and |
| (i) | other risks identified from time to time in Salisbury’s filings with the Securities and Exchange Commission. |
Such developments could have an adverse impact on Salisbury’s and the Bank’s financial position and results of operations.
| 41 |
| Item 3. | QUANTITATIVE AND QUALITATIVE DISCLOSURES ABOUT MARKET RISK |
Salisbury manages its exposure to interest rate risk through its Asset/Liability Management Committee (“ALCO”) using risk limits and policy guidelines to manage assets and funding liabilities to produce financial results that are consistent with Salisbury’s liquidity, capital adequacy, growth, risk and profitability targets. Interest rate risk is the risk of a negative impact to future earnings due to changes in interest rates.
The ALCO manages interest rate risk using income simulation to measure interest rate risk inherent in Salisbury’s financial instruments at a given point in time by showing the effect of interest rate shifts on net interest income over a 24-month horizon. In management’s March 31, 2021 analysis, the simulations incorporate static growth assumptions over the simulation horizons for regulatory compliance and interest rate risk measurement purposes. In the dynamic growth scenarios, allowances are made for loan, deposit and security product mix shifts in selected interest rate scenarios, such as movements between lower rate savings and money market deposit accounts and higher rate time deposits, and changes in the reinvestment of loan and securities cash flows. Additionally, the simulations take into account the specific re-pricing, maturity and prepayment characteristics of differing financial instruments that may vary under different interest rate scenarios.
The ALCO reviews the simulation results to determine whether Salisbury’s exposure to change in net interest income remains within established tolerance levels over the simulation horizons and to develop appropriate strategies to manage this exposure. Salisbury’s tolerance levels for changes in net interest income in its income simulations varies depending on the magnitude of interest rate changes and level of risk-based capital. All changes are measured in comparison to the projected net interest income that would result from an “unchanged” rate scenario where interest rates remain stable over the forecast horizon. The ALCO also evaluates the directional trends of net interest income, net interest margin and other financial measures over the forecast horizon for consistency with its liquidity, capital adequacy, growth, risk and profitability targets.
ALCO uses four interest rate scenarios to evaluate interest risk exposure and may vary these interest rate scenarios to show the effect of steepening or flattening changes in yield curves as well as parallel changes in interest rates. At June 30, 2022, ALCO used the following interest rate scenarios: (1) unchanged interest rates; (2) immediately rising interest rates – immediate parallel upward shift in market interest rates of 300 basis points across the yield curve; (3) immediately falling interest rates – immediate parallel downward shift in market interest rates of 200 basis points across the yield curve; and (4) gradual and non-parallel changes in interest rates – the yield curve is assumed to rise throughout 2022 and into 2023 with the treasury yield curve then declining late in 2023 and into 2024. At June 30, 2023 the two year, five year and 10 year treasury are 0.80%, 0.70% and 0.70% higher than actual rates as of June 30, 2022 with the Fed Funds rate increasing 1.75% from June 30, 2022 to June 30, 2023. The Fed Funds rate is then projected to decline 1.75% from June 30, 2023 to June 30, 2024 with the two year, five year and 10 year treasury declining by 1.46%, 1.30% and 1.05% over that time period. Simulations do not reflect adjustments in strategy that the ALCO could implement in response to rate shifts.
As of June 30, 2022, net interest income simulations indicated that Salisbury’s exposure to changing interest rates over the simulation horizons remained within its tolerance levels.
The following table sets forth the estimated change in net interest income from an unchanged interest rate scenario over the periods indicated for changes in market interest rates using Salisbury’s financial instruments as of June 30, 2022.
| As of June 30, 2022 | Months 1-12 | Months 13-24 | ||||||
| Immediately rising interest rates + 200bp (static growth assumptions) | (2.70 | %) | 2.40 | % | ||||
| Immediately falling interest rates + 100bp (static growth assumptions) | (1.10 | ) | 1.60 | |||||
| Immediately rising interest rates - 100bp (static growth assumptions) | (3.70 | ) | (7.10 | ) | ||||
The negative exposure of net interest income to immediately and gradually rising rates as compared to the unchanged rate scenario results from a faster projected rise in the cost of funds versus income from earning assets, as relatively rate-sensitive money market and time deposits re-price faster than longer duration earning assets. The positive exposure of net interest income to immediately and gradually rising rates as compared to the unchanged rate scenario results from a faster projected rise in income from earning assets versus the projected increase in the Bank’s cost of funds. The negative exposure of net interest income to immediately falling rates as compared to an unchanged rate scenario results from a greater decline in earning asset yields compared to rates paid on funding liabilities, as a result of faster prepayments on existing assets and lower reinvestment rates on future loans originated and securities purchased.
While the ALCO reviews simulation assumptions and back-tests simulation results to ensure that they are reasonable and current, income simulation may not always prove to be an accurate indicator of interest rate risk or future net interest margin. Over time, the re-pricing, maturity and prepayment characteristics of financial instruments and the composition of Salisbury’s balance sheet may change to a different degree than estimated. Simulation modeling assumes Salisbury’s expectation for future balance sheet growth, which is a function of the business environment and customer behavior. Another significant simulation assumption is the sensitivity of core savings deposits to fluctuations in interest rates. Income simulation results assume that changes in both core savings deposit rates and balances are related to changes in short-term interest rates. The assumed relationship between short-term interest rate changes and core deposit rate and balance changes used in income simulation may differ from the ALCO’s estimates. Lastly, mortgage-backed securities and mortgage loans involve a level of risk that unforeseen changes in prepayment speeds may cause related cash flows to vary significantly in differing rate environments. Such changes could affect the level of reinvestment risk associated with cash flow from these instruments, as well as their market value. Changes in prepayment speeds could also increase or decrease the amortization of premium or accretion of discounts related to such instruments, thereby affecting interest income.
Salisbury also monitors the potential change in market value of its available-for-sale debt securities in changing interest rate environments. The purpose is to determine market value exposure that may not be captured by income simulation, but which might result in changes to Salisbury’s capital and liquidity position. Results are calculated using industry-standard analytical techniques and securities data. Equity securities are excluded from this analysis because the market value of such securities cannot be directly correlated with changes in interest rates.
| 42 |
The following table summarizes the potential change in market value of available-for-sale debt securities resulting from immediate parallel rate shifts:
| As of June 30, 2022(in thousands) | Rates up 100bp | Rates up 200bp | ||||||
| U.S. Treasury | $ | (789 | ) | $ | (1,536 | ) | ||
| U.S. Government agency notes | (1,566 | ) | (2,305 | ) | ||||
| Municipal bonds | (3,585 | ) | (6,916 | ) | ||||
| Mortgage backed securities | ||||||||
| U.S. Government agencies and U.S. Government- sponsored enterprises | (3,388 | ) | (6,650 | ) | ||||
| Collateralized mortgage obligations | ||||||||
| U.S. Government agencies | (1,572 | ) | (3,175 | ) | ||||
| Corporate bonds | (424 | ) | (801 | ) | ||||
| Total available-for-sale debt securities | $ | (11,324 | ) | $ | (21,383 | ) |
| Item 4. | CONTROLS AND PROCEDURES |
Evaluation of Disclosure Controls and Procedures
Salisbury’s management, including its Chief Executive Officer and Chief Financial Officer, has evaluated the effectiveness of the design and operation of Salisbury’s disclosure controls and procedures as of June 30, 2022. Based upon that evaluation, the Chief Executive Officer and Chief Financial Officer concluded that the disclosure controls and procedures are effective as of June 30, 2022.
Disclosure controls and procedures are controls and other procedures that are designed to ensure that the information required to be disclosed in reports filed or submitted under the Securities Exchange Act of 1934, as amended (the “Exchange Act”) is recorded, processed, summarized and reported within the time periods specified in the Securities and Exchange Commission’s rules and forms. Disclosure controls and procedures include, without limitation, controls and procedures designed to ensure that information required to be disclosed by Salisbury in its reports filed under the Exchange Act is accumulated and communicated to management, including the principal executive officer and principal financial officer, as appropriate to allow timely decisions regarding required disclosure.
Changes in Internal Controls
In addition, based on an evaluation of its internal controls over financial reporting, no change in Salisbury’s internal control over financial reporting occurred during the quarter ended June 30, 2022 that has materially affected, or is reasonably likely to materially affect, Salisbury’s internal control over financial reporting.
PART II. OTHER INFORMATION
| Item 1. | LEGAL PROCEEDINGS |
The Bank is involved in various claims and legal proceedings arising in the ordinary course of business, which management currently believes are not material, individually or in the aggregate, to the business, financial condition or operating results of Salisbury or any of its subsidiaries. There are no material pending legal proceedings, other than ordinary routine litigation incidental to the registrant’s business, to which Salisbury is a party or of which any of its property is subject.
| Item 1A. | RISK FACTORS |
Please refer to the note on forward-looking statements in this Quarterly Report on Form 10-Q. In addition, please consider the risk factors discussed in Salisbury’s Annual Report on Form 10-K for the year ended December 31, 2021. There were no material changes to the risk factors previously disclosed in such Annual Report.
| Item 2. | UNREGISTERED SALES OF EQUITY SECURITIES AND USE OF PROCEEDS |
None
| Item 3. | DEFAULTS UPON SENIOR SECURITIES |
None
| Item 4. | MINE SAFETY DISCLOSURES |
Not Applicable
| Item 5. | OTHER INFORMATION |
None
| 43 |
| Item 6. | EXHIBITS |
SIGNATURES
Pursuant to the requirements of the Securities Exchange Act of 1934, the registrant has duly caused this report to be signed on its behalf by the undersigned thereunto duly authorized.
| SALISBURY BANCORP, INC. | |||
| August 15, 2022 | By: | /s/ Richard J. Cantele, Jr. | |
| Richard J. Cantele, Jr., | |||
| President and Chief Executive Officer | |||
| August 15, 2022 | By: | /s/ Peter Albero | |
| Peter Albero, | |||
| Executive Vice President and Chief Financial Officer | |||
44
Exhibit 3.1


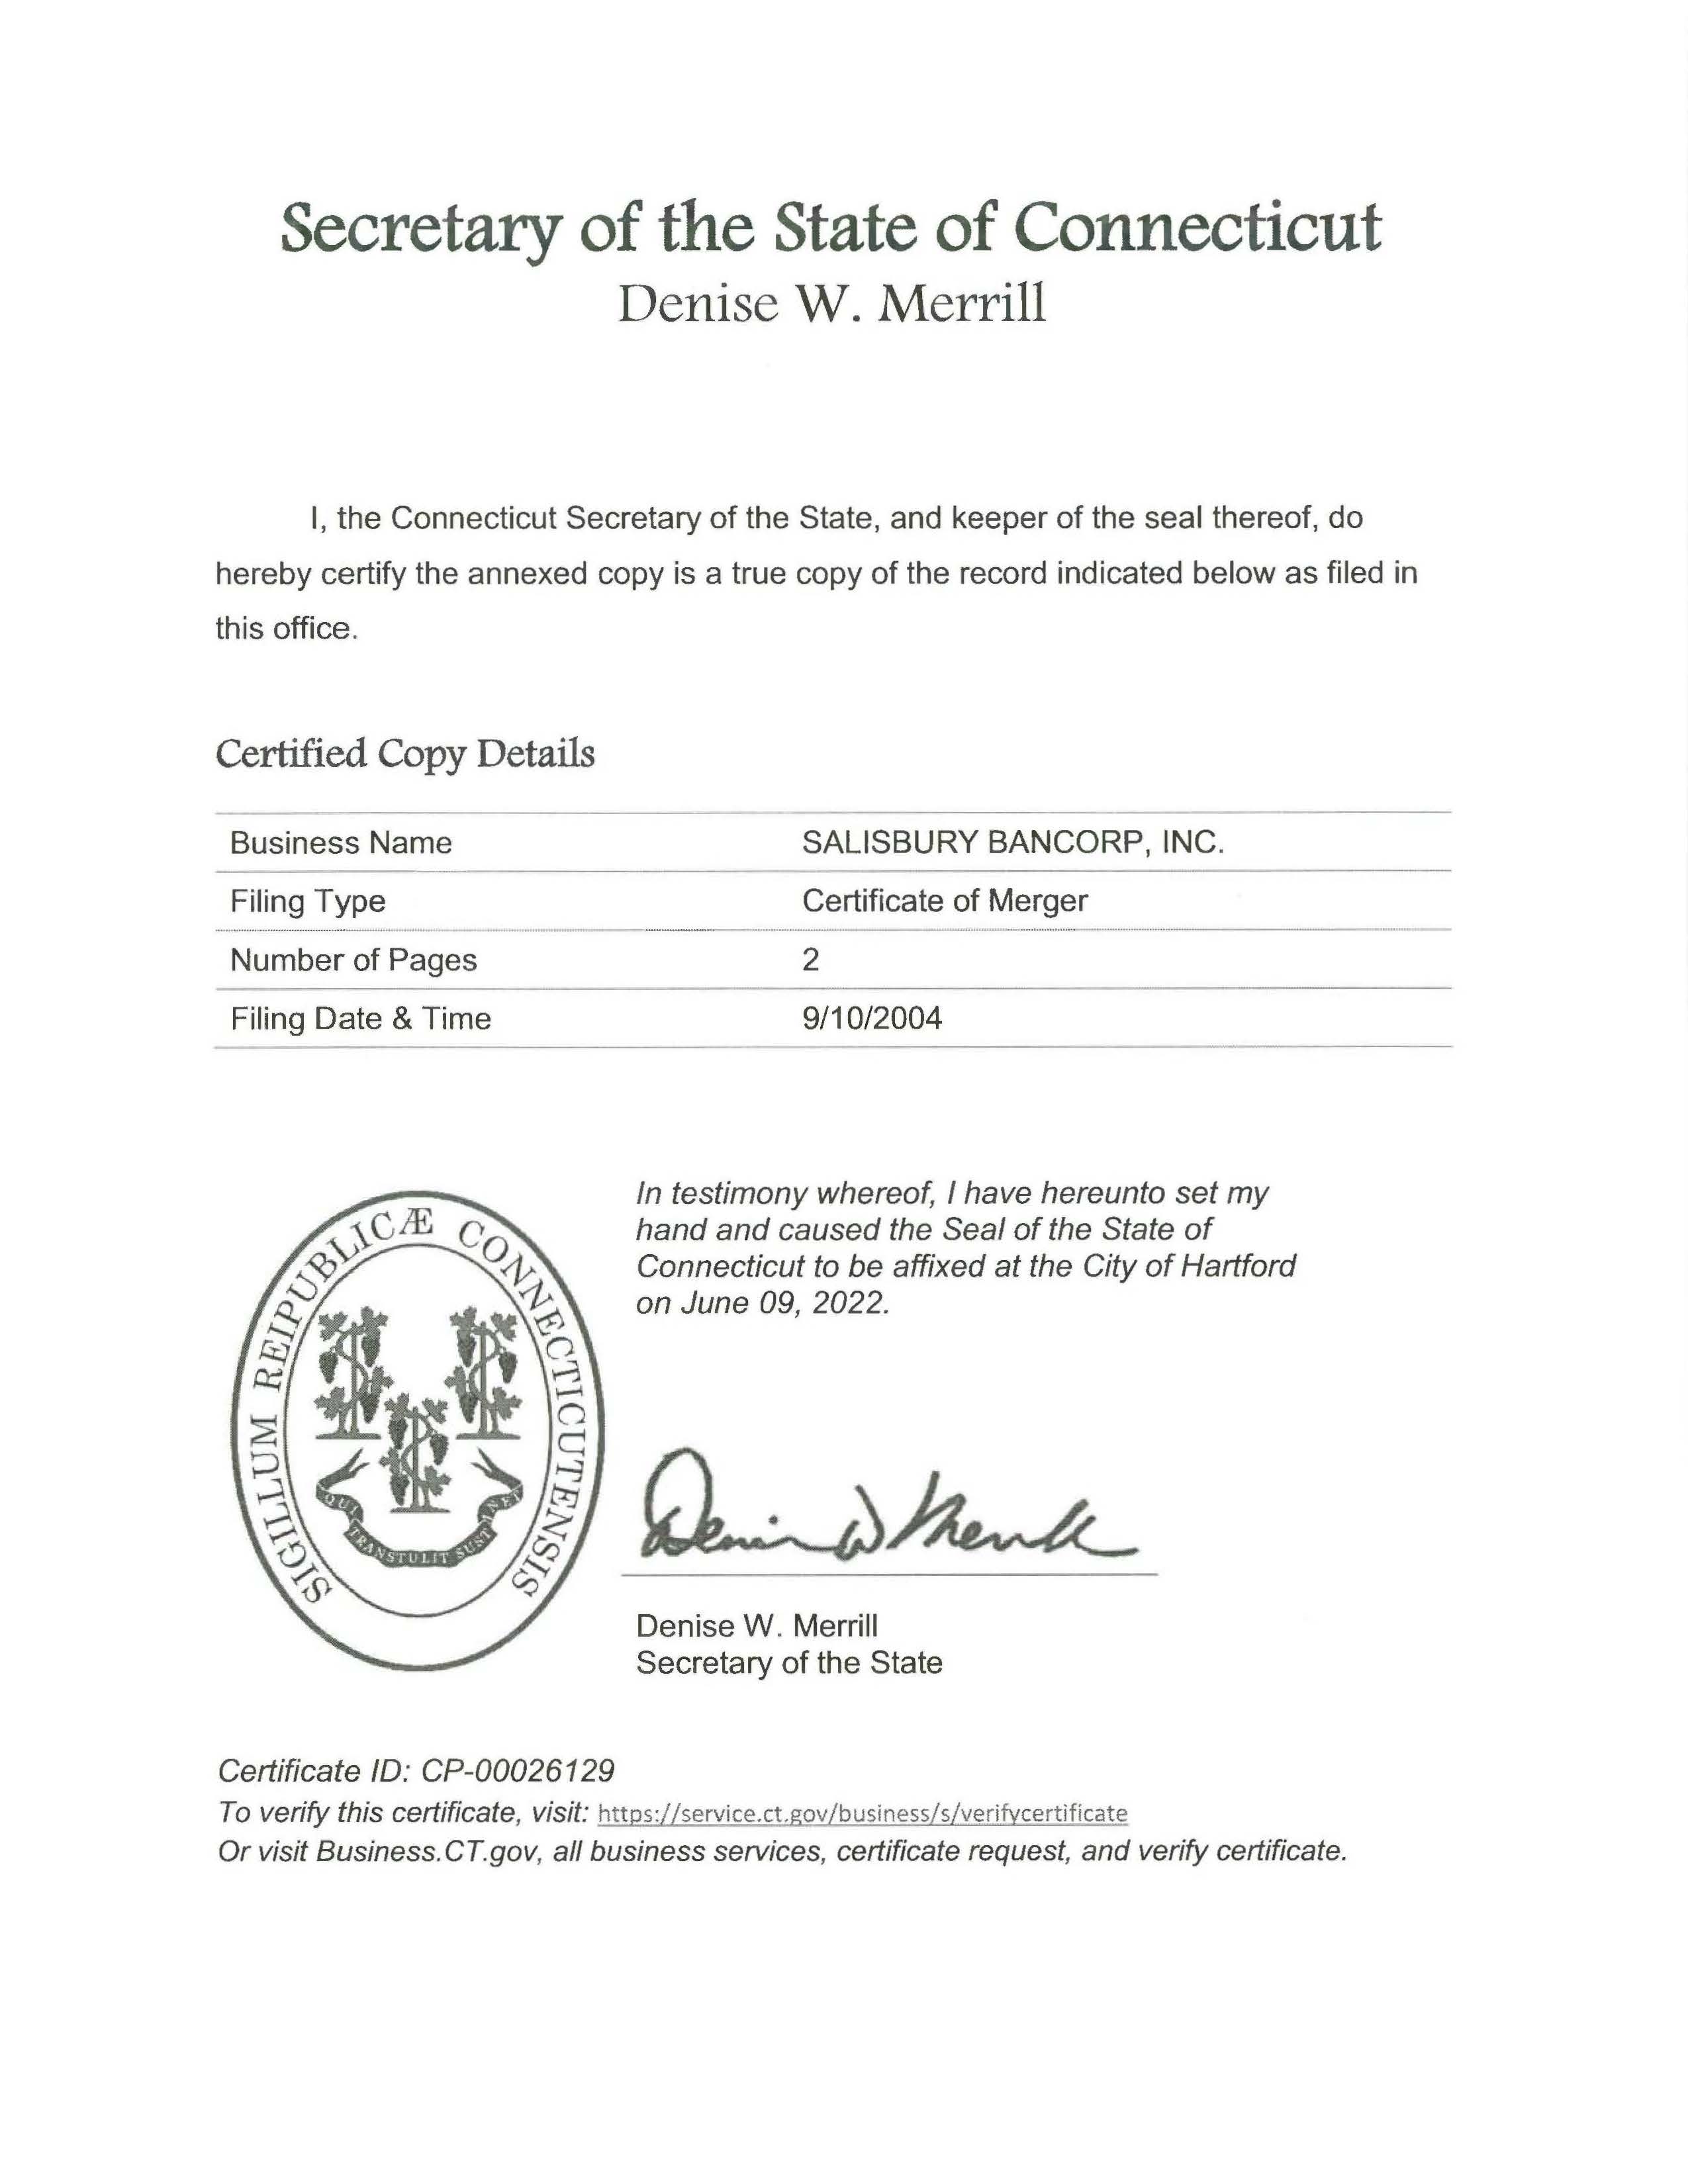


SALISBURY BANCORP, INC.
Form 10-Q
Exhibit 31.1
CERTIFICATION PURSUANT TO
RULE 13a-14(a)/15d-14(a)
I, Richard J. Cantele, Jr., certify that:
| 1. | I have reviewed this quarterly report on Form 10-Q of Salisbury Bancorp, Inc.; |
| 2. | Based on my knowledge, this report does not contain any untrue statement of a material fact or omit to state a material fact necessary to make the statements made, in light of the circumstances under which such statements were made, not misleading with respect to the period covered by this report; |
| 3. | Based on my knowledge, the financial statements, and other financial information included in this report, fairly present in all material respects the financial condition, results of operations and cash flows of the registrant as of, and for, the periods presented in this report; |
| 4. | The registrant's other certifying officer and I are responsible for establishing and maintaining disclosure controls and procedures (as defined in Exchange Act Rules 13a-15(e) and 15d-15(e)) and internal control over financial reporting (as defined in Exchange Act Rules 13a-15(f) and 15d-15(f)) for the registrant and have: |
| a) | designed such disclosure controls and procedures, or caused such disclosure controls and procedures to be designed under our supervision, to ensure that material information relating to the registrant, including its consolidated subsidiaries, is made known to us by others within those entities, particularly during the period in which this report is being prepared; |
| b) | designed such internal control over financial reporting, or caused such internal control over financial reporting to be designed under our supervision, to provide reasonable assurance regarding the reliability of financial reporting and the preparation of financial statements for external purposes in accordance with generally accepted accounting principles; |
| c) | evaluated the effectiveness of the registrant's disclosure controls and procedures and presented in this report our conclusions about the effectiveness of the disclosure controls and procedures, as of the end of the period covered by this report based on such evaluation; |
| d) | disclosed in this report any change in the registrant’s internal control over financial reporting that occurred during the registrant’s most recent fiscal quarter (the registrant’s fourth fiscal quarter in the case of an annual report) that has materially affected, or is reasonably likely to materially affect, the registrant’s internal control over financial reporting; and |
| 5. | The registrant's other certifying officer and I have disclosed, based on our most recent evaluation of internal control over financial reporting, to the registrant's auditors and the audit committee of registrant's Board of Directors (or persons performing the equivalent function): |
| a) | all significant deficiencies and material weakness in the design or operation of internal control over financial reporting which are reasonably likely to adversely affect the registrant’s ability to record, process, summarize and report financial information; and |
| b) | any fraud, whether or not material, that involves management or other employees who have a significant role in the registrant's internal control over financial reporting. |
| August 15, 2022 | By: | /s/ Richard J. Cantele, Jr. | |
| Richard J. Cantele, Jr., | |||
| President and Chief Executive Officer | |||
SALISBURY BANCORP, INC.
Form 10-Q
Exhibit 31.2
CERTIFICATION PURSUANT TO
RULE 13a-14(a)/15d-14(a)
I, Peter Albero, certify that:
| 1. | I have reviewed this quarterly report on Form 10-Q of Salisbury Bancorp, Inc.; |
| 2. | Based on my knowledge, this report does not contain any untrue statement of a material fact or omit to state a material fact necessary to make the statements made, in light of the circumstances under which such statements were made, not misleading with respect to the period covered by this report; |
| 3. | Based on my knowledge, the financial statements, and other financial information included in this report, fairly present in all material respects the financial condition, results of operations and cash flows of the registrant as of, and for, the periods presented in this report; |
| 4. | The registrant's other certifying officer and I are responsible for establishing and maintaining disclosure controls and procedures (as defined in Exchange Act Rules 13a-15(e) and 15d-15(e)) and internal control over financial reporting (as defined in Exchange Act Rules 13a-15(f) and 15d-15(f)) for the registrant and have: |
| a) | designed such disclosure controls and procedures, or caused such disclosure controls and procedures to be designed under our supervision, to ensure that material information relating to the registrant, including its consolidated subsidiaries, is made known to us by others within those entities, particularly during the period in which this report is being prepared; |
| b) | designed such internal control over financial reporting, or caused such internal control over financial reporting to be designed under our supervision, to provide reasonable assurance regarding the reliability of financial reporting and the preparation of financial statements for external purposes in accordance with generally accepted accounting principles; |
| c) | evaluated the effectiveness of the registrant's disclosure controls and procedures and presented in this report our conclusions about the effectiveness of the disclosure controls and procedures, as of the end of the period covered by this report based on such evaluation; |
| d) | disclosed in this report any change in the registrant’s internal control over financial reporting that occurred during the registrant’s most recent fiscal quarter (the registrant’s fourth fiscal quarter in the case of an annual report) that has materially affected, or is reasonably likely to materially affect, the registrant’s internal control over financial reporting; and |
| 5. | The registrant's other certifying officer and I have disclosed, based on our most recent evaluation of internal control over financial reporting, to the registrant's auditors and the audit committee of registrant's Board of Directors (or persons performing the equivalent function): |
| a) | all significant deficiencies and material weakness in the design or operation of internal control over financial reporting which are reasonably likely to adversely affect the registrant’s ability to record, process, summarize and report financial information; and |
| b) | any fraud, whether or not material, that involves management or other employees who have a significant role in the registrant's internal control over financial reporting. |
| August 15, 2022 | By: | /s/ Peter Albero |
| Peter Albero, | ||
| Executive Vice President and Chief Financial Officer |
SALISBURY BANCORP, INC.
Form 10-Q
Exhibit 32
CERTIFICATION PURSUANT TO 18 U.S.C. SECTION 1350,
AS ADOPTED PURSUANT TO SECTION 906
OF THE SARBANES-OXLEY ACT OF 2002
In connection with the Quarterly Report of Salisbury Bancorp, Inc. (the "Company") on Form 10-Q for the period ending June 30, 2022, as filed with the Securities and Exchange Commission on the date hereof (the "Report"), I, Richard J. Cantele, Jr., President and Chief Executive Officer of the Company, and I, Peter Albero, Chief Financial Officer of the Company, certify, pursuant to 18 U.S.C. Section 1350, as adopted pursuant to section 906 of the Sarbanes-Oxley Act of 2002, that:
| (1) | The Report fully complies with the requirements of section 13(a) or 15(d) of the Securities Exchange Act of 1934; and |
| (2) | The information contained in the Report fairly presents, in all material respects, the financial condition and result of operations of the Company. |
| August 15, 2022 | By: | /s/ Richard J. Cantele, Jr. | By: | /s/ Peter Albero |
| Richard J. Cantele, Jr., | Peter Albero, | |||
| President and Chief Executive Officer | Executive Vice President and Chief Financial Officer |
Serious News for Serious Traders! Try StreetInsider.com Premium Free!
You May Also Be Interested In
- Seven New Hotels, Including Hotel Maya Long Beach, Sign with UNITE HERE Local 11, Raising the Total to 41 Agreements
- Blue Owl Capital Hires Australia Future Fund's Deputy Chief Investment Officer Alicia Gregory
- Hempacco Receives Notification of Deficiency from Nasdaq
Create E-mail Alert Related Categories
SEC FilingsSign up for StreetInsider Free!
Receive full access to all new and archived articles, unlimited portfolio tracking, e-mail alerts, custom newswires and RSS feeds - and more!
