

Form 10-Q Life360, Inc. For: Jun 30
 Tweet
Tweet Share
ShareUNITED STATES
SECURITIES AND EXCHANGE COMMISSION
Washington, D.C. 20549
______________
FORM 10-Q
QUARTERLY REPORT PURSUANT TO SECTION 13 OR 15(d) OF THE SECURITIES EXCHANGE ACT OF 1934 | |||||
For the quarterly period ended | |||||
OR
TRANSITION REPORT PURSUANT TO SECTION 13 OR 15(d) OF THE SECURITIES EXCHANGE ACT OF 1934 | |||||
For the transition period from __________ to __________ | |||||
Commission File Number 000-56424
(Exact name of registrant as specified in its charter)
(State or other jurisdiction of incorporation or organization) | (I.R.S. Employer Identification No.) | ||||
(Address of principal executive offices) | (Zip Code) | ||||
Tel: (415 ) 484-5244
(Registrant's telephone number, including area code)
Not applicable.
(Former name, former address and former fiscal year, if changed since last report)
Securities registered pursuant to Section 12(b) of the Securities Exchange Act of 1934, as amended (the “Exchange Act”):
| Title of each class | Trading Symbol(s) | Name of each exchange on which registered | ||||||
| None. | None. | None. | ||||||
Indicate by check mark whether the registrant: (1) has filed all reports required to be filed by Section 13 or 15(d) of the Exchange Act during the preceding 12 months (or for such shorter period that the registrant was required to file such reports); and (2) has been subject to such filing requirements for the past 90 days. Yes o No x
Indicate by check mark whether the registrant has submitted electronically and posted on its corporate web site, if any, every Interactive Data File required to be submitted and posted pursuant to Rule 405 of Regulation S-T (§232.405 of this chapter) during the preceding 12 months (or for such shorter period that the registrant was required to submit and post such files). Yes x No o
Indicate by check mark whether the registrant is a large accelerated filer, an accelerated filer, a non-accelerated filer, or a smaller reporting company. See the definitions of “large accelerated filer,” “accelerated filer,” “smaller reporting company” and “emerging growth company” in Rule 12b-2 of the Exchange Act.
| Large accelerated filer | o | Accelerated filer | o | |||||||||||
| x | Smaller reporting company | |||||||||||||
| Emerging growth company | ||||||||||||||
If an emerging growth company, indicate by check mark if the registrant has elected not to use the extended transition period for complying with any new or revised financial accounting standards provided pursuant to Section 13(a) of the Exchange Act. o
Indicate by check mark whether the registrant is a shell company (as defined in Rule 12b-2 of the Exchange Act). Yes o No x
As of August 15, 2022, the registrant had 62,110,448 shares of common stock, par value $0.001 per share, including shares underlying all issued and outstanding Chess Depository Interests (“CDIs”), outstanding.
Life360, Inc.
FORM 10-Q for the Quarter Ended June 30, 2022
Table of Contents
| Page | ||||||||
Forward-Looking Statements
This Quarterly Report on Form 10-Q contains forward-looking statements within the meaning of the Private Securities Litigation Reform Act of 1995. We intend such forward-looking statements to be covered by the safe harbor provisions for forward-looking statements contained in Section 21E of the Exchange Act. These forward-looking statements involve risks and uncertainties regarding, among other things, (a) our projected sales, profitability, and cash flows, (b) our growth strategy, (c) anticipated trends in our industry, (d) our future financing plans, and (e) our anticipated needs for, and use of, working capital. They are generally identifiable by use of the words “may,” “will,” “should,” “anticipate,” “estimate,” “plan,” “potential,” “project,” “continuing,” “ongoing,” “expects,” “management believes,” “we believe,” “we intend,” or the negative of these words or other variations on these words or comparable terminology. We caution you the foregoing list may not contain all of the forward-looking statements made in this Quarterly Report on Form 10-Q. In light of these risks and uncertainties, there can be no assurance that the forward-looking statements contained in this filing will in fact occur. You should not place undue reliance on these forward-looking statements.
The forward-looking statements are not historical facts, but rather are based on current expectations, estimates, assumptions and projections about our industry, business and future financial results. The forward-looking statements speak only as of the date on which they are made, and, except to the extent required by federal securities laws, we undertake no obligation to update any forward-looking statements to reflect events or circumstances after the date on which the statements are made or to reflect the occurrence of unanticipated events. Our actual results could differ materially from the results contemplated by these forward-looking statements due to a number of factors, including those discussed under “Item 1A. Risk Factors” and other sections in this Quarterly Report on Form 10-Q.
Life360, Inc.
PART I - FINANCIAL INFORMATION
Item 1. Financial Statements (unaudited)
Condensed Consolidated Balance Sheets
(unaudited)
(Dollars in U.S. $, in thousands, except share and per share data)
| June 30, 2022 | December 31, 2021 | ||||||||||
| Assets | |||||||||||
| Current Assets: | |||||||||||
| Cash and cash equivalents | $ | $ | |||||||||
| Accounts receivable, net | |||||||||||
| Costs capitalized to obtain contracts, net | |||||||||||
| Inventory | |||||||||||
| Prepaid expenses and other current assets | |||||||||||
| Total current assets | |||||||||||
| Restricted cash | |||||||||||
| Property and equipment, net | |||||||||||
| Costs capitalized to obtain contracts, net of current portion | |||||||||||
| Prepaid expenses and other assets, noncurrent | |||||||||||
| Right-of-use-asset | |||||||||||
| Intangible assets, net | |||||||||||
| Goodwill | |||||||||||
| Total Assets | $ | $ | |||||||||
| Liabilities and Stockholders’ Equity | |||||||||||
| Current Liabilities: | |||||||||||
| Accounts payable | $ | $ | |||||||||
| Accrued expenses and other liabilities | |||||||||||
| Escrow liability | |||||||||||
| Contingent consideration | |||||||||||
Convertible notes, current ($ | |||||||||||
| Deferred revenue, current | |||||||||||
| Total current liabilities | |||||||||||
Convertible notes, noncurrent ($ | |||||||||||
| Derivative liability, noncurrent | |||||||||||
| Deferred revenue, noncurrent | |||||||||||
| Other noncurrent liabilities | |||||||||||
| Total Liabilities | $ | $ | |||||||||
| Commitments and Contingencies (Note 11) | |||||||||||
| Stockholders’ Equity | |||||||||||
Common Stock, $ | |||||||||||
| Additional paid-in capital | |||||||||||
| Notes due from affiliates | ( | ( | |||||||||
| Accumulated deficit | ( | ( | |||||||||
| Accumulated other comprehensive income | |||||||||||
| Total stockholders’ equity | |||||||||||
| Total Liabilities and Stockholders’ Equity | $ | $ | |||||||||
See accompanying notes to the condensed consolidated financial statements (unaudited).
1
Life360, Inc.
Condensed Consolidated Statements of Operations and Comprehensive Loss
(unaudited)
(Dollars in U.S. $, in thousands, except share and per share data)
| Three Months Ended June 30, | Six Months Ended June 30, | ||||||||||||||||||||||
| 2022 | 2021 | 2022 | 2021 | ||||||||||||||||||||
| Subscription revenue | $ | $ | $ | $ | |||||||||||||||||||
| Hardware revenue | |||||||||||||||||||||||
| Other revenue | |||||||||||||||||||||||
| Total revenue | |||||||||||||||||||||||
| Cost of subscription revenue | |||||||||||||||||||||||
| Cost of hardware revenue | |||||||||||||||||||||||
| Cost of other revenue | |||||||||||||||||||||||
| Total cost of revenue | |||||||||||||||||||||||
| Gross Profit | |||||||||||||||||||||||
| Operating expenses: | |||||||||||||||||||||||
| Research and development | |||||||||||||||||||||||
| Sales and marketing | |||||||||||||||||||||||
| General and administrative | |||||||||||||||||||||||
| Total operating expenses | |||||||||||||||||||||||
| Loss from operations | ( | ( | ( | ( | |||||||||||||||||||
| Other income (expense): | |||||||||||||||||||||||
| Convertible notes fair value adjustment | |||||||||||||||||||||||
| Derivative liability fair value adjustment | |||||||||||||||||||||||
| Other income (expense), net | ( | ( | |||||||||||||||||||||
| Total other income (expense), net | |||||||||||||||||||||||
| Loss before income taxes | ( | ( | ( | ( | |||||||||||||||||||
| Provision (benefit) for income taxes | ( | ||||||||||||||||||||||
| Net Loss | $ | ( | $ | ( | $ | ( | $ | ( | |||||||||||||||
| Net loss per share, basic and diluted | $ | ( | $ | ( | $ | ( | $ | ( | |||||||||||||||
| Weighted-average shares used in computing net loss per share, basic and diluted | |||||||||||||||||||||||
| Comprehensive loss | |||||||||||||||||||||||
| Net loss | ( | ( | ( | ( | |||||||||||||||||||
| Change in foreign currency translation adjustment | ( | ||||||||||||||||||||||
| Total comprehensive loss | $ | ( | $ | ( | $ | ( | $ | ( | |||||||||||||||
See accompanying notes to the condensed consolidated financial statements (unaudited)
2
Life360, Inc.
Condensed Consolidated Statements of Stockholders’ Equity
(unaudited)
(Dollars in U.S. $, in thousands, except share and per share data)
| Common Stock | Additional Paid-In Capital | Notes Due from Affiliates | Accumulated Deficit | Accumulated Other Comprehensive Income | Total Stockholders’ Equity | ||||||||||||||||||||||||||||||||||||
| Shares | Amount | ||||||||||||||||||||||||||||||||||||||||
| Balance at December 31, 2021 | $ | $ | $ | ( | $ | ( | $ | $ | |||||||||||||||||||||||||||||||||
| Exercise of stock options | — | — | — | — | |||||||||||||||||||||||||||||||||||||
| Exercise of warrants | — | — | — | — | — | — | |||||||||||||||||||||||||||||||||||
| Vesting of restricted stock units | — | — | — | — | — | — | |||||||||||||||||||||||||||||||||||
| Taxes paid related to net settlement of equity awards | — | — | ( | — | — | — | ( | ||||||||||||||||||||||||||||||||||
| Issuance of common stock in connection with an acquisition | — | — | — | ||||||||||||||||||||||||||||||||||||||
| Issuance of common stock | — | — | — | — | — | ||||||||||||||||||||||||||||||||||||
| Stock-based compensation expense | — | — | — | — | — | ||||||||||||||||||||||||||||||||||||
| Interest accrued relating to notes due from affiliates | — | — | — | ( | — | — | ( | ||||||||||||||||||||||||||||||||||
| Net loss | — | — | — | — | ( | — | ( | ||||||||||||||||||||||||||||||||||
| Change in foreign currency translation adjustment | — | — | — | — | — | ||||||||||||||||||||||||||||||||||||
| Balance at March 31, 2022 | $ | $ | $ | ( | $ | ( | $ | $ | |||||||||||||||||||||||||||||||||
| Exercise of stock options | — | — | — | — | |||||||||||||||||||||||||||||||||||||
| Exercise of warrants | — | — | — | — | |||||||||||||||||||||||||||||||||||||
| Vesting of restricted stock units | — | — | — | — | — | — | |||||||||||||||||||||||||||||||||||
| Taxes paid related to net settlement of equity awards | — | — | ( | — | — | — | ( | ||||||||||||||||||||||||||||||||||
| Stock-based compensation expense | — | — | — | — | — | ||||||||||||||||||||||||||||||||||||
| Interest accrued relating to notes due from affiliates | — | — | — | ( | — | — | ( | ||||||||||||||||||||||||||||||||||
| Repayment of notes due from affiliates | — | — | — | — | |||||||||||||||||||||||||||||||||||||
| Issuance of common stock in settlement of contingent consideration | — | — | — | — | |||||||||||||||||||||||||||||||||||||
| Net loss | — | — | — | — | ( | — | ( | ||||||||||||||||||||||||||||||||||
| Change in foreign currency translation adjustment | — | — | — | — | — | ( | ( | ||||||||||||||||||||||||||||||||||
| Balance at June 30, 2022 | $ | $ | $ | ( | $ | ( | $ | $ | |||||||||||||||||||||||||||||||||
3
Life360, Inc.
Condensed Consolidated Statements of Stockholders’ Equity
(unaudited)
(Dollars in U.S. $, in thousands, except share and per share data)
| Common Stock | Additional Paid-In Capital | Notes Due from Affiliates | Accumulated Deficit | Total Stockholders’ Equity | |||||||||||||||||||||||||||||||
| Shares | Amount | ||||||||||||||||||||||||||||||||||
| Balance at December 31, 2020 | $ | $ | $ | ( | $ | ( | $ | ||||||||||||||||||||||||||||
| Exercise of stock options | — | — | — | ||||||||||||||||||||||||||||||||
| Vesting of restricted stock units | — | — | — | — | — | ||||||||||||||||||||||||||||||
| Taxes paid related to net settlement of equity awards | — | — | ( | — | — | ( | |||||||||||||||||||||||||||||
| Stock-based compensation expense | — | — | — | — | |||||||||||||||||||||||||||||||
| Interest accrued relating to notes due from affiliates | — | — | — | ( | — | ( | |||||||||||||||||||||||||||||
| Net loss | — | — | — | — | ( | ( | |||||||||||||||||||||||||||||
| Balance at March 31, 2021 | $ | $ | $ | ( | $ | ( | $ | ||||||||||||||||||||||||||||
| Exercise of stock options | — | — | — | ||||||||||||||||||||||||||||||||
| Vesting of restricted stock units | — | — | — | — | — | ||||||||||||||||||||||||||||||
| Taxes paid related to net settlement of equity awards | — | — | ( | — | — | ( | |||||||||||||||||||||||||||||
| Stock-based compensation expense | — | — | — | — | |||||||||||||||||||||||||||||||
| Interest accrued relating to notes due from affiliates | — | — | — | ( | — | ( | |||||||||||||||||||||||||||||
| Net loss | — | — | — | — | ( | ( | |||||||||||||||||||||||||||||
| Balance at June 30, 2021 | $ | $ | $ | ( | $ | ( | $ | ||||||||||||||||||||||||||||
See accompanying notes to the condensed consolidated financial statements (unaudited)
4
Life360, Inc.
Condensed Consolidated Statements of Cash Flows
(unaudited)
(Dollars in U.S. $, in thousands)
| Six months ended | |||||||||||
| June 30, 2022 | June 30, 2021 | ||||||||||
| Cash Flows from Operating Activities: | |||||||||||
| Net loss | $ | ( | $ | ( | |||||||
| Adjustments to reconcile net loss to net cash used in operating activities: | |||||||||||
| Depreciation and amortization | |||||||||||
| Amortization of costs capitalized to obtain contracts | |||||||||||
| Stock-based compensation expense | |||||||||||
| Compensation expense in connection with revesting notes (Note 7) | ( | ||||||||||
| Noncash interest (income) expense, net | ( | ||||||||||
| Convertible notes fair value adjustment | ( | ||||||||||
| Derivative liability fair value adjustment | ( | ||||||||||
| Gain on revaluation of contingent consideration | ( | ||||||||||
| Noncash revenue from affiliate | ( | ||||||||||
| Changes in operating assets and liabilities: | |||||||||||
| Accounts receivable, net | ( | ||||||||||
| Prepaid expenses and other assets | |||||||||||
| Inventory | ( | ||||||||||
| Costs capitalized to obtain contracts, net | ( | ( | |||||||||
| Accounts payable | ( | ( | |||||||||
| Accrued expenses and other liabilities | ( | ||||||||||
| Deferred revenue | |||||||||||
| Other noncurrent liabilities | ( | ||||||||||
| Net cash used in operating activities | ( | ( | |||||||||
| Cash Flows from Investing Activities: | |||||||||||
| Cash paid for acquisition, net of cash acquired | ( | ||||||||||
| Internal use software | ( | ||||||||||
| Cash advance on convertible note receivable | ( | ||||||||||
| Net cash used in investing activities | ( | ( | |||||||||
| Cash Flows from Financing Activities: | |||||||||||
| Proceeds from the exercise of options | |||||||||||
| Taxes paid related to net settlement of equity awards | ( | ( | |||||||||
| Issuance of common stock | |||||||||||
| Cash paid for deferred offering costs | ( | ||||||||||
| Proceeds from repayment of notes due from affiliates | |||||||||||
| Cash received in advance of the issuance of convertible notes | |||||||||||
| Net cash provided by financing activities | |||||||||||
| Net Decrease in Cash, Cash Equivalents, and Restricted Cash | ( | ( | |||||||||
| Cash, Cash Equivalents and Restricted Cash at the Beginning of the Period | |||||||||||
| Cash, Cash Equivalents, and Restricted Cash at the End of the Period | $ | $ | |||||||||
| Non-cash investing and financing activities: | |||||||||||
| Fair value of stock issued in connection with an acquisition | $ | $ | |||||||||
| Fair value of warrants held as investment in affiliate | |||||||||||
| Fair value of stock issued in settlement of contingent consideration | |||||||||||
| Total non-cash investing and financing activities: | $ | $ | |||||||||
5
Life360, Inc.
The following table provides a table of cash, cash equivalents, and restricted cash reported within the balance sheets totaling the same such amounts shown above:
| June 30, 2022 | June 30, 2021 | ||||||||||
| Cash and cash equivalents | $ | $ | |||||||||
| Restricted cash | |||||||||||
| Total cash, cash equivalents, and restricted cash | $ | $ | |||||||||
See accompanying notes to the condensed consolidated financial statements (unaudited).
6
Life360, Inc.
Notes to Condensed Consolidated Financial Statements (Unaudited)
| (Information as of June 30, 2022 and for the three and six months ended June 30, 2022 and 2021 is unaudited) | ||
1. Nature of Business
2. Summary of Significant Accounting Policies
Basis of Presentation and Consolidation
In management’s opinion, the condensed consolidated financial statements include all adjustments necessary to fairly state the Company’s financial position. The information contained within the condensed consolidated financial statements should be read in conjunction with the Company's consolidated financial statements and notes thereto included in the Company’s annual financial statements for the year ended December 31, 2021.
Recently adopted accounting pronouncements
In October 2021, the FASB issued ASU 2021-08, Business Combinations (Topic 805), Accounting for Contract Assets and Contract Liabilities from Contracts with Customers, which requires contract assets and contract liabilities (i.e., deferred revenue) acquired in a business combination to be recognized and measured by the acquirer on the acquisition date in accordance with ASC 606, Revenue from Contracts with Customers. The guidance should be applied prospectively to acquisitions occurring on or after the effective date. The guidance is effective for the Company beginning January 1, 2024,
7
Life360, Inc.
Notes to Condensed Consolidated Financial Statements (Unaudited)
| (Information as of June 30, 2022 and for the three and six months ended June 30, 2022 and 2021 is unaudited) | ||
and interim periods therein. Early adoption is permitted, including in interim periods, for any financial statements that have not yet been issued. The Company elected to early adopt ASU 2021-08 on September 1, 2021, and the Company has recorded the acquired deferred revenue based on historical carrying value rather than fair value in the condensed consolidated financial statements and related disclosures.
In December 2019, the FASB issued ASU No. 2019-12, Simplifying the Accounting for Income Taxes (“ASU 2019-12”), as part of its initiative to reduce complexity in accounting standards. ASU 2019-12 removes the following exceptions: exception to the incremental approach for intraperiod tax allocation; exception to accounting for basis differences when there are ownership changes in foreign investments; and exception to interim period tax accounting for year-to-date losses that exceed anticipated losses. ASU 2019-12 also improves financial reporting for franchise taxes that are partially based on income; transactions with a government that result in a step up in the tax basis of goodwill; separate financial statements of legal entities that are not subject to tax; and enacted changes in tax laws in interim periods. ASU 2019-12 is effective for public business entities in fiscal years beginning after December 15, 2020, including interim periods within those fiscal years. For all other entities, the standard is effective in fiscal years beginning after December 15, 2021, and interim periods within fiscal years beginning after December 15, 2022. Early adoption of the standard is permitted, including adoption in interim or annual periods for which financial statements have not yet been issued. On January 1, 2021, the Company adopted ASU 2019-12, and the standard did not have a material impact on its condensed consolidated financial statements and related disclosures.
Accounting pronouncements not yet adopted
In June 2016, the FASB issued ASU 2016-13, Financial Instruments – Credit Losses: Measurement of Credit Losses on Financial Instruments, which changes the existing incurred loss impairment model for financial assets held at amortized cost. The new model uses a forward-looking expected loss method to calculate credit loss estimates. These changes will result in earlier recognition of credit losses. In March 2022, the FASB issued ASU 2022-02, Financial Instruments – Credit Losses: Troubled Debt Restructurings and Vintage Disclosures, which updates accounting guidance for troubled debt restructurings by creditors and enhances disclosure requirements for certain loan refinancing and restructurings by creditors when a borrower is experiencing financial difficulty. Additionally, the amendments require an entity to disclose gross write-offs by year of origination for financing receivables. The amendments included within ASU 2022-02 become effective after the adoption of ASU 2016-13, which becomes effective for the Company on January 1, 2023 with early adoption permitted. The Company is currently evaluating the impact of the adoption of ASU 2016-13 and ASU 2022-02 on its condensed consolidated financial statements and related disclosures and does not expect a material impact.
Revenue Recognition
The Company recognizes revenue upon transfer of control of promised goods or services to customers at transaction price, an amount that reflects the consideration the Company expects to receive in exchange for those goods or services. Transaction price is calculated as selling price net of variable consideration which may include estimates for future returns
8
Life360, Inc.
Notes to Condensed Consolidated Financial Statements (Unaudited)
| (Information as of June 30, 2022 and for the three and six months ended June 30, 2022 and 2021 is unaudited) | ||
and sales incentives related to current period revenue. The Company determines revenue recognition through the following steps: (i) identify the contract(s) with a customer; (ii) identify the performance obligations in the contract; (iii) determine the transaction price; (iv) allocate the transaction price to the performance obligations in the contract; and (v) recognize revenue when (or as) the Company satisfies a performance obligation. The Company only applies the five-step model to contracts when it is probable that the Company will collect the consideration it is entitled to in exchange for the goods or services it transfers to the customer.
Performance Obligations
Some of the Company’s contracts with customers contain multiple performance obligations, primarily hardware and subscription services for the Tile and Jiobit hardware tracking devices. For these contracts, the Company accounts for individual performance obligations separately if they are distinct. The transaction price is allocated to the separate performance obligations on a relative stand-alone selling price (“SSP”) basis with the amounts allocated to ongoing services deferred and recognized over a period of time and amounts allocated to hardware tracking devices recognized at a point-in time with a portion of the consideration being allocated to application usage (maintenance) and support. The Company determines SSP based on observable, if available, prices for those related goods and services when sold separately. When such observable prices are not available, the Company determines SSP based on overarching pricing objectives and strategies, taking into consideration market conditions and other factors, including customer size, volume purchased, market and industry conditions, product-specific factors, and historical sales of the deliverables.
For hardware products, the Company generally offers a limited warranty to end-users covering a period of twelve months for products and obligates the Company to repair or replace products for manufacturing defects or hardware component failures. The warranty is not sold separately and does not represent a separate performance obligation. Therefore, such warranties are accounted for under ASC 460, Guarantees, and the estimated costs of warranty claims are generally accrued as cost of revenue in the period the related revenue is recorded. See Note 11 “Commitments and Contingencies” for further details.
Variable Consideration
The Company recognizes hardware revenue at the net sales price, which includes certain estimates for variable consideration with our customers. The Company’s variable consideration is primarily in the form of promotional agreements and marketing development fund agreements in relation to the hardware tracking devices.
These agreements are designed to enhance the sale of the Company’s products and consist of incentives to the Company’s customers. The Company estimates variable considerations using the expected value method. All forms of variable consideration are recorded as contra-revenue and a corresponding liability in its condensed consolidated balance sheet. Certain agreements are estimates at period end due to the nature of the incentives or expected and yet-to-be announced incentive programs that apply to current period revenue transactions. These estimates are based on the Company’s incentive program experience, historical and projected sales data and current contractual terms. The remaining portion of this liability is based on contractual amounts and does not require estimation.
Subscription Revenue
The Company’s subscription revenue includes related support and is comprised of Life360 mobile application subscriptions as well as subscription service plans for the Tile and Jiobit hardware tracking devices. The Company’s subscription contracts with customers are established at the point of mobile application download and purchase as indicated through acceptance of the Company’s Standard Service Terms.
The cloud-based subscriptions are considered single combined performance obligations, consisting of multiple features that can be purchased separately, but which are bundled together and delivered to the customer as a combined output. The Company provides its customers with technical support along with unspecified updates and upgrades to the platform on an if and when available basis.
9
Life360, Inc.
Notes to Condensed Consolidated Financial Statements (Unaudited)
| (Information as of June 30, 2022 and for the three and six months ended June 30, 2022 and 2021 is unaudited) | ||
The subscription service plan for the Tile and Jiobit hardware tracking device is a distinct and separate performance obligation from the hardware. Subscription fees are fixed and recognized on a straight-line basis over the non-cancellable contractual term of the agreement, generally beginning on the date that the Company’s service is made available to the customer.
Subscription revenue was $36.0 million and $19.2 million for the three months ended June 30, 2022 and 2021, respectively, and $69.1 million and $36.4 million for the six months ended June 30, 2022 and 2021, respectively.
Hardware Revenue
The Company derives hardware revenue from sale of the Tile and Jiobit hardware tracking devices and related accessories. For hardware and accessories, revenue is recognized at the time products are delivered. The Company offers limited rights of return and estimates reserves based on historical experience and records the reserves as a reduction of revenue and an accrued liability. Amounts billed to customers for shipping and handling are classified as revenue, and the Company’s related shipping and handling costs incurred are classified as cost of revenue. The customers are billed upon shipment of the hardware tracking devices. Sales taxes collected from customers and remitted to respective governmental authorities are recorded as liabilities and are not included in revenue.
The Company’s hardware and the embedded operating system are one distinct performance obligation and separate from the subscription service plans for the Tile and Jiobit hardware tracking device. The Company’s embedded operating system is a component of the hardware that is integral to the functionality of the hardware and only together produce the essential functionality of the hardware. The Company offers extended warranties and hardware protection plans that are recognized over the contractual service period (typically 1 to 2 years).
Hardware revenue was $6.8 million and $0 for the three months ended June 30, 2022 and 2021, respectively, and $16.5 million and $0 for the six months ended June 30, 2022 and 2021, respectively.
Other Revenue
Other revenue consists primarily of data revenue and partnership revenue. For the six months ended June 30, 2022, the Company’s data revenue is comprised of Life360 data monetization arrangements with certain third parties established through Data Master Service Agreements (collectively, “Data MSAs”), which outline specific terms governing the access and use of data and related fees. The Company determines a contract to exist upon the mutual execution of a Data MSA. Those customers historically had ability to access certain portions of the Company’s user data over the contract term, in which certain customers pay a fee based on average active monthly users. Most of the Company’s Data MSAs have been terminated as of June 30, 2022 as the Company has moved toward an aggregate data sales model.
The transaction price is determined based on the consideration to which the Company expects to be entitled in exchange for transferring data to the customer. The Company estimates and includes variable consideration in the transaction price at contract inception to the extent it is probable that a significant reversal in the amount of cumulative revenue recognized will not occur when the uncertainty associated with the variable consideration is subsequently resolved. In estimating variable consideration in data arrangements, the Company considers historical experience and other external factors that may impact the expectation of future data usage. At each reporting period, the Company assesses actual and expected data usage that will be earned for the duration of the contract term. The payment terms for Data MSAs are monthly.
The Company recognizes fees for certain data arrangements over time based on the fee per average active monthly user as the customer simultaneously receives and consumes the benefit of the services that the Company provides over the term of the agreement.
In January 2022, Life360 announced a new partnership agreement with Placer.ai (“Placer”), a prominent provider of aggregated analytics for the retail ecosystem, in which executives of the Company have an immaterial ownership interest through a passive investment vehicle. As part of this partnership, Placer will provide data processing and analytics services to Life360 and will have the right to commercialize aggregated data related to place visits during the term of the agreement. This partnership marked the beginning of Life360’s exit from its legacy data sales model and transition to commercialize
10
Life360, Inc.
Notes to Condensed Consolidated Financial Statements (Unaudited)
| (Information as of June 30, 2022 and for the three and six months ended June 30, 2022 and 2021 is unaudited) | ||
solely aggregated data, while still providing members the option to opt out of even aggregated data sales. In keeping with the Company’s vision and consistent with that aggregated data sales model, the Company is exploring ways, in the future, to enable members to avail themselves of compelling offers and opportunities by enabling Company partners to use their data with members’ explicit, affirmative opt-in consent. The Placer agreement includes fixed monthly revenue amounts for access to aggregated data for the duration of the three-year agreement. The Company has a stand ready obligation to provide aggregated user data over the term of the agreement and recognizes revenue ratably based on the fixed monthly amounts. The Company estimates and includes variable consideration in the transaction price at contract inception to the extent it is probable that a significant reversal in the amount of cumulative revenue recognized will not occur when the uncertainty associated with the variable consideration is subsequently resolved.
In connection with the agreement, Placer issued the Company a warrant to purchase up to 5,100,167 shares of Series C Preferred Stock at an exercise price of $4.90 per share. The grant of the warrant is considered noncash consideration, which the Company measured at fair value on the date of issuance. The warrant was valued using an option pricing model, and the fair value of approximately $5.4 million, has been included as part of the transaction price of the Placer data partnership agreement, and will be included in prepaid expenses and other assets, noncurrent on the Company’s condensed consolidated balance sheets.
Data revenue was $5.0 million and $4.3 million for the three months ended June 30, 2022 and 2021, respectively, and $12.2 million and $8.6 million for the six months ended June 30, 2022 and 2021, respectively.
Partnership revenue includes agreements with third parties to provide access to advertising on the Company’s mobile platform. The Company receives a percentage of the advertising spend as a fee, which is recognized as revenue on a net basis. The variable amounts earned under partnership revenue arrangements are allocable to the month in which the advertising is placed, which is reset on a monthly basis. As such, the Company will recognize revenue monthly based on the advertising placed.
Partnership revenue was $1.0 million and $1.5 million for the three months ended June 30, 2022 and 2021, respectively, and $2.1 million and $3.0 million for the six months ended June 30, 2022 and 2021, respectively.
Remaining Performance Obligations
Remaining performance obligations represent the amount of contracted future revenue not yet recognized as the amounts relate to undelivered performance obligations, including both deferred revenue and non-cancelable contracted amounts that will be invoiced and recognized as revenue in future periods. Revenue allocated to remaining performance obligations was $28.3 million as of June 30, 2022, of which the Company expects $24.8 million to be recognized over the next twelve months .
Cost of Revenue
Cost of subscription revenue includes all direct costs to deliver the Company’s subscription services. These costs include personnel-related costs associated with our cloud-based infrastructure and our customer support organization, third-party hosting fees, software, and maintenance costs, outside services associated with the delivery of our subscription services, personnel-related expenses, travel-related costs, amortization of acquired intangibles and allocated overhead, such as facilities, including rent, utilities, depreciation on equipment shared by all departments, credit card and transaction processing fees, and shared information technology costs. Personnel-related expenses include salaries, bonuses, benefits, and stock-based compensation for operations personnel.
Cost of hardware revenue consists of product costs, including hardware production, contract manufacturers for production, shipping and handling, packaging, fulfillment, personnel-related expenses, manufacturing and equipment depreciation, warehousing, tariff costs, hosting, app fees, customer support costs, warranty replacement, and write-downs of excess and obsolete inventory. Personnel-related expenses include salaries, bonuses, benefits, and stock-based compensation for operations personnel.
11
Life360, Inc.
Notes to Condensed Consolidated Financial Statements (Unaudited)
| (Information as of June 30, 2022 and for the three and six months ended June 30, 2022 and 2021 is unaudited) | ||
Inventory and Contract Manufacturing
Inventory is comprised of raw materials and finished goods related to the Tile and Jiobit hardware tracking devices and accessories. Inventory is stated at the lower of cost or net realizable value on a weighted average basis. The Company assesses the valuation of inventory and periodically writes down the value for estimated excess and obsolete inventory based upon estimates of future demand and market conditions. The Company’s inventory is held at third party warehouses and contract manufacturer premises.
Significant Risks and Uncertainties
The Company’s business, operations, and financial results are subject to various risks and uncertainties including adverse global economic conditions, such as the coronavirus (COVID-19) pandemic, and competition in our industry that could adversely affect our business, financial conditions, results of operations and cash flows. These important factors, among others, could cause our actual results to differ materially from any future results.
The Company’s customers primarily consist of individual consumers, who subscribe to the Company’s product offerings through market exchanges operated by channel partners, data revenue customers and retail partners, who purchase hardware tracking devices from the Company and resell them directly to individual consumers. Any changes in customer preferences and trends or changes in terms of use of channel partners’ platforms could have an adverse impact on its results of operations and financial condition.
12
Life360, Inc.
Notes to Condensed Consolidated Financial Statements (Unaudited)
| (Information as of June 30, 2022 and for the three and six months ended June 30, 2022 and 2021 is unaudited) | ||
The following tables set forth the information about our channel and retail partners who represented greater than 10% of our revenue or accounts receivable, respectively:
| Percentage of Revenue | |||||||||||||||||||||||
| Three Months Ended June 30, | Six Months Ended June 30, | ||||||||||||||||||||||
| 2022 | 2021 | 2022 | 2021 | ||||||||||||||||||||
| Channel Partner A | % | % | % | % | |||||||||||||||||||
| Channel Partner B | % | % | % | % | |||||||||||||||||||
| Retail Partner A | % | * | % | * | |||||||||||||||||||
* Represents less than 10%
| Percentage of Gross Accounts Receivable | |||||||||||
| As of June 30, | As of December 31, | ||||||||||
| 2022 | 2021 | ||||||||||
| Channel Partner A | % | % | |||||||||
| Channel Partner B | % | % | |||||||||
| Data Partner A | % | * | |||||||||
| Retail Partner A | % | * | |||||||||
13
Life360, Inc.
Notes to Condensed Consolidated Financial Statements (Unaudited)
| (Information as of June 30, 2022 and for the three and six months ended June 30, 2022 and 2021 is unaudited) | ||
Fair Value of Financial Instruments
The Company uses fair value measurements to record fair value adjustments to certain financial and non-financial assets and liabilities to determine fair value disclosures. The accounting standards define fair value, establish a framework for measuring fair value, and require disclosures about fair value measurements. Fair value is defined as the price that would be received from selling an asset or paid to transfer a liability in an orderly transaction between market participants at the measurement date. When determining the fair value measurements for assets and liabilities required to be recorded at fair value, the principal or most advantageous market in which the Company would transact are considered along with assumptions that market participants would use when pricing the asset or liability, such as inherent risk, transfer restrictions, and risk of nonperformance. The accounting standard for fair value establishes a fair value hierarchy based on three levels of inputs, the first two of which are considered observable and the last unobservable, that requires an entity to maximize the use of observable inputs and minimize the use of unobservable inputs when measuring fair value. A financial instrument’s categorization within the fair value hierarchy is based upon the lowest level of input that is significant to the fair value measurement.
The three levels of Inputs that may be used to measure fair value are as follows:
Level 1 – Observable inputs, such as quoted prices in active markets for identical assets or liabilities.
Level 2 – Observable inputs other than Level 1 prices, such as quoted prices for similar assets or liabilities, or other inputs that are observable or can be corroborated by observable market data for substantially the full term of the assets or liabilities.
Level 3 – Valuations based on unobservable inputs to the valuation methodology and including data about assumptions market participants would use in pricing the asset or liability based on the best information available under the circumstances.
Property and Equipment, net
Property and equipment are stated at cost less accumulated depreciation and amortization. Depreciation is computed using the straight-line method over the estimated useful lives of the respective assets. Equipment, computer software, furniture, and product manufacturing equipment have estimated useful lives ranging from to ten years . Leasehold improvements are amortized on a straight-line basis over the lesser of the estimated useful life or the term of the lease with expected renewals. As of June 30, 2022, all leasehold improvements are amortized over three years .
14
Life360, Inc.
Notes to Condensed Consolidated Financial Statements (Unaudited)
| (Information as of June 30, 2022 and for the three and six months ended June 30, 2022 and 2021 is unaudited) | ||
Lease Obligations
Operating lease right-of-use assets and lease liabilities are recognized at the present value of the future lease payments at commencement date. The interest rate implicit in the Company’s operating leases is not readily determinable, and therefore an incremental borrowing rate is estimated to determine the present value of future payments. The estimated incremental borrowing rate factors in a hypothetical interest rate on a collateralized basis with similar terms, payments, and economic environments. Operating lease right-of-use assets also include any prepaid lease payments and lease incentives.
Certain of the operating lease agreements contain rent concession, rent escalation, and option to renew provisions. Rent concession and rent escalation provisions are considered in determining the straight-line single lease cost to be recorded over the lease term. Single lease cost is recognized on a straight-line basis over the lease term commencing on the date the Company has the right to use the leased property. The lease terms may include options to extend or terminate the lease. The Company generally uses the base, non-cancellable, lease term when recognizing the lease assets and liabilities, unless it is reasonably certain that the renewal option will be exercised.
15
Life360, Inc.
Notes to Condensed Consolidated Financial Statements (Unaudited)
| (Information as of June 30, 2022 and for the three and six months ended June 30, 2022 and 2021 is unaudited) | ||
Impairment of Long-Lived Assets
The Company assesses the impairment of long-lived assets, such as property and equipment subject to depreciation and acquired intangibles subject to amortization, when events or changes in circumstances indicate that their carrying amount may not be recoverable. Recoverability of assets to be held and used is measured by a comparison of the carrying amount of an asset to the estimated undiscounted future cash flows expected to be generated by the asset. If the carrying amount of an asset exceeds its estimated future cash flows, an impairment charge is recognized in the amount by which the carrying amount of the asset exceeds the fair value of the asset.
Common Stock Warrants
The Company has issued freestanding warrants to purchase shares of common stock in connection with certain debt financing transactions. The warrants are recorded as equity instruments at the grant date fair value using the Black-Scholes option pricing model and are not subject to revaluation at each balance sheet date.
Stock-Based Compensation
The Company has an equity incentive plan under which various types of equity-based awards including, but not limited to, incentive stock options, non-qualified stock options, restricted stock units, and restricted stock awards, may be granted to employees, nonemployee directors, and nonemployee consultants.
16
Life360, Inc.
Notes to Condensed Consolidated Financial Statements (Unaudited)
| (Information as of June 30, 2022 and for the three and six months ended June 30, 2022 and 2021 is unaudited) | ||
For all equity awards granted to employees, nonemployees and directors, the Company recognizes compensation expense based on the grant-date estimated fair values. The fair value of stock options is determined using the Black-Scholes option pricing model. For restricted stock units and restricted stock awards, the fair value is based on the grant date fair value of the award. The Company recognizes compensation expense for stock option awards, restricted stock units, and restricted stock awards on a straight-line basis over the requisite service period of the award, generally to four years . Forfeitures are recorded as they occur.
In 2020, the Company granted a market performance award to an executive that is subject to time-based vesting requirements in which vesting is contingent upon the Company’s achievement of certain market performance goals. The fair value of such performance awards was determined using a Monte Carlo simulation and is recognized under the accelerated attribution method over a four year period.
Income Taxes
The Company accounts for income taxes under the asset and liability method. The Company estimates actual current tax exposure together with assessing temporary differences resulting from differences in accounting for reporting purposes and tax purposes for certain items, such as accruals and allowances not currently deductible for tax purposes. These temporary differences result in deferred tax assets and liabilities, which are included in the Company’s balance sheets. In general, deferred tax assets represent future tax benefits to be received when certain expenses previously recognized in the Company’s statements of operations and comprehensive loss become deductible expenses under applicable income tax laws or when net operating loss or credit carryforwards are utilized. Accordingly, realization of the Company’s deferred tax assets is dependent on future taxable income against which these deductions, losses and credits can be utilized.
The Company must assess the likelihood that the Company’s deferred tax assets will be recovered from future taxable income, and to the extent the Company believes that recovery is not likely, the Company establishes a valuation allowance. The assessment of whether a valuation allowance is required often requires significant judgment including current and historical operating results, the forecast of future taxable income and on-going prudent and feasible tax planning initiatives.
17
Life360, Inc.
Notes to Condensed Consolidated Financial Statements (Unaudited)
| (Information as of June 30, 2022 and for the three and six months ended June 30, 2022 and 2021 is unaudited) | ||
Net Loss Per Share
The Company computes basic and diluted net loss per share in conformity with ASC 260, “Earnings per Share.” Basic net loss per share is calculated by dividing the net loss by the weighted-average number of shares of common stock outstanding during the period without consideration for potentially dilutive securities as they do not share in losses. The diluted net loss per share is computed giving effect to all potential dilutive common stock equivalents outstanding for the period. For purposes of this calculation, options to purchase common stock, common stock warrants, common stock convertible notes, and unvested restricted stock units are considered common stock equivalents but have been excluded from the calculation of diluted net loss per share as the effect is antidilutive.
3. Revenue
Revenue by geography is generally based on the address of the customer as defined in the contract with the customer. The following table sets forth revenue by geographic area (in thousands):
| Three Months Ended June 30, | Six Months Ended June 30, | ||||||||||||||||||||||
| 2022 | 2021 | 2022 | 2021 | ||||||||||||||||||||
| North America | $ | $ | $ | $ | |||||||||||||||||||
| Europe, Middle East and Africa | |||||||||||||||||||||||
| Other international regions | |||||||||||||||||||||||
| Total revenue | $ | $ | $ | $ | |||||||||||||||||||
4. Deferred Revenue
Deferred revenue, which is a contract liability, consists primarily of payments received and accounts receivable recorded in advance of revenue recognition under the Company’s contracts with customers and is recognized as the revenue recognition criteria are met.
The following table represents a roll forward of the Company’s deferred revenue (in thousands):
| Subscription revenue | Hardware revenue | Other revenue | Total | ||||||||||||||||||||
| Beginning balance as of December 31, 2021 | $ | $ | $ | $ | |||||||||||||||||||
| Acquired deferred revenue | |||||||||||||||||||||||
| Additions to deferred revenue | |||||||||||||||||||||||
| Recognized revenue in the period | ( | ( | ( | ( | |||||||||||||||||||
| Ending balance as of June 30, 2022 | $ | $ | $ | $ | |||||||||||||||||||
| Subscription revenue | Other revenue | Total | |||||||||||||||
| Beginning balance as of December 31, 2020 | $ | $ | $ | ||||||||||||||
| Additions to deferred revenue | |||||||||||||||||
| Recognized revenue in the period | ( | ( | ( | ||||||||||||||
| Ending balance as of June 30, 2021 | $ | $ | $ | ||||||||||||||
18
Life360, Inc.
Notes to Condensed Consolidated Financial Statements (Unaudited)
| (Information as of June 30, 2022 and for the three and six months ended June 30, 2022 and 2021 is unaudited) | ||
5. Costs Capitalized to Obtain Contracts
The Company recognizes as an asset the incremental costs of obtaining a contract with a customer if the entity expects to recover those costs. The Company determined that its costs to obtain contracts were both direct and incremental. These costs are attributable to the Company’s largest channel partners.
Renewal contracts are considered non-commensurate with new contracts as the Company pays a different commission rate for renewals. Accordingly, the guidance requires that specifically anticipated renewal periods should be taken into consideration in determining the required amortization period. Specifically, under the guidance of ASC 340-40, the Company is required to estimate the specifically anticipated renewals after the initial contract to which the initial commission asset relates. The total amortization period is then equal to the initial contractual term plus all specifically anticipated renewals that relate to the initial commission asset. Based upon its assessment of historical data and other factors, the Company concluded that its average customer life was approximately to three years depending on the subscription type, which is used as the amortization period for all capitalized contract acquisition costs for that subscription type.
The following table represents a roll forward of the Company’s costs capitalized to obtain contracts, net (in thousands):
| Beginning balance as of December 31, 2021 | $ | ||||
| Acquired costs capitalized to obtain contracts | |||||
| Additions to costs capitalized to obtain contracts | |||||
| Amortization of deferred commissions | ( | ||||
| Ending balance as of June 30, 2022 | $ | ||||
| Costs capitalized to obtain contracts, current | $ | ||||
| Costs capitalized to obtain contracts, net of current | |||||
| Total costs capitalized to obtain contracts as of June 30, 2022 | $ | ||||
| Beginning balance as of December 31, 2020 | |||||
| Additions to costs capitalized to obtain contracts | |||||
| Amortization of deferred commissions | ( | ||||
| Ending balance as of June 30, 2021 | $ | ||||
| Costs capitalized to obtain contracts, current | |||||
| Costs capitalized to obtain contracts, net of current | |||||
| Total costs capitalized to obtain contracts as of June 30, 2021 | $ | ||||
6. Fair Value Measurements
19
Life360, Inc.
Notes to Condensed Consolidated Financial Statements (Unaudited)
| (Information as of June 30, 2022 and for the three and six months ended June 30, 2022 and 2021 is unaudited) | ||
The fair value of these instruments as of June 30, 2022 and December 31, 2021 are classified as follows (in thousands):
| As of June 30, 2022 | |||||||||||||||||||||||
| Level 1 | Level 2 | Level 3 | Total | ||||||||||||||||||||
| Liabilities: | |||||||||||||||||||||||
| Derivative liability | $ | $ | $ | $ | |||||||||||||||||||
| Convertible notes (Note 9) | |||||||||||||||||||||||
| Total | $ | $ | $ | $ | |||||||||||||||||||
| As of December 31, 2021 | |||||||||||||||||||||||
| Level 1 | Level 2 | Level 3 | Total | ||||||||||||||||||||
| Liabilities: | |||||||||||||||||||||||
| Derivative liability | $ | $ | $ | $ | |||||||||||||||||||
| Convertible notes (Note 9) | |||||||||||||||||||||||
| Contingent consideration | |||||||||||||||||||||||
| Total | $ | $ | $ | $ | |||||||||||||||||||
The change in fair value of the Level 3 instruments were as follows (in thousands):
| As of June 30, 2022 | |||||||||||||||||
| Derivative liability | Convertible notes (Note 9) | Contingent consideration | |||||||||||||||
| Fair value, beginning of the year | $ | $ | $ | ||||||||||||||
| Vesting of revesting notes | — | — | |||||||||||||||
| Forfeiture of revesting notes | — | ( | — | ||||||||||||||
| Issuance of common stock in settlement of contingent consideration | — | — | ( | ||||||||||||||
| Changes in fair value | ( | ( | ( | ||||||||||||||
| Fair value, end of quarter | $ | $ | $ | ||||||||||||||
| As of December 31, 2021 | |||||||||||||||||
| Derivative liability | Convertible notes (Note 9) | Contingent consideration | |||||||||||||||
| Fair value, beginning of the year | $ | $ | $ | ||||||||||||||
| Issuance of derivative liability | — | — | |||||||||||||||
| Issuances of convertible notes | — | — | |||||||||||||||
| Issuance of revesting notes | — | — | |||||||||||||||
| Issuance of contingent consideration | — | — | |||||||||||||||
| Changes in fair value | |||||||||||||||||
| Fair value, end of year | $ | $ | $ | ||||||||||||||
For the three and six months ended June 30, 2022, the Company recorded a gain associated with the change in fair value of the derivative liability of $0.4 million and $1.3 million, respectively. For the three and six months ended June 30, 2022, the Company recorded a gain associated with convertible notes of $0.5 million and $2.1 million, respectively. For the year ended December 31, 2021, the Company had recorded a loss associated with the change in fair value of the derivative liability and convertible notes of $0.7 million and $0.5 million, respectively. The amounts have been recorded in other income (expense), net in the condensed consolidated statement of operations and comprehensive loss.
20
Life360, Inc.
Notes to Condensed Consolidated Financial Statements (Unaudited)
| (Information as of June 30, 2022 and for the three and six months ended June 30, 2022 and 2021 is unaudited) | ||
7. Business Combinations
Jio, Inc.
On September 1, 2021, the Company completed the acquisition of Jiobit, a privately held consumer electronics company that specializes in the production of low powered sensors and wearables. The company is based in Chicago, Illinois with an additional development center in Silicon Valley, California and was founded in 2015. Jiobit has developed a small and long-lasting tracking solution. The mobile app, which is run through a wireless subscription service, offers a comprehensive set of monitoring and notification features. The addition of Jiobit is expected to strengthen and extend the Company’s market leadership position by leveraging Jiobit’s developed technology and customer relationships to accelerate the Company’s own product development and augment the Company with a critical mass of talent with strong tracking/wearables experience. The aggregate purchase consideration was $43.2 million, of which $7.3 million was paid in cash, $5.9 million of contingent consideration was payable upon reaching certain operational goals for 2021 and 2022, $11.6 million representing the fair value of convertible notes (the “September 2021 Convertible Notes”), $4.0 million representing forgiveness of Jiobit’s convertible debt held by the Company, $0.6 million comprised of 25,245 vested common stock options issued to Jiobit employees (“replacement awards”), and $13.8 million comprised of 674,516 shares of the Company’s common stock. Of the consideration transferred, $0.2 million in cash was placed in an indemnity escrow fund to be held for fifteen months after the acquisition date for general representations and warranties.
The September 2021 Convertible Notes issued as part of the purchase consideration can be converted to common stock at any time subsequent to the acquisition at a fixed conversion price of $22.50 per share. On each of the first three annual anniversaries of the issuance date of the September 2021 Convertible Notes, the Company will repay 1/3rd of the unconverted principal plus accrued interest to the holders of such notes. Upon a change of control, the holder may elect to either convert at the fixed conversion price of $22.50 per share or be repaid in full. The Company has elected the fair value option and will remeasure the September 2021 Convertible Notes at their fair value on each reporting date and reflect the changes in fair value in earnings. The estimated fair value of the September 2021 Convertible Notes is determined using a combination of the present value of the cash flows and the Black-Scholes option pricing model using assumptions as follows:
| As of September 1, | As of December 31, | As of June 30, | |||||||||||||||
| 2021 | 2021 | 2022 | |||||||||||||||
| Principal | $ | $ | $ | ||||||||||||||
| Interest rate | % | % | % | ||||||||||||||
| Common stock fair value per share | |||||||||||||||||
| Conversion price per share | |||||||||||||||||
| Risk-free interest rate | % | % | % | ||||||||||||||
| Time to exercise (in years) | |||||||||||||||||
| Volatility | % | % | % | ||||||||||||||
| Annual dividend yield | % | % | % | ||||||||||||||
A total of $6.0 million was excluded from purchase consideration which consists of $1.9 million comprised of 91,217 shares of the Company’s common stock (“Revesting Stock” – Note 14) and $1.6 million comprised of convertible notes (“Revesting Notes”) issued to key employees, retention bonuses of $1.0 million, and $0.5 million comprised of 43,083 unvested common stock options issued to Jiobit employees (“Unvested Replacement Awards” – Note 14). The Company incurred transaction related expenses of $1.0 million, which were expensed as incurred and recorded under general and administrative expenses in the condensed consolidated statements of operations and comprehensive loss.
21
Life360, Inc.
Notes to Condensed Consolidated Financial Statements (Unaudited)
| (Information as of June 30, 2022 and for the three and six months ended June 30, 2022 and 2021 is unaudited) | ||
The Revesting Stock and Revesting Notes are restricted and vest with continuous employment of certain key employees over a 3-year 0.3 ) million as stock-based compensation included in general and administrative expense related to the forfeiture of their Revesting Stock and $(0.3 ) million as compensation included in general and administrative expense related to the forfeiture of their Revesting Notes.
The Company recorded an immaterial amount and $0.2 million as stock-based compensation included in general and administrative expense related to the vesting of the Revesting Stock for the three and six months ended June 30, 2022.
The Company records the Revesting Notes at fair value and will remeasure the Revesting Notes at fair value on each reporting date. The Revesting Notes are recognized in general and administrative expense. As the Revesting Notes vest, the changes in fair value are recorded as general and administrative expense with a corresponding entry to convertibles notes. The estimated fair value of the Revesting Notes is determined using a combination of the present value of the Revesting Notes cash flows and the Black-Scholes option pricing model. The terms of the Revesting Notes are consistent with the terms of the September 2021 Convertible Notes. The Company recorded an immaterial amount and $0.1 million as general and administrative and expense related to the changes in fair value of Revesting Notes during the three and six months ended June 30, 2022, respectively.
The retention bonuses are recognized in prepaid expenses and other assets, noncurrent in the condensed consolidated balance sheet and vest monthly over a period of 24 months and require continuous employment. The expense associated with the Unvested Replacement Awards is recognized as stock-based compensation ratably over the remaining service period.
The 2021 and 2022 contingent consideration is based on the achievement of a Qualifying Units Sold Target for the period January 1, 2021 through December 31, 2021 (“2021 Contingent Consideration”) and for the period January 1, 2022 through December 31, 2022 (“2022 Contingent Consideration,” collectively, “Contingent Consideration”). The Contingent Consideration consists of 301,261 and 451,891 shares for 2021 and 2022, respectively, with the amount paid equal to the attainment relative to target in each year and settled in shares of the Company’s common stock. The Contingent Consideration shares payable is determined based on the percentage achievement relative to the target in each period, respectively, with greater than 100 % attainment resulting in 100 % payment, 90 % to 100 % attainment resulting in the number of shares equal to the percentage attainment, and less than 90 % attainment equal to no consideration. The Contingent Consideration is held at fair value with changes in fair value recognized in general and administrative expense. The estimated fair value of the Contingent Consideration is determined by using a Monte Carlo Simulation scenario-based analysis that estimates the fair value of the Contingent Consideration based on the probability-weighted present value of the expected future cash flows, considering possible outcomes based on actual and forecasted results. The estimated fair value of the 2021 and 2022 Contingent Consideration upon issuance was $0.1 million and $5.8 million, respectively. The estimated fair value of the 2021 and 2022 Contingent Consideration as of December 31, 2021 was $6.3 million and $3.1 million, respectively. The Company recorded a $1.3 million and $5.3 million gain within general and administrative expense related to the change in the fair value of the Contingent Consideration during the three and six months ended June 30, 2022, respectively.
In April 2022, the Board of Directors and previous Jiobit shareholders approved an amendment to the 2021 Contingent Consideration. The 2021 Contingent Consideration was amended to 50 % of the total potential amount of which 376,573 shares of the Company’s common stock were issued to shareholders. The fair value of the common stock of $4.2 million was recorded to additional paid-in capital and the contingent consideration liability was reversed.
The acquisition was accounted for as a business combination. The total purchase price of $43.2 million was allocated to the net tangible and intangible assets and liabilities based on their estimated fair values on the acquisition date and the excess was recorded to goodwill. The provisional values assigned to the assets acquired and liabilities assumed are based on preliminary estimates of fair value available as of the date of these financial statements and may be adjusted during the measurement period of up to 12 months from the date of acquisition. Any changes in the fair values of the assets acquired and liabilities assumed during the measurement period may result in adjustments to goodwill.
22
Life360, Inc.
Notes to Condensed Consolidated Financial Statements (Unaudited)
| (Information as of June 30, 2022 and for the three and six months ended June 30, 2022 and 2021 is unaudited) | ||
The assets acquired and liabilities assumed in connection with the acquisition were recorded at their fair value on the date of acquisition as follows (in thousands):
| Fair Value | |||||
| Net tangible assets | $ | ||||
| Intangible assets | |||||
| Goodwill | |||||
| Liabilities assumed | ( | ||||
| Total acquisition consideration | $ | ||||
The following table sets forth the components of identifiable intangible assets acquired (in thousands) and their estimated useful lives as of the date of acquisition:
| Fair Value | Estimated Useful Life (in years) | ||||||||||
| Developed technology | $ | ||||||||||
| Trade name | |||||||||||
| Customer relationships | |||||||||||
| Total identified intangible assets | $ | ||||||||||
Goodwill represents the future economic benefits arising from other assets that could not be individually identified and separately recognized, such as the acquired assembled workforce of Jiobit. In addition, goodwill represents the future benefits as a result of the acquisition that will enhance the Company’s product available to both new and existing customers and increase the Company’s competitive position. The goodwill is not deductible for tax purposes.
The Company estimated and recorded a net deferred tax liability of $0.1 million after offsetting the acquired available tax attributes with the intangible assets shown in the table above. Refer to Note 15 “Income Taxes” for discussion of the partial release of the Company’s valuation allowance relating to the deferred tax liability.
The results of operations of Jiobit are included in the accompanying condensed consolidated statements of operations and comprehensive loss from the date of acquisition.
Tile, Inc.
On January 5, 2022, the Company completed the acquisition of Tile, Inc. (“Tile”), a privately held consumer electronics company. The company is based in San Mateo, California and was founded in 2012. Tile is a smart location company, with a Bluetooth enabled device that works in tandem with the Tile Application (the “Application”), to enable its customers to locate lost or misplaced objects. Tile offers a comprehensive list of products to use with the application, along with optional subscription services to enhance features offered for Tile products. The addition of Tile is expected to strengthen and extend Life360’s market leadership position by leveraging Tile’s developed technology and customer relationships to accelerate the Company’s own product development and augment the Life360 team with a critical mass of talent. The aggregate purchase consideration was $173.6 million, of which $158.0 million was paid in cash and $15.6 million paid in equity. The $15.6 million in equity was comprised of 780,593 shares of the Company’s common stock valued on the date of acquisition and 534,465 shares of common stock contingent consideration which was promised upon reaching certain operational goals. Of the consideration transferred, $14.1 million in cash and 84,524 common shares were placed in an indemnity escrow fund to be held for fifteen months after the acquisition date for general representations and warranties.
23
Life360, Inc.
Notes to Condensed Consolidated Financial Statements (Unaudited)
| (Information as of June 30, 2022 and for the three and six months ended June 30, 2022 and 2021 is unaudited) | ||
A total of $35.0 million was excluded from purchase consideration which consists of retention consideration of 1,499,349 shares of retention restricted stock units valued at $29.6 million, $0.4 million related to 38,730 vested common stock options issued to Tile employees (“replacement awards”) as stock-based compensation on the acquisition date and change in control bonuses of $3.0 million which were recognized as compensation expense on the condensed consolidated statements of operations on the acquisition date. The Company incurred transaction related expenses of $1.7 million, which were recorded under general and administrative expenses in the condensed consolidated statements of operations. The remaining costs excluded from purchase consideration were a result of 1,561 shares granted to key employee and vested based continued employment and 4,784 shares of contingent consideration granted to a key employee and vested based on continued employment.
Of the 1,499,349 shares of retention restricted stock units, 787,446 shares valued at $15.6 million contain performance vesting criteria based on the achievement of certain company milestones, and vest over a two year period. The remaining retention restricted stock units of 711,903 shares vest over a to four year period.
The contingent consideration is based on the achievement of the Company’s achievement certain targets for revenue and earnings before interest, taxes, depreciation, and amortization (“EBITDA”) for the fourth quarter of calendar year 2021 and the second quarter of calendar year 2022. The Company determined that the criteria to satisfy the contingent consideration was not met, and as such, no value was ascribed to the contingent consideration.
The acquisition was accounted for as a business combination and the total purchase consideration was allocated to the net tangible and intangible assets and liabilities based on their fair values on the acquisition date and the excess was recorded to goodwill. The provisional values assigned to the assets acquired and liabilities assumed are based on preliminary estimates of fair value available as of the date of these financial statements and certain assets and liabilities may be subject to adjustment during the measurement period of up to 12 months from the date of acquisition including, but not limited to, intangible assets, certain reserves and income taxes. Any changes in the fair values of the assets acquired and liabilities assumed during the measurement period may result in adjustments to goodwill.
The assets acquired and liabilities assumed in connection with the acquisition were recorded at their fair value on the date of acquisition as follows (in thousands):
| Fair Value | |||||
| Cash | $ | ||||
| Restricted cash | |||||
| Accounts receivable | |||||
| Prepaid expenses and other current assets | |||||
| Inventory | |||||
| Property and equipment | |||||
| Prepaid expenses and other assets, noncurrent | |||||
| Intangible assets | |||||
| Goodwill | |||||
| Accounts payable | ( | ||||
| Accrued expenses and other current liabilities | ( | ||||
| Deferred revenue | ( | ||||
| Total acquisition consideration | $ | ||||
24
Life360, Inc.
Notes to Condensed Consolidated Financial Statements (Unaudited)
| (Information as of June 30, 2022 and for the three and six months ended June 30, 2022 and 2021 is unaudited) | ||
The following table sets forth the components of identifiable intangible assets acquired and their estimated useful lives as of the date of acquisition:
Fair Value (in thousands) | Estimated Useful Life (in years) | ||||||||||
| Developed technology | $ | ||||||||||
| Trade name | |||||||||||
| Customer relationships | |||||||||||
| Total identified intangible assets | $ | ||||||||||
Goodwill represents the future economic benefits arising from other assets that could not be individually identified and separately recognized, such as the acquired assembled workforce of Tile. In addition, goodwill represents the future benefits as a result of the acquisition that will enhance the Company’s product available to both new and existing customers and increase the Company’s competitive position. The goodwill is not deductible for tax purposes.
The results of operations of Tile are included in the accompanying condensed consolidated statements of operations and comprehensive loss from the date of acquisition.
8. Balance Sheet Components
Accounts receivable, net
Accounts receivable, net consists of the following (in thousands):
| As of June 30, | As of December 31, | ||||||||||
| 2022 | 2021 | ||||||||||
| Accounts receivable | $ | $ | |||||||||
| Allowance for doubtful accounts | ( | ||||||||||
| Accounts receivable, net | $ | $ | |||||||||
Inventory
Inventory consists of the following (in thousands):
| As of June 30, | As of December 31, | ||||||||||
| 2022 | 2021 | ||||||||||
| Raw materials | $ | $ | |||||||||
| Finished goods | |||||||||||
| Total inventory | $ | $ | |||||||||
Prepaid Expenses and Other Current Assets
Prepaid expenses and other current assets consist of the following (in thousands):
| As of June 30, | As of December 31, | ||||||||||
| 2022 | 2021 | ||||||||||
| Prepaid expenses | $ | $ | |||||||||
| Other receivables | |||||||||||
| Total prepaid expenses and other current assets | $ | $ | |||||||||
25
Life360, Inc.
Notes to Condensed Consolidated Financial Statements (Unaudited)
| (Information as of June 30, 2022 and for the three and six months ended June 30, 2022 and 2021 is unaudited) | ||
Prepaid expenses primarily consist of certain cloud platform and customer service program costs. Other receivables primarily consist of future tax refunds and deposits held by retail partners.
Property and Equipment, net
Property and equipment, net consists of the following (in thousands):
| As of June 30, | As of December 31, | ||||||||||
| 2022 | 2021 | ||||||||||
| Computer equipment | $ | $ | |||||||||
| Leasehold improvements | |||||||||||
| Production manufacturing equipment | |||||||||||
| Furniture and fixtures | |||||||||||
| Total property and equipment, gross | |||||||||||
| Less: accumulated depreciation | ( | ( | |||||||||
| Total property and equipment, net | $ | $ | |||||||||
Depreciation expense was $0.1 million and $0.2 million for the three and six months ended June 30, 2022 and $0.1 million and $0.2 million for the three and six months ended June 30, 2021, respectively.
Prepaid Expenses and Other Assets, noncurrent
Prepaid expenses and other assets, noncurrent consist of the following (in thousands):
| As of June 30, | As of December 31, | ||||||||||
| 2022 | 2021 | ||||||||||
| Prepaid expenses | $ | $ | |||||||||
| Investment in affiliate | |||||||||||
| Other assets | |||||||||||
| Total prepaid expenses and other assets, noncurrent | $ | $ | |||||||||
Prepaid expenses primarily consist of cloud platform costs. Investment in affiliate relates to warrants to purchase shares of common stock of a current Data Revenue Partner. Refer to Note 3 “Revenue” for additional information.
Leases
The Company currently leases real estate space under non-cancelable operating lease agreements for its corporate headquarters in San Francisco, San Mateo and San Diego, California and Chicago, Illinois. The operating leases have remaining lease terms ranging from 1 to 4 years, some of which include the option to extend the lease.
The Company has recognized a right-of-use (ROU) asset, short term and long-term lease liabilities of $2.0 million, $1.7 million, and $0.4 million in “Right-of-use-asset,” “” and “” respectively, on the Company’s condensed consolidated balance sheet as of June 30, 2022.
The Company has recognized operating ROU assets, short term and long-term lease liabilities of $1.6 million, $1.6 million, and $0.3 million in “Right-of-use-asset,” “” and “” respectively, on the Company’s condensed consolidated balance sheet as of December 31, 2021.
The Company did not have any finance leases as of June 30, 2022 or December 31, 2021.
26
Life360, Inc.
Notes to Condensed Consolidated Financial Statements (Unaudited)
| (Information as of June 30, 2022 and for the three and six months ended June 30, 2022 and 2021 is unaudited) | ||
Operating lease costs were as follows (in thousands):
| Three Months Ended June 30, | Six Months Ended June 30, | ||||||||||||||||||||||
| 2022 | 2021 | 2022 | 2021 | ||||||||||||||||||||
Operating lease cost (1) | $ | $ | $ | $ | |||||||||||||||||||
The weighted-average remaining term of the Company’s operating leases was 1.1 years and 1.3 years as of June 30, 2022 and December 31, 2021, respectively, and the weighted-average discount rate used to measure the present value of the operating lease liabilities was 5.0 % and 4.8 %, respectively.
Maturities of the Company’s operating lease liabilities, which do not include short-term leases, as of June 30, 2022 were as follows (in thousands):
| Operating leases | |||||
| Remainder of 2022 | $ | ||||
| 2023 | |||||
| 2024 | |||||
| Total future minimum lease payments | |||||
| Less imputed interest | ( | ||||
| Total operating lease liability | $ | ||||
Payments for operating leases included in cash from operating activities were $0.6 million and $1.2 million for the three and six months ended June 30, 2022 and $0.4 million and $0.7 million for the three and six months ended June 30, 2021, respectively.
Intangible Assets, net
Intangible assets, net consists of the following (in thousands):
| As of June 30, | As of December 31, | ||||||||||
| 2022 | 2021 | ||||||||||
| Intellectual property | $ | $ | |||||||||
| Licenses | |||||||||||
| Trade name | |||||||||||
| Technology | |||||||||||
| Customer relationships | |||||||||||
| Internal use software | |||||||||||
| Total intangible assets, gross | |||||||||||
| Less: accumulated amortization | ( | ( | |||||||||
| Total intangible assets, net | $ | $ | |||||||||
Amortization expense was $2.2 million and $4.3 million for the three and six months ended June 30, 2022. No
27
Life360, Inc.
Notes to Condensed Consolidated Financial Statements (Unaudited)
| (Information as of June 30, 2022 and for the three and six months ended June 30, 2022 and 2021 is unaudited) | ||
As of June 30, 2022 the Company had $0.3 million of internal use software which had not been released and was therefore not subject to amortization. As of June 30, 2022, estimated remaining amortization expense for intangible assets by fiscal year is as follows (in thousands):
| Amount | |||||
| Remainder of 2022 | $ | ||||
| 2023 | |||||
| 2024 | |||||
| 2025 | |||||
| 2026 | |||||
| Beyond | |||||
| Total future amortization expense | $ | ||||
The weighted-average remaining useful lives of the Company’s acquired intangible assets are as follows:
| Weighted-Average Remaining Useful Life | |||||||||||
| As of June 30, | As of December 31, | ||||||||||
| 2022 | 2021 | ||||||||||
| Trade name | |||||||||||
| Technology | |||||||||||
| Customer relationships | |||||||||||
The detail of intangible assets, net is as follows (in thousands):
| As of June 30, 2022 | |||||||||||||||||||||||||||||||||||||||||
| Intellectual property | Licenses | Trade name | Technology | Customer relationships | Internal use software | Total | |||||||||||||||||||||||||||||||||||
| Total intangible assets | $ | $ | $ | $ | $ | $ | $ | ||||||||||||||||||||||||||||||||||
| Less accumulated amortization | ( | ( | ( | ( | ( | ( | ( | ||||||||||||||||||||||||||||||||||
| Total intangible assets, net | $ | $ | $ | $ | $ | $ | $ | ||||||||||||||||||||||||||||||||||
| As of December 31, 2021 | |||||||||||||||||||||||||||||||||||
| Intellectual property | Licenses | Trade name | Technology | Customer relationships | Total | ||||||||||||||||||||||||||||||
| Total intangible assets | $ | $ | $ | $ | $ | $ | |||||||||||||||||||||||||||||
| Less accumulated amortization | ( | ( | ( | ( | ( | ( | |||||||||||||||||||||||||||||
| Total intangible assets, net | $ | $ | $ | $ | $ | $ | |||||||||||||||||||||||||||||
Goodwill
Goodwill consists of the following (in thousands):
| Balance as of December 31, 2021 | $ | ||||
| Acquisitions | |||||
| Balance as of June 30, 2022 | $ | ||||
28
Life360, Inc.
Notes to Condensed Consolidated Financial Statements (Unaudited)
| (Information as of June 30, 2022 and for the three and six months ended June 30, 2022 and 2021 is unaudited) | ||
Accrued Expenses and Other Liabilities
Accrued expenses and other liabilities consist of the following (in thousands):
| As of June 30, | As of December 31, | ||||||||||
| 2022 | 2021 | ||||||||||
| Accrued vendor expenses | $ | $ | |||||||||
| Accrued compensation | |||||||||||
| Customer related promotions and discounts | |||||||||||
| Operating lease liability | |||||||||||
| Other current liabilities | |||||||||||
| Total accrued expenses and other liabilities | $ | $ | |||||||||
Other current liabilities primarily relate to warranty liabilities and return accruals related to the Company’s hardware tracking devices.
Escrow Liability
The escrow liability relates to restricted cash associated with the Tile, Inc. acquisition placed in an indemnity escrow fund to be held for fifteen months after the acquisition date for general representations and warranties. The initial balance was included within total consideration transferred.
As of June 30, 2022 the total escrow liability remaining was $13.1 million and is included within current liabilities. No escrow liability was recorded as of December 31, 2021.
Other Noncurrent Liabilities
Other noncurrent liabilities consist of the following (in thousands):
| As of June 30, | As of December 31, | ||||||||||
| 2022 | 2021 | ||||||||||
| Deposit liabilities | $ | $ | |||||||||
| Other noncurrent liabilities | |||||||||||
| Operating lease liability | |||||||||||
| Total other noncurrent liabilities | $ | $ | |||||||||
9. Convertible Notes
In July 2021, the Company issued convertible notes (“July 2021 Convertible Notes”) to investors with an underlying principal amount of $2.1 million. The July 2021 Convertible Notes accrue simple interest at an annual rate of 4 % and mature on July 1, 2026. The July 2021 Convertible Notes may be settled under the following scenarios at the option of the holder: (i) at any time into common shares equal to the conversion amount of outstanding principal and any accrued but unpaid interest divided by the conversion price of $11.96 ; (ii) at the option of the holder upon a liquidation event a) paid in cash equal to the outstanding principal and any accrued but unpaid interest or b) into common shares equal to the conversion amount of outstanding principal and any accrued but unpaid interest divided by the conversion price of $11.96 ; or (iii) upon maturity, settlement in cash at the outstanding accrued interest and principal amount.
Certain conversion and redemption features of the July 2021 Convertible Notes were determined to not be clearly and closely associated with the risk of the debt-type host instrument and were required to be separately accounted for as derivative financial instruments. The Company bifurcated these embedded conversion and redemption (“embedded derivatives”) features and classified these as liabilities measured at fair value. The fair value of the derivative liability of
29
Life360, Inc.
Notes to Condensed Consolidated Financial Statements (Unaudited)
| (Information as of June 30, 2022 and for the three and six months ended June 30, 2022 and 2021 is unaudited) | ||
$0.7 million was recorded separate from the July 2021 Convertible Notes with an offsetting amount recorded as a debt discount. The debt discount is amortized over the estimated life of the debt using the straight-line method, as the value attributable to the July 2021 Convertible Notes was zero upon issuance.
As of June 30, 2022 the unamortized amount and net carrying value of the July 2021 Convertible Notes is $1.7 million and $0.4 million, respectively. The amount by which July 2021 Convertible Notes if-converted value does not exceed its principal is $(1.1 ) million as of June 30, 2022.
As of December 31, 2021 the unamortized amount and net carrying value of the July 2021 Convertible Notes is $1.9 million and $0.2 million, respectively. The amount by which July 2021 Convertible Notes if-converted value exceeds its principal is $1.6 million as of December 31, 2021.
In connection with the July 2021 Convertible Notes, the Company issued warrants to purchase 88,213 shares of the Company’s common stock with an exercise price of $0.01 per share and a term of one year (Warrant Tranche 1), 44,106 shares of the Company’s common stock with an exercise price of $11.96 per share and a term of 5 years (Warrant Tranche 2), and 44,106 shares of the Company’s common stock which is exercisable starting twelve months from the issuance date with an exercise price of $11.96 per share and a term of 5 years (Warrant Tranche 3).
The fair value of the warrants was determined using the Black-Scholes option-pricing method, with the following assumptions:
| Warrants Tranche 1 | Warrants Tranche 2 | Warrants Tranche 3 | |||||||||||||||
| Fair market value of common stock | $ | $ | $ | ||||||||||||||
| Expected dividend yield | % | % | % | ||||||||||||||
| Risk-free interest rate | % | % | % | ||||||||||||||
| Expected volatility | % | % | % | ||||||||||||||
| Expected term (in years) | |||||||||||||||||
The warrants were recorded to additional paid-in capital during the year ended December 31, 2021. The relative fair value of the warrants issued in connection with the July 2021 Convertible Notes was $0.8 million and was recorded as a debt discount that is being amortized to interest expense under the straight-line method over the term of respective convertible notes.
As a result of the beneficial conversion feature associated with the July 2021 Convertible Notes, $0.6 million was added to additional paid-in capital during the year ended December 31, 2021. The beneficial conversion feature was recorded as a debt discount and is being amortized to interest expense under the straight-line method over the term of the respective notes.
The Company recognized a total of $0.1 million and $0.2 million in non-cash interest expense related to the July 2021 Convertible Notes for the three and six months ended June 30, 2022, respectively.
The Company has also issued convertible notes, September 2021 Convertible Notes, in connection with an acquisition. Refer to Note 7 “Business Combinations” for further details.
30
Life360, Inc.
Notes to Condensed Consolidated Financial Statements (Unaudited)
| (Information as of June 30, 2022 and for the three and six months ended June 30, 2022 and 2021 is unaudited) | ||
Convertible notes, current and noncurrent consist of the following (in thousands):
| As of June 30, | As of December 31, | ||||||||||
| 2022 | 2021 | ||||||||||
| Convertible notes, current: | |||||||||||
| September 2021 Convertible Notes | $ | $ | |||||||||
| Revesting Notes | |||||||||||
| Convertible notes, noncurrent: | |||||||||||
| July 2021 Convertible Notes | |||||||||||
| September 2021 Convertible Notes | |||||||||||
| Revesting Notes | |||||||||||
| Total convertible notes | $ | $ | |||||||||
10. Derivative Liability
The Company’s derivative liability represents embedded share-settled redemption features bifurcated from its July 2021 Convertible Notes and is carried at fair value. The changes in the fair value of the derivative liability are recorded in other income (expense), net of the Company’s condensed consolidated statements of operations and comprehensive loss.
Estimating fair values of derivative financial instruments requires the development of significant and subjective estimates that may, and are likely to, change over the duration of the instrument with related changes in internal and external market factors. Since derivative financial instruments are initially and subsequently carried at fair value, the Company’s income will reflect the volatility in these estimate and assumption changes.
The features embedded in the July 2021 Convertible Notes are combined into one compound embedded derivative. The fair value of the embedded derivative was estimated based on the present value of the redemption discount applied to the principal amount of the July 2021 Convertible Notes adjusted to reflect the weighted probability of exercise. The discount rate was based on the risk-free interest rate.
11. Commitments and Contingencies
Purchase Commitments
The Company has certain commitments from outstanding purchase orders primarily related to technology support, facilities, marketing and branding and professional services. These agreements, which total $24.6 million as of June 30, 2022 and $11.0 million as of December 31, 2021, are cancellable at any time with the Company required to pay all costs incurred through the cancellation date.
Contingencies
From time to time, the Company may have certain contingent liabilities that arise in the ordinary course of business activities. The Company accrues a liability for such matters when it is probable that future expenditures will be made, and such expenditures can be reasonably estimated. The Company is not subject to any current pending legal matters or claims that would have a material adverse effect on its financial position, results of operations or cash flows.
31
Life360, Inc.
Notes to Condensed Consolidated Financial Statements (Unaudited)
| (Information as of June 30, 2022 and for the three and six months ended June 30, 2022 and 2021 is unaudited) | ||
Indemnification
The Company enters into standard indemnification agreements in the ordinary course of business. Pursuant to these arrangements, the Company indemnifies, holds harmless, and agrees to reimburse the indemnified parties for losses suffered or incurred by the indemnified party, in connection with any trade secret, copyright, patent or other intellectual property infringement claim by any third party with respect to its technology. The term of these indemnification agreements is generally perpetual after the execution of the agreement. The maximum potential amount of future payments the Company could be required to make under these agreements is not determinable because it involves claims that may be made against the Company in the future but have not yet been made. The Company has not incurred costs to defend lawsuits or settle claims related to these indemnification agreements.
The Company has entered into indemnification agreements with its directors and officers that may require the Company to indemnify its directors and officers against liabilities that may arise by reason of their status or service as directors or officers, other than liabilities arising from willful misconduct of the individual. No amounts associated with such indemnifications have been recorded to date.
Litigation
On March 12, 2019, a former alleged competitor of Tile, Cellwitch, Inc, filed a patent infringement claim against the Company in the US District Court, Northern District of California (“Court”). On May 2, 2019, the Company filed a motion to dismiss the case. The plaintiff amended its complaint on May 16, 2019, and the Company filed a renewed motion to dismiss the amended complaint on May 30, 2019. On November 21, 2019, the Court issued an order denying Tile’s motion to dismiss the case but finding the underlying patent to be directed to an abstract idea. On December 18, 2019, Tile filed an inter partes review petition with the Patent Trial and Appeal Board (“PTAB”) challenging the validity of the patent. Both parties appealed the PTAB’s Final Written Decision on Tile’s inter partes review petition, which was affirmed on May 13, 2022. The case is currently in the trial court with discovery stayed, while Tile files a motion for reconsideration of its original motion to dismiss.
Separately, another alleged former competitor of Tile, Linquet Technologies, sued Tile for patent infringement. In July 2021, the Court granted Tile’s motion to dismiss in its entirety without leave to amend. Meanwhile, on November 17, 2021, the US Patent and Trademark Office granted Tile’s institution of inter partes review as to all claims of the Linquet patent which is currently pending.
12. Common Stock
As of June 30, 2022 and December 31, 2021, the Company was authorized to issue up to 100,000,000 0.001
As of June 30, 2022 and December 31, 2021, the Company had 108,592
The Company has also issued shares of common stock as a result of stock option exercises throughout its existence. Common stockholders are entitled to dividends when and if declared by the Board of Directors subject to the prior rights of the preferred stockholders. The holder of each share of common stock is entitled to one vote. The common stockholders voting as a class are entitled to elect three members to the Company’s Board of Directors. No dividends have been declared in the Company’s existence.
32
Life360, Inc.
Notes to Condensed Consolidated Financial Statements (Unaudited)
| (Information as of June 30, 2022 and for the three and six months ended June 30, 2022 and 2021 is unaudited) | ||
The Company has reserved shares of common stock, on an as if converted basis, for issuance as follows:
| As of June 30, | As of December 31, | ||||||||||
| 2022 | 2021 | ||||||||||
| Issuances under stock incentive plan | |||||||||||
| Issuances upon exercise of common stock warrants | |||||||||||
| Issuances upon vesting of restricted stock units | |||||||||||
| Issuances of convertible notes | |||||||||||
| Shares reserved for shares available to be granted but not granted yet | |||||||||||
13. Warrants
14. Equity Incentive Plan
2011 Equity Incentive Plan
The Company’s 2011 Stock Plan was originally adopted by our Board of Directors on July 27, 2011 and our stockholders on October 11, 2011, and most recently amended by our Board on September 7, 2018 and our stockholders (as restated, the “Plan”). The Plan allows us to grant restricted stock units, restricted stock and stock options to employees and consultants of the Company and any of the Company’s parent, subsidiaries, or affiliates, and to the members of our Board of Directors. Options granted under the Plan may be either incentive stock options or nonqualified stock options. Incentive stock options, or ISOs, may be granted only to employees of the Company or any of the Company’s parent or subsidiaries (including officers and directors who are also employees). Nonqualified stock options, or NSOs, may be granted to any person eligible for grants under our Plan.
Under the Plan, the Board of Directors determines the per share exercise price of each stock option, which for ISOs shall not be less than 100 % of the fair market value of a share on the date of grant; provided that the exercise price of an ISO granted to a stockholder who at the time of grant owns stock representing more than 10% of the voting power of all classes of stock (a “10% stockholder”) shall not be less than 110 % of the fair market value of a share on the date of grant.
The Board of Directors determines the period over which options vest and become exercisable. Options granted to new employees generally vest over a 4-year period: 25% of the shares vest on the first anniversary from the vesting commencement date of the option and an additional 1/48th of the shares vest on each monthly anniversary thereafter, subject to the employee’s continuous service through each vesting date. Options granted to continuing employees generally vest monthly over a 4-year period.
The Board of Directors also determines the term of options, provided the maximum term for ISOs granted to a 10% stockholder must be no longer than 5 years from date of grant and the maximum term for all other options must be no longer than 10 years from date of grant. If an option holder’s service terminates, options generally terminate 3 months from the date of termination except under certain circumstances such as death or disability.
33
Life360, Inc.
Notes to Condensed Consolidated Financial Statements (Unaudited)
| (Information as of June 30, 2022 and for the three and six months ended June 30, 2022 and 2021 is unaudited) | ||
The following summary of stock option activity for the periods presented is as follows:
| Number of Shares Underlying Outstanding Options | Weighted Average Exercise Price per Share | Weighted Average Remaining Contractual Life (in Years) | Aggregate Intrinsic Value | ||||||||||||||||||||
| Balance as of December 31, 2021 | |||||||||||||||||||||||
| Options granted | |||||||||||||||||||||||
| Options exercised | ( | ||||||||||||||||||||||
| Options cancelled/forfeited | ( | ||||||||||||||||||||||
| Balance as of June 30, 2022 | |||||||||||||||||||||||
| Exercisable as of June 30, 2022 | $ | $ | |||||||||||||||||||||
As of June 30, 2022, the Company had 27,294,447 shares authorized for issuance and 1,125,625 shares available for issuance under the Plan. Stock options granted during the six months ended June 30, 2022 had a weighted average grant date fair value of $8.33 per share.
The intrinsic values of outstanding, vested, and exercisable options were determined by multiplying the number of shares by the difference in exercise price of the options and the fair value of the common stock as of June 30, 2022 of $5.88 per share, respectively. The intrinsic value of the options exercised represents the difference between the exercise price and the fair market value on the date of exercise.
The following summary of Restricted Stock Units (RSU) activity for the periods presented is as follows:
| Number of Shares | Weighted average grant date fair value | ||||||||||
| Balance as of December 31, 2021 | $ | ||||||||||
| RSU granted | |||||||||||
| RSU vested and settled | ( | ||||||||||
| RSU cancelled/forfeited | ( | ||||||||||
| Balance as of June 30, 2022 | $ | ||||||||||
The number of RSUs vested and settled includes shares of common stock that the Company withheld on behalf of employees to satisfy the minimum statutory tax withholding requirements.
Stock Options Granted to Employees
The fair value of the employee stock options granted is estimated using the Black-Scholes option-pricing model, based on the following assumptions:
| Six Months Ended June 30, | Year Ended December 31, | ||||||||||
| 2022 | 2021 | ||||||||||
| Expected terms (in years) | |||||||||||
| Expected volatility | % | % | |||||||||
| Risk-free interest rate | % | % | |||||||||
| Expected dividend rate | % | % | |||||||||
Fair Value of Common Stock: As the Company’s stock is traded on the public market, the fair value on the date of the grant is used.
34
Life360, Inc.
Notes to Condensed Consolidated Financial Statements (Unaudited)
| (Information as of June 30, 2022 and for the three and six months ended June 30, 2022 and 2021 is unaudited) | ||
Expected Term: The expected term for employees is based on the simplified method, as the Company’s stock options have the following characteristics: (i) granted at-the-money; (ii) exercisability is conditional upon service through the vesting date; (iii) termination of service prior to vesting results in forfeiture; (iv) limited exercise period following termination of service; and (v) options are non-transferable and non-hedgeable, or “plain vanilla” options, and the Company has limited history of exercise data. The expected term for non-employees is based on the remaining contractual term.
Expected Volatility: As the Company has limited historical trading data regarding the volatility of its common stock, the expected volatility is based on volatility of a Company of similar entities and the Company’s trading data since IPO. In evaluating similarity, the Company considered factors such as industry, stage of life cycle and size. The Company will continue to analyze the historical stock price volatility and expected term assumptions as more historical data for the Company’s common stock becomes available.
Risk-Free Interest Rate: The risk-free interest rate is based on U.S. Treasury constant maturity rates with remaining terms similar to the expected term of the options.
Expected Dividend Rate: The Company has never paid any dividends and does not plan to pay dividends in the foreseeable future, and, therefore, an expected dividend rate of zero is used in the valuation model.
Forfeitures: The Company accounts for forfeitures as they occur.
Equity Awards Issued in Connection with Business Combinations
Jio, Inc.
In connection with the Jiobit transaction in September 2021, the Company issued 91,217 shares of restricted common stock with an aggregate fair value of $1.9 million to be recognized as post combination stock-based compensation ratably with continuous employment of certain employees over a 3 year period.
As of June 30, 2022, there was $0.2 million of unrecognized compensation expense related to the restricted common stock which is expected to be recognized over the remaining weighted average life of 2.2 years. As of December 31, 2021, there was $1.7 million of unrecognized compensation expense related to this restricted common stock which is expected to be recognized over the remaining weighted average life of 2.7 years.
Additionally, the Company granted 43,083 service-based stock options under the Plan to certain Jiobit employees with an aggregate fair value of $0.5 million which vests ratably over the requisite service period. As of June 30, 2022, there was $0.3 million of unrecognized compensation expense related to unvested assumed stock options, which is expected to be recognized over the remaining weighted average life of 2.3 years. As of December 31, 2021, there was $0.5 million of unrecognized compensation expense related to unvested assumed stock options, which is expected to be recognized over the remaining weighted average life of 2.0 years.
Tile, Inc.
In connection with the Tile transaction in January 2022, the Company issued 1,499,349 shares of retention restricted stock units with an aggregate fair value of $29.6 million. Of the 1,499,349 shares of retention restricted stock units, 787,446 shares valued at $15.6 million contained performance vesting criteria based on the achievement of certain company milestones during the second quarter of 2022, and vest over a two year period. As of March 31, 2022, the vesting criteria had not been met and all 787,446 restricted stock units were forfeited. The remaining 711,903 retention restricted stock units vest over a to four year period. As of June 30, 2022, there was $9.4 million of unrecognized compensation expense related to the retention restricted stock units which is expected to be recognized over the remaining weighted average life of 2.0 years.
The Company also issued 38,730 vested common stock options to Tile employees as stock-based compensation on the acquisition date. The aggregate fair value of $0.4 million was recognized as compensation expense on the date of acquisition.
35
Life360, Inc.
Notes to Condensed Consolidated Financial Statements (Unaudited)
| (Information as of June 30, 2022 and for the three and six months ended June 30, 2022 and 2021 is unaudited) | ||
A total of 694,672 shares of common stock with an aggregate fair value of $13.7 million were issued to Tile shareholders as part of purchase consideration. All $13.7 million was expensed on the date of acquisition.
A total of 1,561 shares of common stock with an aggregate fair value of $0.03 million were issued to a key employee the vesting of which is subject to continued employment over a 30-month period. As of June 30, 2022, there was $0.09 million of unrecognized compensation expense related to unvested restricted stock units which is expected to be recognized over the remaining 2.1 years.
A total of 84,360 shares of common stock were issued as part of consideration transferred and were placed in an indemnity escrow fund to be held for fifteen months after the acquisition date for general representations and warranties. The aggregate fair value of $1.7 million was recognized as compensation expense on the date of the acquisition.
Stock-Based Compensation
Stock-based compensation expense was allocated as follows (in thousands):
| Three Months Ended June 30, | Six Months Ended June 30, | ||||||||||||||||||||||
| 2022 | 2021 | 2022 | 2021 | ||||||||||||||||||||
| Cost of revenue | |||||||||||||||||||||||
| Subscription costs | $ | $ | $ | $ | |||||||||||||||||||
| Hardware costs | |||||||||||||||||||||||
| Other costs | |||||||||||||||||||||||
| Total cost of revenue | $ | $ | $ | $ | |||||||||||||||||||
| Research and development | |||||||||||||||||||||||
| Sales and marketing | |||||||||||||||||||||||
| General and administrative | |||||||||||||||||||||||
| Total stock-based compensation expense | $ | $ | $ | $ | |||||||||||||||||||
As of June 30, 2022, there was total unrecognized compensation cost for outstanding stock options of $12.2 million to be recognized over a period of approximately 3.2 years. As of December 31, 2021, there was total unrecognized compensation cost for outstanding stock options of $7.0 million to be recognized over a period of approximately 2.6 years.
As of June 30, 2022, there was unrecognized compensation cost for outstanding restricted stock units of $56.8 million to be recognized over a period of approximately 2.8 years. As of December 31, 2021, there was unrecognized compensation cost for outstanding restricted stock units of $26.6 million to be recognized over a period of approximately 3.2 years.
There were no capitalized stock-based compensation costs or recognized stock-based compensation tax benefits during the year ended December 31, 2021 or the three and six months ended June 30, 2022.
15. Income Taxes
The provision for income taxes for interim periods is determined using an estimated annual effective tax rate in accordance with ASC 740-270, Income Taxes, Interim Reporting. The effective tax rate may be subject to fluctuations during the year as new information is obtained, which may affect the assumptions used to estimate the annual effective tax rate, including factors such as valuation allowances against deferred tax assets, the recognition or de-recognition of tax benefits related to uncertain tax positions, if any, and changes in or the interpretation of tax laws in jurisdictions where the Company conducts business.
The Company recorded a provision (benefit) for incomes taxes of $(47.0 ) thousand and $11.0 thousand for the three and six months ended June 30, 2022, respectively. No provision (benefit) for income taxes was recorded for the three and six months ended June 30, 2021. In accordance with ASC 805, a change in the acquirer’s valuation allowance that stems from a business combination should be recognized as an element of the acquirer’s income tax expense or benefit in the period of
36
Life360, Inc.
Notes to Condensed Consolidated Financial Statements (Unaudited)
| (Information as of June 30, 2022 and for the three and six months ended June 30, 2022 and 2021 is unaudited) | ||
16. Related-Party Transactions
The Company has entered into secondary financing transactions and other transactions with certain executive officers and Board members of the Company. A summary of the transactions is detailed below:
Notes Due From Affiliates (Contra Equity)
In February 2016, the Company issued an aggregate of $0.6 million in secured partial recourse promissory notes (“partially secured loan”) to the Chief Executive Officer, Non-Executive Director (Previously President), Chief Operating Officer and an officer of the Company.
The Company accounted for the 2016 partially secured loan as consideration received for the exercise of the related equity award, because even after the original options are exercised or the shares are purchased, an employee could decide not to repay the loan if the value of the shares declines below the outstanding loan amount and could instead choose to return the shares in satisfaction of the loan. The result would be similar to an employee electing not to exercise an option whose exercise price exceeds the current share price. When shares are exchanged for a partially secured loan, the principal and interest are viewed as part of the exercise price of the “option” and no interest income is recognized. Additionally, compensation cost is recognized over any requisite service period, with an offsetting credit to additional paid-in capital. Periodic principal and interest payments, if any, are treated as deposit liabilities until the note is paid off, at which time, the note balance is settled and the deposit liability balance is transferred to additional paid-in capital. During the three months ended June 30, 2022, the Company received proceeds from the repayment of the partially secured loans of $0.6 million. As of June 30, 2022 and December 31, 2021, the Company had deposit liability balances of $0.3 million and $0.7 million, respectively, in connection with the 2016 partially secured loan and other early exercises of equity awards. Principal amounts due under the 2016 partially secured loan are included in Notes Due From Affiliates as a reduction in stockholders’ equity on the condensed consolidated balance sheets.
Other Related Party Transactions
Non-executive director, James Synge, is a Principal and Partner of Carthona Capital. During the year ended December 31, 2021, the Company entered into a consultancy agreement with non-executive director, James Synge. Under this agreement, Mr. Synge agreed to provide consultancy services to the Company in relation to capital raising matters. During the three months ended March 31, 2022, Mr. Synge received consideration of $100,000 .
Annika Hulls is the spouse of the CEO and Executive Director, Chris Hulls. During the three months ended March 31, 2022, a cash payment of $6,500 was paid to Annika Hulls for services relating to a marketing campaign.
17. Defined Contribution Plan
37
Life360, Inc.
Notes to Condensed Consolidated Financial Statements (Unaudited)
| (Information as of June 30, 2022 and for the three and six months ended June 30, 2022 and 2021 is unaudited) | ||
18. Net Loss Per Share
The following table sets forth the computation of basic and diluted net loss per share (in thousands):
| Three Months Ended June 30, | Six Months Ended June 30, | ||||||||||||||||||||||
| 2022 | 2021 | 2022 | 2021 | ||||||||||||||||||||
| Net loss | $ | ( | $ | ( | $ | ( | $ | ( | |||||||||||||||
| Weighted-average shares used in computing net loss per share, basic and diluted | |||||||||||||||||||||||
| Net loss per share, basic and diluted | $ | ( | $ | ( | $ | ( | $ | ( | |||||||||||||||
The potential shares of common stock that were excluded from the computation of diluted net loss per share for the periods presented because including them would have been antidilutive are as follows:
| As of June 30, | As of December 31, | ||||||||||
| 2022 | 2021 | ||||||||||
| Issuances under stock incentive plan | |||||||||||
| Issuances upon exercise of common stock warrants | |||||||||||
| Issuances upon vesting of restricted stock units | |||||||||||
| Issuances of convertible notes | |||||||||||
| Shares reserved for shares available to be granted but not granted yet | |||||||||||
19. Subsequent Events
38
Item 2. Management’s Discussion and Analysis of Financial Condition and Results of Operations
Our management’s discussion and analysis of financial condition and results of operations (MD&A) is provided in addition to the accompanying condensed consolidated financial statements and accompanying notes to assist readers in understanding our results of operations, financial condition and cash flows.
Overview
Life360 is a leading technology platform, according to market share of the family safety and location sharing app market based on revenue, to locate the people, pets and things that matter most to families. Refer to “Market and Industry Data” within our registration statement on Form 10 filed with the Securities and Exchange Commission (the “SEC”) on April 26, 2022, as amended by Amendment No. 1 filed on June 13, 2022 and Amendment No. 2 filed on July 5, 2022, and effective as of June 27, 2022 (“Form 10”) for more information on how we calculate market share. Life360 is creating a new category at the intersection of family, technology, and safety to help keep families connected and safe. We provide safety services delivered through a mobile-native, subscription-based offering built around location-sharing, mobility, driving, and coordination. In 2021, we estimated 1 in 10 families in the United States used the Life360 Platform and, on average, our U.S. active users and members who have enabled push notifications used the service over 15 times a day to coordinate and communicate. We also provide coverage for the “what ifs” that families worry about most, ranging from driving safety, personal SOS, identity theft protection and more. Nothing is more important than family, and we help provide peace of mind in life’s unpredictable moments for families around the world.
Our platform recently entered a new era of location tracking services with the successful acquisitions of Jiobit and Tile. By offering devices and integrated software to members, we have expanded our addressable market to provide members of all ages with a vertically integrated, cross-platform solution of scale. Our core competencies in engineering, data analytics, product design, personalization and assessment are applicable not only to location sharing but also other adjacent verticals and use cases. Life360 has a unique opportunity to further entrench its service by expanding offerings across our core and complementary verticals, such as location sharing, item tracking, crash and roadside assistance, identity theft protection, pet and children location sharing devices, and many more.
For the three months ended June 30, 2022 and 2021, Life360 generated:
•Total revenues of $48.8 million and $25.0 million, respectively, representing year-over-year growth of 95%;
•Subscription revenues of $36.0 million and $19.2 million, respectively, representing year-over-year growth of 87%;
•Hardware revenues of $6.8 million and $0 million, respectively, representing year-over-year growth of 100%;
•Other revenues of $6.0 million and $5.8 million, respectively, representing year-over-year growth of 4%;
•Gross profit of $29.3 million and $20.2 million, respectively, representing year-over-year growth of 45%;
•Net loss of $33.0 million and $6.8 million, respectively; and
•Adjusted EBITDA loss of $18.7 million and $3.3 million, respectively. For a reconciliation of Adjusted EBITDA to net loss, the most directly comparable GAAP measure, see “Non-GAAP Financial Measures.”
For the six months ended June 30, 2022 and 2021, Life360 generated:
•Total revenues of $99.8 million and $48.0 million, respectively, representing year-over-year growth of 108%;
•Subscription revenues of $69.1 million and $36.4 million, respectively, representing year-over-year growth of 90%;
•Hardware revenues of $16.5 million and $0 million, respectively, representing year-over-year growth of 100%;
•Other revenues of $14.3 million and $11.6 million, respectively, representing year-over-year growth of 23%;
•Gross profit of $64.4 million and $38.8 million, respectively, representing year-over-year growth of 66%;
•Net loss of $58.2 million and $10.7 million, respectively; and
•Adjusted EBITDA loss of $32.3 million and $4.8 million, respectively. For a reconciliation of Adjusted EBITDA to net loss, the most directly comparable GAAP measure, see “Non-GAAP Financial Measures.”
39
Impact of COVID-19
The COVID-19 pandemic had an initial impact on our operations and financial performance, as we saw decreased engagement and member growth in the early phase of the pandemic. To adapt to the COVID-19 impact, the Company paused the majority of paid user acquisition spend and implemented other expense management initiatives. Once past the immediate early phase of COVID-19, we saw a resumption of rapid growth and we experienced two successive quarters of record Paying Circle additions in the second half of 2021. The extent of the impact of the COVID-19 pandemic on our operational and financial performance going forward will depend on future developments, including the duration and spread of the outbreak, new information about additional variants, the availability and efficacy of vaccine distributions, additional or renewed actions by government authorities and private businesses to contain the pandemic or respond to its impact and altered consumer behavior, the pace of reopening, impact on our customers and our sales cycles, impact on our business operations, impact on our customer, employee or industry events, and effect on our vendors and other business partners, all of which are uncertain and cannot be predicted. Any such developments may have adverse impacts on global economic conditions, including disruptions of the supply chain globally, labor shortages and consumer confidence and spending, and could materially adversely affect demand, or subscribers’ ability to pay, for our products and services. We considered the impact of COVID-19 on the assumptions and estimates used and determined there were no material adverse impacts on our condensed consolidated financial statements for the six months ended June 30, 2022. As events related to COVID-19 continue to evolve, our assumptions and estimates may change materially in future periods.
Impact of the Russian Invasion of Ukraine
The credit and financial markets have experienced extreme volatility and disruptions due to the current conflict between Ukraine and Russia. The conflict is expected to have further global economic consequences, including but not limited to the possibility of severely diminished liquidity and credit availability, declines in consumer confidence, declines in economic growth, increases in inflation rates and uncertainty about economic and political stability. In addition, the United States and other countries have imposed sanctions on Russia which increases the risk that Russia, as a retaliatory action, may launch cyberattacks against the United States, its government, infrastructure and businesses. Consequences of the conflict, including the aforementioned and those we cannot yet predict, may cause our business, financial condition, results of operations and the price of our shares of common stock to be adversely affected. We considered the impact of the Russian invasion of Ukraine on the assumptions and estimates used and determined there were no material adverse impacts on our condensed consolidated financial statements for the six months ended June 30, 2022. As events related to the Russian invasion of Ukraine continue to evolve, our assumptions and estimates may change materially in future periods.
Key Factors Affecting Our Performance
As we focus on growing our customers and revenue, and achieving profitability while investing for the future and managing risk, expenses and capital, the following factors and others identified in the section of this Quarterly Report on Form 10-Q titled “Risk Factors” have been important to our business and we expect them to impact our operations in future periods:
Ability to Retain Trusted Brand. We strongly believe in our vision to become the indispensable safety membership for families, with a suite of safety services that span every life stage of the family. Our business model and future success are dependent on the value and reputation of the Life360, Jiobit and Tile brands. Our brand is trusted by over 42 million members as of June 30, 2022, and because we know the value of trust is immeasurable, we will continue to work tirelessly to ensure that we provide useful, reliable, trustworthy and innovative products and services.
Attract, Retain and Convert Members. Our business model is based on attracting new members to our platform, converting free members to subscribers, and retaining and expanding subscriptions over time. Our continued success depends in part on our ability to offer compelling new products and features to our members, and to continue providing a quality user experience to retain paying subscribers. We will also seek to increase brand awareness and customer adoption of our platform through various programs and digital and broad-scale advertising.
Maintaining Efficient Member Acquisition. Our investment in developing effective services and devices creates an efficient member acquisition model which drives strong unit economics. The organic member acquisition is complemented with our word-of-mouth and freemium model. We accelerate our organic member acquisition with strategic and targeted paid marketing spend. We expect to continue to invest in product and marketing, while balancing growth with strong unit economics. As we continue to expand internationally, we may increase our targeted marketing investments.
40
Growth in Average Revenue Per Paying Circle (“ARPPC”). Our business model is dependent upon our ability to grow and maintain a large member base, including growing the number of Paying Circles. We have a sophisticated understanding of our members, and as a result, the services we provide are core to families and hard to switch out of. We continue to develop new monetization features leveraging our core technologies to offer additional services, expand into more stages of families and enter new verticals to increase adoption. Many factors will affect the ARPPC including the number of Paying Circles, mix of monetization offerings on our platform, as well as demographic shifts and geographic differences across these variables.
Expanding the Offerings on Our Platform. We are continually evaluating new product offerings that are aligned with our core competencies and the needs of families across the life stage continuum. For example, our acquisition of Tile gives our members the ability to seamlessly leverage Bluetooth-enabled smart trackers, which can equip nearly any item—such as wallets, keys or remotes—with location-based finding technology. Likewise, our acquisition of Jiobit will allow our subscribers to track family members and pets wearing Jiobit devices via a single unified family map. We will continue to invest in and launch products where we see opportunities to grow our platform.
Attracting and Retaining Talent. We compete for talent in the technology industry. Our business relies on the ability to attract and retain talent, including engineers, data scientists, designers and software developers. As of June 30, 2022, we had approximately 600 employees and contractors. Our core values are aimed at simplifying safety for families and we believe there are people who want to work at a values-driven company like Life360. We believe that our ability to recruit talent is aided by our reputation.
Seasonality. We experience seasonality in our user growth, engagement, Paying Circles growth and monetization on our platform. Life360 has historically experienced member and subscription growth seasonality in the third quarter of each calendar year, which includes the return to school for many of our members. Hardware sales have historically experienced revenue seasonality in the fourth quarter of each calendar year, which includes the important selling periods in November (Black Friday and Cyber Monday) and December (Christmas and Hanukkah) in large part due to seasonal holiday demand. As the majority of revenue is generated within the United States, our seasonality primarily relates to U.S. events. Accordingly, an unexpected decrease in sales over those traditionally high-volume selling periods may impact our revenue, result in surplus inventory and could have a disproportionate effect on our operating results for the entire fiscal year. Seasonality in our business can also be affected by introductions of new or enhanced products and services, including the costs associated with such introductions.
Continued Investment in Growth. We expect expenses to increase as we intend to continue to make focused investments to increase revenue and scale operations to support the growth of our business. We plan to further invest in research and development as we hire employees in engineering, product, and design to enhance our platform and support the needs of our growing member base. We also plan to invest in sales and marketing activities to drive our subscriptions and increase our brand awareness. We expect to incur additional general and administrative expenses to support our growth and our transition to being a U.S. reporting company. Further, we continue to make investments in our technical infrastructure to support user and employee growth which will increase expenses and capital expenditures. As cost of revenue, operating expenses, and capital expenditures fluctuate over time, we may experience short-term, negative impacts to our results of operations and cash flows, but we are undertaking such investments in the belief that they will contribute to long-term growth.
International Expansion. Our international active member base of 14.9 million increased 23% for the six months ended June 30, 2022 compared to the six months ended June 30, 2021. We believe our global opportunity is significant, and to address this opportunity, we intend to continue to invest in sales and marketing efforts and infrastructure and personnel to support our international expansion, including undertaking initiatives such as the first international launch of our subscription offering in Canada during the fourth quarter of 2021. Our growth will depend in part on the adoption and sales of our products and services in international markets.
Key Performance Indicators
We review several operating metrics, including the following key performance indicators, to evaluate our business, measure our performance, identify trends affecting our business, formulate financial projections and make strategic decisions. We believe these key performance indicators are useful to investors because they allow for greater transparency with respect to key metrics used by management in its financial and operational decision-making, and they may be used by investors to help analyze the health of our business. Key operating metrics are presented in millions, except ARPPC,
41
however percentage changes are calculated based on actual results. As a result, percentage changes may not recalculate based on figures presented due to rounding.
Key Operating Metrics
| As of June 30, | |||||||||||
| 2022 | 2021 | ||||||||||
| (in millions, except ARPPC) | |||||||||||
| AMR | $ | 174.4 | $ | 105.9 | |||||||
| Members | 42.0 | 32.4 | |||||||||
| Paying Circles | 1.42 | 1.01 | |||||||||
| ARPPC | $ | 89.34 | $ | 79.95 | |||||||
Annualized Monthly Revenue
We use Annualized Monthly Revenue (“AMR”) to identify the annualized monthly value of active customer agreements at the end of a reporting period. AMR includes the annualized monthly value of subscription, data and partnership agreements. All components of these agreements that are not expected to recur are excluded. AMR as of June 30, 2022 and 2021 was $174.4 million and $105.9 million, respectively.
Members
We have a large and growing member base located in over 150 countries as of June 30, 2022, comprised primarily of safety-conscious families who have a high propensity to pay for premium offerings. A Life360 monthly active user (“MAU”) is defined as a unique user who engages with our Life360 branded services each month, which includes both paying and non-paying members. As of June 30, 2022 and 2021, we had over 42 million and over 32.4 million MAUs on the Life360 Platform, respectively, representing a year-over-year increase of 29% and a compounded annual growth rate (“CAGR”) of 21% from June 2019 to June 2022. This has been driven by continued strong organic member growth and the introduction of paid member acquisition.
Paying Circles
Each subscription covers all members in the payor’s Circle so that everyone in the Circle can utilize the benefits of a Life360 Premium Membership, including access to premium location, driving, digital and emergency safety insights and services.
As of June 30, 2022 and 2021, we had approximately 1.42 million and 1.01 million paid subscribers to services under our Life360 brand, respectively, representing an increase of 41% year-over-year and a CAGR of 26% from June 2019 to June 2022.
We grow the number of Paying Circles by growing our free member base, converting a greater number of members to subscribers, and retaining them over time with the provision of high-quality family and safety services. We have experienced strong recent growth in the number of paying subscribers, benefiting from a full year of the new family membership offering which was launched during the third quarter of the year ended December 31, 2020.
42
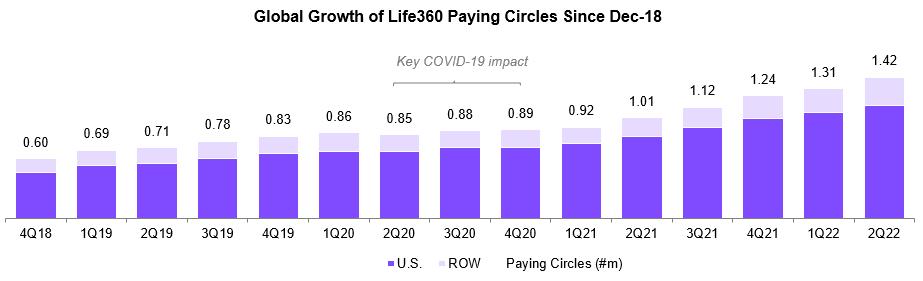
Retention by Member Cohorts
Due to the essential service provided by the Life360 Platform, we retain over 50% of U.S. organic members after three months, on average.
Following an expected initial churn of members post-download, the remaining member cohorts illustrate high retention with the churn rate significantly decreasing and largely stabilizing after six months. Ultimately, the strong retention of our member cohorts presents a constant opportunity to monetize and generate revenue growth from existing and new members, with approximately 30% of U.S. organic members remaining on the platform after three years.
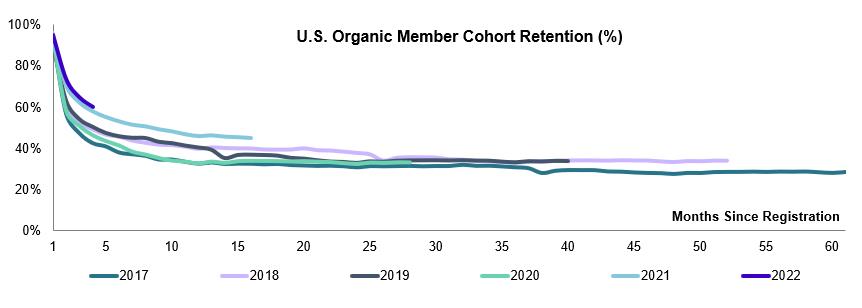
Conversion
New Paying Circles are primarily sourced from the conversion of existing free members, which typically occurs when they are seeking greater utility or features from the Life360 Platform, beyond our free offering. This characteristic of Life360 member behavior highlights how members are “pulled” rather than “pushed” towards the Life360 Paying Circle. Net growth in Paying Circles is also affected by our ability to retain existing Paying Circles. We have maintained high retention over time while also increasing our conversion rates as a result of new features and functionality, a theme we believe will only strengthen over time as the Life360 Service expands its product suite for Paying Circles. Our paid conversion reflects subscribers converting to paid subscriptions within the first month following their initial registration with the Life360 Platform.
43
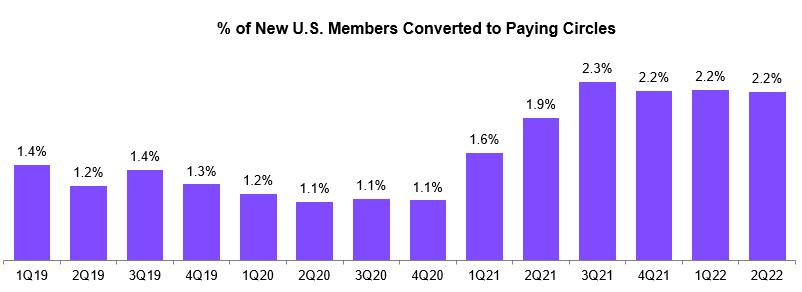
Total Average Revenue per Paying Circle
We define ARPPC as our revenue for the period presented divided by the Average Paying Circles during the same period. Average Paying Circles are calculated based on adding the number of Paying Circles as of the beginning of the period to the number of Paying Circles as of the end of the period, and then dividing by two.
As a result of an increase in Paying Circles combined with an increased mix of sales towards higher-priced subscription plans, we experienced an increase in our ARPPC for the six months ended June 30, 2022 compared to the six months ended June 30, 2021.
ARPPC is a key indicator utilized by Life360 to determine the effective penetration of our tiered product offering for Paying Circles. The implementation of various tiers of paying account offerings (i.e., Silver, Gold and Platinum in 2020) is evident as Life360’s share of wallet has consistently expanded. We believe these dynamics illustrate the potential upside in our key strategic focus of expanding the offering to international Paying Circles.
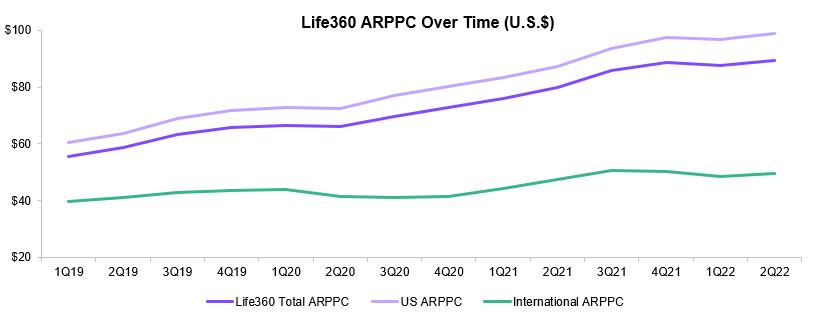
44
Non-GAAP Financial Measures
We collect and analyze operating and financial data to evaluate the health of our business, allocate our resources and assess our performance.
EBITDA and Adjusted EBITDA
In addition to total revenue, net loss and other results under GAAP, we utilize non-GAAP calculations of earnings before interest, taxes, depreciation and amortization (“EBITDA”) and adjusted earnings before interest, taxes, depreciation and amortization (“Adjusted EBITDA”). Adjusted EBITDA is defined as net loss, excluding (i) convertible notes and derivative liability fair value adjustments, (ii) provision (benefit) for income taxes, (iii) depreciation and amortization, (iv) other income (expense), (v) stock-based compensation, (vi) Form 10 transaction costs, (vii) acquisition and integration costs, and (viii) gain on revaluation of contingent consideration.
The above items are excluded from Adjusted EBITDA because these items are non-cash in nature, or because the amount and timing of these items are unpredictable, are not driven by core results of operations and render comparisons with prior periods and competitors less meaningful. We believe EBITDA and Adjusted EBITDA provide useful information to investors and others in understanding and evaluating our results of operations, as well as providing a useful measure for period-to-period comparisons of our business performance. Moreover, we have included EBITDA and Adjusted EBITDA in this Quarterly Report on Form 10-Q because they are key measurements used by our management team internally to make operating decisions, including those related to operating expenses, evaluate performance, and perform strategic planning and annual budgeting. However, these non-GAAP financial measures are presented for supplemental informational purposes only, should not be considered a substitute for or superior to financial information presented in accordance with GAAP, and may be different from similarly titled non-GAAP financial measures used by other companies. As such, you should consider these non-GAAP financial measures in addition to other financial performance measures presented in accordance with GAAP, including various cash flow metrics, net loss and our other GAAP results.
The following table presents a reconciliation of Net Loss, the most directly comparable GAAP measure, to EBITDA and Adjusted EBITDA.
| Three Months Ended June 30, | Six Months Ended June 30, | ||||||||||||||||||||||
| 2022 | 2021 | 2022 | 2021 | ||||||||||||||||||||
| (in thousands) | (in thousands) | ||||||||||||||||||||||
| EBITDA | |||||||||||||||||||||||
| Net Loss | $ | (32,985) | $ | (6,804) | $ | (58,207) | $ | (10,656) | |||||||||||||||
| Add (deduct): | |||||||||||||||||||||||
| Convertible notes fair value adjustment | (532) | — | (2,107) | — | |||||||||||||||||||
Derivative liability fair value adjustment (1) | (415) | — | (1,328) | — | |||||||||||||||||||
| Provision (benefit) for income taxes | (47) | — | 11 | — | |||||||||||||||||||
Depreciation and amortization (2) | 2,301 | 112 | 4,502 | 224 | |||||||||||||||||||
| Other (income) expense, net | 511 | (3) | 1,056 | (8) | |||||||||||||||||||
| EBITDA | $ | (31,167) | $ | (6,695) | $ | (56,073) | $ | (10,440) | |||||||||||||||
| Stock-based compensation | 10,429 | 2,941 | 16,524 | 5,140 | |||||||||||||||||||
| Form 10 transaction costs | 2,138 | — | 2,138 | — | |||||||||||||||||||
| Acquisition and integration costs | 1,136 | 499 | 10,394 | 499 | |||||||||||||||||||
| Gain on revaluation of contingent consideration | (1,279) | — | (5,279) | — | |||||||||||||||||||
| Adjusted EBITDA | $ | (18,743) | $ | (3,255) | $ | (32,296) | $ | (4,801) | |||||||||||||||
(1)To reflect the change in value of the derivative liability associated with the July 2021 Convertible Notes (defined below).
(2)Includes depreciation on fixed assets and amortization of acquired intangible assets.
45
Adjusted loss from ordinary activities after tax
Adjusted loss from ordinary activities after tax is defined as net loss, excluding (i) stock-based compensation, (ii) Form 10 transaction costs, (iii) acquisition and integration costs, (iv) gain on revaluation of contingent consideration, and (v) amortization attributable to intangible assets in connection with acquisitions.
The above items are excluded from net loss because these items are non-cash in nature, or because the amount and timing of these items are unpredictable, are not driven by core results of operations and render comparisons with prior periods and competitors less meaningful. This non-GAAP financial measure is presented for supplemental informational purposes only, should not be considered a substitute for or superior to financial information presented in accordance with GAAP, and may be different from similarly titled non-GAAP financial measures used by other companies. As such, you should consider this non-GAAP financial measure in addition to other financial performance measures presented in accordance with GAAP, including various cash flow metrics, net loss and our other GAAP results.
The following table presents a reconciliation of net loss, the most directly comparable GAAP measure, to Adjusted loss from ordinary activities after tax.
| Three Months Ended June 30, | Six Months Ended June 30, | ||||||||||||||||||||||
| 2022 | 2021 | 2022 | 2021 | ||||||||||||||||||||
| (in thousands) | (in thousands) | ||||||||||||||||||||||
| Net Loss | $ | (32,985) | $ | (6,804) | $ | (58,207) | $ | (10,656) | |||||||||||||||
| Add (deduct): | |||||||||||||||||||||||
| Stock-based compensation | 10,429 | 2,941 | 16,524 | 5,140 | |||||||||||||||||||
| Form 10 transaction costs | 2,138 | — | 2,138 | — | |||||||||||||||||||
| Acquisition and integration costs | 1,136 | 499 | 10,394 | 499 | |||||||||||||||||||
| Gain on revaluation of contingent consideration | (1,279) | — | (5,279) | — | |||||||||||||||||||
| Amortization attributable to intangible assets in connection with acquisitions | 2,178 | — | 4,254 | — | |||||||||||||||||||
| Adjusted loss from ordinary activities after tax | (18,383) | (3,364) | (30,176) | (5,017) | |||||||||||||||||||
Key Components of Our Results of Operations
The following discussion describes certain line items in our Condensed Consolidated Statements of Operations and Comprehensive Loss (unaudited).
The Company currently operates as one reportable and operating segment because its chief operating decision maker (“CODM”), which is its Chief Executive Officer, reviews its financial information on a consolidated basis for purposes of making decisions regarding allocating resources and assessing performance. The Company has no segment managers who are held accountable by the CODM for operations, operating results, and planning for levels of components below the consolidated unit level. In the future, the Company plans to integrate Life360, Tile and Jiobit into one platform.
Revenue
Subscription Revenue
We generate revenue from sales of subscriptions on our platforms. Revenue is recognized ratably over the related contractual term generally beginning on the date that our platform is made available to a customer. Our subscription agreements typically have monthly or annual contractual terms. Our agreements are generally non-cancellable during the contract term. We typically bill in advance for monthly and annual contracts. Amounts that have been billed are initially recorded as deferred revenue until the revenue is recognized.
Hardware Revenue
We generate a majority of our hardware revenue from the sale of the Tile and Jiobit hardware tracking devices and related accessories. For hardware and accessories, revenue is recognized at the time products are delivered. We sell hardware tracking devices and accessories through a number of channels including our website, brick and mortar retail and online retail.
46
Other Revenue
We also generate revenue through data monetization arrangements with certain third parties through data acquisition and license agreements for data collected from our member base for purposes of targeted advertising, research, analytics, attribution, and other commercial purposes. In January 2022, Life360 began to exit the traditional data sales business and transition to solely sales of aggregated data insights. In order to accomplish this, we executed a new partnership agreement with Placer, a prominent provider of aggregated analytics for the retail ecosystem. As part of this partnership, Placer will provide valuable data processing and analytics data to Life360 and will have the right to commercialize aggregated data related to place visits during the term of the agreement, while still providing members the option to opt out of even aggregated data sales. In keeping with our vision and consistent with that aggregated data sales model, we are exploring ways, in the future, to enable members to avail themselves of compelling offers and opportunities by enabling our partners to use their data with members’ explicit, affirmative opt-in consent. The Company is finalizing the termination of existing relationships with certain legacy data sales partners. The Placer agreement includes fixed monthly revenue amounts for unlimited access to aggregated data for the duration of the three-year agreement. Other revenue also includes partnership revenue.
Cost of Revenue and Gross Margin
Cost of Subscription
Cost of subscription primarily consists of expenses related to hosting our services and providing support. These expenses include employee-related costs associated with our cloud-based infrastructure and our customer support organization, third-party hosting fees, software, and maintenance costs, outside services associated with the delivery of our subscription services, personnel-related expenses, travel-related costs, amortization of acquired intangibles and allocated overhead, such as facilities, including rent, utilities, depreciation on equipment shared by all departments, credit card and transaction processing fees, and shared information technology costs. Personnel-related expenses include salaries, bonuses, benefits, and stock-based compensation for operations personnel.
We plan to continue increasing the capacity and enhancing the capability and reliability of our infrastructure to support user growth and increased use of our platform. We expect that cost of revenue will increase in absolute dollars in future periods.
Cost of Hardware Revenue
Cost of hardware revenue consists of product costs, including hardware production, contract manufacturers for production, shipping and handling, packaging, fulfillment, personnel-related expenses, manufacturing and equipment depreciation, warehousing, tariff costs, hosting, app fees, customer support costs, warranty replacement, and write-downs of excess and obsolete inventory. Personnel-related expenses include salaries, bonuses, benefits, and stock-based compensation for operations personnel.
Cost of Other Revenue
Cost of other revenue includes cloud-based hosting costs, as well as costs of product operations functions and employee-related costs associated with our data platform. Personnel-related expenses include salaries, bonuses, benefits, and stock-based compensation for operations personnel.
Gross Profit and Gross Profit Margin
Our gross profit has been, and may in the future be, influenced by several factors, including geographical revenue mix, timing of capital expenditures and related depreciation expense, increases in infrastructure costs, component costs, contract manufacturing and supplier pricing, and foreign currency exchange rates. Gross profit and gross profit margin may fluctuate over time based on the factors described above.
Operating Expenses
Our operating expenses consist of research and development, selling and marketing, and general and administrative expenses.
47
Research and Development
Our research and development expenses consist primarily of employee-related costs for our engineering, product, and design teams, material costs of building and developing prototypes for new products, mobile app development and allocated overhead. We believe that continued investment in our platform is important for our growth. We expect our research and development expenses will increase in absolute dollars as our business grows.
Sales and Marketing
Our sales and marketing expenses consist primarily of employee-related costs, brand marketing costs, lead generation costs, sales incentives, trade shows and events, sponsorships and amortization of acquired intangibles. Revenue-share payments to third parties in connection with annual subscription sales of the Company’s mobile application on third-party store platforms are considered to be incremental and recoverable costs of obtaining a contract with a customer and are deferred and typically amortized over an estimated period of benefit of two to three years depending on the subscription type.
We plan to continue to invest in sales and marketing to grow our member base and increase our brand awareness, including marketing efforts to continue to drive our business model. We expect that sales and marketing expenses will increase in absolute dollars in future periods and will fluctuate as a percentage of revenue. The trend and timing of sales and marketing expenses will depend in part on the timing of marketing campaigns.
General and Administrative
Our general and administrative expenses consist primarily of employee-related costs for our legal, finance, human resources, and other administrative teams, as well as certain executives. In addition, general and administrative expenses include allocated overhead, outside legal, accounting and other professional fees, change in fair value of contingent consideration for business combinations, and non-income-based taxes. We expect our general and administrative expenses will increase in absolute dollars as our business grows.
Convertible Notes Fair Value Adjustment
The Company issued convertible notes to investors in July 2021, and as part of the purchase consideration related to the Jiobit Acquisition in September 2021 (the “September 2021 Convertible Notes” and together with the July 2021 Convertible Notes, the “Convertible Notes”). The September 2021 Convertible Notes are recorded at fair value and are revalued at each reporting period.
Derivative Liability Fair Value Adjustment
Derivative liability fair value adjustment relates to the change in the fair value of the embedded conversion and redemption features associated with the July 2021 Convertible Notes.
Other Income (Expense), net
Other income (expense), net consists of interest income earned on our cash and cash equivalents balances, foreign currency exchange (losses)/gains related to the remeasurement of certain assets and liabilities of our foreign subsidiaries that are denominated in currencies other than the functional currency of the subsidiary and foreign exchange transactions gains/(losses) and interest expense primarily related to the Convertible Notes.
Provision (Benefit) for Income Taxes
Provision (benefit) for income taxes consists of U.S. federal and state income taxes in jurisdictions in which we conduct business. We maintain a full valuation allowance on our federal and state deferred tax assets as we have concluded that it is not more likely than not that the deferred tax assets will be realized.
Results of Operations
The following tables set forth our condensed consolidated statement of operations and comprehensive loss for the three and six months ended June 30, 2022 and 2021. We have derived this data from our condensed consolidated financial statements included elsewhere in this Quarterly Report on Form 10-Q. This information should be read in conjunction with
48
our condensed consolidated financial statements and related notes included elsewhere in this Quarterly Report on Form 10-Q. The results of historical periods are not necessarily indicative of the results of operations for any future period.
| Three Months Ended June 30, | Six Months Ended June 30, | ||||||||||||||||||||||||||||||||||
| 2022 | 2021 | % Change | 2022 | 2021 | % Change | ||||||||||||||||||||||||||||||
| (in thousands) | (in thousands) | ||||||||||||||||||||||||||||||||||
| Subscription revenue | $ | 36,006 | $ | 19,237 | 87 | % | $ | 69,068 | $ | 36,369 | 90 | % | |||||||||||||||||||||||
| Hardware revenue | 6,816 | — | 100 | % | 16,463 | — | 100 | % | |||||||||||||||||||||||||||
| Other revenue | 6,022 | 5,772 | 4 | % | 14,283 | 11,632 | 23 | % | |||||||||||||||||||||||||||
| Total revenue | 48,844 | 25,009 | 95 | % | 99,814 | 48,001 | 108 | % | |||||||||||||||||||||||||||
| Cost of subscription revenue | 7,903 | 3,786 | 109 | % | 14,974 | 7,520 | 99 | % | |||||||||||||||||||||||||||
| Cost of hardware revenue | 10,773 | — | 100 | % | 18,579 | — | 100 | % | |||||||||||||||||||||||||||
| Cost of other revenue | 880 | 974 | (10) | % | 1,855 | 1,729 | 7 | % | |||||||||||||||||||||||||||
| Total cost of revenue | 19,556 | 4,760 | 311 | % | 35,408 | 9,249 | 283 | % | |||||||||||||||||||||||||||
| Gross Profit | 29,288 | 20,249 | 45 | % | 64,406 | 38,752 | 66 | % | |||||||||||||||||||||||||||
Operating expenses(1): | |||||||||||||||||||||||||||||||||||
| Research and development | 27,031 | 12,016 | 125 | % | 52,768 | 22,708 | 132 | % | |||||||||||||||||||||||||||
| Sales and marketing | 22,895 | 10,586 | 116 | % | 46,137 | 18,796 | 145 | % | |||||||||||||||||||||||||||
| General and administrative | 12,830 | 4,454 | 188 | % | 26,076 | 7,907 | 230 | % | |||||||||||||||||||||||||||
| Total operating expenses | 62,756 | 27,056 | 132 | % | 124,981 | 49,411 | 153 | % | |||||||||||||||||||||||||||
| Loss from operations | (33,468) | (6,807) | 392 | % | (60,575) | (10,659) | 468 | % | |||||||||||||||||||||||||||
| Other income (expense): | |||||||||||||||||||||||||||||||||||
| Convertible notes fair value adjustment | 532 | — | 100 | % | 2,107 | — | 100 | % | |||||||||||||||||||||||||||
| Derivative liability fair value adjustment | 415 | — | 100 | % | 1,328 | — | 100 | % | |||||||||||||||||||||||||||
| Other income (expense), net | (511) | 3 | (17,133) | % | (1,056) | 3 | (35,300) | % | |||||||||||||||||||||||||||
| Total other income (expense), net | 436 | 3 | 14,433 | % | 2,379 | 3 | 79,200 | % | |||||||||||||||||||||||||||
| Loss before income taxes | (33,032) | (6,804) | 385 | % | (58,196) | (10,656) | 446 | % | |||||||||||||||||||||||||||
| Provision (benefit) for income taxes | (47) | — | 100 | % | 11 | — | 100 | % | |||||||||||||||||||||||||||
| Net Loss | $ | (32,985) | $ | (6,804) | 385 | % | $ | (58,207) | $ | (10,656) | 446 | % | |||||||||||||||||||||||
| Change in foreign currency translation adjustment | (14) | — | 100 | % | 15 | — | 100 | % | |||||||||||||||||||||||||||
| Total comprehensive loss | $ | (32,999) | $ | (6,804) | 385 | % | $ | (58,192) | $ | (10,656) | 446 | % | |||||||||||||||||||||||
____________________
(1)Includes stock-based compensation as follows:
| Three Months Ended June 30, | Six Months Ended June 30, | ||||||||||||||||||||||||||||||||||
| 2022 | 2021 | % Change | 2022 | 2021 | % Change | ||||||||||||||||||||||||||||||
| (in thousands) | (in thousands) | ||||||||||||||||||||||||||||||||||
| Cost of revenue | |||||||||||||||||||||||||||||||||||
| Subscription costs | $ | 239 | $ | 102 | 134 | % | $ | 438 | $ | 204 | 115 | % | |||||||||||||||||||||||
| Hardware costs | 240 | — | 100 | % | 289 | — | 100 | % | |||||||||||||||||||||||||||
| Other costs | 30 | 19 | 58 | % | 83 | 36 | 131 | % | |||||||||||||||||||||||||||
| Total cost of revenue | $ | 509 | $ | 121 | 321 | % | $ | 810 | $ | 240 | 238 | % | |||||||||||||||||||||||
| Research and development | 5,305 | 1,837 | 189 | % | 8,923 | 3,284 | 172 | % | |||||||||||||||||||||||||||
| Sales and marketing | 1,324 | 174 | 661 | % | 2,174 | 288 | 655 | % | |||||||||||||||||||||||||||
| General and administrative | 3,291 | 809 | 307 | % | 4,617 | 1,328 | 248 | % | |||||||||||||||||||||||||||
| Total stock-based compensation expense | $ | 10,429 | $ | 2,941 | 255 | % | $ | 16,524 | $ | 5,140 | 221 | % | |||||||||||||||||||||||
49
The following table sets forth our results of operations for each of the periods presented as a percentage of revenue:
| Three Months Ended June 30, | Six Months Ended June 30, | ||||||||||||||||||||||
| 2022 | 2021 | 2022 | 2021 | ||||||||||||||||||||
| Subscription revenue | 74 | % | 77 | % | 69 | % | 76 | % | |||||||||||||||
| Hardware revenue | 14 | % | — | % | 16 | % | — | % | |||||||||||||||
| Other revenue | 12 | % | 23 | % | 14 | % | 24 | % | |||||||||||||||
| Total revenue | 100 | % | 100 | % | 100 | % | 100 | % | |||||||||||||||
| Cost of subscription revenue | 16 | % | 15 | % | 15 | % | 16 | % | |||||||||||||||
| Cost of hardware revenue | 22 | % | — | % | 19 | % | — | % | |||||||||||||||
| Cost of other revenue | 2 | % | 4 | % | 2 | % | 4 | % | |||||||||||||||
| Total cost of revenue | 40 | % | 19 | % | 35 | % | 19 | % | |||||||||||||||
| Gross Profit | 60 | % | 81 | % | 65 | % | 81 | % | |||||||||||||||
| Operating expenses: | |||||||||||||||||||||||
| Research and development | 55 | % | 48 | % | 53 | % | 47 | % | |||||||||||||||
| Sales and marketing | 47 | % | 42 | % | 46 | % | 39 | % | |||||||||||||||
| General and administrative | 26 | % | 18 | % | 26 | % | 16 | % | |||||||||||||||
| Total operating expenses | 128 | % | 108 | % | 125 | % | 103 | % | |||||||||||||||
| Loss from operations | (69) | % | (27) | % | (61) | % | (22) | % | |||||||||||||||
| Other income (expense): | |||||||||||||||||||||||
| Convertible notes fair value adjustment | 1 | % | — | % | 2 | % | — | % | |||||||||||||||
| Derivative liability fair value adjustment | 1 | % | — | % | 1 | % | — | % | |||||||||||||||
| Other income (expense), net | (1) | % | — | % | (1) | % | — | % | |||||||||||||||
| Total other income (expense), net | 1 | % | — | % | 2 | % | — | % | |||||||||||||||
| Loss before income taxes | (68) | % | (27) | % | (58) | % | (22) | % | |||||||||||||||
| Provision (benefit) for income taxes | — | % | — | % | — | % | — | % | |||||||||||||||
| Net Loss | (68) | % | (27) | % | (58) | % | (22) | % | |||||||||||||||
| Change in foreign currency translation adjustment | — | % | — | % | — | % | — | % | |||||||||||||||
| Total comprehensive loss | (68) | % | (27) | % | (58) | % | (22) | % | |||||||||||||||
Comparison of the three and six months ended June 30, 2022 and 2021.
Revenue
| Three Months Ended June 30, | Change | ||||||||||||||||||||||
| 2022 | 2021 | $ | % | ||||||||||||||||||||
| (in thousands) | |||||||||||||||||||||||
| Subscription revenue | $ | 36,006 | $ | 19,237 | $ | 16,769 | 87 | % | |||||||||||||||
| Hardware revenue | 6,816 | — | 6,816 | 100 | % | ||||||||||||||||||
| Other revenue | 6,022 | 5,772 | 250 | 4 | % | ||||||||||||||||||
| Total revenue | $ | 48,844 | $ | 25,009 | $ | 23,835 | 95 | % | |||||||||||||||
Total revenue increased $23.8 million, or 95%, during the three months ended June 30, 2022 as compared to the three months ended June 30, 2021.
Subscription revenue increased $16.8 million, or 87%, during the three months ended June 30, 2022 as compared to the three months ended June 30, 2021 primarily due to growth in Paying Circles and ARPPC as we continue to invest in a variety of customer programs and initiatives, which, along with expanded customer use cases, have helped increase our subscription revenue over time. In addition, the increase was also attributable to the inclusion of Tile and Jiobit subscription services of $5.6 million.
50
Hardware revenue increased $6.8 million, or 100%, during the three months ended June 30, 2022 as compared to the three months ended June 30, 2021 due to the inclusion of hardware sales related to Tile and Jiobit hardware devices.
Other revenue increased $0.3 million, or 4%, during the three months ended June 30, 2022 as compared to the three months ended June 30, 2021, due to increased volume as a result of continued demand for data products.
| Six Months Ended June 30, | Change | ||||||||||||||||||||||
| 2022 | 2021 | $ | % | ||||||||||||||||||||
| (in thousands) | |||||||||||||||||||||||
| Subscription revenue | $ | 69,068 | $ | 36,369 | $ | 32,699 | 90 | % | |||||||||||||||
| Hardware revenue | 16,463 | — | 16,463 | 100 | % | ||||||||||||||||||
| Other revenue | 14,283 | 11,632 | 2,651 | 23 | % | ||||||||||||||||||
| Total revenue | $ | 99,814 | $ | 48,001 | $ | 51,813 | 108 | % | |||||||||||||||
Total revenue increased $51.8 million, or 108%, during the six months ended June 30, 2022 as compared to the six months ended June 30, 2021.
Subscription revenue increased $32.7 million, or 90%, during the six months ended June 30, 2022 as compared to the six months ended June 30, 2021 primarily due to growth in Paying Circles and ARPPC as we continue to invest in a variety of customer programs and initiatives, which, along with expanded customer use cases, have helped increase our subscription revenue over time. In addition, the increase was also attributable to the inclusion of Tile and Jiobit subscription services of $10.8 million.
Hardware revenue increased $16.5 million, or 100%, during the six months ended June 30, 2022 as compared to the six months ended June 30, 2021 due to the inclusion of hardware sales related to Tile and Jiobit hardware devices.
Other revenue increased $2.7 million, or 23%, during the six months ended June 30, 2022 as compared to the six months ended June 30, 2021, due to increased volume as a result of continued demand for data products.
Cost of Revenue, Gross Profit, and Gross Margin
| Three Months Ended June 30, | Change | ||||||||||||||||||||||
| 2022 | 2021 | $ | % | ||||||||||||||||||||
| (in thousands) | |||||||||||||||||||||||
| Subscription costs | $ | 7,903 | $ | 3,786 | $ | 4,117 | 109 | % | |||||||||||||||
| Hardware costs | 10,773 | — | 10,773 | 100 | % | ||||||||||||||||||
| Other costs | 880 | 974 | (94) | (10) | % | ||||||||||||||||||
| Total cost of revenue | 19,556 | 4,760 | 14,796 | ||||||||||||||||||||
| Gross profit | $ | 29,288 | $ | 20,249 | $ | 9,039 | |||||||||||||||||
| Gross margin: | |||||||||||||||||||||||
| Subscription | 78 | % | 80 | % | |||||||||||||||||||
| Hardware | (58) | % | — | % | |||||||||||||||||||
| Other | 85 | % | 83 | % | |||||||||||||||||||
Cost of subscription revenue increased by $4.1 million, or 109%, during the three months ended June 30, 2022 as compared to the three months ended June 30, 2021, primarily due to $2.5 million in technology expenses due to higher costs related to cloud infrastructure associated with the Tile and Jiobit acquisitions, an increase of $0.8 million in subscription offerings due to an increase in direct costs related to new product offerings, and an increase of $0.5 million in personnel and related costs and stock-based compensation due to increased headcount. The remaining increase of $0.3 million is attributable to other expenses associated with Company growth.
51
Subscription margin decreased to 78% during the three months ended June 30, 2022 from 80% during the three months ended June 30, 2021, primarily due to a decreased volume of higher margin offerings.
Cost of hardware revenue increased by $10.8 million, or 100%, during the three months ended June 30, 2022 as compared to the three months ended June 30, 2021, primarily due to the inclusion of hardware costs of approximately $7.1 million related to Tile and Jiobit hardware costs, an additional $1.5 million in technology expenses primarily related to cloud and data server infrastructure, and $1.5 million in additional personnel-related costs and stock-based compensation due to increased headcount. The remaining increase of $0.7 million is attributable to other cost of hardware revenue related expenses.
Hardware margin decreased to (58)% during the three months ended June 30, 2022 as compared to the three months ended June 30, 2021 and was negatively impacted by the inclusion of the amortization expense recognized on acquired technology related to intangible assets as well as the inclusion of additional personnel-related costs and stock-based compensation due to increased headcount.
Other cost of revenue decreased by $0.1 million, or 10%, during the three months ended June 30, 2022 as compared to the three months ended June 30, 2021, due to a decrease of $0.1 million in technology expenses due to lower costs related to cloud infrastructure.
Other margin increased to 85% during the three months ended June 30, 2022 from 83% during the three months ended June 30, 2021, primarily due to infrastructure optimization.
| Six Months Ended June 30, | Change | ||||||||||||||||||||||
| 2022 | 2021 | $ | % | ||||||||||||||||||||
| (in thousands) | |||||||||||||||||||||||
| Subscription costs | $ | 14,974 | $ | 7,520 | $ | 7,454 | 99 | % | |||||||||||||||
| Hardware costs | 18,579 | — | 18,579 | 100 | % | ||||||||||||||||||
| Other costs | 1,855 | 1,729 | 126 | 7 | % | ||||||||||||||||||
| Total cost of revenue | 35,408 | 9,249 | 26,159 | ||||||||||||||||||||
| Gross profit | $ | 64,406 | $ | 38,752 | $ | 25,654 | |||||||||||||||||
| Gross margin: | |||||||||||||||||||||||
| Subscription | 78 | % | 79 | % | |||||||||||||||||||
| Hardware | (13) | % | — | % | |||||||||||||||||||
| Other | 87 | % | 85 | % | |||||||||||||||||||
Cost of subscription revenue increased by $7.5 million, or 99%, during the six months ended June 30, 2022 as compared to the six months ended June 30, 2021, primarily due to $4.6 million in technology expenses due to higher costs related to cloud infrastructure associated with the Tile and Jiobit acquisitions, an increase of $1.4 million in subscription offerings due to an increase in direct costs related to new product offerings, and an increase of $0.9 million in personnel and related costs and stock-based compensation due to increased headcount. The remaining increase of $0.6 million is attributable to other expenses associated with Company growth.
Subscription margin remained flat at 78% during the six months ended June 30, 2022 as compared to the six months ended June 30, 2021, primarily due to a consistent volume of higher margin offerings.
Cost of hardware revenue increased by $18.6 million, or 100%, during the six months ended June 30, 2022 as compared to the six months ended June 30, 2021, primarily due to the inclusion of hardware costs of approximately $12.7 million related to Tile and Jiobit hardware costs, an additional $2.4 million in technology expenses primarily related to cloud and data server infrastructure, an additional $0.8 million in professional and other expenses, and an additional $2.3 million in personnel-related costs and stock-based compensation due to increased headcount. The remaining increase of $0.4 million is attributable to other cost of hardware revenue related expenses.
Hardware margin decreased to (13)% during the six months ended June 30, 2022 as compared to the six months ended June 30, 2021 and was negatively impacted by the inclusion of the amortization expense recognized on acquired technology related to intangible assets as well as the inclusion of additional personnel-related costs and stock-based compensation due to increased headcount.
52
Other cost of revenue increased by $0.1 million, or 7%, during the six months ended June 30, 2022 as compared to the six months ended June 30, 2021, primarily due to an increase of $0.1 million in technology expenses due to higher costs related to cloud infrastructure.
Other margin increased to 87% during the six months ended June 30, 2022 from 85% during the six months ended June 30, 2021, primarily due to infrastructure optimization.
Research and Development
| Three Months Ended June 30, | Change | ||||||||||||||||||||||
| 2022 | 2021 | $ | % | ||||||||||||||||||||
| (in thousands) | |||||||||||||||||||||||
| Research and development | $ | 27,031 | $ | 12,016 | $ | 15,015 | 125 | % | |||||||||||||||
Research and development expenses increased $15.0 million, or 125%, during the three months ended June 30, 2022 as compared to the three months ended June 30, 2021. The increase was primarily due to an increase of $11.1 million in personnel-related costs and stock based compensation due to headcount growth attributable to the Tile and Jiobit acquisitions, an increase of $1.7 million in professional and outside services due to higher contractor spend as a result of increased scaling of the combined business, an increase of $1.2 million in technology expenses due to higher costs primarily related to cloud and data server infrastructure, and a $0.7 million increase in facilities and other expenses to support headcount growth. The remaining increase of $0.3 million is attributable to other technology related expenses.
| Six Months Ended June 30, | Change | ||||||||||||||||||||||
| 2022 | 2021 | $ | % | ||||||||||||||||||||
| (in thousands) | |||||||||||||||||||||||
| Research and development | $ | 52,768 | $ | 22,708 | $ | 30,060 | 132 | % | |||||||||||||||
Research and development expenses increased $30.1 million, or 132%, during the six months ended June 30, 2022 as compared to the six months ended June 30, 2021. The increase was primarily due to an increase of $21.3 million in personnel-related costs and stock based compensation due to headcount growth attributable to the Tile and Jiobit acquisitions, an increase of $4.2 million in professional and outside services due to higher contractor spend as a result of increased scaling of the combined business, an increase of $2.6 million in technology expenses due to higher costs primarily related to cloud and data server infrastructure, and a $0.8 million increase in facilities and other expenses to support headcount growth. The remaining increase of $1.2 million is attributable to other technology related expenses.
Sales and Marketing
| Three Months Ended June 30, | Change | ||||||||||||||||||||||
| 2022 | 2021 | $ | % | ||||||||||||||||||||
| (in thousands) | |||||||||||||||||||||||
| Sales and marketing | $ | 22,895 | $ | 10,586 | $ | 12,309 | 116 | % | |||||||||||||||
Sales and marketing expenses increased $12.3 million, or 116%, during the three months ended June 30, 2022 as compared to the three months ended June 30, 2021. This increase was primarily due to a $6.9 million increase in marketing expenses consisting of $3.3 million in paid user acquisition spend, $0.8 million related to brand spend, and $2.8 million in other marketing spend. The increase was also related to an increase of $3.6 million in personnel and related costs and stock-based compensation due to increased headcount, an increase of $1.1 million in depreciation and amortization related to the amortization of intangible assets acquired from the Tile and Jiobit acquisitions, an increase of $0.6 million due to higher contractor spend as a result of increased scaling of the business and acquisitions, and a $0.1 million increase in technology expenses due to higher costs to support headcount growth.
53
| Six Months Ended June 30, | Change | ||||||||||||||||||||||
| 2022 | 2021 | $ | % | ||||||||||||||||||||
| (in thousands) | |||||||||||||||||||||||
| Sales and marketing | $ | 46,137 | $ | 18,796 | $ | 27,341 | 145 | % | |||||||||||||||
Sales and marketing expenses increased $27.3 million, or 145%, during the six months ended June 30, 2022 as compared to the six months ended June 30, 2021. This increase was primarily due to a $16.7 million increase in marketing expenses consisting of $6.6 million in paid user acquisition spend, $1.7 million related to brand spend, and $8.4 million of other marketing spend. The increase was also related to an increase of $6.7 million in personnel and related costs and stock-based compensation due to increased headcount, an increase of $2.1 million in depreciation and amortization related to the amortization of intangible assets acquired from the Tile and Jiobit acquisitions, an increase of $1.3 million due to higher contractor spend as a result of increased scaling of the business and acquisitions, and a $0.5 million increase in technology expenses due to higher costs to support headcount growth.
General and Administrative
| Three Months Ended June 30, | Change | ||||||||||||||||||||||
| 2022 | 2021 | $ | % | ||||||||||||||||||||
| (in thousands) | |||||||||||||||||||||||
| General and administrative | $ | 12,830 | $ | 4,454 | $ | 8,376 | 188 | % | |||||||||||||||
General and administrative expense increased $8.4 million, or 188%, during the three months ended June 30, 2022 as compared to the three months ended June 30, 2021. As a result of our continued investment in headcount and recent acquisitions, personnel and related costs and stock-based compensation increased by $5.6 million. In addition, professional and outside services increased by $3.8 million primarily due to increased expenses related to accounting, legal and advisors due to the Company’s Form 10 filing in April 2022. These increases were offset by a reduction in the fair value of contingent consideration related to Jiobit of approximately $1.3 million as it was determined a portion of the contingent consideration metrics would not be met. The remaining increase of $0.3 million is attributable to other general and administrative expenses associated with Company growth.
| Six Months Ended June 30, | Change | ||||||||||||||||||||||
| 2022 | 2021 | $ | % | ||||||||||||||||||||
| (in thousands) | |||||||||||||||||||||||
| General and administrative | $ | 26,076 | $ | 7,907 | $ | 18,169 | 230 | % | |||||||||||||||
General and administrative expense increased $18.2 million, or 230%, during the six months ended June 30, 2022 as compared to the six months ended June 30, 2021. As a result of our continued investment in headcount and recent acquisitions, personnel and related costs and stock-based compensation increased by $11.3 million. In addition, professional and outside services increased by $11.0 million primarily due to Tile Acquisition costs of approximately $5.0 million and increased expenses related to accounting, legal and advisors due to the Company’s Form 10 filing in April 2022. The Company also saw a $0.5 million increase in technology expenses and a $0.3 million increase in facilities expenses due to higher costs to support headcount growth. These increases were offset by a reduction in the fair value of contingent consideration related to Jiobit of approximately $5.3 million as it was determined a portion of the contingent consideration metrics would not be met. The remaining increase of $0.4 million is attributable to other general and administrative expenses associated with Company growth.
Convertible Notes Fair Value Adjustment
The Company issued convertible notes to investors in July 2021, and as part of the purchase consideration related to the Jiobit Acquisition in September 2021 (the “September 2021 Convertible Notes” and together with the July 2021 Convertible Notes, the “Convertible Notes”). The September 2021 Convertible Notes are recorded at fair value and are revalued at each reporting period. The convertible notes fair value adjustment decreased $0.5 million and $2.1 million during the three and six months ended June 30, 2022, respectively. There was no fair value adjustment related to convertible notes recorded during the three and six months ended June 30, 2021.
54
Derivative Liability Fair Value Adjustment
The derivative liability fair value decreased $0.4 million, or 100%, during the three months ended June 30, 2022 as compared to the three months ended June 30, 2021 and $1.3 million, or 100%, during the six months ended June 30, 2022 as compared to the six months ended June 30, 2021. The decrease is due to the revaluation of the derivative liability at each reporting period and is related to embedded redemption features bifurcated from the July 2021 Convertible Notes issued to investors.
Other Income (Expense), Net
Other income (expense), net increased $0.5 million, or 17,133%, during the three months ended June 30, 2022 as compared to the three months ended June 30, 2021 and $1.1 million, or 35,300% during the six months ended June 30, 2022 as compared to the six months ended June 30, 2021. The other expense includes an increase in interest expense associated with the Convertible Notes and an increase in foreign exchange losses.
Provision (Benefit) for Income Taxes
The provision (benefit) for income taxes increased an immaterial amount, during the three months ended June 30, 2022 as compared to the three months ended June 30, 2021 and increased an immaterial amount during the six months ended June 30, 2022 as compared to the six months ended June 30, 2021. The increases are primarily due to the tax effects related to the Tile Acquisition.
Liquidity and Capital Resources
We believe that our existing cash and cash equivalents and cash provided by sales of our subscriptions and hardware devices will be sufficient to support working capital and capital expenditure requirements for at least the next 12 months. Our future capital requirements will depend on many factors and as a result, we may be required to seek additional capital. If we are unable to raise additional capital on terms acceptable to us or at all or generate cash flows necessary to expand our operations and invest in continued innovation, we may not be able to compete successfully, which would harm our business, financial condition and results of operations.
A number of our users pay in advance for annual subscriptions, while a majority pay in advance for monthly subscriptions. Deferred revenue consists of the unearned portion of customer billings, which is recognized as revenue in accordance with our revenue recognition policy. As of June 30, 2022 and 2021, we had deferred revenue of $28.3 million and $12.0 million, respectively, which is expected to be recorded as revenue in the next 12 months, provided all other revenue recognition criteria have been met.
Our cash flow activities were as follows for the periods presented:
| Six Months Ended June 30, | |||||||||||
| 2022 | 2021 | ||||||||||
| (in thousands) | |||||||||||
Net cash used in operating activities | $ | (38,528) | $ | (4,919) | |||||||
Net cash used by investing activities | (113,797) | (2,500) | |||||||||
Net cash provided by financing activities | 300 | 1,563 | |||||||||
Net decrease in cash and cash equivalents | $ | (152,025) | $ | (5,856) | |||||||
Operating Activities
Our largest source of operating cash is cash collections from our paying users for subscriptions to our platform. Our primary uses of cash from operating activities are for employee-related expenditures, inventory, infrastructure-related costs, and marketing expenses. Net cash used in operating activities is impacted by our net loss adjusted for certain non-cash items, including depreciation and amortization expenses, amortization of costs capitalized to obtain a contract, and stock-based compensation, as well as the effect of changes in operating assets and liabilities.
For the six months ended June 30, 2022, net cash used in operating activities was $38.5 million. The primary factors affecting our operating cash flows during this period were our net loss of $58.2 million, impacted by $13.6 million non-
55
cash charges, and $6.1 million of cash provided by changes in our operating assets and liabilities. The non-cash charges primarily consisted of $16.5 million in stock-based compensation, $2.1 million gain in convertible notes fair value adjustment, $5.3 million in gain on revaluation of contingent consideration, $1.3 million gain in derivative liability fair value adjustment, $0.5 million noncash revenue from affiliate, and $4.5 million of depreciation and amortization. The cash provided by changes in our operating assets and liabilities was primarily due to a $20.1 million decrease in accounts receivable, a $6.6 million decrease in prepaid expenses and other assets, a $0.4 million increase in other noncurrent liabilities, and a $0.5 million increase in deferred revenue. These amounts were partially offset by a $1.8 million increase in costs capitalized to obtain contracts, a $15.0 million decrease in accounts payable, a $1.6 million increase in inventory, and a $3.1 million decrease in accrued expenses and other liabilities.
For the six months ended June 30, 2021, net cash used in operating activities was $4.9 million. The primary factors affecting our operating cash flows during this period were our net loss of $10.7 million, impacted by $7.6 million non-cash charges and $1.9 million of cash used by changes in our operating assets and liabilities. The non-cash charges primarily consisted of $5.1 million in stock-based compensation and $2.5 million in depreciation and amortization. The cash used by changes in our operating assets and liabilities was primarily due to a $3.0 million increase in accounts receivable, net, a $1.0 million increase in costs capitalized to obtain contracts, net, and a $1.5 million decrease in accounts payable. These amounts were partially offset by a $3.5 million decrease in prepaid expenses and other assets.
Investing Activities
For the six months ended June 30, 2022, net cash used in investing activities was $113.8 million, which related to $113.4 million of cash paid for the Tile Acquisition, net of cash acquired and $0.4 million related to the capitalization of internal use software costs.
For the six months ended June 30, 2021, net cash used in investing activities was $2.5 million, which related to a cash advance on convertible note receivable.
Financing Activities
For the six months ended June 30, 2022, net cash provided by financing activities was $0.3 million, which primarily related to $0.3 million of proceeds from the exercise of stock options net of taxes paid related to net settlement of equity awards.
For the six months ended June 30, 2021, net cash provided by financing activities was $1.6 million, which primarily related to $2.1 million in cash received in advance of the issuance of convertible notes offset by $0.5 million of
cash used by the exercise of stock options net of taxes paid related to net settlement of equity awards.
Obligations and Other Commitments
Our principal commitments consist of obligations under our convertible notes, operating leases for office space, and other purchase commitments. Our obligations under our convertible notes are described in the “Liquidity and Capital Resources” section and in Notes 6 and 9 to our condensed consolidated financial statements. Information regarding our non-cancellable lease and other purchase commitments as of June 30, 2022, can be found in Notes 8 and 11 to our condensed consolidated financial statements.
Critical Accounting Policies and Significant Management Estimates
Our condensed consolidated financial statements are prepared in accordance with GAAP. The preparation of condensed consolidated financial statements requires us to make estimates and assumptions that affect the reported amounts of assets, liabilities, revenues, expenses and related disclosures. We base our estimates on historical experience and on various other assumptions we believe to be reasonable under the circumstances. Actual results could differ materially from the estimates made by our management. Other than items discussed in Note 2, “Summary of Significant Accounting Policies,” of our condensed consolidated financial statements, there have been no material changes to our critical accounting policies as compared to the critical accounting policies and significant judgments and estimates disclosed in our Form 10.
56
Item 3. Quantitative and Qualitative Disclosures About Market Risk
We are exposed to market risk in the ordinary course of our business. Market risk represents the risk of loss that may impact our financial position due to adverse changes in financial market prices and rates. Our market risk exposure is primarily the result of fluctuations in interest rates and foreign currency exchange rates.
Interest Rate Risk
As of June 30, 2022 and December 31, 2021, we had $79.3 million and $231.3 million of cash equivalents invested in cash and cash equivalents and money market funds, respectively. Our cash and cash equivalents are held for working capital purposes.
As of June 30, 2022 and December 31, 2021, a hypothetical 10% relative change in interest rates would not have a material impact on our condensed consolidated financial statements.
Foreign Currency Exchange Risk
Our reporting currency and functional currency is the U.S. dollar. All of our sales are denominated in U.S. dollars, and therefore our revenue is not currently subject to significant foreign currency risk. Our operating expenses are denominated in the currencies of the countries in which our operations are located, which is primarily in the United States. Our condensed consolidated results of operations and cash flows are, therefore, subject to fluctuations due to changes in foreign currency exchange rates and may be adversely affected in the future due to changes in foreign exchange rates. To date, we have not entered into any hedging arrangements with respect to foreign currency risk or other derivative financial instruments, although we may choose to do so in the future. We do not believe that a hypothetical 1,000 basis-point increase or decrease in the relative value of the U.S. dollar to other currencies would have a material effect on our operating results.
Inflation Risk
We do not believe that inflation has had a material effect on our business, results of operations, or financial condition. Nonetheless, if our costs were to become subject to significant inflationary pressures, we may not be able to fully offset such higher costs. Our inability or failure to do so could harm our business, results of operations, or financial condition.
Fair Value Risk
As of June 30, 2022 and December 31, 2021, we had $10.1 million and $23.2 million of liabilities that are measured at fair value, respectively. Fair value measurements include significant assumptions that are driven by market conditions and macroeconomic factors at measurement dates. Our condensed consolidated results of operations are therefore subject to market fluctuations and may be affected in the future as a result of these fair value changes.
Item 4. Controls and Procedures
The term “disclosure controls and procedures,” as defined in Rules 13a-15(e) and 15d-15(e) under the Exchange Act, refers to controls and procedures that are designed to ensure that information required to be disclosed by a company in the reports that it files or submits under the Exchange Act is recorded, processed, summarized and reported, within the time periods specified in the rules and forms of the SEC. Disclosure controls and procedures include, without limitation, controls and procedures designed to ensure that information required to be disclosed by a company in the reports that it files or submits under the Exchange Act is accumulated and communicated to the company’s management, including its principal executive and principal financial officers, or persons performing similar functions, as appropriate to allow timely decisions regarding required disclosure.
In designing and evaluating our disclosure controls and procedures, management recognizes that any controls and procedures, no matter how well designed and operated, can provide only reasonable assurance of achieving the desired control objectives. In addition, the design of disclosure controls and procedures must reflect the fact there are resource constraints and management is required to apply judgment in evaluating the benefits of possible controls and procedures relative to their costs.
57
Evaluation of Disclosure Controls and Procedures
Our management, with the participation of our Principal Executive Officer and Principal Financial Officer, evaluated, as of the end of the period covered by this Quarterly Report on Form 10-Q, the effectiveness of our disclosure controls and procedures (as defined in Rules 13a-15(e) and 15d-15(e) under the Exchange Act). Based on that evaluation, our Principal Executive Officer and Principal Financial Officer concluded our disclosure controls and procedures were effective at the reasonable assurance level as of June 30, 2022.
Changes in Internal Control Over Financial Reporting
No change in our internal control over financial reporting (as defined in Rules 13a-15(f) and 15d-15(f) under the Exchange Act) has occurred during the three months ended June 30, 2022 that has materially affected, or is reasonably likely to materially affect, our internal control over financial reporting.
58
PART II - OTHER INFORMATION
Item 1. Legal Proceedings
From time to time, we may be involved in legal proceedings, claims and government investigations in the ordinary course of business. We have received, and may in the future continue to receive, inquiries from regulators regarding our compliance with law and regulations, including those related to data protection and consumer rights, and due to the nature of our business and the rapidly evolving landscape of laws relating to data privacy, cybersecurity, consumer protection and data use, we expect to continue to be the subject of regulatory investigations and inquiries in the future. We have received, and may in the future continue to receive, claims from third parties relating to information or content that is published or made available on our platform, among other types of claims including those relating to, among other things, regulatory matters, commercial matters, intellectual property, competition, tax, employment, pricing, discrimination, and consumer rights. Future litigation may be necessary to defend ourselves, our partners, and our customers by determining the scope, enforceability, and validity of these claims. The results of any current or future regulatory inquiry or litigation cannot be predicted with certainty, and regardless of the outcome, such investigations and litigation can have an adverse impact on us because of defense and settlement costs, diversion of management resources, the potential for enforcement orders or settlements to impose operational restrictions or obligations on our business practices and other factors.
The information set forth under Note 11 “Commitments and Contingencies” in the notes to the condensed consolidated financial statements under the caption “Litigation” is incorporated herein by reference.
Item 1A. Risk Factors
There have been no material changes from the risk factors previously disclosed within Item 1A “Risk Factors” in the Form 10.
Item 2. Unregistered Sales of Equity Securities and Use of Proceeds
Share-based Compensation
During the three months ended June 30, 2022, we issued the following securities as compensation to certain of our employees and consultants:
On April 12, 2022, the Committee and the Board approved the grant of stock option awards to two employees, to acquire up to 237,408 shares of common stock under the Company’s 2011 Equity Incentive Plan. The option shares are exercisable at a price of $11.18 per share, which equaled the closing price of the common stock as of the date immediately prior to the grant date.
On May 20, 2022, the Committee and the Board approved the grant of stock option awards to its seven non-employee directors and the Company’s Chief Executive Officer, to acquire up to 439,053 shares of common stock under the Company’s 2011 Equity Incentive Plan. The option shares are exercisable at a price of $8.19 per share, which equaled the closing price of the common stock as of the date immediately prior to the grant date.
On June 8, 2022, the Company issued 179,118 shares of common stock to 168 employees and consultants in accordance with the vesting schedules set forth in RSU agreements previously entered into with such employees and consultants. The RSUs were a portion of the compensation paid to such employees and consultants for their services to us. Of the shares issued to employees, 108,822 shares were withheld by the Company to satisfy tax withholding obligations and/or to satisfy cash settlement options to employees, equaling approximately $0.8 million.
None of the foregoing transactions involved any underwriters, underwriting discounts or commissions, or any public offering. We believe the offers, sales, and issuances of the above securities were exempt from registration under the Securities Act of 1933, as amended (the “Securities Act”) by virtue of Section 4(a)(2) of the Securities Act or Regulation D promulgated thereunder because the issuance of securities to the recipients did not involve a public offering, or in reliance on Rule 701 because the transactions were pursuant to compensatory benefit plans or contracts relating to compensation as provided under such rule.
Item 3. Defaults Upon Senior Securities
None.
59
Item 4. Mine Safety Disclosures
Not applicable.
Item 5. Other Information
None.
60
Item 6. Exhibits
Exhibit No. | Description | |||||||
| 101.INS | XBRL Instance Document | |||||||
| 101.SCH | XBRL Schema Document | |||||||
| 101.CAL | XBRL Calculation Linkbase Document | |||||||
| 101.DEF | XBRL Definition Linkbase Document | |||||||
| 101.LAB | XBRL Label Linkbase Document | |||||||
| 101.PRE | XBRL Presentation Linkbase Document | |||||||
| 104 | Cover Page Interactive Data | |||||||
_____________________
* This certification is being furnished solely to accompany this Quarterly Report on Form 10-Q pursuant to 18 U.S.C. Section 1350, and is not being filed for purposes of Section 18 of the Exchange Act or otherwise subject to the liability of that section, nor shall it be deemed incorporated by reference into any filing of the registrant under the Securities Act or the Exchange Act, whether made before or after the date hereof, regardless of any general incorporation language in such filing.
§ Portions of this exhibit have been redacted in accordance with Regulation S-K Item 601(b)(10)(iv).
+ Corrected to reflect correct execution date. The exhibit was initially filed with the SEC on June 13, 2022 as Exhibit 10.14 to Amendment No. 1 to the Form 10.
61
SIGNATURES
Pursuant to the requirements of Section 13 of 15(d) of the Securities Exchange Act of 1934, the registrant has duly caused this report to be signed on its behalf by the undersigned, thereunto duly authorized.
| LIFE360, INC. | |||||||||||
| Dated: | August 15, 2022 | By: | /s/ Chris Hulls | ||||||||
| Chris Hulls | |||||||||||
| Chief Executive Officer | |||||||||||
| (Principal Executive Officer) | |||||||||||
| Dated: | August 15, 2022 | By: | /s/ Russell Burke | ||||||||
| Russell Burke | |||||||||||
| Chief Financial Officer | |||||||||||
| (Principal Financial Officer) | |||||||||||
62
EXHIBIT 10.1
CERTAIN IDENTIFIED INFORMATION HAS BEEN EXCLUDED FROM THE EXHIBIT BECAUSE IT IS BOTH NOT MATERIAL AND IS THE TYPE THAT THE REGISTRANT TREATS AS PRIVATE OR CONFIDENTIAL. SUCH EXCLUDED INFORMATION HAS BEEN MARKED WITH “[***].”
AMENDMENT NO. 1
TO
DATA SERVICES AND LICENSE AGREEMENT
Reference is made to the Data Services and License Agreement (the “Agreement”), effective as of January 26, 2022, by and between Life360, Inc., a Delaware corporation (“Life360”), and Placer Labs Inc., a Delaware corporation (“Placer”). Unless otherwise defined, capitalized terms herein have the same meaning as in the Agreement.
This AMENDMENT NO. 1 TO DATA SERVICES AND LICENSE AGREEMENT (this “Amendment”) is entered into by and between the parties as of June 8, 2022.
WHEREAS: The parties have been operating under the Agreement, and now desire to amend and modify certain provisions therein.
NOW, THEREFORE: Notwithstanding any other provisions in the Agreement, the parties agree, and the Agreement is accordingly amended and modified, as follows:
1. Section 2(f) of Attachment A of the Agreement is amended to add the following sub-sections (ii) and (iii):
[***]
[***]
2. In the event of any conflict between the Agreement and this Amendment, the provisions in this Amendment shall control. In all other respects, the Agreement shall remain in full force and effect.
3. This Amendment shall be governed by, and construed in accordance with, the laws of the State of California, without reference to conflicts of laws principles that would require the application of the laws of a different jurisdiction.
4. This Amendment may be executed in counterparts, each of which will be considered an original and all of which together will constitute the same instrument, and may be executed by facsimile or electronic signature.
| "Placer" | "Life360" | |||||||||||||
| Placer Labs, Inc. | Life360, Inc. | |||||||||||||
| By: | /s/ Naom Ben-Zvi | By: | /s/ Itamar Novick | |||||||||||
| Name: | Naom Ben-Zvi | Name: | Itamar Novick | |||||||||||
| Title: | CEO | Title: | Chief Business Officer | |||||||||||
Exhibit 31.1
CERTIFICATION OF CHIEF EXECUTIVE OFFICER
PURSUANT TO EXCHANGE ACT RULE 13a-14(a)/15d-14(a)
AS ADOPTED PURSUANT TO SECTION 302
OF THE SARBANES-OXLEY ACT OF 2002
I, Chris Hulls, certify that:
1. I have reviewed this Quarterly Report on Form 10-Q of Life360, Inc. (the “registrant”);
2. Based on my knowledge, this report does not contain any untrue statement of a material fact or omit to state a material fact necessary to make the statements made, in light of the circumstances under which such statements were made, not misleading with respect to the period covered by this report;
3. Based on my knowledge, the financial statements, and other financial information included in this report, fairly present in all material respects the financial condition, results of operations and cash flows of the registrant as of, and for, the periods presented in this report;
4. The registrant's other certifying officer and I are responsible for establishing and maintaining disclosure controls and procedures (as defined in Exchange Act Rules 13a-15(e) and 15d-15(e) for the registrant and have:
a) Designed such disclosure controls and procedures, or caused such disclosure controls and procedures to be designed under our supervision, to ensure that material information relating to the registrant, including its consolidated subsidiaries, is made known to us by others within those entities, particularly during the period in which this report is being prepared;
b) Evaluated the effectiveness of the registrant's disclosure controls and procedures and presented in this report our conclusions about the effectiveness of the disclosure controls and procedures, as of the end of the period covered by this report based on such evaluation; and
c) Disclosed in this report any change in the registrant’s internal control over financial reporting that occurred during the registrant’s most recent fiscal quarter (the registrant’s fourth fiscal quarter in the case of an annual report) that has materially affected, or is reasonably likely to materially affect, the registrant’s internal control over financial reporting; and
5. The registrant's other certifying officer and I have disclosed, based on our most recent evaluation of internal control over financial reporting, to the registrant's auditors and the audit committee of the registrant's board of directors (or persons performing the equivalent functions):
a) All significant deficiencies and material weaknesses in the design or operation of internal control over financial reporting which are reasonably likely to adversely affect the registrant's ability to record, process, summarize and report financial information; and
b) Any fraud, whether or not material, that involves management or other employees who have a significant role in the registrant's internal control over financial reporting.
Dated: | August 15, 2022 | /s/ | Chris Hulls | |||||||||||
| Chris Hulls | ||||||||||||||
| Chief Executive Officer | ||||||||||||||
Exhibit 31.2
CERTIFICATION OF CHIEF FINANCIAL OFFICER
PURSUANT TO EXCHANGE ACT RULE 13a-14(a)/15d-14(a)
AS ADOPTED PURSUANT TO SECTION 302
OF THE SARBANES-OXLEY ACT OF 2002
I, Russell Burke , certify that:
1. I have reviewed this Quarterly Report on Form 10-Q of Life360, Inc. (the “registrant”);
2. Based on my knowledge, this report does not contain any untrue statement of a material fact or omit to state a material fact necessary to make the statements made, in light of the circumstances under which such statements were made, not misleading with respect to the period covered by this report;
3. Based on my knowledge, the financial statements, and other financial information included in this report, fairly present in all material respects the financial condition, results of operations and cash flows of the registrant as of, and for, the periods presented in this report;
4. The registrant's other certifying officer and I are responsible for establishing and maintaining disclosure controls and procedures (as defined in Exchange Act Rules 13a-15(e) and 15d-15(e)) for the registrant and have:
a) Designed such disclosure controls and procedures, or caused such disclosure controls and procedures to be designed under our supervision, to ensure that material information relating to the registrant, including its consolidated subsidiaries, is made known to us by others within those entities, particularly during the period in which this report is being prepared;
b) Evaluated the effectiveness of the registrant's disclosure controls and procedures and presented in this report our conclusions about the effectiveness of the disclosure controls and procedures, as of the end of the period covered by this report based on such evaluation; and
c) Disclosed in this report any change in the registrant’s internal control over financial reporting that occurred during the registrant’s most recent fiscal quarter (the registrant’s fourth fiscal quarter in the case of an annual report) that has materially affected, or is reasonably likely to materially affect, the registrant’s internal control over financial reporting; and
5. The registrant's other certifying officer and I have disclosed, based on our most recent evaluation of internal control over financial reporting, to the registrant's auditors and the audit committee of the registrant's board of directors (or persons performing the equivalent functions):
a) All significant deficiencies and material weaknesses in the design or operation of internal control over financial reporting which are reasonably likely to adversely affect the registrant's ability to record, process, summarize and report financial information; and
b) Any fraud, whether or not material, that involves management or other employees who have a significant role in the registrant's internal control over financial reporting.
Dated: | August 15, 2022 | /s/ | Russell Burke | |||||||||||
| Russell Burke | ||||||||||||||
| Chief Financial Officer | ||||||||||||||
Exhibit 32.1
CERTIFICATION
PURSUANT TO 18 U.S.C. SECTION 1350
AS ADOPTED PURSUANT TO
SECTION 906 OF THE SARBANES-OXLEY ACT OF 2002
In connection with the accompanying Quarterly Report of Life360, Inc. (the “Company”), on Form 10-Q for the quarter ended June 30, 2022 (the “Report”), I, Chris Hulls, Chief Executive Officer of the Company, hereby certify pursuant to 18 U.S.C. § 1350, as adopted pursuant to § 906 of the Sarbanes-Oxley Act of 2002 that, to my knowledge:
(1)the Report fully complies with the requirements of section 13(a) or 15(d) of the Securities Exchange Act of 1934; and
(2)the information contained in the Report fairly presents, in all material respects, the financial condition and results of operations of the Company.
Dated: | August 15, 2022 | /s/ | Chris Hulls | |||||||||||
| Chris Hulls | ||||||||||||||
| Chief Executive Officer | ||||||||||||||
Exhibit 32.2
CERTIFICATION
PURSUANT TO 18 U.S.C. SECTION 1350
AS ADOPTED PURSUANT TO
SECTION 906 OF THE SARBANES-OXLEY ACT OF 2002
In connection with the accompanying Quarterly Report of Life360, Inc. (the “Company”), on Form 10-Q for the quarter ended June 30, 2022 (the “Report”), I, Russell Burke, Chief Financial Officer of the Company, hereby certify pursuant to 18 U.S.C. § 1350, as adopted pursuant to § 906 of the Sarbanes-Oxley Act of 2002 that, to my knowledge:
(1)the Report fully complies with the requirements of section 13(a) or 15(d) of the Securities Exchange Act of 1934; and
(2)the information contained in the Report fairly presents, in all material respects, the financial condition and results of operations of the Company.
Dated: | August 15, 2022 | /s/ | Russell Burke | |||||||||||
| Russell Burke | ||||||||||||||
| Chief Financial Officer | ||||||||||||||
Serious News for Serious Traders! Try StreetInsider.com Premium Free!
You May Also Be Interested In
- ARGAN: Mr. Aymar de GERMAY is appointed at the Executive Board of ARGAN
- BGHL (GBP): NAV(s)
- China's Yiwu Establishes Welcoming Committee to Attract International Buyers
Create E-mail Alert Related Categories
SEC FilingsSign up for StreetInsider Free!
Receive full access to all new and archived articles, unlimited portfolio tracking, e-mail alerts, custom newswires and RSS feeds - and more!
