

Form 10-Q DEERE JOHN CAPITAL CORP For: May 01
 Tweet
Tweet Share
ShareUNITED STATES
SECURITIES AND EXCHANGE COMMISSION
WASHINGTON, D.C. 20549
FORM
(Mark One)
For the quarterly period ended
or
For the transition period from ____ to ____
Commission file no:
JOHN DEERE CAPITAL CORPORATION
(Exact name of registrant as specified in its charter)
|
| |
| ||
Telephone Number: ( | ||
Securities Registered Pursuant to Section 12(b) of the Act:
Title of each class | Trading symbol | Name of each exchange on which registered | ||
Indicate by check mark whether the registrant: (1) has filed all reports required to be filed by Section 13 or 15(d) of the Securities Exchange Act of 1934 during the preceding 12 months (or for such shorter period that the registrant was required to file such reports), and (2) has been subject to such filing requirements for the past 90 days.
Indicate by check mark whether the registrant has submitted electronically every Interactive Data File required to be submitted pursuant to Rule 405 of Regulation S-T (§232.405 of this chapter) during the preceding 12 months (or for such shorter period that the registrant was required to submit such files).
Indicate by check mark whether the registrant is a large accelerated filer, an accelerated filer, a non-accelerated filer, a smaller reporting company, or an emerging growth company. See the definitions of “large accelerated filer,” “accelerated filer,” “smaller reporting company,” and “emerging growth company” in Rule 12b-2 of the Exchange Act.
Large accelerated filer | ☐ | Accelerated filer | ☐ |
☒ | Smaller reporting company | ||
Emerging growth company |
If an emerging growth company, indicate by check mark if the registrant has elected not to use the extended transition period for complying with any new or revised financial accounting standards provided pursuant to Section 13(a) of the Exchange Act. ☐
Indicate by check mark whether the registrant is a shell company (as defined in Rule 12b-2 of the Exchange Act). Yes
At May 26, 2022,
The registrant meets the conditions set forth in General Instruction H(1)(a) and (b) of Form 10-Q and is therefore filing this Form with certain reduced disclosures as permitted by those instructions.
PART I. FINANCIAL INFORMATION
Item 1. Financial Statements.
John Deere Capital Corporation and Subsidiaries
Statements of Consolidated Income
(Unaudited)
(in millions)
Three Months Ended | Six Months Ended |
| |||||||||||
May 1 | May 2 | May 1 | May 2 |
| |||||||||
| 2022 |
| 2021 |
| 2022 |
| 2021 |
| |||||
Revenues | |||||||||||||
Finance income earned on retail notes | $ | | $ | | $ | | $ | | |||||
Lease revenues |
| |
| |
| |
| | |||||
Revolving charge account income |
| |
| |
| |
| | |||||
Finance income earned on wholesale receivables |
| |
| |
| |
| | |||||
Other income |
| |
| |
| |
| | |||||
Total revenues |
| |
| |
| |
| | |||||
Expenses | |||||||||||||
Interest expense |
| |
| |
| | | ||||||
Operating expenses: | |||||||||||||
Depreciation of equipment on operating leases |
| |
| |
| | | ||||||
Administrative and operating expenses |
| |
| |
| | | ||||||
Fees paid to John Deere |
| |
| |
| | | ||||||
Provision (credit) for credit losses |
| |
| ( | |
| ( | ||||||
Total operating expenses |
| |
| |
| |
| | |||||
Total expenses |
| |
| |
| |
| | |||||
Income of consolidated group before income taxes |
| |
| |
| |
| | |||||
Provision for income taxes |
| |
| |
| | | ||||||
Income of consolidated group |
| |
| |
| |
| | |||||
Equity in income of unconsolidated affiliate |
| |
| |
| | | ||||||
Net income |
| |
| |
| |
| | |||||
Less: Net loss attributable to noncontrolling interests | ( | ( | |||||||||||
Net income attributable to the Company | $ | | $ | | $ | | $ | | |||||
See Condensed Notes to Interim Consolidated Financial Statements.
2
John Deere Capital Corporation and Subsidiaries
Statements of Consolidated Comprehensive Income
(Unaudited)
(in millions)
Three Months Ended | Six Months Ended |
| |||||||||||
May 1 | May 2 | May 1 | May 2 |
| |||||||||
| 2022 |
| 2021 |
| 2022 |
| 2021 |
| |||||
Net income | $ | | $ | | $ | | $ | | |||||
Other comprehensive income (loss), net of income taxes | |||||||||||||
Cumulative translation adjustment |
| ( | | ( | | ||||||||
Unrealized gain on derivatives |
| | | | | ||||||||
Unrealized gain (loss) on debt securities | ( | ( | | ||||||||||
Other comprehensive income (loss), net of income taxes |
| ( |
| |
| ( |
| | |||||
Comprehensive income of consolidated group |
| |
| |
| |
| | |||||
Less: Comprehensive loss attributable to noncontrolling interests | ( | ( | |||||||||||
Comprehensive income attributable to the Company | $ | | $ | | $ | | $ | | |||||
See Condensed Notes to Interim Consolidated Financial Statements.
3
John Deere Capital Corporation and Subsidiaries
Consolidated Balance Sheets
(Unaudited)
(in millions)
May 1 | October 31 | May 2 |
| |||||||
2022 | 2021 | 2021 |
| |||||||
Assets |
|
|
| |||||||
Cash and cash equivalents | $ | | $ | | $ | | ||||
Marketable securities | | | | |||||||
Receivables: | ||||||||||
Retail notes |
| |
| |
| | ||||
Retail notes securitized |
| |
| |
| | ||||
Revolving charge accounts |
| |
| |
| | ||||
Wholesale receivables |
| |
| |
| | ||||
Financing leases |
| |
| |
| | ||||
Total receivables |
| |
| |
| | ||||
Allowance for credit losses |
| ( |
| ( |
| ( | ||||
Total receivables – net |
| |
| |
| | ||||
Other receivables |
| |
| |
| | ||||
Receivables from John Deere |
| |
| |
| | ||||
Equipment on operating leases – net |
| |
| |
| | ||||
Notes receivable from John Deere | | | | |||||||
Investment in unconsolidated affiliate |
| |
| |
| | ||||
Deferred income taxes |
| |
| |
| | ||||
Other assets |
| |
| |
| | ||||
Total Assets | $ | | $ | | $ | | ||||
Liabilities and Stockholder’s Equity | ||||||||||
Short-term external borrowings: | ||||||||||
Commercial paper and other notes payable | $ | | $ | | $ | | ||||
Securitization borrowings |
| |
| |
| | ||||
Current maturities of long-term external borrowings |
| |
| |
| | ||||
Total short-term external borrowings |
| |
| |
| | ||||
Notes payable to John Deere |
| |
| |
| | ||||
Other payables to John Deere |
| |
| |
| | ||||
Accounts payable and accrued expenses |
| |
| |
| | ||||
Deposits held from dealers and merchants |
| |
| |
| | ||||
Deferred income taxes |
| |
| |
| | ||||
Long-term external borrowings |
| |
| |
| | ||||
Total liabilities |
| |
| |
| | ||||
Commitments and contingencies (Note 9) | ||||||||||
Stockholder’s equity: | ||||||||||
Common stock, without par value (issued and outstanding – |
| |
| |
| | ||||
Retained earnings |
| |
| |
| | ||||
Accumulated other comprehensive loss |
| ( |
| ( |
| ( | ||||
Total Company stockholder’s equity |
| |
| |
| | ||||
Noncontrolling interests |
| |
| |
| | ||||
Total stockholder’s equity |
| |
| |
| | ||||
Total Liabilities and Stockholder’s Equity | $ | | $ | | $ | | ||||
See Condensed Notes to Interim Consolidated Financial Statements.
4
John Deere Capital Corporation and Subsidiaries
Statements of Consolidated Cash Flows
(Unaudited)
(in millions)
| Six Months Ended | ||||||
May 1 | May 2 | ||||||
| 2022 |
| 2021 |
| |||
Cash Flows from Operating Activities: | |||||||
Net income | $ | | $ | | |||
Adjustments to reconcile net income to net cash | |||||||
provided by operating activities: | |||||||
Provision (credit) for credit losses |
| | ( | ||||
Provision for depreciation and amortization |
| | | ||||
Credit for deferred income taxes |
| ( | ( | ||||
Undistributed earnings of unconsolidated affiliate |
| ( | ( | ||||
Change in accounts payable and accrued expenses |
| ( | ( | ||||
Change in accrued income taxes payable/receivable |
| ( | |||||
Other |
| ( | | ||||
Net cash provided by operating activities |
| |
| | |||
Cash Flows from Investing Activities: | |||||||
Cost of receivables acquired (excluding wholesale) |
| ( | ( | ||||
Collections of receivables (excluding wholesale) |
| | | ||||
Increase in wholesale receivables – net |
| ( | ( | ||||
Cost of equipment on operating leases acquired |
| ( | ( | ||||
Proceeds from sales of equipment on operating leases |
| | | ||||
Cost of notes receivable acquired from John Deere | ( | ( | |||||
Collections of notes receivable from John Deere | | | |||||
Other |
| ( | ( | ||||
Net cash used for investing activities |
| ( |
| ( | |||
Cash Flows from Financing Activities: | |||||||
Increase in commercial paper and other notes payable – net |
| | | ||||
Decrease in securitization borrowings – net |
| ( | ( | ||||
Increase (decrease) in short-term borrowings with John Deere – net |
| ( | | ||||
Proceeds from issuance of long-term external borrowings |
| | | ||||
Payments of long-term external borrowings |
| ( | ( | ||||
Dividends paid |
| ( | ( | ||||
Debt issuance costs |
| ( | ( | ||||
Net cash provided by financing activities |
| |
| | |||
Effect of exchange rate changes on cash, cash equivalents, and restricted cash |
| ( | | ||||
Net decrease in cash, cash equivalents, and restricted cash |
| ( |
| ( | |||
Cash, cash equivalents, and restricted cash at beginning of period |
| |
| | |||
Cash, cash equivalents, and restricted cash at end of period | $ | | $ | | |||
Components of cash, cash equivalents, and restricted cash: | |||||||
Cash and cash equivalents | | | |||||
Restricted cash* | | | |||||
Total cash, cash equivalents, and restricted cash | $ | | $ | | |||
* Restricted cash is reported in other assets on the consolidated balance sheets and primarily relates to the securitization of receivables (see Note 5).
See Condensed Notes to Interim Consolidated Financial Statements.
5
John Deere Capital Corporation and Subsidiaries
Statements of Changes in Consolidated Stockholder’s Equity
For the Three and Six Months Ended May 1, 2022 and May 2, 2021
(Unaudited)
(in millions)
Company Stockholder |
| |||||||||||||||
Accumulated | ||||||||||||||||
Total | Other | Non- | ||||||||||||||
Stockholder’s | Common | Retained | Comprehensive | Controlling | ||||||||||||
Equity | Stock | Earnings | Income (Loss) | Interests |
| |||||||||||
|
|
|
|
|
| |||||||||||
Three Months Ended May 2, 2021 | ||||||||||||||||
Balance January 31, 2021 | $ | | $ | | $ | | $ | ( | $ | | ||||||
Net income | | | ||||||||||||||
Other comprehensive income | | | ||||||||||||||
Balance May 2, 2021 | $ | | $ | | $ | | $ | ( | $ | | ||||||
Six Months Ended May 2, 2021 | ||||||||||||||||
Balance November 1, 2020 | $ | | $ | | $ | | $ | ( | $ | | ||||||
ASU No. 2016-13 adoption | ( | ( | ||||||||||||||
Net income |
| |
| | ||||||||||||
Other comprehensive income |
| | | |||||||||||||
Dividends declared |
| ( | ( | |||||||||||||
Balance May 2, 2021 | $ | | $ | | $ | | $ | ( | $ | | ||||||
Three Months Ended May 1, 2022 | ||||||||||||||||
Balance January 30, 2022 | $ | | $ | | $ | | $ | ( | $ | | ||||||
Net income (loss) | | | ( | |||||||||||||
Other comprehensive loss | ( | ( | ||||||||||||||
Dividends declared | ( | ( | ||||||||||||||
Balance May 1, 2022 | $ | | $ | | $ | | $ | ( | $ | | ||||||
Six Months Ended May 1, 2022 | ||||||||||||||||
Balance October 31, 2021 | $ | | $ | | $ | | $ | ( | $ | | ||||||
Net income (loss) |
| |
| | ( | |||||||||||
Other comprehensive loss |
| ( | ( | |||||||||||||
Dividends declared |
| ( | ( | |||||||||||||
Balance May 1, 2022 | $ | | $ | | $ | | $ | ( | $ | | ||||||
See Condensed Notes to Interim Consolidated Financial Statements.
6
John Deere Capital Corporation and Subsidiaries
Condensed Notes to Interim Consolidated Financial Statements
(Unaudited)
(1) Organization and Consolidation
John Deere Capital Corporation (Capital Corporation) and its subsidiaries are collectively called the Company. John Deere Financial Services, Inc. (JDFS), a wholly-owned finance holding subsidiary of Deere & Company, owns all of the outstanding common stock of Capital Corporation. The Company provides and administers financing for retail purchases of new equipment manufactured by Deere & Company’s production and precision agriculture operations, small agriculture and turf operations, and construction and forestry operations and used equipment taken in trade for this equipment. References to agriculture and turf include both production and precision agriculture and small agriculture and turf. The Company generally purchases retail installment sales and loan contracts (retail notes) from Deere & Company and its wholly-owned subsidiaries (collectively called John Deere). John Deere generally acquires these retail notes through John Deere retail dealers. The Company also purchases and finances a limited amount of non-John Deere retail notes. The Company also finances and services revolving charge accounts, in most cases acquired from and offered through merchants in the agriculture and turf and construction and forestry markets (revolving charge accounts). Additionally, the Company provides wholesale financing to dealers of John Deere agriculture and turf and construction and forestry equipment, primarily to finance inventories of equipment for those dealers (wholesale receivables). In addition, the Company leases John Deere equipment and a limited amount of non-John Deere equipment to retail customers (financing and operating leases). The Company also offers credit enhanced international export financing to select customers and dealers, which generally involves John Deere products. Retail notes, revolving charge accounts, wholesale receivables, and financing leases are collectively called “Receivables.” Receivables and equipment on operating leases are collectively called “Receivables and Leases.” The Company generally secures its Receivables, other than certain revolving charge accounts, by retaining as collateral security in the goods associated with those Receivables or with the use of other collateral.
The Company uses a 52/53 week fiscal year with quarters ending on the last Sunday in the reporting period. The second quarter ends for fiscal years 2022 and 2021 were May 1, 2022 and May 2, 2021, respectively. Both second quarters contained
The Company is the primary beneficiary of and consolidates certain variable interest entities (VIEs) that are special purpose entities (SPEs) related to the securitization of receivables. See Note 5 for more information on these SPEs.
(2) Summary of Significant Accounting Policies and New Accounting Standards
Quarterly Financial Statements
The Company has prepared its interim consolidated financial statements, without audit, pursuant to the rules and regulations of the U.S. Securities and Exchange Commission (SEC). Certain information and footnote disclosures normally included in annual financial statements prepared in accordance with accounting principles generally accepted in the U.S. have been condensed or omitted as permitted by such rules and regulations. All adjustments, consisting of normal recurring adjustments, have been included. Management believes the disclosures are adequate to present fairly the financial position, results of operations, and cash flows at the dates and for the periods presented. It is suggested these interim consolidated financial statements be read in conjunction with the consolidated financial statements and the notes thereto appearing in the Company’s latest Annual Report on Form 10-K. Results for interim periods are not necessarily indicative of those to be expected for the fiscal year.
7
Use of Estimates in Financial Statements
The preparation of financial statements in conformity with accounting principles generally accepted in the U.S. requires management to make estimates and assumptions that affect the reported amounts and related disclosures. Actual results could differ from those estimates.
New Accounting Standards
The Company closely monitors all Accounting Standard Updates (ASUs) issued by the Financial Accounting Standards Board (FASB) and other authoritative guidance. ASUs adopted in 2022 did not have a material impact on the Company’s financial statements.
In March 2022, the FASB issued ASU No. 2022-02, Financial Instruments – Credit Losses (Topic 326): Troubled Debt Restructurings and Vintage Disclosures, which will be effective in the first quarter of fiscal year 2024. The ASU eliminates the accounting guidance for troubled debt restructurings, enhances disclosures for certain receivable modifications related to borrowers experiencing financial difficulty, and requires disclosure of current period gross write-offs by year of origination. ASU No. 2022-02 and other ASUs to be adopted in future periods are being evaluated and at this point are not expected to have a material impact on the Company’s financial statements.
(3) Other Comprehensive Income Items
The after-tax components of accumulated other comprehensive income (loss) were as follows (in millions of dollars):
May 1 | October 31 | May 2 | |||||||
2022 | 2021 | 2021 | |||||||
Cumulative translation adjustment | $ | ( | $ | ( | $ | ( | |||
Unrealized gain (loss) on derivatives | | | ( | ||||||
Unrealized loss on debt securities | ( | ( | ( | ||||||
Total accumulated other comprehensive income (loss) | $ | ( | $ | ( | $ | ( | |||
8
Amounts recorded in and reclassifications out of other comprehensive income (loss), and the income tax effects were as follows (in millions of dollars):
Before | Tax | After |
| |||||||
Tax | (Expense) | Tax |
| |||||||
Three Months Ended May 1, 2022 | Amount | Credit | Amount |
| ||||||
Cumulative translation adjustment |
| $ | ( | $ | ( | |||||
Unrealized gain (loss) on derivatives: | ||||||||||
Unrealized hedging gain (loss) |
| | $ | ( |
| | ||||
Reclassification of realized (gain) loss to: | ||||||||||
Interest rate contracts – Interest expense |
| ( | ( | |||||||
Net unrealized gain (loss) on derivatives |
| |
| ( |
| | ||||
Unrealized gain (loss) on debt securities: | ||||||||||
Unrealized holding gain (loss) | ( | ( | ||||||||
Total other comprehensive income (loss) | $ | | $ | ( | $ | ( | ||||
Six Months Ended May 1, 2022 | ||||||||||
Cumulative translation adjustment | $ | ( | $ | ( | ||||||
Unrealized gain (loss) on derivatives: | ||||||||||
Unrealized hedging gain (loss) |
| | $ | ( |
| | ||||
Reclassification of realized (gain) loss to: | ||||||||||
Interest rate contracts – Interest expense |
| | ( | | ||||||
Net unrealized gain (loss) on derivatives |
| |
| ( |
| | ||||
Unrealized gain (loss) on debt securities: | ||||||||||
Unrealized holding gain (loss) | ( | | ( | |||||||
Total other comprehensive income (loss) | $ | ( | $ | ( | $ | ( | ||||
Three Months Ended May 2, 2021 | ||||||||||
Cumulative translation adjustment | $ | | $ | | ||||||
Unrealized gain (loss) on derivatives: | ||||||||||
Unrealized hedging gain (loss) |
| | $ | ( |
| | ||||
Reclassification of realized (gain) loss to: | ||||||||||
Interest rate contracts – Interest expense |
| | ( |
| | |||||
Net unrealized gain (loss) on derivatives |
| | ( |
| | |||||
Unrealized gain (loss) on debt securities: | ||||||||||
Unrealized holding gain (loss) | ( | | ||||||||
Total other comprehensive income (loss) | $ | | $ | ( | $ | | ||||
Six Months Ended May 2, 2021 | ||||||||||
Cumulative translation adjustment | $ | | $ | | ||||||
Unrealized gain (loss) on derivatives: | ||||||||||
Unrealized hedging gain (loss) |
| |
| | ||||||
Reclassification of realized (gain) loss to: | ||||||||||
Interest rate contracts – Interest expense |
| | $ | ( |
| | ||||
Net unrealized gain (loss) on derivatives |
| |
| ( |
| | ||||
Unrealized gain (loss) on debt securities: | ||||||||||
Unrealized holding gain (loss) | ( | | | |||||||
Total other comprehensive income (loss) | $ | | $ | ( | $ | | ||||
9
(4) Receivables
Credit Quality
The Company monitors the credit quality of Receivables based on delinquency status. Past due balances of Receivables still accruing finance income represent the total balance held (principal plus accrued interest) with any payment amounts
Receivable balances are written off to the allowance for credit losses when, in the judgment of management, they are considered uncollectible. Generally, when retail notes and accounts are
The credit quality analysis of retail notes, financing leases, and revolving charge accounts (collectively, Customer Receivables) by year of origination was as follows (in millions of dollars):
May 1, 2022 | ||||||||||||||||||||||||
2022 | 2021 | 2020 | 2019 | 2018 | Prior Years | Revolving Charge Accounts | Total | |||||||||||||||||
Customer Receivables: |
|
|
|
|
|
|
|
| ||||||||||||||||
Agriculture and turf | ||||||||||||||||||||||||
Current | $ | | $ | | $ | | $ | | $ | | $ | | $ | | $ | | ||||||||
30-59 days past due | | | | | | | | | ||||||||||||||||
60-89 days past due | | | | | | | | | ||||||||||||||||
90+ days past due | | | | | | |||||||||||||||||||
Non-performing | | | | | | | | | ||||||||||||||||
Construction and forestry | ||||||||||||||||||||||||
Current | | | | | | | | | ||||||||||||||||
30-59 days past due | | | | | | | | | ||||||||||||||||
60-89 days past due | | | | | | | | | ||||||||||||||||
90+ days past due | | | | | ||||||||||||||||||||
Non-performing | | | | | | | | | ||||||||||||||||
Total Customer Receivables | $ | | $ | | $ | | $ | | $ | | $ | | $ | | $ | | ||||||||
10
October 31, 2021 | ||||||||||||||||||||||||
2021 | 2020 | 2019 | 2018 | 2017 | Prior Years | Revolving Charge Accounts | Total | |||||||||||||||||
Customer Receivables: |
|
|
|
|
|
|
|
| ||||||||||||||||
Agriculture and turf | ||||||||||||||||||||||||
Current | $ | | $ | | $ | | $ | | $ | | $ | | $ | | $ | | ||||||||
30-59 days past due | | | | | | | | | ||||||||||||||||
60-89 days past due | | | | | | | | | ||||||||||||||||
90+ days past due | | | | | | | ||||||||||||||||||
Non-performing | | | | | | | | | ||||||||||||||||
Construction and forestry | ||||||||||||||||||||||||
Current | | | | | | | | | ||||||||||||||||
30-59 days past due | | | | | | | | | ||||||||||||||||
60-89 days past due | | | | | | | | | ||||||||||||||||
90+ days past due | | | | | | |||||||||||||||||||
Non-performing | | | | | | | | | ||||||||||||||||
Total Customer Receivables | $ | | $ | | $ | | $ | | $ | | $ | | $ | | $ | | ||||||||
May 2, 2021 | ||||||||||||||||||||||||
2021 | 2020 | 2019 | 2018 | 2017 | Prior Years | Revolving Charge Accounts | Total | |||||||||||||||||
Customer Receivables: |
|
|
|
|
|
|
|
| ||||||||||||||||
Agriculture and turf | ||||||||||||||||||||||||
Current | $ | | $ | | $ | | $ | | $ | | $ | | $ | | $ | | ||||||||
30-59 days past due | | | | | | | | | ||||||||||||||||
60-89 days past due | | | | | | | | | ||||||||||||||||
90+ days past due | | | | | ||||||||||||||||||||
Non-performing | | | | | | | | | ||||||||||||||||
Construction and forestry | ||||||||||||||||||||||||
Current | | | | | | | | | ||||||||||||||||
30-59 days past due | | | | | | | | | ||||||||||||||||
60-89 days past due | | | | | | | | | ||||||||||||||||
90+ days past due | | | | |||||||||||||||||||||
Non-performing | | | | | | | | | ||||||||||||||||
Total Customer Receivables | $ | | $ | | $ | | $ | | $ | | $ | | $ | | $ | | ||||||||
11
The credit quality analysis of wholesale receivables by year of origination was as follows (in millions of dollars):
May 1, 2022 | ||||||||||||||||||||||||
2022 | 2021 | 2020 | 2019 | 2018 | Prior Years | Revolving | Total | |||||||||||||||||
Wholesale receivables: |
|
|
|
|
|
|
|
| ||||||||||||||||
Agriculture and turf | ||||||||||||||||||||||||
Current | $ | | $ | | $ | | $ | | $ | | $ | | $ | | $ | | ||||||||
30+ days past due | | | ||||||||||||||||||||||
Non-performing | | | ||||||||||||||||||||||
Construction and forestry | ||||||||||||||||||||||||
Current | | | | | | | | |||||||||||||||||
30+ days past due | | | ||||||||||||||||||||||
Non-performing | ||||||||||||||||||||||||
Total wholesale receivables | $ | | $ | | $ | | $ | | $ | | $ | | $ | | $ | | ||||||||
October 31, 2021 | ||||||||||||||||||||||||
2021 | 2020 | 2019 | 2018 | 2017 | Prior Years | Revolving | Total | |||||||||||||||||
Wholesale receivables: |
|
|
|
|
|
|
|
| ||||||||||||||||
Agriculture and turf | ||||||||||||||||||||||||
Current | $ | | $ | | $ | | $ | | $ | | $ | | $ | | $ | | ||||||||
30+ days past due | | | ||||||||||||||||||||||
Non-performing | | | ||||||||||||||||||||||
Construction and forestry | ||||||||||||||||||||||||
Current | | | | | | | ||||||||||||||||||
30+ days past due | | | ||||||||||||||||||||||
Non-performing | ||||||||||||||||||||||||
Total wholesale receivables | $ | | $ | | $ | | $ | | $ | | $ | | $ | | $ | | ||||||||
May 2, 2021 | ||||||||||||||||||||||||
2021 | 2020 | 2019 | 2018 | 2017 | Prior Years | Revolving | Total | |||||||||||||||||
Wholesale receivables: |
|
|
|
|
|
|
|
| ||||||||||||||||
Agriculture and turf | ||||||||||||||||||||||||
Current | $ | | $ | | $ | | $ | | $ | | $ | | $ | | $ | | ||||||||
30+ days past due | | | ||||||||||||||||||||||
Non-performing | | | | |||||||||||||||||||||
Construction and forestry | ||||||||||||||||||||||||
Current | | | | | | | ||||||||||||||||||
30+ days past due | | | ||||||||||||||||||||||
Non-performing | ||||||||||||||||||||||||
Total wholesale receivables | $ | | $ | | $ | | $ | | $ | | $ | | $ | | $ | | ||||||||
Allowance for Credit Losses
The allowance for credit losses is an estimate of the credit losses expected over the life of the Company’s Receivable portfolio. The Company measures expected credit losses on a collective basis when similar risk characteristics exist. Risk characteristics considered by the Company include product category, market, geography, credit risk, and remaining duration. Receivables that do not share risk characteristics with other receivables in the portfolio are evaluated on an individual basis. Non-performing Receivables are included in the estimate of expected credit losses.
12
Recoveries from freestanding credit enhancements, such as dealer deposits, and certain credit insurance contracts are not included in the estimate of expected credit losses. Recoveries from dealer deposits are recognized in other income on the statements of consolidated income when the dealer’s withholding account is charged. Recoveries from freestanding credit enhancements recorded in other income were $
An analysis of the allowance for credit losses and investment in Receivables during 2022 was as follows (in millions of dollars):
Three Months Ended |
| ||||||||||||
May 1, 2022 |
| ||||||||||||
Retail Notes | Revolving |
| |||||||||||
& Financing | Charge | Wholesale | Total |
| |||||||||
Leases | Accounts | Receivables | Receivables |
| |||||||||
Allowance: | |||||||||||||
Beginning of period balance | $ | | $ | | $ | | $ | | |||||
Provision (credit) for credit losses* |
| | | | | ||||||||
Write-offs |
| ( | ( | ( | ( | ||||||||
Recoveries |
| | | | |||||||||
Translation adjustments |
| ( | | ( | ( | ||||||||
End of period balance | $ | | $ | | $ | | $ | | |||||
Six Months Ended |
| ||||||||||||
May 1, 2022 |
| ||||||||||||
Retail Notes | Revolving |
| |||||||||||
& Financing | Charge | Wholesale | Total |
| |||||||||
Leases | Accounts | Receivables | Receivables |
| |||||||||
Allowance: | |||||||||||||
Beginning of period balance | $ | | $ | | $ | | $ | | |||||
Provision (credit) for credit losses* |
| | ( | | | ||||||||
Write-offs |
| ( | ( | ( | ( | ||||||||
Recoveries |
| | | | |||||||||
Translation adjustments |
| ( | | ( | ( | ||||||||
End of period balance | $ | | $ | | $ | | $ | | |||||
Receivables: | |||||||||||||
End of period balance | $ | | $ | | $ | | $ | | |||||
*Excludes provision (credit) for credit losses on unfunded commitments of $(
The allowance for credit losses increased slightly in the second quarter, in part due to higher portfolio balances, and was lower for the first six months of 2022, reflecting continued strong agricultural market conditions.
13
An analysis of the allowance for credit losses and investment in Receivables during 2021 was as follows (in millions of dollars):
Three Months Ended |
| ||||||||||||
May 2, 2021 |
| ||||||||||||
Retail Notes | Revolving |
| |||||||||||
& Financing | Charge | Wholesale | Total |
| |||||||||
Leases | Accounts | Receivables | Receivables |
| |||||||||
Allowance: | |||||||||||||
Beginning of period balance | $ | | $ | | $ | | $ | | |||||
Provision (credit) for credit losses* |
| ( | ( | ( | ( | ||||||||
Write-offs |
| ( | ( | ( | ( | ||||||||
Recoveries |
| | | | |||||||||
Translation adjustments |
| ( | ( | | ( | ||||||||
End of period balance | $ | | $ | | $ | | $ | | |||||
Six Months Ended |
| ||||||||||||
May 2, 2021 |
| ||||||||||||
Retail Notes | Revolving |
| |||||||||||
& Financing | Charge | Wholesale | Total |
| |||||||||
Leases | Accounts | Receivables | Receivables |
| |||||||||
Allowance: | |||||||||||||
Beginning of period balance | $ | | $ | | $ | | $ | | |||||
ASU No. 2016-13 adoption |
| | ( | ( | | ||||||||
Provision (credit) for credit losses* |
| ( | ( | ( | ( | ||||||||
Write-offs |
| ( | ( | ( | ( | ||||||||
Recoveries |
| | | | |||||||||
Translation adjustments |
| | ( | | | ||||||||
End of period balance | $ | | $ | | $ | | $ | | |||||
Receivables: | |||||||||||||
End of period balance | $ | | $ | | $ | | $ | | |||||
*Excludes provision (credit) for credit losses on unfunded commitments of $(
The allowance for credit losses on Receivables decreased $
Troubled Debt Restructuring
14
troubled debt restructurings that subsequently defaulted and were written off. At May 1, 2022, the Company had
(5) Securitization of Receivables
As a part of its overall funding strategy, the Company periodically transfers certain Receivables (retail notes) into VIEs that are SPEs, or non-VIE banking operations, as part of its asset-backed securities programs (securitizations). The structure of these transactions is such that the transfer of the retail notes does not meet the accounting criteria for sales of receivables, and is, therefore, accounted for as a secured borrowing. SPEs utilized in securitizations of retail notes differ from other entities included in the Company’s consolidated statements because the assets they hold are legally isolated. Use of the assets held by the SPEs or the non-VIEs is restricted by terms of the documents governing the securitization transactions.
The components of consolidated restricted assets, secured borrowings, and other liabilities related to secured borrowings in securitization transactions were as follows (in millions of dollars):
May 1 | October 31 | May 2 |
| |||||||
2022 | 2021 | 2021 |
| |||||||
Retail notes securitized | $ | | $ | | $ | | ||||
Allowance for credit losses |
| ( |
| ( |
| ( | ||||
Other assets (primarily restricted cash) |
| |
| |
| | ||||
Total restricted securitized assets | $ | | $ | | $ | | ||||
Securitization borrowings | $ | | $ | | $ | | ||||
Accrued interest on borrowings |
| |
| |
| | ||||
Total liabilities related to restricted securitized assets | $ | | $ | | $ | | ||||
(6) Leases
The Company leases John Deere equipment and a limited amount of non-John Deere equipment to retail customers through sales-type, direct financing, and operating leases. Sales-type and direct financing leases are reported in financing leases on the consolidated balance sheets. Operating leases are reported in equipment on operating leases – net on the consolidated balance sheets.
Lease revenues earned by the Company were as follows (in millions of dollars):
Three Months Ended | Six Months Ended | |||||||||||
May 1 | May 2 | May 1 | May 2 | |||||||||
2022 | 2021 | 2022 | 2021 | |||||||||
Sales-type and direct financing lease revenues | $ | | $ | | $ | | $ | | ||||
Operating lease revenues | | | | | ||||||||
Variable lease revenues |
| |
| |
| |
| | ||||
Total lease revenues | $ | | $ | | $ | | $ | | ||||
Variable lease revenues reported above primarily relate to separately invoiced property taxes on leased equipment in certain markets, late fees, and excess use and damage fees. Excess use and damage fees are reported in other income on the statements of consolidated income. Excess use and damage fees were $
15
The cost of equipment on operating leases by market was as follows (in millions of dollars):
May 1 | October 31 | May 2 | |||||||
2022 | 2021 | 2021 | |||||||
Agriculture and turf | $ | | $ | | $ | | |||
Construction and forestry | |
| |
| | ||||
Total | | | | ||||||
Accumulated depreciation |
| ( | ( | ( | |||||
Equipment on operating leases - net | $ | | $ | | $ | | |||
Total operating lease residual values at May 1, 2022, October 31, 2021, and May 2, 2021 were $
The Company discusses with lessees and dealers options to purchase the equipment or extend the lease prior to operating lease maturity. Equipment returned to the Company upon termination of leases is remarketed by the Company. The matured operating lease inventory balances at May 1, 2022, October 31, 2021, and May 2, 2021 were $
(7) Notes Receivable from and Payable to John Deere
The Company provides loans to and holds other receivables from affiliated companies. The loan agreements mature over the next
The Company had notes receivable from John Deere with the following affiliated companies as follows (in millions of dollars):
May 1 | October 31 | May 2 | ||||||||
2022 | 2021 | 2021 | ||||||||
Limited Liability Company John Deere Financial | $ | | $ | | ||||||
Banco John Deere S.A. | $ | |
| |
| | ||||
John Deere Agricultural Holdings, Inc. |
| | ||||||||
Total Notes Receivable from John Deere | $ | | $ | | $ | | ||||
Limited Liability Company John Deere Financial (JDF Russia) is a John Deere financial services affiliate in Russia. The Company previously provided ruble-denominated loans to JDF Russia to fund JDF Russia’s retail portfolio. The Company had entered into non-designated cross-currency interest rate contracts and foreign currency exchange contracts to hedge against interest rate and foreign currency exchange risk associated with the loans. In April 2022, the loans to JDF Russia and related derivative contracts were assumed by Deere & Company for cash at carrying value as of the date of assumption.
John Deere Agricultural Holdings, Inc. (JDAH) is a John Deere equipment operations affiliate in Russia. The Company purchased wholesale receivables from this affiliate related to independent John Deere dealers in Russia. Cash collections on the wholesale receivables continue to remain strong. The affiliate receivable from JDAH represents cash collections on the Russia wholesale portfolio that have not yet been remitted to the Company. The remaining outstanding wholesale portfolio in Russia held by the Company did not represent a significant portion of its wholesale receivable portfolio at May 1, 2022. John Deere currently requires prepayment of existing equipment inventory in Russia, and, as such, no further wholesale receivables are being purchased by the Company.
16
The Company also obtains funding from affiliated companies. At May 1, 2022, October 31, 2021, and May 2, 2021, the Company had notes payable to John Deere of $
(8) Long-Term External Borrowings
Long-term external borrowings of the Company at May 1, 2022, October 31, 2021, and May 2, 2021 consisted of the following (in millions of dollars):
| May 1 | October 31 | May 2 | ||||||
| 2022 | 2021 | 2021 | ||||||
Senior Debt: |
| ||||||||
Medium-term notes |
| $ | | $ | | $ | | ||
Other notes | | | | ||||||
Total senior debt | | | | ||||||
Unamortized debt discount and debt issuance costs | ( | ( | ( | ||||||
Total | $ | | $ | | $ | | |||
The medium-term notes in the table above include unamortized fair value adjustments related to interest rate swaps. The principal balances of the medium-term notes were $
In April 2022, the Company issued $
(9) Commitments and Contingencies
At May 1, 2022, John Deere Financial Inc., the John Deere finance subsidiary in Canada, had $
Capital Corporation has a variable interest in John Deere Canada Funding Inc. (JDCFI), a wholly-owned subsidiary of John Deere Financial Inc., which was created as a VIE to issue debt in public markets to fund the operations of affiliated companies in Canada. Capital Corporation has a variable interest in JDCFI because it provides guarantees for all debt issued by JDCFI, however it does not consolidate JDCFI because it does not have the power to direct the activities that most significantly impact JDCFI’s economic performance. Capital Corporation has
The Company has commitments to extend credit to customers and John Deere dealers through lines of credit and other pre-approved credit arrangements. The Company applies the same credit policies and approval process for these commitments to extend credit as it does for its Receivables. Collateral is not required for these commitments, but if credit is extended, collateral may be required upon funding. The amount of unused commitments to extend credit to John Deere dealers was $
17
commitments to extend credit to customers was $
At May 1, 2022, the Company had restricted other assets associated with borrowings related to securitizations (see Note 5). Excluding the securitization programs, the remaining balance of restricted other assets was not material as of May 1, 2022.
The Company is subject to various unresolved legal actions which arise in the normal course of its business, the most prevalent of which relate to retail credit matters. The Company believes the reasonably possible range of losses for these unresolved legal actions would not have a material effect on its consolidated financial statements.
(10) Fair Value Measurements
Fair value is defined as the price that would be received to sell an asset or paid to transfer a liability in an orderly transaction between market participants at the measurement date. To determine fair value, the Company uses various methods, including market and income approaches. The Company utilizes valuation models and techniques that maximize the use of observable inputs. The models are industry-standard models that consider various assumptions, including time values and yield curves as well as other economic measures. These valuation techniques are consistently applied.
Level 1 measurements consist of quoted prices in active markets for identical assets or liabilities. Level 2 measurements include significant other observable inputs, such as quoted prices for similar assets or liabilities in active markets; identical assets or liabilities in inactive markets; observable inputs such as interest rates and yield curves; and other market-corroborated inputs. Level 3 measurements include significant unobservable inputs.
The fair values of financial instruments that do not approximate the carrying values were as follows (in millions of dollars):
May 1, 2022 | October 31, 2021 | May 2, 2021 |
| ||||||||||||||||
Carrying | Fair | Carrying | Fair | Carrying | Fair |
| |||||||||||||
Value | Value | Value | Value | Value | Value |
| |||||||||||||
Receivables financed – net |
| $ | |
| $ | |
| $ | |
| $ | |
| $ | |
| $ | | |
Retail notes securitized – net |
| |
| |
| |
| |
| |
| | |||||||
Securitization borrowings |
| |
| |
| |
| |
| |
| | |||||||
Current maturities of long-term external borrowings |
| |
| |
| |
| |
| |
| | |||||||
Long-term external borrowings |
| |
| |
| |
| |
| |
| | |||||||
Fair value measurements above were Level 3 for all Receivables and Level 2 for all borrowings.
Fair values of Receivables that were issued long-term were based on the discounted values of their related cash flows at interest rates currently being offered by the Company for similar Receivables. The fair values of the remaining Receivables approximated the carrying amounts.
Fair values of long-term external borrowings and securitization borrowings were based on current market quotes for identical or similar borrowings and credit risk, or on the discounted values of their related cash flows at current market interest rates. Certain long-term external borrowings have been swapped to current variable interest rates. The carrying values of these long-term external borrowings include adjustments related to fair value hedges.
18
Assets and liabilities measured at fair value on a recurring basis were as follows (in millions of dollars):
| May 1 |
| October 31 |
| May 2 |
| ||||
2022 | 2021 | 2021 |
| |||||||
Marketable securities |
|
|
| |||||||
International debt securities | $ | | $ | | $ | | ||||
Receivables from John Deere | ||||||||||
Derivatives | | | | |||||||
Other assets | ||||||||||
Derivatives | |
| |
| | |||||
Total assets | $ | | $ | | $ | | ||||
Other payables to John Deere | ||||||||||
Derivatives | $ | | $ | | $ | | ||||
Accounts payable and accrued expenses | ||||||||||
Derivatives | |
| |
| | |||||
Total liabilities | $ | | $ | | $ | | ||||
All fair value measurements in the table above were Level 2. Excluded from the table above were the Company’s cash equivalents, which were carried at cost that approximates fair value. The cash equivalents consist primarily of time deposits and money market funds.
The international debt securities mature over the next nine years. At May 1, 2022, the amortized cost basis and fair value of these available-for-sale debt securities were $
There were no assets or liabilities measured at fair value on a nonrecurring basis, other than Receivables with specific allowances which were not material, during each of the periods ended May 1, 2022, October 31, 2021, and May 2, 2021.
The following is a description of the valuation methodologies the Company uses to measure certain balance sheet items at fair value:
Marketable securities – The international debt securities are valued using quoted prices for identical assets in inactive markets.
Derivatives – The Company’s derivative financial instruments consist of interest rate contracts (swaps and caps), foreign currency exchange contracts (futures, forwards, and swaps), and cross-currency interest rate contracts (swaps). The portfolio is valued based on an income approach (discounted cash flow) using market observable inputs, including swap curves and both forward and spot exchange rates for currencies.
Receivables – Specific reserve impairments are based on the fair value of the collateral, which is measured using a market approach (appraisal values or realizable values). Inputs include a selection of realizable values.
(11) Derivative Instruments
It is the Company’s policy that derivative transactions are executed only to manage exposures arising in the normal course of business and not for the purpose of creating speculative positions or trading. The Company manages the relationship of the types and amounts of its funding sources to its Receivable and Lease portfolios in an effort to diminish risk due to interest rate and foreign currency fluctuations, while responding to favorable financing opportunities. The Company also has foreign currency exposures at some of its foreign and domestic operations related to financing in currencies other than the functional currencies.
All derivatives are recorded at fair value on the consolidated balance sheets. Cash collateral received or paid is not offset against the derivative fair values on the consolidated balance sheets. The cash flows from these contracts are recorded in operating activities in the statements of consolidated cash flows. Each derivative is designated as a cash flow hedge, a fair value hedge, or remains undesignated. All designated hedges are formally
19
documented as to the relationship with the hedged item as well as the risk-management strategy. Both at inception and on an ongoing basis the hedging instrument is assessed as to its effectiveness. If and when a derivative is determined not to be highly effective as a hedge, the underlying hedged transaction is no longer likely to occur, the hedge designation is removed, or the derivative is terminated, hedge accounting is discontinued.
Cash Flow Hedges
Certain interest rate contracts (swaps) were designated as hedges of future cash flows from borrowings. The total notional amounts of the receive-variable/pay-fixed interest rate contracts at May 1, 2022, October 31, 2021, and May 2, 2021 were $
The amount of gain recorded in OCI at May 1, 2022 that is expected to be reclassified to interest expense in the next twelve months if interest rates remain unchanged is $
Fair Value Hedges
Certain interest rate contracts (swaps) were designated as fair value hedges of borrowings. The total notional amounts of the receive-fixed/pay-variable interest rate contracts at May 1, 2022, October 31, 2021, and May 2, 2021 were $
The amounts recorded in the consolidated balance sheets related to borrowings designated in fair value hedging relationships were as follows (in millions of dollars):
Cumulative Increase (Decrease) of Fair Value | |||||||||||||
Hedging Adjustments Included in the | |||||||||||||
Carrying Amount | |||||||||||||
Carrying | Active | ||||||||||||
Amount of | Hedging | Discontinued | |||||||||||
May 1, 2022 | Hedged Item | Relationships | Relationships | Total | |||||||||
Current maturities of long-term external borrowings | $ | | $ | | $ | | $ | | |||||
Long-term external borrowings | | ( | | ( | |||||||||
October 31, 2021 | |||||||||||||
Current maturities of long-term external borrowings | $ | | $ | | $ | ( | $ | | |||||
Long-term external borrowings | | | | | |||||||||
May 2, 2021 | |||||||||||||
Current maturities of long-term external borrowings | $ | ( | $ | ( | $ | ( | |||||||
Long-term external borrowings | | $ | | | | ||||||||
Derivatives Not Designated as Hedging Instruments
The Company has certain interest rate contracts (swaps and caps), foreign currency exchange contracts (futures, forwards, and swaps), and cross-currency interest rate contracts (swaps), which were not formally designated as hedges. These derivatives were held as economic hedges for underlying interest rate or foreign currency exposures primarily for certain borrowings. The total notional amounts of the interest rate swaps at
20
May 1, 2022, October 31, 2021, and May 2, 2021 were $
Fair values of derivative instruments in the consolidated balance sheets were as follows (in millions of dollars):
| May 1 |
| October 31 |
| May 2 |
| ||||
2022 | 2021 | 2021 |
| |||||||
Receivables from John Deere | ||||||||||
Designated as hedging instruments: | ||||||||||
Interest rate contracts | $ | | $ | | $ | | ||||
Not designated as hedging instruments: | ||||||||||
Interest rate contracts |
| |
| |
| | ||||
Cross-currency interest rate contracts |
| |
| |
| | ||||
Total not designated |
| |
| |
| | ||||
Other Assets | ||||||||||
Not designated as hedging instruments: | ||||||||||
Foreign currency exchange contracts |
| |
| |
| | ||||
Total derivative assets | $ | | $ | | $ | | ||||
Other Payables to John Deere | ||||||||||
Designated as hedging instruments: | ||||||||||
Interest rate contracts | $ | | $ | | $ | | ||||
Not designated as hedging instruments: | ||||||||||
Interest rate contracts |
| |
| |
| | ||||
Cross-currency interest rate contracts | | |
| | ||||||
Total not designated |
| |
| |
| | ||||
Accounts Payable and Accrued Expenses | ||||||||||
Not designated as hedging instruments: | ||||||||||
Foreign currency exchange contracts |
| |
| |
| | ||||
Total derivative liabilities | $ | | $ | | $ | | ||||
21
The classification and gains (losses) including accrued interest expense related to derivative instruments on the statements of consolidated income consisted of the following (in millions of dollars):
Three Months Ended | Six Months Ended |
| |||||||||||
May 1 | May 2 | May 1 | May 2 |
| |||||||||
| 2022 |
| 2021 |
| 2022 |
| 2021 |
| |||||
Fair Value Hedges | |||||||||||||
Interest rate contracts - Interest expense |
| $ | ( | $ | ( | $ | ( | $ | ( | ||||
Cash Flow Hedges | |||||||||||||
Recognized in OCI | |||||||||||||
Interest rate contracts - OCI (pretax) |
|
| |
| |
| |
| | ||||
Reclassified from OCI | |||||||||||||
Interest rate contracts - Interest expense |
|
| |
| ( |
| ( |
| ( | ||||
Not Designated as Hedges | |||||||||||||
Interest rate contracts - Interest expense * |
| $ | | $ | | $ | | $ | ( | ||||
Foreign currency exchange contracts - Administrative and operating expenses * |
|
| ( |
| ( |
|
| |
| ( | |||
Total not designated | $ | | $ | ( | $ | | $ | ( | |||||
* Includes interest and foreign currency exchange gains (losses) from cross-currency interest rate contracts.
Included in the table above are interest expense and administrative and operating expense amounts the Company incurred on derivatives transacted with John Deere. The amounts the Company recognized on these affiliate party transactions for the three months ended May 1, 2022 and May 2, 2021 were losses of $
Counterparty Risk and Collateral
Derivative instruments are subject to significant concentrations of credit risk to the banking sector. The Company manages individual unrelated external counterparty exposure by setting limits that consider the credit rating of the unrelated external counterparty, the credit default swap spread of the counterparty, and other financial commitments and exposures between the Company and the unrelated external counterparty banks. All interest rate derivatives are transacted under International Swaps and Derivatives Association (ISDA) documentation. Each master agreement permits the net settlement of amounts owed in the event of default or termination. None of the Company’s derivative agreements contain credit-risk-related contingent features.
The Company’s outstanding derivatives transactions are with both unrelated external counterparties and with John Deere. For derivatives transactions with John Deere, the Company utilizes a centralized hedging structure in which John Deere enters into a derivative transaction with an unrelated external counterparty and simultaneously enters into a derivative transaction with the Company. Except for collateral provisions, the terms of the transaction between the Company and John Deere are identical to the terms of the transaction between John Deere and its unrelated external counterparty.
The Company has ISDA agreements with John Deere that permit the net settlement of amounts owed between counterparties in the event of early termination. In addition, the Company has a loss sharing agreement with John Deere in which the Company has agreed to absorb any losses and expenses John Deere incurs if an unrelated external counterparty fails to meet its obligations on a derivative transaction that John Deere entered into to manage exposures of the Company. The loss sharing agreement did not increase the maximum amount of loss that the Company would incur, after considering collateral received and netting arrangements, as of May 1, 2022, October 31, 2021, and May 2, 2021.
22
Derivatives are recorded without offsetting for netting arrangements or collateral. The impact on the derivative assets and liabilities for external derivatives and those with John Deere related to netting arrangements and any collateral received or paid were as follows (in millions of dollars):
May 1, 2022 |
| ||||||||||||
Derivatives: | Gross Amounts | Netting | Collateral | Net |
| ||||||||
Assets |
|
|
|
|
|
|
|
| |||||
External | $ | | $ | ( | $ | | |||||||
John Deere |
| | ( |
| | ||||||||
Liabilities | |||||||||||||
External |
| |
| ( |
| ||||||||
John Deere |
| |
| ( |
|
| | ||||||
October 31, 2021 |
| ||||||||||||
Derivatives: | Gross Amounts | Netting | Collateral | Net |
| ||||||||
Assets |
|
|
|
|
|
|
|
| |||||
External | $ | | $ | ( |
| $ | | ||||||
John Deere |
| |
| ( |
|
| | ||||||
Liabilities | |||||||||||||
External |
| |
| ( |
|
| | ||||||
John Deere |
| |
| ( |
|
| |||||||
May 2, 2021 |
|
|
|
|
|
| |||||||
Derivatives: | Gross Amounts | Netting | Collateral | Net |
| ||||||||
Assets |
|
|
| ||||||||||
External | $ | | $ | ( | $ | | |||||||
John Deere |
| | ( |
| | ||||||||
Liabilities | |||||||||||||
External |
| |
| ( | $ | ( |
| | |||||
John Deere |
| |
| ( |
|
| | ||||||
23
Item 2. Management’s Discussion and Analysis of Financial Condition and Results of Operations.
Results of Operations
Overview
Organization
The Company primarily generates revenues and cash by financing John Deere dealers’ sales and leases of new and used production and precision agriculture, small agriculture and turf, and construction and forestry equipment. In addition, the Company also provides wholesale financing to dealers of the foregoing equipment and finances retail revolving charge accounts.
Trends and Economic Conditions for Fiscal Year 2022
The Company’s acquisition volume of Receivables and Leases is largely dependent upon the level of retail sales and leases of John Deere products. The level of John Deere retail sales and leases is responsive to a variety of economic, financial, climatic, legislative, and other factors that influence demand for its products.
Industry sales of large agricultural machinery in the U.S. and Canada are expected to be up about 20 percent. Industry sales of turf and utility equipment in the U.S. and Canada are expected to be flat. Industry sales of agricultural machinery in Europe are forecast to be up about 5 percent. In South America, industry sales of tractors and combines are projected to be up about 10 percent. Asia industry sales of agricultural machinery are forecast to be down moderately. Construction equipment industry sales in the U.S. and Canada for 2022 are expected to increase about 10 percent, while compact construction equipment industry sales in the U.S. and Canada are anticipated to be flat to up 5 percent. Forestry global industry equipment sales are expected to be flat to up 5 percent. Global industry roadbuilding equipment sales are forecasted to be flat to up 5 percent.
The Company’s full-year 2022 results are expected to be slightly lower than fiscal 2021 due to a higher provision for credit losses, higher selling, general, and administrative expenses, and less favorable financing spreads, partially offset by income earned on a higher average portfolio.
Items of concern include global and regional political conditions, economic and trade policies, inflationary pressures, the ongoing pandemic, capital market disruptions, changes in demand and pricing for new and used equipment, and the other items discussed in the “Forward-Looking Statements” below. Significant fluctuations in foreign currency exchange rates, volatility in the price of many commodities, and supply chain disruptions could also impact the Company’s results.
2022 Compared with 2021
The total revenues and net income attributable to the Company were as follows (in millions of dollars):
Three Months Ended | Six Months Ended | ||||||||||||
May 1 | May 2 | May 1 | May 2 |
| |||||||||
| 2022 |
| 2021 |
| 2022 |
| 2021 |
| |||||
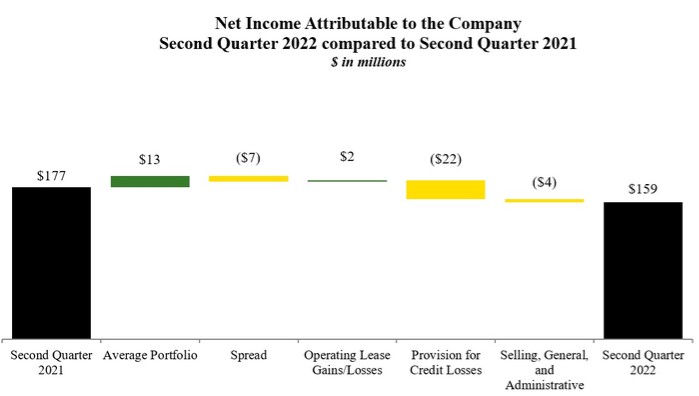
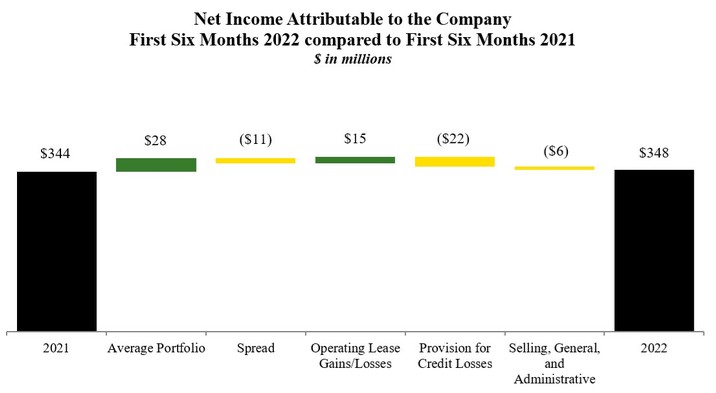
Total revenues | $ | 651.4 | $ | 675.3 | $ | 1,294.3 | $ | 1,332.3 | |||||
Net income attributable to the Company | 158.6 | 177.2 | 348.2 | 343.9 | |||||||||
Total revenues for the second quarter and the first six months of 2022 decreased primarily due to lower average financing rates, partially offset by an average portfolio that was 5 percent higher in the second quarter and 6 percent higher in the first six months of 2022, compared to the same periods last year. In addition, the first six months of 2022 benefited from larger gains on operating lease dispositions.
Net income for the second quarter decreased due to a higher provision for credit losses and less favorable financing spreads, partially offset by income earned on a higher average portfolio. For the first six months, net income rose mainly due to income earned on a higher average portfolio and improvement on operating lease
24
residual values, partially offset by a higher provision for credit losses and less favorable financing spreads. The prior year also benefited from a favorable adjustment to the provision for credit losses.
Revenues
Finance income, lease revenues, and other income earned by the Company were as follows (in millions of dollars):
Three Months Ended | Six Months Ended | ||||||||||||||||
May 1 | May 2 | % | May 1 | May 2 | % | ||||||||||||
2022 | 2021 | Change |
| 2022 | 2021 | Change | |||||||||||
Finance income earned on: | |||||||||||||||||
Retail notes | $ | 242.8 | $ | 234.2 | 4 | $ | 482.8 | $ | 471.5 | 2 | |||||||
Revolving charge accounts | 65.9 | 65.9 | 132.4 | 138.8 | (5) | ||||||||||||
Wholesale receivables | 71.0 | 80.3 | (12) | 130.9 | 153.6 | (15) | |||||||||||
Lease revenues | 236.5 | 256.2 | (8) | 478.0 | 519.8 | (8) | |||||||||||
Other income | 35.2 | 38.7 | (9) | 70.2 | 48.6 | 44 | |||||||||||
25
Finance income earned on retail notes increased slightly compared to 2021 primarily due to higher average portfolio balances, offset by lower average financing rates. Finance income earned on revolving charge accounts decreased for the first six months of 2022 primarily due to lower average financing rates. Finance income earned on wholesale receivables declined due to lower average portfolio balances. Lease revenues decreased primarily due to lower average financing rates and lower average portfolio balances.
Other income decreased for the second quarter of 2022 due to lower freestanding credit enhancement recoveries. Other income increased for the first six months of 2022 primarily due to larger gains on operating lease dispositions. Better than expected conditions in the agriculture and construction used equipment markets are leading to favorable results when the matured operating lease equipment is sold.
Revenues earned from John Deere totaled $149.7 million for the second quarter and $288.3 million for the first six months of 2022, compared with $157.7 million and $306.8 million for the same periods last year, respectively. The decrease was primarily due to decreased compensation paid by John Deere for waived or reduced finance charges on Receivables and Leases, which is amortized into income over the lives of the related Receivables and Leases. Revenues earned from John Deere are included in each of the revenue amounts discussed above.
Expenses
Expenses incurred by the Company were as follows (in millions of dollars):
Three Months Ended | Six Months Ended | ||||||||||||||||
May 1 | May 2 | % | May 1 | May 2 | % | ||||||||||||
2022 | 2021 | Change |
| 2022 | 2021 | Change | |||||||||||
Interest expense | $ | 55.7 | $ | 125.0 | (55) | $ | 155.2 | $ | 259.0 | (40) | |||||||
Depreciation of equipment on operating leases | 165.8 | 184.6 | (10) | 334.6 | 379.4 | (12) | |||||||||||
Administrative and operating expenses | 115.2 | 106.3 | 8 | 211.6 | 198.8 | 6 | |||||||||||
Fees paid to John Deere | 99.6 | 39.4 | 153 | 139.3 | 70.9 | 96 | |||||||||||
Provision (credit) for credit losses | 13.2 | (15.6) | 12.0 | (16.2) | |||||||||||||
Provision for income taxes | 44.5 | 59.0 | (25) | 96.5 | 98.0 | (2) | |||||||||||
The decrease in interest expense for the second quarter and first six months of 2022 was primarily due to lower average borrowing rates and gains on non-designated derivatives.
The depreciation of equipment on operating leases for the second quarter and first six months of 2022 decreased primarily due to updated depreciation estimates as a result of improving conditions in the agriculture and construction markets, in addition to lower average balances of equipment on operating leases.
Fees paid to John Deere increased in the second quarter and first six months of 2022 partially due to the remittance of gains on non-designated derivatives that were assumed by Deere & Company (see Note 7). In addition, fees paid to John Deere increased in both the second quarter and first six months of 2022 due to higher interest on intercompany borrowings from John Deere as a result of larger notional balances in certain high interest rate international markets.
The provision (credit) for credit losses increased in the second quarter and first six months of 2022 compared with the same periods last year due to favorable allowance adjustments in the second quarter of 2021, which did not recur in the current year, and higher write-offs on construction and forestry retail notes and finance leases. The annualized provision (credit) for credit losses, as a percentage of the average balance of total Receivables financed, was .14 percent for the second quarter and .07 percent for the first six months of 2022, compared with (.18) percent and (.10) percent for the same periods last year.
The provision for income taxes decreased during the second quarter of 2022 primarily due to favorable discrete tax items and lower pretax income.
26
Receivables and Leases
Receivable and Lease (excluding wholesale) acquisition volumes were as follows (in millions of dollars):
Three Months Ended | |||||||||||
May 1 | May 2 | $ | % | ||||||||
2022 | 2021 | Change | Change | ||||||||
Retail notes: |
|
|
|
|
|
| |||||
Agriculture and turf | $ | 3,040.3 | $ | 3,189.3 | $ | (149.0) |
| (5) | |||
Construction and forestry |
| 779.8 |
| 700.0 |
| 79.8 |
| 11 | |||
Total retail notes |
| 3,820.1 |
| 3,889.3 |
| (69.2) |
| (2) | |||
Revolving charge accounts |
| 1,946.8 |
| 1,795.6 |
| 151.2 |
| 8 | |||
Financing leases |
| 159.6 |
| 152.5 |
| 7.1 |
| 5 | |||
Equipment on operating leases |
| 521.1 |
| 511.0 |
| 10.1 |
| 2 | |||
Total Receivables and Leases (excluding wholesale) | $ | 6,447.6 | $ | 6,348.4 | $ | 99.2 |
| 2 | |||
Six Months Ended | |||||||||||
May 1 | May 2 | $ | % | ||||||||
2022 | 2021 | Change | Change | ||||||||
Retail notes: |
|
|
|
|
|
| |||||
Agriculture and turf | $ | 5,360.2 | $ | 5,517.0 | $ | (156.8) |
| (3) | |||
Construction and forestry |
| 1,454.2 |
| 1,331.9 |
| 122.3 |
| 9 | |||
Total retail notes |
| 6,814.4 |
| 6,848.9 |
| (34.5) |
| (1) | |||
Revolving charge accounts |
| 4,035.3 |
| 3,786.7 |
| 248.6 |
| 7 | |||
Financing leases |
| 259.8 |
| 232.0 |
| 27.8 |
| 12 | |||
Equipment on operating leases |
| 828.6 |
| 795.2 |
| 33.4 |
| 4 | |||
Total Receivables and Leases (excluding wholesale) | $ | 11,938.1 | $ | 11,662.8 | $ | 275.3 |
| 2 | |||
27
Total Receivables and Leases owned were as follows (in millions of dollars):
| May 1 |
| October 31 |
| May 2 | ||||
2022 | 2021 | 2021 | |||||||
Retail notes: |
|
|
| ||||||
Agriculture and turf | $ | 21,510.2 | $ | 21,518.9 | $ | 19,079.3 | |||
Construction and forestry |
| 4,780.4 |
| 4,487.0 |
| 4,173.1 | |||
Total retail notes |
| 26,290.6 |
| 26,005.9 |
| 23,252.4 | |||
Revolving charge accounts |
| 3,425.0 |
| 3,740.1 |
| 3,267.9 | |||
Wholesale receivables |
| 7,346.4 |
| 5,951.3 |
| 8,424.1 | |||
Financing leases |
| 896.5 |
| 972.3 |
| 789.1 | |||
Equipment on operating leases |
| 4,708.7 |
| 4,947.6 |
| 5,008.9 | |||
Total Receivables and Leases | $ | 42,667.2 | $ | 41,617.2 | $ | 40,742.4 | |||
Total Receivables 30 days or more past due, non-performing Receivables, and the allowance for credit losses were as follows (in millions of dollars and as a percentage of the Receivables balance):
May 1 | October 31 | May 2 | |||||||||||||
2022 | 2021 | 2021 | |||||||||||||
Dollars | Percent | Dollars | Percent | Dollars | Percent | ||||||||||
Receivables 30 days or more past due | $ | 379.9 | 1.00 | $ | 340.8 | .93 | $ | 372.2 | 1.04 | ||||||
Non-performing Receivables | 260.2 | .69 | 280.1 | .76 | 285.7 | .80 | |||||||||
Allowance for credit losses | 124.5 | .33 | 129.0 | .35 | 129.8 | .36 | |||||||||
Receivables 30 days or more past due continue to accrue finance income. The Company ceases to accrue finance income once Receivables are considered non-performing. An allowance for credit losses is recorded for the estimated credit losses expected over the life of the Receivable portfolio. The Company measures expected credit losses on a collective basis when similar risk characteristics exist. Risk characteristics considered by the Company include product category, market, geography, credit risk, and remaining duration. Receivables that do not share risk characteristics with other receivables in the portfolio are evaluated on an individual basis. While the Company believes its allowance is sufficient to provide for losses over the life of its existing Receivable portfolio, different assumptions or changes in economic conditions would result in changes to the allowance for credit losses and the provision for credit losses. See Note 4 for additional information related to the allowance for credit losses.
Deposits held from dealers and merchants amounted to $126.9 million at May 1, 2022, compared with $131.8 million at October 31, 2021 and $125.8 million at May 2, 2021. These balances primarily represent the aggregate dealer retail note and lease withholding accounts from individual John Deere dealers to which losses from retail notes and leases originating from the respective dealers can be charged. Recoveries from dealer deposits are recognized in other income when the dealer’s withholding account is charged. Recoveries from dealer deposits and other freestanding credit enhancements recorded in other income were $1.9 million for the second quarter and $3.1 million for the first six months of 2022, compared with $5.7 million and $6.6 million for the same periods last year, respectively.
28
Write-offs and recoveries of Receivables, by product, and as an annualized percentage of average balances held during the period, were as follows (in millions of dollars):
Three Months Ended | |||||||||||
May 1, 2022 | May 2, 2021 | ||||||||||
Dollars | Percent | Dollars | Percent | ||||||||
Write-offs: |
|
|
|
|
|
|
|
| |||
Retail notes and financing leases: | |||||||||||
Agriculture and turf | $ | (5.3) |
| (.10) | $ | (5.3) |
| (.11) | |||
Construction and forestry |
| (8.0) |
| (.66) |
| (1.8) |
| (.17) | |||
Total retail notes and financing leases |
| (13.3) |
| (.20) |
| (7.1) |
| (.12) | |||
Revolving charge accounts |
| (7.5) |
| (1.00) |
| (9.0) |
| (1.25) | |||
Wholesale receivables |
| (.2) |
| (.01) |
| (.1) |
| ||||
Total write-offs |
| (21.0) |
| (.23) |
| (16.2) |
| (.19) | |||
Recoveries: | |||||||||||
Retail notes and financing leases: | |||||||||||
Agriculture and turf |
| 2.7 |
| .05 |
| 1.6 |
| .03 | |||
Construction and forestry |
| 1.0 |
| .08 |
| .5 |
| .05 | |||
Total retail notes and financing leases |
| 3.7 |
| .06 |
| 2.1 |
| .04 | |||
Revolving charge accounts |
| 7.1 |
| .95 |
| 9.8 |
| 1.36 | |||
Total recoveries |
| 10.8 |
| .12 |
| 11.9 |
| .14 | |||
Total net write-offs | $ | (10.2) |
| (.11) | $ | (4.3) |
| (.05) | |||
Six Months Ended | |||||||||||
May 1, 2022 | May 2, 2021 | ||||||||||
Dollars | Percent | Dollars | Percent | ||||||||
Write-offs: |
|
|
|
|
|
|
| ||||
Retail notes and financing leases: | |||||||||||
Agriculture and turf | $ | (11.3) |
| (.10) | $ | (7.2) |
| (.08) | |||
Construction and forestry |
| (14.5) |
| (.61) |
| (4.0) |
| (.20) | |||
Total retail notes and financing leases |
| (25.8) |
| (.19) |
| (11.2) |
| (.10) | |||
Revolving charge accounts |
| (11.5) |
| (.77) |
| (14.3) |
| (.97) | |||
Wholesale receivables |
| (.2) |
| (.01) |
| (.1) |
| ||||
Total write-offs |
| (37.5) |
| (.21) |
| (25.6) |
| (.15) | |||
Recoveries: | |||||||||||
Retail notes and financing leases: | |||||||||||
Agriculture and turf |
| 4.6 |
| .04 |
| 4.0 |
| .04 | |||
Construction and forestry |
| 2.0 |
| .08 |
| .9 |
| .04 | |||
Total retail notes and financing leases |
| 6.6 |
| .05 |
| 4.9 |
| .04 | |||
Revolving charge accounts |
| 14.9 |
| .99 |
| 19.0 |
| 1.29 | |||
Total recoveries |
| 21.5 |
| .12 |
| 23.9 |
| .14 | |||
Total net write-offs | $ | (16.0) |
| (.09) | $ | (1.7) |
| (.01) | |||
Critical Accounting Estimates
See the Company’s critical accounting estimates discussed in the Management’s Discussion and Analysis of Financial Condition and Results of Operations of the most recently filed Annual Report on Form 10-K. There have been no material changes to these estimates.
Capital Resources and Liquidity
For additional information on the Company’s dependence on, and relationship with, Deere & Company, see the Company’s most recently filed Annual Report on Form 10-K.
29
During the first six months of 2022, net cash provided by operating activities was $541.1 million. Net cash used by investing activities totaled $1,698.0 million, primarily due to a seasonal increase in wholesale receivables. The increase in wholesale receivables was funded primarily through external borrowings, with financing activities providing net cash of $1,111.7 million. Cash, cash equivalents, and restricted cash decreased $54.6 million during the first six months of 2022.
During the first six months of 2021, net cash provided by operating activities was $689.8 million. Net cash used by investing activities totaled $2,032.0 million, primarily due to the cost of Receivables acquired exceeding the collections of Receivables. The increase in Receivables was funded primarily through external borrowings, with financing activities providing net cash of $1,318.5 million. Cash, cash equivalents, and restricted cash decreased $15.0 million during the first six months of 2021.
The Company relies on its ability to raise substantial amounts of funds to finance its Receivable and Lease portfolios. The Company has access to most global markets at reasonable costs and expects to have sufficient sources of global funding and liquidity to meet its funding needs in the short term and long term. The Company’s ability to meet its debt obligations is supported in several ways. The assets of the Company are self-liquidating in nature. A solid equity position is available to absorb unusual losses on these assets and all commercial paper is backed by unsecured, committed borrowing lines from various banks. Liquidity is also provided by the Company’s ability to securitize these assets and through the issuance of term debt (both public and private markets). Additionally, liquidity may be provided through loans from John Deere. The Company’s commercial paper outstanding at May 1, 2022, October 31, 2021, and May 2, 2021 was $1,654.6 million, $662.9 million, and $1,168.9 million, respectively, while the total cash, cash equivalents, and marketable securities position was $633.7 million, $679.1 million, and $669.0 million, respectively. The amount of cash, cash equivalents, and marketable securities held by foreign subsidiaries was $138.4 million, $158.0 million, and $174.8 million at May 1, 2022, October 31, 2021, and May 2, 2021, respectively.
The Company has a revolving warehouse facility to utilize bank conduit facilities to securitize retail notes (see Note 5). The facility was renewed in November 2021 with an expiration in November 2022 and a reduction of the total capacity or “financing limit” from $2,000.0 million to $1,000.0 million. As a result of the reduced capacity, the Company repurchased $511.1 million of outstanding short-term securitization borrowings in November 2021, in addition to the normal monthly liquidations related to payments collected on the retail notes. At May 1, 2022, $759.9 million of securitization borrowings were outstanding under the facility. At the end of the contractual revolving period, unless the banks and the Company agree to renew, the Company would liquidate the secured borrowings over time as payments on the retail notes are collected.
During the first six months of 2022, the Company issued $3,658.0 million and retired $2,722.9 million of long-term external borrowings, which primarily consisted of medium-term notes. During the first six months of 2022, the Company also issued $1,223.9 million and retired $1,817.6 million of retail note securitization borrowings and maintained an average commercial paper balance of $1,165.7 million. At May 1, 2022, the Company’s funding profile included $1,731.5 million of commercial paper and other notes payable, $4,000.9 million of securitization borrowings, $5,276.4 million of notes payable to John Deere, $26,545.0 million of unsecured term debt, and $4,669.0 million of equity capital. The Company’s funding profile may be altered to reflect such factors as relative costs of funding sources, assets available for securitizations, and capital market accessibility.
In April 2022, the Company issued $600.0 million of sustainability-linked medium-term notes with an initial interest rate of 3.35 percent, which are due in 2029. This transaction supports John Deere’s commitment to environmental sustainability by linking financing to the achievement of its ambitious and comprehensive environmental, social, and governance targets. Failure to meet the stated sustainability performance target will result in a 25-basis point increase to the interest rate payable on the 2029 notes from and including April 2026.
Total interest-bearing indebtedness amounted to $37,553.8 million at May 1, 2022, compared with $37,319.9 million at October 31, 2021 and $36,499.7 million at May 2, 2021. Total external short-term indebtedness amounted to $11,886.1 million at May 1, 2022, compared with $11,093.2 million at October 31, 2021 and $10,964.3 million at May 2, 2021. Total external long-term indebtedness amounted to $20,391.3 million at May 1, 2022, compared with $20,607.3 million at October 31, 2021 and $19,783.0 million
30
at May 2, 2021. Total notes payable to John Deere amounted to $5,276.4 million at May 1, 2022, compared with $5,619.4 million at October 31, 2021 and $5,752.4 million at May 2, 2021. The ratio of total interest-bearing debt, including securitization indebtedness, to stockholder’s equity was 8.0 to 1 at May 1, 2022, compared with 8.2 to 1 at October 31, 2021 and 8.1 to 1 at May 2, 2021.
Lines of Credit
The Company has access to bank lines of credit with various banks throughout the world. Some of the lines are available to both the Company and Deere & Company. Worldwide lines of credit totaled $8,077.0 million at May 1, 2022, $4,607.5 million of which were unused. For the purpose of computing the unused credit lines, commercial paper and short-term bank borrowings of the Company and John Deere, excluding secured borrowings and the current portion of long-term external borrowings, were considered to constitute utilization. Included in the total credit lines at May 1, 2022 was a 364-day credit facility agreement of $3,000.0 million, expiring in the second quarter of 2023. In addition, total credit lines included long-term credit facility agreements of $2,500.0 million, expiring in the second quarter of 2026, and $2,500.0 million, expiring in the second quarter of 2027. These credit agreements require the Company to maintain its consolidated ratio of earnings to fixed charges at not less than 1.05 to 1 for each fiscal quarter and its ratio of senior debt, excluding securitization indebtedness, to capital base (total subordinated debt and stockholder’s equity excluding accumulated other comprehensive income (loss)) at not more than 11 to 1 at the end of any fiscal quarter. All of these credit agreement requirements have been met during the periods included in the consolidated financial statements.
Debt Ratings
The Company’s ability to obtain funding is affected by its debt ratings, which are closely related to the outlook for and the financial condition of John Deere, and the nature and availability of support facilities, such as the Company’s lines of credit and the support agreement from Deere & Company.
To access public debt capital markets, the Company relies on credit rating agencies to assign short-term and long-term credit ratings to the Company’s securities as an indicator of credit quality for fixed income investors. A security rating is not a recommendation by the rating agency to buy, sell, or hold the Company’s securities. A credit rating agency may change or withdraw Company ratings based on its assessment of the Company’s current and future ability to meet interest and principal repayment obligations. Each agency’s rating should be evaluated independently of any other rating. Lower credit ratings generally result in higher borrowing costs, including costs of derivative transactions, and reduced access to debt capital markets.
The senior long-term and short-term debt ratings and outlook currently assigned to unsecured Company debt securities by the rating agencies engaged by the Company are the same as those for John Deere. Those ratings are as follows:
| Senior Long-Term |
| Short-Term |
| Outlook |
| |
Fitch Ratings | A | F1 | Stable | ||||
Moody’s Investors Service, Inc. |
| A2 |
| Prime-1 |
| Stable | |
Standard & Poor’s |
| A |
| A-1 |
| Stable |
Dividends and Other Events
Capital Corporation declared and paid cash dividends to John Deere Financial Services, Inc. (JDFS) of $175.0 million and $135.0 million in the first six months of 2022 and 2021, respectively. In each case, JDFS paid comparable dividends to Deere & Company.
On May 24, 2022, Capital Corporation declared a $135.0 million dividend to be paid to JDFS on June 15, 2022. JDFS, in turn, declared a $135.0 million dividend to Deere & Company, also payable on June 15, 2022.
In May 2022, the Company entered into a retail note securitization using its revolving warehouse facility that resulted in securitization borrowings of $223.6 million.
31
Forward-Looking Statements
Certain statements contained herein, including in the section entitled “Overview” relating to future events, expectations, and trends constitute “forward-looking statements” as defined in the Private Securities Litigation Reform Act of 1995 and involve factors that are subject to change, assumptions, risks, and uncertainties that could cause actual results to differ materially.
Forward-looking statements are based on currently available information and current assumptions, expectations, and projections about future events. Except as required by law, the Company undertakes no obligation to update or revise its forward-looking statements. Further information concerning the Company and its business, including factors that could materially affect the Company’s financial results, is included in the Company’s other filings with the SEC (including, but not limited to, the factors discussed in Item 1A. “Risk Factors” of the Company’s most recent Annual Report on Form 10-K and the Company’s subsequent Quarterly Reports on Form 10-Q).
The Company’s business is closely related to John Deere’s business. Further information, including factors that could materially affect the Company’s and John Deere’s financial results, is included in the most recent Deere & Company Annual Report on Form 10-K and subsequent Quarterly Reports on Form 10-Q (including, but not limited to, the factors discussed in Item 1A., “Risk Factors” of the Annual Report on Form 10-K and subsequent Quarterly Reports on Form 10-Q) and other Deere & Company filings with the SEC.
In addition, the Company’s business and its results are affected by general economic conditions in the global markets and industry in which the Company operates; actions of banks, financing and leasing companies, and other lenders that compete with the Company for customers; customer confidence in general economic conditions; foreign currency exchange rates and their volatility, especially fluctuations in the value of the U.S. dollar; changing interest rates; inflation and deflation rates; changes in weather and climate patterns; the political and social stability of the global markets in which the Company operates; the effects of, or response to, terrorism and security threats; wars and other conflicts, including the current military conflict between Russia and Ukraine; natural disasters; and the spread of major epidemics or pandemics (including the COVID-19 pandemic).
The liquidity and ongoing profitability of the Company depend on timely access to capital in order to meet future cash flow requirements, and to fund operations, costs, and finance customer purchases of John Deere products. If general economic conditions deteriorate or capital markets become more volatile, funding could be unavailable or insufficient. Significant changes in market liquidity conditions, changes in the Company’s credit ratings, and any failure to comply with financial covenants in credit agreements could also impact access to funding and funding costs, which could reduce the Company’s earnings and cash flows. Financial market conditions could also negatively impact customer confidence levels, access to capital for purchases of John Deere products and purchase decisions, credit application volumes, financing and repayment practices, and the number of and size of customer delinquencies and defaults, which could materially impact the Company’s write-offs and provision for credit losses. A debt crisis in Europe, Latin America, or elsewhere could negatively impact currencies, global financial markets, funding sources and costs, asset and obligation values, customers, demand for John Deere equipment, and Company operations and results. The Company’s operations could be impaired by changes in the equity, bond, and other financial markets, which would negatively affect earnings.
Additional factors that could materially affect the Company’s operations, access to capital, expenses, and results include changes in, uncertainty surrounding, and the impact of governmental trade, banking, monetary, and fiscal policies, including financial regulatory reform and its effects on the consumer finance industry, derivatives, funding costs, governmental programs, policies, and tariffs for the benefit of certain industries or sectors; retaliatory actions to such changes in trade, banking, monetary, and fiscal policies; actions by central banks and by financial and securities regulators, which may affect the costs and expenses of financing the Company and the financing rates it is able to offer; actions by environmental, health, and safety regulatory agencies, including those related to the effects of climate change; changes in labor and immigration regulations; changes to accounting standards; changes in tax rates, estimates, laws, and regulations and Company actions related thereto; changes to and compliance with privacy, banking, and other regulations; changes to and
32
compliance with economic sanctions, or countersanctions, and export controls laws and regulations; and compliance with U.S. and foreign laws when expanding to new markets and otherwise.
Other factors that could materially affect the Company’s results and operations include security breaches, cybersecurity attacks, technology failures, and other disruptions to the information technology infrastructure of the Company and John Deere dealers; the failure of customers, John Deere dealers, or the Company to comply with laws, regulations, and company policies pertaining to employment, human rights, health, safety, the environment, sanctions, export controls, anti-corruption, privacy and data protection, and other ethical business practices; events that damage the Company’s reputation or brand; significant investigations, claims, lawsuits, or other legal proceedings; the success of new product initiatives or business strategies; changes in customer product preferences; oil and energy prices, supplies, and volatility; actions of competitors; changes in demand and pricing for used equipment and resulting impacts on lease residual values; labor relations and contracts, including work stoppages and other disruptions; changes in the ability to attract, develop, engage, and retain qualified personnel; greater-than-anticipated transaction costs; and the failure to realize anticipated savings or benefits of cost reduction, productivity, or efficiency efforts.
Uncertainties related to the continued effects of the COVID-19 pandemic have adversely affected and may continue to affect the Company’s business and outlook. These uncertainties include, among other things: the duration and impact of any resurgence in COVID-19; disruptions in the supply chain, including those caused by industry capacity constraints, material availability, and global logistics delays and constraints arising from, among other things, the transportation capacity of ocean shipping containers, and continued disruptions in the operations of one or more of John Deere’s key suppliers, or the failure of any key suppliers; and an increasingly competitive labor market due to a sustained labor shortage or increased turnover caused by the COVID-19 pandemic. The sustainability of the economic recovery from the pandemic remains unclear and significant volatility could continue for a prolonged period.
Item 3. Quantitative and Qualitative Disclosures About Market Risk.
Omitted pursuant to General Instruction H.
Item 4. Controls and Procedures.
The Company’s principal executive officer and its principal financial officer have concluded that the Company’s disclosure controls and procedures (as defined in Rules 13a-15(e) and 15d-15(e) of the Securities Exchange Act of 1934, as amended (the Exchange Act)) were effective as of May 1, 2022, based on the evaluation of these controls and procedures required by Rule 13a-15(b) or 15d-15(b) of the Exchange Act. During the second quarter, there were no changes that have materially affected or are reasonably likely to materially affect the Company’s internal control over financial reporting.
33
PART II. OTHER INFORMATION
Item 1. Legal Proceedings.
The Company is subject to various unresolved legal actions which arise in the normal course of its business, the most prevalent of which relate to retail credit matters. The Company believes the reasonably possible range of losses for these unresolved legal actions would not have a material effect on its consolidated financial statements.
Item 1A. Risk Factors.
See the Company’s most recently filed Annual Report on Form 10-K (Part I, Item 1A). There has been no material change in this information. The risks described in the Annual Report on Form 10-K, and the “Forward-Looking Statements” in this report, are not the only risks faced by the Company. Additional risks and uncertainties may also materially affect the Company’s business, financial condition, or operating results. One should not consider the risk factors to be a complete discussion of risks, uncertainties, and assumptions.
Item 2. Unregistered Sales of Equity Securities and Use of Proceeds.
Omitted pursuant to General Instruction H.
Item 3. Defaults Upon Senior Securities.
Omitted pursuant to General Instruction H.
Item 4. Mine Safety Disclosures.
Not applicable.
Item 5. Other Information.
None.
34
Item 6. Exhibits.
Certain instruments relating to long-term debt, constituting less than 10 percent of the registrant’s total assets, are not filed as exhibits herewith pursuant to Item 601(b)(4)(iii)(A) of Regulation S-K. The registrant will file copies of such instruments upon request of the SEC.
3.1 | |
3.2 | |
10.1 | |
10.2 | |
10.3 | |
31.1 | |
31.2 | |
32 | |
101.SCH | Inline XBRL Taxonomy Extension Schema Document |
101.CAL | Inline XBRL Taxonomy Extension Calculation Linkbase Document |
101.DEF | Inline XBRL Taxonomy Extension Definition Linkbase Document |
101.LAB | Inline XBRL Taxonomy Extension Label Linkbase Document |
101.PRE | Inline XBRL Taxonomy Extension Presentation Linkbase Document |
104 | Cover Page Interactive Data File (formatted as Inline XBRL and contained in Exhibit 101) |
* Incorporated by reference.
35
SIGNATURES
Pursuant to the requirements of the Securities Exchange Act of 1934, the registrant has duly caused this report to be signed on its behalf by the undersigned thereunto duly authorized.
JOHN DEERE CAPITAL CORPORATION | ||||
Date: | May 26, 2022 | By: | /s/ Ryan D. Campbell | |
Ryan D. Campbell | ||||
Senior Vice President and | ||||
Principal Financial Officer and Principal Accounting Officer | ||||
36
Serious News for Serious Traders! Try StreetInsider.com Premium Free!
You May Also Be Interested In
- Intra-Cellular Therapies Announces Closing of $575 Million Public Offering Including Full Exercise of Underwriters’ Option to Purchase Additional Shares
- Princeton Bancorp, Inc. Announces Declaration of a $0.30 Quarterly Cash Dividend
- Midday movers: Tesla, Boeing rise; Uber, Old Dominion Freight fall
Create E-mail Alert Related Categories
SEC FilingsSign up for StreetInsider Free!
Receive full access to all new and archived articles, unlimited portfolio tracking, e-mail alerts, custom newswires and RSS feeds - and more!
