

Form 10-Q Cboe Global Markets, For: Mar 31
 Tweet
Tweet Share
ShareUNITED STATES
SECURITIES AND EXCHANGE COMMISSION
Washington, D.C. 20549
FORM
QUARTERLY REPORT PURSUANT TO SECTION 13 OR 15(d) OF THE SECURITIES EXCHANGE ACT OF 1934 |
For the quarterly period ended
OR
TRANSITION REPORT PURSUANT TO SECTION 13 OR 15(d) OF THE SECURITIES EXCHANGE ACT OF 1934 |
For the transition period from to
Commission file number:
(Exact Name of Registrant as Specified in Its Charter)
(
(Registrant’s telephone number, including area code)
Securities registered pursuant to Section 12(b) of the Act:
Title of each class: |
| Trading Symbol |
| Name of each exchange on which registered: |
Indicate by check mark whether the registrant (1) has filed all reports required to be filed by Section 13 or 15(d) of the Securities Exchange Act of 1934 during the preceding 12 months (or for such shorter period that the registrant was required to file such reports), and (2) has been subject to such filing requirements for the past 90 days.
Indicate by check mark whether the registrant has submitted electronically every Interactive Data File required to be submitted pursuant to Rule 405 of Regulation S-T (§232.405 of this chapter) during the preceding 12 months (or for such shorter period that the registrant was required to submit such files).
Indicate by check mark whether the registrant is a large accelerated filer, an accelerated filer, a non-accelerated filer, a smaller reporting company, or an emerging growth company. See the definitions of “large accelerated filer,” “accelerated filer,” “smaller reporting company,” and “emerging growth company” in Rule 12b-2 of the Exchange Act.
☒ | Accelerated Filer | ◻ | Non-accelerated Filer | ◻ | |
Smaller Reporting Company | Emerging Growth Company |
If an emerging growth company, indicate by check mark if the registrant has elected not to use the extended transition period for complying with any new or revised financial accounting standards provided pursuant to Section 13(a) of the Exchange Act. ◻
Indicate by check mark whether the registrant is a shell company (as defined in Rule 12b-2 of the Exchange Act). Yes
Indicate the number of shares outstanding of each of the registrant’s classes of common stock, as of the latest practicable date:
Class |
| April 22, 2022 |
TABLE OF CONTENTS
2
CERTAIN DEFINED TERMS
Throughout this document, unless otherwise specified or the context so requires:
| ● | “Cboe,” “we,” “us,” “our” or “the Company” refers to Cboe Global Markets, Inc. and its subsidiaries. |
| ● | “ADV” means average daily volume. |
| ● | “ADNV” means average daily notional value. |
| ● | “AFM” refers to the Netherlands Authority for the Financial Markets. |
| ● | “ATS” refers to an alternative trading system. |
| ● | “Bats Global Markets” and “Bats” refer to our wholly-owned subsidiary Bats Global Markets, Inc., now known as Cboe Bats, LLC, and its subsidiaries. |
| ● | “BIDS Trading” refers to BIDS Trading, L.P., a wholly-owned subsidiary of Cboe Global Markets, Inc. The ATS operated by BIDS Trading is not a registered national securities exchange or a facility thereof. |
| ● | “BYX” refers to Cboe BYX Exchange, Inc., a wholly-owned subsidiary of Cboe Global Markets, Inc. |
| ● | “BZX” refers to Cboe BZX Exchange, Inc., a wholly-owned subsidiary of Cboe Global Markets, Inc. |
| ● | “C2” refers to Cboe C2 Exchange, Inc., a wholly-owned subsidiary of Cboe Global Markets, Inc. |
| ● | “Cboe Asia Pacific” refers to Chi-X Holdings Limited, a wholly-owned subsidiary of Cboe Global Markets, Inc. |
| ● | “Cboe Australia” refers to Cboe Australia Pty Ltd. (formerly known as Chi-X Australia Pty. Ltd.), a wholly-owned subsidiary of Cboe Global Markets, Inc. |
| ● | “Cboe Chi-X Europe” refers to Cboe Chi-X Europe Limited, a wholly-owned subsidiary of Cboe Global Markets, Inc. |
| ● | “Cboe Europe Equities and Derivatives” refers to the combined businesses of Cboe Europe and Cboe NL. |
| ● | “Cboe Europe” refers to Cboe Europe Limited, a wholly-owned subsidiary of Cboe Global Markets, Inc., the UK operator of our Multilateral Trading Facility (“MTF”), our Regulated Market (“RM”), and our Approved Publication Arrangement (“APA”) under its Recognized Investment Exchange (“RIE”) status. |
| ● | “Cboe FX” refers to Cboe FX Markets, LLC, a wholly-owned subsidiary of Cboe Global Markets, Inc. |
| ● | “Cboe Japan” refers to Cboe Japan Ltd. (formerly known as Chi-X Japan Ltd.), a wholly-owned subsidiary of Cboe Global Markets, Inc. |
| ● | “Cboe NL” refers to Cboe Europe BV, a wholly-owned subsidiary of Cboe Global Markets, Inc., the Netherlands operator of our MTF, RM, and APA. |
| ● | “Cboe Options” refers to Cboe Exchange, Inc., a wholly-owned subsidiary of Cboe Global Markets, Inc. |
| ● | “Cboe SEF” refers to Cboe SEF, LLC, a wholly-owned subsidiary of Cboe Global Markets, Inc. |
| ● | “Cboe Swiss” refers to Cboe Switzerland GmbH, a wholly-owned subsidiary of Cboe Global Markets, Inc. |
| ● | “Cboe Trading” refers to Cboe Trading, Inc., a wholly-owned subsidiary of Cboe Global Markets, Inc., operated in the United States. |
| ● | “CFE” refers to Cboe Futures Exchange, LLC, a wholly-owned subsidiary of Cboe Global Markets, Inc. |
| ● | “CFTC” refers to the U.S. Commodity Futures Trading Commission. |
| ● | “EDGA” refers to Cboe EDGA Exchange, Inc., a wholly-owned subsidiary of Cboe Global Markets, Inc. |
| ● | “EDGX” refers to Cboe EDGX Exchange, Inc., a wholly-owned subsidiary of Cboe Global Markets, Inc. |
| ● | “ErisX” refers to Eris Digital Holdings, LLC. |
| ● | “ESMA” refers to the European Securities and Markets Authority. |
| ● | “EuroCCP” refers to European Central Counterparty N.V., a wholly-owned subsidiary of Cboe Global Markets, Inc. |
| ● | “Exchanges” refers to Cboe Options, C2, BZX, BYX, EDGX, and EDGA. |
| ● | “FASB” refers to the Financial Accounting Standards Board. |
| ● | “FCA” refers to the UK Financial Conduct Authority. |
| ● | “FINRA” refers to the Financial Industry Regulatory Authority. |
| ● | “GAAP” refers to Generally Accepted Accounting Principles in the United States. |
| ● | “IIROC” refers to the Investment Industry Regulatory Organization of Canada. |
| ● | “MATCHNow” refers to TriAct Canada Marketplace LP, a wholly-owned subsidiary of Cboe Global Markets, Inc., the operator of our Canadian ATS called MATCHNow. |
| ● | “Merger” refers to our acquisition of Bats Global Markets, completed on February 28, 2017. |
| ● | “NEO” refers to Aequitas Innovations, Inc. |
| ● | “OCC” refers to The Options Clearing Corporation. |
| ● | “OPRA” refers to Options Price Reporting Authority, LLC. |
| ● | “SEC” refers to the U.S. Securities and Exchange Commission. |
| ● | “SPX” refers to our S&P 500 Index exchange-traded options products. |
| ● | “TPH” refers to either a Trading Permit Holder or a Trading Privilege Holder. |
| ● | “VIX” refers to our Cboe Volatility Index exchange traded options and futures products. |
3
TRADEMARK AND OTHER INFORMATION
Cboe®, Cboe Global Markets®, Bats®, BIDS Trading®, BYX®, BZX®, Cboe Volatility Index®, CFE®, EDGA®, EDGX®, EuroCCP®, Hybrid®, LiveVol®, MATCHNow®, Options Institute®, Silexx®, VIX® and XSP® are registered trademarks, and Cboe Futures ExchangeSM, Cboe BIDS EuropeSM, C2SM, f(t)optionsSM, HanweckSM, NANOSM, Nanos by CboeSM, and Trade AlertSM are service marks of Cboe Global Markets, Inc. and its subsidiaries. Standard & Poor's®, S&P®, S&P 100®, S&P 500® and SPX® are registered trademarks of Standard & Poor's Financial Services LLC and have been licensed for use by Cboe Exchange, Inc. Dow Jones®, Dow Jones Industrial Average®, DJIA® and Dow Jones Indices are registered trademarks or service marks of Dow Jones Trademark Holdings, LLC, used under license. Russell® and the Russell index names are registered trademarks of Frank Russell Company, used under license. FTSE® and the FTSE indices are trademarks and service marks of FTSE International Limited, used under license. All other trademarks and service marks are the property of their respective owners.
MSCI and the MSCI index names are service marks of MSCI Inc. (“MSCI”) or its affiliates and have been licensed for use by us. Any derivative indices and any financial products based on the derivative indices (“MCSI-Based Products”) are not sponsored, guaranteed or endorsed by MSCI, its affiliates or any other party involved in, or related to, making or compiling such MSCI index. Neither MSCI, its affiliates nor any other party involved in, or related to, making or compiling any MSCI index makes any representations regarding the advisability of investing in such MSCI-Based Products; makes any warranty, express or implied; or bears any liability as to the results to be obtained by any person or any entity from the use of any such MSCI index or any data included therein. No purchaser, seller or holder of any MSCI-Based Product, or any other person or entity, should use or refer to any MSCI trade name, trademark or service mark to sponsor, endorse, market or promote any security without first contacting MSCI to determine whether MSCI’s permission is required.
This Quarterly Report on Form 10-Q includes market share and industry data that we obtained from industry publications and surveys, reports of governmental agencies and internal company surveys. Industry publications and surveys generally state that the information they contain has been obtained from sources believed to be reliable, but we cannot assure you that this information is accurate or complete. We have not independently verified any of the data from third-party sources nor have we ascertained the underlying economic assumptions relied upon therein. Statements as to our market position are based on the most currently available market data. While we are not aware of any misstatements regarding industry data presented herein, our estimates involve risks and uncertainties and are subject to change based on various factors. We refer you to the “Risk Factors” in Part II, Item 1A of this Quarterly Report on Form 10-Q and our other filings with the SEC.
4
FORWARD-LOOKING STATEMENTS
This Quarterly Report on Form 10-Q contains forward-looking statements within the meaning of the Private Securities Litigation Reform Act of 1995 that involve a number of risks and uncertainties. You can identify these statements by forward-looking words such as “may,” “might,” “should,” “expect,” “plan,” “anticipate,” “believe,” “estimate,” “predict,” “potential” or “continue,” and the negative of these terms and other comparable terminology. All statements that reflect our expectations, assumptions or projections about the future other than statements of historical fact are forward-looking statements, including statements in “Management’s Discussion and Analysis of Financial Condition and Results of Operations”. These forward-looking statements, which are subject to known and unknown risks, uncertainties and assumptions about us, may include projections of our future financial performance based on our growth strategies and anticipated trends in our business. These statements are only predictions based on our current expectations and projections about future events. There are important factors that could cause our actual results, level of activity, performance or achievements to differ materially from those expressed or implied by the forward-looking statements. In particular, you should consider the risks and uncertainties described under “Risk Factors” in this Quarterly Report and our other filings with the SEC.
While we believe we have identified material risks, these risks and uncertainties are not exhaustive. Moreover, we operate in a very competitive and rapidly changing environment. New risks and uncertainties emerge from time to time, and it is not possible to predict all risks and uncertainties, nor can we assess the impact of all factors on our business or the extent to which any factor, or combination of factors, may cause actual results to differ materially from those contained in any forward-looking statements.
Some factors that could cause actual results to differ include:
| ● | the loss of our right to exclusively list and trade certain index options and futures products; |
| ● | economic, political and market conditions; |
| ● | compliance with legal and regulatory obligations; |
| ● | price competition and consolidation in our industry; |
| ● | decreases in trading or clearing volumes, market data fees or a shift in the mix of products traded on our exchanges; |
| ● | legislative or regulatory changes or changes in tax regimes; |
| ● | our ability to protect our systems and communication networks from security risks, cybersecurity risks, insider threats and unauthorized disclosure of confidential information; |
| ● | our ability to attract and retain skilled management and other personnel; |
| ● | increasing competition by foreign and domestic entities; |
| ● | our dependence on and exposure to risk from third parties; |
| ● | fluctuations to currency exchange rates; |
| ● | factors that impact the quality and integrity of our indices; |
| ● | the impact of the novel coronavirus (“COVID-19”) pandemic; |
| ● | our ability to operate our business without violating the intellectual property rights of others and the costs associated with protecting our intellectual property rights; |
| ● | our ability to minimize the risks, including our credit and default risks, associated with operating a European clearinghouse; |
| ● | our ability to accommodate trading and clearing volume and transaction traffic, including significant increases, without failure or degradation of performance of our systems; |
| ● | misconduct by those who use our markets or our products or for whom we clear transactions; |
| ● | challenges to our use of open source software code; |
| ● | our ability to meet our compliance obligations, including managing potential conflicts between our regulatory responsibilities and our for-profit status; |
| ● | our ability to maintain BIDS Trading as an independently managed and operated trading venue, separate from and not integrated with our registered national securities exchanges; |
| ● | damage to our reputation; |
| ● | the ability of our compliance and risk management methods to effectively monitor and manage our risks; |
| ● | our ability to manage our growth and strategic acquisitions or alliances effectively; |
| ● | restrictions imposed by our debt obligations and our ability to make payments on or refinance our debt obligations; |
| ● | our ability to maintain an investment grade credit rating; |
5
| ● | impairment of our goodwill, long-lived assets, investments or intangible assets; |
| ● | the accuracy of our estimates and expectations; |
| ● | litigation risks and other liabilities; and |
| ● | if the acquisition of ErisX is consummated, operating a digital asset business. |
For a detailed discussion of these and other factors that might affect our performance, see Part II, Item 1A of this Report. We do not undertake, and expressly disclaim, any duty to update any forward-looking statement whether as a result of new information, future events or otherwise, except as required by law. We caution you not to place undue reliance on the forward-looking statements, which speak only as of the date of this filing.
6
PART I—FINANCIAL INFORMATION
Item 1. Financial Statements.
Cboe Global Markets, Inc. and Subsidiaries
Condensed Consolidated Balance Sheets
(unaudited)
(in millions, except par value data and share amounts)
| March 31, |
| December 31, | |||
2022 | 2021 | |||||
Assets | ||||||
Current assets: | ||||||
Cash and cash equivalents | $ | | $ | | ||
Financial investments | | | ||||
Accounts receivable, net of $ | | | ||||
Margin deposits and clearing funds | | | ||||
Income taxes receivable |
| — |
| | ||
Other current assets |
| |
| | ||
Total current assets |
| |
| | ||
Investments |
| |
| | ||
Land |
| |
| | ||
Property and equipment, net | | | ||||
Operating lease right of use assets | | | ||||
Goodwill | | | ||||
Intangible assets, net | | | ||||
Other assets, net |
| |
| | ||
Total assets | $ | | $ | | ||
Liabilities and Stockholders’ Equity | ||||||
Current liabilities: | ||||||
Accounts payable and accrued liabilities | $ | | $ | | ||
Section 31 fees payable | | | ||||
Deferred revenue | | | ||||
Margin deposits and clearing funds | | | ||||
Income taxes payable | |
| | |||
Current portion of contingent consideration liabilities |
| |
| | ||
Total current liabilities |
| |
| | ||
Long-term debt |
| | | |||
Unrecognized tax benefits |
| | | |||
Deferred income taxes |
| | | |||
Non-current operating lease liabilities | | | ||||
Contingent consideration liabilities | | | ||||
Other non-current liabilities | |
| | |||
Total liabilities | | | ||||
Commitments and contingencies | ||||||
Stockholders’ equity: | ||||||
Preferred stock, $ | ||||||
Common stock, $ |
| |
| | ||
Common stock in treasury, at cost, |
| ( |
| ( | ||
Additional paid-in capital |
| |
| | ||
Retained earnings |
| |
| | ||
Accumulated other comprehensive income, net |
| |
| | ||
Total stockholders’ equity |
| |
| | ||
Total liabilities and stockholders’ equity | $ | | $ | | ||
See accompanying notes to condensed consolidated financial statements.
7
Cboe Global Markets, Inc. and Subsidiaries
Condensed Consolidated Statements of Income
(unaudited)
(in millions, except per share data)
Three Months Ended | ||||||
March 31, | ||||||
| 2022 |
| 2021 | |||
Revenues: | ||||||
Cash and spot markets | $ | | $ | | ||
Data and access solutions | | | ||||
Derivatives markets | | | ||||
Total revenues |
| |
| | ||
Cost of revenues: | ||||||
Liquidity payments |
| |
| | ||
Routing and clearing | | | ||||
Section 31 fees | | | ||||
Royalty fees and other cost of revenues |
| |
| | ||
Total cost of revenues |
| |
| | ||
Revenues less cost of revenues |
| |
| | ||
Operating expenses: | ||||||
Compensation and benefits |
| |
| | ||
Depreciation and amortization |
| |
| | ||
Technology support services |
| |
| | ||
Professional fees and outside services |
| |
| | ||
Travel and promotional expenses |
| |
| | ||
Facilities costs |
| |
| | ||
Acquisition-related costs |
| |
| | ||
Other expenses | | | ||||
Total operating expenses |
| |
| | ||
Operating income |
| |
| | ||
Non-operating (expenses) income: | ||||||
Interest expense, net |
| ( |
| ( | ||
Other (expense) income, net |
| ( |
| | ||
Income before income tax provision |
| |
| | ||
Income tax provision |
| |
| | ||
Net income | | | ||||
Net income allocated to participating securities | ( | ( | ||||
Net income allocated to common stockholders | $ | | $ | | ||
Basic earnings per share | $ | | $ | | ||
Diluted earnings per share | $ | | $ | | ||
Basic weighted average shares outstanding | | | ||||
Diluted weighted average shares outstanding | | | ||||
See accompanying notes to condensed consolidated financial statements.
8
Cboe Global Markets, Inc. and Subsidiaries
Condensed Consolidated Statements of Comprehensive Income
(unaudited)
(in millions)
| Three Months Ended | |||||
March 31, | ||||||
| 2022 |
| 2021 | |||
Net income | $ | | $ | | ||
Other comprehensive (loss) income, net of income tax: | ||||||
Foreign currency translation adjustments |
| ( | | |||
Comprehensive income | | | ||||
Comprehensive income allocated to participating securities | ( | ( | ||||
Comprehensive income allocated to common stockholders, net of income tax | $ | | $ | | ||
See accompanying notes to condensed consolidated financial statements.
9
Cboe Global Markets, Inc. and Subsidiaries
Condensed Consolidated Statements of Changes in Stockholders’ Equity
Three months ended March 31, 2022 and March 31, 2021
(unaudited)
(in millions, except per share amounts)
Accumulated | |||||||||||||||||||||
Additional | other | Total | |||||||||||||||||||
Preferred | Common | Treasury | paid-in | Retained | comprehensive | stockholders’ | |||||||||||||||
| Stock |
| Stock |
| Stock |
| capital |
| earnings |
| income, net |
| equity | ||||||||
Balance at December 31, 2021 | $ | — | $ | | $ | ( | $ | | $ | | $ | | $ | | |||||||
Cash dividends on common stock of $ | — | — | — | — | ( | — | ( | ||||||||||||||
Stock-based compensation | — | — | — | | — | — | | ||||||||||||||
Repurchases of common stock from employee stock plans | — | — | ( | — | — | — | ( | ||||||||||||||
Purchase of common stock | — | — | ( | — | — | — | ( | ||||||||||||||
Shares issued under employee stock purchase plan | — | — | — | | — | — | | ||||||||||||||
Net income | — | — | — | — | | — | | ||||||||||||||
Other comprehensive loss | — | — | — | — | — | ( | ( | ||||||||||||||
Balance at March 31, 2022 | $ | — | $ | | $ | ( | $ | | $ | | $ | | $ | | |||||||
Accumulated | |||||||||||||||||||||
Additional | other | Total | |||||||||||||||||||
Preferred | Common | Treasury | paid-in | Retained | comprehensive | stockholders’ | |||||||||||||||
| Stock |
| Stock |
| Stock |
| capital |
| earnings |
| income, net |
| equity | ||||||||
Balance at December 31, 2020 |
| $ | — | $ | | $ | ( | $ | | $ | | $ | | $ | | ||||||
Cash dividends on common stock of $ | — | — | — | — | ( | — | ( | ||||||||||||||
Stock-based compensation | — | | — | | — | — | | ||||||||||||||
Repurchases of common stock from employee stock plans | — | — | ( | — | — | — | ( | ||||||||||||||
Purchase of common stock | — | — | ( | — | — | — | ( | ||||||||||||||
Shares issued under employee stock purchase plan | — | — | — | | — | — | | ||||||||||||||
Net income | — | — | — | — | | — | | ||||||||||||||
Other comprehensive income | — | — | — | — | — | | | ||||||||||||||
Balance at March 31, 2021 | $ | — | $ | | $ | ( | $ | | $ | | $ | | $ | | |||||||
See accompanying notes to condensed consolidated financial statements.
10
Cboe Global Markets, Inc. and Subsidiaries
Condensed Consolidated Statements of Cash Flows
(unaudited)
(in millions)
| Three Months Ended | |||||
March 31, | ||||||
2022 |
| 2021 | ||||
Cash flows from operating activities: | ||||||
Net income | $ | | $ | | ||
Adjustments to reconcile net income to net cash provided by operating activities: | ||||||
Depreciation and amortization |
| |
| | ||
Amortization of debt issuance cost and debt discount | | | ||||
Provision for accounts receivable credit losses | | | ||||
Provision for deferred income taxes | ( | ( | ||||
Stock-based compensation expense | | | ||||
Loss on disposal of property and equipment | | — | ||||
Impairment charge of investment | — | | ||||
Equity loss in investments | | | ||||
Changes in assets and liabilities: | ||||||
Accounts receivable | ( | ( | ||||
Restricted cash and cash equivalents (margin deposits and clearing funds) | | | ||||
Income taxes receivable | | | ||||
Other current assets | | ( | ||||
Other assets | ( | ( | ||||
Accounts payable and accrued liabilities | | ( | ||||
Section 31 fees payable | ( | ( | ||||
Deferred revenue | | | ||||
Income taxes payable | | | ||||
Unrecognized tax benefits | | | ||||
Other liabilities | ( | | ||||
Net cash provided by operating activities |
| | | |||
Cash flows from investing activities: |
| |||||
Purchases of available-for-sale financial investments |
| ( | ( | |||
Proceeds from maturities of available-for-sale financial investments | | | ||||
Contributions to investments | ( | — | ||||
Purchases of property and equipment and leasehold improvements |
| ( | ( | |||
Net cash used in investing activities |
| ( | ( | |||
Cash flows from financing activities: |
| |||||
Proceeds from long-term debt |
| | — | |||
Principal payments of current portion of long-term debt |
| — | ( | |||
Debt issuance costs |
| ( | — | |||
Cash dividends on common stock |
| ( | ( | |||
Repurchases of common stock from employee stock plans |
| ( | ( | |||
Payment of contingent consideration from acquisition | ( | ( | ||||
Shares issued under employee stock purchase plan | ( | ( | ||||
Purchase of common stock |
| ( | ( | |||
Net cash provided by (used in) financing activities | | ( | ||||
Effect of foreign currency exchange rates on cash, cash equivalents, and restricted cash and cash equivalents | | ( | ||||
Increase in cash, cash equivalents, and restricted cash and cash equivalents | | | ||||
Cash, cash equivalents, and restricted cash and cash equivalents: | ||||||
Beginning of period | | | ||||
End of period | $ | | $ | | ||
Reconciliation of cash, cash equivalents, and restricted cash and cash equivalents: | ||||||
Cash and cash equivalents | | | ||||
Restricted cash and cash equivalents (margin deposits and clearing funds) | | | ||||
Restricted cash and cash equivalents (included in other current assets) | | — | ||||
Total | $ | | $ | | ||
Supplemental disclosure of cash transactions: | ||||||
Cash paid for income taxes | $ | | $ | | ||
Cash paid for interest | | | ||||
See accompanying notes to condensed consolidated financial statements.
11
Cboe Global Markets, Inc. and Subsidiaries
Notes to Condensed Consolidated Financial Statements (unaudited)
1. ORGANIZATION AND BASIS OF PRESENTATION
Cboe Global Markets, Inc. (“Cboe” or “the Company”), a leading provider of market infrastructure and tradable products, delivers cutting-edge trading, clearing and investment solutions to market participants around the world. The Company is committed to operating a trusted, inclusive global marketplace, and to providing leading products, technology and data solutions that enable participants to define a sustainable financial future. Cboe provides trading solutions and products in multiple asset classes, including equities, derivatives and FX, across North America, Europe, and Asia Pacific.
Cboe’s subsidiaries include the largest options exchange and the third largest stock exchange operator in the U.S. In addition, the Company operates one of the largest stock exchanges by value traded in Europe, and owns EuroCCP, a leading pan-European equities and derivatives clearinghouse, BIDS Trading, a leading block-trading ATS by volume in the U.S., MATCHNow, a leading equities ATS in Canada, Cboe Australia, an operator of trading venues in Australia, and Cboe Japan, an operator of trading venues in Japan. Cboe also is a leading market globally for exchange-traded products (“ETPs”) listings and trading.
The Company is headquartered in Chicago with offices in Amsterdam, Belfast, Calgary, Hong Kong, Kansas City, London, Manila, New York, San Francisco, Sarasota Springs, Singapore, Sydney, Tokyo and Toronto.
Basis of Presentation
These interim unaudited condensed consolidated financial statements have been prepared in accordance with GAAP as established by FASB for interim financial information and with the instructions to Form 10-Q and should be read in conjunction with the consolidated financial statements and notes thereto contained in the Company’s Annual Report on Form 10-K for the year ended December 31, 2021. The results of operations for interim periods are not necessarily indicative of the results of operations for the full year.
The preparation of condensed consolidated financial statements in conformity with GAAP requires management to make estimates and assumptions that affect the reported amounts of assets and liabilities, disclosures of contingent assets and liabilities, and reported amounts of revenues and expenses. On an ongoing basis, management evaluates its estimates based upon historical experience, observance of trends, information available from outside sources and various other assumptions that management believes to be reasonable under the circumstances. Actual results may differ from these estimates under different conditions or assumptions.
In the opinion of management, all adjustments (consisting of normal recurring adjustments) considered necessary for a fair presentation of financial position, results of operations and cash flows at the dates and for the periods presented have been included.
Beginning in the first quarter of 2022, the Company updated the financial statement captions within its condensed consolidated statements of income for both periods presented to better reflect the Company’s diversified products, expansive geographical reach, and overall business strategy. Below is a summary of the changes to the financial statement captions. The changes do not have a financial impact on the Company’s reported revenue, revenues less cost of revenues, reported net income, or cash flows from operations.
Revenues
| ● | Cash and spot markets – includes associated transaction and clearing fees, the portion of market data fees relating to associated U.S. tape plan market data fees, associated regulatory fees, and associated other revenue from Cboe’s North American Equities, Europe and Asia Pacific, and Global FX segments. |
| ● | Data and access solutions – includes access and capacity fees, proprietary market data fees, and associated other revenue across Cboe’s |
| ● | Derivatives markets – includes associated transaction and clearing fees, the portion of market data fees relating to associated U.S. tape plan market data fees, associated regulatory fees, and associated other revenue from Cboe’s Options, Futures, and Europe and Asia Pacific segments. |
12
Cost of Revenues
| ● | Royalty fees and other cost of revenues – includes royalty fees and other cost of revenues across the Company’s |
Segment Information
The Company has
Update to Significant Accounting Policies
There have been no new or material changes to the significant accounting policies discussed in the Company’s Annual Report on Form 10-K for the fiscal year ended December 31, 2021, that are of significance, or potential significance, to the Company.
Recent Accounting Pronouncements - Adopted
There were no recent applicable material accounting pronouncements that have been adopted as of March 31, 2022.
Recent Accounting Pronouncements - Issued, not yet Adopted
There were no applicable material accounting pronouncements that have been issued, but not yet adopted as of March 31, 2022.
2. REVENUE RECOGNITION
The Company’s main types of revenue contracts consist of the following, which are disaggregated from the condensed consolidated statements of income.
| ● | Transaction and clearing fees - Transaction fees represent fees charged by the Company for meeting the point-in-time performance obligation of executing a trade on its markets. These fees can be variable based on trade volume tiered discounts; however, as all tiered discounts are calculated monthly, the actual discount is recorded on a monthly basis. Transaction fees are recognized across all segments. Clearing fees, which include settlement fees, represent fees charged by the Company for meeting the point-in-time performance obligation for transactions cleared and settled by EuroCCP. Clearing fees can be variable based on trade volume tiered discounts; however, as all tiered discounts are calculated monthly, the actual discount is recorded on a monthly basis. Clearing fees are recognized in the Europe and Asia Pacific segment. Transaction and clearing fees, as well as any tiered volume discounts, are calculated and billed monthly in accordance with the Company’s published fee schedules. |
| ● | Access and capacity fees - Access and capacity fees represent fees assessed for the opportunity to trade, including fees for trading-related functionality across all segments, terminal and other equipment rights, maintenance services, trading floor space and telecommunications services. Facilities, systems services and other fees are generally monthly fee-based. These fees are billed monthly in accordance with the Company’s published fee schedules and recognized on a monthly basis when the performance obligations are met. All access and capacity fees associated with the trading floor are recognized over time in the Options segment, as the performance obligations are met. |
| ● | Market data fees - Market data fees represent the fees received by the Company from the U.S. tape plans and fees charged to customers for proprietary market data. Fees from the U.S. tape plans are collected monthly based on published fee schedules and distributed quarterly to the Exchanges based on a known formula. A contract for proprietary market data is entered into and charged on a monthly basis in accordance with the Company’s published fee schedules as the service is provided. Proprietary market data also includes revenue from various licensing agreements, which was classified as other revenue prior to January 1, 2022. Both types of market data are satisfied over time, and revenue is recognized on a monthly basis as the customer receives and consumes the benefit as the Company provides the data to meet its performance obligation. U.S. tape plan market data is recognized in the North American Equities and Options segments. Proprietary market data fees are recognized across all segments. |
13
| ● | Regulatory fees - There are |
| ● | Other revenue - Other revenue primarily includes interest income from clearing operations, all fees related to the trade reporting facility operated in the Europe and Asia Pacific segment, listing fees, and revenue associated with advertisements through the Company’s websites. |
All revenue recognized in the condensed consolidated statements of income is considered to be revenue from contracts with customers, with the exception of interest income from clearing operations. The following table depicts the disaggregated revenue contract types listed above within each respective financial statement caption in the condensed consolidated statements of income (in millions):
Cash | Data and | |||||||||||
and Spot | Access | Derivatives | ||||||||||
| Markets |
| Solutions |
| Markets |
| Total | |||||
Three Months Ended March 31, 2022 | ||||||||||||
Transaction and clearing fees | $ | | $ | — | $ | | $ | | ||||
Access and capacity fees | — | | — | | ||||||||
Market data fees | | | | | ||||||||
Regulatory fees | | — | | | ||||||||
Other revenue | | | | | ||||||||
$ | | $ | | $ | | $ | | |||||
Cash | Data and | |||||||||||
and Spot | Access | Derivatives | ||||||||||
Markets |
| Solutions |
| Markets |
| Total | ||||||
Three Months Ended March 31, 2021 | ||||||||||||
Transaction and clearing fees | $ | | $ | — | $ | | $ | | ||||
Access and capacity fees | — | | — | | ||||||||
Market data fees | | | | | ||||||||
Regulatory fees | | — | | | ||||||||
Other revenue | | | | | ||||||||
$ | | $ | | $ | | $ | | |||||
14
The following table depicts the disaggregation of revenue according to segment (in millions):
North | Europe | Corporate | |||||||||||||||||||
American | and Asia | Global | Items and | ||||||||||||||||||
| Options |
| Equities |
| Pacific |
| Futures |
| FX |
| Eliminations |
| Total | ||||||||
Three Months Ended March 31, 2022 | |||||||||||||||||||||
Transaction and clearing fees | $ | | $ | | $ | | $ | | $ | | $ | — | $ | | |||||||
Access and capacity fees | | | | | | — | | ||||||||||||||
Market data fees | | | | | | — | | ||||||||||||||
Regulatory fees | | | — | — | — | — | | ||||||||||||||
Other revenue | | | | — | | — | | ||||||||||||||
$ | | $ | | $ | | $ | | $ | | $ | — | $ | | ||||||||
Timing of revenue recognition | |||||||||||||||||||||
Services transferred at a point in time | $ | | $ | | $ | | $ | | $ | | $ | — | $ | | |||||||
Services transferred over time | | | | | | — | | ||||||||||||||
$ | | $ | | $ | | $ | | $ | | $ | — | $ | | ||||||||
Three Months Ended March 31, 2021 | |||||||||||||||||||||
Transaction and clearing fees | $ | | $ | | $ | | $ | | $ | | $ | — | $ | | |||||||
Access and capacity fees | | | | | | — | | ||||||||||||||
Market data fees | | | | | | — | | ||||||||||||||
Regulatory fees | | | — | — | — | — | | ||||||||||||||
Other revenue | | | | — | — | | | ||||||||||||||
$ | | $ | | $ | | $ | | $ | | $ | | $ | | ||||||||
Timing of revenue recognition | |||||||||||||||||||||
Services transferred at a point in time | $ | | $ | | $ | | $ | | $ | | $ | | $ | | |||||||
Services transferred over time | | | | | | — | | ||||||||||||||
$ | | $ | | $ | | $ | | $ | | $ | | $ | | ||||||||
Contract liabilities as of March 31, 2022 primarily represent prepayments of transaction fees and certain access and capacity and market data fees to the Exchanges.
| Balance at |
| Cash |
| Revenue |
| Balance at | |||||
Liquidity provider sliding scale (1) | $ | — | $ | | $ | ( | $ | | ||||
Other, net | | | ( | | ||||||||
Total deferred revenue | $ | | $ | | $ | ( | $ | | ||||
| (1) | Liquidity providers are eligible to participate in the sliding scale program, which involves prepayment of transaction fees, and to receive reduced fees based on the achievement of certain volume thresholds within a calendar month. These transaction fees are amortized and recorded ratably as the transactions occur over the period. |
3. ACQUISITIONS
On July 1, 2021, the Company purchased Chi-X Holdings Limited, which was subsequently rebranded to Cboe Asia Pacific. Cboe Asia Pacific is a holding company of alternative market operators and providers of market solutions, which is included in the Company’s Europe and Asia Pacific segment. The acquisition of Cboe Asia Pacific provided the Company with a single point of entry into
15
The following table presents the details of intangible assets at the date of acquisition (in millions, except as stated). All acquired intangible assets with finite lives are amortized using the straight-line method.
Cboe | Useful Life (Years) | ||||
Trading registrations and licenses | $ | | Indefinite | ||
Customer relationships | | ||||
Technology | | ||||
Total identifiable intangible assets | $ | | |||
Acquisition-related costs relate to acquisitions and other strategic opportunities. The Company expensed $
4. INVESTMENTS
As of March 31, 2022 and December 31, 2021, the Company’s investments were comprised of the following (in millions):
March 31, | December 31, | |||||
| 2022 |
| 2021 | |||
Equity method investments: | ||||||
Investment in 7Ridge Investments 3 LP | $ | | $ | | ||
Total equity method investments | | | ||||
Other equity investments: | ||||||
Investment in Eris Exchange Holdings, LLC | | | ||||
Investment in American Financial Exchange, LLC | | | ||||
Investment in Cboe Vest Financial Group, Inc. | | | ||||
Investment in Eris Digital Holdings, LLC | | | ||||
Investment in OCC | | | ||||
Other equity investments |
| |
| | ||
Total other equity investments | | | ||||
Total investments | $ | | $ | | ||
Equity Method Investments
The Company’s investment in 7Ridge Investments 3 LP (“7Ridge Fund”), accounted for under the equity method of accounting, represents a nonconsolidated variable interest entity (“VIE”). The Company has determined that consolidation of the VIE is not required as the Company is not the primary beneficiary of the 7Ridge Fund, as it does not have controlling financial interest and lacks the ability to unilaterally remove the general partner, 7Ridge Investments 3 GP Limited, direct material strategic decisions, or dissolve the entity (i.e., the Company does not have unilateral substantive “kick-out” or “liquidation” rights).
The Company’s interest in the 7Ridge Fund is equal to the carrying value of the investment as of March 31, 2022, or $
Other Equity Investments
The carrying value of other equity investments is included in investments in the condensed consolidated balance sheets. The Company accounts for these investments using the measurement alternative given the absence of readily
16
determinable fair values for the respective investments and due to the Company’s inability to exercise significant influence over the investments based upon the respective ownership interests held. As of March 31, 2022, other equity investments primarily reflect a
As announced on October 20, 2021, the Company plans to acquire the remaining interest in Eris Digital Holdings, LLC. However, Eris Exchange Holdings, LLC is not a part of this transaction and the Company retains its minority equity ownership interest in Eris Exchange Holdings, LLC. The closing of the transaction is subject to customary closing conditions. As a result, the timing of the closing is uncertain, but the Company presently anticipates a closing in the second quarter of 2022. See Item 2 (“Management’s Discussion and Analysis of Financial Condition and Results of Operations”) for more information.
5. PROPERTY AND EQUIPMENT, NET
Property and equipment, net consisted of the following as of March 31, 2022 and December 31, 2021 (in millions):
March 31, | December 31, | |||||
| 2022 |
| 2021 | |||
Construction in progress | $ | | $ | | ||
Building | | | ||||
Furniture and equipment |
| |
| | ||
Total property and equipment |
| |
| | ||
Less accumulated depreciation |
| ( |
| ( | ||
Total property and equipment, net | $ | | $ | | ||
Depreciation expense using the straight-line method was $
As a result of the Merger, there was a reduction in employee workspace needed in Chicago, which led to the decision to market for sale the former headquarters location. The Company classified the associated land, building, and certain furniture and equipment of the former headquarters location as held for sale, performed an impairment assessment, and ceased depreciation effective May 1, 2019, as the Company anticipated selling the property held for sale in less than twelve months. As of March 31, 2022, the former headquarters location remains on the market for sale and management’s intent to sell the property is unchanged. However, due to the time elapsed since active marketing for sale of the building commenced, the Company has reclassified the property to held and used, effective May 1, 2021, and the building was once again subject to depreciation. The total value of the property classified as property held and used was $
6. CREDIT LOSSES
Current expected credit losses are estimated for accounts receivable and certain notes receivable. The notes receivable included within other assets, net on the condensed consolidated balance sheets primarily relate to the consolidated audit trail (“CAT”), which involves the creation of an audit trail that strives to enhance regulators’ ability to monitor trading activity in the U.S. markets through a phased implementation. The funding of the CAT is ultimately expected to be provided by both self-regulatory organizations (“SROs”) (which includes the Exchanges) and industry members; however, the funding to date has solely been provided by the SROs in exchange for promissory notes, which are expected to be repaid once fee filings and plan amendments associated with a funding model are approved by the SEC and such industry member fees are collected. Until those fees are collected, the SROs may continue to incur additional significant costs, including additional promissory notes to fund CAT operations. The allowance for notes receivable credit losses associated with the CAT is calculated using a probability of default methodology that is primarily based on various potential outcomes of the funding model proposals being discussed with the SEC. Accounts receivable represent amounts due from the Company’s member firms. The allowance for accounts receivable credit losses is calculated using an aging schedule.
17
The following represents the changes in allowance for credit losses during the three months ended March 31, 2022 (in millions):
Balance at | Current period provision for expected credit losses | Write-offs charged against the allowance | Recoveries collected | Balance at | |||||||||||
Allowance for notes receivable credit losses | $ | | $ | — | $ | — | $ | — | $ | | |||||
Allowance for accounts receivable credit losses | | | — | ( | | ||||||||||
Total allowance for credit losses | $ | | $ | | $ | — | $ | ( | $ | | |||||
7. OTHER ASSETS, NET
Other assets, net consisted of the following as of March 31, 2022 and December 31, 2021 (in millions):
March 31, | December 31, | |||||
| 2022 |
| 2021 | |||
Software development work in progress | $ | | $ | | ||
Data processing software | | | ||||
Less accumulated depreciation and amortization |
| ( |
| ( | ||
Data processing software, net |
| |
| | ||
Other assets (1) | | | ||||
Total other assets, net | $ | | $ | | ||
| (1) | At March 31, 2022 and December 31, 2021, the majority of the balance included notes receivable and long-term prepaid assets. See Note 6 (“Credit Losses”) for more information on the notes receivable included within other assets, net on the condensed consolidated balance sheets. As of March 31, 2022 and December 31, 2021, the notes receivable, net balance was $ |
Amortization expense related to data processing software was $
8. GOODWILL AND INTANGIBLE ASSETS, NET
The following table presents the details of goodwill by segment (in millions):
North American | Europe and | ||||||||||||||
| Options |
| Equities |
| Asia Pacific |
| Global FX |
| Total | ||||||
Balance as of December 31, 2021 | $ | | $ | | $ | | $ | | $ | | |||||
Changes in foreign currency exchange rates |
| — |
| |
| ( |
| — |
| ( | |||||
Balance as of March 31, 2022 | $ | | $ | | $ | | $ | | $ | | |||||
Goodwill has been allocated to specific reporting units for purposes of impairment testing - Options, North American Equities, Europe and Asia Pacific, and Global FX.
18
The following table presents the details of the intangible assets (in millions):
North American | Europe and | ||||||||||||||
| Options |
| Equities |
| Asia Pacific |
| Global FX |
| Total | ||||||
Balance as of December 31, 2021 | $ | | $ | | $ | | $ | | $ | | |||||
Amortization |
| ( |
| ( |
| ( | ( |
| ( | ||||||
Changes in foreign currency exchange rates |
| — |
| | ( |
| — |
| ( | ||||||
Balance as of March 31, 2022 | $ | | $ | | $ | | $ | | $ | | |||||
For the three months ended March 31, 2022 and 2021, amortization expense was $
The following tables present the categories of intangible assets as of March 31, 2022 and December 31, 2021 (in millions, except as stated):
March 31, 2022 | Weighted | |||||||||||||
North | Europe | Average | ||||||||||||
American | and Asia | Amortization | ||||||||||||
| Options |
| Equities |
| Pacific |
| Global FX |
| Period (in years) | |||||
Trading registrations and licenses | $ | | $ | | $ | | $ | — | Indefinite | |||||
Customer relationships |
| |
| |
| |
| | ||||||
Market data customer relationships |
| |
| |
| |
| | ||||||
Technology |
| |
| |
| |
| | ||||||
Trademarks and tradenames |
| |
| |
| |
| | ||||||
Accumulated amortization |
| ( |
| ( |
| ( |
| ( | ||||||
$ | | $ | | $ | | $ | | |||||||
December 31, 2021 | Weighted | |||||||||||||
North | Europe | Average | ||||||||||||
American | and Asia | Amortization | ||||||||||||
| Options |
| Equities |
| Pacific |
| Global FX |
| Period (in years) | |||||
Trading registrations and licenses | $ | | $ | | $ | | $ | — | Indefinite | |||||
Customer relationships |
| | | | | |||||||||
Market data customer relationships |
| | | | | |||||||||
Technology |
| | | | | |||||||||
Trademarks and tradenames |
| | | | | |||||||||
Accumulated amortization |
| ( | ( | ( | ( | |||||||||
$ | | $ | | $ | | $ | | |||||||
9. ACCOUNTS PAYABLE AND ACCRUED LIABILITIES
Accounts payable and accrued liabilities consisted of the following as of March 31, 2022 and December 31, 2021 (in millions):
| March 31, | December 31, | ||||
2022 |
| 2021 | ||||
Compensation and benefit-related liabilities | $ | | $ | | ||
Royalties | | | ||||
Current unrecognized tax benefits | | — | ||||
Accrued liabilities |
| | | |||
Rebates payable | | | ||||
Marketing fee payable |
| | | |||
Accounts payable |
| | | |||
Total accounts payable and accrued liabilities | $ | | $ | | ||
19
10. DEBT
The Company’s debt consisted of the following as of March 31, 2022 and December 31, 2021 (in millions):
| March 31, | December 31, | ||||
2022 |
| 2021 | ||||
Term Loan Agreement due December 2023, floating rate | $ | | $ | | ||
$ | | — | ||||
$ | | | ||||
$ |
| |
| | ||
Revolving Credit Agreement (1) | ( | — | ||||
EuroCCP Credit Facility | — | — | ||||
Total debt | $ | | $ | | ||
(1) | As of March 31, 2022 there was |
As described below in further detail, on February 25, 2022, the Company amended the Revolving Credit Agreement (as defined below) to allow for an additional $
Term Loan Agreement
On March 22, 2018, the Company, as borrower, entered into a Term Loan Credit Agreement (the “Term Loan Agreement”) with Bank of America, N.A. (“Bank of America”), as administrative agent and initial lender, and the several banks and other financial institutions from time to time party thereto as lenders. Bank of America also acted as sole lead arranger and sole bookrunner with respect to the Term Loan Agreement. The Term Loan Agreement provided for a senior unsecured term loan facility in an aggregate principal amount of $
Loans under the Term Loan Agreement bear interest, at the Company’s option, at either (i) the London Interbank Offered Rate (“LIBOR”) periodically fixed for an interest period (as selected by the Company) of one, two, three or six months plus a margin (based on the Company’s public debt ratings) ranging from
On May 29, 2020, the Company amended the Term Loan Agreement to, among other items, (i) permit liens on assets of the EuroCCP settlement and clearing business that secures indebtedness incurred in support of its settlement and clearing activities, and permit the Company’s subsidiaries to incur such indebtedness, provided that such amounts are repaid within 35 days; and (ii) provide that LIBOR, as used in the Term Loan Agreement, may be succeeded by one or more secured overnight financing rates (“SOFR”) published by the Federal Reserve Bank of New York or another alternate benchmark rate giving due consideration to any evolving or then-existing convention for similar agreements.
On June 25, 2021, the Company further amended the Term Loan Agreement to, among other items, (i) extend the maturity date from December 15, 2021 to December 15, 2023; (ii) allow for an additional draw of $
20
maximum permitted consolidated leverage ratio to
On March 29, 2022, the Company further amended the Term Loan Agreement to, among other items, (i) allow for additional delayed draws of up to $
The Term Loan Agreement, which matures on December 15, 2023, contains customary representations, warranties and affirmative and negative covenants for facilities of its type, including financial covenants, events of default, including cross-defaults from the Company’s other indebtedness, and indemnification provisions in favor of the lenders thereunder. The negative covenants include restrictions regarding the incurrence of liens, the incurrence of indebtedness by the Company’s subsidiaries and fundamental changes, subject to certain exceptions in each case. The financial covenants require the Company to meet a quarterly financial test with respect to a minimum consolidated interest coverage ratio of not less than
Senior Notes
On January 12, 2017, the Company entered into an indenture (the “Indenture”), by and between the Company and Computershare Trust Company, N.A. (as successor to Wells Fargo Bank, National Association), as trustee, in connection with the issuance of $
On December 15, 2020, the Company issued $
On March 16, 2022, the Company issued $
The Senior Notes are unsecured obligations of the Company and rank equally with all of the Company’s other existing and future unsecured, senior indebtedness, but are effectively junior to the Company’s secured indebtedness, to
21
the extent of the value of the assets securing such indebtedness, and will be structurally subordinated to the secured and unsecured indebtedness of the Company’s subsidiaries.
The Company has the option to redeem some or all of the Senior Notes, at any time in whole or from time to time in part, at the redemption prices set forth in the applicable Officer’s Certificate. The Company may also be required to offer to repurchase the Senior Notes upon the occurrence of a Change of Control Triggering Event (as such term is defined in the applicable Officer’s Certificate) at a repurchase price equal to
Indenture
Under the Indenture, the Company may issue debt securities, which includes the
Revolving Credit Agreement
On February 25, 2022, the Company, as borrower, entered into a Second Amended and Restated Credit Agreement (the “Revolving Credit Agreement”), which amended and restated the prior revolving credit agreement, with Bank of America, N.A., as administrative agent and as swing line lender, certain lenders named therein (the “Revolving Lenders”), BOFA Securities, Inc., as sole lead arranger and sole bookrunner and certain syndication agents named therein ("Syndication Agents").
The Revolving Credit Agreement provides for a senior unsecured $
Funds borrowed under the Revolving Credit Agreement may be used to fund working capital and for other general corporate purposes, including the making of any acquisitions the Company may pursue in the ordinary course of its business. As of March 31, 2022,
Loans under the Revolving Credit Agreement will bear interest, at the Company’s option, at either (i) the Relevant Rate (defined herein) plus a margin (based on the Company’s public debt ratings) ranging from
Subject to certain conditions stated in the Revolving Credit Agreement, the Company and any subsidiaries designated as additional borrowers may borrow, prepay and reborrow amounts under the Revolving Credit Facility at any time during the term of the Revolving Credit Agreement. The Revolving Credit Agreement will terminate and all amounts owing thereunder will be due and payable on February 25, 2027, unless the commitments are terminated earlier, either at the request of the Company or, if an event of default occurs, by the Revolving Lenders (or automatically in the case of certain bankruptcy-related events). The Revolving Credit Agreement contains customary representations, warranties and affirmative and negative covenants for facilities of its type, including financial covenants, events of default and indemnification provisions in favor of the Revolving Lenders. The negative covenants include restrictions regarding the incurrence of liens, the incurrence of indebtedness by the Company’s subsidiaries and fundamental changes, subject to
22
certain exceptions in each case. The financial covenants require the Company to meet a quarterly financial test with respect to a minimum consolidated interest coverage ratio of not less than
EuroCCP Credit Facility
On July 1, 2020, EuroCCP, as borrower, the Company, as guarantor, entered into a Facility Agreement (the “Facility” or “EuroCCP Credit Facility”) with Bank of America Merrill Lynch International Designated Activity Company, as co-ordinator, facility agent, lender, sole lead arranger and sole bookrunner, Citibank N.A., as security agent, and certain other lenders named therein.
The Facility provides for a €
Borrowings under the Facility are secured by cash, eligible government bonds and eligible equity assets deposited by EuroCCP into secured accounts. In addition, EuroCCP must ensure that at all times the aggregate of (a) each clearing participant’s contribution to the relevant clearing fund, (b) each clearing participant’s margin amount and (c) any cash equities purchased using the proceeds of the assets described in (a) and (b), less the amount of any such clearing participant contribution, margin amount or cash equities which have been transferred to (or secured in favor of) any provider of settlement or custody services to EuroCCP, is not less than €
Borrowings under the Facility’s revolving loans and non-U.S. dollar swingline loans bear interest at the relevant floating base rate plus a margin of
Subject to certain conditions stated in the Facility, EuroCCP may borrow, prepay and reborrow amounts under the Facility at any time during the term of the Facility. The Facility will terminate and all amounts owing thereunder will be due and payable on
The Facility contains customary representations, warranties and covenants for facilities of its type, including events of default of the Company and EuroCCP and indemnification provisions in favor of the Lenders. In particular, the covenants include restrictions regarding the incurrence of liens by EuroCCP and its subsidiaries, and an event of default will be triggered if EuroCCP ceases its business, subject to certain exceptions in each case. There is also a requirement for the net worth of (a) the Company to be no less than $
On July 1, 2021, the Facility was amended and restated to, among other items: (i) extend the term of the Facility until June 30, 2022; (ii) update benchmark rates for U.S. dollar swingline loans and alternative term rates for revolving loans; (iii) remove references to LIBOR and clarified procedures to calculate interest rates; (iv) reduce the minimum tangible net worth requirement from €
23
increase access to certain currencies; (vi) update the borrowing base calculations to more accurately reflect the collateral held by EuroCCP; and (vii) modify certain other provisions to incorporate updates in applicable laws and regulations.
Loan and Notes Payments and Contractual Interest
The future expected loan repayments related to the Term Loan Agreement and the Senior Notes as of March 31, 2022 are as follows (in millions):
Remainder of 2022 |
| $ | — |
2023 | | ||
2024 | — | ||
2025 | — | ||
2026 | — | ||
Thereafter | | ||
Principal amounts repayable | | ||
Debt issuance costs | ( | ||
Unamortized discounts on notes | ( | ||
Total debt outstanding | $ | |
Interest expense recognized on the Term Loan Agreement, the Senior Notes, and the Revolving Credit Agreement is included in interest expense, net in the condensed consolidated statements of income. The Company is also obligated to pay commitment fees under the terms of the Revolving Credit Agreement, Term Loan Agreement and Facility, which are also included in interest expense, net.
Three Months Ended | ||||||
March 31, | ||||||
| 2022 |
| 2021 | |||
Components of interest expense: | ||||||
Contractual interest | $ | | $ | | ||
Amortization of debt discount and issuance costs |
| |
| | ||
Interest expense | $ | | $ | | ||
Interest income | ( | ( | ||||
Interest expense, net | $ | | $ | | ||
11. ACCUMULATED OTHER COMPREHENSIVE INCOME, NET
The following represents the changes in accumulated other comprehensive income, net by component (in millions):
Foreign | Total Accumulated | |||||||||||
Currency |
| Unrealized | Other | |||||||||
Translation |
| Investment | Post-Retirement | Comprehensive | ||||||||
| Adjustment |
| Loss |
| Benefits |
| Income, Net | |||||
Balance at December 31, 2021 | $ | | $ | ( | $ | | $ | | ||||
Other comprehensive loss |
| ( | — | — | ( | |||||||
Balance at March 31, 2022 | $ | | $ | ( | $ | | $ | | ||||
12. CLEARING OPERATIONS
EuroCCP is a European equities central counterparty that provides post-trade services to stock exchanges, MTFs, over-the-counter (“OTC”) equities trades and an equity index derivatives exchange. EuroCCP clears equities from
24
EuroCCP only assumes the guarantor role if it has an equal and offsetting claim against a clearing participant. For the period ended March 31, 2022, there have been no events of default for which a liability is required to be recognized in accordance with GAAP.
Clearing Participant Deposits
EuroCCP generally requires all clearing participants to deposit collateral to help mitigate EuroCCP’s exposure to credit risk in the event that a clearing participant fails to meet a financial or contractual obligation.
Margin Deposits
Margin deposits, which are predominately in the form of cash and cash equivalents, are deposits made by each clearing participant to EuroCCP to cover some or all of the credit risk of its failure to fulfill its obligations in the trade. EuroCCP maintains and manages all cash deposits related to margin deposits. Substantially all risks and rewards of margin deposit ownership, including net interest income, belong to EuroCCP and are recorded in other revenue on the condensed consolidated statements of income. In the event of a default, EuroCCP can access the defaulting participant’s margin deposits to cover the defaulting participant’s losses. For more information, see “Default and Liquidity Waterfalls” below.
Clearing Funds
The clearing fund mutualizes the risk of default among all clearing participants. Depending on their membership, clearing participants contribute to the cash-equity and/or derivatives segment of the clearing fund. Although the entire clearing fund is available to cover potential losses in the event that the margin deposits and the clearing fund deposits of a defaulting clearing participant are inadequate to fulfill that clearing participant’s outstanding financial obligations, the clearing fund first uses the product class segment of the Clearing Fund in which the defaulting participants was active (see “Default and Liquidity Waterfalls” below). In the event of a default, EuroCCP is generally required to liquidate the defaulting clearing participant’s open positions. To the extent that the positions remain open, EuroCCP is required to assume the defaulting clearing participant’s obligations related to the open positions. Clearing participants are required to make contributions to the clearing fund that are proportional to their risk exposure in the form of cash or non-cash contributions, which generally consist of highly liquid securities.
Interoperability Fund
For the cash equity business line, EuroCCP has entered into interoperable arrangements with
The following tables present the Company’s total clearing participant deposits as of March 31, 2022 and December 31, 2021 (in millions):
March 31, 2022 | |||||||||
| Cash Contributions |
| Non-Cash Contributions (1) |
| Total Contributions | ||||
Margin deposits | $ | | $ | | $ | | |||
Clearing funds | | | | ||||||
Interoperability funds (1) | | | | ||||||
Total | $ | | $ | | $ | | |||
December 31, 2021 | |||||||||
| Cash Contributions |
| Non-Cash Contributions (1) |
| Total Contributions | ||||
Margin deposits | $ | $ | $ | ||||||
Clearing funds | |||||||||
Interoperability funds (1) | |||||||||
Total | $ | $ | $ | ||||||
(1) These amounts are not reflected in the condensed consolidated balance sheet, as EuroCCP does not take economic ownership of these balances.
25
Default and Liquidity Waterfalls
The default waterfall is the priority order in which the capital resources are expected to be utilized in the event of a default where the defaulting clearing participant’s collateral would not be sufficient to cover the cost to liquidate its portfolio. If a default occurs and the defaulting clearing participant’s collateral, including margin deposits and clearing fund deposits, are depleted, then additional capital is utilized in the following order:
| ● | EuroCCP dedicated own resources: The EuroCCP default waterfall first utilizes its own dedicated resources ahead of clearing fund contributions of non-defaulting clearing participants, up to |
| ● | Clearing fund: Second, the EuroCCP default waterfall utilizes traditional CCP risk mutualization, in the event that default losses fully exhaust EuroCCP’s dedicated own resources amount, whereby contributions applicable to a particular product class are applied first to any loss attributable to that product class. |
| ● | Pro rata contributions: Third, if the default losses caused cannot be covered by the first two layers, the non-defaulting clearing participants shall on demand make additional payments to EuroCCP on a pro rata basis in proportion to the amount of their clearing fund contributions to cover any such remaining losses, which is limited to an amount equal to twice their clearing fund contribution as established under EuroCCP’s rules and regulations. In this scenario, contributions applicable to a particular product class are first applied to any losses attributable to that product class. |
In addition to the default waterfall, the liquidity waterfall is the priority order in which the liquidity resources are expected to be utilized for EuroCCP’s ordinary course business operations and in situations when additional liquidity resources and liquidity measures may be activated in case of a potential liquidity shortfall. Liquidity, intraday or overnight, is mainly required for securities settlement. In ordinary course business circumstances, liquidity resources include the collateral directly deposited with EuroCCP, FX swap arrangements, and reverse repurchase agreements, as well as the use of the Facility.
13. FAIR VALUE MEASUREMENT
Fair value is the price that would be received upon the sale of an asset or paid upon the transfer of a liability in an orderly transaction between market participants at the measurement date and in the principal or most advantageous market for that asset or liability. The fair value should be calculated based on assumptions that market participants would use in pricing the asset or liability, not on assumptions specific to the entity. In addition, the fair value of liabilities should include consideration of non-performance risk, including the Company’s own credit risk.
The Company applied FASB Accounting Standards Codification (“ASC”) 820— Fair Value Measurement, which provides guidance for using fair value to measure assets and liabilities by defining fair value and establishing the framework for measuring fair value. ASC 820 applies to financial and nonfinancial instruments that are measured and reported on a fair value basis. The three-level hierarchy of fair value measurements is based on whether the inputs to those measurements are observable or unobservable. Observable inputs reflect market data obtained from independent sources, while unobservable inputs reflect the Company’s market assumptions. The fair value hierarchy requires the use of observable market data when available and consists of the following levels:
| ● | Level 1—Unadjusted inputs based on quoted markets for identical assets or liabilities. |
| ● | Level 2—Observable inputs, either direct or indirect, not including Level 1 measurements, corroborated by market data or based upon quoted prices in non-active markets. |
| ● | Level 3—Unobservable inputs that reflect management’s best assumptions of what market participants would use in valuing the asset or liability. |
The Company has included a tabular disclosure for financial assets and liabilities that are measured at fair value on a recurring basis in the condensed consolidated balance sheets as of March 31, 2022 and December 31, 2021, respectively.
26
Assets and Liabilities Measured at Fair Value on a Recurring Basis
The following tables present the Company’s fair value hierarchy for those assets and liabilities measured at fair value on a recurring basis as of March 31, 2022 and December 31, 2021 (in millions):
March 31, 2022 | ||||||||||||
| Total |
| Level 1 |
| Level 2 |
| Level 3 | |||||
Assets: | ||||||||||||
U.S. Treasury securities | $ | | $ | | $ | — | $ | — | ||||
Marketable securities: | ||||||||||||
Mutual funds | | | — | — | ||||||||
Money market funds |
| |
| |
| — |
| — | ||||
Total assets | $ | | $ | | $ | — | $ | — | ||||
Liabilities: | ||||||||||||
Contingent consideration liabilities | $ | | $ | — | $ | — | $ | | ||||
Total liabilities | $ | | $ | — | $ | — | $ | | ||||
December 31, 2021 | ||||||||||||
| Total |
| Level 1 |
| Level 2 |
| Level 3 | |||||
Assets: | ||||||||||||
U.S. Treasury securities | $ | | $ | | $ | — | $ | — | ||||
Marketable securities: | ||||||||||||
Mutual funds | | | — | — | ||||||||
Money market funds | | | — | — | ||||||||
Total assets | $ | | $ | | $ | — | $ | — | ||||
Liabilities: | ||||||||||||
Contingent consideration liabilities | $ | | $ | — | $ | — | $ | | ||||
Total liabilities | $ | | $ | — | $ | — | $ | | ||||
The following is a description of the Company’s valuation methodologies used for instruments measured at fair value on a recurring basis:
Financial Investments
Financial investments consist of highly liquid U.S. Treasury securities and marketable securities held in a trust for the Company’s non-qualified retirement and benefit plans, also referred to as deferred compensation plan assets. The deferred compensation plan assets have an equal and offsetting deferred compensation plan liability based on the value of the deferred compensation plan assets. These securities are valued by obtaining feeds from a number of live data sources, including active market makers and inter dealer brokers and therefore categorized as Level 1. No material adjustments were made to the carrying value of financial investments for the period ended March 31, 2022. See Note 15 (“Employee Benefit Plans”) for more information.
Contingent Consideration Liabilities
In connection with the acquisitions of Hanweck Associates, LLC (“Hanweck”), MATCHNow, and Cboe Asia Pacific, as well as the acquisition of assets of FT Providers, LLC (“FT Options”) and Trade Alert, LLC (“Trade Alert”), the Company entered into contingent consideration arrangements with the former owners. The total fair value of the liabilities at March 31, 2022 was $
27
Assets and Liabilities Measured at Fair Value on a Nonrecurring Basis
Certain assets, such as goodwill and intangible assets, are measured at fair value on a non-recurring basis. For goodwill, the process involves using a market approach and income approach (using discounted estimated cash flows) to determine the fair value of each reporting unit on a stand-alone basis. That fair value is compared to the carrying value of the reporting unit, including its recorded goodwill. In connection with the annual impairment evaluation of goodwill and indefinite life intangibles, impairment is considered to have occurred if the fair value of the reporting unit is lower than the carrying value of the reporting unit. For the intangible assets, the process also involves using a discounted cash flow method to determine the fair value of each intangible asset. Impairment is considered to have occurred if the fair value of the intangible asset is lower than its carrying value. The Company did not perform an impairment test during the three months ended March 31, 2022, as there were no market events that would indicate it was more likely than not that these assets were impaired. These measurements are considered Level 3 and these assets are recognized at fair value if they are deemed to be impaired.
Equity investments without readily determinable fair values that are valued using the measurement alternative are measured at fair value on a non-recurring basis. See Note 4 (“Investments”) for more information. During the three months ended March 31, 2022, no observable transactions or impairments materially impacted the measurements of the investments accounted for as other equity investments.
Fair Value of Assets and Liabilities
The following tables present the Company’s fair value hierarchy for certain assets and liabilities held by the Company, with the exception of debt which is presented at its carrying value, as of March 31, 2022 and December 31, 2021 (in millions):
March 31, 2022 | ||||||||||||
| Total |
| Level 1 |
| Level 2 |
| Level 3 | |||||
Assets: | ||||||||||||
U.S. Treasury securities | $ | | $ | | $ | — | $ | — | ||||
Deferred compensation plan assets | | | — | — | ||||||||
Total assets | $ | | $ | | $ | — | $ | — | ||||
Liabilities: | ||||||||||||
Contingent consideration liabilities | $ | | $ | — | $ | — | $ | | ||||
Deferred compensation plan liabilities | | | — | — | ||||||||
Debt |
| |
| — |
| |
| — | ||||
Total liabilities | $ | | $ | | $ | | $ | | ||||
December 31, 2021 | ||||||||||||
| Total |
| Level 1 |
| Level 2 |
| Level 3 | |||||
Assets: | ||||||||||||
U.S. Treasury securities | $ | | $ | | $ | — | $ | — | ||||
Deferred compensation plan assets |
| |
| |
| — |
| — | ||||
Total assets | $ | | $ | | $ | — | $ | — | ||||
Liabilities: | ||||||||||||
Contingent consideration liabilities | $ | | $ | — | $ | — | $ | | ||||
Deferred compensation plan liabilities | | | — | — | ||||||||
Debt |
| |
| — |
| |
| — | ||||
Total liabilities | $ | | $ | | $ | | $ | | ||||
Certain financial assets and liabilities, including cash and cash equivalents, accounts receivable, income tax receivable, accounts payable and Section 31 fees payable, are not measured at fair value on a recurring basis, but the carrying values approximate fair value due to their liquid or short-term nature.
Debt
The debt balance consists of fixed rate Senior Notes and a floating rate Term Loan Agreement. The fair values of the Senior Notes are classified as Level 2 under the fair value hierarchy and are estimated using prevailing market quotes.
28
The fair value of the Term Loan Agreement was determined by utilizing a discounted cash flow analysis and is considered a Level 2 measurement.
At March 31, 2022 and December 31, 2021, the fair values of the Company’s debt obligations were as follows (in millions):
Fair Value | |||||
March 31, 2022 | December 31, 2021 | ||||
Term Loan Agreement | $ | | $ | | |
| | | |||
| | ||||
| — | ||||
Information on Level 3 Financial Liabilities
The following table sets forth a summary of changes in the fair value of the Company’s Level 3 financial liabilities during the three months ended March 31, 2022 (in millions):
Level 3 Financial Liabilities for the Three Months Ended March 31, 2022 | ||||||||||||||||||
Balance at | Realized (Gains) | Foreign | Balance at | |||||||||||||||
Beginning of | Losses during | Currency | End of | |||||||||||||||
| Period |
| Period |
| Additions |
| Settlements | Translation |
| Period | ||||||||
Liabilities | ||||||||||||||||||
Contingent consideration liabilities |
| $ | | $ | — | $ | — |
| $ | ( | $ | |
| $ | | |||
Total liabilities | $ | | $ | — | $ | — | $ | ( | $ | | $ | | ||||||
14. SEGMENT REPORTING
The Company reports
Options. The Options segment includes options on market indices (“index options”), as well as on the stocks of individual corporations (“equity options”), and options on ETPs, such as exchange-traded funds (“ETFs”) and exchange-traded notes (“ETNs”), which are “multi-listed” options and listed on a non-exclusive basis. These options are eligible to trade on Cboe Options, C2, BZX, EDGX, and other U.S. national security exchanges. Cboe Options is the Company’s primary options market and offers trading in listed options through a single system that integrates electronic trading and traditional open outcry trading on the Cboe Options trading floor in Chicago. C2 Options, BZX Options, and EDGX Options are all-electronic options exchanges, and typically operate with different market models and fee structures than Cboe Options. The Options segment also includes applicable market data fees generated from the consolidated tape plans, the licensing of proprietary options market data, index licensing, and access and capacity services.
North American Equities. The North American Equities segment includes listed U.S. equities and ETP transaction services that occur on fully electronic exchanges owned and operated by BZX, BYX, EDGX, and EDGA, equities transactions that occur on the BIDS Trading platform, and Canadian equities and other transaction services that occur on or through the MATCHNow ATS. The North American Equities segment also includes ETP listings on BZX, the Cboe Global Markets, Inc. common stock listing, applicable market data fees generated from the consolidated tape plans, the licensing of proprietary equities market data, routing services, and access and capacity services.
Europe and Asia Pacific. The Europe and Asia Pacific segment includes the pan-European listed equities and derivatives transaction services, ETPs, exchange-traded commodities, and international depository receipts that are hosted on MTFs operated by Cboe Europe Equities (Cboe Europe and Cboe NL equities exchanges) and Cboe Europe
29
Derivatives (“CEDX”). It also includes the ETP listings business on RMs and clearing activities of EuroCCP, as well as the equities transaction services of Cboe Australia and Cboe Japan, each operators of trading venues in Australia and Japan. This segment was previously referred to as the European Equities segment but was updated to the Europe segment in the first quarter of 2021 as a result of the launch of Cboe Europe Derivatives, a pan-European derivatives platform in September 2021. The segment was subsequently updated to Europe and Asia Pacific to reflect the acquisition of Cboe Asia Pacific in July 2021. Cboe Europe operates lit and dark books, a periodic auctions book, and Cboe BIDS Europe, a Large-in-Scale (“LIS”) trading negotiation facility for UK symbols. Cboe NL, launched in October 2019 and based in Amsterdam, operates similar business functionality to that offered by Cboe Europe, and provides for trading only in European Economic Area (“EEA”) symbols. The new Cboe Europe Derivatives venue offers futures and options based on Cboe Europe equity indices. This segment also includes Cboe Europe, Cboe NL, CEDX, Cboe Australia and Cboe Japan revenue generated from the licensing of proprietary market data and from access and capacity services.
Futures. The Futures segment includes transaction services provided by the Company’s fully electronic futures exchange, CFE, which includes offerings for trading of VIX futures and other futures products, the licensing of proprietary market data, as well as access and capacity services.
Global FX. The Global FX segment includes institutional FX trading services that occur on the Cboe FX fully electronic trading platform, non-deliverable forward FX transactions (“NDFs”) offered for execution on Cboe SEF and Cboe Swiss, as well as revenue generated from the licensing of proprietary market data and from access and capacity services.
Summarized financial data of reportable segments was as follows (in millions):
| North |
| Europe |
|
|
| Corporate |
| |||||||||||||
American | and Asia | Items and | |||||||||||||||||||
| Options |
| Equities |
| Pacific |
| Futures |
| Global FX |
| Eliminations |
| Total | ||||||||
Three Months Ended March 31, 2022 | |||||||||||||||||||||
Revenues | $ | | $ | | $ | | $ | | $ | | $ | — | $ | | |||||||
Operating income (loss) |
| | | | | | ( | | |||||||||||||
Three Months Ended March 31, 2021 | |||||||||||||||||||||
Revenues | $ | | $ | | $ | | $ | | $ | | $ | | $ | | |||||||
Operating income (loss) |
| | | | | | ( | | |||||||||||||
15. EMPLOYEE BENEFIT PLANS
Eligible U.S. employees are eligible to participate in the Cboe Options SMART Plan (“SMART Plan”). The SMART Plan is a defined contribution plan, which is qualified under Internal Revenue Code Section 401(k). In addition, eligible employees may participate in the Supplemental Employee Retirement Plan, Executive Retirement Plan and Deferred Compensation Plan. Effective January 1, 2017, the Executive Retirement Plan is closed to new executive officers and employees. Each plan is a defined contribution plan that is non-qualified under the Internal Revenue Code. The Deferred Compensation Plan assets, held in a trust, are subject to the claims of general creditors of the Company and totaled $
Eligible employees outside of the U.S., which includes employees of Cboe Europe, EuroCCP, MATCHNow, BIDS, and Cboe Asia Pacific are eligible to participate in various employee-selected stakeholder contribution plans or plans covered by local jurisdictions or by applicable laws. The Company’s contribution amounted to $
16. REGULATORY CAPITAL
As broker-dealers registered with the SEC, Cboe Trading and BIDS Trading are subject to the SEC’s Uniform Net Capital Rule (“Rule 15c3-1”), which requires the maintenance of minimum net capital, as defined therein. The SEC’s requirement also provides that equity capital may not be withdrawn or a cash dividend paid if certain minimum net capital
30
requirements are not met. Cboe Trading and BIDS Trading compute the net capital requirements under the basic method provided for in Rule 15c3-1. As of March 31, 2022, Cboe Trading and BIDS Trading were required to maintain net capital equal to the greater of
As entities regulated by the FCA, Cboe Europe is subject to the Financial Resource Requirement (“FRR”) and Cboe Chi-X Europe is subject to the Capital Resources Requirement (“CRR”). As a RIE, Cboe Europe computes its FRR in accordance with its Financial Risk Assessment, as agreed by the FCA.
In accordance with the Markets in Financial Instruments Directive of the FCA requirements, Cboe Chi-X Europe computes its CRR as the greater of the base requirement of $
On March 8, 2019, Cboe NL received approval from the Dutch Ministry of Finance to operate a RM, an MTF, and an approved publication arrangement in the Netherlands. As a RM, Cboe NL is subject to minimum capital requirements, as established by the Dutch Ministry of Finance in the license dated March 8, 2019.
EuroCCP was granted authorization under European Market Infrastructure Regulation (“EMIR”) by the National Competent Authority, DNB. EuroCCP is required by the EMIR, to maintain a minimum amount of capital to reflect an estimate of the capital required to wind down or restructure the activities of the clearinghouse, cover operational, legal and business risks and to reserve capital to meet credit, counterparty and market risks not covered by the clearing participants’ collateral and clearing funds.
The Investment Industry Regulatory Organization of Canada (“IIROC”) sets and monitors regulatory capital requirements for MATCHNow to protect its clients and counterparties. MATCHNow is required to maintain a prescribed minimum level of risk adjusted capital in accordance with such requirements as IIROC may from time to time prescribe.
As a designated contract market regulated by the CFTC, CFE is required to meet
As a swap execution facility regulated by the CFTC, Cboe SEF is required to meet
The following table presents the Company’s subsidiaries with regulatory capital requirements discussed above, as well as the actual and minimum regulatory capital requirements of the subsidiary as of March 31, 2022 (in millions):
Minimum | ||||||||
Subsidiary | Regulatory Authority | Actual | Requirement | |||||
Cboe Trading | FINRA/SEC | $ | $ | |||||
BIDS Trading | FINRA/SEC | |||||||
Cboe Europe | FCA | |||||||
Cboe Chi-X Europe | FCA | |||||||
Cboe NL | Dutch Authority for Financial Markets | |||||||
EuroCCP | DNB | |||||||
MATCHNow | IIROC | |||||||
CFE | CFTC | |||||||
SEF | CFTC | |||||||
Cboe Australia is regulated by the Australian Securities and Investments Commission (“ASIC”). Cboe Australia is required to maintain sufficient financial resources to operate the market properly in accordance with Section 794A(d) of the Corporations Act, which Cboe Australia satisfies by maintaining a prudent cash reserve, which must be equal to at least six months of its projected operating expenses. As of March 31, 2022, Cboe Australia holds $
Cboe Japan is regulated by the Japanese Financial Services Agency (“JFSA”) and the Japan Securities Dealers Association (“JSDA”). Cboe Japan is required to maintain a minimum level of regulatory capital ratio of
31
accordance with such requirements prescribed by the JFSA and JSDA. As of March 31, 2022, Cboe Japan had a regulatory capital ratio of
17. STOCK-BASED COMPENSATION
Stock-based compensation is based on the fair value of the award on the date of grant, which is recognized over the related service period, net of actual forfeitures. The service period is the period over which the related service is performed, which is generally the same as the vesting period. Vesting may be accelerated for certain officers and employees as a result of attaining certain age and service based requirements in the Company’s long-term incentive plan and award agreements.
The Company recognized stock-based compensation expense of $
The activity in the Company’s restricted stock, consisting of restricted stock awards (“RSAs”), restricted stock units (“RSUs”), and performance-based restricted stock units (“PSUs”) for the three months ended March 31, 2022 was as follows:
RSAs and RSUs
The following table summarizes RSA and RSU activity during the three months ended March 31, 2022:
Weighted | |||||
Number of | average grant | ||||
| Shares |
| date fair value | ||
Nonvested stock at December 31, 2021 |
| | $ | | |
Granted |
| | | ||
Vested |
| ( | | ||
Forfeited |
| ( | | ||
Nonvested stock at March 31, 2022 |
| | $ | | |
RSAs granted to non-employee members of the Board of Directors have a
RSUs entitle the holder to
During the three months ended March 31, 2022, to satisfy employees’ tax obligations upon the vesting of restricted stock, the Company purchased
32
PSUs
The following table summarizes restricted stock units contingent upon achievement of performance conditions, also known as PSUs, activity during the three months ended March 31, 2022:
Weighted | |||||
Number of | average grant | ||||
| Shares |
| date fair value | ||
Nonvested stock at December 31, 2021 |
| | $ | | |
Granted |
| | | ||
Vested |
| ( | | ||
Forfeited |
| ( | | ||
Nonvested stock at March 31, 2022 |
| | $ | | |
PSUs include awards related to earnings per share during the performance period as well as awards related to total shareholder return during the performance period. The Company used the Monte Carlo valuation model method to estimate the fair value of the total shareholder return PSUs which incorporated the following assumptions: risk-free interest rate (
In the three months ended March 31, 2022, to satisfy employees’ tax obligations upon the vesting of performance stock, the Company purchased
As of March 31, 2022, there were $
Employee Stock Purchase Plan
In May 2018, the Company’s stockholders approved an Employee Stock Purchase Plan, (“ESPP”), under which a total of
The Company records compensation expense over the offering period related to the discount that is given to employees, which totaled $
18. EQUITY
Common Stock
The Company’s common stock is listed on Cboe BZX under the trading symbol CBOE. As of March 31, 2022,
33
Common Stock in Treasury, at Cost
The Company accounts for the purchase of treasury stock under the cost method with the shares of stock repurchased reflected as a reduction to Cboe stockholders’ equity and included in common stock in treasury, at cost in the condensed consolidated balance sheets. Shares repurchased under the Company’s share repurchase program are retired or they are available to be redistributed. When treasury shares are redistributed, they are recorded at the average cost of the treasury shares acquired. When treasury shares are retired, they are removed from the common stock in treasury balance. The Company held
Share Repurchase Program
In 2011, the Board of Directors approved an initial authorization for the Company to repurchase shares of its outstanding common stock of $100 million and subsequently approved additional authorizations for a total authorization of $1.6 billion. The Company expects to fund repurchases primarily through the use of existing cash balances. The program permits the Company to purchase shares, through a variety of methods, including in the open market or through privately negotiated transactions, in accordance with applicable securities laws. It does not obligate the Company to make any repurchases at any specific time or situation.
The table below shows the repurchased shares of common stock under the Company’s share repurchase program during the periods presented as follows:
Three Months Ended | ||||||
| 2022 |
| 2021 | |||
Number of shares of common stock repurchased |
| | | |||
Average price paid per share |
| $ | | $ | | |
Total purchase price (in millions) |
| $ | | $ | | |
Since inception of the program through March 31, 2022, the Company has repurchased
As of March 31, 2022 and 2021, the Company had $
Purchase of Common Stock from Employees
The Company purchased
Preferred Stock
The Company has authorized the issuance of
Dividends
During the three months ended March 31, 2022, the Company declared and cash dividends per share of $
Each share of common stock, including RSAs, RSUs, and PSUs, is entitled to receive dividend and dividend equivalents, respectively, if, as and when declared by the Board of Directors of the Company. The Company’s expectation
34
is to continue to pay dividends. The decision to pay a dividend, however, remains within the discretion of the Company’s Board of Directors and may be affected by various factors, including earnings, financial condition, capital requirements, level of indebtedness and other considerations the Board of Directors deems relevant. Future debt obligations and statutory provisions, among other things, may limit, or in some cases prohibit, the Company’s ability to pay dividends.
As a holding company, the Company’s ability to declare and continue to pay dividends in the future with respect to its common stock will also be dependent upon the ability of its subsidiaries to pay dividends to it under applicable corporate law.
19. INCOME TAXES
The Company records income tax expense during interim periods based on the best estimate of the full year’s tax rate as adjusted for discrete items, if any, that are taken into account in the relevant interim period. Each quarter, the Company updates its estimate of the annual effective tax rate and any change in the estimated rate is recorded on a cumulative basis. The effective tax rate from continuing operations was
The following table summarizes the non-GAAP calculation of the effective tax rate for the three months ended March 31, 2022:
Tax Rate | |||
GAAP effective tax rate | | % | |
Tax effect of Section 199 related matters | ( | % | |
Effective tax rate excluding Section 199 matters | | % |
The higher effective tax rate in the first quarter of 2022 is due to the derecognition of the Company’s Section 199 tax benefits for tax years 2008 through 2016 upon the unfavorable decision by the United States Tax Court in the matter of Bats Global Markets Holdings, Inc. and Subsidiaries v. Commissioner of Internal Revenue, on March 31, 2022.
The Company petitioned the U.S. Tax Court on January 13, 2017, May 7, 2018 and November 29, 2018 for a redetermination of IRS notices of deficiency for Cboe and certain of its subsidiaries for tax years 2011 through 2015 related to its Section 199 claims. These petitions resulted in the establishment of
The first case that went to trial involved certain subsidiaries related to electronic trading for tax years 2011, 2012 and 2013. The U.S. Tax Court held the trial remotely from May 24, 2021 to June 1, 2021. On March 31, 2022, the U.S. Tax Court issued its decision rejecting the Company’s basis for its petition (the “Opinion”). A notice of appeal, which would lie before the U.S. Court of Appeals for the 10th Circuit, must be filed within 90 days of entry of the pending decision which will give effect to the Opinion. The Company plans to appeal.
As a result of the Opinion, the Company’s Section 199 positions no longer meet the recognition threshold provided by ASC 740-10. Accordingly, the Company increased its provision for income taxes in order to fully reserve for the expected aggregate amount of additional liabilities that the Company currently expects would result from these cases if they were all decided against the Company.
20. EARNINGS PER SHARE
The computation of basic net income per common share is calculated by reducing net income for the period by dividends paid or declared and undistributed net income for the period that are allocated to participating securities to arrive at net income allocated to common stockholders. Net income allocated to common stockholders is divided by the weighted average number of common shares outstanding during the period to determine net income per share allocated to common stockholders.
The computation of diluted net income per share is calculated by dividing net income allocated to common stockholders by the sum of the weighted average number of common shares outstanding plus all additional common
35
shares that would have been outstanding if the potentially dilutive common shares had been issued. The dilutive effect is calculated using the more dilutive of the two-class or treasury stock method.
The following table sets forth the computation of basic and diluted earnings per share for the three months ended March 31, 2022 and 2021 (in millions, except per share data):
Three Months Ended | ||||||
| 2022 |
| 2021 | |||
Basic earnings per share numerator: | ||||||
Net income | $ | | $ | | ||
Earnings allocated to participating securities |
| ( |
| ( | ||
Net income allocated to common stockholders | $ | | $ | | ||
Basic earnings per share denominator: | ||||||
Weighted average shares outstanding | | | ||||
Basic earnings per share | $ | | $ | | ||
Diluted earnings per share numerator: | ||||||
Net income | $ | | $ | | ||
Earnings allocated to participating securities |
| ( |
| ( | ||
Net income allocated to common stockholders | $ | | $ | | ||
Diluted earnings per share denominator: | ||||||
Weighted average shares outstanding | | | ||||
Dilutive potential common shares outstanding | | | ||||
Total dilutive weighted average shares | | | ||||
Diluted earnings per share | $ | | $ | | ||
For the periods presented, the Company did not have shares of stock-based compensation that would have an anti-dilutive effect on the computation of diluted earnings per share.
21. COMMITMENTS, CONTINGENCIES, AND GUARANTEES
Legal Proceedings
As of March 31, 2022, the Company was subject to the various legal proceedings and claims discussed below, as well as certain other legal proceedings and claims that have not been fully resolved and that have arisen in the ordinary course of business.
The Company reviews its legal proceedings and claims, regulatory reviews and inspections and other legal proceedings on an ongoing basis and follows appropriate accounting guidance when making accrual and disclosure decisions. The Company establishes accruals for those contingencies where the incurrence of a loss is probable and can be reasonably estimated, and the Company discloses the amount accrued and the amount of a reasonably possible loss in excess of the amount accrued, if such disclosure is necessary for the condensed consolidated financial statements to not be misleading. The Company does not record liabilities when the likelihood that the liability has been incurred is probable, but the amount cannot be reasonably estimated, or when the liability is believed to be only reasonably possible or remote. The Company’s assessment of whether a loss is remote, reasonably possible, or probable is based on its assessment of the ultimate outcome of the matter following all appeals.
As of March 31, 2022, the Company does not believe that there is a reasonable possibility that any material loss exceeding the amounts already recognized for these legal proceedings and claims, regulatory reviews, inspections or other legal proceedings, if any, has been incurred. While the consequences of certain unresolved proceedings are not presently determinable, the outcome of any proceeding is inherently uncertain and an adverse outcome from certain matters could have a material effect on the financial position, results of operations, or cash flows of the Company in any given reporting period.
36
City of Providence
On April 18, 2014, the City of Providence, Rhode Island filed a securities class action lawsuit in the federal district court for the Southern District of New York (“Lower Court”) against Bats and Direct Edge Holdings LLC, as well as
VIX Litigation
On March 20, 2018, a putative class action complaint captioned Tomasulo v. Cboe Exchange, Inc., et al., No. 18-cv-02025 was filed in federal district court for the Northern District of Illinois alleging that the Company intentionally designed its products, operated its platforms, and formulated the method for calculating VIX and the Special Opening Quotation, (i.e., the special VIX value designed by the Company and calculated on the settlement date of VIX derivatives prior to the opening of trading), in a manner that could be collusively manipulated by a group of entities named as John Doe defendants. A number of similar putative class actions, some of which do not name the Company as a party, were filed in federal court in Illinois and New York on behalf of investors in certain volatility-related products. On June 14, 2018, the Judicial Panel on Multidistrict Litigation centralized the putative class actions in the federal district court for the Northern District of Illinois. On September 28, 2018, plaintiffs filed a master, consolidated complaint that is a putative class action alleging various claims against the Company and John Doe defendants in the federal district court for the Northern District of Illinois. The claims asserted against the Company consist of a Securities Exchange Act fraud claim,
37
October 8, 2019. On January 27, 2020, the federal district court for the Northern District of Illinois granted the Company’s second motion to dismiss and all counts against the Company were dismissed with prejudice. On April 21, 2020, the federal district court for the Northern District of Illinois granted plaintiffs’ motion to certify the January 27, 2020 dismissal order for an immediate appeal. On May 19, 2020, plaintiffs filed a notice of appeal with the Court of Appeals for the Seventh Circuit (“7th Circuit”), seeking to appeal the April 21, 2020 order granting the entry of partial final judgment and both orders granting the Company’s motions to dismiss entered on May 29, 2019 and January 27, 2020. On June 29, 2020, plaintiffs filed their opening brief with the 7th Circuit, on August 28, 2020 the Company filed its opposition brief with the 7th Circuit, on September 7, 2020, CME Group Inc., Intercontinental Exchange, Inc. and National Futures Association filed an amici curiae brief in support of the Company on the Bad Faith Standard with the 7th Circuit and on October 16, 2020, plaintiffs filed their reply brief with the 7th Circuit. Oral arguments were held remotely on November 30, 2020 and the parties are currently awaiting a decision by the 7th Circuit. The Company currently believes that the claims are without merit and intends to litigate the matter vigorously. The Company is unable to estimate what, if any, liability may result from this litigation.
Other
As self-regulatory organizations under the jurisdiction of the SEC, Cboe Options, C2, BZX, BYX, EDGX and EDGA are subject to routine reviews and inspections by the SEC. As a designated contract market under the jurisdiction of the CFTC, CFE is subject to routine rule enforcement reviews and examinations by the CFTC. Cboe SEF, LLC is a swap execution facility registered with the CFTC and subject to routine rule enforcement reviews and examinations by the CFTC. Cboe Trading and BIDS Trading are subject to reviews and inspections by FINRA. The Company has from time to time received inquiries and investigative requests from the SEC’s Office of Compliance Inspections and Examinations and the CFTC’s Division of Market Oversight as well as the SEC Division of Enforcement and CFTC Division of Enforcement seeking information about the Company’s compliance with its obligations as a self-regulatory organization under the federal securities laws and Commodity Exchange Act as well as members’ compliance with the federal securities laws and Commodity Exchange Act.
In addition, while Cboe Europe, Cboe Chi-X Europe, EuroCCP, Cboe NL, Cboe Australia, Cboe Japan, and MATCHNow have not been the subject of any material litigation or regulatory investigation in the past, there is always the possibility of such action in the future. As Cboe Europe and Cboe Chi-X Europe are domiciled in the UK, it is likely that any action would be taken in the UK courts in relation to litigation or by the FCA in relation to any regulatory enforcement action. As EuroCCP is domiciled in the Netherlands, it is likely that any action would be taken in the Dutch courts in relation to litigation or by the DNB or Dutch Authority for Financial Markets in relation to any regulatory enforcement action. For Cboe NL, also domiciled in the Netherlands, it is likely that any actions would be taken in the Dutch courts in relation to litigation or Dutch Authority for Financial Markets in relation to any regulatory enforcement action. As Cboe Australia is domiciled in Australia, it is likely that any action would be taken in the Australian courts in relation to litigation or by the ASIC, in relation to any regulatory enforcement action. As Cboe Japan is domiciled in Japan, it is likely that any action would be taken in the Japanese courts in relation to litigation or by the JFSA or the JSDA in relation to any regulatory enforcement action. As MATCHNow is domiciled in Canada, it is likely that any action would be taken in the Canadian courts in relation to litigation or by the IIROC or Ontario Securities Commission in relation to any regulatory enforcement action.
The Company is also currently a party to various other legal proceedings in addition to those already mentioned. Management does not believe that the likely outcome of any of these other reviews, inspections, investigations or other legal proceedings is expected to have a material impact on the Company’s financial position, results of operations, liquidity or capital resources.
See also Note 6 (“Credit Losses”) for information on promissory notes related to the CAT.
See also Note 19 (“Income Taxes”).
Contractual Obligations
The Company has contractual obligations related to licensing agreements with various licensors, some of which included fixed fees and/or variable fees calculated using agreed upon contracted rates and reported cleared volumes. Certain licensing agreements contain annual minimum fee requirements that total $
See Note 12 (“Clearing Operations”) for information on EuroCCP’s clearinghouse exposure guarantee.
38
See Note 22 (“Leases”) for information on lease obligations.
22. LEASES
The Company currently leases office space, data centers, remote network operations centers, and equipment under non-cancelable operating leases with third parties as of . Certain leases include one or more options to renew, with renewal terms that can extend the lease term from to
In May 2021, the Company signed a new lease to secure approximately
Additionally, in October 2021, the Company signed a new lease to secure approximately
The following table presents the supplemental balance sheet information related to leases as of March 31, 2022 and December 31, 2021, respectively (in millions):
March 31, | December 31, | ||||
2022 | 2021 | ||||
$ | | $ | | ||
Total leased assets | $ | | $ | | |
|
| ||||
$ | | $ | | ||
| | ||||
Total leased liabilities | $ | | $ | | |
The following table presents operating lease costs and other information as of and for the three months ended March 31, 2022 and 2021, respectively (in millions, except as stated):
Three Months Ended | |||||||
2022 | 2021 | ||||||
Operating lease costs (1) | $ | | $ | | |||
Lease term and discount rate information: | |||||||
Weighted average remaining lease term (years) | |||||||
Weighted average discount rate | % | | % | ||||
Supplemental cash flow information and non-cash activity: | |||||||
Cash paid for amounts included in the measurement of lease liabilities | $ | | $ | | |||
Lease incentive for leasehold improvements | — | — | |||||
Right-of-use assets obtained in exchange for lease liabilities | | | |||||
| (1) | Includes short-term lease and variable lease costs, which are immaterial. |
39
The maturities of the lease liabilities are as follows as of March 31, 2022 (in millions):
March 31, | |||
| 2022 | ||
Remainder of 2022 | $ | | |
2023 | | ||
2024 | | ||
2025 | | ||
2026 | | ||
After 2026 |
| | |
Total lease payments (1) | $ | | |
Less: Interest | ( | ||
Present value of lease liabilities | $ | | |
| (1) | Total lease payments include $ |
23. SUBSEQUENT EVENTS
On April 27, 2022, pursuant to the Term Loan Agreement, the Company submitted a committed loan notice to borrow $
On April 28, 2022, the Company entered into an agreement to sell its former headquarters building with a tentative close date in June 2022, subject to customary closing conditions.
There have been no other subsequent events that would require disclosure in, or adjustment to, the condensed consolidated financial statements as of and for the three months ended March 31, 2022.
40
Item 2. Management’s Discussion and Analysis of Financial Condition and Results of Operations
The following discussion should be read in conjunction with the accompanying unaudited condensed consolidated financial statements and the notes thereto, included in Item 1 in this Quarterly Report on Form 10-Q, and the audited consolidated financial statements in the Company’s Annual Report on Form 10-K for the year ended December 31, 2021, and as contained in that report, the information under the heading “Management’s Discussion and Analysis of Financial Condition and Results of Operations.” This discussion contains forward-looking information. Please see “Forward-Looking Statements” for a discussion of the uncertainties, risks and assumptions associated with these statements.
Overview
Cboe Global Markets, Inc. (“Cboe” or “the Company”), a leading provider of market infrastructure and tradable products, delivers cutting-edge trading, clearing and investment solutions to market participants around the world. The Company is committed to operating a trusted, inclusive global marketplace, providing leading products, technology and data solutions that enable participants to define a sustainable financial future. Cboe provides trading solutions and products in multiple asset classes, including equities, derivatives and FX, across North America, Europe, and Asia Pacific.
Cboe’s subsidiaries include the largest options exchange and the third largest stock exchange operator in the U.S. In addition, the Company operates one of the largest stock exchanges by value traded in Europe, and owns EuroCCP, a leading pan-European equities and derivatives clearinghouse, BIDS Trading, a leading block-trading ATS by volume in the U.S., MATCHNow, a leading equities ATS in Canada, Cboe Australia, an operator of trading venues in Australia, and Cboe Japan, an operator of trading venues in Japan. Cboe also is a leading market globally for exchange-traded products (“ETPs”) listings and trading.
The Company is headquartered in Chicago with offices in Amsterdam, Belfast, Calgary, Hong Kong, Kansas City, London, Manila, New York, San Francisco, Sarasota Springs, Singapore, Sydney, Tokyo and Toronto.
Recent Developments
Planned acquisition of ErisX
On October 20, 2021, the Company announced it entered into a definitive agreement to acquire ErisX. ErisX operates a U.S. based digital asset spot market, a regulated futures exchange and a regulated clearinghouse. Ownership of ErisX presents a unique opportunity for the Company to enter the digital asset spot and derivatives marketplaces through a digital-first platform developed with industry partners to focus on robust regulatory compliance, data and transparency. The transaction is expected to close in the second quarter of 2022, subject to customary closing conditions.
Planned acquisition of NEO
On November 15, 2021, the Company announced it entered into a definitive agreement to acquire Aequitas Innovations, Inc. (“NEO”). NEO is a fintech organization that is comprised of a fully registered Tier-1 Canadian securities exchange with a diverse product and services set ranging from corporate listings to cash equity trading. Ownership of NEO will help allow the Company to provide a more fulsome Canadian equities offering, operating the NEO Exchange, a national securities exchange with trading, listings, and other services, in addition to MATCHNow, the ATS acquired by the Company in 2020. The transaction is expected to close in the second or third quarter of 2022, subject to regulatory review and other customary closing conditions.
Business Segments
The Company reports five business segments: Options, North American Equities, Europe and Asia Pacific, Futures, and Global FX. Segment performance is primarily based on operating income (loss). The Company has aggregated all of its corporate costs and eliminations, as well as other business ventures, within Corporate Items and Eliminations; however, operating expenses that relate to activities of a specific segment have been allocated to that segment. Our management allocates resources, assesses performance and manages our business according to these segments:
Options. The Options segment includes options on market indices (“index options”), as well as on the stocks of individual corporations (“equity options”), and options on ETPs, such as exchange-traded funds (“ETFs”) and exchange-traded notes (“ETNs”), which are “multi-listed” options and listed on a non-exclusive basis. These options are eligible to trade on Cboe Options, C2, BZX, EDGX, and other U.S. national security exchanges. Cboe Options is the Company’s
41
primary options market and offers trading in listed options through a single system that integrates electronic trading and traditional open outcry trading on the Cboe Options trading floor in Chicago. C2 Options, BZX Options, and EDGX Options are all-electronic options exchanges, and typically operate with different market models and fee structures than Cboe Options. The Options segment also includes applicable market data fees generated from the consolidated tape plans, the licensing of proprietary options market data, index licensing, and access and capacity services.
North American Equities. The North American Equities segment includes listed U.S. equities and ETP transaction services that occur on fully electronic exchanges owned and operated by BZX, BYX, EDGX, and EDGA, equities transactions that occur on the BIDS Trading platform, and Canadian equities and other transaction services that occur on or through the MATCHNow ATS. The North American Equities segment also includes ETP listings on BZX, the Cboe Global Markets, Inc. common stock listing, applicable market data fees generated from the consolidated tape plans, the licensing of proprietary equities market data, routing services, and access and capacity services.
Europe and Asia Pacific. The Europe and Asia Pacific segment includes the pan-European listed equities and derivatives transaction services, ETPs, exchange-traded commodities, and international depository receipts that are hosted on MTFs operated by Cboe Europe Equities (Cboe Europe and Cboe NL equities exchanges) and Cboe Europe Derivatives (“CEDX”). It also includes the ETP listings business on RMs and clearing activities of EuroCCP, as well as the equities transaction services of Cboe Australia and Cboe Japan, each operators of trading venues in Australia and Japan. This segment was previously referred to as the European Equities segment but was updated to the Europe segment in the first quarter of 2021 as a result of the launch of Cboe Europe Derivatives, a pan-European derivatives platform in September 2021. The segment was subsequently updated to Europe and Asia Pacific to reflect the acquisition of Cboe Asia Pacific in July 2021. Cboe Europe operates lit and dark books, a periodic auctions book, and Cboe BIDS Europe, a Large-in-Scale (“LIS”) trading negotiation facility for UK symbols. Cboe NL, launched in October 2019 and based in Amsterdam, operates similar business functionality to that offered by Cboe Europe, and provides for trading only in European Economic Area (“EEA”) symbols. The new Cboe Europe Derivatives venue offers futures and options based on Cboe Europe equity indices. This segment also includes Cboe Europe, Cboe NL, CEDX, Cboe Australia, and Cboe Japan revenue generated from the licensing of proprietary market data and from access and capacity services.
Futures. The Futures segment includes transaction services provided by the Company’s fully electronic futures exchange, CFE, which includes offerings for trading of VIX futures and other futures products, the licensing of proprietary market data, as well as access and capacity services.
Global FX. The Global FX segment includes institutional FX trading services that occur on the Cboe FX fully electronic trading platform, non-deliverable forward FX transactions (“NDFs”) offered for execution on Cboe SEF and Cboe Swiss, as well as revenue generated from the licensing of proprietary market data and from access and capacity services.
General Factors Affecting Results of Operations
In broad terms, our business performance is impacted by a number of drivers, including macroeconomic events affecting the risk and return of financial assets, investor sentiment, the regulatory environment for capital markets, geopolitical events, tax policies, central bank policies and changing technology, particularly in the financial services industry. We believe our future revenues and net income will continue to be influenced by a number of domestic and international economic trends, including:
| ● | trading volumes on our proprietary products such as VIX options and futures and SPX options; |
| ● | trading volumes in listed equity securities, options, futures, and ETPs in North America, Europe, and Asia Pacific, clearing volumes in listed equity securities and ETPs in Europe, volumes in listed equity options, and volumes in institutional FX trading; |
| ● | the demand for and pricing structure of the U.S. tape plan market data distributed by the Securities Information Processors (“SIPs”), which determines the pool size of the industry market data fees we receive based on our market share; |
| ● | consolidation and expansion of our customers and competitors in the industry; |
| ● | the demand for information about, or access to, our markets and products, which is dependent on the products we trade, our importance as a liquidity center, quality and integrity of our proprietary indices, and the quality and pricing of our data and access and capacity services; |
| ● | continuing pressure in transaction fee pricing due to intense competition in the North American, European, and Asia Pacific markets; |
| ● | significant fluctuations in foreign currency translation rates or weakened value of currencies; and |
42
| ● | regulatory changes and obligations relating to market structure and increased capital requirements, and those which affect certain types of instruments, transactions, products, pricing structures, capital market participants or reporting or compliance requirements. |
A number of significant structural, political and monetary issues, global conflicts and the COVID-19 pandemic continue to confront the global economy, and instability could continue, resulting in an increased or subdued level of inflation, market volatility, supply chain constraints, changes in trading volumes and greater uncertainty, inflationary increases in our expenses, such as compensation inflation, may have an adverse effect on our financial results.
We continue to closely monitor developments around COVID-19 and follow guidance provided by governmental and public health agencies. In response to COVID-19, we have provided frequent communications to employees, customers, regulators, critical vendors, technology equipment suppliers, data and disaster recovery centers, and other service providers and instructed non-essential employees to work from home on a temporary basis, implemented travel restrictions, and temporarily suspended open outcry trading between March 13, 2020 and June 14, 2020, without any known significant disruptions to our business or control processes. We expect to continue to take further actions as necessary in response to addressing COVID-19. Our business and operations could be materially and adversely affected by the effects of COVID-19, however, the extent to which our results could be affected by COVID-19 largely depends on future developments which cannot be accurately predicted and are uncertain. Further, changes in trading behavior, additional suspensions of open outcry trading, market disruptions and other future developments caused by the effects of COVID-19 could impact trading volumes and the demand for our products, market data, and services, which could have a material adverse effect on our business, financial condition, operating results and cash flows for fiscal year 2022 and could be material during any future period impacted either directly or indirectly by this pandemic.
Components of Revenues
Cash and Spot Markets
Revenue aggregated into cash and spot markets includes associated transaction and clearing fees, the portion of market data fees relating to associated U.S. tape plan market data fees, associated regulatory fees, and associated other revenue from the Company’s North American Equities, Europe and Asia Pacific, and Global FX segments.
Data and Access Solutions
Revenue aggregated into data and access solutions includes access and capacity fees, proprietary market data fees, and associated other revenue across the Company’s five segments.
Derivatives Markets
Includes associated transaction and clearing fees, the portion of market data fees relating to associated U.S. tape plan market data fees, associated regulatory fees, and associated other fees from the Company’s Options, Futures, and Europe and Asia Pacific segments.
Components of Cost of Revenues
Liquidity Payments
Liquidity payments are directly correlated to the volume of securities traded on our markets. As stated above, we record the liquidity rebates paid to market participants providing liquidity, in the case of C2, BZX, EDGX, and Cboe Europe Equities and Derivatives, as cost of revenue. BYX and EDGA offer a pricing model where we rebate liquidity takers for executing against an order resting on our book, which is also recorded as a cost of revenues.
Routing and Clearing
Various rules require that U.S. options and equities trade executions occur at the NBBO displayed by any exchange. Linkage order routing consists of the cost incurred to provide a service whereby Cboe equities and options exchanges deliver orders to other execution venues when there is a potential for obtaining a better execution price or when instructed to directly route an order to another venue by the order provider. The service affords exchange order flow providers an opportunity to obtain the best available execution price and may also result in cost benefits to those clients. Such an
43
offering improves our competitive position and provides an opportunity to attract orders which would otherwise bypass our exchanges. We utilize third-party brokers or our broker-dealer, Cboe Trading, to facilitate such delivery. Also included within routing and clearing are the Order Management System and Execution Management System (“OMS” and “EMS”, respectively) fees incurred for U.S. Equities Off-Exchange order execution, as well as settlement costs incurred for the settlement process executed by EuroCCP.
Section 31 Fees
Exchanges under the authority of the SEC (Cboe Options, C2, BZX, BYX, EDGX, and EDGA) are assessed fees pursuant to the Exchange Act designed to recover the costs to the U.S. government of supervision and regulation of securities markets and securities professionals. We treat these fees as a pass-through charge to customers executing eligible listed equities and listed equity options trades. Accordingly, we recognize the amount that we are charged under Section 31 as a cost of revenues and the corresponding amount that we charge our customers as regulatory transaction fees revenue. Since the regulatory transaction fees recorded in revenues are equal to the Section 31 fees recorded in cost of revenues, there is no impact on our operating income. CFE, Cboe Trading, Cboe Europe, Cboe NL, BIDS, MATCHNow, Cboe FX, Cboe Australia and Cboe Japan are not U.S. national securities exchanges, and accordingly are not charged Section 31 fees.
Royalty Fees and Other Cost of Revenues
Royalty fees primarily consist of license fees paid by us for the use of underlying indices in our proprietary products usually based on contracts traded. The Company has licenses with the owners of the S&P 500 Index, S&P 100 Index and certain other S&P indices, FTSE Russell indices, the DJIA, MSCI, and certain other index products. This category also includes fees related to the dissemination of market data related to S&P indices and other products through Cboe Streaming Market Indices (“CSMI”).
Other cost of revenues primarily consists of interest expense from clearing operations, electronic access permit fees and other miscellaneous costs associated with other revenue.
Components of Operating Expenses
Compensation and Benefits
Compensation and benefits represent our largest expense category and tend to be driven by our staffing requirements, financial performance, and the general dynamics of the employment market. Stock-based compensation is a non-cash expense related to equity awards. Stock-based compensation can vary depending on the quantity and fair value of the award on the date of grant and the related service period.
Depreciation and Amortization
Depreciation and amortization expense results from the depreciation of long-lived assets purchased, the amortization of purchased and internally developed software, and the amortization of intangible assets.
Technology Support Services
Technology support services consists primarily of costs related to the maintenance of computer equipment supporting our system architecture, circuits supporting our wide area network, support for production software, operating system license and support fees, fees paid to information vendors for displaying data and off-site system hosting fees.
Professional Fees and Outside Services
Professional fees and outside services consist primarily of consulting services, which include supplemental staff activities primarily related to systems development and maintenance, legal, regulatory and audit, and tax advisory services.
44
Travel and Promotional Expenses
Travel and promotional expenses primarily consist of advertising, costs for special events, sponsorship of industry conferences, options education seminars and travel-related expenses.
Facilities Costs
Facilities costs primarily consist of expenses related to owned and leased properties including rent, maintenance, utilities, real estate taxes and telecommunications costs.
Acquisition-Related Costs
Acquisition-related costs relate to acquisitions and other strategic opportunities, including the Merger. The acquisition-related costs include fees for investment banking advisors, lawyers, accountants, tax advisors, public relations firms, severance and retention costs, impairment of goodwill, capitalized software and facilities, and other external costs directly related to the mergers and acquisitions.
Other Expenses
Other expenses represent costs necessary to support our operations that are not already included in the above categories.
Non-Operating (Expenses) Income
Income and expenses incurred through activities outside of our core operations are considered non-operating and are classified as other (expense) income. These activities primarily include interest earned on the investing of excess cash, interest expense related to outstanding debt facilities, dividend income, income and unrealized gains and losses related to investments held in a trust for the Company’s non-qualified retirement and benefit plans, and equity earnings or losses from our investments in other business ventures.
Financial Summary
The following are summaries of changes in financial performance and include certain non-GAAP financial measures. Management uses these non-GAAP measures internally in conjunction with GAAP measures to help evaluate our performance and to help make financial and operational decisions. These non-GAAP financial measures assist management in comparing our performance on a consistent basis for purposes of business decision making by removing the impact of certain items management believes do not reflect our underlying operations.
We believe our presentation of these measures provides investors with greater transparency into financial measures used by management and is useful to investors for period-to-period comparisons of our ongoing operating performance.
These non-GAAP financial measures are not presented in accordance with, or as an alternative to, GAAP financial measures and may be calculated differently from non-GAAP measures used by other companies, which reduces their usefulness as comparative measures. We encourage analysts, investors and other interested parties to use these non-GAAP measures as supplemental information to the GAAP financial measures included herein, including our consolidated financial statements, to enhance their analysis and understanding of our performance and in making comparisons. Please see the footnotes below for definitions, additional information, and reconciliations from the closest GAAP measure.
45
The following summarizes changes in financial performance for the three months ended March 31, 2022, compared to the three months ended March 31, 2021:
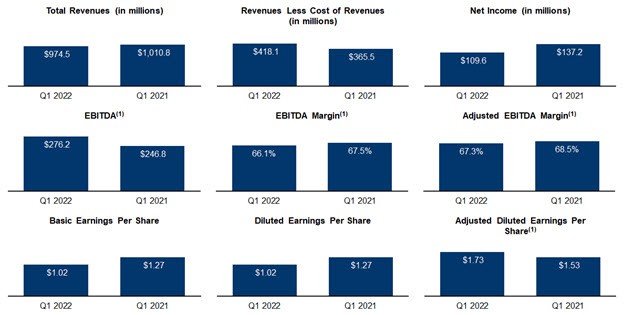
| (1) | These are Non-GAAP figures for which reconciliations are provided below. |
Three Months Ended March 31, | Increase/ | Percent |
| ||||||||||
| 2022 |
| 2021 |
| (Decrease) |
| Change |
|
| ||||
(in millions, except percentages, earnings per share, and as noted below) |
| ||||||||||||
Total revenues | $ | 974.5 | $ | 1,010.8 | $ | (36.3) | (4) | % | |||||
Total cost of revenues |
| 556.4 |
| 645.3 |
| (88.9) |
| (14) | % |
| |||
Revenues less cost of revenues |
| 418.1 |
| 365.5 |
| 52.6 |
| 14 | % |
| |||
Total operating expenses |
| 178.4 |
| 160.9 |
| 17.5 |
| 11 | % |
| |||
Operating income |
| 239.7 |
| 204.6 |
| 35.1 |
| 17 | % |
| |||
Income before income tax provision |
| 224.9 |
| 192.9 |
| 32.0 |
| 17 | % |
| |||
Income tax provision |
| 115.3 |
| 55.7 |
| 59.6 |
| 107 | % |
| |||
Net income | $ | 109.6 | $ | 137.2 | $ | (27.6) |
| (20) | % | ||||
Basic earnings per share | $ | 1.02 | $ | 1.27 | $ | (0.25) | (20) | % | |||||
Diluted earnings per share | 1.02 | 1.27 | (0.25) | (20) | % | ||||||||
Organic net revenue (1) | 409.7 | 365.5 | 44.2 | 12 | % | ||||||||
EBITDA (2) | 276.2 | 246.8 | 29.4 |
| 12 | % | |||||||
EBITDA margin (3) |
| 66.1 | % |
| 67.5 | % |
| (1.4) | % |
| * | ||
Adjusted EBITDA (2) | $ | 281.2 | $ | 250.2 | $ | 31.0 |
| 12 | % | ||||
Adjusted EBITDA margin (4) |
| 67.3 | % |
| 68.5 | % |
| (1.2) | % |
| * | ||
Adjusted earnings (5) | $ | 184.3 | $ | 164.8 | $ | 19.5 |
| 12 | % | ||||
Adjusted earnings margin (5) |
| 44.1 | % |
| 45.1 | % |
| (1.0) | % |
| * | ||
Diluted weighted average shares outstanding | 106.8 | 107.4 | (0.6) | (1) | % | ||||||||
Adjusted Diluted earnings per share (6) | $ | 1.73 | $ | 1.53 | $ | 0.20 |
| 13 | % | ||||
* | Not meaningful |
46
| (1) | Organic net revenue is defined as revenues less cost of revenues excluding revenues less cost of revenues of any acquisition that has been owned for less than one year. Revenues from acquisitions that have been owned at least one year are considered organic and are no longer excluded from organic net revenue from either period for comparative purposes. Organic net revenue does not represent, and should not be considered as, an alternative to revenues less cost of revenues, or net revenue, as determined in accordance with GAAP. We have presented organic net revenue because we consider it an important supplemental measure of our performance and we use it as the basis for monitoring our operating financial performance before the effects of acquisitions. We also believe that it is frequently used by analysts, investors and other interested parties in the evaluation of companies. We believe that investors may find this non-GAAP measure useful in evaluating our performance compared to that of peer companies in our industry. Other companies may calculate organic net revenue differently than we do. Organic net revenue has limitations as an analytical tool, and you should not consider it in isolation or as a substitute for analysis of our results as reported under GAAP. |
Three Months Ended | |||||
March 31, | |||||
2022 | 2021 | ||||
(in millions) | |||||
Revenues less cost of revenues | $ | 418.1 | $ | 365.5 | |
Recent acquisitions: | |||||
Acquisition revenues less cost of revenues | $ | (8.4) | $ | — | |
Organic net revenue | $ | 409.7 | $ | 365.5 | |
| (2) | EBITDA is defined as income before interest, income taxes, depreciation and amortization. Adjusted EBITDA is defined as EBITDA before acquisition-related costs and investment establishment costs. EBITDA and adjusted EBITDA do not represent, and should not be considered as, alternatives to net income as determined in accordance with GAAP. We have presented EBITDA and adjusted EBITDA because we consider them important supplemental measures of our performance and believe that they are frequently used by analysts, investors and other interested parties in the evaluation of companies. In addition, we use adjusted EBITDA as a measure of operating performance for preparation of our forecasts and evaluating our leverage ratio for the debt to earnings covenant included in our outstanding credit facility. Other companies may calculate EBITDA and adjusted EBITDA differently than we do. EBITDA and adjusted EBITDA have limitations as analytical tools, and you should not consider them in isolation or as substitutes for analysis of our results as reported under GAAP. |
| (3) | EBITDA margin represents EBITDA divided by revenues less cost of revenues. |
| (4) | Adjusted EBITDA margin represents adjusted EBITDA divided by revenues less cost of revenues. |
| (5) | Adjusted earnings is defined as net income adjusted for amortization of purchased intangibles, acquisition-related costs, investment establishment costs, tax reserves, and net income allocated to participating securities, net of the income tax effects of these adjustments. Adjusted earnings does not represent, and should not be considered as, an alternative to net income, as determined in accordance with GAAP. We have presented adjusted earnings because we consider it an important supplemental measure of our performance and we use it as the basis for monitoring our own core operating financial performance relative to other operators of exchanges. We also believe that it is frequently used by analysts, investors and other interested parties in the evaluation of companies. We believe that investors may find this non-GAAP measure useful in evaluating our performance compared to that of peer companies in our industry. Other companies may calculate adjusted earnings differently than we do. Adjusted earnings has limitations as an analytical tool, and you should not consider it in isolation or as a substitute for analysis of our results as reported under GAAP. |
| (6) | Adjusted diluted earnings per share represents adjusted earnings divided by diluted weighted average shares outstanding. |
47
The following is a reconciliation of net income (loss) allocated to common stockholders to EBITDA and adjusted EBITDA (in millions):
Three Months Ended March 31, | |||||||||||||||||||||
2022 | |||||||||||||||||||||
| Options |
| North American Equities |
| Europe and Asia Pacific |
| Futures |
| Global FX |
| Corporate |
| Total | ||||||||
Net income (loss) allocated to common stockholders | $ | 162.4 | $ | 38.4 | $ | 14.0 | $ | 16.9 | $ | 2.4 | $ | (124.9) | $ | 109.2 | |||||||
Interest expense, net |
| — |
| — |
| 1.9 |
| — |
| — |
| 8.9 |
| 10.8 | |||||||
Income tax provision |
| — |
| — |
| 4.8 |
| — |
| — |
| 110.5 |
| 115.3 | |||||||
Depreciation and amortization |
| 6.7 |
| 18.1 |
| 9.6 |
| 0.7 |
| 5.8 |
| — |
| 40.9 | |||||||
EBITDA |
| 169.1 |
| 56.5 |
| 30.3 |
| 17.6 |
| 8.2 |
| (5.5) |
| 276.2 | |||||||
Acquisition-related costs |
| — |
| 0.4 |
| 0.8 |
| — |
| — |
| 0.8 |
| 2.0 | |||||||
Investment establishment costs | — |
| — |
| — |
| — |
| — |
| 3.0 |
| 3.0 | ||||||||
Adjusted EBITDA | $ | 169.1 | $ | 56.9 | $ | 31.1 | $ | 17.6 | $ | 8.2 | $ | (1.7) | $ | 281.2 | |||||||
Three Months Ended March 31, | |||||||||||||||||||||
2021 | |||||||||||||||||||||
| Options |
| North American Equities |
| Europe and Asia Pacific |
| Futures |
| Global FX |
| Corporate |
| Total | ||||||||
Net income (loss) allocated to common stockholders | $ | 127.9 | $ | 43.7 | $ | 7.8 | $ | 17.4 | $ | 1.2 | $ | (61.2) | $ | 136.8 | |||||||
Interest expense, net |
| — |
| — |
| 3.4 |
| — |
| — |
| 8.9 |
| 12.3 | |||||||
Income tax provision |
| — |
| 1.2 |
| 3.5 |
| — |
| — |
| 51.0 |
| 55.7 | |||||||
Depreciation and amortization |
| 7.4 |
| 19.6 |
| 7.9 |
| 0.7 |
| 6.4 |
| — |
| 42.0 | |||||||
EBITDA |
| 135.3 |
| 64.5 |
| 22.6 |
| 18.1 |
| 7.6 |
| (1.3) |
| 246.8 | |||||||
Acquisition-related costs |
| 0.3 |
| — |
| — |
| — |
| — |
| 3.1 |
| 3.4 | |||||||
Adjusted EBITDA | $ | 135.6 | $ | 64.5 | $ | 22.6 | $ | 18.1 | $ | 7.6 | $ | 1.8 | $ | 250.2 | |||||||
The following is a reconciliation of net income allocated to common stockholders to adjusted earnings (in millions):
Three Months Ended | |||||||
March 31, | |||||||
| 2022 |
| 2021 |
| |||
Net income allocated to common stockholders | $ | 109.2 | $ | 136.8 | |||
Amortization |
| 30.6 |
| 32.9 | |||
Acquisition-related costs |
| 2.0 |
| 3.4 | |||
Investment establishment costs | 3.0 | — | |||||
Tax reserves | 48.5 | — | |||||
Tax effect of adjustments |
| (8.7) |
| (8.2) | |||
Net income allocated to participating securities | (0.3) | (0.1) | |||||
Adjusted earnings | $ | 184.3 | $ | 164.8 | |||
48
The following summarizes changes in certain operational and financial metrics for the three months ended March 31, 2022, compared to the three months ended March 31, 2021:
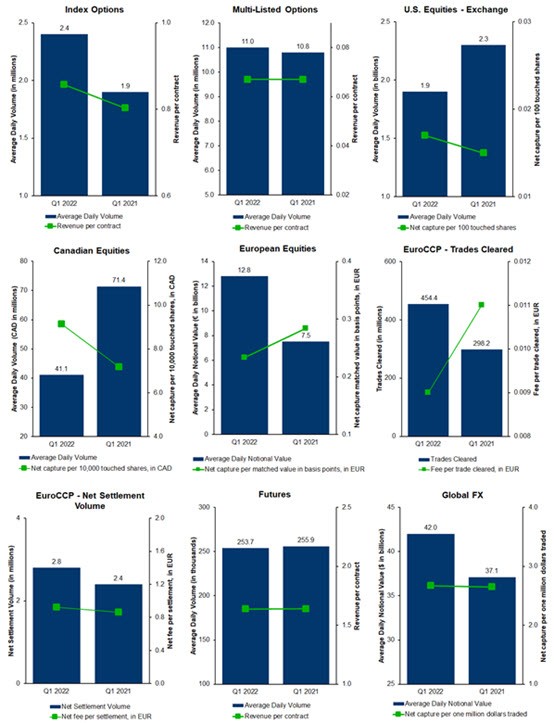
49
The following table includes operational and financial metrics for our Options, North American Equities, Europe and Asia Pacific, Futures, and Global FX segments. The metrics listed for Australian Equities and Japanese Equities in the table below are newly added for the three months ended March 31, 2022 as a result of the acquisition completed during 2021. Therefore, the table does not include results from the periods preceding each acquisition for the applicable metrics. The following summarizes changes in certain operational and financial metrics for the three months ended March 31, 2022 compared to the three months ended March 31, 2021:
Three Months Ended March 31, | Increase/ | Percent | |||||||||||
| 2022 |
| 2021 |
| (Decrease) |
| Change |
| |||||
(in millions, except percentages, trading days, and as noted below) | |||||||||||||
Options: |
|
|
|
|
|
|
|
|
|
|
|
| |
Average daily volume (ADV) (in millions of contracts): |
|
|
|
|
|
|
|
| |||||
Market ADV | 42.5 | 42.0 | 0.5 |
| 1 | % | |||||||
Total touched contracts (1) |
| 13.4 | 12.7 | 0.7 |
| 6 | % | ||||||
Multi-listed contract ADV | 11.0 | 10.8 | 0.2 | 2 | % | ||||||||
Index contract ADV |
| 2.4 | 1.9 | 0.5 |
| 27 | % | ||||||
Number of trading days | 62 | 61 | 1 |
| 2 | % | |||||||
Total Options revenue per contract (RPC) (2) | $ | 0.210 | $ | 0.177 | $ | 0.033 |
| 18 | % | ||||
Multi-listed options RPC (2) | 0.067 | 0.067 | — |
| — | % | |||||||
Index options RPC (2) | 0.857 | 0.803 | 0.054 |
| 7 | % | |||||||
Total Options market share | 31.5 | % | 30.2 | % | 1.3 | % | * | ||||||
Multi-listed options market share | 27.4 | % | 26.9 | % | 0.5 | % | * | ||||||
Index options market share | 99.1 | % | 99.0 | % | 0.1 | % | * | ||||||
North American Equities: |
|
|
|
|
|
| |||||||
U.S. Equities: | |||||||||||||
U.S. Equities - Exchange: | |||||||||||||
ADV: |
|
|
|
|
|
| |||||||
Total touched shares (in billions) (1) |
| 1.9 |
| 2.3 |
| (0.4) |
| (17) | % | ||||
Market ADV (in billions) |
| 12.9 |
| 14.7 |
| (1.8) |
| (12) | % | ||||
Market share | 14.3 | % | 15.0 | % | (0.7) | % | * | ||||||
U.S. Equities - Exchange (net capture per one hundred touched shares) (3) | $ | 0.017 | $ | 0.015 | $ | 0.002 |
| 8 | % | ||||
U.S. ETPs: launches (number of launches) | 32 |
| 35 | (3) |
| (9) | % | ||||||
U.S. ETPs: listings (number of listings) | 566 |
| 471 | 95 |
| 20 | % | ||||||
U.S. Equities - Off-Exchange: | |||||||||||||
ADV: |
|
|
|
|
|
| |||||||
Total touched shares (in millions) (1) |
| 108.5 |
| 99.5 |
| 9.0 |
| 9 | % | ||||
U.S. Equities - Off-Exchange (net capture per one hundred touched shares) (4) | $ | 0.117 | $ | 0.121 | $ | (0.004) |
| (4) | % | ||||
Trading days | 62 | 61 | 1 | 2 | % | ||||||||
Canadian Equities: | |||||||||||||
ADV (matched shares, in millions) (5) | 41.1 | 71.4 | (30.3) | (42) | % | ||||||||
Trading days | 62 | 62 | — | — | % | ||||||||
Net capture (per 10,000 touched shares, in Canadian dollars) (6) | 9.131 | 7.184 | 1.947 | 27 | % | ||||||||
Europe and Asia Pacific: |
|
|
|
|
|
| |||||||
European Equities: | |||||||||||||
ADNV: |
|
|
|
|
| ||||||||
Matched ADNV (in billions) (7) | € | 12.8 | € | 7.5 | € | 5.3 | 71 | % | |||||
Market ADNV (in billions) | 58.7 | 44.8 | 13.9 | 31 | % | ||||||||
Trading days |
| 64 |
| 63 |
| 1 | 2 | % | |||||
Market share | 21.8 | % | 16.8 | % | 5.0 | % | * | ||||||
Net capture (per matched notional value in basis points) (8) | 0.233 | 0.284 | (0.051) | (18) | % | ||||||||
EuroCCP: | |||||||||||||
Trades cleared (9) | 454.4 | 298.2 | 156.2 | 52 | % | ||||||||
Fee per trade cleared (10) | € | 0.009 | € | 0.011 | € | (0.002) | (14) | % | |||||
Net settlement volume (11) | 2.8 | 2.4 | 0.4 | 16 | % | ||||||||
Net fee per settlement (12) | € | 0.924 | € | 0.865 | € | 0.059 | 7 | % | |||||
Australian Equities: | |||||||||||||
ADNV (AUD billions) | $ | 0.9 | $ | — | $ | 0.9 | — | % | |||||
Trading days | 63 | — | 63 | — | % | ||||||||
Market share - Continuous | 15.8 | % | — | % | 15.8 | * | |||||||
Net capture (per matched notional value in basis points) (13) | 0.173 | — | 0.173 | — | % | ||||||||
Japanese Equities: | |||||||||||||
ADNV (JPY billions) | ¥ | 164.6 | ¥ | — | ¥ | 164.6 | — | % | |||||
Trading days | 58 | — | 58 | — | % | ||||||||
Market share - Lit Continuous | 3.8 | % | — | % | 3.8 | % | * | ||||||
Net capture (per matched notional value in basis points) (14) | 0.228 | — | 0.228 | — | % | ||||||||
Futures: | |||||||||||||
ADV (in thousands) | 253.7 | 255.9 | (2.2) | (1) | % | ||||||||
Trading days | 62 | 61 | 1 | 2 | % | ||||||||
Revenue per contract | $ | 1.637 | $ | 1.639 | $ | (0.002) | — | % | |||||
Global FX: |
|
|
|
|
| ||||||||
ADNV (in billions) | $ | 42.0 | $ | 37.1 | $ | 4.9 | 13 | % | |||||
Trading days |
| 64 |
| 63 |
| 1 | 2 | % | |||||
Global FX (net capture per one million dollars traded) (15) | 2.67 | 2.65 | 0.02 | 1 | % | ||||||||
Average British pound/U.S. dollar exchange rate | $ | 1.342 | $ | 1.379 | $ | (0.037) | (3) | % | |||||
Average Canadian dollar/U.S. dollar exchange rate | $ | 0.789 | $ | 0.790 | $ | (0.001) | — | % | |||||
Average Euro/U.S. dollar exchange rate | $ | 1.122 | $ | 1.205 | $ | (0.083) | (7) | % | |||||
Average Euro/British pound exchange rate | £ | 0.836 | £ | 0.874 | £ | (0.038) | (4) | % | |||||
Average Australian dollar/U.S. dollar exchange rate | $ | 0.721 | $ | — | $ | 0.721 | — | % | |||||
Average Japanese Yen/U.S. dollar exchange rate | $ | 0.009 | $ | — | $ | 0.009 | — | % | |||||
* | Not meaningful |
Note, the percent change listed represents the change in the unrounded metrics figures.
50
| (1) | Touched volume represents the total number of shares of equity securities and ETFs internally matched on our exchanges or routed to and executed on an external market center. |
| (2) | Average revenue per contract, for options and futures represents total net transaction fees recognized for the period divided by total contracts traded during the period. |
| (3) | Net capture per one hundred touched shares refers to transaction fees less liquidity payments and routing and clearing costs divided by the product of one-hundredth ADV of touched shares on BZX, BYX, EDGX, and EDGA and the number of trading days. |
| (4) | Net capture per 100 touched shares refers to transaction fees less order and execution management system (OMS/EMS) fees and clearing costs divided by the product of one-hundredth ADV of touched shares on BIDS Trading and the number of trading days for the period. |
| (5) | Matched volume represents the total number of shares of equity securities and ETFs activity executed on our exchanges. |
| (6) | Net capture per 10,000 touched shares refers to transaction fees divided by the product of one-ten thousandth ADV of shares for MATCHNow and the number of trading days. |
| (7) | Matched ADNV represents the average daily notional value of shares or contracts executed on our exchanges. |
| (8) | Net capture per matched notional value refers to transaction fees less liquidity payments in British pounds divided by the product of ADNV in British pounds of shares matched on Cboe Europe Equities and the number of trading days. |
| (9) | Trades cleared refers to the total number of non-interoperable trades cleared. |
| (10) | Fee per trade cleared refers to clearing fees divided by number of non-interoperable trades cleared. |
| (11) | Net settlement volume refers to the total number of settlements executed after netting. |
| (12) | Net fee per settlement refers to settlement fees less direct costs incurred to settle divided by the number of settlements executed after netting. |
| (13) | Net capture per matched notional value refers to transaction fees less liquidity payments in Australian dollars divided by the product of ADNV in Australian dollars of shares matched on Cboe Australia and the number of Australian Equities trading days. |
| (14) | Net capture per matched notional value refers to transaction fees less liquidity payments in Japanese Yen divided by the product of ADNV in Japanese Yen of shares matched on Cboe Japan and the number of Japanese Equities trading days. |
| (15) | Net capture per one million dollars traded refers to net transaction fees less liquidity payments, if any, divided by the Spot and SEF products of one-thousandth of ADNV traded on the Cboe FX Markets and the number of trading days, divided by two, which represents the buyer and seller that are both charged on the transaction. |
51
Revenues
Total revenues for the three months ended March 31, 2022 decreased $36.3 million, or 4%, compared to the prior period primarily due to decreased cash and spot markets revenue as a result of a decline in the Section 31 fee rate and a decline in volumes traded on the U.S. Equities exchanges, partially offset by increased derivatives markets revenue attributable to increased volumes traded on the Options exchanges, coupled with increased data and access solutions revenue primarily related to increased access and capacity fees in the Options and North American Equities segments. The following summarizes changes in revenues for the three months ended March 31, 2022, compared to the three months ended March 31, 2021 (in millions, except percentages):
Three Months Ended |
| |||||||||||
March 31, | Increase/ | Percent |
| |||||||||
| 2022 |
| 2021 |
| (Decrease) |
| Change |
| ||||
Cash and spot markets | $ | 461.9 | $ | 548.9 | $ | (87.0) | (16) | % | ||||
Data and access solutions | 118.9 | 100.6 | 18.3 | 18 | % | |||||||
Derivatives markets | 393.7 | 361.3 | 32.4 | 9 | % | |||||||
Total revenues | $ | 974.5 | $ | 1,010.8 | $ | (36.3) | (4) | % | ||||
Cash and Spot Markets
Cash and spot markets revenue decreased for the three months ended March 31, 2022 compared to the same period in 2021 primarily due to decreases in regulatory fees and transaction and clearing fees. Regulatory fees decreased primarily due to a 68% decline in the Section 31 fee rate, from an average rate of $15.80 per million dollars of covered sales for the three months ended March 31, 2021 to an average rate of $5.10 per million dollars of covered sales during the three months ended March 31, 2022. Transaction and clearing fees decreased primarily due to a 17% decrease in total touched shares on U.S. Equities exchanges, partially offset by a 71% increase in European Equities matched ADNV.
Data and Access Solutions
Data and access solutions revenue increased for the three months ended March 31, 2022 compared to the same period in 2021 primarily due to increases in access and capacity fees and proprietary market data fees. Access and capacity fees increased primarily due to increases in logical port revenue in the Options and North American Equities segments, increases in physical port revenue in the North American Equities and Options segments, and increased access fees in the Europe and Asia Pacific segment. Proprietary market data fees increased primarily due to proprietary market data attributable to Cboe Asia Pacific, which was acquired in the third quarter of 2021, coupled with an increase in financial risk analytics market data in the Options segment, partially offset by a decrease in licensing fees.
Derivatives Markets
Derivatives markets revenue increased for the three months ended March 31, 2022 compared to the same period in 2021 primarily due to an increase in transaction and clearing fees, partially offset by a decrease in regulatory fees. Transaction and clearing fees increased primarily due to a 27% increase in index options ADV. Regulatory fees decreased primarily due to a 68% decline in the Section 31 fee rate, from an average rate of $15.80 per million dollars of covered sales for the three months ended March 31, 2021 to an average rate of $5.10 per million dollars of covered sales during the three months ended March 31, 2022.
52
Cost of Revenues
The following tables reconcile the cost of revenues captions presented on the condensed consolidated statements of income to the updated net revenue captions discussed in Note 1 (“Organization and Basis of Presentation”) for the three months ended March 31, 2022 and 2021, respectively (in millions):
Three Months Ended March 31, | ||||||||||||
2022 | ||||||||||||
Cash and | Data and | Derivatives | Total | |||||||||
Liquidity payments | $ | 299.6 | $ | — | $ | 167.9 | $ | 467.5 | ||||
Routing and clearing fees | 15.6 | — | 6.7 | 22.3 | ||||||||
Section 31 fees | 31.8 | — | 3.9 | 35.7 | ||||||||
Royalty fees and other cost of revenues | 4.6 | 2.4 | 23.9 | 30.9 | ||||||||
Total cost of revenues | $ | 351.6 | $ | 2.4 | $ | 202.4 | $ | 556.4 | ||||
Three Months Ended March 31, | ||||||||||||
2021 | ||||||||||||
Cash and | Data and | Derivatives | Total | |||||||||
Liquidity payments | $ | 335.8 | $ | — | $ | 166.0 | $ | 501.8 | ||||
Routing and clearing fees | 21.6 | — | 5.5 | 27.1 | ||||||||
Section 31 fees | 82.0 | — | 9.9 | 91.9 | ||||||||
Royalty fees and other cost of revenues | 4.2 | 2.0 | 18.3 | 24.5 | ||||||||
Total cost of revenues | $ | 443.6 | $ | 2.0 | $ | 199.7 | $ | 645.3 | ||||
Cost of revenues decreased for the three months ended March 31, 2022 compared to the same period in 2021 primarily due to decreased cash and spot markets cost of revenues related to lower Section 31 fees, coupled with a decline in liquidity payments.
The following summarizes changes in the disaggregated cost of revenues for the three months ended March 31, 2022 compared to the three months ended March 31, 2021 (in millions, except percentages):
Three Months Ended |
| |||||||||||
March 31, | Increase/ | Percent |
| |||||||||
| 2022 |
| 2021 |
| (Decrease) |
| Change |
| ||||
Liquidity payments | $ | 467.5 | $ | 501.8 | $ | (34.3) | (7) | % | ||||
Routing and clearing |
| 22.3 |
| 27.1 |
| (4.8) | (18) | % | ||||
Section 31 fees | 35.7 | 91.9 | (56.2) | (61) | % | |||||||
Royalty fees and other cost of revenues | 30.9 | 24.5 | 6.4 | 26 | % | |||||||
Total cost of revenues | $ | 556.4 | $ | 645.3 | $ | (88.9) | (14) | % | ||||
Liquidity Payments
Liquidity payments decreased for the three months ended March 31, 2022 compared to the same period in 2021 primarily due to a decrease in volumes traded on the U.S. Equities exchanges, partially offset by increased volumes traded on the European Equities exchanges.
Routing and Clearing
Routing and clearing fees decreased for the three months ended March 31, 2022 compared to the same period in 2021 primarily due to a decline in routed trades in the North American Equities segment, partially offset by an increase in routed shares on the Options exchanges.
Section 31 Fees
Section 31 fees decreased for the three months ended March 31, 2022 compared to the same period in 2021 primarily due to a 68% decline in the Section 31 fee rate, from an average rate of $15.80 per million dollars of covered
53
sales for the three months ended March 31, 2021 to an average rate of $5.10 per million dollars of covered sales during the three months ended March 31, 2022.
Royalty Fees and Other Cost of Revenues
Royalty fees and other cost of revenues increased for the three months ended March 31, 2022 compared to the same period in 2021 primarily due to an increase in trading volume in licensed products.
Revenues Less Cost of Revenues
Revenues less cost of revenues increased $52.6 million, or 14%, for the three months ended March 31, 2022 compared to the same period in 2021 primarily due to increased derivatives markets revenue attributable to increased volumes traded on the Options exchanges, as well as increased access and capacity fees in the Options and North American Equities segments.
The following summarizes the components of revenues less cost of revenues for the three months ended March 31, 2022 compared to the three months ended March 31, 2021 (in millions, except percentages):
Three Months Ended | ||||||||||||
March 31, | Percent | |||||||||||
| 2022 |
| 2021 |
| Increase |
| Change |
| ||||
Cash and spot markets | $ | 110.3 | $ | 105.3 | $ | 5.0 | 5 | % | ||||
Data and access solutions |
| 116.5 |
| 98.6 | 17.9 | 18 | % | |||||
Derivatives markets |
| 191.3 |
| 161.6 | 29.7 | 18 | % | |||||
Total revenues less cost of revenues | $ | 418.1 | $ | 365.5 | $ | 52.6 | 14 | % | ||||
Cash and Spot Markets
Cash and spot markets revenues less cost of revenues increased for the three months ended March 31, 2022 compared to the same period in 2021 primarily due to increased transaction and clearing fees in the European Equities segment. Transaction and clearing fees increased primarily due to a 71% increase in European Equities matched ADNV, partially offset by a 17% decline in total touched shares on U.S. Equities exchanges. Routing and clearing fees decreased primarily due to a 36% decline in routed shares on U.S. Equities exchanges.
Data and Access Solutions
Data and access solutions revenues less cost of revenues increased for the three months ended March 31, 2022 compared to the same period in 2021 primarily due to increases in access and capacity fees and proprietary market data fees. Access and capacity fees increased due to increases in logical port revenue in the Options and North American Equities segments, increases in physical port revenue in the North American Equities and Options segments, and increased access fees in the Europe and Asia Pacific segment. Proprietary market data fees increased due to proprietary market data attributable to Cboe Asia Pacific, coupled with an increase in financial risk analytics market data in the Options segment.
Derivatives Markets
Derivatives markets revenues less cost of revenues increased for the three months ended March 31, 2022 compared to the same period in 2021 due to increased transaction and clearing fees, partially offset by increased royalty fees in the Options segment. Transaction and clearing fees increased primarily due to a 27% increase in index options ADV.
Operating Expenses
Total operating expenses for the three months ended March 31, 2022 compared to the same period in 2021 increased $17.5 million, or 11%, primarily due to increases in compensation and benefits, professional fees and outside services, and other expenses, partially offset by a decrease in acquisition-related costs.
54
The following summarizes changes in operating expenses for the three months ended March 31, 2022 compared to the three months ended March 31, 2021 (in millions, except percentages):
Three Months Ended |
| |||||||||||
March 31, | Increase/ | Percent |
| |||||||||
| 2022 |
| 2021 |
| (Decrease) |
| Change |
| ||||
Compensation and benefits | $ | 81.2 | $ | 72.3 | $ | 8.9 | 12 | % | ||||
Depreciation and amortization |
| 40.9 |
| 42.0 |
| (1.1) | (3) | % | ||||
Technology support services |
| 19.2 |
| 17.2 |
| 2.0 | 12 | % | ||||
Professional fees and outside services |
| 19.7 |
| 15.6 |
| 4.1 | 26 | % | ||||
Travel and promotional expenses |
| 2.9 |
| 1.6 |
| 1.3 | 81 | % | ||||
Facilities costs |
| 6.5 |
| 5.3 |
| 1.2 | 23 | % | ||||
Acquisition-related costs |
| 2.0 |
| 3.4 |
| (1.4) | (41) | % | ||||
Other expenses |
| 6.0 |
| 3.5 |
| 2.5 | 71 | % | ||||
Total operating expenses | $ | 178.4 | $ | 160.9 | $ | 17.5 | 11 | % | ||||
Compensation and Benefits
Compensation and benefits increased for the three months ended March 31, 2022 compared to the same period in 2021 primarily due to a $9.8 million increase in salaries, wages, and bonuses, driven by a $3.5 million increase in compensation and benefits expense related to Cboe Asia Pacific, a $4.6 million increase in salaries, wages, and bonuses driven by strong Company performance year to date, merit increases, and increased headcount excluding acquisitions, and a $1.0 million increase in benefits driven by increases in payroll taxes and benefit plan contributions, partially offset by a $2.7 million decrease in equity compensation related to the reversal of 2019 PSUs which did not meet performance conditions required for vesting and forfeited awards during the three months ended March 31, 2022.
Depreciation and Amortization
Depreciation and amortization decreased for the three months ended March 31, 2022 compared to the same period in 2021 primarily due to a decrease in amortization under the discounted cash flow method for the intangibles acquired in the Bats acquisition, partially offset by an increase in depreciation expense related to Cboe Asia Pacific, as well as an increase in depreciation expense related to the former headquarters location, which was not subject to depreciation during the three months ended March 31, 2021 as it was classified as held for sale from May 1, 2019 until May 1, 2021.
Technology Support Services
Technology support services increased for the three months ended March 31, 2022 compared to the same period in 2021 primarily due to increases in software maintenance support service fees and market data support service fees, partially offset by a decrease in purchased hardware and equipment.
Professional Fees and Outside Services
Professional fees and outside services increased for the three months ended March 31, 2022 compared to the same period in 2021 primarily due to increases in legal fees, contract services, and recruiting fees.
Travel and Promotional Expenses
Travel and promotional expenses increased for the three months ended March 31, 2022 compared to the same period in 2021 primarily due to increases in marketing expenses and travel expenses.
Facilities Costs
Facilities costs increased for the three months ended March 31, 2022 compared to the same period in 2021 primarily due to an increase in rent expense related to additional office locations following the acquisition of Cboe Asia Pacific, along with the new trading floor in Chicago.
55
Acquisition-Related Costs
Acquisition-related costs decreased for the three months ended March 31, 2022 compared to the same period in 2021 primarily due to a decline in professional fees, partially offset by an impairment charge related to the Company’s investment in Signal Trading Systems, LLC that occurred in the first quarter of 2021 and did not recur in 2022.
Other Expenses
Other expenses increased for the three months ended March 31, 2022 compared to the same period in 2021 primarily due to increases in taxes, licenses, and permits, as well as record storage costs and additional one-time charitable contributions made related to Ukraine relief efforts during the three months ended March 31, 2022.
Operating Income
As a result of the items above, operating income for the three months ended March 31, 2022 was $239.7 million, compared to $204.6 million for the same period in 2021, an increase of $35.1 million.
Interest Expense, Net
Net interest expense decreased for the three months ended March 31, 2022 compared to the same period in 2021. The decrease for the three months ended March 31, 2022 was primarily due to a decrease in interest expense related to the EuroCCP Credit Facility, which was amended and restated in July 2021, partially offset by interest income related to Cboe Asia Pacific.
Other (Expense) Income, Net
Net other income decreased for the three months ended March 31, 2022 compared to the same period in 2021 primarily due to a $3.1 million loss, related to the Company’s share of the 7Ridge Fund’s loss accounted for under the equity method of accounting, of which $3.0 million was related to investment establishment costs, which are not expected to recur.
Income Before Income Tax Provision
As a result of the above, income before income tax provision for the three months ended March 31, 2022 was $224.9 million, compared to $192.9 million for the same period in 2021, an increase of $32.0 million.
Income Tax Provision
The effective tax rate from continuing operations was 51.3% and 28.9% for the three months ended March 31, 2022 and 2021, respectively. The higher effective tax rate for the three months ended March 31, 2022 is primarily due to additional tax reserves of $48.5 million related to the Section 199 litigation.
Net Income
As a result of the items above, net income for the three months ended March 31, 2022 was $109.6 million, compared to $137.2 million for the three months ended March 31, 2021, a decrease of $27.6 million.
56
Segment Operating Results
We report results from our five segments: Options, North American Equities, Europe and Asia Pacific, Futures, and Global FX. Segment performance is primarily based on operating income (loss). We have aggregated all corporate costs, as well as other business ventures, within Corporate Items and Eliminations as those activities should not be used to evaluate a segment’s operating performance. All operating expenses that relate to activities of a specific segment have been allocated to that segment.
The following summarizes our total revenues by segment (in millions, except percentages):
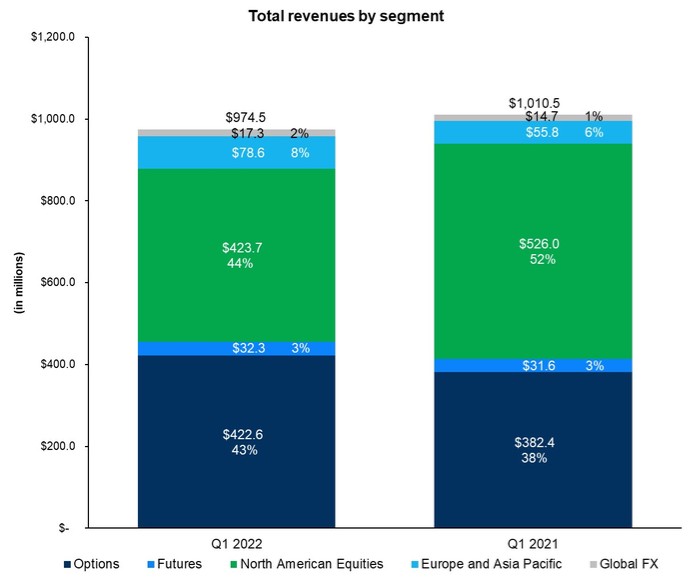
Note, the chart excludes Corporate revenues less cost of revenues of $0.3 million for the quarter ended March 31, 2021.
Percentage |
| |||||||||||||
of Total |
| |||||||||||||
Revenues |
| |||||||||||||
Three Months Ended | Three Months Ended |
| ||||||||||||
March 31, | Percent | March 31, |
| |||||||||||
| 2022 |
| 2021 |
| Change |
| 2022 |
| 2021 |
|
| |||
Options | $ | 422.6 | $ | 382.4 | 11 | % | 43 | % | 38 | % | ||||
North American Equities |
| 423.7 |
| 526.0 | (19) | % | 44 | % | 52 | % | ||||
Europe and Asia Pacific |
| 78.6 |
| 55.8 | 41 | % | 8 | % | 6 | % | ||||
Futures |
| 32.3 |
| 31.6 | 2 | % | 3 | % | 3 | % | ||||
Global FX | 17.3 | 14.7 | 18 | % | 2 | % | 1 | % | ||||||
Corporate | — | 0.3 | — | % | — | % | — | % | ||||||
Total revenues | $ | 974.5 | $ | 1,010.8 | (4) | % | 100 | % | 100 | % | ||||
57
The following summarizes our revenues less cost of revenues by segment (in millions, except percentages):
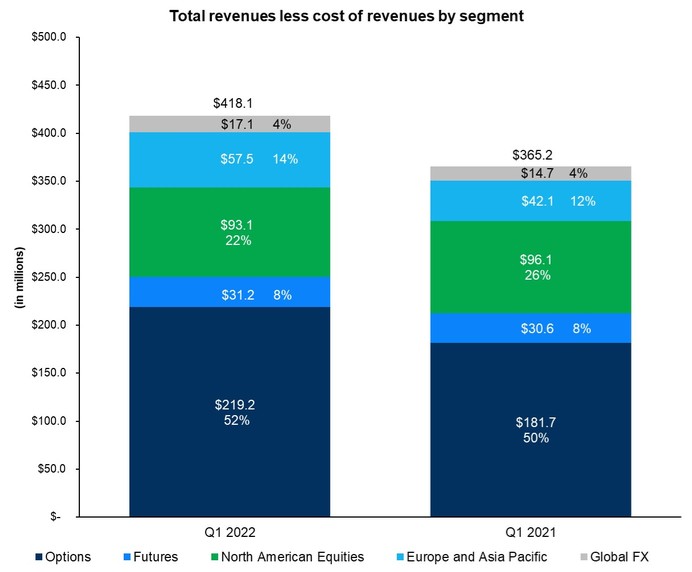
Note, the chart excludes Corporate revenues less cost of revenues of $0.3 million for the quarter ended March 31, 2021.
Percentage of |
| |||||||||||||
Total Revenues |
| |||||||||||||
Less Cost of Revenues |
| |||||||||||||
Three Months Ended | Three Months Ended |
| ||||||||||||
March 31, | Percent | March 31, |
| |||||||||||
| 2022 |
| 2021 |
| Change |
| 2022 |
| 2021 |
|
| |||
Options | $ | 219.2 | $ | 181.7 | 21 | % | 52 | % | 50 | % | ||||
North American Equities |
| 93.1 |
| 96.1 | (3) | % | 22 | % | 26 | % | ||||
Europe and Asia Pacific |
| 57.5 |
| 42.1 | 37 | % | 14 | % | 12 | % | ||||
Futures |
| 31.2 |
| 30.6 | 2 | % | 8 | % | 8 | % | ||||
Global FX | 17.1 | 14.7 | 16 | % | 4 | % | 4 | % | ||||||
Corporate | — | 0.3 | — | % | — | % | — | % | ||||||
Total revenues less cost of revenues | $ | 418.1 | $ | 365.5 | 14 | % | 100 | % | 100 | % | ||||
58
Options
The following summarizes revenues less cost of revenues, operating expenses, operating income, EBITDA, and EBITDA margin for our Options segment (in millions, except percentages):
Percentage |
| |||||||||||||||||
of Total |
| |||||||||||||||||
Revenues |
| |||||||||||||||||
Three Months Ended | Three Months Ended |
| ||||||||||||||||
March 31, | Percent | March 31, |
| |||||||||||||||
| 2022 |
|
| 2021 |
|
| Change |
|
| 2022 |
|
| 2021 |
|
| |||
Revenues less cost of revenues | $ | 219.2 | $ | 181.7 |
| 21 | % | 52 | % | 48 | % | |||||||
Operating expenses |
| 56.5 |
| 53.0 |
| 7 | % | 13 | % | 14 | % | |||||||
Operating income | $ | 162.7 | $ | 128.7 |
| 26 | % | 38 | % | 34 | % | |||||||
EBITDA (1) | $ | 169.1 | $ | 135.3 |
| 25 | % | 40 | % | 35 | % | |||||||
EBITDA margin (2) |
| 77.1 | % |
| 74.5 | % | * | * | * | |||||||||
* | Not meaningful |
| (1) | See footnote (2) to the table under “Financial Summary” above for a reconciliation of net income to EBITDA, and management’s reasons for using such non-GAAP measures. |
| (2) | EBITDA margin represents EBITDA divided by revenues less cost of revenues. |
Revenues less cost of revenues increased $37.5 million for the three months ended March 31, 2022 compared to the three months ended March 31, 2021 primarily due to a 27% increase in index options ADV and a 7% increase in index options net capture. For the three months ended March 31, 2022, operating income for the Options segment increased $34.0 million compared to the three months ended March 31, 2021 primarily due to an increase in revenues less cost of revenues. Operating expenses increased $3.5 million for the three months ended March 31, 2022 compared to the three months ended March 31, 2021 primarily due to increases in professional fees and outside services, other expenses, and technology support services.
North American Equities
The following summarizes revenues less cost of revenues, operating expenses, operating income, EBITDA, and EBITDA margin for our North American Equities segment (in millions, except percentages):
Percentage |
| |||||||||||||||||
of Total |
| |||||||||||||||||
Revenues |
| |||||||||||||||||
Three Months Ended | Three Months Ended |
| ||||||||||||||||
March 31, | Percent | March 31, |
| |||||||||||||||
| 2022 |
|
| 2021 |
|
| Change |
|
| 2022 |
|
| 2021 |
|
| |||
Revenues less cost of revenues | $ | 93.1 | $ | 96.1 |
| (3) | % | 22 | % | 18 | % | |||||||
Operating expenses |
| 54.5 |
| 51.0 |
| 7 | % | 13 | % | 10 | % | |||||||
Operating income | $ | 38.6 | $ | 45.1 |
| (14) | % | 9 | % | 9 | % | |||||||
EBITDA (1) | $ | 56.5 | $ | 64.5 |
| (12) | % | 13 | % | 12 | % | |||||||
EBITDA margin (2) |
| 60.7 | % |
| 67.1 | % | * | * | * | |||||||||
* | Not meaningful |
| (1) | See footnote (2) to the table under “Financial Summary” above for a reconciliation of net income to EBITDA, and management’s reasons for using such non-GAAP measures. |
| (2) | EBITDA margin represents EBITDA divided by revenues less cost of revenues. |
Revenues less cost of revenues decreased $3.0 million for the three months ended March 31, 2022 compared to the three months ended March 31, 2021 primarily due to a decline in transaction and clearing fees as a result of a 17% decrease in total touched shares on U.S. Equities exchanges. For the three months ended March 31, 2022, operating income for the North American Equities segment decreased $6.5 million compared to the three months ended March 31, 2021 primarily due to an increase in operating expenses, coupled with a decrease in revenues less cost of revenues. Operating expenses increased $3.5 million for the three months ended March 31, 2022 compared to the three months ended March 31, 2021 primarily due to increases in professional fees and outside services and compensation and benefits, partially offset by a decrease in depreciation and amortization.
59
Europe and Asia Pacific
The following summarizes revenues less cost of revenues, operating expenses, operating income, EBITDA, and EBITDA margin for our Europe and Asia Pacific segment (in millions, except percentages):
Percentage |
| |||||||||||||||||
of Total |
| |||||||||||||||||
Revenues |
| |||||||||||||||||
Three Months Ended | Three Months Ended |
| ||||||||||||||||
March 31, | Percent | March 31, |
| |||||||||||||||
| 2022 |
|
| 2021 |
|
| Change |
|
| 2022 |
|
| 2021 |
|
| |||
Revenues less cost of revenues | $ | 57.5 | $ | 42.1 |
| 37 | % | 73 | % | 75 | % | |||||||
Operating expenses |
| 36.6 |
| 27.6 |
| 33 | % | 47 | % | 50 | % | |||||||
Operating income | $ | 20.9 | $ | 14.5 |
| 44 | % | 27 | % | 26 | % | |||||||
EBITDA (1) | $ | 30.3 | $ | 22.6 |
| 34 | % | 39 | % | 41 | % | |||||||
EBITDA margin (2) |
| 52.7 | % |
| 53.7 | % | * | * | * | |||||||||
*Not meaningful
| (1) | See footnote (2) to the table under “Financial Summary” above for a reconciliation of net income to EBITDA, and management’s reasons for using such non-GAAP measures. |
| (2) | EBITDA margin represents EBITDA divided by revenues less cost of revenues. |
Revenues less cost of revenues increased $15.4 million for the three months ended March 31, 2022 compared to the three months ended March 31, 2021 primarily due to a 71% increase in European Equities matched ADNV, driven by a 31% increase in European Equities market ADNV, and additional revenue attributable to Cboe Asia Pacific. For the three months ended March 31, 2022, operating income for the Europe and Asia Pacific segment increased $6.4 million compared to the three months ended March 31, 2021, due to higher revenues less cost of revenues. Operating expenses increased $9.0 million for the three months ended March 31, 2022 compared to the three months ended March 31, 2021 primarily due to increases in compensation and benefits and depreciation and amortization attributable to Cboe Asia Pacific.
Futures
The following summarizes revenues less cost of revenues, operating expenses, operating income, EBITDA, and EBITDA margin for our Futures segment (in millions, except percentages):
Percentage |
| |||||||||||||||||
of Total |
| |||||||||||||||||
Revenues |
| |||||||||||||||||
Three Months Ended | Three Months Ended |
| ||||||||||||||||
March 31, | Percent | March 31, |
| |||||||||||||||
| 2022 |
|
| 2021 |
|
| Change |
|
| 2022 |
|
| 2021 |
|
| |||
Revenues less cost of revenues | $ | 31.2 | $ | 30.6 |
| 2 | % | 97 | % | 97 | % | |||||||
Operating expenses |
| 14.2 |
| 13.1 |
| 8 | % | 44 | % | 42 | % | |||||||
Operating income | $ | 17.0 | $ | 17.5 |
| (3) | % | 53 | % | 55 | % | |||||||
EBITDA (1) | $ | 17.6 | $ | 18.1 |
| (3) | % | 54 | % | 57 | % | |||||||
EBITDA margin (2) |
| 56.4 | % |
| 59.2 | % | * | * | * | |||||||||
* | Not meaningful |
| (1) | See footnote (2) to the table under “Financial Summary” above for a reconciliation of net income to EBITDA, and management’s reasons for using such non-GAAP measures. |
| (2) | EBITDA margin represents EBITDA divided by revenues less cost of revenues. |
Revenues less cost of revenues increased $0.6 million for the three months ended March 31, 2022 compared to the three months ended March 31, 2021 primarily due to an increase in proprietary market data and logical port fees. For the three months ended March 31, 2022, operating income for the Futures segment decreased $0.5 million compared to the three months ended March 31, 2021 primarily due to higher operating expenses. Operating expenses increased $1.1 million for the three months ended March 31, 2022 compared to the three months ended March 31, 2021 primarily due to an increase in professional fees and outside services.
60
Global FX
The following summarizes revenues less cost of revenues, operating expenses, operating income, EBITDA, and EBITDA margin for our Global FX segment (in millions, except percentages):
Percentage |
| |||||||||||||||||
of Total |
| |||||||||||||||||
Revenues |
| |||||||||||||||||
Three Months Ended | Three Months Ended |
| ||||||||||||||||
March 31, | Percent | March 31, |
| |||||||||||||||
| 2022 |
|
| 2021 |
|
| Change |
|
| 2022 |
|
| 2021 |
|
| |||
Revenues less cost of revenues | $ | 17.1 | $ | 14.7 |
| 16 | % | 99 | % | 100 | % | |||||||
Operating expenses |
| 14.7 |
| 13.5 |
| 9 | % | 85 | % | 92 | % | |||||||
Operating income | $ | 2.4 | $ | 1.2 |
| 100 | % | 14 | % | 8 | % | |||||||
EBITDA (1) | $ | 8.2 | $ | 7.6 |
| 8 | % | 47 | % | 52 | % | |||||||
EBITDA margin (2) |
| 48.0 | % |
| 51.7 | % | * | * | * | |||||||||
* | Not meaningful |
| (1) | See footnote (2) to the table under “Financial Summary” above for a reconciliation of net income to EBITDA, and management’s reasons for using such non-GAAP measures. |
| (2) | EBITDA margin represents EBITDA divided by revenues less cost of revenues. |
Revenues less cost of revenues increased $2.4 million for the three months ended March 31, 2022 compared to the three months ended March 31, 2021 primarily due to a 13% increase in Global FX ADNV. For the three months ended March 31, 2022, operating income for the Global FX segment increased $1.2 million compared to the three months ended March 31, 2021 primarily due to an increase in revenues less cost of revenues. Operating expenses increased $1.2 million for the three months ended March 31, 2022 compared to the three months ended March 31, 2021 primarily due to an increase in compensation and benefits, partially offset by a decrease in depreciation and amortization.
Liquidity and Capital Resources
Below are charts that reflect elements of our capital allocation:
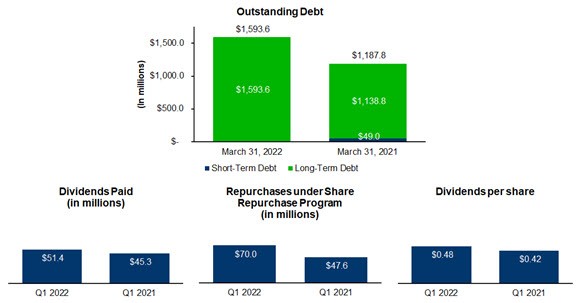
We expect our cash on hand at March 31, 2022 and other available resources, including cash generated from operations, to be sufficient to continue to meet our cash requirements for the foreseeable future. In the near term, we expect that our cash from operations and availability under the Revolving Credit Facility and Term Loan Agreement will
61
meet our cash needs to fund our operations, capital expenditures, interest payments on debt, any dividends, potential strategic acquisitions, opportunities for common stock repurchases under the previously announced program, and payouts related to the unfavorable decision in the Section 199 litigation. We may also utilize excess cash on hand to pay down amounts outstanding under the Term Loan Agreement. See Note 10 (“Debt”) of the condensed consolidated financial statements for further information.
EuroCCP also has a €1.5 billion committed syndicated multicurrency revolving and swingline credit facility agreement with EuroCCP as borrower and the Company as guarantor of scheduled interest and fees on borrowings (but not the principal amount of any borrowings) (the “Facility”). The Facility is available to be drawn by EuroCCP towards (a) financing unsettled amounts in connection with the settlement of transactions in securities and other items processed through EuroCCP’s clearing system and (b) financing any other liability or liquidity requirement of EuroCCP incurred in the operation of its clearing system. Borrowings under the Facility are secured by cash, eligible bonds and eligible equity assets deposited by EuroCCP into secured accounts. As a result, should the Facility be drawn by EuroCCP it could potentially impact EuroCCP’s liquidity, and we can give no assurance that this Facility will be sufficient to meet all of such obligations or sufficiently mitigate EuroCCP’s liquidity risk to meet its payment obligations when due. Additionally, a default of the Facility may allow lenders, under certain circumstances, to accelerate any related drawn amounts and may result in the acceleration of the Company’s other outstanding debt to which a cross-acceleration or cross-default provision applies, which may limit the Company’s liquidity, business and financing activities. The Facility is expected to terminate on June 30, 2022 and we may not be able to enter into a replacement facility on commercially reasonable terms, or at all.
Our long-term cash needs will depend on many factors, including an introduction of new products, enhancements of current products, the geographic mix of our business and any potential acquisitions. We believe our cash from operations and the availability under our Revolving Credit Facility will meet any long-term needs unless a significant acquisition or acquisitions are identified, in which case we expect that we would be able to borrow the necessary funds and/or issue additional shares of our common stock to complete such acquisition(s). In addition, we do not expect COVID-19 to have a material impact on our liquidity or capital resources, including cash from operations or uses of cash, or change our ability to access capital markets in the near term or the foreseeable future.
Cash and cash equivalents include cash in banks and all non-restricted, highly liquid investments with original maturities of three months or less at the time of purchase. Cash and cash equivalents as of March 31, 2022 increased $317.5 million from December 31, 2021 primarily due to the issuance of the 3.000% Senior Notes, results of operations, and adjustment for depreciation expense. See “Cash Flow” below for further discussion.
Our cash and cash equivalents held outside of the United States in various foreign subsidiaries totaled $173.1 million as of March 31, 2022. The remaining balance was held in the United States and totaled $486.3 million as of March 31, 2022. The majority of cash held outside the United States is available for repatriation, but under current law, could subject us to additional United States income taxes, less applicable foreign tax credits.
Our financial investments include deferred compensation plan assets, as well as investments with original or acquired maturities longer than three months, but that mature in less than one year from the balance sheet date and are recorded at fair value. As of March 31, 2022 and December 31, 2021, financial investments consisted of U.S. Treasury securities and deferred compensation plan assets.
62
Cash Flow
The following table summarizes our cash flow data for the three months ended March 31, 2022 and 2021, respectively (in millions):
Three Months Ended | ||||||
March 31, | ||||||
| 2022 |
| 2021 | |||
Net cash provided by operating activities | $ | 1,259.8 | $ | 599.1 | ||
Net cash used in investing activities |
| (24.9) |
| (13.3) | ||
Net cash provided by (used in) financing activities |
| 146.5 |
| (119.5) | ||
Effect of foreign currency exchange rate changes on cash, cash equivalents, and restricted cash and cash equivalents |
| 0.7 |
| (0.5) | ||
Increase in cash, cash equivalents, and restricted cash and cash equivalents | $ | 1,382.1 | $ | 465.8 | ||
As of March 31, | ||||||
| 2022 |
| 2021 | |||
Reconciliation of cash, cash equivalents, and restricted cash and cash equivalents: | ||||||
Cash and cash equivalents | $ | 659.4 | $ | 263.3 | ||
Restricted cash and cash equivalents (margin deposits and clearing funds) | 1,810.3 | 1,260.0 | ||||
Restricted cash and cash equivalents (included in other current assets) | 4.6 | — | ||||
Total | $ | 2,474.3 | $ | 1,523.3 | ||
Net Cash Flows Provided by Operating Activities
During the three months ended March 31, 2022, net cash provided by operating activities was $1,150.2 million higher than net income. The variance is primarily attributable to the change of $1,064.4 million of restricted cash and cash equivalents, driven by margin deposits and clearing funds related to EuroCCP, the change in accounts payable and accrued liabilities of $93.7 million, the change in income taxes receivable of $42.7 million, the adjustment for depreciation of $40.9 million, and the change in income taxes payable of $24.5 million, partially offset by the change in accounts receivable of $56.2 million and the adjustment for the provision for deferred income taxes of $17.8 million for the three months ended March 31, 2022.
Net cash flows provided by operating activities were $1,259.8 million and $599.1 million for the three months ended March 31, 2022 and 2021, respectively. The change in net cash flows provided by operating activities was primarily due to the change in restricted cash and cash equivalents, driven by margin deposits and clearing funds related to EuroCCP, the change in Section 31 fees payable, and the change in unrecognized tax benefits, partially offset by the change in accounts receivable and the change in other liabilities for the three months ended March 31, 2022 compared to the three months ended March 31, 2021.
Net Cash Flows Used in Investing Activities
Net cash flows used in investing activities were $24.9 million and $13.3 million for the three months March 31, 2022 and 2021, respectively. The variance is primarily due to the change in the proceeds from available-for-sale financial investments, partially offset by the change in purchases of available-for-sale financial investments for the three months ended March 31, 2022 compared to the three months ended March 31, 2021.
Net Cash Flows Provided by (Used in) Financing Activities
Net cash flows provided by (used in) financing activities were $146.5 and ($119.5) million for the three months ended March 31, 2022 and 2021, respectively. The variance is primarily attributable to proceeds from the long-term debt issuance of $298.6 million, partially offset by the change in share repurchases, as well as the change in payment of contingent consideration from acquisition for the three months ended March 31, 2022 compared to the three months ended March 31, 2021.
63
Financial Assets
The following summarizes our financial assets, excluding margin deposits and clearing funds, as of March 31, 2022 and December 31, 2021 (in millions):
| March 31, | December 31, | ||||
2022 | 2021 | |||||
Cash and cash equivalents | $ | 659.4 | $ | 341.9 | ||
Financial investments |
| 48.7 |
| 37.1 | ||
Less deferred compensation plan assets | (27.4) | (28.0) | ||||
Less cash collected for Section 31 fees | (20.7) | (25.9) | ||||
Adjusted cash (1) | $ | 660.0 | $ | 325.1 | ||
| (1) | Adjusted cash is a non-GAAP measure and represents cash and cash equivalents plus financial investments, minus deferred compensation plan assets and cash collected for Section 31 fees. We have presented adjusted cash because we consider it an important supplemental measure of our liquidity and believe that it is frequently used by analysts, investors and other interested parties in the evaluation of companies. |
Debt
The following summarizes our debt obligations as of March 31, 2022 and December 31, 2021 (in millions):
| March 31, | December 31, | ||||
2022 | 2021 | |||||
Term Loan Agreement | $ | 160.0 | $ | 160.0 | ||
3.650% Senior Notes |
| 650.0 |
| 650.0 | ||
1.625% Senior Notes | 500.0 | 500.0 | ||||
3.000% Senior Notes | 300.0 | — | ||||
Revolving Credit Agreement | — | — | ||||
EuroCCP Credit Facility | — | — | ||||
Less unamortized discount and debt issuance costs | (16.4) | (10.7) | ||||
Total debt | $ | 1,593.6 | $ | 1,299.3 | ||
As of March 31, 2022 and December 31, 2021, we were in compliance with the covenants of our debt agreements.
In addition to the debt outstanding, as of March 31, 2022, we had an additional $400.0 million available through our revolving credit facility, with the ability to borrow another $200.0 million by increasing the commitments under the facility, and, as of March 31, 2022, through September 30, 2022 we have an additional $400.0 million available through our term loan agreement. Together with adjusted cash, we had $1.7 billion available to fund our operations, capital expenditures, potential acquisitions, debt repayments and any dividends as of March 31, 2022.
Dividends
The Company’s expectation is to continue to pay dividends. The decision to pay a dividend, however, remains within the discretion of the Company's Board of Directors and may be affected by various factors, including our earnings, financial condition, capital requirements, level of indebtedness and other considerations our Board of Directors deems relevant. Future debt obligations and statutory provisions, among other things, may limit, or in some cases prohibit, our ability to pay dividends.
Share Repurchase Program
In 2011, the Board of Directors approved an initial authorization for the Company to repurchase shares of its outstanding common stock of $100 million and subsequently approved additional authorizations for a total authorization of $1.6 billion. The program permits the Company to purchase shares through a variety of methods, including in the open market or through privately negotiated transactions, in accordance with applicable securities laws. It does not obligate the Company to make any repurchases at any specific time or situation.
64
Under the program, for the three months ended March 31, 2022, the Company repurchased 596,988 shares of common stock at an average cost per share of $117.25, totaling $70.0 million. Since inception of the program through March 31, 2022, the Company has repurchased 18,669,117 shares of common stock at an average cost per share of $69.69, totaling $1.3 billion.
As of March 31, 2022, the Company had $248.9 million of availability remaining under its existing share repurchase authorizations.
Commercial Commitments and Contractual Obligations
As of March 31, 2022, our commercial commitments and contractual obligations included operating leases, data and telecommunications agreements, equipment leases, our long-term debt outstanding, contingent considerations and other obligations. See Note 21 (“Commitments, Contingencies, and Guarantees”) to the condensed consolidated financial statements for a discussion of commitments and contingencies, Note 10 (“Debt”) for a discussion of the outstanding debt, Note 12 (“Clearing Operations”) for information on EuroCCP’s clearinghouse exposure guarantee, and Note 22 (“Leases”) for discussion on operating leases and equipment leases.
Guarantees
We use Wedbush and Morgan Stanley to clear our routed equities transactions for our U.S. Equities exchanges. Wedbush and Morgan Stanley guarantee the trade until one day after the trade date, after which time the National Securities Clearing Corporation (“NSCC”) provides a guarantee. The BIDS Trading ATS platform delivers matched trades to BofA Securities, Inc. (“BOA”), which delivers the matched trades to the NSCC. BOA guarantees the trade until one day after the trade date, after which time the NSCC provides a guarantee. In the case of failure to perform on the part of Wedbush or Morgan Stanley on routed transactions for our U.S. Equities exchanges, we provide the guarantee to the counterparty to the trader. In the case of failure to perform on the part of BOA on transactions for the BIDS Trading ATS platform, BIDS has obligations to the counterparties to satisfy the trades. OCC acts as a central counterparty on all transactions in listed equity options in our Options segment, and as such, guarantees clearance and settlement of all of our options transactions. We believe that any potential requirement for us to make payments under these guarantees is remote and accordingly, have not recorded any liability in the consolidated financial statements for these guarantees. Similarly, with respect to U.S. listed equity options and futures, we deliver matched trades of our customers to the OCC, which acts as a central counterparty on all transactions occurring on Cboe Options, C2, BZX, EDGX, and CFE and, as such, guarantees clearance and settlement of all of our matched options and futures trades. With respect to Canadian equities, we deliver matched trades of our customers to The Canadian Depository for Securities, which acts as a central counterparty on all transactions occurring on MATCHNow and, as such, guarantees clearance and settlement of all of our matched Canadian equities trades. With respect to Australian equities and derivatives, we deliver matched trades of our customers to ASX Clear Pty Ltd and ASX Settlement Pty Ltd. ASX Clear Pty Ltd acts as a central counterparty on all transactions occurring on Cboe Australia and, as such, guarantees clearance and settlement on all of our matched trades in Australia. With respect to Japanese equities, we deliver matched trades of our customers to the Japanese Securities Clearing Corporation, which acts as a central counterparty on all transactions occurring on Cboe Japan and, as such, guarantees clearance and settlement on all of our matched trades in Japan.
Critical Accounting Estimates
The preparation of consolidated financial statements in conformity with U.S. GAAP requires our management to make estimates and assumptions that affect the reported amounts of assets and liabilities, disclosure of the amounts of contingent assets and liabilities at the date of the financial statements and the reported amounts of revenues and expenses during the reporting period. Actual results could differ materially from those estimates. On an ongoing basis, the Company evaluates its estimates, including those related to areas that require a significant level of judgment or are otherwise subject to an inherent degree of uncertainty. The Company bases its estimates on historical experience, observance of trends in particular areas, information available from outside sources and various other assumptions that are believed to be reasonable under the circumstances. Information from these sources form the basis for making judgments about the carrying values of assets and liabilities that may not be readily apparent from other sources.
In the three months ended March 31, 2022, there were no significant changes to our critical accounting estimates from those disclosed in the “Management’s Discussion and Analysis of Financial Condition and Results of Operations” in our 2021 Annual Report on Form 10-K.
65
Item 3. Quantitative and Qualitative Disclosures about Market Risk
As a result of our operating activities, we are exposed to market risks such as foreign currency exchange rate risk, equity risk, credit risk, interest rate risk, and liquidity risk. We have implemented policies and procedures to measure, manage and monitor and report risk exposures, which are reviewed regularly by management and our Board of Directors.
Foreign Currency Exchange Rate Risk
Our operations in Europe, Canada and Asia are subject to increased currency translation risk as revenues and expenses are denominated in foreign currencies, primarily the British pound, Canadian dollar, Euro, Australian dollar, and Japanese Yen. We also have de minimis exposure to other foreign currencies, including the Swiss Franc, Norwegian Kroner, Swedish Krona, Danish Kroner, Singapore dollar, Hong Kong dollar, and Philippine Peso.
For the three months ended March 31, 2022, our exposure to foreign-denominated revenues and expenses is presented by primary foreign currency in the following table (in millions, except percentages):
Three Months Ended | ||||||||||||
March 31, 2022 | ||||||||||||
British | Australian | |||||||||||
| Pounds (1) | Euros (1) |
| Dollars (1) | ||||||||
Foreign denominated % of: | ||||||||||||
Revenues | 2.0 | % | 3.6 | % | 0.6 | % | ||||||
Cost of revenues | — | % | 3.2 | % | 0.1 | % | ||||||
Operating expenses | 4.9 | % | 5.8 | % | 2.9 | % | ||||||
Impact of 10% adverse currency fluctuation on: | ||||||||||||
Revenues | $ | 1.9 | $ | 3.5 | $ | 0.6 | ||||||
Cost of revenues | — | 1.8 | — | |||||||||
Operating expenses | 0.9 | 1.0 | 0.5 | |||||||||
| (1) | An average foreign exchange rate to the U.S. dollar for the period was used. See Item 2 (“Management’s Discussion and Analysis of Financial Condition and Results of Operations”) for the table summarizing the changes in certain operational and financial metrics for more information. |
Equity Risk
Our investment in European, Canadian, and Asia Pacific operations is exposed to volatility in currency exchange rates through translation of our net assets or equity to U.S. dollars. The assets and liabilities of our European businesses are denominated in British pounds or Euros. The assets and liabilities of our Canadian businesses are denominated in Canadian dollars. The assets and liabilities of our Asia Pacific businesses are denominated in Hong Kong dollars, Australian dollars, Japanese Yen, or Philippine Pesos. Fluctuations in currency exchange rates may create volatility in our reported results as we are required to translate foreign currency reported statements of financial condition and operational results into U.S. dollars for consolidated reporting. The translation of these non-U.S. dollar statements of financial condition into U.S. dollars for consolidated reporting results in a cumulative translation adjustment, which is recorded in accumulated other comprehensive income, net within stockholders' equity on our condensed consolidated balance sheet.
Our primary exposure to this equity risk as of March 31, 2022 is presented by foreign currency in the following table (in millions):
British | Canadian | ||||||||
| Pounds (1) | Euros (1) | Dollars (1) | ||||||
Net equity investment in Cboe Europe Equities and Derivatives, EuroCCP, and MATCHNow |
| $ | 634.8 | $ | 129.4 | $ | 194.5 | ||
Impact on consolidated equity of a 10% adverse currency fluctuation |
| 63.5 | 12.9 | 19.4 | |||||
| (1) | Converted to U.S. dollars using the foreign exchange rate of British pounds per U.S. dollar, Euros per U.S. dollar, and Canadian dollars per U.S. dollar, respectively, as of March 31, 2022. |
66
Credit Risk
We are exposed to credit risk from third parties, including customers, counterparties and clearing agents. These parties may default on their obligations due to bankruptcy, lack of liquidity, operational failure or other reasons. We limit our exposure to credit risk by considering such risk when selecting the counterparties with which we make investments and execute agreements.
We do not have counterparty credit risk with respect to trades matched on our exchanges in the U.S., Canada, and Europe. With respect to listed equities, we deliver matched trades of our customers to the NSCC without taking on counterparty risk for those trades. NSCC acts as a central counterparty on all equity transactions occurring on BZX, BYX, EDGX and EDGA and, as such, guarantees clearance and settlement of all of our matched equity trades. Similarly, with respect to U.S. listed equity options and futures, we deliver matched trades of our customers to the OCC, which acts as a central counterparty on all transactions occurring on Cboe Options, C2, BZX, EDGX and CFE and, as such, guarantees clearance and settlement of all of our matched options and futures trades. With respect to Canadian equities, we deliver matched trades of our customers to The Canadian Depository for Securities, which acts as a central counterparty on all transactions occurring on MATCHNow and, as such, guarantees clearance and settlement of all of our matched Canadian equities trades. The BIDS Trading ATS platform delivers matched trades to BOA, which delivers the matched trades to the NSCC. BOA guarantees the trade until one day after the trade date, after which time the NSCC provides a guarantee. Thus, BIDS Trading is potentially exposed to credit risk to the counterparty between the trade date and one day after the trade date in the event BOA fails. With respect to Australian equities and derivatives, we deliver matched trades of our customers to ASX Clear Pty Ltd and ASX Settlement Pty Ltd. ASX Clear Pty Ltd acts as a central counterparty on all transactions occurring on Cboe Australia and, as such, guarantees clearance and settlement on all of our matched trades in Australia. With respect to Japanese equities, we deliver matched trades of our customers to the Japanese Securities Clearing Corporation, which acts as a central counterparty on all transactions occurring on Cboe Japan and, as such, guarantees clearance and settlement on all of our matched trades in Japan.
With respect to orders Cboe Trading routes to other markets for execution on behalf of our customers, Cboe Trading is exposed to some counterparty credit risk in the case of failure to perform on the part of our clearing firms, Morgan Stanley or Wedbush. Morgan Stanley and Wedbush guarantee trades until one day after the trade date, after which time NSCC provides a guarantee. The BIDS Trading ATS platform delivers matched trades to BOA, which delivers the matched trades to the NSCC. Thus, Cboe Trading is potentially exposed to credit risk to the counterparty to a trade routed to another market center between the trade date and one day after the trade date in the event that Morgan Stanley or Wedbush fails. The BIDS Trading ATS platform is potentially exposed to counterparty credit risk on equities trades between the trade date and one day after the trade date in the event that BOA fails. We believe that any potential requirement for us to make payments under these guarantees is remote and accordingly, have not recorded any liability in the condensed consolidated financial statements for these guarantees.
Historically, we have not incurred any liability due to a customer’s failure to satisfy its contractual obligations as counterparty to a system trade. Credit difficulties or insolvency, or the perceived possibility of credit difficulties or insolvency, of one or more larger or more visible market participants could also result in market-wide credit difficulties or other market disruptions.
We do not have counterparty credit risk with respect to institutional spot FX trades occurring on our platform because Cboe FX is not a counterparty to any FX transactions. All transactions occurring on our platform occur bilaterally between two banks or prime brokers as counterparties to the trade. While Cboe FX does not have direct counterparty risk, Cboe FX may suffer a decrease in transaction volume if a bank or prime broker experiences an event that causes other prime brokers to decrease or revoke the credit available to the prime broker experiencing the event. Therefore, Cboe FX may have risk that is related to the credit of the banks and prime brokers that trade FX on the Cboe FX platform.
We also have credit risk related to transaction fees that are billed in arrears to customers on a monthly basis. Our potential exposure to credit losses on these transactions is represented by the receivable balances in our balance sheet. Our customers are financial institutions whose ability to satisfy their contractual obligations may be impacted by volatile securities markets.
The Company is exposed to further credit risk through our clearing operations. EuroCCP holds material amounts of clearing participant collateral, both cash and non-cash deposits, which are held or invested primarily to provide security of
67
capital while minimizing credit risk as well as liquidity and market risks. The following is a summary of the risks associated with these deposits and how these risks are mitigated:
| ● | Credit Risk - The credit risk is predominantly in the event a clearing participant fails to meet a financial or contractual obligation. EuroCCP attempts to mitigate this risk through minimum participant requirements for clearing participants and monitoring their financial health. To cover potential loss to EuroCCP in the event of a clearing participant default, collateral is required from clearing participants. Besides potential defaults of clearing participants, the main credit risk faced by the clearinghouse is exposure to clearing participants when a trade fails to settle. To help mitigate this risk, a fail fee is charged to discourage late settlements. This fee covers EuroCCP’s costs but also acts as a deterrent as required by Regulation (EU) No 236/2012 on short selling, together with certain aspects of credit default swaps. |
| ● | Liquidity Risk - Liquidity risk is the risk EuroCCP may not be able to meet its payment obligations in the right currency, in the right place and at the right time. To help mitigate this risk, EuroCCP monitors its liquidity requirements closely and maintains funds and assets in a manner which attempt to minimize the risk of loss or delay in the access by the clearinghouse to such funds and assets. For example, holding funds with a central bank where possible or making only short-term investments serves to help reduce liquidity risks. Liquidity is mainly required for securities settlement. The payment and settlement obligations generally stem from the function of EuroCCP as a cash equity clearinghouse: shares are bought and sold by clearing participants on a trading platform or OTC, and netted to settle two days later. During the settlement the actual payment for and delivery of the shares take place, this process requires intraday liquidity. If counterparties, which receive shares against payment, are unable to settle, an overnight liquidity need arises. The overnight liquidity is typically very short term, and is usually limited to a few days. |
| ● | Market Risk - EuroCCP is also exposed to market risk in the event that a clearing participant defaults and the market prices of the securities in its open positions have moved adversely so the clearinghouse can only close out the participant’s obligations at a loss. To help mitigate market risk, EuroCCP collects collateral from clearing participants to cover for the probable loss during normal market conditions, together with contributions to the clearing fund to cover losses if a default occurred during extreme but plausible market conditions. Adverse movements in exchange rates affecting the value of obligations and collateral are factored into the calculation of the amount of collateral to be collected. |
On a regular basis, we review and evaluate changes in the status of our counterparties’ creditworthiness. Credit losses such as those described above could adversely affect our condensed consolidated financial position and results of operations. Any such effects to date have been minimal.
Interest Rate Risk
We have exposure to market risk for changes in interest rates relating to our cash and cash equivalents, financial investments, and indebtedness. As of March 31, 2022 and 2021, our cash and cash equivalents and financial investments were $708.1 million and $358.8 million, respectively, of which $173.1 million and $133.4 million is held outside of the United States in various foreign subsidiaries in 2022 and 2021, respectively. The remaining cash and cash equivalents and financial investments are denominated in U.S. dollars. We do not use our investment portfolio for trading or other speculative purposes. Due to the nature of these investments, we have not been exposed to, nor do we anticipate being exposed to, material risks due to changes in interest rates, assuming no change in the amount or composition of our cash and cash equivalents and financial investments.
As of March 31, 2022, we had $1,593.6 million in outstanding debt, of which $1,436.0 million relates to our Senior Notes, which bear interest at fixed interest rates. Changes in interest rates will have no impact on the interest we pay on fixed-rate obligations. $159.5 million of the outstanding debt relates to the Term Loan Agreement, which bears interest at fluctuating rates and, therefore, subjects us to interest rate risk. The discontinuance of LIBOR and introduction to SOFR also contributes to interest rate risk. The overnight Treasury repurchase market underlying SOFR has experienced and may experience disruptions from time to time, which may result in unexpected fluctuations, including potentially higher rates, in SOFR. The Company continues to monitor the transition from LIBOR to SOFR and the potential impacts on our operating results. A hypothetical 100 basis point increase in interest rates relating to the amounts outstanding under the Term Loan Agreement as of March 31, 2022 would decrease annual pre-tax earnings by $1.6 million, assuming no change in the composition of our outstanding indebtedness. We are also exposed to changes in interest rates as a result of borrowings under our Revolving Credit Agreement and the EuroCCP Credit Facility, as these facilities bear interest at fluctuating rates. As of March 31, 2022, there were no outstanding borrowings under our Revolving Credit Agreement. However, there were $1.9 million in debt issuance costs related to the amendment of the Revolving Credit Agreement as
68
defined in Note 10 (“Debt”). There were no outstanding borrowings under the EuroCCP Credit Facility. See Note 10 (“Debt”) to the condensed consolidated financial statements for a discussion of debt agreements.
Liquidity Risk
We are exposed to liquidity risk under certain circumstances in relation to the cross-acceleration and cross-default provisions within the Term Loan Agreement and the Revolving Credit Agreement as a result of the Company, as guarantor, entering into the EuroCCP Credit Facility. A default of the Facility may allow lenders to accelerate any related drawn amounts and may result in the acceleration of the Company’s other outstanding debt to which a cross-acceleration or cross-default provision applies, which may limit the Company’s liquidity, business and financing activities. See Note 10 (“Debt”) to the condensed consolidated financial statements for a discussion of debt agreements.
Item 4. Controls and Procedures
PART II—OTHER INFORMATION
Item 1. Legal Proceedings.
Cboe incorporates herein by reference the discussion set forth in Note 19 (“Income Taxes”) and Note 21 (“Commitments, Contingencies, and Guarantees”) of the condensed consolidated financial statements included herein.
Other than the legal proceedings below and incorporated by reference herein, there have been no material updates during the period covered by this Form 10-Q to the Legal Proceedings as set forth in Item 3. of our Annual Report on Form 10-K for the year ended December 31, 2021.
CT Plan Order (Continuation of Consolidated Data Plans Proceeding)
On May 6, 2020, the SEC issued an order (the “Consolidated Data Plan Order”) that directed the U.S. equities exchanges and FINRA to submit a new National Market System (“NMS”) Plan regarding Consolidated Equity Market Data. The contemplated new NMS Plan is referred to as the “CT Plan” and it will replace three Equity Data Plans that govern the dissemination of real-time, consolidated market data for NMS stocks. The Consolidated Data Plan Order set forth certain changes to be included in the proposed CT Plan, including governance structure changes related to voting rights and a deadline of August 11, 2020 by which the proposed CT Plan had to be filed.
On June 29, 2020, the Company filed a Petition for Review (“PFR”) with the Court of Appeals for the D.C. Circuit Court (“D.C. Circuit) challenging the Consolidated Data Plan Order. Briefing concluded on March 12, 2021 and oral argument was held on April 26, 2021. On June 15, 2021, the D.C. Circuit issued an order dismissing the PFR for lack of jurisdiction, holding that the Consolidated Data Plan Order was not a “final order” because the SEC had not determined whether the challenged features would make it into the new CT Plan.
On August 6, 2021, the SEC issued an order approving the CT Plan that was previously filed on August 11, 2020 (as mandated by the Consolidated Data Plan Order) and subject to public comment (“CT Plan Order”). On August 9, 2021, the Company filed another PFR with the D.C. Circuit challenging the CT Plan Order and the prior Consolidated Data Plan Order. On September 13, 2021, the Company filed a motion requesting that the D.C. Circuit stay the CT Plan Order pending resolution of the appeal and also requesting that the D.C. Circuit expedite the appeal. On October 13, 2021, the D.C. Circuit granted the motion to stay the CT Plan order and to expedite the appeal and established a briefing schedule. Briefing concluded in January 2022 and oral argument occurred on March 24, 2022. The Company is currently awaiting a decision by the D.C. Circuit.
69
The new CT Plan approved by the SEC may cause the Company’s equities exchanges, BZX, BYX, EDGX, and EDGA, to require additional resources to comply with or challenge such new consolidated data plan and it may have a material impact on our business, financial condition and operating results if, for example, there is a negative impact on the applicable market data fees that we receive that are generated from such new plan.
Market Data Infrastructure Final Rule
On December 9, 2020, the SEC issued a Market Data Infrastructure Final Rule (“Final Rule”), which makes significant additions to the content available on the Securities Information Processors (“SIPs”) and replaces the exclusive processors with a competing consolidator model. The Final Rule is limited to market data disseminated by the equities SIPs and does not apply to proprietary market data, or the dissemination of options market data through OPRA.
On February 5, 2021, the Company filed a Petition for Review (the “2/5 PFR”) with the Court of Appeals for the D.C. Circuit challenging the Final Order. Additionally, on February 5, 2021, the Company filed a motion for stay of the Final Rule with the SEC, which the SEC denied on March 24, 2021.
On March 24, 2021, the SEC filed a Motion to Dismiss (“MTD”) with the D.C. Circuit: (1) arguing that the PFR is not ripe because the Final Rule had not been published in the Federal Register (“FR”), (2) suggesting (if there is ambiguity) that the D.C. Circuit clarify whether publication in the FR opens the filing window, and (3) suggesting that the D.C. Circuit could hold the case in abeyance pending filing of a PFR after publication in the FR.
On April 9, 2021, the Final Rule was published in the FR. On April 13, 2021, the Company filed another PFR (the “4/13 PFR””) as a protective measure in the event the D.C. Circuit determined that the time to file a PFR does not commence until publication of the Final Rule in the FR.
On June 15, 2021, the D.C. Circuit entered an order granting the SEC’s MTD respecting the 2/5 PFR. This order does not affect the 4/13 PFR, which was filed after publication of the Final Rule in the FR on April 9, 2021. On July 9, 2021, the D.C. Circuit entered a briefing schedule, which concluded in January 2022. Oral argument occurred on March 18, 2022. The Company is currently awaiting a decision by the D.C. Circuit.
The implementation of the Final Rule could cause Cboe’s equities exchanges, BZX, BYX, EDGX, and EDGA, to require additional resources to comply with or to challenge the new rules and they may have a material impact on our business, financial condition and operating results if, for example, there are lower SIP plan revenues or we must reduce the fees we charge for market data. The Company intends to litigate the matter vigorously.
Item 1A. Risk Factors
Other than the risk factor listed below, there have been no material updates during the period covered by this Form 10-Q to the Risk Factors as set forth in Item 1A. of our Annual Report on Form 10-K for the year ended December 31, 2021. These risks and uncertainties, however, are not the only risks and uncertainties that we face. Additional risks and uncertainties not currently known to us or that we currently deem to be immaterial may also significantly impact us. Any of these risks and uncertainties may materially and adversely affect our business, financial condition or results of operations, liquidity and cash flows.
Risks Relating to Our Business Following Consummation of Pending ErisX Acquisition
Digital asset custodial solutions and related technology, including ErisX’s systems and custodial arrangements, are subject to risks related to a loss of funds due to theft of digital assets, employee or vendor sabotage, security and cybersecurity risks, system failures and other operational issues which could cause damage to our and ErisX’s reputation and brand.
The secure storage and transmission of digital assets and data over networks is a critical element of ErisX’s operations. Threats to ErisX’s storage and transmission of digital assets and data may come from external factors such as governments, organized crime, hackers and other third parties such as outsourced or infrastructure-support providers and application developers, or may originate internally from an employee or service provider to whom ErisX has granted access to its systems.
Digital asset transactions may be irrevocable, and stolen or incorrectly transferred digital assets may be irretrievable. Once a transaction has been verified and recorded in a block that is added to the blockchain, an incorrect transfer of a digital asset generally will not be reversible, and ErisX may not be capable of seeking compensation for any such transfer or theft. It is possible that, through computer or human error, or through theft or criminal action, the digital asset could be
70
transferred in incorrect amounts or to unauthorized third parties, or to uncontrolled accounts. Such events could have a material adverse effect on the ability of ErisX to continue as a going concern, which may have an adverse effect on our business following the acquisition.
While we and ErisX maintain cybersecurity procedures and policies, those procedures and policies may not be adequate to avoid the potential losses caused by security breaches, and ErisX may lose digital assets without any recourse. Unlike bank accounts or accounts at some other financial institutions, in the event of loss or loss of utility value, there is no public insurer, such as the Securities Investor Protection Corporation or the FDIC, to offer recourse to us, ErisX, or to any investor and the misappropriated digital assets may not easily be traced to the bad actor.
Further, when cryptocurrency custodial solutions (whether involving ErisX systems or others) experience system failures or other operational issues, such events could result in a reduction in cryptocurrency prices or confidence and impact the success of ErisX and have a material adverse effect on the ability of ErisX to continue as a going concern, which may have an adverse effect on our business following the acquisition.
While we understand that ErisX has experienced in the past cybersecurity threats and events of varying degrees, we are not aware of any of these threats or events having a material impact on ErisX’s business, financial condition or operating results to date. However, we cannot assure you that we or ErisX will not experience future threats or events that may be material. If any such threats or events materialize, ErisX may be subject to contractual restrictions, liability and damages, loss of business, penalties, unfavorable publicity, and increased scrutiny by its regulators, which may materially impact its business, financial condition and operating results, and which may have an adverse effect on our business following the acquisition.
Item 2. Unregistered Sales of Equity Securities and Use of Proceeds.
Share repurchase program
In 2011, the Board of Directors approved an initial authorization for the Company to repurchase shares of its outstanding common stock of $100 million and subsequently approved additional authorizations for a total authorization of $1.6 billion. The program permits the Company to purchase shares through a variety of methods, including in the open market or through privately negotiated transactions, in accordance with applicable securities laws. It does not obligate the Company to make any repurchases at any specific time or situation. The Company repurchased 596,988 shares of its common stock under its share repurchase program during the first quarter of 2022 at an average cost per share of $117.25, totaling $70.0 million and had $248.9 million of availability remaining under its existing share repurchase authorizations as of March 31, 2022.
Purchase of common stock from employees
The table below reflects the acquisition of common stock by the Company in the three months ended March 31, 2022 that were not part of the publicly announced share repurchase authorization. These shares consisted of shares retained to cover payroll withholding taxes in connection with the vesting of restricted stock unit awards and performance share awards.
Period |
| Total Number of Shares Purchased |
| Average Price Paid per Share | |
January 1 to January 31, 2022 | — | $ | — | ||
February 1 to February 28, 2022 | 323,377 | 118.87 | |||
March 1 to March 31, 2022 | 273,611 | 115.32 | |||
Total | 596,988 | $ | 117.25 | ||
Use of proceeds
None.
Item 3. Defaults upon Senior Securities.
None.
Item 4. Mine Safety Disclosures.
Not applicable.
71
Item 6. Exhibits.
Exhibit No. |
| Description |
4.1 | ||
4.2 | Form of 3.000% Senior Notes due 2032 (included in Exhibit 4.1 hereto). | |
10.1 | ||
10.2 | ||
10.3 | ||
10.4 | ||
31.1 | Certification of Chief Executive Officer pursuant to Rule 13a-14 (Filed herewith). | |
31.2 | Certification of Chief Financial Officer pursuant to Rule 13a-14 (Filed herewith). | |
32.1 | ||
32.2 | ||
101.INS | XBRL Instance Document (Filed herewith). — The instance document does not appear in the Interactive Data File because its XBRL tags are embedded within the Inline XBRL document. | |
101.SCH | XBRL Taxonomy Extension Schema Document (Filed herewith). | |
101.CAL | XBRL Taxonomy Extension Calculation Linkbase Document (Filed herewith). | |
101.DEF | XBRL Taxonomy Extension Definition Linkbase (Filed herewith). | |
101.LAB | XBRL Taxonomy Extension Label Linkbase Document (Filed herewith). | |
101.PRE | XBRL Taxonomy Extension Presentation Linkbase Document (Filed herewith). | |
104 | Cover Page Interactive Data File (embedded as Inline XBRL document). |
* Indicates Management Compensatory Plan, Contract or Arrangement.
73
SIGNATURES
Pursuant to the requirements of the Securities Exchange Act of 1934, the registrant has duly caused this report to be signed on its behalf by the undersigned, thereunto duly authorized.
CBOE GLOBAL MARKETS, INC. | ||
Registrant | ||
By: | /s/ Edward T. Tilly | |
Edward T. Tilly | ||
President and Chief Executive Officer | ||
(Principal Executive Officer) | ||
Date: April 29, 2022 | ||
By: | /s/ Brian N. Schell | |
Brian N. Schell | ||
Executive Vice President and Chief Financial Officer | ||
(Principal Financial Officer) | ||
Date: April 29, 2022 | ||
74
Serious News for Serious Traders! Try StreetInsider.com Premium Free!
You May Also Be Interested In
- Cboe Global Markets (CBOE) Realigns Digital Asset Business
- The Eastern Company Declares 335th Consecutive Quarterly Cash Dividend
- Cboe Global Markets Realigns Digital Asset Business, Leveraging Strength and Expertise in Derivatives and Clearing
Create E-mail Alert Related Categories
SEC FilingsSign up for StreetInsider Free!
Receive full access to all new and archived articles, unlimited portfolio tracking, e-mail alerts, custom newswires and RSS feeds - and more!
