

Form 10-Q CNL Healthcare Propertie For: Jun 30
 Tweet
Tweet Share
Share
UNITED STATES
SECURITIES AND EXCHANGE COMMISSION
Washington, D.C. 20549
FORM |
|
QUARTERLY REPORT PURSUANT TO SECTION 13 OR 15(d) OF THE SECURITIES EXCHANGE ACT OF 1934 |
|
For the quarterly period ended
OR
TRANSITION REPORT PURSUANT TO SECTION 13 OR 15(d) OF THE SECURITIES EXCHANGE ACT OF 1934 |
For the transition period from to ______
Commission file number:
(Exact name of registrant as specified in its charter) |
|
||
(State or other jurisdiction of incorporation or organization) |
|
(I.R.S. Employer Identification No.) |
|
||
(Address of principal executive offices) |
|
(Zip Code) |
Registrant’s telephone number, including area code ( |
||
Indicate by check mark whether the registrant (1) has filed all reports required to be filed by Section 13 or 15(d) of the Securities Exchange Act of 1934 during the preceding 12 months (or for such shorter period that the registrant was required to file such reports), and (2) has been subject to such filing requirements for the past 90 days.
Indicate by check mark whether the registrant has submitted electronically every Interactive Data File required to be submitted pursuant to Rule 405 of Regulation S-T (§232.405 of this chapter) during the preceding 12 months (or for such shorter period that the registrant was required to submit such files).
Indicate by check mark whether the registrant is a large accelerated filer, an accelerated filer, a non-accelerated filer, a smaller reporting company, or an emerging growth company. See the definitions of “large accelerated filer,” “accelerated filer,” “smaller reporting company” and “emerging growth company” in Rule 12b-2 of the Exchange Act.
Large accelerated filer |
|
Accelerated filer |
|
|
Smaller reporting company |
||
Emerging growth company |
|
|
If an emerging growth company, indicate by check mark if the registrant has elected not to use the extended transition period for complying with any new or revised financial accounting standards provided pursuant to Section 13(a) of the Exchange Act.
Indicate by check mark whether the registrant is a shell company (as defined in Rule 12b-2 of the Exchange Act). Yes No
Securities registered pursuant to Section 12(b) of the Act:
Title of each class |
Trading Symbol(s) |
Name of each exchange on which registered |
None |
N/A |
N/A |
The number of shares of common stock of the registrant outstanding as of August 11, 2022 was
CNL HEALTHCARE PROPERTIES, INC. AND SUBSIDIARIES
INDEX
|
|
Page |
PART I. FINANCIAL INFORMATION |
|
|
|
|
|
Item 1. |
Condensed Consolidated Financial Information (unaudited): |
|
|
2 |
|
|
3 |
|
|
Condensed Consolidated Statements of Comprehensive Income (Loss) |
4 |
|
Condensed Consolidated Statements of Stockholders’ Equity and Redeemable Noncontrolling Interest |
5 |
|
7 |
|
|
8 |
|
Item 2. |
Management’s Discussion and Analysis of Financial Condition and Results of Operations |
17 |
Item 3. |
35 |
|
Item 4. |
36 |
|
|
|
|
PART II. OTHER INFORMATION |
|
|
|
|
|
Item 1. |
36 |
|
Item 1A. |
36 |
|
Item 2. |
36 |
|
Item 3. |
36 |
|
Item 4. |
36 |
|
Item 5. |
36 |
|
Item 6. |
36 |
|
|
|
|
|
37 |
|
|
38 |
|
Exhibits |
|
|
Item 1. Condensed Consolidated Financial Information
CNL HEALTHCARE PROPERTIES, INC. AND SUBSIDIARIES
CONDENSED CONSOLIDATED BALANCE SHEETS (UNAUDITED)
(in thousands, except per share data)
|
|
June 30, |
|
|
December 31, |
|
||
ASSETS |
|
2022 |
|
|
2021 |
|
||
Real estate investment properties, net (including VIEs $ |
|
$ |
|
|
$ |
|
||
Assets held for sale |
|
― |
|
|
|
|
||
Cash (including VIEs $ |
|
|
|
|
|
|
||
Restricted cash (including VIEs $ |
|
|
|
|
|
|
||
Other assets (including VIEs $ |
|
|
|
|
|
|
||
Deferred rent, lease incentives and intangibles, net |
|
|
|
|
|
|
||
Total assets |
|
$ |
|
|
$ |
|
||
LIABILITIES AND EQUITY |
|
|
|
|
|
|
||
Liabilities: |
|
|
|
|
|
|
||
Mortgages and other notes payable, net (including VIEs $ |
|
$ |
|
|
|
|
||
Credit facilities |
|
|
|
|
|
|
||
Accounts payable and accrued liabilities (including VIEs $ |
|
|
|
|
|
|
||
Other liabilities (including VIEs $ |
|
|
|
|
|
|
||
Due to related parties |
|
|
|
|
|
|
||
Total liabilities |
|
|
|
|
|
|
||
|
|
|
|
|
|
|||
Stockholders' equity: |
|
|
|
|
|
|
||
Preferred stock, $ |
|
― |
|
|
― |
|
||
Excess shares, $ |
|
― |
|
|
― |
|
||
Common stock, $ |
|
|
|
|
|
|
||
Capital in excess of par value |
|
|
|
|
|
|
||
Accumulated income |
|
|
|
|
|
|
||
Accumulated distributions |
|
|
( |
) |
|
|
( |
) |
Accumulated other comprehensive income |
|
|
|
|
|
|
||
Total stockholders' equity |
|
|
|
|
|
|
||
Noncontrolling interest |
|
|
|
|
|
|
||
Total equity |
|
|
|
|
|
|
||
Total liabilities and equity |
|
$ |
|
|
$ |
|
||
|
|
|
|
|
|
|
||
The abbreviation VIEs above means variable interest entities. |
|
|
|
|
|
|
||
See accompanying notes to condensed consolidated financial statements.
2
CNL HEALTHCARE PROPERTIES, INC. AND SUBSIDIARIES
CONDENSED CONSOLIDATED STATEMENTS OF OPERATIONS (UNAUDITED)
(in thousands, except per share data)
|
|
Quarter Ended |
|
|
Six Months Ended |
|
||||||||||
|
|
June 30, |
|
|
June 30, |
|
||||||||||
|
|
2022 |
|
|
2021 |
|
|
2022 |
|
|
2021 |
|
||||
Revenues: |
|
|
|
|
|
|
|
|
|
|
|
|
||||
|
$ |
|
|
$ |
|
|
$ |
|
|
$ |
|
|||||
|
|
|
|
|
|
|
|
|
|
|
|
|||||
Total revenues |
|
|
|
|
|
|
|
|
|
|
|
|
||||
Operating expenses: |
|
|
|
|
|
|
|
|
|
|
|
|
||||
Property operating expenses |
|
|
|
|
|
|
|
|
|
|
|
|
||||
General and administrative expenses |
|
|
|
|
|
|
|
|
|
|
|
|
||||
Asset management fees |
|
|
|
|
|
|
|
|
|
|
|
|
||||
Property management fees |
|
|
|
|
|
|
|
|
|
|
|
|
||||
Depreciation and amortization |
|
|
|
|
|
|
|
|
|
|
|
|
||||
Total operating expenses |
|
|
|
|
|
|
|
|
|
|
|
|
||||
Operating income |
|
|
|
|
|
|
|
|
|
|
|
|
||||
Other income (expense): |
|
|
|
|
|
|
|
|
|
|
|
|
||||
Interest and other income |
|
|
|
|
|
|
|
|
|
|
|
|
||||
Interest expense and loan cost amortization |
|
|
( |
) |
|
|
( |
) |
|
|
( |
) |
|
|
( |
) |
Gain on change of control of a joint venture |
|
|
|
|
|
|
|
|
|
|
|
|
||||
Equity in earnings of unconsolidated entity |
|
|
|
|
|
|
|
|
|
|
|
|
||||
Total other (expense) income |
|
|
( |
) |
|
|
( |
) |
|
|
|
|
|
( |
) |
|
Income (loss) before income taxes |
|
|
|
|
|
( |
) |
|
|
|
|
|
( |
) |
||
Income tax (expense) benefit |
|
|
( |
) |
|
|
|
|
|
( |
) |
|
|
|
||
Income (loss) from continuing operations |
|
|
|
|
|
|
|
|
|
|
|
( |
) |
|||
Loss from discontinued operations |
|
|
|
|
|
|
|
|
|
|
|
( |
) |
|||
Net income (loss) |
|
|
|
|
|
|
|
|
|
|
|
( |
) |
|||
Less: Amounts attributable to noncontrolling interests |
|
|
|
|
|
|
|
|
|
|
|
|
||||
Net income (loss) from continuing operations |
|
|
|
|
|
( |
) |
|
|
|
|
|
( |
) |
||
Net income (loss) attributable to common stockholders |
|
$ |
|
|
$ |
|
|
$ |
|
|
$ |
( |
) |
|||
|
|
|
|
|
|
|
|
|
|
|
|
|
||||
Net income (loss) per share of common stock (basic and diluted) |
|
|
|
|
|
|
|
|
|
|
|
|
||||
Continuing operations |
|
$ |
|
|
$ |
|
|
$ |
|
|
$ |
( |
) |
|||
Discontinued operations |
|
$ |
|
|
$ |
|
|
$ |
|
|
$ |
( |
) |
|||
Weighted average number of shares of common stock outstanding |
|
|
|
|
|
|
|
|
|
|
|
|
||||
See accompanying notes to condensed consolidated financial statements.
3
CNL HEALTHCARE PROPERTIES, INC. AND SUBSIDIARIES
CONDENSED CONSOLIDATED STATEMENTS OF COMPREHENSIVE INCOME (LOSS)
(UNAUDITED)
(in thousands)
|
|
Quarter Ended |
|
|
Six Months Ended |
|
||||||||||
|
|
June 30, |
|
|
June 30, |
|
||||||||||
|
|
2022 |
|
|
2021 |
|
|
2022 |
|
|
2021 |
|
||||
Net income (loss) |
|
$ |
|
|
$ |
|
|
$ |
|
|
$ |
( |
) |
|||
Other comprehensive income: |
|
|
|
|
|
|
|
|
|
|
|
|
||||
Unrealized gain on derivative financial instruments, net |
|
|
|
|
|
|
|
|
|
|
|
|
||||
Unrealized gain on derivative financial instruments of equity method investments |
|
|
|
|
|
|
|
|
|
|
|
|
||||
Total other comprehensive income |
|
|
|
|
|
|
|
|
|
|
|
|
||||
Comprehensive income (loss) |
|
|
|
|
|
|
|
|
|
|
|
( |
) |
|||
Less: Comprehensive income (loss) attributable to noncontrolling interest |
|
|
|
|
|
( |
) |
|
|
|
|
|
( |
) |
||
Comprehensive income (loss) attributable to common stockholders |
|
$ |
|
|
$ |
|
|
$ |
|
|
$ |
( |
) |
|||
See accompanying notes to condensed consolidated financial statements.
4
CNL HEALTHCARE PROPERTIES, INC. AND SUBSIDIARIES
CONDENSED CONSOLIDATED STATEMENTS OF STOCKHOLDERS' EQUITY AND REDEEMABLE NONCONTROLLING INTEREST
QUARTER AND SIX MONTHS ENDED JUNE 30, 2022 (UNAUDITED)
(in thousands, except per share data)
|
|
|
|
|
|
|
|
|
|
|
|
|
|
|
|
|
Accumulated |
|
|
|
|
|
|
|
|
|
|
|||||||||
|
|
Common Stock |
|
|
Capital in |
|
|
|
|
|
|
|
|
Other |
|
|
Total |
|
|
Non- |
|
|
|
|
||||||||||||
|
|
Number |
|
|
Par |
|
|
Excess of |
|
|
Accumulated |
|
|
Accumulated |
|
|
Comprehensive |
|
|
Stockholders' |
|
|
controlling |
|
|
Total |
|
|||||||||
|
|
of Shares |
|
|
Value |
|
|
Par Value |
|
|
Income |
|
|
Distributions |
|
|
Income (Loss) |
|
|
Equity |
|
|
Interest |
|
|
Equity |
|
|||||||||
Balance at March 31, 2022 |
|
|
|
|
$ |
|
|
$ |
|
|
$ |
|
|
$ |
( |
) |
|
$ |
|
|
$ |
|
|
$ |
|
|
$ |
|
||||||||
Net income |
|
― |
|
|
― |
|
|
― |
|
|
|
|
|
― |
|
|
― |
|
|
|
|
|
|
|
|
|
|
|||||||||
Other comprehensive income |
|
― |
|
|
― |
|
|
― |
|
|
― |
|
|
― |
|
|
|
|
|
|
|
|
― |
|
|
|
|
|||||||||
Cash distributions declared |
|
― |
|
|
― |
|
|
― |
|
|
― |
|
|
|
( |
) |
|
― |
|
|
|
( |
) |
|
― |
|
|
|
( |
) |
||||||
Balance at June 30, 2022 |
|
$ |
|
|
$ |
|
|
$ |
|
|
$ |
|
|
$ |
( |
) |
|
$ |
|
|
$ |
|
|
$ |
|
|
$ |
|
||||||||
|
|
|
|
|
|
|
|
|
|
|
|
|
|
|
|
|
|
|
|
|
|
|
|
|
|
|
|
|||||||||
Balance at December 31, 2021 |
|
|
|
|
$ |
|
|
$ |
|
|
$ |
|
|
$ |
( |
) |
|
$ |
|
|
$ |
|
|
$ |
|
|
$ |
|
||||||||
Net income |
|
― |
|
|
― |
|
|
― |
|
|
|
|
|
― |
|
|
― |
|
|
|
|
|
|
|
|
|
|
|||||||||
Other comprehensive income |
|
― |
|
|
― |
|
|
― |
|
|
― |
|
|
― |
|
|
|
|
|
|
|
|
― |
|
|
|
|
|||||||||
Cash distributions declared |
|
― |
|
|
― |
|
|
― |
|
|
― |
|
|
|
( |
) |
|
― |
|
|
|
( |
) |
|
― |
|
|
|
( |
) |
||||||
Balance at June 30, 2022 |
|
$ |
|
|
$ |
|
|
$ |
|
|
$ |
|
|
$ |
( |
) |
|
$ |
|
|
$ |
|
|
$ |
|
|
$ |
|
||||||||
See accompanying notes to condensed consolidated financial statements.
5
CNL HEALTHCARE PROPERTIES, INC. AND SUBSIDIARIES
CONDENSED CONSOLIDATED STATEMENTS OF STOCKHOLDERS' EQUITY AND REDEEMABLE NONCONTROLLING INTEREST
QUARTER AND SIX MONTHS ENDED JUNE 30, 2021 (UNAUDITED)
(in thousands, except per share data)
|
|
|
|
|
|
|
|
|
|
|
|
|
|
|
|
|
|
|
|
Accumulated |
|
|
|
|
|
|
|
|
|
|
||||||||||
|
|
Redeemable |
|
|
Common Stock |
|
|
Capital in |
|
|
|
|
|
|
|
|
Other |
|
|
Total |
|
|
Non- |
|
|
|
|
|||||||||||||
|
|
Noncontrolling |
|
|
Number |
|
|
Par |
|
|
Excess of |
|
|
Accumulated |
|
|
Accumulated |
|
|
Comprehensive |
|
|
Stockholders' |
|
|
controlling |
|
|
Total |
|
||||||||||
|
|
Interest |
|
|
of Shares |
|
|
Value |
|
|
Par Value |
|
|
Income |
|
|
Distributions |
|
|
Income (Loss) |
|
|
Equity |
|
|
Interest |
|
|
Equity |
|
||||||||||
Balance at March 31, 2021 |
|
$ |
|
|
|
|
|
$ |
|
|
$ |
|
|
$ |
|
|
$ |
( |
) |
|
$ |
( |
) |
|
$ |
|
|
$ |
|
|
$ |
|
||||||||
Net income (loss) |
|
|
|
|
― |
|
|
― |
|
|
― |
|
|
|
|
|
― |
|
|
― |
|
|
|
|
|
|
( |
) |
|
|
|
|||||||||
Other comprehensive income |
|
― |
|
|
― |
|
|
― |
|
|
― |
|
|
― |
|
|
― |
|
|
|
|
|
|
|
|
― |
|
|
|
|
||||||||||
Distributions to noncontrolling |
|
|
( |
) |
|
― |
|
|
― |
|
|
― |
|
|
― |
|
|
― |
|
|
― |
|
|
― |
|
|
― |
|
|
|
( |
) |
||||||||
Cash distributions declared |
|
― |
|
|
― |
|
|
― |
|
|
― |
|
|
― |
|
|
|
( |
) |
|
― |
|
|
|
( |
) |
|
― |
|
|
|
( |
) |
|||||||
Reclassification of redeemable noncontrolling interest |
|
|
( |
) |
|
― |
|
|
― |
|
|
― |
|
|
― |
|
|
― |
|
|
― |
|
|
― |
|
|
|
|
|
― |
|
|||||||||
Balance at June 30, 2021 |
|
$ |
— |
|
|
|
|
|
$ |
|
|
$ |
|
|
$ |
|
|
$ |
( |
) |
|
$ |
( |
) |
|
$ |
|
|
$ |
|
|
$ |
|
|||||||
|
|
|
|
|
|
|
|
|
|
|
|
|
|
|
|
|
|
|
|
|
|
|
|
|
|
|
|
|
|
|
||||||||||
Balance at December 31, 2020 |
|
$ |
|
|
|
|
|
$ |
|
|
$ |
|
|
$ |
|
|
$ |
( |
) |
|
$ |
( |
) |
|
$ |
|
|
$ |
|
|
|
|
||||||||
Net income (loss) |
|
|
|
|
― |
|
|
― |
|
|
― |
|
|
|
( |
) |
|
― |
|
|
― |
|
|
|
( |
) |
|
|
( |
) |
|
|
( |
) |
||||||
Other comprehensive income |
|
― |
|
|
― |
|
|
― |
|
|
― |
|
|
― |
|
|
― |
|
|
|
|
|
|
|
|
― |
|
|
|
|
||||||||||
Distributions to noncontrolling |
|
|
( |
) |
|
― |
|
|
― |
|
|
― |
|
|
― |
|
|
― |
|
|
― |
|
|
― |
|
|
|
( |
) |
|
|
( |
) |
|||||||
Cash distributions declared |
|
― |
|
|
― |
|
|
― |
|
|
― |
|
|
― |
|
|
|
( |
) |
|
― |
|
|
|
( |
) |
|
― |
|
|
|
( |
) |
|||||||
Reclassification of redeemable noncontrolling interest |
|
|
( |
) |
|
― |
|
|
― |
|
|
― |
|
|
― |
|
|
― |
|
|
― |
|
|
― |
|
|
|
|
|
― |
|
|||||||||
Balance at June 30, 2021 |
|
$ |
— |
|
|
|
|
|
$ |
|
|
$ |
|
|
$ |
|
|
$ |
( |
) |
|
$ |
( |
) |
|
$ |
|
|
$ |
|
|
$ |
|
|||||||
See accompanying notes to condensed consolidated financial statements.
6
CNL HEALTHCARE PROPERTIES, INC. AND SUBSIDIARIES
CONDENSED CONSOLIDATED STATEMENTS OF CASH FLOWS (UNAUDITED)
(in thousands)
|
|
Six Months Ended June 30, |
|
|||||
|
|
2022 |
|
|
2021 |
|
||
Operating activities: |
|
|
|
|
|
|
||
Net cash flows provided by operating activities – continuing operations |
|
$ |
|
|
$ |
|
||
Net cash flows used in operating activities – discontinued operations |
|
|
|
|
|
( |
) |
|
Net cash flows provided by operating activities |
|
|
|
|
|
|
||
Investing activities: |
|
|
|
|
|
|
||
Acquisition of joint venture interest, net of cash acquired |
|
|
( |
) |
|
|
|
|
Net proceeds from sale of property |
|
|
|
|
|
|
||
Capital expenditures |
|
|
( |
) |
|
|
( |
) |
Other investing activities |
|
|
( |
) |
|
|
|
|
Net cash used in investing activities – continuing operations |
|
|
( |
) |
|
|
( |
) |
Net cash provided by investing activities – discontinued operations |
|
|
|
|
|
|
||
Net cash (used in) provided by investing activities |
|
|
( |
) |
|
|
|
|
Financing activities: |
|
|
|
|
|
|
||
Distributions to stockholders |
|
|
( |
) |
|
|
( |
) |
Draws on line of credit |
|
|
|
|
|
|
||
Principal payments on mortgages and other notes payable |
|
|
( |
) |
|
|
( |
) |
Other financing activities |
|
|
( |
) |
|
|
( |
) |
Net cash flows used in financing activities |
|
|
( |
) |
|
|
( |
) |
Net increase in cash and restricted cash |
|
|
|
|
|
|
||
Cash and restricted cash at beginning of period, including assets held for sale |
|
|
|
|
|
|
||
Cash and restricted cash at end of period, including assets held for sale |
|
$ |
|
|
$ |
|
||
|
|
|
|
|
|
|
||
Supplemental disclosure of non-cash investing and financing activities: |
|
|
|
|
|
|
||
Real estate investment properties |
|
$ |
|
|
$ |
|
||
Intangibles |
|
|
|
|
|
|
||
Mortgages and notes payable |
|
|
( |
) |
|
|
|
|
Net assets recognized upon the change in control of the Windsor Manor Joint Venture (Note 4) |
|
$ |
|
|
$ |
|
||
See accompanying notes to condensed consolidated financial statements.
7
CNL HEALTHCARE PROPERTIES, INC. AND SUBSIDIARIES
NOTES TO CONDENSED CONSOLIDATED FINANCIAL STATEMENTS
FOR THE QUARTER AND SIX MONTHS ENDED JUNE 30, 2022 (UNAUDITED)
1. Organization
CNL Healthcare Properties, Inc. (the “Company”) is a Maryland corporation that elected to be taxed as a real estate investment trust (“REIT”) for United States (“U.S.”) federal income tax purposes. The Company has been and intends to continue to be organized and operate in a manner that allows it to remain qualified as a REIT for U.S. federal income tax purposes. The Company conducts substantially all of its operations either directly or indirectly through: (1) an operating partnership, CHP Partners, LP (“Operating Partnership”), in which the Company is the sole limited partner and its wholly-owned subsidiary, CHP GP, LLC, is the sole general partner; (2) a wholly-owned taxable REIT subsidiary (“TRS”), CHP TRS Holding, Inc.; (3) property owner and lender subsidiaries, which are single purpose entities; and (4) investments in joint ventures.
The Company is externally managed and advised by CNL Healthcare Corp. (“Advisor”), which is an affiliate of CNL Financial Group, LLC (“Sponsor”). The Sponsor is an affiliate of CNL Financial Group, Inc. (“CNL”). The Advisor is responsible for managing the Company’s day-to-day operations, serving as a consultant in connection with policy decisions to be made by the board of directors, and for identifying, recommending and executing on possible strategic alternatives and dispositions on the Company’s behalf pursuant to an advisory agreement among the Company, the Operating Partnership and the Advisor. Substantially all of the Company’s operating, administrative and certain property management services are provided by affiliates of the Advisor. In addition, certain property management services are provided by third-party property managers.
In 2017, the Company began evaluating possible strategic alternatives to provide liquidity to the Company’s stockholders. As part of executing under possible strategic alternatives, the Company’s board of directors committed to a plan to sell
As of June 30, 2022, the Company’s seniors housing portfolio was geographically diversified with properties in
2. Summary of Significant Accounting Policies
Basis of Presentation and Consolidation — The accompanying unaudited condensed consolidated financial statements have been prepared in accordance with the instructions to Form 10-Q and do not include all of the information and note disclosures required by generally accepted accounting principles in the U.S. (“GAAP”). The unaudited condensed consolidated financial statements reflect all normal recurring adjustments, which, in the opinion of management, are necessary for the fair statement of the Company’s results for the interim period presented. Operating results for the six months ended June 30, 2022 may not be indicative of the results that may be expected for the year ending December 31, 2022. Amounts as of December 31, 2021 included in the unaudited condensed consolidated financial statements have been derived from audited consolidated financial statements as of that date but do not include all disclosures required by GAAP. These unaudited condensed consolidated financial statements should be read in conjunction with the audited consolidated financial statements and notes thereto included in the Company’s Annual Report on Form 10-K for the year ended December 31, 2021.
8
CNL HEALTHCARE PROPERTIES, INC. AND SUBSIDIARIES
NOTES TO CONDENSED CONSOLIDATED FINANCIAL STATEMENTS
FOR THE QUARTER AND SIX MONTHS ENDED JUNE 30, 2022 (UNAUDITED)
2. Summary of Significant Accounting Policies (Continued)
The accompanying unaudited condensed consolidated financial statements include the Company’s accounts, the accounts of wholly owned subsidiaries or subsidiaries for which the Company has a controlling interest, the accounts of
Government Grant Income — On March 27, 2020, the Coronavirus Aid, Relief, and Economic Security Act (“CARES Act”) was signed into law which provided, among other things, for the establishment of a Provider Relief Fund under the direction of the Department of Health and Human Services (“HHS”). Provider relief funds received under the CARES Act are deemed governmental grants provided that the recipient attests to and complies with certain terms and conditions. Grant income is recognized upon receipt of provider relief funds and when all the conditions of the grant have been met. During the six months ended June 30, 2022 and 2021, the Company recorded approximately $
Risks and Uncertainties — In March 2020, the World Health Organization declared the outbreak of the novel coronavirus (“COVID-19”) as a pandemic around the globe. Since the onset of the pandemic, the Company has operated and continues to operate its communities through the disruptions and uncertainties of the pandemic, including disruptions from new variants of the virus. Although more normalized activities have resumed, at this time the Company cannot predict the full extent of the impacts of the COVID-19 pandemic on the Company and its operations, and the COVID-19 pandemic may continue to have a material and adverse impact on our financial condition, results of operations and cash flows.
Use of Estimates — The preparation of financial statements in conformity with U.S. GAAP requires management to make estimates and assumptions that affect the reported amounts of assets and liabilities as of the date of the consolidated financial statements, the reported amounts of revenues and expenses during the reporting periods and the disclosure of contingent liabilities. For example, significant assumptions are made in the analysis of real estate impairments, the valuation of contingent assets and liabilities, and the valuation of restricted common stock (“Restricted Stock”) shares issued to the Advisor. Accordingly, actual results could differ from those estimates.
Assets Held For Sale, net and Discontinued Operations — The Company determines to classify a property as held for sale once management has the authority to approve and commits to a plan to sell the property, the property is available for immediate sale, there is an active program to locate a buyer, the sale of the property is probable and the transfer of the property is expected to occur within one year. Upon the determination to classify a property as held for sale, the Company ceases recording further depreciation and amortization relating to the associated assets and those assets are measured at the lower of its carrying amount or fair value less disposition costs and are presented separately in the consolidated balance sheets for all periods presented. In addition, the Company classifies assets held for sale as discontinued operations if the disposal represents a strategic shift that has (or will have) a major effect on the Company’s operations and financial results. For any disposal(s) qualifying as discontinued operations, the Company allocates interest expense and loan cost amortization that directly relates to either: (1) expense on mortgages and other notes payable collateralized by properties classified as discontinued operations; or (2) expense on the Company’s Credit Facilities, which is allocated based on the value of the properties that are classified as discontinued operations since these properties are included in the Credit Facilities’ unencumbered pool of assets and the related indebtedness is required to be repaid upon sale of the properties.
Reclassifications — Certain amounts in the prior years’ consolidated balance sheet have been reclassified to conform to the current year’s presentation.
9
CNL HEALTHCARE PROPERTIES, INC. AND SUBSIDIARIES
NOTES TO CONDENSED CONSOLIDATED FINANCIAL STATEMENTS
FOR THE QUARTER AND SIX MONTHS ENDED JUNE 30, 2022 (UNAUDITED)
2. Summary of Significant Accounting Policies (Continued)
Recently Adopted Accounting Pronouncements — In Q1 2020, the FASB issued ASU 2020-04, “Reference Rate Reform (Topic 848): Facilitation of the Effects of Reference Rate Reform on Financial Reporting” (“ASU 2020-04”). ASU 2020-04 contains practical expedients for reference rate reform related activities that impact debt, leases, derivatives and other contracts. The guidance in ASU 2020-04 is optional and may be elected over time as reference rate reform activities occur. During the year ended December 31, 2020, the Company elected to apply the hedge accounting expedients related to probability and the assessments of effectiveness for future LIBOR-indexed cash flows to assume that the index upon which future hedged transactions will be based matches the index on the corresponding derivatives. Application of these expedients preserves the presentation of derivatives consistent with past presentation. As of June 30, 2022, the Company does not anticipate that this guidance will have a material impact on its consolidated financial statements; however, the Company will continue to assess the potential impact on its variable rate debt contracts and future hedging relationships, as applicable.
3. Revenue
The following table presents disaggregated revenue related to the Company’s resident fees and services during the quarter and six months ended June 30, 2022 and 2021:
|
|
Quarter Ended June 30, |
|
|||||||||||||||||||||
|
|
Number of |
|
|
Revenues |
|
|
Percentage |
|
|||||||||||||||
Resident fees and services: |
|
2022 |
|
|
2021 |
|
|
2022 |
|
|
2021 |
|
|
2022 |
|
|
2021 |
|
||||||
Independent living |
|
|
|
|
|
|
|
$ |
|
|
$ |
|
|
|
% |
|
|
% |
||||||
Assisted living |
|
|
|
|
|
|
|
|
|
|
|
|
|
|
% |
|
|
% |
||||||
Memory care |
|
|
|
|
|
|
|
|
|
|
|
|
|
|
% |
|
|
% |
||||||
Other revenues |
|
|
|
|
|
|
|
|
|
|
|
|
|
|
% |
|
|
% |
||||||
|
|
|
|
|
|
|
|
$ |
|
|
$ |
|
|
|
% |
|
|
% |
||||||
|
|
|
|
|
|
|
|
|
|
|
|
|
|
|
|
|
|
|
||||||
|
|
Six Months Ended June 30, |
|
|||||||||||||||||||||
|
|
Number of |
|
|
Revenues |
|
|
Percentage |
|
|||||||||||||||
Resident fees and services: |
|
2022 |
|
|
2021 |
|
|
2022 |
|
|
2021 |
|
|
2022 |
|
|
2021 |
|
||||||
Independent living |
|
|
|
|
|
|
|
$ |
|
|
$ |
|
|
|
% |
|
|
% |
||||||
Assisted living |
|
|
|
|
|
|
|
|
|
|
|
|
|
|
% |
|
|
% |
||||||
Memory care |
|
|
|
|
|
|
|
|
|
|
|
|
|
|
% |
|
|
% |
||||||
Other revenues |
|
|
|
|
|
|
|
|
|
|
|
|
|
|
% |
|
|
% |
||||||
|
|
|
|
|
|
|
|
$ |
|
|
$ |
|
|
|
% |
|
|
% |
||||||
10
CNL HEALTHCARE PROPERTIES, INC. AND SUBSIDIARIES
NOTES TO CONDENSED CONSOLIDATED FINANCIAL STATEMENTS
FOR THE QUARTER AND SIX MONTHS ENDED JUNE 30, 2022 (UNAUDITED)
4. Acquisition
As of December 31, 2021, the Company held an interest in five properties through a
As the Company previously held an equity method investment in the Windsor Manor Joint Venture, the acquisition resulted in a gain on change of control of a joint venture of approximately $
The following table summarizes the fair market value of the assets and liabilities recorded as part of the acquisition, adjusted on a relative fair value basis for the difference between the consideration transferred and the fair market value of the net assets acquired, of the Windsor Manor Joint Venture as of the acquisition date (in thousands):
Equity method investment in unconsolidated joint venture |
|
$ |
|
|
Consideration paid for additional 25% interest in joint venture |
|
|
|
|
Total equity method investment and consideration paid |
|
$ |
|
|
|
|
|
|
|
Cash |
|
$ |
|
|
Restricted Cash |
|
|
|
|
Prepaid and other assets |
|
|
|
|
Real estate assets |
|
|
|
|
Intangibles(1) |
|
|
|
|
Total assets acquired |
|
|
|
|
Accounts payable and accrued expenses |
|
|
( |
) |
Other liabilities |
|
|
( |
) |
Mortgages and notes payable |
|
|
( |
) |
Total liabilities assumed |
|
|
( |
) |
Net assets acquired |
|
$ |
|
|
_____________
FOOTNOTE:
5. Real Estate Assets, net
The gross carrying amount and accumulated depreciation of the Company’s real estate assets as of June 30, 2022 and December 31, 2021 are as follows, excluding the one asset held for sale (in thousands):
|
|
June 30, |
|
|
December 31, |
|
||
|
|
2022 |
|
|
2021 |
|
||
Land and land improvements |
|
$ |
|
|
$ |
|
||
Building and building improvements |
|
|
|
|
|
|
||
Furniture, fixtures and equipment |
|
|
|
|
|
|
||
Less: accumulated depreciation |
|
|
( |
) |
|
|
( |
) |
Real estate investment properties, net |
|
$ |
|
|
$ |
|
||
Depreciation expense on the Company’s real estate investment properties, net was approximately $
11
CNL HEALTHCARE PROPERTIES, INC. AND SUBSIDIARIES
NOTES TO CONDENSED CONSOLIDATED FINANCIAL STATEMENTS
FOR THE QUARTER AND SIX MONTHS ENDED JUNE 30, 2022 (UNAUDITED)
6. Asset Held For Sale and Discontinued Operations
In March 2022, the Company received an unsolicited offer and entered into a purchase and sale agreement for the Hurst Specialty Hospital with an unrelated third party and classified this property as held for sale as of December 31, 2021 in the accompanying condensed consolidated balance sheet. Assets held for sale consisted of real estate held for sale, net as of December 31, 2021. The Company sold this property in April 2022, received net sales proceeds of $
The sale of the Hurst Specialty Hospital did not cause a strategic shift in the Company's operations, and was not considered significant; therefore, this property did not qualify as discontinued operations. The Company did not have any properties for which it had classified the revenues and expenses as discontinued operations during the quarter and six months ended June 30, 2022.
During the six months ended June 30, 2021, the Company classified the revenues and expenses related to the Company’s acute care property sold in January 2021 as discontinued operations in the accompanying condensed consolidated statements of operations. This property was identified for sale as part of the plan to sell the MOB/Healthcare portfolio and the Company determined that the sale of these properties represented a strategic shift in the Company’s operations. The Company recorded a loss from discontinued operations of approximately $
7. Variable Interest Entities
As of June 30, 2022 and December 31, 2021, the Company had
12
CNL HEALTHCARE PROPERTIES, INC. AND SUBSIDIARIES
NOTES TO CONDENSED CONSOLIDATED FINANCIAL STATEMENTS
FOR THE QUARTER AND SIX MONTHS ENDED JUNE 30, 2022 (UNAUDITED)
8. Indebtedness
The following table provides details of the Company's indebtedness as of June 30, 2022 and December 31, 2021, (in thousands):
|
As of June 30, |
|
|
As of December 31, |
|
||
|
2022 |
|
|
2021 |
|
||
Mortgages payable and other notes payable: |
|
|
|
|
|
||
Fixed rate debt(1) |
$ |
|
|
$ |
|
||
Variable rate debt(1)(2)(6) |
|
|
|
|
|
||
Premium(3) |
|
|
|
|
|
||
Loan costs, net |
|
( |
) |
|
|
( |
) |
Total mortgages and other notes payable, net |
|
|
|
|
|
||
Credit facilities: |
|
|
|
|
|
||
Revolving Credit Facility(4)(5)(6) |
|
|
|
|
|
||
Term Loan Facility(4)(6) |
|
|
|
|
|
||
2021 Term Loan Facility(4)(6) |
|
|
|
|
|
||
Loan costs, net related to Term Loan Facilities |
|
( |
) |
|
|
( |
) |
Total credit facilities, net |
|
|
|
|
|
||
Total indebtedness, net |
$ |
|
|
$ |
|
||
_____________
FOOTNOTES:
In June 2022, the Company refinanced secured indebtedness of approximately $
The Company had liquidity of approximately $
13
CNL HEALTHCARE PROPERTIES, INC. AND SUBSIDIARIES
NOTES TO CONDENSED CONSOLIDATED FINANCIAL STATEMENTS
FOR THE QUARTER AND SIX MONTHS ENDED JUNE 30, 2022 (UNAUDITED)
8. Indebtedness (continued)
The following is a schedule of future principal payments for the Company’s total indebtedness for the remainder of 2022, each of the next four years and thereafter, in the aggregate, as of June 30, 2022 (in thousands):
2022 |
$ |
|
|
2023 |
|
|
|
2024 |
|
|
|
2025 |
|
— |
|
2026 |
|
— |
|
Thereafter |
|
— |
|
|
$ |
|
The following table provides the details of the fair market value and carrying value of the Company’s indebtedness as of June 30, 2022 and December 31, 2021 (in millions):
|
|
June 30, |
|
|
December 31, |
|
||||||||||
|
|
2022 |
|
|
2021 |
|
||||||||||
|
|
Fair |
|
|
Carrying |
|
|
Fair |
|
|
Carrying |
|
||||
Mortgages and other notes payable, net |
|
$ |
|
|
$ |
|
|
$ |
|
|
$ |
|
||||
Credit facilities, net |
|
$ |
|
|
$ |
|
|
$ |
|
|
$ |
|
||||
These fair market values are based on current rates and spreads the Company would expect to obtain for similar borrowings. Since this methodology includes inputs that are less observable by the public and are not necessarily reflected in active markets, the measurement of the estimated fair values related to the Company’s mortgage notes payable is categorized as Level 3 on the three-level valuation hierarchy.
Generally, the loan agreements for the Company’s mortgage loans contain customary financial covenants and ratios; including (but not limited to) the following: debt service coverage ratio, minimum occupancy levels, limitations on incurrence of additional indebtedness, etc. The loan agreements also contain customary events of default and remedies for the lenders. As of June 30, 2022, the Company was in compliance with all financial covenants related to its mortgage loans.
14
CNL HEALTHCARE PROPERTIES, INC. AND SUBSIDIARIES
NOTES TO CONDENSED CONSOLIDATED FINANCIAL STATEMENTS
FOR THE QUARTER AND SIX MONTHS ENDED JUNE 30, 2022 (UNAUDITED)
9. Related Party Arrangements
In May 2022, the Company extended its advisory agreement with the Advisor through June 2023.
The Company paid approximately $
The expenses and fees incurred by and reimbursable to the Company’s related parties, including amounts included in income from discontinued operations, for the quarter and six months ended June 30, 2022 and 2021, and related amounts unpaid as of June 30, 2022 and December 31, 2021 are as follows (in thousands):
|
|
Quarter Ended |
|
|
Six Months Ended |
|
|
Unpaid amounts as of (1) |
|
|||||||||||||||
|
|
June 30, |
|
|
June 30, |
|
|
June 30, |
|
|
December 31, |
|
||||||||||||
|
|
2022 |
|
|
2021 |
|
|
2022 |
|
|
2021 |
|
|
2022 |
|
|
2021 |
|
||||||
Reimbursable expenses: |
|
|
|
|
|
|
|
|
|
|
|
|
|
|
|
|
|
|
||||||
Operating expenses (2) |
|
$ |
|
|
$ |
|
|
$ |
|
|
$ |
|
|
$ |
|
|
$ |
|
||||||
|
|
|
|
|
|
|
|
|
|
|
|
|
|
|
|
|
|
|
||||||
|
|
|
|
|
|
|
|
|
|
|
|
|
|
|
|
|
|
|
||||||
Investment services fee (3) |
|
|
|
|
|
|
|
|
|
|
|
|
|
|
|
|
|
|||||||
Disposition fee (4) |
|
|
|
|
|
|
|
|
|
|
|
|
|
|
|
|
|
|
||||||
Asset management fees (5) |
|
|
|
|
|
|
|
|
|
|
|
|
|
|
|
|
|
|
||||||
|
|
$ |
|
|
$ |
|
|
$ |
|
|
$ |
|
|
$ |
|
|
$ |
|
||||||
_______________
FOOTNOTES:
10. Equity
In March 2022, the Board approved a reduction in the quarterly distribution rate to $
During the quarter and six months ended June 30, 2022, the Company declared cash distributions of approximately $
15
CNL HEALTHCARE PROPERTIES, INC. AND SUBSIDIARIES
NOTES TO CONDENSED CONSOLIDATED FINANCIAL STATEMENTS
FOR THE QUARTER AND SIX MONTHS ENDED JUNE 30, 2022 (UNAUDITED)
11. Income Taxes
The accompanying condensed consolidated financial statements include an interim tax provision for the quarter and six months ended June 30, 2022 and 2021. For the quarter and six months ended June 30, 2022, the Company recorded an income tax expense of approximately $
12. Commitments and Contingencies
From time to time, the Company may be a party to legal proceedings in the ordinary course of, or incidental to the normal course of, its business, including proceedings to enforce its contractual or statutory rights. While the Company cannot predict the outcome of these legal proceedings with certainty, based upon currently available information, the Company does not believe the final outcome of any pending or threatened legal proceeding will have a material adverse effect on its results of operations or financial condition.
As a result of the Company’s completed seniors housing developments continuing to move towards or achieving stabilization, the Company monitors the lease-up of these properties to determine whether the established performance metrics have been met as of each reporting period. As of June 30, 2022, the Company had
The Company’s Advisor has approximately
13. Subsequent Events
In July 2022, the Company entered into a purchase and sale agreement for the sale of its Fieldstone Memory Care and Fieldstone at Pear Orchard properties (the “Fieldstone Sale Agreement”) with an unrelated third party buyer for a gross sales price of $
16
Item 2. Management’s Discussion and Analysis of Financial Condition and Results of Operations
Caution Concerning Forward-Looking Statements
Statements contained under “Management’s Discussion and Analysis of Financial Condition and Results of Operations” and elsewhere in this Quarterly Report on Form 10-Q for the quarter and six months ended June 30, 2022 that are not statements of historical or current fact may constitute “forward-looking statements” within the meaning of the Federal Private Securities Litigation Reform Act of 1995. The Company intends that such forward-looking statements be subject to the safe harbor created by Section 21E of the Securities Exchange Act of 1934, as amended (the “Exchange Act”). Forward-looking statements are statements that do not relate strictly to historical or current facts, but reflect management’s current understandings, intentions, beliefs, plans, expectations, assumptions and/or predictions regarding the future of the Company’s business and its performance, the economy, and other future conditions and forecasts of future events and circumstances. Forward-looking statements are typically identified by words such as “believes,” “expects,” “anticipates,” “intends,” “estimates,” “plans,” “continues,” “may,” “will,” “seeks,” “should,” and “could” and words and terms of similar substance in connection with discussions of future operating or financial performance, business strategy and portfolios, projected growth prospects, cash flows, costs and financing needs, legal proceedings, amount and timing of anticipated future distributions, estimated net asset value per share of the Company’s common stock, and/or other matters. The Company’s forward-looking statements are not guarantees of future performance. While the Company’s management believes its forward-looking statements are reasonable, such statements are inherently susceptible to uncertainty and changes in circumstances. As with any projection or forecast, forward-looking statements are necessarily dependent on assumptions, data and/or methods that may be incorrect or imprecise, and may not be realized. The Company’s forward-looking statements are based on management’s current expectations and a variety of risks, uncertainties and other factors, many of which are beyond the Company’s ability to control or accurately predict. Although the Company believes that the expectations reflected in such forward-looking statements are based upon reasonable assumptions, the Company’s actual results could differ materially from those set forth in the forward-looking statements due to a variety of risks, uncertainties and other factors.
Important factors that could cause the Company's actual results to vary materially from those expressed or implied in its forward-looking statements include, but are not limited to government regulation, economic, strategic, political and social conditions and the following:
17
Given these uncertainties, the Company cautions you not to place undue reliance on forward-looking information.
For further information regarding risks and uncertainties associated with the Company’s business and other important factors that could cause the Company’s actual results to vary materially from those expressed or implied in its forward-looking statements, please refer to the factors listed and described in the Company’s reports filed from time to time with the SEC, including, but not limited to, the Company’s quarterly reports on Form 10-Q and the Company’s annual reports on Form 10-K, copies of which may be obtained from the Company’s website at www.cnlhealthcareproperties.com. One of the most significant factors is the ongoing and potential impact of the current outbreak of the COVID-19 pandemic on the economy and the broader financial markets, which may have a significant negative impact on the Company’s financial condition, results of operations and cash flows. The Company is unable to predict whether the continuing effects of the COVID-19 pandemic will trigger a further economic slowdown or a recession and to what extent the Company will experience disruptions related to the COVID-19 pandemic in the third quarter of 2022 or thereafter.
18
All written and oral forward-looking statements attributable to the Company or persons acting on its behalf are qualified in their entirety by this cautionary note. Forward-looking statements speak only as of the date on which they are made, and the Company undertakes no obligation to, and expressly disclaims any obligation to, publicly release the results of any revisions to its forward-looking statements to reflect new information, changed assumptions, the occurrence of unanticipated subsequent events or circumstances, or changes to future operating results over time, except as otherwise required by law.
Introduction
The following discussion is based on the condensed consolidated financial statements as of June 30, 2022 (unaudited) and December 31, 2021. Amounts as of December 31, 2021 included in the unaudited condensed consolidated balance sheets have been derived from the audited consolidated financial statements as of that date. This information should be read in conjunction with the accompanying unaudited condensed consolidated balance sheets and the notes thereto, as well as the audited consolidated financial statements, notes and management’s discussion and analysis included in our Annual Report on Form 10-K for the year ended December 31, 2021.
Overview
CNL Healthcare Properties, Inc. is a Maryland corporation that elected to be taxed as a REIT for U.S. federal income tax purposes. We have and intend to continue to be organized and operate in a manner that allows us to remain qualified as a REIT for federal income tax purposes. The terms “us,” “we,” “our,” “Company” and “CNL Healthcare Properties” include CNL Healthcare Properties, Inc. and each of its subsidiaries.
Substantially all of our assets are held by, and all operations are conducted, either directly or indirectly, through: (1) the Operating Partnership in which we are the sole limited partner and our wholly owned subsidiary, CHP GP, LLC, is the sole general partner; (2) a wholly owned TRS, CHP TRS Holding, Inc.; (3) property owner subsidiaries and lender subsidiaries, which are single purpose entities; and (4) investments in joint ventures.
We are externally managed and advised by CNL Healthcare Corp. (the “Advisor”). Our Advisor has responsibility for our day-to-day operations, serving as our consultant in connection with policy decisions to be made by our board of directors, and for identifying, recommending and executing on Possible Strategic Alternatives (as described below under “Possible Strategic Alternatives”), and dispositions on our behalf pursuant to an advisory agreement. For additional information on our Advisor, its affiliates or other related parties, as well as the fees and reimbursements we pay, see Note 9. “Related Party Arrangements.”
As of June 30, 2022, our seniors housing investment portfolio consisted of interests in 72 properties, consisting of a geographically diversified portfolio of 71 seniors housing communities and one vacant land parcel. The types of seniors housing properties that we own include independent and assisted living facilities, continuing care retirement communities and Alzheimer’s/memory care facilities. Five of our 71 seniors housing properties were previously owned through an unconsolidated joint venture and became wholly-owned effective January 1, 2022.
Market Conditions
During the last half of 2021, we continued to experience the operational impacts of a challenging labor market. Labor costs increased at an accelerated rate during the last half of 2021 due to increases throughout all wage classifications within our communities and an increased focus on attracting and retaining staff at our communities. The “great resignation” resulted in an increase in the number of vacant positions at our communities and COVID-19 staff infections contributed to staff absences due to quarantine requirements under CDC guidelines. These factors led to an increase in the usage of temporary agency labor which led to incremental, measurable labor costs beginning in the middle of 2021. During 2022, we have begun to slowly reduce our reliance on agency labor as a result of hiring and filling some of the vacant staff roles as well as a decline in absences from lower COVID staff infections and more relaxed CDC quarantine requirements. However, we expect that historically low unemployment rates, wage pressures, overtime pay and continued reliance on temporary agency labor will result in higher labor costs and lower NOI margins during the rest of 2022.
19
During 2021, we began to experience the impact of higher inflation levels in the form of higher food costs and virtually all other operating expenses. This has contributed and continues to contribute to property NOI margin compressions in our managed seniors housing communities. We anticipate that operating expenses will continue to increase which will result in continued operating margin compressions during the remainder of 2022.
Macro-economic and geo political events around the globe have contributed to volatile credit markets. As part of its effort to reduce the rising levels of inflation, the Federal Reserve enacted several interest rate hikes during 2022 and projects additional rate increases during the rest of 2022. The interest rate increases to date and any further interest rate increases during 2022 will contribute to higher interest expense on our variable rate debt. We have purchased interest rate caps for interest rate protection on a portion of our unhedged variable rate debt and continue to monitor opportunities to further protect the remaining variable rate debt.
COVID-19
In March 2020, the World Health Organization declared the outbreak of the novel coronavirus (“COVID-19”) as a pandemic around the globe. Throughout 2020 and 2021, we operated our communities through the disruptions and uncertainties of the pandemic, including disruptions from new variants of the virus. Average occupancy began to decline at the onset of the pandemic starting in the second half of March 2020 and trended lower through February 2021. Starting in March 2021, we began to experience small occupancy gains each month as vaccines became available and regulatory move-in restrictions were lifted or relaxed. The positive marginal occupancy gains have continued through 2022 and have resulted in increases in resident fees and revenues. Absent the arrival of a new variant of the virus, we anticipate continued marginal occupancy improvements each month during the year ending December 31, 2022.
As of June 30, 2022, our 71 seniors housing communities were located throughout the United States in 26 states, and had a population of nearly 7,000 residents and approximately 4,700 community-level staff.
Of our 71 senior housing communities, we owned 15 properties (leased to two separate third party tenants under triple-net leases (“NNN”), and the remaining 56 properties were managed through third party operators. In December 2021, we provided a second round of rent relief in the form of a $1.4 million rent deferral agreement with a tenant that leases two properties under NNN leases. We did not grant any rent concessions as part of any rent deferral provided to this tenant. As of August 11, 2022, we had deferred $1.4 million in rents under the second rent deferral agreement and had collected all other amounts due in accordance with the terms of the tenant's lease agreements. As of August 11, 2022, had collected 100% of all rental amounts due under the lease agreements related to 13 seniors housing properties leased to our other tenant under NNN leases.
Since March 13, 2020, there have been a number of federal, state and local government initiatives to manage the spread of the virus and its impact on the economy, financial markets and continuity of businesses of all sizes and industries. On March 27, 2020, the Coronavirus Aid, Relief, and Economic Security Act (“CARES Act”) was signed into law which provided, among other things, for the establishment of a Provider Relief Fund under the direction of the Department of Health and Human Services (“HHS”). During the six months ended June 30, 2022 and 2021, we received provider relief funds under the CARES Act, which are deemed governmental grants provided that the recipient attests to and complies with certain terms and conditions, and we recorded approximately $3.9 million and $0.4 million, as other income in the accompanying condensed consolidated statements of operations as all conditions of the grant had been met.
We believe we have taken appropriate actions to manage through the COVID-19 pandemic. Although more normalized activities have resumed, we maintain focus on improving occupancy at the communities which will lead to a positive impact on our financial condition, results of operations and cash flows.
20
Possible Strategic Alternatives
In 2017, we began evaluating possible strategic alternatives to provide liquidity to our stockholders. In April 2018, our board of directors formed a special committee consisting solely of our independent directors (“Special Committee”) to consider possible strategic alternatives, including, but not limited to: (i) the listing of our or one of our subsidiaries’ common stock on a national securities exchange; (ii) an orderly disposition of our assets or one or more of our asset classes and the distribution of the net sale proceeds thereof to our stockholders; and (iii) a potential business combination or other transaction with a third party or parties that provides our stockholders with cash and/or securities of a publicly traded company (collectively, among other options, “Possible Strategic Alternatives”). Since 2018, the Special Committee has engaged KeyBanc Capital Markets Inc. to act as its financial advisor in connection with exploring our Possible Strategic Alternatives.
In connection with our consideration of the Possible Strategic Alternatives, our board of directors suspended both our Reinvestment Plan and our Redemption Plan effective July 11, 2018. In addition, as part of executing on Possible Strategic Alternatives, our board of directors committed to a plan to sell 70 properties which included medical office buildings, post-acute care facilities and acute care hospitals across the US), collectively (the “MOB/Healthcare Portfolio”) plus several skilled nursing facilities. Through December 31, 2021, we sold 69 properties, received net sales proceeds of approximately $1.4497 billion and used the net sales proceeds to: (1) repay indebtedness secured by the properties; (2) strategically rebalance other corporate borrowings; (3) make a special cash distribution in May 2019 of approximately $347.9 million (or $2.00 per share) to our stockholders and (4) retained net sales proceeds for other corporate purposes, because we were focused on maintaining balance sheet strength and liquidity during COVID-19 to enhance financial flexibility. In March 2022, we entered into a purchase and sale agreement for the last property in our MOB/Healthcare Portfolio, the Hurst Specialty Hospital, with an unrelated third party and in April 2022, sold it and received net sales proceeds of $8.3 million.
During the year ended December 31, 2020, we shifted our focus away from the pursuit of larger strategic alternatives to provide further liquidity to our stockholders due to the market and industry disruptions in the seniors housing sector from COVID-19. However, our Special Committee continued working and continues to work with our financial advisor to carefully study market data and pursue potential options to determine suitable liquidity alternatives that are in the best interests of all of our stockholders.
Seniors Housing Portfolio
Our remaining investment focus is in seniors housing communities. We have invested in or developed the following types of seniors housing properties:
Independent Living Facilities. Independent living facilities are age-restricted, multi-family rental or ownership (condominium) housing with central dining facilities that provide residents, as part of a monthly fee, meals and other services such as housekeeping, linen service, transportation, social and recreational activities.
Assisted Living Facilities. Assisted living facilities are usually state-regulated rental properties that provide the same services as independent living facilities, but also provide, in a majority of the units, supportive care from trained employees to residents who are unable to live independently and require assistance with activities of daily living. The additional services may include assistance with bathing, dressing, eating, and administering medications.
Memory Care/Alzheimer’s Facilities. Those suffering from the effects of Alzheimer’s disease or other forms of memory loss need specialized care. Memory care/Alzheimer’s centers provide the specialized care for this population including residential housing and assistance with the activities of daily living.
Portfolio Overview
As of June 30, 2022, our healthcare investment portfolio consisted of interests in 72 properties, comprising 71 seniors housing communities and one vacant land parcel. We completed the sale of two seniors housing managed properties in August 2022.
21
We believe demographic trends and compelling supply and demand indicators present a strong case for an investment focus on seniors housing real estate and real estate-related assets. Our seniors housing investment portfolio is geographically diversified with properties in 26 states. The map below shows our seniors housing investment portfolio across geographic regions as of August 11, 2022:
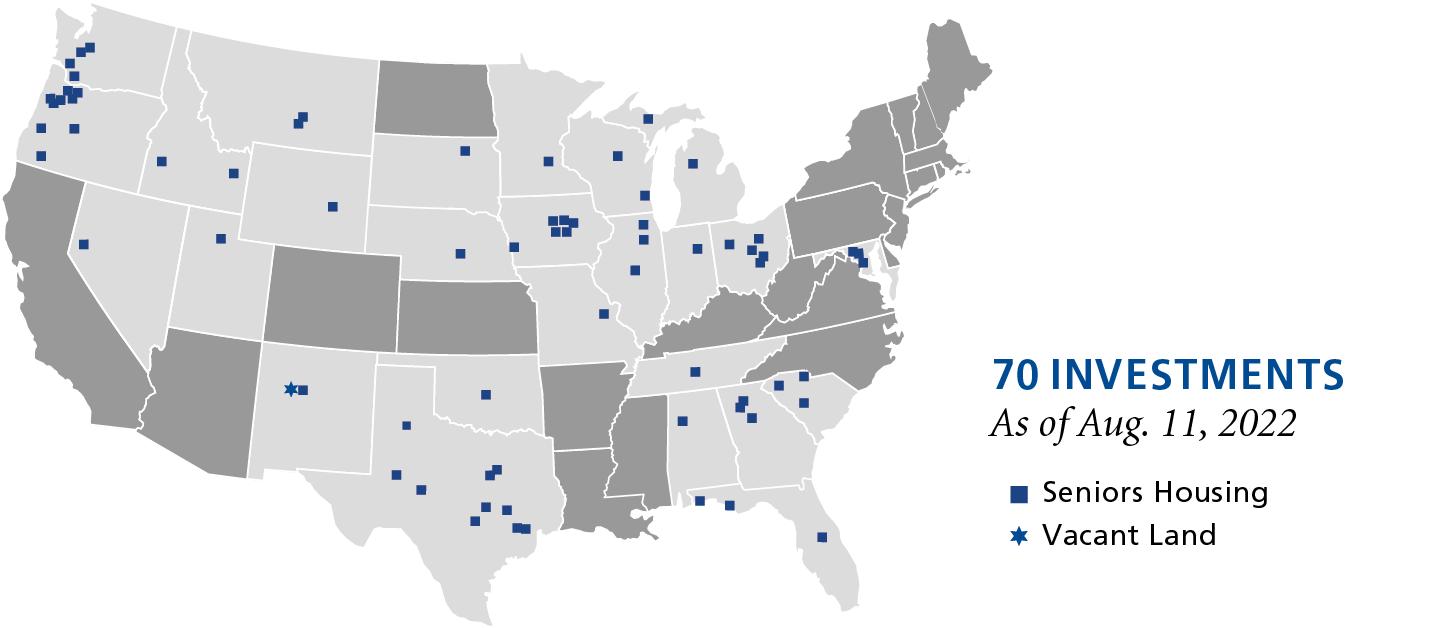
The following table summarizes our seniors housing investment portfolio by investment structure as of August 11, 2022:
Type of Investment |
|
Number of |
|
|
Amount of |
|
|
Percentage |
|
|||
Consolidated investments: |
|
|
|
|
|
|
|
|
|
|||
Seniors housing leased (1) |
|
|
15 |
|
|
$ |
311.0 |
|
|
|
17.8 |
% |
Seniors housing managed (2) |
|
|
54 |
|
|
|
1,427.6 |
|
|
|
82.1 |
% |
Vacant land |
|
|
1 |
|
|
|
1.1 |
|
|
|
0.1 |
% |
|
|
|
70 |
|
|
$ |
1,739.7 |
|
|
|
100.0 |
% |
_____________
FOOTNOTES:
Portfolio Evaluation
While we are not directly impacted by the performance of the underlying properties leased to third-party tenants, we believe that the financial and operational performance of our tenants provides an indication about the stability of our tenants and their ability to pay rent. To the extent that our tenants, managers or joint venture partners experience operating difficulties and become unable to generate sufficient cash to make rent payments to us, there could be a material adverse impact on our consolidated results of operations, liquidity and/or financial condition. Our tenants and managers are generally contractually required to provide this information to us in accordance with their respective lease, management and/or joint venture agreements. Therefore, in order to mitigate the aforementioned risk, we monitor our investments through a variety of methods determined by the type of property.
We monitor the credit of our tenants to stay abreast of any material changes in credit quality. We monitor credit quality by (1) reviewing financial statements that are publicly available or that are required to be delivered to us under the applicable lease, (2) direct interaction with onsite property managers, (3) monitoring news and rating agency reports regarding our tenants (or their parent companies) and their underlying businesses, (4) monitoring the timeliness of rent collections and (5) monitoring lease coverage.
22
When evaluating the performance of our seniors housing portfolio, management reviews property-level operating performance versus budgeted expectations, conducts periodic operational review calls with operators and conducts periodic property inspections or site visits. Management also reviews occupancy levels and monthly revenue per occupied unit, which we define as total revenue divided by average number of occupied units. Similarly, when evaluating the performance of our third-party operators, management reviews monthly financial statements, property-level operating performance versus budgeted expectations, conducts periodic operational review calls with operators and conducts periodic property inspections or site visits. All of the aforementioned operating and statistical metrics assist us in determining the ability of our properties or operators to achieve market rental rates, to assess the overall performance of our diversified healthcare portfolio, and to review compliance with leases, debt, licensure, real estate taxes, and other collateral.
Significant Tenants and Operators
Our real estate portfolio of 69 seniors housing properties is operated by a mix of national or regional operators and the following represent the significant tenants and operators that lease or manage 10% or more of our rentable space as of August 11, 2022, excluding the vacant land parcel:
Tenants |
|
Number of |
|
Rentable |
|
|
Percentage |
|
|
Lease |
||
TSMM Management, LLC |
|
13 |
|
|
1,261 |
|
|
|
77.5 |
% |
|
2025 |
Wellmore, LLC |
|
2 |
|
|
366 |
|
|
|
22.5 |
% |
|
2031-2032 |
|
|
15 |
|
|
1,627 |
|
|
|
100.0 |
% |
|
|
|
|
|
|
|
|
|
|
|
|
|
||
Operators |
|
Number of |
|
Rentable |
|
|
Percentage |
|
|
Operator |
||
Integrated Senior Living, LLC |
|
7 |
|
|
1,948 |
|
|
|
30.8 |
% |
|
2023-2024 |
Prestige Senior Living, LLC |
|
13 |
|
|
895 |
|
|
|
14.2 |
% |
|
2023-2024 |
Morningstar Senior Management, LLC |
|
4 |
|
|
834 |
|
|
|
13.2 |
% |
|
2023 |
Other operators (1) |
|
30 |
|
|
2,645 |
|
|
|
41.8 |
% |
|
2022-2029 |
|
|
54 |
|
|
6,322 |
|
|
|
100.0 |
% |
|
|
_________________
FOOTNOTE:
Tenant Lease Expirations
As of June 30, 2022, we owned 15 seniors housing properties that were leased to third party tenants under triple-net operating leases. During the six months ended June 30, 2022, our rental income from continuing operations represented approximately 8.5% of our total revenues from continuing operations.
Under the terms of our triple-net lease agreements, each tenant is responsible for payment of property taxes, general liability insurance, utilities, repairs and maintenance, including structural and roof expenses. Each tenant is expected to pay real estate taxes directly to the taxing authorities. However, if the tenant does not pay the real estate taxes, we are liable.
We work with our tenants in advance of the lease expirations or renewal period options in order for us to maintain a balanced lease rollover schedule and high occupancy levels, as well as to enhance the value of our properties through extended lease terms. Certain amendments or modifications to the terms of existing leases could require lender approval.
The following table lists, on an aggregate basis, scheduled expirations for the remainder of 2022, each of the next nine years and thereafter on our consolidated seniors housing portfolio, assuming that none of the tenants exercise any of their renewal options (in thousands, except for number of properties and percentages):
23
Year of Expiration (1) |
|
Number of |
|
|
Expiring |
|
|
|
Expiring |
|
|
Percentage |
|
||||
2022 |
|
|
— |
|
|
|
— |
|
|
|
$ |
— |
|
|
|
— |
|
2023 |
|
|
— |
|
|
|
— |
|
|
|
|
— |
|
|
|
— |
|
2024 |
|
|
— |
|
|
|
— |
|
|
|
|
— |
|
|
|
— |
|
2025 |
|
|
13 |
|
|
|
1,261 |
|
|
|
|
17,864 |
|
|
|
68.7 |
% |
2026 |
|
|
— |
|
|
|
— |
|
|
|
|
— |
|
|
|
— |
|
2027 |
|
|
— |
|
|
|
— |
|
|
|
|
— |
|
|
|
— |
|
2028 |
|
|
— |
|
|
|
— |
|
|
|
|
— |
|
|
|
— |
|
2029 |
|
|
— |
|
|
|
— |
|
|
|
|
— |
|
|
|
— |
|
2030 |
|
|
— |
|
|
|
— |
|
|
|
|
— |
|
|
|
— |
|
2031 |
|
|
1 |
|
|
|
137 |
|
|
|
|
3,497 |
|
|
|
13.4 |
% |
Thereafter |
|
|
1 |
|
|
|
229 |
|
|
|
|
4,653 |
|
|
|
17.9 |
% |
Total |
|
|
15 |
|
|
|
1,627 |
|
|
|
$ |
26,014 |
|
|
|
100.0 |
% |
|
|
|
|
|
|
|
|
|
|
|
|
|
|
||||
Weighted Average Remaining Lease Term: (3) |
|
|
|
5.2 years |
|
|
|
|
|||||||||
_________________
FOOTNOTES:
Liquidity and Capital Resources
General
Our ongoing primary source of capital includes proceeds from operating cash flows. Our primary use of capital includes the payment of distributions, payment of operating expenses, funding capital improvements to existing properties and payment of debt service. Generally, we expect to meet short-term working capital needs from our cash flows from operations. Our ongoing sources and uses of capital have been and will continue to be impacted by the COVID-19 pandemic, rising interest rates and rising inflation levels. As necessary, we may use financings or other sources of capital in the event of unforeseen significant capital expenditures or to cover periodic shortfalls between distributions paid and cash flows from operating activities.
Despite the marginal increases in occupancy beginning in March 2021 as described above in “COVID-19”, we began to experience and we continue to experience higher than anticipated compression in property level NOI margins due to increases in operating expenses. Labor costs increased due to increased wages in a tight labor market and due to increases in usage of agency temporary personnel to fill vacancies. The impact of rising inflation levels surfaced in the form of higher food costs and other operating expenses, which also contributed to margin compressions. We have begun implementing rate increases at our properties effective with renewals in 2022 which have resulted and will result in an increase in revenues. We anticipate that the rental rate increases will contribute favorably to operating margins. However, we anticipate incurring increases in labor costs and operating expenses which will result in continued operating margin compressions during the remainder of the year ending December 31, 2022.
As of June 30, 2022, we had approximately $146.5 million of liquidity (consisting of $65.8 million cash on hand and $80.7 million undrawn availability under the Revolving Credit Facility). We remain focused on maintaining liquidity and financial flexibility and continue to monitor developments as we continue to recover from the disruptions in occupancy from COVID-19, continue to navigate through rising labor costs during a tight labor market, increased operating expenses from the rise in inflation levels and the increase in interest costs from a rising interest rate environment. The extent of the continued impact of COVID-19, a tight labor market, inflation, the volatility in the credit markets and a rising interest rate environment on our financial condition, results of operations and cash flows is uncertain and cannot be predicted at the current time as it depends on the timing and speed of economic recovery.
24
We have pledged certain of our properties in connection with our borrowings and may continue to strategically leverage our real estate and use debt financing as a means of providing additional funds for the payment of distributions to stockholders, working capital and for other corporate purposes. Our ability to increase our borrowings could be adversely affected by credit market conditions, inflation and rising interest rates, which could result in lenders reducing or limiting funds available for loans, including loans collateralized by real estate. We may also be negatively impacted by rising interest rates on our unhedged variable rate debt or the timing of when we seek to refinance existing debt. In addition, we continue to monitor the credit markets and continue to evaluate the need for additional interest rate protection in the form of interest rate swaps or caps on unhedged variable rate debt.
Our cash flows from operating and investing activities as described within “Sources of Liquidity and Capital Resources” and “Uses of Liquidity and Capital Resources” represent cash flows from continuing operations and exclude the results of one property that was classified as discontinued operations, which was sold in January 2021.
Sources of Liquidity and Capital Resources
Proceeds from Sale of Real Estate – Continuing Operations
During the six months ended June 30, 2022, we closed on the sale of the Hurst Specialty Hospital and received net sales proceeds of approximately $8.3 million. During the six months ended June 30, 2021, we did not sell any properties from continuing operations. As described in Note 13. “Subsequent Events”, in July 2022, we entered into a purchase and sale agreement for the sale of two seniors housing communities with an unrelated third party buyer for a gross sales price of $29.5 million. We completed the sale of these two properties in August 2022 and will use the net sales proceeds for corporate purposes.
Proceeds from Sale of Real Estate – Discontinued Operations
As part of executing under our Possible Strategic Alternatives, during the six months ended June 30, 2021, we closed on the sale of one acute care property and received net sales proceeds of approximately $7.4 million. During the six months ended June 30, 2022, we did not sell any properties classified as discontinued operations.
Borrowings
In June 2022, we borrowed $45.0 million from our Revolving Credit Facility to refinance approximately $44.5 million of secured indebtedness in advance of its September 2022 maturity. There were no borrowings during the six months ended June 30, 2021. See “Liquidity and Capital Resources – Uses of Liquidity and Capital Resources – Debt Repayments” below for additional information regarding debt repayments during the six months ended June 30, 2022.
We may borrow money to fund enhancements to our portfolio, as well as to cover periodic shortfalls between distributions paid and cash flows from operating activities to the extent impacted by compressed property NOI margins from rising labor and inflationary pressures on other operating expenses and an increased interest rate environment.
Net Cash Provided by Operating Activities – Continuing Operations
Cash flows from operating activities for the six months ended June 30, 2022 and 2021 were approximately $24.1 million and $24.2 million, respectively. The change in cash flows from operating activities for the six months ended June 30, 2022 as compared to the same period in 2021 was primarily the result of the following:
25
Lease Renewals and Extensions
We entered into new leases covering five of our properties that expired in February 2022. The new leases with the same tenant commenced in February 2022 and will expire in February 2025. We do not have any leases expiring until 2025.
Tenant Financial Difficulties
The tenant of the Hurst Specialty property had experienced financial difficulties and we recorded rental income on a cash basis for this tenant because we previously assessed that collectability of lease payments was not probable. During the six months ended June 30, 2021, we collected $0.5 million in rental amounts from the tenant and we paid real estate taxes related to the Hurst Specialty Hospital of approximately $0.2 million which were not reimbursed by the tenant. We did not collect any rental income and we did not pay any real estate taxes during the six months ended June 30, 2022. We sold our Hurst Specialty Hospital in April 2022.
Uses of Liquidity and Capital Resources
Purchase of Joint Venture Interest
As of December 31, 2021, we indirectly owned five properties through a 75% interest in the Windsor Manor Joint Venture, an unconsolidated equity method investment. Effective January 1, 2022, we acquired the remaining 25% interest from our joint venture partner who wanted to sell its 25% interest in the joint venture, for approximately $3.3 million and we currently own a 100% controlling interest in the Windsor Manor Joint Venture.
Capital Expenditures
We paid approximately $8.2 million and $3.9 million in capital expenditures during the six months ended June 30, 2022 and 2021, respectively. We have increased our investment in capital improvements to maintain and improve our properties.
Debt Repayments
During the six months ended June 30, 2022, we paid approximately $45.6 million, which included $1.1 million of scheduled repayments on our mortgages and other notes payable and the June 2022 refinance of approximately $44.5 million of secured indebtedness, consisting of debt collateralized by five properties, in advance of its scheduled maturity of September 2022. We added the five properties to the borrowing base of our unsecured Credit Facilities and used $45.0 million from amounts available under the Revolving Credit Facility to repay our secured indebtedness. During the six months ended June 30, 2021, we paid approximately $5.6 million of scheduled repayments on our mortgages and other notes payable.
26
The following is a schedule of future principal payments for our total indebtedness for the remainder of 2022, each of the next four years and thereafter, in the aggregate, as of June 30, 2022 (in thousands) and reflects the $18 million of indebtedness relating to the Windsor Manor Joint Venture in which we own a 100% controlling interest effective as of January 1, 2022:
2022 |
$ |
664 |
|
2023 |
|
157,054 |
|
2024 |
|
452,887 |
|
2025 |
|
— |
|
2026 |
|
— |
|
Thereafter |
|
— |
|
|
$ |
610,605 |
|
As of June 30, 2022, we had approximately $146.5 million of liquidity (consisting of $65.8 million of cash on hand and $80.7 million available under the Revolving Credit Facility) and were well positioned to manage our near-term debt maturities. We have $0.7 million of scheduled payments coming due during the rest of 2022 and in May 2023, the $133 million outstanding under our Revolving Credit Facility will become due. We plan to exercise the one-year extension option which will extend the maturity date to May 2024. We also have a mortgage note of approximately $22.6 million maturing in June 2023, collateralized by one property. Options for this maturing debt include but are not limited to, refinancing the facility with the existing lender or another lending institution as a secured loan facility, liquidating the property to satisfy the obligation, or adding the property to our existing Credit Facilities and repaying the balance with a draw on the Revolving Credit Facility. We will begin discussions with our lender later in 2022 about repayment or refinancing options upon maturity.
On an ongoing basis, we monitor our debt maturities, engage in dialogue with third-party lenders about various financing scenarios and analyze our overall portfolio borrowings in advance of scheduled maturity dates of the debt obligations to determine the optimal borrowing strategy.
The aggregate amount of long-term financing is not expected to exceed 60% of our gross asset values (as defined in our Credit Facilities) on an annual basis. As of June 30, 2022 and December 31, 2021, we had aggregate debt leverage ratios of approximately 32.0% and 31.8%, respectively, of the aggregate carrying value of our assets.
Generally, the loan agreements for our mortgage loans contain customary financial covenants and ratios; including (but not limited to) the following: debt service coverage ratio, minimum occupancy levels, limitations on incurrence of additional indebtedness, etc. The loan agreements also contain customary performance criteria and remedies for the lenders. As of June 30, 2022, we were in compliance with all financial covenants related to our mortgage loans.
The Credit Facilities contain affirmative, negative, and financial covenants which are customary for loans of this type, including (but not limited to): (i) maximum leverage, (ii) minimum fixed charge coverage ratio, (iii) minimum consolidated net worth, (iv) restrictions on payments of cash distributions except if required by REIT requirements, (v) maximum secured indebtedness, (vi) maximum secured recourse debt, (vii) minimum unsecured interest coverage, (viii) maximum unsecured indebtedness ratio and (ix) limitations on certain types of investments and with respect to the pool of properties supporting borrowings under the credit facilities, minimum weighted average occupancy, and remaining lease terms, as well as property type, MSA, operator, and asset value concentration limits. The limitations on distributions generally include a limitation on the extent of allowable distributions, which are not to exceed the greater of 95% of adjusted FFO (as defined per the credit facilities) and the minimum amount of distributions required to maintain the Company’s REIT status. As of June 30, 2022, we were in compliance with all financial covenants related to our Credit Facilities.
27
Distributions
In order to qualify as a REIT, we are required to make distributions, other than capital gain distributions, to our stockholders each year in the amount of at least 90% of our taxable income. We may make distributions in the form of cash or other property, including distributions of our own securities. While we generally expect to pay distributions from cash flows provided by operating activities, we have and may continue to cover periodic shortfalls between distributions paid and cash flows from operating activities with proceeds from other sources; such as from cash flows provided by financing activities, a component of which could include borrowings, whether collateralized by our properties or unsecured, or net sales proceeds from the sale of real estate.
In March 2022, our board of directors reduced our quarterly distributions to $0.0256 per share effective with the first quarter 2022 distribution. The decrease in the quarterly distribution rate was the result of various factors including, without limitation, the continued COVID-19 impact on industry performance, inflation rates and volatility in the credit markets. Our management team and our board of directors will continue to monitor our results of operations and operating cash flows, as well as our strategic alternatives process and make no assurances regarding future quarterly cash distributions.
The following table represents total cash distributions declared, distributions reinvested and cash distributions per share for the quarter and six months ended June 30, 2022 and 2021 (in thousands, except per share data):
Periods |
|
Cash |
|
|
Total Cash |
|
|
Cash Flows |
|
|||
2022 Quarters |
|
|
|
|
|
|
|
|
|
|||
First(3) |
|
$ |
0.02560 |
|
|
$ |
4,453 |
|
|
$ |
8,236 |
|
Second |
|
|
0.02560 |
|
|
|
4,453 |
|
|
|
15,840 |
|
Total |
|
$ |
0.05120 |
|
|
$ |
8,906 |
|
|
$ |
24,076 |
|
|
|
|
|
|
|
|
|
|
|
|||
2021 Quarters |
|
|
|
|
|
|
|
|
|
|||
First |
|
$ |
0.05120 |
|
|
$ |
8,907 |
|
|
$ |
12,633 |
|
Second |
|
|
0.05120 |
|
|
|
8,906 |
|
|
|
11,560 |
|
Total |
|
$ |
0.10240 |
|
|
$ |
17,813 |
|
|
$ |
24,193 |
|
_________________
FOOTNOTES:
Results of Operations
Except for the impact of lower occupancy from the COVID-19 pandemic, rising labor costs, rising inflation levels and a rising interest rate environment, we are not aware of other material trends or uncertainties, favorable or unfavorable, that may be reasonably anticipated to have a material impact on either capital resources or the revenues or income to be derived from the operation of properties, other than those referred to in the risk factors identified in “Part II, Item 1A” of this report and the “Risk Factors” section of our Annual Report.
The following discussion and analysis should be read in conjunction with the accompanying unaudited condensed consolidated financial statements and the notes thereto.
28
Quarter and six months ended June 30, 2022 as compared to the quarter and six months ended June 30, 2021
As of June 30, 2022, excluding our vacant land and including the five properties consolidated from the Windsor Manor Joint Venture effective January 1, 2022, we owned 71 consolidated operating investment properties and owned 67 properties as of June 30, 2021.
|
|
Investment count as of June 30, |
|
|||||
Consolidated operating investment types: |
|
2022 |
|
|
2021 |
|
||
Seniors housing leased |
|
|
15 |
|
|
|
15 |
|
Seniors housing managed |
|
|
56 |
|
|
|
51 |
|
Acute care leased |
|
|
— |
|
|
|
1 |
|
|
|
|
71 |
|
|
|
67 |
|
Rental Income and Related Revenues. Rental income and related revenues were approximately $6.7 million and $13.6 million and for the quarter and six months ended June 30, 2022, respectively, as compared to approximately $7.5 million and $14.7 million for the quarter and six months ended June 30, 2021, respectively. The decrease in revenue during the quarter and six months ended June 30, 2022 as compared to the quarter and six months ended June 30, 2021 was primarily due to reduced rent related to new leases at five seniors housing properties, as well as the sale of Hurst Specialty Hospital in April 2022. Rental income and related revenues will be lower going forward, as compared to the previous period, due to the reduced rent relating to the five seniors housing properties and the sale of the Hurst Specialty Hospital.
Resident Fees and Services. Resident fees and services income was approximately $74.3 million and $146.1 million for the quarter and six months ended June 30, 2022, respectively, as compared to approximately $65.9 million and $130.7 million for the quarter and six months ended June 30, 2021, respectively. The increase in revenue during the quarter and six months ended June 30, 2022 as compared to the six months ended June 30, 2021 was primarily due to an increase in average occupancy and increases in rates charged to our residents. Average occupancy was lower during the six months ended June 30, 2021 due to move-in restrictions, intensified screening and other measures enacted at our communities to address the spread of COVID-19. The increase in resident fees and services was also partially due to the acquisition of the remaining 25% interest in the Windsor Manor Joint Venture and the subsequent consolidation of the Windsor Manor revenues effective January 1, 2022. Refer to Note 4. “Acquisition” for additional information.
Property Operating Expenses. Property operating expenses were approximately $56.5 million and $111.9 million for the quarter and six months ended June 30, 2022, respectively, as compared to approximately $47.3 million and $95.2 million for the quarter and six months ended June 30, 2021, respectively. Property operating expenses increased during the quarter and six months ended June 30, 2022 as compared to the six months ended June 30, 2021, primarily due to increased labor costs driven by higher wages and usage of agency labor in a tight labor market and an increase in operating expenses due to inflation. In addition, property operating expense were higher during the six months ended June 30, 2022 as compared to the six months ended June 30, 2021 due to an increase in average occupancy as well as the consolidation of our Windsor Manor expenses, as described above.
General and Administrative Expenses. General and administrative expenses were approximately $2.4 million and $5.1 million for the quarter and six months ended June 30, 2022, respectively, as compared to approximately $2.3 million and $4.5 million for the quarter and six months ended June 30, 2021, respectively. General and administrative expenses were comprised primarily of personnel expenses of affiliates of our Advisor, directors’ and officers’ insurance, franchise taxes, accounting and legal fees, and board of director fees.
Asset Management Fees. We incurred asset management fees of approximately $3.5 million and $7.1 million for the quarter and six months ended June 30, 2022, respectively, as compared to approximately $4.1 million and $8.6 million for the quarter and six months ended June 30, 2021, respectively. Asset management fees are paid to our Advisor for the management of our real estate assets, including our pro rata share of investments in unconsolidated entities, loans and other permitted investments. Asset management fees decreased during the quarter and six months ended June 30, 2022 as compared to the quarter and six months ended June 30, 2021, primarily due to a reduction in our asset management fee from 1.0% per annum to 0.80% per annum of average invested assets, which became effective in May 2021.
29
Property Management Fees. We incurred property management fees payable to our third-party property managers of approximately $3.8 million and $7.3 million for the quarter and six months ended June 30, 2022, respectively, as compared to approximately $3.1 million and $6.2 million for the quarter and six months ended June 30, 2021, respectively. The property management fees are based on a percentage of revenues under the property management agreement and the increase across periods is reflective of the increase in average occupancy and resident fees and service revenue over the same period as described above.
Depreciation and Amortization. Depreciation and amortization expenses were approximately $13.9 million and $27.5 million for the quarter and six months ended June 30, 2022, respectively, as compared to approximately $12.3 million and $24.9 million for the quarter and six months ended June 30, 2021, respectively. Depreciation and amortization expenses are comprised of depreciation and amortization of the buildings, equipment, land improvements and in-place leases related to our real estate portfolio. The increase is primarily due to investing approximately $18 million dollars in capital improvements to maintain and improve our properties subsequent to June 30, 2021, and to a lesser extent, due to the consolidation of the Windsor Manor assets effective January 1, 2022.
Interest and Other Income. Interest and other income were approximately $4.0 million for each of the quarter and six months ended June 30, 2022, as compared to approximately $0.4 million for each of the quarter and six months ended June 30, 2021. Other income includes approximately $3.9 million during each of the quarter and six months ended June 30, 2022, and $0.4 million during each of the quarter and six months ended June 30, 2021 in CARES Act provider relief funds recorded as conditions of the grant were met. Refer to Note 2. “Summary of Significant Accounting Policies - Government Income” for additional information.
Interest Expense and Loan Cost Amortization. Interest expense and loan cost amortization were approximately $4.7 million and $8.6 million for the quarter and six months ended June 30, 2022, respectively, as compared to approximately $5.3 million and $10.5 million for the quarter and six months ended June 30, 2021, respectively. The decrease in interest expense and loan cost amortization was primarily due to the reduction in weighted average cost of debt as a result of refinancing approximately $238.0 million of secured indebtedness in October 2021 with proceeds from our unsecured Credit Facilities, partially offset by the increase in LIBOR rates year over year.
Gain on Change of Control of a Joint Venture. As described above in Note 4. “Acquisition,” six months ended June 30, 2022, we recognized a gain of approximately $8.4 million as part of acquiring the remaining 25% interest in the Windsor Manor Joint Venture from our joint venture partner, resulting in us owning a 100% controlling interest in the Windsor Manor Joint Venture and derecognizing our equity method investment in the Windsor Manor Joint Venture. We did not record such gains during the quarter and six months ended June 30, 2021.
Income Tax (Expense) Benefit. We incurred income tax (expense) benefit of approximately $(0.1) million and $(0.2) million during the quarter and six months ended June 30, 2022, respectively, and $1.0 million and $2.4 million during the quarter and six months ended June 30, 2021, respectively. The increase in income tax expense during the quarter and six months ended June 30, 2022, as compared to the six months ended June 30, 2021, is primarily attributable to the increase in valuation allowance against the Company’s deferred tax assets.
30
Net Operating Income
We generally expect to meet future cash needs for general and administrative expenses, debt service and distributions from NOI. We define NOI, a non-GAAP measure, as total revenues less the property operating expenses and property management fees from managed properties. We use NOI as a key performance metric for internal monitoring and planning purposes, including the preparation of annual operating budgets and monthly operating reviews, as well as to facilitate analysis of future investment and business decisions. It does not represent cash flows from operating activities in accordance with GAAP and should not be considered to be an alternative to net income or loss (determined in accordance with GAAP) as an indication of our operating performance or to be an alternative to cash flows from operating activities (determined in accordance with GAAP) as a measure of our liquidity. We believe the presentation of this non-GAAP measure is important to the understanding of our operating results for the periods presented because it is an indicator of the return on property investment and provides a method of comparing property performance over time. In addition, we have aggregated NOI on a “same-store” basis only for comparable properties that we have owned during the entirety of all periods presented. Non-same-store NOI includes NOI from the acquisition of the remaining 25% interest in the Windsor Manor Joint Venture effective January 1, 2022 and the subsequent transition of the Windsor Manor properties from unconsolidated to consolidated, as we did not consolidate those properties during the entirety of all periods presented. Non-same-store NOI also includes NOI from the Hurst Specialty Hospital that was sold in April 2022, as we did not own the property during the entirety of all periods presented. The chart below presents a reconciliation of our net income to NOI for the quarter and six months ended June 30, 2022 and 2021 (in thousands) and the amount invested in properties as of June 30, 2022 and 2021 (in millions), excluding one property classified as discontinued operations:
|
|
Quarter Ended |
|
|
|
|
|
|
|
|
Six Months Ended |
|
|
|
|
|
|
|
||||||||||||||
|
|
June 30, |
|
|
Change |
|
|
June 30, |
|
|
Change |
|
||||||||||||||||||||
|
|
2022 |
|
|
2021 |
|
|
$ |
|
|
% |
|
|
2022 |
|
|
2021 |
|
|
$ |
|
|
% |
|
||||||||
Net income (loss) |
|
$ |
24 |
|
|
$ |
586 |
|
|
|
|
|
|
|
|
$ |
4,352 |
|
|
$ |
(1,586 |
) |
|
|
|
|
|
|
||||
Adjusted to exclude: |
|
|
|
|
|
|
|
|
|
|
|
|
|
|
|
|
|
|
|
|
|
|
|
|
||||||||
General and administrative expenses |
|
|
2,441 |
|
|
|
2,271 |
|
|
|
|
|
|
|
|
|
5,072 |
|
|
|
4,519 |
|
|
|
|
|
|
|
||||
Asset management fees |
|
|
3,523 |
|
|
|
4,114 |
|
|
|
|
|
|
|
|
|
7,102 |
|
|
|
8,583 |
|
|
|
|
|
|
|
||||
Depreciation and amortization |
|
|
13,891 |
|
|
|
12,307 |
|
|
|
|
|
|
|
|
|
27,533 |
|
|
|
24,944 |
|
|
|
|
|
|
|
||||
Other expenses (income) |
|
|
750 |
|
|
|
4,612 |
|
|
|
|
|
|
|
|
|
(3,768 |
) |
|
|
9,914 |
|
|
|
|
|
|
|
||||
Income tax expense (benefit) |
|
|
65 |
|
|
|
(1,023 |
) |
|
|
|
|
|
|
|
|
150 |
|
|
|
(2,359 |
) |
|
|
|
|
|
|
||||
Loss from discontinued operations |
|
|
— |
|
|
|
— |
|
|
|
|
|
|
|
|
|
— |
|
|
|
10 |
|
|
|
|
|
|
|
||||
NOI |
|
$ |
20,694 |
|
|
$ |
22,867 |
|
|
$ |
(2,173 |
) |
|
|
(9.5 |
)% |
|
$ |
40,441 |
|
|
$ |
44,025 |
|
|
$ |
(3,584 |
) |
|
|
(8.1 |
)% |
Less: Non-same-store NOI |
|
|
662 |
|
|
|
347 |
|
|
|
|
|
|
|
|
|
1,023 |
|
|
|
820 |
|
|
|
|
|
|
|
||||
Same-store NOI |
|
$ |
20,032 |
|
|
$ |
22,520 |
|
|
$ |
(2,488 |
) |
|
|
(11.0 |
)% |
|
$ |
39,418 |
|
|
$ |
43,205 |
|
|
$ |
(3,787 |
) |
|
|
(8.8 |
)% |
Invested in operating properties, |
|
$ |
1,765 |
|
|
$ |
1,768 |
|
|
|
|
|
|
|
|
$ |
1,765 |
|
|
$ |
1,768 |
|
|
|
|
|
|
|
||||
Overall, our same-store NOI for the quarter and six months ended June 30, 2022 decreased by approximately $2.5 million and $3.8 million, respectively, as compared to the quarter and six months ended June 30, 2021. Same store NOI was negatively impacted by increased property operating expenses as a result of increased labor costs in a tight labor market and increased operating costs from rising inflation levels.
Funds from Operations and Modified Funds from Operations
Due to certain unique operating characteristics of real estate companies, as discussed below, the National Association of Real Estate Investment Trusts, (“NAREIT”) promulgated a measure known as funds from operations (“FFO”), which we believe to be an appropriate supplemental measure to reflect the operating performance of a REIT. The use of FFO is recommended by the REIT industry as a supplemental performance measure. FFO is not equivalent to net income or loss as determined under GAAP.
We define FFO, a non-GAAP measure, consistent with the standards approved by the Board of Governors of NAREIT. NAREIT defines FFO as net income or loss computed in accordance with GAAP, excluding gains or losses from sales of property, real estate asset impairment write-downs, plus depreciation and amortization of real estate related assets, and after adjustments for unconsolidated partnerships and joint ventures. Our FFO calculation complies with NAREIT’s policy described above.
31
The historical accounting convention used for real estate assets requires straight-line depreciation of buildings and improvements, which implies that the value of real estate assets diminishes predictably over time, especially if such assets are not adequately maintained or repaired and renovated as required by relevant circumstances and/or is requested or required by lessees for operational purposes in order to maintain the value of the property. We believe that, because real estate values historically rise and fall with market conditions, including inflation, interest rates, the business cycle, unemployment and consumer spending, presentations of operating results for a REIT using historical accounting for depreciation may be less informative. Historical accounting for real estate involves the use of GAAP. Any other method of accounting for real estate such as the fair value method cannot be construed to be any more accurate or relevant than the comparable methodologies of real estate valuation found in GAAP. Nevertheless, we believe that the use of FFO, which excludes the impact of real estate related depreciation and amortization, provides a more complete understanding of our performance to investors and to management, and when compared year over year, reflects the impact on our operations from trends in occupancy rates, rental rates, operating costs, general and administrative expenses, and interest costs, which may not be immediately apparent from net income or loss. However, FFO and MFFO, as described below, should not be construed to be more relevant or accurate than the current GAAP methodology in calculating net income or loss in its applicability in evaluating operating performance. The method utilized to evaluate the value and performance of real estate under GAAP should be construed as a more relevant measure of operational performance and considered more prominently than the non-GAAP FFO and MFFO measures and the adjustments to GAAP in calculating FFO and MFFO.
Changes in the accounting and reporting promulgations under GAAP (for acquisition fees and expenses for business combinations from a capitalization/depreciation model) to an expensed-as-incurred model that were put into effect in 2009, and other changes to GAAP accounting for real estate subsequent to the establishment of NAREIT’s definition of FFO, have prompted an increase in cash-settled expenses, specifically acquisition fees and expenses, as items that are expensed under GAAP and accounted for as operating expenses. Our management believes these fees and expenses do not affect our overall long-term operating performance. Publicly registered, non-listed REITs typically have a significant amount of acquisition activity and are substantially more dynamic during their initial years of investment and operation. While other start up entities may also experience significant acquisition activity during their initial years, we believe that non-listed REITs are unique in that they have a limited life with targeted exit strategies within a relatively limited time frame after acquisition activity ceases. Due to the above factors and other unique features of publicly registered, non-listed REITs, the IPA has standardized a measure known as modified funds from operations (“MFFO”) which the IPA has recommended as a supplemental measure for publicly registered non-listed REITs and which we believe to be another appropriate supplemental measure to reflect the operating performance of a non-listed REIT. MFFO is not equivalent to our net income or loss as determined under GAAP, and MFFO may not be a useful measure of the impact of long-term operating performance on value if we do not continue to operate with a limited life and targeted exit strategy, as currently intended. We believe that because MFFO excludes costs that we consider more reflective of investing activities and other non-operating items included in FFO and also excludes acquisition fees and expenses that affect our operations only in periods in which properties are acquired, MFFO can provide, on a going forward basis, an indication of the sustainability (that is, the capacity to continue to be maintained) of our operating performance after the period in which we acquired our properties and once our portfolio is in place. By providing MFFO, we believe we are presenting useful information that assists investors and analysts to better assess the sustainability of our operating performance after our properties have been acquired. We also believe that MFFO is a recognized measure of sustainable operating performance by the non-listed REIT industry.
32
We define MFFO, a non-GAAP measure, consistent with the IPA’s Guideline 2010-01, Supplemental Performance Measure for Publicly Registered, Non-Listed REITs: MFFO, or the Practice Guideline, issued by the IPA in November 2010. The Practice Guideline defines MFFO as FFO further adjusted for the following items, as applicable, included in the determination of GAAP net income or loss: acquisition fees and expenses; amounts relating to deferred rent receivables and amortization of above and below market leases and liabilities (which are adjusted from a GAAP accrual basis in order to reflect such payments on a cash basis of amounts expected to be received for such lease and rental payments); contingent purchase price consideration adjustments; accretion of discounts and amortization of premiums on debt investments; mark-to-market adjustments included in net income or loss; gains or losses included in net income from the extinguishment or sale of debt, hedges, foreign exchange, derivatives or securities holdings where trading of such holdings is not a fundamental attribute of the business plan; and unrealized gains or losses resulting from consolidation from, or deconsolidation to, equity accounting and after adjustments for consolidated and unconsolidated partnerships and joint ventures, with such adjustments calculated to reflect MFFO on the same basis. The accretion of discounts and amortization of premiums on debt investments, unrealized gains and losses on hedges, foreign exchange, derivatives or securities holdings, unrealized gains and losses resulting from consolidations, as well as other listed cash flow adjustments are adjustments made to net income or loss in calculating the cash flows provided by operating activities and, in some cases, reflect gains or losses which are unrealized and may not ultimately be realized.
Our MFFO calculation complies with the IPA’s Practice Guideline described above. In calculating MFFO, we exclude acquisition related expenses. Under GAAP, acquisition fees and expenses are characterized as operating expenses in determining operating net income or loss. These expenses are paid in cash by us. All paid and accrued acquisition fees and expenses will have negative effects on returns to investors, the potential for future distributions, and cash flows generated by us, unless earnings from operations or net sales proceeds from the disposition of other properties are generated to cover the purchase price of the property.
Our management uses MFFO and the adjustments used to calculate it in order to evaluate our performance against other non-listed REITs which have limited lives with short and defined acquisition periods and targeted exit strategies shortly thereafter. As noted above, MFFO may not be a useful measure of the impact of long-term operating performance on value if we do not continue to operate in this manner. We believe that our use of MFFO and the adjustments used to calculate it allow us to present our performance in a manner that reflects certain characteristics that are unique to non-listed REITs, such as their limited life, limited and defined acquisition period and targeted exit strategy, and hence that the use of such measures is useful to investors. For example, acquisition costs are funded from our subscription proceeds and other financing sources and not from operations.
By excluding expensed acquisition costs, the use of MFFO provides information consistent with management’s analysis of the operating performance of the properties.
Presentation of this information is intended to provide useful information to investors as they compare the operating performance of different non-listed REITs, although it should be noted that not all REITs calculate FFO and MFFO the same way and as such comparisons with other REITs may not be meaningful. Furthermore, FFO and MFFO are not necessarily indicative of cash flows available to fund cash needs and should not be considered as an alternative to net income (or loss) or income (or loss) from continuing operations as an indication of our performance, as an alternative to cash flows from operations, as an indication of our liquidity, or indicative of funds available to fund our cash needs including our ability to make distributions to our stockholders. FFO and MFFO should be reviewed in conjunction with other GAAP measurements as an indication of our performance. MFFO is useful in assisting management and investors in assessing the sustainability of operating performance in future operating periods.
Neither the SEC, NAREIT nor any other regulatory body has passed judgment on the acceptability of the adjustments we use to calculate FFO or MFFO. In the future, the SEC, NAREIT or another regulatory body may decide to standardize the allowable adjustments across the non-listed REIT industry and we would have to adjust our calculation and characterization of FFO or MFFO.
33
The following table presents a reconciliation of net income to FFO and MFFO for the quarter and six months ended June 30, 2022 and 2021 (in thousands, except per share data):
|
|
Quarter Ended |
|
|
Six Months Ended |
|
||||||||||
|
|
2022 |
|
|
2021 |
|
|
2022 |
|
|
2021 |
|
||||
Net income (loss) attributable to common stockholders |
|
$ |
1 |
|
|
$ |
594 |
|
|
$ |
4,304 |
|
|
$ |
(1,553 |
) |
Adjustments: |
|
|
|
|
|
|
|
|
|
|
|
|
||||
Depreciation and amortization |
|
|
13,891 |
|
|
|
12,307 |
|
|
|
27,533 |
|
|
|
24,944 |
|
Gain on change of control of a joint venture(1) |
|
|
— |
|
|
|
— |
|
|
|
(8,376 |
) |
|
|
— |
|
FFO adjustments attributable to noncontrolling interests |
|
|
(34 |
) |
|
|
(48 |
) |
|
|
(69 |
) |
|
|
(95 |
) |
FFO adjustments from unconsolidated entities(2) |
|
|
— |
|
|
|
116 |
|
|
|
— |
|
|
|
296 |
|
FFO attributable to common stockholders |
|
|
13,858 |
|
|
|
12,969 |
|
|
|
23,392 |
|
|
|
23,592 |
|
Straight-line rent adjustments(3) |
|
|
169 |
|
|
|
297 |
|
|
|
520 |
|
|
|
729 |
|
Amortization of premium for debt investments |
|
|
(11 |
) |
|
|
(11 |
) |
|
|
(21 |
) |
|
|
(21 |
) |
Realized loss on extinguishment of debt: (4) |
|
|
28 |
|
|
|
— |
|
|
|
28 |
|
|
|
— |
|
MFFO adjustments attributable to noncontrolling interests |
|
|
(1 |
) |
|
|
— |
|
|
|
(10 |
) |
|
|
(7 |
) |
MFFO attributable to common stockholders |
|
$ |
14,043 |
|
|
$ |
13,255 |
|
|
$ |
23,909 |
|
|
$ |
24,293 |
|
Weighted average number of shares of common |
|
|
173,960 |
|
|
|
173,960 |
|
|
|
173,960 |
|
|
|
173,960 |
|
Net (loss) income per share (basic and diluted) |
|
$ |
0.00 |
|
|
$ |
0.00 |
|
|
$ |
0.02 |
|
|
$ |
(0.01 |
) |
FFO per share (basic and diluted) |
|
$ |
0.08 |
|
|
$ |
0.07 |
|
|
$ |
0.13 |
|
|
$ |
0.14 |
|
MFFO per share (basic and diluted) |
|
$ |
0.08 |
|
|
$ |
0.08 |
|
|
$ |
0.14 |
|
|
$ |
0.14 |
|
________________
FOOTNOTES:
Related Party Transactions
See Item 1. “Condensed Consolidated Financial Information” and our Annual Report on Form 10-K for the year ended December 31, 2021 for a summary of our related party transactions.
Critical Accounting Policies and Estimates
See Item 1. “Condensed Consolidated Financial Information” and our Annual Report on Form 10-K for the year ended December 31, 2021 for a summary of our critical accounting policies and estimates.
Recent Accounting Pronouncements
See Item 1. “Condensed Consolidated Financial Information” for a summary of the impact of recent accounting pronouncements.
34
Item 3. Quantitative and Qualitative Disclosures about Market Risks
We may be exposed to interest rate changes primarily as a result of the long-term debt we used to acquire properties and other permitted investments, as well as impacts of volatile credit markets and a rising interest rate environment. Our management objectives related to interest rate risk are to limit the impact of interest rate changes on earnings and on operating cash flows. To achieve our objectives, we borrow at fixed rates or variable rates with the lowest margins available, and in some cases, with the ability to convert from variable rates to fixed rates. With regard to variable rate financing, we assess interest rate cash flow risk by continually identifying and monitoring changes in interest rate exposures that may adversely impact expected future cash flows and by evaluating hedging opportunities.
The following is a schedule as of June 30, 2022 of our fixed and variable rate debt maturities for the remainder of 2022, and each of the next four years and thereafter (principal maturities only) (in thousands):
|
|
Expected Maturities |
|
|
|
|
|
|
|
|||||||||||||||||||||||
|
|
2022 |
|
|
2023 (1) |
|
|
2024 |
|
|
2025 |
|
|
2026 |
|
|
Thereafter |
|
|
Total |
|
|
Fair Value (2) |
|
||||||||
Fixed rate debt |
|
$ |
358 |
|
|
$ |
23,407 |
|
|
$ |
20,675 |
|
|
$ |
— |
|
|
$ |
— |
|
|
$ |
— |
|
|
$ |
44,440 |
|
|
$ |
44,000 |
|
Weighted average interest |
|
|
4.51 |
% |
|
|
4.65 |
% |
|
|
3.25 |
% |
|
|
— |
|
|
|
— |
|
|
|
— |
|
|
|
4.00 |
% |
|
|
|
|
Variable rate debt |
|
$ |
306 |
|
|
$ |
133,647 |
|
|
$ |
432,212 |
|
|
$ |
— |
|
|
$ |
— |
|
|
$ |
— |
|
|
$ |
566,165 |
|
|
$ |
566,000 |
|
Average interest rate |
|
1.55% + LIBOR |
|
|
1.55% + LIBOR |
|
|
1.55% + LIBOR |
|
|
|
— |
|
|
|
— |
|
|
|
— |
|
|
1.55% + LIBOR |
|
|
|
|
|||||
_____________
FOOTNOTE:
Management estimates that a hypothetical one-percentage point increase in LIBOR compared to LIBOR rates as of June 30, 2022, considering the impact of our interest rate caps, would increase interest expense approximately $0.6 million and $1.3 million for the quarter and six months ended June 30, 2022. This sensitivity analysis contains certain simplifying assumptions, and although it gives an indication of our exposure to changes in interest rates, it is not intended to predict future results and actual results will likely vary given that our sensitivity analysis on the effects of changes in LIBOR does not factor in a potential change in variable rate debt levels.
As of June 30, 2022, the Company’s debt is comprised of approximately 7.3% in fixed rate debt, approximately 58.1% in variable rate debt with current interest rate protection and approximately 34.6% of unhedged variable rate debt. The remaining unhedged variable rate debt primarily relates to our Term Loan Facility. Overall, we believe longer term fixed rate debt could be beneficial in a rising interest rate or rising inflation rate environment and as such we continue to evaluate the need for additional interest rate protection on unhedged variable rate debt or variable rate debt with interest rate protection scheduled to mature.
35
Item 4. Controls and Procedures
Evaluation of Disclosure Controls and Procedures
Pursuant to Rule 13a-15(b) under the Exchange Act, under the supervision and with the participation of our management, including our principal executive officer and principal financial officer, we conducted an evaluation of the effectiveness of our disclosure controls and procedures (as defined under Rule 13a-15(e) under the Exchange Act) as of the end of the period covered by this report. Based upon that evaluation, our management, including our principal executive officer and principal financial officer, concluded that our disclosure controls and procedures are effective as of the end of the period covered by this report to provide reasonable assurance that material information required to be included in our periodic SEC reports is recorded, processed, summarized and reported within the time periods specified in the relevant SEC rules and forms.
Changes in Internal Control over Financial Reporting
During the most recent fiscal quarter, there were no changes in our internal controls over financial reporting (as defined under Rule 13a-15(f) under the Exchange Act) that have materially affected, or are reasonably likely to materially affect, our internal controls over financial reporting.
PART II. OTHER INFORMATION
Item 1. Legal Proceedings
From time to time, we may be a party to legal proceedings in the ordinary course of, or incidental to the normal course of, our business, including proceedings to enforce our contractual or statutory rights. While we cannot predict the outcome of these legal proceedings with certainty, based upon currently available information, we do not believe the final outcome of any pending or threatened legal proceeding will have a material adverse effect on our results of operations or financial condition.
Item 1A. Risk Factors
There have been no material changes in our assessment of our risk factors from those set forth in our Annual Report on Form 10-K for the fiscal year ended December 31, 2021.
Item 2. Unregistered Sales of Equity Securities and Use of Proceeds
Unregistered Sales of Equity Securities – None
Issuer Purchases of Equity Securities – None
Secondary Sales of Registered Shares between Investors
During the six months ended June 30, 2022 and 2021, there were approximately 627,000 shares and 305,000 shares transferred between investors, respectively, at an average sales price per share of approximately $4.65 and $3.99, respectively. We are not aware of any other trades of our shares, other than previous purchases made in our Offerings and/or redemptions of shares by us.
Item 3. Defaults Upon Senior Securities – None
Item 4. Mine Safety Disclosure – Not Applicable
Item 5. Other Information – None
Item 6. Exhibits
The exhibits required by this item are set forth in the Exhibit Index attached hereto and are filed or incorporated as part of this report.
36
EXHIBIT INDEX
Exhibits
The following exhibits are included, or incorporated by reference in this Quarterly Report on Form 10-Q for the quarter and six months ended June 30, 2022 (and are numbered in accordance with Item 601 of Regulation S-K).
Exhibit No. |
|
Description |
|
|
|
3.1 |
|
|
3.2 |
|
|
4.1 |
|
|
10.1 |
|
|
10.2 |
|
|
31.1 |
|
|
31.2 |
|
|
32.1 |
|
|
101 |
|
The following materials from CNL Healthcare Properties, Inc. Quarterly Report on Form 10-Q for the quarter and six months ended June 30, 2022, formatted in iXBRL (Inline eXtensible Business Reporting Language); (i) Condensed Consolidated Balance Sheets, (ii) Condensed Consolidated Statements of Operations, (iii) Condensed Consolidated Statements of Comprehensive Loss, (iv) Condensed Consolidated Statements of Stockholders’ Equity and Redeemable Noncontrolling Interest, (v) Condensed Consolidated Statements of Cash Flows, and (vi) Notes to the Condensed Consolidated Financial Statements. |
104 |
|
Cover Page Interactive Data File included as Exhibit 101 (embedded within the Inline XBRL document) |
37
SIGNATURES
Pursuant to the requirements of the Securities Exchange Act of 1934, the registrant has duly caused this report to be signed on its behalf by the undersigned thereunto duly authorized, on the 11th day of August 2022.
CNL HEALTHCARE PROPERTIES, INC. |
|
|
|
By: |
/s/ Stephen H. Mauldin |
|
STEPHEN H. MAULDIN |
|
Chief Executive Officer and President |
|
(Principal Executive Officer) |
|
|
|
|
By: |
/s/ Ixchell C. Duarte |
|
IXCHELL C. DUARTE |
|
Chief Financial Officer, Senior Vice President and Treasurer |
|
(Principal Financial Officer and Principal Accounting Officer) |
|
|
38
EXHIBIT 31.1
CERTIFICATION OF CHIEF EXECUTIVE OFFICER
OF CNL HEALTHCARE PROPERTIES, INC.
PURSUANT TO RULE 13a-14(a), AS ADOPTED PURSUANT TO
SECTION 302 OF THE SARBANES-OXLEY ACT OF 2002
I, Stephen H. Mauldin, certify that:
1. I have reviewed this quarterly report on Form 10-Q of CNL Healthcare Properties, Inc. (the “Registrant”);
2. Based on my knowledge, this report does not contain any untrue statement of a material fact or omit to state a material fact necessary to make the statements made, in light of the circumstances under which such statements were made, not misleading with respect to the period covered by this report;
3. Based on my knowledge, the financial statements, and other financial information included in this report, fairly present in all material respects the financial condition, results of operations and cash flows of the Registrant as of, and for, the periods presented in this report;
4. The Registrant’s other certifying officer(s) and I are responsible for establishing and maintaining disclosure controls and procedures (as defined in Exchange Act Rules 13a-15(e) and 15d-15(e)) and internal control over financial reporting (as defined in Exchange Act Rules 13a-15(f) and 15d-15(f)) for the Registrant and have:
(a) designed such disclosure controls and procedures, or caused such disclosure controls and procedures to be designed under our supervision, to ensure that material information relating to the Registrant, including its consolidated subsidiaries, is made known to us by others within those entities, particularly during the period in which this report is being prepared;
(b) designed such internal control over financial reporting, or caused such internal control over financial reporting to be designed under our supervision, to provide reasonable assurance regarding the reliability of financial reporting and the preparation of financial statements for external purposes in accordance with generally accepted accounting principles;
(c) evaluated the effectiveness of the Registrant’s disclosure controls and procedures and presented in this report our conclusions about the effectiveness of the disclosure controls and procedures, as of the end of the period covered by this report based on such evaluation; and
(d) disclosed in this report any change in the Registrant’s internal control over financial reporting that occurred during the Registrant’s most recent fiscal quarter (the Registrant’s fourth fiscal quarter in the case of an annual report) that has materially affected, or is reasonably likely to materially affect, the Registrant’s internal control over financial reporting; and
5. The Registrant’s other certifying officer(s) and I have disclosed, based on our most recent evaluation of internal control over financial reporting, to the Registrant’s auditors and the audit committee of the Registrant’s board of directors (or persons performing the equivalent functions):
(a) all significant deficiencies and material weaknesses in the design or operation of internal control over financial reporting which are reasonably likely to adversely affect the Registrant’s ability to record, process, summarize and report financial information; and
(b) any fraud, whether or not material, that involves management or other employees who have a significant role in the Registrant’s internal control over financial reporting.
|
|
|||
Date: August 11, 2022 |
|
By: |
|
/s/ Stephen H. Mauldin |
|
|
|
|
Stephen H. Mauldin |
|
|
|
|
Chief Executive Officer and President (Principal Executive Officer) |
EXHIBIT 31.2
CERTIFICATION OF CHIEF FINANCIAL OFFICER
OF CNL HEALTHCARE PROPERTIES, INC.
PURSUANT TO RULE 13a-14(a), AS ADOPTED PURSUANT TO
SECTION 302 OF THE SARBANES-OXLEY ACT OF 2002
I, Ixchell C. Duarte, certify that:
1. I have reviewed this quarterly report on Form 10-Q of CNL Healthcare Properties, Inc. (the “Registrant”);
2. Based on my knowledge, this report does not contain any untrue statement of a material fact or omit to state a material fact necessary to make the statements made, in light of the circumstances under which such statements were made, not misleading with respect to the period covered by this report;
3. Based on my knowledge, the financial statements, and other financial information included in this report, fairly present in all material respects the financial condition, results of operations and cash flows of the Registrant as of, and for, the periods presented in this report;
4. The Registrant’s other certifying officer(s) and I are responsible for establishing and maintaining disclosure controls and procedures (as defined in Exchange Act Rules 13a-15(e) and 15d-15(e)) and internal control over financial reporting (as defined in Exchange Act Rules 13a-15(f) and 15d-15(f)) for the Registrant and have:
(a) designed such disclosure controls and procedures, or caused such disclosure controls and procedures to be designed under our supervision, to ensure that material information relating to the Registrant, including its consolidated subsidiaries, is made known to us by others within those entities, particularly during the period in which this report is being prepared;
(b) designed such internal control over financial reporting, or caused such internal control over financial reporting to be designed under our supervision, to provide reasonable assurance regarding the reliability of financial reporting and the preparation of financial statements for external purposes in accordance with generally accepted accounting principles;
(c) evaluated the effectiveness of the Registrant’s disclosure controls and procedures and presented in this report our conclusions about the effectiveness of the disclosure controls and procedures, as of the end of the period covered by this report based on such evaluation; and
(d) disclosed in this report any change in the Registrant’s internal control over financial reporting that occurred during the Registrant’s most recent fiscal quarter (the Registrant’s fourth fiscal quarter in the case of an annual report) that has materially affected, or is reasonably likely to materially affect, the Registrant’s internal control over financial reporting; and
5. The Registrant’s other certifying officer(s) and I have disclosed, based on our most recent evaluation of internal control over financial reporting, to the Registrant’s auditors and the audit committee of the Registrant’s board of directors (or persons performing the equivalent functions):
(a) all significant deficiencies and material weaknesses in the design or operation of internal control over financial reporting which are reasonably likely to adversely affect the Registrant’s ability to record, process, summarize and report financial information; and
(b) any fraud, whether or not material, that involves management or other employees who have a significant role in the Registrant’s internal control over financial reporting.
|
|
|||
Date: August 11, 2022 |
|
By: |
|
/s/ Ixchell C. Duarte |
|
|
|
|
Ixchell C. Duarte |
|
|
|
|
Chief Financial Officer, Senior Vice President and Treasurer (Principal Financial Officer and Principal Accounting Officer) |
EXHIBIT 32.1
CERTIFICATION
PURSUANT TO 18 U.S.C. SECTION 1350 AS ADOPTED PURSUANT TO
SECTION 906 OF THE SARBANES-OXLEY ACT OF 2002
In connection with the quarterly report of CNL Healthcare Properties, Inc. (the “Company”) on Form 10-Q for the period ended June 30, 2022, as filed with the United States Securities and Exchange Commission on the date hereof (the “Report”), I, Stephen H. Mauldin, Chief Executive Officer and President and Ixchell C. Duarte, Chief Financial Officer, Senior Vice President and Treasurer of the Company, each certify, pursuant to 18 U.S.C. 1350, as adopted pursuant to Section 906 of the Sarbanes-Oxley Act of 2002, that:
(1) The Report fully complies with the requirements of Section 13(a) or 15(d) of the Securities Exchange Act of 1934, as amended; and
(2) The information contained in the Report fairly presents, in all material respects, the financial condition and results of operations of the Company.
Date: August 11, 2022 |
|
By: |
|
/s/ Stephen H. Mauldin |
|
|
|
|
Stephen H. Mauldin |
|
|
|
|
Chief Executive Officer and President |
|
|
|
||
Date: August 11, 2022 |
|
By: |
|
/s/ Ixchell C. Duarte |
|
|
|
|
Ixchell C. Duarte |
|
|
|
|
Chief Financial Officer, Senior Vice President and Treasurer |
1
Serious News for Serious Traders! Try StreetInsider.com Premium Free!
You May Also Be Interested In
- NeoGames and Aristocrat Receive Final Regulatory Approvals on Proposed Acquisition
- Two Top Rating Agencies Reaffirm Metropolitan’s Strong Credit Ratings
- U.S. FDA Approves Subcutaneous Administration of Takeda’s ENTYVIO® (vedolizumab) for Maintenance Therapy in Moderately to Severely Active Crohn’s Disease
Create E-mail Alert Related Categories
SEC FilingsSign up for StreetInsider Free!
Receive full access to all new and archived articles, unlimited portfolio tracking, e-mail alerts, custom newswires and RSS feeds - and more!
