

Form 10-K Triton International For: Dec 31
 Tweet
Tweet Share
ShareUNITED STATES
SECURITIES AND EXCHANGE COMMISSION
WASHINGTON, D.C. 20549
FORM 10-K
| ANNUAL REPORT PURSUANT TO SECTION 13 OR 15(d) OF THE SECURITIES EXCHANGE ACT OF 1934 | |||||
For The Fiscal Year Ended December 31 , 2021
Or
| TRANSITION REPORT PURSUANT TO SECTION 13 OR 15(d) OF THE SECURITIES EXCHANGE ACT OF 1934 | |||||
For the Transition Period from to
Commission file number - 001-37827

(Exact name of registrant as specified in the charter)
| (State or other jurisdiction of incorporation or organization) | (I.R.S. Employer Identification Number) | |||||||
(Address of principal executive office)
(441 ) 294-8033
(Registrant's telephone number including area code)
Securities registered pursuant to Section 12(b) of the Act:
| Title of each class | Trading Symbol(s) | Name of each exchange on which registered | ||||||
| | ||||||||
Securities registered pursuant to Section 12(g) of the Act: None
Indicate by check mark if the registrant is a well-known seasoned issuer, as defined in Rule 405 of the Securities Act. Yes ☒ No ☐
Indicate by check mark if the registrant is not required to file reports pursuant to Section 13 or Section 15(d) of the Act. Yes ☐ No ☒
Indicate by check mark whether the registrant (1) has filed all reports required to be filed by Section 13 or 15(d) of the Securities Exchange Act of 1934 during the preceding 12 months (or for such shorter period that the registrant was required to file such reports), and (2) has been subject to such filing requirement for the past 90 days. Yes ☒ No ☐
Indicate by check mark whether the registrant has submitted electronically every Interactive Data File required to be submitted pursuant to Rule 405 of Regulation S-T (§ 232.405 of this chapter) during the preceding 12 months (or for such shorter period that the registrant was required to submit such files). Yes ☒ No ☐
Indicate by check mark whether the registrant is a large accelerated filer, an accelerated filer, a non-accelerated filer, smaller reporting company, or an emerging growth company. See definitions of "large accelerated filer," "accelerated filer," "smaller reporting company," and "emerging growth company" in Rule 12b-2 of the Exchange Act.
| ☒ | Accelerated Filer | ☐ | |||||||||||||||||||||
| Non-accelerated filer | ☐ | Smaller reporting company | |||||||||||||||||||||
| Emerging growth company | |||||||||||||||||||||||
If an emerging growth company, indicate by check mark if the registrant has elected not to use the extended transition period for complying with any new or revised financial accounting standards provided pursuant to Section 13(a) of the Exchange Act. ☐
Indicate by check mark whether the registrant has filed a report on attestation to its management's assessment of the effectiveness of its internal control over financial reporting under Section 404(b) of the Sarbanes-Oxley Act (15 U.S.C. 7262(b)) by the registered public accounting firm that prepared or issued its audit report. ☒
Indicate by check mark whether the registrant is a shell company (as defined in rule 12b-2 of the Act). Yes ☐ No ☒
The aggregate market value of voting common shares held by non-affiliates as of June 30, 2021 was approximately $2,508.0 million. As of February 11, 2022, there were 65,262,183 common shares, $0.01 par value, of the Registrant outstanding.
| DOCUMENTS INCORPORATED BY REFERENCE | |||||
| Part of Form 10-K | Document Incorporated by Reference | ||||
| Part III, Items 10, 11, 12, 13, and 14 | Portion of the Registrant's proxy statement to be filed in connection with the Annual Meeting of Shareholders of the Registrant to be held on April 26, 2022. | ||||
Table of Contents
3
CAUTIONARY NOTE REGARDING FORWARD-LOOKING STATEMENTS
This annual report on Form 10-K contains forward-looking statements within the meaning of the Private Securities Litigation Reform Act of 1995, Section 27A of the Securities Act of 1933, as amended, or the Securities Act, and Section 21E of the Securities Exchange Act of 1934, as amended, or the Exchange Act, that involve substantial risks and uncertainties. In addition, we, or our executive officers on our behalf, may from time to time make forward-looking statements in reports and other documents we file with the Securities and Exchange Commission, or SEC, or in connection with oral statements made to the press, potential investors or others. All statements, other than statements of historical facts, including statements regarding our strategy, future operations, future financial position, future revenues, future costs, prospects, plans and objectives of management are forward-looking statements. The words "expect," "estimate," "anticipate," "predict," "believe," "think," "plan," "will," "should," "intend," "seek," "potential" and similar expressions and variations are intended to identify forward-looking statements, although not all forward-looking statements contain these identifying words.
All forward-looking statements address matters that involve risks and uncertainties, many of which are beyond Triton's control. Accordingly, there are or will be important factors that could cause actual results to differ materially from those indicated in such statements and, therefore, you should not place undue reliance on any such statements. These factors include, without limitation, economic, business, competitive, market and regulatory conditions and the following:
•the impact of COVID-19 on our business and financial results;
•decreases in the demand for leased containers;
•decreases in market leasing rates for containers;
•difficulties in re-leasing containers after their initial fixed-term leases;
•our customers' decisions to buy rather than lease containers;
•our dependence on a limited number of customers and suppliers;
•customer defaults;
•decreases in the selling prices of used containers;
•extensive competition in the container leasing industry;
•difficulties stemming from the international nature of our businesses;
•decreases in demand for international trade;
•disruption to our operations resulting from the political and economic policies of the United States and other countries, particularly China, including but not limited to, the impact of trade wars, duties and tariffs;
•disruption to our operations from failures of, or attacks on, our information technology systems;
•disruption to our operations as a result of natural disasters;
•compliance with laws and regulations related to economic and trade sanctions, security, anti-terrorism, environmental protection and corruption;
•the availability and cost of capital;
•restrictions imposed by the terms of our debt agreements;
•changes in tax laws in Bermuda, the United States and other countries; and
•other risks and uncertainties, including those listed under the caption "Risk Factors."
The foregoing list of important factors should not be construed as exhaustive and should be read in conjunction with the other cautionary statements that are included herein and elsewhere, including the risk factors included in this annual report on Form 10-K. Any forward-looking statements made in this annual report on Form 10-K are qualified in their entirety by these cautionary statements, and there can be no assurance that the actual results or developments anticipated by us will be realized or, even if substantially realized, that they will have the expected consequences to, or effects on, Triton or its businesses or operations. Except to the extent required by applicable law, we undertake no obligation to update publicly or revise any forward-looking statement, whether as a result of new information, future developments or otherwise.
WEBSITE ACCESS TO COMPANY'S REPORTS AND CODE OF ETHICS
Our Internet website address is http://www.trtn.com. Our annual reports on Form 10-K, quarterly reports on Form 10-Q, current reports on Form 8-K, and amendments to those reports filed or furnished pursuant to Section 13(a) or 15(d) of the Exchange Act are available free of charge through our website as soon as reasonably practicable after they are electronically filed with, or furnished to, the SEC.
We have adopted a code of ethics that applies to all of our employees, officers, and directors, including our principal executive officer and principal financial officer. The text of our code of ethics is posted within the Corporate Governance portion of the "Investors" section of our website.
4
Also, copies of our annual report and Code of Ethics will be made available, free of charge, upon written request to:
Triton International Limited
Victoria Place, 5th Floor
31 Victoria Street
Hamilton HM 10, Bermuda
Attn: General Counsel and Secretary
Telephone: (441) 294-8033
SERVICE MARKS MATTERS
The following items referred to in this annual report are registered or unregistered service marks in the United States and/or foreign jurisdictions pursuant to applicable intellectual property laws and are the property of Triton and its subsidiaries: Triton®, TAL®, and  ®.
®.
®.5
PART I
ITEM 1. BUSINESS
Our Company
Triton International Limited ("Triton", "we", "our" or the "Company") is the world's largest lessor of intermodal containers. Intermodal containers are large, standardized steel boxes used to transport freight by ship, rail or truck. Because of the handling efficiencies they provide, intermodal containers are the primary means by which many goods and materials are shipped internationally. We also lease chassis, which are used for the transportation of containers.
Our operations include the acquisition, leasing, re-leasing and subsequent sale of multiple types of intermodal containers and chassis. As of December 31, 2021, our total fleet consisted of 4.3 million containers and chassis, representing 7.3 million twenty-foot equivalent units ("TEU") or 8.0 million cost equivalent units ("CEU"). We have an extensive global presence offering leasing services through a worldwide network of local offices and utilize third-party container depots spread across 46 countries to provide customers global access to our container fleet. Our primary customers include the world's largest container shipping lines. Our global field operations include sales, operations, equipment resale, and logistics services. Our registered office is located in Bermuda.
The most important driver of our profitability is the extent to which leasing revenues, which are driven by our owned equipment fleet size, utilization and average rental rates, exceed our ownership and operating costs. Our profitability is also driven by the gains or losses we realize on the sale of used containers and the margins generated from trading new and used containers.
Industry Overview
Intermodal containers provide a secure and cost-effective method of transporting raw materials, component parts and finished goods because they can be used in multiple modes of transport. By making it possible to move cargo from a point of origin to a final destination without repeated unpacking and repacking, containers reduce freight and labor costs. In addition, automated handling of containers permits faster loading and unloading of vessels, more efficient utilization of transportation equipment and reduced transit time. The protection provided by sealed containers also reduces cargo damage and the loss and theft of goods during shipment.
Over the last thirty years, containerized trade has grown at a rate greater than that of general worldwide economic growth. According to Clarkson Research Studies, worldwide containerized cargo volume increased at a compound annual growth rate ("CAGR") of 7.7% from 1991 to 2021. We believe that this high historical growth was due to several factors, including the shift in global manufacturing capacity to lower labor cost areas such as China, the continued integration of developing high growth economies into global trade patterns and the continued conversion of cargo from bulk shipping into containers. However, worldwide containerized cargo volume growth has been more in line with global economic growth over the last 10 years, averaging 4.2% per year from 2011 to 2021. In 2021, worldwide cargo volumes are estimated to have increased 6.6% in-line with worldwide economic growth.
Container leasing companies maintain inventories of new and used containers in a wide range of worldwide locations and supply these containers primarily to shipping line customers under a variety of short and long-term lease structures. Based on container fleet information reported by Drewry Maritime Research, we estimate that container lessors owned approximately 24.7 million TEU, or approximately 52% of the total worldwide container fleet of 48.0 million TEU, as of the end of 2021.
Leasing containers helps shipping lines improve their container fleet efficiency and provides shipping lines with an alternative source of equipment financing. Given the uncertainty and variability of export volumes, and the fact that shipping lines have difficulty in accurately forecasting their container requirements on a day-by-day, port-by-port basis, the availability of containers for lease on short notice reduces shipping lines' need to purchase and maintain larger container inventory buffers. In addition, the drop-off flexibility provided by operating leases also allows the shipping lines to adjust their container fleet sizes and the mix of container types in their fleets both seasonally and over time and helps balance their trade flows.
Spot leasing rates are typically a function of, among other things, new equipment prices (which are heavily influenced by steel prices), interest rates and the equipment supply and demand balance at a particular time and location. Average leasing rates on an entire portfolio of leases respond more gradually to changes in new equipment prices or changes in the balance of container supply and demand because lease agreements are generally only re-priced upon the expiration of the lease. In addition, the value that lessors receive upon resale of equipment is closely related to the cost of new equipment.
6
Our Equipment
Intermodal containers are designed to meet a number of criteria outlined by the International Standards Organization (ISO). The standard criteria include the size of the container and the gross weight rating of the container. This standardization ensures that containers can be used by the widest possible number of transporters and it facilitates container and vessel sharing by the shipping lines. The standardization of the container is also an important element of the container leasing business since we can operate one fleet of containers that can be used by all of our major customers.
Our fleet primarily consists of five types of equipment:
•Dry Containers. A dry container is a steel constructed box with a set of doors on one end. Dry containers come in lengths of 20, 40 or 45 feet. They are 8 feet wide, and either 8½ or 9½ feet tall. Dry containers are the least expensive and most widely used type of intermodal container and are used to carry general cargo such as manufactured component parts, consumer staples, electronics and apparel.
•Refrigerated Containers. Refrigerated containers include an integrated cooling machine and an insulated container. Refrigerated containers come in lengths of 20 or 40 feet. They are 8 feet wide, and are either 8½ or 9½ feet tall. These containers are typically used to carry perishable cargo such as fresh and frozen produce.
•Special Containers. Most of our special containers are open top and flat rack containers. Open top containers come in similar sizes as dry containers, but do not have a fixed roof. Flat rack containers come in varying sizes and are steel platforms with folding ends and no fixed sides. Open top and flat rack containers are generally used to move heavy or bulky cargos, such as marble slabs, steel coils or factory components, that cannot be easily loaded on a fork lift through the doors of a standard container.
•Tank Containers. Tank containers are stainless steel cylindrical tanks enclosed in rectangular steel frames with the same outside dimensions as 20 foot dry containers. These containers carry bulk liquids such as chemicals.
•Chassis. An intermodal chassis is a rectangular, wheeled steel frame, generally 23½, 40 or 45 feet in length, built specifically for the purpose of transporting intermodal containers over the road. Longer sized chassis, designed to solely accommodate rail containers, can be up to 53 feet in length. When mounted on a chassis, the container may be trucked either to its destination or to a railroad terminal for loading onto a rail car. Our chassis are primarily used in the United States.
Our Leases
Most of our revenues are derived from leasing our equipment to our core shipping line customers. The majority of our leases are structured as operating leases, though we also provide customers with finance leases. Regardless of the lease type, we seek to exceed our targeted return on our investments over the life cycle of the equipment by managing utilization, lease rates, and the used equipment sale process.
Our lease products provide numerous operational and financial benefits to our shipping line customers. These benefits include:
•Operating Flexibility. The timing, location and daily volume of cargo movements for a shipping line are often unpredictable. Leasing containers and chassis helps our customers manage this uncertainty and minimizes the requirement for large inventory buffers by allowing them to pick-up leased equipment on short notice.
•Fleet Size and Mix Flexibility. The drop-off flexibility included in container and chassis operating leases allows our customers to more quickly adjust the size of their fleets and the mix of container types in their fleets as their trade volumes and patterns change due to seasonality, market changes or changes in company strategies.
•Alternative Source of Financing. Container and chassis leases provide an additional source of equipment financing to help our customers manage the high level of investment required to maintain pace with the growth of the asset intensive container shipping industry.
Operating Leases. Operating leases are structured to allow customers flexibility to pick-up equipment on short notice and to drop-off equipment prior to the end of its useful life. Because of this flexibility, most of our containers and chassis will go through several pick-up and drop-off cycles. Our operating lease contracts specify a per diem rate for equipment on-hire, where and when such equipment can be returned, how the customer will be charged for damage and the charge for lost or destroyed equipment, among other things.
We categorize our operating leases as either long-term leases or service leases. Some leases have contractual terms that have features reflective of both long-term and service leases. We classify such leases as either long-term or service leases,
7
depending upon which features we believe are predominant. Long-term leases typically have initial contractual terms ranging from five to eight or more years. However, in 2021 the exceptionally high new container price environment led to a much higher average lease duration for containers purchased and leased out during the year, reflecting the desire of Triton and our customers to spread the higher container costs over a longer period. Our long-term leases require our customers to maintain specific units on-hire for the duration of the lease term, and they provide us with predictable recurring cash flow.
We also have expired long-term leases whose fixed terms have ended but for which the related units remain on-hire and for which we continue to receive rental payments pursuant to the terms of the initial contract.
Service leases allow our customers to pick-up and drop-off equipment during the term of the lease, subject to contractual limitations. Service leases provide the customer with a higher level of flexibility than long-term leases and, as a result, typically carry a higher per diem rate. The terms of our service leases can range from 12 months to five years, though because equipment can be returned during the term of a service lease and since service leases are generally renewed or modified and extended upon expiration, lease term does not dictate expected on-hire time for our equipment on service leases. As of December 31, 2021, this equipment has been on-hire for an average of 37 months.
Finance Leases. Finance leases provide our customers with an alternative method to finance their equipment acquisitions. Finance leases are generally structured for specific quantities of equipment, generally require the customer to keep the equipment on-hire for its remaining useful life, and typically provide the customer with a purchase option at the end of the lease term.
The following table provides a summary of our equipment lease portfolio by lease type, based on CEU and net book value, as of December 31, 2021:
| By CEU | By Net Book Value | |||||||||||||
| Lease Portfolio | December 31, 2021 | December 31, 2021 | ||||||||||||
| Long-term leases | 72.4 | % | 73.6 | % | ||||||||||
| Finance leases | 8.0 | 13.8 | ||||||||||||
| Subtotal | 80.4 | 87.4 | ||||||||||||
| Service leases | 5.0 | 3.5 | ||||||||||||
| Expired long-term leases, non-sale age (units on hire) | 8.4 | 6.2 | ||||||||||||
| Expired long-term leases, sale-age (units on hire) | 6.2 | 2.9 | ||||||||||||
| Total | 100.0 | % | 100.0 | % | ||||||||||
Due to our aggressive fleet investment in 2021 and the high cost of these new containers, we placed the vast majority of this equipment on long-term operating and finance leases with an average initial duration of 13 years. We have presented the above table by net book value, in addition to CEU, to better reflect the impact of these dynamics on our lease portfolio.
As of December 31, 2021, our long-term and finance leases combined had a weighted average remaining contractual term by CEU and net book value of approximately 61 months and 78 months, respectively, assuming no leases are renewed. However, we believe that many of our customers will renew operating leases for equipment that is less than sale age at the expiration of the lease. In addition, our equipment on operating leases typically remains on-hire at the contractual per diem rate for an additional six to twelve months beyond the end of the contractual lease term due to monthly drop-off volume limitations and the logistical requirements in our leases that require our customers to return the containers and chassis to specific drop-off locations.
Logistics Management, Re-leasing, Depot Management and Equipment Disposals
We believe that managing the period after our equipment's first lease is the most important aspect of our business. Successful management of this period requires disciplined logistics management, extensive re-lease capability, careful cost control and effective sales of used equipment.
Logistics Management. Since the late 1990s, the shipping industry has been characterized by large regional trade imbalances, with loaded containers generally flowing from export-oriented economies in Asia to North America and Western Europe. Because of these trade imbalances, shipping lines have an incentive to return leased containers in North America and Europe to reduce the cost of empty container backhaul. Triton attempts to mitigate the risk of these unbalanced trade flows by maintaining a large portion of our fleet on long-term and finance leases and by contractually restricting the ability of our
8
customers to return containers outside of Asian demand locations.
In addition, we attempt to minimize the costs of any container imbalances by finding local users in surplus locations and by moving empty containers as inexpensively as possible. While we believe we manage our logistics risks and costs effectively, logistical risk remains an important element of our business due to competitive pressures, changing trade patterns and other market factors and uncertainties.
Re-leasing. Since our operating leases allow customers to return containers and chassis prior to the end of their useful lives, we typically place containers and chassis on several leases during their useful lives. Initial lease transactions for new containers and chassis can usually be generated with a limited sales and customer service infrastructure because initial leases for new containers and chassis typically cover large volumes of units and are fairly standardized transactions. Used equipment, on the other hand, is typically leased out in small transactions that are structured to accommodate pick-ups and returns in a variety of locations. As a result, leasing companies benefit from having an extensive global marketing and operations infrastructure, a large number of customers, and a high level of operating contact with these customers.
Depot Management. As of December 31, 2021, we managed our equipment fleet through approximately 400 third-party owned and operated depot facilities located in 46 countries. Depot facilities are generally responsible for repairing our containers and chassis when they are returned by lessees and for storing the equipment while it is off-hire. We have a global operations group that is responsible for managing our depot contracts and they also regularly visit the depot facilities to conduct inventory and repair audits. We also supplement our internal operations group with the use of independent inspection agents.
Our leases are generally structured so that the lessee is responsible for the customer damage portion of the repair costs, and customers are billed for damages at the time the equipment is returned. We sometimes offer our customers a repair service program whereby we, for an additional payment by the lessee (in the form of a higher per-diem rate or a flat fee at off-hire), assume financial responsibility for all or a portion of the cost of repairs upon return of the equipment.
Equipment Disposals. Our in-house equipment sales group has a worldwide team of specialists that manage the sale process for our used containers and chassis from our lease fleet. We generally sell to portable storage companies, freight forwarders (who often use the containers for one-way trips) and other purchasers of used containers. We believe we are one of the world's largest sellers of used containers.
The sale prices we receive for our used containers are influenced by many factors, including the level of demand for used containers compared to the number of used containers available for disposal in a particular location, the cost of new containers, and the level of damage on the containers. While our total revenue is primarily made up of leasing revenues, gains or losses on the sale of used containers can have a significant positive or negative impact on our profitability.
Equipment Trading. We also buy and sell new and used containers and chassis acquired from third parties. We typically purchase our equipment trading fleet from container manufacturers, our shipping line customers or other sellers of used or new equipment. Trading margins are dependent on the volume of units purchased and resold, selling prices, costs paid for equipment sold and selling and administrative costs.
Locations
We have an extensive global presence, offering leasing services through 20 offices and 3 independent agencies located in 16 countries. Our extensive third-party depot network allows us to offer leasing and/or sales services in approximately 300 locations globally.
Customers
Our customers are mainly international shipping lines, though we also lease containers to freight forwarding companies and manufacturers. We believe that we have strong, long-standing relationships with our largest customers, most of whom we have done business with for more than 30 years. Our twenty largest customers account for 86% of our lease billings. The shipping industry has been consolidating for a number of years, and further consolidation could increase the portion of our revenues that come from our largest customers. Our five largest customers accounted for 60% of our lease billings, and our three largest customers accounted for 21%, 16% and 10% of our lease billings, respectively, in 2021. A default by one of our major customers could have a material adverse impact on our business, financial condition and future prospects.
9
Marketing and Customer Service
Our global marketing team and our customer service representatives are responsible for developing and maintaining relationships with senior operations staff at our shipping line customers, supporting lease negotiations and maintaining day-to-day coordination with junior level staff at our customers. This close customer communication is critical to our ability to provide customers with a high level of service, helps us to negotiate lease contracts that satisfy both our financial return requirements and our customers' operating needs, ensures that we are aware of our customers' potential equipment shortages, and provides customers knowledge of our available equipment inventories.
Credit Controls
We monitor our customers' performance and our lease exposures on an ongoing basis. Our credit management processes are aided by the long payment experience we have with most of our customers and our broad network of relationships in the shipping industry that provides current information about our customers' market reputations. Credit criteria may include, but are not limited to, customer payment history, customer financial position and performance (e.g., net worth, leverage and profitability), trade routes, country of domicile and the type of, and location of, equipment that is to be supplied.
Competition
We compete with at least five other major intermodal equipment leasing companies in addition to many smaller lessors, manufacturers of intermodal equipment, and companies offering finance leases as distinct from operating leases. It is common for our customers to utilize several leasing companies to meet their equipment needs.
Our competitors compete with us in many ways, including lease pricing, lease flexibility, supply reliability and customer service. In times of weak demand or excess supply, leasing companies often respond by lowering leasing rates and increasing the logistical flexibility offered in their lease agreements. In addition, new entrants into the leasing business are often aggressive on pricing and lease flexibility. Furthermore, customers also have the option to purchase intermodal equipment and utilize owned equipment instead of leasing, relying on their own fleets to satisfy their intermodal equipment needs and even leasing their excess container stock to other shipping companies.
While we are forced to compete aggressively on price, we attempt to emphasize our supply reliability and high level of customer service to our customers. We invest heavily to ensure adequate equipment availability in high demand locations, dedicate large portions of our organization to building customer relationships and maintaining close day-to-day coordination with customers' operating staffs, and have developed self-service systems that allow our customers to transact with us through the Internet.
Suppliers
We have long-standing relationships with all of our major suppliers. We purchase most of our equipment from third-party manufacturers based in China. There are four large manufacturers of dry containers and four large manufacturers of refrigerated containers, though for both dry containers and refrigerated containers, we estimate that the four largest manufacturers account for more than 90% of global production volume. Our procurement and engineering staff reviews the designs for our containers and periodically audits the production facilities of our suppliers. In addition, we use our procurement and engineering group and third-party inspectors to visit factories when our containers are being produced to provide an extra layer of quality control. Nevertheless, defects in our containers sometimes occur. We work with the manufacturers to correct these defects, and our manufacturers have generally honored their warranty obligations in such cases.
Systems and Information Technology
The efficient operation of our business is highly dependent on our information technology systems to track transactions, bill customers and provide the information needed to report our financial results. Our systems allow customers to facilitate sales orders and drop-off requests on the Internet, view current inventories and check contractual terms in effect with respect to any given container lease agreement. Our systems also maintain a database, which accounts for the containers in our fleet and our leasing agreements, processes leasing and sale transactions, and bills our customers for their use of and damage to our containers. We also use the information provided by these systems in our day-to-day business to make business decisions and improve our operations and customer service.
10
Segments
We operate our business in one industry, intermodal transportation equipment, and have two business segments, which also represent our reporting segments:
•Equipment leasing—Our equipment leasing operations include the acquisition, leasing, re-leasing and ultimate sale of multiple types of intermodal transportation equipment, primarily intermodal containers.
•Equipment trading—We purchase containers from shipping line customers, and other sellers of containers, and resell these containers to container retailers and users of containers for storage or one-way shipment.
Human Capital Management
We seek to attract, retain, and develop the best talent available in order to drive our continued success and achieve our business goals. Our workforce as of December 31, 2021 was comprised of approximately 237 employees located in 20 offices and 13 countries. We are not a party to any collective bargaining agreements. Our workforce was relatively flat in 2021 compared to 2020. Voluntary workforce turnover for the year was 5%.
Our approach to human capital management is underpinned by our corporate culture, which seeks to foster an inclusive and respectful work environment where employees are empowered at all levels to implement new ideas to better serve our global customer base and continuously improve our processes and operations. This culture is supported by a flat organizational structure that enables speed of decision making and execution; compensation programs that emphasize Company-wide common shared objectives; a diverse, international team that mirrors our local communities and customer base; robust training and development opportunities; and resources for employees to seek guidance and raise concerns when needed. We believe the combination of competitive compensation and benefits, career growth and development opportunities and our strong corporate culture promote increased employee tenure and reduced voluntary turnover. As of December 31, 2021, our average employee tenure was 14 years for all employees and 21 years for leadership (defined as vice president level and above). In 2021, 40% of open positions were filled with internal candidates.
As of December 31, 2021, our global workforce was approximately 60% male and 40% female. Approximately 40% of our workforce is located outside the United States, and in the U.S., approximately 30% of our workforce was comprised of racial and ethnic minorities. Triton is committed to diversity and inclusion across our Company, and we have a number of programs and initiatives in place aimed at further promoting diversity and inclusion in our organization.
In 2021, the COVID-19 pandemic had a significant impact on our human capital management. A majority of our workforce continued to work remotely for most of the year, and we instituted reduced office capacity and staggered shifts, upgraded cleaning practices, social distancing requirements and other safety measures and procedures for those employees who worked at our office locations during this time.
For additional information, please see the section titled “Human Capital Management, Talent Development and Succession Planning” in our Proxy Statement.
Environmental and Other Regulation
We face a number of environmental concerns, including potential liability due to accidental discharge from our containers, potential equipment obsolescence or retrofitting expenses due to changes in environmental regulations, and increased risk of container performance problems due to container design changes driven by environmental factors. These risks are particularly significant for our refrigerated container product line, as environmental regulations have targeted the global warming potential of chemical refrigerants and the blowing agent historically used in the insulation for refrigerated containers. Refrigerated container manufacturers have also changed the treatment process for the steel frame of refrigerated containers in a way that may lead to increased corrosion. Additional information on environmental and equipment performance risks is located in the Risk Factors section.
While we maintain environmental liability insurance coverage, and the terms of our leases and other arrangements for use of our containers place the responsibility for environmental liability on the end user, we still may be subject to environmental liability in connection with our current or historical operations. In certain countries like the United States, the owner of a leased container may be liable for the costs of environmental damage from the discharge of the contents of the container even though the owner is not at fault. Our lessees are required to indemnify us from environmental claims and our standard master tank container lease agreement insurance clause requires our tank container lessees to provide pollution liability insurance.
11
Our operations are also subject to regulations promulgated in various countries, including the United States, seeking to protect the integrity of international commerce and prevent the use of equipment for international terrorism or other illicit activities. As these regulations develop and change, we may incur increased compliance costs due to the acquisition of new, compliant equipment and/or the adaptation of existing equipment to meet new requirements imposed by such regulations. In addition, violations of these rules and regulations can result in substantial fines and penalties, including potential limitations on operations or forfeitures of assets. We may also be affected by legal or regulatory responses to supply chain disruptions that have occurred as a result of the COVID-19 pandemic.
Currency
The U.S. dollar is the operating currency for the large majority of our leases and obligations, and most of our revenues and expenses are denominated in U.S. dollars. However, we pay our subsidiaries' non-U.S. staff in local currencies, and our direct operating expenses and disposal transactions for our older containers are often structured in foreign currencies. We record realized and unrealized foreign currency exchange gains and losses primarily due to fluctuations in exchange rates related to our Euro and Pound Sterling transactions and related assets and liabilities.
Information about our Executive Officers
| Name | Age | Current Position | Position Held Since | ||||||||
| Brian M. Sondey | 54 | Chairman, Chief Executive Officer | 2016 | ||||||||
| John Burns | 61 | Senior Vice President and Chief Financial Officer | 2016 | ||||||||
| Carla Heiss | 52 | Senior Vice President, General Counsel and Secretary | 2019 | ||||||||
| John F. O'Callaghan | 61 | Executive Vice President and Global Head of Marketing & Operations | 2016 | ||||||||
| Kevin Valentine | 56 | Senior Vice President, Triton Container Sales | 2016 | ||||||||
Brian M. Sondey is our Chairman and Chief Executive Officer. Upon the closing of the merger of Triton Container International Limited ("TCIL") and TAL International Group, Inc. ("TAL") in July 2016, Mr. Sondey, who had served as Chairman, President and Chief Executive Officer of TAL since 2004, became Chairman and Chief Executive Officer of Triton. Mr. Sondey joined TAL’s former parent, Transamerica Corporation, in April 1996 as Director of Corporate Development. He then joined TAL International Container Corporation in November 1998 as Senior Vice President of Business Development. In September 1999, Mr. Sondey became President of TAL International Container Corporation. Prior to his work with Transamerica Corporation and TAL International Container Corporation, Mr. Sondey worked as a Management Consultant at the Boston Consulting Group and as a Mergers & Acquisitions Associate at J.P. Morgan. Mr. Sondey holds an MBA from The Stanford Graduate School of Business and a BA degree in Economics from Amherst College.
John Burns is our Senior Vice President and Chief Financial Officer. Upon the closing of the merger of TCIL and TAL in July 2016, Mr. Burns, who had served as the Senior Vice President and Chief Financial Officer of TAL since 2009, became the Senior Vice President and Chief Financial Officer of Triton. Mr. Burns joined TAL’s former parent, Transamerica Corporation in 1996 as Director of Internal Audit and progressed over time to positions of increasing responsibility. Prior to his work with Transamerica Corporation and TAL International Container Corporation, Mr. Burns worked as an Audit Senior Manager at Ernst & Young LLP. Mr. Burns holds a BA in Finance from the University of St. Thomas, St. Paul, Minnesota and is a certified public accountant.
Carla Heiss is our Senior Vice President, General Counsel and Secretary and has served in this role since December 2019. Prior to joining Triton, Ms. Heiss was Deputy General Counsel and Secretary at Bunge Limited, where she worked from 2003 to 2019. Prior to that, she worked as an Associate in Capital Markets and International Finance at Shearman & Sterling, LLP from 1994 to 2003. Ms. Heiss holds a J.D. degree from the George Washington University Law School and earned her B.A. degree in Government from Cornell University.
John O’Callaghan is our Executive Vice President and Global Head of Field Marketing and Operations. Upon the closing of the merger of TCIL and TAL in July 2016, Mr. O’Callaghan, who had served as the Senior Vice President for Europe, North America, South America and the Indian Subcontinent of TCIL since 2006, became the Executive Vice President, Global Head of Field Marketing & Operations of Triton. Mr. O’Callaghan joined TCIL in 1994 as Marketing Manager of Refrigerated Containers and progressed over time to positions of increasing responsibility. Prior to his work with TCIL, Mr. O’Callaghan
12
worked as an Architect at Buro Bolles Wilson, Germany & Young LLP and was also an Architect at Canary Wharf development with Koetter Kim. Mr. O’Callaghan studied engineering at Trinity College Dublin and qualified with RIBA (Royal Institute of British Architects) as an architect with the Architectural Association in London.
Kevin Valentine is our Senior Vice President of Triton Container Sales. Upon the closing of the merger of TCIL and TAL in July 2016, Mr. Valentine, who had served as the Senior Vice President of Trader and Global Operations of TAL since 2011, became the Senior Vice President of Triton Container Sales of Triton. Mr. Valentine joined TAL International Container Corporation in 1994 as Regional Marketing Manager and progressed over time to positions of increasing responsibility. Prior to his work with TAL, Mr. Valentine worked as a Marketing Manager at Tiphook Container Rental. Mr. Valentine received a BA (Hons) degree in Business from Middlesex University, London, England.
13
ITEM 1A. RISK FACTORS
Risks Related to the COVID-19 Pandemic
Our business, results of operations and financial condition could be materially adversely affected by a resurgence of the COVID-19 pandemic.
The initial outbreak of COVID-19 and the resulting imposition of work, social and travel restrictions, as well as other actions by government authorities to contain the outbreak, led to a significant decrease in global economic activity and global trade in the first half of 2020. During this time, we faced reduced container demand, decreasing utilization, market leasing rates and used container sale prices, and decreasing profitability. We also had increased concerns about customer credit risk. These market pressures eased and our performance recovered in the second half of 2020 as economic and social restrictions were lifted and global trade rebounded. However, many countries are seeing high levels of COVID-19 cases and there continues to be an elevated degree of risk and uncertainty with respect to the trajectory of the pandemic. Market conditions and our financial performance could be negatively impacted in the future by a resurgence of the pandemic.
Unique dynamics related to the COVID-19 pandemic supported very strong market conditions and our financial performance in 2021. We expect these dynamics will eventually fade.
While the outbreak of COVID-19 and imposition of economic and social restrictions had a negative impact on global trade and container demand in the first part of 2020, COVID-19 had a strongly positive impact on our market conditions beginning in the second half of 2020 and continuing through 2021. Once initial lockdown pressures eased, global goods consumption was boosted by a shift in consumer spending from services and experiences to goods, which drove a strong rebound in global trade volumes and container demand. In addition, the cycle time for containers was negatively impacted by a variety of supply chain challenges related to COVID-19, including reduced port productivity, a shortage of trucking capacity and warehouse staffing challenges. The slower velocity for containers created incremental container demand. In 2021, this strong demand for containers led to very high utilization for our container fleet, record prices for new and used containers, and very high market leasing rates. However, we anticipate that trade growth will normalize as consumers shift more spending back to services and experiences and as supply chain bottlenecks are addressed. While the timing is uncertain, we expect normalizing conditions will cause container prices, market lease rates and our key operating metrics to trend down toward historically-normal levels.
Risks Related to Our Business and Industry
The international nature of our business exposes us to numerous risks.
We are subject to numerous risks inherent in conducting business across national boundaries, any one of which could adversely impact our business. Several of these risks are discussed in more detail throughout this Risk Factors section. Additional risks of international operations include, but are not limited to:
•the imposition of tariffs or other trade barriers;
•difficulties with enforcement of lessees' obligations across various jurisdictions;
•changes in governmental policy or regulation affecting our business and industry, including as a result of the political relationship between the U.S. and other countries;
•restrictions on the transfer of funds into or out of countries in which we operate;
•political and social unrest or instability;
•nationalization of foreign assets;
•military conflicts;
•government protectionism;
•health or similar issues, including epidemics and pandemics such as the COVID-19 pandemic; and
•labor or other disruptions at key ports or at manufacturing facilities of our suppliers.
Our ability to enforce lessees’ obligations will be subject to applicable law in the jurisdiction in which enforcement is sought. As containers are used in international commerce, it is not possible to predict, with any degree of certainty, the jurisdictions in which enforcement proceedings may be commenced. For example, repossession from defaulting lessees may be difficult and more expensive in jurisdictions in which laws do not confer the same security interests and rights to creditors and lessors as those in the United States and in other jurisdictions where recovery of containers from defaulting lessees is more
14
cumbersome. As a result, the costs, relative success and expedience of collecting receivables or pursuing enforcement proceedings with respect to containers in various jurisdictions cannot be predicted.
Substantial supply chain bottlenecks and other logistical constraints such as the ones experienced in 2021 could lead to increased government regulation which may negatively impact container flows and container demand, as well as lead to higher costs of conducting business globally. Any one or more of these or other factors could adversely affect our current or future international operations and business.
Container leasing demand can be negatively affected by decreases in global trade due to global and regional economic downturns.
Overall demand for containers depends largely on the rate of world trade and economic growth. A significant downturn in global economic growth or recessionary conditions in major geographic regions can negatively affect container demand and lessors' decisions to lease containers. During economic downturns and periods of reduced trade, shipping lines tend to use and lease fewer containers, or lease containers only at reduced rates, and tend to rely more on their own fleets to satisfy a greater percentage of their requirements. As a result, during periods of weak global economic activity or reduced trade, container lessors typically experience decreased leasing demand, decreased equipment utilization, lower average rental rates, decreased leasing revenue, decreased used container resale prices and significantly decreased profitability. These effects can be and have been severe.
Increased tariffs or other trade actions could adversely affect our business, financial condition and results of operations.
The international nature of our business and the container shipping industry exposes us to risks relating to the imposition of import and export duties, quotas and tariffs. These risks have increased recently as the United States and other countries have adopted protectionist trade policies and as companies look to on-shoring or near-shoring their production to address material and parts shortages and/or increased costs due to these actions. Trade growth and demand for leased containers decreased significantly from 2018 to 2019 due to a trade dispute between the U.S. and China that led to both countries imposing tariffs on imported goods from the other. While the United States and China agreed in January 2020 to limit further actions, tariffs and other trade barriers remain historically high and key areas of difference remain unresolved and tensions have remained elevated. Given the importance of the United States and China in the global economy, continued tensions between these countries could significantly reduce the volume of goods traded internationally and reduce the rate of global economic growth. Increased trade barriers and the risk of further disruptions is also motivating some manufacturers and retailers to reduce their reliance on overseas production and could reduce the long-term growth rate for international trade, leading to decreased demand for leased containers, lower new container prices, decreased market leasing rates and lower used container disposal prices. These impacts could have a materially adverse effect on our business, profitability and cash flows.
We face extensive competition in the container leasing industry.
The container leasing and sales business is highly competitive. We compete with five other major leasing companies, many smaller container lessors, equipment financing companies, and manufacturers of container equipment, who sometimes lease and finance containers directly with our shipping line customers. Some of these competitors may have greater financial resources and access to capital than us and may have lower investment return expectations. Additionally, some of these competitors may, at times, accumulate a high volume of underutilized inventories of containers, which could lead to significant downward pressure on lease rates and margins. As market conditions evolve, we may see new competition entering the market.
Competition among container leasing companies involves many factors, including, among others, lease rates, lease terms (including lease duration, and drop-off and repair provisions), customer service, and the location, availability, quality and individual characteristics of equipment. In addition, new technologies and the expansion of existing technologies, such as digitalization and expanded online services, may increase competitive pressures in our industry. The highly competitive nature of our industry may reduce our lease rates and margins and undermine our ability to maintain our current level of container utilization or achieve our growth plans.
Our customers may decide to lease fewer containers. Should shipping lines decide to buy a larger percentage of the containers they operate, our utilization rate and level of investment would decrease, resulting in decreased leasing revenues, increased storage costs, increased repositioning costs and lower growth.
We, like other suppliers of leased containers, are dependent upon decisions by shipping lines to lease rather than buy their container equipment. Shipping lines were exceptionally profitable in 2021, which could lead to increased investment in their
15
container fleets. Should shipping lines decide to buy a larger percentage of the containers they operate, our utilization rate would decrease, resulting in decreased leasing revenues, increased storage costs and increased repositioning costs. A decrease in the portion of leased containers operated by shipping lines would also reduce our investment opportunities and significantly constrain our growth. Most of the factors affecting the lease versus buy decisions of our customers are outside of our control.
Market leasing rates may decrease due to a decrease in new container prices, weak leasing demand, increased competition or other factors.
Market leasing rates have historically varied widely and changed suddenly. Market leasing rates are typically a function of, among other things, new equipment prices (which are heavily influenced by steel prices), interest rates, the type and length of the lease, the equipment supply and demand balance at a particular time and location, and other factors described in this “Risk Factors” section.
A decrease in market leasing rates negatively impacts the leasing rates on both new container investments and the existing containers in our fleet. Most of our existing containers are on operating leases, with lease terms shorter than the expected life of the container, thus the lease rate we receive for the container is subject to change at the expiration of the current lease. The profitability impact of decreasing lease rates on existing containers can be particularly severe since it leads to a reduction in revenue with no corresponding reduction in investment or expenses.
We are exposed to customer credit risk, including the risk of lessee defaults.
Our containers and chassis are leased to numerous customers, who are responsible to pay lease rentals and other charges, including repair fees and costs for damage to or loss of equipment. Some of our customers are privately owned and do not provide detailed financial information regarding their operations. Our customers could incur financial difficulties, or otherwise have difficulty making payments to us when due for any number of factors which we may be unable to anticipate. A delay or diminution in amounts received under the leases, or a default in the performance of our lessees' obligations under the leases could adversely affect our business, financial condition, results of operations and cash flows and our ability to make payments on our debt.
In addition, when lessees default, we may fail to recover all of our equipment, and the equipment we do recover may be returned in damaged condition or to locations where we may not be able to efficiently re-lease or sell the equipment. As a result, we may have to repair our equipment and reposition it to other locations and we may lose lease revenues and incur significant operating expenses. We also often incur extra costs when repossessing containers from a defaulting lessee. These costs typically arise when our lessee has also defaulted on payments owed to container terminals or depot facilities where the repossessed containers are located. In such cases, the terminal or depot facility may delay or bar us from taking possession of our containers or sometimes seek to have us repay a portion of the lessee's unpaid bills as a condition to releasing the containers back to us.
While the container shipping industry experienced improved profitability in 2020 and 2021, the industry has generally been characterized by excess vessel capacity and weak financial performance. A number of our customers generated significant financial losses in the years prior to 2021. In addition, the potential impact of a customer default has increased due to the large volume of high-priced containers purchased and leased out in 2021. If a customer defaults in the future and new equipment prices and market lease rates have returned to historical long-term averages, the impact of such a default would likely be greater than our historical experience. In addition, following the bankruptcy of Hanjin Shipping Co. Ltd. in 2016, it has become more difficult and expensive to obtain credit insurance in our industry and we have chosen not to purchase credit insurance policies. As a result, a major customer default could have a significant adverse impact on our business, financial condition and cash flows.
Our customer base is highly concentrated. A default by or significant reduction in leasing business from any of our large customers could have a material adverse impact on our business and financial performance.
Our five largest customers represented approximately 60% of our lease billings in 2021. Our single largest customer, CMA CGM S.A., represented approximately 21% of lease billings in 2021, our second largest customer Mediterranean Shipping Company S.A., represented approximately 16% of lease billings in 2021, and our third largest customer, Ocean Network Express, represented approximately 10% of lease billings in 2021. Furthermore, the shipping industry has been consolidating for a number of years, and further consolidation could increase the portion of our revenues that come from our largest customers. Given the high concentration of our customer base, a default by or a significant reduction in future lease
16
transactions with any of our major customers could materially reduce our leasing revenues, profitability, liquidity and growth prospects.
We purchase containers from a small number of container manufacturers primarily based in China, potentially limiting our ability to maintain an adequate supply of containers and increasing our risk of negative outcomes from any manufacturing disputes.
The vast majority of intermodal containers are currently manufactured in China, and we currently purchase substantially all of our dry, refrigerated, special, and tank containers from third-party manufacturers based there. In addition, the container manufacturing industry in China is highly concentrated. In the event that it were to become more difficult or more expensive for us to procure containers in China because of further consolidation among container suppliers, reduced production by our suppliers, increased tariffs imposed by the United States or other governments or for any other reason, we may be unable to fully pass these increased costs through to our customers in the form of higher lease rates and we may not be able to adequately invest in and grow our container fleet.
Additionally, we may face significant challenges in the event of disputes with container manufacturers due to the limited number of potential alternative suppliers and higher uncertainty of outcomes for commercial disputes in China. Such disputes could involve manufacturers’ warranties or manufacturers’ ability and willingness to comply with key terms of our purchase agreements such as container quantities, container quality, delivery timing and price.
Manufacturers of equipment may be unwilling or unable to honor manufacturer warranties covering defects in our equipment or we may incur significant increased costs or reductions in the useful life of equipment due to changes in manufacturing processes, which could adversely affect our business, financial condition and results of operations.
We obtain warranties from the manufacturers of equipment that we purchase. When defects in the containers occur, we work with the manufacturers to identify and rectify the problems. However, there is no assurance that manufacturers will be willing or able to honor warranty obligations. In addition, manufacturers’ warranties typically do not cover the full expected life of our containers. If the manufacturer is unwilling or unable to honor warranties covering failures occurring within the warranty period or if defects are discovered in containers that are no longer covered by manufacturers' warranties, we could be required to expend significant amounts of money to repair the containers, the useful lives of the containers could be shortened and the value of the containers reduced.
Several key container components and manufacturing processes have undergone changes over the last several years, in many cases due to environmental concerns. These changes include, but are not limited to, the following:
•Changes in paint application systems to water-based from solvent-based;
•Changes to the wood floorboard materials to farm-grown woods from tropical hard woods; and
•Changes to insulation foaming processes for the walls of refrigerated containers.
These changes have not yet proven their durability over the typical 12 to 15 year life of a container in a marine environment. In addition, due to increased container demand in 2021, manufacturers significantly accelerated their rate of production in order to keep pace with demand. The impact of these and future changes in manufacturing processes or materials on the quality and durability of our equipment is uncertain and may result in increased costs to maintain or a significant reduction in the useful life of the equipment.
Used container sales prices are volatile and sale prices can fall below our accounting residual values, leading to losses on the disposal of our equipment.
Although our revenues primarily depend upon equipment leasing, our profitability is also affected by the gains or losses we realize on the sale of used containers because, in the ordinary course of our business, we sell certain containers when they are returned by customers upon lease expiration. The volatility of the selling prices and gains or losses from the disposal of such equipment can be significant. Used container selling prices, which can vary substantially, depend upon, among other factors, the cost of new containers, the global supply and demand balance for containers generally, the location of the containers, the supply and demand balance for used containers at a particular location, the physical condition of the container and related refurbishment needs, materials and labor costs and obsolescence of certain equipment or technology. Most of these factors are outside of our control.
17
Containers are typically sold if it is in our best interest to do so after taking into consideration local and global leasing and sale market conditions and the age, location and physical condition of the container. As these considerations vary, gains or losses on sale of equipment will also fluctuate and may be significant if we sell large quantities of containers.
Used container selling prices and the gains or losses that we have recognized from selling used containers have varied widely. In 2015 and 2016, used container prices dropped to levels below our estimated residual values, resulting in significant losses on sale of leasing equipment. Used container sale prices rebounded significantly in 2017 and 2018, declined in 2019, and again rebounded significantly beginning in the second half of 2020 and continuing throughout 2021. If disposal prices were to fall back below our residual values for an extended period, it would have a significantly negative impact on our profitability and cash flows.
Equipment trading results have been highly volatile and are subject to many factors outside of our control.
The profitability of our equipment trading activities has varied widely. Our ability to sustain a high level of equipment trading profitability will require securing large volumes of additional trading equipment and continuing to achieve high selling margins. Several factors could limit our trading volumes. Shipping lines that have sold containers to us could develop other means for disposing of their equipment or develop their own sales networks. In addition, we may limit our purchases if we have concerns that used container selling prices might decrease. Our equipment trading results would also be negatively impacted by a reduction in our selling margins by increased competition for purchasing trading containers or by decreased sales prices. If sales prices rapidly deteriorate and we hold a large inventory of equipment that was purchased when prices for equipment were higher, we may incur significant losses.
A number of key personnel are critical to the success of our business.
We have senior executives and other management level employees with extensive industry experience. We rely on this knowledge and experience in our strategic planning and in our day-to-day business operations. Our success depends in large part upon our ability to retain our senior management, the loss of one or more of whom could have a material adverse effect on our business. Our success also depends on our ability to retain our experienced sales team and technical personnel, as well as to recruit new skilled sales, marketing and technical and other support personnel. Competition for experienced managers in our industry can be intense. If we fail to retain and recruit the necessary personnel, our business and our ability to retain customers and provide acceptable levels of customer service could suffer.
We may incur future asset impairment charges.
An asset impairment charge may result from the occurrence of an adverse change in market conditions, unexpected adverse events or management decisions that impact our estimates of expected cash flows generated from our long-lived assets. We review our long-lived assets, including our container and chassis equipment, goodwill and other intangible assets, for impairment when events or changes in circumstances indicate that the carrying value of an asset may not be recoverable. We may be required to recognize asset impairment charges in the future as a result of reductions in demand for specific container and chassis types, a weak economic environment, challenging market conditions, events related to particular customers or asset types, or as a result of asset or portfolio sale decisions by management. The likelihood that we could incur asset impairment charges increases during periods of low new container prices, low market lease rates and low used container selling prices.
In addition, while used container selling prices are currently above our estimated residual values, they are extremely volatile and if disposal prices fall below our residual values for an extended period, we would likely need to revise our estimates for residual values. Decreasing estimates for residual values would result in an immediate impairment charge on containers older than the estimated useful life in our depreciation calculations, and would result in increased depreciation expense for all of our other containers in subsequent periods. Asset impairment charges could significantly impact our profitability and could potentially cause us to breach the financial covenants contained in some or all of our debt agreements. The impact of asset impairment charges and a potential covenant default could be severe.
We may incur significant costs associated with relocation of leased equipment.
When lessees return equipment to locations where supply exceeds demand, containers are routinely repositioned to higher demand areas. Positioning expenses vary depending on geographic location, distance, freight rates and other factors. Positioning expenses can be significant if a large portion of our containers are returned to locations with weak demand. We seek to limit the number of containers that can be returned to areas where demand is not expected to be strong. However, future market conditions may not enable us to continue such practices. In addition, we may not be successful in accurately
18
anticipating which port locations will be characterized by weak or strong demand in the future, and current contracts will not provide much protection against positioning costs if ports that are expected to be strong demand ports turn out to be low demand ports when the equipment is returned. In particular, many of our lease contracts are structured so that most containers will be returned to areas with current strong demand, especially major ports in China. If the economy in China continues to evolve in a way that leads to less focus on manufacturing and exports and more focus on consumer spending, imports and services, we may face large positioning costs in the future to relocate containers dropped off into China.
It may become more expensive for us to store our off-hire containers.
We are dependent on third-party depot operators to repair and store our equipment in port areas throughout the world. In many of these locations, the land occupied by these depots is increasingly being considered as prime real estate. Accordingly, some depots are seeking to increase the rates we pay to store our containers, and some local communities are increasing restrictions on depot operations which increase their costs of operation and, in some cases, force depots to relocate to sites further from the port areas. Additionally, depots in prime locations may become filled to capacity based on market conditions and may refuse additional containers due to space constraints. As a result of these factors, the cost of maintaining and storing our off-hire containers could increase significantly.
Severe weather, climate change, international hostilities, terrorist attacks or other catastrophic events could negatively impact our operations and profitability and may expose us to liability.
Catastrophic natural events such as hurricanes, earthquakes, or fires, or other events, such as chemical explosions or other industrial accidents could lead to extensive damage to our equipment, significant disruptions to trade and reduced demand for containers. In addition, climate change could worsen some of these risks and lead to economic instability and extensive disruptions to world trade. These events could also impact the profitability of our customers and lead to higher credit risk. The incidence, severity and consequences of any of these events are unpredictable.
Military conflicts or other serious international disputes could also significantly impact our business. International conflicts often lead to economic sanctions and decreased trade activity and military conflicts often involve the blockade of ports. A serious conflict involving major global trading partners could have a material impact on global trade, the demand for containers, our profitability and our customers’ ability to honor their lease obligations.
It is also possible that our containers could be involved in a terrorist attack. Although our lease agreements typically require our customers to indemnify us against all damages and liabilities arising out of the use of our containers and we carry insurance to potentially offset any costs in the event that our customer indemnifications prove to be insufficient, our insurance does not cover certain types of terrorist attacks. We may also experience reputational harm from a terrorist attack in which one of our containers is involved.
Risks Related to Our Indebtedness and Liquidity
We have a substantial amount of debt outstanding and have significant debt service requirements. Our high level of indebtedness may reduce our financial flexibility, impede our ability to operate and increase our risk of default.
We use substantial amounts of debt to fund our operations, particularly our purchase of equipment. As of December 31, 2021, we had outstanding indebtedness of approximately $8,562.5 million under our debt facilities. Total interest and debt expense for the year ended December 31, 2021 was $222.0 million.
Our substantial amount of debt could have important consequences for investors, including:
•making it more difficult for us to satisfy our obligations with respect to our debt facilities, which could result in an event of default under the agreements governing such indebtedness and potentially lead to insolvency;
•requiring us to dedicate a substantial portion of our cash flow from operations to make payments on our debt, thereby reducing funds available for operations, capital expenditures, future business opportunities and other purposes;
•limiting our flexibility in planning for, or reacting to, changes in our business and the industry in which we operate;
▪reducing our profit margin and investment returns on new container investments if we are unable to pass along increases in our cost of financing to our customers through higher lease rates,
•making it difficult for us to pay dividends on or repurchase our common and preferred shares;
19
•increasing our vulnerability to general adverse economic and industry conditions, including changes in interest rates; and
•placing us at a competitive disadvantage compared to our competitors having less debt.
We may also incur substantial additional indebtedness in the future. To the extent that new indebtedness is added to current debt levels, the risks described above would increase.
We may not be able to refinance any of our indebtedness on commercially reasonable terms or at all.
During difficult market environments, lenders to the container leasing industry may become more cautious, decreasing our sources of available debt financing and increasing our borrowing costs. In addition, we are the largest container leasing exposure for many of our lenders, and the amount of incremental loans available from our existing lenders may become constrained due to single-name credit limitations. If we cannot refinance our indebtedness, we may have to take actions such as selling assets, seeking equity capital or reducing or delaying future capital expenditures or other business investments, which could have a material adverse impact on our growth rate, profitability, share price and cash flows. Such actions, if necessary, may not be effected on commercially reasonable terms.
Our credit facilities impose significant operating and financial restrictions, which may prevent us from pursuing certain business opportunities and taking certain actions.
Our credit facilities and other indebtedness impose, and the terms of any future indebtedness may impose, significant operating, financial and other restrictions on us and our subsidiaries. These restrictions may limit or prohibit, among other things, our ability to:
•incur additional indebtedness;
•pay dividends on or redeem or repurchase our shares;
•make loans and investments;
•create liens;
•sell certain assets or merge with or into other companies;
•enter into certain transactions with our shareholders and affiliates;
•cause our subsidiaries to make dividend, distributions and other payments to us; and
•otherwise conduct necessary corporate activities.
These restrictions could adversely affect our ability to finance our future operations or capital needs and pursue available business opportunities. In addition, certain agreements governing our indebtedness contain financial maintenance covenants that require us to satisfy certain ratios such as maximum leverage and minimum interest coverage. A breach of any of the above restrictions or financial covenants could result in an event of default in respect of the related indebtedness. If a default occurs, the relevant lenders could elect to declare the indebtedness to be immediately due and payable and proceed against any collateral securing that indebtedness.
Our ability to obtain debt financing and our cost of debt financing is, in part, dependent upon our credit ratings and outlook. A credit downgrade or being placed on negative watch could adversely impact our liquidity, access to capital markets and our financial results.
Maintaining our credit ratings depends on our financial results and on other factors, including the outlook of the rating agencies on our sector and on the debt capital markets generally. A credit rating downgrade or being placed on negative watch may make it more difficult or costly for us to raise debt financing, resulting in a negative impact on our liquidity and financial results.
A significant increase in our borrowing costs could negatively affect our financial condition, cash flow and results of operations.
Our lease rental stream is generally fixed over the life of our leases whereas our interest costs can vary over time. The interest rates on our debt financings have several components, including credit spreads and underlying benchmark rates. We employ various hedging strategies to mitigate this interest rate risk. Our hedging strategies rely considerably on assumptions and projections regarding our assets and lease portfolio as well as general market factors. If any of these assumptions or projections prove to be incorrect or our hedges do not adequately mitigate the impact of changes in interest rates, we may experience volatility in our earnings that could adversely affect our profitability and financial condition. In addition, we may
20
not be able to find market participants that are willing to act as our hedging counterparties on acceptable terms or at all, which could have an adverse effect on the success of our hedging strategies.
The expected discontinuation of the LIBOR benchmark interest rate may have an impact on our business.
On July 27, 2017, the U.K. Financial Conduct Authority (the "FCA"), which regulates LIBOR, announced that it will no longer persuade or compel banks to submit rates for the calculation of LIBOR after 2021. On March 5, 2021, the FCA announced in a public statement the future cessation of LIBOR benchmark settings. Based on this announcement, we expect that the 1-month LIBOR rate that we currently use in our credit facilities and interest rate swap agreements will cease to be published on June 30, 2023.
In the United States, the Secured Overnight Finance Rate ("SOFR") has emerged as the preferred alternative rate for LIBOR following its discontinuation. SOFR is a broad measure of the cost of borrowing cash overnight collateralized by Treasury securities in the repurchase agreement market. At this time, it is not possible to predict how markets will respond to SOFR or other alternative reference rates. In addition, it is uncertain what methods of calculating a replacement rate will be adopted generally or whether different industry bodies, such as the loan market and the derivatives market, will adopt the same methodologies.
As of December 31, 2021, we had $3,116.0 million of total debt outstanding under facilities with interest rates based on floating-rate indices. In addition, we had $1,929.7 million notional value of interest rate swaps in place that are indexed to LIBOR. Our credit facilities include fallback language that generally would result in SOFR automatically replacing LIBOR at the time of its discontinuance. We cannot predict what the impact of such replacement rate would be to our interest expense. The Company's swap agreements are governed by the International Swap Dealers Association ("ISDA"), which has developed fallback language for swap agreements and has established guidelines to allow counterparties to modify historical trades to include the new fallback language. Potential changes to the underlying floating-rate indices and reference rates may have an adverse impact on our agreements indexed to LIBOR and could have a negative impact on our profitability and cash flows. Furthermore, we cannot predict or quantify the time, effort and cost required to transition to the use of new benchmark rates, including with respect to negotiating and implementing any necessary changes to existing contractual arrangements, and implementing changes to our systems and processes. We continue to evaluate the operational and other effects of such changes.
Risks Related to Information Technology and Data Security
We rely on our information technology systems to conduct our business. If there are disruptions and these systems fail to adequately perform their functions, or if we experience an interruption in our operations, our business and financial results could be adversely affected.
The efficient operation of our business is highly dependent on our information technology systems, including our transaction tracking and billing systems and our customer interface systems. These systems allow customers to facilitate sales orders and drop-off requests, view current inventory and check contractual terms in effect with respect to any given container lease agreement. These systems also process and track transactions, such as container pick-ups, drop-offs and repairs, and bill customers for the use of and damage to our equipment. If our information technology systems are damaged or an interruption is caused by a computer systems failure, viruses, security breach, hacker attack, ransom attack, fire, natural disasters or power loss, we may not be able to accurately bill our customers for the containers they have on lease and the disruption to our normal business operations and impact on our costs, competitiveness and financial results could be significant.
Security breaches and other disruptions could compromise our information technology systems and expose us to liability, which could cause our business and reputation to suffer.
In the ordinary course of our business, we collect and store sensitive data on our systems and networks, including our proprietary business information and that of our customers and suppliers, and personally identifiable information of our customers and employees. The secure storage, processing, maintenance and transmission of this information is critical to our operations. Despite the security measures we employ, our information technology systems and networks may be vulnerable to attacks by hackers or breached due to employee error, malfeasance or other disruptions. Any such breach could compromise such systems and networks and the information stored therein could be accessed, publicly disclosed and/or lost or stolen. Any such access, disclosure or other loss of information could result in legal claims or proceedings, liability under laws that protect the privacy of personal information, disruption to our operations, damage to our reputation and/or loss of competitive position.
21
Risks Related to Legal, Tax, and Other Regulatory and Compliance Matters
We may incur increased costs or be required to comply with increased restrictions due to the implementation of government regulations.
Trade and transportation activity is regulated in most major economies. International containers and container leasing companies have historically not been heavily impacted by regulations since containers have typically been viewed as international assets. However, many governments, including the United States, are considering increased regulation of containerized trade in response to supply chain disruptions and increased transportation costs in 2021. We could incur increased costs and face operational complexity under new regulations. For example, draft legislation in the United States would subject shipping lines to liability for failure to provide containers to exporters in consideration of reasonably foreseeable export demand, which might eventually lead to increased oversight of container suppliers, including container leasing companies.
We also may become subject to regulations seeking to protect the integrity of international commerce and prevent the use of containers for international terrorism or other illicit activities. For example, the Container Safety Initiative, the Customs-Trade Partnership Against Terrorism and Operation Safe Commerce are among the programs administered by the U.S. Department of Homeland Security that are designed to enhance security for containerized cargo entering and leaving the United States. Moreover, the International Convention for Safe Containers (“CSC”) applies to containers and seeks to maintain a high level of safety of human life in the transport and handling of containers by providing uniform international safety regulations. As these regulations develop and change, we may incur increased costs for the acquisition of new, compliant containers and/or the adaptation of existing containers to meet any new requirements imposed by such regulations. Additionally, certain companies are currently developing or may in the future develop products designed to enhance the security of containers transported in international commerce. We may incur increased costs associated with the adoption of these products, which could have a material adverse effect on our business, financial condition, results of operations and cash flows.
The lack of an international title registry for containers increases the risk of ownership disputes.
There is no internationally recognized system for recording or filing to evidence our title to containers nor is there an internationally recognized system for filing security interests in containers. Although this has not occurred to date, the lack of an international title recordation system for containers could result in disputes with lessees, end-users, or third parties who may improperly claim ownership of the containers.
If we fail to comply with applicable regulations that impact our international operations, our business, results of operations or financial condition could be adversely affected.
Due to the international scope of our operations, we are subject to a numerous laws and regulations, including economic sanctions, anti-corruption, anti-money laundering, import and export and similar laws. Recent years have seen a substantial increase in the enforcement of many of these laws in the United States and other countries. Any failure or perceived failure to comply with existing or new laws and regulations may subject us to significant fines, penalties, criminal and civil lawsuits, forfeiture of significant assets, and other enforcement actions in one or more jurisdictions, result in significant additional compliance requirements and costs, increase regulatory scrutiny of our business, result in the loss of customers, restrict our operations and limit our ability to grow our business, adversely affect our results of operations, and harm our reputation.
Environmental regulations and liability may adversely affect our business and financial condition.
We are subject to U.S. federal, state, local and foreign laws and regulations relating to the protection of the environment, including those governing the discharge of pollutants to air and water, the management and disposal of hazardous substances and wastes and the cleanup of contaminated sites. We could incur substantial costs, including cleanup costs, fines and third-party claims for property damage and personal injury, as a result of violations of or liabilities under environmental laws and regulations in connection with our or our lessees’ current or historical operations. Under some environmental laws in the United States and certain other countries, the owner of a leased container may be liable for environmental damage, cleanup or other costs in the event of a spill or discharge of material from a container without regard to the owner's fault. Our insurance coverage and any indemnities provided by our lessees may be insufficient to compensate us for losses arising from environmental damage.
Changes in laws and regulations, or actions by authorities under existing laws or regulations, to address greenhouse gas emissions and climate change could negatively impact our and our customers’ business. For example, restrictions on emissions
22
could significantly increase costs for our customers whose operations require significant amounts of energy. Customers’ increased costs could reduce their demand to lease our assets. Additionally, many countries, including the United States, restrict, prohibit or otherwise regulate the use of chemical refrigerants due to their ozone depleting and global warming effects. Our refrigerated containers currently use various refrigerants. Manufacturers of cooling machines for refrigerated containers have begun selling units that utilize alternative refrigerants, as well as natural refrigerants such as carbon dioxide, that may have less global warming potential than current refrigerants. If future regulations prohibit the use or servicing of containers using current refrigerants, we could be forced to incur large retrofitting expenses. In addition, refrigerated containers that are not retrofitted may become difficult to lease, command lower rental rates and disposal prices, or may have to be scrapped.
Also, historically, the foam insulation in the walls of refrigerated intermodal containers required the use of a blowing agent that contained CFCs. The manufacturers producing our refrigerated containers have eliminated the use of this blowing agent in the manufacturing process, but a large number of our refrigerated containers manufactured prior to 2014 contain these CFCs. The EU prohibits the import and the placing on the market in the EU of intermodal containers with insulation made with such process. However, we believe international conventions governing free movement of intermodal containers allow the use of such intermodal refrigerated containers in the EU if they have been admitted into EU countries on temporary customs admission. We have procedures in place that we believe comply with the relevant EU and country regulations. If such intermodal refrigerated containers exceed their temporary customs admission period and/or their customs admission status changes and such intermodal refrigerated containers are deemed placed on the market in the EU, or if our procedures are deemed not to comply with EU or a country’s regulation, we could be subject to fines and penalties. Also, if future international regulations change, we could be forced to incur large retrofitting expenses and those containers that are not retrofitted may become more difficult to lease and command lower rental rates and disposal prices. Potential consequences of changes in laws and regulations addressing climate change and other environmental impacts could have a material adverse effect on our financial condition and results of operations and cash flows.
Future U.S. tax rule changes that result in tax rate increases or a reduction in our level of continuing investment in U.S. subsidiaries may subject us to unanticipated tax liabilities that may have a material adverse effect on our results of operations and cash flows.
We are a Bermuda company, however, a significant portion of our operations is subject to taxation in the U.S. Our U.S. subsidiaries record tax provisions in their financial statements based on current tax rates. If there was an increase in the tax rate due to changes in enacted tax laws, our tax provision and effective tax rate would increase and our results of operations would be negatively impacted.
Furthermore, certain of these subsidiaries currently do not pay any meaningful U.S. income taxes primarily due to the benefit they currently receive from accelerated tax depreciation of their container investments. However, the long duration of recent leases has limited the accelerated tax depreciation benefits of container investments, and as a result, we have limited the container investments made by the U.S. subsidiaries.
We expect this reduced investment in containers by the U.S. subsidiaries to result in an increase in cash tax payments in the future. A change in rules governing the tax depreciation for these U.S. subsidiaries' containers could further reduce or eliminate this tax benefit and further increase the U.S. subsidiaries' cash tax payments.
Beginning in 2022, a company's U.S. net interest expense deduction will be limited to 30% of its current year taxable income before net interest expense. Additionally, proposed legislation would, if enacted, potentially further limit a company’s U.S. net interest expense deduction. In future years, the benefit our U.S. subsidiaries receive from accelerated tax depreciation of their container investments is expected to result in annual interest expense limitations, which may significantly increase these U.S. subsidiaries' cash tax payments and our overall effective tax rate.
We may be subject to unanticipated tax liabilities due to future foreign tax rule changes that may have a material adverse effect on our results of operations.
We are a Bermuda company, and we believe that the income derived from our operations will not be subject to tax in Bermuda, which currently has no corporate income tax. We further believe that a significant portion of the income derived from our operations will not be subject to tax in many other countries in which our customers or containers are located. However, this belief is also based on our understanding of the tax laws of the countries in which our customers use containers. The tax positions we take in various jurisdictions are subject to review and possible challenge by taxing authorities and to possible changes in law or rates that may have retroactive effect.
23
The Organization for Economic Co-operation and Development (“OECD”) is coordinating a global effort to reform certain aspects of the international tax system. This effort included the December 2021 release of model rules for a 15% global minimum tax regime. If these model rules are partially or fully implemented globally, we expect an increase to our annual global income tax expense and potentially an increase in our annual global income tax payments.
Related to these efforts, Bermuda implemented the Economic Substance Act 2018 which requires affected Bermuda registered companies to maintain a substantial economic presence in Bermuda. This legislation and/or other OECD efforts could require us to incur substantial additional costs to maintain compliance, result in the imposition of significant penalties, create additional tax liabilities globally, and possibly require us to re-domicile our company or any Bermuda subsidiary to a jurisdiction with higher tax rates. Our results of operations could be materially and adversely affected if we become subject to these or other unanticipated tax liabilities.
Our U.S. investors could suffer adverse tax consequences if we are characterized as a passive foreign investment company for U.S. federal income tax purposes.
Based upon the nature of our business activities, we may be classified as a passive foreign investment company ("PFIC") for U.S. federal income tax purposes. Such characterization could result in adverse U.S. tax consequences for direct or indirect U.S. investors in our common and preferred shares. For example, if we are a PFIC, our U.S. investors could become subject to increased tax liabilities under U.S. tax laws and regulations and could become subject to burdensome reporting requirements. The determination of whether or not we are a PFIC is made on an annual basis and depends on the composition of our income and assets from time to time. Specifically, for any taxable year, we will be classified as a PFIC for U.S. tax purposes if either:
•75% or more of the our gross income in a taxable year is passive income; or
•the average percentage of our assets (which includes cash) by value in a taxable year which produce or are held for the production of passive income is at least 50%.
Based on the composition of our income and valuation of our assets, we do not expect that we should be treated as a PFIC for the current taxable year or for the foreseeable future. However, because the PFIC determination in our case is made by taking into account all of the relevant facts and circumstances regarding our business without the benefit of clearly defined bright line rules, it is possible that we may be a PFIC for any taxable year or that the U.S. Internal Revenue Service (the "IRS") may challenge our determination concerning our PFIC status. U.S. investors should consult their own tax advisors regarding the application of the PFIC rules, including the availability of any elections that may mitigate adverse U.S. tax consequences in the event that we are or become a PFIC.
Risks Related to Owning Our Common or Preferred Shares
The price of our common and preferred shares has been highly volatile and may decline regardless of our operating performance.
The trading price of our common and preferred shares has been and may remain highly volatile. Factors affecting the trading price of our common and preferred shares may include:
•broad market and industry factors, including global and political instability, trade actions and interest rate and currency changes;
•variations in our financial results;
•changes in financial estimates or investment recommendations by securities analysts following our business;
•the public's response to our press releases, other public announcements and filings with the SEC;
•changes in accounting standards, policies, guidance or interpretations or principles;
•future sales of common shares by our directors, officers and significant shareholders;
•announcements of technological innovations or enhanced or new products by us or our competitors;
•the failure to achieve operating results consistent with securities analysts' projections;
•the operating and stock price performance of other companies that investors may deem comparable to us;
•changes in our dividend policy and share repurchase programs;
•fluctuations in the worldwide equity markets;
•recruitment or departure of key personnel;
•failure to timely address changing customer preferences; and
24
•other events or factors, including those resulting from the perceived or actual threat of impending natural disasters, coups, terrorism, war, or other armed conflict, as well as the actual occurrence of such events or responses to such events.
In addition, if the market for intermodal equipment leasing company stocks or the stock market in general experiences a loss of investor confidence, the trading price of our common and preferred shares could decline for reasons unrelated to our business or financial results. The trading price of our common and preferred shares might also decline in reaction to events that affect other companies in our industry even if these events do not directly affect us.
If securities analysts do not publish research or reports about our business or if they downgrade our shares, the price of our common shares could decline.
The trading market for our common shares relies in part on research and reports that industry or financial analysts publish about us, our business or our industry. We have no influence or control over the decisions or opinions of these analysts. In addition, regulatory changes such as Markets in Financial Instruments Regulation (MiFIR) have led to a reduction in the number of sell side research analysts covering companies of our size and our industry. If more of these analysts cease coverage of us, we could lose visibility in the market, which in turn could cause our share price to decline. Furthermore, if one or more analysts covering our Company downgrades our shares, the price of our shares could decline.
Future sales of our common or preferred shares, or the perception in the public markets that such sales may occur, may depress our share price.
The issuance of additional common and preferred shares or other equity securities or securities convertible into equity by us for financing or in connection with our incentive plans, acquisitions or otherwise may dilute the economic and voting rights of our existing shareholders or reduce the market price of our common and preferred shares or both. Sales or other issuances of substantial amounts of our common or preferred shares, or the perception that such sales could occur, could adversely affect the price of our common and preferred shares and could impair our ability to raise capital through the sale of additional shares.
We are incorporated in Bermuda and a significant portion of our assets are located outside the United States. As a result, it may not be possible for shareholders to enforce civil liability provisions of the federal or state securities laws of the United States against the Company. Additionally, Bermuda law differs from the laws of the United States and may afford less protections to shareholders.
We are incorporated under the laws of Bermuda and a significant portion of our assets are located outside the United States. It may not be possible to enforce court judgments obtained in the United States against us in Bermuda or in countries, other than the United States, where we will have assets, based on the civil liability provisions of the federal or state securities laws of the United States. In addition, there is some doubt as to whether the courts of Bermuda and other countries would recognize or enforce judgments of United States courts obtained against us or our officers or directors based on the civil liability provisions of the federal or state securities laws of the United States or would hear actions against us or those persons based on those laws. We have been advised by our legal advisors in Bermuda that the United States and Bermuda do not currently have a treaty providing for the reciprocal recognition and enforcement of judgments in civil and commercial matters. Therefore, a final judgment for the payment of money rendered by any federal or state court in the United States based on civil liability, whether or not based solely on United States federal or state securities laws, would not automatically be enforceable in Bermuda. Similarly, those judgments may not be enforceable in countries, other than the United States, where we have assets.
Additionally, our shareholders might have more difficulty protecting their interests than would shareholders of a corporation incorporated in a jurisdiction of the United States. As a Bermuda company, we are governed by the Bermuda Companies Act. The Bermuda Companies Act differs in some material respects from laws generally applicable to United States corporations and shareholders, including the provisions relating to interested directors, mergers, amalgamations and acquisitions, takeovers, shareholder lawsuits and indemnification of directors.
Certain provisions of our bye-laws and Bermuda law could hinder, delay or prevent a change in control that you might consider favorable, which could also adversely affect the price of our common shares.
Certain provisions of our bye-laws and Bermuda law could discourage, delay or prevent a transaction involving a change in control, even if doing so would benefit our shareholders. These provisions may include customary anti-takeover provisions. Anti-takeover provisions could substantially impede the ability of our public shareholders to benefit from a change in control or change of our management and Board of Directors and, as a result, may materially adversely affect the market price of our
25
common shares and your ability to realize any potential change of control premium. These provisions could also discourage proxy contests and make it more difficult for you and other shareholders to elect directors of your choosing and to cause us to take other corporate actions you desire.
26
ITEM 1B. UNRESOLVED STAFF COMMENTS
None.
ITEM 2. PROPERTIES
Office Locations. As of December 31, 2021, our employees are located in 20 offices in 13 countries.
ITEM 3. LEGAL PROCEEDINGS
From time to time we are a party to various legal proceedings, including claims, suits and government proceedings and investigations arising in connection with the normal course of our business. While we cannot predict the outcome of these matters, in the opinion of our management, any liability arising from these matters will not have a material adverse effect on our business. Nevertheless, unexpected adverse future events, such as an unforeseen development in our existing proceedings, a significant increase in the number of new cases or changes in our current insurance arrangements could result in liabilities that have a material adverse impact on our business.
ITEM 4. MINE SAFETY DISCLOSURES
Not applicable.
27
PART II
ITEM 5. MARKET FOR REGISTRANT'S COMMON EQUITY, RELATED SHAREHOLDER MATTERS, AND ISSUER PURCHASES OF EQUITY SECURITIES
Our common shares are listed on the NYSE under the symbol "TRTN".
On February 4, 2022, there were 111 holders of record of our common shares and 62,532 beneficial holders, based on information obtained from our transfer agent.
The following table provides certain information with respect to our purchases of the Company's common shares during the fourth quarter for the year ended December 31, 2021.
Issuer Purchases of Common Shares(1) | |||||||||||
| Period | Total number of shares purchased(2) | Average price paid per share | Approximate dollar value of shares that may yet be purchased under the plan (in thousands) | ||||||||
| October 1, 2021 through October 31, 2021 | 244,408 | $ | 53.51 | $ | 200,000 | ||||||
| November 1, 2021 through November 30, 2021 | 280,000 | $ | 60.00 | $ | 183,193 | ||||||
| December 1, 2021 through December 31, 2021 | 625,000 | $ | 57.98 | $ | 146,942 | ||||||
| Total | 1,149,408 | $ | 57.52 | $ | 146,942 | ||||||
(1) On October 20, 2021, the Company's Board of Directors increased the share repurchase authorization to $200.0 million. The revised authorization may be used by the Company to repurchase common or preferred shares.
(2) This column represents the total number of shares purchased and the total number of shares purchased as part of publicly announced plans.
28
Performance Graph
The graph below compares our cumulative shareholder returns with the S&P 500 Stock Index and the Russell 2000 Stock Index for the period from December 31, 2016 through December 31, 2021. The graph assumes that the value of the investment in our common shares, the S&P 500 Stock Index and the Russell 2000 Stock Index was $100 on December 31, 2016 and that all dividends were reinvested.
Comparison of Cumulative Total Return
December 31, 2016 through December 31, 2021
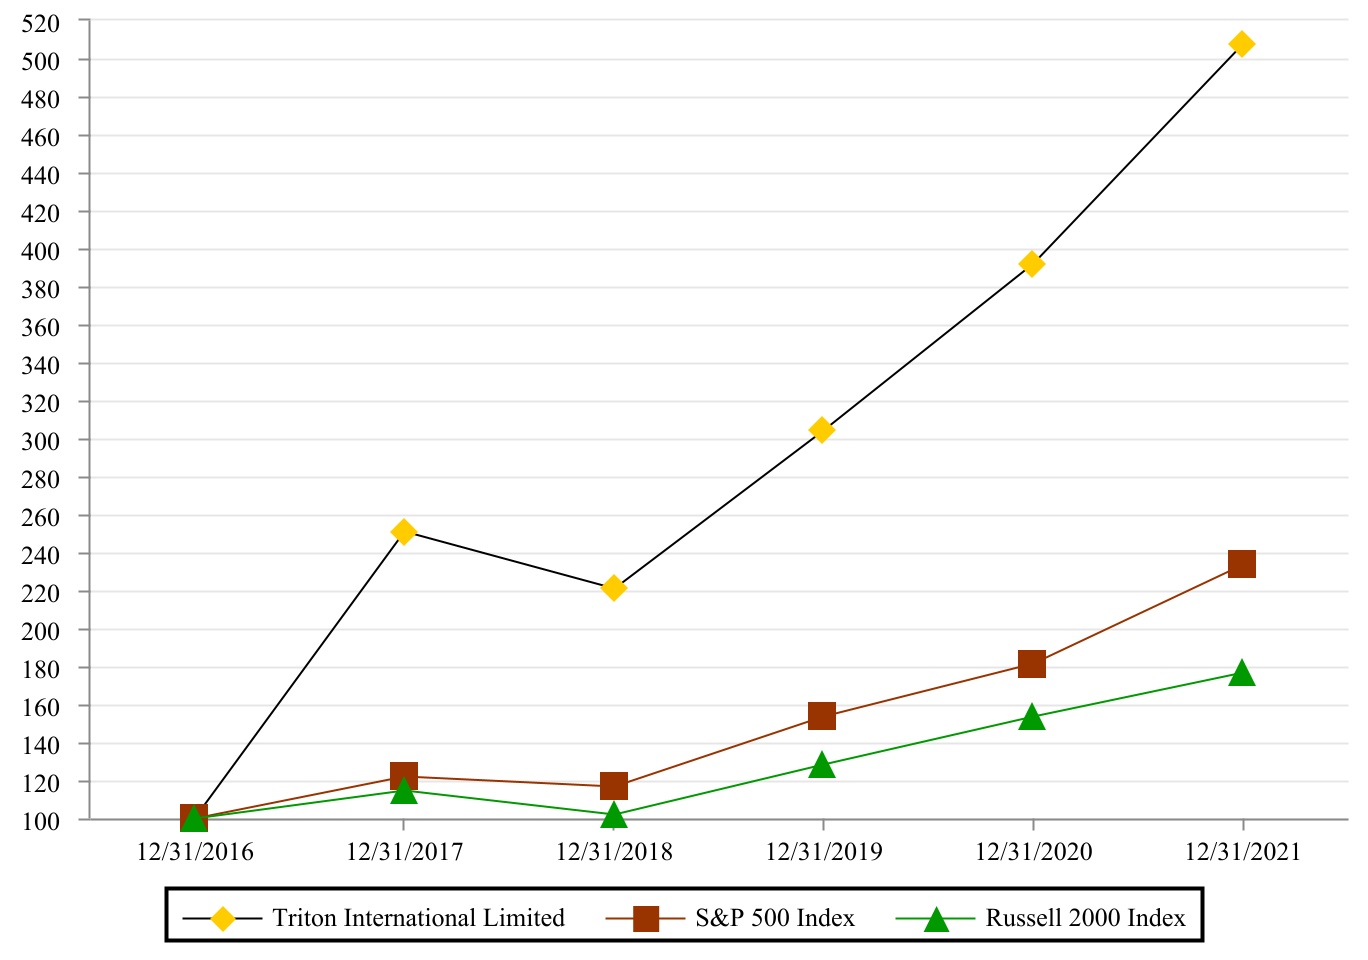
| INDEXED RETURNS FOR THE YEARS ENDED DECEMBER 31, | |||||||||||||||||||||||||||||||||||
| Company / Index | 2016 | 2017 | 2018 | 2019 | 2020 | 2021 | |||||||||||||||||||||||||||||
| Triton International Limited | $100.00 | $250.87 | $220.64 | $304.05 | $391.91 | $507.51 | |||||||||||||||||||||||||||||
| S&P 500 Index | $100.00 | $121.83 | $116.49 | $153.17 | $181.35 | $233.41 | |||||||||||||||||||||||||||||
| Russell 2000 Index | $100.00 | $114.65 | $102.02 | $128.06 | $153.62 | $176.39 | |||||||||||||||||||||||||||||
ITEM 6. SELECTED FINANCIAL DATA
Reserved
29
ITEM 7. MANAGEMENT'S DISCUSSION AND ANALYSIS OF FINANCIAL CONDITION AND RESULTS OF OPERATIONS
The statements in this discussion regarding industry outlook, our expectations regarding our future performance, liquidity and capital resources and other non-historical statements are subject to numerous risks and uncertainties, including, but not limited to, the risks and uncertainties described under "Risk Factors" and "Cautionary Note Regarding Forward-Looking Statements" as discussed elsewhere in this Form 10-K. Our actual results may differ materially from those contained in or implied by any forward-looking statements.
Our Company
Triton International Limited ("Triton", "we", "our" or the "Company") is the world's largest lessor of intermodal containers. Intermodal containers are large, standardized steel boxes used to transport freight by ship, rail or truck. Because of the handling efficiencies they provide, intermodal containers are the primary means by which many goods and materials are shipped internationally. We also lease chassis, which are used for the transportation of containers.
We operate our business in one industry, intermodal transportation equipment, and have two business segments, which also represent our reporting segments:
•Equipment leasing - we own, lease and ultimately dispose of containers and chassis from our lease fleet.
•Equipment trading - we purchase containers from shipping line customers, and other sellers of containers, and resell these containers to container retailers and users of containers for storage or one-way shipment.
Operations
Our consolidated operations include the acquisition, leasing, re-leasing and subsequent sale of multiple types of intermodal containers and chassis. As of December 31, 2021, our total fleet consisted of 4.3 million containers and chassis, representing 7.3 million TEU or 8.0 million CEU. Our primary customers include the world's largest container shipping lines. For the year ended December 31, 2021, our twenty largest customers accounted for 86% of our lease billings, our five largest customers accounted for 60% of our lease billings, and our three largest customers accounted for 21%, 16%, and 10% of our lease billings.
The most important driver of profitability in our business is the extent to which leasing revenues, which are driven by our owned equipment fleet size, utilization and average lease rates, exceed our ownership and operating costs. Our profitability is also driven by the gains or losses we realize on the sale of used containers and the margins generated from trading new and used containers.
We lease five types of equipment: (1) dry containers, which are used for general cargo such as manufactured component parts, consumer staples, electronics and apparel, (2) refrigerated containers, which are used for perishable items such as fresh and frozen foods, (3) special containers, which are used for heavy and over-sized cargo such as marble slabs, building products and machinery, (4) tank containers, which are used to transport bulk liquid products such as chemicals, and (5) chassis, which are used for the transportation of containers on the road. Our in-house equipment sales group manages the sale process for our used containers and chassis from our equipment leasing fleet and sells used and new containers and chassis acquired from third parties.
30
The following tables summarize our equipment fleet as of December 31, 2021, 2020 and 2019, indicated in units, TEU and CEU. CEU and TEU are standard industry measures of fleet size and are used to measure the quantity of containers that make up our revenue earning assets:
| Equipment Fleet in Units | Equipment Fleet in TEU | ||||||||||||||||||||||||||||||||||
| December 31, 2021 | December 31, 2020 | December 31, 2019 | December 31, 2021 | December 31, 2020 | December 31, 2019 | ||||||||||||||||||||||||||||||
| Dry | 3,843,719 | 3,295,908 | 3,267,624 | 6,531,816 | 5,466,421 | 5,369,377 | |||||||||||||||||||||||||||||
| Refrigerated | 235,338 | 227,519 | 225,520 | 457,172 | 439,956 | 435,148 | |||||||||||||||||||||||||||||
| Special | 92,411 | 93,885 | 94,453 | 169,004 | 170,792 | 171,437 | |||||||||||||||||||||||||||||
| Tank | 11,692 | 11,312 | 12,485 | 11,692 | 11,312 | 12,485 | |||||||||||||||||||||||||||||
| Chassis | 24,139 | 24,781 | 24,515 | 44,554 | 45,188 | 45,154 | |||||||||||||||||||||||||||||
| Equipment leasing fleet | 4,207,299 | 3,653,405 | 3,624,597 | 7,214,238 | 6,133,669 | 6,033,601 | |||||||||||||||||||||||||||||
| Equipment trading fleet | 53,204 | 64,243 | 17,906 | 83,692 | 98,991 | 27,121 | |||||||||||||||||||||||||||||
| Total | 4,260,503 | 3,717,648 | 3,642,503 | 7,297,930 | 6,232,660 | 6,060,722 | |||||||||||||||||||||||||||||
Equipment Fleet in CEU(1) | |||||||||||||||||
| December 31, 2021 | December 31, 2020 | December 31, 2019 | |||||||||||||||
| Operating leases | 7,291,769 | 6,649,350 | 6,434,434 | ||||||||||||||
| Finance leases | 623,136 | 295,784 | 423,638 | ||||||||||||||
| Equipment trading fleet | 81,136 | 98,420 | 37,232 | ||||||||||||||
| Total | 7,996,041 | 7,043,554 | 6,895,304 | ||||||||||||||
(1) In the equipment fleet tables above, we have included total fleet count information based on CEU. CEU is a ratio used to convert the actual number of containers in our fleet to a figure based on an estimate for the historical average relative purchase prices of our various equipment types to that of a 20-foot dry container. For example, the CEU ratio for a 40-foot high cube dry container is 1.70, and a 40-foot high cube refrigerated container is 7.50. These factors may differ slightly from CEU ratios used by others in the industry.
The following table summarizes the percentage of our equipment fleet in terms of units and CEU as of December 31, 2021:
| Equipment Type | Percentage of total fleet in units | Percentage of total fleet in CEU | |||||||||
| Dry | 90.1 | % | 71.4 | % | |||||||
| Refrigerated | 5.5 | 21.8 | |||||||||
| Special | 2.2 | 3.0 | |||||||||
| Tank | 0.3 | 1.2 | |||||||||
| Chassis | 0.6 | 1.6 | |||||||||
| Equipment leasing fleet | 98.7 | 99.0 | |||||||||
| Equipment trading fleet | 1.3 | 1.0 | |||||||||
| Total | 100.0 | % | 100.0 | % | |||||||
We generally lease our equipment on a per diem basis to our customers under three types of leases:
•Long-term leases typically have initial contractual terms ranging from five to eight or more years and provide us with stable cash flow and low transaction costs by requiring customers to maintain specific units on-hire for the duration of the lease term. Some of our containers, primarily used containers, are placed on lifecycle leases which keep the containers on-hire until the end of their useful life.
•Finance leases are typically structured as full payout leases and provide for a predictable recurring revenue stream with the lowest cost to the customer as customers are generally required to retain the equipment for the duration of its useful life.
•Service leases command a premium per diem rate in exchange for providing customers with greater operational flexibility by allowing non-scheduled pick-up and drop-off of units during the lease term.
We also have expired long-term leases whose fixed terms have ended but for which the related units remain on-hire and for which we continue to receive rental payments pursuant to the terms of the initial contract. Some leases have contractual terms that have features reflective of both long-term and service leases and we classify such leases as either long-term or service leases, depending upon which features we believe are predominant.
31
The following table summarizes our lease portfolio by lease type, based on CEU on-hire as of December 31, 2021, 2020 and 2019:
| Lease Portfolio by CEU | December 31, 2021 | December 31, 2020 | December 31, 2019 | ||||||||||||||
| Long-term leases | 72.4 | % | 73.8 | % | 69.5 | % | |||||||||||
| Finance leases | 8.0 | 4.4 | 6.8 | ||||||||||||||
| Subtotal | 80.4 | 78.2 | 76.3 | ||||||||||||||
| Service leases | 5.0 | 7.2 | 7.8 | ||||||||||||||
| Expired long-term leases, non-sale age (units on hire) | 8.4 | 9.8 | 10.5 | ||||||||||||||
| Expired long-term leases, sale-age (units on hire) | 6.2 | 4.8 | 5.4 | ||||||||||||||
| Total | 100.0 | % | 100.0 | % | 100.0 | % | |||||||||||
| Weighted average remaining contractual term in months for long-term and finance leases | 61 | 49 | 48 | ||||||||||||||
Due to our aggressive fleet investment in 2021 and the high cost of these new containers, we placed the vast majority of this equipment on long-term operating and finance leases with an average initial duration of 13 years. To better reflect the impact of these dynamics on our lease portfolio, we have included the following equipment lease portfolio table based on net book value of units on-hire, as of December 31, 2021, 2020, and 2019:
| Lease Portfolio by Net Book Value | December 31, 2021 | December 31, 2020 | December 31, 2019 | ||||||||||||||
| Long-term leases | 73.6 | % | 79.2 | % | 75.6 | % | |||||||||||
| Finance leases | 13.8 | 3.3 | 5.1 | ||||||||||||||
| Subtotal | 87.4 | 82.5 | 80.7 | ||||||||||||||
| Service leases | 3.5 | 5.9 | 6.5 | ||||||||||||||
| Expired long-term leases, non-sale age (units on hire) | 6.2 | 9.0 | 9.9 | ||||||||||||||
| Expired long-term leases, sale-age (units on hire) | 2.9 | 2.6 | 2.9 | ||||||||||||||
| Total | 100.0 | % | 100.0 | % | 100.0 | % | |||||||||||
| Weighted average remaining contractual term in months for long-term and finance leases | 78 | 54 | 54 | ||||||||||||||
Market Overview and COVID-19
The COVID-19 pandemic has meaningfully impacted global trade and our business. The initial outbreak of COVID-19 and resulting social and economic lockdowns led to a sharp decrease in global trade in the first half of 2020, and we faced weak demand for containers and pressure on our utilization and profitability. However, our lease portfolio provided strong protections and our utilization and profitability decreased gradually.
Trade volumes rebounded rapidly in the third quarter of 2020 as lockdowns eased and consumers shifted spending from services and experiences to goods, and trade volumes remained strong throughout 2021. Demand for containers was further boosted by extensive logistical disruptions such as reduced port productivity and a shortage of trucking capacity that slowed turn times for containers. In 2021, the strong and sustained demand for containers led to a shortage of containers, high prices for new and used containers, and high market leasing rates. In addition, we were able to drive our utilization close to maximum levels and invested aggressively in new containers to support our customers. Our profitability increased rapidly from the second half of 2020 through the end of 2021.
New container production accelerated to record levels in 2021, which has helped ease the shortage of containers. As a result, we may see more balance between container supply and demand over the course of the year. However, the timing for a return to more normal market conditions is uncertain.
Operating Performance
Our operating and financial performance throughout 2021 was strong as we benefited from very favorable market conditions driven by strong global trade volumes, logistical disruptions that slowed container turn times, and limited availability of containers.
32
Fleet size. As of December 31, 2021, our revenue earning assets had a net book value of $11.8 billion, an increase of over 30% compared to December 31, 2020. We purchased $3.6 billion of new containers in 2021 to support our customers. Our aggressive fleet investment in 2021 reflects our customers' sizable demand for containers due to strong trade growth and operational disruptions, a high reliance on leased containers and Triton's leading share of new leasing transactions. The dollar value of our investments was also driven by very high new container prices.
Utilization. Our average utilization was 99.4% during 2021, an increase of 3.2% compared to 2020. Our utilization increased rapidly in the second half of 2020 due to the strong rebound in global trade volumes as pandemic restrictions were eased, and container demand and our utilization remained high throughout 2021. During 2021, we benefited from a very high volume of container pick-ups driven by our aggressive investment in new containers, while container drop-off activity was limited due to the overall shortage of container capacity that existed for most of the year. Our ending utilization was 99.6% as of December 31, 2021 and currently remains at this level.
The following tables summarize our equipment fleet utilization for the periods indicated below. Utilization is computed by dividing our total units on lease (in CEU) by the total units in our fleet (in CEU) excluding new units not yet leased and off-hire units designated for sale:
| Year Ended December 31, | Quarter Ended | |||||||||||||||||||||||||||||||
| Average Utilization | December 31, | September 30, | June 30, | March 31, | ||||||||||||||||||||||||||||
| 2021 | 99.4 | % | 99.6 | % | 99.6 | % | 99.4 | % | 99.1 | % | ||||||||||||||||||||||
| 2020 | 96.2 | % | 98.1 | % | 96.1 | % | 95.0 | % | 95.4 | % | ||||||||||||||||||||||
| 2019 | 96.9 | % | 95.8 | % | 96.7 | % | 97.2 | % | 97.7 | % | ||||||||||||||||||||||
| Quarter Ended | ||||||||||||||||||||||||||
| Ending Utilization | December 31, | September 30, | June 30, | March 31, | ||||||||||||||||||||||
| 2021 | 99.6% | 99.6% | 99.5% | 99.3% | ||||||||||||||||||||||
| 2020 | 98.9% | 97.4% | 94.8% | 95.3% | ||||||||||||||||||||||
| 2019 | 95.4% | 96.4% | 97.1% | 97.4% | ||||||||||||||||||||||
Average lease rates. Average lease rates for our dry container product line increased by 6.1% in 2021 compared to 2020. The increase in our average dry container lease rates was primarily driven by the addition of new containers with lease rates well above the average rates in our lease portfolio. New container prices and market lease rates increased sharply in 2021 due to the surge in container demand and limited availability of containers, and the price for a new 20' dry container reached nearly $3,900 during the year. New container prices have recently decreased into the range of $3,400, although they remain high historically and market leasing rates remain above our portfolio average.
Average lease rates for our refrigerated container product line decreased by 4.2% in 2021 compared to 2020. In 2021, we completed a large lease extension transaction for refrigerated containers that lowered the lease rates on expired leases in return for a lease extension covering the remaining useful life of the equipment. We have also been experiencing larger differences in lease rates for older refrigerated containers compared to rates on new equipment, and we expect our average lease rates for refrigerated containers will continue to gradually trend down.
The average lease rates for special containers decreased by 0.8% in 2021 compared to 2020 primarily due to a lease extension transaction for a large number of special containers completed in 2021.
Interest and Debt Expense. Our average debt balance increased by $1,066.9 million during 2021 to support the growth in revenue earning assets of over 30%. Despite the increase in our debt balance, our interest and debt expense decreased by $31.0 million to $222.0 million in 2021. This decrease was largely driven by the refinancing of over $6.7 billion of debt over the last two years as we took advantage of the low interest rate environment and the recent upgrade of our corporate credit rating to investment grade.
Equipment disposals. Disposal gains were strong throughout 2021, reflecting very high used container selling prices. The strong worldwide demand for containers, the large increase in new container prices in 2021 and limited availability of used containers for sale pushed used container sale prices to record levels, and our average used dry container sale price in 2021
33
increased 117.6% from 2020. The benefit of this large increase in used dry container sale prices was partially offset by a substantial decrease in disposal volumes due to limited drop-off volumes and low inventories of containers for sale. Our used dry container sales volumes decreased by 61.7% in 2021 compared to 2020.
Liquidity and Capital Resources
Our principal sources of liquidity are cash flows provided by operating activities, proceeds from the sale of our leasing equipment, borrowings under our credit facilities and proceeds from other financing activities. Our principal uses of cash include capital expenditures, debt service, dividends, and share repurchases.
For the year ended December 31, 2021, cash provided by operating activities, together with the proceeds from the sale of our leasing equipment, was $1,622.2 million. In addition, as of December 31, 2021 we had $106.2 million of cash and cash equivalents and $1,788.0 million of borrowing capacity remaining under our existing credit facilities.
As of December 31, 2021, our cash commitments in the next twelve months include $477.6 million of scheduled principal payments on our existing debt facilities, and $586.1 million of committed but unpaid capital expenditures, primarily for the purchase of equipment.
We believe that cash provided by operating activities, existing cash, proceeds from the sale of our leasing equipment, and availability under our credit facilities will be sufficient to meet our obligations over the next twelve months.
Capital Activity
During the year ended December 31, 2021, the Company paid dividends on preferred shares of $45.3 million and paid dividends on common shares of $157.3 million.
During the year ended December 31, 2021, the Company repurchased a total of 1.5 million common shares at an average price per share of $55.95 for a total cost of $85.5 million under its share repurchase program. Since October 2018, the Company has purchased over 15.4 million shares, or 19.1% of our common shares.
In August 2021, the Company completed a public offering of 7,000,000 shares of 5.75% Series E preference shares, which generated $175.0 million of gross proceeds. The costs associated with the offering, inclusive of underwriting discount and other offering expenses, were $6.2 million.
For additional information on the share repurchase program, preferred share offering, and dividends, please refer to Note 10 - "Other Equity Matters" in Part IV, Item 15 of this Annual Report on Form 10-K.
Debt Activity
In February and March 2021, the Company issued a combined $1.2 billion in asset-backed securitization notes at a weighted average interest rate of 1.8%. Proceeds from these issuances were primarily used to fund additional capital expenditures and prepay existing debt.
We successfully transitioned our capital structure toward unsecured investment grade financing in 2021. As part of this transition, the Company issued a total of $2.3 billion of corporate notes with a range of maturities of 2 - 10 years at a weighted average interest rate of 1.8%. The Company also prepaid $1.5 billion in aggregate principal of its remaining outstanding institutional notes with a weighted average interest rate of 4.5% and paid a related make-whole premium of $127.9 million.
The Company also amended various debt agreements that converted certain facilities from secured to unsecured borrowings. In addition, these amendments increased the Company's borrowing capacity to $2.0 billion on the revolving credit facility and to $1.2 billion on the term loan facility.
Credit Ratings
Our investment-grade corporate and long-term debt credit ratings help us to lower our cost of funds and broaden our access to attractively priced capital. While a ratings downgrade would not result in a default under any of our debt agreements, it could adversely affect our ability to issue debt and obtain new financings, or renew existing financings, and it would increase the cost of our financings.
34
The following table summarizes our current credit ratings:
| Rating Agency | Long-term Debt | Corporate Rating | Outlook | Date of Last Ratings Action | ||||||||||
| S&P Global Ratings | BBB- | BBB- | Stable | 10/14/2021 | ||||||||||
| Fitch Ratings | BBB- | BBB- | Stable | 10/14/2021 | ||||||||||
Debt Agreements
As of December 31, 2021, our outstanding indebtedness was comprised of the following (amounts in millions):
| December 31, 2021 | Maximum Borrowing Level | ||||||||||
| Asset-backed securitization term notes | $ | 3,801.8 | $ | 3,801.8 | |||||||
| Corporate notes | 2,300.0 | 2,300.0 | |||||||||
| Term loan facilities | 1,176.0 | 1,176.0 | |||||||||
| Asset-backed securitization warehouse | 225.0 | 1,125.0 | |||||||||
| Revolving credit facilities | 1,112.0 | 2,000.0 | |||||||||
| Finance lease obligations | 15.0 | 15.0 | |||||||||
| Total debt outstanding | $ | 8,629.8 | $ | 10,417.8 | |||||||
| Unamortized debt costs | (63.8) | — | |||||||||
| Unamortized debt premiums & discounts | (3.5) | — | |||||||||
| Debt, net of unamortized costs | $ | 8,562.5 | $ | 10,417.8 | |||||||
The maximum borrowing levels depicted in the table above may not reflect the actual availability under all of the credit facilities. Certain of these facilities are governed by either borrowing bases or an unencumbered asset test that limits borrowing capacity. As of December 31, 2021, the availability under these credit facilities without adding additional assets was $1,034.2 million.
As of December 31, 2021, we had a combined $7,443.6 million of total debt on facilities with fixed interest rates or floating interest rates that have been synthetically fixed through interest rate swap contracts. This accounts for 86% of total debt.
Pursuant to the terms of certain debt agreements, we are required to maintain certain amounts in restricted cash accounts. As of December 31, 2021, we had restricted cash of $124.4 million.
For additional information on our debt, please see Note 6 - "Debt" in Part IV, Item 15 of this Annual Report on Form 10-K.
Debt Covenants
We are subject to certain financial covenants related to leverage and interest coverage as defined in our debt agreements. Failure to comply with these covenants could result in a default under the related credit agreements and the acceleration of our outstanding debt if we were unable to obtain a waiver from the creditors. As of December 31, 2021, we were in compliance with all such covenants
35
Cash Flow
The following table sets forth certain cash flow information for the years ended December 31, 2021 and 2020 (in thousands):
| Year Ended December 31, | |||||||||||
| 2021 | 2020 | ||||||||||
| Net cash provided by (used in) operating activities | $ | 1,405,164 | $ | 943,752 | |||||||
| Net cash provided by (used in) investing activities | $ | (3,217,386) | $ | (489,017) | |||||||
| Net cash provided by (used in) financing activities | $ | 1,890,764 | $ | (471,711) | |||||||
Operating Activities
Net cash provided by operating activities increased by $461.4 million to $1,405.2 million in 2021, compared to $943.8 million in 2020. The significant increase was primarily due to an increase in profitability due to strong market conditions. This was further increased due to deferred revenue collections related to leases with uneven payment terms in 2021 and the reduction of cash collateral that was required for certain interest rate swaps in liability positions in the prior year.
Investing Activities
Net cash used in investing activities increased by $2,728.4 million to $3,217.4 million in 2021 compared to $489.0 million in 2020. The change was primarily due to a $2,690.3 million increase in leasing equipment purchases to support the strong container demand.
Financing Activities
Net cash provided by financing activities increased by $2,362.5 million to $1,890.8 million in 2021 compared to net cash used in financing activities of $471.7 million in 2020. The increase was primarily due to a $2,295.7 million increase in net borrowings to finance the substantial purchase of leasing equipment.
36
Results of Operations
The following table summarizes our comparative results of operations for the years ended December 31, 2021 and 2020 (in thousands):
| Year Ended December 31, | |||||||||||||||||
| 2021 | 2020 | Variance | |||||||||||||||
| Leasing revenues: | |||||||||||||||||
| Operating leases | $ | 1,480,495 | $ | 1,276,697 | $ | 203,798 | |||||||||||
| Finance leases | 53,385 | 31,210 | 22,175 | ||||||||||||||
| Total leasing revenues | 1,533,880 | 1,307,907 | 225,973 | ||||||||||||||
| Equipment trading revenues | 142,969 | 85,780 | 57,189 | ||||||||||||||
| Equipment trading expenses | (108,870) | (70,981) | (37,889) | ||||||||||||||
| Trading margin | 34,099 | 14,799 | 19,300 | ||||||||||||||
| Net gain (loss) on sale of leasing equipment | 107,060 | 37,773 | 69,287 | ||||||||||||||
| Operating expenses: | |||||||||||||||||
| Depreciation and amortization | 626,240 | 542,128 | 84,112 | ||||||||||||||
| Direct operating expenses | 26,860 | 93,690 | (66,830) | ||||||||||||||
| Administrative expenses | 89,319 | 80,532 | 8,787 | ||||||||||||||
| Provision (reversal) for doubtful accounts | (2,475) | 2,768 | (5,243) | ||||||||||||||
| Total operating expenses | 739,944 | 719,118 | 20,826 | ||||||||||||||
| Operating income (loss) | 935,095 | 641,361 | 293,734 | ||||||||||||||
| Other expenses: | |||||||||||||||||
| Interest and debt expense | 222,024 | 252,979 | (30,955) | ||||||||||||||
| Debt termination expense | 133,853 | 24,734 | 109,119 | ||||||||||||||
| Other (income) expense, net | (1,379) | (4,371) | 2,992 | ||||||||||||||
| Total other expenses | 354,498 | 273,342 | 81,156 | ||||||||||||||
| Income (loss) before income taxes | 580,597 | 368,019 | 212,578 | ||||||||||||||
| Income tax expense (benefit) | 50,357 | 38,240 | 12,117 | ||||||||||||||
| Net income (loss) | $ | 530,240 | $ | 329,779 | $ | 200,461 | |||||||||||
| Less: dividend on preferred shares | 45,740 | 41,362 | 4,378 | ||||||||||||||
| Net income (loss) attributable to common shareholders | $ | 484,500 | $ | 288,417 | $ | 196,083 | |||||||||||
For the discussion on the Results of Operations for the Year Ended December 31, 2020 compared to the Year Ended December 31, 2019, see the Results of Operations section in Part II, Item 7 of our 2020 Annual Report on Form 10-K, filed with the SEC on February 16, 2021.
37
Comparison of the Year Ended December 31, 2021 to the Year Ended December 31, 2020
Leasing revenues. Per diem revenue represents revenue earned under operating lease contracts. Fee and ancillary lease revenue represents fees billed for the pick-up and drop-off of containers in certain geographic locations and billings of certain reimbursable operating costs such as repair and handling expenses. Finance lease revenue represents interest income earned under finance lease contracts. The following table summarizes our leasing revenue for the periods indicated below (in thousands):
| Year Ended December 31, | |||||||||||||||||
| Leasing revenues | 2021 | 2020 | Variance | ||||||||||||||
| Operating leases: | |||||||||||||||||
| Per diem revenues | $ | 1,445,292 | $ | 1,217,423 | $ | 227,869 | |||||||||||
| Fee and ancillary revenues | 35,203 | 59,274 | (24,071) | ||||||||||||||
| Total operating lease revenues | 1,480,495 | 1,276,697 | 203,798 | ||||||||||||||
| Finance leases | 53,385 | 31,210 | 22,175 | ||||||||||||||
| Total leasing revenues | $ | 1,533,880 | $ | 1,307,907 | $ | 225,973 | |||||||||||
Total leasing revenues were $1,533.9 million in 2021 compared to $1,307.9 million in 2020, an increase of $226.0 million.
Per diem revenues were $1,445.3 million in 2021 compared to $1,217.4 million in 2020, an increase of $227.9 million. The primary reasons for this increase are as follows:
•$181.7 million increase due to an increase in the average number of containers on-hire of approximately 0.9 million CEU; and
•$40.2 million increase primarily due to an increase in average per diem rates for our dry containers partially offset by a decrease in average per diem rates for our refrigerated and special containers.
Fee and ancillary lease revenues were $35.2 million in 2021 compared to $59.3 million in 2020, a decrease of $24.1 million, primarily due to lower drop-off activity, partially offset by fee revenues related to the repositioning of containers.
Finance lease revenues were $53.4 million in 2021 compared to $31.2 million in 2020, an increase of $22.2 million. This increase is primarily due to the addition of $1,349.5 million of net finance lease receivable in 2021 offset by the runoff of the existing portfolio.
Trading margin. Trading margin was $34.1 million in 2021 compared to $14.8 million in 2020, an increase of $19.3 million. The increase was due to higher per container selling margins due to a significant increase in container selling prices, partially offset by a decrease in container sales volume.
Net gain (loss) on sale of leasing equipment. Gain on sale of equipment was $107.1 million in 2021 compared to $37.8 million in 2020, an increase of $69.3 million. The primary reasons for the increase are as follows:
•$92.8 million increase due to a 117.6% increase in average used dry container selling prices, partially offset by
•$23.5 million decrease due to a 61.7% decrease in selling volumes.
Depreciation and amortization. Depreciation and amortization was $626.2 million in 2021 compared to $542.1 million in 2020, an increase of $84.1 million. The primary reasons for the increase are as follows:
•$111.9 million increase due to the increased size of our container fleet; partially offset by
•$28.3 million decrease due to an increase in the number of containers that have become fully depreciated.
Direct operating expenses. Direct operating expenses primarily consist of our costs to repair equipment returned off lease, store equipment when it is not on lease and reposition equipment from locations with weak leasing demand. Direct operating expenses were $26.9 million in 2021 compared to $93.7 million in 2020, a decrease of $66.8 million. The primary reasons for the decrease are as follows:
•$36.8 million decrease in storage expense resulting from a decrease in the number of idle units; and
•$29.7 million decrease in repair, handling and repositioning expense primarily due to lower drop-off activity.
38
Administrative expenses. Administrative expenses were $89.3 million in 2021 compared to $80.5 million in 2020, an increase of $8.8 million. The primary reasons for this increase are as follows:
•$5.5 million increase due to higher compensation costs;
•$2.4 million increase in professional fees; and
•$1.3 million increase in foreign exchange loss.
Provision (reversal) for doubtful accounts. There was a reversal for doubtful accounts of $2.5 million in 2021 compared to a provision of $2.8 million in 2020, a change of $5.3 million. We reversed reserves in 2021 which were recorded in 2020 against a mid-sized customer's receivable.
Interest and debt expense. Interest and debt expense was $222.0 million in 2021 compared to $253.0 million in 2020, a decrease of $31.0 million. The primary reasons for the decrease are as follows:
•$59.7 million decrease due to a decrease in the average effective interest rate to 2.91% from 3.81%; partially offset by
•$31.6 million increase due to an increase in the average debt balance of $1,066.9 million.
Debt termination expense. Debt termination expense was $133.9 million in 2021 compared to $24.7 million in 2020, an increase of $109.2 million. In 2021, the Company incurred make-whole premium and other debt termination costs primarily related to the prepayment of senior secured institutional notes in connection with the transition of our capital structure toward unsecured investment grade bonds. In 2020, the Company incurred write-offs for unamortized debt and other costs related to the prepayment of ABS notes.
Income taxes. Income tax expense was $50.4 million in 2021 compared to $38.2 million in 2020, an increase of $12.2 million. The increase in income tax expense was primarily the result of an increase in pre-tax income, partially offset by an $8.6 million tax expense related to a U.S. entity to foreign entity intra-company asset sale recorded in 2020 that did not reoccur in 2021.
39
Segments
Our leasing segment is discussed in our results of operations comparisons and the trading segment is discussed in the trading margin comparison within the results of operations comparisons.
For additional information on our segments, please see Note 11 - "Segment and Geographic Information" in Part IV, Item 15 of this Annual Report on Form 10-K.
Contractual Obligations
We are party to various operating and finance leases and are obligated to make payments related to our borrowings. We are also obligated under various commercial commitments, including obligations to our equipment manufacturers. Our equipment manufacturer obligations are in the form of conventional accounts payable and are satisfied by cash flows from operations and financing activities.
The following table summarizes our contractual commitments and obligations as of December 31, 2021 and the effect such obligations are expected to have on our liquidity and cash flows in future periods:
| Contractual Obligations by Period | |||||||||||||||||||||||||||||||||||||||||
| Contractual Obligations: | Total | 2022 | 2023 | 2024 | 2025 | 2026 | 2027 and thereafter | ||||||||||||||||||||||||||||||||||
| (dollars in millions) | |||||||||||||||||||||||||||||||||||||||||
| Principal debt obligations | $ | 8,614.8 | $ | 462.6 | $ | 1,230.5 | $ | 1,254.0 | $ | 430.5 | $ | 2,838.6 | $ | 2,398.6 | |||||||||||||||||||||||||||
Interest on debt obligations(1) | 970.0 | 193.7 | 181.0 | 154.4 | 134.6 | 106.6 | 199.7 | ||||||||||||||||||||||||||||||||||
Finance lease obligations(2) | 15.2 | 15.2 | — | — | — | — | — | ||||||||||||||||||||||||||||||||||
| Operating leases (mainly facilities) | 6.1 | 3.5 | 2.1 | 0.4 | 0.1 | — | — | ||||||||||||||||||||||||||||||||||
| Purchase obligations: | |||||||||||||||||||||||||||||||||||||||||
| Equipment purchases payable | 429.6 | 429.6 | — | — | — | — | — | ||||||||||||||||||||||||||||||||||
| Equipment purchase commitments | 156.5 | 156.5 | — | — | — | — | — | ||||||||||||||||||||||||||||||||||
| Total contractual obligations | $ | 10,192.2 | $ | 1,261.1 | $ | 1,413.6 | $ | 1,408.8 | $ | 565.2 | $ | 2,945.2 | $ | 2,598.3 | |||||||||||||||||||||||||||
(1) Amounts include actual interest for fixed debt, estimated interest for floating-rate debt and interest rate swaps which are in a payable position based on December 31, 2021 rates.
(2) Amounts include interest.
40
Critical Accounting Estimates
Our consolidated financial statements have been prepared in conformity with U.S. GAAP, which requires us to make estimates and assumptions that affect the amounts and disclosures reported in the consolidated financial statements and accompanying notes. We base our estimates and judgments on historical experience and on various other assumptions that we believe are reasonable under the circumstances. We evaluate our estimates and assumptions on an ongoing basis. Our actual results may differ from these estimates under different assumptions or conditions.
Leasing Equipment
We purchase new equipment from equipment manufacturers for the purpose of leasing such equipment to customers. We also purchase used equipment with the intention of selling such equipment in one or more years from the date of purchase.
Leasing equipment is recorded at cost and depreciated to an estimated residual value on a straight-line basis over the estimated useful lives. Capitalized costs for new container rental equipment include the manufactured cost of the container, inspection, delivery, and associated costs incurred in moving the container from the manufacturer to the initial on-hire location of such container. Repair and maintenance costs that do not extend the lives of the container rental equipment are charged to direct operating expenses at the time the costs are incurred.
The estimated useful lives and residual values of our leasing equipment are based on our expectations for future used container sale prices. We evaluate estimates used in our depreciation policies on a regular basis to determine whether changes have taken place that would suggest that a change in our depreciation estimates for useful lives or the assigned residual values of our equipment is warranted. For 2021, the Company completed its annual depreciation policy assessment during the fourth quarter and concluded no change was necessary.
The estimated useful lives and residual values for each major equipment type for the periods indicated below were as follows:
| As of December 31, 2021 and 2020 | |||||||||||
Equipment Type | Depreciable Life | Residual Value | |||||||||
| Dry containers | |||||||||||
| 20-foot dry container | 13 years | $ | 1,000 | ||||||||
| 40-foot dry container | 13 years | $ | 1,200 | ||||||||
| 40-foot high cube dry container | 13 years | $ | 1,400 | ||||||||
| Refrigerated containers | |||||||||||
| 20-foot refrigerated container | 12 years | $ | 2,350 | ||||||||
| 40-foot high cube refrigerated container | 12 years | $ | 3,350 | ||||||||
| Special containers | |||||||||||
| 40-foot flat rack container | 16 years | $ | 1,700 | ||||||||
| 40-foot open top container | 16 years | $ | 2,300 | ||||||||
| Tank containers | 20 years | $ | 3,000 | ||||||||
| Chassis | 20 years | $ | 1,200 | ||||||||
Depreciation on leasing equipment commences on the date of initial on-hire.
For leasing equipment purchased for resale that may be leased for a period of time, we adjust our estimates for remaining useful life and residual values based on our expectations for how long the equipment will remain on-hire to the current lessee and the expected sales market for older containers when these units are redelivered.
41
The net book value of our leasing equipment by equipment type is as follows (in thousands):
| December 31, 2021 | December 31, 2020 | |||||||||||||
| Dry container | $ | 8,087,346 | $ | 6,589,960 | ||||||||||
| Refrigerated container | 1,556,673 | 1,483,820 | ||||||||||||
| Special container | 297,925 | 307,765 | ||||||||||||
| Tank container | 102,220 | 97,982 | ||||||||||||
| Chassis | 156,949 | 151,169 | ||||||||||||
| Total | $ | 10,201,113 | $ | 8,630,696 | ||||||||||
Included in the amounts above are units not on lease at December 31, 2021 and 2020 with a total net book value of $391.3 million and $173.2 million, respectively. A large majority of the units not on lease at December 31, 2021 are for recently purchased equipment. Depreciation on equipment purchased under finance lease obligations is included in depreciation and amortization expense on the consolidated statements of operations.
Valuation of Leasing Equipment
Leasing equipment is evaluated for impairment whenever events or changes in circumstances indicate that its carrying value may not be recoverable. Recoverability of an asset to be held and used is measured by a comparison of the carrying value to its estimated undiscounted future cash flows expected to be generated by the asset. If the carrying value of an asset exceeds our estimated undiscounted future cash flows, an impairment charge is recognized in the amount by which the carrying value of the asset exceeds the fair value of the asset. Key indicators of impairment on leasing equipment include, among other factors, a sustained decrease in operating profitability, a sustained decrease in utilization, or indications of technological obsolescence.
When testing for impairment, leasing equipment is generally grouped by equipment type, and is tested separately from other groups of assets and liabilities. Some of the significant estimates and assumptions used to determine future undiscounted cash flows and the measurement for impairment are the remaining useful life, expected utilization, expected future lease rates and expected disposal prices of the equipment. We consider the assumptions on expected utilization and the remaining useful life to have the greatest impact on its estimate of future undiscounted cash flows. These estimates are principally based on our historical experience and management's judgment of market conditions.
There were no key indicators of impairment and we did not record any impairment charges related to leasing equipment for the years ended December 31, 2021 and 2020.
Equipment Held for Sale
When leasing equipment is returned from lease, we make a determination of whether to repair and re-lease the equipment or sell the equipment. At the time we determine that equipment will be sold, we reclassify the carrying value of leasing equipment to equipment held for sale. Equipment held for sale is recorded at the lower of its estimated fair value, less costs to sell, or carrying value at the time identified for sale. Depreciation expense on equipment held for sale is halted and disposals generally occur within 90 days. Initial write downs of equipment held for sale to fair value are recorded as an impairment charge and are included in net gain or loss on sale of leasing equipment. Subsequent increases or decreases to the fair value of those assets are recorded as adjustments to the carrying value of the equipment held for sale, however, any such adjustments may not exceed the respective equipment's carrying value at the time it was initially classified as held for sale. Realized gains and losses resulting from the sale of equipment held for sale are recorded as net gain or loss on sale of leasing equipment, and cash flows associated with the disposal of equipment held for sale are classified as cash flows from investing activities.
Equipment recorded within our equipment trading segment is also included in Equipment held for sale. Gains and losses resulting from the sale of this equipment is recorded in Trading margin, and cash flows associated with the sale of this equipment are classified as cash flows from operating activities.
42
During the years ended December 31, 2021 and 2020, we recorded the following net gains or losses on equipment held for sale on the consolidated statements of operations (in thousands):
| Year Ended December 31, | |||||||||||
| 2021 | 2020 | ||||||||||
| Impairment (loss) reversal on equipment held for sale | $ | 16 | $ | (3,532) | |||||||
| Gain (loss) on sale of equipment, net of selling costs | 107,044 | 41,305 | |||||||||
| Net gain on sale of leasing equipment | $ | 107,060 | $ | 37,773 | |||||||
Goodwill
Goodwill is tested for impairment at least annually on October 31 of each fiscal year or more frequently if events occur or circumstances exist that indicate that the fair value of a reporting unit may be below its carrying value. Goodwill has been allocated to our reporting units which are the same as our reporting segments.
In evaluating goodwill for impairment, we have the option to first assess qualitative factors to determine whether further impairment testing is necessary. Among other relevant events and circumstances that affect the fair value of reporting units, we consider individual factors such as macroeconomic conditions, changes in our industry and the markets in which we operate, as well as our reporting units' historical and expected future financial performance. If, after assessing the totality of events or circumstances, we determine it is more-likely-than-not that the fair value of a reporting unit is greater than our carrying amount, then the quantitative goodwill impairment test is unnecessary. The quantitative goodwill impairment test compares the fair value of a reporting unit with our carrying amount, including goodwill. If the carrying amount of the reporting unit is less than its fair value, no impairment exists. If the carrying amount of a reporting unit exceeds its fair value, an impairment loss shall be recognized in an amount equal to that excess, limited to the total amount of goodwill allocated to that reporting unit.
We elected to perform the qualitative assessment for our evaluation of goodwill impairment during the year ended December 31, 2021 and concluded there was no impairment. Since inception through December 31, 2021, we have not had any goodwill impairment.
For additional information on our accounting policies, please see Note 2 - "Summary of Significant Accounting Policies" in Part IV, Item 15 of this Annual Report on Form 10-K.
Recent Accounting Pronouncements
See Note 2 - "Summary of Significant Accounting Policies" in Part IV, Item 15 of this Annual Report on Form 10-K for a full description of recent accounting pronouncements.
43
ITEM 7A. QUANTITATIVE AND QUALITATIVE DISCLOSURES ABOUT MARKET RISK
Market risk is the risk of loss to future earnings, values or cash flows that may result from changes in the price of a financial instrument. The fair value of a financial instrument, derivative or non-derivative, might change as a result of changes in interest rates, exchange rates, commodity prices, equity prices and other market changes. We have operations internationally and we are exposed to market risks in the ordinary course of our business. These risks include interest rate and foreign currency exchange rate risks.
Interest Rate Risk
We enter into derivative agreements to fix the interest rates on a portion of our floating-rate debt. We assess and manage the external and internal risk associated with these derivative instruments in accordance with our overall operating goals. External risk is defined as those risks outside of our direct control, including counterparty credit risk, liquidity risk, systemic risk and legal risk. Internal risk relates to those operational risks within the management oversight structure and include actions taken in contravention of our policies.
The primary external risk of our derivative agreements is counterparty credit exposure, which is defined as the ability of a counterparty to perform its financial obligations under the agreement. All of our derivative agreements are with highly-rated financial institutions. Credit exposures are measured based on the market value of outstanding derivative instruments. In order to monitor counterparty credit exposure, both current and potential exposures are calculated.
As of December 31, 2021, we had derivative agreements in place to fix interest rates on a portion of our borrowings under debt facilities with floating interest rates as summarized below:
| Derivatives | Notional Amount | Weighted Average Fixed Leg (Pay) Interest Rate | Cap Rate | Weighted Average Remaining Term | ||||||||||||||||||||||
Interest Rate Swap(1) | $1,929.7 million | 1.9% | n/a | 5.1 years | ||||||||||||||||||||||
| Interest Rate Cap | $400.0 million | n/a | 5.5% | 1.9 years | ||||||||||||||||||||||
(1) The impact of forward starting swaps with total notional amount of $350.0 million will increase the weighted average remaining term to 6.0 years.
Our derivative agreements are designated as cash flow hedges for accounting purposes. Any unrealized gains or losses related to the changes in fair value are recognized in accumulated other comprehensive income and reclassified to interest and debt expense as they are realized. As of December 31, 2021, we do not have any material non-designated derivatives. Previously, a portion of our swap portfolio was not designated and unrealized and realized changes in the fair value of these agreements were recognized in the consolidated statements of operations as other (income) expense, net.
Approximately 86% of our debt is either fixed or hedged using derivative instruments which helps mitigate the impact of changes in short-term interest rates. A 100 basis point increase in the interest rates on our unhedged debt (primarily LIBOR) would result in an increase of approximately $11.7 million in interest expense over the next 12 months.
Foreign currency exchange rate risk
Although we have significant foreign-based operations, the majority of our revenues and our operating expenses are denominated in U.S. dollars. However, we pay our non-U.S. employees in local currencies and certain operating expenses are denominated in foreign currencies. Net foreign currency exchange gains and losses were a loss of $1.0 million and a gain of $0.4 million for the years ended December 31, 2021 and, 2020, respectively.
ITEM 8. FINANCIAL STATEMENTS AND SUPPLEMENTARY DATA
The Consolidated Financial Statements and financial statement schedules listed under Item 15—Exhibits and Financial Statement Schedules are filed as a part of this Item 8.
ITEM 9. CHANGES IN AND DISAGREEMENTS WITH ACCOUNTANTS ON ACCOUNTING AND FINANCIAL DISCLOSURE
None.
44
ITEM 9A. CONTROLS AND PROCEDURES
Management's Report Regarding the Effectiveness of Disclosure Controls and Procedures
We carried out an evaluation, under the supervision and with the participation of our management, including our Chief Executive Officer and our Senior Vice President and Chief Financial Officer, of the effectiveness of the design and operation of our disclosure controls and procedures (as defined in Rules 13a-15(e) and 15d-15(e) under the Exchange Act) as of the end of the period covered by this Annual Report on Form 10-K. Based upon management's evaluation of these disclosure controls and procedures, our Chief Executive Officer and our Senior Vice President and Chief Financial Officer concluded, as of the end of the period covered by this Annual Report on Form 10-K, that our disclosure controls and procedures were effective.
Management's Report on Internal Control Over Financial Reporting
We are responsible for establishing and maintaining adequate internal control over financial reporting. Our internal control over financial reporting is designed to provide reasonable assurance regarding the reliability of our financial reporting and the preparation of financial statements for external purposes in accordance with generally accepted accounting principles.
We assessed our internal control over financial reporting as of December 31, 2021 and based our assessment on criteria established in Internal Control-Integrated Framework (2013) issued by the Committee of Sponsoring Organizations of the Treadway Commission. Based on our assessment, we have concluded that our internal control over financial reporting was effective as of December 31, 2021.
KPMG LLP, an independent registered public accounting firm, has audited the consolidated financial statements included in this Annual Report on Form 10-K and, as part of the audit, has issued a report on the effectiveness of our internal control over financial reporting as of December 31, 2021. Please refer to "Report of Independent Registered Public Accounting Firm" in Part IV, Item 15 of this Annual Report on Form 10-K.
Changes in Internal Controls
There were no changes in our internal control over financial reporting identified in management's evaluation pursuant to Rules 13a-15(d) or 15d-15(d) of the Exchange Act during the three months ended December 31, 2021 that materially affected, or are reasonably likely to materially affect, our internal control over financial reporting.
ITEM 9B. OTHER INFORMATION
Not applicable.
45
PART III
ITEM 10. DIRECTORS, EXECUTIVE OFFICERS AND CORPORATE GOVERNANCE
The information required by this Item regarding our Code of Ethics, Code of Ethics for Senior Company Officers, Audit Committee and Audit Committee Financial Experts, compliance with Section 16(a) of the Exchange Act, and corporate governance is contained in the sections captioned “Codes of Ethics”, "Board Committees", "Proposal 1: Election of Directors", "Delinquent Section 16(a) Reports" and possibly elsewhere in our proxy statement to be issued in connection with the Annual General Meeting of Shareholders to be held on April 26, 2022, which will be filed with the SEC within 120 days after the end of our fiscal year ended December 31, 2021 (the "2022 Proxy Statement") and that information is incorporated herein by reference.
Information regarding our executive officers is included after Item 1 in Part I of this Form 10-K and is incorporated herein by reference.
ITEM 11. EXECUTIVE COMPENSATION
The information required by this Item is incorporated herein by reference from the sections captioned "Director Compensation Table", "Compensation Discussion and Analysis", "Executive Compensation Tables", "Compensation Risk Management", "Compensation and Talent Management Committee Interlocks and Insider Participation", "Report of the Compensation and Talent Management Committee" and possibly elsewhere in the 2022 Proxy Statement.
ITEM 12. SECURITY OWNERSHIP OF CERTAIN BENEFICIAL OWNERS AND MANAGEMENT AND RELATED SHAREHOLDER MATTERS
The information required by this Item is incorporated herein by reference from the sections captioned "Equity Compensation Plan Information", "Information Regarding Beneficial Ownership of Management and Principal Shareholders" and possibly elsewhere in the 2022 Proxy Statement.
ITEM 13. CERTAIN RELATIONSHIPS AND RELATED TRANSACTIONS, AND DIRECTOR INDEPENDENCE
The information required by this Item is incorporated herein by reference from the sections captioned "Certain Relationships and Related Person Transactions", "Board Independence" and possibly elsewhere in the 2022 Proxy Statement.
ITEM 14. PRINCIPAL ACCOUNTANT FEES AND SERVICES
Our independent registered public accounting firm is KPMG LLP , New York, NY , Auditor Firm ID: 185 .
The information required by this Item is incorporated herein by reference from the section captioned "Audit Fees" in the 2022 Proxy Statement.
46
PART IV
ITEM 15. EXHIBITS AND FINANCIAL STATEMENT SCHEDULES
(a)(1) Financial Statements
The following financial statements are included in Item 8 of this report:
(a)(2) Financial Statement Schedules
The following financial statement schedules for the Company are filed as part of this report:
Schedules not listed above have been omitted because the information required to be set forth therein is not applicable or is shown in the accompanying Consolidated Financial Statements or notes thereto.
(a)(3) List of Exhibits
The following exhibits are filed as part of and incorporated by reference into this Annual Report on Form 10-K:
| Exhibit No. | Description | |||||||
| Amended and Restated By-Laws of Triton International Limited, dated April 27, 2021 (incorporated by reference to Exhibit 3.1 to the Company's Quarterly Report on Form 10-Q for the quarter ended June 30, 2021, filed July 27, 2021) | ||||||||
| Memorandum of Association of Triton International Limited, dated September 29, 2015 (incorporated by reference to Exhibit 3.1 to the Company's Quarterly Report on Form 10-Q for the quarter ended March 31, 2016, filed June 23, 2016) | ||||||||
| Certificate of Designations of 8.50% Series A Cumulative Redeemable Perpetual Preference Shares (incorporated by reference to Exhibit 4.1 to the Company's Current Report on Form 8-K filed March 14, 2019) | ||||||||
| Certificate of Designations of 8.00% Series B Cumulative Redeemable Perpetual Preference Shares (incorporated by reference to Exhibit 4.1 to the Company's Current Report on Form 8-K filed June 20, 2019) | ||||||||
| Certificate of Designations of 7.375% Series C Cumulative Redeemable Perpetual Preference Shares (incorporated by reference to Exhibit 4.1 to the Company's Current Report on Form 8-K filed November 6, 2019) | ||||||||
| Certificate of Designations of 6.875% Series D Cumulative Redeemable Perpetual Preference Shares (incorporated by reference to Exhibit 4.1 to the Company's Current Report on Form 8-K filed January 21, 2020) | ||||||||
Certificate of Designations of 5.75% Series E Cumulative Redeemable Perpetual Preference Shares (incorporated by reference to Exhibit 4.1 to the Company’s Current Report on Form 8-K filed August 17, 2021) | ||||||||
47
| Exhibit No. | Description | |||||||
Indenture, dated September 21, 2020, between Triton Container Finance VIII LLC and Wilmington Trust, National Association, as indenture trustee (incorporated by reference to Exhibit 4.1 to the Company's Current Report on Form 8-K filed September 21, 2020) | ||||||||
Amendment Number 1, dated as of December 20, 2021, to the Indenture, dated as of September 21, 2020, between Triton Container Finance VIII LLC and Wilmington Trust, National Association, as indenture trustee | ||||||||
| Series 2020-1 Supplement, dated September 21, 2020, between Triton Container Finance VIII LLC and Wilmington Trust, National Association, as indenture trustee (incorporated by reference to Exhibit 4.2 to the Company's Current Report on Form 8-K filed September 21, 2020) | ||||||||
Amendment Number 1, dated as of December 20, 2021, to Series 2020-1 Supplement to Indenture, dated as of September 21, 2020, between Triton Container Finance VIII LLC and Wilmington Trust, National Association, as indenture trustee | ||||||||
| Description of the Registrant's Securities Registered Pursuant to Section 12 of the Securities Exchange Act of 1934 | ||||||||
| 4.12 | As permitted by Item 601(b)(4)(iii)(A) of Regulation S-K, the Company has not filed with this Annual Report on Form 10-K certain instruments defining the rights of holders of long-term debt of the Company and its subsidiaries because such long-term debt is not being registered and the total amount of securities authorized under any of such instruments does not exceed 10% of the total assets of the Company and its subsidiaries on a consolidated basis. The Company agrees to furnish a copy of any such agreements to the Securities and Exchange Commission upon request. | |||||||
| Eleventh Restated and Amended Credit Agreement, dated as of October 14, 2021, by and among Triton Container International Limited and TAL International Container Corporation, as borrowers, Triton International Limited, as guarantor, various lenders from time to time party thereto, and Bank of America, N.A., as administrative agent and letter of credit issuer (incorporated by reference to Exhibit 10.1 to the Company's Quarterly Report on Form 10-Q for the quarter ended September 30, 2021, filed on October 26, 2021) | ||||||||
| Amended and Restated Term Loan Agreement dated as of October 14, 2021 by and among Triton Container International Limited and TAL International Container Corporation, as borrowers, Triton International Limited, as guarantor, various lenders from time to time party thereto, and PNC Bank, National Association, as a lender and administrative agent (incorporated by reference to Exhibit 10.2 to the Company's Quarterly Report on Form 10-Q for the quarter ended September 30, 2021, filed October 26, 2021) | ||||||||
Loan and Security Agreement (Conformed), dated as of December 13, 2018, among TIF Funding LLC, as borrower, certain other wholly-owned subsidiaries of Triton International Limited, Wells Fargo Bank, National Association, as administrative agent, certain lenders party thereto and Wilmington Trust, National Association, as collateral agent and securities intermediary, as amended by Amendment Number 1 to Loan and Security Agreement, dated as of February 8, 2019, Amendment Number 2 to Loan and Security Agreement, dated as of November 4, 2019, and the Omnibus Amendment No. 1, dated as of November 13, 2020 (incorporated by reference to Exhibit 10.1 to the Company's Current Report on Form 8-K filed November 16, 2020) | ||||||||
Amendment Number 4, dated as of December 20, 2021, to Loan and Security Agreement, dated as of December 13, 2018, among TIF Funding LLC, Borrower, Wells Fargo Bank Association, as Administrative Agent, certain lenders party thereto and Wilmington Trust, National Association, as Collateral Agent | ||||||||
| Employment Offer Letter between Carla Heiss and Triton Container International, Incorporated of North America (incorporated by reference to Exhibit 10.1 to the Company’s Quarterly Report on Form 10-Q for the quarter ended March 31, 2020, filed April 24, 2020) | ||||||||
48
| Exhibit No. | Description | |||||||
Employment Agreement, dated as of November 3, 2004, by and between TAL International Group, Inc. and Brian M. Sondey (incorporated by reference from exhibit number 10.13 to TAL International Group, Inc.'s Form S-1 filed on June 30, 2005, file number 333-126317) | ||||||||
| Triton International Limited Amended and Restated 2016 Equity Incentive Plan (incorporated by reference to Exhibit 10.1 to the Company's Quarterly Report on Form 10-Q for the quarter ended March 31, 2021, filed April 29, 2021) | ||||||||
| Form of Restricted Share Award Agreement under the Triton International Limited 2016 Equity Incentive Plan (incorporated by reference to Exhibit 10.7 to the Company's Annual Report on Form 10-K filed on February 16, 2020) | ||||||||
Form of Restricted Share Award Agreement under the Triton International Limited Amended and Restated 2016 Equity Incentive Plan (incorporated by reference to Exhibit 10.2 to the Company's Quarterly Report on Form 10-Q for the quarter ended March 31, 2021, filed April 29, 2021) | ||||||||
| Form of Restricted Share Unit Award Agreement under the Triton International Limited Amended and Restated 2016 Equity Incentive Plan (incorporated by reference to Exhibit 10.3 to the Company’s Quarterly Report on Form 10-Q for the quarter ended March 31, 2021, filed April 29, 2021) | ||||||||
| Form of Indemnification Agreement for Directors and Certain Officers (incorporated by reference to Exhibit 10.1 to the Company’s Current Report on Form 8-K filed on July 14, 2016) | ||||||||
| List of Subsidiaries | ||||||||
| List of Subsidiary Guarantors and Issuers of Guaranteed Securities (incorporated by reference to Exhibit 22.1 to the Company's Current Report on Form 8-K filed January 19, 2022) | ||||||||
| Consent of Independent Registered Public Accounting Firm | ||||||||
| Powers of Attorney (included on the signature page to this Annual Report on Form 10-K) | ||||||||
| Certification of the Chief Executive Officer pursuant to Rules 13a-14(a) and 15d-14(a) of the Securities Exchange Act of 1934, as amended | ||||||||
| Certification of the Chief Financial Officer pursuant to Rules 13a-14(a) and 15d-14(a) of the Securities Exchange Act of 1934, as amended | ||||||||
| Certification by Chief Executive Officer pursuant to 18 U.S.C. Section 1350 | ||||||||
| Certification by Chief Financial Officer pursuant to 18 U.S.C. Section 1350 | ||||||||
| 101.INS | Inline XBRL Instance Document - the instance document does not appear on the Interactive Data File because its XBRL tags are embedded within the Inline XBRL document | |||||||
| 101.SCH | Inline XBRL Instance Extension Schema | |||||||
| 101.CAL | Inline XBRL Taxonomy Extension Calculation Linkbase | |||||||
| 101.DEF | Inline XBRL Taxonomy Extension Definition Linkbase | |||||||
| 101.LAB | Inline XBRL Taxonomy Extension Label Linkbase | |||||||
| 101.PRE | Inline XBRL Taxonomy Extension Presentation Linkbase | |||||||
| 104 | Cover Page Inline XBRL Data (formatted as Inline XBRL and contained in Exhibit 101) | |||||||
+ Indicates a management contract or compensatory plan or arrangement.
* Filed herewith.
** Furnished herewith.
† Schedules (or similar attachments) to these exhibits have not been filed since they do not contain information material to an investment or voting decision and that information is not otherwise disclosed in these exhibits or the Form 10-K.
49
(b) Exhibits.
The Company hereby files as part of this Annual Report on Form 10-K the exhibits listed in Item 15(a)(3) set forth above.
(c) Financial Statement Schedules
The Company hereby files as part of this Annual Report on Form 10-K the financial statement schedule listed in Item 15(a)(2) set forth above.
ITEM 16. FORM 10-K SUMMARY
None.
50
SIGNATURES
Pursuant to the requirements of Section 13 or 15(d) of the Securities Exchange Act of 1934, the Registrant has duly caused this report to be signed on its behalf by the undersigned, thereunto duly authorized.
| Date: February 15, 2022 | TRITON INTERNATIONAL LIMITED | |||||||
| By: | /s/ BRIAN M. SONDEY | |||||||
Brian M. Sondey Chairman of the Board, Director and Chief Executive Officer | ||||||||
51
POWER OF ATTORNEY AND SIGNATURES
We, the undersigned officers and directors of Triton International Limited hereby severally constitute and appoint Brian M. Sondey and John Burns and each of them singly, our true and lawful attorneys, with the power to them and each of them singly, to sign for us and in our names in the capacities indicated below, any amendments to this Annual Report on Form 10-K, and generally to do all things in our names and on our behalf in such capacities to enable Triton International Limited to comply with the provisions of the Securities Exchange Act of 1934, as amended, and all the requirements of the Securities and Exchange Commission.
Pursuant to the requirements of the Securities Exchange Act of 1934, this report has been signed below by the following persons on behalf of the Registrant, in the capacities indicated, on the 15th day of February, 2022.
| Signature | Title(s) | ||||
/s/ BRIAN M. SONDEY | Chairman of the Board, Director and Chief Executive Officer | ||||
Brian M. Sondey | |||||
/s/ JOHN BURNS | Senior Vice President and Chief Financial Officer | ||||
John Burns | |||||
/s/ MICHELLE GALLAGHER | Vice President and Controller (Principal Accounting Officer) | ||||
Michelle Gallagher | |||||
/s/ ROBERT L. ROSNER | Lead Director | ||||
Robert L. Rosner | |||||
/s/ ROBERT W. ALSPAUGH | Director | ||||
Robert W. Alspaugh | |||||
/s/ MALCOLM P. BAKER | Director | ||||
Malcolm P. Baker | |||||
| /s/ ANNABELLE BEXIGA | Director | ||||
| Annabelle Bexiga | |||||
/s/ CLAUDE GERMAIN | Director | ||||
Claude Germain | |||||
/s/ KENNETH HANAU | Director | ||||
Kenneth Hanau | |||||
/s/ JOHN S. HEXTALL | Director | ||||
John S. Hextall | |||||
| /s/ NIHARIKA RAMDEV | Director | ||||
| Niharika Ramdev | |||||
/s/ SIMON R. VERNON | Director | ||||
Simon R. Vernon | |||||
52
INDEX TO FINANCIAL STATEMENTS
F-1
Report of Independent Registered Public Accounting Firm
To the Shareholders and Board of Directors
Triton International Limited:
Opinions on the Consolidated Financial Statements and Internal Control Over Financial Reporting
We have audited the accompanying consolidated balance sheets of Triton International Limited and subsidiaries (the Company) as of December 31, 2021 and 2020, the related consolidated statements of operations, comprehensive income, shareholders’ equity, and cash flows for each of the years in the three-year period ended December 31, 2021, and the related notes and financial statement schedules I to II (collectively, the consolidated financial statements). We also have audited the Company’s internal control over financial reporting as of December 31, 2021, based on criteria established in Internal Control – Integrated Framework (2013) issued by the Committee of Sponsoring Organizations of the Treadway Commission.
In our opinion, the consolidated financial statements referred to above present fairly, in all material respects, the financial position of the Company as of December 31, 2021 and 2020, and the results of its operations and its cash flows for each of the years in the three-year period ended December 31, 2021, in conformity with U.S. generally accepted accounting principles. Also in our opinion, the Company maintained, in all material respects, effective internal control over financial reporting as of December 31, 2021 based on criteria established in Internal Control – Integrated Framework (2013) issued by the Committee of Sponsoring Organizations of the Treadway Commission.
Basis for Opinions
The Company’s management is responsible for these consolidated financial statements, for maintaining effective internal control over financial reporting, and for its assessment of the effectiveness of internal control over financial reporting, included in the accompanying Management's Report on Internal Control Over Financial Reporting. Our responsibility is to express an opinion on the Company’s consolidated financial statements and an opinion on the Company’s internal control over financial reporting based on our audits. We are a public accounting firm registered with the Public Company Accounting Oversight Board (United States) (PCAOB) and are required to be independent with respect to the Company in accordance with the U.S. federal securities laws and the applicable rules and regulations of the Securities and Exchange Commission and the PCAOB.
We conducted our audits in accordance with the standards of the PCAOB. Those standards require that we plan and perform the audits to obtain reasonable assurance about whether the consolidated financial statements are free of material misstatement, whether due to error or fraud, and whether effective internal control over financial reporting was maintained in all material respects.
Our audits of the consolidated financial statements included performing procedures to assess the risks of material misstatement of the consolidated financial statements, whether due to error or fraud, and performing procedures that respond to those risks. Such procedures included examining, on a test basis, evidence regarding the amounts and disclosures in the consolidated financial statements. Our audits also included evaluating the accounting principles used and significant estimates made by management, as well as evaluating the overall presentation of the consolidated financial statements. Our audit of internal control over financial reporting included obtaining an understanding of internal control over financial reporting, assessing the risk that a material weakness exists, and testing and evaluating the design and operating effectiveness of internal control based on the assessed risk. Our audits also included performing such other procedures as we considered necessary in the circumstances. We believe that our audits provide a reasonable basis for our opinions.
Definition and Limitations of Internal Control Over Financial Reporting
A company’s internal control over financial reporting is a process designed to provide reasonable assurance regarding the reliability of financial reporting and the preparation of financial statements for external purposes in accordance with generally accepted accounting principles. A company’s internal control over financial reporting includes those policies and procedures that (1) pertain to the maintenance of records that, in reasonable detail, accurately and fairly reflect the transactions and dispositions of the assets of the company; (2) provide reasonable assurance that transactions are recorded as necessary to permit preparation of financial statements in accordance with generally accepted accounting principles, and that receipts and expenditures of the company are being made only in accordance with authorizations of management and directors of the company; and (3) provide reasonable assurance regarding prevention or timely detection of unauthorized acquisition, use, or disposition of the company’s assets that could have a material effect on the financial statements.
F-2
Because of its inherent limitations, internal control over financial reporting may not prevent or detect misstatements. Also, projections of any evaluation of effectiveness to future periods are subject to the risk that controls may become inadequate because of changes in conditions, or that the degree of compliance with the policies or procedures may deteriorate.
Critical Audit Matter
The critical audit matter communicated below is a matter arising from the current period audit of the consolidated financial statements that was communicated or required to be communicated to the audit committee and that: (1) relates to accounts or disclosures that are material to the consolidated financial statements and (2) involved our especially challenging, subjective, or complex judgments. The communication of a critical audit matter does not alter in any way our opinion on the consolidated financial statements, taken as a whole, and we are not, by communicating the critical audit matter below, providing a separate opinion on the critical audit matter or on the accounts or disclosures to which it relates.
Assessment of residual values of leasing equipment
As discussed in Note 2 to the consolidated financial statements, the net book value of leasing equipment as of December 31, 2021 was $10.2 billion. Leasing equipment is recorded at cost and depreciated to an estimated residual value on a straight-line basis over the estimated useful lives. To determine the residual values of leasing equipment, the Company evaluates historical disposal experience and expectations of future used container sales prices.
We identified the assessment of residual values of leasing equipment as a critical audit matter. Subjective auditor judgment was required given the measurement uncertainty of the residual values of leasing equipment. Specifically, auditor judgment was required to evaluate the identification and support for trends affecting future used container sales prices.
The following are the primary procedures we performed to address this critical audit matter. We evaluated the design and tested the operating effectiveness of certain internal controls over the Company's residual value estimation process, including controls over the key assumption used to estimate residual values of leasing equipment. We tested historical used container sales of the Company by examining historical sales invoices and considered their relevance and reliability to the residual values of leasing equipment. We assessed the mathematical accuracy of the historical average selling prices. We compared the historical average selling prices to current residual values. We compared identified trends in certain used container sales prices from published industry reports to trends identified by the Company within its historical data and evaluated the Company's determination of the effect of those trends on current residual value estimates. We compared the estimated residual values of certain containers to publicly available peer data.
| /s/ KPMG LLP | |||||
We have served as the Company's auditor since 2014.
New York, New York
February 15, 2022
F-3
TRITON INTERNATIONAL LIMITED
CONSOLIDATED BALANCE SHEETS
(In thousands, except share data)
| December 31, 2021 | December 31, 2020 | ||||||||||
| ASSETS: | |||||||||||
Leasing equipment, net of accumulated depreciation of $ | $ | $ | |||||||||
| Net investment in finance leases | |||||||||||
| Equipment held for sale | |||||||||||
| Revenue earning assets | |||||||||||
| Cash and cash equivalents | |||||||||||
| Restricted cash | |||||||||||
Accounts receivable, net of allowances of $ | |||||||||||
| Goodwill | |||||||||||
Lease intangibles, net of accumulated amortization of $ | |||||||||||
| Other assets | |||||||||||
| Fair value of derivative instruments | |||||||||||
| Total assets | $ | $ | |||||||||
| LIABILITIES AND SHAREHOLDERS' EQUITY: | |||||||||||
| Equipment purchases payable | $ | $ | |||||||||
| Fair value of derivative instruments | |||||||||||
| Deferred revenue | |||||||||||
| Accounts payable and other accrued expenses | |||||||||||
| Net deferred income tax liability | |||||||||||
Debt, net of unamortized costs of $ | |||||||||||
| Total liabilities | |||||||||||
| Shareholders' equity: | |||||||||||
Preferred shares, $ | |||||||||||
Common shares, $ | |||||||||||
Undesignated shares, $ | |||||||||||
Treasury shares, at cost, | ( | ( | |||||||||
| Additional paid-in capital | |||||||||||
| Accumulated earnings | |||||||||||
| Accumulated other comprehensive income (loss) | ( | ( | |||||||||
| Total shareholders' equity | |||||||||||
| Total liabilities and shareholders' equity | $ | $ | |||||||||
The accompanying notes to the consolidated financial statements are an integral part of these statements.
F-4
TRITON INTERNATIONAL LIMITED
CONSOLIDATED STATEMENTS OF OPERATIONS
(In thousands, except per share data)
| Year Ended December 31, 2021 | Year Ended December 31, 2020 | Year Ended December 31, 2019 | |||||||||||||||
| Leasing revenues: | |||||||||||||||||
| Operating leases | $ | $ | $ | ||||||||||||||
| Finance leases | |||||||||||||||||
| Total leasing revenues | |||||||||||||||||
| Equipment trading revenues | |||||||||||||||||
| Equipment trading expenses | ( | ( | ( | ||||||||||||||
| Trading margin | |||||||||||||||||
| Net gain on sale of leasing equipment | |||||||||||||||||
| Operating expenses: | |||||||||||||||||
| Depreciation and amortization | |||||||||||||||||
| Direct operating expenses | |||||||||||||||||
| Administrative expenses | |||||||||||||||||
| Provision (reversal) for doubtful accounts | ( | ||||||||||||||||
| Total operating expenses | |||||||||||||||||
| Operating income (loss) | |||||||||||||||||
| Other expenses: | |||||||||||||||||
| Interest and debt expense | |||||||||||||||||
| Debt termination expense | |||||||||||||||||
| Other (income) expense, net | ( | ( | ( | ||||||||||||||
| Total other expenses | |||||||||||||||||
| Income (loss) before income taxes | |||||||||||||||||
| Income tax expense (benefit) | |||||||||||||||||
| Net income (loss) | $ | $ | $ | ||||||||||||||
| Less: income (loss) attributable to noncontrolling interest | |||||||||||||||||
| Less: dividend on preferred shares | |||||||||||||||||
| Net income (loss) attributable to common shareholders | $ | $ | $ | ||||||||||||||
| Net income per common share—Basic | $ | $ | $ | ||||||||||||||
| Net income per common share—Diluted | $ | $ | $ | ||||||||||||||
| Cash dividends paid per common share | $ | $ | $ | ||||||||||||||
| Weighted average number of common shares outstanding—Basic | |||||||||||||||||
| Dilutive restricted shares | |||||||||||||||||
| Weighted average number of common shares outstanding—Diluted | |||||||||||||||||
The accompanying notes to the consolidated financial statements are an integral part of these statements.
F-5
TRITON INTERNATIONAL LIMITED
CONSOLIDATED STATEMENTS OF COMPREHENSIVE INCOME
(In thousands)
| Year Ended December 31, 2021 | Year Ended December 31, 2020 | Year Ended December 31, 2019 | |||||||||||||||
| Net income (loss) | $ | $ | $ | ||||||||||||||
| Other comprehensive income (loss), net of tax: | |||||||||||||||||
| Change in derivative instruments designated as cash flow hedges | ( | ( | |||||||||||||||
| Reclassification of (gain) loss on derivative instruments designated as cash flow hedges | ( | ||||||||||||||||
| Cumulative effect for the adoption of ASU 2017-12, net of income tax effect | |||||||||||||||||
| Foreign currency translation adjustment | ( | ( | |||||||||||||||
| Other comprehensive income (loss), net of tax | ( | ( | |||||||||||||||
| Comprehensive income | |||||||||||||||||
| Less: | |||||||||||||||||
| Other comprehensive income attributable to noncontrolling interest | $ | $ | $ | ||||||||||||||
| Dividend on preferred shares | |||||||||||||||||
| Comprehensive income attributable to common shareholders | $ | $ | $ | ||||||||||||||
| Tax (benefit) provision on change in derivative instruments designated as cash flow hedges | $ | $ | ( | $ | ( | ||||||||||||
| Tax (benefit) provision on reclassification of (gain) loss on derivative instruments designated as cash flow hedges | $ | $ | $ | ( | |||||||||||||
| Tax (benefit) provision on cumulative effect for the adoption of ASU 2017-12 | $ | $ | $ | ||||||||||||||
The accompanying notes to the consolidated financial statements are an integral part of these statements.
F-6
TRITON INTERNATIONAL LIMITED
CONSOLIDATED STATEMENTS OF SHAREHOLDERS' EQUITY
(In thousands, except share amounts)
| Preferred Shares | Common Shares | Treasury Shares | Add'l Paid in Capital | Accumulated Earnings | Accumulated Other Comprehensive Income | Non controlling Interest | Total Equity | ||||||||||||||||||||||||||||||||||||||||||||||||||||||||||
| Shares | Amount | Shares | Amount | Shares | Amount | ||||||||||||||||||||||||||||||||||||||||||||||||||||||||||||
| Balance as of December 31, 2018 | $ | $ | $ | ( | $ | $ | $ | $ | $ | ||||||||||||||||||||||||||||||||||||||||||||||||||||||||
| Issuance of preferred shares, net of offering expenses | — | — | — | — | ( | — | — | — | |||||||||||||||||||||||||||||||||||||||||||||||||||||||||
| Share-based compensation | — | — | — | — | — | — | — | ||||||||||||||||||||||||||||||||||||||||||||||||||||||||||
| Treasury shares acquired | — | — | — | — | ( | — | — | — | — | ( | |||||||||||||||||||||||||||||||||||||||||||||||||||||||
| Share repurchase to settle shareholder tax obligations | — | — | ( | ( | — | — | ( | — | — | — | ( | ||||||||||||||||||||||||||||||||||||||||||||||||||||||
| Net income (loss) | — | — | — | — | — | — | — | — | |||||||||||||||||||||||||||||||||||||||||||||||||||||||||
| Other comprehensive income (loss) | — | — | — | — | — | — | — | ( | ( | — | ( | ||||||||||||||||||||||||||||||||||||||||||||||||||||||
| Purchase of noncontrolling interests | — | — | — | — | — | — | — | — | ( | ( | |||||||||||||||||||||||||||||||||||||||||||||||||||||||
| Distributions to noncontrolling interests | — | — | — | — | — | — | — | — | — | ( | ( | ||||||||||||||||||||||||||||||||||||||||||||||||||||||
| Common shares dividend declared | — | — | — | — | — | — | — | ( | — | — | ( | ||||||||||||||||||||||||||||||||||||||||||||||||||||||
| Preferred shares dividend declared | — | — | — | — | — | — | — | ( | — | — | ( | ||||||||||||||||||||||||||||||||||||||||||||||||||||||
| Balance as of December 31, 2019 | $ | $ | $ | ( | $ | $ | $ | ( | $ | $ | |||||||||||||||||||||||||||||||||||||||||||||||||||||||
| Issuance of preferred shares, net of offering expenses | — | — | — | — | ( | — | — | — | |||||||||||||||||||||||||||||||||||||||||||||||||||||||||
| Share-based compensation | — | — | — | — | — | — | — | ||||||||||||||||||||||||||||||||||||||||||||||||||||||||||
| Treasury shares acquired | — | — | — | — | ( | — | — | — | — | ( | |||||||||||||||||||||||||||||||||||||||||||||||||||||||
| Share repurchase to settle shareholder tax obligations | — | — | ( | ( | — | — | ( | — | — | — | ( | ||||||||||||||||||||||||||||||||||||||||||||||||||||||
| Net income (loss) | — | — | — | — | — | — | — | — | |||||||||||||||||||||||||||||||||||||||||||||||||||||||||
| Other comprehensive income (loss) | — | — | — | — | — | — | — | ( | — | ( | |||||||||||||||||||||||||||||||||||||||||||||||||||||||
| Common shares dividend declared | — | — | — | — | — | — | — | ( | — | — | ( | ||||||||||||||||||||||||||||||||||||||||||||||||||||||
| Preferred shares dividend declared | — | — | — | — | — | — | — | ( | — | — | ( | ||||||||||||||||||||||||||||||||||||||||||||||||||||||
| Balance as of December 31, 2020 | $ | $ | $ | ( | $ | $ | $ | ( | $ | $ | |||||||||||||||||||||||||||||||||||||||||||||||||||||||
| Issuance of preferred shares, net of offering expenses | — | — | — | — | ( | — | — | — | |||||||||||||||||||||||||||||||||||||||||||||||||||||||||
| Share-based compensation | — | — | — | — | — | — | — | ||||||||||||||||||||||||||||||||||||||||||||||||||||||||||
| Treasury shares acquired | — | — | — | — | ( | — | — | — | — | ( | |||||||||||||||||||||||||||||||||||||||||||||||||||||||
| Share repurchase to settle shareholder tax obligations | — | — | ( | ( | — | — | ( | — | — | — | ( | ||||||||||||||||||||||||||||||||||||||||||||||||||||||
| Net income (loss) | — | — | — | — | — | — | — | — | |||||||||||||||||||||||||||||||||||||||||||||||||||||||||
| Other comprehensive income (loss) | — | — | — | — | — | — | — | — | |||||||||||||||||||||||||||||||||||||||||||||||||||||||||
| Common shares dividend declared | — | — | — | — | — | — | — | ( | — | — | ( | ||||||||||||||||||||||||||||||||||||||||||||||||||||||
| Preferred shares dividend declared | — | — | — | — | — | — | — | ( | — | — | ( | ||||||||||||||||||||||||||||||||||||||||||||||||||||||
| Balance as of December 31, 2021 | $ | $ | $ | ( | $ | $ | $ | ( | $ | $ | |||||||||||||||||||||||||||||||||||||||||||||||||||||||
The accompanying notes to the consolidated financial statements are an integral part of these statements.
F-7
TRITON INTERNATIONAL LIMITED
CONSOLIDATED STATEMENTS OF CASH FLOWS
(In thousands)
| Year Ended December 31, 2021 | Year Ended December 31, 2020 | Year Ended December 31, 2019 | |||||||||||||||
| Cash flows from operating activities: | |||||||||||||||||
| Net income (loss) | $ | $ | $ | ||||||||||||||
| Adjustments to reconcile net income (loss) to net cash provided by operating activities: | |||||||||||||||||
| Depreciation and amortization | |||||||||||||||||
| Amortization of deferred debt cost and other debt related amortization | |||||||||||||||||
| Lease related amortization | |||||||||||||||||
| Share-based compensation expense | |||||||||||||||||
| Net (gain) loss on sale of leasing equipment | ( | ( | ( | ||||||||||||||
| Unrealized (gain) loss on derivative instruments | |||||||||||||||||
| Debt termination expense | |||||||||||||||||
| Deferred income taxes | |||||||||||||||||
| Changes in operating assets and liabilities: | |||||||||||||||||
| Accounts receivable | ( | ( | |||||||||||||||
| Deferred revenue | |||||||||||||||||
| Accounts payable and accrued expenses | ( | ( | |||||||||||||||
| Net equipment sold (purchased) for resale activity | ( | ||||||||||||||||
| Cash received (paid) for settlement of interest rate swaps | ( | ( | |||||||||||||||
| Cash collections on finance lease receivables, net of income earned | |||||||||||||||||
| Other assets | ( | ( | |||||||||||||||
| Net cash provided by (used in) operating activities | |||||||||||||||||
| Cash flows from investing activities: | |||||||||||||||||
| Purchases of leasing equipment and investments in finance leases | ( | ( | ( | ||||||||||||||
| Proceeds from sale of equipment, net of selling costs | |||||||||||||||||
| Other | ( | ( | |||||||||||||||
| Net cash provided by (used in) investing activities | ( | ( | ( | ||||||||||||||
| Cash flows from financing activities: | |||||||||||||||||
| Issuance of preferred shares, net of underwriting discount | |||||||||||||||||
| Purchases of treasury shares | ( | ( | ( | ||||||||||||||
| Debt issuance costs | ( | ( | ( | ||||||||||||||
| Borrowings under debt facilities | |||||||||||||||||
| Payments under debt facilities and finance lease obligations | ( | ( | ( | ||||||||||||||
| Dividends paid on preferred shares | ( | ( | ( | ||||||||||||||
| Dividends paid on common shares | ( | ( | ( | ||||||||||||||
| Distributions to noncontrolling interests | ( | ||||||||||||||||
| Purchase of noncontrolling interests | ( | ||||||||||||||||
| Other | ( | ( | ( | ||||||||||||||
| Net cash provided by (used in) financing activities | ( | ( | |||||||||||||||
| Net increase (decrease) in cash, cash equivalents and restricted cash | $ | $ | ( | $ | |||||||||||||
| Cash, cash equivalents and restricted cash, beginning of period | |||||||||||||||||
| Cash, cash equivalents and restricted cash, end of period | $ | $ | $ | ||||||||||||||
| Supplemental disclosures: | |||||||||||||||||
| Interest paid | $ | $ | $ | ||||||||||||||
| Income taxes paid (refunded) | $ | $ | $ | ( | |||||||||||||
| Right-of-use asset for leased property | $ | $ | $ | ||||||||||||||
| Supplemental non-cash investing activities: | |||||||||||||||||
| Equipment purchases payable | $ | $ | $ | ||||||||||||||
The accompanying notes to the consolidated financial statements are an integral part of these statements.
F-8
TRITON INTERNATIONAL LIMITED
NOTES TO CONSOLIDATED FINANCIAL STATEMENTS
Note 1—Description of the Business and Basis of Presentation
Description of the Business and Basis of Presentation
Triton International Limited ("Triton" or the "Company"), through its subsidiaries, leases intermodal transportation equipment, primarily maritime containers, and provides maritime container management services through a worldwide network of service subsidiaries, third-party depots and other facilities. The majority of the Company's business is derived from leasing its containers to shipping line customers through a variety of long-term and short-term contractual lease arrangements. The Company also sells containers from its equipment leasing fleet as well as containers specifically acquired for resale from third parties. The Company's registered office is located in Bermuda.
Note 2—Summary of Significant Accounting Policies
Concentration of Credit Risk
F-9
TRITON INTERNATIONAL LIMITED
NOTES TO CONSOLIDATED FINANCIAL STATEMENTS (Continued)
Fair Value Measurements
Fair value represents the price that would be received upon the sale of an asset or paid to transfer a liability in an orderly transaction between market participants at the measurement date. The determination of fair value may require an entity to make significant judgments or develop assumptions about market participants to reflect risks specific to the asset being valued. The Company uses the following fair value hierarchy when selecting inputs for its valuation techniques, with the highest priority given to Level 1:
•Level 1—quoted prices (unadjusted) in active markets for identical assets or liabilities;
•Level 2—inputs other than quoted prices included within Level 1 that are either directly or indirectly observable; and
•Level 3—unobservable inputs in which little or no market activity exists, therefore requiring an entity to develop its own assumptions about the assumptions that market participants would use in pricing.
Cash and cash equivalents, restricted cash, accounts receivable, equipment purchases payable and accounts payable carrying amounts approximate fair values because of the short-term nature of these instruments. The Company's other financial and non-financial assets, which include leasing equipment, net investment in finance leases, intangible assets and goodwill, are not required to be measured at fair value on a recurring basis. However, if certain triggering events occur, or if an annual impairment test is required, and the Company determines that these other financial and non-financial assets are impaired after completing an evaluation, these assets would be written down to their fair value.
For information on the fair value of equipment held for sale, debt, and the fair value of derivative instruments, please refer to Note 3 - "Equipment Held for Sale", Note 6 - "Debt" and Note 7 - "Derivative Instruments", respectively.
Cash and Cash Equivalents
Cash and cash equivalents consist of all cash balances and highly liquid investments having original maturities of three months or less at the time of purchase.
Restricted Cash
The Company's restricted cash relates to amounts held at financial institutions pursuant to certain debt arrangements. The restricted cash balances represent cash proceeds collected and required to be used to pay debt service and other related expenses.
Allowance for Doubtful Accounts
The Company's allowance for doubtful accounts is estimated based upon a review of the collectability of its receivables. This review is based on the risk profile of the receivables, credit quality indicators such as the level of past-due amounts and economic conditions. Generally, the Company does not require collateral on accounts receivable balances. An account is considered past due when a payment has not been received in accordance with the contractual terms. Changes in economic conditions or other events may necessitate additions or deductions to the allowance for doubtful accounts. The allowance for doubtful accounts is intended to provide for losses in the receivables, and requires the application of estimates and judgments as to the outcome of collection efforts, among other things. The Company believes its allowance for doubtful accounts is adequate to provide for credit losses inherent in its existing receivables.
For our net investment in finance leases and accounts receivable for sales of equipment, the Company measures expected credit loss by evaluating the overall credit quality of its customers. Expected credit losses for these financial assets are estimated using historical experience which includes multiple economic cycles, customer payment history, management's assessment of the customer's financial condition, and consideration of current conditions and reasonable forecasts.
F-10
TRITON INTERNATIONAL LIMITED
NOTES TO CONSOLIDATED FINANCIAL STATEMENTS (Continued)
Net Investment in Finance Leases
The Company has entered into various lease agreements that qualify as finance leases. These leases are long-term in nature, ranging for a period of three to fourteen years, and typically include an option to purchase the equipment at the end of the lease term for a nominal price that the Company deems reasonably certain to be exercised. At the inception of a finance lease, a net investment is recorded based on the gross investment (representing the total future minimum lease payments plus the estimated residual value), net of unearned income. Unearned income represents the excess of the gross investment over the fair value of the leased equipment at lease commencement. Any gain or loss is recognized at commencement and recorded in Net gain on sale of leasing equipment.
Leasing Equipment
The Company purchases new equipment from equipment manufacturers for the purpose of leasing such equipment to customers. The Company also purchases used equipment with the intention of selling such equipment in one or more years from the date of purchase.
Leasing equipment is recorded at cost and depreciated to an estimated residual value on a straight-line basis over the estimated useful lives. Capitalized costs for new container rental equipment include the manufactured cost of the container, inspection, delivery, and associated costs incurred in moving the container from the manufacturer to the initial on-hire location of such container. Repair and maintenance costs that do not extend the lives of the container rental equipment are charged to direct operating expenses at the time the costs are incurred.
The estimated useful lives and residual values of the Company's leasing equipment are based on the Company's expectations for future used container sale prices. The Company evaluates estimates used in its depreciation policies on a regular basis to determine whether changes have taken place that would suggest that a change in its depreciation estimates for useful lives or the assigned residual values of its equipment is warranted. For 2021, the Company completed its annual depreciation policy assessment during the fourth quarter and concluded no change was necessary.
The estimated useful lives and residual values for each major equipment type for the periods indicated below were as follows:
| As of December 31, 2021 and 2020 | |||||||||||
Equipment Type | Depreciable Life | Residual Value | |||||||||
| Dry containers | |||||||||||
| 20-foot dry container | $ | ||||||||||
| 40-foot dry container | $ | ||||||||||
| 40-foot high cube dry container | $ | ||||||||||
| Refrigerated containers | |||||||||||
| 20-foot refrigerated container | $ | ||||||||||
| 40-foot high cube refrigerated container | $ | ||||||||||
| Special containers | |||||||||||
| 40-foot flat rack container | $ | ||||||||||
| 40-foot open top container | $ | ||||||||||
| Tank containers | $ | ||||||||||
| Chassis | $ | ||||||||||
Depreciation on leasing equipment commences on the date of initial on-hire.
For leasing equipment purchased for resale that may be leased for a period of time, the Company adjusts its estimates for remaining useful life and residual values based on our expectations for how long the equipment will remain on-hire to the current lessee and the expected sales market for older containers when these units are redelivered.
F-11
TRITON INTERNATIONAL LIMITED
NOTES TO CONSOLIDATED FINANCIAL STATEMENTS (Continued)
The net book value of the Company's leasing equipment by equipment type as of the dates indicated was (in thousands):
| December 31, 2021 | December 31, 2020 | |||||||||||||
| Dry container | $ | $ | ||||||||||||
| Refrigerated container | ||||||||||||||
| Special container | ||||||||||||||
| Tank container | ||||||||||||||
| Chassis | ||||||||||||||
| Total | $ | $ | ||||||||||||
Included in the amounts above are units not on lease at December 31, 2021 and 2020 with a total net book value of $391.3 million and $173.2 million, respectively. A large majority of the units not on lease at December 31, 2021 are recently purchased equipment.
Valuation of Leasing Equipment
Leasing equipment is evaluated for impairment whenever events or changes in circumstances indicate that its carrying value may not be recoverable. Recoverability of an asset to be held and used is measured by a comparison of the carrying value to its estimated undiscounted future cash flows expected to be generated by the asset. If the carrying value of an asset exceeds its estimated undiscounted future cash flows, an impairment charge is recognized in the amount by which the carrying value of the asset exceeds the fair value of the asset. Key indicators of impairment on leasing equipment include, among other factors, a sustained decrease in operating profitability, a sustained decrease in utilization, or indications of technological obsolescence.
When testing for impairment, leasing equipment is generally grouped by equipment type, and is tested separately from other groups of assets and liabilities. Some of the significant estimates and assumptions used to determine future undiscounted cash flows and the measurement for impairment are the remaining useful life, expected utilization, expected future lease rates and expected disposal prices of the equipment. The Company considers the assumptions on expected utilization and the remaining useful life to have the greatest impact on its estimate of future undiscounted cash flows. These estimates are principally based on the Company's historical experience and management's judgment of market conditions.
The Company did not record any impairment charges related to leasing equipment for the years ended December 31, 2021, 2020, and 2019.
Equipment Held for Sale
When leasing equipment is returned off lease, the Company makes a determination of whether to repair and re-lease the equipment or sell the equipment. At the time the Company determines that equipment will be sold, it reclassifies the carrying value of leasing equipment to equipment held for sale. Equipment held for sale is recorded at the lower of its estimated fair value less costs to sell or carrying value at the time identified for sale. Depreciation expense on equipment held for sale is halted and disposals generally occur within 90 days. Initial write downs of equipment held for sale to fair value are recorded as an impairment charge and are included in Net gain on sale of leasing equipment. Subsequent increases or decreases to the fair value of those assets are recorded as adjustments to the carrying value of the equipment held for sale, however, any such adjustments may not exceed the respective equipment's carrying value at the time it was initially classified as held for sale. Realized gains and losses resulting from the sale of equipment held for sale are recorded in Net gain on sale of leasing equipment, and cash flows associated with the disposal of equipment held for sale are classified as cash flows from investing activities.
F-12
TRITON INTERNATIONAL LIMITED
NOTES TO CONSOLIDATED FINANCIAL STATEMENTS (Continued)
Operating Leases
The Company leases office space and office equipment and evaluates whether these leases are classified as operating or financing at the inception of the lease. The classification is based on certain assumptions that require judgment, such as the asset's fair value, the asset's estimated residual value, the interest rate implicit in the lease, and the asset's economic useful life.
For operating leases, the Company records a lease liability based on the present value of the remaining minimum payments and a corresponding right-of-use ("ROU") asset. The Company uses its estimated incremental borrowing rate at the commencement date to determine the present value of lease payments. The benefits of lease incentives, including rent-free or reduced rent periods, and the cost of future rent escalations are recognized on a straight-line basis over the term of the lease. A lease liability and a corresponding ROU asset are not recognized when, at the commencement date of the lease, the term is 12 months or less.
Goodwill
Goodwill is tested for impairment at least annually on October 31 of each fiscal year or more frequently if events occur or circumstances exist that indicate that the fair value of a reporting unit may be below its carrying value. Goodwill has been allocated to the Company's reporting units, which are the same as its reporting segments.
In evaluating goodwill for impairment, the Company has the option to first assess qualitative factors to determine whether further impairment testing is necessary. Among the relevant events and circumstances that affect the fair value of reporting units, the Company considers individual factors such as macroeconomic conditions, changes in its industry and the markets in which the Company operates, as well as its reporting units' historical and expected future financial performance. If, after assessing the totality of events or circumstances, the Company determines it is more-likely-than-not that the fair value of a reporting unit is greater than its carrying amount, then the quantitative goodwill impairment test is unnecessary. The quantitative goodwill impairment test compares the fair value of a reporting unit with its carrying amount, including goodwill. If the carrying amount of the reporting unit is less than its fair value, no impairment exists. If the carrying amount of a reporting unit exceeds its fair value, an impairment loss shall be recognized in an amount equal to that excess, limited to the total amount of goodwill allocated to that reporting unit.
Revenue Recognition
Operating Leases with Customers
The Company enters into long-term leases and service leases with ocean carriers, principally as lessor in operating leases, for marine cargo equipment. Long-term leases provide customers with specified equipment for a specified term. The Company's leasing revenues are based upon the number of equipment units leased, the applicable per diem rate and the length
F-13
TRITON INTERNATIONAL LIMITED
NOTES TO CONSOLIDATED FINANCIAL STATEMENTS (Continued)
of the lease. Long-term leases typically have initial contractual terms ranging from to or more years. Revenues are recognized on a straight-line basis over the life of the respective lease. Revenue from advance billings are deferred and recognized in the period earned. Service leases do not specify the exact number of equipment units to be leased or the term that each unit will remain on-hire, but allow the lessee to pick-up and drop-off units at various locations specified in the lease agreement. Under a service lease, rental revenue is based on the number of equipment units on-hire for a given period. Revenue from customers considered to be non-performing is deferred and recognized when the amounts are received.
The Company recognizes billings to customers for damages and certain other operating costs as leasing revenue when earned based on the terms of the contractual agreements with the customer.
Finance Leases with Customers
The Company enters into finance leases as lessor for some of the equipment in its fleet. At the inception of the lease, the Company records the total future minimum lease payments plus the estimated residual value, net of executory costs, if any. Cash deposits reduce the net finance lease receivable and are recorded on the statement of cash flows as deferred revenue within operating activities. The net investment in finance leases represents the receivables due from lessees, net of unearned income and amounts previously billed, which are included in accounts receivable. Unearned income, which also includes any initial direct costs, is recognized on a constant yield basis over the lease term and is recorded as leasing revenue. The Company's finance leases are usually long-term in nature and typically include an option to purchase the equipment at the end of the lease term for a nominal price that the Company deems reasonably certain to be exercised.
Equipment Trading Revenues and Expenses
Direct Operating Expenses
Direct operating expenses are directly related to the Company's equipment under and available for lease. These expenses primarily consist of the Company's costs to repair and maintain the equipment, to reposition the equipment and to store the equipment when it is not on lease. These costs are recognized when incurred. Certain positioning costs may be capitalized when incurred to place new equipment on an initial lease.
Derivative Instruments
The Company primarily uses derivatives in the management of its interest rate exposure on its long-term borrowings. The Company records derivative instruments on its balance sheet at fair value and establishes criteria for both the designation and effectiveness of hedging activities.
The Company has entered into interest rate swap agreements with certain financial institutions. The interest rate swap agreements require the Company to make payments to counterparties at fixed rates in return for receipts based upon variable rates indexed to the London Interbank Offered Rate ("LIBOR") or its replacement rate.
Derivative instruments are designated or non-designated for hedge accounting purposes. The fair value of the derivative instruments is measured at each balance sheet date and is reflected on a gross basis on the consolidated balance sheets. The change in fair value of the derivative instruments designated as a cash flow hedge are recorded on the consolidated balance sheets in accumulated other comprehensive income (loss) and are re-classified to interest and debt expense when the hedged interest payments are recognized. The change in fair value of non-designated derivative instruments is recorded in the consolidated statements of operations as other (income) expense, net.
F-14
TRITON INTERNATIONAL LIMITED
NOTES TO CONSOLIDATED FINANCIAL STATEMENTS (Continued)
Income Taxes
The Company uses the liability method of accounting for income taxes, which requires recognition of deferred tax assets and liabilities based on the expected future tax consequences of temporary differences that currently exist between the tax basis and financial reporting basis of assets and liabilities. Deferred tax assets and liabilities are measured using enacted tax rates expected to apply to taxable income in the years in which those temporary differences are expected to be recovered or settled. Any change in the tax rate which has an effect on deferred tax assets and liabilities is recognized as an increase or decrease to income in the period that includes the enactment date of the law that resulted in the change in tax rate.
The Company recognizes the effect of income tax positions which are more-likely-than-not of being sustained. If a position does not meet the more-likely-than-not criteria, the Company records a reserve against the tax position such that a tax benefit is recognized only in the amount that has a greater than 50% likelihood of being recognized. The full impact of any change in recognition or measurement of an uncertain tax position is reflected in the period in which such change occurs. Potential interest and penalties associated with such uncertain tax positions are recorded as a component of income tax expense.
Non-controlling Interests
During 2019, the Company acquired all of the remaining third-party partnership interests in Triton Container Investments LLC ("TCI"), a fully consolidated entity, for an aggregate of $103.0 million in cash and recognized a benefit of $16.9 million in the consolidated statements of shareholders' equity.
Foreign Currency Translation and Re-measurement
The Company uses the U.S. dollar as its reporting currency. The net assets and operations that are denominated in foreign currency and are subject to foreign currency translation included in the consolidated financial statements are attributable primarily to the Company's U.K. subsidiary. The accounts of this subsidiary have been converted at rates of exchange in effect at year end as to balance sheet accounts and at the annual weighted average exchange rates for the statements of operations accounts. The effects of changes in exchange rates in translating foreign subsidiaries' financial statements are included in shareholders' equity as accumulated other comprehensive (loss) income.
The Company also has certain cash accounts, certain finance lease receivables and certain obligations that are denominated in currencies other than the Company's functional currency. These assets and liabilities are generally denominated in euros or British pounds, and are re-measured at each balance sheet date at the exchange rates in effect as of those dates. The impact of changes in exchange rates on the re-measurement of assets and liabilities are included in administrative expenses on the consolidated statements of operations. Net foreign currency exchange gains or losses was a loss of $1.0 million for the year ended December 31, 2021, a gain of $0.4 million for the year ended December 31, 2020 and a loss of $0.8 million for the year ended December 31, 2019.
Share-based Compensation
The Company measures and recognizes share-based awards granted to employees based on the grant date fair value. Share-based awards may be subject to forfeiture if certain employment conditions are not met. The Company has elected to account for forfeitures as they occur. Time based awards are measured at the grant date and are recognized as compensation expense over the employee's requisite service period, generally the vesting period of the equity award, on a straight-line basis. Performance-based awards are recognized as compensation expense when satisfaction of the performance condition is considered probable. The Company also grants share-based awards to non-employee directors that vest immediately and are recognized as compensation expense based on the grant date fair value.
Earnings Per Share
Basic earnings per share is computed by dividing net income attributable to common shareholders by the weighted average number of common shares outstanding for the period. Any potential issuance of common shares, including those that are contingent and do not participate in dividends, are excluded from the weighted average number of common shares outstanding. Diluted earnings per share reflect the potential dilution that would occur if securities exercisable or convertible into common shares were exercised or converted into common shares, utilizing the treasury share method.
F-15
TRITON INTERNATIONAL LIMITED
NOTES TO CONSOLIDATED FINANCIAL STATEMENTS (Continued)
Recently Issued Accounting Standards Update
Lessors - Certain Leases with Variable Lease Payments
Note 3—Equipment Held for Sale
The Company's equipment held for sale is recorded at the lower of fair value less cost to sell, or carrying value at the time identified for sale. Fair value is measured using Level 2 inputs and is based predominantly on recent sales prices. The following table summarizes the portion of equipment held for sale in the consolidated balance sheet that have been impaired and written down to fair value less cost to sell (in thousands):
| December 31, 2021 | December 31, 2020 | |||||||
| Equipment held for sale | $ | $ | ||||||
An impairment charge is recorded when the carrying value of the asset exceeds its fair value less cost to sell. The following table summarizes the Company's net impairment charges recorded in Net gain on sale of leasing equipment on the consolidated statements of operations (in thousands):
| Year Ended December 31, | |||||||||||||||||
| 2021 | 2020 | 2019 | |||||||||||||||
| Impairment (loss) reversal on equipment held for sale | $ | $ | ( | $ | ( | ||||||||||||
| Gain (loss) on sale of equipment, net of selling costs | |||||||||||||||||
| Net gain on sale of leasing equipment | $ | $ | $ | ||||||||||||||
Note 4—Intangible Assets
Intangible assets consist of lease intangibles for leases acquired with lease rates above market in a business combination. The following table summarizes the amortization of intangible assets as of December 31, 2021 (in thousands):
| Years ending December 31, | Total Intangible Assets | ||||
| 2022 | $ | ||||
| 2023 | |||||
| 2024 | |||||
| Total | $ | ||||
Amortization expense related to intangible assets was $16.5 million, $22.5 million, and $37.5 million for the years ended December 31, 2021, 2020, and 2019, respectively.
F-16
TRITON INTERNATIONAL LIMITED
NOTES TO CONSOLIDATED FINANCIAL STATEMENTS (Continued)
Note 5—Restricted Cash
The components of restricted cash as of December 31, 2021 and December 31, 2020 were as follows (in thousands):
| December 31, 2021 | December 31, 2020 | ||||||||||
| Collection accounts | $ | $ | |||||||||
| Trust accounts | |||||||||||
| Other restricted cash accounts | |||||||||||
| Total restricted cash | $ | $ | |||||||||
Collection accounts
Pursuant to certain debt agreements, the Company maintains bank accounts for collections related to certain containers that are financed ("the Collection Accounts"). Cash proceeds collected from leasing and disposition are deposited into the Collection Accounts. Similarly, all expenses related to the operation of the containers are paid from the Collection Accounts.
Trust accounts
Pursuant to certain debt agreements, cash is transferred from the Collection Accounts to separate accounts (the "Trust Accounts"). The Trust Accounts are maintained by the Company on behalf of certain Asset Backed Securitization ("ABS") noteholders. The cash in the Trust Accounts is used to pay related ABS debt service and related expenses. After such payments, any remaining cash in these accounts is transferred to certain unrestricted bank accounts of the Company and is included in cash and cash equivalents on the consolidated balance sheets.
Other restricted cash accounts
Note 6—Debt
The table below summarizes the Company's key terms and carrying value of debt (in thousands):
Contractual Weighted Avg Interest Rate(1) | Maturity Range(1) | December 31, 2021 | December 31, 2020 | ||||||||||||||||||||||||||
| From | To | ||||||||||||||||||||||||||||
| Asset-backed securitization term notes | Aug 2023 | Feb 2031 | $ | $ | |||||||||||||||||||||||||
| Institutional notes | — | — | |||||||||||||||||||||||||||
| Corporate notes | Aug 2023 | Jun 2031 | |||||||||||||||||||||||||||
| Term loan facilities | May 2026 | May 2026 | |||||||||||||||||||||||||||
| Asset-backed securitization warehouse | Nov 2027 | Nov 2027 | |||||||||||||||||||||||||||
| Revolving credit facilities | Oct 2026 | Oct 2026 | |||||||||||||||||||||||||||
| Finance lease obligations | Feb 2022 | Feb 2022 | |||||||||||||||||||||||||||
| Total debt outstanding | |||||||||||||||||||||||||||||
| Unamortized debt costs | ( | ( | |||||||||||||||||||||||||||
| Unamortized debt premiums & discounts | ( | ( | |||||||||||||||||||||||||||
| Unamortized fair value debt adjustment | |||||||||||||||||||||||||||||
| Debt, net of unamortized costs | $ | $ | |||||||||||||||||||||||||||
(1) Data as of December 31, 2021.
The fair value of total debt outstanding was $8,572.9 million and $6,536.5 million as of December 31, 2021 and December 31, 2020, respectively, and was measured using Level 2 inputs.
F-17
TRITON INTERNATIONAL LIMITED
NOTES TO CONSOLIDATED FINANCIAL STATEMENTS (Continued)
As of December 31, 2021, the maximum borrowing levels for the ABS warehouse and the revolving credit facilities are $1,125.0 million and $2,000.0 million, respectively. These facilities are governed by either borrowing bases or an unencumbered asset test that limits borrowing capacity. As of December 31, 2021, the availability under these credit facilities without adding additional assets to the borrowing base was approximately $1,034.2 million.
The Company is subject to certain financial covenants under its debt agreements. As of December 31, 2021 and December 31, 2020, the Company was in compliance with all financial covenants in accordance with the terms of its debt agreements.
The Company hedges the risks associated with fluctuations in interest rates on a portion of its floating-rate debt by entering into interest rate swap agreements that convert a portion of its floating-rate debt to a fixed rate basis, thus reducing the impact of interest rate changes on future interest expense. The following table summarizes the Company's outstanding fixed-rate and floating-rate debt as of December 31, 2021 (in thousands):
| Balance Outstanding | Contractual Weighted Avg Interest Rate | Maturity Range | Weighted Avg Remaining Term | ||||||||||||||||||||||||||
| From | To | ||||||||||||||||||||||||||||
| Excluding impact of derivative instruments: | |||||||||||||||||||||||||||||
| Fixed-rate debt | $ | Feb 2022 | Jun 2031 | ||||||||||||||||||||||||||
| Floating-rate debt | $ | Aug 2023 | Nov 2027 | ||||||||||||||||||||||||||
| Including impact of derivative instruments: | |||||||||||||||||||||||||||||
| Fixed-rate debt | $ | ||||||||||||||||||||||||||||
| Hedged floating-rate debt | |||||||||||||||||||||||||||||
| Total fixed and hedged debt | |||||||||||||||||||||||||||||
| Unhedged floating-rate debt | |||||||||||||||||||||||||||||
| Total | $ | ||||||||||||||||||||||||||||
The Company issued the following corporate notes during the year ended December 31, 2021:
| Date | Total Offering | Contractual Interest Rate | Maturity | |||||||||||||||||
| April 15, 2021 | $ | Apr 2026 | ||||||||||||||||||
| June 7, 2021 | $ | Jun 2024 | ||||||||||||||||||
| June 7, 2021 | $ | Jun 2031 | ||||||||||||||||||
| August 6, 2021 | $ | Aug 2023 | ||||||||||||||||||
The Company issued the following ABS fixed rate series during the year ended December 31, 2021:
| Date | Total Offering | Contractual Weighted Avg Interest Rate | Expected Maturity | |||||||||||||||||
| February 3, 2021 | $ | Feb 2031 | ||||||||||||||||||
| March 17, 2021 | $ | Dec 2030 | ||||||||||||||||||
On May 27, 2021, the Company extinguished a term loan and paid the outstanding balance of $820.0 1.8 million of debt related costs. Concurrently, the Company entered into a delayed draw term loan facility with a maximum capacity of $1,200.0 million at an interest rate of 1-month LIBOR plus 1.375 % and a maturity date of May 27, 2026.
On June 28, 2021, the Company redeemed approximately $821.0 million of its outstanding institutional notes. As a result, the Company paid a make-whole premium of $84.8 million and wrote off $2.5 million of debt related costs. The cash paid for the make-whole premium is classified under financing cash flows as payments under debt facilities and finance lease obligations.
On August 30, 2021, the Company redeemed the remaining $648.9 million of its outstanding institutional notes. As a result, the Company paid a make-whole premium of $43.1 million and recognized a gain of $0.6 million from the write-off of
F-18
TRITON INTERNATIONAL LIMITED
NOTES TO CONSOLIDATED FINANCIAL STATEMENTS (Continued)
unamortized debt costs and fair value adjustments. The cash paid for the make-whole premium is classified under financing cash flows as payments under debt facilities and finance lease obligations.
On October 14, 2021, the Company amended its revolving facility which increased its borrowing capacity to $2,000.0 million. As a result, the company wrote off $0.7 million of debt related costs. Additionally on this date, the Company prepaid a term loan and a revolving facility, which resulted in an additional write off of $0.6 million of debt related costs.
Asset-Backed Securitization Term Notes
Under the Company's ABS facilities, indirect wholly-owned subsidiaries of the Company issue ABS notes. These subsidiaries are intended to be bankruptcy remote so that such assets are not available to creditors of the Company or its affiliates until and unless the related secured borrowings have been fully discharged. These transactions do not meet accounting requirements for sales treatment and are recorded as secured borrowings.
The Company's borrowings under the ABS facilities amortize in monthly installments, typically in level payments over five or more years. These facilities provide for an advance rate against the net book values of designated eligible equipment. The net book values for purposes of calculating eligible equipment is determined according to the related debt agreement and may be different than those calculated per U.S. GAAP. The Company is required to maintain restricted cash balances on deposit in designated bank accounts equal to three to nine months of interest expense depending on the terms of each facility.
Institutional Notes
The Company's institutional notes were fully redeemed during the year ended December 31, 2021.
Corporate Notes
The Company’s corporate notes are unsecured and have maturities ranging from 2 -10 years and interest payments due semi-annually. The corporate notes are pre-payable (in whole or in part) at the Company's option at any time prior to the maturity date, subject to certain provisions in the corporate note agreements, including the payment of a make-whole premium in respect to such prepayment.
Term Loan Facility
The Company's term loan facility has a maturity date of May 27, 2026, which amortizes in quarterly installments. This facility is subject to covenants customary for unsecured financings of this type, primarily financial covenants that require us to maintain a maximum ratio of unencumbered assets to certain financial indebtedness.
Asset-Backed Securitization Warehouse
Under the Company's ABS warehouse facility, an indirect wholly-owned subsidiary of the Company issues ABS notes. This subsidiary is intended to be bankruptcy remote so that such assets are not available to creditors of the Company or its affiliates until and unless the related secured borrowings have been fully discharged. These transactions do not meet accounting requirements for sales treatment and are recorded as secured borrowings.
The Company's ABS warehouse facility has a borrowing capacity of $1,125.0 million that is available on a revolving basis until November 13, 2023, paying interest at LIBOR plus 1.85 %, after which any borrowings will convert to term notes with a maturity date of November 15, 2027, paying interest at LIBOR plus 2.85 %.
During the revolving period, the borrowing capacity under this facility is determined by applying an advance rate against the net book values of designated eligible equipment. The net book values for purposes of calculating eligible equipment are determined according to the related debt agreement and may be different than those calculated per U.S. GAAP. The Company is required to maintain restricted cash balances on deposit in designated bank accounts equal to three months of interest expense.
F-19
TRITON INTERNATIONAL LIMITED
NOTES TO CONSOLIDATED FINANCIAL STATEMENTS (Continued)
Revolving Credit Facility
The revolving credit facility has a maturity date of October 14, 2026, and has a maximum borrowing capacity of $2,000.0 million. This facility is subject to covenants customary for unsecured financings of this type, primarily financial covenants that require us to maintain a maximum ratio of unencumbered assets to certain financial indebtedness.
Finance Lease Obligations
Certain containers are leased with a financial institution. The lease is accounted for as a finance lease, with interest expense recognized on a level yield basis over the period preceding early purchase options, which is to seven years from the transaction date. The Company has provided notice to early terminate these finance lease obligations in the first quarter of 2022.
Debt Maturities
At December 31, 2021, the Company's scheduled principal repayments and maturities, including finance lease obligations, were as follows (in thousands):
| Years ending December 31, | |||||
| 2022 | $ | ||||
| 2023 | |||||
| 2024 | |||||
| 2025 | |||||
| 2026 | |||||
| 2027 and thereafter | |||||
| Total | $ | ||||
Note 7—Derivative Instruments
Interest Rate Swaps / Caps
The Company enters into derivative agreements to manage interest rate risk exposure. Interest rate swap agreements are utilized to limit the Company's exposure to interest rate risk by converting a portion of its floating-rate debt to a fixed rate basis, thus reducing the impact of interest rate changes on future interest expense. Interest rate swaps involve the receipt of floating-rate amounts in exchange for fixed rate interest payments over the lives of the agreements without an exchange of the underlying principal amounts. The Company also utilizes interest rate cap agreements to manage the Company's exposure to rising interest rates by placing a ceiling on the rate that will be paid under certain floating-rate debt agreements.
The counterparties to these agreements are highly rated financial institutions. In the unlikely event that the counterparties fail to meet the terms of these agreements, the Company's exposure is limited to the interest rate differential on the notional amount at each monthly settlement period over the life of the agreements. The Company does not anticipate any non-performance by the counterparties.
Certain assets of the Company's subsidiaries are pledged as collateral for various ABS facilities and the amounts payable under certain derivative agreements. Additionally, the Company may be required to post cash collateral on these agreements. Any amounts of cash collateral posted are included in Other assets on the consolidated balance sheet and are presented in operating activities of the consolidated statements of cash flows. As of December 31, 2021, the Company has cash collateral of $17.0 million related to interest rate swap contracts.
During the year ended December 31, 2021, the Company entered into the following hedging instruments:
| Derivative Instrument | Date Effective | Notional Amount | Fixed Leg (Pay) Interest Rate | Indexed To | Scheduled Maturity | |||||||||||||||||||||||||||
| Interest rate cap | May 24, 2021 | $ | n/a | 1 month LIBOR | November 13, 2023 | |||||||||||||||||||||||||||
| Interest rate swap | October 29, 2021 | $ | 1 month LIBOR | October 29, 2031(1) | ||||||||||||||||||||||||||||
(1) Mandatory termination date of July 29, 2022.
F-20
TRITON INTERNATIONAL LIMITED
NOTES TO CONSOLIDATED FINANCIAL STATEMENTS (Continued)
In conjunction with the issuance of ABS notes, the Company canceled the following interest rate swaps that were in place to hedge the impact of interest rate changes on fixed-rate debt issuances:
| Derivative Instrument | Date Canceled | Notional Amount | Funds Received | |||||||||||||||||
| Interest rate swap | January 25, 2021 | $ | $ | |||||||||||||||||
| Interest rate swap | January 27, 2021 | $ | $ | |||||||||||||||||
| Interest rate swap | February 19, 2021 | $ | $ | |||||||||||||||||
| Interest rate swap | February 19, 2021 | $ | $ | |||||||||||||||||
On April 15, 2021, the Company canceled and simultaneously entered into an interest rate swap with a notional amount of $93.8 million. The Company paid $0.1 million for the cancellation of the existing contract. The new contract has a scheduled maturity date of April 20, 2024 and is indexed to 1 month LIBOR with a fixed leg interest rate of 0.25 %.
In conjunction with the redemption of the institutional notes, the Company entered into and subsequently canceled the following interest rate swaps that were in place to hedge the impact of interest rate changes related to the make-whole premium payment during the notification period. The settlement of these swaps of $0.9 million is presented in debt termination expense on the consolidated statement of operations and in payments under debt facilities and finance lease obligations within the financing section of the consolidated statement of cash flows.
| Derivative Instrument | Date Canceled | Notional Amount | Funds Received (Paid) | |||||||||||||||||
| Interest rate swap | June 25, 2021 | $ | $ | |||||||||||||||||
| Interest rate swap | June 25, 2021 | $ | $( | |||||||||||||||||
As of December 31, 2021, the Company had interest rate swap and cap agreements in place to fix or limit the floating interest rates on a portion of the borrowings under its debt facilities summarized below:
| Derivatives | Notional Amount | Weighted Average Fixed Leg (Pay) Interest Rate | Cap Rate | Weighted Average Remaining Term | ||||||||||||||||||||||
Interest Rate Swap(1) | $ | n/a | ||||||||||||||||||||||||
| Interest Rate Cap | $ | n/a | ||||||||||||||||||||||||
(1) The impact of forward starting swaps will increase total notional amount by $350.0 million and increase the weighted average remaining term to 6.0 years.
Unrealized losses of $24.7 million related to interest rate swap and cap agreements included in accumulated other comprehensive income (loss) are expected to be recognized in Interest and debt expense over the next twelve months.
The following table summarizes the impact of derivative instruments on the consolidated statements of operations and the consolidated statements of comprehensive income on a pretax basis (in thousands):
| Year Ended December 31, | ||||||||||||||||||||||||||
| Financial statement caption | 2021 | 2020 | 2019 | |||||||||||||||||||||||
| Non-Designated Derivative Instruments | ||||||||||||||||||||||||||
| Realized (gains) losses | Other (income) expense, net | $ | $ | ( | $ | ( | ||||||||||||||||||||
| Realized (gains) losses | Debt termination expense | $ | $ | $ | ||||||||||||||||||||||
| Unrealized (gains) losses | Other (income) expense, net | $ | $ | $ | ||||||||||||||||||||||
| Designated Derivative Instruments | ||||||||||||||||||||||||||
| Realized (gains) losses | Interest and debt (income) expense | $ | $ | $ | ( | |||||||||||||||||||||
| Unrealized (gains) losses | Comprehensive (income) loss | $ | ( | $ | $ | |||||||||||||||||||||
Fair Value of Derivative Instruments
The Company has elected to use the income approach to value its interest rate swap and cap agreements, using Level 2 market expectations at the measurement date and standard valuation techniques to convert future values to a single discounted present value. The Level 2 inputs for the interest rate swap and cap valuations are inputs other than quoted prices that are observable for the asset or liability (specifically LIBOR and swap rates and credit risk at commonly quoted intervals). In
F-21
TRITON INTERNATIONAL LIMITED
NOTES TO CONSOLIDATED FINANCIAL STATEMENTS (Continued)
response to the expected phase out of LIBOR, the Company continues to work with its counterparties to identify an alternative reference rate. Substantially all of the Company's debt agreements already include transition language, and the Company also adopted various practical expedients which will facilitate the transition.
The Company presents the fair value of derivative financial instruments on a gross basis as a separate line item on the consolidated balance sheet. As of December 31, 2021 and 2020, the Company has no material non-designated instruments.
Note 8—Leases
Lessee
The Company's leases are primarily for multiple office facilities which are contracted under various cancelable and non-cancelable operating leases, most of which provide extension or early termination options. The Company's lease agreements do not contain any residual value guarantees or material restrictive covenants.
The weighted average implicit rate was 3.50 % and 4.04 % for the years ended December 31, 2021 and 2020, respectively and the weighted average remaining lease term was 2.1 years and 2.6 years for the years ended December 31, 2021 and 2020, respectively.
The following table summarizes the impact of the Company's leases in its financial statements (in thousands):
| Balance Sheet | Financial statement caption | December 31, 2021 | December 31, 2020 | |||||||||||||||||
| Right-of-use asset - operating | $ | $ | ||||||||||||||||||
| Lease liability - operating | $ | $ | ||||||||||||||||||
| Income Statement | Financial statement caption | Year Ended December 31, 2021 | Year Ended December 31, 2020 | Year Ended December 31, 2019 | ||||||||||||||||
Operating lease cost(1) | Administrative expenses | $ | $ | $ | ||||||||||||||||
(1) Includes short-term leases that are immaterial.
Cash paid for amounts of lease liabilities included in operating cash flows was $3.3 million, $3.1 million, and $3.2 million for the years ended December 31, 2021, 2020, and 2019, respectively.
The following represents our future undiscounted cash flows related to lease liabilities for each of the next five years and thereafter as of December 31, 2021 (in thousands):
| Years ending December 31, | |||||
| 2022 | $ | ||||
| 2023 | |||||
| 2024 | |||||
| 2025 | |||||
| 2026 | |||||
| 2027 and thereafter | |||||
| Total undiscounted future cash flows related to lease payments | $ | ||||
| Less: imputed interest | ( | ||||
| Total present value of lease liability | $ | ||||
F-22
TRITON INTERNATIONAL LIMITED
NOTES TO CONSOLIDATED FINANCIAL STATEMENTS (Continued)
Lessor
Operating Leases
The following is the minimum future rental income as of December 31, 2021 under non-cancelable operating leases, assuming the minimum contractual lease term (in thousands):
| Years ending December 31, | |||||
| 2022 | $ | ||||
| 2023 | |||||
| 2024 | |||||
| 2025 | |||||
| 2026 | |||||
| 2027 and thereafter | |||||
| Total | $ | ||||
As of December 31, 2021, the Company has deferred revenue balances related to leases with uneven payment terms. We expect to amortize these amounts into revenue as follows (in thousands):
| Years ending December 31, | |||||
| 2022 | $ | ||||
| 2023 | |||||
| 2024 | |||||
| 2025 | |||||
| 2026 | |||||
| 2027 and thereafter | |||||
| Total | $ | ||||
Finance Leases
The following table summarizes the components of the net investment in finance leases (in thousands):
| December 31, 2021 | December 31, 2020 | ||||||||||
Future minimum lease payment receivable(1) | $ | $ | |||||||||
Estimated residual receivable(2) | |||||||||||
Gross finance lease receivables(3) | |||||||||||
Unearned income(4) | ( | ( | |||||||||
Net investment in finance leases(5) | $ | $ | |||||||||
(1) There were no executory costs included in gross finance lease receivables as of December 31, 2021 and December 31, 2020.
(2) The Company's finance leases generally include a purchase option at nominal amounts that is reasonably certain to be exercised, and therefore, the Company has immaterial residual value risk for assets.
(3) The gross finance lease receivable is reduced as billed to customers and reclassified to accounts receivable until paid by customers.
(4) There were no unamortized initial direct costs as of December 31, 2021 and December 31, 2020.
(5) One major customer represented 91 % and 75 % of the Company's finance lease portfolio as of December 31, 2021 and 2020, respectively. No other customer represented more than 10% of the Company's finance lease portfolio in each of those years.
F-23
TRITON INTERNATIONAL LIMITED
NOTES TO CONSOLIDATED FINANCIAL STATEMENTS (Continued)
Maturities of the Company's gross finance lease receivables subsequent to December 31, 2021 are as follows (in thousands):
| Years ending December 31, | |||||
| 2022 | $ | ||||
| 2023 | |||||
| 2024 | |||||
| 2025 | |||||
| 2026 | |||||
| 2027 and thereafter | |||||
| Total | $ | ||||
The Company’s finance lease portfolio lessees are primarily comprised of the largest international shipping lines. In its estimate of expected credit losses, the Company evaluates the overall credit quality of its finance lease portfolio. The Company considers an account past due when a payment has not been received in accordance with the terms of the related lease agreement and maintains allowances, if necessary, for doubtful accounts. These allowances are based on, but not limited to, historical experience which includes stronger and weaker economic cycles, each lessee's payment history, management's current assessment of each lessee's financial condition, consideration of current economic conditions and reasonable market forecasts. As of December 31, 2021 and December 31, 2020 the Company does not have an allowance on its gross finance lease receivables and does not have any material past due balances.
Note 9—Share-Based Compensation
The Company's 2016 Equity Incentive Plan ("2016 Equity Plan") provides for the granting of service-based and performance-based restricted shares and units to executives, employees and directors. The maximum aggregate number of shares and units that may be issued under the 2016 Equity Plan is 5,000,000 common shares and units. Any awards issued under the 2016 Equity Plan that are forfeited by the participant, will become available for future grant under the 2016 Equity Plan.
The following table summarizes the Company's restricted share activity for the year ended December 31, 2021:
| Number of Shares | Weighted Average Fair Value | ||||||||||
Non-vested balance at December 31, 2020 | $ | ||||||||||
Shares/units granted(1) | |||||||||||
Shares/units vested(2) | ( | ||||||||||
| Shares/units forfeited | ( | ||||||||||
Non-vested balance at December 31, 2021 | $ | ||||||||||
(1) Additional shares and units may be granted based upon the satisfaction of certain performance criteria.
(2) Plan participants tendered 87,740 common shares to satisfy income tax withholding obligations. These shares were subsequently retired by the Company.
The share-based compensation expense for the years ended December 31, 2021, 2020 and 2019 included in administrative expenses on the consolidated statements of operations was $9.4 million, $9.9 million, and $9.0 million, respectively. Share based compensation expense includes charges for performance-based shares and units that are deemed probable to vest.
F-24
TRITON INTERNATIONAL LIMITED
NOTES TO CONSOLIDATED FINANCIAL STATEMENTS (Continued)
Note 10—Other Equity Matters
Share Repurchase Program
The Company's Board of Directors authorized repurchases of shares up to a specified dollar amount as part of its repurchase program. Purchases under the repurchase program may be made in the open market or privately negotiated transactions, and may include transactions pursuant to a repurchase plan administered in accordance with Rules 10b5-1 and 10b-18 under the Securities Exchange Act of 1934, as amended. Purchases may be made from time to time at the Company's discretion and the timing and amount of any share repurchases will be determined based on share price, market conditions, legal requirements, and other factors. The repurchase program does not obligate the Company to acquire any particular amount of common shares, and the Company may suspend or discontinue the repurchase program at any time.
During the year ended December 31, 2021, the Company repurchased a total of 1,528,173 common shares at an average price per-share of $55.95 for a total of $85.5 million. As of December 31, 2021, $146.9 million remains available under the share repurchase program.
Preferred Shares
The following table summarizes the Company's preferred share issuances (the "Series"):
| Preferred Share Offering | Issuance | Liquidation Preference (in thousands) | # of Shares(1) | Underwriting Discounts (in thousands) | ||||||||||
Series A | March 2019 | $ | $ | |||||||||||
Series B | June 2019 | $ | ||||||||||||
Series C | November 2019 | $ | ||||||||||||
Series D | January 2020 | $ | ||||||||||||
Series E | August 2021 | $ | ||||||||||||
| $ | $ | |||||||||||||
(1) Represents number of shares authorized, issued, and outstanding.
As a result of these offerings, the Company received $707.0 million in aggregate net proceeds which were used for general corporate purposes, including the purchase of containers, the repurchase of outstanding common shares, the payment of dividends, and the repayment or repurchase of outstanding indebtedness.
Each Series of preferred shares may be redeemed at the Company's option, at any time after approximately five years from original issuance, in whole or in part at a redemption price, plus an amount equal to all accumulated and unpaid dividends, whether or not declared. The Company may also redeem each Series of preferred shares prior to the lapse of the five year period upon the occurrence of certain events as described in each agreement, such as transactions that either transfer ownership of substantially all assets to a single entity or establish a majority voting interest by a single entity, and cause a downgrade or withdrawal of rating by the rating agency within 60 days of the event. If the Company does not elect to redeem each Series upon the occurrence of the preceding events, holders of preferred shares may have the right to convert their preferred shares into common shares. Specifically for Series E only, the Company may redeem the Series E Preference Shares if an applicable rating agency changes the methodology or criteria that were employed in assigning equity credit to securities similar to the Series E Preference Shares when originally issued, which either (a) shortens the period of time during which equity credit pertaining to the Series E Preference Shares would have been in effect had the methodology not been changed or (b) reduces the amount of equity credit as compared with the amount of equity credit that the rating agency had assigned to the Series E Preference Shares when originally issued.
Holders of preferred shares generally have no voting rights. If the Company fails to pay dividends for six or more quarterly periods (whether or not consecutive), holders will be entitled to elect two additional directors to the Board of
F-25
TRITON INTERNATIONAL LIMITED
NOTES TO CONSOLIDATED FINANCIAL STATEMENTS (Continued)
Directors and the size of the Board of Directors will be increased to accommodate such election. Such right to elect two directors will continue until such time as there are no accumulated and unpaid dividends in arrears.
Dividends
Dividends on shares of each Series are cumulative from the date of original issue and will be payable quarterly in arrears on the 15th day of March, June, September and December of each year, when, as and if declared by the Company's Board of Directors. Dividends will be payable equal to the stated rate per annum of the $25.00 liquidation preference per share. The Series rank senior to the Company's common shares with respect to dividend rights and rights upon the Company's liquidation, dissolution or winding up, whether voluntary or involuntary.
The Company paid the following dividends during the years ended December 31, 2021, 2020, and 2019 on its issued and outstanding Series (in millions except for the per-share amounts):
| Year ended December 31, | |||||||||||||||||||||||||||||||||||||||||
| 2021 | 2020 | 2019 | |||||||||||||||||||||||||||||||||||||||
| Series | Per Share Payment | Aggregate Payment | Per Share Payment | Aggregate Payment | Per Share Payment | Aggregate Payment | |||||||||||||||||||||||||||||||||||
A(1) | $ | $ | $ | $ | $ | $ | |||||||||||||||||||||||||||||||||||
| B | $ | $ | $ | $ | $ | $ | |||||||||||||||||||||||||||||||||||
C(1) | $ | $ | $ | $ | $ | $ | |||||||||||||||||||||||||||||||||||
D(1) | $ | $ | $ | $ | $ | $ | |||||||||||||||||||||||||||||||||||
E(1) | $ | $ | $ | $ | $ | $ | |||||||||||||||||||||||||||||||||||
| Total | $ | $ | $ | ||||||||||||||||||||||||||||||||||||||
(1) Per share payments rounded to the nearest whole cent.
As of December 31, 2021, the Company had cumulative unpaid preferred dividends of $2.2 million.
Common Share Dividends
The Company paid the following dividends during the years ended December 31, 2021, 2020, 2019 on its issued common shares (in millions except for the per-share amounts):
| Year Ended December 31, | |||||||||||||||||||||||||||||||||||
| 2021 | 2020 | 2019 | |||||||||||||||||||||||||||||||||
| Per Share Payment | Aggregate Payment | Per Share Payment | Aggregate Payment | Per Share Payment | Aggregate Payment | ||||||||||||||||||||||||||||||
| $ | $ | $ | $ | $ | $ | ||||||||||||||||||||||||||||||
F-26
TRITON INTERNATIONAL LIMITED
NOTES TO CONSOLIDATED FINANCIAL STATEMENTS (Continued)
Accumulated Other Comprehensive Income
The following table summarizes the components of accumulated other comprehensive income (loss), net of tax, for the years ended December 31, 2021, 2020, and 2019 (in thousands):
| Cash Flow Hedges | Foreign Currency Translation | Accumulated Other Comprehensive (Loss) Income | |||||||||||||||
| Balance at January 1, 2019 | $ | $ | ( | $ | |||||||||||||
Change in derivative instruments designated as cash flow hedges(1) | ( | ( | |||||||||||||||
Reclassification of (gain) loss on derivative instruments designated as cash flow hedges(1) | ( | ( | |||||||||||||||
| Cumulative effect for the adoption of ASU 2017-12, net of income tax effect | |||||||||||||||||
| Foreign currency translation adjustment | ( | ( | |||||||||||||||
| Balance at December 31, 2019 | $ | ( | $ | ( | $ | ( | |||||||||||
Change in derivative instruments designated as cash flow hedges(1) | ( | ( | |||||||||||||||
Reclassification of (gain) loss on derivative instruments designated as cash flow hedges(1) | |||||||||||||||||
| Foreign currency translation adjustment | |||||||||||||||||
| Balance at December 31, 2020 | $ | ( | $ | ( | $ | ( | |||||||||||
Change in derivative instruments designated as cash flow hedges(1) | |||||||||||||||||
Reclassification of (gain) loss on derivative instruments designated as cash flow hedges(1) | |||||||||||||||||
| Foreign currency translation adjustment | ( | ( | |||||||||||||||
| Balance at December 31, 2021 | $ | ( | $ | ( | $ | ( | |||||||||||
(1) Refer to Note 7 - "Derivative Instruments" for reclassification impact on the Consolidated Statements of Operations.
Note 11—Segment and Geographic Information
Segment Information
The Company operates its business in one industry, intermodal transportation equipment, and has two
•Equipment leasing - the Company owns, leases and ultimately disposes of containers and chassis from its lease fleet.
•Equipment trading - the Company purchases containers from shipping line customers, and other sellers of containers, and resells these containers to container retailers and users of containers for storage or one-way shipment. Included in the equipment trading segment revenues are leasing revenues from equipment purchased for resale that is currently on lease until the containers are dropped off.
These operating segments were determined based on the chief operating decision maker's review and resource allocation of the products and services offered.
F-27
TRITON INTERNATIONAL LIMITED
NOTES TO CONSOLIDATED FINANCIAL STATEMENTS (Continued)
The following tables summarizes our segment information and the consolidated totals reported (in thousands):
| As of and for the Year Ended December 31, 2021 | Equipment Leasing | Equipment Trading | Totals | ||||||||||||||
| Total leasing revenues | $ | $ | $ | ||||||||||||||
| Trading margin | |||||||||||||||||
| Net gain on sale of leasing equipment | |||||||||||||||||
| Depreciation and amortization expense | |||||||||||||||||
| Interest and debt expense | |||||||||||||||||
Segment income (loss) before income taxes(1) | |||||||||||||||||
| Equipment held for sale | |||||||||||||||||
| Goodwill | |||||||||||||||||
| Total assets | |||||||||||||||||
Purchases of leasing equipment and investments in finance leases(2) | $ | $ | $ | ||||||||||||||
| As of and for the Year Ended December 31, 2020 | Equipment Leasing | Equipment Trading | Totals | ||||||||||||||
| Total leasing revenues | $ | $ | $ | ||||||||||||||
| Trading margin | |||||||||||||||||
| Net gain on sale of leasing equipment | |||||||||||||||||
| Depreciation and amortization expense | |||||||||||||||||
| Interest and debt expense | |||||||||||||||||
Segment income (loss) before income taxes(1)(3) | |||||||||||||||||
| Equipment held for sale | |||||||||||||||||
| Goodwill | |||||||||||||||||
| Total assets | |||||||||||||||||
Purchases of leasing equipment and investments in finance leases(2) | $ | $ | $ | ||||||||||||||
| As of and for the Year Ended December 31, 2019 | Equipment Leasing | Equipment Trading | Totals | ||||||||||||||
| Total leasing revenues | $ | $ | $ | ||||||||||||||
| Trading margin | |||||||||||||||||
| Net gain on sale of leasing equipment | |||||||||||||||||
| Depreciation and amortization expense | |||||||||||||||||
| Interest and debt expense | |||||||||||||||||
Segment income (loss) before income taxes(1) | |||||||||||||||||
| Equipment held for sale | |||||||||||||||||
| Goodwill | |||||||||||||||||
| Total assets | |||||||||||||||||
Purchases of leasing equipment and investments in finance leases(2) | $ | $ | $ | ||||||||||||||
(1) Segment income before income taxes excludes unrealized gains or losses on derivative instruments and debt termination expense. The Company recorded debt termination expense of $133.9 million, $24.7 million, and $2.5 million for the years ended December 31, 2021, 2020, and 2019, respectively and unrealized losses of nil, $0.3 million, and $3.1 million for the years ended December 31, 2021, 2020, and 2019, respectively.
(2) Represents cash disbursements for purchases of leasing equipment and investments in finance lease as reflected in the consolidated statements of cash flows for the periods indicated, but excludes cash flows associated with the purchase of equipment held for resale.
There are no intercompany revenues or expenses between segments. Certain administrative expenses have been allocated between segments based on an estimate of services provided to each segment. A portion of the Company's equipment purchased for resale in the equipment trading segment may be leased for a period of time and is reflected as leasing equipment as opposed to equipment held for sale and the cash flows associated with these transactions are reflected as purchases of leasing equipment and proceeds from the sale of equipment in investing activities in the Company's consolidated statements of cash flows.
F-28
TRITON INTERNATIONAL LIMITED
NOTES TO CONSOLIDATED FINANCIAL STATEMENTS (Continued)
Geographic Segment Information
The Company generates the majority of its leasing revenues from international containers which are deployed by its customers in a wide variety of global trade routes. The majority of the Company's leasing related revenue is denominated in U.S. dollars.
The following table summarizes the geographic allocation of equipment leasing revenues for the years ended December 31, 2021, 2020, and 2019 based on customers' primary domicile (in thousands):
| Year Ended December 31, | |||||||||||||||||
| 2021 | 2020 | 2019 | |||||||||||||||
| Total equipment leasing revenues: | |||||||||||||||||
| Asia | $ | $ | $ | ||||||||||||||
| Europe | |||||||||||||||||
| Americas | |||||||||||||||||
| Bermuda | |||||||||||||||||
| Other International | |||||||||||||||||
| Total | $ | $ | $ | ||||||||||||||
Since the majority of the Company's containers are used internationally, where no one container is domiciled in one particular place for a prolonged period of time, all of the Company's long-lived assets are considered to be international.
The following table summarizes the geographic allocation of equipment trading revenues for the years ended December 31, 2021, 2020 and 2019 based on the location of the sale (in thousands):
| Year Ended December 31, | |||||||||||||||||
| 2021 | 2020 | 2019 | |||||||||||||||
| Total equipment trading revenues: | |||||||||||||||||
| Asia | $ | $ | $ | ||||||||||||||
| Europe | |||||||||||||||||
| Americas | |||||||||||||||||
| Bermuda | |||||||||||||||||
| Other International | |||||||||||||||||
| Total | $ | $ | $ | ||||||||||||||
Note 12—Income Taxes
F-29
TRITON INTERNATIONAL LIMITED
NOTES TO CONSOLIDATED FINANCIAL STATEMENTS (Continued)
The following table sets forth the total income taxes for the periods indicated (in thousands):
| December 31, 2021 | December 31, 2020 | December 31, 2019 | |||||||||||||||
| Current taxes: | |||||||||||||||||
| Bermuda | $ | $ | $ | ||||||||||||||
| U.S. | ( | ||||||||||||||||
| Foreign | |||||||||||||||||
| $ | $ | $ | |||||||||||||||
| Deferred taxes: | |||||||||||||||||
| Bermuda | $ | $ | $ | ||||||||||||||
| U.S. | |||||||||||||||||
| Foreign | ( | ||||||||||||||||
| Total income taxes | $ | $ | $ | ||||||||||||||
The following table sets forth the components of income (loss) before income taxes (in thousands):
| December 31, 2021 | December 31, 2020 | December 31, 2019 | |||||||||||||||
| Bermuda sources | $ | $ | $ | ||||||||||||||
| U.S. sources | |||||||||||||||||
| Foreign sources | |||||||||||||||||
| Income (loss) before income taxes | $ | $ | $ | ||||||||||||||
The following table sets forth the difference between the Bermuda statutory income tax rate and the effective tax rate on the consolidated statements of operations for the periods indicated below:
| December 31, 2021 | December 31, 2020 | December 31, 2019 | |||||||||||||||
| Bermuda tax rate | % | % | % | ||||||||||||||
| Change in enacted tax act | % | % | % | ||||||||||||||
| U.S. income taxed at other than the statutory rate | % | % | % | ||||||||||||||
| Effect of uncertain tax positions | ( | % | ( | % | % | ||||||||||||
| Foreign income taxed at other than the statutory rate | % | % | % | ||||||||||||||
| Effect of permanent differences | % | % | % | ||||||||||||||
| Other discrete items | ( | % | ( | % | ( | % | |||||||||||
| Effective income tax rate | % | % | % | ||||||||||||||
F-30
TRITON INTERNATIONAL LIMITED
NOTES TO CONSOLIDATED FINANCIAL STATEMENTS (Continued)
The following table sets forth the components of deferred income tax assets and liabilities (in thousands):
| December 31, 2021 | December 31, 2020 | ||||||||||
| Deferred income tax assets: | |||||||||||
| Net operating loss carryforwards | $ | $ | |||||||||
| Allowance for losses | |||||||||||
| Derivative instruments | |||||||||||
| Deferred income | |||||||||||
| Accrued liabilities and other payables | |||||||||||
| Total gross deferred tax assets | |||||||||||
| Less: Valuation allowance | ( | ||||||||||
| Net deferred tax assets | $ | $ | |||||||||
| Deferred income tax liabilities: | |||||||||||
| Accelerated depreciation | $ | $ | |||||||||
| Goodwill and other intangible amortization | |||||||||||
| Derivative instruments | |||||||||||
| Deferred income | |||||||||||
| Deferred partnership income (loss) | |||||||||||
| Other | |||||||||||
| Total gross deferred tax liability | |||||||||||
| Net deferred income tax liability | $ | $ | |||||||||
The Company has no net operating loss carryforwards for U.S. federal income tax purposes at year end December 31, 2021. At December 31, 2021, the Company had deferred tax assets from U.S. state net operating loss carryforwards of $1.2 million that expire at various times beginning in 2022. The Company recorded a valuation allowance of $0.2 million at December 31, 2021 related to U.S. state net operating losses, as it is more likely than not that Triton will be unable to utilize these losses. The Company did not record a valuation allowance at December 31, 2020.
In assessing the potential future realization of deferred tax assets, management considers whether it is more-likely-than-not that some portion or all of the deferred tax assets will not be realized. The ultimate realization of deferred tax assets is dependent upon the generation of future taxable income during the periods in which those temporary differences become deductible. The Company considers the scheduled reversal of deferred tax liabilities, projected future taxable income and tax planning strategies in making this assessment. Based upon the level of historical taxable income and projections for future taxable income over the periods during which the deferred tax assets are deductible, the Company believes it is more-likely-than-not that the Company will realize the benefits of these deductible differences at December 31, 2021.
Certain income taxes on unremitted earnings have not been reflected on the consolidated financial statements because such earnings are intended to be permanently reinvested in those jurisdictions. Such earnings and related income taxes are estimated to be approximately $79.9 million and $23.6 million, respectively, at December 31, 2021.
The Tax Cuts and Jobs Act includes a tax on "global intangible low-taxed income" ("GILTI"), which taxes U.S shareholders on certain income earned by foreign subsidiaries. The Company has made an accounting policy election to account for the tax effects of the GILTI tax in the income tax provision in future periods as the tax arises.
The Company files income tax returns in several jurisdictions including the U.S. and certain U.S. states.
F-31
TRITON INTERNATIONAL LIMITED
NOTES TO CONSOLIDATED FINANCIAL STATEMENTS (Continued)
The following table sets forth the unrecognized tax benefit amounts (in thousands):
| December 31, 2021 | December 31, 2020 | ||||||||||
| Beginning balance at January 1 | $ | $ | |||||||||
| Increase (decrease) related to tax positions | |||||||||||
| Lapse of statute of limitations | ( | ( | |||||||||
| Foreign exchange adjustment | |||||||||||
| Ending balance at December 31 | $ | $ | |||||||||
It is reasonably possible that the total amount of unrecognized tax benefits as of December 31, 2021 will decrease by $0.2 million within the next twelve months due to statute of limitations lapses. This reduction will impact income tax expense when recognized. The tax years 2018 through 2021 remain subject to examination by major tax jurisdictions.
The Company accrues interest and penalties related to income taxes in the provision for income taxes.
The following table summarizes interest and penalty expense (in thousands):
| December 31, 2021 | December 31, 2020 | December 31, 2019 | |||||||||||||||
| Interest expense (benefit) | $ | ( | $ | ( | $ | ||||||||||||
| Penalty expense (benefit) | $ | ( | $ | ( | $ | ( | |||||||||||
The following table summarizes the components of income taxes payable included in Accounts payable and other accrued expenses on the consolidated balance sheets (in thousands):
| December 31, 2021 | December 31, 2020 | ||||||||||
| Corporate income taxes payable | $ | $ | |||||||||
| Unrecognized tax benefits | |||||||||||
| Interest accrued | |||||||||||
| Penalties | |||||||||||
| Income taxes payable | $ | $ | |||||||||
Note 13—Other Postemployment Benefits
Note 14—Commitments and Contingencies
Container Equipment Purchase Commitments
As of December 31, 2021, the Company had commitments to purchase equipment in the amount of $156.5 million payable in 2022.
Contingencies
The Company is party to various pending or threatened legal or regulatory proceedings arising in the ordinary course of its business. Based upon information presently available, the Company does not expect any liabilities arising from these matters to have a material effect on the consolidated financial position, results of operations or cash flows of the Company.
F-32
TRITON INTERNATIONAL LIMITED
NOTES TO CONSOLIDATED FINANCIAL STATEMENTS (Continued)
Note 15—Related Party Transactions
Note 16—Subsequent Events
On January 19, 2022, the Company completed a $600.0 million corporate note offering. The corporate notes have a contractual interest rate of 3.25 % with an expected maturity date of March 15, 2032. In conjunction with this, we terminated $300.0 million notional value of interest rate swaps and received a cash settlement of $12.1 million.
On February 9, 2022, the Company's Board of Directors approved and declared a $0.65 per share quarterly cash dividend on its issued and outstanding common shares, payable on March 25, 2022 to shareholders of record at the close of business on March 11, 2022.
On February 9, 2022, the Company's Board of Directors also approved and declared a cash dividend on its issued and outstanding preferred shares, payable on March 15, 2022 to holders of record as the close of business on March 8, 2022 as follows:
| Preferred Share Offering | Dividend Rate | Dividend Per Share | ||||||||||||
| Series A | $ | |||||||||||||
| Series B | $ | |||||||||||||
| Series C | $ | |||||||||||||
| Series D | $ | |||||||||||||
| Series E | $ | |||||||||||||
F-33
SCHEDULE I - CONDENSED FINANCIAL INFORMATION OF REGISTRANT
TRITON INTERNATIONAL LIMITED
Parent Company Condensed Balance Sheets
(In thousands, except share data)
| December 31, 2021 | December 31, 2020 | ||||||||||
| ASSETS: | |||||||||||
| Cash and cash equivalents | $ | $ | |||||||||
| Investment in subsidiaries | |||||||||||
| Other assets | |||||||||||
| Total assets | $ | $ | |||||||||
| LIABILITIES AND SHAREHOLDERS' EQUITY: | |||||||||||
| Accounts payable and other accrued expenses | $ | $ | |||||||||
| Payables with affiliates, net | |||||||||||
| Total liabilities | |||||||||||
| Shareholders' equity | |||||||||||
Preferred shares, $ | |||||||||||
Common shares, $ | |||||||||||
Undesignated shares, $ | |||||||||||
Treasury shares, at cost, | ( | ( | |||||||||
| Additional paid-in capital | |||||||||||
| Accumulated earnings | |||||||||||
| Accumulated other comprehensive income | ( | ( | |||||||||
| Total shareholders' equity | |||||||||||
| Total liabilities and shareholders' equity | $ | $ | |||||||||
S-1
TRITON INTERNATIONAL LIMITED
Parent Company Condensed Statements of Operations
(In thousands)
| Year Ended December 31, | |||||||||||||||||
| 2021 | 2020 | 2019 | |||||||||||||||
| Revenues: | |||||||||||||||||
| Revenues | $ | $ | $ | ||||||||||||||
| Total revenues | |||||||||||||||||
| Operating expenses: | |||||||||||||||||
| Administrative expenses | |||||||||||||||||
| Operating income (loss) | ( | ( | ( | ||||||||||||||
| Other income (expenses): | |||||||||||||||||
| Interest and debt expense | ( | ||||||||||||||||
| Net income from subsidiaries | |||||||||||||||||
| Total other income (expenses) | |||||||||||||||||
| Income (loss) before income taxes | |||||||||||||||||
| Income tax expense (benefit) | |||||||||||||||||
| Net income (loss) | $ | $ | $ | ||||||||||||||
S-2
TRITON INTERNATIONAL LIMITED
Parent Company Condensed Statements of Cash Flows
(In thousands)
| Year Ended December 31, | |||||||||||||||||
| 2021 | 2020 | 2019 | |||||||||||||||
| Cash flows from operating activities: | |||||||||||||||||
| Net income (loss) | $ | $ | $ | ||||||||||||||
| Adjustments to reconcile net income (loss) to net cash provided by operating activities: | |||||||||||||||||
| Net (income) loss from subsidiaries | ( | ( | ( | ||||||||||||||
| Dividends received from subsidiaries | |||||||||||||||||
| Share-based compensation expense | |||||||||||||||||
| Changes in operating assets and liabilities: | |||||||||||||||||
| Other | ( | ( | ( | ||||||||||||||
| Net cash provided by (used in) operating activities | |||||||||||||||||
| Cash flows from investing activities: | |||||||||||||||||
| Investment in subsidiary | ( | ( | ( | ||||||||||||||
| Net cash provided by (used in) investing activities | ( | ( | ( | ||||||||||||||
| Cash flows from financing activities: | |||||||||||||||||
| Issuance of preferred shares, net of underwriting discount | |||||||||||||||||
| Purchases of treasury shares | ( | ( | ( | ||||||||||||||
| Loan with affiliate | ( | ||||||||||||||||
| Dividends paid on preferred shares | ( | ( | ( | ||||||||||||||
| Dividends paid on common shares | ( | ( | ( | ||||||||||||||
| Other | ( | ( | ( | ||||||||||||||
| Net cash provided by (used in) financing activities | ( | ( | ( | ||||||||||||||
| Net increase (decrease) in cash and cash equivalents | $ | $ | $ | ( | |||||||||||||
| Cash, cash equivalents and restricted cash, beginning of period | |||||||||||||||||
| Cash, cash equivalents and restricted cash, end of period | $ | $ | $ | ||||||||||||||
S-3
TRITON INTERNATIONAL LIMITED
Valuation and Qualifying Accounts
(In thousands)
| For the year ended December 31, | |||||||||||||||||
| Accounts Receivable-Allowance for doubtful accounts: | 2021 | 2020 | 2019 | ||||||||||||||
| Beginning Balance | $ | $ | $ | ||||||||||||||
| Additions / (Reversals) | ( | ||||||||||||||||
| Write-offs | ( | ( | ( | ||||||||||||||
| Ending Balance | $ | $ | $ | ||||||||||||||
S-4
Serious News for Serious Traders! Try StreetInsider.com Premium Free!
You May Also Be Interested In
- Interactive Brokers Launches Global Contracts for Difference (CFDs) in Japan
- Yugabyte Embraces ‘No Downtime, No Limits,’ as the Theme of the Upcoming Distributed SQL Summit Asia
- LIVE NATION ALERT: Bragar Eagel & Squire, P.C. is Investigating Live Nation Entertainment, Inc. on Behalf of Live Nation Stockholders and Encourages Investors to Contact the Firm
Create E-mail Alert Related Categories
SEC FilingsSign up for StreetInsider Free!
Receive full access to all new and archived articles, unlimited portfolio tracking, e-mail alerts, custom newswires and RSS feeds - and more!
