

Form 10-K TAKE TWO INTERACTIVE For: Mar 31
 Tweet
Tweet Share
ShareUNITED STATES
SECURITIES AND EXCHANGE COMMISSION
WASHINGTON, D.C. 20549
FORM 10-K
| Annual Report Pursuant to Section 13 or 15(d) of the Securities Exchange Act of 1934 | |||||
For the fiscal year ended | |||||
| OR | |||||
| Transition Report Pursuant to Section 13 or 15(d) of the Securities Exchange Act of 1934 | |||||
| For the transition period from to . | |||||
Commission file number 001-34003
(Exact name of registrant as specified in its charter)
(State or Other Jurisdiction of Incorporation or Organization) | (I.R.S. Employer Identification No.) | |||||||
(Address of principal executive offices) | (Zip Code) | |||||||
Registrant's Telephone Number, Including Area Code: (646 ) 536-2842
Securities registered pursuant to Section 12(b) of the Act:
| Title of each class | Trading symbol | Name of each exchange on which registered | ||||||
Securities registered pursuant to Section 12(g) of the Act: None
Indicate by check mark if the registrant is a well-known seasoned issuer, as defined in Rule 405 of the Securities Act. Yes ý No o
Indicate by check mark if the registrant is not required to file reports pursuant to Section 13 or Section 15(d) of the Act. Yes o No ý
Indicate by check mark whether the Registrant (1) has filed all reports required to be filed by Section 13 or 15(d) of the Securities Exchange Act of 1934 during the preceding 12 months (or for such shorter period that the registrant was required to file such reports), and (2) has been subject to such filing requirements for the past 90 days. Yes ý No o
Indicate by check mark whether the registrant has submitted electronically every Interactive Data File required to be submitted pursuant to Rule 405 of Regulation S-T (§232.405 of this chapter) during the preceding 12 months (or for such shorter period that the registrant was required to submit such files). Yes ý No o
Indicate by check mark whether the registrant is a large accelerated filer, an accelerated filer, a non-accelerated filer, a smaller reporting company, or an emerging growth company. See the definitions of "large accelerated filer," "accelerated filer," "smaller reporting company," and "emerging growth company" in Rule 12b-2 of the Exchange Act. (Check one):
Accelerated filer o | Non-accelerated filer o | Smaller reporting company | Emerging growth company | |||||||||||
If an emerging growth company, indicate by check mark if the registrant has elected not to use the extended transition period for complying with any new or revised financial accounting standards provided pursuant to Section 13(a) of the Exchange Act. o
Indicate by check mark whether the registrant has filed a report on and attestation to its management’s assessment of the effectiveness of its internal control over financial reporting under Section 404(b) of the Sarbanes-Oxley Act (15 U.S.C. 7262(b)) by the registered public accounting firm that prepared or issued its audit report. ý
Indicate by check mark whether the registrant is a shell company (as defined in Rule 12b-2 of the Exchange Act). Yes ☐ No ý
The aggregate market value of the voting and non-voting common equity held by non-affiliates computed by reference to the price at which the common equity was last sold, or the average bid and asked price of such common equity, as of the last business day of the Registrant's most recently completed second fiscal quarter was approximately $17,527,063,287 .
As of May 5, 2022, there were 115,808,814 shares of the Registrant's Common Stock outstanding, net of treasury stock.
Documents Incorporated by Reference:
INDEX
| PAGE | ||||||||
CAUTIONARY NOTE ABOUT FORWARD-LOOKING STATEMENTS
The statements contained herein, which are not historical facts, including statements relating to our proposed acquisition of Zynga Inc. ("Zynga"), are considered forward-looking statements under federal securities laws and may be identified by words such as "anticipates," "believes," "estimates," "expects," "intends," "plans," "potential," "predicts," "projects," "seeks," "should," "will," or words of similar meaning and include, but are not limited to, statements regarding the outlook for Take-Two Interactive Software, Inc.'s ("Take-Two," the "Company," "we," "us," or similar pronouns) future business and financial performance. Such forward-looking statements are based on the current beliefs of our management as well as assumptions made by and information currently available to them, which are subject to inherent uncertainties, risks, and changes in circumstances that are difficult to predict. Actual outcomes and results may vary materially from these forward-looking statements based on a variety of risks and uncertainties including the uncertainty of the impact of the COVID-19 pandemic and measures taken in response thereto; the effect that measures taken to mitigate the COVID-19 pandemic have on our operations, including our ability to timely deliver our titles and other products, and on the operations of our counterparties, including retailers, including digital storefronts and platform partners, and distributors; the effects of the COVID-19 pandemic on consumer demand and the discretionary spending patterns of our customers as the situation with the pandemic continues to evolve; the impact of reductions in interest rates by the Federal Reserve and other central banks, including on our short-term investment portfolio; the impact of potential inflation; volatility in foreign currency exchange rates; the occurrence of any event, change or other circumstances that could give rise to the termination of the merger agreement for the Zynga acquisition; the inability to obtain our or Zynga's respective stockholder approval or the failure to satisfy other conditions to completion of the proposed acquisition, on a timely basis or at all; risks that the proposed acquisition disrupts each company’s current plans and operations; the diversion of the attention of the respective management teams of Take-Two and Zynga from their respective ongoing business operations; the ability of either Take-Two, Zynga or the combined company to retain key personnel; the ability to realize the benefits of the proposed acquisition, including Net Bookings opportunities and cost synergies; the ability to successfully integrate Zynga’s business with Take-Two’s business or to integrate the businesses within the anticipated timeframe; the outcome of any legal proceedings that may be instituted against Take-Two, Zynga or others related to the proposed acquisition; the amount of the costs, fees, expenses and charges related to the proposed acquisition; other risks included herein; as well as, but not limited to, the risks and uncertainties discussed under the heading "Risk Factors" included in Part I, Item 1A herein. All forward-looking statements are qualified by these cautionary statements and speak only as of the date they are made. We undertake no obligation to update any forward-looking statement, whether as a result of new information, future events, or otherwise.
PART I
Item 1. Business
Recent Developments
Pending Acquisition. On January 9, 2022, we entered into a definitive merger agreement to acquire Zynga Inc. ("Zynga"), a leading developer of mobile games. Under the terms and subject to the conditions of the merger agreement, Zynga stockholders will receive $3.50 in cash and a number of shares of our common stock equal to the exchange ratio for each share of Zynga common stock outstanding at the closing. The transaction is valued at $9.86 per share of Zynga common stock based on the market closing as of January 7, 2022, implying an enterprise value of $12.7 billion. The transaction includes a collar mechanism on the equity consideration, so that if the volume weighted average price ("VWAP") of Take-Two common stock on the Nasdaq Global Select Market for the consecutive period beginning at 9:30 a.m. New York time on the twenty-third trading day immediately preceding the closing date of the transaction and concluding at 4:00 p.m. New York time on the third trading day preceding such closing date is in a range from $156.50 to $181.88, the exchange ratio would be adjusted to deliver total consideration of $9.86 per Zynga share. If the VWAP of our common stock for the period noted in the prior sentence exceeds the higher end of that range the exchange ratio would be 0.0350 per share, and, if the VWAP is below the lower end of that range, the exchange ratio would be 0.0406 per share.
The transaction, which is currently anticipated to close on Monday, May 23, 2022, is subject to approval by Take-Two and Zynga stockholders and the satisfaction of the other customary closing conditions.
In connection with the transaction, on April 14, 2022, we completed our offering and sale of $2.7 billion aggregate principal amount of our senior notes, consisting of $1.0 billion principal amount of our 3.300% Senior Notes due 2024 (the “2024 Notes”), $600 million principal amount of our 3.550% Senior Notes due 2025 (the “2025 Notes”), $600 million principal amount of our 3.700% Senior Notes due 2027 (the “2027 Notes”) and $500 million principal amount of our 4.000% Senior Notes due 2032 (the “2032 Notes” and, together with the 2024 Notes, the 2025 Notes and the 2027 Notes, the “Notes”).The Notes were issued under an indenture between the Company and The Bank of New York Mellon, as trustee (the “Trustee”).
The Notes are the Company’s senior unsecured obligations and rank equally with all of our other existing and future unsubordinated obligations. The 2024 Notes mature on March 28, 2024 and bear interest at an annual rate of 3.300%. The 2025
1
Notes mature on April 14, 2025 and bear interest at an annual rate of 3.550%. The 2027 Notes mature on April 14, 2027 and bear interest at an annual rate of 3.700%. The 2032 Notes mature on April 14, 2032 and bear interest at an annual rate of 4.000%. We will pay interest on the 2024 Notes semiannually on March 28 and September 28 of each year, commencing September 28, 2022. We will pay interest on each of the 2025 Notes, 2027 Notes and 2032 Notes semi-annually on April 14 and October 14 of each year, commencing October 14, 2022.
General
We are a leading developer, publisher and marketer of interactive entertainment for consumers around the globe. We develop and publish products principally through Rockstar Games, 2K, Private Division, and T2 Mobile Games. Our products are currently designed for console gaming systems, including, but not limited to, the Sony Computer Entertainment, Inc. ("Sony") PlayStation®4 ("PS4") and PlayStation5 ("PS5"), Microsoft Corporation ("Microsoft") Xbox One® ("Xbox One") and Xbox Series X|S ("Xbox Series X|S"), and Nintendo's SwitchTM ("Switch"), as well as personal computers ("PC"), and mobile, including, smartphones and tablets ("Mobile"). We deliver our products through physical retail, digital download, online platforms, and cloud streaming services.
Our website address is www.take2games.com. We make all of our filings with the Securities and Exchange Commission ("SEC") available free of charge on our website under the caption "Financial Information—SEC Filings." Included in these filings are our annual reports on Form 10-K, quarterly reports on Form 10-Q, current reports on Form 8-K, and amendments to those reports, which are available as soon as reasonably practicable after we electronically file or furnish such materials with the SEC pursuant to Section 13(a) or 15(d) of the Securities Exchange Act of 1934. Our website and the information contained therein or connected thereto are not intended to be incorporated into this Annual Report on Form 10-K. The SEC maintains a website that contains annual, quarterly and current reports, proxy and information statements and other information that issuers (including the Company) file electronically with the SEC. The SEC's website is www.sec.gov.
Strategy
Overview. We endeavor to be the most creative, innovative, and efficient company in our industry. Our core strategy is to capitalize on the popularity of video games by developing and publishing high-quality interactive entertainment experiences across a range of genres. We focus on building compelling entertainment franchises by publishing a select number of titles for which we can create sequels and incremental revenue opportunities through virtual currency, add-on content, and in-game purchases. Most of our intellectual property is internally owned and developed, which we believe best positions us financially and competitively. We have established a portfolio of proprietary software content for the major hardware platforms in a wide range of genres, including action, adventure, family/casual, role-playing, shooter, sports and strategy, which we distribute worldwide. We believe that our commitment to creativity and innovation is a distinguishing strength, enabling us to differentiate our products in the marketplace by combining advanced technology with compelling storylines and characters that provide unique gameplay experiences for consumers. We have created, acquired, or licensed a group of highly recognizable brands to match the broad consumer demographics that we serve, ranging from adults to children and game enthusiasts to casual gamers. Another cornerstone of our strategy is to support the success of our products in the marketplace through innovative marketing programs and global distribution on platforms and through channels that are relevant to our target audience.
Support World-Class Creative Teams. Creativity and innovation remain two of the core tenets of our organization and are the lifeblood of our ongoing success. We have 6,042 employees working in game development in studios around the world, including some of the most well-known names in the business. The creative teams at Rockstar Games and 2K are renowned for their consistent ability to deliver games that set new benchmarks for excellence. In addition, Private Division is dedicated to bringing titles from top independent developers to market, and T2 Mobile Games further enhances our development capabilities with a track record of producing multiple hits in the free-to-play mobile sector. Whether expanding our portfolio of franchises, launching new intellectual property, or providing innovative ways for audiences to remain captivated and engaged, we prioritize producing the highest quality entertainment experiences. We support our teams by focusing on talent acquisition and retention, and our label structure enables us to target distinct market segments and opportunities.
Focus on Core Strength of Producing High Quality Titles. We focus on publishing a number of high-quality titles based on internally owned and developed intellectual properties. We and our subsidiaries currently own the intellectual property rights to 30 proprietary brands. In addition, we selectively develop titles based on licensed properties, including sports leagues, and also publish externally developed titles.
We use a product investment review process to evaluate potential titles for investment, to review existing titles in development, and to assess titles after release by measuring their performance in the market and the return on our investment. We apply this process to all of our products, whether internally or externally developed. Our product investment review process
2
includes reviews of each project at various stages of development by our executive management team and the senior management of our publishing labels and also includes coordination between our sales and marketing personnel before the launch of titles. This disciplined approach to product investment is expected to enhance the competitiveness and profitability of our titles.
We develop our products using a combination of our internal development teams and external development resources acting under contract with us. We typically select external developers based on their track record and expertise in developing products in the same category or genre. One developer will generally produce the same game for multiple platforms and will also produce sequels to the original game. We believe that selecting and using development resources in this manner allows us to leverage the particular expertise of our internal and external development resources, which is designed to maintain our quality standards for our products.
Leverage Emerging Technologies, Platforms, and Distribution Channels, Including Digitally-Delivered Content. Interactive entertainment played online and on Mobile, presents opportunities to enhance our growth and profitability. In addition, the interactive entertainment software industry is delivering a growing amount of content for traditional platforms through digital download. We provide a variety of digitally-delivered products and offerings, which typically have a higher gross margin than physically-delivered products. Virtually all of our titles that are available through retailers as packaged goods products are also available through direct digital download (from websites we own or third-party websites). We also publish an expanding variety of titles for Mobile, which are delivered to consumers through digital download. We will continue to invest in emerging opportunities in mobile and online gameplay, particularly for our wholly-owned franchises, as well as downloadable content and microtransactions that enable gamers to pay to download additional content to enhance their game playing experience. We aim to drive ongoing engagement and incremental revenue from recurrent consumer spending on our titles through virtual currency, add-on content, and in-game purchases.
Expand International Business. The global market for interactive entertainment continues to grow, and we seek to increase our presence internationally, particularly in Asia, the Middle East, and Latin America. We are continuing to execute on our growth initiatives in Asia, where our strategy is to broaden the distribution of our existing products and expand our online gaming presence, especially in China and South Korea. We are a direct publisher in Japan and South Korea. While we retain title to all intellectual property, in some regions, local publishers, under license agreements, are responsible for localization of software content, distribution, and marketing of the products in their respective local markets. We intend to continue to build on our licensing relationships and also continue to expand on distribution strategies to grow our international business.
Our Businesses
Our revenue is primarily derived from the sale of internally developed software titles and software titles developed by third parties. Operating margins are dependent in part upon our ability to release new, commercially successful software products and to manage effectively their development and marketing costs. We have internal development studios located in Australia, Canada, China, Czech Republic, Hungary, India, Serbia, South Korea, Spain, the United Kingdom (U.K.), and the United States (U.S.). As of March 31, 2022, we had a research and development staff of 6,042 employees with the technical capabilities to develop software titles for all major consoles, PCs, and mobile platforms in multiple languages and territories.
Agreements with third-party developers generally give us exclusive publishing and marketing rights and require us to make development payments, pay royalties based on product sales, and satisfy other conditions. Development payments for software titles are typically recoupable against royalties otherwise due to developers based on software sales. Our agreements with third-party developers generally provide us with the right to monitor development efforts and to cease making development payments if specified development milestones are not satisfied. We also regularly monitor the level of development payments in light of the expected sales for the related titles.
We continue to engage in evolving business models such as online gaming, virtual currency, add-on content, and in-game purchases, and we expect to continue to generate incremental revenue from these opportunities.
Rockstar Games. Software titles published by our Rockstar Games label are primarily internally developed. We expect Rockstar Games, our wholly-owned publisher of the Grand Theft Auto, Max Payne, Midnight Club, Red Dead Redemption, and other popular franchises, to continue to be a leader in the action/adventure product category and to create groundbreaking entertainment. We believe that Rockstar Games has established a uniquely original, popular cultural phenomenon with its Grand Theft Auto series, which is the interactive entertainment industry's most iconic and critically acclaimed brand and has sold-in over 375 million units worldwide. The latest installment, Grand Theft Auto V, has sold-in over 160 million units worldwide and includes access to Grand Theft Auto Online. Red Dead Redemption 2, which has been a critical and commercial success that set numerous entertainment industry records, has sold-in more than 40 million units worldwide to date. Rockstar Games confirmed that active development for the next entry in the Grand Theft Auto franchise is well underway with more details to be shared over time. Rockstar Games is also well known for developing brands in other
3
genres, including the LA Noire, Bully, and Manhunt games. Rockstar Games continues to expand on our established series by developing sequels, offering downloadable episodes, and additional content. Rockstar Game's titles are published across all key platforms, including Mobile.
2K. Our 2K label has published a variety of popular entertainment properties across all key platforms and across a range of genres including shooter, action, role-playing, strategy, sports and family/casual entertainment. We expect 2K to continue to develop new, successful franchises in the future. 2K's internally owned and developed franchises include the critically acclaimed, multi-million unit selling BioShock, Mafia, Sid Meier's Civilization, and XCOM series. 2K also publishes externally developed franchises such as Borderlands. 2K's realistic sports simulation titles include our flagship NBA 2K series, which continues to be the top-ranked NBA basketball video game, the WWE 2K professional wrestling series, and PGA TOUR 2K. 2K has announced a multi-year partnership with the National Football League encompassing multiple future video games that will be non-simulation football game experiences. 2K also publishes mobile titles, such as WWE SuperCard.
Private Division. Our Private Division label is dedicated to bringing titles from the industry's leading creative talent to market and is the publisher and owner of Kerbal Space Program and OlliOlli World. Kerbal Space Program 2 is planned for release in fiscal year 2023. Private Division also released The Outer Worlds and Ancestors: The Humankind Odyssey.
T2 Mobile Games T2 Mobile Games includes Socialpoint, Playdots, and Nordeus, which publish popular free-to-play mobile games that deliver high quality, deeply engaging entertainment experiences and generates revenue from in-game sales and in-game advertising. T2 Mobile Games' titles include Dragon City, Monster Legends, Two Dots, and Top Eleven.
On June 1, 2021, we acquired Nordeus Limited ("Nordeus"), for consideration having an acquisition date fair value of $289.8 million, consisting of $132.9 million in cash and the issuance of 0.5 million shares of our common stock, and a contingent earn-out consideration arrangement that requires us to pay up to an aggregate of $153.0 million in cash if Nordeus achieves certain performance measures over the 12- and 24- month periods following the closing (see Note 22 - Acquisitions of our Consolidated Financial Statements). Founded in 2010, Nordeus is a mobile games company based in Belgrade, Serbia, best known for Top Eleven, which has over 240 million registered users.
We are continuing to execute on our growth initiatives in Asia, where our strategy is to broaden the distribution of our existing products and establish an online gaming presence, especially in China and South Korea. 2K has secured a multi-year license from the NBA to develop an online version of our NBA simulation game in China, Taiwan, South Korea and Southeast Asia. NBA 2K Online, our free-to-play NBA simulation game that is based on the console edition of NBA 2K, which was co-developed by 2K and Tencent, is the top online PC sports game in China with over 56 million registered users. We have released two iterations of NBA 2K Online and continue to enhance the title with new features.
We have expanded our relationship with the NBA through the NBA 2K League. This groundbreaking competitive gaming league is jointly owned by us and the NBA and consists of teams operated by actual NBA franchises. The NBA 2K League follows a professional sports league format: head-to-head competition throughout a regular season, followed by a bracketed playoff system and a finals match-up. The NBA 2K League is currently in its fifth season.
Intellectual Property
Our business is highly dependent on the creation, acquisition, licensing, and protection of intellectual property. The intellectual property rights we have created or acquired for our internally-owned portfolio of brands include BioShock, Bully, Carnival Games, Dragon City, Grand Theft Auto, Kerbal Space Program, L.A. Noire, Mafia, Manhunt, Max Payne, Midnight Club, Monster Legends, OlliOlli World, Red Dead, Sid Meier's Civilization, Top Eleven, Two Dots, and XCOM. We believe that content ownership facilitates our internal product development efforts and maximizes profit potential. We attempt to protect our software and production techniques under copyright, patent, trademark, and trade secret laws as well as through contractual restrictions on disclosure, copying, and distribution.
We also enter into content license agreements, such as those with sports leagues, players associations, music labels and musicians. These licenses are typically limited to use of the licensed rights in products for specific time periods. In addition, we license and include console manufacturer technology in our products on a non-exclusive basis, which allows our games to be played on their respective hardware systems.
Manufacturing
Platform manufacturers, such as Sony, Microsoft, and Nintendo, either manufacture or control the selection of approved manufacturers of software products sold for use on their respective hardware platforms. We place a purchase order for the manufacture of our products with Sony, Nintendo, or Microsoft's approved replicator and then send software code to the manufacturer, together with related artwork, user instructions, warranty information, brochures and packaging designs for approval, defect testing and manufacture. Games are generally shipped within two to three weeks of receipt of our purchase order and all materials.
4
Our software titles typically carry a 90-day limited warranty.
Arrangements with Platform Manufacturers
We have entered into license agreements with Sony and Microsoft to develop and publish software in Asia, Australia, Europe, North America, and certain Latin American, Middle Eastern, and African countries. We are not required to obtain any licenses from hardware manufacturers to develop titles for the PC.
Sony. Effective March 23, 2017, we entered into a PlayStation Global Developer and Publisher Agreement with Sony Computer Entertainment, Inc. and certain of its affiliates, pursuant to which Sony granted us the right and license to develop, publish, have manufactured, market, advertise, distribute and sell PlayStation compatible products for all PlayStation systems. The agreement requires us to submit products to Sony for approval and for us to make royalty payments to Sony based on the number of units manufactured or revenue from digitally downloaded content. In addition, products for PlayStation systems are required to be manufactured by Sony-approved manufacturers. On September 30, 2020, we entered into a PlayStation 5 Amendment, with an effective date of May 1, 2020 (the “PS5 Amendment”), to our existing PlayStation Global Developer and Publisher Agreement. The PS5 Amendment amends the existing agreement to include the PlayStation 5 interactive entertainment system in the definition of systems in the agreement and to extend all of the terms and conditions of the existing agreement to our PlayStation 5 products and services.
The term of the agreement, as amended, expires on March 31, 2023, with automatic one-year renewal terms thereafter (unless one party gives the other notice of termination). Sony may terminate the agreement for any or no reason upon 30 days’ notice. The agreement may also be terminated by Sony immediately in the event of a breach by us or our bankruptcy or insolvency. Upon expiration or termination of the agreement, we have certain rights to sell off existing inventories.
Microsoft. Under the terms of the license agreements that we have entered into with Microsoft Corporation and its affiliates, Microsoft granted us the right and license to develop, publish, have manufactured, market, advertise, distribute and sell Xbox compatible products. The agreements require us to submit products to Microsoft for approval and to make royalty payments to Microsoft based on the number of units manufactured or revenue from digitally downloaded content. In addition, products for the Xbox consoles are required to be manufactured by Microsoft-approved manufacturers.
Effective as of November 17, 2005, we entered into an Xbox 360 Publisher License Agreement with Microsoft for the Xbox 360 console (the “Xbox 360 Agreement”). Effective as of July 1, 2020, we entered into an Xbox Console Publisher License Agreement with Microsoft for the Xbox Series X|S and Xbox One consoles (the “Xbox Next Gen Agreement” and together with Xbox 360 Agreement, the “Xbox Agreements”). The term of Xbox 360 Agreement expires on March 31, 2023, and the term of the Xbox Next Gen Agreement expires on March 31, 2023, each with automatic one-year renewal terms thereafter (unless one party gives the other advance notice of non-renewal). These Xbox Agreements may be terminated by Microsoft immediately in the event of a breach by us, and the Xbox Next Gen Agreement may also be terminated by Microsoft immediately in the event of our bankruptcy or insolvency. Upon expiration or termination of each of the Xbox Agreements, we have certain rights to sell off existing inventories.
Sales
We sell software titles both physically and digitally through direct relationships with large retail customers, including digital storefronts and platform partners, and third-party distributors. Our top customers include, among others, Sony, Microsoft, Steam, GameStop, Epic, Apple, and Google. We sell our products globally and have sales operations in Australia, Canada, France, Germany, Japan, the Netherlands, New Zealand, Singapore, South Korea, Spain, Taiwan, the United Kingdom, and the United States.
We are dependent on a limited number of customers that account for a significant portion of our sales. Sales to our five largest customers during the fiscal year ended March 31, 2022, accounted for 79.0% of our net revenue, with Sony and Microsoft each accounting for more than 10.0% of our net revenue during the fiscal year ended March 31, 2022.
We also distribute our titles, add-on content, and in-game purchases through direct digital download to consoles and PCs, including smartphones and tablets. We view digital distribution as an important growth opportunity for our industry and Company; however, we expect that packaged goods and traditional retailers will continue to be a significant channel for the sale of our console products for the foreseeable future.
Marketing
Our marketing and promotional efforts are intended to maximize consumer interest in our titles, promote brand name recognition of our franchises, assist retailers and properly position, package and merchandise our titles. From time to time, we also receive marketing support from hardware manufacturers in connection with their own promotional efforts.
5
We market titles by:
•Implementing public relations campaigns, using social, digital, online, television, outdoor, and print marketing, including certain performance marketing programs. We believe that we label and market our products in accordance with the applicable principles and guidelines of the Entertainment Software Rating Board, ("ESRB"), an independent self-regulatory body that assigns ratings and enforces advertising guidelines for the interactive software industry.
•Stimulating continued sales by reducing the wholesale prices of our products to retailers, digital storefronts, and platform providers at various times during the life of a product. Price protection may occur at any time in a product's life cycle, but typically occurs three to nine months after a product's initial launch. In certain international markets, we also provide volume rebates to stimulate continued product sales.
•Employing various other marketing methods designed to promote consumer awareness, including social media, in-store promotions and point-of-purchase displays, direct mail, cooperative advertising, attendance at trade shows as well as product sampling through demonstration software distributed via the Internet or the digital online services.
As of March 31, 2022, we had a sales and marketing staff of 811 people.
Product Procurement
We procure products from suppliers principally using standard purchase orders based on our assessment of market demand. We carry inventory quantities that we believe are necessary to provide rapid response to retailer and distributor orders. We utilize electronic data interchange with many of our customers to enhance the efficiency of placing and shipping orders and receiving payments.
Competition
In our business, we compete with:
•Other interactive entertainment companies, including those offering mobile games, that range in size and cost structure from very small with limited resources to very large with greater financial, marketing, technical, and other resources than ours. Examples of our competitors include Activision Blizzard, Inc., Electronic Arts Inc., Ubisoft Entertainment S.A., and Embracer Group AB.
•Sony, Microsoft, and Nintendo for the sale of interactive entertainment software. Each of these competitors is a large developer and marketer of software for their own platforms and has the financial resources to withstand significant price competition and to implement extensive advertising campaigns.
•Other software, hardware, entertainment, and media for limited retail shelf space and promotional resources. The competition is intense among an increasing number of newly introduced entertainment software titles and hardware for adequate levels of shelf space and promotional support.
•Other forms of entertainment such as motion pictures, television, social networking, online computer programs, and other forms of entertainment, which may be less expensive or provide other advantages to consumers.
Competition in the entertainment software industry is based on innovation, features, playability, product quality, brand name recognition, compatibility with popular platforms, access to distribution channels, price, marketing, and customer service. Our business is driven by hit titles, which require increasing budgets for development and marketing. For physical sales, competition for our titles is influenced by the timing of competitive product releases and the similarity of such products to our titles and may result in loss of shelf space or a reduction in sell-through of our titles at retail stores.
International Operations
International sales are a significant part of our business. For the fiscal years ended March 31, 2022, 2021 and 2020, we earned 40.1%, 40.2% and 42.5%, respectively, of our net revenue outside the United States. We are continuing to execute on our growth initiatives in Asia, where our strategy is to broaden the distribution of our existing products and expand our online gaming presence, especially in China and South Korea. We are subject to risks inherent in foreign trade, including increased credit risks, tariffs and duties, fluctuations in foreign currency exchange rates, shipping delays and international political, regulatory, and economic developments, all of which can have a significant effect on our operating results. See Notes 1 and 2 to our Consolidated Financial Statements.
Segment and Geographic Information
We have one operating and reportable segment. See Notes 1, 2, and 9 to our Consolidated Financial Statements.
6
Human Capital
Human Capital Management. One of Take-Two’s most important assets is our people. With 7,799 full-time employees as of March 31, 2022, of which 3,812 were employed outside of the United States, we are constantly focused on our teams – their success, their structure and how best to support them given their particular needs and projects. 47% of our employees are located in North America, 37% in Europe, and 16% in the Asia-Pacific region; 77% of our employees are focused on product development.
Due to COVID-19's continued impact, this past year was a challenging one for our employees, and, given the largely remote working environment, we continued programs to make sure our people felt supported in their roles, including enhanced manager training to help strengthen teams despite the physical distance, broadening our wellness and mental health offerings, encouraging people to step away from their screens when they could and spending a lot of time listening to employee feedback.
Despite the challenges of the ongoing pandemic, creativity and innovation remained two of the core tenets of our organization and the lifeblood of our ongoing success. The creative teams at our labels are renowned for their consistent ability to deliver games that set new benchmarks for excellence. We support our creative and corporate teams by focusing on talent acquisition and retention, including through offering job development and skills training initiatives, extensive employee benefits and numerous well-being programs, and partnering with the leadership at our labels to foster the types of cultures our leaders believe best support and grow the creative processes for their particular teams.
Diversity, Equity, and Inclusion. We firmly believe that diverse teams are more valuable and effective, and that diversity is key to our success. We are committed to enhancing workforce diversity at Take-Two, and we strive to provide an inclusive workplace in which everyone feels respected, heard, and safe. We believe our culture of compassion and respect fosters a warm, welcoming environment for all qualified candidates and colleagues. Specific efforts we take include company-sponsored service projects in the communities in which we operate; providing financial and other support to organizations working to eradicate social and racial injustice as well as providing educational, athletic, and other opportunities to underserved communities; working with organizations to support the rights of the LGBTIQ community; endeavoring to expand the diversity of our industry’s candidate pool through scholarships to minority game design students and contributions to organizations providing STEM opportunities to children in underserved communities; delivering interview training and career counseling to young adults in those same communities; and celebrating cultural differences through various employee affinity groups and company events and offerings.
Talent Assessment & Development and Employee Experience. We strongly believe in internal growth opportunities and career development tracks. We also recognize the importance of our employees staying current in an ever-changing industry. To that end, our global Learning & Development team curates a wide variety of training materials and programs targeting both hard skills development and career progression as well as programs in leadership development and employee round tables. Further, our compliance training program seeks to ensure that our employees recognize and report any signs of harassment, discrimination, retaliation, or other inappropriate behaviors in the workplace and that they understand and abide by our Code of Business Conduct and other internal policies.
Our learning and development programs are designed to be closely aligned with our performance management process and succession planning. Our formalized performance management process provides the platform for evaluating each individual employee’s contributions to the team and our success, with a focus on regular communication and transparency. We work hard to ensure that development opportunities are individually tailored and that all decisions regarding hiring, career progression, and compensation are based on qualifications, work ethic, and job performance.
Beyond formal performance management, we check in with our teams throughout the year with global town hall meetings, "pulse" surveys, culture assessments and team qualities and values workshops. The feedback generated through these tools helps to ensure we are providing a supportive, dynamic, and stimulating work environment for all of our employees. These efforts and more contributed to Take-Two being named one of The Wall Street Journal’s Best Managed US Companies and included in Forbes' Best Mid-Size Employers list four years in a row, beginning in 2018. In addition, we were included on Fortune’s Great Places to Work list for the past three years and were recently honored by Gay Gaming Professionals in 2021 as a DEI&B leader in the interactive entertainment industry.
Compensation and Benefits. The main objectives of our compensation and benefit programs are to attract, retain, motivate, and reward our employees, who operate in a highly competitive and technologically challenging environment. We offer competitive compensation packages designed to incentivize high individual and company performance. We regularly review our compensation and benefits packages from both an internal and external standpoint to ensure competitiveness, including through industry benchmarking analysis. We seek to link compensation (including annual changes in compensation)
7
to our overall and business unit performance, as well as each individual’s contribution to the results achieved. The emphasis on our overall performance is intended to align our employees’ financial interests with the interests of our shareholders. In addition to awarding Restricted Stock Units to employees at certain levels, we also offer an Employee Stock Purchase Plan to further align the interests of our employees with our shareholders.
We also provide a comprehensive benefits package that includes traditional offerings, such as medical, dental vision, retirement, disability, accident and life insurance, prescription drugs, and leaves, and also includes programs such as well-being, fitness reimbursement, mental health benefits, mental health awareness training for Human Resources personnel and managers throughout the Company, and charitable giving with a company match. We have hosted more than 150 company-wide bootcamps to promote physical fitness and employee comradery.
Item 1A. Risk Factors
Our business is subject to many risks and uncertainties, which may affect our future financial performance. Because of the risks and uncertainties described below, as well as other factors affecting our operating results and financial condition, past financial performance should not be considered to be a reliable indicator of future performance and our business and financial performance could be harmed and the market value of our securities could decline. These risks are not presented in order of importance of probability of occurrence.
Summary of Risk Factors
Material risks that may affect our business, operating results and financial condition include, but are not necessarily limited to:
Risks relating to our business and industry
•Results of operations may be impacted by COVID-19
•Our industry is highly competitive
•Uncertainty of achieving market acceptance, delays or disruptions for our products may have an adverse effect
•We face development risks and must adapt to changes in software technologies
•Increased competition for retailer support could increase expenses
•Increasing importance of digital sales exposes us to risks of that business model
•Our ability to develop successful products for current video game platforms
•We require approval of hardware licensors to publish titles
•Potential adverse impact of inadequate consumer data protection
•Potential adverse impact of security breaches
•Dependence on key management and product development personnel
•Offensive consumer-created content can harm our results of operations or reputation
•We rely on software development arrangements with third parties
•Reliance on channel partners to distribute our games on their platforms
•Increasing importance of free-to-play games exposes us to the risks of that business model
•Our acquisitions and investments may not have the anticipated results
•International operations risks
•Connectivity issues could affect our profitability and online services
•Reliance on complex information technology systems and networks
•The loss of server capacity or lack of sufficient bandwidth could cause our business to suffer
•Use of open-source software exposes us to risks
•Our software is susceptible to errors
•The continued ability to acquire and maintain license to intellectual property is key
•We may experience fluctuations in the recurring portion of our business
•Uncertainty of expansion into new products and services
•We are dependent on the timing of our product releases
•We are dependent on the future success of our Grand Theft Auto products and other “hit” titles
•Adverse effects of price protection, returns, and used game sales
•A limited number of customers account for a significant portion of our sales
8
•Content policies could negatively affect sales
•Entertainment Software Rating Board ratings for our products could negatively affect our ability to distribute and sell
•The competitive position and value of our products could be adversely affected by unprotected intellectual property
•Contractual covenants can place certain limitations on our business
Risks related to legal or regulatory compliance
•Government regulation of the internet can affect our business
•Legislation could limit the retail market of our products
•Failure to comply with laws and regulations, including data privacy, could harm our business
•Adverse effect of alleged or actual infringement on the intellectual property rights of third parties
Risks related to financial and economic condition
•Provisions in our charter documents and debt agreements may impede or discourage a takeover
•Adverse effects of changes in tax rates and additional tax liabilities
•We are subject to risks and uncertainties of international trade, including foreign currency fluctuations
•Potential adverse effects of existing or future accounting standards
•Adverse effects of declines in consumer spending and changes in the economy
General Risk Factors
•Additional issuances of equity securities would cause dilution and could affect the market price of our common stock
•We are subject to risks related to corporate and social responsibility and reputation
•Climate change may have a long-term impact on our business
•We may be adversely affected by the effects of inflation
Risks Related to our Pending Acquisition of Zynga
•The Zynga acquisition may not be completed
•The Zynga acquisition presents risks before and after closing
Risks relating to our business and industry
Our results of operations may be materially adversely impacted by the coronavirus pandemic (COVID-19).
Our results of operations may be materially adversely affected by COVID-19. The global spread of COVID-19 has created significant uncertainty, resulting in volatility and economic disruption. The extent to which COVID-19 has an impact on our business, operations, or financial results will depend on numerous evolving factors that we may not be able to accurately predict, including the duration and scope of the pandemic; governmental, business, and individuals’ actions that have been and continue to be taken in response to the pandemic; economic activity and related actions taken in response to the pandemic; the effect on consumer demand for our products and the discretionary spending patterns of our customers, including the ability of our customers to pay for our products; our ability to develop, market, and sell our products, including as a result of travel restrictions and people working from home; the impact on the operations of our counterparties, including the physical retail, digital download online platforms, and cloud streaming services we rely on for the distribution of our products, the suppliers who manufacture our physical products, and other third parties with which we partner (e.g. to market or ship our products); any closures of our, our customers', and counterparties' offices and facilities; additional volatility in exchange rates; the impact of potential inflation; and the impact of reductions in interest rates by the Federal Reserve and other central banks, including on our short-term investment portfolio.
Further, “shelter-in-place,” quarantine, or other such initiatives by governmental entities could also disrupt our operations. In such situations, if employees or third-party developers who cannot optimally perform their responsibilities from home are not able to or are unwilling to report to work, we may experience material interruptions in product development and delays in bringing products to market. Such circumstances may also impact the effectiveness of our quality controls and game testing measures. An increase in the number of employees working remotely also increases the potential adverse impact of risk associated with information technology systems and networks, including cyber-attacks, computer viruses, malicious software, security breach, and telecommunication failures, both for systems and networks we control directly and for those that employees and third-party developers rely on to work remotely. Any failure to prevent or mitigate security breaches or cyber risks or detect, or respond adequately to, a security breach or cyber risk, or any other disruptions to our information technology
9
systems and networks, can have adverse effects on our business. The spread of COVID-19 has caused us to modify our business practices (including employee travel, employee work locations, and cancellation of physical participation in meetings, events and conferences), and we may take further actions as may be required by government authorities or that we determine are in the best interests of our employees, customers and business partners. Further, key personnel could contract COVID-19, hindering their availability and productivity.
The global work-from-home operating environment caused some strain and fatigue within parts of our global workforce. In addition, certain of our development teams currently work in a distributed environment, whereas these teams historically collaborated in-person on the creative and technical process required to develop high-quality products and services at scale. These factors have affected, and may continue to affect, the way our teams conduct business and the creative process to which our teams are accustomed. Companies in our industry have experienced issues related to game and service quality during the work-from-home period. While we are reintroducing teams of employees to the workplace, this process could introduce operational risk, negatively impact productivity, and give rise to claims by employees or otherwise adversely affect our business. In addition, the long-term effects of the COVID-19 pandemic on the nature of the office environment and remote working are not certain and may present operational challenges and impact our ability to attract and retain talent, and our teams’ ability to collaborate creatively, each of which may adversely affect our business.
While we have developed and continue to develop plans to help mitigate the negative impact of the pandemic on our business, these efforts may not be effective, and a protracted economic downturn may limit the effectiveness of our mitigation efforts. Any of these considerations described above could cause or contribute to the risks described elsewhere herein and could materially adversely affect our business, financial condition, results of operations or stock price. Additionally, while we have seen increased demand for our products due to stay-at-home orders, the curtailment of certain other forms of entertainment, and other pandemic-related factors that make consumers more inclined to spend time at home, benefiting our financial results and operating metrics, the trends in fiscal year 2021 with respect to our revenues, net income, and other financial results and operating metrics may not be indicative of results for future periods, particularly if these pandemic-related factors become less significant. As expected, during fiscal year 2022, we experienced a moderation in engagement from the all-time highs experienced in fiscal year 2021, but overall engagement continued to be notably higher than it was pre-pandemic
The interactive entertainment software industry is highly competitive.
We compete for both licenses to properties and the sale of interactive entertainment software with Sony and Microsoft, each of which is a large developer and marketer of software for its own platforms. We also compete with game publishers, such as Activision Blizzard, Inc., Electronic Arts Inc., Ubisoft Entertainment S.A., and Embracer Group AB. In addition, the gaming, technology/internet, and entertainment industries have converged in recent years and larger, well-funded technology companies are pursuing and strengthening their interactive entertainment capabilities, as evidenced, for example, by Microsoft's pending acquisition of Activision Blizzard. As our business is dependent upon our ability to develop hit titles, which require increasing budgets for development and marketing, the availability of significant financial resources has become a major competitive factor in developing and marketing software games. Some of our competitors have greater financial, technical, personnel, and other resources than we do and are able to finance larger budgets for development and marketing and make higher offers to licensors and developers for commercially desirable properties. Our titles also compete with other forms of entertainment, such as social media and casual games, in addition to motion pictures, television and audio and video products featuring similar themes, online computer programs and other entertainment, which may be less expensive or provide other advantages to consumers.
A number of software publishers who compete with us have developed and commercialized or are currently developing online games. As technological advances significantly increase the availability of online games and as consumer acceptance of online gaming grows substantially, it could result in a decline in our platform-based software sales and negatively affect sales of such products.
Additionally, we compete with other forms of entertainment and leisure activities. While we monitor general market conditions, significant shifts in consumer demand that could materially alter public preferences for different forms of entertainment and leisure activities are difficult to predict. Failure to adequately identify and adapt to these competitive pressures could have a negative impact on our business.
The inability of our products to achieve significant market acceptance, delays in product releases or disruptions following the commercial release of our products may have a material adverse effect on our business, financial condition and operating results.
New products may not achieve significant market acceptance, generate sufficient sales, or be introduced in a timely manner to permit us to recover development, manufacturing and marketing costs associated with these products. These products or enhancements may not be well-received by consumers, even if well-reviewed and of high quality. The life cycle of a title generally involves a relatively high level of sales during the first few months after introduction followed by a rapid decline in sales. Because sales associated with an initial product launch generally constitute a high percentage of the total sales associated
10
with the life of a product, delays in product releases or disruptions following the commercial release of one or more new products could have a material adverse effect on our business, financial condition, and operating results and therefore cause our operating results to be materially different from our expectations.
We are subject to product development risks which could result in delays and additional costs, and we must adapt to changes in software technologies.
We depend on our internal development studios and third-party software developers to develop new interactive entertainment software within anticipated release schedules and cost projections. The development cycle for new titles generally ranges from 12 months for annual sports releases, to multiple years for certain of our top-selling titles. Therefore, our development costs can be substantial. If we or our third-party developers experience unanticipated development delays, financial difficulties, or additional costs, for example, as a result of COVID-19, we may not be able to release titles according to our schedule and at budgeted costs. There can be no assurance that our products will be sufficiently successful so that we can recoup these costs or make a profit on these products.
Additionally, in order to stay competitive, our internal development studios must anticipate and adapt to rapid technological changes affecting software development, such as cloud-based game streaming, and evolving business models, such as free-to-play and subscription-based access to a portfolio of interactive content, to stay competitive. Rapid changes in our industry require us to anticipate, sometimes years in advance, the ways in which our products and services will be competitive in the market. We have invested, and in the future may invest, in new business and marketing strategies, technologies, distribution methods, products, and services. There can be no assurance that these strategic investments will achieve expected returns. Any inability to respond to technological advances and implement new technologies could render our products obsolete or less marketable. Further, the failure to pursue the development of new technology, platforms, or business models that obtain meaningful commercial success in a timely manner may negatively affect our business, resulting in increased production or development costs and more strenuous competition.
Our reputation and brand could also be adversely affected. We also may miss opportunities or fail to respond quickly enough to adopt technology or distribution methods or develop products, services, or new ways to engage with our games that become popular with consumers, which could adversely affect our financial results. In either case, our products and services may be technologically inferior to those of our competitors, less appealing to consumers, or both.
Increased competition for limited shelf space and promotional support from retailers could affect the success of our business and require us to incur greater expenses to market our titles.
While digital sales are increasingly important to our business, for physical sales, retailers have limited shelf space and promotional resources. Competition is intense among newly introduced interactive entertainment software titles for adequate levels of shelf space and promotional support, with most and highest quality shelf space devoted to those products expected to be best sellers. We cannot be certain that our new products will consistently achieve best seller status. Competition for retail shelf space is expected to continue to increase, which may require us to increase our marketing expenditures to maintain desirable sales levels of our titles. Competitors with more extensive lines and more popular titles may have greater bargaining power with retailers. Accordingly, we may not be able, or we may have to pay more than our competitors, to achieve similar levels of promotional support and shelf space. Similarly, as digital sales increase in importance to our business, there is increasing competition for premium placements of products on websites. Such placement is subject to many similar risks as physical shelf space discussed above.
The increasing importance of digital sales exposes us to the risks of that business model, including greater competition.
The proportion of our revenues derived from digital content delivery, as compared to traditional retail sales, may continue to increase. The increased importance of digital content delivery in our industry, including through subscription-based access to a portfolio of interactive content, increases our potential competition, as the minimum capital needed to produce and publish a digitally delivered game is significantly less than that needed to produce and publish one that is delivered through retail distribution. This shift also requires us to dedicate capital to developing and implementing alternative marketing strategies, which may not be successful. If either occurs, we may be unable to effectively market and distribute our products, which could materially adversely affect our business, financial condition, and operating results. In addition, a continuing shift to digital delivery could result in a deprioritization of our products by traditional retailers. Also, while digitally‑distributed products generally have higher profit margins than retail sales, as business shifts to digital distribution, the volume of orders from retailers for physical discs has been, and is expected to be, reduced.
Our business is subject to our ability to develop commercially successful products for the current video game platforms.
We derive most of our revenue from the sale of products made for video game platforms manufactured by third parties, such as Sony's PS4 and PS5 and Microsoft's Xbox One and Xbox Series X|S, which comprised 72.2% of our net revenue by product platform for the fiscal year ended March 31, 2022. The success of our business is subject to the continued popularity of these platforms and our ability to develop commercially successful products for these platforms.
11
In 2020, Sony and Microsoft each launched their respective next generation consoles. Historically, when next generation consoles are announced or introduced into the market, consumers have typically reduced their purchases of products for prior-generation consoles in anticipation of purchasing a next-generation console and products for that console. During these periods, sales of the products we publish may decline until new platforms achieve wide consumer acceptance. Console transitions may have a comparable impact on sales of downloadable content, amplifying the impact on our revenues. This decline may not be offset by increased sales of products for the next-generation consoles. In addition, as console hardware moves through its life cycle, hardware manufacturers typically enact price reductions, and decreasing prices may put downward pressure on software prices. During console transitions, we may simultaneously incur costs both in continuing to develop and market new titles for prior-generation video game platforms, which may not sell at premium prices, and also in developing products for next-generation platforms, which may not generate immediate or near-term revenues. As a result, our business and operating results may be more volatile and difficult to predict during console transitions than during other times.
We cannot publish our titles without the approval of hardware licensors that are also our competitors.
We are required to obtain licenses from certain of our competitors, including Sony and Microsoft, to develop and publish titles for their respective hardware platforms. Our existing platform licenses require that we obtain approval for the publication of new titles on a title-by-title basis. As a result, the number of titles we are able to publish for these hardware platforms, our ability to manage the timing of the release of these titles, and, accordingly, our net revenue from titles for these hardware platforms, may be limited. If a licensor chooses not to renew or extend our license agreement at the end of its current term, or if a licensor were to terminate our license for any reason or does not approve one or more of our titles, we may be unable to publish that title as well as additional titles for that licensor's platform. During or following a console transition, like the one that occurred in 2020, hardware platform manufacturers may seek to change the terms governing our relationships with them. Termination of any such agreements or disapproval of titles could seriously hurt our business and prospects. We may be unable to continue to enter into license agreements for certain current generation platforms on satisfactory terms or at all. Failure to enter into any such agreement could also seriously hurt our business.
In addition, platform providers, such as Sony and Microsoft, control the networks over which consumers purchase digital products and services for their platforms and through which we provide online game capabilities for our products. The control that these platform providers have over consumer access to our games, the fee structures and/or retail pricing for products and services for their platforms and online networks and the terms and conditions under which we do business with them could impact the availability of our products or the volume of purchases of our products made over their networks and our profitability. The networks provided by these platform providers are the exclusive means of selling and distributing our content on these platforms. If the platform provider establishes terms that restrict our offerings on its platform, significantly alters the financial terms on which these products or services are offered, or does not approve the inclusion of content on its platform, our business could be negatively impacted. We also derive significant revenues from distribution on third‑party mobile and web platforms, such as the Apple App Store, the Google Play Store, and Facebook, which are also our direct competitors and in some cases the exclusive means through which our content reaches gamers on those platforms, and most of the virtual currency we sell is purchased using these platform providers’ payment processing systems. If these platforms deny access to our games, modify their current discovery mechanisms, communication channels available to developers, operating systems, terms of service, or other policies (including fees), our business could be negatively impacted. These platform providers or their services may be unavailable or may not function as intended or may experience issues with their in‑app purchasing functionality.
Our business could be adversely affected if our consumer data protection measures are not seen as adequate or there are breaches of our security measures or unintended disclosures of our consumer data.
We are collecting and storing consumer information, including personal information. We take measures to protect our consumer information from unauthorized access or disclosure. It is possible that our security controls over consumer information may not prevent the improper access or disclosure of personal information. In addition, due to the high-profile nature of our products, we may draw a disproportionately higher amount of attention and attempts to breach our security controls than companies with lower profile products. A security incident that leads to disclosure of consumer information (including personal information) could harm our reputation, compel us to comply with disparate breach notification laws in various jurisdictions and otherwise subject us to liability under laws that protect personal information, any of which could result in increased costs or loss of revenue. A resulting perception that our products or services do not adequately protect the privacy of personal information could result in a loss of current or potential consumers and business partners. In addition, if any of our business partners experience a security incident that leads to disclosure of consumer information, our reputation could be harmed, resulting in loss of revenue.
In addition, certain of our products are online enabled. The ability of our products to offer online functionality, and our ability to offer content through a video game platform's digital distribution channel, is dependent upon the continued operation and security of such platform's online network. These third-party networks, as well as our own internal systems and websites, and the related security measures may be breached as a result of third-party action, including intentional misconduct by computer hackers, employee error, malfeasance or otherwise, and result in someone obtaining unauthorized access to our
12
customers' information or our data—including our intellectual property and other confidential business information—or our information technology systems. Because the techniques used to obtain unauthorized access, or to sabotage systems, change frequently and generally are not recognized until launched against a target, we may be unable to anticipate these techniques or to implement adequate preventative measures. Further, the risk of such a breach may be heightened by world events, such as the current conflict between Russia and Ukraine. If an actual or perceived breach of our safeguards occurs, we may lose business, suffer irreparable damage to our reputation, and/or incur significant costs and expenses relating to the investigation and possible litigation of claims relating to such event.
Security breaches involving the source code for our products or other sensitive and proprietary information could adversely affect our business.
We securely store the source code for our interactive entertainment software products as it is created. A breach, whether physical, electronic or otherwise, of the systems on which such source code and other sensitive data are stored could lead to damage or piracy of our software. In addition, certain parties with whom we do business are given access to our sensitive and proprietary information in order to provide services and support our team. These third parties may misappropriate our information and engage in unauthorized use of it. A data intrusion into a server for a game with online features or for our proprietary online gaming service could also disrupt the operation of such game or platform. Further, the risk of such a breach may be heightened by world events, such as the current conflict between Russia and Ukraine. If we or these third parties are subject to data security breaches, we may have a loss in sales or increased costs arising from the restoration or implementation of additional security measures which could materially and adversely affect our business, financial condition and operating results. Any theft and/or unauthorized use or publication of our trade secrets and other confidential business information as a result of such an event could adversely affect our competitive position, reputation, brand, and future sales of our products. Our business could be subject to significant disruption, and we could suffer monetary and other losses and reputational harm, in the event of such incidents and claims.
We depend on our key management and product development personnel.
Our continued success will depend to a significant extent on our senior management team and our relationship with ZelnickMedia Corporation ("ZelnickMedia"). Our Executive Chairman/Chief Executive Officer and President are partners of ZelnickMedia. We are also highly dependent on the expertise, skills and knowledge of our key creative personnel responsible for content creation and development of our Grand Theft Auto and other hit titles and titles based on other brands. We may not be able to continue to retain these personnel at current compensation levels, or at all. Our industry is generally characterized by a high level of employee mobility, competitive compensation programs, and aggressive recruiting among competitors for employees with technical, marketing, sales, engineering, product development, creative, and/or management skills.
The loss of the services of our executive officers, ZelnickMedia, or certain key creative personnel could significantly harm our business. In addition, if one or more key employees were to join a competitor or form a competing company, we may lose additional personnel, experience material interruptions in product development, delays in bringing products to market and difficulties in our relationships with licensors, suppliers and customers, which would significantly harm our business. Failure to continue to attract and retain qualified management and creative personnel could adversely affect our business and prospects.
Our results of operations or reputation may be harmed as a result of offensive consumer-created content.
We are subject to risks associated with the collaborative online features in our games which allow consumers to post narrative comments, in real time, that are visible to other consumers. From time to time, objectionable and offensive consumer content may be posted to a gaming or other site with online chat features or game forums which allow consumers to post comments. We may be subject to lawsuits, governmental regulation or restrictions, and consumer backlash (including decreased sales and harmed reputation), as a result of consumers posting offensive content. We may also be subject to consumer backlash from comments made in response to postings we make on social media sites such as Facebook, YouTube and Twitter. If we fail to appropriately respond to the dissemination of such content, we may be subject to lawsuits and governmental regulation, our players may not engage with our products and services and/or may lose confidence in our brands and our financial results may be adversely affected.
Our business is partly dependent on our ability to enter into successful software development arrangements with third parties.
Our success depends on our ability to continually identify and develop new titles timely. We rely on third-party software developers for the development of some of our titles. Quality third-party developers are continually in high demand, and those who have developed titles for us in the past may not be available to develop software for us in the future. Due to the limited availability of third-party software developers and the limited control that we exercise over them, these developers may not be able to complete titles for us on a timely basis or within acceptable quality standards, if at all. We have entered into agreements with third parties to acquire the rights to publish and distribute interactive entertainment software as well as to use licensed intellectual properties in our titles. These agreements typically require us to make development payments, pay
13
royalties, and satisfy other conditions. Our development payments may not be sufficient to permit developers to develop new software successfully, which could result in material delays and significant increases in our costs to bring particular products to market. Software development costs, promotion and marketing expenses and royalties payable to software developers and third-party licensors have continued to increase and reduce potential profits derived from sales of our software. Future sales of our titles may not be sufficient to recover development payments and advances to software developers and licensors, and we may not have adequate financial and other resources to satisfy our contractual commitments to such developers. If we fail to satisfy our obligations under agreements with third-party developers and licensors, the agreements may be terminated or modified in ways that are burdensome to us and have a material adverse effect on our business, financial condition, and operating results.
In addition, disputes occasionally arise with external developers, including with respect to game content, launch timing, achievement of certain milestones, the game development timeline, marketing campaigns, contractual terms, and interpretation. If we have disputes with external developers or they cannot meet product development schedules, acquire certain approvals or are otherwise unable or unwilling to honor their obligations to us, we may delay or cancel previously announced games, alter our launch schedule or experience increased costs and expenses, which could result in a delay or significant shortfall in anticipated revenue, harm our profitability and reputation, and cause our financial results to be materially affected.
We rely on a limited number of channel partners some of whom influence the fee structures for online distribution of our games on their platforms.
We rely on a limited number of channel partners, some of whom have retained the right to change the fee structures for online distribution of both paid content and free content (including patches and corrections) that we license to them for distribution on their platforms. Such channel partners' ability to set or influence royalty rates may increase costs, which could negatively affect our operating margins. We may be unable to distribute our content in a cost-effective or profitable manner through such distribution channel, which could adversely affect our business, financial condition and operating results.
Outside of fee arrangements, our agreements with our channel partners sometimes give them significant control over other aspects of the distribution of our products and services that we develop for their platform. If our channel partners establish terms that restrict our offerings through their channels, or significantly affect the financial terms on which these products or services are offered to our customers, we may be unable to distribute our product offerings through them or be forced to do so on materially worse financial or business terms in negotiating such various aspects of distribution. Increased competition for digital “shelf space” has put channel partners in more favorable bargaining positions in relation to such terms of distribution.
The increasing importance of free-to-play games to our business exposes us to the risks of that business model, including the dependence on a relatively small number of consumers for a significant portion of revenues and profits from any given game.
We are increasingly dependent on our ability to develop, enhance, and monetize free‑to‑play games. As such, we are increasingly exposed to the risks of the free‑to‑play business model. For example, we may invest in the development of new free‑to‑play interactive entertainment products that do not achieve significant commercial success, in which case our revenues from those products likely will be lower than anticipated and we may not recover our development costs. Further, our business may be negatively impacted if: (1) we are unable to encourage new and existing consumers to purchase our virtual items; (2) we fail to offer monetization features that appeal to these consumers; (3) our platform providers make it more difficult or expensive for players to purchase our virtual items; (4) we cannot encourage significant additional consumers to purchase virtual items in our game and/or (5) our free-to-play releases reduce sales of our other games.
If we acquire or invest in other businesses, intellectual properties, or other assets, we may be unable to integrate them with our business, our financial performance may be impaired and/or we may not realize the anticipated financial and strategic goals for such transactions.
If appropriate opportunities present themselves, we may acquire or make investments in businesses, intellectual properties and other assets that we believe are strategic. We may not be able to identify, negotiate or finance any future acquisition or investment successfully. Even if we do succeed in acquiring or investing in a business, intellectual property or other asset, such acquisitions and investments involve a number of risks, including:
•retaining key employees and maintaining the key business and customer relationships of the businesses we acquire;
•cultural challenges associated with integrating employees from an acquired company or business into our organization;
•the possibility that the combined company would not achieve the expected benefits, including any anticipated operating and product synergies, of the acquisition as quickly as anticipated or that the costs of, or operational difficulties arising from, an acquisition would be greater than anticipated;
•the potential for the acquired business to underperform relative to our expectations and the acquisition price;
14
•unexpected tax consequences from the acquisition, or the tax treatment of the acquired business's operations going forward, giving rise to incremental tax liabilities that are difficult to predict;
•significant acquisition-related accounting adjustments, particularly relating to an acquired company's deferred revenue, that may cause reported revenue and profits of the combined company to be lower than the sum of their stand-alone revenue and profits;
•significant accounting charges resulting from the completion and integration of a sizable acquisition and increased capital expenditures, including potential impairment charges incurred to write down the carrying amount of intangible assets generated as a result of an acquisition;
•the possibility that significant acquisitions, when not managed cautiously, may result in the over-extension of our existing operating infrastructures, internal controls and information technology systems;
•the possibility that we will not discover important facts during due diligence that could have a material adverse effect on the value of the businesses we acquire, including the possibility that a change of control of a company we acquire triggers a termination of contractual or intellectual property rights important to the operation of its business;
•the need to integrate an acquired company's accounting, management information, human resource and other administrative systems to permit effective management and timely reporting, and the need to implement or remediate controls, procedures and policies appropriate for a public company in an acquired company that, prior to the acquisition, lacked these controls, procedures and policies;
•litigation or other claims in connection with, or inheritance of claims or litigation risks as a result of, an acquisition, including claims from terminated employees, customers or other third parties; and
•to the extent that we engage in strategic transactions outside of the U.S., we face additional risks, including risks related to integration of operations across different cultures and languages, currency risks and the particular economic, political and regulatory risks associated with specific countries.
•the need to implement controls, procedures and policies appropriate for a larger, U.S.-based public company at companies that prior to acquisition may not have as robust controls, procedures and policies, particularly, with respect to the effectiveness of cyber and information security practices and incident response plans, compliance with data privacy and protection and other laws and regulations protecting the rights of players and customers, and compliance with U.S.-based economic policies and sanctions which may not have previously been applicable to the acquired company’s operations.
Further, any such transaction may involve the risk that our senior management’s attention will be excessively diverted from our other operations, the risk that our industry does not evolve as anticipated, and that any intellectual property or personnel skills acquired do not prove to be those needed for our future success, and the risk that our strategic objectives, cost savings or other anticipated benefits are otherwise not achieved.
Future acquisitions and investments could also involve the issuance of our equity and equity-linked securities (potentially diluting our existing stockholders), the incurrence of debt, contingent liabilities or amortization expenses, write-offs of goodwill, intangibles, or acquired in-process technology, or other increased cash and non-cash expenses such as stock-based compensation. Any of the foregoing factors could harm our financial condition or prevent us from achieving improvements in our financial condition and operating performance that could have otherwise been achieved by us on a stand-alone basis. Our stockholders may not have the opportunity to review, vote on or evaluate future acquisitions or investments.
We face risks from our international operations.
We are subject to certain risks because of our international operations, particularly as we continue to grow our business and presence in Asia, Latin America, and other parts of the world. Changes to and compliance with a variety of foreign laws and regulations may increase our cost of doing business and our inability or failure to obtain required approvals could harm our international and domestic sales. In either the U.S. or other countries, trade legislation, such as a change in the current tariff structures, import/export compliance laws, a change in the relationship between either us or the U.S. and any country in which we have significant operations or sales, or other trade laws or policies, could adversely affect our ability to sell or to distribute in international markets. Additionally, cultural differences may affect consumer preferences and as a result, some of our "hit" products may not sell as well as they do in the U.S. Cultural differences may also require us to modify the content of our products or the method by which we charge our customers. If we do not correctly assess consumer preferences in the countries in which we sell our products, or respond to other risks related to our international operations, it could negatively affect our business.
Our business may also be affected directly or indirectly by major world events, such as the conflict between Russia and Ukraine. Such events could decrease the demand for our products and services, make it difficult or impossible for us to
15
deliver products and services to certain of our customers, or result in restrictions in trade, all of which could negatively affect our business.
Further, the enforcement of regulations relating to mobile and other games with an online element in China remains uncertain, and further changes, either in the regulation or their enforcement could have a negative impact on our business in China. In order to operate in China, all games must have regulatory approval. A decision by the Chinese government to revoke its approval for any of our games or to decline to approve any products we desire to sell in China in the future could have a negative impact on our business.
We are subject to a variety of laws in the U.S. and abroad that affect our business, including state and federal laws regarding consumer protection, electronic marketing, protection of minors, data protection and privacy, competition, taxation, intellectual property, export, and national security, which are continuously evolving and developing. The scope and interpretation of the laws that are or may be applicable to us are often uncertain and may be conflicting, particularly laws outside the U.S. There is a risk that existing or future laws may be interpreted in a manner that is not consistent with our current practices and could have an adverse effect on our business. We incur legal compliance costs associated with our international operations and could become subject to legal penalties in foreign countries if we do not comply with local laws and regulations which may be substantially different from those in the U.S. In many foreign countries, particularly in those with developing economies, it may be common to engage in business practices that are prohibited by U.S. laws and regulations, such as the Foreign Corrupt Practices Act, and by local laws, such as laws prohibiting corrupt payments to government officials. Although we implement policies and procedures designed to ensure compliance with these laws, there can be no assurance that all of our employees, contractors and agents, as well as those companies to which we outsource certain of our business operations, including those based in countries where practices which violate such laws may be customary, will not take actions in violation of our policies. Any such violation, even if prohibited by our policies, could have a material adverse effect on our business.
We are potentially subject to a number of foreign and domestic laws and regulations that affect the offering of certain types of content, such as that which depicts violence, many of which are ambiguous, still evolving and could be interpreted in ways that could harm our business or expose us to liability. In addition, there are ongoing academic, political and regulatory discussions in the U.S., Europe, Australia, Brazil and other jurisdictions regarding whether certain game genres, such as social casino, or certain game mechanics, such as “loot boxes”, should be subject to a higher level or different type of regulation than other game genres or mechanics to protect consumers, in particular minors and persons susceptible to addiction, and, if so, what such regulation should include.
In 2020, the U.K. left the European Union ("E.U.") ("Brexit"). Subsequently, the U.K. and the E.U. struck a bilateral trade and cooperation deal governing the future relationship between the U.K. and the E.U. (the "Trade and Cooperation Agreement"), which took effect on May 1, 2021. There remains unavoidable uncertainties and risks to our business related to Brexit and the new relationship between the U.K. and E.U., which will continue to be developed and defined. We are preparing to mitigate those risks with operational and commercial changes to the extent possible and warranted. However, the legal and regulatory landscape remains uncertain, and we have no assurance that such preparations will enable us to avoid a material adverse impact on our business from Brexit. Brexit could lead to legal uncertainty and potentially divergent national laws and regulations as the U.K. determines which E.U. laws to replace and replicate. For example, if there are changes to U.K. immigration policy as a result of Brexit, our employees and their ability to move freely between the E.U. member states for work-related matters could be affected.
The effects of the U.K.'s future trade agreements with the E.U. or other nations could potentially disrupt the markets we serve and may cause us to lose customers, distributors, and employees. The Trade and Cooperation Agreement sets out preferential arrangements in areas such as the trade in goods and services but does not reach the level of integration that existed while the U.K. was an E.U. member state, which could have a detrimental impact on our U.K. growth. Such a decline could also make our doing business in Europe more difficult, which could negatively affect sales to consumers of our products. Without access to the single E.U. market, it may be more challenging and costly to distribute our products in Europe.
Connectivity issues could affect our profitability and our ability to sell and provide online services for our products.
We rely upon third-party digital delivery platforms, such as Microsoft's Xbox Live, PlayStation Network, Steam, Epic, and other third-party service providers, to provide connectivity from the consumer to our digital products and our online services. Connectivity issues could prevent customers from accessing this content and our ability to successfully market and sell our products could be adversely affected. Given the increasing global usage of online platforms, in part as a result of the COVID-19 pandemic, the risks of connectivity issues may be heightened. In addition, we could experience similar issues related to services we host on our internal servers. Such issues also could affect our ability to provide game-related services and could have a material adverse effect on our business, financial condition, and operating results.
16
We rely on complex information technology systems and networks to operate our business. Any significant system or network disruption could have a negative impact on our business.
We rely on the efficient and uninterrupted operation of complex information technology systems and networks, some of which are within Take-Two and some of which are managed or hosted by third-party providers. All information technology systems and networks are potentially vulnerable to damage or interruption from a variety of sources, including but not limited to cyber-attacks, computer viruses, malicious software, security breaches, energy blackouts, natural disasters, terrorism, war, and telecommunication failures. We may also face sophisticated attacks, referred to as advanced persistent threats, which are cyber-attacks aimed at compromising our intellectual property and other commercially sensitive information, such as the source code and game assets for our software or confidential customer or employee information, which remain undetected for prolonged periods of time. Information technology system disruptions, network failures, or security breaches could negatively affect our business continuity, operations and financial results. These risks extend to the networks and e-commerce sites of console platform providers and other partners who sell or host our content online. The risk of such threats may be heightened as a result of international conflicts such as the one between Russia and Ukraine or as a result of an extended period of remote work arrangements due to COVID-19. Along with our partners, we have expended, and expect to continue to expend, financial and operational resources to implement certain systems, processes and technologies to guard against cyber risks and to help protect our data and systems. However, the techniques used to exploit, disable, damage, disrupt or gain access to our networks, our products and services, supporting technological infrastructure, intellectual property and other assets change frequently, continue to evolve in sophistication and volume, and often are not detected for long periods of time. Our systems, processes and technologies, and the systems, processes and technologies of our business partners or our third-party service providers, may not be adequate against all eventualities. In addition, the costs to respond to, mitigate, or notify affected parties of cyber-attacks and other security vulnerabilities are significant. Any failure to prevent or mitigate security breaches or cyber risks, or detect or respond adequately to a security breach or cyber risk, could result in a loss of anticipated revenue, interruptions to our products and services, our having to incur significant remediation and notification costs, degrade the user experience, cause consumers to lose confidence in our products and services, and significant legal and financial costs. Additionally, applicable insurance policies may be insufficient to reimburse us for all such losses, and it is uncertain whether we will be able to maintain the current level of insurance coverage in the future on reasonable terms or at all.
Successful exploitation of our systems can have other negative effects upon the products, services and user experience we offer. In particular, the virtual economies that we have established in many of our games are subject to abuse, exploitation and other forms of fraudulent activity that can negatively affect our business. Virtual economies involve the use of virtual currency or virtual assets that can be used or redeemed by a player within a particular game or service. Although we have implemented and continue to develop programs reasonably designed to prevent such negative impacts, the abuse or exploitation of our virtual economies can include the illegitimate generation and sale of virtual items in black markets. These kinds of activities and the steps that we take to address and prevent these issues may result in a loss of anticipated revenue, interfere with players’ enjoyment of a balanced game environment and cause reputational harm.
We depend on servers and Internet bandwidth to operate our games and digital services with online features. If we were to lose server capacity or lack sufficient Internet bandwidth for any reason, our business could suffer.
We rely on data servers, including those owned or controlled by third parties, to enable our customers to download our games and other downloadable content, and to operate our online games and other products with online functionality. Events such as limited hardware failure, any broad-based catastrophic server malfunction, a significant intrusion by hackers that circumvents security measures, or a failure of disaster recovery services would likely interrupt the functionality of our games with online services and could result in a loss of sales for games and related services. An extended interruption of service could materially adversely affect our business, financial condition and operating results.
We expect a significant portion of our games to be online enabled in the future, and therefore we must project our future server needs and make advance purchases of servers or server capacity to accommodate expected business demands. If we underestimate the amount of server capacity our business requires or if our business were to grow more quickly than expected or if Internet bandwidth becomes limited, for example as a result of COVID-19-related increased worldwide demand, our consumers may experience service problems, such as slow or interrupted gaming access. Insufficient server capacity may result in decreased sales, a loss of our consumer base and adverse consequences to our reputation. Conversely, if we overestimate the amount of server capacity required by our business, we may incur additional operating costs.
Because of the importance of our online business to our revenues and results of operations, our ability to access adequate Internet bandwidth and online computational resources to support our business is critical. If the price of such resources increases, we may not be able to increase our prices or subscriber levels to compensate for such costs, which could materially adversely affect our business, financial condition, and operating results.
17
We use open source software in connection with certain of our games and services, which may pose particular risks to our proprietary software, products, and services in a manner that could have a negative impact on our business.
We use open source software in connection with certain of our games and the services we offer. Some open source software licenses require users who distribute open source software as part of their software to publicly disclose all or part of the source code to such software or make available any derivative works of the open source code on unfavorable terms or at no cost. The terms of various open source licenses have not been interpreted by courts, and there is a risk that such licenses could be construed in a manner that imposes unanticipated conditions or restrictions on our use of the open source software. If it were determined that our use was not in compliance with a particular license, we may be required to release our proprietary source code, pay damages for breach of contract, re-engineer our games, discontinue distribution in the event re-engineering cannot be accomplished on a timely basis or take other remedial action that may divert resources away from our game development efforts, any of which could harm our business.
Our software is susceptible to errors, which can harm our financial results and reputation.
The technological advancements of new hardware platforms result in the development of more complex software products. As software products become more complex, the risk of undetected errors in new products increases. We may need to produce and distribute patches in order to repair such errors, which could be costly and may distract our developers from working on new products. If, despite testing, errors are found in new products or releases after shipments have been made, we may have to consider suspending distribution of defective products or offering refunds, and we could experience a loss of or delay in timely market acceptance, product returns, loss of revenue, increases in costs relating to the repair of such errors and damage to our reputation. In such an event, the technological reliability and stability of our products and services could be below our standards and the standards of our players and our reputation, brand and sales could be adversely affected. In addition, we could be required to, or may find it necessary to, offer a refund for the product or service, suspend the availability or sale of the product or service or expend significant resources to cure the defect, bug or error each of which could significantly harm our business and operating results.
Our ability to acquire and maintain licenses to intellectual property, especially for sports titles, affects our revenue and profitability. Competition for these licenses may make them more expensive and increase our costs.
Certain of our products are based on or incorporate intellectual property owned by others. For example, certain of our 2K products include rights licensed from major sports leagues and players' associations. Similarly, some of our other titles are based on licenses of popular entertainment products. Competition for these licenses is intense. If we are unable to maintain and renew these licenses or obtain additional licenses on reasonable economic terms or with significant commercial value, our revenue and profitability could decline significantly. Competition for these licenses may also increase the advances, guarantees and royalties that we must pay to the licensor, which could significantly increase our costs and adversely affect our profitability. In addition, on certain intellectual property licenses, we are subject to guaranteed minimum payments, royalties or standards of performance and may not be able to terminate these agreements prior to their stated expiration. If such licensed products do not generate revenues in excess of such minimum guarantees, our profitability will be adversely affected.
We may experience declines or fluctuations in the recurring portion of our business.
Our business model includes revenue that we expect to be recurring in nature, such as revenue from our annualized titles and associated services, and ongoing mobile businesses. While we have been able to forecast the revenue from these areas of our business with greater certainty than for new offerings, we cannot provide assurances that consumers will purchase these games and services on a consistent basis. Furthermore, we may cease to offer games and services that we previously had deemed to be recurring in nature. Consumer purchases of our games and services may decline or fluctuate as a result of a number of factors, including their level of satisfaction with our games and services, our ability to improve and innovate our annualized titles, our ability to adapt our games and services to new platforms, outages and disruptions of online services, the games and services offered by our competitors, our marketing and advertising efforts or declines in consumer activity generally as a result of economic downturns, for example, as a result of COVID-19, among others. Any decline or fluctuation in this portion of our business may have a negative impact on our financial and operating results.
Our efforts to expand into new products and services may subject us to additional risks.
In recent years, we have continued to invest in emerging opportunities in interactive entertainment played on mobile platforms, including tablets and smartphones, and online platforms, including social networks. We have also grown our product offerings that are available through digital download, including virtual currency, through our existing franchises such as Grand Theft Auto and NBA 2K, as well as through our mobile product offerings. We are actively investing to capitalize on these trends in order to diversify our product mix, reduce our operating risks, and increase our revenue. There are risks and uncertainties associated with these efforts, particularly in instances where the markets are not fully developed. While we anticipate growth in this area of our business, consumer demand is difficult to predict as a result of a number of factors,
18
including satisfaction with our products and services, our ability to provide engaging products and services, third parties offering their products and services within our subscription, partners that provide, or don’t provide, access to our subscription, products and services offered by our competitors, reliability of our infrastructure and the infrastructure of our partners, pricing, the actual or perceived security of our and our partners information technology systems and reductions in consumer spending levels. There is no assurance that we will be able to attract a sufficiently large number of customers or recover costs incurred for developing and marketing any of these new products or services. For example, we may offer games that do not attract sufficient purchases of virtual currency, which may cause our investments into this product space, such as through our acquisitions of Social Point and Playdots or our pending acquisition of Zynga, to fail to realize the expected benefits. External factors, such as competitive alternatives and shifting market preferences, may also have an impact on the successful implementation of any new products or services. Failure to successfully manage these risks in the development and implementation of new products or services could have a material adverse effect on our business, financial condition and operating results.
Our quarterly and annual operating results are dependent on the release of "hit" titles and therefore dependent on the timing of our product releases, which may cause our quarterly operating results to fluctuate significantly.
We have experienced and may continue to experience wide fluctuations in quarterly operating results. The release of a "hit" title typically leads to a high level of sales during the first few months after introduction followed by a rapid decline in sales. In addition, the interactive entertainment industry is highly seasonal, with sales typically higher during the fourth calendar quarter, due primarily to increased demand for games during the holiday season. Demand for and sales of titles in our NBA 2K series are also seasonal in that they are typically released just prior to the start of the NBA season. If a key event or sports season to which our product release schedule is tied were to be delayed or interrupted, as has happened as a result of COVID-19, our sales might also suffer disproportionately. Our failure or inability to produce "hit" titles or introduce products on a timely basis to meet seasonal fluctuations in demand could adversely affect our business, financial condition and operating results. The uncertainties associated with software development, manufacturing lead times, production delays and the approval process for products by hardware manufacturers and other licensors make it difficult to predict the quarter in which our products will ship and therefore may cause us to fail to meet financial expectations. We also expect that a relatively limited number of popular franchises will continue to produce a disproportionately high percentage of our revenues and profits. Due to this dependence on a limited number of franchises, the failure to achieve anticipated results by one or more products based on these franchises could negatively impact our business. Additionally, if the popularity of a franchise declines, as has happened in the past with other popular franchises, we may have to write off the unrecovered portion of the underlying intellectual property assets, which could negatively impact our business.
We are dependent on the future success of our Grand Theft Auto products, and we must continue to publish "hit" titles or sequels to such "hit" titles in order to compete successfully in our industry.
Grand Theft Auto and certain of our other titles, such as Red Dead Redemption or NBA 2K, are "hit" products and have historically accounted for a substantial portion of our revenue. Grand Theft Auto products contributed 30.9% of our net revenue for the fiscal year ended March 31, 2022, and the five best-selling franchises (including Grand Theft Auto), which may change year over year, in the aggregate accounted for 83.2% of our net revenue for the fiscal year ended March 31, 2022. If we fail to continue to develop and sell new commercially successful "hit" titles or sequels to such "hit" titles or experience any delays in product releases or disruptions following the commercial release of our "hit" titles or their sequels, our revenue and profits may decrease substantially and we may incur losses. In addition, competition in our industry is intense and a relatively small number of hit titles account for a large portion of total revenue in our industry. Hit products offered by our competitors may take a larger share of consumer spending than we anticipate, which could cause revenue generated from our products to fall below our expectations. If our competitors develop more successful products or services at lower price points or based on payment models perceived as offering better value, or if we do not continue to develop consistently high quality and well-received products and services, our revenue and profitability may decline. In addition, both the online and mobile games marketplaces are characterized by frequent product introductions, relatively low barriers to entry, and new and evolving business methods, technologies and platforms for development. Widespread consumer adoption of these new platforms for games and other technological advances in and/or new business or payment models in online or mobile game offerings could negatively affect our sales of console and traditional PC products before we have an opportunity to develop profitable businesses in such markets.
Price protection granted to our customers and returns of our published titles by our customers, or sales of used video games, may adversely affect our operating results.
We are exposed to the risk of price protection and product returns with respect to our customers. Our distribution arrangements with customers generally do not give them the right to return titles to us or to cancel firm orders. However, we sometimes accept product returns from our distribution customers for stock balancing and negotiate accommodations for customers, which include credits and returns, when demand for specific products falls below expectations. We grant price protection and accept returns in connection with our publishing arrangements, and revenue is recognized after deducting estimated price protection and reserves for returns. While we believe that we can reliably estimate price protection and returns,
19
if price protection and return rates for our products exceed our reserves, our revenue could decline, which could have a material adverse effect on our business, financial condition, and operating results. Certain of our larger customers sell used video games, which are generally priced lower than new video games. If our customers increase their sales of used video games, it could negatively affect our sales of new video games.
A limited number of customers account for a significant portion of our sales. The loss of a principal customer or other significant business relationship could seriously hurt our business.
A substantial portion of our product sales are made to a limited number of customers. Sales to our five largest customers during the fiscal year ended March 31, 2022 accounted for 79.0% of our net revenue, with Sony and Microsoft each accounting for more than 10.0%. Our sales are made primarily without long-term agreements or other commitments, and our customers may terminate their relationship with us at any time. Certain of our customers may decline to carry products containing mature content. The loss of our relationships with principal customers or a decline in sales to principal customers, including as a result of a product being rated "AO" (age 18 and over), could materially adversely affect our business, financial condition, and operating results. In addition, if our customers are subject to pricing pressures due to deteriorating demand for our products, competition, or otherwise, such customers may pass those pricing pressures through to us, which could materially adversely affect our business, financial condition and operating results.
In addition, because some of our customers are also publishers of games for their own hardware platforms and may manufacture products for other licensees, such customers may give priority to their own products or those of our competitors. Accordingly, console manufacturers like Sony or Microsoft could cause unanticipated delays in the release of our products, as well as increases to projected development, manufacturing, marketing, or distribution costs, any of which could negatively impact our business.
Furthermore, our customers may also be placed into bankruptcy, become insolvent, or be liquidated due to economic downturns, global credit contractions, or other factors, for example, as a result of COVID-19. Bankruptcies or consolidations of certain large retail customers could seriously hurt our business, including as a result of uncollectible accounts receivable from such customers and the concentration of purchasing power among large retailers. In addition, our results of operations may be adversely affected if certain of our customers who purchase on credit terms are no longer eligible to purchase on such terms due to their financial distress or lack of credit insurance, which may reduce the quantity of products they demand from us.
Content policies adopted by retailers, consumer opposition and litigation could negatively affect sales of our products.
Retailers, including digital storefronts and platform partners, may decline to sell interactive entertainment software containing what they judge to be graphic violence, sexually explicit material, or other content that they deem inappropriate. If retailers decline to sell our products based on their opinion that they contain objectionable themes, graphic violence, sexually explicit material, or other generally objectionable content, or if any of our previously "M" rated series products are rated "AO," we might be required to significantly change or discontinue particular titles or series, which in the case of our best-selling Grand Theft Auto titles could seriously affect our business. Consumer advocacy groups have opposed sales of interactive entertainment software containing objectionable themes, violence, sexual material, or other objectionable content by pressing for legislation in these areas and by engaging in public demonstrations and media campaigns. Additionally, although lawsuits seeking damages for injuries allegedly suffered by third parties as a result of video games have generally been unsuccessful in the courts, claims of this kind have been asserted against us from time to time and may be asserted and be successful in the future. An increase in the number of lawsuits filed by the families of victims of violence may trigger supplemental governmental scrutiny, damage our reputation, and negatively affect the sale of our products. Further, in 2019, the World Health Organization included "gaming disorder" in the 11th revision of the International Classification of Diseases, leading some to consider legislation and policies aimed at addressing this issue. In addition, public dialogue concerning interactive entertainment may have an adverse impact on our reputation and our customers' willingness to purchase our products.
We submit our products for rating by the Entertainment Software Rating Board ("ESRB") in the United States and other voluntary or government ratings organizations in foreign countries. Failure to obtain a target rating for certain of our products could negatively affect our ability to distribute and sell those games, as could the re-rating of a game for any reason.
We voluntarily submit our game products to the ESRB, a U.S.-based non-profit and independent ratings organization. The ESRB system provides consumers with information about game content using a rating symbol that generally suggests the appropriate player age group and specific content descriptors, such as graphic violence, profanity or sexually explicit material. The ESRB may impose significant penalties on game publishers for violations of its rules related to rating or marketing games, including revocation of a rating or monetary fines. Other countries require voluntary or government backed ratings as prerequisites for product sales. In some instances, we may have to modify our products in order to market them under the target
20
rating, which could delay or disrupt the release of our products. In addition, some of our titles may not be sold at all or without extensive edits in certain countries.
In the U.S., if the ESRB rates a game as "AO" (age 18 and older), platform licensors may not certify the game and retailers may refuse to sell it. In addition, some consumers have reacted to re-ratings or controversial game content by refusing to purchase such games, demanding refunds for games that they had already purchased, and refraining from buying other games published by us. Many of our Rockstar titles and certain of our 2K titles have been rated "M" (age 17 and older) by the ESRB. If we are unable to obtain "M" ratings and instead receive "AO" ratings on future versions of those or similar titles as a result of changes in the ESRB's ratings standards or for other reasons, including the adoption of legislation in this area, our business and prospects could be negatively affected. If any of our games are re-rated by the ESRB or other foreign-based ratings organizations, we could be exposed to litigation, administrative fines and penalties and other potential liabilities, and our operating results and financial condition could be significantly affected.
We have implemented processes to comply with the requirements of the ESRB and other ratings organizations and properly display the designated rating symbols and content descriptions. Nonetheless, these processes are subject to human error, circumvention, overriding, and reasonable resource constraints. If a video game we publish were found to contain undisclosed pertinent content, the ESRB could re-rate a game, retailers could refuse to sell it and demand that we accept the return of any unsold copies or returns from customers, and consumers could refuse to buy it or demand that we refund their money. This could have a material negative effect on our operating results and financial condition. In addition, we may be exposed to litigation, administrative fines, and penalties, and our reputation could be harmed, which could affect sales of our other video games. If any of these were to occur, our business and financial performance could be significantly harmed.
Certain other countries have also established content rating systems as prerequisites for product sales in those countries. In addition, certain stores use other ratings systems, such as Apple’s use of its proprietary “App Rating System” and Google Play’s use of the International Age Rating Coalition (“IARC”) rating system. If we are unable to obtain the ratings we have targeted for our products, it could have a negative impact on our business. In some instances, we may be required to modify our products to meet the requirements of the rating systems, which could delay or disrupt the release of any given product or may prevent its sale altogether in certain territories. Further, if one of our games is “re‑rated” for any reason, a ratings organization could require corrective actions, which could include a recall, retailers could refuse to sell it and demand that we accept the return of any unsold or returned copies or consumers could demand a refund for copies previously purchased.
Additionally, retailers may decline to sell interactive entertainment software containing what they judge to be graphic violence or sexually explicit material or other content that they deem inappropriate for their businesses, whether because a product received a certain rating by the ESRB or other content rating system, or otherwise. If retailers decline to sell our products based upon their opinion that they contain objectionable themes, graphic violence or sexually explicit material, or other generally objectionable content, we might be required to modify particular titles or forfeit the revenue opportunity of selling such titles with that retailer.
If we are unable to protect the intellectual property relating to our software, the commercial value of our products will be adversely affected and our competitive position could be harmed.
We develop proprietary software and have obtained the rights to publish and distribute software developed by third parties. We attempt to protect our software and production techniques under patent, copyright, trademark and trade secret laws as well as through contractual restrictions on disclosure, copying and distribution. Nonetheless, our software is susceptible to piracy and unauthorized copying, and third parties may potentially exploit or misappropriate our intellectual property and proprietary information, causing significant reputational damage. Unauthorized third parties, for example, may be able to copy or to reverse engineer our software to obtain and use programming or production techniques that we regard as proprietary. Well organized piracy operations have also proliferated in recent years, resulting in the ability to download pirated copies of our software over the Internet. Although we attempt to incorporate protective measures into our software, piracy of our products could negatively affect our future profitability. In addition, "cheating" programs or other unauthorized software tools and modifications that enable consumers to cheat in games harm the experience of players who play fairly and could negatively impact the volume of microtransactions or purchases of downloadable content. Also, vulnerabilities in the design of our applications and of the platforms upon which they run could be discovered after their release. This may lead to lost revenues from paying consumers or increased cost of developing technological measures to respond to these, either of which could negatively affect our business.
We are or may be subject to contractual covenants which place certain limitations on how we manage our business.
Our credit agreement (the "Credit Agreement") may limit our ability to take various actions, including incurring additional debt, paying dividends, repurchasing shares, and acquiring or disposing of assets or businesses. Accordingly, we may be restricted from taking actions that management believes would be desirable and in the best interests of us and our stockholders. Our Credit Agreement also requires us to satisfy specified financial covenants and comply with other affirmative
21
and negative covenants. A breach of any of the covenants contained in our Credit Agreement could result in an event of default, which would allow our lenders to pursue various remedies, including accelerating the repayment of any outstanding indebtedness under our Credit Agreement.
Risks related to legal or regulatory compliance
Change in government regulations relating to the Internet could have a negative impact on our business.
We rely on our consumers' access to significant levels of Internet bandwidth for the sale and digital delivery of our content and the functionality of our games with online features. Changes in laws or regulations that adversely affect the growth, popularity, or use of the Internet, including laws affecting "net neutrality" or measures enacted in certain jurisdictions as a result of the COVID-19 pandemic, could decrease the demand for our products and services or increase our cost of doing business. Although certain jurisdictions have implemented laws and regulations intended to prevent Internet service providers from discriminating against particular types of legal traffic on their networks, other jurisdictions may lack such laws and regulations or repeal existing laws or regulations. For example, on December 14, 2017, the Federal Communications Commission voted to repeal net neutrality regulations in the U.S., and, following that decision, several states enacted net neutrality regulations. Given uncertainty around these rules, including changing interpretations, amendments, or repeal, coupled with the potentially significant political and economic power of local Internet service providers and the relatively significant level of Internet bandwidth access our products and services require, we could experience discriminatory or anti-competitive practices that could impede our growth, cause us to incur additional expenses, or otherwise negatively affect our business.
Our business and products are subject to potential legislation. The adoption of such proposed legislation could limit the retail market for our products.
Several proposals have been made for federal legislation to regulate our industry. Such proposals seek to prohibit the sale of products containing certain content included in some of our games. If any such proposals are enacted into law, it may limit the potential market for some of our games in the U.S., and adversely affect our business, financial condition and operating results. Other countries have adopted laws regulating content both in packaged games and those transmitted over the Internet that are stricter than current U.S. laws. In the U.S., proposals have also been made by numerous state legislators to regulate and prohibit the sale of interactive entertainment software products containing certain types of violent or sexual content to audiences under the ages of 17 or 18, such as the State of California's "ultraviolent video games law" that sought to ban the sale or rental of violent video games to minors. While such legislation to date has been enjoined by industry and retail groups or been found unconstitutional, the adoption into law of such legislation in federal and/or in state jurisdictions in which we do significant business could severely limit the retail market for some of our games.
Certain of our business models and features within our games and services are subject to new laws or regulations or evolving interpretations and application of existing laws and regulations, including those related to gambling. The growth and development of electronic commerce, virtual items and virtual currency has prompted calls for new laws and regulations and resulted in the application of existing laws or regulations that have limited or restricted the sale of our products and services in certain territories. In addition, certain foreign countries allow government censorship of interactive entertainment software products or require pre-approval processes of uncertain length before our games and services can be offered. Adoption of ratings systems, censorship, restrictions on distribution and changes to approval processes or the status of any approvals could harm our business by limiting the products we are able to offer to our consumers. In addition, compliance with new and possibly inconsistent regulations for different territories could be costly, delay or prevent the release of our products in those territories.
The laws and regulations concerning data privacy and certain other aspects of our business are continually evolving. Failure to comply with these laws and regulations could harm our business.
We are subject to certain privacy and data protection laws, including those in the U.S. Certain activities related to processing the personal data of individuals in the E.U. are conducted by our U.K.-based data controller or our local entities in the E.U. The U.S. Children's Online Privacy Protection Act also regulates the collection, use, and disclosure of personal information from children under 13 years of age. Failure to comply with privacy and data protection laws or age restrictions may increase our costs, subject us to expensive and distracting government investigations, and result in substantial fines, or result in lawsuits and claims against us to the extent these laws include a private right of action.
Privacy and data protection laws and industry terms are rapidly changing and likely will continue to do so for the foreseeable future, which could have an impact on our approach to operating and marketing our games and which may harm the sales of our products or decrease the size of our potential audience. For example, the E.U. General Data Protection Regulation ("GDPR") and the UK Data Protection Act 2018 ("DPA 2018") both became effective in May 2018. GDPR and DPA 2018 apply to us because we receive and process the personal information of individuals in the E.U. and the U.K., and we maintain certain local entities in the E.U. and the U.K. responsible for processing personal information. GDPR and DPA 2018 contain
22
significant penalties for non-compliance. Countries in the E.U. are still enacting national laws that correspond to certain portions of the GDPR. The U.K. also implemented an Age Appropriate Design Code that applies to how personal data is used for individuals up to age 18. In the U.S., the California Consumer Privacy Act ("CCPA") became effective on January 1, 2020 and applies to processing of personal information of California residents. California also enacted the California Privacy Rights Act ("CPRA"), which updates the CCPA, and Virginia enacted the Consumer Data Protection Act, both effective January 1, 2023. Other states, including Nevada, have enacted or are considering similar privacy or data protection laws that may apply to us. The U.S. government, including the Federal Trade Commission and the Department of Commerce, also continue to review the need for greater or different regulation over the collection of personal information and information about consumer behavior on the Internet and on mobile devices, and the U.S. Congress is considering a number of legislative proposals to regulate in this area. Various government and consumer agencies worldwide have also called for new regulation and changes in industry practices. Further, and most notably in the mobile ecosystem, companies that provide the platforms on which our games are played are changing the terms on how publishers can collect and use personal data obtained from users on those platforms.
Player use of our games is subject to our privacy policy, end user license agreements ("EULA"), and terms of service. If we fail to comply with our posted privacy policy, EULA, or terms of service, or if we fail to comply with existing privacy or data protection laws and regulations, it could result in proceedings or litigation against us by governmental authorities or others, which could result in fines or judgments against us, damage our reputation, affect our financial condition, and harm our business. If regulators, the media, or consumers raise any concerns about our privacy and data protection or consumer protection practices, even if unfounded, this could also result in fines or judgments against us, damage our reputation, negatively affect our financial condition, and damage our business.
It is possible that a number of laws and regulations may be adopted or construed to apply to us in the U.S. and elsewhere that could restrict the interactive entertainment industry, including player privacy, advertising, taxation, content suitability, copyright, distribution, and antitrust. Furthermore, the growth and development of electronic commerce and virtual goods may prompt calls for more stringent consumer protection laws that may impose additional burdens on companies such as ours conducting business through digital sales. Any such changes would require us to devote legal and other resources to address such regulation. For example, existing laws or new laws regarding the regulation of currency, banking institutions, and unclaimed property may be interpreted to cover virtual currency or virtual goods. If that were to occur, we may be required to seek licenses, authorizations, or approvals from relevant regulators, the granting of which may be dependent on us meeting certain capital and other requirements and we may be subject to additional regulation and oversight, all of which could significantly increase our operating costs. Changes in current laws or regulations or the imposition of new laws and regulations in the U.S. or elsewhere regarding these activities may lessen the growth of the interactive entertainment industry and impair our business, financial condition, and operating results. Further, in 2019, the World Health Organization included "gaming disorder" in the 11th revision of the International Classification of Diseases, leading some to consider legislation and policies aimed at mitigating the overuse of, and overspending within, video games.
Although we have structured and operate our skill tournaments and game mechanics, including random digital item mechanics, with applicable laws in mind, including any applicable laws relating to gambling, and believe that playing these games does not constitute gambling, our skill tournaments or game mechanics could become subject to gambling-related rules and regulations, or be deemed violative of current rules and regulations, and expose us to civil and criminal penalties. We also sometimes offer consumers of our online and casual games various types of contests and promotional opportunities. We are subject to laws in a number of jurisdictions concerning the operation and offering of such activities and games, many of which are still evolving and could be interpreted in ways that could harm our business. Further, random digital item mechanics may become subject to regulations in various jurisdictions. If these were to occur, we might be required to seek licenses, authorizations, or approvals from relevant regulators, the granting of which may be dependent on us meeting certain capital and other requirements, and we may be subject to additional regulation and oversight, such as reporting to regulators, all of which could significantly increase our operating costs. Moreover, the inclusion of random digital item mechanics has attracted the attention of the interactive gaming community, and if the future implementation of these features creates a negative perception of gameplay fairness or other negative perceptions, our reputation and brand could be harmed and revenue could be negatively impacted. Changes in current laws or regulations or the imposition of new laws and regulations in the U.S., the E.U., or elsewhere regarding these activities may lessen the growth of online or casual game services and impair our business. Also, existing laws or new laws regarding the marketing of in-game or in-app purchases, regulation of currency, banking institutions, unclaimed property, or money laundering may be interpreted to cover virtual currency or goods.
If we infringe on or are alleged to infringe on the intellectual property rights of third parties, our business could be adversely affected.
As our industry grows, we may be subject to an increasing amount of litigation that is common in the software industry based on allegations of infringement or other alleged violations of patent, copyright, or trademarks. In addition, we believe that interactive entertainment software will increasingly become the subject of claims that such software infringes on
23
the intellectual property rights of others with both the growth of online functionality and advances in technology, game content and software graphics as games become more realistic. From time to time, we receive notices from third parties or are named in lawsuits by third parties alleging infringement of their proprietary rights. Although we believe that our software and technologies and the software and technologies of third-party developers and publishers with whom we have contractual relations do not and will not infringe or violate proprietary rights of others, it is possible that infringement of proprietary rights of others may occur. Any claims of infringement, with or without merit, could be time consuming, costly and difficult to defend. Moreover, intellectual property litigation or claims could require us to discontinue the distribution of products, obtain a license or redesign our products, which could result in additional substantial costs and material delays.
In addition, many patents have been issued that may apply to potential new modes of delivering, playing or monetizing products and services such as those that we produce or would like to offer in the future. We may discover that future opportunities to provide new and innovative modes of game play and game delivery may be precluded by existing patents that we are unable to acquire or license on reasonable terms.
Risks related to financial and economic condition
Delaware law, our charter documents, and provisions of our debt agreements may impede or discourage a takeover, which could cause the market price of our shares to decline.
We are a Delaware corporation, and the anti-takeover provisions of Delaware law impose various impediments to the ability of a third party to acquire control of us, even if a change in control would be beneficial to our existing stockholders. Our Board of Directors has the power, without stockholder approval, to adopt a stockholder rights plan and/or to designate the terms of one or more series of preferred stock and issue shares of preferred stock. The ability of our Board of Directors to create and issue a new series of preferred stock and certain provisions of Delaware law, our certificate of incorporation and bylaws could impede a merger, takeover or other business combination involving us or discourage a potential acquirer from making a tender offer for our common stock, which, under certain circumstances, could reduce the market price of our common stock and the value of any outstanding notes.
Changes in our tax rates or exposure to additional tax liabilities could adversely affect our earnings and financial condition.
We are a multinational corporation with operations in the U.S. and various other jurisdictions around the world. Accordingly, we are subject to tax in the U.S. and in various other jurisdictions. Significant judgment is required in determining our worldwide provision for income taxes, and, in the ordinary course of business, there are many transactions and calculations where the ultimate tax determination is uncertain. We are required to estimate future taxes. Although we currently believe our tax estimates are reasonable, the estimation process is inherently uncertain, and such estimates are not binding on tax authorities. Further, our effective tax rate or tax payable could be adversely affected by a variety of factors, including changes in the business, the mix and level of earnings between countries with differing statutory tax rates, changes in the realizability of deferred tax assets, changes in tax elections, and changes in applicable tax laws. Additionally, tax determinations are regularly subject to audit by tax authorities, and developments in those audits could adversely affect our income tax provision. Should the ultimate tax liability exceed estimates, our income tax provision and net income or loss could be materially affected.
Beginning in 2022, the Tax Cuts and Jobs Act of 2017 (“TCJA”) eliminates the option to deduct research and development expenditures currently and requires taxpayers to amortize them pursuant to IRC Section 174. Although Congress is considering legislation that would defer the capitalization and amortization requirement to later years, we have no assurance that the requirement will be deferred, repealed or otherwise modified. The requirement was effective for the Company for fiscal year 2023, beginning April 1, 2022. It is possible that this change could have a significant adverse impact on our effective tax rate, tax payments, and financial condition in future periods.
In addition, the U.S. enacted the American Rescue Plan Act of 2021 (“ARPA”) which provided numerous tax and other stimulus measures. One such measure will expand limitation of compensation deductions for certain covered employees of publicly held corporations, beginning in 2027, to also include our next five highly compensated employees. It is possible that these changes could have an adverse impact on our effective tax rate, tax payments, and financial condition in future periods.
Additionally, a number of countries are actively pursuing fundamental changes to the tax laws applicable to multinational companies like us, including an increasing number that have enacted, or are considering enacting, revenue-based taxes on digital services. These digital services taxes target various business activities, including online advertising and, in some cases, video game sales. While the scope and applicability of these taxes often remains unclear, digital services taxes that ultimately apply to us could have an adverse impact on our business.
24
We are subject to risks and uncertainties of international trade, including fluctuations in the values of local foreign currencies against the dollar.
Sales in international markets, primarily in Europe, have accounted for a significant portion of our net revenue. For the fiscal year ended March 31, 2022, 40.1% of our net revenue was earned outside the U.S. We are continuing to execute on our growth initiatives in Asia, where our strategy is to broaden the distribution of our existing products and expand our online gaming presence, especially in China and South Korea. We are subject to risks inherent in foreign trade, including increased credit risks, tariffs, and duties, fluctuations in foreign currency exchange rates, shipping delays, and international political, regulatory and economic developments, such as those relating to the conflict between Russia and Ukraine, all of which can have a significant influence on our operating results. Many of our international sales are made in local currencies, which could fluctuate against the dollar. While we may use forward exchange contracts to a limited extent to seek to mitigate foreign currency risk, our operating results could be adversely affected by unfavorable foreign currency fluctuations.
Our reported financial results could be adversely affected by the application of existing or future accounting standards to our business as it evolves.
Our financial results are reported under the accounting policies promulgated by the SEC and national accounting standards bodies and the methods, estimates, and judgments that we use in applying our accounting policies. For example, standards regarding revenue recognition have and could further significantly affect the way we account for revenue related to our products and services. We expect that an increasing number of our games will be supported with material post-release activities, such as content updates and online-enabled features, and we could therefore be required to recognize more of the related revenues for those games over a period of time rather than at the time of sale. Further, as we increase our downloadable content and add new features to our online services, user playing patterns can affect our estimate of the service period, and we could be required to recognize revenues, and defer related costs, over a shorter or longer period of time than we initially allocated. As we enhance, expand and diversify our business and product offerings, the application of existing or future financial accounting standards, particularly those relating to the way we account for revenue, could have a significant adverse effect on our reported results although not necessarily on our cash flows.
Declines in consumer spending and other adverse changes in the economy could have a material adverse effect on our business, financial condition and operating results.
Most of our products involve discretionary spending on the part of consumers. We believe that consumer spending is influenced by general economic conditions and the availability of discretionary income. This makes our products particularly sensitive to general economic conditions and economic cycles as consumers are generally more willing to make discretionary purchases, including purchases of products like ours, during periods in which favorable economic conditions prevail. Adverse economic conditions, such as a prolonged U.S. or international general economic downturn, such as those caused by COVID-19, including periods of increased inflation, unemployment levels, tax rates, interest rates, energy prices, or declining consumer confidence, could also reduce consumer spending. Reduced consumer spending has and may in the future continue to result in reduced demand for our products and may also require increased selling and promotional expenses, which has had and may continue to have an adverse effect on our business, financial condition and operating results. In addition, during periods of relative economic weakness, our consolidated credit risk, reflecting our counterparty dealings with distributors, customers, capital providers and others may increase, perhaps materially so. As a result of COVID-19, our counterparty credit risk may be particularly exacerbated, as certain of our counterparties may face financial difficulties in paying owed amounts on a timely basis or at all. Furthermore, uncertainty and adverse changes in the economy could also increase the risk of material losses on our investments, increase costs associated with developing and publishing our products, increase the cost and availability of sources of financing, and increase our exposure to material losses from bad debts, any of which could have a material adverse effect on our business, financial condition and operating results. If economic conditions worsen, our business, financial condition and operating results could be adversely affected.
We are particularly susceptible to market conditions and risks associated with the entertainment industry, which, in addition to general macroeconomic downturns, also include the popularity, price, and timing of our products; changes in consumer demographics; the availability and popularity of other forms of entertainment and leisure; and critical reviews and public tastes and preferences, which may change rapidly and cannot necessarily be predicted.
General Risk Factors
Additional issuances or sales of equity securities by us would dilute the ownership of our existing stockholders and could adversely affect the market price of our common stock.
We may issue equity or equity-based securities in the future to facilitate acquisitions or strategic transactions, to adjust our ratio of debt to equity, to fund expansion of our operations or for other purposes. To the extent we issue additional equity securities, the percentage ownership of our existing stockholders would be reduced. The sale of substantial amounts of our
25
common stock could adversely affect its price. The sale or the availability for sale of a large number of shares of our common stock in the public market could cause the price of our common stock to decline.
We are subject to risks related to corporate and social responsibility and reputation.
Many factors influence our reputation including the perception held by our customers, business partners and other key stakeholders. Our business faces increasing scrutiny related to environmental, social and governance activities. We risk damage to our reputation if we fail to act responsibly in a number of areas, such as diversity and inclusion, environmental stewardship, supply chain management, climate change, workplace conduct, human rights and philanthropy. Any harm to our reputation could impact employee engagement and retention and the willingness of customers and our partners to do business with us, which could have a material adverse effect on our business, results of operations and cash flows.
Climate change may have a long-term impact on our business.
Climate change could result in an increase in the frequency or severity of natural disasters, such as earthquakes, fires, floods, or significant power outages and other catastrophic events. Such events may adversely impact critical infrastructure, have the potential to disrupt our business, our third-party suppliers, or the business of our customers, and may cause us to experience higher attrition, losses and additional costs to maintain or resume operations.
We may be adversely affected by the effects of inflation
Inflation has the potential to adversely affect our business, results of operations, financial position and liquidity by increasing our overall cost structure, particularly if we are unable to achieve commensurate increases in the prices we charge our customers. The existence of inflation in the economy has the potential to result in higher interest rates and capital costs, supply shortages, increased costs of labor and other similar effects. Further, world events such as the conflict between Russia and Ukraine could affect inflationary trends. As a result of inflation, we have experienced and may continue to experience, increases in our costs associated with operating our business including labor, equipment and other inputs. Although we may take measures to mitigate the impact of this inflation through pricing actions and efficiency gains, if these measures are not effective our business, results of operations, financial position and liquidity could be materially adversely affected. Even if such measures are effective, there could be a difference between the timing of when these beneficial actions impact our results of operations and when the cost of inflation is incurred.
Risks Related to our Pending Acquisition of Zynga
The Zynga acquisition may not be completed and the merger agreement may be terminated in accordance with its terms.
The Zynga acquisition remains subject to the approval by Take-Two stockholders of the Take-Two share issuance proposal, the Take-Two charter amendment proposal, and approval by Zynga stockholders of the Zynga merger proposal, and other customary closing conditions that must be satisfied or waived (to the extent permitted), in each case prior to the completion of the transaction. These conditions to the completion of the transaction, some of which are beyond the control of Take-Two and Zynga, may not be satisfied or waived in a timely manner or at all, and, accordingly, the Zynga acquisition may be delayed or not completed.
Additionally, either Take-Two or Zynga may terminate the merger agreement under certain circumstances, subject to the payment of a “termination fee” in certain cases, including if the merger agreement is terminated by either Take-Two or Zynga as a result of an adverse change in the recommendation of the other party’s board of directors. In such circumstances, Take-Two is required to pay to Zynga (in the case of a termination by Zynga), or Zynga is required to pay to Take-Two (in the case of a termination by Take-Two), a termination fee of $550 million. In addition, Zynga is required to pay to Take-Two a termination fee of $550 million if Zynga terminates the merger agreement to enter into a definitive agreement for an alternative business combination transaction that constitutes a “superior proposal.”
The Zynga acquisition may present certain risks to our business and operations prior to the closing and, if consummated, after the closing.
Our business and operations are subject to various risks related to the Zynga acquisition prior to closing, including:
a.our operations will be restricted by the terms of the merger agreement, which may cause us to forgo otherwise beneficial business opportunities;
b.the proposed transaction may disrupt our current business plans and operations;
c.our management’s attention may be directed toward the completion of the Zynga acquisition and diverted away from our day-to-day business operations;
d.legal proceedings may be instituted against Take-Two, Zynga or others following announcement of the proposed transaction;
26
e.we may incur significantly higher transaction costs than we currently anticipate, such as legal, financing and accounting fees, and other costs, fees, expenses and charges related to the Zynga acquisition, whether or not the transaction is completed; and
f.the Zynga acquisition may not be completed, which may have an adverse effect on our stock price and future business and financial results.
In addition, in the event the Zynga acquisition is consummated, certain risks may continue to exist after the closing of the Zynga acquisition, including, among other things, risks that:
a.the future results of the combined company will suffer if the combined company does not effectively manage its operations following the closing of the transaction;
b.the parties may fail to successfully combine the businesses in a manner that permits the combined company to realize the benefits of the proposed transaction, including net bookings opportunities and cost synergies;
c.Take-Two, Zynga, or the combined company may be unable to retain key personnel; and
d.the parties may not be able to successfully integrate Zynga’s business with Take-Two’s business or to integrate the businesses within the anticipated timeframe.
Should the Zynga acquisition be consummated, following which Zynga’s business is expected to constitute a significant portion of our business, additional significant risks may apply to the combined business as detailed in the joint proxy statement/prospectus previously filed on April 7, 2022, and incorporated by reference herein (File No. 333-263511), including the risks relating to Zynga’s business as detailed in Exhibit 99.2 of the Form 8-K previously filed on April 6, 2022, and incorporated by reference herein.
Item 1B. Unresolved Staff Comments
None.
Item 2. Properties
Our principal executive offices are located at 110 West 44th Street (also known as 1133 Avenue of the Americas), New York, New York, in approximately 117,100 square feet of space under a lease expiring in December 2037.
We also lease approximately 64,000 square feet of space under a lease expiring in March 2023 at 622 Broadway, New York, New York.
Take-Two Interactive Software Europe Ltd, our wholly-owned subsidiary, leases approximately 39,500 square feet of office space in London, United Kingdom, which expires in December 2034 and owns two office buildings in Edinburgh, United Kingdom.
2K corporate offices and two development studios occupy approximately 123,000 square feet of leased office space in Novato, California. The lease expires in June 2023 with respect to approximately 59,000 square feet and July 2025 with respect to approximately 64,000 square feet.
In addition, our other subsidiaries lease office space in Sydney and Pyrmont, Australia; Halifax, Oakville, Montreal, Parksville, and Vancouver, Canada; Chengdu, Hong Kong, and Shanghai, China; Brno and Prague, Czech Republic; Cesson-Sévigné and Paris, France; Munich, Germany; Budapest, Hungary; Bangalore, India; Dublin, Ireland; Tokyo, Japan; Breda, Netherlands; Auckland, New Zealand; Belgrade, Serbia; Singapore; Seoul, South Korea; Barcelona, Madrid, and Valencia, Spain; Luzerne, Switzerland; Taipei, Taiwan; Brighton, Dundee, London, Lincoln, Leeds, and Oxford, United Kingdom; and, in the United States: Agoura Hills, Carlsbad, Foothill Ranch, Petaluma, Moorpark, San Jose, and San Mateo, California; Sparks, Maryland; Andover and Westwood, Massachusetts; Las Vegas, Nevada; Bethpage and New York, New York; Austin, Texas; and Kirkland and Seattle, Washington.
For information regarding our lease commitments, see Note 14 - Leases to our Consolidated Financial Statements.
Item 3. Legal Proceedings
Refer to Note 15 - Commitments and Contingencies to our Consolidated Financial Statements for disclosures regarding our legal proceedings.
Item 4. Mine Safety Disclosures
Not applicable.
27
PART II
Item 5. Market for Registrant's Common Equity, Related Stockholder Matters and Issuer Purchases of Equity Securities
Market Information and Holders
Our common stock trades on the NASDAQ Global Select Market under the symbol "TTWO." The number of record holders of our common stock was 54 as of May 5, 2022.
Dividend Policy
We have never declared or paid cash dividends. We currently anticipate that all future earnings will be retained to finance the growth of our business and we do not expect to declare or pay any cash dividends in the foreseeable future. The payment of dividends in the future is within the discretion of our Board of Directors and will depend upon future earnings, capital requirements and other relevant factors. Our Credit Agreement requires us to meet certain incurrence tests prior to paying a dividend. See "Liquidity and Capital Resources" under Item 7 for additional information on our Credit Agreement.
Securities Authorized for Issuance under Equity Compensation Plans
The table setting forth this information is included in Part III—Item 12, Security Ownership of Certain Beneficial Owners and Management and Related Stockholder Matters.
Stock Performance Graph
This performance graph shall not be deemed "filed" for purposes of Section 18 of the Exchange Act or otherwise subject to the liabilities under that Section, and shall not be deemed to be incorporated by reference into any filing of the Company under the Exchange Act or the Securities Act of 1933.
The following line graph compares, from March 31, 2017 through March 31, 2022, the cumulative total stockholder return on our common stock with the cumulative total return on the stocks comprising the NASDAQ Composite Index and the stocks comprising a peer group index consisting of Activision Blizzard, Inc. and Electronic Arts Inc. The comparison assumes $100 was invested on March 31, 2017 in our common stock and in each of the following indices and assumes reinvestment of all cash dividends, if any, paid on such securities. We have not paid any cash dividends and, therefore, our cumulative total return calculation is based solely upon stock price appreciation and not upon reinvestment of cash dividends. Historical stock price is not necessarily indicative of future stock price performance.
28
Comparison of 5 Year Cumulative Total Return*
Among Take-Two Interactive Software, Inc., the NASDAQ Composite Index and a Peer Group
March 2022
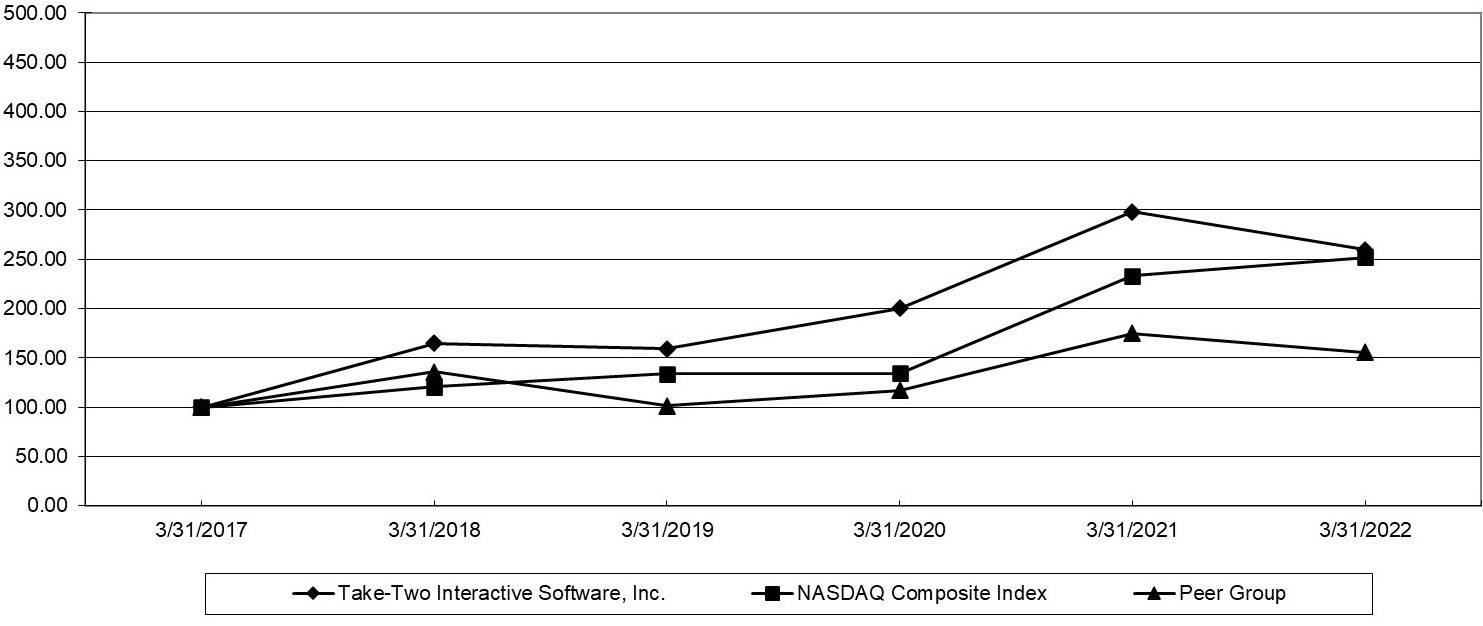
* The graph and chart assume that $100 was invested on March 31, 2017 in the applicable stock or index and that all dividends were reinvested.
| March 31, | |||||||||||||||||||||||||||||||||||
| 2017 | 2018 | 2019 | 2020 | 2021 | 2022 | ||||||||||||||||||||||||||||||
| Take-Two Interactive Software, Inc. | $ | 100.00 | $ | 164.97 | $ | 159.22 | $ | 200.12 | $ | 298.13 | $ | 259.39 | |||||||||||||||||||||||
| NASDAQ Composite Index | 100.00 | 120.76 | 133.60 | 134.52 | 233.26 | 252.05 | |||||||||||||||||||||||||||||
| Peer Group | 100.00 | 135.75 | 101.36 | 117.31 | 174.69 | 155.70 | |||||||||||||||||||||||||||||
Issuer Purchases of Equity Securities
Share Repurchase Program—Our Board of Directors has authorized the repurchase of up to 21,659,976 shares of our common stock. Under this program, we may purchase shares from time to time through a variety of methods, including in the open market or through privately negotiated transactions, in accordance with applicable securities laws. Repurchases are subject to the availability of stock, prevailing market conditions, the trading price of the stock, our financial performance and other conditions. The program does not require us to repurchase shares and may be suspended or discontinued at any time for any reason.
During the fiscal years ended March 31, 2022, 2021, and 2020, we repurchased 1,260,447, 0, and 0 shares of our common stock in the open market, respectively, for $200.0 million, $0.0 million, and $0.0 million, respectively, including commissions, as part of the program. As of March 31, 2022, we had repurchased a total of 11,659,976 shares of our common stock under the program, and 10,000,000 shares of our common stock remained available for repurchase under the share repurchase program. All of the repurchased shares are classified as Treasury stock in our Consolidated Balance Sheets.
Summary Table—The table below details the share repurchases that were made by us during the three months ended March 31, 2022:
| Period | Shares purchased | Average price per share | Total number of shares purchased as part of publicly announced plans or programs | Maximum number of shares that may yet be purchased under the repurchase program | ||||||||||||||||||||||
| January 1 - 31, 2022 | — | — | — | 10,000 | ||||||||||||||||||||||
| February 1 - 28, 2022 | — | — | — | 10,000 | ||||||||||||||||||||||
| March 1 - 31, 2022 | — | — | — | 10,000 | ||||||||||||||||||||||
29
Item 6. Selected Financial Data
Not applicable
Item 7. Management's Discussion and Analysis of Financial Condition and Results of Operations
Overview
Our Business
We are a leading developer, publisher, and marketer of interactive entertainment for consumers around the globe. We develop and publish products principally through Rockstar Games, 2K, Private Division, and T2 Mobile Games. Our products are currently designed for console gaming systems and PC, including smartphones and tablets. We deliver our products through physical retail, digital download, online platforms and cloud streaming services.
Recent Developments
Pending Acquisition. On January 9, 2022, we entered into a definitive merger agreement to acquire Zynga Inc. ("Zynga"), a leading developer of mobile games. Under the terms and subject to the conditions of the merger agreement, Zynga stockholders will receive $3.50 in cash and a number of shares of our common stock equal to the exchange ratio for each share of Zynga common stock outstanding at the closing. The transaction is valued at $9.86 per share of Zynga common stock based on the market closing as of January 7, 2022, implying an enterprise value of $12.7 billion. The transaction includes a collar mechanism on the equity consideration, so that if the volume weighted average price ("VWAP") of Take-Two common stock on the Nasdaq Global Select Market for the consecutive period beginning at 9:30 a.m. New York time on the twenty-third trading day immediately preceding the closing date of the transaction and concluding at 4:00 p.m. New York time on the third trading day preceding such closing date is in a range from $156.50 to $181.88, the exchange ratio would be adjusted to deliver total consideration of $9.86 per Zynga share. If the VWAP of our common stock for the period noted in the prior sentence exceeds the higher end of that range the exchange ratio would be 0.0350 per share, and, if the VWAP is below the lower end of that range, the exchange ratio would be 0.0406 per share.
The transaction, which is currently anticipated to close on Monday May 23, 2022, is subject to approval by Take-Two and Zynga stockholders and the satisfaction of the other customary closing conditions.
In connection with the transaction, on April 14, 2022, we completed our offering and sale of $2.7 billion aggregate principal amount of our senior notes, consisting of $1.0 billion principal amount of our 3.300% Senior Notes due 2024 (the “2024 Notes”), $600 million principal amount of our 3.550% Senior Notes due 2025 (the “2025 Notes”), $600 million principal amount of our 3.700% Senior Notes due 2027 (the “2027 Notes”) and $500 million principal amount of our 4.000% Senior Notes due 2032 (the “2032 Notes” and, together with the 2024 Notes, the 2025 Notes and the 2027 Notes, the “Notes”).The Notes were issued under an indenture between the Company and The Bank of New York Mellon, as trustee (the “Trustee”).
The Notes are the Company’s senior unsecured obligations and rank equally with all of our other existing and future unsubordinated obligations. The 2024 Notes mature on March 28, 2024 and bear interest at an annual rate of 3.300%. The 2025 Notes mature on April 14, 2025 and bear interest at an annual rate of 3.550%. The 2027 Notes mature on April 14, 2027 and bear interest at an annual rate of 3.700%. The 2032 Notes mature on April 14, 2032 and bear interest at an annual rate of 4.000%. We will pay interest on the 2024 Notes semiannually on March 28 and September 28 of each year, commencing September 28, 2022. We will pay interest on each of the 2025 Notes, 2027 Notes and 2032 Notes semi-annually on April 14 and October 14 of each year, commencing October 14, 2022.
Trends and Factors Affecting our Business
Product Release Schedule. Our financial results are affected by the timing of our product releases and the commercial success of those titles. Our Grand Theft Auto products in particular have historically accounted for a significant portion of our revenue. Sales of Grand Theft Auto products generated 30.9% of our net revenue for the fiscal year ended March 31, 2022. The timing of our Grand Theft Auto product releases may affect our financial performance on a quarterly and annual basis.
Economic Environment and Retailer Performance. We continue to monitor economic conditions, including the impact of the COVID-19 pandemic, that may affect our businesses, such as consumer demand, pricing pressure on our products, credit quality of our receivables, and foreign currency exchange rates. The COVID-19 pandemic has affected and may continue to affect our business operations, including our employees, customers, partners, and communities, and there is substantial uncertainty in the nature and degree of its continued effects over time. During fiscal year 2021, as in the final quarter of fiscal year 2020, we noted a positive impact to our results that we believe was partly due to increased consumer engagement with our products because of the COVID-19 related business closures and movement restrictions, such as "shelter in place" and "lockdown" orders, implemented around the world, as well as the online accessibility and social nature of our products. As
30
expected, during fiscal year 2022, we experienced a moderation in engagement from the all-time highs experienced in fiscal year 2021, but overall engagement continued to be notably higher than it was pre-pandemic.
Based on our concern for the health and safety of our teams, we have developed and continue to develop plans to help mitigate the negative impact of the pandemic on our business, including transitioning the vast majority of our teams to working from home. The majority of our offices either have reopened or are scheduled to reopen in the coming months. Given the evolving dynamics of the COVID-19 pandemic, we continue to adhere to safety standards in the planning and implementation of our return to office. To date, our plans have resulted in minimal disruption. However, despite largely positive outcomes to date, these efforts may ultimately not be effective, and a protracted economic downturn may limit the effectiveness of our mitigation efforts. Any of these considerations described above could cause or contribute to the risks described, above, in Item 1A of this Form 10-K and could materially adversely affect our business, financial condition, results of operations, or stock price. Therefore, the effects of COVID-19 may not be fully reflected in our financial results until future periods, and, at this time, we are not able to predict its ultimate impact on our business.
Additionally, our business is dependent upon a limited number of customers that account for a significant portion of our revenue. Our five largest customers accounted for 79.0%, 78.4% and 71.5% of net revenue during the fiscal years ended March 31, 2022, 2021 and 2020, respectively. As of March 31, 2022, and 2021, five customers comprised 72.8% and 77.6% of our gross accounts receivable, respectively, with our significant customers (those that individually comprised more than 10% of our gross accounts receivable balance) accounting for 63.8% and 69.2% of such balance at March 31, 2022, and 2021, respectively. We had two customers who accounted for 43.5% and 20.3% of our gross accounts receivable as of March 31, 2022, and two customers who accounted for 50.4% and 18.8% of our gross accounts receivable as of March 31, 2021. We did not have any additional customers that exceeded 10% of our gross accounts receivable as of March 31, 2022, and 2021. The economic environment has affected our customers in the past, and may do so in the future, including as a result of the COVID-19 pandemic. Bankruptcies or consolidations of our large retail customers could seriously hurt our business, due to uncollectible accounts receivables and the concentration of purchasing power among the remaining large retailers. The COVID-19 pandemic has led, and may continue to lead, to increased consolidation as larger, better capitalized competitors will be in a stronger position to withstand prolonged periods of economic downturn and sustain their business through the financial volatility. Certain of our large customers sell used copies of our games, which may negatively affect our business by reducing demand for new copies of our games. While the downloadable content that we now offer for certain of our titles may serve to reduce used game sales, we expect used game sales to continue to adversely affect our business.
Hardware Platforms. We derive most of our revenue from the sale of products made for video game consoles manufactured by third parties, which comprised 72.2% of our net revenue by product platform for the fiscal year ended March 31, 2022. The success of our business is dependent upon the consumer acceptance of these platforms and the continued growth in the installed base of these platforms. When new hardware platforms are introduced, such as those released in November 2020 by Sony and Microsoft, demand for interactive entertainment used on older platforms typically declines, which may negatively affect our business during the market transition to the new consoles. The new Sony and Microsoft consoles provide "backwards compatibility" (i.e., the ability to play games for the previous generation of consoles), which could mitigate the risk of such a decline. However, we cannot be certain how backwards compatibility will affect demand for our products. Further, events beyond our control may impact the availability of these new consoles, which may also affect demand. We manage our product delivery on each current and future platform in a manner we believe to be most effective to maximize our revenue opportunities and achieve the desired return on our investments in product development. Accordingly, our strategy is to focus our development efforts on a select number of the highest quality titles for these platforms, while also expanding our offerings for other platforms such as tablets, smartphones, and online games.
Online Content and Digital Distribution. The interactive entertainment software industry is delivering a growing amount of content through digital online delivery methods. We provide a variety of online delivered products and offerings. Virtually all of our titles that are available through retailers as packaged goods products are also available through direct digital download (from websites we own and others owned by third parties) as well as a large selection of our catalog titles. In addition, we aim to drive ongoing engagement and incremental revenue from recurrent consumer spending on our titles through virtual currency, add-on content, and in-game purchases. We also publish an expanding variety of titles for Mobile, which are delivered to consumers through digital download. As disclosed in our "Results of Operations," below, net revenue from digital online channels comprised 89.8% of our net revenue for the fiscal year ended March 31, 2022. We expect online delivery of games and game offerings to continue to grow and to be the primary part of our business over the long term.
Content Release Highlights
During fiscal year 2022, 2K released NBA 2K22, WWE 2K22, and Tiny Tina's Wonderlands, Private Division released Hades physically on consoles and OlliOlli World, and Rockstar released Grand Theft Auto: The Trilogy - The Definitive Edition and Grand Theft Auto V and a standalone version of Grand Theft Auto Online for the PS5 and Xbox Series X|S.
31
To date we have announced that, during fiscal year 2023, 2K will release The Quarry, Marvel's Midnight Suns, NBA 2K23, WWE 2K23, and PGA TOUR 2K23, and Private Division will release Kerbal Space Program 2. In addition, throughout the year, we expect our labels to deliver new content for our franchises. We will also continue to invest in opportunities that we believe will enhance and scale our business and have the potential to drive growth over the long-term.
Fiscal 2022 Financial Summary
We acquired Nordeus Limited ("Nordeus") on June 1, 2021, for initial consideration having an acquisition date fair value of $289.8 million, consisting of $132.9 million in cash, the issuance of 0.5 million shares of our common stock, and a contingent earn-out consideration arrangement that requires us to pay up to an aggregate of $153.0 million in cash if Nordeus achieves certain performance measures over the 12- and 24-month periods following the closing (refer to Note 22 - Acquisitions). Founded in 2010, Nordeus is a free-to-play mobile game company based in Belgrade, Serbia, best known for Top Eleven.
Our Net revenue for fiscal year ended March 31, 2022 was led by a variety of our top franchises, primarily NBA 2K, Grand Theft Auto, Red Dead Redemption, Borderlands, and WWE 2K. Our Net revenue increased to $3,504.8 million, an increase of $132.0 million or 3.9% compared to the fiscal year ended March 31, 2021.
For the fiscal year ended March 31, 2022, our Net income was $418.0 million, as compared to $588.9 million in the prior year. Diluted earnings per share for the fiscal year ended March 31, 2022 was $3.58, as compared to Diluted income per share of $5.09 for the fiscal year ended March 31, 2021. Our operating income for the fiscal year ended March 31, 2022 decreased compared to the operating income for fiscal year ended March 31, 2021, due to (i) higher operating expenses for personnel and marketing and (ii) increases in the fair value of the contingent earn-out liability related to our June 2021 acquisition of Nordeus.
At March 31, 2022, we had $2,195.3 million of Cash and cash equivalents and Restricted cash and cash equivalents, compared to $2,060.2 million at March 31, 2021. The increase in Cash and cash equivalents and Restricted cash and cash equivalents from March 31, 2021 was due primarily to (i) Net cash provided by operating activities from sales primarily from the previously mentioned titles, partially offset by investments in software development and licenses as well as royalty payments and (ii) Net cash provided by investing activities primarily related to net proceeds from available for sale securities changes in bank time deposits, partially offset primarily by our acquisition of Nordeus, and purchases of fixed assets including our acquisition of two office buildings in the U.K. (refer to Note 22 - Acquisitions). This net increase was partially offset by Net cash used in financing activities, which was primarily related to repurchase of our common stock and tax payments related to net share settlements of our restricted stock.
Critical Accounting Policies and Estimates
Our most critical accounting policies, which are those that require significant judgment, include revenue recognition; price protection and allowances for returns; capitalization and recognition of software development costs and licenses; fair value estimates including valuation of goodwill, and intangible assets; valuation and recognition of stock-based compensation; and income taxes. See Note 1 - Basis of Presentation and Significant Accounting Policies in the Notes to our Consolidated Financial Statements in this Annual Report on Form 10-K.
Recently Adopted and Recently Issued Accounting Pronouncements
Operating Metric
Net Bookings
We monitor Net Bookings as a key operating metric in evaluating the performance of our business. Net Bookings is defined as the net amount of products and services sold digitally or sold-in physically during the period and includes licensing fees, merchandise, in-game advertising, strategy guides, and publisher incentives. Net Bookings were as follows:
| Fiscal Year Ended March 31, | |||||||||||||||||||||||
| 2022 | 2021 | Increase/(decrease) | Increase/(decrease) % | ||||||||||||||||||||
| Net Bookings | $ | 3,408,184 | $ | 3,552,598 | $ | (144,414) | (4.1) | % | |||||||||||||||
For the fiscal year ended March 31, 2022, Net Bookings decreased by $144.4 million as compared to the prior year due primarily to a decrease in Net Bookings from our NBA 2K franchise; our PGA TOUR 2K franchise, which benefited from the release of PGA TOUR 2K21 in the prior year; and our Mafia franchise, which benefited from the releases of Mafia: Definitive Editions and Mafia: Trilogy in the prior year; and The Outer Worlds, which released in October 2020. These
32
decreases were partially offset by an increase in Net Bookings from Top Eleven, which was part of our Nordeus acquisition in June 2021; Tiny Tina’s Wonderlands, which released in March 2022; Two Dots, which was part of our Playdots acquisition in September 2020; and our WWE 2K franchise, including WWE 2K22, which released in March 2022.
Results of Operations
In this section, we discuss the results of our operations for the fiscal year ended March 31, 2022 compared to the fiscal year ended March 31, 2021. For the comparison of fiscal year 2021 to fiscal year 2020, refer to Part II, Item 7 “Management’s Discussion and Analysis of Financial Condition and Results of Operations” of our Annual Report on Form 10-K for the year ended March 31, 2021.
The following table sets forth, for the periods indicated, our statements of operations, net revenue by geographic region, net revenue by platform, net revenue by distribution channel, and net revenue by content type:
| Fiscal Year Ended March 31, | ||||||||||||||||||||||||||||||||||||||
| 2022 | 2021 | 2020 | ||||||||||||||||||||||||||||||||||||
| Net revenue | $ | 3,504,800 | 100.0 | % | $ | 3,372,772 | 100.0 | % | $ | 3,088,970 | 100.0 | % | ||||||||||||||||||||||||||
| Cost of goods sold | 1,535,401 | 43.8 | % | 1,535,085 | 45.5 | % | 1,542,450 | 49.9 | % | |||||||||||||||||||||||||||||
| Gross profit | 1,969,399 | 56.2 | % | 1,837,687 | 54.5 | % | 1,546,520 | 50.1 | % | |||||||||||||||||||||||||||||
| Selling and marketing | 516,429 | 14.7 | % | 444,985 | 13.2 | % | 458,424 | 14.8 | % | |||||||||||||||||||||||||||||
| General and administrative | 510,855 | 14.6 | % | 390,683 | 11.6 | % | 318,235 | 10.3 | % | |||||||||||||||||||||||||||||
| Research and development | 406,566 | 11.6 | % | 317,311 | 9.4 | % | 296,398 | 9.6 | % | |||||||||||||||||||||||||||||
| Depreciation and amortization | 61,105 | 1.7 | % | 55,596 | 1.6 | % | 48,113 | 1.6 | % | |||||||||||||||||||||||||||||
| Business reorganization | 849 | — | % | (272) | — | % | 83 | — | % | |||||||||||||||||||||||||||||
| Total operating expenses | 1,495,804 | 42.7 | % | 1,208,303 | 35.8 | % | 1,121,253 | 36.3 | % | |||||||||||||||||||||||||||||
| Income from operations | 473,595 | 13.5 | % | 629,384 | 18.7 | % | 425,267 | 13.8 | % | |||||||||||||||||||||||||||||
| Interest and other, net | (14,212) | (0.4) | % | 8,796 | 0.3 | % | 38,505 | 1.2 | % | |||||||||||||||||||||||||||||
| Gain (loss) on long-term investments, net | 6,015 | 0.2 | % | 39,636 | 1.2 | % | (5,333) | (0.2) | % | |||||||||||||||||||||||||||||
| Income before income taxes | 465,398 | 13.3 | % | 677,816 | 20.1 | % | 458,439 | 14.8 | % | |||||||||||||||||||||||||||||
| Provision for income taxes | 47,376 | 1.4 | % | 88,930 | 2.6 | % | 53,980 | 1.7 | % | |||||||||||||||||||||||||||||
| Net income | $ | 418,022 | 11.9 | % | $ | 588,886 | 17.5 | % | $ | 404,459 | 13.1 | % | ||||||||||||||||||||||||||
| Fiscal Year Ended March 31, | ||||||||||||||||||||||||||||||||||||||
| 2022 | 2021 | 2020 | ||||||||||||||||||||||||||||||||||||
| Net revenue by geographic region: | ||||||||||||||||||||||||||||||||||||||
| United States | $ | 2,100,237 | 59.9 | % | $ | 2,015,885 | 59.8 | % | $ | 1,775,682 | 57.5 | % | ||||||||||||||||||||||||||
| International | 1,404,563 | 40.1 | % | 1,356,887 | 40.2 | % | 1,313,288 | 42.5 | % | |||||||||||||||||||||||||||||
| Net revenue by platform: | ||||||||||||||||||||||||||||||||||||||
| Console | $ | 2,528,857 | 72.2 | % | $ | 2,516,993 | 74.6 | % | $ | 2,308,602 | 74.7 | % | ||||||||||||||||||||||||||
| PC and other | 572,506 | 16.3 | % | 581,702 | 17.2 | % | 594,619 | 19.2 | % | |||||||||||||||||||||||||||||
| Mobile | 403,437 | 11.5 | % | 274,077 | 8.1 | % | 185,749 | 6.0 | % | |||||||||||||||||||||||||||||
| Net revenue by distribution channel: | ||||||||||||||||||||||||||||||||||||||
| Digital online | $ | 3,148,957 | 89.8 | % | $ | 2,972,403 | 88.1 | % | $ | 2,405,097 | 77.9 | % | ||||||||||||||||||||||||||
| Physical retail and other | 355,843 | 10.2 | % | 400,369 | 11.9 | % | 683,873 | 22.1 | % | |||||||||||||||||||||||||||||
| Net revenue by content: | ||||||||||||||||||||||||||||||||||||||
| Recurrent consumer spending | $ | 2,271,171 | 64.8 | % | $ | 2,151,952 | 63.8 | % | $ | 1,448,191 | 46.9 | % | ||||||||||||||||||||||||||
| Full game and other | 1,233,629 | 35.2 | % | 1,220,820 | 36.2 | % | 1,640,779 | 53.1 | % | |||||||||||||||||||||||||||||
33
Fiscal Years ended March 31, 2022 and 2021
| (thousands of dollars) | 2022 | % of net revenue | 2021 | % of net revenue | Increase/(decrease) | % Increase/(decrease) | ||||||||||||||||||||||||||||||||
| Net revenue | $ | 3,504,800 | 100.0 | % | $ | 3,372,772 | 100.0 | % | $ | 132,028 | 3.9 | % | ||||||||||||||||||||||||||
| Internal royalties | 619,902 | 17.7 | % | 637,652 | 18.9 | % | (17,750) | (2.8) | % | |||||||||||||||||||||||||||||
| Software development costs and royalties(1) | 417,431 | 11.9 | % | 396,797 | 11.8 | % | 20,634 | 5.2 | % | |||||||||||||||||||||||||||||
| Licenses | 254,203 | 7.3 | % | 260,721 | 7.7 | % | (6,518) | (2.5) | % | |||||||||||||||||||||||||||||
| Product costs | 243,865 | 7.0 | % | 239,915 | 7.1 | % | 3,950 | 1.6 | % | |||||||||||||||||||||||||||||
| Cost of goods sold | 1,535,401 | 43.8 | % | 1,535,085 | 45.5 | % | 316 | — | % | |||||||||||||||||||||||||||||
| Gross profit | $ | 1,969,399 | 56.2 | % | $ | 1,837,687 | 54.5 | % | $ | 131,712 | 7.2 | % | ||||||||||||||||||||||||||
(1) Includes $48,381 and $8,707 of stock-based compensation expense in fiscal year 2022 and 2021, respectively.
For the fiscal year ended March 31, 2022, net revenue increased by $132.0 million, as compared to the prior year. The increase was due primarily to an increase in net revenue of (i) $96.3 million from our Grand Theft Auto franchise, (ii) $83.9 million from Tiny Tina's Wonderlands, which released in March 2022, (iii) $75.0 million from Two Dots, which was part of our Playdots acquisition completed in September 2020, (iv) $51.3 million from Top Eleven, which was part of our Nordeus acquisition completed in June 2021, and (v) $36.6 million from our WWE 2K franchise, including WWE 2K22, which released in March 2022. These increases were offset by a decrease in net revenue of (i) $46.7 million from our Mafia franchise, (ii) 41.4 million from our Borderlands franchise, (iii) $39.3 million from our PGA TOUR 2K franchise, (iv) $29.0 million from our Civilization franchise, and (v) $25.2 million from our Red Dead Redemption franchise.
Net revenue from console games increased by $11.9 million and accounted for 72.2% of our total net revenue in the fiscal year ended March 31, 2022, as compared to 74.6% in the prior year. The increase was due to an increase in net revenue from our Grand Theft Auto franchise, Tiny Tina's Wonderlands, and our WWE 2K franchise, partially offset by a decrease in net revenue from our Mafia, Borderlands, PGA TOUR 2K, Red Dead Redemption, and BioShock franchises, The Outer Worlds, and our Civilization and NBA 2K franchises. Net revenue from PC and other decreased by $9.2 million and accounted for 16.3% of our total net revenue in the fiscal year ended March 31, 2022, as compared to 17.2% in the prior year. The decrease was due to a decrease in net revenue from our Grand Theft Auto, Civilization, and XCOM franchises, The Outer Worlds, our Mafia franchise, L.A. Noire, and our Borderlands franchise, partially offset by an increase in net revenue from Tiny Tina's Wonderlands and our NBA 2K franchise. Net revenue from mobile increased by $129.4 million and accounted for 11.5% of our total net revenue in the fiscal year ended March 31, 2022, as compared to 8.1% in the prior year. The increase was due to an increase in net revenue from Top Eleven and Two Dots.
Net revenue from digital online channels increased by $176.6 million and accounted for 89.8% of our total net revenue for the fiscal year ended March 31, 2022, as compared to 88.1% in the prior year. The increase was due to an increase in net revenue from Two Dots, our Grand Theft Auto franchise, Tiny Tina's Wonderlands, Top Eleven, our NBA 2K and WWE 2K franchises, partially offset by a decrease in net revenue from our Mafia, Civilization, PGA TOUR 2K, and Borderlands franchises and The Outer Worlds. Net revenue from physical retail and other channels decreased by $44.5 million and accounted for 10.2% of our total net revenue for the fiscal year ended March 31, 2022, as compared to 11.9% for the prior year. The decrease was due to a decrease in net revenue from our Borderlands, Mafia, PGA TOUR 2K, NBA 2K, and Red Dead Redemption franchises, partially offset by an increase in net revenue from our Grand Theft Auto franchise and Tiny Tina's Wonderlands.
Recurrent consumer spending is generated from ongoing consumer engagement and includes revenue from virtual currency, add-on content, and in-game purchases. Net revenue from recurrent consumer spending increased by $119.2 million and accounted for 64.8% of net revenue for the fiscal year ended March 31, 2022, as compared to 63.8% for the prior year. The increase was due to an increase in net revenue from Two Dots, Top Eleven, and our Grand Theft Auto and NBA 2K franchises, partially offset by a decrease in net revenue from our Borderlands franchise. Net revenue from full game and other increased by $12.8 million and accounted for 35.2% of net revenue for the fiscal year ended March 31, 2022, as compared to 36.2% for the prior year. The increase was due to an increase in net revenue from Tiny Tina's Wonderlands, our Grand Theft Auto, and WWE 2K franchises, partially offset by a decrease in net revenue from our Mafia and PGA TOUR 2K franchises, The Outer Worlds, and our NBA 2K, Red Dead Redemption, Civilization, BioShock and XCOM franchises and L.A. Noire.
Gross profit as a percentage of net revenue for the fiscal year ended March 31, 2022 was 56.2%, as compared to 54.5% in the prior year. The percentage increase was due primarily to lower development royalties due primarily to the timing of releases, partially offset by impairments recognized against some of our capitalized software balances (refer to Note 8 - Software Development Costs and Licenses).
34
Net revenue earned outside of the United States increased by $47.7 million and accounted for 40.1% of our total net revenue in the fiscal year ended March 31, 2022, as compared to 40.2% in the prior year. The increase in net revenue outside of the United States was due to an increase in net revenue from Top Eleven, Two Dots, Tiny Tina's Wonderlands, and our Grand Theft Auto, and WWE 2K franchises, partially offset by a decrease in net revenue from our Mafia, Borderlands, Civilization, PGA TOUR 2K, Red Dead Redemption franchises and The Outer Worlds. Changes in foreign currency exchange rates decreased net revenue and gross profit by $1.7 million and $4.2 million, respectively, in the fiscal year ended March 31, 2022 as compared to the prior year.
Operating Expenses
| (thousands of dollars) | 2022 | % of net revenue | 2021 | % of net revenue | Increase/(decrease) | % Increase/(decrease) | ||||||||||||||||||||||||||||||||
| Selling and marketing | $ | 516,429 | 14.7 | % | $ | 444,985 | 13.2 | % | $ | 71,444 | 16.1 | % | ||||||||||||||||||||||||||
| General and administrative | 510,855 | 14.6 | % | 390,683 | 11.6 | % | 120,172 | 30.8 | % | |||||||||||||||||||||||||||||
| Research and development | 406,566 | 11.6 | % | 317,311 | 9.4 | % | 89,255 | 28.1 | % | |||||||||||||||||||||||||||||
| Depreciation and amortization | 61,105 | 1.7 | % | 55,596 | 1.6 | % | 5,509 | 9.9 | % | |||||||||||||||||||||||||||||
| Business reorganization | 849 | — | % | (272) | — | % | 1,121 | (412.1) | % | |||||||||||||||||||||||||||||
| Total operating expenses | $ | 1,495,804 | 42.7 | % | $ | 1,208,303 | 35.8 | % | $ | 287,501 | 23.8 | % | ||||||||||||||||||||||||||
Includes stock-based compensation expense, which was allocated as follows (in thousands):
| 2022 | 2021 | |||||||||||||
| Selling and marketing | $ | 30,027 | $ | 18,348 | ||||||||||
| General and administrative | $ | 66,443 | $ | 56,830 | ||||||||||
| Research and development | $ | 38,118 | $ | 26,587 | ||||||||||
Foreign currency exchange rates increased total operating expenses by $5.5 million in the fiscal year ended March 31, 2022 as compared to the prior year.
Selling and marketing
Selling and marketing expenses increased by $71.4 million in the fiscal year ended March 31, 2022 as compared to the prior year, due primarily to (i) $62.2 million in higher overall marketing expenses due primarily to Top Eleven, with no corresponding expense in the prior fiscal year and higher spend on Two Dots, Grand Theft Auto Online, and our WWE 2K franchise and (ii) an increase in personnel expenses, primarily due to increased headcount.
General and administrative
General and administrative expenses increased by $120.2 million for the fiscal year ended March 31, 2022, as compared to the prior year, due primarily to increases in (i) personnel expenses for additional headcount and higher incentive compensation, (ii) the fair value of the contingent earn-out liability related to our acquisition of Nordeus (refer to Note 22 - Acquisitions), (iii) professional fees related to acquisitions, including our pending acquisition of Zynga, (iv) IT expenses, primarily for cloud-based services, and (v) rent expenses for additional locations and lease renewals. These increases were partially offset by a decrease in charitable contributions, primarily related to our COVID-19 response and relief efforts in the prior fiscal year.
General and administrative expenses for the fiscal years ended March 31, 2022 and 2021 include occupancy expense (primarily rent, utilities and office expenses) of $37.2 million and $27.5 million, respectively, related to our development studios.
Research and development
Research and development expenses increased by $89.3 million for the fiscal year ended March 31, 2022, as compared to the prior year, due primarily to increased personnel expense due to increased headcount including related to our recent acquisitions.
Depreciation and amortization
Depreciation and amortization expenses increased by $5.5 million for the fiscal year ended March 31, 2022, as compared to the prior year, due primarily to an increase in costs related to IT infrastructure.
35
Business Reorganization
During the fiscal year ended March 31, 2022, business reorganization expense increased by $1.1 million as compared to the prior year period and was not material.
Interest and other, net
| (thousands of dollars) | 2022 | % of net revenue | 2021 | % of net revenue | Increase/(decrease) | % Increase/(decrease) | ||||||||||||||||||||||||||||||||
| Interest income | $ | 17,622 | 0.5 | % | $ | 18,701 | 0.6 | % | $ | (1,079) | (5.8) | % | ||||||||||||||||||||||||||
| Interest expense | (18,628) | (0.5) | % | (6,207) | (0.2) | % | (12,421) | 200.1 | % | |||||||||||||||||||||||||||||
| Foreign currency exchange gain (loss) | (7,289) | (0.2) | % | 727 | — | % | (8,016) | (1,102.6) | % | |||||||||||||||||||||||||||||
| Other | (5,917) | (0.2) | % | (4,425) | (0.1) | % | (1,492) | 33.7 | % | |||||||||||||||||||||||||||||
| Interest and other, net | $ | (14,212) | (0.4) | % | $ | 8,796 | 0.3 | % | $ | (23,008) | (261.6) | % | ||||||||||||||||||||||||||
Interest and other, net was expense of $14.2 million for the fiscal year ended March 31, 2022, as compared to income of $8.8 million for the fiscal year ended March 31, 2021. The change was due primarily to (i) an increase in interest expense primarily related to an unsecured bridge loan facility related to our pending acquisition of Zynga with no corresponding expense in the prior year period (refer to Note 12 - Debt), (ii) lower interest income on our available-for-sale securities due to lower interest rates, and (iii) foreign currency losses in the current year period as compared to gains in the prior year period.
Gain/(loss) on long-term investments, net
Gain/(loss) on long-term investments, net for the fiscal year ended March 31, 2022 was a gain of $6.0 million compared to a gain of $39.6 million in the prior year period. The decrease was due primarily to the sale of one of our investments in the prior year period (see Note 4 - Fair Value Measurements).
Provision for income taxes
Our income tax expense was $47.4 million for the fiscal year ended March 31, 2022 as compared to $88.9 million for the fiscal year ended March 31, 2021.
When compared to the statutory rate of 21%, the effective tax rate of 10.2% for the fiscal year ended March 31, 2022 was due primarily to a $30.9 million benefit from tax credits anticipated to be utilized, $14.6 million in excess tax benefits from employee stock compensation, an $11.6 million benefit due to an increase to the net deferred tax asset that arose from a step up in tax basis related to the Federal Act on Tax Reform and AVH (Old-Age and Survivors Insurance) Financing ("TRAF") enacted in Switzerland, discussed below, and an $8.0 million benefit from our geographic mix of earnings, partially offset by a $10.1 million nondeductible expense due to an increase in fair value of the contingent consideration liability associated with the acquisition of Nordeus.
When compared to the statutory rate of 21%, the effective tax rate of 13.1% for the fiscal year ended March 31, 2021 was primarily due to a $29.1 million tax benefit from tax credits anticipated to be utilized, a $21.4 million tax benefit from our geographic mix of earnings and $13.7 million in excess tax benefits from employee stock compensation.
The effective tax rate in the current year was lower compared to the prior year primarily due an increased benefit to the net deferred tax asset related to TRAF, increased benefits from tax credits and excess tax benefits from employee stock compensation partially offset by a nondeductible expense due to an increase in fair value of the contingent consideration liability associated with the acquisition of Nordeus.
The accounting for share-based compensation will increase or decrease our effective tax rate based upon the difference between our share-based compensation expense and the deductions taken on our tax return, which depends on the stock price at the time of the employee award vesting.
We anticipate that additional excess tax benefits or shortfalls from employee stock compensation, tax credits, and changes in our geographic mix of earnings could have a significant impact on our effective tax rate in the future. In addition, we are regularly examined by domestic and foreign taxing authorities. Examinations may result in tax assessments in excess of amounts claimed and the payment of additional taxes. We believe our tax positions comply with applicable tax law, and that we have adequately provided for reasonably foreseeable tax assessments. It is possible that settlement of audits or the expiration of the statute of limitations could have an impact on our effective tax rate in future periods.
The Tax Cuts and Jobs Act of 2017 (“TCJA”) requires taxpayers to capitalize and amortize research and development costs pursuant to Internal Revenue Code ("IRC") Section 174. Although Congress is considering legislation that would defer the capitalization and amortization requirement to later years, we have no assurance that the requirement will be repealed or
36
otherwise modified. The requirement is effective for the Company for fiscal year 2023, beginning April 1, 2022. It is possible that this change could have a significant adverse impact on our effective tax rate, tax payments, and financial condition in future periods.
On March 11, 2021, the American Rescue Plan Act of 2021 (the “ARPA”) was enacted. The ARPA, among other things, includes provisions to expand the IRC Section 162(m) disallowance for deduction of certain compensation paid by publicly held corporations. Effective for tax years starting after December 31, 2026 (April 1, 2027 for the Company), the ARPA expands the limitation to cover the next five most highly compensated employees. The ARPA did not have a material impact on our Consolidated Financial Statements for the fiscal year ended March 31, 2022. We continue to evaluate the potential impact the ARPA may have on our operations and Consolidated Financial Statements in future periods.
On March 27, 2020, the U.S. enacted the Coronavirus Aid, Relief and Economic Security Act (the "CARES Act"), which provides numerous tax and other stimulus measures that generally support the U.S. economy. The CARES Act did not have a material impact on our Consolidated Financial Statements.
On May 19, 2019, a public referendum held in Switzerland approved the TRAF, which was effective for us on January 1, 2020. The TRAF abolished preferential tax regimes for holding companies, domicile companies, and mixed companies at the cantonal level. The TRAF allows the cantons to establish transition rules, the implementation of which may be subject to a ruling from the canton. On March 31, 2020, we recorded a deferred tax asset of $45.3 million offset by a valuation allowance of $33.4 million arising from the Swiss cantonal tax basis step-up. For the fiscal year ended March 31, 2022, we recorded a net tax benefits of $11.6 million due to an increase in the deferred tax asset of $13.2 million offset by an increase in the valuation allowance of $1.6 million, as it is more-likely-than-not that such deferred tax assets would be realized.
As of March 31, 2022, we had gross unrecognized tax benefits, including interest and penalties, of $176.0 million, of which $65.8 million would affect our effective tax rate if realized. For the fiscal year ended March 31, 2022, gross unrecognized tax benefits increased by $8.5 million.
We are no longer subject to audit for U.S. federal income tax returns for periods prior to our fiscal year ended March 31, 2019 and state income tax returns for periods prior to the fiscal year ended March 31, 2018. With few exceptions, we are no longer subject to income tax examinations in non-U.S. jurisdictions for years prior to fiscal year ended March 31, 2016. Certain taxing authorities are currently examining our income tax returns for the fiscal years ended March 31, 2015 through March 31, 2019.
Net income and earnings per share
For the fiscal year ended March 31, 2022, our net income was $418.0 million, as compared to $588.9 million in the prior year. Diluted earnings per share for the fiscal year ended March 31, 2022 was $3.58, as compared to $5.09 for the fiscal year ended March 31, 2021. Diluted weighted average shares outstanding of 116.8 million were 1.0 million higher due primarily to normal stock compensation activity, including vests as well as grants and forfeitures in the prior year being fully outstanding in the current year.
Liquidity and Capital Resources
Our primary cash requirements have been to fund (i) the development, manufacturing and marketing of our published products, (ii) working capital, (iii) acquisitions and (iv) capital expenditures. We expect to rely on cash and cash equivalents as well as on short-term investments, funds provided by our operating activities, and our Credit Agreement to satisfy our working capital needs.
Short-term Investments
As of March 31, 2022, we had $820.1 million of short-term investments, which are highly liquid in nature and represent an investment of cash that is available for current operations. From time to time, we may purchase additional short-term investments depending on future market conditions and liquidity needs. As of March 31, 2022, based on the composition of our investment portfolio and actions taken in recent years by central banks around the world to cut interest rates, including the U.S. Federal Reserve, in response to the COVID-19 pandemic and related adverse economic conditions, we anticipate investment yields to remain low, which would lower our future interest income. Such impact is not expected to be material to our liquidity.
Credit Agreement
On February 8, 2019, we entered into an unsecured Credit Agreement (the “Credit Agreement”), and on June 28, 2021, we amended our unsecured Credit Agreement solely to increase the commitments under the facility by $50 million (as amended, the “Credit Agreement”) that runs through February 8, 2024. The Credit Agreement provides for an unsecured five-
37
year revolving credit facility with commitments of $250 million, including sublimits for (i) the issuance of letters of credit in an aggregate face amount of up to $25 million and (ii) borrowings and letters of credit denominated in Pounds Sterling, Euros, and Canadian Dollars in an aggregate principal amount of up to $25 million. In addition, the Credit Agreement contains uncommitted incremental capacity permitting the incurrence of up to an additional $200 million in term loans or revolving credit facilities.
Loans under the Credit Agreement will bear interest at a rate of (a) 0.250% to 0.750% above a certain base rate (3.50% at March 31, 2022) or (b) 1.125% to 1.750% above LIBOR (approximately 0.45% at March 31, 2022), which rates are determined by reference to our consolidated total net leverage ratio. The LIBOR benchmark rate is expected to be phased out by the end of June 2023. We do not expect that the discontinuation of the LIBOR rate will have a material impact on our liquidity or results of operations.
As of March 31, 2022, there was $247.5 million available to borrow under the Credit Agreement and we had $2.5 million of letters of credit outstanding. At March 31, 2022, we had no outstanding borrowings under the Credit Agreement.
The Credit Agreement also includes, among other terms and conditions, maximum leverage ratio, minimum cash reserves and, in certain circumstances, minimum interest coverage ratio financial covenants, as well as limitations on the Company’s and each of its subsidiaries’ ability to create, incur, assume or be liable for indebtedness; dispose of assets outside the ordinary course; acquire, merge or consolidate with or into another person or entity; create, incur or allow any lien on any of its property; make investments; or pay dividends or make distributions, in each case subject to certain exceptions. In addition, the Credit Agreement provides for certain events of default such as nonpayment of principal and interest when due thereunder, breaches of representations and warranties, noncompliance with covenants, acts of insolvency and default on indebtedness held by third parties (subject to certain limitations and cure periods).
Financial Condition
We are subject to credit risks, particularly if any of our receivables represent a limited number of customers or are concentrated in foreign markets. If we are unable to collect our accounts receivable as they become due, it could adversely affect our liquidity and working capital position.
Generally, we have been able to collect our accounts receivable in the ordinary course of business. We do not hold any collateral to secure payment from customers. We have trade credit insurance on the majority of customers who sell our physical products to mitigate accounts receivable risk.
A majority of our trade receivables are derived from sales to major retailers, including digital storefronts and platform partners, and distributors. Our five largest customers accounted for 79.0%, 78.4%, and 71.5% of net revenue during the fiscal years ended March 31, 2022, 2021, and 2020, respectively. As of March 31, 2022 and 2021, five customers accounted for 72.8% and 77.6% of our gross accounts receivable, respectively. Customers that individually accounted for more than 10% of our gross accounts receivable balance comprised 63.8% and 48.8% of such balances at March 31, 2022 and 2021, respectively. We had two customers who accounted for 43.5% and 20.3% of our gross accounts receivable as of March 31, 2022 and two customers who accounted for 50.4%, and 18.8% of our gross accounts receivable as of March 31, 2021. We did not have any additional customers that exceeded 10% of our gross accounts receivable as of March 31, 2022 and 2021. Based upon performing ongoing credit evaluations, maintaining trade credit insurance on a majority of our customers who sell our physical products and our past collection experience, we believe that the receivable balances from these largest customers do not represent a significant credit risk, although we actively monitor each customer's creditworthiness and economic conditions that may affect our customers' business and access to capital. We are monitoring the current global economic conditions, including credit markets and other factors as it relates to our customers in order to manage the risk of uncollectible accounts receivable, including as a result of the COVID-19 pandemic.
We believe that our current cash and cash equivalents, short-term investments, and projected cash flow from operations, along with availability under our Credit Agreement will provide us with sufficient liquidity to satisfy our cash requirements for working capital, capital expenditures, and commitments on both a short-term and long-term basis. Our liquidity and capital resources have not been materially affected by the COVID-19 pandemic and related volatility and slowdown in the global financial markets to date. For further discussion regarding the potential future impacts of the COVID-19 pandemic and related economic conditions on our business, refer to Item 1A, Risk Factors.
As of March 31, 2022, the amount of cash and cash equivalents held outside of the U.S. by our foreign subsidiaries was $657.2 million. These balances are dispersed across various locations around the world. We believe that such dispersion meets the business and liquidity needs of our foreign affiliates. In addition, we expect to have the ability to generate sufficient cash domestically to support ongoing operations for the foreseeable future.
38
On January 9, 2022, we entered into a definitive merger agreement to acquire Zynga Inc. ("Zynga"), a leading developer of mobile games. Under the terms and subject to the conditions of the merger agreement, Zynga stockholders will receive $3.50 in cash and a number of shares of our common stock equal to the exchange ratio for each share of Zynga common stock outstanding at the closing. The transaction is valued at $9.86 per share of Zynga common stock based on the market closing as of January 7, 2022, implying an enterprise value of $12.7 billion. The transaction includes a collar mechanism on the equity consideration, so that if the volume weighted average price ("VWAP") of Take-Two common stock on the Nasdaq Global Select Market for the consecutive period beginning at 9:30 a.m. New York time on the twenty-third trading day immediately preceding the closing date of the transaction and concluding at 4:00 p.m. New York time on the third trading day preceding such closing date is in a range from $156.50 to $181.88, the exchange ratio would be adjusted to deliver total consideration of $9.86 per Zynga share. If the VWAP of our common stock for the period noted in the prior sentence exceeds the higher end of that range the exchange ratio would be 0.0350 per share, and, if the VWAP is below the lower end of that range, the exchange ratio would be 0.0406 per share.
The transaction, which is currently anticipated to close on Monday, May 23, 2022, is subject to approval by Take-Two and Zynga stockholders and the satisfaction of the other customary closing conditions.
In connection with the transaction, on April 14, 2022, we terminated our Bridge Loan and completed our offering and sale of $2.7 billion aggregate principal amount of our senior notes, consisting of $1.0 billion principal amount of our 3.300% Senior Notes due 2024 (the “2024 Notes”), $600 million principal amount of our 3.550% Senior Notes due 2025 (the “2025 Notes”), $600 million principal amount of our 3.700% Senior Notes due 2027 (the “2027 Notes”) and $500 million principal amount of our 4.000% Senior Notes due 2032 (the “2032 Notes” and, together with the 2024 Notes, the 2025 Notes and the 2027 Notes, the “Notes”).The Notes were issued under an indenture between the Company and The Bank of New York Mellon, as trustee (the “Trustee”).
The Notes are the Company’s senior unsecured obligations and rank equally with all of our other existing and future unsubordinated obligations. The 2024 Notes mature on March 28, 2024 and bear interest at an annual rate of 3.300%. The 2025 Notes mature on April 14, 2025 and bear interest at an annual rate of 3.550%. The 2027 Notes mature on April 14, 2027 and bear interest at an annual rate of 3.700%. The 2032 Notes mature on April 14, 2032 and bear interest at an annual rate of 4.000%. We will pay interest on the 2024 Notes semiannually on March 28 and September 28 of each year, commencing September 28, 2022. We will pay interest on each of the 2025 Notes, 2027 Notes and 2032 Notes semi-annually on April 14 and October 14 of each year, commencing October 14, 2022.
Our Board of Directors has authorized the repurchase of up to 21.7 million shares of our common stock. Under this program, we may purchase shares from time to time through a variety of methods, including in the open market or through privately negotiated transactions, in accordance with applicable securities laws. Repurchases are subject to the availability of stock, prevailing market conditions, the trading price of the stock, our financial performance and other conditions. The program does not require us to repurchase shares and may be suspended or discontinued at any time for any reason.
During the fiscal years ended March 31, 2022, 2021, and 2020, we repurchased 1.3 million, zero, and zero shares of our common stock, respectively, in the open market for $200 million, $0.0 million, and $0.0 million, respectively, including commissions as part of the program. As of March 31, 2022, we had repurchased a total of 11.7 million shares of our common stock under the program, and 10.0 million shares of our common stock remained available for repurchase under the share repurchase program.
Our changes in cash flows were as follows:
| Fiscal Year Ended March 31, | ||||||||||||||||||||
| (thousands of dollars) | 2022 | 2021 | 2020 | |||||||||||||||||
| Net cash provided by operating activities | $ | 257,984 | $ | 912,318 | $ | 685,678 | ||||||||||||||
| Net cash provided by (used in) investing activities | 139,216 | (806,724) | 4,049 | |||||||||||||||||
| Net cash used in financing activities | (256,813) | (57,338) | (77,453) | |||||||||||||||||
| Effects of foreign currency exchange rates on cash, cash equivalents, and restricted cash and cash equivalents | (5,303) | 18,599 | (10,868) | |||||||||||||||||
| Net change in cash, cash equivalents, and restricted cash and cash equivalents | $ | 135,084 | $ | 66,855 | $ | 601,406 | ||||||||||||||
At March 31, 2022, we had $2,195.3 million of Cash, cash equivalents, and restricted cash and cash equivalents, compared to $2,060.2 million at March 31, 2021. The increase in Cash, cash equivalents, and restricted cash and cash equivalents from March 31, 2021 was due primarily to (i) Net cash provided by operating activities from sales primarily from the previously mentioned titles, partially offset by investments in software development and licenses as well as royalty payments and (ii) Net cash provided by investing activities primarily related to net proceeds from available for sale securities
39
changes in bank time deposits, partially offset primarily by our acquisition of Nordeus (refer to Note 22 - Acquisitions), and purchases of fixed assets including our acquisition of two office buildings in the U.K. (refer to Note 22 - Acquisitions). This net increase was partially offset by Net cash used in financing activities, which was primarily related to repurchase of our common stock and tax payments related to net share settlements of our restricted stock.
Commitments
Refer to Note 15 - Commitments and Contingencies to our Consolidated Financial Statements for disclosures regarding our commitments.
Capital Expenditures
In fiscal year 2023, we anticipate capital expenditures to be $120 million.
Off-Balance Sheet Arrangements
As of March 31, 2022 and 2021, we did not have any material relationships with unconsolidated entities or financial parties, such as entities often referred to as structured finance or variable interest entities, which would have been established for the purpose of facilitating off-balance sheet arrangements or other contractually narrow or limited purposes. As such, we are not exposed to any financing, liquidity, market or credit risk that could arise if we had engaged in such relationships.
International Operations
Net revenue earned outside of the United States is principally generated by our operations in Europe, Asia, Australia, Canada and Latin America. For the fiscal years ended March 31, 2022, 2021 and 2020, 40.1%, 40.2% and 42.5%, respectively, of our net revenue was earned outside the United States. We are subject to risks inherent in foreign trade, including increased credit risks, tariffs and duties, fluctuations in foreign currency exchange rates, shipping delays and international political, regulatory and economic developments, all of which can have a significant effect on our operating results.
Fluctuations in Quarterly Operating Results and Seasonality
We have experienced fluctuations in quarterly and annual operating results as a result of the timing of the introduction of new titles, variations in sales of titles developed for particular platforms, market acceptance of our titles, development and promotional expenses relating to the introduction of new titles, sequels or enhancements of existing titles, projected and actual changes in platforms, the timing and success of title introductions by our competitors, product returns, changes in pricing policies by us and our competitors, the accuracy of retailers' forecasts of consumer demand, the size and timing of acquisitions, the timing of orders from major customers, and order cancellations and delays in product shipment. Sales of our full game products are also seasonal, with peak demand typically occurring in the fourth calendar quarter during the holiday season. For certain of our software products with multiple performance obligations, we defer the recognition of our net revenue over an estimated service period which generally ranges from six to fifteen months. As a result, the quarter in which we generate the highest Net Bookings may be different from the quarter in which we recognize the highest amount of Net revenue. Quarterly comparisons of operating results are not necessarily indicative of future operating results.
Item 7A. Quantitative and Qualitative Disclosures About Market Risk
Market risk is the potential loss arising from fluctuations in market rates and prices. Our market risk exposures primarily include fluctuations in interest rates and foreign currency exchange rates.
Interest Rate Risk
Our exposure to fluctuations in interest rates relates primarily to our short-term investment portfolio and variable rate debt under the Credit Agreement.
We seek to manage our interest rate risk by maintaining a short-term investment portfolio that includes corporate bonds with high credit quality and maturities less than two years. Since short-term investments mature relatively quickly and can be reinvested at the then-current market rates, interest income on a portfolio consisting of short-term securities is more subject to market fluctuations than a portfolio of longer-term maturities. However, the fair value of a short-term portfolio is less sensitive to market fluctuations than a portfolio of longer-term securities. We do not currently use derivative financial instruments in our short-term investment portfolio. Our investments are held for purposes other than trading.
As of March 31, 2022, we had $820.1 million of short-term investments, which included $688.3 million of available-for-sale securities. The available-for-sale securities were recorded at fair market value with unrealized gains or losses resulting from changes in fair value reported as a separate component of Accumulated other comprehensive income (loss), net of tax, in Stockholders' equity. We also had $1,732.0 million of cash and cash equivalents that are comprised primarily of money market
40
funds and bank-time deposits. We determined that, based on the composition of our investment portfolio, there was no material interest rate risk exposure to our Consolidated Financial Statements or liquidity as of March 31, 2022.
Historically, fluctuations in interest rates have not had a significant effect on our operating results. Under our Credit Agreement, loans will bear interest at our election of (a) 0.250% to 0.750% above a certain base rate (3.50% at March 31, 2022) or (b) 1.125% to 1.750% above the LIBOR (approximately 0.45% at March 31, 2022), with the margin rate subject to the achievement of certain average liquidity levels. Changes in market rates may affect our future interest expense if there is an outstanding balance on our line of credit. At March 31, 2022, there were no outstanding borrowings under our Credit Agreement.
Foreign Currency Exchange Rate Risk
We transact business in foreign currencies and are exposed to risks resulting from fluctuations in foreign currency exchange rates. Accounts relating to foreign operations are translated into U.S. dollars using prevailing exchange rates at the relevant period end. Translation adjustments are included as a separate component of stockholders' equity on our Consolidated Balance Sheets. For the fiscal years ended March 31, 2022 and 2021, our foreign currency translation adjustment was a loss of $43.6 million and a gain of $51.3 million, respectively. We recognized a foreign currency exchange transaction loss of $7.3 million, a gain of $0.7 million, and a loss of $3.6 million for the fiscal years ended March 31, 2022, 2021, and 2020, respectively, in Interest and other, net in our Consolidated Statements of Operations.
Balance Sheet Hedging Activities
We use foreign currency forward contracts to mitigate foreign currency exchange rate risk associated with non-functional currency denominated cash balances and intercompany funding loans, non-functional currency denominated accounts receivable and non-functional currency denominated accounts payable. These transactions are not designated as hedging instruments and are accounted for as derivatives whereby the fair value of the contracts is reported as either assets or liabilities on our Consolidated Balance Sheets, and gains and losses resulting from changes in the fair value are reported in Interest and other, net, in our Consolidated Statements of Operations. We do not enter into derivative financial contracts for speculative or trading purposes. At March 31, 2022, we had $75.8 million of forward contracts outstanding to buy foreign currencies in exchange for U.S. dollars and $132.8 million of forward contracts outstanding to sell foreign currencies in exchange for U.S. dollars all of which have maturities of less than one year. At March 31, 2021, we had $92.1 million of forward contracts outstanding to buy foreign currencies in exchange for U.S. dollars and $140.5 million of forward contracts outstanding to sell foreign currencies in exchange for U.S. dollars all of which have maturities of less than one year. For the fiscal years ended March 31, 2022, 2021 and 2020, we recorded a gain of $5.9 million, a loss of $3.6 million, and a loss of $1.0 million, respectively, related to foreign currency forward contracts in Interest and other, net on our Consolidated Statements of Operations. As of March 31, 2022 and 2021, the fair value of these outstanding forward contracts was a loss of $0.2 million and a loss $0.1 million, respectively, and is included in accrued and other current liabilities. The fair value of these outstanding forward contracts is estimated based on the prevailing exchange rates of the various hedged currencies as of the end of the period.
Our hedging programs are designed to reduce, but do not entirely eliminate, the effect of currency exchange rate movements. We believe that the counterparties to these foreign currency forward contracts are creditworthy multinational commercial banks and that the risk of counterparty nonperformance is not material. Notwithstanding our efforts to mitigate some foreign currency exchange rate risks, there can be no assurance that our hedging activities will adequately protect us against the risks associated with foreign currency fluctuations, which may be more volatile as a result of the COVID-19 pandemic. For the fiscal year ended March 31, 2022, 40.1% of our revenue was generated outside the United States. Using sensitivity analysis, a hypothetical 10% increase in the value of the U.S. dollar against all currencies would decrease revenue by 4.0%, while a hypothetical 10% decrease in the value of the U.S. dollar against all currencies would increase revenue by 4.0%. In our opinion, a substantial portion of this fluctuation would be offset by cost of goods sold and operating expenses incurred in local currency.
Item 8. Financial Statements and Supplementary Data
The financial statements and supplementary data appear in a separate section of this Form 10-K following Part IV. We provide details of our valuation and qualifying accounts in Note 21 - Supplementary Financial Information to our Consolidated Financial Statements. All schedules have been omitted since the information required to be submitted has been included on our Consolidated Financial Statements or notes thereto or has been omitted as not applicable or not required.
Item 9. Changes in and Disagreements with Accountants on Accounting and Financial Disclosure
None.
41
Item 9A. Controls and Procedures
Definition and Limitations of Disclosure Controls and Procedures
Our disclosure controls and procedures (as defined in Rules 13a-15(e) and 15d-15(e) under the Securities Exchange Act of 1934, as amended (the "Exchange Act")) are designed to reasonably ensure that information required to be disclosed in our reports filed under the Exchange Act is (i) recorded, processed, summarized, and reported within the time periods specified in the Securities and Exchange Commission's rules and forms and (ii) accumulated and communicated to management, including our principal executive officer and principal financial officer, as appropriate, to allow timely decisions regarding required disclosures.
There are inherent limitations to the effectiveness of any system of disclosure controls and procedures. These limitations include the possibility of human error, the circumvention or overriding of the controls and procedures and reasonable resource constraints. In addition, because we have designed our system of controls based on certain assumptions, which we believe are reasonable, about the likelihood of future events, our system of controls may not achieve its desired purpose under all possible future conditions. Accordingly, our disclosure controls and procedures provide reasonable assurance, but not absolute assurance, of achieving their objectives.
Evaluation of Disclosure Controls and Procedures
Our management, with the participation of our principal executive officer and principal financial officer, has evaluated the effectiveness of our disclosure controls and procedures at March 31, 2022, the end of the period covered by this report. Based on this evaluation, the principal executive officer and principal financial officer concluded that, at March 31, 2022, our disclosure controls and procedures were effective to provide reasonable assurance that information required to be disclosed by us in the reports that we file or submit under the Exchange Act is (i) recorded, processed, summarized, and reported on a timely basis, and (ii) accumulated and communicated to management, including our principal executive officer and principal financial officer, as appropriate to allow timely decisions regarding required disclosures.
Management's Report on Internal Control Over Financial Reporting
Our management is responsible for establishing and maintaining adequate internal control over financial reporting (as defined in Rule 13a-15(f) under the Exchange Act). Management conducted an evaluation of the effectiveness of our internal control over financial reporting based on the criteria set forth in Internal Control—Integrated Framework issued by the Committee of Sponsoring Organizations of the Treadway Commission 2013 framework ("COSO"). Based on this evaluation, management has concluded that our internal control over financial reporting was effective as of March 31, 2022.
In accordance with SEC guidance, our management’s assessment of and conclusion on the effectiveness of internal control over financial reporting did not include the internal controls of Nordeus, which we acquired in June 2021 and is included in the March 31, 2022 Consolidated Financial Statements and constituted 5.6% of consolidated total assets as of March 31, 2022.
Our independent registered public accounting firm, Ernst & Young LLP, has issued an audit report on our internal control over financial reporting, which is included in this Form 10-K.
Changes in Internal Control Over Financial Reporting
There were no changes in our internal control over financial reporting during the fiscal quarter ended March 31, 2022, which were identified in connection with management's evaluation required by paragraph (d) of Rules 13a-15 and 15d-15 under the Exchange Act, that have materially affected, or are reasonably likely to materially affect, our internal control over financial reporting. We have not experienced any material impact to our internal controls over financial reporting despite the fact that most of our employees are working remotely due to the COVID-19 pandemic. We are continually monitoring and assessing the effect of the COVID-19 situation on our internal controls to minimize the impact on their design and operating effectiveness.
On June 1, 2021, we acquired Nordeus. We are currently in the process of incorporating the internal controls and procedures of Nordeus into our internal control over financial reporting for purposes of our assessment of and report on internal control over financial reporting for the fiscal year ending March 31, 2023.
Item 9B. Other Information
None.
42
PART III
Item 10. Directors, Executive Officers and Corporate Governance
The information required by this Item is incorporated herein by reference to the sections entitled "Proposal 1—Election of Directors" and "Executive Compensation—Section 16(a) Beneficial Ownership Reporting Compliance" in our definitive Proxy Statement (the "Proxy Statement") for the Annual Meeting of Stockholders to be held in 2022. We intend to file the Proxy Statement within 120 days after the end of the fiscal year (i.e. on or before July 29, 2022). Our Code of Business Conduct and Ethics applicable to our directors and all employees, including senior financial officers, is available on our website at www.take2games.com. If we make any amendment to our Code of Business Conduct and Ethics that is required to be disclosed pursuant to the Exchange Act, we will make such disclosures on our website.
Item 11. Executive Compensation
The information required by this Item is incorporated herein by reference to the section entitled "Executive Compensation" in our Proxy Statement.
Item 12. Security Ownership of Certain Beneficial Owners and Management and Related Stockholder Matters
The information required by this Item is incorporated herein by reference to the sections entitled "Voting Security Ownership of Certain Beneficial Owners and Management" and "Equity Compensation Plan Information" in our Proxy Statement.
Item 13. Certain Relationships and Related Transactions, and Director Independence
The information required by this Item is incorporated herein by reference to the section entitled "Certain Relationships and Related Transactions" in our Proxy Statement.
Item 14. Principal Accounting Fees and Services
The information required by this Item is incorporated herein by reference to the section entitled "Independent Auditor Fee Information" in our Proxy Statement.
43
PART IV
Item 15. Exhibits, Financial Statement Schedules
(a)The following documents are filed as part of this Report:
(ii)Financial Statement Schedule. See Note 21 - Supplementary Financial Information to our Consolidated Financial Statements.
Index to Exhibits:
| Incorporated by Reference | ||||||||||||||||||||||||||||||||
| Exhibit Number | Exhibit Description | Form | Filing Date | Exhibit | Filed Herewith | |||||||||||||||||||||||||||
| 1.1 | 8-K | 4/13/2022 | 1.1 | |||||||||||||||||||||||||||||
| 2.1 | 8-K | 1/10/2022 | 2.1 | |||||||||||||||||||||||||||||
| 2.2 | S-4 | 3/14/2022 | 2.2 | |||||||||||||||||||||||||||||
| 2.3 | 8-K | 5/5/2022 | 2.1 | |||||||||||||||||||||||||||||
| 2.4 | S-4 | 3/14/2022 | 2.3 | |||||||||||||||||||||||||||||
| 2.5 | S-4 | 3/14/2022 | 2.4 | |||||||||||||||||||||||||||||
| 2.6 | S-4 | 3/14/2022 | 2.5 | |||||||||||||||||||||||||||||
| 3.1 | 10-K | 2/12/2004 | 3.1 | |||||||||||||||||||||||||||||
| 3.1.1 | 10-K | 2/12/2004 | 3.1.2 | |||||||||||||||||||||||||||||
| 3.1.2 | 10-K | 2/12/2004 | 3.1.3 | |||||||||||||||||||||||||||||
| 3.1.3 | 8-K | 4/23/2009 | 3.1 | |||||||||||||||||||||||||||||
| 3.1.4 | 8-K | 9/24/2012 | 3.1 | |||||||||||||||||||||||||||||
| 3.2 | 10-K | 2/12/2004 | 3.1.1 | |||||||||||||||||||||||||||||
| 3.3 | 8-A12B | 3/26/2008 | 4.2 | |||||||||||||||||||||||||||||
| 3.4 | 8-K | 1/10/2022 | 3.1 | |||||||||||||||||||||||||||||
| 4.1 | 10-K | 5/22/2020 | 4.1 | |||||||||||||||||||||||||||||
| 4.2 | 8-K | 4/14/2022 | 4.1 | |||||||||||||||||||||||||||||
| 4.3 | 8-K | 4/14/2022 | 4.2 | |||||||||||||||||||||||||||||
44
| Incorporated by Reference | ||||||||||||||||||||||||||||||||
| Exhibit Number | Exhibit Description | Form | Filing Date | Exhibit | Filed Herewith | |||||||||||||||||||||||||||
| 4.4 | 8-K | 4/14/2022 | 4.3 | |||||||||||||||||||||||||||||
| 4.5 | 8-K | 4/14/2022 | 4.4 | |||||||||||||||||||||||||||||
| 4.6 | 8-K | 4/14/2022 | 4.5 | |||||||||||||||||||||||||||||
| 4.7 | 8-K | 4/14/2022 | 4.6 | |||||||||||||||||||||||||||||
| 4.8 | 8-K | 4/14/2022 | 4.7 | |||||||||||||||||||||||||||||
| 4.9 | 8-K | 4/14/2022 | 4.8 | |||||||||||||||||||||||||||||
| 4.10 | 8-K | 4/14/2022 | 4.9 | |||||||||||||||||||||||||||||
| 10.1 | 8-K | 3/7/2008 | 10.1 | |||||||||||||||||||||||||||||
| 10.2 | 14A | 7/28/2016 | Annex A | |||||||||||||||||||||||||||||
| 10.3 | 10-Q | 6/5/2009 | 10.2 | |||||||||||||||||||||||||||||
| 10.4 | 10-Q | 6/5/2009 | 10.3 | |||||||||||||||||||||||||||||
| 10.5 | 10-Q | 8/1/2012 | 10.1 | |||||||||||||||||||||||||||||
| 10.6 | 10-Q | 10/30/2013 | 10.1 | |||||||||||||||||||||||||||||
| 10.7 | 10-Q | 10/30/2013 | 10.2 | |||||||||||||||||||||||||||||
| 10.8 | 10-Q | 10/30/2013 | 10.3 | |||||||||||||||||||||||||||||
| 10.9 | 10-Q | 10/30/2013 | 10.4 | |||||||||||||||||||||||||||||
| 10.10 | 10-Q | 10/30/2013 | 10.5 | |||||||||||||||||||||||||||||
| 10.11 | 14A | 7/27/2021 | Annex B | |||||||||||||||||||||||||||||
| 10.12 | S-8 | 9/4/2020 | 99.2 | |||||||||||||||||||||||||||||
| 10.13 | 14A | 7/27/2017 | Annex C | |||||||||||||||||||||||||||||
| 10.14 | 10-K | 5/14/2019 | 10.13 | |||||||||||||||||||||||||||||
| 10.15 | 10-Q | 11/8/2017 | 10.4 | |||||||||||||||||||||||||||||
| 10.16 | 10-Q | 11/8/2017 | 10.5 | |||||||||||||||||||||||||||||
| 10.17 | 10-Q | 11/8/2017 | 10.6 | |||||||||||||||||||||||||||||
45
| Incorporated by Reference | ||||||||||||||||||||||||||||||||
| Exhibit Number | Exhibit Description | Form | Filing Date | Exhibit | Filed Herewith | |||||||||||||||||||||||||||
| 10.18 | 10-Q | 11/8/2017 | 10.7 | |||||||||||||||||||||||||||||
| 10.19 | 8-K | 5/14/2010 | 10.1 | |||||||||||||||||||||||||||||
| 10.20 | 8-K | 10/25/2010 | 10.1 | |||||||||||||||||||||||||||||
| 10.21 | 10-Q | 10/31/2012 | 10.6 | |||||||||||||||||||||||||||||
| 10.22 | 10-Q | 8/3/2018 | 10.2 | |||||||||||||||||||||||||||||
| 10.23 | 8-K | 2/15/2008 | 10.3 | |||||||||||||||||||||||||||||
| 10.24 | 10-Q | 2/6/2015 | 10.1 | |||||||||||||||||||||||||||||
| 10.25 | 8-K | 11/22/2017 | 10.1 | |||||||||||||||||||||||||||||
| 10.26 | S-3 ASR | 4/13/2018 | 10.2 | |||||||||||||||||||||||||||||
| 10.27 | S-3 ASR | 4/15/2019 | 10.2 | |||||||||||||||||||||||||||||
| 10.28 | S-3 ASR | 4/13/2020 | 10.2 | |||||||||||||||||||||||||||||
| 10.29 | S-3 ASR | 4/13/2021 | 10.2 | |||||||||||||||||||||||||||||
| 10.30 | S-3 ASR | 4/13/2022 | 10.2 | |||||||||||||||||||||||||||||
| 10.31 | 8-K | 5/05/2022 | 10.1 | |||||||||||||||||||||||||||||
| 10.32 | 10-K | 5/14/2019 | 10.35 | |||||||||||||||||||||||||||||
| 10.33 | 10-Q | 8/3/2021 | 10.3 | |||||||||||||||||||||||||||||
| 10.34 | 10-Q | 11/8/2011 | 10.3 | |||||||||||||||||||||||||||||
| 10.35 | 10-Q | 6/5/2009 | 10.1 | |||||||||||||||||||||||||||||
46
| Incorporated by Reference | ||||||||||||||||||||||||||||||||
| Exhibit Number | Exhibit Description | Form | Filing Date | Exhibit | Filed Herewith | |||||||||||||||||||||||||||
| 10.36 | 10-Q | 2/3/2012 | 10.1 | |||||||||||||||||||||||||||||
| 10.37 | 10-Q | 2/6/2013 | 10.2 | |||||||||||||||||||||||||||||
| 10.38 | 10-Q | 2/4/2014 | 10.2 | |||||||||||||||||||||||||||||
| 10.39 | 10-Q | 10/30/2014 | 10.1 | |||||||||||||||||||||||||||||
| 10.40 | 10-Q | 2/8/2018 | 10.2 | |||||||||||||||||||||||||||||
| 10.41 | 10-Q | 11/6/2020 | 10.1 | |||||||||||||||||||||||||||||
| 10.42 | 10-K | 5/24/2017 | 10.48 | |||||||||||||||||||||||||||||
| 10.43 | 10-Q | 11/6/2020 | 10.4 | |||||||||||||||||||||||||||||
| 10.44 | 10-Q | 9/16/2002 | 10.2 | |||||||||||||||||||||||||||||
| 10.45 | 10-K | 5/23/2012 | 10.45 | |||||||||||||||||||||||||||||
| 10.46 | 10-K | 5/14/2014 | 10.39 | |||||||||||||||||||||||||||||
| 10.47 | 10-K | 5/19/2016 | 10.47 | |||||||||||||||||||||||||||||
| 10.48 | 10-Q | 2/4/2016 | 10.1 | |||||||||||||||||||||||||||||
| 10.49 | 10-Q | 2/8/2017 | 10.1 | |||||||||||||||||||||||||||||
| 10.50 | 10-Q | 11/8/2018 | 10.1 | |||||||||||||||||||||||||||||
| 10.51 | 10-Q | 11/4/2021 | 10.1 | |||||||||||||||||||||||||||||
| 10.52 | 10-Q | 8/3/2021 | 10.2 | |||||||||||||||||||||||||||||
47
| Incorporated by Reference | ||||||||||||||||||||||||||||||||
| Exhibit Number | Exhibit Description | Form | Filing Date | Exhibit | Filed Herewith | |||||||||||||||||||||||||||
| 10.53 | S-4 | 3/14/2022 | 99.1 | |||||||||||||||||||||||||||||
| 21.1 | X | |||||||||||||||||||||||||||||||
| 23.1 | X | |||||||||||||||||||||||||||||||
| 31.1 | X | |||||||||||||||||||||||||||||||
| 31.2 | X | |||||||||||||||||||||||||||||||
| 32.1 | X | |||||||||||||||||||||||||||||||
| 32.2 | X | |||||||||||||||||||||||||||||||
| 101.INS | The Instance Document does not appear in the Interactive Data File because its XBRL tags are embedded within the Inline XBRL document. | X | ||||||||||||||||||||||||||||||
| 101.SCH | XBRL Taxonomy Extension Schema Document | X | ||||||||||||||||||||||||||||||
| 101.CAL | XBRL Taxonomy Calculation Linkbase Document | X | ||||||||||||||||||||||||||||||
| 101.LAB | XBRL Taxonomy Label Linkbase Document | X | ||||||||||||||||||||||||||||||
| 101.PRE | XBRL Taxonomy Presentation Linkbase Document | X | ||||||||||||||||||||||||||||||
| 101.DEF | XBRL Taxonomy Extension Definition Document | X | ||||||||||||||||||||||||||||||
| 104 | Cover Page Interactive Data File (formatted as Inline XBRL and contained in Exhibit 101) | X | ||||||||||||||||||||||||||||||
_______________________________________________________________________________
† Schedules have been omitted pursuant to Item 601(a)(5) of Regulation S-K. A copy of any omitted schedule will be furnished supplementally to the U.S. Securities and Exchange Commission upon request; provided, however, that the Company may request confidential treatment pursuant to Rule 24b-2 of the Exchange Act for any document so furnished.
+ Represents a management contract or compensatory plan or arrangement.
*Portions thereof were omitted and filed separately with the Securities and Exchange Commission pursuant to a request for confidential treatment that was granted in accordance with Exchange Act Rule 24b-2.
** Portions of this exhibit have been redacted in compliance with Regulation S-K Item 601(b)(10).
Attached as Exhibit 101 to this report are the following formatted in XBRL (Extensible Business Reporting Language): (i) Consolidated Balance Sheets at March 31, 2022 and 2021, (ii) Consolidated Statements of Operations for the fiscal years ended March 31, 2022, 2021 and 2020, (iii) Consolidated Statements of Comprehensive Income for the fiscal years ended March 31, 2022, 2021 and 2020, (iv) Consolidated Statements of Cash Flows for the fiscal years ended March 31, 2022, 2021 and 2020, (v) Consolidated Statements of Stockholders' Equity for the fiscal years ended March 31, 2022, 2021 and 2020, and (vi) Notes to the Consolidated Financial Statements.
Item 16. Form 10-K Summary
Not applicable.
48
TAKE-TWO INTERACTIVE SOFTWARE, INC.
FISCAL YEAR ENDED MARCH 31, 2022
INDEX TO FINANCIAL STATEMENTS
| Page | |||||
Reports of Independent Registered Public Accounting Firm ( | |||||
Consolidated Balance Sheets—At March 31, 2022 and 2021 | |||||
Consolidated Statements of Operations—For the fiscal years ended March 31, 2022, 2021 and 2020 | |||||
Consolidated Statements of Comprehensive Income—For the fiscal years ended March 31, 2022, 2021 and 2020 | |||||
Consolidated Statements of Cash Flows—For the fiscal years ended March 31, 2022, 2021 and 2020 | |||||
Consolidated Statements of Stockholders' Equity—For the fiscal years ended March 31, 2022, 2021 and 2020 | |||||
(All other items in this report are inapplicable)
49
Report of Independent Registered Public Accounting Firm
To the Stockholders and the Board of Directors of Take-Two Interactive Software, Inc.
Opinion on the Financial Statements
We have audited the accompanying consolidated balance sheets of Take-Two Interactive Software, Inc. (the Company) as of March 31, 2022 and 2021, the related consolidated statements of operations, comprehensive income, cash flows, and stockholders’ equity for each of the three years in the period ended March 31, 2022, and the related notes (collectively referred to as the “consolidated financial statements”). In our opinion, the consolidated financial statements present fairly, in all material respects, the financial position of the Company at March 31, 2022 and 2021, and the results of its operations and its cash flows for each of the three years in the period ended March 31, 2022, in conformity with U.S. generally accepted accounting principles.
We also have audited, in accordance with the standards of the Public Company Accounting Oversight Board (United States) (PCAOB), the Company's internal control over financial reporting as of March 31, 2022, based on criteria established in Internal Control-Integrated Framework issued by the Committee of Sponsoring Organizations of the Treadway Commission (2013 framework) and our report dated May 16, 2022 expressed an unqualified opinion thereon.
Basis for Opinion
These financial statements are the responsibility of the Company's management. Our responsibility is to express an opinion on the Company’s financial statements based on our audits. We are a public accounting firm registered with the PCAOB and are required to be independent with respect to the Company in accordance with the U.S. federal securities laws and the applicable rules and regulations of the Securities and Exchange Commission and the PCAOB.
We conducted our audits in accordance with the standards of the PCAOB. Those standards require that we plan and perform the audit to obtain reasonable assurance about whether the financial statements are free of material misstatement, whether due to error or fraud. Our audits included performing procedures to assess the risks of material misstatement of the financial statements, whether due to error or fraud, and performing procedures that respond to those risks. Such procedures included examining, on a test basis, evidence regarding the amounts and disclosures in the financial statements. Our audits also included evaluating the accounting principles used and significant estimates made by management, as well as evaluating the overall presentation of the financial statements. We believe that our audits provide a reasonable basis for our opinion.
Critical Audit Matters
The critical audit matters communicated below are matters arising from the current period audit of the financial statements that were communicated or required to be communicated to the audit committee and that: (1) relate to accounts or disclosures that are material to the financial statements and (2) involved our especially challenging, subjective, or complex judgments. The communication of critical audit matters does not alter in any way our opinion on the consolidated financial statements, taken as a whole, and we are not, by communicating the critical audit matters below, providing separate opinions on the critical audit matters or on the accounts or disclosures to which they relate.
50
| Revenue recognition | |||||
| Description of the Matter | As described in Note 1 to the consolidated financial statements, a significant portion of the Company’s revenue recognized is for full game software products that management must evaluate to determine whether such products sold have distinct and separable performance obligations. Such performance obligations can be licenses for intellectual property that provide a functional offline gaming experience or game related services. If multiple performance obligations are identified, management must estimate a standalone selling price for each identified performance obligation which is used to allocate the full game software product transaction price. Revenue for amounts allocated to offline functionality is recognized upon delivery of the product. Separately, revenue for amounts allocated to the game related services is recognized ratably over an estimated service period. Significant judgment is exercised by the Company in identifying performance obligations within its full game software products that should be accounted for separately in each revenue arrangement, estimating the standalone selling price for each performance obligation and determining the service period that should be utilized to recognize revenue over time. Auditing the identification of performance obligations for full game software products requires complex auditor judgment as each full game software product has unique features that management must evaluate to determine whether each feature should be accounted for separately. Auditing the judgments and estimates made by management in determining the standalone selling prices for each identified performance obligation is especially challenging as the Company typically does not have observable standalone selling prices for each performance obligation and must rely on an expected cost-plus margin methodology, taking into account relevant cost assumptions including estimates of post-release support. Similarly, auditing the estimated service period for the game related services is especially challenging as the Company must consider a variety of data points. Such data points include the weighted average number of days between players’ first and last days played online, known online trends, the service periods of the Company’s previously released products, and, to the extent publicly available, the service periods of the Company’s competitors’ products that are similar in nature. | ||||
| How We Addressed the Matter in Our Audit | We obtained an understanding, evaluated the design and tested the operating effectiveness of Company’s controls over the revenue recognition process. We selected a sample of transactions and tested the Company’s controls over evaluating and identifying performance obligations, determining the estimated standalone selling price and estimating the service period over which game related services revenue is recognized. Our audit procedures to test the Company’s identification of performance obligations included, among others, inspecting product-specific marketing materials for promised full game software product features, inspecting summaries of product features from Company personnel in product development roles, and independently evaluating the full game software product to corroborate identified product features on a sample basis. Our audit procedures to test the Company’s estimates of standalone selling price for performance obligations included, among others, testing the underlying data used in management’s calculations for completeness and accuracy as well as evaluating the reasonableness of significant assumptions and other factors utilized in making estimates of standalone selling price. For example, for a selection of full game software products which included multiple performance obligations, we tested the Company’s expected cost-plus margin analysis by testing the appropriateness of the assumptions used in the analysis, including product development costs and forecasted post-release support costs, marketing costs and licensing costs. Our audit procedures to test and evaluate the reasonableness of the Company’s estimated service period included, among others, testing the completeness and accuracy of management’s player data analysis, testing qualitative factors utilized such as reviewing online trends, comparing to similar or historical products and analyzing competitor information. | ||||
51
| Capitalized internally developed software costs | |||||
| Description of the Matter | As described in Note 1 to the consolidated financial statements, the Company capitalizes internally developed software costs, subsequent to establishing technological feasibility of a product. As noted in Note 8, the Company had approximately $658.5 million of capitalized internally developed software as of March 31, 2022. Auditing the Company’s determination of the establishment of technological feasibility was especially challenging because management’s determination of which products qualify and the related timing of capitalization requires significant judgment. | ||||
| How We Addressed the Matter in Our Audit | We obtained an understanding, evaluated the design and tested the operating effectiveness of controls over the internally developed software costs process. For example, we tested the control over management’s evaluation of products that established technological feasibility. To test the Company’s capitalization of internally developed software costs, we performed audit procedures that included, among others, inspecting underlying documentation to support management’s conclusion on the establishment of technological feasibility in accordance with the applicable accounting standards. This included inspecting the product’s technical and game design documentation. We also held corroborative inquiries of Company personnel in product development roles to assess the Company’s conclusions as to the technological feasibility of its products. | ||||
/s/ Ernst & Young LLP
We have served as the Company’s auditor since 2006.
New York, New York
May 16, 2022
52
REPORT OF INDEPENDENT REGISTERED PUBLIC ACCOUNTING FIRM
To the Stockholders and the Board of Directors of Take-Two Interactive Software, Inc.
Opinion on Internal Control Over Financial Reporting
We have audited Take-Two Interactive Software, Inc.'s (the Company) internal control over financial reporting as of March 31, 2022, based on criteria established in Internal Control—Integrated Framework issued by the Committee of Sponsoring Organizations of the Treadway Commission (2013 framework) (the COSO criteria). In our opinion, the Company maintained, in all material respects, effective internal control over financial reporting as of March 31, 2022, based on the COSO criteria.
As indicated in the accompanying Management’s Report on Internal Control Over Financial reporting, management’s assessment of and conclusion on the effectiveness of internal control over financial reporting did not include the internal controls of Nordeus Limited, which is included in the March 31, 2022 consolidated financial statements of the Company and constituted 5.6% of total assets as of March 31, 2022 and 1.5% of net revenue for the year then ended. Our audit of internal control over financial reporting of the Company also did not include an evaluation of the internal control over financial reporting of Nordeus Limited.
We also have audited, in accordance with the standards of the Public Company Accounting Oversight Board (United States) (PCAOB), the consolidated balance sheets of the Company as of March 31, 2022 and 2021, the related consolidated statements of operations, comprehensive income, cash flows and stockholders’ equity for each of the three years in the period ended March 31, 2022, and the related notes and our report dated May 16, 2022 expressed an unqualified opinion thereon.
Basis for Opinion
The Company’s management is responsible for maintaining effective internal control over financial reporting and for its assessment of the effectiveness of internal control over financial reporting included in the accompanying Management's Report on Internal Control Over Financial Reporting. Our responsibility is to express an opinion on the Company's internal control over financial reporting based on our audit. We are a public accounting firm registered with the PCAOB and are required to be independent with respect to the Company in accordance with the U.S. federal securities laws and the applicable rules and regulations of the Securities and Exchange Commission and the PCAOB.
We conducted our audit in accordance with the standards of the PCAOB. Those standards require that we plan and perform the audit to obtain reasonable assurance about whether effective internal control over financial reporting was maintained in all material respects.
Our audit included obtaining an understanding of internal control over financial reporting, assessing the risk that a material weakness exists, testing and evaluating the design and operating effectiveness of internal control based on the assessed risk and performing such other procedures as we considered necessary in the circumstances. We believe that our audit provides a reasonable basis for our opinion.
Definition and Limitations of Internal Control Over Financial Reporting
A company’s internal control over financial reporting is a process designed to provide reasonable assurance regarding the reliability of financial reporting and the preparation of financial statements for external purposes in accordance with generally accepted accounting principles. A company’s internal control over financial reporting includes those policies and procedures that (1) pertain to the maintenance of records that, in reasonable detail, accurately and fairly reflect the transactions and dispositions of the assets of the company; (2) provide reasonable assurance that transactions are recorded as necessary to permit preparation of financial statements in accordance with generally accepted accounting principles, and that receipts and expenditures of the company are being made only in accordance with authorizations of management and directors of the company; and (3) provide reasonable assurance regarding prevention or timely detection of unauthorized acquisition, use, or disposition of the company’s assets that could have a material effect on the financial statements.
Because of its inherent limitations, internal control over financial reporting may not prevent or detect misstatements. Also, projections of any evaluation of effectiveness to future periods are subject to the risk that controls may become inadequate because of changes in conditions, or that the degree of compliance with the policies or procedures may deteriorate.
/s/ Ernst & Young LLP
New York, New York
May 16, 2022
53
TAKE-TWO INTERACTIVE SOFTWARE, INC.
CONSOLIDATED BALANCE SHEETS
(in thousands, except per share amounts)
| March 31, | ||||||||||||||
| 2022 | 2021 | |||||||||||||
| ASSETS | ||||||||||||||
| Current assets: | ||||||||||||||
| Cash and cash equivalents | $ | $ | ||||||||||||
| Short-term investments | ||||||||||||||
| Restricted cash and cash equivalents | ||||||||||||||
Accounts receivable, net of allowances of $ | ||||||||||||||
| Inventory | ||||||||||||||
| Software development costs and licenses | ||||||||||||||
| Deferred cost of goods sold | ||||||||||||||
| Prepaid expenses and other | ||||||||||||||
| Total current assets | ||||||||||||||
| Fixed assets, net | ||||||||||||||
| Right-of-use assets | ||||||||||||||
| Software development costs and licenses, net of current portion | ||||||||||||||
| Goodwill | ||||||||||||||
| Other intangibles, net | ||||||||||||||
| Deferred tax assets | ||||||||||||||
| Long-term restricted cash and cash equivalents | ||||||||||||||
| Other assets | ||||||||||||||
| Total assets | $ | $ | ||||||||||||
| LIABILITIES AND STOCKHOLDERS' EQUITY | ||||||||||||||
| Current liabilities: | ||||||||||||||
| Accounts payable | $ | $ | ||||||||||||
| Accrued expenses and other current liabilities | ||||||||||||||
| Deferred revenue | ||||||||||||||
| Lease liabilities | ||||||||||||||
| Total current liabilities | ||||||||||||||
| Non-current deferred revenue | ||||||||||||||
| Non-current lease liabilities | ||||||||||||||
| Non-current software development royalties | ||||||||||||||
| Other long-term liabilities | ||||||||||||||
| Total liabilities | $ | $ | ||||||||||||
| Stockholders' equity: | ||||||||||||||
Preferred stock, $ | ||||||||||||||
Common stock, $ | ||||||||||||||
| Additional paid-in capital | ||||||||||||||
Treasury stock, at cost; | ( | ( | ||||||||||||
| Retained earnings | ||||||||||||||
| Accumulated other comprehensive loss | ( | ( | ||||||||||||
| Total stockholders' equity | $ | $ | ||||||||||||
| Total liabilities and stockholders' equity | $ | $ | ||||||||||||
See accompanying Notes.
54
TAKE-TWO INTERACTIVE SOFTWARE, INC.
CONSOLIDATED STATEMENTS OF OPERATIONS
(in thousands, except per share amounts)
| Fiscal Year Ended March 31, | ||||||||||||||||||||
| 2022 | 2021 | 2020 | ||||||||||||||||||
| Net revenue | $ | $ | $ | |||||||||||||||||
| Cost of goods sold | ||||||||||||||||||||
| Gross profit | ||||||||||||||||||||
| Selling and marketing | ||||||||||||||||||||
| General and administrative | ||||||||||||||||||||
| Research and development | ||||||||||||||||||||
| Depreciation and amortization | ||||||||||||||||||||
| Business reorganization | ( | |||||||||||||||||||
| Total operating expenses | ||||||||||||||||||||
| Income from operations | ||||||||||||||||||||
| Interest and other, net | ( | |||||||||||||||||||
| Gain (loss) on long-term investments, net | ( | |||||||||||||||||||
| Income before income taxes | ||||||||||||||||||||
| Provision for income taxes | ||||||||||||||||||||
| Net income | $ | $ | $ | |||||||||||||||||
| Earnings per share: | ||||||||||||||||||||
| Basic earnings per share | $ | $ | $ | |||||||||||||||||
| Diluted earnings per share | $ | $ | $ | |||||||||||||||||
See accompanying Notes.
55
TAKE-TWO INTERACTIVE SOFTWARE, INC.
CONSOLIDATED STATEMENTS OF COMPREHENSIVE INCOME
(in thousands)
| March 31, | ||||||||||||||||||||
| 2022 | 2021 | 2020 | ||||||||||||||||||
| Net income | $ | $ | $ | |||||||||||||||||
| Other comprehensive income (loss) | ||||||||||||||||||||
| Foreign currency translation adjustment | ( | ( | ||||||||||||||||||
| Cash flow hedges: | ||||||||||||||||||||
| Change in unrealized gains | ( | |||||||||||||||||||
| Reclassification to earnings | ( | ( | ||||||||||||||||||
| Tax effect on effective cash flow hedges | ||||||||||||||||||||
| Change in fair value of cash flow hedges | ( | |||||||||||||||||||
| Change in fair value of available-for-sale securities | ( | ( | ||||||||||||||||||
| Other comprehensive income (loss) | ( | ( | ||||||||||||||||||
| Comprehensive income | $ | $ | $ | |||||||||||||||||
See accompanying Notes.
56
TAKE-TWO INTERACTIVE SOFTWARE, INC.
CONSOLIDATED STATEMENTS OF CASH FLOWS
(in thousands)
| Fiscal Year Ended March 31, | ||||||||||||||||||||
| 2022 | 2021 | 2020 | ||||||||||||||||||
| Operating activities: | ||||||||||||||||||||
| Net income | $ | $ | $ | |||||||||||||||||
| Adjustments to reconcile net income to net cash provided by operating activities: | ||||||||||||||||||||
| Amortization and impairment of software development costs and licenses | ||||||||||||||||||||
| Stock-based compensation | ||||||||||||||||||||
| Noncash lease expense | ||||||||||||||||||||
| Amortization of intellectual property | ||||||||||||||||||||
| Depreciation | ||||||||||||||||||||
| Impairment of software development costs and licenses | ||||||||||||||||||||
| Amortization of debt issuance costs | ||||||||||||||||||||
| Deferred income taxes | ( | |||||||||||||||||||
| Gain on long-term investments, net | ( | ( | ||||||||||||||||||
| Other, net | ||||||||||||||||||||
| Changes in assets and liabilities: | ||||||||||||||||||||
| Accounts receivable | ( | ( | ||||||||||||||||||
| Inventory | ||||||||||||||||||||
| Software development costs and licenses | ( | ( | ( | |||||||||||||||||
| Prepaid expenses, other current and other non-current assets | ( | ( | ( | |||||||||||||||||
| Deferred revenue | ( | ( | ||||||||||||||||||
| Deferred cost of goods sold | ||||||||||||||||||||
| Accounts payable, accrued expenses and other liabilities | ( | |||||||||||||||||||
| Net cash provided by operating activities | ||||||||||||||||||||
| Investing activities: | ||||||||||||||||||||
| Change in bank time deposits | ( | |||||||||||||||||||
| Proceeds from available-for-sale securities | ||||||||||||||||||||
| Purchases of available-for-sale securities | ( | ( | ( | |||||||||||||||||
| Purchases of fixed assets | ( | ( | ( | |||||||||||||||||
| Proceeds from sale of long-term investment | ||||||||||||||||||||
| Purchase of long-term investments | ( | ( | ( | |||||||||||||||||
| Business acquisitions, net of cash acquired | ( | ( | ( | |||||||||||||||||
| Other | ||||||||||||||||||||
| Net cash provided by (used in) investing activities | ( | |||||||||||||||||||
| Financing activities: | ||||||||||||||||||||
| Tax payment related to net share settlements on restricted stock awards | ( | ( | ( | |||||||||||||||||
| Repurchase of common stock | ( | |||||||||||||||||||
| Issuance of common stock | ||||||||||||||||||||
| Cost of debt | ( | |||||||||||||||||||
| Other | ( | |||||||||||||||||||
| Net cash used in financing activities | ( | ( | ( | |||||||||||||||||
| Effects of foreign currency exchange rates on cash, cash equivalents, and restricted cash and cash equivalents | ( | ( | ||||||||||||||||||
| Net change in cash, cash equivalents, and restricted cash and cash equivalents | ||||||||||||||||||||
| Cash, cash equivalents, and restricted cash and cash equivalents, beginning of year (1) | ||||||||||||||||||||
| Cash, cash equivalents, and restricted cash equivalents, end of year (1) | $ | $ | $ | |||||||||||||||||
| Supplemental data: | ||||||||||||||||||||
| Interest paid | $ | $ | $ | |||||||||||||||||
| Income taxes paid | $ | $ | $ | |||||||||||||||||
(1) Cash, cash equivalents and restricted cash and cash equivalents shown on our Consolidated Statements of Cash Flow includes amounts in the Cash and cash equivalents, Restricted cash and cash equivalents, and Long-term restricted cash and cash equivalents on our Consolidated Balance Sheet.
See accompanying Notes.
57
TAKE-TWO INTERACTIVE SOFTWARE, INC.
CONSOLIDATED STATEMENTS OF STOCKHOLDERS' EQUITY
(in thousands)
| Common Stock | Additional Paid-in Capital | Treasury Stock | Retained Earnings/(Accumulated Deficit) | Accumulated Other Comprehensive Income (Loss) | Total Stockholders' Equity | |||||||||||||||||||||||||||||||||||||||||||||
| Shares | Amount | Shares | Amount | |||||||||||||||||||||||||||||||||||||||||||||||
| Balance, March 31, 2019 | $ | $ | ( | $ | ( | $ | $ | ( | $ | |||||||||||||||||||||||||||||||||||||||||
| Net income | — | — | — | — | — | — | ||||||||||||||||||||||||||||||||||||||||||||
| Change in cumulative foreign currency translation adjustment | — | — | — | — | — | — | ( | ( | ||||||||||||||||||||||||||||||||||||||||||
| Net unrealized gain on available-for-sale securities, net of taxes | — | — | — | — | — | — | ( | ( | ||||||||||||||||||||||||||||||||||||||||||
| Change in unrealized gains on cash flow hedge, net | — | — | — | — | — | — | ||||||||||||||||||||||||||||||||||||||||||||
| Stock-based compensation | — | — | — | — | — | — | ||||||||||||||||||||||||||||||||||||||||||||
| Issuance of restricted stock, net of forfeitures and cancellations | ( | — | — | — | — | |||||||||||||||||||||||||||||||||||||||||||||
| Net share settlement of restricted stock awards | ( | ( | ( | — | — | — | — | ( | ||||||||||||||||||||||||||||||||||||||||||
| Employee share purchase plan settlement | — | — | — | — | ||||||||||||||||||||||||||||||||||||||||||||||
| Balance, March 31, 2020 | $ | $ | ( | $ | ( | $ | $ | ( | $ | |||||||||||||||||||||||||||||||||||||||||
| Net income | — | — | — | — | — | — | ||||||||||||||||||||||||||||||||||||||||||||
| Change in cumulative foreign currency translation adjustment | — | — | — | — | — | — | ||||||||||||||||||||||||||||||||||||||||||||
| Change in unrealized gains on cash flow hedge, net | — | — | — | — | — | — | ( | ( | ||||||||||||||||||||||||||||||||||||||||||
| Net unrealized gain on available-for-sale securities, net of taxes | — | — | — | — | — | — | ||||||||||||||||||||||||||||||||||||||||||||
| Stock-based compensation | — | — | — | — | — | — | ||||||||||||||||||||||||||||||||||||||||||||
| Issuance of restricted stock, net of forfeitures and cancellations | ( | — | — | — | — | |||||||||||||||||||||||||||||||||||||||||||||
| Net share settlement of restricted stock awards | ( | ( | ( | — | — | — | — | ( | ||||||||||||||||||||||||||||||||||||||||||
| Employee share purchase plan settlement | — | — | — | — | ||||||||||||||||||||||||||||||||||||||||||||||
| Issuance of shared related to Playdots, Inc. acquisitions | — | — | — | — | ||||||||||||||||||||||||||||||||||||||||||||||
| Balance, March 31, 2021 | $ | $ | ( | $ | ( | $ | $ | ( | $ | |||||||||||||||||||||||||||||||||||||||||
| Net income | — | — | — | — | — | — | ||||||||||||||||||||||||||||||||||||||||||||
| Change in cumulative foreign currency translation adjustment | — | — | — | — | — | — | ( | ( | ||||||||||||||||||||||||||||||||||||||||||
| Net unrealized gain on available-for-sale securities, net of taxes | — | — | — | — | — | — | ( | ( | ||||||||||||||||||||||||||||||||||||||||||
| Repurchased common stock | — | — | — | ( | ( | — | — | ( | ||||||||||||||||||||||||||||||||||||||||||
| Stock-based compensation | — | — | — | — | — | — | ||||||||||||||||||||||||||||||||||||||||||||
| Issuance of restricted stock, net of forfeitures and cancellations | ( | — | — | — | — | |||||||||||||||||||||||||||||||||||||||||||||
| Net share settlement of restricted stock awards | ( | ( | ( | — | — | — | — | ( | ||||||||||||||||||||||||||||||||||||||||||
| Employee share purchase plan settlement | — | — | — | — | ||||||||||||||||||||||||||||||||||||||||||||||
| Issuance of shares related to Nordeus. acquisition | — | — | — | — | ||||||||||||||||||||||||||||||||||||||||||||||
| Balance, March 31, 2022 | $ | $ | ( | $ | ( | $ | $ | ( | $ | |||||||||||||||||||||||||||||||||||||||||
See accompanying Notes.
58
TAKE-TWO INTERACTIVE SOFTWARE, INC.
NOTES TO THE CONSOLIDATED FINANCIAL STATEMENTS
(In thousands, except per share amounts)
1. BASIS OF PRESENTATION AND SIGNIFICANT ACCOUNTING POLICIES
Take-Two Interactive Software, Inc. (the "Company," "we," "us," or similar pronouns) was incorporated in the state of Delaware in 1993. We are a leading developer, publisher, and marketer of interactive entertainment for consumers around the globe. We develop and publish products principally through Rockstar Games, 2K, Private Division, and T2 Mobile Games. Our products are designed for console gaming systems, personal computers ("PC"), and mobile including smart phones and tablets ("Mobile"), and are delivered through physical retail, digital download, online platforms, and cloud streaming services.
Pending Acquisition of Zynga
On January 9, 2022, we entered into a definitive merger agreement to acquire Zynga Inc. ("Zynga"), a leading developer of mobile games. Refer to Note 23 - Subsequent Events for additional information.
Principles of Consolidation
The Consolidated Financial Statements include the financial statements of the Company and its wholly-owned subsidiaries. All inter-company balances and transactions have been eliminated in consolidation.
Reclassifications
Certain immaterial amounts in the financial statements of the prior years have been reclassified to conform to the current year presentation for comparative purposes.
Use of Estimates
The preparation of financial statements in conformity with U.S. generally accepted accounting principles ("U.S. GAAP") requires management to make estimates and assumptions that affect the reported amounts of assets, liabilities, net revenue, and expense, as well as the disclosure of contingent assets and liabilities at the dates of the financial statements during the reporting periods. Our most significant estimates relate to revenue recognition (see Note 2 - Revenue from Contracts with Customers); the recoverability and amortization of software development costs, licenses, and intangible assets; assets acquired and liabilities assumed in business combinations, including the valuation of contingent earn-out consideration; the realization of deferred income taxes; the valuation of stock-based compensation; and assumptions used in our goodwill impairment tests. These estimates generally involve complex issues and require us to make judgments, involve analysis of historical and the prediction of future trends, and are subject to change from period to period. Actual amounts could differ significantly from these estimates, including as a result of the COVID-19 pandemic, which may affect economic conditions in a number of different ways and result in uncertainty and risk. We consider transactions or events that occur after the balance sheet date, but before the financial statements are issued, to provide additional evidence relative to certain estimates or to identify matters that require additional disclosures.
Concentration of Credit Risk and Accounts Receivable
We maintain cash balances at several major financial institutions. While we attempt to limit credit exposure with any single institution, balances often exceed insurable amounts.
Accounts receivable are recorded at the original invoiced amount less an allowance for credit losses. In evaluating our ability to collect outstanding receivable balances and related allowance for credit losses, we consider many factors, including the age of the balance, the customer’s payment history and current creditworthiness, as well as current and forecasted economic conditions that may affect our customers’ ability to pay. Bad debts are written off after all collection efforts have been exhausted. We do not require collateral from our customers.
59
Cash and Cash Equivalents
We consider all highly liquid instruments purchased with original maturities of three months or less to be cash equivalents. Our restricted cash and cash equivalents balances are primarily related to dedicated accounts limited to the payment of certain internal royalty obligations. Balances that are restricted from use for more than one year are classified as non-current.
Short-term Investments
Short-term investments designated as available-for-sale securities are carried at fair value, which is based on quoted market prices for such securities, if available, or is estimated on the basis of quoted market prices of financial instruments with similar characteristics. Investments with original maturities greater than 90 days and remaining maturities of less than one year are normally classified within Short-term investments on our Consolidated Balance Sheets. In addition, investments with maturities beyond one year at the time of purchase that are highly liquid in nature and represent the investment of cash that is available for current operations are classified as short-term investments.
Unrealized gains and losses of available-for-sale securities are excluded from earnings and are reported as a component of Other comprehensive income (loss), net of tax, until the security is sold, the security has matured, or we determine that the fair value of the security has declined below its adjusted cost basis and the decline is not due to a credit loss. Realized gains and losses on short-term investments are calculated based on the specific identification method and would be reclassified from accumulated other comprehensive loss to Interest and other, net.
Short-term investments are evaluated for impairment quarterly. We consider various factors in determining whether we should recognize an impairment charge, including the credit quality of the issuer, the duration that the fair value has been less than the adjusted cost basis, the severity of the impairment, the reason for the decline in value, and our intent to sell and ability to hold the investment for a period of time sufficient to allow for any anticipated recovery in market value. If we conclude that an investment is impaired or a portion of the unrealized loss is a result of a credit loss, we recognize the charge at that time in our Consolidated Statements of Operations. Determining whether the decline in fair value is due to a credit loss requires management judgment based on the specific facts and circumstances of each security. The ultimate value realized on these securities is subject to market price volatility until they are sold.
Inventory
Inventory consists of materials, including manufacturing royalties paid to console manufacturers, and is stated at the lower of weighted average cost or net realizable value. Estimated product returns are included in the inventory balance at their cost. We regularly review inventory quantities on-hand and in the retail channels and record an inventory provision for excess or obsolete inventory based on the future expected demand for our products. Significant changes in demand for our products would affect management's estimates in establishing our inventory provision. We write down inventory based on excess or obsolete inventories determined primarily by anticipated future demand for our products. Inventory write-downs are measured as the difference between the cost of the inventory and market value, based upon assumptions about future demand that are inherently difficult to assess.
Software Development Costs and Licenses
Capitalized software development costs include direct costs incurred for internally developed titles and payments made to third-party software developers under development agreements.
60
We capitalize internal software development costs (including specifically identifiable payroll expense, employee stock-based compensation, and incentive compensation costs related to the completion and release of titles, as well as third-party production and other content costs), subsequent to establishing technological feasibility of a software title. Technological feasibility of a product includes the completion of both technical design documentation and game design documentation. Significant management judgments are made in the assessment of when technological feasibility is established. For products where proven technology exists, this may occur early in the development cycle. Technological feasibility is evaluated on a product-by-product basis. Prior to establishing technological feasibility of a product, we record any costs incurred by third-party developers as research and development expenses.
We enter into agreements with third-party developers that require us to make payments for game development and production services. In exchange for our payments, we receive the exclusive publishing and distribution rights to the finished game title as well as, in some cases, the underlying intellectual property rights. Such agreements typically allow us to fully recover these payments to the developers at an agreed upon royalty rate earned on the subsequent sales of such software, net of any agreed upon costs. Subsequent to establishing technological feasibility of a product, we capitalize all development and production service payments to third-party developers as software development costs and licenses. We typically enter into agreements with third-party developers after completing the technical design documentation for our products and therefore record the design costs leading up to a signed development contract as research and development expense. When we contract with third-party developers, we generally select those that have proven technology and experience in the genre of the software being developed, which often allows for the establishment of technological feasibility early in the development cycle. In instances where the documentation of the design and technology are not in place prior to an executed contract, we monitor the software development process and require our third-party developers to adhere to the same technological feasibility standards that apply to our internally developed products.
Licenses consist of payments and guarantees made to holders of intellectual property rights for use of their trademarks, copyrights or other intellectual property rights in the development of our products. Agreements with license holders generally provide for guaranteed minimum payments for use of their intellectual property. Certain licenses, especially those related to our sports products, extend over multi-year periods and encompass multiple game titles. In addition to guaranteed minimum payments, these licenses frequently contain provisions that could require us to pay royalties to the license holder based on pre-agreed unit sales thresholds.
Amortization of capitalized software development costs and licenses commences when a product is available for general release and is recorded on a title-by-title basis in cost of goods sold. For capitalized software development costs, annual amortization is calculated using (1) the proportion of current year revenue to the total revenue expected to be recorded over the life of the title or (2) the straight-line method over the remaining estimated life of the title, whichever is greater. For capitalized licenses, amortization is calculated as a ratio of (1) current year revenue to the total revenue expected to be recorded over the remaining estimated life of the title or (2) the contractual royalty rate based on actual net product sales as defined in the licensing agreement, whichever is greater. Amortization periods for our software products generally range from 12 to 30 months.
We evaluate the future recoverability of capitalized software development costs and licenses on a quarterly basis. Recoverability is primarily assessed based on the title's actual performance. For products that are scheduled to be released in the future, recoverability is evaluated based on the expected performance of the specific products to which the cost or license relates. We use a number of criteria in evaluating expected product performance, including historical performance of comparable products developed with comparable technology, market performance of comparable titles, orders for the product prior to its release, general market conditions, and past performance of the franchise. When we determine that capitalized cost of the title is unlikely to be recovered by product sales, an impairment of software development and license costs capitalized is charged to cost of goods sold in the period in which such determination is made.
We have profit and unit sales based internal royalty programs that allow selected employees to participate in the success of software titles that they assist in developing. Royalties earned under these programs are recorded as a component of Cost of goods sold in the period earned. Amounts earned and not yet paid are reflected within the software development royalties component of Accrued expenses and other current liabilities on our Consolidated Balance Sheets.
Fixed Assets, net
Office equipment, furniture and fixtures are depreciated using the straight-line method over their estimated useful life of five years . Computer equipment and software are generally depreciated using the straight-line method over to five years . Leasehold improvements are amortized over the lesser of the term of the related lease or the useful life of the underlying asset, typically seven years . Buildings are depreciated over the remaining life of the buildings, which is typically approximately 30 years. The cost of additions and improvements are capitalized, and repairs and maintenance costs are charged to operations, in the periods incurred. When depreciable assets are retired or sold, the cost and related allowances for depreciation are
61
Leases
We determine if an arrangement is a lease at contract inception. If there is an identified asset in the contract (either explicitly or implicitly) and we have control over its use, the contract is (or contains) a lease. In certain of our lease arrangements, primarily those related to our data center arrangements, judgment is required in determining if a contract contains a lease. For these arrangements, there is judgment in evaluating if the arrangement provides us with an asset that is physically distinct, or that represents substantially all of the capacity of the asset, and if we have the right to direct the use of the asset. Lease assets and liabilities are recognized based on the present value of future lease payments over the lease term at the commencement date. Included in the lease liability are future lease payments that are fixed, in-substance fixed, or payments based on an index or rate known at the commencement date of the lease. Variable lease payments are recognized as lease expenses as incurred. The operating lease right-of-use (“ROU”) asset also includes any lease payments made prior to commencement, initial direct costs incurred, and lease incentives received.
As most of our leases do not provide an implicit rate, we generally use our incremental borrowing rate in determining the present value of future lease payments. The incremental borrowing rate represents the rate required to borrow funds over a similar term to purchase the leased asset and is based on an unsecured borrowing rate and risk-adjusted to approximate a collateralized rate at the commencement date of the lease.
In determining our lease liability, the lease term includes options to extend or terminate the lease when it is reasonably certain that we will exercise such option. For operating leases, the lease expense for minimum lease payments is recognized on a straight-line basis over the lease term. Lease modifications result in remeasurement of the lease liability. Leases with an initial term of twelve months or less are not recorded on the balance sheet, and we recognize lease expense for these leases on a straight-line basis over the lease term. We do not separate non-lease components from the related lease components.
Goodwill and Intangible Assets
Goodwill is the excess of purchase price paid over identified intangible and tangible net assets of acquired companies. Intangible assets consist of intellectual property, developed game technology, analytics technology, user base, trade names, and in-process research and development. Certain intangible assets acquired in a business combination are recognized as assets apart from goodwill.
We use either the income, cost or market approach to aid in our conclusions of such fair values and asset lives. The income approach presumes that the value of an asset can be estimated by the net economic benefit to be received over the life of the asset, discounted to present value. The cost approach presumes that an investor would pay no more for an asset than its replacement or reproduction cost. The market approach estimates value based on what other participants in the market have paid for reasonably similar assets. Although each valuation approach is considered in valuing the assets acquired, the approach, or combination of approaches, ultimately selected is based on the characteristics of the asset and the availability of information.
We test our goodwill for impairment annually, or more frequently if events and circumstances indicate the fair value of a reporting unit may be below its carrying amount. A reporting unit is defined as an operating segment or one level below an operating segment. We have determined that we operate in two reporting units, which are components of our operating segment. In the evaluation of goodwill for impairment, we have the option to first perform a qualitative assessment to determine if the fair value of a reporting unit is more likely than not (i.e., a likelihood of more than 50%) less than the carrying value before performing a quantitative impairment test.
When a qualitative assessment is not used, or if the qualitative assessment is not conclusive, a quantitative impairment analysis for goodwill is performed at the reporting unit level. The quantitative goodwill impairment test is used to identify potential impairment by comparing the fair value of a reporting unit with its carrying amount, including goodwill. If the carrying value exceeds the fair value, an impairment charge is recognized equal to the difference between the carrying value of the reporting unit and its fair value, considering the related income tax effect of any goodwill deductible for tax purposes.
62
Based on our annual impairment assessment process for goodwill, no
Derivatives and Hedging
We transact business in various foreign currencies and have significant sales and purchase transactions denominated in foreign currencies, subjecting us to foreign currency exchange rate risk. From time to time, we carry out transactions involving foreign currency exchange derivative financial instruments. The transactions are designed to hedge our exposure in currency exchange rate movements. We recognize derivative instruments as either assets or liabilities on our Consolidated Balance Sheets and we measure those instruments at fair value. The changes in fair value of derivatives that are not designated as hedges are recognized currently in earnings as Interest and other, net in our Consolidated Statements of Operations. If a derivative meets the definition of a cash flow hedge and is so designated, the effective portion of changes in the fair value of the derivative are recognized, as a component of Other comprehensive income (loss) while the ineffective portion of the changes in fair value is recorded currently in earnings as Interest and other, net in our Consolidated Statements of Operations. Amounts included in Accumulated other comprehensive income (loss) for cash flow hedges are reclassified into earnings in the same period that the hedged item is recognized in Cost of goods sold, Research and development expenses, or Interest and other, net, as appropriate.
Income Taxes
We record a tax provision for the anticipated tax consequences of the reported results of operations. Our provision for income taxes is computed using the asset and liability method, under which deferred income taxes are recognized for differences between the financial statement and tax bases of assets and liabilities at currently enacted statutory tax rates for the years in which the differences are expected to reverse. The effect on deferred taxes of a change in tax rates is recognized in income in the period that includes the enactment.
Valuation allowances are established when we determine that it is more likely than not that such deferred tax assets will not be realized. We do not record income tax expense related to foreign withholding taxes or United States income taxes that may become payable upon the repatriation of undistributed earnings of foreign subsidiaries, as such earnings are expected to be reinvested indefinitely outside of the United States.
We use estimates and assumptions to compute the provision for income taxes including allocations of certain transactions to different tax jurisdictions, amounts of permanent and temporary differences, the likelihood of deferred tax assets being recovered and the outcome of contingent tax risks. These estimates and assumptions are revised as new events occur, more experience is acquired and additional information is obtained. The effect of these revisions is recorded in income tax expense or benefit in the period in which they become known.
Revenue Recognition
We derive revenue primarily from the sale of our interactive entertainment content, principally for console gaming systems, personal computers, and Mobile. Our interactive entertainment content consists of full game software products that may contain offline gameplay, online gameplay, or a combination of offline and online gameplay. We may also sell separate downloadable add-on content to supplement our full game software products. Certain of our software products provide customers with the option to acquire virtual currency or make in-game purchases.
We determine revenue recognition by:
•identifying the contract, or contracts, with the customer;
•identifying the performance obligations in the contract;
•determining the transaction price;
•allocating the transaction price to performance obligations in the contract; and
63
•recognizing revenue when, or as, we satisfy performance obligations by transferring the promised goods or services.
We recognize revenue in the amount that reflects the consideration we expect to receive in exchange for the sales of software products and game related services when control of the promised products and services is transferred to our customers and our performance obligations under the contract have been satisfied. Revenue is recorded net of transaction taxes assessed by governmental authorities such as sales, value-added and other similar taxes.
Our software products are sold as full games, which typically provide access to the main game content, primarily for console and PC. Generally, our full game software products deliver a license of our intellectual property that provides a functional offline gaming experience (i.e., one that does not require an Internet connection to access the main game content or other significant game related services). We recognize revenue related to the license of our intellectual property that provides offline functionality at the time control of the products has been transferred to our customers (i.e. upon delivery of the software product).
In addition, some of our full game software products that provide a functional offline gaming experience may also include significant game related services delivered over time, such as online functionality that is dependent upon online support services and/or additional free content updates. For full game sales that offer offline functionality and significant game related services we evaluate whether the license of our intellectual property and the game related services are distinct and separable. This evaluation is performed for each software product sold. If we determine that our software products contain a license of intellectual property separate from the game related services (i.e. multiple performance obligations), we estimate a standalone selling price for each identified performance obligation. We allocate the transaction price to each performance obligation using a relative standalone selling price method (the transaction price is allocated to a performance obligation based on the proportion of the standalone selling price of each performance obligation to the sum of the standalone selling prices for all performance obligations in the contract). For the portion of the transaction price allocable to the license, revenue is recognized when the customer takes control of the product. For the portion of the transaction price allocated to game related services, revenue is recognized ratably over an estimated service period for the related software product. We also defer related product costs and recognize the costs as the revenues are recognized.
Certain of our full game software products are delivered primarily as an online gaming experience with substantially all gameplay requiring online access to our game related services. We recognize revenue for full game software products that are dependent on our game related services over an estimated service period. For our full game online software products, we also defer related product costs and recognize the costs as the revenue is recognized.
In addition to sales of our full game software products, certain of our software products provide customers with the option to acquire virtual currency or make in-game purchases. Revenue from the sale of virtual currency and in-game purchases is deferred and recognized ratably over an estimated service period.
We also sell separate downloadable add-on content to supplement our full game software products. Revenue from the sale of separate downloadable add-on content is evaluated for revenue recognition on the same basis as our full game software products.
Certain software products are sold to customers with a “street date” (the earliest date these products may be sold by these retailers). For the transaction price related to the license for these products that also provide a functional offline gaming experience, we recognize revenue on the later of the street date or the sale date as this is generally when we have transferred control of this performance obligation. For the sale of physical software products, recognition of revenue allocated to game related services does not begin until the product is sold-through by our customer to the end user. We currently estimate sell-through to the end user for all our titles to be approximately two months after we have sold-in the software products to retailers. Determining the estimated sell-through period requires management judgment and estimates.
In addition, some of our software products are sold as digital downloads. Revenue from digital downloads generally commences when the download is made available to the end user by a third-party digital storefront.
Our payment terms and conditions vary by customer and typically provide net 30- to 60-day terms. In instances where the timing of revenue recognition differs from the timing of invoicing, we do not adjust the promised amount of consideration for the effects of a significant financing component when we expect, at contract inception, that the period between our transfer of a promised product or service to our customer and payment for that product or service will be one year or less.
In certain countries, we use third-party licensees to distribute and host our games in accordance with license agreements, for which the licensees typically pay us a fixed minimum guarantee and sales-based royalties. These arrangements typically include multiple performance obligations, such as an upfront license of intellectual property and rights to future updates. Based on the allocated transaction price, we recognize revenue associated with the minimum guarantee when we
64
transfer control of the upfront license of intellectual property (generally upon commercial launch) and the remaining portion ratably over the contractual term in which we provide the licensee with future update rights. Royalty payments in excess of the minimum guarantee are generally recognized when the licensed product is sold by the licensee.
Contract Balances
We generally record a receivable related to revenue when we have an unconditional right to invoice and receive payment, and we record deferred revenue when cash payments are received or due in advance of satisfying our performance obligations, even if amounts are refundable. Contract assets generally consist of arrangements for which we have recognized revenue to the extent it is probable that significant reversal will not occur but do not have a right to invoice as of the reporting date. Contract assets are recorded within Prepaid expenses and other on our Consolidated Balance Sheet.
Our allowances for doubtful accounts are typically immaterial and, if required, are based on our best estimate of expected credit losses inherent in our accounts receivable balance.
Deferred revenue is comprised primarily of unsatisfied revenue related to the portion of the transaction price allocable to game related services of our full game software products and sales of virtual currency. These sales are typically invoiced at the beginning of the contract period, and revenue is recognized ratably over the estimated service period. Deferred revenue may also include amounts related to software products with future street dates.
Refer to Note 2 - Revenue from Contracts with Customers for further information, including changes in deferred revenue during the period.
Principal Agent Considerations
We offer certain software products via third-party digital storefronts, such as Microsoft’s Xbox Live, Sony’s PlayStation Network, Valve's Steam, Epic Games Store, Apple's App Store, and the Google Play Store. For sales of our software products via third-party digital storefronts, we determine whether or not we are acting as the principal in the sale to the end user, which we consider in determining if revenue should be reported based on the gross transaction price to the end user or based on the transaction price net of fees retained by the third-party digital storefront. An entity is the principal if it controls a good or service before it is transferred to the customer. Key indicators that we use in evaluating these sales transactions include, but are not limited to, the following:
•the underlying contract terms and conditions between the various parties to the transaction;
•which party is primarily responsible for fulfilling the promise to provide the specified good or service; and
•which party has discretion in establishing the price for the specified good or service.
Based on our evaluation of the above indicators, for sales arrangements via Microsoft’s Xbox Live, Sony’s PlayStation Network, Valve's Steam, and Epic Games Store we have determined we are not the principal in the sales transaction to the end user and therefore we report revenue based on the consideration received from the digital storefront. For sales arrangements via Apple's App Store and the Google Play Store, we have determined that we are the principal to the end user and thus report revenue on a gross basis and mobile platform fees charged by these digital storefronts are expensed as incurred and reported within Cost of goods sold.
Shipping and Handling
Shipping and handling costs are incurred to move physical software products to customers. We recognize all shipping and handling costs as an expense in Cost of goods sold because we are responsible for delivery of the product to our customers prior to transfer of control to the customer.
Estimated Service Period
For certain performance obligations satisfied over time, we have determined that the estimated service period is the time period in which an average user plays our software products (“user life”) which most faithfully depicts the timing of satisfying our performance obligation. We consider a variety of data points when determining and subsequently reassessing the estimated service period for players of our software products. Primarily, we review the weighted average number of days between players’ first and last days played online. When a new game is launched and therefore no history of online player data is available, we consider other factors to determine the user life, such as the estimated service period of other games actively being sold with similar characteristics. We also consider known online trends, the service periods of our previously released software products, and, to the extent publicly available, the service periods of our competitors’ software products that are similar in nature to ours. We believe this provides a reasonable depiction of the transfer of our game related services to our
65
customers, as it is the best representation of the period during which our customers play our software products. Determining the estimated service period is subjective and requires significant management judgment and estimates. Future usage patterns may differ from historical usage patterns, and therefore the estimated service period may change in the future. The estimated service periods for players of our current software products are generally between and fifteen months depending on the software product.
Revenue Arrangements with Multiple Performance Obligations
Our contracts with customers often include promises to transfer multiple products and services. Determining whether products and services are considered distinct performance obligations that should be accounted for separately versus together requires significant judgment. For software products in which the software license has offline functionality and benefits from meaningful game related services, which may include online functionality that is dependent on our online support services and/or additional free content updates, we believe we have separate performance obligations for the license of the intellectual property and the game related services. Additionally, because each of our product offerings has unique features and because we do not sell our game related services separately, we typically do not have observable standalone selling prices for each performance obligation. Significant judgment and estimates are also required to determine the standalone selling price for each distinct performance obligation and whether a discount needs to be allocated based on the relative standalone selling price of our products and services.
To estimate the standalone selling price for each performance obligation, we consider, to the extent available, a variety of data points such as past selling prices of the product or other similar products, competitor pricing, and market data. If observable pricing is not available, we use an expected cost-plus margin approach taking into account relevant costs including product development, post-release support, marketing and licensing costs. This evaluation is performed on a product by product basis.
Price Protection, Allowances for Returns, and Sales Incentives
We grant price protection and accept returns in connection with our distribution arrangements. Following reductions in the price of our physical software products, we grant price protection to permit customers to take credits against amounts they owe us with respect to merchandise unsold by them. Our customers must satisfy certain conditions to entitle them to receive price protection or return products, including compliance with applicable payment terms and confirmation of field inventory levels.
At contract inception and at each subsequent reporting period, we make estimates of price protection and product returns related to current period software product revenue. We estimate the amount of price protection and returns for software products based upon, among other factors, historical experience and performance of the titles in similar genres, historical performance of the hardware platform, customer inventory levels, analysis of sell-through rates, sales force and retail customer feedback, industry pricing, market conditions, and changes in demand and acceptance of our products by consumers.
We enter into various sales incentive arrangements with our customers, such as rebates, discounts, and cooperative marketing. These incentives are considered adjustments to the transaction price of our software products and are reflected as reductions to revenue. Sales incentives incurred by us for distinct goods or services received, such as the appearance of our products in a customer’s national circular ad, are included in Selling and marketing expense if there is a separate identifiable benefit and the benefit’s fair value can be established. Otherwise, such sales incentives are reflected as a reduction to revenue.
Revenue is recognized after deducting the estimated price protection, allowances for returns, and sales incentives, which are accounted for as variable consideration. Price protection, allowances for returns, and sales incentives are considered refund liabilities and are reported within Accrued expenses and other current liabilities on our Consolidated Balance Sheet.
Significant Estimates
Significant management judgment and estimates must be used in connection with many of the determinations described above, such as estimating the fair value allocation to distinct and separable performance obligations, the service period over which to defer recognition of revenue, and the amounts of price protection. We believe we can make reliable estimates. However, actual results may differ from initial estimates due to changes in circumstances, market conditions, and assumptions. Adjustments to estimates are recorded in the period in which they become known.
66
Stock-based Compensation
We have stock-based compensation plans that are broad-based long-term retention programs intended to attract and retain talented employees and align stockholder and employee interests, which allows for awards of restricted stock, restricted stock units and other stock-based awards of our common stock to employees and non-employees. Our plans include time-based, market-based, and performance-based awards of our common stock to employees and non-employees.
We account for stock-based awards under the fair value method of accounting. The fair value of all stock-based compensation is either capitalized and amortized in accordance with our software development cost accounting policy or recognized as expense on a straight-line basis over the full vesting period of the awards for time-based stock awards and on an accelerated attribution method for market-based and performance-based stock awards.
We estimate the fair value of time-based awards using our closing stock price on the date of grant. We estimate the fair value of market-based awards using a Monte Carlo Simulation method, which takes into account assumptions such as the expected volatility of our common stock, the risk-free interest rate based on the contractual term of the award, expected dividend yield, vesting schedule and the probability that the market conditions of the awards will be achieved. For performance-based shares, we do not record expense until the performance criteria are considered probable.
Stock-based compensation expense is recorded net of forfeitures as they occur.
Earnings (loss) per Share ("EPS")
Basic EPS is computed by dividing the net income (loss) applicable to common stockholders for the period by the weighted average number of shares of common stock outstanding during the same period. Diluted EPS is computed by dividing the net income (loss) applicable to common stockholders for the period by the weighted average number of shares of common stock and common stock equivalents outstanding. Common stock equivalents are measured using the treasury stock method and represent unvested stock-based awards.
Foreign Currency
The functional currency for our foreign operations is primarily the applicable local currency. Accounts of foreign operations are translated into U.S. dollars using exchange rates for assets and liabilities at the balance sheet date and average prevailing exchange rates for the period for revenue and expense accounts. Adjustments resulting from translation are included in accumulated other comprehensive income (loss). Realized and unrealized transaction gains and losses are included in our Consolidated Statements of Operations in the period in which they occur.
Comprehensive Income (Loss)
Comprehensive income (loss) is defined to include all changes in equity except those resulting from investments by owners and distributions to owners. Accumulated other comprehensive income (loss) includes foreign currency translation adjustments, which relate to investments that are permanent in nature and therefore do not require tax adjustments, and the amounts for unrealized gains (losses), net on derivative instruments designated as cash flow hedges, as well as any associated tax impact, and available for sale securities.
Recently Adopted Accounting Pronouncements
Accounting for Income Taxes
In December 2019, the FASB issued ASU 2019-12, Income Taxes (Topic 740): Simplifying the Accounting for Income Taxes, which enhances and simplifies various aspects of the income tax accounting guidance, including requirements such as tax basis step-up in goodwill obtained in a transaction that is not a business combination, ownership changes in investments, and interim-period accounting for enacted changes in tax law. We adopted this update effective April 1, 2021. The adoption of this update did not have a material impact on our Consolidated Financial Statements.
Recently Issued Accounting Pronouncements
Accounting for Government Assistance
In November 2021, the FASB issued ASU 2021-10, Government Assistance (Topic 832): Disclosures by Business Entities about Government Assistance, which requires annual disclosures that increase the transparency of transactions involving government grants, including (1) the types of transactions, (2) the accounting for those transactions, and (3) the effect of those transactions on any entity's financial statements. We adopted this update effective April 1, 2022. We are currently evaluating the potential impact of adopting this guidance on our disclosures.
67
Accounting for Contract Assets and Contract Liabilities
In October 2021, the FASB issued ASU 2021-08, Business Combinations (Topic 805): Accounting for Contract Assets and Contract Liabilities from Contracts with Customers. Under this new standard, deferred revenue acquired in a business combination is measured pursuant to ASC 606, Revenue from Contracts with Customers, rather than its assumed acquisition date fair value under the current guidance. ASU 2021-08 is effective for fiscal years, and interim periods within those fiscal years, beginning December 15, 2022 (April 1, 2023 for the Company), with early adoption permitted. However, adoption in an interim period other than the first fiscal quarter requires an entity to apply the new guidance to all prior business combinations that have occurred since the beginning of the annual period in which the new guidance is adopted. We early adopted this update for our fiscal year 2023 on April 1, 2022. There was no impact of adopting this guidance on our Consolidated Financial Statements.
2. REVENUE FROM CONTRACTS WITH CUSTOMERS
Disaggregation of Revenue
Timing of recognition
Product revenue is primarily comprised of the portion of revenue from software products that is recognized when the customer takes control of the product (i.e. upon delivery of the software product).
Service and other revenue is primarily comprised of revenue from our software products that include game related services, or separate virtual currency transactions, and in-game purchases, which are recognized over an estimated service period.
| Fiscal Year Ended March 31, | ||||||||||||||||||||
| 2022 | 2021 | 2020 | ||||||||||||||||||
| Net revenue recognized: | ||||||||||||||||||||
| Service and other (over time) | $ | $ | $ | |||||||||||||||||
| Product (point in time) | ||||||||||||||||||||
| Total net revenue | $ | $ | $ | |||||||||||||||||
Content
Recurrent consumer spending revenue is generated from ongoing consumer engagement and includes revenue from virtual currency, add-on content, and in-game purchases.
Full game and other revenue primarily includes the initial sale of full game software products, which may include offline and/or significant game related services.
| Fiscal Year Ended March 31, | ||||||||||||||||||||
| 2022 | 2021 | 2020 | ||||||||||||||||||
| Net revenue recognized: | ||||||||||||||||||||
| Recurrent consumer spending | $ | $ | $ | |||||||||||||||||
| Full game and other | ||||||||||||||||||||
| Total net revenue | $ | $ | $ | |||||||||||||||||
68
Geography
We attribute net revenue to geographic regions based on software product destination. Net revenue by geographic region was as follows:
| Fiscal Year Ended March 31, | ||||||||||||||||||||
| 2022 | 2021 | 2020 | ||||||||||||||||||
| Net revenue recognized: | ||||||||||||||||||||
| United States | $ | $ | $ | |||||||||||||||||
| International | ||||||||||||||||||||
| Total net revenue | $ | $ | $ | |||||||||||||||||
Platform
| Fiscal Year Ended March 31, | ||||||||||||||||||||
| 2022 | 2021 | 2020 | ||||||||||||||||||
| Net revenue recognized: | ||||||||||||||||||||
| Console | $ | $ | $ | |||||||||||||||||
| PC and other | ||||||||||||||||||||
| Mobile | ||||||||||||||||||||
| Total net revenue | $ | $ | $ | |||||||||||||||||
Distribution Channel
Our products are delivered through digital online services (digital download, online platforms, and cloud streaming) and physical retail and other. Net revenue by distribution channel was as follows:
| Fiscal Year Ended March 31, | ||||||||||||||||||||
| 2022 | 2021 | 2020 | ||||||||||||||||||
| Net revenue recognized: | ||||||||||||||||||||
| Digital online | $ | $ | $ | |||||||||||||||||
| Physical retail and other | ||||||||||||||||||||
| Total net revenue | $ | $ | $ | |||||||||||||||||
Deferred Revenue
We record deferred revenue when payments are due or received in advance of the fulfillment of our associated performance obligations. The balance of deferred revenue, including current and non-current balances, as of March 31, 2022 and March 31, 2021 were $936,181 and $965,331 , respectively. For the fiscal year ended March 31, 2022, the additions to our deferred revenue balance were primarily due to cash payments received or due in advance of satisfying our performance obligations, while the reductions to our deferred revenue balance were due primarily to the recognition of revenue upon fulfillment of our performance obligations, both of which were in the ordinary course of business.
During the fiscal year ended March 31, 2022, $916,546 of revenue was recognized that was included in the deferred revenue balance at the beginning of the period. As of March 31, 2022, the aggregate amount of contract revenue allocated to unsatisfied performance obligations is $1,101,533 , which includes our deferred revenue balances and amounts to be invoiced and recognized as revenue in future periods. We expect to recognize approximately $949,872 of this balance as revenue over the next 12 months, and the remainder thereafter. This balance does not include an estimate for variable consideration arising from sales-based royalty license revenue in excess of the contractual minimum guarantee.
As of March 31, 2022 and March 31, 2021, our contract asset balances were $104,913 and $105,554 , respectively, which are included within Prepaid and other in our Consolidated Balance Sheet.
69
3. MANAGEMENT AGREEMENT
In November 2017, we entered into a management agreement (the "2017 Management Agreement") with ZelnickMedia Corporation ("ZelnickMedia") that replaced our previous agreement with ZelnickMedia and pursuant to which ZelnickMedia provides financial and management consulting services to the Company through March 31, 2024. The 2017 Management Agreement became effective January 1, 2018. As part of the 2017 Management Agreement, Strauss Zelnick, the President of ZelnickMedia, continues to serve as Executive Chairman and Chief Executive Officer of the Company, and Karl Slatoff, a partner of ZelnickMedia, continues to serve as President of the Company. The 2017 Management Agreement provides for an annual management fee of $3,100 over the term of the agreement and a maximum annual bonus opportunity of $7,440 over the term of the agreement, based on the Company achieving certain performance thresholds.
In consideration for ZelnickMedia's services, we recorded consulting expense (a component of General and administrative expenses) of $9,940 , $10,540 , and $10,540 for the fiscal years ended March 31, 2022, 2021, and 2020, respectively.
Pursuant to the 2017 Management Agreement, we also issued stock-based awards to ZelnickMedia. During the fiscal years ended March 31, 2022, 2021, and 2020, we recorded $29,153 , $27,281 , and $23,413 , respectively, of stock-based compensation expense for non-employee awards, which is included in General and administrative expenses. See Note 17 - Stock-Based Compensation for a discussion of such awards.
In May 2022, we entered into a new management agreement (the "2022 Management Agreement") with ZelnickMedia that, once effective, will replace the 2017 Management Agreement and pursuant to which ZelnickMedia will continue to provide financial and management consulting services to the Company through March 31, 2029. The 2022 Management Agreement will become effective when our pending acquisition of Zynga closes (refer to Note 23 - Subsequent Events). As part of the 2022 Management Agreement, Strauss Zelnick, the President of ZelnickMedia, will continue to serve as Executive Chairman and Chief Executive Officer of the Company, and Karl Slatoff, a partner of ZelnickMedia, will continue to serve as President of the Company. The 2022 Management Agreement provides for an annual management fee of $3,300 over the term of the agreement and a maximum annual bonus opportunity of $13,200 over the term of the agreement, based on the Company achieving certain performance thresholds. In connection with the 2022 Management Agreement, we expect to grant time-based and performance-based restricted units to ZelnickMedia.
4. FAIR VALUE MEASUREMENTS
The carrying amounts of our financial instruments, including cash and cash equivalents, restricted cash and cash equivalents, accounts receivable, accounts payable and accrued liabilities, approximate fair value because of their short maturities.
We follow a three-level fair value hierarchy that prioritizes the inputs used to measure fair value. This hierarchy requires entities to maximize the use of "observable inputs" and minimize the use of "unobservable inputs." The three levels of inputs used to measure fair value are as follows:
•Level 1—Quoted prices in active markets for identical assets or liabilities.
•Level 2—Observable inputs other than quoted prices included in Level 1, such as quoted prices for markets that are not active or other inputs that are observable or can be corroborated by observable market data.
•Level 3—Unobservable inputs that are supported by little or no market activity and that are significant to the fair value of the assets or liabilities. This includes certain pricing models, discounted cash flow methodologies and similar techniques that use significant unobservable inputs.
70
| March 31, 2022 | Quoted prices in active markets for identical assets (level 1) | Significant other observable inputs (level 2) | Significant unobservable inputs (level 3) | Balance Sheet Classification | ||||||||||||||||||||||||||||
| Bank-time deposits | $ | $ | $ | $ | Cash and cash equivalents | |||||||||||||||||||||||||||
| Money market funds | Cash and cash equivalents | |||||||||||||||||||||||||||||||
| Commercial paper | Cash and cash equivalents | |||||||||||||||||||||||||||||||
| US Treasuries | Cash and cash equivalents | |||||||||||||||||||||||||||||||
| Certificates of Deposit | Cash and cash equivalents | |||||||||||||||||||||||||||||||
| Corporate bonds | Cash and cash equivalents | |||||||||||||||||||||||||||||||
| Money market funds | Restricted cash and cash equivalents | |||||||||||||||||||||||||||||||
| Bank-time deposits | Restricted cash and cash equivalents | |||||||||||||||||||||||||||||||
| Corporate Bonds | Short-term investments | |||||||||||||||||||||||||||||||
| Bank-time deposits | Short-term investments | |||||||||||||||||||||||||||||||
| Commercial paper | Short-term investments | |||||||||||||||||||||||||||||||
| US Treasuries | Short-term investments | |||||||||||||||||||||||||||||||
| Certificates of Deposit | Short-term investments | |||||||||||||||||||||||||||||||
| Private equity | Other assets | |||||||||||||||||||||||||||||||
| Money market funds | Restricted cash and cash equivalents, long term | |||||||||||||||||||||||||||||||
| Foreign currency forward contracts | ( | ( | Accrued expenses and other current liabilities | |||||||||||||||||||||||||||||
| Contingent earn-out consideration | ( | ( | Accrued expenses and other current liabilities | |||||||||||||||||||||||||||||
| Contingent earn-out consideration | ( | ( | Other long-term liabilities | |||||||||||||||||||||||||||||
| Total recurring fair value measurements, net | $ | $ | $ | $ | ( | |||||||||||||||||||||||||||
| March 31, 2021 | Quoted prices in active markets for identical assets (level 1) | Significant other observable inputs (level 2) | Significant unobservable inputs (level 3) | Balance Sheet Classification | ||||||||||||||||||||||||||||
| Money market funds | $ | $ | $ | $ | Cash and cash equivalents | |||||||||||||||||||||||||||
| Bank-time deposits | Cash and cash equivalents | |||||||||||||||||||||||||||||||
| Commercial paper | Cash and cash equivalents | |||||||||||||||||||||||||||||||
| Money market funds | Restricted cash and cash equivalents | |||||||||||||||||||||||||||||||
| Bank-time deposits | Restricted cash and cash equivalents | |||||||||||||||||||||||||||||||
| Corporate Bonds | Short-term investments | |||||||||||||||||||||||||||||||
| Bank-time deposits | Short-term investments | |||||||||||||||||||||||||||||||
| US Treasuries | Short-term investments | |||||||||||||||||||||||||||||||
| Commercial paper | Short-term investments | |||||||||||||||||||||||||||||||
| Asset-backed securities | Short-term investments | |||||||||||||||||||||||||||||||
| Money market funds | Long-term restricted cash and cash equivalents | |||||||||||||||||||||||||||||||
| Private equity | Other assets | |||||||||||||||||||||||||||||||
| Foreign currency forward contracts | ( | ( | Accrued expenses and other current liabilities | |||||||||||||||||||||||||||||
| Total recurring fair value measurements, net | $ | $ | $ | $ | ||||||||||||||||||||||||||||
In connection with the Nordeus acquisition (see Note 22 - Acquisitions), we recorded $61,055 as the initial fair value of contingent earn-out consideration. The fair value was estimated using a Monte-Carlo simulation model, which included significant unobservable Level 3 inputs, such as projected financial performance over the earn-out period along with estimates for market volatility and the discount rate applicable to potential cash payouts.
During the fiscal year ended March 31, 2022, we recognized General and administrative expense of $48,000 within our Consolidated Statements of Operations for the increase in fair value of the contingent earn-out consideration liability associated with the Nordeus acquisition, which increased the fair value of the contingent consideration liability to $109,055 . The increase resulted from a higher probability of Nordeus achieving certain performance measures in the 12 - and 24 -month periods following the closing.
71
We did not have any transfers between Level 1 and Level 2 fair value measurements, nor did we have any transfers into or out of Level 3 during the fiscal year ended March 31, 2022.
Nonrecurring Fair Value Measurements
We hold equity investments in certain unconsolidated entities without a readily determinable fair value. Our strategic investments represent less than a 20% ownership interest in each of the privately held entities, and we do not maintain power over or control of the entities. We have elected the practical expedient in Topic 321, Investments-Equity Securities, to measure these investments at cost less any impairment, adjusted for observable price changes, if any. Based on these considerations, we estimate that the carrying value of the acquired shares represents the fair value of the investment. At March 31, 2022, we held approximately $20,000 of such investments in Other assets within our Consolidated Balance Sheet.
5. SHORT-TERM INVESTMENTS
| March 31, 2022 | ||||||||||||||||||||||||||
| Cost or Amortized Cost | Gross Unrealized | |||||||||||||||||||||||||
| Gains | Losses | Fair Value | ||||||||||||||||||||||||
| Short-term investments | ||||||||||||||||||||||||||
| Bank time deposits | $ | $ | $ | $ | ||||||||||||||||||||||
| Available-for-sale securities: | ||||||||||||||||||||||||||
| Corporate bonds | ( | |||||||||||||||||||||||||
| US Treasuries | ( | |||||||||||||||||||||||||
| Commercial paper | ||||||||||||||||||||||||||
| Certificates of Deposit | ||||||||||||||||||||||||||
| Total short-term investments | $ | $ | $ | ( | $ | |||||||||||||||||||||
| March 31, 2021 | ||||||||||||||||||||||||||
| Cost or Amortized Cost | Gross Unrealized | |||||||||||||||||||||||||
| Gains | Losses | Fair Value | ||||||||||||||||||||||||
| Short-term investments | ||||||||||||||||||||||||||
| Bank time deposits | $ | $ | $ | $ | ||||||||||||||||||||||
| Available-for-sale securities: | ||||||||||||||||||||||||||
| Corporate bonds | ( | |||||||||||||||||||||||||
| US Treasuries | ||||||||||||||||||||||||||
| Commercial paper | ||||||||||||||||||||||||||
| Asset-backed securities | ||||||||||||||||||||||||||
| Total short-term investments | $ | $ | $ | ( | $ | |||||||||||||||||||||
| March 31, 2022 | ||||||||||||||
| Amortized Cost | Fair Value | |||||||||||||
| Short-term investments | ||||||||||||||
| Due in 1 year or less | $ | $ | ||||||||||||
| Due in 1-2 years | ||||||||||||||
| Total short-term investments | $ | $ | ||||||||||||
6. DERIVATIVE INSTRUMENTS AND HEDGING ACTIVITIES
72
for speculative or trading purposes. We classify cash flows from derivative transactions as cash flows from operating activities in our Consolidated Statements of Cash Flows.
Foreign Currency Forward Contracts
| March 31, | ||||||||||||||
| 2022 | 2021 | |||||||||||||
| Forward contracts to sell foreign currencies | $ | $ | ||||||||||||
| Forward contracts to purchase foreign currencies | $ | $ | ||||||||||||
For the fiscal years ended March 31, 2022, 2021 and 2020, we recorded a gain of $5,887 , a loss of $3,584 , and a loss of $959 , respectively, related to foreign currency forward contracts in Interest and other, net on our Consolidated Statements of Operations. Our derivative contracts are foreign currency exchange forward contracts that are not designated as hedging instruments under hedge accounting and are used to reduce the impact of foreign currency on certain balance sheet exposures and certain revenue and expense. These instruments are generally short term in nature, with typical maturities of less than one year, and are subject to fluctuations in foreign exchange rates.
Cross-currency Swaps
In August 2017, we entered into a cross-currency swap agreement related to an intercompany loan that was designated and accounted for as a cash flow hedge of foreign currency exchange risk. During the three months ended June 30, 2020, we settled the intercompany loan and cross-currency swap, thereby discontinuing the cash flow hedge. As a result, we reclassified $3,109 from Accumulated other comprehensive income (loss) to earnings as an increase to Interest and other, net on our Consolidated Statement of Operations. We also received $7,420 in cash to settle our corresponding derivative asset.
7. INVENTORY
| March 31, | ||||||||||||||
| 2022 | 2021 | |||||||||||||
| Finished products | $ | $ | ||||||||||||
| Parts and supplies | ||||||||||||||
| Inventory | $ | $ | ||||||||||||
Estimated product returns included in inventory at March 31, 2022 and 2021 were $21 and $186 , respectively.
8. SOFTWARE DEVELOPMENT COSTS AND LICENSES
| March 31, | ||||||||||||||||||||||||||
| 2022 | 2021 | |||||||||||||||||||||||||
| Current | Non-current | Current | Non-current | |||||||||||||||||||||||
| Software development costs, internally developed | $ | $ | $ | $ | ||||||||||||||||||||||
| Software development costs, externally developed | ||||||||||||||||||||||||||
| Licenses | ||||||||||||||||||||||||||
| Software development costs and licenses | $ | $ | $ | $ | ||||||||||||||||||||||
Software development costs and licenses, net of current portion as of March 31, 2022 and 2021 included $738,038 and $483,110 , respectively, related to titles that have not been released.
73
| Fiscal Year Ended March 31, | ||||||||||||||||||||
| 2022 | 2021 | 2020 | ||||||||||||||||||
| Amortization of software development costs and licenses | $ | $ | $ | |||||||||||||||||
| Impairment of software development costs and licenses | ||||||||||||||||||||
| Less: Portion representing stock-based compensation | ( | ( | ( | |||||||||||||||||
| Amortization and impairment, net of stock-based compensation | $ | $ | $ | |||||||||||||||||
The impairment charges related to (i) a decision not to proceed with further development of certain interactive entertainment software products, and (ii) recognizing unamortized capitalized costs for the development of a title, which were anticipated to exceed the net realizable value of the asset at the time they were impaired.
9. FIXED ASSETS, NET
| March 31, | ||||||||||||||
| 2022 | 2021 | |||||||||||||
| Computer equipment | $ | $ | ||||||||||||
| Leasehold improvements | ||||||||||||||
| Computer software | ||||||||||||||
| Furniture and fixtures | ||||||||||||||
| Office equipment | ||||||||||||||
| Buildings | ||||||||||||||
| Less: accumulated depreciation | ( | ( | ||||||||||||
| Fixed assets, net | $ | $ | ||||||||||||
Depreciation expense related to fixed assets for the fiscal years ended March 31, 2022, 2021 and 2020 was $59,050 , $54,835 and $47,628 , respectively.
The following represents our fixed assets, net by location:
| March 31, | ||||||||||||||
| 2022 | 2021 | |||||||||||||
| United States | $ | $ | ||||||||||||
| International | ||||||||||||||
| Fixed assets, net | $ | $ | ||||||||||||
74
10. GOODWILL AND INTANGIBLE ASSETS, NET
Goodwill
| Total | ||||||||
| Balance at March 31, 2020 | $ | |||||||
| Acquisition of Playdots, Inc. | ||||||||
| Additions from immaterial acquisitions | ||||||||
| Currency translation adjustment | ||||||||
| Balance at March 31, 2021 | $ | |||||||
| Additions from immaterial acquisitions | ||||||||
| Currency translation adjustment | ( | |||||||
| Balance at March 31, 2022 | $ | |||||||
Intangibles
| March 31, | ||||||||||||||||||||||||||||||||||||||||||||
| 2022 | 2021 | |||||||||||||||||||||||||||||||||||||||||||
| Gross Carrying Amount | Accumulated Amortization | Net Book Value | Gross Carrying Amount | Accumulated Amortization | Net Book Value | Weighted average useful life | ||||||||||||||||||||||||||||||||||||||
| Intellectual property | $ | $ | ( | $ | $ | $ | ( | $ | ||||||||||||||||||||||||||||||||||||
| Developed game technology | ( | ( | ||||||||||||||||||||||||||||||||||||||||||
| Branding and trade names | ( | ( | ||||||||||||||||||||||||||||||||||||||||||
| Lease-in-place | ( | |||||||||||||||||||||||||||||||||||||||||||
| User base | ( | ( | ||||||||||||||||||||||||||||||||||||||||||
| Analytics technology | ( | ( | ||||||||||||||||||||||||||||||||||||||||||
| Total intangible assets | $ | $ | ( | $ | $ | $ | ( | $ | ||||||||||||||||||||||||||||||||||||
| Fiscal Year Ended March 31, | ||||||||||||||||||||
| 2022 | 2021 | 2020 | ||||||||||||||||||
| Cost of goods sold | $ | $ | $ | |||||||||||||||||
| Selling and marketing | ||||||||||||||||||||
| Research and development | ||||||||||||||||||||
| Depreciation and amortization | ||||||||||||||||||||
| Total amortization of intangible assets | $ | $ | $ | |||||||||||||||||
| Fiscal Year Ended March 31, | Amortization | |||||||
| 2023 | $ | |||||||
| 2024 | ||||||||
| 2025 | ||||||||
| 2026 | ||||||||
| 2027 | ||||||||
75
11. ACCRUED EXPENSES AND OTHER CURRENT LIABILITIES
| March 31, | ||||||||||||||
| 2022 | 2021 | |||||||||||||
| Software development royalties | $ | $ | ||||||||||||
| Compensation and benefits | ||||||||||||||
| Licenses | ||||||||||||||
| Deferred acquisition payments | ||||||||||||||
| Refund Liability | ||||||||||||||
| Marketing and promotions | ||||||||||||||
| Other | ||||||||||||||
| Accrued expenses and other current liabilities | $ | $ | ||||||||||||
12. DEBT
Credit Agreement
On February 8, 2019, we entered into an unsecured credit agreement (the “Credit Agreement”) , and on June 28, 2021, we amended our unsecured Credit Agreement solely to increase the commitments under the facility by $50,000 (as amended, the “Credit Agreement”) that runs through February 8, 2024. The Credit Agreement provides for an unsecured five-year revolving credit facility with commitments of $250,000 , including sublimits for (i) the issuance of letters of credit in an aggregate face amount of up to $25,000 25,000 200,000 in term loans or revolving credit facilities.
Loans under the Credit Agreement will bear interest at a rate of (a) 0.250 % to 0.750 % above a certain base rate (3.50 % at March 31, 2022) or (b) 1.125 % to 1.750 % above LIBOR (approximately 0.45 % at March 31, 2022), which rates are determined by reference to our consolidated total net leverage ratio. We had no
| March 31, | ||||||||||||||
| 2022 | 2021 | |||||||||||||
| Available borrowings | $ | $ | ||||||||||||
| Outstanding letters of credit | $ | $ | ||||||||||||
We recorded interest expense and fees related to the Credit Agreement of $450 , $355 and $275 , for the fiscal years ended March 31, 2022, 2021 and 2020. The Credit Agreement also includes, among other terms and conditions, maximum leverage ratio, minimum cash reserves and, in certain circumstances, minimum interest coverage ratio financial covenants, as well as limitations on us and each of our subsidiaries’ ability to create, incur, assume or be liable for indebtedness; dispose of assets outside the ordinary course; acquire, merge or consolidate with or into another person or entity; create, incur or allow any lien on any of its property; make investments; or pay dividends or make distributions, in each case subject to certain exceptions. In addition, the Credit Agreement provides for certain events of default such as nonpayment of principal and interest when due thereunder, breaches of representations and warranties, noncompliance with covenants, acts of insolvency and default on indebtedness held by third parties (subject to certain limitations and cure periods).
Bridge Loan
During the fiscal year ended March 31, 2022, in connection with our pending acquisition of Zynga, we received a bridge loan commitment of $2.7 billion from J.P. Morgan and certain other lenders and recognized expense related to interest and fees of $6,075 within Interest and other, net in our Consolidated Statements of Operations. At March 31, 2022, $6,075 of deferred financing costs remained within Prepaid expenses and other on our Consolidated Balance Sheet. The bridge loan was terminated in April 2022 as a result of our debt offering. Refer to Note 23 - Subsequent Events.
76
13. EARNINGS PER SHARE ("EPS")
| Fiscal Year Ended March 31, | ||||||||||||||||||||
| 2022 | 2021 | 2020 | ||||||||||||||||||
| Computation of Basic earnings per share: | ||||||||||||||||||||
| Net income | $ | $ | $ | |||||||||||||||||
| Weighted average common shares outstanding—basic | ||||||||||||||||||||
| Basic earnings per share | $ | $ | $ | |||||||||||||||||
| Computation of Diluted earnings per share: | ||||||||||||||||||||
| Net income | $ | $ | $ | |||||||||||||||||
| Weighted average common shares outstanding—basic | ||||||||||||||||||||
| Add: dilutive effect of common stock equivalents | ||||||||||||||||||||
| Weighted average common shares outstanding—diluted | ||||||||||||||||||||
| Diluted earnings per share | $ | $ | $ | |||||||||||||||||
14. LEASES
Our lease arrangements are primarily for (1) corporate, administrative, and development studio offices and (2) data centers and server equipment. Our existing leases have remaining lease terms ranging from to sixteen years . In certain instances, such leases include one or more options to renew, with renewal terms that generally extend the lease term by to five years for each option. The exercise of lease renewal options is generally at our sole discretion. Additionally, the majority of our leases are classified as operating leases.
Information related to our operating leases are as follows:
| Fiscal Year Ended March 31, | ||||||||||||||||||||
| 2022 | 2021 | 2020 | ||||||||||||||||||
| Lease costs | ||||||||||||||||||||
| Operating lease costs | $ | $ | $ | |||||||||||||||||
| Short term lease costs | $ | $ | $ | |||||||||||||||||
| Fiscal Year Ended March 31, | ||||||||||||||||||||
| 2022 | 2021 | 2020 | ||||||||||||||||||
| Supplemental operating cash flow information | ||||||||||||||||||||
| Cash paid for amounts included in the measurement of lease liabilities | $ | $ | $ | |||||||||||||||||
| ROU assets obtained in exchange for lease obligations | $ | $ | $ | |||||||||||||||||
| March 31, | ||||||||||||||||||||
| 2022 | 2021 | 2020 | ||||||||||||||||||
| Weighted average information | ||||||||||||||||||||
| Remaining lease term | ||||||||||||||||||||
| Discount rate | % | % | % | |||||||||||||||||
77
Future undiscounted lease payments for our operating lease liabilities, and a reconciliation of these payments to our operating lease liabilities at March 31, 2022, are as follows:
| For the years ending March 31, | ||||||||
| 2023 | $ | |||||||
| 2024 | ||||||||
| 2025 | ||||||||
| 2026 | ||||||||
| 2027 | ||||||||
| Thereafter | ||||||||
| Total future lease payments | $ | |||||||
| Less imputed interest | ( | |||||||
| Total lease liabilities | $ | |||||||
15. COMMITMENTS AND CONTINGENCIES
| Fiscal Year Ending March 31, | Software Development and Licensing | Marketing | Purchase Obligations | Total | ||||||||||||||||||||||
| 2023 | $ | $ | $ | $ | ||||||||||||||||||||||
| 2024 | ||||||||||||||||||||||||||
| 2025 | ||||||||||||||||||||||||||
| 2026 | ||||||||||||||||||||||||||
| 2027 | ||||||||||||||||||||||||||
| Thereafter | ||||||||||||||||||||||||||
| Total | $ | $ | $ | $ | ||||||||||||||||||||||
Software Development and Licensing Agreements: We make payments to third-party software developers that include contractual payments to developers under several software development agreements that expire at various times through July 2031. Our aggregate outstanding software development commitments assume satisfactory performance by third-party software developers. We also have licensing commitments that primarily consist of obligations to holders of intellectual property rights for use of their trademarks, copyrights, technology or other intellectual property rights in the development of our products.
Marketing Agreements: We have certain minimum marketing support commitments where we commit to spend specified amounts related to marketing our products. Marketing commitments expire at various times through March 2027 and primarily reflect our agreements with major sports leagues and players' associations.
Purchase Obligations: These obligations are primarily related to agreements to purchase services that are enforceable and legally binding on us that specifies all significant terms, including fixed, minimum or variable pricing provisions; and the approximate timing of the transactions, expiring at various times through March 2027.
Employee Savings Plans: For our United States employees we maintain a 401(k) retirement savings plan and trust. Our 401(k) plan is offered to all eligible employees and participants may make voluntary contributions. We also have various pension plans for our non-U.S. employees, some of which are required by local laws, and allow or require employer contributions. Employer contributions under all defined contribution and pension plans during the fiscal years ended March 31, 2022, 2021, and 2020 were $22,445 , $17,701 , and $14,071 , respectively.
Legal and Other Proceedings: We are, or may become, subject to demands and claims (including intellectual property and employment related claims) and are involved in routine litigation in the ordinary course of business which we do not believe to be material to our business or financial condition or results of operations. We have appropriately accrued amounts related to certain of these claims and legal and other proceedings. While it is reasonably possible that a loss may be incurred in excess of the amounts accrued in our financial statements, we believe that such losses, unless otherwise disclosed, would not be material.
78
16. INCOME TAXES
| Fiscal Year Ended March 31, | ||||||||||||||||||||
| 2022 | 2021 | 2020 | ||||||||||||||||||
| Domestic | $ | $ | $ | |||||||||||||||||
| Foreign | ||||||||||||||||||||
| Income before income taxes | $ | $ | $ | |||||||||||||||||
| Fiscal Year Ended March 31, | ||||||||||||||||||||
| 2022 | 2021 | 2020 | ||||||||||||||||||
| Current: | ||||||||||||||||||||
| U.S. federal | $ | $ | $ | |||||||||||||||||
| U.S. state and local | ( | |||||||||||||||||||
| Foreign | ||||||||||||||||||||
| Total current income taxes | ||||||||||||||||||||
| Deferred: | ||||||||||||||||||||
| U.S. federal | ||||||||||||||||||||
| U.S. state and local | ||||||||||||||||||||
| Foreign | ( | ( | ( | |||||||||||||||||
| Total deferred income taxes | ||||||||||||||||||||
| Provision for income taxes | $ | $ | $ | |||||||||||||||||
A reconciliation of our effective tax rate to the U.S. statutory federal income tax rate is as follows:
| Fiscal Year Ended March 31, | ||||||||||||||||||||
| 2022 | 2021 | 2020 | ||||||||||||||||||
| U.S. federal statutory rate | % | % | % | |||||||||||||||||
| State and local taxes, net of U.S. federal benefit | % | % | % | |||||||||||||||||
Foreign tax rate differential(1) | ( | % | ( | % | % | |||||||||||||||
Foreign earnings(2) | ( | % | ( | % | ( | % | ||||||||||||||
Tax credits(3) | ( | % | ( | % | ( | % | ||||||||||||||
| Excess tax benefits from stock-based compensation | ( | % | ( | % | ( | % | ||||||||||||||
| Earn-out adjustments | % | % | % | |||||||||||||||||
| Valuation allowance—domestic | ( | % | % | % | ||||||||||||||||
Valuation allowance—foreign(2) | % | % | % | |||||||||||||||||
| Change in reserves | ( | % | ( | % | ( | % | ||||||||||||||
| Other | % | % | % | |||||||||||||||||
| Effective tax rate | % | % | % | |||||||||||||||||
(1) The foreign rate differentials in relation to foreign earnings, for all periods presented, are primarily driven by changes in the mix of our foreign earnings and the difference between the foreign and U.S. income tax rates. Fiscal year ended March 31, 2020 includes the impact of the reversal of a net deferred tax asset of $19,826 related to the effects of stock-based compensation from our intercompany cost-sharing arrangements due to an appeals court decision issued in Altera Corp. v. Commissioner.
(2) Fiscal year ended March 31, 2022 includes effects of an increase of the deferred tax asset related to the Federal Act on Tax Reform and AVH Financing ("TRAF") enacted on January 1, 2020. Fiscal year ended March 31, 2020 includes effects of a deferred tax asset and valuation allowance associated with a tax basis step up received in Switzerland related to TRAF.
(3) Tax benefits were recorded for fiscal years ended March 31, 2022, 2021, and 2020 attributable to certain tax credits related to software development activities.
79
| March 31, | ||||||||||||||
| 2022 | 2021 | |||||||||||||
| Deferred tax assets: | ||||||||||||||
| Accrued compensation expense | $ | $ | ||||||||||||
| Equity-based compensation | ||||||||||||||
| Tax credit carryforward | ||||||||||||||
| Tax basis step up related to TRAF | ||||||||||||||
| Operating lease liabilities | ||||||||||||||
| Net operating loss carryforward | ||||||||||||||
| Deferred revenue | ||||||||||||||
| Business reorganization | ||||||||||||||
| Other | ||||||||||||||
| Total deferred tax assets | ||||||||||||||
| Less: Valuation allowance | ( | ( | ||||||||||||
| Net deferred tax assets | $ | $ | ||||||||||||
| Deferred tax liabilities: | ||||||||||||||
| Capitalized software and depreciation | $ | ( | $ | ( | ||||||||||
| Right of use assets | ( | ( | ||||||||||||
| Intangible amortization | ( | ( | ||||||||||||
| Deferred revenue | ||||||||||||||
| Other | ( | ( | ||||||||||||
| Total deferred tax liabilities | ( | ( | ||||||||||||
Net deferred tax asset (1) | $ | $ | ||||||||||||
(1) As of March 31, 2022, $73,801 is included in Deferred tax assets and $21,788 is included in Other long-term liabilities. As of March 31, 2021, $90,206 is included in Deferred tax assets and $3,457 is included in Other long-term liabilities.
The valuation allowance is primarily attributable to deferred tax assets for which no benefit is provided due to uncertainty with respect to their realization.
At March 31, 2022, we had domestic net operating loss carryforwards totaling $32,955 of which $13,131 will expire in 2023 to 2028, $13,210 will expire from 2029 to 2032, and $6,614 will expire in 2035 to 2041. In addition, we had foreign net operating loss carryforwards of $39,074 , of which $18,438 will expire from 2026 to 2028, $7,317 will expire from 2041 to 2042 and the remainder may be carried forward indefinitely.
At March 31, 2022, we had domestic tax credit carryforwards totaling $194,517 , of which $47,743 expire in 2039 to 2043, and the remainder may be carried forward indefinitely.
The total amount of undistributed earnings of foreign subsidiaries was approximately $392,647 at March 31, 2022 and $419,887 at March 31, 2021. As of March 31, 2022, it is our intention to reinvest indefinitely undistributed earnings of our foreign subsidiaries. Accordingly, no provision has been made for foreign withholding taxes or U.S. income taxes which may become payable if undistributed earnings of foreign subsidiaries are repatriated. It is not practicable to estimate the tax liability that would arise if these earnings were remitted.
We are regularly audited by domestic and foreign taxing authorities. Audits may result in tax assessments in excess of amounts claimed and the payment of additional taxes. We believe that our tax return positions comply with applicable tax law and that we have adequately provided for reasonably foreseeable assessments of additional taxes. Additionally, we believe that any assessments in excess of the amounts provided for will not have a material adverse effect on our Consolidated Financial Statements. It is possible that settlement of audits or the expiration of the statute of limitations may have an impact on our effective tax rate in future periods.
We recognize interest and penalties related to uncertain tax positions in the provision for income taxes in our Consolidated Statements of Operations. For the fiscal years ended March 31, 2022, 2021 and 2020, we recognized an increase of interest and penalties of $1,877 , $2,594 and $71 , respectively. The gross amount of interest and penalties accrued as of March 31, 2022 and 2021 was $11,228 and $9,351 , respectively.
80
As of March 31, 2022, we had gross unrecognized tax benefits, including interest and penalties, of $176,024 , of which $65,781 would affect our effective tax rate if realized. For the fiscal year ended March 31, 2022, gross unrecognized tax benefits increased by $8,464 .
We are no longer subject to audit for U.S. federal income tax returns for periods prior to our fiscal year ended March 31, 2019 and state income tax returns for periods prior to the fiscal year ended March 31, 2018. With few exceptions, we are no longer subject to income tax examinations in non-U.S. jurisdictions for years prior to fiscal year ended March 31, 2016. Certain U.S. state and foreign taxing authorities are currently examining our income tax returns for the fiscal years ended March 31, 2015 through March 31, 2019.
The timing of the resolution of income tax examinations is highly uncertain, and the amounts ultimately paid, if any, upon resolution of the issues raised by the taxing authorities may differ materially from the amounts accrued for each year. Although potential resolution of uncertain tax positions involve multiple tax periods and jurisdictions, it is reasonably possible that a reduction of $8,817 of unrecognized tax benefits may occur within the next 12 months, some of which, depending on the nature of the settlement or expiration of statutes of limitations, may affect our income tax provision and therefore benefit the resulting effective tax rate. The actual amount could vary significantly depending on the ultimate timing and nature of any settlements.
| Fiscal Year Ended March 31, | ||||||||||||||||||||
| 2022 | 2021 | 2020 | ||||||||||||||||||
| Balance, beginning of period | $ | $ | $ | |||||||||||||||||
| Additions: | ||||||||||||||||||||
| Current year tax positions | ||||||||||||||||||||
| Prior year tax positions | ||||||||||||||||||||
| Reduction of prior year tax positions | ( | ( | ||||||||||||||||||
| Lapse of statute of limitations | ( | ( | ( | |||||||||||||||||
| Balance, end of period | $ | $ | $ | |||||||||||||||||
We believe that we have provided for any reasonably foreseeable outcomes related to our tax audits and that any settlement will not have a material adverse effect on our consolidated financial statements. However, there can be no assurances as to the possible outcomes.
17. STOCK-BASED COMPENSATION
Stock Incentive Plan
In September 2017, our stockholders approved our 2017 Stock Incentive Plan (the "2017 Plan"). The aggregate number of shares issuable under the 2017 Plan is 13,954 , subject to adjustment as set forth in the 2017 Plan, and, as of March 31, 2022, there were approximately 8,348 shares available for issuance. The 2017 Plan is administered by the Compensation Committee of the Board of Directors and allows for awards of restricted stock units and other stock-based awards of our common stock to employees and non-employees, including to ZelnickMedia in connection with their contract to provide executive management service to us. Subject to the provisions of the plans, the Board of Directors, or any Committee appointed by the Board of Directors, has the authority to determine the individuals to whom the equity awards are to be granted, the number of shares to be covered by each equity award, the vesting period, restrictions, if any, on the equity award and the terms and conditions of the equity award. Upon the vesting of certain stock-based awards, employees have the option to have us withhold shares to satisfy the employee's federal and state tax withholding requirements.
81
Stock-Based Compensation Expense
| Fiscal Year Ended March 31, | ||||||||||||||||||||
| 2022 | 2021 | 2020 | ||||||||||||||||||
| Cost of goods sold | $ | $ | $ | |||||||||||||||||
| Selling and marketing | ||||||||||||||||||||
| General and administrative | ||||||||||||||||||||
| Research and development | ||||||||||||||||||||
| Stock-based compensation expense before income taxes | $ | $ | $ | |||||||||||||||||
| Income tax provision/(benefit) | $ | ( | $ | ( | $ | ( | ||||||||||||||
| Stock-based compensation expense, net of income tax benefit | $ | $ | $ | |||||||||||||||||
| Capitalized stock-based compensation expense | $ | $ | $ | |||||||||||||||||
During the fiscal year ended March 31, 2022, the forfeiture of awards resulted in the reversal of expense of $690 and amounts capitalized as software development costs of $3,201 . During the fiscal year ended March 31, 2021, the forfeiture of awards resulted in the reversal of expense of $69,758 and amounts capitalized as software development costs of $10,837 . During the fiscal year ended March 31, 2020, the forfeiture of awards resulted in the reversal of expense of $425 and amounts capitalized as software development costs of $2,607 .
As of March 31, 2022, the total future unrecognized compensation cost related to outstanding unvested restricted stock was $466,143 and will be either recognized as compensation expense over a weighted-average period of approximately 2.96 years or capitalized as software development costs.
For the fiscal years ended March 31, 2022, 2021 and 2020, the total fair values of restricted stock units that vested were $208,614 , $205,867 and $219,007 , respectively.
Restricted Stock Units
Employee Awards
Time-based restricted stock units granted to employees under our stock-based compensation plans generally vest either annually or quarterly over three years from the date of grant. Certain restricted stock units granted to key officers, senior-level employees, or key employees vest based on market conditions, primarily related to the performance of the price of our common stock. Certain restricted stock units granted to key officers, senior-level employees, or key employees vest based on performance conditions, primarily related to performance metrics around certain of our titles.
ZelnickMedia Non-Employee Awards
| Fiscal Year Ended March 31, | ||||||||||||||
| 2022 | 2021 | |||||||||||||
| Time-based | ||||||||||||||
Market-based(1) | ||||||||||||||
Performance-based(1) | ||||||||||||||
| IP | ||||||||||||||
| Recurrent Consumer Spending ("RCS") | ||||||||||||||
| Total Performance-based | ||||||||||||||
| Total Restricted Stock Units | ||||||||||||||
(1) Represents the maximum number of shares eligible to vest.
Time-based restricted stock units granted in fiscal year 2022 will vest on April 13, 2023, provided that the 2017 Management Agreement or the 2022 Management Agreement, as applicable, has not been terminated prior to such vesting date, and those granted in fiscal 2021 vested on April 13, 2022.
82
Market-based restricted stock units granted in fiscal year 2022 are eligible to vest on April 13, 2023, provided that the 2017 Management Agreement or the 2022 Management Agreement, as applicable, has not been terminated prior to such vesting date, and those granted in fiscal 2021 vested on April 13, 2022. Market-based restricted stock units are eligible to vest based on our Total Shareholder Return (as defined in the relevant grant agreement) relative to the Total Shareholder Return (as defined in the relevant grant agreement) of the companies that constitute the NASDAQ Composite Index as of the grant date measured over a two-year period. To earn the target number of market-based restricted stock units (which represents 50 % of the number of the market-based restricted stock units set forth in the table above), the Company must perform at the 50th percentile, with the maximum number of market-based restricted stock units earned if the Company performs at least at the 75th percentile.
Performance-based restricted stock units granted in fiscal year 2022 are eligible to vest on April 13, 2023, provided that the 2017 Management Agreement or the 2022 Management Agreement, as applicable, has not been terminated prior to such vesting date, and those granted in fiscal 2021 vested on April 13, 2022. Performance-based restricted stock units, of which 50 % are tied to "IP" and 50 % to "RCS" (as defined in the relevant grant agreement), are eligible to vest based on the Company's achievement of certain performance metrics (as defined in the relevant grant agreement) of either individual product releases of "IP" or "RCS" measured over a two-year period. The target number of performance-based restricted stock units that may be earned pursuant to these grants is equal to 50 % of the grant amounts set forth in the above table (the numbers in the table represent the maximum number of performance-based restricted stock units that may be earned). At the end of each reporting period, we assess the probability of each performance metric and upon determination that certain thresholds are probable, we record expense for the unvested portion of the shares of performance-based restricted stock units. Certain performance metrics have been achieved as of March 31, 2022 for the "IP" and "RCS" performance-based restricted stock units granted in fiscal year 2021 and fiscal year 2022.
The unvested portion of time-based, market-based and performance-based restricted stock units held by ZelnickMedia as of March 31, 2022 and 2021 were 449 and 588 , respectively. During the fiscal year ended March 31, 2022, 315 restricted stock units previously granted to ZelnickMedia vested and 0 restricted stock units were forfeited by ZelnickMedia.
Fair Value of Stock-Based Awards
Time-Based Awards
The estimated value, based on the closing price of our stock on the grant date, of time-based restricted stock units granted to employees during the fiscal years ended March 31, 2022, 2021 and 2020 was $180.97 , $171.58 and $115.01 per share, respectively.
For the fiscal years ended March 31, 2022, 2021 and 2020, the estimated value, based on the closing price of our stock on the grant date, of time-based restricted stock awards granted to ZelnickMedia was $182.66 , $120.00 and $92.65 per share, respectively.
83
| Shares (in thousands) | Weighted Average Fair Value on Grant Date | |||||||||||||
| Non-vested restricted stock units at March 31, 2021 | $ | |||||||||||||
| Granted | $ | |||||||||||||
| Vested | ( | $ | ||||||||||||
| Forfeited | ( | $ | ||||||||||||
| Non-vested restricted stock units at March 31, 2022 | $ | |||||||||||||
Market-Based Awards
| Fiscal Year Ended March 31, | ||||||||||||||||||||||||||||||||||||||
| 2022 | 2021 | 2020 | ||||||||||||||||||||||||||||||||||||
| Employee Market-Based | Non-Employee Market-Based | Employee Market-Based | Non-Employee Market-Based | Employee Market-Based | Non-Employee Market-Based | |||||||||||||||||||||||||||||||||
| Risk-free interest rate | % | % | % | % | % | % | ||||||||||||||||||||||||||||||||
| Expected stock price volatility | % | % | % | % | % | % | ||||||||||||||||||||||||||||||||
| Expected service period (years) | ||||||||||||||||||||||||||||||||||||||
| Dividends | ||||||||||||||||||||||||||||||||||||||
The estimated value of market-based restricted stock awards granted to employees during the fiscal years ended March 31, 2022, 2021, and 2020 was $292.76 , $279.09 , and $201.07 per share, respectively. For the fiscal years ended March 31, 2022, 2021, and 2020, the estimated value of the market-based restricted stock awards granted to ZelnickMedia was $293.32 , $200.34 , and $132.50 per share, respectively.
| Shares (in thousands) | Weighted Average Fair Value on Grant Date | |||||||||||||
| Non-vested restricted stock units at March 31, 2021 | $ | |||||||||||||
| Granted | $ | |||||||||||||
| Vested | ( | $ | ||||||||||||
| Forfeited | ( | $ | ||||||||||||
| Non-vested restricted stock units at March 31, 2022 | $ | |||||||||||||
Performance-Based Awards
The estimated value of performance-based restricted stock awards granted to employees during the fiscal year ended March 31, 2022, 2021, and 2020 was $176.05 , $176.42 , and $124.50 , respectively. For the fiscal years ended March 31, 2022, 2021, and 2020, the estimated value of the performance-based restricted stock awards granted to ZelnickMedia was $182.66 , $120.00 , and $92.65 per share, respectively.
84
| Shares (in thousands) | Weighted Average Fair Value on Grant Date | |||||||||||||
| Non-vested restricted stock units at March 31, 2021 | $ | |||||||||||||
| Granted | $ | |||||||||||||
| Vested | ( | $ | ||||||||||||
| Forfeited | ( | $ | ||||||||||||
| Non-vested restricted stock units at March 31, 2022 | $ | |||||||||||||
Employee Stock Purchase Plans
In September 2017, our stockholders approved our 2017 Global Employee Stock Purchase Plan as amended and restated ("ESPP"). The maximum aggregate number of shares of common stock that may be issued under the plan is 9,000 , and as of March 31, 2022, there were approximately 8,535 shares available for issuance. The ESPP is administered by the Compensation Committee of the Board of Directors and allows for eligible employees an option to purchase shares of our common stock, which the employee may or may not exercise during an offering period. Eligible employees may authorize payroll deductions of between 1 % and 10 % of their compensation to purchase shares of common stock at 85% of the lower of the market price of our common stock on the date of commencement of the applicable offering period or on the last day of each six-month purchase period.
The fair value is determined using the Black-Scholes valuation model. Key assumptions of the Black-Scholes valuation model are the risk-free interest rate, expected volatility, expected term and expected dividends. The risk-free interest rate is based on U.S. Treasury yields in effect at the time of grant for the expected term of the option. Expected volatility is based on historical stock price volatility. Expected term is determined based on historical exercise behavior, post-vesting termination patterns, options outstanding and future expected exercise behavior. The following table summarizes the assumptions used in the Black-Scholes valuation model to value our purchase rights:
| Fiscal Year Ended March 31, | ||||||||||||||
| 2022 | 2021 | |||||||||||||
| Risk-free interest rate | ||||||||||||||
| Expected stock price volatility | ||||||||||||||
| Expected service period (years) | ||||||||||||||
| Dividends | ||||||||||||||
For the fiscal year ended March 31, 2022, our employees purchased 143 shares for $19,657 with a weighted-average fair value of $137.84 . For the fiscal year ended March 31, 2021, our employees purchased 139 shares for $14,214 with a weighted-average fair value of $101.81 .
18. SHARE REPURCHASE PROGRAM
Our Board of Directors has authorized the repurchase of up to 21,660 shares of our common stock, including an increase of 7,442 shares in November 2021. Under this program, we may purchase shares from time to time through a variety of methods, including in the open market or through privately negotiated transactions, in accordance with applicable securities laws. Repurchases are subject to the availability of stock, prevailing market conditions, the trading price of the stock, our financial performance and other conditions. The program does not require us to repurchase shares and may be suspended or discontinued at any time for any reason.
During the fiscal years ended March 31, 2022, 2021, and 2020 we repurchased 1,260 , 0 , and 0 shares of our common stock in the open market, respectively, for $200,012 , $0 , and $0 , respectively, including commissions of $13 , $0 and $0 , respectively, as part of the program. As of March 31, 2022, we had repurchased a total of 11,660 shares of our common stock under the program, and 10,000 shares of our common stock remained available for repurchase under the share repurchase program.
All of the repurchased shares are classified as Treasury stock in our Consolidated Balance Sheets.
85
19. INTEREST AND OTHER, NET
| Fiscal Year Ended March 31, | ||||||||||||||||||||
| 2022 | 2021 | 2020 | ||||||||||||||||||
| Interest income | $ | $ | $ | |||||||||||||||||
| Interest expense | ( | ( | ( | |||||||||||||||||
| Foreign currency exchange gain (loss) | ( | ( | ||||||||||||||||||
| Other | ( | ( | ( | |||||||||||||||||
| Interest and other, net | $ | ( | $ | $ | ||||||||||||||||
20. ACCUMULATED OTHER COMPREHENSIVE INCOME (LOSS)
| Foreign currency translation adjustments | Unrealized gain (loss) on derivative instruments | Unrealized gain (loss) on cross-currency swap | Unrealized gain (loss) on available- for-sales securities | Total | ||||||||||||||||||||||||||||
| Balance at March 31, 2020 | $ | ( | $ | $ | $ | ( | $ | ( | ||||||||||||||||||||||||
| Other comprehensive (loss) income before reclassifications | ( | |||||||||||||||||||||||||||||||
| Amounts reclassified from accumulated other comprehensive (loss) income | ( | ( | ( | |||||||||||||||||||||||||||||
| Tax effect on cross-currency swap | ||||||||||||||||||||||||||||||||
| Balance at March 31, 2021 | $ | ( | $ | $ | $ | $ | ( | |||||||||||||||||||||||||
| Other comprehensive income (loss) before reclassifications | ( | ( | ( | |||||||||||||||||||||||||||||
| Balance at March 31, 2022 | $ | ( | $ | $ | $ | ( | $ | ( | ||||||||||||||||||||||||
21. SUPPLEMENTARY FINANCIAL INFORMATION
| Beginning Balance | Additions | Deductions | Other | Ending Balance | ||||||||||||||||||||||||||||
| Fiscal Year Ended March 31, 2022 | ||||||||||||||||||||||||||||||||
| Valuation allowance for deferred income taxes | $ | ( | $ | |||||||||||||||||||||||||||||
| Allowance for doubtful accounts | ||||||||||||||||||||||||||||||||
| Fiscal Year Ended March 31, 2021 | ||||||||||||||||||||||||||||||||
| Valuation allowance for deferred income taxes | $ | ( | $ | |||||||||||||||||||||||||||||
| Allowance for doubtful accounts | ( | |||||||||||||||||||||||||||||||
| Fiscal Year Ended March 31, 2020 | ||||||||||||||||||||||||||||||||
| Valuation allowance for deferred income taxes | $ | ( | $ | |||||||||||||||||||||||||||||
| Allowance for doubtful accounts | ( | ( | ||||||||||||||||||||||||||||||
22. ACQUISITIONS
Nordeus Acquisition
On June 1, 2021, we completed the acquisition of 94.5 % of Nordeus Limited ("Nordeus"), a privately-held Irish holding company of a Belgrade, Serbia based free-to-play mobile game developer, for initial consideration of $120,488 in cash, 515 shares of our common stock, and a contingent earn-out consideration arrangement that requires us to pay up to an aggregate
86
of $153,000 in cash if Nordeus achieves certain performance measures over the 12 - and 24 -month periods following the closing. The cash portion was funded from our cash on hand. In addition, we exercised our option to purchase the remaining 5.5 % of the outstanding equity of Nordeus for cash consideration of $12,375 , in September 2021.
We acquired Nordeus as part of our ongoing strategy to expand selectively our portfolio of owned intellectual property and to diversify and strengthen further our mobile offerings.
The acquisition-date fair value of the consideration totaled $289,774 , which consisted of the following:
| Fair value of purchase consideration | |||||
| Cash, including call option exercise | $ | ||||
Common stock ( | |||||
| Contingent earn-out | $ | ||||
| Deferred payment | $ | ||||
| Total | $ | ||||
The fair value of the contingent earn-out consideration arrangement at the acquisition date was $61,055 . We estimated the fair value of the contingent earn-out consideration using a Monte Carlo simulation model. This fair value measurement is based on significant inputs not observable in the market and thus represents a Level 3 measurement as defined in ASC 820. (Refer to Note 4 - Fair Value Measurements.)
During the fiscal year ended March 31, 2022, we recognized General and administrative expense of $48,000 , within our Consolidated Statements of Operations for the increase in fair value of the contingent earn-out consideration liability associated with the acquisition of Nordeus. We reported $66,025 within Accrued expenses and $43,030 within Other long-term liabilities in our Consolidated Balance Sheet as of March 31, 2022.
We used the acquisition method of accounting and recognized assets and liabilities at their fair value as of the date of acquisition, with the excess recorded to goodwill. The preliminary fair values of net tangible and intangible assets are management’s estimates based on the information available at the acquisition date and may change over the measurement period, which will end no later than one year from the acquisition date, as additional information is received. The following table summarizes the preliminary acquisition date fair value of net tangible and intangible assets acquired, net of liabilities assumed from Nordeus:
| Fair Value | Weighted average useful life | ||||||||||
| Cash acquired | $ | N/A | |||||||||
| Other tangible net assets | N/A | ||||||||||
| Other liabilities assumed | ( | N/A | |||||||||
| Intangible Assets | |||||||||||
| Developed game technology | |||||||||||
| User base | |||||||||||
| Branding and trade names | |||||||||||
| Game engine technology | |||||||||||
| Goodwill | N/A | ||||||||||
| Total | $ | ||||||||||
Goodwill, which is not deductible for U.S. income tax purposes, is primarily attributable to the assembled workforce of the acquired business and expected synergies at the time of the acquisition.
87
The amounts of revenue and earnings of Nordeus included in our Consolidated Statement of Operations from the acquisition date to the fiscal year ending March 31, 2022 are as follows:
| Fiscal Year Ended March 31, 2022 | |||||
| Net revenue | $ | ||||
| Net loss | $ | ||||
The following table summarizes the pro-forma consolidated results of operations (unaudited) for the fiscal year ended March 31, 2022, as though the acquisition had occurred on April 1, 2020, the beginning of our fiscal year 2021 and Nordeus had been included in our consolidated results for the entire periods subsequent to that date.
| Fiscal Year Ended March 31, | ||||||||||||||
| 2022 | 2021 | |||||||||||||
| Pro forma Net revenue | $ | $ | ||||||||||||
| Pro forma Net income | $ | $ | ||||||||||||
The unaudited pro-forma consolidated results above are based on the historical financial statements of the Company and Nordeus and not necessarily indicative of the results of operations that would have been achieved if the acquisition was completed at the beginning of fiscal year 2021 and are not indicative of the future operating results of the combined company. The financial information for Nordeus prior to the acquisition has been included in the pro-forma results of operations and includes certain adjustments to the historical consolidated financial statements of Nordeus to align with our accounting policies. The pro-forma consolidated results of operations also include the business combination accounting effects resulting from the acquisition, including amortization expense related to finite-lived intangible assets acquired and the related tax effects assuming that the business combination occurred on April 1, 2020.
Transaction costs of $5,100 for the fiscal year ended March 31, 2022, which have been recorded within General and administrative expense in our Consolidated Statements of Operations, have been excluded from the above pro-forma consolidated results of operations due to their non-recurring nature.
Asset Acquisition
In June 2021, we acquired two office buildings in the United Kingdom to use for office space for total cash consideration of $72,908 . The transaction was treated as an asset acquisition, in which the cash consideration and direct transaction costs were allocated on a relative fair value basis to identified assets. The following table summarizes the acquisition date fair value of tangible assets, which are included within Fixed assets, net on our Consolidated Balance Sheets, and intangible assets, which are included within Intangible assets, net on our Consolidated Balance Sheets, acquired:
| Fair Value | Weighted average useful life | ||||||||||
| Building | $ | ||||||||||
| Land | N/A | ||||||||||
| Lease-in-place intangible asset | |||||||||||
| Total | $ | ||||||||||
23. SUBSEQUENT EVENTS
Pending Acquisition
On January 9, 2022, we entered into a definitive merger agreement to acquire Zynga, a leading developer of mobile games. Under the terms and subject to the conditions of the merger agreement, Zynga stockholders will receive $3.50 in cash and a number of shares of our common stock equal to the exchange ratio for each share of Zynga common stock outstanding at the closing. The transaction is valued at $9.86 per share of Zynga common stock based on the market closing as of January 7, 2022, implying an enterprise value of $12.7 billion. The transaction includes a collar mechanism on the equity consideration, so that if the volume weighted average price ("VWAP") of Take-Two common stock on the Nasdaq Global Select Market for the
88
consecutive period beginning at 9:30 a.m. New York time on the twenty-third trading day immediately preceding the closing date of the transaction and concluding at 4:00 p.m. New York time on the third trading day preceding such closing date is in a range from $156.50 to $181.88 , the exchange ratio would be adjusted to deliver total consideration of $9.86 per Zynga share. If the VWAP of our common stock for the period noted in the prior sentence exceeds the higher end of that range the exchange ratio would be 0.0350 per share, and, if the VWAP is below the lower end of that range, the exchange ratio would be 0.0406 per share.
The transaction, which is currently anticipated to close during on Monday May 23, 2022, is subject to approval by Take-Two and Zynga stockholders and the satisfaction of the other customary closing conditions.
In connection with the transaction, on April 14, 2022, we completed our offering and sale of $2.7 billion aggregate principal amount of our senior notes, consisting of $1.0 billion principal amount of our 3.300 % Senior Notes due 2024 (the “2024 Notes”), $600 million principal amount of our 3.550 % Senior Notes due 2025 (the “2025 Notes”), $600 million principal amount of our 3.700 % Senior Notes due 2027 (the “2027 Notes”) and $500 million principal amount of our 4.000 % Senior Notes due 2032 (the “2032 Notes” and, together with the 2024 Notes, the 2025 Notes and the 2027 Notes, the “Notes”).The Notes were issued under an indenture between the Company and The Bank of New York Mellon, as trustee (the “Trustee”).
The Notes are the Company’s senior unsecured obligations and rank equally with all of our other existing and future unsubordinated obligations. The 2024 Notes mature on March 28, 2024 and bear interest at an annual rate of 3.300 %. The 2025 Notes mature on April 14, 2025 and bear interest at an annual rate of 3.550 %. The 2027 Notes mature on April 14, 2027 and bear interest at an annual rate of 3.700 %. The 2032 Notes mature on April 14, 2032 and bear interest at an annual rate of 4.000 %. We will pay interest on the 2024 Notes semiannually on March 28 and September 28 of each year, commencing September 28, 2022. We will pay interest on each of the 2025 Notes, 2027 Notes and 2032 Notes semi-annually on April 14 and October 14 of each year, commencing October 14, 2022.
ZelnickMedia Management Agreement
See Note 3 - Management Agreement for information relating to the 2022 Management Agreement entered into with ZelnickMedia.
89
SIGNATURES
Pursuant to the requirements of Section 13 or 15(d) of the Securities Exchange Act of 1934 the registrant has duly caused this report to be signed on its behalf by the undersigned, thereunto duly authorized.
| TAKE-TWO INTERACTIVE SOFTWARE, INC. | ||||||||
| By: | /s/ STRAUSS ZELNICK | |||||||
| Strauss Zelnick Chairman and Chief Executive Officer | ||||||||
| May 16, 2022 | ||||||||
POWER OF ATTORNEY
Each individual whose signature appears below constitutes and appoints Strauss Zelnick and Lainie Goldstein and each of them, his or her true and lawful attorneys-in-fact and agents with full power of substitution, for him or her and in his or her name, place and stead, in any and all capacities, to sign any and all amendments to this Annual Report on Form 10-K, and to file the same, with all exhibits thereto and all documents in connection therewith, with the Securities and Exchange Commission, granting unto said attorneys-in-fact and agents, and each of them, full power and authority to do and perform each and every act and thing requisite and necessary to be done in and about the premises, as fully to all intents and purposes as he or she might or could do in person, hereby ratifying and confirming all that said attorneys-in-fact and agents or any of them, or his, her or their substitute or substitutes, may lawfully do or cause to be done or by virtue hereof.
Pursuant to the requirements of the Securities Exchange Act of 1934, this report has been signed below by the following persons on behalf of the Registrant in the capacities and on the date indicated.
| Signature | Title | Date | ||||||||||||
| /s/ STRAUSS ZELNICK | Chairman and Chief Executive Officer (Principal Executive Officer) | |||||||||||||
| Strauss Zelnick | May 16, 2022 | |||||||||||||
| /s/ LAINIE GOLDSTEIN | Chief Financial Officer (Principal Financial and Accounting Officer) | |||||||||||||
| Lainie Goldstein | May 16, 2022 | |||||||||||||
| /s/ MICHAEL DORNEMANN | ||||||||||||||
| Michael Dornemann | Lead Independent Director | May 16, 2022 | ||||||||||||
| /s/ ROLAND HERNANDEZ | ||||||||||||||
| Roland Hernandez | Director | May 16, 2022 | ||||||||||||
| /s/ J MOSES | ||||||||||||||
| J Moses | Director | May 16, 2022 | ||||||||||||
| /s/ MICHAEL SHERESKY | ||||||||||||||
| Michael Sheresky | Director | May 16, 2022 | ||||||||||||
| /s/ LAVERNE SRINIVASAN | ||||||||||||||
| LaVerne Srinivasan | Director | May 16, 2022 | ||||||||||||
| /s/ SUSAN TOLSON | ||||||||||||||
| Susan Tolson | Director | May 16, 2022 | ||||||||||||
| /s/ PAUL VIERA | ||||||||||||||
| Paul Viera | Director | May 16, 2022 | ||||||||||||
90
Serious News for Serious Traders! Try StreetInsider.com Premium Free!
You May Also Be Interested In
- Take-Two Interactive Software (TTWO) to Cut 5% Staff, Announces Cost Reduction Plan
- SM ENERGY SCHEDULES FIRST QUARTER 2024 EARNINGS RELEASE AND CALL
- Betterware Joins the Mexican Olympic Committee in Supporting Athletes Representing Mexico at the 2024 Olympiad
Create E-mail Alert Related Categories
SEC FilingsSign up for StreetInsider Free!
Receive full access to all new and archived articles, unlimited portfolio tracking, e-mail alerts, custom newswires and RSS feeds - and more!
