

Form 10-K Summit Materials, LLC For: Dec 31 Filed by: Summit Materials, Inc.
 Tweet
Tweet Share
ShareUNITED STATES
SECURITIES AND EXCHANGE COMMISSION
Washington, D.C. 20549
FORM 10-K
(Mark One)
For the fiscal year ended December 31 , 2022
OR
For the transition period from to
Commission file numbers:
(exact name of registrants as specified in their charters)
(State or other jurisdiction of incorporation or organization)
(Address of principal executive offices)
(I.R.S. Employer Identification No.)
(Zip Code)
Registrants’ telephone number, including area code: (303 ) 893-0012
Securities registered pursuant to Section 12(b) of the Act:
Title of each class | Trading Symbol(s) | Name of each exchange on which registered | ||||||||||||
Securities registered pursuant to Section 12(g) of the Act: None
| Indicate by check mark if the registrant is a well-known seasoned issuer, as defined in Rule 405 of the Securities Act. | ||||||||||||||||||||||||||||||||
| Summit Materials, Inc. | ☒ | No | ☐ | Summit Materials, LLC | Yes | ☐ | ☒ | |||||||||||||||||||||||||
| Indicate by check mark if the registrant is not required to file reports pursuant to Section 13 or Section 15(d) of the Act. | ||||||||||||||||||||||||||||||||
| Summit Materials, Inc. | Yes | ☐ | ☒ | Summit Materials, LLC | Yes | ☐ | ☒ | |||||||||||||||||||||||||
| Indicate by check mark whether the registrant (1) has filed all reports required to be filed by Section 13 or 15(d) of the Securities Exchange Act of 1934 during the preceding 12 months (or for such shorter period that the registrant was required to file such reports), and (2) has been subject to such filing requirements for the past 90 days. | ||||||||||||||||||||||||||||||||
| Summit Materials, Inc. | ☒ | No | ☐ | Summit Materials, LLC | ☒ | No | ☐ | |||||||||||||||||||||||||
| Indicate by check mark whether the registrant has submitted electronically every Interactive Data File required to be submitted pursuant to Rule 405 of Regulation S-T (§232.405 of this chapter) during the preceding 12 months (or for such shorter period that the registrant was required to submit such files). | ||||||||||||||||||||||||||||||||
| Summit Materials, Inc. | ☒ | No | ☐ | Summit Materials, LLC | ☒ | No | ☐ | |||||||||||||||||||||||||
| Indicate by check mark whether the registrant is a large accelerated filer, an accelerated filer, a non-accelerated filer, a smaller reporting company or an emerging growth company. See the definitions of “large accelerated filer,” “accelerated filer,” “smaller reporting company” and “emerging growth company” in Rule 12b-2 of the Exchange Act. | ||||||||||||||
| Summit Materials, Inc. | ||||||||||||||
| ☒ | Accelerated filer | ☐ | ||||||||||||
| Non-accelerated filer | ☐ | Smaller reporting company | ||||||||||||
| Emerging growth company | ||||||||||||||
| Summit Materials, LLC | ||||||||||||||
| Large accelerated filer | ☐ | Accelerated filer | ☐ | |||||||||||
| ☒ | Smaller reporting company | |||||||||||||
| Emerging growth company | ||||||||||||||
Indicate by check mark whether the registrant has filed a report on and attestation to its management’s assessment of the effectiveness of its internal control over financial reporting under Section 404(b) of the Sarbanes-Oxley Act (15 U.S.C.7262(b)) by the registered public accounting firm that prepared or issued its audit report. | ||||||||||||||||||||||||||||||||
| Summit Materials, Inc. | Yes | No | ☐ | Summit Materials, LLC | Yes | No | ☐ | |||||||||||||||||||||||||
| Indicate by check mark whether the registrant is a shell company (as defined in Rule 12b-2 of the Exchange Act). If an emerging growth company, indicate by check mark if the registrant has elected not to use the extended transition period for complying with any new or revised financial accounting standards provided pursuant to Section 13(a) of the Exchange Act. | ||||||||||||||||||||||||||||||||
| Summit Materials, Inc. | Yes | ☐ | No | Summit Materials, LLC | Yes | ☐ | No | |||||||||||||||||||||||||
If securities are registered pursuant to Section 12(b) of the Act, indicate by check mark whether the financial statements of the registrant included in the filing reflect correction of an error to previously issued financial statements. ☐
Indicate by check mark whether any of those error corrections are restatements that required a recovery analysis of incentive-based compensation received by any of the registrant’s executive officers during the relevant recovery period pursuant to §240.10D-1(b). ☐
The aggregate market value of the Summit Materials, Inc. voting stock held by non-affiliates of the Registrants as of July 2, 2022 was approximately $2.7 billion.
As of February 13, 2023, the number of shares of Summit Materials, Inc.’s outstanding Class A and Class B common stock, par value $0.01 per share for each class, was 118,427,867 and 99 , respectively.
As of February 13, 2023, 100% of Summit Materials, LLC’s outstanding limited liability company interests were held by Summit Materials Intermediate Holdings, LLC, its sole member and an indirect subsidiary of Summit Materials, Inc.
DOCUMENTS INCORPORATED BY REFERENCE
1
2
| PART | ITEM | PAGE | ||||||||||||||||||
3
EXPLANATORY NOTE
This annual report on Form 10-K (this “report”) is a combined annual report being filed separately by two registrants: Summit Materials, Inc. and Summit Materials, LLC. Each registrant hereto is filing on its own behalf all of the information contained in this report that relates to such registrant. Each registrant hereto is not filing any information that does not relate to such registrant, and therefore makes no representation as to any such information. We believe that combining the annual reports on Form 10-K of Summit Materials, Inc. and Summit Materials, LLC into this single report eliminates duplicative and potentially confusing disclosure and provides a more streamlined presentation since a substantial amount of the disclosure applies to both registrants.
Unless stated otherwise or the context requires otherwise, references to “Summit Inc.” mean Summit Materials, Inc., a Delaware corporation, and references to “Summit LLC” mean Summit Materials, LLC, a Delaware limited liability company. The references to Summit Inc. and Summit LLC are used in cases where it is important to distinguish between them. We use the terms “we,” “our,” “Summit Materials” or “the Company” to refer to Summit Inc. and Summit LLC together with their respective subsidiaries, unless otherwise noted or the context otherwise requires.
Summit Inc. was formed on September 23, 2014 to be a holding company. As of December 31, 2022, its sole material asset was a 98.9% economic interest in Summit Materials Holdings L.P. (“Summit Holdings”). Summit Inc. has 100% of the voting rights of Summit Holdings, which is the indirect parent of Summit LLC. Summit LLC is a co-issuer of our outstanding 6 1/2 % senior notes due 2027 (“2027 Notes”) and our 5 1/4% senior notes due 2029 (“2029 Notes” and collectively with the 2027 Notes, the “Senior Notes”). Summit Inc.’s only revenue for the year ended December 31, 2022 is that generated by Summit LLC and its consolidated subsidiaries. Summit Inc. controls all of the business and affairs of Summit Holdings and, in turn, Summit LLC.
DISCLOSURE REGARDING FORWARD-LOOKING STATEMENTS
This report includes “forward-looking statements” within the meaning of the federal securities laws, which involve risks and uncertainties. Forward-looking statements include all statements that do not relate solely to historical or current facts, and you can identify forward-looking statements because they contain words such as “believes,” “expects,” “may,” “will,” “should,” “seeks,” “intends,” “trends,” “plans,” “estimates,” “projects” or “anticipates” or similar expressions that concern our strategy, plans, expectations or intentions. All statements made relating to our estimated and projected earnings, margins, costs, expenditures, cash flows, growth rates and financial results are forward-looking statements. These forward-looking statements are subject to risks, uncertainties and other factors that may cause our actual results, performance or achievements to be materially different from future results, performance or achievements expressed or implied by such forward-looking statements. We derive many of our forward-looking statements from our operating budgets and forecasts, which are based upon many detailed assumptions. While we believe that our assumptions are reasonable, it is very difficult to predict the effect of known factors, and, of course, it is impossible to anticipate all factors that could affect our actual results.
Some of the important factors that could cause actual results to differ materially from our expectations are disclosed under “Risk Factors” and elsewhere in this report. All subsequent written and oral forward-looking statements attributable to us, or persons acting on our behalf, are expressly qualified in their entirety by these cautionary statements.
We undertake no obligation to publicly update or revise any forward-looking statement as a result of new information, future events or otherwise, except as otherwise required by law.
CERTAIN DEFINITIONS
As used in this report, unless otherwise noted or the context otherwise requires:
•“EBITDA” refers to net income (loss) before interest expense, income tax expense (benefit), depreciation, depletion and amortization expense;
•“Finance Corp.” refers to Summit Materials Finance Corp., an indirect wholly-owned subsidiary of Summit LLC and the co-issuer of the Senior Notes;
•“Issuers” refers to Summit LLC and Finance Corp. as co‑issuers of the Senior Notes;
•“LP Units” refers to the Class A limited partnership units of Summit Holdings;
4
•“Mainland” refers to Mainland Construction Materials ULC, which is the surviving entity from the acquisition of Rock Head Holdings Ltd., B.I.M. Holdings Ltd., Carlson Ventures Ltd., Mainland Sand and Gravel Ltd. and Jamieson Quarries Ltd.;
•“TRA” refers to a tax receivable agreement between Summit Inc. and holders of LP Units.
5
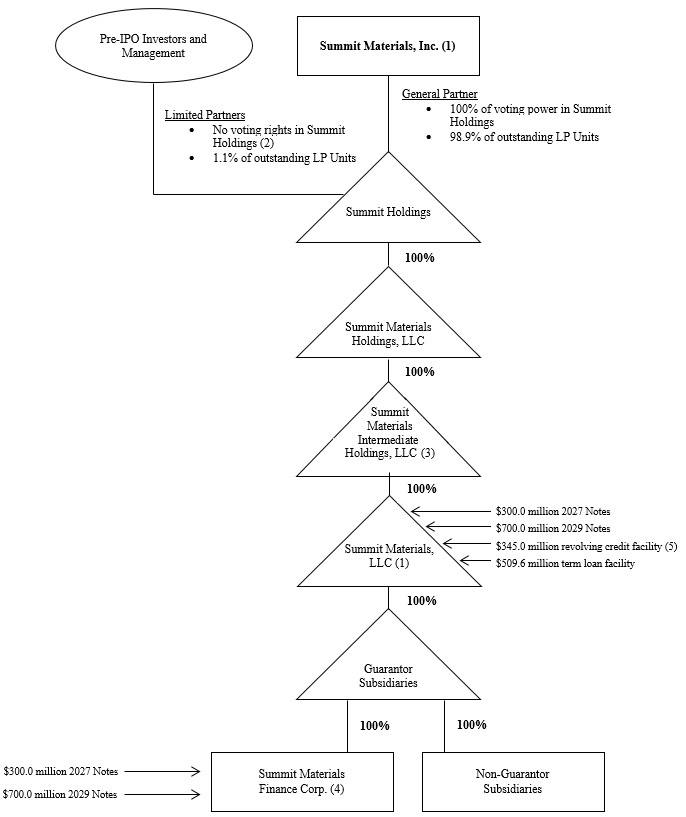
Corporate Structure
The following chart summarizes our organizational structure, equity ownership and our principal indebtedness as of December 31, 2022. This chart is provided for illustrative purposes only and does not show all of our legal entities or all obligations of such entities.
______________________
(1)U.S. Securities and Exchange Commission (“SEC”) registrant.
(2)The shares of Class B Common Stock are currently held by pre-initial public offering investors, including certain members of management or their family trusts that directly hold LP Units. A holder of Class B Common Stock is entitled, without regard to the number of shares of Class B Common Stock held by such holder, to a number of votes that is equal to the aggregate number of LP Units held by such holder.
(3)Guarantor under the senior secured credit facilities, but not the Senior Notes.
(4)Summit LLC and Finance Corp are the issuers of the Senior Notes and Summit LLC is the borrower under our senior secured credit facilities. Finance Corp. was formed solely for the purpose of serving as co-issuer or guarantor of certain indebtedness, including the Senior Notes. Finance Corp. does not and will not have operations of any kind and does not and will not have revenue or assets other than as may be incidental to its activities as a co-issuer or guarantor of certain indebtedness.
(5)In January 2023, we amended our senior secured revolving credit facility, increasing the total availability to $395.0 million and extending the maturity date to January 2028.
6
PART I
ITEM 1. BUSINESS.
Overview
Summit’s vision is to be the most socially responsible, integrated construction materials solution provider, collaborating with stakeholders to deliver differentiated innovations and solve our customers’ challenges. Within our markets, we strive to be a market leader by offering customers a single-source provider for construction materials and related vertically integrated downstream products. Our materials include aggregates, which we supply across the United States, and in British Columbia, Canada, and cement, which we supply to surrounding states along the Mississippi River from Minnesota to Louisiana. In addition to supplying aggregates to customers, we use a portion of our materials internally to produce ready-mix concrete and asphalt paving mix, which may be sold externally or used in our paving and related services businesses. Our vertically integrated business model creates opportunities to increase aggregates volumes, optimize margin at each stage of production and provide customers with efficiency gains, convenience and reliability, which we believe gives us a competitive advantage.
We believe we are a major participant in the U.S. construction materials industry as our sales volumes of aggregates put us in the top 10 of aggregates suppliers, a top 15 cement producer and a major producer of ready‑mix concrete and asphalt paving mix. Our aggregates reserves and resources were 5.7 billion tons as of December 31, 2022. In the year ended December 31, 2022 we sold 59.5 million tons of aggregates, 2.5 million tons of cement, 5.0 million cubic yards of ready-mix concrete and 3.7 million tons of asphalt paving mix across our nearly 400 sites and plants.
In the decade following the great financial crisis, the U.S. economy witnessed a gradual recovery in the private construction market and modest growth in public infrastructure spending. More recently, the U.S. private construction market has grown both nationally and in our markets while public infrastructure spending has been a steady contributor to overall construction market growth. We believe we are well positioned to expand our business by capitalizing on growth in the construction market, but any near-term economic slowdown or recession would challenge our industry growth and, as a result, our growth plans.
Our revenue in 2022 was $2.4 billion with net income attributable to Summit Inc. of $272.1 million. As of December 31, 2022, our total indebtedness outstanding was approximately $1.5 billion.
We anticipate demand to vary by end market. Public infrastructure, which includes spending by federal, state and local governments for roads, highways, bridges, airports and other public infrastructure projects, has been a relatively stable portion of government budgets providing consistent demand to our industry and is projected by the Portland Cement Association (“PCA”) to grow approximately 16% in the U.S. from 2023 to 2027. By fiscal year 2026, The Infrastructure Investment and Jobs Act (the "IIJA") will provide $52.3 billion in funding to Texas, Utah, Kansas and Missouri, our top four states by revenue in 2022. We believe states will continue to institute state and local level funding initiatives dedicated towards increased infrastructure spending. Historically, infrastructure spending has varied by geography depending on several factors including underlying economic conditions and fiscal health of individual states. Economic conditions in our markets do vary by state, and public infrastructure funding is expected to differ as a result. The public infrastructure market represented approximately 35% of our revenue in 2022.
The private construction market includes residential and nonresidential new construction and the repair and replace market. According to the PCA, the number of total housing starts in the United States, a leading indicator for our residential business, is expected to decline as compared to historically high levels. Despite this decline, the PCA projects that spending in private nonresidential construction will grow 7% from 2023 to 2027 and we believe residential activity in our key markets will continue to be a driver for volumes in future periods. Growth in private construction spending is influenced by changes in population, employment and general economic activity, among other factors which vary by geography across the United States. The private construction market represented approximately 65% of our revenue in 2022.
We expect continued improvement in pricing, especially in our materials businesses. The United States Geological Survey ("USGS") reports that aggregates pricing has increased in 70 of the last 75 years. Accordingly, we believe that this trend will continue in the future. The PCA estimates that cement consumption will increase approximately 16% in the U.S. from 2023 to 2027, reflecting rising demand in the major end markets. We believe that the increased demand will support higher cement pricing as production capacity in the United States remains tight and the cost of imported cement remains high.
We have supplemented organic growth with acquisitions by strategically targeting attractive, new markets and expanding in existing markets. We consider population trends, employment rates, private and public construction outlook, public funding and various other factors prior to entering a new market. In addition to considering macroeconomic data, we
7
seek to establish, and believe that we have, a top three position in our local markets, which we believe supports improving profit margins and sustainable organic growth. This positioning provides local economies of scale and synergies, which benefits our profitability.
We believe that significant opportunities remain for growth through acquisitions. We estimate that approximately 65% of the U.S. construction materials market is privately owned. Our management team maintains contact with hundreds of private companies. These long‑standing relationships have been the primary source for our past acquisitions and, we believe, will continue to be an important source for future acquisitions. We believe we offer a compelling value proposition for private company sellers, including secure ongoing stewardship of their legacy businesses and brands.
We also seek greenfield development opportunities, particularly in our current geographies where we have been unable to identify additional acquisition opportunities at reasonable values. While greenfield development opportunities generally take longer to reach positive cash flows, the return on investment can equal or exceed those of business acquisitions.
In March 2021, we launched our Elevate Summit strategy, which included an initiative to divest of 10 to 12 business units which did not meet certain criteria. Since that time, we have divested 11 businesses, including three businesses in 2022 that resulted in net proceeds of $373.1 million, and cumulatively the 11 divested businesses generated $501.4 million in net proceeds. We plan to continue our efforts to optimize our portfolio, which could include future divestitures.
Our Business Segments
We operate in 22 U.S. states and in British Columbia, Canada and have assets in 21 U.S. states and in British Columbia, Canada through our platforms that make up our operating segments: West, East and Cement. The platform businesses in the West, East and Cement segments have their own management teams that are responsible for overseeing local operations, implementing commercial and operational best practices, developing growth opportunities and integrating acquired businesses. We seek to enhance value through increased scale, efficiencies and cost savings within local markets.
•West Segment: Our West segment is comprised of our West and South regions, and includes operations in Texas, Utah, Colorado, Idaho, Wyoming, Oklahoma, Nevada, Arkansas and British Columbia, Canada. We supply aggregates, ready‑mix concrete, asphalt paving mix and paving and related services in the West segment. As of December 31, 2022, the West segment controlled approximately 1.6 billion tons of aggregates reserves and resources and $745.4 million of net property, plant and equipment and inventories (“hard assets”). During the year ended December 31, 2022, approximately 58% of our revenue was generated in the West segment.
•East Segment: Our East segment is comprised of our East and Central regions, and serves markets extending across the Midwestern and Eastern United States, most notably in Kansas, Missouri, Virginia, North Carolina, South Carolina, Georgia and Nebraska where we supply aggregates, ready‑mix concrete, asphalt paving mix and paving and related services. As of December 31, 2022, the East segment controlled approximately 3.5 billion tons of aggregates reserves and resources and $668.2 million of hard assets. During the year ended December 31, 2022, approximately 28% of our revenue was generated in the East segment.
•Cement Segment: Our Cement segment consists of our Hannibal, Missouri and Davenport, Iowa cement plants and nine distribution terminals along the Mississippi River from Minnesota to Louisiana. Our highly efficient plants, which have converted all production to lower carbon Portland Limestone Cement, are complemented by our integrated distribution system that spans the Mississippi River. We process solid and liquid waste into fuel for the plants, which can reduce the plants’ fuel costs by up to 50%. The Hannibal, Missouri plant is one of very few cement facilities in the United States that can process both hazardous and non-hazardous solid and liquid waste into fuel. As of December 31, 2022, the Cement segment controlled approximately 0.6 billion tons of aggregates reserves and resources, which serve its cement business, and $591.2 million of hard assets. During the year ended December 31, 2022, approximately 15% of our revenue was generated in the Cement segment.
Our End Markets
Public Infrastructure. Public infrastructure construction includes spending by federal, state and local governments for highways, bridges, airports, schools, public buildings and other public infrastructure projects. Public infrastructure spending has historically been more stable than private sector construction. We believe that public infrastructure spending is less sensitive to interest rate changes and economic cycles and often is supported by multi-year federal and state legislation and programs. A significant portion of our revenue is derived from public infrastructure projects. As a result, the supply of federal and state funding for public infrastructure highway construction significantly affects our public infrastructure end-use business.
8
Federal infrastructure funds are allocated to the states, which are required to match a portion of the federal funds they receive. Federal highway spending uses funds predominantly from the Federal Highway Trust Fund, which derives its revenue from taxes on diesel fuel, gasoline and other user fees. The dependability of federal funding allows the state departments of transportation to plan for their long-term highway construction and maintenance needs. The Infrastructure Investment and Jobs Act was signed into law on November 15, 2021. The IIJA legislation provides $1.2 trillion in funding over five years from 2022 through 2026, $347.8 billion for highways, and $91.0 billion for transit.
Residential Construction. Residential construction includes single family homes and multi‑family units such as apartments and condominiums. Demand for residential construction is influenced primarily by employment prospects, new household formation and mortgage interest rates. In recent years, we have observed migration trends towards rural and exurban U.S. markets, notably in our Texas and Utah markets. Given the high inflationary pressures, and recent increases in mortgage interest rates, we have begun to see a decrease in residential activity, which we expect to continue in 2023.
Nonresidential Construction. Nonresidential construction encompasses all privately financed construction other than residential structures. Demand for nonresidential construction is customarily driven primarily by population and economic growth, and activity tends to follow residential activity by 12-24 months. Population growth generally spurs demand for stores, shopping centers and restaurants. Economic growth typically creates demand for projects such as hotels, office buildings, warehouses and factories, although growth rates vary across the U.S. The supply of nonresidential construction projects is also affected by other variables, including interest rates and the availability of credit to finance these projects.
Our Competitive Strengths
Leading market positions. We seek to obtain a top two market share position in our local market areas. We believe we are a top 10 supplier of aggregates, a top 15 producer of cement and a major producer of ready‑mix concrete and asphalt paving mix in the United States by volume. We generally focus on acquiring aggregate-based companies that have leading local market positions, which we seek to enhance by building scale through additional bolt-on acquisitions. The construction materials industry is highly local in nature due to transportation costs from the high weight‑to‑value ratio of the products. Given this dynamic, we believe achieving local market scale provides a competitive advantage that drives growth and profitability for our business. We believe that our ability to prudently acquire, rapidly integrate and improve multiple businesses has enabled, and will continue to enable, our market leadership.
Vertically‑integrated business model. We generate revenue across a spectrum of related products and services. Approximately 19% of the aggregates used in our products and services are internally supplied. Our vertically‑integrated business model enables us to operate as a single source provider of materials and paving and related services, creating cost, convenience and reliability advantages for our customers, while at the same time creating significant cross‑marketing opportunities among our interrelated businesses. We believe this creates opportunities to increase aggregates volumes, optimize margin at each stage of the value chain, foster more stable demand for aggregates through a captive demand outlet, create a competitive advantage through the efficiency gains, convenience and reliability provided to customers and enhance our acquisition strategy by providing a greater population of target companies.
Attractive diversity, scale and product portfolio. We operate in dozens of metropolitan statistical areas across 22 U.S. states and in British Columbia, Canada. In the year ended December 31, 2022, 54% of our operating income increase came from the West segment, 19% from East segment and 27% from the Cement segment, excluding corporate charges. As of December 31, 2022, we had 3.7 billion tons of proven and probable mineral reserves and 1.8 billion tons of measured and indicated mineral resources. We estimate that the useful life of our reserves serving our aggregates and cement businesses are approximately 53 years and 172 years, respectively, based on the average production rates in 2022 and 2021.
Our dry process cement plants in Hannibal, Missouri and Davenport, Iowa were commissioned in 2008 and 1981, respectively. These low-cost cement plants have efficient manufacturing capabilities and are strategically located on the Mississippi River and complemented by an extensive network of river and rail fed distribution terminals. Our terminal network can accept imported cement to supplement our internal production capacity as demand and market conditions dictate. Due to the location of our Hannibal and Davenport plants on the Mississippi River, in 2022, we shipped approximately 70-80% of our cement by barge, which is more cost‑effective than truck or rail transport.
Proven ability to incorporate new acquisitions and grow businesses. Since our inception, we have acquired dozens of businesses, successfully integrating them into three segments through the implementation of operational improvements, industry‑proven information technology systems, comprehensive safety and management programs. A typical acquisition and subsequent integration generally involves implementing common safety and financial back office systems, driving best
9
practices in pricing and productivity. In addition, we seek to leverage scale while maintaining local branding and management decision-making and providing management support, strategic direction and financial capital for investment.
Experienced and proven leadership driving organic growth, acquisition and optimization strategy. Our management team, including corporate and regional managers, corporate development, finance and legal executives and other heavy side industry operators, has extensive experience in the industry. Our management team has successfully enhanced the operations of acquired companies, focusing on scale advantages, cost efficiencies and price optimization to improve profitability and cash flow. Our management team has undertaken an optimization process whereby we are disposing of certain assets and businesses that are not core to our business, helping our management teams narrow their focus to the highest returning components of our business and serve our broader goal of increasing our return on invested capital.
Our Business Strategy
We believe our integrated business model creates a distinct competitive advantage to support our growth ambitions. We continue to execute on our Elevate Summit Strategy, which has four key themes:
Market Leadership. We expect to create sustainable advantages in suburban and exurban communities that enhance total shareholder value. We believe that our vertical integration of construction materials, products and services is a significant competitive advantage and being materials focused and improving the quality, and sustainability of our earnings will drive share growth in existing markets and enable entry into new markets. A significant portion of materials used to produce our products and provide services to our customers is internally supplied, which enables us to operate as a single source provider of materials, products and paving and related services. This creates cost, convenience and reliability advantages for our customers and enables us to capture additional value throughout the supply chain, while at the same time creating significant cross‑marketing opportunities among our interrelated businesses.
Asset Light Approach. We seek to maximize aggregates pull through in order to improve capital efficiency, and reduce volatility. Our growth has been a result of the successful execution of our materials-led acquisition strategy and implementation of best practices to drive organic growth. We believe we have opportunity for further growth through strategic acquisitions in markets adjacent to our existing markets within the states where we currently operate, as well as into additional states as market and competitive conditions permit. We also believe we can enhance our return on investment by partnering with our customers in asset light partnerships by retaining aggregate supply agreements where possible.
Social Responsibility. We strive to build differentiated, heavy materials solutions to enhance returns and maximize social impact. As our customers focus on their own social responsibility goals, we plan to provide innovative solutions to meet those goals. We view social responsibility, which includes human capital, land use, water and addressing carbon emissions impacts, as a strategic imperative essential to serving the needs of our employees, customers, and communities where we operate. We publish an annual sustainability report aligned with the Sustainability Accounting Standards Board Construction Materials Standard. Our sustainability report describes our safety performance as well as water usage, waste production, and carbon emissions impacts. We seek to proactively address those impacts to align our business activities with the interests of our external stakeholders.
Innovation Focus. We seek to make investments to address tomorrow's customer challenges with new products and solutions. We seek to enhance margins through proven profit optimization plans, managed working capital and achieved scale‑driven purchasing synergies and fixed overhead control and reduction. Our management team, supported by our operations, development, risk management, information technology and finance teams, drive the implementation of detailed and thorough profit optimization plans for each acquisition post close. These integration and improvement plans typically include, among other things, implementation of a common pricing strategy, safety and financial systems, systematic commercial strategies, operational benefits, efficiency improvement plans and business-wide cost reduction techniques. In addition, through our portfolio optimization program, we are also evaluating and executing on divestitures of certain assets and businesses that are not core to our business or have underperformed our investment expectations.
Our Industry
The U.S. construction materials industry is composed of four primary sectors: aggregates; cement; ready‑mix concrete; and asphalt paving mix. Each of these materials is widely used in most forms of construction activity. Participants in these sectors typically range from small, privately‑held companies focused on a single material, product or market to publicly traded multinational corporations that offer a wide array of construction materials and services. The industry is shaped in part by the distance materials can be transported efficiently, resulting in primarily local or regional operations. Due to the lack of product differentiation, competition for all of our products is predominantly based on price and, to a lesser extent, quality of products
10
and service. Accordingly, our profitability is generally dependent on the level of demand for our materials and products and our ability to control operating costs.
Transportation infrastructure projects, driven by both federal and state funding programs, represent a significant share of the U.S. construction materials market. Federal funds are allocated to the states, which are required to match a portion of the federal funds they receive. Federal highway spending primarily uses funds from the Federal Highway Trust Fund, which derives its revenue from taxes on diesel fuel, gasoline and other user fees. The dependability of federal funding allows the state departments of transportation to plan for their long-term highway construction and maintenance needs. The IIJA passed in November 2021 provides $1.2 trillion in funding over five years from 2022 through 2026, which includes $347.8 billion for highways, and $91.0 billion for transit.
In addition to federal funding, state, county and local agencies provide highway construction and maintenance funding. Our four largest states by revenue, Texas, Utah, Kansas and Missouri, represented approximately 24%, 17%, 10% and 10%, respectively, of our total revenue in 2022.
Our Industry and Operations
We do not believe that increases in our prices of materials or products are likely to affect the decision to undertake a construction project since these costs usually represent a small portion of total construction costs.
We operate our construction materials, products and paving and related services businesses through local management teams, which work closely with our customers to deliver the materials, products and services that meet each customer’s specific needs for a project. We believe that this strong local branding presence gives us a competitive advantage by allowing us to obtain a unique understanding for the evolving needs of our customers.
We have operations in 22 U.S. states and in British Columbia, Canada. Our business in each region is vertically‑integrated. We supply aggregates internally for the production of cement, ready‑mix concrete and asphalt paving mix and a significant portion of our asphalt paving mix is used internally by our paving and related services businesses. In the year ended December 31, 2022, approximately 82% of our aggregates production was sold directly to outside customers with the remaining amount being further processed by us and sold as a downstream product. In addition, we operate a municipal waste landfill in our East segment, and have construction and demolition debris landfills in our West and East segments.
Approximately 67% of our asphalt paving mix was installed by our paving and related services businesses in the year ended December 31, 2022. We charge a market price and competitive margin at each stage of the production process in order to optimize profitability across our operations. Our production value chain is illustrated as follows:
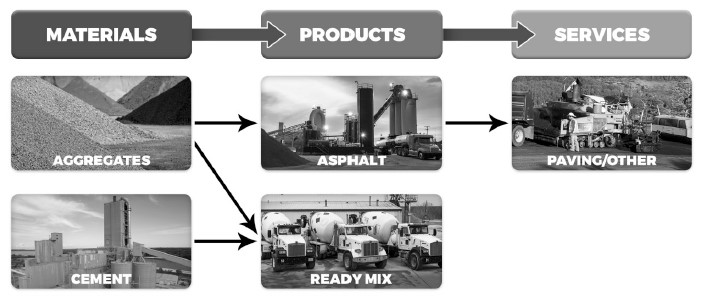
Aggregates
Aggregates are key material components used in the production of cement, ready‑mix concrete and asphalt paving mixes for the public infrastructure, residential and nonresidential end markets and are also widely used for various applications
11
and products, such as road and building foundations, railroad ballast, erosion control, filtration, roofing granules and in solutions for snow and ice control. Generally extracted from the earth using surface or underground mining methods, aggregates are produced from natural deposits of various materials such as limestone, sand and gravel, granite and trap rock. Aggregates are produced mainly from blasting hard rock from quarries and then crushing and screening it to various sizes to meet our customers’ needs. The production of aggregates also involves the extraction of sand and gravel, which requires less crushing, but still requires screening for different sizes. Aggregate production utilizes capital intensive heavy equipment which includes the use of loaders, large haul trucks, crushers, screens and other heavy equipment at quarries and sand and gravel pits. Once extracted, processed and/or crushed and graded on-site into crushed stone, concrete and masonry sand, specialized sand, pulverized lime or agricultural lime, they are supplied directly to their end use or incorporated for further processing into construction materials and products, such as cement, ready‑mix concrete and asphalt paving mix. The minerals are processed to meet customer specifications or to meet industry standard sizes. Crushed stone is used primarily in ready‑mix concrete, asphalt paving mix, and the construction of road base for highways.
We mine limestone, gravel, and other natural resources from 125 crushed stone quarries and 107 sand and gravel deposits throughout the United States and in British Columbia, Canada. Our extensive network of quarries, plants and facilities, located throughout the regions in which we operate, enables us to have a nearby operation to meet the needs of customers in each of our markets. As of December 31, 2022, we had approximately 5.7 billion tons of reserves and resources of recoverable stone, and sand and gravel of suitable quality for economic extraction. Our estimate is based on drilling and studies by geologists and engineers, recognizing reasonable economic and operating restraints as to maximum depth of extraction and permit or other restrictions. Reported proven and probable reserves include only quantities that are owned or under lease, and for which all required zoning and permitting have been obtained. Of the 5.7 billion tons of aggregates reserves and resources, 2.6 billion, or 46%, are located on owned land and 3.1 billion are located on leased land.
Transportation costs are a major variable in determining the marketing radius for our products. The cost of transporting aggregate products from the plant to the market often equates to or exceeds the sale price of the product at the plant. As a result of the high transportation costs and the large quantities of bulk material that have to be shipped, finished products are typically marketed locally. High transportation costs are responsible for the wide dispersion of production sites. Our transportation costs are also increasing, primarily due to driver shortages and elevated fuel costs. Where possible, construction material producers maintain operations adjacent to highly populated areas to reduce transportation costs and enhance margins. However, more recently, local environmental concerns and a more restrictive permitting and regulatory landscape have been forcing production sites to move further away from the end‑use locations.
Each of our aggregates operations is responsible for the sale and marketing of its aggregates products. Approximately 82% of our aggregates production is sold directly to outside customers and the remaining amount is further processed by us and sold as a downstream product. Even though aggregates are a commodity product, we work to optimize pricing depending on the site location, availability of a particular product, customer type, project type and haul cost. We sell aggregates to internal downstream operations at market prices.
Our competitors in aggregates include large vertically‑integrated companies, that have a combined estimated market share of approximately 30%, in addition to various local suppliers.
We believe we have a strong competitive advantage in aggregates through our well located reserves and assets in key markets, high quality reserves and our logistic networks. We further share and implement best practices relating to safety, strategy, sales and marketing, production, and environmental and land management. Our vertical integration and local market knowledge enable us to maintain a strong understanding of the needs of our aggregates customers. In addition, our companies have a reputation for responsible environmental stewardship and land restoration, which assists us in obtaining new permits and new reserves.
Cement
Portland cement, an industry term for the common cement in general use around the world, is made from a combination of limestone, shale, clay, silica and iron ore. It is a fundamental building material consumed in several stages throughout the construction cycle of public infrastructure, residential and nonresidential projects. It is a binding agent that, when mixed with sand or aggregates and water, produces either ready‑mix concrete or mortar and is an important component of other essential construction materials. Few construction projects can take place without utilizing cement somewhere in the design, making it a key ingredient used in the construction industry. The majority of all cement shipments are sent to ready‑mix concrete operators. Sales are made on the basis of competitive terms and prices in each market. Nearly two‑thirds of U.S. consumption occurs between May and November, coinciding with end‑market construction activity.
12
Cement production in the United States is distributed from over 90 production facilities located across a majority of the states and is a capital‑intensive business with variable costs dominated by raw materials and energy required to fuel the kiln. Most U.S. cement producers are owned by large foreign companies operating in multiple international markets. Our largest competitors include large vertically integrated companies. Construction of cement production facilities is highly capital intensive and requires long lead times to complete engineering design, obtain regulatory permits, acquire equipment and construct a plant.
We operate a highly‑efficient, low-cost integrated cement manufacturing and distribution network through our cement plants in Hannibal, Missouri, and Davenport, Iowa and our nine distribution terminals along the Mississippi River from Minnesota to Louisiana. The combined potential capacity at our Hannibal and Davenport cement plants is approximately 2.4 million short tons per annum. We also operate on‑site waste fuel processing facilities at the plants, which can reduce plant fuel costs by up to 50%. Our Hannibal plant is one of very few with hazardous waste fuel facilities permitted and operating out of over 90 cement plants in the United States. Competitive factors include price, reliability of deliveries, location, quality of cement and support services. Aligned with our core strategy of sustainability, we converted 100% of our cement production from general use Portland cement to Portland Limestone Cement (PLC) during 2022. Portland Limestone Cement is accepted in all major specifications, approved in all major markets, can be used in all applications in lieu of Portland cement while reducing cement’s embodied CO2 content by up to 10%. With two cement plants, on‑site raw material supply, a network of cement terminals, and longstanding customer relationships, we believe we are well positioned to serve our customers.
Cement is a product that is costly to transport. Consequently, the radius within which a typical cement plant is competitive with truck transportation is typically limited to 150 miles from any shipping/distribution point. However, access to rail and barge can extend the distribution radius significantly. With both of our plants located on the Mississippi River, we are able to cost effectively distribute cement from both of our plants by truck, rail and barge directly to customers or to our nine storage and distribution terminals along the Mississippi River. Our Hannibal and Davenport plants are located on the Mississippi River and, consequently, we ship approximately 70-80% of our cement by barge, which is more cost‑effective than truck or rail transport.
The majority of U.S. cement plants are subject to the Portland Cement – Maximum Achievable Control Technology (“PC‑MACT”). Our Hannibal and Davenport cement plants utilize alternative fuels, hazardous and non‑hazardous at Hannibal and non‑hazardous at Davenport, as well as coal, natural gas and petroleum coke and, as a result, are subject to additional standards including the Hazardous Waste Combustor – Maximum Achievable Control Technology (“HWC-MACT”) and Commercial/Industrial Solid Waste Incinerators (“CISWI”) standards, respectively, rather than PC‑MACT standards.
Ready‑mix Concrete
Ready‑mix concrete is one of the most versatile and widely used materials in construction today. Its flexible recipe characteristics allow for an end product that can assume almost any color, shape, texture and strength to meet the many requirements of end users that range from bridges, foundations, skyscrapers, pavements, dams, houses, parking garages, water treatment facilities, airports, tunnels, power plants, hospitals and schools. The versatility of ready‑mix concrete gives engineers significant flexibility when designing these projects.
Cement, coarse aggregate, fine aggregate, water and admixtures are the primary ingredients in ready‑mix concrete. Other materials commonly used in the production of ready‑mix concrete include fly‑ash, a waste by‑product from coal burning power plants, silica fume, a waste by‑product generated from the manufacture of silicon and ferro‑silicon metals, and ground granulated blast furnace slag, a by‑product of the iron and steel manufacturing process. These materials are available directly from the producer or via specialist distributors who intermediate between the ready‑mix concrete producers and the users.
We believe our West and East segments are leaders in the supply of ready‑mix concrete in their respective markets. The West segment has ready‑mix concrete operations in the Texas, Utah, Nevada, Idaho, Oklahoma and Colorado markets. Our East segment supplies ready‑mix concrete in the Kansas and Missouri markets and surrounding areas. We operated 69 ready-mix concrete plants and over 700 concrete delivery trucks in the West segment and 22 ready-mix concrete plants and over 150 concrete delivery trucks in the East segment as of December 31, 2022. Our aggregates business serves as the primary source of the raw materials for our concrete production, functioning essentially as a supplier to our ready‑mix concrete operations.
Asphalt Paving Mix
Asphalt paving mix is the most common roadway material used today. It is a versatile and essential building material that has been used to surface 94% of the more than 2.7 million miles of paved roadways in the United States, according to the National Asphalt Pavement Association (“NAPA”).
13
Typically, asphalt paving mix is placed in three distinct layers to create a flexible pavement structure. These layers consist of a base course, an intermediate or binder course, and a surface or wearing course. These layers vary in thicknesses.
Asphalt pavement is generally 100% recyclable and reusable and is the most reused and recycled pavement material in the United States. Reclaimed asphalt pavement can be incorporated into new pavement at replacement rates in excess of 30% depending upon the mix and the application of the product. We actively engage in the recycling of previously used asphalt pavement and concrete. This material is crushed and repurposed in the construction cycle. As of December 31, 2022, we operated 26 and 5 asphalt paving mix plants in the West and East segments, respectively. Nearly all of our plants can utilize recycled asphalt pavement.
The use of warm mix asphalt (“WMA”) or “green” asphalt is gaining popularity. The immediate benefit to producing WMA is the reduction in energy consumption required by burning fuels to heat traditional hot mix asphalt (“HMA”) to temperatures in excess of 300°F at the production plant. These high production temperatures are needed to allow the asphalt binder to become viscous enough to completely coat the aggregate in the HMA, have good workability during laying and compaction, and durability during traffic exposure. According to the Federal Highway Administration, WMA can reduce the mixing temperature by 50°F to 70°F, resulting in lower emissions, fumes and odors generated at the plant and the paving site.
Approximately 67% of the asphalt paving mix we produce is installed by our own paving crews. The rest is sold on a per ton basis to road contractors, state departments of transportation and local agencies. Asphalt paving mix is used by our paving crews and by our customers primarily for the construction of roads, driveways and parking lots.
As part of our vertical integration strategy, we provide asphalt paving and related services to both the private and public infrastructure sectors as either a prime or sub‑contractor. These services complement our construction materials and products businesses by providing a reliable downstream outlet, in addition to our external distribution channels.
Our asphalt paving and related services businesses bid on both private construction and public infrastructure projects in their respective local markets. We only provide paving and related services operations as a complement to our aggregates operations, which we believe is a major competitive strength. Factors affecting competitiveness in this business segment include price, estimating abilities, knowledge of local markets and conditions, project management, financial strength, reputation for quality and the availability of machinery and equipment.
Contracts with our customers are primarily fixed price or fixed unit price. Under fixed unit price contracts, we provide materials or services at fixed unit prices (for example, dollars per ton of asphalt placed). While the fixed unit price contract shifts the risk of estimating the quantity of units required for a particular project to the customer, any increase in our unit cost over the bid amount, whether due to inflation, inefficiency, errors in our estimates or other factors, is borne by us unless otherwise provided in the contract. Many of our contracts contain adjustment provisions to account for changes in liquid asphalt prices.
Customers
Our business is not dependent on any single customer or a few customers. Therefore, the loss of any single or small number of customers would not have a material adverse effect on any individual respective market in which we operate or on us as a whole. No individual customer accounted for more than 10% of our 2022 revenue.
Seasonality
Use and consumption of our products fluctuate due to seasonality. Nearly all of the products used by us, and by our customers, in the private construction or public infrastructure industries are used outdoors. Our highway operations and production and distribution facilities are also located outdoors. Therefore, seasonal changes and other weather‑related conditions, in particular extended rainy and cold weather in the spring and fall and major weather events, such as hurricanes, tornadoes, tropical storms, heavy snows, flooding and drought, can adversely affect our business and operations through a decline in the use of our products, demand for our services and our ability to provide our products and services. In addition, construction materials production and shipment levels follow activity in the construction industry, which typically occurs in the spring, summer and fall. Warmer and drier weather during the second and third quarters of our fiscal year typically result in higher activity and revenue levels during those quarters. The first quarter of our fiscal year typically has lower levels of activity due to weather conditions.
Backlog
14
Our products are generally delivered upon receipt of orders or requests from customers, or shortly thereafter. Accordingly, the backlog associated with product sales is converted into revenue within a relatively short period of time. Inventory for products is generally maintained in sufficient quantities to meet rapid delivery requirements of customers. Therefore, a period over period increase or decrease of backlog does not necessarily result in a material improvement or a deterioration of our business. Our backlog includes only those products and projects for which we have obtained a purchase order or a signed contract with the customer and does not include products purchased and sold or services awarded and provided within the period.
Subject to applicable contract terms, substantially all contracts in our backlog may be canceled or modified by our customers. Historically, we have not been materially adversely affected by significant contract cancellations or modifications.
Intellectual Property
We do not own or have a license or other rights under any patents that are material to our business.
Corporate Information
Summit Materials, Inc. and Summit Materials, LLC were formed under the laws of the State of Delaware on September 23, 2014 and September 24, 2008, respectively. Our principal executive office is located at 1801 California Street, Suite 3500, Denver, Colorado 80202. Through its predecessor, Summit Inc. commenced operations in 2009 when Summit Holdings was formed. Our telephone number is (303) 893-0012.
Human Capital Resources
As of December 31, 2022, we employed approximately 4,800 employees, of which approximately 4,500 were employed in the United States with the remainder being employed in Canada. Approximately 79% of our employees are hourly workers, with the remainder being salaried. Approximately 10% of our employees are union members, substantially all in our cement division and at our Canadian operations, with whom we believe we enjoy a satisfactory working relationship. Our collective bargaining agreements for employees who are union members generally expire within three years. Because of the seasonal nature of our industry, many of our hourly and certain of our salaried employees are subject to seasonal layoffs. The scope of layoffs varies greatly from season to season as they are predominantly a function of the type of projects in process and the weather during the late fall through early spring.
Health and Safety: We maintain a safety culture grounded on the premise of striving to eliminate workplace incidents, risks and hazards. We have created and implemented processes to help eliminate safety events by reducing their frequency and severity. We also review and monitor our performance closely. Our goal is to reduce Occupational Safety and Health Administration ("OSHA") recordable incidents each year. During fiscal 2022, our recordable incident rate declined 23% compared to fiscal 2021.
Inclusion and Diversity: We embrace the diversity of our team members, customers, stakeholders and consumers, including their unique backgrounds, experiences, thoughts and talents. Everyone is valued and appreciated for their distinct contributions to the growth and sustainability of our business. We strive to cultivate a culture and vision that supports and enhances our ability to recruit, develop and retain diverse talent at every level. We have a goal to build a highly engaged team by increasing retention year over year. We achieved gender parity at the Board level with over 50% female Board directors.
Talent Development: We prioritize and invest in creating opportunities to help employees grow and build their careers, through various training and development programs. These include on-the-job learning formats as well as executive talent and succession planning paired with an individualized development approach.
Compensation and Benefits: In addition to competitive base compensation, we offer incentive plans for both safety and operational results, stock awards, a 401(k) plan, healthcare and insurance benefits, health savings and flexible spending accounts, paid time off, family leave programs, and employee assistance programs, among other benefits. Our 401(k) plan covers all U.S. employees, and provides for matching contributions to the plan, including 100% of pre‑tax employee contributions, up to 4% of eligible compensation. Employer contributions vest immediately. During 2021, we implemented an Employee Stock Purchase Plan in which the majority of our employees are eligible to participate.
Legal Proceedings
15
We are party to certain legal actions arising from the ordinary course of business activities. While the ultimate results of claims and litigation cannot be predicted with certainty, management expects that the ultimate resolution of all current pending or threatened claims and litigation will not have a material effect on our consolidated financial condition, results of operations or liquidity.
In March 2018, we were notified of an investigation by the Canadian Competition Bureau (the “CCB”) into pricing practices by certain asphalt paving contractors in British Columbia, including Winvan Paving, Ltd. (“Winvan”). We believe the investigation is focused on time periods prior to our April 2017 acquisition of Winvan and we are cooperating with the CCB. Although we currently do not believe this matter will have a material adverse effect on our business, financial condition or results of operations, we are currently not able to predict the ultimate outcome or cost of the investigation.
Environmental and Government Regulation
We are subject to federal, state, provincial and local laws and regulations relating to the environment and to health and safety, including noise, discharges to air and water, waste management including the management of hazardous waste used as a fuel substitute in our cement plants, remediation of contaminated sites, mine reclamation, operation and closure of landfills, dust control and zoning, land use and permitting. Our failure to comply with such laws and regulations can result in sanctions such as fines or the cessation of part or all of our operations. From time to time, we may also be required to conduct investigation or remediation activities. There also can be no assurance that our compliance costs or liabilities associated with such laws and regulations or activities will not be significant.
In addition, our operations require numerous governmental approvals and permits. Environmental operating permits are subject to modification, renewal and revocation and can require us to make capital, maintenance and operational expenditures to comply with the applicable requirements. Stricter laws and regulations, or more stringent interpretations of existing laws or regulations, may impose new liabilities on us, reduce operating hours, require additional investment by us in pollution control equipment or impede our opening new, expanding or maintaining existing plants or facilities. We regularly monitor and review our operations, procedures and policies for compliance with environmental laws and regulations, changes in interpretations of existing laws and enforcement policies, new laws that are adopted, and new requirements that we anticipate will be adopted that could affect our operations.
Multiple permits are required for our operations, including those required to operate our cement plants, conduct mining activities at our aggregate quarries, operate our ready-mixed concrete plants and lay asphalt. Applicable permits may include conditional use permits to allow us to operate in certain areas absent zoning approval and operational permits governing, among other matters, air and water emissions, dust, particulate matter and storm water management and control. In addition, we are often required to obtain bonding for future reclamation costs, most commonly specific to restorative grading and seeding of disturbed surface areas.
Like others in our industry, we expend substantial amounts to comply with applicable environmental laws and regulations and permit limitations, which include amounts for pollution control equipment required to monitor and regulate emissions into the environment. The Hannibal and Davenport cement plants are subject to HWC-MACT and CISWI standards, respectively, for which we do not expect any material incremental costs to maintain compliance. Since many environmental requirements are likely to be affected by future legislation or rule making by government agencies, and are therefore not quantifiable, it is not possible to accurately predict the aggregate future costs of compliance and their effect on our future financial condition, results of operations and liquidity.
At most of our quarries, we incur reclamation obligations as part of our mining activities. Reclamation methods and requirements can vary depending on the individual site and state regulations. Generally, we are required to grade the mined properties to a certain slope and seed the property to prevent erosion. We record a mining reclamation liability in our consolidated financial statements to reflect the estimated fair value of the cost to reclaim each property including active and closed sites.
Our operations in Kansas include one municipal waste landfill and three construction and demolition debris landfills, and in Colorado, we have a construction and demolition debris landfill. In Vancouver, British Columbia, we operate a landfill site that accepts environmentally clean soil deposits. Among other environmental, health and safety requirements, we are subject to obligations to appropriately close those landfills at the end of their useful lives and provide for appropriate post‑closure care. Asset retirement obligations relating to these landfills are recorded in our consolidated financial statements.
Health and Safety
16
Our facilities and operations are subject to a variety of worker health and safety requirements, particularly those administered by the federal Occupational Safety and Health Administration (“OSHA”) and Mine Safety and Health Administration (“MSHA”). Throughout our organization, we strive for a zero‑incident safety culture and full compliance with safety regulations. Failure to comply with these requirements can result in sanctions such as fines and penalties and claims for personal injury and property damage. These requirements may also result in increased operating and capital costs in the future.
Worker safety and health matters are overseen by our corporate risk management and safety department as well as operations level safety managers. We provide our operations level safety managers leadership and support, comprehensive training, and other tools designed to accomplish health and safety goals, reduce risk, eliminate hazards, and ultimately make our work places safer.
Where You Can Find More Information
We file annual, quarterly and current reports, proxy statements and other information with the SEC. Our SEC filings are available to the public over the internet at the SEC’s website at http://www.sec.gov. Our SEC filings are also available on our website, free of charge, at http://www.summit-materials.com as soon as reasonably practicable after they are filed with or furnished to the SEC.
We maintain an internet site at http://www.summit-materials.com. Our website and the information contained on or connected to that site are not incorporated into this report.
17
ITEM 1A. RISK FACTORS
Risks Related to Our Industry and Our Business
Industry Risks
Our business depends on activity within the construction industry and the strength of the economies in which we operate.
We sell most of our construction materials and products and provide all of our paving and related services to the construction industry, so our results are significantly affected by the strength of the construction industry. The strength of the construction industry in turn can be substantially affected by macroeconomic and other factors beyond our control, including changes in general economic conditions, political or social trends and unrest, terrorism or war, and natural, climate-related or man-made disasters and extreme weather conditions. In addition, federal and state budget issues may negatively affect the amount of funding available for infrastructure spending, particularly highway construction, which constitutes a significant portion of our business. Demand for our products, particularly in the residential and nonresidential construction markets, could decline if companies and consumers cannot obtain funding for construction projects, or due to other market factors such as rising interest rates, labor shortages and inflation which have impacted demand more recently and are expected to further impact demand in 2023. In addition, a slow pace of economic activity typically results in delays or cancellations of capital projects.
While our business operations cover a wide geographic area, our earnings depend on the strength of the local economies in which we operate because of the high cost to transport our products relative to their price. If economic and construction activity diminishes in one or more areas, particularly in our top revenue‑generating markets of Texas, Utah, Kansas and Missouri, our financial condition, results of operations and liquidity could be materially adversely affected.
Our industry is cyclical and requires significant working capital to fund operations.
Our industry is cyclical and requires that we maintain significant working capital to fund our operations. Our ability to generate sufficient cash flow depends on future performance, which will be subject to general economic conditions, industry cycles and financial, business and other factors affecting our operations, many of which are beyond our control. If we are unable to generate sufficient cash to operate our business and service our outstanding debt and other obligations, we may be required, among other things, to further reduce or delay planned capital or operating expenditures, sell assets or take other measures, including the restructuring of all or a portion of our debt, which may only be available, if at all, on unsatisfactory terms.
Weather can materially affect our business and we are subject to seasonality.
The products we sell and the services we provide are used or performed outdoors. Therefore, seasonal changes and other weather‑related conditions can adversely affect our business and operations through a decline in the use and production of our products, demand for our services and our ability to provide our products and services. Adverse weather conditions such as heavy or sustained rainy and cold weather in the spring and fall can reduce demand for our products and reduce sales, render our contracting operations less efficient or restrict our ability to ship our products. For example, flooding conditions on the Mississippi River have in prior years negatively impacted our operations which affected our financial results. More recently, unusually low water levels on the Mississippi River in late 2022 negatively impacted the shipping of our products as well. Major weather events such as hurricanes, tornadoes, tropical storms, flooding, droughts, wildfires and heavy snows have adversely affected and could adversely affect sales in the near term and may be more severe due to climate change. In particular, our operations in the southeastern and Gulf Coast regions of the United States are at risk for hurricane activity, most notably in August, September and October. For example, in 2017, Hurricane Harvey adversely affected our operations not only during the days immediately before and after the storm, but also in the weeks and months after the storm as our customers recovered and reallocated resources in response to damage caused by the storm.
Construction materials production and shipment levels follow activity in the construction industry, which typically occurs in the spring, summer and fall. Warmer and drier weather during the second and third quarters of our fiscal year typically result in higher activity and revenue levels during those quarters. The first quarter of our fiscal year has typically lower levels of activity due to the weather conditions. Our second quarter varies greatly with spring rains and wide temperature variations. A cool wet spring increases drying time on projects, which can delay sales in the second quarter, while a warm dry spring may enable earlier project startup. Such adverse weather conditions can adversely affect our business, financial condition and results of operations if they occur with unusual intensity, during abnormal periods or last longer than usual in our major markets, especially during peak construction periods.
18
Our industry is capital intensive and we have significant fixed and semi‑fixed costs. Therefore, our profitability is sensitive to changes in volume.
The property and machinery needed to produce our materials and products can be very expensive and can have long lead times to acquire. Therefore, we need to spend a substantial amount of capital to purchase and maintain the equipment necessary to operate our business. Although we believe that our current cash balance, along with our projected internal cash flows and our available financing resources, will provide sufficient cash to support our currently anticipated operating and capital needs, if we are unable to generate sufficient cash to purchase and maintain the property and machinery necessary to operate our business, we may be required to reduce or delay planned capital expenditures or incur additional debt. In addition, given the level of fixed and semi‑fixed costs within our business, particularly at our cement production facilities, decreases in volumes could have a material adverse effect on our financial condition, results of operations and liquidity.
Within our local markets, we operate in a highly competitive industry.
The U.S. construction aggregates industry is highly fragmented with a large number of independent local producers in a number of our markets. Additionally, in most markets, we also compete against large private and public companies, some of which are also vertically‑integrated. Therefore, there is intense competition in a number of the markets in which we operate. This significant competition could lead to lower prices, higher wages, lower sales volumes and higher costs in some markets, negatively affecting our financial condition, results of operations and liquidity.
We also face competition for some of our products from alternative products, new product technologies, different production and distribution processes and alternative business models. For example, our aggregates, ready mixed concrete, and asphalt and paving businesses may compete with recycled asphalt and concrete products that could be used in certain applications instead of new products and our cement operations may compete with international competitors who are importing products into the United States from jurisdictions with lower production and regulatory costs.
Growth and Portfolio Optimization Risks
The success of our business depends in part on our ability to execute on our acquisition and portfolio optimization strategy.
A significant portion of our historical growth has occurred through acquisitions, and we will likely execute acquisition transactions in the future. Acquisitions involve risks that, among other things, the businesses acquired will not perform as expected. We are presently evaluating, and we expect to continue to evaluate on an ongoing basis, possible acquisition transactions. We are presently engaged, and at any time in the future we may be engaged, in discussions or negotiations with respect to possible acquisitions, including larger transactions that would be significant to us. We regularly make, and we expect to continue to make, non‑binding acquisition proposals, and we may enter into letters of intent, in each case allowing us to conduct due diligence on a confidential basis. In addition, we have recently disposed of a number of assets and businesses that we did not believe met our long-term investment criteria and through our portfolio optimization program, we are also evaluating additional divestiture opportunities of certain assets and businesses that are not core to our business. There can be no assurances that we will be able to recover the current carrying amount of our investments, and in some circumstances, assets or businesses may result in additional impairment expenses or other losses. In addition, we may become subject to certain contractual indemnity or other obligations or may fail to successfully deploy sale proceeds. We cannot predict the timing of any contemplated transactions. To successfully acquire a significant target, we may need to raise additional capital through additional equity issuances, additional indebtedness, or a combination of equity and debt issuances. There can be no assurance that we will enter into definitive agreements with respect to any contemplated transactions or that they will be completed. Our acquisitions and portfolio optimization efforts have placed, and may continue to place, significant demands on our management and operational and financial resources.
Our results of operations from these acquisitions could, in the future, result in impairment charges for any of our intangible assets, including goodwill, or other long‑lived assets, particularly if economic conditions worsen unexpectedly. As a result of these changes, our financial condition, results of operations and liquidity could be materially adversely affected. In addition, many of the businesses that we have acquired and will acquire have unaudited financial statements that have been prepared by the management of such companies and have not been independently reviewed or audited. We cannot assure you that the financial statements of companies we have acquired or will acquire would not be materially different if such statements were independently reviewed or audited. If such statements were to be materially different, the tangible and intangible assets we acquire may be more susceptible to impairment charges, which could have a material adverse effect on us.
The success of our business depends on our ability to successfully integrate acquisitions.
19
Acquisitions may require integration of the acquired companies’ sales and marketing, distribution, production, purchasing, information technology, finance and administrative organizations. We may not be able to integrate successfully any business we may acquire or have acquired into our existing business and any acquired businesses may not be profitable or as profitable as we had expected. Our inability to complete the integration of new businesses in a timely and orderly manner could increase costs and lower profits. Factors affecting the successful integration of acquired businesses include, but are not limited to, the following:
•We may become liable for certain liabilities of any acquired business, whether or not known to us. These risks could include, among others, tax liabilities, product liabilities, environmental liabilities and liabilities for employment practices. These liabilities may be significant.
•Substantial attention from our senior management and the management of the acquired business may be required, which could decrease the time that they have to service and attract customers.
•Capital equipment at acquired businesses may require additional maintenance or need to be replaced sooner than we expected.
•The complete integration of acquired companies depends, to a certain extent, on the full implementation of our financial systems and policies.
•We may actively pursue a number of opportunities simultaneously and we may encounter unforeseen expenses, complications and delays, including difficulties in employing sufficient staff and maintaining operational and management oversight.
The success of our business depends on our ability to retain key employees of our acquired businesses.
We cannot assure you we will be able to retain local managers and employees who are important to the operations of our acquired businesses. The loss of key employees may have an adverse effect on the acquired business and on our business as a whole.
Our long‑term success is dependent upon securing and permitting aggregate reserves in strategically located areas. The inability to secure and permit such reserves could negatively affect our earnings in the future.
Aggregates are bulky and heavy and therefore difficult to transport efficiently. Because of the nature of the products, the freight costs can quickly surpass production costs. Therefore, except for geographic regions that do not possess commercially viable deposits of aggregates and are served by rail, barge or ship, the markets for our products tend to be localized around our quarry sites and are served by truck. New quarry sites often take a number of years to develop. Our strategic planning and new site development must stay ahead of actual growth. Additionally, in a number of urban and suburban areas in which we operate, it is increasingly difficult to permit new sites or expand existing sites due to community resistance. Therefore, our future success is dependent, in part, on our ability to accurately forecast future areas of high growth in order to locate optimal facility sites and on our ability to either acquire existing quarries or secure operating and environmental permits to open new quarries. If we are unable to accurately forecast areas of future growth, acquire existing quarries or secure the necessary permits to open new quarries, our financial condition, results of operations and liquidity could be materially adversely affected.
While we perform significant activities around estimating the quantity and quality of our reserves, if those estimates of reserve quantities and qualities differ significantly from actual results due to unexpected geological conditions, we may exhaust our economically viable aggregates reserves sooner than we expect. If we are unable to acquire replacement aggregate reserves, our financial results may be adversely impacted.
Economic Risks
Our business could be impacted by rising interest rates.
Our operations are highly dependent upon the interest rate-sensitive construction industry. Therefore, our business may decline as a result of rising interest rates and costs.
20
Notably, demand in the residential construction market in which we sell our aggregates and ready-mix concrete is affected by interest rates which were recently at historically low levels but have been increasing in recent months. There can be no assurance that interest rates will not continue to increase in the future, affecting our business in an adverse manner. While the residential construction market accounted for 30% of our aggregates business and 60% of our ready-mix concrete business in 2022, we expect volume declines in 2023.
Aside from these inherent risks from within our operations, our earnings are also affected by changes in short-term interest rates. However, rising interest rates are not necessarily predictive of weaker operating results.
A decline in public infrastructure construction and reductions in governmental funding could adversely affect our earnings in the future.
A significant portion of our revenue is generated from publicly‑funded construction projects. As a result, if publicly‑funded construction decreases due to reduced federal or state funding or otherwise, our financial condition, results of operations and liquidity could be materially adversely affected.
Under U.S. law, annual funding levels for highways is subject to yearly appropriation reviews. This annual review of funding increases the uncertainty of many state departments of transportation regarding funds for highway projects. This uncertainty could result in states being reluctant to undertake large multi‑year highway projects which could, in turn, negatively affect our sales. We cannot be assured of the existence, amount and timing of appropriations for spending on federal, state or local projects. A government shutdown, and other similar budgetary impasses or reductions, may contribute to uncertainty in regard to government spending and may have adverse effects on the economy. Federal support for the cost of highway maintenance and construction is dependent on congressional action. In addition, each state funds its infrastructure spending from specially allocated amounts collected from various taxes, typically gasoline taxes and vehicle fees, along with voter‑approved bond programs. Shortages in state tax revenues can reduce the amounts spent on state infrastructure projects, even below amounts awarded under legislative bills. If state tax revenues in Texas, Utah, Kansas and Missouri experience state‑level funding pressures caused by lower tax revenues and an inability to finance approved projects, our revenues could be negatively impacted. Delays or cancellations of state infrastructure spending could have a material adverse effect on our financial condition, results of operations and liquidity.
Our business relies on private investment in infrastructure, and periods of economic stagnation or recession may adversely affect our earnings in the future.
A significant portion of our sales are for projects with non‑public owners whose construction spending is affected by developers’ ability to finance projects. Residential and nonresidential construction could decline if companies and consumers are unable to finance construction projects or in periods of economic stagnation or recession, which could result in delays or cancellations of capital projects. If housing starts, particularly in the Houston and Salt Lake City geographies, and nonresidential projects stagnate or decline, which in some cases we are already starting to experience, sale of our construction materials, downstream products and paving and related services may decline and our financial condition, results of operations and liquidity could be materially adversely affected.
Environmental, health and safety laws and regulations and any changes to, or liabilities or litigation arising under, such laws and regulations could have a material adverse effect on our financial condition, results of operations and liquidity.
We are subject to a variety of federal, state, provincial and local laws and regulations relating to, among other things: (i) the release or discharge of materials into the environment; (ii) the management, use, generation, treatment, processing, handling, storage, transport or disposal of hazardous materials, including the management of hazardous and non-hazardous waste used as a fuel substitute in our cement kiln in Hannibal, Missouri; (iii) the management, use, generation, treatment, processing, handling, storage, transport or disposal of non‑hazardous solid waste used as a fuel substitute in our cement kiln in Davenport, Iowa; and (iv) the protection of public and employee health and safety and the environment. These laws and regulations impose strict liability in some cases without regard to negligence or fault and expose us to liability for the environmental condition of our currently or formerly owned, leased or operated facilities or third‑party waste disposal sites, and may expose us to liability for the conduct of others or for our actions, even if such actions complied with all applicable laws at the time these actions were taken. In particular, we may incur remediation costs and other related expenses because our facilities were constructed and operated before the adoption of current environmental laws and the institution of compliance practices or because certain of our processes are regulated. These laws and regulations may also expose us to liability for claims of personal injury or property or natural resource damage related to alleged exposure to, or releases of, regulated or hazardous materials. The existence of contamination at properties we own, lease or operate could also result in increased operational costs or restrictions on our ability to use those properties as intended.
21
There is an inherent risk of liability in the operation of our business, and despite our compliance efforts, we may be in noncompliance with environmental, health and safety laws and regulations from time to time. These potential liabilities or events of noncompliance could have a material adverse effect on our operations and profitability. In many instances, we must have government approvals, certificates, permits or licenses in order to conduct our business, which could require us to make significant capital, operating and maintenance expenditures to comply with environmental, health and safety laws and regulations. Our failure to obtain and maintain required approvals, certificates, permits or licenses or to comply with applicable governmental requirements could result in sanctions, including substantial fines or possible revocation of our authority to conduct some or all of our operations. Governmental requirements that affect our operations also include those relating to air and water quality, waste management, asset reclamation, the operation and closure of municipal waste and construction and demolition debris landfills, remediation of contaminated sites and worker health and safety. These requirements are complex and subject to frequent change, often in connection with changes in the presidential administration. Stricter laws and regulations, more stringent interpretations of existing laws or regulations or the future discovery of environmental conditions may impose new liabilities on us, reduce operating hours, require additional investment by us in pollution control equipment or impede our opening new or expanding existing plants or facilities.
We have incurred, and may in the future incur, significant capital and operating expenditures to comply with such laws and regulations, and in some cases we have been or could be named as a defendant in litigation brought by governmental agencies or private parties. In addition, we have recorded liabilities in connection with our reclamation and landfill closure obligations, but there can be no assurances that the costs of our obligations will not exceed our estimates. The cost of complying with such laws and defending against any litigation could have a material adverse effect on our financial condition, results of operations and liquidity.
Shortages of, or increases in prices for, commodities, labor and other production and delivery inputs, including as a result of inflation, could restrict our ability to operate our business and could have significant impacts on our operating costs.
Shortages of, or increases in prices for, production and delivery inputs, including commodities and labor, and other inputs related to the production and delivery of our products, could adversely affect our business, and have already in certain cases. Our cost of revenue consists of production and delivery inputs, which primarily include labor, utilities, raw materials, fuel, transportation, royalties and other direct costs incurred in the production and delivery of our products and services. Increases in these costs, as a result of general economic conditions, inflationary pressures or otherwise, may reduce our operating margin and adversely affect our financial position if we are unable to hedge or otherwise offset such increases. Specifically, significant increases or fluctuations in the prices of certain energy commodities, including coal, diesel fuel, liquid asphalt and other petroleum-based resources, which we consume significant amounts of in our production and distribution processes, have negatively affected the results of our business operations and may further cause our results to suffer. Additionally, labor is a meaningful component in our ability to operate our business and can have a significant impact on the cost of operating our business. Labor shortages could restrict our ability to operate our business or result in increased labor costs as a result of wage increases due to competition for qualified workers. Increased labor costs, whether due to labor shortages, competition for labor from other industries, changing demographics of the overall work force or otherwise may reduce our operating margin and adversely affect our financial position.
Recent inflation, across several input costs has adversely impacted us. Sustained inflation could result in higher costs for transportation, energy, materials, supplies and labor. Our efforts to recover inflation-based cost increases from our customers may be hampered as a result of the structure of our contracts and the contract bidding process as well as the competitive industries, economic conditions and countries in which we operate. Accordingly, substantial inflation may result in a material adverse impact on our costs, profitability and financial result.
Availability of and pricing for raw materials and labor can be affected by various national, regional, local, economic and political factors. For example, government-imposed tariffs and trade regulations on imported raw materials could have significant impacts on our costs to operate our business, as well as the ongoing labor and supply shortage.
Financial Risks
Difficult and volatile conditions in the credit markets could affect our financial condition, results of operations and liquidity.
Demand for our products is primarily dependent on the overall health of the economy, and federal, state and local public infrastructure funding levels. A stagnant or declining economy tends to produce less tax revenue for public infrastructure agencies, thereby decreasing a source of funds available for spending on public infrastructure improvements, which constitute a significant part of our business.
22
There is a likelihood that we will not be able to collect on certain of our accounts receivable from our customers. If our customers are unable to obtain credit or unable to obtain credit in a timely manner, they may be unable to pay us, which could have a material adverse effect on our financial condition, results of operations and liquidity.
If we are unable to accurately estimate the overall risks, requirements or costs when we bid on or negotiate contracts that are ultimately awarded to us, we may achieve lower than anticipated profits or incur contract losses.
Even though the majority of our government contracts contain raw material escalators to protect us from certain input material price increases, a portion or all of the contracts are often on a fixed cost basis. Pricing on a contract with a fixed unit price is based on approved quantities irrespective of our actual costs and contracts with a fixed total price require that the total amount of work be performed for a single price irrespective of our actual costs. We realize profit on our contracts only if our revenue exceeds actual costs, which requires that we successfully estimate our costs and then successfully control actual costs and avoid cost overruns. If our cost estimates for a contract are inadequate, or if we do not execute the contract within our cost estimates, then cost overruns may cause us to incur a loss or cause the contract not to be as profitable as we expected. The costs incurred and profit realized, if any, on our contracts can vary, sometimes substantially, from our original projections due to a variety of factors, including, but not limited to:
•failure to include materials or work in a bid, or the failure to estimate properly the quantities or costs needed to complete a lump sum contract;
•delays caused by weather conditions or otherwise failing to meet scheduled acceptance dates;
•contract or project modifications or conditions creating unanticipated costs that are not covered by change orders;
•changes in availability, proximity and costs of materials, including liquid asphalt, cement, aggregates and other construction materials (such as stone, gravel, sand and oil for asphalt paving), as well as fuel and lubricants for our equipment;
•to the extent not covered by contractual cost escalators, variability and inability to predict the costs of purchasing coal, diesel, liquid asphalt and cement;
•availability and skill level of workers;
•failure by our suppliers, subcontractors, designers, engineers or customers to perform their obligations;
•fraud, theft or other improper activities by our suppliers, subcontractors, designers, engineers, customers or our own personnel;
•mechanical problems with our machinery or equipment;
•citations issued by any governmental authority, including OSHA and MSHA;
•difficulties in obtaining required governmental permits or approvals;
•changes in applicable laws and regulations;
•uninsured claims or demands from third parties for alleged damages arising from the design, construction or use and operation of a project of which our work is part; and
•public infrastructure customers may seek to impose contractual risk‑shifting provisions more aggressively which may result in us facing increased risks.
These factors, as well as others, may cause us to incur losses, which could have a material adverse effect on our financial condition, results of operations and liquidity.
We could incur material costs and losses as a result of claims that our products do not meet regulatory requirements or contractual specifications.
23
We provide our customers with products designed to meet building code or other regulatory requirements and contractual specifications for measurements such as durability, compressive strength, weight‑bearing capacity and other characteristics. If we fail or are unable to provide products meeting these requirements and specifications, material claims may arise against us and our reputation could be damaged. Additionally, if a significant uninsured, non‑indemnified or product‑related claim is resolved against us in the future, that resolution could have a material adverse effect on our financial condition, results of operations and liquidity.
The cancellation of a significant number of contracts or our disqualification from bidding for new contracts could have a material adverse effect on our financial condition, results of operations and liquidity.
We could be prohibited from bidding on certain government contracts if we fail to maintain qualifications required by the relevant government entities. In addition, contracts with governmental entities can usually be canceled at any time by them with payment only for the work completed. A cancellation of an unfinished contract or our disqualification from the bidding process could result in lost revenue and cause our equipment to be idled for a significant period of time until other comparable work becomes available, which could have a material adverse effect on our financial condition, results of operations and liquidity.
Our operations are subject to special hazards that may cause personal injury or property damage, subjecting us to liabilities and possible losses, including punitive damages, which may not be covered by insurance.
Operating hazards inherent in our business, some of which may be outside our control, can cause personal injury and loss of life, damage to or destruction of property, plant and equipment and environmental damage. We maintain insurance coverage in amounts and against the risks we believe are consistent with industry practice, but this insurance may not be adequate or available to cover all losses or liabilities we may incur in our operations. Our insurance policies are subject to varying levels of deductibles. However, liabilities subject to insurance are difficult to estimate due to unknown factors, including the severity of an injury, the determination of our liability in proportion to other parties, the number of incidents not reported and the effectiveness of our safety programs. If we were to experience insurance claims or costs above our estimates, our financial condition, results of operations and liquidity could be materially adversely affected.
Unexpected factors affecting self‑insurance claims and reserve estimates could adversely affect our business.
We use a combination of third‑party insurance and self‑insurance to provide for potential liabilities for workers’ compensation, general liability, vehicle accident, property and medical benefit claims. Although we seek to minimize our exposure on individual claims, for the benefit of costs savings we have accepted the risk of multiple independent material claims occurring. We estimate the projected losses and liabilities associated with the risks retained by us, in part, by considering historical claims experience, demographic and severity factors and other actuarial assumptions which, by their nature, are subject to a high degree of variability. Among the causes of this variability are unpredictable external factors affecting future inflation rates, discount rates, litigation trends, legal interpretations, benefit level changes and claim settlement patterns. Any such matters could have a material adverse effect on our financial condition, results of operations and liquidity.
Our debt could adversely affect our financial condition, our ability to raise additional capital to fund our operations, our ability to operate our business, our ability to react to changes in the economy or our industry and our ability to pay our debts, which could divert our cash flow from operations to debt payments.
As of December 31, 2022, our total debt was approximately $1.5 billion, which includes $1.0 billion of Senior Notes and $509.6 million of senior secured indebtedness under our senior secured credit facilities and we had an additional $325.2 million of unutilized capacity under our senior secured revolving credit facility (after giving effect to approximately $19.8 million of letters of credit outstanding). In addition, on January 10, 2023, we increased the total aggregate commitments under our senior secured revolving credit facility from $345.0 million to $395.0 million.
Our debt level subjects us to risks with important consequences, including:
•increasing our vulnerability to general economic and industry conditions;
•requiring a significant portion of cash flow from operations to be dedicated to the payment of principal and interest on our indebtedness, thereby reducing our ability to use our cash flow to fund our operations, capital expenditures and future business opportunities;
•the deductibility of our interest expense may be currently limited under existing law;
24
•subjecting us to the risk of increased interest rates as a portion of our borrowings under our senior secured credit facilities are exposed to variable rates of interest;
•restricting us from making strategic acquisitions or causing us to make non-strategic divestitures;
•limiting our ability to obtain additional financing for working capital, capital expenditures, debt service requirements, acquisitions and general corporate or other purposes;
•limiting our ability to adjust to changing market conditions and placing us at a competitive disadvantage compared to our competitors who have less leverage than we do; and
•making it more difficult for us to make payments on our debt.
Borrowings under our senior secured credit facilities are at variable rates of interest and expose us to interest rate risk. If interest rates increase, our debt service obligations on the variable rate indebtedness will increase even though the amount borrowed remained the same, and our net income and cash flows, including cash available for servicing our indebtedness, will correspondingly decrease. We may in the future enter into interest rate swaps that involve the exchange of floating for fixed rate interest payments in order to reduce interest rate volatility. However, we may not maintain interest rate swaps with respect to all of our variable rate indebtedness, and any interest rate swaps we enter into may not fully mitigate our interest rate risk. In addition, the indentures that govern the Senior Notes and the amended and restated credit agreement governing our senior secured credit facilities (“Credit Agreement”) contain restrictive covenants that limit our ability to engage in activities that may be in our long-term best interest. Our failure to comply with those covenants could result in an event of default which, if not cured or waived, could result in the acceleration of all our debt.
Despite our current level of indebtedness, we and our subsidiaries may still incur substantially more debt. This could reduce our ability to satisfy our current obligations and further exacerbate the risks to our financial condition described above.
We and our subsidiaries may incur significant additional indebtedness in the future to fund acquisitions as part of our growth strategy. Although the indentures governing the Senior Notes and the Credit Agreement contain restrictions on the incurrence of additional indebtedness, these restrictions are subject to a number of qualifications and exceptions, and we could incur substantial additional indebtedness in compliance with these restrictions.
Our senior secured credit facilities include an uncommitted incremental facility that allows us the option to increase the amount available under the term loan facility and/or the senior secured revolving credit facility by the greater of (i) $500.0 million and (ii) an amount equal to our Consolidated EBITDA for the most recently ended test period.
Availability of such incremental facilities will be subject to, among other conditions, the absence of an event of default and the receipt of commitments by existing or additional financial institutions.
We may not be able to generate sufficient cash to service all of our indebtedness and may be forced to take other actions to satisfy our obligations under our indebtedness, which may not be successful.
Our ability to make scheduled payments on our debt obligations, refinance our debt obligations and fund planned capital expenditures and other corporate expenses depends on our financial condition and operating performance, which is subject to prevailing economic and competitive conditions. We are also subject to certain financial, business, legislative, regulatory and legal restrictions on the payment of distributions and dividends. Many of these factors are beyond our control. We may not be able to maintain a level of cash flows from operating activities sufficient to permit us to pay the principal, premium, if any, and interest on our indebtedness, which would constitute an event of default if not cured. See “Management’s Discussion and Analysis of Financial Condition and Results of Operations—Liquidity and Capital Resources.” If our cash flows and capital resources are insufficient to fund our debt service obligations or our other needs, we may be forced to reduce or delay investments and capital expenditures, seek additional capital, restructure or refinance our indebtedness or sell assets. These alternative measures may not be successful and may not permit us to meet our scheduled debt service obligations or fund planned capital expenditures. Significant delays in our planned capital expenditures may materially and adversely affect our future revenue prospects. In addition, our ability to restructure or refinance our debt will depend on the capital markets and our financial condition at such time. Any refinancing of our debt could be at higher interest rates and may require us to comply with more onerous covenants, which could further restrict our business operations. The Credit Agreement and the indentures governing the Senior Notes restrict our ability to use the proceeds from asset sales. We may not be able to consummate those
25
asset sales to raise capital or sell assets at prices that we believe are fair and proceeds that we do receive may not be adequate to meet any debt service obligations then due. In addition, any failure to make payments of interest and principal on our outstanding indebtedness on a timely basis would likely result in a reduction of our credit rating, which could harm our ability to incur additional indebtedness.
The indentures governing the Senior Notes and the Credit Agreement contain covenants and provisions that are restrictive.
The indentures governing the Senior Notes and Credit Agreement contain restrictive covenants that, among other things, limit our ability, and the ability of our restricted subsidiaries, to:
•incur additional indebtedness, issue certain preferred shares or issue guarantees;
•pay cash dividends, redeem our membership interests or make other restricted payments, including purchasing our Class A common stock;
•make investments, loans or advances;
•incur additional liens;
•transfer or sell assets;
•merge or engage in consolidations;
•enter into certain transactions with our affiliates;
•designate subsidiaries as unrestricted subsidiaries;
•repay subordinated indebtedness; and
•change our lines of business.
The senior secured credit facilities also require us to maintain a maximum first lien net leverage ratio. The Credit Agreement also contains certain customary representations and warranties, affirmative covenants and events of default (including, among others, an event of default upon a change of control). If an event of default occurs, the lenders under our senior secured credit facilities will be entitled to take various actions, including the acceleration of amounts due under our senior secured credit facilities and all actions permitted to be taken by a secured creditor. Our failure to comply with obligations under the indentures governing the Senior Notes and the Credit Agreement may result in an event of default under the indenture or the amended and restated Credit Agreement. A default, if not cured or waived, may permit acceleration of our indebtedness. If our indebtedness is accelerated, we may not have sufficient funds available to pay the accelerated indebtedness or the ability to refinance the accelerated indebtedness on terms favorable to us or at all.
Other Risks
Our success is dependent on our senior management team and our ability to retain and attract qualified personnel.
Our success depends on the continuing services of key members of our management team. We believe our senior management team possesses valuable knowledge and skills that are crucial to our success and would be difficult to replicate or replace.
Competition for senior management is intense, and we may not be able to retain our management team or attract additional qualified personnel. The unexpected loss of a member of senior management has in the past and could in the future require certain of our remaining senior officers to divert immediate attention, which can be substantial or require costly external resources in the short term. While we are developing plans for key management succession and have long-term compensation plans designed to retain our senior employees, if our retention and succession plans do not operate effectively, our business could be adversely affected. The inability to adequately fill vacancies in our senior executive positions on a timely basis could negatively affect our ability to implement our business strategy, which could have a material adverse effect on our results of operations, financial condition and liquidity.
26
We use large amounts of coal, electricity, diesel fuel, liquid asphalt and other petroleum‑based resources that are subject to potential reliability issues, supply constraints and significant price fluctuation, which could have a material adverse effect on our financial condition, results of operations and liquidity.
In our production and distribution processes, we consume significant amounts of electricity, diesel fuel, liquid asphalt and other petroleum‑based resources. The availability and pricing of these resources are subject to market forces that are beyond our control. For example, during 2022 the cost of coal, diesel fuel and other petroleum-based resources rose sharply. Furthermore, we are vulnerable to any reliability issues experienced by our suppliers, which also are beyond our control. Our suppliers contract separately for the purchase of such resources and our sources of supply could be interrupted should our suppliers not be able to obtain these materials due to higher demand or other factors that interrupt their availability. Variability in the supply and prices of these resources could have a material adverse effect on our financial condition, results of operations and liquidity.
Climate change and climate change legislation or regulations may adversely affect our business.
A number of governmental bodies have finalized, proposed or are contemplating legislative and regulatory changes in response to the potential effects of climate change, and Canada and the United States have agreed to the Paris Agreement, the successor to the Kyoto Protocol to the United Nations Framework Convention on Climate Change, which could lead to additional legislative and regulatory changes in those countries. In addition, in the United States, in part due to the current administration’s focus on climate change as central to U.S. policy, there may be additional legislative and regulatory changes connected to changes in presidential administration. In April 2021, President Biden announced that the United States' Nationally Defined Contribution to the Paris Agreement will be an economy-wide reduction in greenhouse (“GHG”) emissions of 50-52% by 2030, relative to 2005 levels. In addition, in advance of the November 2021 Conference of the Parties 26 meeting in Glasgow, Scotland (“COP26”), the Biden administration released details on its strategy to achieve those targets. The COP26 meeting concluded with international consensus to further reduce GHG emissions, including through the elimination of certain fossil fuel subsidies. In conjunction with COP26, the United States and China also bilaterally agreed to cooperate on GHG emission reductions. Any resulting legislation or regulation has and potentially could include provisions for a “cap and trade” system of allowances and credits, among other provisions. The EPA promulgated a mandatory reporting rule covering GHG emissions from sources considered to be large emitters. The EPA has also promulgated a GHG emissions permitting rule, referred to as the “Tailoring Rule” which sets forth criteria for determining which facilities are required to obtain permits for GHG emissions pursuant to the U.S. Clean Air Act’s Prevention of Significant Deterioration (“PSD”) and Title V operating permit programs. The U.S. Supreme Court ruled in June 2014 that the EPA exceeded its statutory authority in issuing the Tailoring Rule but upheld the Best Available Control Technology (“BACT”) requirements for GHGs emitted by sources already subject to PSD requirements for other pollutants. Our cement plants and one of our landfills hold Title V Permits. If future modifications to our facilities require PSD review for other pollutants, GHG BACT requirements may also be triggered, which could require significant additional costs.
Other potential effects of climate change include physical effects such as disruption in production and product distribution as a result of major storm events and shifts in regional weather patterns and intensities. Given the nature of our operations, physical impacts may include disruptions in production and/or regional supply or product distribution networks due to major storm events, shifts in regional rainfall and temperature patterns and intensities, as well as flooding from sea level changes. There is also a potential for climate change legislation and regulation to adversely affect the cost of purchased energy and electricity.
The effects of climate change on our operations are highly uncertain and difficult to estimate. However, because a chemical reaction inherent to the manufacture of Portland cement releases carbon dioxide, a GHG, cement kiln operations may be disproportionately affected by future regulation of GHGs. Climate change and legislation and regulation concerning GHGs could have a material adverse effect on our financial condition, results of operations and liquidity.
Our business is subject to evolving corporate governance and corporate disclosure regulations and expectations, including with respect to environmental, social and governance matters, that could expose us to numerous risks.
We are subject to changing rules and regulations promulgated by a number of governmental and self-regulatory organizations, including the SEC, the New York Stock Exchange (the "NYSE") and the Financial Accounting Standards Board. These rules and regulations continue to evolve in scope and complexity and many new requirements have been created in response to laws enacted by Congress, making compliance more difficult and uncertain. In addition, increasingly regulators, customers, investors and employees and other stakeholders are focusing on environmental, social and governance (“ESG”) matters and related disclosures. These changing rules, regulations and stakeholder expectations have resulted in, and are likely to continue to result in, increased general and administrative expenses and increased management time and attention spent complying or meeting such regulations and expectations. For example, developing and acting on initiatives within the scope of ESG and collecting, measuring, and reporting ESG related information and metrics can be costly, difficult and time consuming and is subject to evolving reporting standards, including the SEC’s recently proposed climate-related reporting requirements,
27
and similar proposals by other international regulatory bodies. We may also communicate certain initiatives and goals, regarding environmental matters, diversity, responsible sourcing and social investments and other ESG related matters, in our SEC filings or in other public disclosures. These initiatives and goals within the scope of ESG could be difficult and expensive to implement, the technologies needed to implement them may not be cost effective and may not advance at a sufficient pace, and we could be criticized for the accuracy, adequacy or completeness of the disclosure. Further, statements about our ESG-related initiatives and goals, and progress against these goals, may be based on standards for measuring progress that are still developing, internal controls and processes that continue to evolve, and assumptions that are subject to change in the future. In addition, we could be criticized for the scope or nature of such initiatives or goals, or for any revisions to these goals. If our ESG-related data, processes and reporting are incomplete or inaccurate, or if we fail to achieve progress with respect to our goals within the scope of ESG on a timely basis, or at all, our reputation, business, financial performance and growth could be adversely affected.
Unexpected operational difficulties at our facilities could disrupt operations, raise costs, and reduce revenue and earnings in the affected locations.
The reliability and efficiency of certain of our facilities is dependent upon vital pieces of equipment, such as our cement manufacturing kilns in Hannibal, Missouri and Davenport, Iowa. Although we have scheduled outages to perform maintenance on certain of our facilities, vital equipment may periodically experience unanticipated disruptions due to accidents, mechanical failures or other unanticipated events such as fires, explosions, violent weather conditions or other unexpected operational difficulties. A substantial interruption of one of our facilities could require us to make significant capital expenditures to restore operations and could disrupt our operations, raise costs, and reduce revenue and earnings in the affected locations.
We may incur significant costs in connection with pending and future litigation.
We have seen increases in litigation as the scope of our business and operations has grown. We are, or may become, party to various lawsuits, claims, investigations, and proceedings, including but not limited to personal injury, environmental, antitrust, tax, property entitlements and land use, commercial, contract, product liability, health and safety, and employment matters. The outcome of pending or future lawsuits, claims, investigations, or proceedings is often difficult to predict and could be adverse and material in amount. Development in these proceedings can lead to changes in management’s estimates of liabilities associated with these proceedings including the judge’s rulings or judgments, jury verdicts, settlements, or changes in applicable law. Future adverse rulings, settlements, or unfavorable developments could result in charges that could have a material adverse effect on our results of operations and cash flows in a particular period. In addition, the defense of these lawsuits, claims, investigations, and proceedings may divert our management’s attention, and we may incur significant costs in defending these matters.
We are dependent on information technology. Our systems and infrastructure face certain risks, including cyber security risks and data leakage risks.
We are dependent on information technology systems and infrastructure to carry out important operational activities and to maintain our business records. In addition, we rely on the systems of third parties, such as third-party vendors. As part of our normal business activities, we collect and store certain personal identifying and confidential information relating to our customers, employees, vendors and suppliers, and maintain operational and financial information related to our business. We may share some of this confidential information with our vendors. We rely on our vendors and third-party service providers to maintain effective cybersecurity measures to keep our information secure. Any significant breakdown, invasion, destruction or interruption of our existing or future systems by employees, third parties, vendors, others with authorized access to our systems, or unauthorized persons could negatively affect operations. In addition, future systems upgrades or changes could be time consuming, costly and result in unexpected interruptions or other adverse effects on our business. There is also a risk that we could experience a business interruption, theft of information or reputational damage as a result of a cyber-attack, such as an infiltration of a data center, “ransomware” or other malware, denial-of services attacks, hacking, “phishing” attacks, employee or insider error, malfeasance, social engineering, or data leakage of confidential information either internally or at our third‑party providers. In addition, remote work arrangements for our employees could strain our technology resources and introduce operational risks, including heightened cybersecurity risk. Remote working environments may be less secure and more susceptible to hacking attacks. These risks have also impacted, and may in the future impact the third parties on which we rely, and security measures employed by these third parties may also prove to be ineffective at countering threats.
While we have invested in the protection of our data and information technology to reduce these risks and periodically test the security of our information systems network, there can be no assurance that our efforts will prevent breakdowns or breaches in our systems that could have a material adverse effect on our financial condition, results of operations and liquidity. Any or our vendors’ and third-party service providers’ failure to maintain the security of the data we
28
are required to protect could result in damage to our reputation, financial obligations to third parties, fines, penalties, regulatory proceedings and private litigation with potentially large costs, and also in deterioration in customers’ confidence in us and other competitive disadvantages. While, to date, we have not had a significant cybersecurity breach or attack that has a material impact on our business or results of operations, there can be no assurance that our efforts to maintain the security and integrity of our information technology networks and related systems will be effective or that attempted security breaches or disruptions would not be successful or damaging.
Our current information technology platforms and systems require periodic updating and maintenance. Further, we also undertake activities to replace our current systems with technology we believe to be superior to our existing technology. The cost and effort to implement such changes may be significant, and may be more than we initially estimate. These changes may result in our systems being unavailable from time to time, or may not produce the desired results, which may adversely affect our ability to manage and report our results.
Labor disputes, strikes, other forms of work stoppage or slowdown or other union activities could disrupt operations of our businesses.
As of December 31, 2022, labor unions represented approximately 10% of our total employees, substantially all in our cement division and at our Canadian operations. Our collective bargaining agreements for employees generally expire within three years. Although we believe we have good relations with our employees and unions, disputes with our trade unions, union organizing activity, or the inability to renew our labor agreements or adverse labor relations at any of our locations, could lead to strikes, other forms of work stoppage, slowdowns or other actions that could disrupt our operations and, consequently, have a material adverse effect on our financial condition, results of operations and liquidity.
Outbreaks of contagious disease or similar public health threats could materially and adversely affect our business, financial condition and results of operations.
Outbreaks of contagious disease, including COVID-19, or other adverse public health developments in the U.S. or worldwide could have a material adverse effect on our business, financial condition and results of operations. For example, the emergence and spread of COVID-19 variants could adversely impact our business and results of operations. Outbreaks of contagious disease, including COVID-19, and other adverse public health developments could affect our business in a number of ways, including but not limited to:
•disruptions or restrictions on our employees’ ability to work effectively due to illness;
•temporary closures or disruptions at our facilities or the facilities of our customers or suppliers could reduce demand for our products or affect our ability to timely meet our customer’s orders and negatively impact our supply chain;
•outbreaks of contagious disease could cause delays or disruptions in our supply chain and we could experience a mining or manufacturing slow-down or seek to obtain alternate sources of supply, which may not be available or may be more expensive; and
•the failure of third parties on which we rely, including our suppliers, customers, contractors, commercial banks, transportation service providers and external business partners, to meet their respective obligations to us, or significant disruptions in their ability to do so, which may be caused by their own financial or operational difficulties, could have an adverse impact on our business, financial condition or results operations.
The impact of contagious disease or other adverse public health developments could also exacerbate other risks discussed elsewhere in this section of this report, any of which could have a material adverse effect on us.
Tax increases and changes in tax rules may adversely affect our financial results.
As a company conducting business with physical operations throughout the United States and Canada, we are exposed, both directly and indirectly, to the effects of changes in U.S., state and local tax rules. Taxes for financial reporting purposes and cash tax liabilities in the future may be adversely affected by changes in such tax rules. Such changes may put us at a competitive disadvantage compared to some of our major competitors, to the extent we are unable to pass the tax costs through to our customers.
The Biden administration has announced in 2022 and 2021, and in certain cases has enacted, a number of tax proposals to fund new government investments in infrastructure, healthcare, and education, among other things. Certain of these proposals involve an increase in the domestic corporate tax rate, which if implemented could have a material impact on
29
our future results of operations and cash flows. On August 16, 2022, the Inflation Reduction Act of 2022 (“IRA”) was signed into law, with tax provisions primarily focused on implementing a 15% minimum tax on global adjusted financial statement income and a 1% excise tax on share repurchases. The IRA also creates a number of potentially beneficial tax credits to incentivize investments in certain technologies and industries. Certain provisions of the IRA will become effective beginning in fiscal 2023. While we do not believe the IRA will have a negative impact on our business, the effects of the measures are unknown at this time.
Organizational Structure Risks
Summit Inc.’s only material asset is its interest in Summit Holdings, and it is accordingly dependent upon distributions from Summit Holdings to pay taxes, make payments under the TRA and pay dividends.
Summit Inc. is a holding company and has no material assets other than its ownership of LP Units and has no independent means of generating revenue. Summit Inc. intends to cause Summit Holdings to make distributions to holders and former holders of LP Units in an amount sufficient to cover all applicable taxes at assumed tax rates, payments under the TRA and cash distributions, if any, declared by it. Deterioration in the financial condition, earnings or cash flow of Summit Holdings and its subsidiaries for any reason, or restrictions on payments by subsidiaries to their parent companies under applicable laws, including laws that require companies to maintain minimum amounts of capital and to make payments to stockholders only from profits, could limit or impair their ability to pay such distributions. Additionally, to the extent that Summit Inc. needs funds, and Summit Holdings is restricted from making such distributions under applicable law or regulation or under the terms of our financing arrangements, or is otherwise unable to provide such funds, it could have a material adverse effect on our financial condition, results of operations and liquidity.
Payments of dividends, if any, are at the discretion of our board of directors after taking into account various factors, including our business, operating results and financial condition, current and anticipated cash needs, plans for expansion and any legal or contractual limitations on our ability to pay dividends. Any financing arrangement that we enter into in the future may include restrictive covenants that limit our ability to pay dividends. In addition, Summit Holdings is generally prohibited under Delaware law from making a distribution to a limited partner to the extent that, at the time of the distribution, after giving effect to the distribution, liabilities of Summit Holdings (with certain exceptions) exceed the fair value of its assets. Subsidiaries of Summit Holdings are generally subject to similar legal limitations on their ability to make distributions to Summit Holdings.
Summit Inc. anticipates using certain distributions from Summit Holdings to acquire additional LP Units.
The limited partnership agreement of Summit Holdings provides for cash distributions, which we refer to as “tax distributions,” to be made to the holders of the LP Units if it is determined that the income of Summit Inc. will give rise to net taxable income allocable to holders of LP Units. To the extent that future tax distributions Summit Inc. receives exceed the amounts it actually requires to pay taxes and make payments under the TRA, our board of directors has in the past and may in the future cause Summit Inc. to use such excess cash to acquire additional newly-issued LP Units at a per unit price determined by reference to the volume weighted average price per share of the Class A common stock during the five trading days immediately preceding the date of the relevant board action. During the fourth quarter of 2022, Summit Inc. used approximately $59.3 million of such distributions to purchase LP Units. See “Part II, Item 5. Market for Registrant’s Common Equity, Related Stockholder Matters and Issuer Purchases of Equity Securities–Dividends.” Any cash used by Summit Inc. to acquire additional LP Units would not then be available to fund cash dividends on the Class A common stock.
Summit Inc. is required to pay exchanging holders of LP Units for most of the benefits relating to any additional tax depreciation or amortization deductions that we may claim as a result of the tax basis step-up we receive in connection with sales or exchanges of LP Units and related transactions.
Holders of LP Units (other than Summit Inc.) may exchange their LP Units for Class A common stock on a one-for-one basis. The exchanges are expected to result in increases in the tax basis of the tangible and intangible assets of Summit Holdings. These increases in tax basis may increase (for tax purposes) depreciation and amortization deductions and therefore reduce the amount of tax that Summit Inc. would otherwise be required to pay in the future.
In connection with Summit Inc.'s initial public offering ("IPO"), we entered into a TRA with the holders of LP Units that provides for the payment by Summit Inc. to exchanging holders of LP Units of 85% of the benefits, if any, that Summit Inc. is deemed to realize as a result of the increases in tax basis described above and certain other tax benefits related to entering into the TRA, including tax benefits attributable to payments under the TRA. This payment obligation is an obligation of Summit Inc. and not of Summit Holdings. While the actual increase in tax basis and the actual amount and utilization of net operating losses, as well as the amount and timing of any payments under the TRA, will vary depending upon a number of
30
factors, including the timing of exchanges, the price of shares of our Class A common stock at the time of the exchange, the extent to which such exchanges are taxable and the amount and timing of our income, we expect that as a result of the size of the transfers and increases in the tax basis of the tangible and intangible assets of Summit Holdings and our possible utilization of net operating losses, the payments that Summit Inc. may make under the TRA will be substantial.
In certain cases, payments under the TRA may be accelerated or significantly exceed the actual benefits Summit Inc. realizes in respect of the tax attributes subject to the TRA.
The TRA provides that upon certain changes of control, or if, at any time, Summit Inc. elects an early termination of the TRA, Summit Inc.’s obligations under the TRA may be accelerated. Summit Inc.’s ability to achieve benefits from any tax basis increase or net operating losses, and the payments to be made under the TRA, will depend upon a number of factors, including the timing and amount of our future income. As a result, even in the absence of a change of control or an election to terminate the TRA, payments under the TRA could be in excess of 85% of Summit Inc.’s actual cash tax savings.
The actual cash tax savings realized by Summit Inc. under the TRA may be less than the corresponding TRA payments. Further, payments under the TRA may be made years in advance of when the benefits, if any, are realized on our federal and state income tax returns. Accordingly, there may be a material negative effect on our liquidity if the payments under the TRA exceed the actual cash tax savings that Summit Inc. realizes in respect of the tax attributes subject to the TRA and/or distributions to Summit Inc. by Summit Holdings are not sufficient to permit Summit Inc. to make payments under the TRA. Based upon a $28.39 share price of our Class A common stock, which was the closing price on December 30, 2022, and a contractually defined discount rate of 6.48%, we estimate that if Summit Inc. were to exercise its termination right, the aggregate amount of these termination payments would be approximately $249 million. The foregoing number is merely an estimate and the actual payments could differ materially. We may need to incur debt to finance payments under the TRA to the extent our cash resources are insufficient to meet our obligations under the TRA as a result of timing discrepancies or otherwise.
Ownership of Our Class A Common Stock Risks
The market price of shares of our Class A common stock has fluctuated significantly, which could cause the value of your investment to decline.
The market price of our Class A common stock has fluctuated significantly in the past and could be subject to wide fluctuations in the future. During the year ended December 31, 2022, the closing price of our Class A common stock on the NYSE has fluctuated from a low of $21.62 per share to a high of $40.77 per share. Securities markets worldwide experience significant price and volume fluctuations. This market volatility, as well as general economic, market or political conditions, could reduce the market price of shares of our Class A common stock regardless of our operating performance. In addition, our operating results could be below the expectations of public market analysts and investors due to a number of potential factors, including variations in our quarterly operating results or dividends, if any, to stockholders, additions or departures of key management personnel, failure to meet analysts’ earnings estimates, publication of research reports about our industry, litigation and government investigations, changes or proposed changes in laws or regulations or differing interpretations or enforcement thereof affecting our business, adverse market reaction to any indebtedness we may incur or securities we may issue in the future, changes in market valuations of similar companies or speculation in the press or investment community, announcements by our competitors of significant contracts, acquisitions, dispositions, strategic partnerships, joint ventures or capital commitments, adverse publicity about the industries we participate in or individual scandals, and in response the market price of shares of our Class A common stock could decrease significantly. You may be unable to resell your shares of Class A common stock for a profit.
In recent years, stock markets have experienced extreme price and volume fluctuations. In the past, following periods of volatility in the overall market and the market price of a company’s securities, securities class action litigation has often been instituted against these companies. Such litigation, if instituted against us, could result in substantial costs and a diversion of our management’s attention and resources.
Because we have no current plans to pay cash dividends on our Class A common stock, you may not receive any return on investment unless you sell your Class A common stock for a price greater than that which you paid for it.
We have no current plans to pay any cash dividends. The declaration, amount and payment of any future dividends on shares of Class A common stock will be at the sole discretion of our board of directors. Our board of directors may take into account general and economic conditions, our financial condition and results of operations, our available cash and current and
31
anticipated cash needs, capital requirements, contractual, legal, tax and regulatory restrictions and implications on the payment of dividends by us to our stockholders or by our subsidiaries to us and such other factors as our board of directors may deem relevant. In addition, our ability to pay dividends is limited by our senior secured credit facilities and our Senior Notes and may be limited by covenants of other indebtedness we or our subsidiaries incur in the future. As a result, you may not receive any return on an investment in our Class A common stock unless you sell our Class A common stock for a price greater than that which you paid for it.
Future issuance of additional Class A common stock, or securities convertible or exchangeable for Class A common stock, may adversely affect the market price of the shares of our Class A common stock.
As of December 31, 2022, we had 118,408,655 shares of Class A common stock issued and outstanding, and 881,591,345 shares authorized but unissued. The number of unissued shares includes 1,312,004 shares available for issuance upon exchange of LP Units held by limited partners of Summit Holdings. Our amended and restated certificate of incorporation authorizes us to issue shares of Class A common stock and options, rights, warrants and appreciation rights relating to Class A common stock for the consideration and on the terms and conditions established by our board of directors in its sole discretion. We may need to raise significant additional equity capital in connection with acquisitions or otherwise. Similarly, the limited partnership agreement of Summit Holdings permits Summit Holdings to issue an unlimited number of additional limited partnership interests of Summit Holdings with designations, preferences, rights, powers and duties that are different from, and may be senior to, those applicable to the LP Units, and which may be exchangeable for shares of our Class A common stock. Sales of substantial amounts of Class A common stock, or securities convertible or exchangeable for Class A common stock, or the perception that such sales could occur may adversely affect the prevailing market price for the shares of our Class A common stock. Thus holders of our Class A common stock will bear the risk of our future issuances reducing the market price of our Class A common stock and diluting the value of their stock holdings in us.
As of December 31, 2022, we have reserved an aggregate of 17.5 million shares of Class A common stock for issuances under the Amended and Restated Summit Materials, Inc. 2015 Omnibus Incentive Plan (the “Omnibus Incentive Plan”), including 7.2 million shares were available for grant as of December 31, 2022. In addition, we also have 5.5 million shares of Class A common stock reserved for issuance under the Summit Materials, Inc. 2021 Employee Stock Purchase Plan (“ESPP”) as of December 31, 2022. Lastly, as of December 31, 2022, we had outstanding warrants to purchase an aggregate of 31,519 shares of Class A common stock. Any Class A common stock that we issue, including under our Omnibus Incentive Plan, our ESPP or other equity incentive plans that we may adopt in the future, or upon exercise of outstanding options or warrants, or other securities convertible or exchangeable for Class A common stock would dilute the percentage ownership held by the investors of our Class A common stock and may adversely affect the market price of the shares of our Class A common stock.
Anti-takeover provisions in our organizational documents and Delaware law might discourage or delay acquisition attempts for us that you might consider favorable.
Our amended and restated certificate of incorporation and amended and restated bylaws contain provisions that may make the merger or acquisition of our company more difficult without the approval of our board of directors. Among other things, these provisions:
•would allow us to authorize the issuance of undesignated preferred stock in connection with a stockholder rights plan or otherwise, the terms of which may be established and the shares of which may be issued without stockholder approval, and which may include super voting, special approval, dividend, or other rights or preferences superior to the rights of the holders of Class A common stock;
•prohibit stockholder action by written consent unless such action is recommended by all directors then in office;
•provide that the board of directors is expressly authorized to make, alter, or repeal our bylaws and that our stockholders may only amend our bylaws with the affirmative vote of a majority in voting power of all the then-outstanding shares of stock of the Corporation entitled to vote thereon.
•establish advance notice requirements for nominations for elections to our board or for proposing matters that can be acted upon by stockholders at stockholder meetings.
Further, as a Delaware corporation, we are also subject to provisions of Delaware law, which may impede or discourage a takeover attempt that our stockholders may find beneficial. These anti-takeover provisions and other provisions under Delaware law could discourage, delay or prevent a transaction involving a change in control of our company, including
32
actions that our stockholders may deem advantageous, or negatively affect the trading price of our Class A common stock. These provisions could also discourage proxy contests and make it more difficult for you and other stockholders to elect directors of your choosing and to cause us to take other corporate actions you desire.
33
ITEM 1B. UNRESOLVED STAFF COMMENTS
None.
ITEM 2. PROPERTIES.
Properties
In 2022, we moved our headquarters to new office space consisting of 33,191 square feet of office space, which we lease in Denver, Colorado, under a lease expiring on November 30, 2033.
We mine a variety of hard rock materials including limestone, granite, quartzite and unconsolidated materials including clay, sand and gravel at our quarry operations. The aggregates produced at our quarries are utilized as general construction aggregates, bituminous asphalt pavement and ready-mix concrete. Our reserves and resources are across over 230 sites, to which we believe we have adequate road, barge or railroad access.
A map showing the location of all mining properties is below:
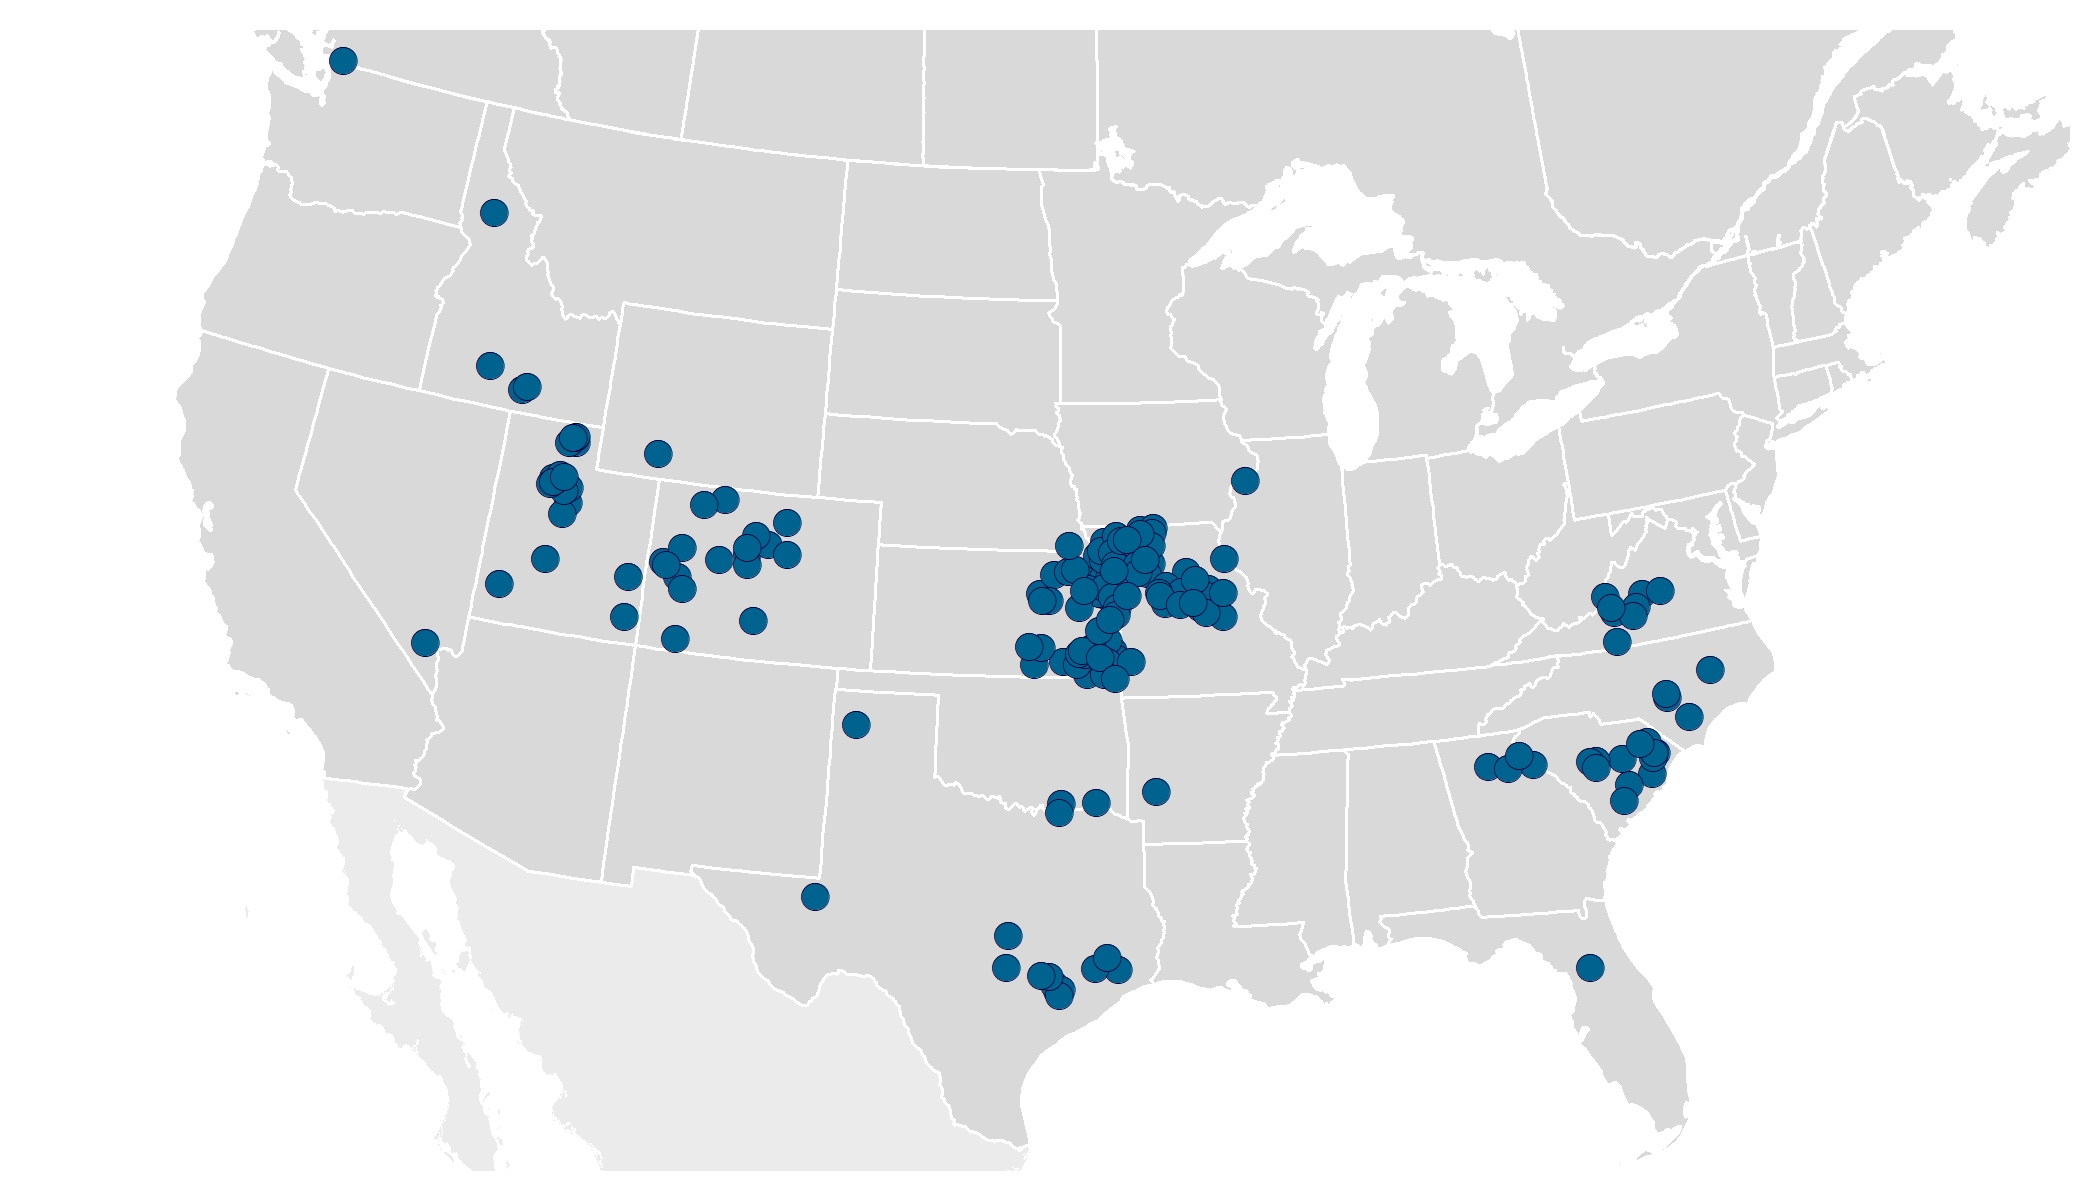
We periodically perform sub-surface exploration at most of our sites through drilling methods. At most of our sites, our mining operations are conducted using surface open pit techniques. Mineral resources are defined as having a reasonable prospect of extraction, and is likely to, either in whole or in part, to become economically extractable. Mineral resource estimates were obtained using property boundaries, exploration coverage and regional geologic research. Areas of uneconomically thick overburden or poor aggregate quality rock were defined to the best ability and excluded from reserves or resources areas. Mineral reserves are defined as an estimate of tonnage that can be economically extracted and includes an allowance for losses that may occur when the material is mined or extracted. Mineral reserves estimates were made using similar parameters as for mineral resources. Quantities are counted as reserves based on the nature of the permit, property boundaries, mineral rights and sub-surface exploration. Areas that are not yet permitted or not explored through a drilling campaign are typically excluded from reserves. Due to the nature of our products, we do not perform metallurgical testing, however during exploration, material is tested for construction aggregates and materials or cement suitability.
As of December 31, 2022, we had 3.7 billion tons of proven and probable mineral reserves and 1.8 billion measured and indicated mineral resources. All mineral reserves are reported as saleable tons. All mineral resources are reported as in-situ tons. In total, we owned 46 percent and leased 54 percent of total mineral reserves and resources. We do not consider any of our individual quarrying operations as material for disclosure purposes. We estimate that the useful life of our reserves serving our aggregates and cement businesses are approximately 53 years and 172 years, respectively, based on the average production
34
rates in 2022 and 2021. We obtained technical reports covering each of our mining sites prepared by Continental Placer Inc. as of December 31, 2022. The technical reports were prepared in accordance with the requirements of the Modernization of Property Disclosures for Mining Registrants set forth in subpart 1300 of Regulation S-K (the “SEC Mining Modernization Rules”). Inferred resources are defined as a mineral resource for which quantity and grade have been estimated but not yet verified. The terms defined in the table below are defined and used in accordance with the SEC Mining Modernization Rules. By segment, our estimate of proven and probable mineral reserves and measured and indicated mineral resources as of December 31, 2022 are shown in the table below:
| Hard Rock Tons | Sand and Gravel Tons | ||||||||||||||||||||||||||||
| (tons in thousands) | West | East | Cement | Total | West | East | Cement | Total | |||||||||||||||||||||
| Proven Reserves | 155,254 | 1,001,504 | 492,303 | 1,649,061 | 854,397 | 176,250 | — | 1,030,647 | |||||||||||||||||||||
| Probable Reserves | 178,613 | 609,547 | 10,760 | 798,920 | 202,128 | 37,113 | — | 239,241 | |||||||||||||||||||||
| Total Proven and Probable Mineral Reserves | 333,867 | 1,611,051 | 503,063 | 2,447,981 | 1,056,525 | 213,363 | — | 1,269,888 | |||||||||||||||||||||
| Measured Resources | 20,675 | 1,013,110 | 47,185 | 1,080,970 | 118,184 | 46,420 | — | 164,604 | |||||||||||||||||||||
| Indicated Resources | 25,000 | 474,433 | — | 499,433 | 19,484 | 31,779 | — | 51,263 | |||||||||||||||||||||
| Total Measured and Indicated Resources | 45,675 | 1,487,543 | 47,185 | 1,580,403 | 137,668 | 78,199 | — | 215,867 | |||||||||||||||||||||
| Inferred Resources | — | 121,500 | — | 121,500 | 46,918 | 11,122 | — | 58,040 | |||||||||||||||||||||
| Hard Rock Market Value (1) | Sand and Gravel Market Value (1) | ||||||||||||||||||||||||||||
| ($ in millions) | West | East | Cement (2) | Total | West | East | Cement (2) | Total | |||||||||||||||||||||
| Proven Reserves | $ | 1,609 | $ | 14,263 | $ | 6,342 | $ | 22,214 | $ | 10,068 | $ | 1,488 | $ | — | $ | 11,555 | |||||||||||||
| Probable Reserves | 1,851 | 8,681 | 139 | 10,671 | 2,382 | 313 | — | 2,695 | |||||||||||||||||||||
| Total Proven and Probable Mineral Reserves | $ | 3,460 | $ | 22,943 | $ | 6,480 | $ | 32,884 | $ | 12,449 | $ | 1,801 | $ | — | $ | 14,250 | |||||||||||||
| Measured Resources | $ | 214 | $ | 14,428 | $ | 608 | $ | 15,250 | $ | 1,393 | $ | 392 | $ | — | $ | 1,784 | |||||||||||||
| Indicated Resources | 259 | 6,757 | — | 7,016 | 230 | 268 | — | 498 | |||||||||||||||||||||
| Total Measured and Indicated Resources | $ | 473 | $ | 21,184 | $ | 608 | $ | 22,266 | $ | 1,622 | $ | 660 | $ | — | $ | 2,282 | |||||||||||||
| Inferred Resources | $ | — | $ | 1,730 | $ | — | $ | 1,730 | $ | 553 | $ | 94 | $ | — | $ | 647 | |||||||||||||
(1) The prices used in estimating the hard rock resources and reserves were determined by using average selling prices ranging from $10.36 to $14.24 per ton, depending on location and market. The prices used in estimating the sand and gravel resources and reserves were determined by using average selling prices ranging from $8.44 to $11.78 per ton, depending on location and market. These prices were selected by the qualified person and are based on our average sales prices per ton realized for the year ended December 31, 2022.
(2) The reserves and resources presented in the Cement Segment include limestone used in cement production using an average selling price for hard rock of $12.88 per ton for the year ended December 31, 2022.
The following chart summarizes our annual production volumes by segment:
| (tons in thousands) | Production Hard Rock Tons | Production Sand and Gravel Tons | |||||||||||||||||||||||||||
| Fiscal Year | West | East | Cement | Total | West | East | Cement | Total | |||||||||||||||||||||
| 2022 | 11,504 | 22,572 | 2,946 | 37,022 | 20,954 | 5,676 | — | 26,630 | |||||||||||||||||||||
| 2021 | 10,763 | 25,338 | 2,904 | 39,005 | 19,127 | 7,075 | — | 26,202 | |||||||||||||||||||||
| 2020 | 8,993 | 24,663 | 3,078 | 36,734 | 18,180 | 6,425 | — | 24,605 | |||||||||||||||||||||
35
As of December 31, 2022, we operated the following production and distribution facilities:
| Quarries and Sand Deposits | Cement Plants | Cement Distribution Terminals | Fixed and portable ready-mix concrete plants | Asphalt paving mix plants | ||||||||||||||||||||||||||||
| Owned | 88 | 2 | 5 | 67 | 18 | |||||||||||||||||||||||||||
| Leased | 131 | — | 4 | 24 | 13 | |||||||||||||||||||||||||||
| Partially owned and leased | 13 | — | — | — | — | |||||||||||||||||||||||||||
| Total | 232 | 2 | 9 | 91 | 31 | |||||||||||||||||||||||||||
The following chart summarizes our production and distribution facilities by state as of December 31, 2022:
| State | Sand & Gravel | Hard Rock | Cement | Ready-mix Concrete | Asphalt Plant | Landfill | Other* | |||||||||||||||||||||||||||||||||||||
| Arkansas | 1 | — | — | — | 2 | — | — | |||||||||||||||||||||||||||||||||||||
| Colorado | 27 | 1 | — | 9 | 7 | 1 | 3 | |||||||||||||||||||||||||||||||||||||
| Florida | — | 1 | — | — | — | — | — | |||||||||||||||||||||||||||||||||||||
| Georgia | 1 | 4 | — | — | — | — | — | |||||||||||||||||||||||||||||||||||||
| Idaho | 6 | — | — | 3 | 1 | — | 3 | |||||||||||||||||||||||||||||||||||||
| Iowa | — | 1 | 2 | — | — | 8 | 1 | |||||||||||||||||||||||||||||||||||||
| Kansas | 7 | 47 | — | 16 | — | — | 11 | |||||||||||||||||||||||||||||||||||||
| Louisiana | — | — | 3 | — | — | — | — | |||||||||||||||||||||||||||||||||||||
| Minnesota | — | — | 2 | — | — | — | — | |||||||||||||||||||||||||||||||||||||
| Missouri | 2 | 51 | 2 | 6 | — | — | 6 | |||||||||||||||||||||||||||||||||||||
| Nebraska | — | 1 | — | — | — | — | — | |||||||||||||||||||||||||||||||||||||
| Nevada | 1 | — | — | 3 | — | — | — | |||||||||||||||||||||||||||||||||||||
| North Carolina | 5 | — | — | — | — | — | 2 | |||||||||||||||||||||||||||||||||||||
| Oklahoma | 5 | 1 | — | 12 | — | — | 3 | |||||||||||||||||||||||||||||||||||||
| South Carolina | 14 | 2 | — | — | — | — | — | |||||||||||||||||||||||||||||||||||||
| Tennessee | — | — | 1 | — | — | — | — | |||||||||||||||||||||||||||||||||||||
| Texas | 17 | 2 | — | 23 | 8 | — | 15 | |||||||||||||||||||||||||||||||||||||
| Utah | 18 | 2 | — | 19 | 5 | — | 4 | |||||||||||||||||||||||||||||||||||||
| Virginia | — | 9 | — | — | 5 | — | 5 | |||||||||||||||||||||||||||||||||||||
| Wisconsin | — | — | 1 | — | — | — | — | |||||||||||||||||||||||||||||||||||||
| Wyoming | 1 | — | — | — | 2 | — | 2 | |||||||||||||||||||||||||||||||||||||
| Total US | 105 | 122 | 11 | 91 | 30 | 9 | 55 | |||||||||||||||||||||||||||||||||||||
| British Columbia, Canada | 2 | 3 | — | — | 1 | 3 | 6 | |||||||||||||||||||||||||||||||||||||
| Total | 107 | 125 | 11 | 91 | 31 | 12 | 61 | |||||||||||||||||||||||||||||||||||||
______________________
*Other primarily consists of office space.
Internal Controls Disclosure
The analysis of our reserves and resources has been developed by our personnel in collaboration with Continental Placer Inc. (“CPI”), designated as our qualified person. Our management teams periodically review our reserves by performing sub-surface exploration as part of our mine planning process. Further, we also review and update our mineral resources and reserves as operations progress through our reserves, and as mining permits are submitted for updates and approvals. The modeling and analysis of the Company’s reserves and resources has been developed by Company mine personnel and reviewed by several levels of internal management, including CPI. The development of such reserves and resources estimates, including related assumptions, was a collaborative effort between CPI and Company staff. This section summarizes the internal control considerations for the Company’s development of estimations, including assumptions, used in reserve and resource analysis and modeling.
36
When determining reserves and resources, as well as the differences between reserves and resources, management developed specific criteria, each of which must be met to qualify as a reserve or resource, respectively. These criteria, such as demonstration of economic viability, legal right to mine, and material quality are specific and attainable. CPI and Company management agree on the reasonableness of the criteria for the purposes of estimating reserves and resources. Calculations using these criteria are either performed or reviewed and validated by CPI.
Estimations and assumptions were developed independently for each geographical operational area. All estimates require a combination of historical data and key assumptions and parameters. When possible, resources and data from generally accepted industry sources, such as governmental resource agencies, were used to develop these estimations.
ITEM 3. LEGAL PROCEEDINGS.
The information set forth under “—Legal Proceedings” in Item 1, “Business,” is incorporated herein by reference.
ITEM 4. MINE SAFETY DISCLOSURES.
The information concerning mine safety violations or other regulatory matters required by Section 1503(a) of the Dodd-Frank Wall Street Reform and Consumer Protection Act and Item 104 of Regulation S-K (17 CFR 229.104) is included in Exhibit 95.1 to this report.
INFORMATION ABOUT OUR EXECUTIVE OFFICERS
Pursuant to General Instruction G(3) to Form 10-K, certain of the information regarding our executive officers required by Items 401(b) and (e) of Regulation S-K is hereby included in Part I of this report.
Anne P. Noonan, 59, President and Chief Executive Officer and Director. Ms. Noonan joined the Company in September 2020. Prior to joining the Company, Ms. Noonan served as president and chief executive officer and as a director of OMNOVA Solutions Inc. (“OMNOVA”), a global provider of emulsion polymers, specialty chemicals, and engineered surfaces for a variety of commercial, industrial, and residential end uses, with manufacturing, technical, and other facilities located in North America, Europe, China, and Thailand, from December 2016 until April 1, 2020 when OMNOVA was acquired by Synthomer plc. Before being appointed President and Chief Executive Officer, Ms. Noonan served as OMNOVA’s President, Performance Chemicals, from 2014 until December 2016. Ms. Noonan previously held several positions of increasing responsibility with Chemtura Corporation, a global specialty chemicals company, from 1987 through 2014, including most recently as senior vice president and president of Chemtura’s Industrial Engineered Products business and Corporate Development function. Ms. Noonan serves on the board of CF Industries Holdings, Inc., a global leader in nitrogen fertilizer manufacturing and distribution.
Karli S. Anderson, 49, Executive Vice President, Chief Environmental, People and ESG Officer. Ms. Anderson joined the Company in 2019 and has served in various roles of increasing responsibility, most recently as the Executive Vice President, Chief Environmental, Social & Governance Officer and Head of Investor Relations after having served as Vice President at Royal Gold, Inc., a precious metals stream and royalty company from 2013 to 2018. Prior to that, Ms. Anderson served in senior investor relations roles at Newmont Mining Corporation and Coeur Mining, and was the Chair of the Board of the Denver Gold Group for six years. Ms. Anderson currently serves on the Board of Westwater Resources where she is the chair of the Compensation Committee and a member of the Audit and Environmental, Health and Safety committees. Ms. Anderson received her Master of Business Administration in finance from the Wharton School at the University of Pennsylvania and her Bachelor of Science from Ohio University. Ms. Anderson is also a National Association of Corporate Directors fellow.
Chris B. Gaskill, 41, Executive Vice President, Chief Legal Officer and Secretary. Mr. Gaskill joined the Company in 2015 and has served in various roles of increasing responsibility, most recently as the Senior Vice President, Deputy General Counsel and Assistant Secretary. Prior to joining the Company, Mr. Gaskill served in senior legal roles at The Western Union Company and Cardinal Health, Inc. Mr. Gaskill began his career at Simpson Thacher & Bartlett, LLP in New York, NY. Mr. Gaskill has a Bachelor of Arts in Government and Legal Studies from Bowdoin College and received his Juris Doctor from the University of Virginia School of Law. He currently serves on the Board of Governors of Colorado Goodwill, one of the state’s largest 501(c)(3) organizations.
Kekin M. Ghelani, 49, Chief Strategy and Growth Officer. Mr. Ghelani joined the Company as Chief Strategy and Growth Officer in May 2022 after serving as Vice President of Strategy, Growth and Ventures of the Water & Protection business unit of DuPont de Nemours, Inc. from 2019 to 2022. From 2013 to 2019, Mr. Ghelani held roles of increasing
37
responsibility at Celanese Corporation, a global chemical and specialty materials company. He has also held senior positions at McKesson Corporation and Honeywell International. Mr. Ghelani received his Master of Business Administration from Emory University and his Bachelor of Science in Mechanical Engineering from the University of South Alabama.
Brian J. Harris, 65, Executive Vice President and Chief Financial Officer. Mr. Harris joined the Company as Chief Financial Officer in October 2013 after having been Executive Vice President and Chief Financial Officer of Bausch & Lomb Holdings Incorporated, a leading global eye health company, from 2009 to 2013. In September 2022, Mr. Harris informed the Company of his intention to retire from the Company and the Board of directors has commenced a search for his successor. From 1990 to 2009, Mr. Harris held positions of increasing responsibility with industrial, automotive, building products and engineering manufacturing conglomerate Tomkins plc, including President of the $2 billion worldwide power transmission business for Gates Corporation, and Senior Vice President for Strategic Business Development and Business Administration, Chief Financial Officer and Secretary of Gates Corporation. Mr. Harris received a Bachelor of Accountancy from Glasgow University and is qualified as a Scottish Chartered Accountant.
38
PART II
ITEM 5. MARKET FOR REGISTRANT’S COMMON EQUITY, RELATED STOCKHOLDER MATTERS AND ISSUER PURCHASES OF EQUITY SECURITIES.
Market Information
Summit Inc.’s Class A common stock began publicly trading on the NYSE under the symbol “SUM” on March 11, 2015. Prior to that time, there was no public market for our Class A common stock. Our Class B common stock is not publicly traded. As of February 13, 2023, there were five holders of record of our Class A common stock and 30 holders of record of our Class B common stock.
These stockholder figures do not include a substantially greater number of holders whose shares are held of record by banks, brokers and other financial institutions.
All of the outstanding limited liability company interests of Summit LLC are held by Summit Materials Intermediate Holdings, LLC, an indirect subsidiary of Summit Inc. There is no established public trading market for limited liability company interests of Summit LLC.
Dividends
On December 29, 2022, Summit Inc. paid a stock dividend of 0.017 shares of its Class A common stock for each then outstanding share of Class A common stock as of the record date of December 15, 2022. Summit Holdings makes cash distributions to Summit Holdings’ LP Unit holders to cover tax obligations arising from allocated taxable income. As an LP Unit holder, Summit Inc. received cash distributions from Summit Holdings in excess of the amount required to satisfy Summit Inc.’s tax obligations. In fiscal 2022, Summit Inc. primarily used the excess cash of approximately $59.3 million to acquire newly-issued LP Units from Summit Holdings. The LP Units were purchased at a per unit price of $29.94, which is the volume weighted average price per share of the Class A common stock for the five trading days ended December 2, 2022. Immaterial cash payments were made in lieu of fractional shares.
If Summit Inc. uses future excess tax distributions to purchase additional LP Units, we anticipate that in order to maintain the relationship between the shares of Class A common stock and the LP Units, our board of directors may continue to declare stock dividends on the Class A common stock.
Summit Inc. has no current plans to pay cash dividends on its Class A common stock. The declaration, amount and payment of any future dividends on shares of Class A common stock is at the sole discretion of our board of directors and we may reduce or discontinue entirely the payment of any such dividends at any time. Our board of directors may take into account general and economic conditions, our financial condition and operating results, our available cash and current and anticipated cash needs, capital requirements, contractual, legal, tax and regulatory restrictions and implications on the payment of dividends by us to our stockholders or by our subsidiaries to us, and such other factors as our board of directors may deem relevant.
Summit Inc. is a holding company and has no material assets other than its ownership of LP Units. Should we decide to pay a cash dividend on our Class A common stock in the future, we anticipate funding this cash dividend by causing Summit Holdings to make distributions to Summit Inc. in an amount sufficient to cover such dividend, whereupon the other holders of LP Units will also be entitled to receive distributions pro rata in accordance with the percentages of their respective limited partnership interests. Because Summit Inc. must pay taxes and make payments under the TRA, any amounts ultimately distributed as dividends to holders of our Class A common stock are expected to be less on a per share basis than the amounts distributed by Summit Holdings to its partners on a per LP Unit basis.
The agreements governing our senior secured credit facilities and the Senior Notes contain a number of covenants that restrict, subject to certain exceptions, Summit LLC’s ability to pay distributions to its parent company and ultimately to Summit Inc. See Note 8, Debt, to our consolidated financial statements.
Any financing arrangements that we enter into in the future may include restrictive covenants that limit our ability to pay dividends. In addition, Summit Holdings is generally prohibited under Delaware law from making a distribution to a limited partner to the extent that, at the time of the distribution, after giving effect to the distribution, liabilities of Summit Holdings (with certain exceptions) exceed the fair value of its assets.
39
Subsidiaries of Summit Holdings are generally subject to similar legal limitations on their ability to make distributions to Summit Holdings.
Issuer Purchases of Equity Securities
In March 2022, our Board of Directors authorized a share repurchase program, whereby we can repurchase up to $250.0 million of our Class A common stock. As of December 31, 2022, approximately $149.0 million remained available for share repurchases under the share repurchase program. Under the repurchase program, we are authorized to repurchase shares from time to time in open market transactions, in privately negotiated transactions or otherwise. The repurchase program does not obligate the Company to acquire any specific dollar amount of Class A common stock and may be suspended or discontinued at any time.
During the quarter ended December 31, 2022, we did not purchase any of our equity securities that are registered under Section 12(b) of the Securities Exchange Act of 1934, as amended (the “Exchange Act”).
Unregistered Sales of Equity Securities
There were no unregistered sales of equity securities which have not been previously disclosed in a quarterly report on Form 10-Q or a current report on Form 8-K during the year ended December 31, 2022.
ITEM 6. [RESERVED]
ITEM 7. MANAGEMENT’S DISCUSSION AND ANALYSIS OF FINANCIAL CONDITION AND RESULTS OF OPERATIONS
This Management’s Discussion and Analysis of Financial Condition and Results of Operations is intended to assist in understanding and assessing the trends and significant changes in our results of operations and financial condition. Historical results may not be indicative of future performance. Forward-looking statements reflect our current views about future events, are based on assumptions and are subject to known and unknown risks and uncertainties that could cause actual results to differ materially from those contemplated by these statements. Factors that may cause differences between actual results and those contemplated by forward-looking statements include, but are not limited to, those discussed in the section entitled “Risk Factors” and any factors discussed in the sections entitled “Disclosure Regarding Forward-Looking Statements” and “Risk Factors” of this report. This Management’s Discussion and Analysis of Financial Condition and Results of Operations should be read in conjunction with the “Selected Historical Consolidated Financial Data,” our audited consolidated annual financial statements and the related notes thereto and other information included in this report. A discussion and analysis of our results of operations and changes in financial condition for fiscal 2021 compared to 2020 may be found in Item 7. Management's Discussion and Analysis of Financial Condition and Results of Operation of our Annual Report on Form 10-K for the fiscal year ended January 1, 2022, filed with the SEC on February 24, 2022, which discussion is incorporated herein by reference.
Overview
Summit’s vision is to be the most socially responsible, integrated construction materials solution provider, collaborating with stakeholders to deliver differentiated innovations and solve our customers’ challenges. Within our markets, we strive to be a market leader by offering customers a single-source provider for construction materials and related vertically integrated downstream products. Our materials include aggregates, which we supply across the United States, and in British Columbia, Canada, and cement, which we supply to surrounding states along the Mississippi River from Minnesota to Louisiana. In addition to supplying aggregates to customers, we use a portion of our materials internally to produce ready-mix concrete and asphalt paving mix, which may be sold externally or used in our paving and related services businesses. Our vertically integrated business model creates opportunities to increase aggregates volumes, optimize margin at each stage of production and provide customers with efficiency gains, convenience and reliability, which we believe gives us a competitive advantage.
We are organized into 10 operating companies that make up our three distinct operating segments—West, East and Cement. We operate in 22 U.S. states and in British Columbia, Canada and currently have assets in 21 U.S. states and British Columbia, Canada. The map below illustrates our geographic footprint:
40
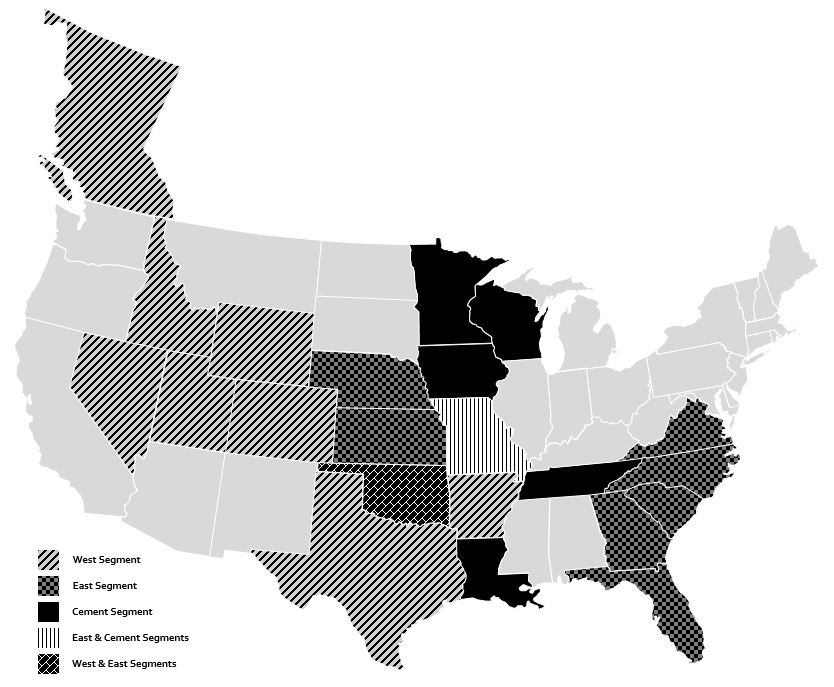
Business Trends and Conditions
The U.S. construction materials industry is composed of four primary sectors: aggregates; cement; ready-mix concrete; and asphalt paving mix. Each of these materials is widely used in most forms of construction activity. Participants in these sectors typically range from small, privately-held companies focused on a single material, product or market to publicly traded multinational corporations that offer a wide array of construction materials and services. Competition is constrained in part by the distance materials can be transported efficiently, resulting in predominantly local or regional operations. Due to the lack of product differentiation, competition for all of our products is predominantly based on price and, to a lesser extent, quality of products and service. Accordingly, our profitability is generally dependent on the level of demand for our materials and products and our ability to control operating costs.
Our revenue is derived from multiple end-use markets including public infrastructure construction and private residential and nonresidential construction. Public infrastructure includes spending by federal, state, provincial and local governments for roads, highways, bridges, airports and other infrastructure projects. Public infrastructure projects have
historically been a relatively stable portion of state and federal budgets. Residential and nonresidential construction consists of new construction and repair and remodel markets. Any economic stagnation or decline, which could vary by local region and market, could affect our results of operations. Our sales and earnings are sensitive to national, regional and local economic conditions and particularly to cyclical changes in construction spending, especially in the private sector. From a macroeconomic view, we see a positive trend in highway obligations, but headwinds in housing starts.
41
Transportation infrastructure projects, driven by both federal and state funding programs, represent a significant share of the U.S. construction materials market. Federal funds are allocated to the states, which are required to match a portion of the federal funds they receive. Federal highway spending uses funds predominantly from the Federal Highway Trust Fund, which derives its revenue from taxes on diesel fuel, gasoline and other user fees. The dependability of federal funding allows the state departments of transportation to plan for their long term highway construction and maintenance needs. The Infrastructure Investment and Jobs Act (IIJA) was signed into law on November 15, 2021. The IIJA provides $1.2 trillion in funding over five years from 2022 through 2026, which includes $347.8 billion for highways, and $91.0 billion for transit.
In addition to federal funding, state, county and local agencies provide highway construction and maintenance funding. Our four largest states by revenue, Texas, Utah, Kansas and Missouri, represented approximately 24%, 17%, 10% and 10%, respectively, of our total revenue in 2022. The following is a summary of key funding initiatives in those states:
•The Texas Department of Transportation (“TXDOT”) Unified Transportation Program is a long-term planning document, released annually, that guides the development of transportation work over ten years. The total ten-year work program for fiscal years 2023-2032 totals $85.1 billion, a 14.3% increase over fiscal years 2022-2031. The first year of the updated plan (fiscal year 2023) calls for $13.6 billion in total spending, a 58% increase over the first year (fiscal year 2022) of the previous plan.
•Total Utah transportation appropriations in fiscal year 2023 is $2.7 billion. Given that the fiscal year 2023 appropriations bill for transportation was passed in February 2022, prior to resolution of the federal appropriations process, the current budget may not fully incorporate increased federal funding under the IIJA.
•For fiscal year 2023, total projected expenditures for Kansas Department of Transportation are $2.2 billion, a 25.4% increase over fiscal 2022. Projected construction expenditures total $1.3 billion, a 29.2% annual increase.
•The state budget for the Missouri Department of Transportation budget grew 11% between fiscal year 2022 and fiscal year 2023, from $3.1 billion to $3.5 billion.
Use and consumption of our products fluctuate due to seasonality. Nearly all of the products used by us, and by our customers, in the private construction or public infrastructure industries are used outdoors. Our highway operations and production and distribution facilities are also located outdoors. Therefore, seasonal changes and other weather-related conditions, in particular extended rainy and cold weather in the spring and fall and major weather events, such as hurricanes, tornadoes, tropical storms, heavy snows and flooding, can adversely affect our business and operations through a decline in both the use of our products and demand for our services. In addition, construction materials production and shipment levels follow activity in the construction industry, which typically occurs in the spring, summer and fall. Warmer and drier weather during the second and third quarters of our fiscal year typically result in higher activity and revenue levels during those quarters. The first quarter of our fiscal year typically has lower levels of activity due to weather conditions.
We are subject to commodity price risk with respect to price changes in liquid asphalt and energy, including fossil fuels and electricity for aggregates, cement, ready-mix concrete and asphalt paving mix production, natural gas for hot mix asphalt production and diesel fuel for distribution vehicles and production related mobile equipment. Liquid asphalt escalator provisions in most of our private and commercial contracts limit our exposure to price fluctuations in this commodity. We often obtain similar escalators on public infrastructure contracts. In addition, as we seek to manage our risk to increasing energy prices, we enter into various firm purchase commitments, with terms generally less than one year, for certain raw materials.
Financial Highlights— Year ended December 31, 2022
The principal factors in evaluating our financial condition and operating results for the year ended December 31, 2022 are:
•Net revenue decreased (0.5)% or $10.6 million in 2022 as compared to 2021, primarily resulting from decreases due to divestitures completed in 2022 and 2021 and decreases in organic volumes, mostly offset by increases in average sales prices.
•Our operating income increased 6.3% or $16.0 million in 2022 as compared to 2021, as our increases in revenue slightly trailed inflationary impacts on our cost of revenue, mitigated by $28.9 million decrease in depreciation, depletion, amortization and accretion expenses primarily resulting from our divestitures.
•The Company sold three businesses in the East segment, resulting in cash proceeds of $373.1 million and a total gain on disposition of $172.4 million. We used $95.6 million of proceeds to prepay our term loan related to divestitures of businesses in 2022.
42
•Average sales price increased 8.2%, 12.0%, 13.3% and 19.0% in aggregates, cement, ready-mix concrete and asphalt, respectively.
•Sales volume decreased 7.3%, 13.5% and 26.4% in aggregates, ready-mix concrete and asphalt, respectively, and increased 4.2% in cement.
•The Company repurchased $101.0 million of our Class A common stock.
•In December 2022, the Company amended and extended our term loan, which resulted in a loss on debt financings of $1.7 million.
Components of Operating Results
Total Revenue
We derive our revenue predominantly by selling construction materials and products and providing paving and related services. Construction materials consist of aggregates and cement. Products consist of related downstream products, including ready-mix concrete, asphalt paving mix and concrete products. Paving and related services that we provide are primarily asphalt paving services.
Revenue derived from the sale of construction materials is recognized when risks associated with ownership have passed to unaffiliated customers. Typically this occurs when products are shipped. Product revenue generally includes sales of aggregates, cement and related downstream products and other materials to customers, net of discounts or allowances and taxes, if any.
Revenue derived from paving and related services is recognized using a method similar to the percentage-of-completion method, measured by the cost incurred to date compared to estimated total cost of each project. This method is used because management considers cost incurred to be the best available measure of progress on these contracts. Due to the inherent uncertainties in estimating costs, it is at least reasonably possible that the estimates used will change over the life of the contract.
Operating Costs and Expenses
The key components of our operating costs and expenses consist of the following:
Cost of Revenue (excluding items shown separately)
Cost of revenue consists of all direct production and delivery costs and primarily includes labor, repair and maintenance, utilities, raw materials, fuel, transportation, subcontractor costs, and royalties. Our cost of revenue is directly affected by fluctuations in commodity energy prices, primarily diesel fuel, liquid asphalt and other petroleum-based resources. As a result, our adjusted cash gross profit margins can be significantly affected by changes in the underlying cost of certain raw materials if they are not recovered through corresponding changes in revenue. We attempt to limit our exposure to changes in commodity energy prices by entering into forward purchase commitments when appropriate. In addition, we have sales price adjustment provisions that provide for adjustments based on fluctuations outside a limited range in certain energy-related production costs. These provisions are in place for most of our public infrastructure contracts, and we seek to include similar price adjustment provisions in our private contracts.
General and Administrative Expenses
General and administrative expenses consist primarily of salaries and personnel costs, including stock-based compensation charges, for our sales and marketing, administration, finance and accounting, legal, information systems, human resources and certain managerial employees. Additional expenses include audit, consulting and professional fees, travel, insurance, rental costs, property taxes and other corporate and overhead expenses.
Depreciation, Depletion, Amortization and Accretion
Our business is capital intensive. We carry property, plant and equipment on our balance sheet at cost, net of applicable depreciation, depletion and amortization. Depreciation on property, plant and equipment is computed on a straight-line basis or based on the economic usage over the estimated useful life of the asset. The general range of depreciable lives by category, excluding mineral reserves, which are depleted based on the units of production method on a site-by-site basis, is as follows:
43
| Buildings and improvements | 10 - 30 | years | |||||||||
| Plant, machinery and equipment | 7 - 20 | years | |||||||||
| Office equipment | 3 - 7 | years | |||||||||
| Truck and auto fleet | 5 - 8 | years | |||||||||
| Mobile equipment and barges | 6 - 8 | years | |||||||||
| Landfill airspace and improvements | 10 - 30 | years | |||||||||
| Other | 4 - 20 | years | |||||||||
Amortization expense is the periodic expense related to leasehold improvements and intangible assets. The intangible assets were recognized with certain acquisitions and are generally amortized on a straight-line basis over the estimated useful lives of the assets. Leasehold improvements are amortized over the lesser of the life of the underlying asset or the remaining lease term.
Accretion expense is the periodic expense recorded for the accrued mining reclamation liabilities and landfill closure and post-closure liabilities using the effective interest method.
Results of Operations
The following discussion of our results of operations is focused on the key financial measures we use to evaluate the performance of our business from both a consolidated and operating segment perspective. Operating income and margins are discussed in terms of changes in volume, pricing and mix of revenue source (i.e., type of product sales or service revenue). We focus on operating margin, which we define as operating income as a percentage of net revenue, as a key metric when assessing the performance of the business, as we believe that analyzing changes in costs in relation to changes in revenue provides more meaningful insight into the results of operations than examining costs in isolation.
Operating income (loss) reflects our profit after taking into consideration cost of revenue, general and administrative expenses, depreciation, depletion, amortization and accretion and gain on sale of property, plant and equipment. Cost of revenue generally increases ratably with revenue, as labor, transportation costs and subcontractor costs are recorded in cost of revenue. General and administrative expenses as a percentage of revenue vary throughout the year due to the seasonality of our business, and may also be impacted by acquisition and divestiture activities, depending on the size of the business acquired or divested. During 2022, our general and administrative expenses were not materially impacted by our acquisition or divestiture activity.
The table below includes revenue and operating income by segment for the periods indicated. Operating income (loss) by segment is computed as earnings before interest, loss on debt financings, tax receivable agreement expense, gain on sale of business, other income / expense and taxes.
| Year ended | ||||||||||||||||||||||||||||||||||||||
| December 31, 2022 | January 1, 2022 | January 2, 2021 | ||||||||||||||||||||||||||||||||||||
| Operating | Operating | Operating | ||||||||||||||||||||||||||||||||||||
| (in thousands) | Revenue | income (loss) | Revenue | income (loss) | Revenue | income (loss) | ||||||||||||||||||||||||||||||||
| West | $ | 1,390,307 | $ | 181,837 | $ | 1,262,061 | $ | 171,164 | $ | 1,262,196 | $ | 176,528 | ||||||||||||||||||||||||||
| East | 664,479 | 64,567 | 849,374 | 90,403 | 799,633 | 69,796 | ||||||||||||||||||||||||||||||||
| Cement | 357,736 | 89,155 | 298,234 | 66,131 | 270,622 | 55,335 | ||||||||||||||||||||||||||||||||
| Corporate (1) | — | (66,512) | — | (74,633) | — | (76,486) | ||||||||||||||||||||||||||||||||
| Total | $ | 2,412,522 | $ | 269,047 | $ | 2,409,669 | $ | 253,065 | $ | 2,332,451 | $ | 225,173 | ||||||||||||||||||||||||||
______________________
(1) Corporate results primarily consist of compensation and office expenses for employees included in the Company's headquarters.
Consolidated Results of Operations
The table below sets forth our consolidated results of operations for the periods indicated:
44
| 2022 | 2021 | 2020 | ||||||||||||||||||
| ($ in thousands) | ||||||||||||||||||||
| Net revenue | $ | 2,222,084 | $ | 2,232,696 | $ | 2,134,754 | ||||||||||||||
| Delivery and subcontract revenue | 190,438 | 176,973 | 197,697 | |||||||||||||||||
| Total revenue | 2,412,522 | 2,409,669 | 2,332,451 | |||||||||||||||||
| Cost of revenue (excluding items shown separately below) | 1,763,177 | 1,736,410 | 1,710,654 | |||||||||||||||||
| General and administrative expenses | 190,218 | 196,728 | 182,873 | |||||||||||||||||
| Depreciation, depletion, amortization and accretion | 200,450 | 229,366 | 221,320 | |||||||||||||||||
| Gain on sale of property, plant and equipment | (10,370) | (5,900) | (7,569) | |||||||||||||||||
| Operating income | 269,047 | 253,065 | 225,173 | |||||||||||||||||
| Interest expense | 86,969 | 92,240 | 103,595 | |||||||||||||||||
| Loss on debt financings | 1,737 | 6,016 | 4,064 | |||||||||||||||||
| Tax receivable agreement expense (benefit) | 1,566 | (6,779) | (7,559) | |||||||||||||||||
| Loss (gain) on sale of businesses | (172,389) | (20,011) | — | |||||||||||||||||
| Other income, net | (10,324) | (17,038) | (3,982) | |||||||||||||||||
| Income from operations before taxes | 361,488 | 198,637 | 129,055 | |||||||||||||||||
| Income tax expense | 85,545 | 44,356 | (12,185) | |||||||||||||||||
| Net income | $ | 275,943 | $ | 154,281 | $ | 141,240 | ||||||||||||||
45
Fiscal Year 2022 Compared to 2021
| ($ in thousands) | 2022 | 2021 | Variance | |||||||||||||||||||||||
| Net revenue | $ | 2,222,084 | $ | 2,232,696 | $ | (10,612) | (0.5) | % | ||||||||||||||||||
| Operating income | 269,047 | 253,065 | 15,982 | 6.3 | % | |||||||||||||||||||||
| Operating margin percentage | 12.1 | % | 11.3 | % | ||||||||||||||||||||||
| Adjusted EBITDA (1) | $ | 491,476 | $ | 520,082 | $ | (28,606) | (5.5) | % | ||||||||||||||||||
______________________
(1)Adjusted EBITDA is a non-GAAP measure that we find helpful in monitoring the performance of our business. See the definition of and the reconciliation below of Adjusted EBITDA to net income, which is the most directly comparable GAAP measure.
Net revenue decreased $10.6 million in the year ended December 31, 2022, primarily resulting from increases in our average sales prices which were more than offset by a $193.0 million decrease in East net revenues due to divestitures. Of the decrease in net revenue, $61.3 million was from increased sales of materials, offset by $51.0 million from decreased sales of products and $20.9 million from decreased service revenue. We generated organic volume growth of 4.2% in cement, offset by a decrease of 3.6%, 5.2% and 3.3% in aggregates, ready-mix concrete and asphalt, respectively, during 2022 over the prior year period. We had organic price growth in our aggregates, cement, ready-mix and asphalt lines of business of 8.9%, 12.0%, 14.6% and 16.9%, respectively, during 2022.
Operating income increased by $16.0 million in 2022 as compared to 2021, as inflationary increases in cost of revenue, increased repair and maintenance costs from sourcing constraints and higher subcontracting costs were more than offset by revenue growth, lower general and administrative expenses resulting from adjustments to estimates of health care and short term incentive amounts, and a decrease of $28.9 million in depletion, amortization and accretion expenses as a result of our divestitures.
For the year ended December 31, 2022, our operating margin percentage increased from 11.3% to 12.1% compared to the year ended January 1, 2022, due to the items noted above. Adjusted EBITDA, as defined below, decreased by $28.6 million in the year ended December 31, 2022 as compared to the year ended January 1, 2022.
As a vertically-integrated company, we include intercompany sales from materials to products and from products to services when assessing the operating results of our business. We refer to revenue inclusive of intercompany sales as gross revenue. These intercompany transactions are eliminated in the consolidated financial statements. Gross revenue by line of business was as follows:
| ($ in thousands) | 2022 | 2021 | Variance | |||||||||||||||||||||||
| Revenue by product*: | ||||||||||||||||||||||||||
| Aggregates | $ | 718,492 | $ | 716,021 | $ | 2,471 | 0.3 | % | ||||||||||||||||||
| Cement | 341,082 | 292,295 | 48,787 | 16.7 | % | |||||||||||||||||||||
| Ready-mix concrete | 688,185 | 702,402 | (14,217) | (2.0) | % | |||||||||||||||||||||
| Asphalt | 274,805 | 333,983 | (59,178) | (17.7) | % | |||||||||||||||||||||
| Paving and related services | 500,032 | 562,905 | (62,873) | (11.2) | % | |||||||||||||||||||||
| Other | (110,074) | (197,937) | 87,863 | 44.4 | % | |||||||||||||||||||||
| Total revenue | $ | 2,412,522 | $ | 2,409,669 | $ | 2,853 | 0.1 | % | ||||||||||||||||||
______________________
* Revenue by product includes intercompany and intracompany sales transferred at market value. The elimination of intracompany transactions is included in Other. Revenue from the liquid asphalt terminals is included in asphalt revenue.
Detail of our volumes and average selling prices by product for the years ended December 31, 2022 and January 1, 2022 were as follows:
46
| 2022 | 2021 | |||||||||||||||||||||||||||||||||||||
| Volume(1) | Volume(1) | Percentage Change in | ||||||||||||||||||||||||||||||||||||
| (in thousands) | Pricing(2) | (in thousands) | Pricing(2) | Volume | Pricing | |||||||||||||||||||||||||||||||||
| Aggregates | 59,525 | $ | 12.07 | 64,185 | $ | 11.16 | (7.3) | % | 8.2 | % | ||||||||||||||||||||||||||||
| Cement | 2,533 | 134.66 | 2,431 | 120.24 | 4.2 | % | 12.0 | % | ||||||||||||||||||||||||||||||
| Ready-mix concrete | 5,043 | 136.47 | 5,831 | 120.47 | (13.5) | % | 13.3 | % | ||||||||||||||||||||||||||||||
| Asphalt | 3,724 | 72.65 | 5,062 | 61.05 | (26.4) | % | 19.0 | % | ||||||||||||||||||||||||||||||
______________________
(1)Volumes are shown in tons for aggregates, cement and asphalt and in cubic yards for ready-mix concrete.
(2)Pricing is shown on a per ton basis for aggregates, cement and asphalt and on a per cubic yard basis for ready-mix concrete.
Revenue from aggregates increased $2.5 million in the year ended December 31, 2022. We had strong price increases which were mostly offset by decreased aggregate volumes. Aggregate average sales prices of $12.07 per ton increased 8.2% in 2022 as compared to 2021, primarily due to a combination of inflation-justified price increases and an ongoing focus to improve customer mix. Organic aggregate volumes decreased 3.6% in 2022 as compared to 2021, primarily due to moderating demand, as well as unfavorable weather conditions in certain geographies, partially offset by increases in our Virginia and Georgia markets.
Revenue from cement increased $48.8 million in the year ended December 31, 2022. In 2022, organic cement volumes increased 4.2%, reflecting a healthy demand environment, and organic cement average sales prices increased 12.0%, as compared to 2021.
Revenue from ready-mix concrete decreased $14.2 million in the year ended December 31, 2022. In 2022, our organic ready-mix volumes decreased (5.2)% and our organic average sales prices increased 14.6%. The volume decrease in 2022 occurred primarily in our Intermountain West and Kansas markets while our price increase was primarily in the Intermountain West and South Texas markets.
Revenue from asphalt decreased $59.2 million in the year ended December 31, 2022, primarily due to the divestitures in our East segment. Despite the overall decrease in revenue from asphalt, in 2022 organic pricing increased 16.9%, with strong pricing gains in the Virginia, North Texas and Intermountain West geographies. In 2022, organic volumes decreased by 3.3% due to decreases in our North Texas and Virginia markets.
Other Financial Information
Interest expense
In September 2021, we redeemed all $300.0 million 5.125% Senior Notes due 2025 using existing cash on hand. As a result, interest expense in 2022 decreased, partially offset by increased interest expense due to the variable rate of our term loan.
Loss on Debt Financings
In December 2022, we amended and extended our $509.6 million term loan. In connection with this transaction, charges of $1.7 million were recognized for the quarter ended December 31, 2022. The fees included $0.8 million of arrangement and third party fees, $0.4 million for the write-off of unamortized original issue discount and $0.5 million for the write-off of unamortized deferred financing fees.
In September 2021, we redeemed all $300.0 million 5.125% Senior Notes due 2025 using existing cash on hand. In connection with this transaction, charges of $6.0 million were recognized in the quarter ended October 2, 2021. The fees included $3.9 million for the applicable prepayment premium and $2.1 million for the write-off of unamortized deferred financing fees.
In August 2020, we issued $700 million of 5.25% Senior Notes due 2029 (the "2029 Notes"), resulting in net proceeds of $690.4 million, after related fees and expenses. The proceeds from the 2029 Notes were used to redeem the $650 million of 6.125% Senior Notes due 2023 (the "2023 Notes") at par. In connection with that transaction, charges of $4.1 million were recognized in the quarter ended September 26, 2020. The fees included $0.8 million for the write-off of unamortized original issue discount and $3.3 million for the write-off of unamortized deferred financing fees.
47
Gain on Sale of Businesses
We continue to make progress on our strategy to divest certain businesses through portfolio optimization. In 2022, we sold three businesses in the East segment, resulting in cash proceeds of $373.1 million and a net gain on disposition of businesses of $172.4 million. In 2021, we sold seven businesses in the East segment and one business in the West segment, resulting in total cash proceeds of $128.3 million and a net gain on disposition of businesses of $20.0 million.
Tax Receivable Agreement Expense (Benefit)
Our TRA expense (benefit) for the years ended December 31, 2022 and January 1, 2022 was $1.6 million and $(6.8) million, respectively. Each year, we update our estimate as to when TRA payments will be made. When payments are made under the TRA, a portion of the payment made will be characterized as imputed interest under Internal Revenue Service ("IRS") regulations. We also updated our estimate of the state income tax rate that will be in effect at the date the TRA payments are made. As a result of updated state income tax rate, and the timing of expected utilization of attributes noted above, we adjusted our TRA liability by the amounts noted above.
Income Tax Expense (Benefit)
Our income tax expense was $85.5 million for the year ended December 31, 2022 as compared to income tax expense of $44.4 million for the year ended January 1, 2022. The effective tax rate for Summit Inc. differs from the federal statutory tax rate primarily due to (1) state taxes, (2) tax depletion expense in excess of the expense recorded under U.S. GAAP, (3) differences between book and tax basis for divested businesses and (4) various other items such as limitations on meals and entertainment, certain stock compensation and other costs.
As of December 31, 2022 and January 1, 2022, Summit Inc. had a valuation allowance of $1.1 million and $1.7 million against our deferred tax assets, respectively.
Segment Results of Operations
West Segment
| ($ in thousands) | 2022 | 2021 | Variance | |||||||||||||||||||||||
| Net revenue | $ | 1,272,041 | $ | 1,169,466 | $ | 102,575 | 8.8 | % | ||||||||||||||||||
| Operating income | 181,837 | 171,164 | 10,673 | 6.2 | % | |||||||||||||||||||||
| Operating margin percentage | 14.3 | % | 14.6 | % | ||||||||||||||||||||||
| Adjusted EBITDA (1) | $ | 280,557 | $ | 271,560 | $ | 8,997 | 3.3 | % | ||||||||||||||||||
______________________
(1)Adjusted EBITDA is a non-GAAP measure that we find helpful in monitoring the performance of our business. See the reconciliation of Adjusted EBITDA to net income, the most directly comparable GAAP measure below.
Net revenue in the West segment increased $102.6 million in the year ended December 31, 2022, due to net revenue increases across all lines of business. Organic aggregate volumes decreased 1.3% in 2022 as compared to 2021, while organic aggregates average sales prices increased 10.4%, as price increases were implemented across all geographies to help offset inflationary factors. Organic ready-mix concrete volumes decreased 4.2% and our organic ready-mix concrete average sales prices increased 14.3%. Construction activity appears to be slowing, to varying degrees, across residential markets, including in our two largest, Houston and Salt Lake City, as home builders anticipate lower demand due to higher interest rates and inflationary pressures. We continue to monitor that activity given increases in mortgage rates and other inflationary concerns that impact residential markets.
The West segment’s operating income increased $10.7 million and Adjusted EBITDA increased $9.0 million in the year ended December 31, 2022. The increases in operating income and Adjusted EBITDA in 2022 occurred primarily due to increases in average sales prices for aggregates and ready-mix concrete. The operating margin percentage in the West segment decreased slightly in 2022 as compared to 2021, due to the aggregate product mix in Texas as well as ongoing input cost inflation.
Gross revenue by product/service was as follows:
48
| ($ in thousands) | 2022 | 2021 | Variance | |||||||||||||||||||||||
| Revenue by product*: | ||||||||||||||||||||||||||
| Aggregates | $ | 360,531 | $ | 330,678 | $ | 29,853 | 9.0 | % | ||||||||||||||||||
| Ready-mix concrete | 592,306 | 541,003 | 51,303 | 9.5 | % | |||||||||||||||||||||
| Asphalt | 213,617 | 205,971 | 7,646 | 3.7 | % | |||||||||||||||||||||
| Paving and related services | 388,280 | 347,053 | 41,227 | 11.9 | % | |||||||||||||||||||||
| Other | (164,427) | (162,644) | (1,783) | (1.1) | % | |||||||||||||||||||||
| Total revenue | $ | 1,390,307 | $ | 1,262,061 | $ | 128,246 | 10.2 | % | ||||||||||||||||||
______________________
* Revenue by product includes intercompany and intracompany sales transferred at market value. The elimination of intracompany transactions is included in Other. Revenue from the liquid asphalt terminals is included in asphalt revenue.
The West segment’s percent changes in sales volumes and pricing comparing 2022 to 2021 were as follows:
| Percentage Change in | ||||||||||||||
| Volume | Pricing | |||||||||||||
| Aggregates | (1.3) | % | 10.4 | % | ||||||||||
| Ready-mix concrete | (4.2) | % | 14.3 | % | ||||||||||
| Asphalt | (10.2) | % | 17.7 | % | ||||||||||
Revenue from aggregates in the West segment increased $29.9 million in 2022 over 2021, due to an increase in aggregates sales pricing. Aggregates pricing in 2022 increased 10.4% when compared to 2021, as we implemented price increases in all our markets. Aggregates volumes decreased slightly in 2022.
Revenue from ready-mix concrete in the West segment increased $51.3 million in 2022 over 2021. For the year ended December 31, 2022, organic ready-mix concrete prices increased 14.3%, as price increases were implemented to mitigate higher costs of labor, materials and transportation. For the year ended December 31, 2022, our ready-mix concrete organic volumes decreased 4.2% as residential volumes began to slow in our Houston and Salt Lake City markets.
In May 2021, we divested our paving business in Texas, which reduced our volumes subsequent to the closing date. As a result, asphalt volumes decreased 10.2% in 2022. However, revenue from asphalt in the West segment increased $7.6 million in 2022, as increases in average sales prices for asphalt of 17.7% more than offset the volume decline. Gross revenue for paving and related services in the West segment increased by $41.2 million in 2022, primarily due to increased demand.
Prior to eliminations of intercompany transactions, the net effect of volume and pricing changes on gross revenue for the year ended December 31, 2022 was approximately $(42.3) million and $131.1 million, respectively.
East Segment
| ($ in thousands) | 2022 | 2021 | Variance | |||||||||||||||||||||||
| Net revenue | $ | 592,307 | $ | 764,996 | $ | (172,689) | (22.6) | % | ||||||||||||||||||
| Operating income | 64,567 | 90,403 | (25,836) | (28.6) | % | |||||||||||||||||||||
| Operating margin percentage | 10.9 | % | 11.8 | % | ||||||||||||||||||||||
| Adjusted EBITDA (1) | $ | 129,203 | $ | 181,483 | $ | (52,280) | (28.8) | % | ||||||||||||||||||
______________________
(1)Adjusted EBITDA is a non-GAAP measure that we find helpful in monitoring the performance of our business. See the reconciliation of Adjusted EBITDA to the most directly comparable GAAP measure, net income, below.
Net revenue in the East segment decreased $172.7 million in 2022 over 2021, primarily due to a $193.0 million decrease from divestitures. Increases in average selling prices in all of our markets was more than offset by the volume declines from our divestiture program.
Operating income in the East segment decreased $25.8 million, due to the divestitures noted above, and incrementally, supply chain disruptions and inflationary increases beyond our increases in average sales prices. Adjusted EBITDA decreased $52.3 million in 2022 over 2021, primarily due to a decrease of $41.2 million from divestitures. Operating margin percentage in 2022 decreased to 10.9% from 11.8% in 2021, due to the items noted above.
49
Gross revenue by product/service was as follows:
| ($ in thousands) | 2022 | 2021 | Variance | |||||||||||||||||||||||
| Revenue by product*: | ||||||||||||||||||||||||||
| Aggregates | $ | 357,961 | $ | 385,343 | $ | (27,382) | (7.1) | % | ||||||||||||||||||
| Ready-mix concrete | 95,879 | 161,399 | (65,520) | (40.6) | % | |||||||||||||||||||||
| Asphalt | 61,188 | 128,012 | (66,824) | (52.2) | % | |||||||||||||||||||||
| Paving and related services | 111,752 | 215,852 | (104,100) | (48.2) | % | |||||||||||||||||||||
| Other | 37,699 | (41,232) | 78,931 | 191.4 | % | |||||||||||||||||||||
| Total revenue | $ | 664,479 | $ | 849,374 | $ | (184,895) | (21.8) | % | ||||||||||||||||||
______________________
* Revenue by product includes intercompany and intracompany sales transferred at market value. The elimination of intracompany transactions is included in Other. Revenue from the liquid asphalt terminals is included in asphalt revenue.
The East segment’s percent changes in sales volumes and pricing in 2022 as compared to 2021 were as follows:
| Percentage Change in | ||||||||||||||
| Volume | Pricing | |||||||||||||
| Aggregates | (13.4) | % | 7.3 | % | ||||||||||
| Ready-mix concrete | (44.1) | % | 6.4 | % | ||||||||||
| Asphalt | (54.7) | % | 17.3 | % | ||||||||||
Revenue from aggregates in the East segment decreased $27.4 million in the year ended December 31, 2022. Aggregate volumes in 2022 decreased 13.4%, primarily due to our divestiture program. Excluding the impact of the divestitures, we had further declines due to softness in our residential markets and unfavorable weather conditions. Aggregates pricing increased 7.3% in 2022 due to increases in all of our markets.
Revenue from ready-mix concrete in the East segment decreased $65.5 million in 2022, primarily due to our divestiture program. In 2022, organic ready-mix concrete volumes decreased 11.0% due to softness in our residential markets and unfavorable weather conditions. Organic ready-mix average sales prices increased 15.7% due to pricing gains in almost all of our markets.
Revenue from asphalt decreased $66.8 million in 2022, primarily due to divestitures. Asphalt pricing increased 17.3% in 2022, due to increases in liquid asphalt. Paving and related service revenue decreased $104.1 million in 2022, primarily due to our divestitures noted above.
Prior to eliminations of intercompany transactions, the net effect of volume and pricing changes on gross revenue for the year ended December 31, 2022 was approximately $(232.3) million and $72.6 million, respectively.
Cement Segment
| ($ in thousands) | 2022 | 2021 | Variance | |||||||||||||||||||||||
| Net revenue | $ | 357,736 | $ | 298,234 | $ | 59,502 | 20.0 | % | ||||||||||||||||||
| Operating income | 89,155 | 66,131 | 23,024 | 34.8 | % | |||||||||||||||||||||
| Operating margin percentage | 24.9 | % | 22.2 | % | ||||||||||||||||||||||
| Adjusted EBITDA (1) | $ | 125,582 | $ | 117,159 | $ | 8,423 | 7.2 | % | ||||||||||||||||||
______________________
(1)Adjusted EBITDA is a non-GAAP measure that we find helpful in monitoring the performance of our business. See the reconciliation of Adjusted EBITDA to the most directly comparable GAAP measure, net income, below.
Net revenue in the Cement segment increased $59.5 million in 2022 over 2021, primarily due to increased organic cement volumes of 4.2% and increased organic average selling prices of 12.0%. Our Green America Recycling facility, which provides alternative fuel for one of our plants, was fully operational in 2022; however, the facility was only fully operational for the last half of 2021, after its prolonged shutdown due to an explosion in April 2020.
The Cement segment’s operating income increased $23.0 million in 2022 and Adjusted EBITDA increased $8.4 million in 2022. In 2022, we received $1.7 million in insurance proceeds related to property, plant and equipment that was destroyed in the recycling plant explosion that occurred in April 2020. In 2021, we received insurance proceeds of $1.2 million
50
related to property, plant and equipment, and $9.8 million related to business interruption. In all periods, insurance proceeds relative to property, plant and equipment were recorded as gain on sale of assets and business interruption insurance proceeds were recorded as other income.
Operating margin percentage for the year ended December 31, 2022 increased to 24.9% from 22.2% in the prior year, due to the same factors noted above, as well as more depreciation, depletion, amortization and accretion expense was capitalized into inventory in 2022 than in 2021. Lastly, during 2022, 15% of our sales volumes were of imported cement, as compared to 6% in 2021. Sales of imported cement generates Adjusted EBITDA at lower margins than manufactured cement. Production of cement in 2022 was 3.6% higher than it was in 2021.
Gross revenue by product was as follows:
| ($ in thousands) | 2022 | 2021 | Variance | |||||||||||||||||||||||
| Revenue by product*: | ||||||||||||||||||||||||||
| Cement | $ | 341,082 | $ | 292,295 | $ | 48,787 | 16.7 | % | ||||||||||||||||||
| Other | 16,654 | 5,939 | 10,715 | 180.4 | % | |||||||||||||||||||||
| Total revenue | $ | 357,736 | $ | 298,234 | $ | 59,502 | 20.0 | % | ||||||||||||||||||
______________________
* Revenue from waste processing and the elimination of intracompany transactions are included in Other.
The Cement segment’s percent changes in sales volumes and pricing in 2022 from 2021 were as follows:
| Percentage Change in | ||||||||||||||
| Volume | Pricing | |||||||||||||
| Cement | 4.2 | % | 12.0 | % | ||||||||||
Revenue from cement increased $48.8 million in 2022, due to increased volumes of 4.2% and increased pricing of 12.0%.
Liquidity and Capital Resources
Our primary sources of liquidity include cash on-hand, cash provided by operations, amounts available for borrowing under our senior secured credit facilities and capital-raising activities in the debt and capital markets. In addition to our current sources of liquidity, we have access to liquidity through public offerings of shares of our Class A common stock. To facilitate such offerings, in January 2023, we filed a shelf registration statement with the SEC that will expire in January 2026. The amount of Class A common stock to be issued pursuant to this shelf registration statement was not specified when it was filed and there is no specific limit on the amount we may issue. The specifics of any future offerings, along with the use of the proceeds thereof, will be described in detail in a prospectus supplement, or other offering materials, at the time of any offering.
As of December 31, 2022, we had $520.5 million in cash and cash equivalents and $762.5 million of working capital as compared to $381.0 million and $560.5 million, respectively, at January 1, 2022. Working capital is calculated as current assets less current liabilities. There were no restricted cash balances as of December 31, 2022 or January 1, 2022.
Our remaining borrowing capacity on our $345.0 million senior secured revolving credit facility as of December 31, 2022 was $325.2 million, which is net of $19.8 million of outstanding letters of credit, and is fully available to us within the terms and covenant requirements of our credit agreement. In January 2023, we amended our senior secured revolving credit facility, increasing the total availability to $395.0 million and extending the maturity date to January 2028.
In March 2022, our Board of Directors authorized a share repurchase program, whereby we can repurchase up to $250.0 million of our Class A common stock. During the first nine months of 2022, we repurchased 3.4 million shares of Class A common stock for $101.0 million. As of December 31, 2022, approximately $149.0 million remained available for share repurchases under the share repurchase program.
Given the seasonality of our business, we typically experience significant fluctuations in working capital needs and balances throughout the year. Our working capital requirements generally increase during the first half of the year as we build up inventory and focus on repair and maintenance and other set-up costs for the upcoming season. Working capital levels then decrease as the construction season winds down and we enter the winter months, which is when we see significant inflows of cash from the collection of receivables.
51
Our acquisition strategy has historically required us to raise capital through equity issuances or debt financings. As of December 31, 2022 and January 1, 2022, our long-term borrowings totaled $1.5 billion and $1.6 billion, for which we incurred $77.0 million and $80.3 million of interest expense, respectively. Our senior secured revolving facility has been adequate to fund our seasonal working capital needs and certain acquisitions. We had no outstanding borrowings on the revolving credit facility as of December 31, 2022.
For details regarding certain other material cash requirements from known contractual and other obligations see “—Contractual Obligations” below.
During 2022, we also received $373.1 million in proceeds from divestitures as part of our Elevate Summit strategy. Management will continue to optimize the portfolio, which could include future divestitures.
We believe we have access to sufficient financial resources from our liquidity sources to fund our business and operations, including contractual obligations, capital expenditures and debt service obligations, for at least the next twelve months. Our growth strategy contemplates future acquisitions for which we believe we have sufficient access to capital. We also plan to divest of certain dilutive businesses as we rationalize our portfolio, which will also generate additional capital.
As market conditions warrant we may, from time to time, seek to purchase our outstanding debt securities or loans, including Senior Notes and borrowings under our senior secured credit facilities. Such transactions could be privately negotiated, open market transactions, tender offers or otherwise. Subject to any applicable limitations contained in the agreements governing our indebtedness, any purchases made by us may be funded by the use of cash on our balance sheet or the incurrence of new secured or unsecured debt. The amounts involved in any such purchase transactions, individually or in the aggregate, may be material. Any such purchases may equate to a substantial amount of a particular class or series of debt, which may reduce the trading liquidity of such class or series.
Our Long-Term Debt
Please refer to the notes to the consolidated financial statements found elsewhere in this report for detailed information regarding our long-term debt and senior secured revolving credit facility, scheduled maturities of long-term debt and affirmative and negative covenants. Among other things, we are required to maintain a Consolidated First Lien Net Leverage Ratio that is no greater than 4.75 to 1.00. Our first lien net leverage ratio, for purposes of this maintenance requirement, is calculated following each quarter based on information for the most recently ended four fiscal quarters for which internal financial information is available by dividing our Consolidated First Lien Net Debt as of the end of such period by our Consolidated EBITDA for such period. Consolidated EBITDA for purposes of our senior secured credit facility is calculated in accordance with our presentation of Further Adjusted EBITDA below. We define Further Adjusted EBITDA as Adjusted EBITDA plus transaction costs and the EBITDA contribution of certain recent acquisitions.
For the years ended December 31, 2022 and January 1, 2022, our Consolidated First Lien Net Leverage Ratio was 0.01 to 1.00 and 0.50 to 1.00, respectively, based on consolidated first lien net debt of $3.2 million and $261.6 million as of December 31, 2022 and January 1, 2022, respectively, divided by Further Adjusted EBITDA of $493.0 million and $520.3 million for the years ended December 31, 2022 and January 1, 2022, respectively. As of December 31, 2022 and January 1, 2022, we were in compliance with all debt covenants.
The following table sets forth a reconciliation of net income to Adjusted EBITDA and Further Adjusted EBITDA for the periods indicated. Adjusted EBITDA and Further Adjusted EBITDA are not U.S. GAAP measures and should not be considered in isolation, or as a substitute for our results as reported under U.S. GAAP.
52
| ($ in thousands) | 2022 | 2021 | 2020 | |||||||||||||||||
| Net income | $ | 275,943 | $ | 154,281 | $ | 141,240 | ||||||||||||||
| Interest expense | 86,969 | 92,240 | 103,595 | |||||||||||||||||
| Income tax expense (benefit) | 85,545 | 44,356 | (12,185) | |||||||||||||||||
| Depreciation, depletion, and amortization | 197,837 | 226,442 | 218,682 | |||||||||||||||||
| EBITDA | $ | 646,294 | $ | 517,319 | $ | 451,332 | ||||||||||||||
| Accretion | 2,613 | 2,924 | 2,638 | |||||||||||||||||
| Loss on debt financings | 1,737 | 6,016 | 4,064 | |||||||||||||||||
| Tax receivable agreement expense (benefit) | 1,566 | (6,779) | (7,559) | |||||||||||||||||
| Gain on sale of business | (172,389) | (20,011) | — | |||||||||||||||||
| Non-cash compensation(a) | 18,347 | 19,705 | 28,857 | |||||||||||||||||
| Other(b) | (6,692) | 908 | 2,957 | |||||||||||||||||
| Adjusted EBITDA | $ | 491,476 | $ | 520,082 | $ | 482,289 | ||||||||||||||
| Transaction costs(c) | 3,358 | 3,252 | 2,747 | |||||||||||||||||
| EBITDA for certain acquisitions, net of divestitures(d) | (1,827) | (2,992) | 11,448 | |||||||||||||||||
| Further Adjusted EBITDA | $ | 493,007 | $ | 520,342 | $ | 496,484 | ||||||||||||||
______________________
(a)Represents non-cash equity-based compensation granted to employees.
(b)Represents the net (gain) loss recognized on assets identified for disposal. Includes non-recurring or one time income and expense items that were incurred outside normal operating activities such as integration costs, unrealized currency gains and losses and interest, tax, depreciation on unconsolidated joint ventures and fair value adjustments to contingent consideration obligations that originated with various acquisitions.
(c)Represents the transaction expenses associated with acquisitions and divestitures, consisting primarily of accounting, legal, valuation and financial advisory fees.
(d)Under the terms of our credit facilities, we include EBITDA from our acquisitions, net of dispositions, in each fiscal year for periods prior to acquisition. We believe this provides our lenders with a more meaningful view of our EBITDA across all periods by making the information more comparable.
At December 31, 2022 and January 1, 2022, $1.5 billion and $1.6 billion of total debt was outstanding under our respective debt agreements, respectively. During 2022, we repaid $95.6 million of our term loan under provisions related to the divestitures of businesses. Summit LLC’s senior secured credit facilities provide for term loans in an aggregate amount of $509.6 million and revolving credit commitments in an aggregate amount of $395.0 million (the “Senior Secured Credit Facilities”). Summit LLC’s domestic wholly-owned subsidiary companies are named as guarantors of the Senior Notes and the Senior Secured Credit Facilities. Certain other partially-owned subsidiaries, and the wholly-owned Canadian subsidiary, Mainland, do not guarantee the Senior Notes or Senior Secured Credit Facilities. Summit LLC has pledged substantially all of its assets as collateral for the Senior Secured Credit Facilities.
Senior Notes
On September 27, 2021, Summit LLC and Summit Finance (together, the “Issuers”) redeemed all $300.0 million in aggregate principal amount of their 5.125% senior notes due June 1, 2025 (“2025 Notes”) using existing cash on hand at a price equal to par plus an applicable premium and the indenture under which the 2025 Notes were issued was satisfied and discharged. As a result of the redemption, charges of $6.0 million were recognized in the quarter ended October 2, 2021, which included charges of $3.9 million for the applicable redemption premium and $2.1 million for the write-off of the deferred financing fees.
On August 11, 2020, the Issuers issued $700.0 million in aggregate principal amount of 5.250% senior notes due January 15, 2029. The 2029 Notes were issued at 100.0% of their par value with proceeds of $690.4 million, net of related fees and expenses. Interest on the 2029 Notes is payable semi-annually on January 15 and July 15 of each year commencing on January 15, 2021.
In August 2020, using the proceeds from the 2029 Notes, all of the outstanding $650.0 million 6.125% senior notes due 2023 were redeemed at a price equal to par and the indenture under which the 2023 Notes were issued was satisfied and discharged. As a result of the extinguishment, charges of $4.1 million were recognized in the quarter ended September 26, 2020, which included charges of $0.8 million for the write-off of original issue discount and $3.3 million for the write-off of deferred financing fees.
53
Senior Secured Credit Facilities
On December 14, 2022, Summit Materials, LLC entered into Amendment No. 5 to the credit agreement governing the Senior Secured Credit Facilities (the “Credit Agreement”), which among other things, (a) refinanced the existing $509.6 million of existing term loans with new term loans under the Term Loan Facility bearing interest, at Summit LLC’s option, based on either the base rate or Term SOFR rate and an applicable margin of (i) 2.00% per annum with respect to base rate borrowings and a floor of 1.00% per annum or (ii) 3.00% per annum with respect to Term SOFR borrowings, with a SOFR adjustment of 0.10% per annum and a floor of zero, and (b) extended the maturity date to December 14, 2027.
On January 10, 2023, Summit Materials, LLC entered into Amendment No. 6 to the Credit Agreement, which among other things, increased the maximum amount available to $395.0 million and extended the maturity date to January 10, 2028. The revolving credit agreement bears interest per annum equal to a Term SOFR Rate with a SOFR adjustment of 0.10% per annum and a floor of zero.
There were no outstanding borrowings under the revolving credit facility as of December 31, 2022 or January 1, 2022. As of December 31, 2022, we had remaining borrowing capacity of $325.2 million under the revolving credit facility, which is net of $19.8 million of outstanding letters of credit. The outstanding letters of credit are renewed annually and support required bonding on construction projects and the Company’s insurance liabilities.
Summit LLC’s Consolidated First Lien Net Leverage Ratio, as such term is defined in the Credit Agreement, should be no greater than 4.75:1.0 as of each quarter-end. As of December 31, 2022 and January 1, 2022, Summit LLC was in compliance with all financial covenants under the Credit Agreement.
Summit LLC’s wholly-owned domestic subsidiary companies, subject to certain exclusions and exceptions, are named as subsidiary guarantors of the Senior Notes and the Senior Secured Credit Facilities. In addition, Summit LLC has pledged substantially all of its assets as collateral, subject to certain exclusions and exceptions, for the Senior Secured Credit Facilities.
Cash Flows
The following table summarizes our net cash provided by and used for operating, investing and financing activities and our capital expenditures for the periods indicated:
| Summit Inc. | Summit LLC | |||||||||||||||||||||||||
| ($ in thousands) | 2022 | 2021 | 2022 | 2021 | ||||||||||||||||||||||
| Net cash provided by (used in): | ||||||||||||||||||||||||||
| Operating activities | $ | 284,098 | $ | 361,929 | $ | 283,553 | $ | 361,929 | ||||||||||||||||||
| Investing activities | 95,822 | (91,248) | 95,822 | (91,248) | ||||||||||||||||||||||
| Financing activities | (238,993) | (307,927) | (238,448) | (307,927) | ||||||||||||||||||||||
Operating Activities
During the year ended December 31, 2022, cash provided by operating activities was $284.1 million primarily as a result of:
•Net income of $275.9 million, adjusted for $117.6 million of non-cash expenses, including $212.5 million of depreciation, depletion, amortization and accretion, $18.3 million of share-based compensation and $69.6 million of change in deferred tax asset, net, offset by the net gain on asset and business divestitures of $182.3 million.
•Billed and unbilled accounts receivable decreased by $5.8 million in fiscal 2022 as a result of our sales in the latter part of 2022 exceeding those levels of 2021.
•The timing of payments associated with accounts payable and accrued expenses of cash, which is consistent with the seasonality of our business whereby we build-up inventory levels and incur repairs and maintenance costs to ready the business for increased sales volumes in the summer and fall. These costs are typically incurred in the first half of the year and paid by year-end. In addition, we made $76.3 million of interest payments in 2022.
During the year ended January 1, 2022, cash provided by operating activities was $361.9 million primarily as a result of:
54
•Net income of $154.3 million, adjusted for $254.0 million of non-cash expenses, including $235.3 million of depreciation, depletion, amortization and accretion, $19.7 million of share-based compensation and $24.7 million of change in deferred tax asset, net.
•Billed and unbilled accounts receivable increased by $31.7 million in fiscal 2021 as a result of our sales in the latter part of 2021 exceeding those levels of 2020.
•The timing of payments associated with accounts payable and accrued expenses of cash, which is consistent with the seasonality of our business whereby we build-up inventory levels and incur repairs and maintenance costs to ready the business for increased sales volumes in the summer and fall. These costs are typically incurred in the first half of the year and paid by year-end. In addition, we made $81.6 million of interest payments in 2021. Our cash interest payments are expected to decrease slightly from this amount in 2021 and beyond.
Investing Activities
During the year ended December 31, 2022, cash provided by investing activities was $95.8 million, resulting from $373.1 million of proceeds from the sale of businesses, which more than offset $22.7 million related to acquisitions completed in the period and $266.7 million was invested in capital expenditures. In addition, during 2022, we received $15.4 million of proceeds from asset sales.
During the year ended January 1, 2022, cash used for investing activities was $91.2 million, of which $19.5 million related to acquisitions completed in the period and $212.0 million was invested in capital expenditures, which was offset by $128.3 million of proceeds from the sale of businesses, as well as $11.7 million of proceeds from asset sales.
Financing Activities
During the year ended December 31, 2022, cash used in financing activities was $239.0 million. We made $122.5 million of payments on debt, including the $95.6 million prepayment of the term loan due to our divestiture program, $13.4 million of payments on acquisition related liabilities and used $101.0 million to repurchase shares of Class A common stock.
During the year ended January 1, 2022, cash provided by financing activities was $307.9 million. We made $329.0 million of payments on debt, including the redemption of $300.0 million of the 2025 Senior Notes in September 2021, received $32.5 million of proceeds from stock option exercises, which was offset by $10.4 million of payments on acquisition related liabilities.
Cash Paid for Capital Expenditures
We expended approximately $266.7 million in capital expenditures for the year ended December 31, 2022 compared to $212.0 million in the year ended January 1, 2022.
We estimate that we will invest between $220 million and $240 million in capital expenditures in 2023, which includes greenfield development projects. The timing of our greenfield expenditures is dependent upon the timing of when permits may be issued. We expect to fund our capital expenditure program through cash on hand, cash from operations, outside financing arrangements and available borrowings under our revolving credit facility.
Tax Receivable Agreement
Exchanges of LP Units for shares of Class A common stock are expected to result in increases in the tax basis of the tangible and intangible assets of Summit Holdings. These increases in tax basis may increase (for tax purposes) depreciation and amortization deductions and therefore reduce the amount of tax that Summit Inc. would otherwise be required to pay in the future. In connection with the IPO, we entered into a TRA with the holders of LP Units that provides for the payment by Summit Inc. to exchanging holders of LP Units of 85% of the benefits, if any, that Summit Inc. is deemed to realize as a result of these increases in tax basis and certain other tax benefits related to entering into the TRA, including tax benefits attributable to payments under the TRA. The increases in tax basis as a result of an exchange of LP Units for shares of Class A common stock, as well as the amount and timing of any payments under the TRA, are difficult to accurately estimate as they will vary depending upon a number of factors, including:
55
•the timing of exchanges—for instance, the increase in any tax deductions will vary depending on the fair market value, which may fluctuate over time, of the depreciable or amortizable assets of Summit Holdings at the time of each exchange;
•the price of shares of our Class A common stock at the time of the exchange—the increase in any tax deductions, as well as the tax basis increase in other assets, of Summit Holdings, is directly proportional to the price of shares of our Class A common stock at the time of the exchange;
•the extent to which such exchanges are taxable—if an exchange is not taxable for any reason, increased deductions will not be available;
•the amount and timing of our income—Summit Inc. is required to pay 85% of the cash tax savings, if any, as and when realized. If Summit Inc. does not have taxable income, Summit Inc. is not required (absent a change of control or circumstances requiring an early termination payment) to make payments under the TRA for that taxable year because no cash tax savings will have been realized. However, any tax attributes that do not result in realized benefits in a given tax year will likely generate tax attributes that may be utilized to generate benefits in previous or future tax years. The utilization of such tax attributes will result in cash tax savings that will result in payments under the tax receivable agreement; and
•the effective tax rate – The benefit that Summit Inc. realizes is dependent on the tax rate in effect at the time taxable income is generated.
We anticipate funding payments under the TRA from cash flows from operations, available cash and available borrowings under our Senior Secured Revolving Credit Facilities. As of December 31, 2022, we had accrued $328.4 million as TRA liability. Of the total TRA liability, $0.5 million is expected to be paid in the next twelve months.
In addition, the TRA provides that upon certain changes of control, Summit Inc.’s (or its successor’s) obligations would be based on certain assumptions, including that Summit Inc. would have sufficient taxable income to fully utilize the deductions arising from tax basis and other tax attributes subject to the TRA. With respect to our obligations under the TRA relating to previously exchanged or acquired LP Units and certain net operating losses, we would be required to make a payment equal to the present value (at a discount rate equal to one year LIBOR plus 100 basis points) of the anticipated future tax benefits determined using assumptions (ii) through (v) of the following paragraph.
Furthermore, Summit Inc. may elect to terminate the TRA early by making an immediate payment equal to the present value of the anticipated future cash tax savings. In determining such anticipated future cash tax savings, the TRA includes several assumptions, including that (i) any LP Units that have not been exchanged are deemed exchanged for the market value of the shares of Class A common stock at the time of termination, (ii) Summit Inc. will have sufficient taxable income in each future taxable year to fully realize all potential tax savings, (iii) Summit Inc. will have sufficient taxable income to fully utilize any remaining net operating losses subject to the TRA on a straight line basis over the shorter of the statutory expiration period for such net operating losses or the five-year period after the early termination or change of control, (iv) the tax rates for future years will be those specified in the law as in effect at the time of termination and (v) certain non-amortizable assets are deemed disposed of within specified time periods. In addition, the present value of such anticipated future cash tax savings are discounted at a rate equal to LIBOR plus 100 basis points.
As a result of the change in control provisions and the early termination right, Summit Inc. could be required to make payments under the TRA that are greater than or less than the specified percentage of the actual cash tax savings that Summit Inc. realizes in respect of the tax attributes subject to the TRA (although any such overpayment would be taken into account in calculating future payments, if any, under the TRA) or that are prior to the actual realization, if any, of such future tax benefits. Also, the obligations of Summit Inc. would be automatically accelerated and be immediately due and payable in the event that Summit Inc. breaches any of its material obligations under the agreement and in certain events of bankruptcy or liquidation. In these situations, our obligations under the TRA could have a substantial negative impact on our liquidity.
Under the terms of the TRA, we can terminate the TRA at any time, which would trigger a cash payment to the pre-IPO owners. Based upon a $28.39 per share price of our Class A common stock, the closing price of our stock on December 31, 2022 and a contractually defined discount rate of 6.48%, we estimate that if we were to exercise our right to terminate the TRA, the aggregate amount required to settle the TRA would be approximately $249 million.
Contractual Obligations
56
The following table presents, as of December 31, 2022, our obligations and commitments to make future payments under contracts and contingent commitments (in thousands).
| Payments Due by Period | ||||||||||||||||||||||||||||||||||||||||||||
| Total | 2023 | 2024 | 2025 | 2026 | 2027 | Thereafter | ||||||||||||||||||||||||||||||||||||||
| (in thousands) | ||||||||||||||||||||||||||||||||||||||||||||
| Short term borrowings and long-term debt, including current portion | $ | 1,509,560 | $ | 5,096 | $ | 3,822 | $ | 6,369 | $ | 5,096 | $ | 789,177 | $ | 700,000 | ||||||||||||||||||||||||||||||
| Finance lease obligations | 15,520 | 7,443 | 2,829 | 2,415 | 990 | 760 | 1,083 | |||||||||||||||||||||||||||||||||||||
| Operating lease obligations | 53,375 | 9,061 | 7,996 | 6,199 | 4,959 | 4,154 | 21,006 | |||||||||||||||||||||||||||||||||||||
| Interest payments (1) | 518,674 | 97,024 | 91,947 | 98,007 | 94,229 | 82,342 | 55,125 | |||||||||||||||||||||||||||||||||||||
| Acquisition-related liabilities | 60,429 | 13,887 | 7,725 | 7,901 | 7,040 | 5,984 | 17,892 | |||||||||||||||||||||||||||||||||||||
| Royalty payments | 191,872 | 10,794 | 10,431 | 10,202 | 9,060 | 8,468 | 142,917 | |||||||||||||||||||||||||||||||||||||
| Asset retirement obligation payments | 124,882 | 4,405 | 5,920 | 3,868 | 3,680 | 1,367 | 105,642 | |||||||||||||||||||||||||||||||||||||
| Purchase commitments (2) | 62,237 | 51,072 | 11,165 | — | — | — | — | |||||||||||||||||||||||||||||||||||||
| Payments pursuant to tax receivable agreement (3) | 328,356 | 543 | 6,431 | 6,710 | 36,368 | 57,527 | 220,777 | |||||||||||||||||||||||||||||||||||||
| Other | 5,686 | 4,896 | 753 | 37 | — | — | — | |||||||||||||||||||||||||||||||||||||
| Total contractual obligations | $ | 2,870,591 | $ | 204,221 | $ | 149,019 | $ | 141,708 | $ | 161,422 | $ | 949,779 | $ | 1,264,442 | ||||||||||||||||||||||||||||||
______________________
(1)Future interest payments were calculated using the applicable fixed and floating rates charged by our lenders in effect as of December 31, 2022 and may differ from actual results.
(2)Amounts represent purchase commitments entered into in the normal course of business, primarily for fuel purchases, the terms of which are generally one year.
(3)The total amount payable under our TRA is estimated at $328.4 million as of December 31, 2022. Under the terms of the TRA, payment of amounts benefiting us is due to the pre-IPO owners within four months of the tax returns being submitted to the respective regulatory agencies when the benefits are realized. The estimated timing of TRA payments is subject to a number of factors, primarily around the timing of the generation of future taxable income in future years, which will be impacted by business activity in those periods.
Commitments and Contingencies
We are party to certain legal actions arising from the ordinary course of business activities. Accruals are recorded when the outcome is probable and can be reasonably estimated. While the ultimate results of claims and litigation cannot be predicted with certainty, management expects that the ultimate resolution of all pending or threatened claims and litigation will not have a material effect on our consolidated financial position, results of operations or liquidity. We record legal fees as incurred.
In March 2018, we were notified of an investigation by the CCB into pricing practices by certain asphalt paving contractors in British Columbia, including Winvan. We believe the investigation is focused on time periods prior to our April 2017 acquisition of Winvan and we are cooperating with the CCB. Although we currently do not believe this matter will have a material adverse effect on our business, financial condition or results of operations, we are not able to predict the ultimate outcome or cost of the investigation at this time.
Environmental Remediation and Site Restoration—Our operations are subject to and affected by federal, state, provincial and local laws and regulations relating to the environment, health and safety and other regulatory matters. These operations require environmental operating permits, which are subject to modification, renewal and revocation. We regularly monitor and review its operations, procedures and policies for compliance with these laws and regulations. Despite these compliance efforts, risk of environmental liability is inherent in the operation of our business, as it is with other companies engaged in similar businesses and there can be no assurance that environmental liabilities and noncompliance will not have a material adverse effect on our consolidated financial condition, results of operations or liquidity.
Other—We are obligated under various firm purchase commitments for certain raw materials and services that are in the ordinary course of business. Management does not expect any significant changes in the market value of these goods and services during the commitment period that would have a material adverse effect on the financial condition, results of operations, and cash flows of the Company. The terms of the purchase commitments generally approximate one year.
Off-Balance Sheet Arrangements
As of December 31, 2022, we had no material off-balance sheet arrangements.
57
Non-GAAP Performance Measures
We evaluate our operating performance using metrics that we refer to as “Adjusted EBITDA,” “Adjusted EBITDA Margin,” “Adjusted Cash Gross Profit” and “Adjusted Cash Gross Profit Margin” which are not defined by U.S. GAAP and should not be considered as an alternative to earnings measures defined by U.S. GAAP. We define Adjusted EBITDA as EBITDA, adjusted to exclude accretion, loss on debt financings, gain on sale of business, non-cash compensation and certain other non-cash and non-operating items. We define Adjusted EBITDA Margin as Adjusted EBITDA divided by net revenue. We define Adjusted Cash Gross Profit as operating income before general and administrative expenses, depreciation, depletion, amortization and accretion and Adjusted Cash Gross Profit Margin as Adjusted Cash Gross Profit as a percentage of net revenue.
We present Adjusted EBITDA, Adjusted EBITDA Margin, Adjusted Cash Gross Profit and Adjusted Cash Gross Profit Margin for the convenience of investment professionals who use such metrics in their analyses. The investment community often uses these metrics to assess the operating performance of a company’s business and to provide a consistent comparison of performance from period to period. We use these metrics, among others, to assess the operating performance of our individual segments and the consolidated company.
Non-GAAP financial measures are not standardized; therefore, it may not be possible to compare such financial measures with other companies’ non-GAAP financial measures having the same or similar names. We strongly encourage investors to review our consolidated financial statements in their entirety and not rely on any single financial measure.
The tables below reconcile our net income (loss) to EBITDA and Adjusted EBITDA, present Adjusted EBITDA by segment and reconcile operating income to Adjusted Cash Gross Profit for the periods indicated:
| Reconciliation of Net Income (Loss) to Adjusted EBITDA | Year ended December 31, 2022 | |||||||||||||||||||||||||||||||
| by Segment | West | East | Cement | Corporate | Consolidated | |||||||||||||||||||||||||||
| ($ in thousands) | ||||||||||||||||||||||||||||||||
| Net income (loss) | $ | 196,586 | $ | 118,635 | $ | 110,017 | $ | (149,295) | $ | 275,943 | ||||||||||||||||||||||
| Interest (income) expense | (17,123) | (11,857) | (20,463) | 136,412 | 86,969 | |||||||||||||||||||||||||||
| Income tax expense (benefit) (1) | 3,025 | (106) | — | 82,626 | 85,545 | |||||||||||||||||||||||||||
| Depreciation, depletion and amortization | 96,939 | 61,697 | 35,968 | 3,233 | 197,837 | |||||||||||||||||||||||||||
| EBITDA | $ | 279,427 | $ | 168,369 | $ | 125,522 | $ | 72,976 | $ | 646,294 | ||||||||||||||||||||||
| Accretion | 953 | 1,600 | 60 | — | 2,613 | |||||||||||||||||||||||||||
| Loss on debt financings | — | — | — | 1,737 | 1,737 | |||||||||||||||||||||||||||
| Tax receivable agreement expense (1) | — | — | — | 1,566 | 1,566 | |||||||||||||||||||||||||||
| Gain on sale of businesses (2) | — | (40,952) | — | (131,437) | (172,389) | |||||||||||||||||||||||||||
| Non-cash compensation | — | — | — | 18,347 | 18,347 | |||||||||||||||||||||||||||
| Other | 177 | 186 | — | (7,055) | (6,692) | |||||||||||||||||||||||||||
| Adjusted EBITDA | $ | 280,557 | $ | 129,203 | $ | 125,582 | $ | (43,866) | $ | 491,476 | ||||||||||||||||||||||
58
| Reconciliation of Net Income (Loss) to Adjusted EBITDA | Year ended January 1, 2022 | |||||||||||||||||||||||||||||||
| by Segment | West | East | Cement | Corporate | Consolidated | |||||||||||||||||||||||||||
| ($ in thousands) | ||||||||||||||||||||||||||||||||
| Net income (loss) | $ | 181,253 | $ | 122,321 | $ | 95,352 | $ | (244,645) | $ | 154,281 | ||||||||||||||||||||||
| Interest (income) expense | (11,460) | (8,872) | (17,217) | 129,789 | 92,240 | |||||||||||||||||||||||||||
| Income tax expense (1) | 2,697 | 114 | — | 41,545 | 44,356 | |||||||||||||||||||||||||||
| Depreciation, depletion and amortization | 98,596 | 84,912 | 38,685 | 4,249 | 226,442 | |||||||||||||||||||||||||||
| EBITDA | $ | 271,086 | $ | 198,475 | $ | 116,820 | $ | (69,062) | $ | 517,319 | ||||||||||||||||||||||
| Accretion | 874 | 1,711 | 339 | — | 2,924 | |||||||||||||||||||||||||||
| Loss on debt financings | — | — | — | 6,016 | 6,016 | |||||||||||||||||||||||||||
| Tax receivable agreement benefit (1) | — | — | — | (6,779) | (6,779) | |||||||||||||||||||||||||||
| Gain on sale of businesses | (355) | (19,656) | — | — | (20,011) | |||||||||||||||||||||||||||
| Non-cash compensation | — | — | — | 19,705 | 19,705 | |||||||||||||||||||||||||||
| Other | (45) | 953 | — | — | 908 | |||||||||||||||||||||||||||
| Adjusted EBITDA | $ | 271,560 | $ | 181,483 | $ | 117,159 | $ | (50,120) | $ | 520,082 | ||||||||||||||||||||||
| Reconciliation of Net Income (Loss) to Adjusted EBITDA | Year ended January 2, 2021 | |||||||||||||||||||||||||||||||
| by Segment | West | East | Cement | Corporate | Consolidated | |||||||||||||||||||||||||||
| ($ in thousands) | ||||||||||||||||||||||||||||||||
| Net income (loss) | $ | 178,460 | $ | 74,781 | $ | 69,484 | $ | (181,485) | $ | 141,240 | ||||||||||||||||||||||
| Interest (income) expense (1) | (5,447) | (3,156) | (13,795) | 125,993 | 103,595 | |||||||||||||||||||||||||||
| Income tax expense (benefit) | 4,287 | (283) | — | (16,189) | (12,185) | |||||||||||||||||||||||||||
| Depreciation, depletion and amortization | 93,279 | 84,504 | 36,917 | 3,982 | 218,682 | |||||||||||||||||||||||||||
| EBITDA | $ | 270,579 | $ | 155,846 | $ | 92,606 | $ | (67,699) | $ | 451,332 | ||||||||||||||||||||||
| Accretion | 587 | 1,701 | 350 | — | 2,638 | |||||||||||||||||||||||||||
| Loss on debt financings | — | — | — | 4,064 | 4,064 | |||||||||||||||||||||||||||
| Tax receivable agreement expense (1) | — | — | — | (7,559) | (7,559) | |||||||||||||||||||||||||||
| Non-cash compensation | — | — | — | 28,857 | 28,857 | |||||||||||||||||||||||||||
| Other (2) | (114) | 4,728 | — | (1,657) | 2,957 | |||||||||||||||||||||||||||
| Adjusted EBITDA | $ | 271,052 | $ | 162,275 | $ | 92,956 | $ | (43,994) | $ | 482,289 | ||||||||||||||||||||||
______________________
(1)The reconciliation of net income (loss) to Adjusted EBITDA is based on the financial results of Summit Inc. and its subsidiaries, which was $70.2 million and $16.7 million less and 20.5 million more than Summit LLC and its subsidiaries in the years ended December 31, 2022, January 1, 2022 and January 2, 2021, respectively, due to interest expense associated with a deferred consideration obligation, TRA expense and income tax benefit are obligations of Summit Holdings and Summit Inc., respectively, and are thus excluded from Summit LLC’s consolidated net income.
(2)The Corporate gain is related to the sale of businesses in the East Segment in 2022.
| Reconciliation of Working Capital | 2022 | 2021 | ||||||||||||
| ($ in thousands) | ||||||||||||||
| Total current assets | $ | 1,018,376 | $ | 869,610 | ||||||||||
| Less total current liabilities | (255,847) | (309,070) | ||||||||||||
| Working capital | $ | 762,529 | $ | 560,540 | ||||||||||
59
| Reconciliation of Operating Income to Adjusted Cash Gross Profit | 2022 | 2021 | 2020 | |||||||||||||||||
| ($ in thousands) | ||||||||||||||||||||
| Operating income | $ | 269,047 | $ | 253,065 | $ | 225,173 | ||||||||||||||
| General and administrative expenses | 190,218 | 196,728 | 182,873 | |||||||||||||||||
| Depreciation, depletion, amortization and accretion | 200,450 | 229,366 | 221,320 | |||||||||||||||||
| Gain on sale of property, plant and equipment | (10,370) | (5,900) | (7,569) | |||||||||||||||||
| Adjusted Cash Gross Profit (exclusive of items shown separately) | $ | 649,345 | $ | 673,259 | $ | 621,797 | ||||||||||||||
| Adjusted Cash Gross Profit Margin (exclusive of items shown separately) (1) | 29.2 | % | 30.2 | % | 29.1 | % | ||||||||||||||
_____________________
(1)Adjusted Cash Gross Margin is defined as Adjusted Cash Gross Profit as a percentage of net revenue.
Critical Accounting Policies and Estimates
Our management’s discussion and analysis of our financial condition and results of operations is based on our consolidated financial statements, which have been prepared in accordance with U.S. GAAP. The preparation of these consolidated financial statements requires management to make estimates and assumptions that affect the reported amounts of assets and liabilities, disclosure of contingent assets and liabilities at the date of the consolidated financial statements and the reported amounts of revenue and expenses during the reported period.
On an ongoing basis, management evaluates its estimates, including those related to the valuation of accounts receivable, inventories, goodwill, intangibles and other long-lived assets, pension and other postretirement obligations and asset retirement obligations. We base our estimates and judgments on historical experience and on various other factors that we believe to be reasonable under the circumstances, the results of which form the basis for making judgments about the carrying values of assets and liabilities that are not readily apparent from other sources. Actual results may differ from these estimates under different assumptions or conditions.
Acquisitions—Purchase Price Allocation
We regularly review strategic long-term plans, including potential investments in value-added acquisitions of related or similar businesses, which would increase our market share and/or are related to our existing markets. When an acquisition is completed, our consolidated statement of operations includes the operating results of the acquired business starting from the date of acquisition, which is the date that control is obtained. The purchase price is determined based on the estimated fair value of assets given to and liabilities assumed from the seller as of the date of acquisition. We allocate the purchase price to the estimated fair values of the tangible and intangible assets acquired and liabilities assumed as valued at the date of acquisition. Goodwill is recorded for the excess of the purchase price over the net of the fair value of the identifiable assets acquired and liabilities assumed as of the acquisition date. The estimation of fair values of acquired assets and assumed liabilities is judgmental and requires various assumptions and the amounts and useful lives assigned to depreciable and amortizable assets compared to amounts assigned to goodwill, which is not amortized, can significantly affect the results of operations in the period of and periods subsequent to a business combination.
Fair value is the price that would be received to sell an asset or paid to transfer a liability in an orderly transaction, and therefore represents an exit price. A fair value measurement assumes the highest and best use of the asset by market participants, considering the use of the asset that is physically possible, legally permissible, and financially feasible at the measurement date. We assign the highest level of fair value available to assets acquired and liabilities assumed based on the following options:
•Level 1—Quoted prices in active markets for identical assets and liabilities.
•Level 2—Observable inputs, other than quoted prices, for similar assets or liabilities in active markets.
•Level 3—Unobservable inputs, which includes the use of valuation models.
Level 1 fair values are used to value investments in publicly-traded entities and assumed obligations for publicly-traded long-term debt.
60
Level 2 fair values are typically used to value acquired receivables, inventories, machinery and equipment,, land, buildings, deferred income tax assets and liabilities, liabilities for asset retirement obligations, environmental remediation and compliance obligations. Additionally, Level 2 fair values are typically used to value assumed contracts at other-than-market rates.
Level 3 fair values are used to value acquired mineral reserves and leased mineral interests and other identifiable intangible assets. The fair values of mineral reserves and leased mineral interests are determined using an excess earnings approach, which requires management to estimate future cash flows. The estimate of future cash flows is based on available historical information and forecasts determined by management, but is inherently uncertain. Key assumptions in estimating future cash flows include sales price, volumes and expected profit margins, net of capital requirements. The present value of the projected net cash flows represents the fair value assigned to mineral reserves and mineral interests. The discount rate is a significant assumption used in the valuation model and is based on the required rate of return that a hypothetical market participant would assume if purchasing the acquired business.
There is a measurement period after the acquisition date during which we may adjust the amounts recognized for a business combination. Any such adjustments are based on us obtaining additional information that existed at the acquisition date regarding the assets acquired or the liabilities assumed. Measurement period adjustments are generally recorded as increases or decreases to the goodwill recognized in the transaction. The measurement period ends once we have obtained all necessary information that existed as of the acquisition date, but does not extend beyond one year from the date of acquisition. Any adjustments to assets acquired or liabilities assumed beyond the measurement period are recorded in earnings.
We paid cash of $22.7 million and $19.5 million, net of cash acquired, in business combinations and allocated this amount to assets acquired and liabilities assumed during the years ended December 31, 2022 and January 1, 2022, respectively.
Goodwill
Goodwill is tested annually for impairment and in interim periods if events occur indicating that the carrying amounts may be impaired. The evaluation involves the use of significant estimates and assumptions and considerable management judgment. Our judgments regarding the existence of impairment indicators and future cash flows are based on operational performance of our businesses, market conditions and other factors. Although there are inherent uncertainties in this assessment process, the estimates and assumptions we use, including estimates of future cash flows, volumes, market penetration and discount rates, are consistent with our internal planning. The estimated future cash flows are derived from internal operating budgets and forecasts for long-term demand and pricing in our industry and markets. If these estimates or their related assumptions change in the future, we may be required to record an impairment charge on all or a portion of our goodwill. Furthermore, we cannot predict the occurrence of future impairment-triggering events nor the affect such events might have on our reported values. Future events could cause us to conclude that impairment indicators exist and that goodwill associated with our acquired businesses are impaired. Any resulting impairment loss could have an adverse effect on our financial condition and results of operations.
The annual goodwill test is performed by first assessing qualitative factors to determine whether the existence of events or circumstances leads to a determination that it is more likely than not (more than 50%) that the estimated fair value of a reporting unit is less than its carrying amount. If, as a result of the qualitative assessment, it is determined that an impairment is more likely than not, a Step-1 approach is performed to quantitatively compare each reporting unit’s fair value to its carrying value. The Step-1 analysis fails when a report unit's carrying value is in excess of its fair value, resulting in an impairment loss.
Under the quantitative impairment test, Step-1 of the evaluation of impairment involves comparing the current fair value of each reporting unit to its carrying value, including goodwill. We use a discounted cash flow (“DCF”) model to estimate the current fair value of our reporting units when testing for impairment, as management believes forecasted cash flows are the best indicator of fair value. A number of significant assumptions and estimates are involved in the application of the DCF model to forecast operating cash flows, including macroeconomic trends in the reporting unit’s geographic area impacting private construction and public infrastructure industries, the timing of work embedded in our backlog, our performance and profitability under our contracts, our success in securing future sales and the appropriate interest rate used to discount the projected cash flows. We also perform a market assessment of our enterprise value. We believe the estimates and assumptions used in the valuations are reasonable.
In 2022, in conjunction with our annual review of goodwill on the first day of the fourth quarter, we selected a Step-1 approach for all of our reporting units. As of December 31, 2022, we determined that no events or circumstances from October 3, 2022 through December 31, 2022 indicated that a further assessment was necessary.
61
Service Revenue Recognition
We earn revenue from the provision of services, which are primarily paving and related services, but also include landfill operations and the receipt and disposal of waste that is converted to fuel for use in our cement plants. Revenue from the receipt of waste fuels is recognized when the waste is accepted and a corresponding liability is recognized for the costs to process the waste into fuel for the manufacturing of cement or to ship the waste offsite for disposal in accordance with applicable regulations.
Collectability of service contracts is due reasonably after certain milestones in the contract are performed. Milestones vary by project, but are typically calculated using monthly progress based on a percentage of completion or a customer’s engineer review of progress. The majority of the time, collection occurs within 90 days of billing and cash is received within the same fiscal year as services performed. On most projects the customer will withhold a portion of the invoice for retainage which may last longer than a year depending on the job.
Revenue derived from paving and related services is recognized over time based on the proportion of costs incurred to date relative to the total estimated costs at completion, which approximates progress towards completion. Under the this method, we recognize paving and related services revenue as services are rendered. The majority of our construction service contracts are completed within one year, but may occasionally extend beyond this time frame. The majority of our construction service contracts, and therefore, revenue, are opened and completed within one year, with most activity during the spring, summer and fall. We estimate profit as the difference between total estimated revenue and total estimated cost of a contract and recognize that profit over the life of the contract based on input measures. We generally measure progress toward completion on long-term paving and related services contracts based on the proportion of costs incurred to date relative to total estimated costs at completion. We include revisions of estimated profits on contracts in earnings under the cumulative catch-up method, under which the effect of revisions in estimates is recognized immediately. If a revised estimate of contract profitability reveals an anticipated loss on the contract, we recognize the loss in the period it is identified.
Our method, which is similar to the percentage of completion method of accounting, involves the use of various estimating techniques to project costs at completion, and in some cases includes estimates of recoveries asserted against the customer for changes in specifications or other disputes. Contract estimates involve various assumptions and projections relative to the outcome of future events over multiple periods, including future labor productivity and availability, the nature and complexity of the work to be performed, the cost and availability of materials, the effect of delayed performance, and the availability and timing of funding from the customer. These estimates are based on our best judgment. A significant change in one or more of these estimates could affect the profitability of one or more of our contracts. We review our contract estimates regularly to assess revisions in contract values and estimated costs at completion. Inherent uncertainties in estimating costs make it at least reasonably possible that the estimates used will change within the near term and over the life of the contracts. No material adjustments to a contract were recognized in the year ended December 31, 2022.
We recognize claims when the amount of the claim can be estimated reliably and it is legally enforceable. In evaluating these criteria, we consider the contractual basis for the claim, the cause of any additional costs incurred, the reasonableness of those costs and the objective evidence available to support the claim.
When the contract includes variable consideration, we estimate the amount of consideration to which we will be entitled in exchange for transferring the promised goods or services to a customer. The amount of estimated variable consideration included in the transaction price is the amount for which it is probable that a significant reversal in the amount of cumulative revenue recognized will not occur when the uncertainty associated with the variable consideration is subsequently resolved. Types of variable consideration include, but are not limited to, liquidated damages and other performance penalties and production and placement bonuses.
The majority of contract modifications relate to the original contract and are often an extension of the original performance obligation. Predominately, modifications are not distinct from the terms in the original contract; therefore, they are considered part of a single performance obligation. We account for the modification using a cumulative catch-up adjustment. However, there are instances where goods or services in a modification are distinct from those transferred prior to the modification. In these situations, we account for the modifications as either a separate contract or prospectively depending on the facts and circumstances of the modification.
Generally, construction contracts contain mobilization costs which are categorized as costs to fulfill a contract. These costs are excluded from any measure of progress toward contract fulfillment. These costs do not result in the transfer of control of a good or service to the customer and are amortized over the life of the contract.
62
Costs and estimated earnings in excess of billings are composed principally of revenue recognized on contracts on a method similar to the percentage of completion method for which billings had not been presented to customers because the amounts were not billable under the contract terms at the balance sheet date. In accordance with the contract terms, the unbilled receivables at the balance sheet date are expected to be billed in following periods. Billings in excess of costs and estimated earnings represent billings in excess of revenue recognized.
Income Taxes
Summit Inc. is a corporation subject to income taxes in the United States. Certain subsidiaries, including Summit Holdings, or subsidiary groups of the Company are taxable separate from Summit Inc. The provisions for income taxes, or Summit Inc.’s proportional share of the provision, are included in the Company’s consolidated financial statements.
The Company’s deferred income tax assets and liabilities are computed for differences between the tax basis and financial statement amounts that will result in taxable or deductible amounts in the future. The ultimate realization of deferred tax assets is dependent upon the generation of future taxable income during the periods in which those temporary differences become deductible, as well as consideration of tax-planning strategies to determine whether we may seek to utilize any net operating loss carryforwards scheduled to expire in the near future. The estimates of future taxable income involves the use of significant estimates and assumptions and considerable management judgment. Our judgments regarding future taxable income and future cash flows are based on operational performance of our businesses, market conditions and other factors. Although there are inherent uncertainties in this assessment process, the estimates and assumptions we use, including estimates of future cash flows, are consistent with our internal planning. The computed deferred balances are based on enacted tax laws and applicable rates for the periods in which the differences are expected to affect taxable income. A valuation allowance is recognized for deferred tax assets if it is more likely than not that some portion or all of the net deferred tax assets will not be realized. In making such a determination, all available positive and negative evidence is considered, including future reversals of existing taxable temporary differences, projected future taxable income, tax-planning strategies, and results of recent operations. If the Company determines it would be able to realize its deferred tax assets for which a valuation allowance had been recorded, then an adjustment would be made to the deferred tax asset valuation allowance, which would reduce the provision for income taxes.
The Company evaluates the tax positions taken on income tax returns that remain open and positions expected to be taken on the current year tax returns to identify uncertain tax positions. Unrecognized tax benefits on uncertain tax positions are recorded on the basis of a two-step process in which (1) the Company determines whether it is more likely than not that the tax positions will be sustained on the basis of the technical merits of the position and (2) for those tax positions that meet the more-likely-than-not recognition threshold, the largest amount of tax benefit that is more than 50 percent likely to be realized is recognized. Interest and penalties related to unrecognized tax benefits are recorded in income tax expense (benefit).
Tax Receivable Agreement
Tax Receivable Agreement— When Summit Inc. purchases LP Units for cash or LP Units are exchanged for shares of Class A common stock, this results in increases in Summit Inc.’s share of the tax basis of the tangible and intangible assets of Summit Holdings, which increases the tax depreciation and amortization deductions that otherwise would not have been available to Summit Inc. These increases in tax basis and tax depreciation and amortization deductions are expected to reduce the amount of cash taxes that we would otherwise be required to pay in the future. In connection with our IPO, we entered into a TRA with the holders of the LP Units and the pre-IPO owners that provides for the payment by Summit Inc. to exchanging holders of LP Units of 85% of the benefits, if any, that Summit Inc. actually realizes (or, under certain circumstances such as an early termination of the TRA is deemed to realize) as a result of (i) these increases in tax basis and (ii) our utilization of certain net operating losses of the pre-IPO owners and certain other tax benefits related to entering into the TRA, including tax benefits attributable to payments under the TRA.
We periodically evaluate the realizability of the deferred tax assets resulting from the exchange of LP Units for Class A common stock. Our evaluation considers all sources of taxable income; all evidence, both positive and negative, is considered to determine whether, based on the weight of that evidence, a valuation allowance is needed for some portion or all of the deferred tax assets. If the deferred tax assets are determined to be realizable, we then assess whether payment of amounts under the TRA have become probable. If so, we record a TRA liability of 85% of such deferred tax assets. In subsequent periods, we assess the realizability of all of our deferred tax assets subject to the TRA. Should we determine a deferred tax asset with a valuation allowance is realizable in a subsequent period, the related valuation allowance will be released and consideration of a corresponding TRA liability will be assessed. The realizability of deferred tax assets, including those subject to the TRA, is dependent upon the generation of future taxable income during the periods in which those deferred tax assets become deductible and consideration of prudent and feasible tax-planning strategies.
63
The measurement of the TRA liability is accounted for as a contingent liability. Therefore, once we determine that a payment to a pre-IPO owner has become probable and can be estimated, the estimate of payment will be accrued.
ITEM 7A. QUANTITATIVE AND QUALITATIVE DISCLOSURES ABOUT MARKET RISK.
We are exposed to certain market risks arising from transactions that are entered into in the normal course of business. Our operations are highly dependent upon the interest rate‑sensitive construction industry as well as the general economic environment. Consequently, these marketplaces could experience lower levels of economic activity in an environment of rising interest rates or escalating costs. Management has considered the current economic environment and its potential effect to our business. Demand for materials‑based products, particularly in the residential and nonresidential construction markets, could decline if companies and consumers are unable to obtain financing for construction projects or if an economic recession causes delays or cancellations to capital projects. Additionally, in preceding years, declining tax revenue, state budget deficits and unpredictable or inconsistent federal funding have negatively affected states’ abilities to finance infrastructure construction projects.
Commodity and Energy Price Risk
We are subject to commodity price risk with respect to price changes in liquid asphalt and energy, including fossil fuels and electricity for aggregates, cement, ready‑mix concrete and asphalt paving mix production, natural gas for hot mix asphalt production and diesel fuel for distribution vehicles and production related mobile equipment. Liquid asphalt escalators in most of our public infrastructure contracts limit our exposure to price fluctuations in this commodity, and we seek to obtain escalators on private and commercial contracts. Similarly, in periods of decreasing oil prices, a portion of the cost savings will be recouped by our end customers. Changes in oil prices also could affect demand in certain of our markets, particularly in Midland/Odessa, Texas and indirectly in Houston, Texas, which collectively represented approximately 15.7% of our consolidated revenue in 2022. In addition, we enter into various firm purchase commitments, with terms generally less than one year, for certain raw materials.
For the year ended December 31, 2022, our costs associated with liquid asphalt and energy amounted to approximately $282.2 million. Accordingly, a 10% increase or decrease in the total cost of liquid asphalt and energy would have decreased or increased, respectively, our operating results for the year by approximately $28.2 million. However, this does not take into consideration liquid asphalt escalators in certain contracts or forward purchase commitments put into place before December 31, 2022.
Inflation Risk
Although there has been a significant increase in inflation recently, it has not had a substantial impact due to our ability to recover increasing costs by obtaining higher prices for our products, including sale price escalators in place for most public infrastructure sector contracts. Inflation risk varies with the level of activity in the construction industry, the number, size and strength of competitors and the availability of products to supply a local market. We continue to monitor inflationary impacts in our business, primarily labor, energy and raw materials, with the goal of passing along price increases to our customers to mitigate the full effect of inflation.
Foreign Currency Risk
In 2014, we expanded our operations into Canada with the acquisition of Mainland. With this expansion, we became subject to foreign currency risk related to changes in the U.S. dollar/Canadian dollar exchange rates. A 10% adverse change in foreign currency rates from December 2022 levels would not have had a material effect on our financial condition, results of operations or liquidity.
Interest Rate Risk
As of December 31, 2022, we had $509.6 million in term loans outstanding which bear interest at a variable rate. As of December 31, 2022, the rate in effect was SOFR of 4.51%, plus a floor of 3.00% and 0.10% SOFR adjustment rate. Therefore, a 100 basis point increase in the interest rate at December 31, 2022 would only have increased the all-in rate from 7.61% to 8.61%, the effect of which would have been an increase of $5.1 million on annual interest expense.
64
We have occasionally entered into interest rate derivatives on our term loan borrowings to add stability to interest expense and to manage exposure to interest rate movements, however, we have not done so recently. Our last derivative expired in September 2019.
65
ITEM 8. FINANCIAL STATEMENTS AND SUPPLEMENTARY DATA.
INDEX TO FINANCIAL STATEMENTS
| Page | |||||
Auditor Name: | |||||
Auditor Location: | |||||
Auditor Firm ID: | |||||
66
Report of Independent Registered Public Accounting Firm
To the Stockholders and Board of Directors
Summit Materials, Inc.:
Opinion on the Consolidated Financial Statements
We have audited the accompanying consolidated balance sheets of Summit Materials, Inc. and subsidiaries (the Company) as of December 31, 2022 and January 1, 2022, the related consolidated statements of operations, comprehensive income, cash flows, and changes in stockholders’ equity for each of the fiscal years in the three-year period ended December 31, 2022, and the related notes (collectively, the consolidated financial statements). In our opinion, the consolidated financial statements present fairly, in all material respects, the financial position of the Company as of December 31, 2022 and January 1, 2022, and the results of its operations and its cash flows for each of the fiscal years in the three-year period ended December 31, 2022, in conformity with U.S. generally accepted accounting principles.
We also have audited, in accordance with the standards of the Public Company Accounting Oversight Board (United States) (PCAOB), the Company’s internal control over financial reporting as of December 31, 2022, based on criteria established in Internal Control – Integrated Framework (2013) issued by the Committee of Sponsoring Organizations of the Treadway Commission, and our report dated February 16, 2023 expressed an unqualified opinion on the effectiveness of the Company’s internal control over financial reporting.
Basis for Opinion
These consolidated financial statements are the responsibility of the Company’s management. Our responsibility is to express an opinion on these consolidated financial statements based on our audits. We are a public accounting firm registered with the PCAOB and are required to be independent with respect to the Company in accordance with the U.S. federal securities laws and the applicable rules and regulations of the Securities and Exchange Commission and the PCAOB.
We conducted our audits in accordance with the standards of the PCAOB. Those standards require that we plan and perform the audit to obtain reasonable assurance about whether the consolidated financial statements are free of material misstatement, whether due to error or fraud. Our audits included performing procedures to assess the risks of material misstatement of the consolidated financial statements, whether due to error or fraud, and performing procedures that respond to those risks. Such procedures included examining, on a test basis, evidence regarding the amounts and disclosures in the consolidated financial statements. Our audits also included evaluating the accounting principles used and significant estimates made by management, as well as evaluating the overall presentation of the consolidated financial statements. We believe that our audits provide a reasonable basis for our opinion.
Critical Audit Matter
The critical audit matter communicated below is a matter arising from the current period audit of the consolidated financial statements that was communicated or required to be communicated to the audit committee and that: (1) relates to accounts or disclosures that are material to the consolidated financial statements and (2) involved our especially challenging, subjective, or complex judgments. The communication of a critical audit matter does not alter in any way our opinion on the consolidated financial statements, taken as a whole, and we are not, by communicating the critical audit matter below, providing a separate opinion on the critical audit matter or on the accounts or disclosures to which it relates.
Revenue recognized over time on paving and related services contracts
As discussed in Notes 1 and 4 to the consolidated financial statements, the Company earns revenue from providing paving and related services, which are recognized over time as performance obligations are satisfied. The Company recognizes paving and related services revenue as services are rendered based on the proportion of costs incurred to date relative to total estimated costs to complete. For the year ended December 31, 2022, the Company recognized service revenue related to paving and related services of $289 million.
We identified the assessment of revenue recognized over time on paving and related services contracts in-progress as a critical audit matter. Paving and related services contracts in-progress required challenging auditor judgment to evaluate the forecast of remaining costs to complete, which had a significant impact on the amount of revenue recognized during the period.
The following are the primary procedures we performed to address this critical audit matter. We evaluated the design and tested the operating effectiveness of certain internal controls over the Company’s revenue recognition process related to
67
paving and related services, including controls over the forecasting of estimated costs to complete. We selected a sample of in-progress paving and related services costs incurred and compared the amounts and dates incurred to underlying supporting documentation. We analyzed prior year end in-progress contracts that were completed in the current year to evaluate the Company’s ability to accurately estimate paving and related services contract forecasted costs to complete. For certain contracts, we evaluated the estimated costs to complete by performing project manager interviews to obtain an understanding of the facts and circumstances of each selected contract, including changes in scope to the contract, additional estimated costs to complete, and expected completion date. For certain contracts, we also confirmed with the Company’s customers that the original contract amount, terms of the contract, modifications and billings to the customer were accurate.
/s/ KPMG LLP
We have served as the Company’s auditor since 2012.
Denver, Colorado
February 16, 2023
68
SUMMIT MATERIALS, INC. AND SUBSIDIARIES
Consolidated Balance Sheets
December 31, 2022 and January 1, 2022
(In thousands, except share and per share amounts)
| 2022 | 2021 | |||||||||||||
| Assets | ||||||||||||||
| Current assets: | ||||||||||||||
| Cash and cash equivalents | $ | $ | ||||||||||||
| Accounts receivable, net | ||||||||||||||
| Costs and estimated earnings in excess of billings | ||||||||||||||
| Inventories | ||||||||||||||
| Other current assets | ||||||||||||||
| Current assets held for sale | ||||||||||||||
| Total current assets | ||||||||||||||
| Property, plant and equipment, net | ||||||||||||||
| Goodwill | ||||||||||||||
| Intangible assets, net | ||||||||||||||
| Deferred tax assets | ||||||||||||||
| Operating lease right-of-use assets | ||||||||||||||
| Other assets | ||||||||||||||
| Total assets | $ | $ | ||||||||||||
| Liabilities and Stockholders’ Equity | ||||||||||||||
| Current liabilities: | ||||||||||||||
| Current portion of debt | $ | $ | ||||||||||||
| Current portion of acquisition-related liabilities | ||||||||||||||
| Accounts payable | ||||||||||||||
| Accrued expenses | ||||||||||||||
| Current operating lease liabilities | ||||||||||||||
| Billings in excess of costs and estimated earnings | ||||||||||||||
| Total current liabilities | ||||||||||||||
| Long-term debt | ||||||||||||||
| Acquisition-related liabilities | ||||||||||||||
| Tax receivable agreement liability | ||||||||||||||
| Noncurrent operating lease liabilities | ||||||||||||||
| Other noncurrent liabilities | ||||||||||||||
| Total liabilities | ||||||||||||||
| Commitments and contingencies (see note 16) | ||||||||||||||
| Stockholders’ equity: | ||||||||||||||
Class A common stock, par value $ | $ | $ | ||||||||||||
Class B common stock, par value $ | ||||||||||||||
| Additional paid-in capital | ||||||||||||||
| Accumulated earnings | ||||||||||||||
| Accumulated other comprehensive income | ||||||||||||||
| Stockholders’ equity | ||||||||||||||
| Noncontrolling interest in Summit Holdings | ||||||||||||||
| Total stockholders’ equity | ||||||||||||||
| Total liabilities and stockholders’ equity | $ | $ | ||||||||||||
See accompanying notes to consolidated financial statements.
69
SUMMIT MATERIALS, INC. AND SUBSIDIARIES
Consolidated Statements of Operations
Years ended December 31, 2022, January 1, 2022 and January 2, 2021
(In thousands, except share and per share amounts)
| 2022 | 2021 | 2020 | ||||||||||||||||||
| Revenue: | ||||||||||||||||||||
| Product | $ | $ | $ | |||||||||||||||||
| Service | ||||||||||||||||||||
| Net revenue | ||||||||||||||||||||
| Delivery and subcontract revenue | ||||||||||||||||||||
| Total revenue | ||||||||||||||||||||
| Cost of revenue (excluding items shown separately below): | ||||||||||||||||||||
| Product | ||||||||||||||||||||
| Service | ||||||||||||||||||||
| Net cost of revenue | ||||||||||||||||||||
| Delivery and subcontract cost | ||||||||||||||||||||
| Total cost of revenue | ||||||||||||||||||||
| General and administrative expenses | ||||||||||||||||||||
| Depreciation, depletion, amortization and accretion | ||||||||||||||||||||
| Gain on sale of property, plant and equipment | ( | ( | ( | |||||||||||||||||
| Operating income | ||||||||||||||||||||
| Interest expense | ||||||||||||||||||||
| Loss on debt financings | ||||||||||||||||||||
| Tax receivable agreement expense (benefit) | ( | ( | ||||||||||||||||||
| Loss (gain) on sale of businesses | ( | ( | ||||||||||||||||||
| Other income, net | ( | ( | ( | |||||||||||||||||
| Income from operations before taxes | ||||||||||||||||||||
| Income tax expense | ( | |||||||||||||||||||
| Net income | ||||||||||||||||||||
| Net income attributable to Summit Holdings | ||||||||||||||||||||
| Net income attributable to Summit Inc. | $ | $ | $ | |||||||||||||||||
| Earnings per share of Class A common stock: | ||||||||||||||||||||
| Basic | $ | $ | $ | |||||||||||||||||
| Diluted | $ | $ | $ | |||||||||||||||||
| Weighted average shares of Class A common stock: | ||||||||||||||||||||
| Basic | ||||||||||||||||||||
| Diluted | ||||||||||||||||||||
See accompanying notes to consolidated financial statements.
70
SUMMIT MATERIALS, INC. AND SUBSIDIARIES
Consolidated Statements of Comprehensive Income
Years ended December 31, 2022, January 1, 2022 and January 2, 2021
(In thousands)
| 2022 | 2021 | 2020 | ||||||||||||||||||
| Net income | $ | $ | $ | |||||||||||||||||
| Other comprehensive income (loss): | ||||||||||||||||||||
| Postretirement liability adjustment | ( | |||||||||||||||||||
| Foreign currency translation adjustment | ( | |||||||||||||||||||
| Less tax effect of other comprehensive (loss) income items | ( | ( | ||||||||||||||||||
| Other comprehensive income (loss) | ( | |||||||||||||||||||
| Comprehensive income | ||||||||||||||||||||
| Less comprehensive income attributable to Summit Holdings | ||||||||||||||||||||
| Comprehensive income attributable to Summit Inc. | $ | $ | $ | |||||||||||||||||
See accompanying notes to consolidated financial statements.
71
SUMMIT MATERIALS, INC. AND SUBSIDIARIES
Consolidated Statements of Cash Flows
Years ended December 31, 2022, January 1, 2022 and January 2, 2021
(In thousands)
| 2022 | 2021 | 2020 | ||||||||||||||||||
| Cash flows from operating activities: | ||||||||||||||||||||
| Net income | $ | $ | $ | |||||||||||||||||
| Adjustments to reconcile net income to net cash provided by operating activities: | ||||||||||||||||||||
| Depreciation, depletion, amortization and accretion | ||||||||||||||||||||
| Share-based compensation expense | ||||||||||||||||||||
| Net gain on asset and business disposals | ( | ( | ( | |||||||||||||||||
| Non-cash loss on debt financings | ||||||||||||||||||||
| Change in deferred tax asset, net | ( | |||||||||||||||||||
| Other | ( | ( | ||||||||||||||||||
| Decrease (increase) in operating assets, net of acquisitions and dispositions: | ||||||||||||||||||||
| Accounts receivable, net | ( | |||||||||||||||||||
| Inventories | ( | |||||||||||||||||||
| Costs and estimated earnings in excess of billings | ( | ( | ||||||||||||||||||
| Other current assets | ( | ( | ||||||||||||||||||
| Other assets | ( | |||||||||||||||||||
| (Decrease) increase in operating liabilities, net of acquisitions and dispositions: | ||||||||||||||||||||
| Accounts payable | ( | ( | ||||||||||||||||||
| Accrued expenses | ( | ( | ||||||||||||||||||
| Billings in excess of costs and estimated earnings | ( | ( | ||||||||||||||||||
| Tax receivable agreement liability | ( | |||||||||||||||||||
| Other liabilities | ( | ( | ( | |||||||||||||||||
| Net cash provided by operating activities | ||||||||||||||||||||
| Cash flows from investing activities: | ||||||||||||||||||||
| Acquisitions, net of cash acquired | ( | ( | ( | |||||||||||||||||
| Purchases of property, plant and equipment | ( | ( | ( | |||||||||||||||||
| Proceeds from the sale of property, plant and equipment | ||||||||||||||||||||
| Proceeds from sale of businesses | ||||||||||||||||||||
| Other | ( | |||||||||||||||||||
| Net cash provided by (used in) investing activities | ( | ( | ||||||||||||||||||
| Cash flows from financing activities: | ||||||||||||||||||||
| Proceeds from debt issuances | ||||||||||||||||||||
| Debt issuance costs | ( | ( | ||||||||||||||||||
| Payments on debt | ( | ( | ( | |||||||||||||||||
| Payments on acquisition-related liabilities | ( | ( | ( | |||||||||||||||||
| Distributions from partnership | ( | |||||||||||||||||||
| Repurchases of common stock | ( | |||||||||||||||||||
| Proceeds from stock option exercises | ||||||||||||||||||||
| Other | ( | ( | ( | |||||||||||||||||
| Net cash used in financing activities | ( | ( | ( | |||||||||||||||||
| Impact of foreign currency on cash | ( | |||||||||||||||||||
| Net increase (decrease) in cash | ( | |||||||||||||||||||
| Cash and cash equivalents—beginning of period | ||||||||||||||||||||
| Cash and cash equivalents—end of period | $ | $ | $ | |||||||||||||||||
See accompanying notes to consolidated financial statements.
72
SUMMIT MATERIALS, INC. AND SUBSIDIARIES
Consolidated Statements of Changes in Stockholders’ Equity
Years ended December 31, 2022, January 1, 2022 and January 2, 2021
(In thousands, except share amounts)
| Summit Materials, Inc. | ||||||||||||||||||||||||||||||||||||||||||||||||||||||||
| Accumulated | ||||||||||||||||||||||||||||||||||||||||||||||||||||||||
| Other | Class A | Class B | Additional | Noncontrolling | Total | |||||||||||||||||||||||||||||||||||||||||||||||||||
| Accumulated | Comprehensive | Common Stock | Common Stock | Paid-in | Interest in | Stockholders’ | ||||||||||||||||||||||||||||||||||||||||||||||||||
| Earnings | income | Shares | Dollars | Shares | Dollars | Capital | Summit Holdings | Equity | ||||||||||||||||||||||||||||||||||||||||||||||||
| Balance — December 28, 2019 | $ | $ | $ | $ | $ | $ | $ | |||||||||||||||||||||||||||||||||||||||||||||||||
| Net income | — | — | — | — | — | — | ||||||||||||||||||||||||||||||||||||||||||||||||||
| LP Unit exchanges | — | — | — | — | ( | |||||||||||||||||||||||||||||||||||||||||||||||||||
| Other comprehensive income, net of tax | — | — | — | — | — | — | ||||||||||||||||||||||||||||||||||||||||||||||||||
| Stock option exercises | — | — | — | — | — | |||||||||||||||||||||||||||||||||||||||||||||||||||
| Share-based compensation | — | — | — | — | — | — | — | |||||||||||||||||||||||||||||||||||||||||||||||||
| Shares redeemed to settle taxes and other | — | — | — | — | ( | — | ( | |||||||||||||||||||||||||||||||||||||||||||||||||
| Balance — January 2, 2021 | $ | $ | $ | $ | $ | $ | $ | |||||||||||||||||||||||||||||||||||||||||||||||||
| Net income | — | — | — | — | — | — | ||||||||||||||||||||||||||||||||||||||||||||||||||
| LP Unit exchanges | — | — | — | — | ( | |||||||||||||||||||||||||||||||||||||||||||||||||||
| Other comprehensive income, net of tax | — | — | — | — | — | — | ||||||||||||||||||||||||||||||||||||||||||||||||||
| Stock option exercises | — | — | — | — | — | |||||||||||||||||||||||||||||||||||||||||||||||||||
| Share-based compensation | — | — | — | — | — | — | — | |||||||||||||||||||||||||||||||||||||||||||||||||
| Shares redeemed to settle taxes and other | — | — | — | — | ( | — | ( | |||||||||||||||||||||||||||||||||||||||||||||||||
| Balance — January 1, 2022 | $ | $ | $ | $ | $ | $ | $ | |||||||||||||||||||||||||||||||||||||||||||||||||
| Net income | — | — | — | — | — | — | ||||||||||||||||||||||||||||||||||||||||||||||||||
| LP Unit exchanges | — | — | — | — | — | ( | ||||||||||||||||||||||||||||||||||||||||||||||||||
| Other comprehensive loss, net of tax | — | ( | — | — | — | — | — | ( | ( | |||||||||||||||||||||||||||||||||||||||||||||||
| Stock option exercises | — | — | — | — | — | — | ||||||||||||||||||||||||||||||||||||||||||||||||||
| Share-based compensation | — | — | — | — | — | — | — | |||||||||||||||||||||||||||||||||||||||||||||||||
Dividend ( | ( | — | — | — | ( | ( | ||||||||||||||||||||||||||||||||||||||||||||||||||
| Repurchases of common stock | ( | — | ( | ( | — | — | ( | ( | ||||||||||||||||||||||||||||||||||||||||||||||||
| Distributions from partnership | — | — | — | — | — | — | — | ( | ( | |||||||||||||||||||||||||||||||||||||||||||||||
| Shares redeemed to settle taxes and other | — | — | — | — | ( | ( | ||||||||||||||||||||||||||||||||||||||||||||||||||
| Balance — December 31, 2022 | $ | $ | $ | $ | $ | $ | $ | |||||||||||||||||||||||||||||||||||||||||||||||||
See accompanying notes to consolidated financial statements.
73
SUMMIT MATERIALS, INC. AND SUBSIDIARIES
NOTES TO CONSOLIDATED FINANCIAL STATEMENTS
(Dollars in tables in thousands, unless otherwise noted)
(1) Summary of Organization and Significant Accounting Policies
Summit Materials, Inc. (“Summit Inc.” and, together with its subsidiaries, “Summit,” “we,” “us,” “our” or the “Company”) is a vertically-integrated construction materials company. The Company is engaged in the production and sale of aggregates, cement, ready-mix concrete, asphalt paving mix and concrete products and owns and operates quarries, sand and gravel pits, two cement plants, cement distribution terminals, ready-mix concrete plants, asphalt plants and landfill sites. It is also engaged in paving and related services. The Company’s three
Substantially all of the Company’s construction materials, products and services are produced, consumed and performed outdoors, primarily in the spring, summer and fall. Seasonal changes and other weather-related conditions can affect the production and sales volumes of its products and delivery of services. Therefore, the financial results for any interim period are typically not indicative of the results expected for the full year. Furthermore, the Company’s sales and earnings are sensitive to national, regional and local economic conditions, weather conditions and to cyclical changes in construction spending, among other factors.
On September 23, 2014, Summit Inc. was formed as a Delaware corporation to be a holding company. Its sole material asset is a controlling equity interest in Summit Materials Holdings L.P. (“Summit Holdings”). Pursuant to a reorganization into a holding company structure (the “Reorganization”) consummated in connection with Summit Inc.’s March 2015 initial public offering ("IPO"), Summit Inc. became a holding corporation operating and controlling all of the business and affairs of Summit Holdings and its subsidiaries. Summit Inc. owns the majority of the partnership interests of Summit Holdings (see note 11, Stockholders’ Equity). Summit Materials, LLC (“Summit LLC”) an indirect wholly owned subsidiary of Summit Holdings, conducts the majority of our operations. Continental Cement Company, L.L.C. (“Continental Cement”) is also a wholly owned subsidiary of Summit LLC. Summit Materials Finance Corp. (“Summit Finance”), an indirect wholly owned subsidiary of Summit LLC, has jointly issued our Senior Notes as described below.
Principles of Consolidation—The consolidated financial statements include the accounts of Summit Inc. and its majority owned subsidiaries. All intercompany balances and transactions have been eliminated. As a result of the Reorganization, Summit Holdings became a variable interest entity over which Summit Inc. has 100 % voting power and control and for which Summit Inc. has the obligation to absorb losses and the right to receive benefits.
The Company’s fiscal year is based on a 52-53 week year with each quarter composed of 13 weeks ending on a Saturday. The year ended January 2, 2021 was a 53-week year.
For a summary of the changes in Summit Inc.’s ownership of Summit Holdings, see Note 11, Stockholders’ Equity.
The Company attributes consolidated stockholders’ equity and net income separately to the controlling and noncontrolling interests. The Company accounted for investments in entities for which it has an ownership of 20% to 50% using the equity method of accounting.
74
Accounts Receivable—Accounts receivable are stated at the amount management expects to collect from outstanding balances. Management provides for probable uncollectible amounts through a charge to earnings and a credit to a valuation allowance based on its assessment of the collectability of individual accounts. In establishing the allowance, management considers historical losses adjusted to take into account current market conditions and its customers’ financial condition, the amount of receivables in dispute, the current receivables aging and current payment terms. Balances that remain outstanding after reasonable collection efforts are exercised are written off through a charge to the valuation allowance.
The balances billed but not paid by customers, pursuant to retainage provisions included in contracts, are generally due upon completion of the contracts.
Revenue Recognition—We earn revenue from the sale of products, which primarily include aggregates, cement, ready-mix concrete and asphalt, but also include concrete products and plastics components, and from the provision of services, which are primarily paving and related services, but also include landfill operations, the receipt and disposal of waste that is converted to fuel for use in our cement plants.
Products
We earn revenue from the sale of products, which primarily include aggregates, cement, ready-mix concrete and asphalt, but also include concrete products, net of discounts or allowances, if any, and freight and delivery charges billed to customers. Revenue for product sales is recognized when the performance obligation is satisfied, which generally is when the product is shipped.
Aggregates and cement products are sold point-of-sale through purchase orders. When the product is sold on account, collectability typically occurs 30 to 60 days after the sale. Revenue is recognized when cash is received from the customer at the point of sale or when the products are delivered or collected on site. There are no other timing implications that will create a contract asset or liability, and contract modifications are unlikely given the timing and nature of the transaction. Material sales are likely to have multiple performance obligations if the product is sold with delivery. In these instances, delivery most often occurs on the same day as the control of the product transfers to the customer. As a result, even in the case of multiple performance obligations, the performance obligations are satisfied concurrently and revenue is recognized simultaneously.
Services
We earn revenue from the provision of services, which are primarily paving and related services, but also include landfill operations and the receipt and disposal of waste that is converted to fuel for use in our cement plants. Revenue from the receipt of waste fuels is recognized when the waste is accepted and a corresponding liability is recognized for the costs to process the waste into fuel for the manufacturing of cement or to ship the waste offsite for disposal in accordance with applicable regulations.
Collectability of service contracts is due reasonably after certain milestones in the contract are performed. Milestones vary by project, but are typically calculated using monthly progress based on a percentage of completion or a customer’s engineer review of progress. The majority of the time, collection occurs within 90 days of billing and cash is received within the same fiscal year as services performed. On most projects, the customer will withhold a portion of the invoice for retainage, which may last longer than a year depending on the job.
Revenue derived from paving and related services is recognized over time based on the proportion of costs incurred to date relative to the total estimated costs at completion, which approximates progress towards completion. Under this method, we recognize paving and related services revenue as services are rendered. The majority of our construction service contracts are completed within one year, but may occasionally extend beyond this time frame. The majority of our construction service contracts, and therefore, revenue, are opened and completed within one year, with most activity during the spring, summer and fall. We estimate profit as the difference between total estimated revenue and total estimated cost of a contract and recognize that profit over the life of the contract based on input measures. We generally measure progress toward completion on long-
75
term paving and related services contracts based on the proportion of costs incurred to date relative to total estimated costs at completion. We include revisions of revenue on contracts in earnings under the cumulative catch-up method, under which the effect of revisions in estimates is recognized immediately. If a revised estimate of contract profitability reveals an anticipated loss on the contract, we recognize the loss in the period it is identified.
The actual cost to total estimated cost method of accounting involves the use of various estimating techniques to project costs at completion, and in some cases includes estimates of recoveries asserted against the customer for changes in specifications or other disputes. Contract estimates involve various assumptions and projections relative to the outcome of future events over multiple periods, including future labor productivity and availability, the nature and complexity of the work to be performed, the cost and availability of materials, the effect of delayed performance, and the availability and timing of funding from the customer. These estimates are based on our best judgment. A significant change in one or more of these estimates could affect the profitability of one or more of our contracts. We review our contract estimates regularly to assess revisions in contract values and estimated costs at completion. Inherent uncertainties in estimating costs make it at least reasonably possible that the estimates used will change within the near term and over the life of the contracts. No material adjustments to a contract were recognized in the year ended December 31, 2022.
We recognize claims when the amount of the claim can be estimated reliably and it is legally enforceable. In evaluating these criteria, we consider the contractual basis for the claim, the cause of any additional costs incurred, the reasonableness of those costs and the objective evidence available to support the claim.
When the contract includes variable consideration, we estimate the amount of consideration to which we will be entitled in exchange for transferring the promised goods or services to a customer. The amount of estimated variable consideration included in the transaction price is the amount for which it is probable that a significant reversal in the amount of cumulative revenue recognized will not occur when the uncertainty associated with the variable consideration is subsequently resolved. Types of variable consideration include, but are not limited to, liquidated damages and other performance penalties and production and placement bonuses.
The majority of contract modifications relate to the original contract and are often an extension of the original performance obligation. Predominately, modifications are not distinct from the terms in the original contract; therefore, they are considered part of a single performance obligation. We account for the modification using a cumulative catch-up adjustment. However, there are instances where goods or services in a modification are distinct from those transferred prior to the modification. In these situations, we account for the modifications as either a separate contract or prospectively depending on the facts and circumstances of the modification.
Generally, construction contracts contain mobilization costs which are categorized as costs to fulfill a contract. These costs are excluded from any measure of progress toward contract fulfillment. These costs do not result in the transfer of control of a good or service to the customer and are amortized over the life of the contract.
Costs and estimated earnings in excess of billings are composed principally of revenue recognized on contracts on a method similar to the percentage of completion method for which billings had not been presented to customers because the amounts were not billable under the contract terms at the balance sheet date. In accordance with the contract terms, the unbilled receivables at the balance sheet date are expected to be billed in following periods. Billings in excess of costs and estimated earnings represent billings in excess of revenue recognized.
Property, Plant and Equipment, net—Property, plant and equipment are recorded at cost, less accumulated depreciation, depletion and amortization. Expenditures for additions and improvements that significantly add to the productive capacity or extend the useful life of an asset are capitalized. Repair and maintenance costs that do not substantially expand productive capacity or extend the life of property, plant and equipment are expensed as incurred.
Landfill airspace is included in property, plant and equipment at cost and is amortized based on the portion of the airspace used during the period compared to the gross estimated value of available airspace, which is updated periodically as circumstances dictate. Management reassesses the landfill airspace capacity with any changes in value recorded in cost of
76
revenue. Capitalized landfill costs include expenditures for the acquisition of land and related airspace, engineering and permitting costs, cell construction costs and direct site improvement costs.
Upon disposal of an asset, the cost and related accumulated depreciation are removed from the Company’s accounts and any gain or loss is included in general and administrative expenses.
The Company reviews the carrying value of property, plant and equipment for impairment whenever events or circumstances indicate that the carrying value of an asset may not be recoverable from the estimated future cash flows expected to result from its use and eventual disposition. Such indicators may include, among others, deterioration in general economic conditions, adverse changes in the markets in which an entity operates, increases in input costs that have a negative effect on earnings and cash flows or a trend of negative or declining cash flows over multiple periods.
Property, plant and equipment is tested for impairment at the lowest level for which identifiable cash flows are largely independent of the cash flows of other assets. As a result, the property, plant and equipment impairment test is at a significantly lower level than the level at which goodwill is tested for impairment. In markets where the Company does not produce downstream products, such as ready-mix concrete, asphalt paving mix and paving and related services, the lowest level of largely independent identifiable cash flows is at the individual aggregates operation or a group of aggregates operations collectively serving a local market or the cement operations. Conversely, in vertically-integrated markets, the cash flows of the downstream and upstream businesses are not largely independently identifiable and the vertically-integrated operations are considered the lowest level of largely independent identifiable cash flows.
Aggregates mineral bearing land and interests are included in property, plant and equipment. When leased mineral interests are acquired during a business combination, they are valued using an excess earnings approach for the life of the proven and probable reserves. Depletion expense is recorded using a units of production methodology.
Accrued Mining and Landfill Reclamation—The mining reclamation reserve and financial commitments for landfill closure and post-closure activities are based on management’s estimate of future cost requirements to reclaim property at both currently operating and closed sites. Estimates of these obligations have been developed based on management’s interpretation of current requirements and proposed regulatory changes and are intended to approximate fair value. Costs are estimated in current dollars, inflated until the expected time of payment, and then discounted back to present value using a credit-adjusted risk-free rate on obligations of similar maturity, adjusted to reflect the Company’s credit rating. Changes in the credit-adjusted risk-free rate do not change recorded liabilities. However, subsequent increases in the recognized obligations are measured using a current credit-adjusted risk-free rate. Decreases in the recognized obligations are measured at the initial credit-adjusted risk-free rate.
Significant changes in inflation rates, or the amount or, timing of future cost estimates typically result in both (1) a current adjustment to the recorded liability (and corresponding adjustment to the asset) and (2) a change in accretion of the liability and depreciation of the asset to be recorded prospectively over the remaining capacity of the unmined quarry or landfill.
Income Taxes—Summit Inc. is a corporation subject to income taxes in the United States. Certain subsidiaries, including Summit Holdings, or subsidiary groups of the Company are taxable separate from Summit Inc. The provision for income taxes, or Summit Inc.’s proportional share of the provision, are included in the Company’s consolidated financial statements.
The Company’s deferred income tax assets and liabilities are computed for differences between the tax basis and financial statement amounts that will result in taxable or deductible amounts in the future. The computed deferred balances are based on enacted tax laws and applicable rates for the periods in which the differences are expected to affect taxable income. A valuation allowance is recognized for deferred tax assets if it is more likely than not that some portion or all of the net deferred
77
tax assets will not be realized. In making such a determination, all available positive and negative evidence is considered, including future reversals of existing taxable temporary differences, projected future taxable income, tax-planning strategies, and results of recent operations. If the Company determines it would be able to realize its deferred tax assets for which a valuation allowance had been recorded then an adjustment would be made to the deferred tax asset valuation allowance, which would reduce the provision for income taxes.
The Company evaluates the tax positions taken on income tax returns that remain open and positions expected to be taken on the current year tax returns to identify uncertain tax positions. Unrecognized tax benefits on uncertain tax positions are recorded on the basis of a two-step process in which (1) the Company determines whether it is more likely than not that the tax positions will be sustained on the basis of the technical merits of the position and (2) for those tax positions that meet the more-likely-than-not recognition threshold, the largest amount of tax benefit that is more than 50 percent likely to be realized is recognized. Interest and penalties related to unrecognized tax benefits are recorded in income tax expense (benefit).
Tax Receivable Agreement—When Class A limited partnership units of Summit Holdings (“LP Units”) are exchanged for shares of Class A common stock of Summit Inc. or Summit Inc. purchases LP Units for cash, this results in increases in Summit Inc.’s share of the tax basis of the tangible and intangible assets, which increases the tax depreciation and amortization deductions that otherwise would not have been available to Summit Inc. These increases in tax basis and tax depreciation and amortization deductions are expected to reduce the amount of cash taxes that we would otherwise be required to pay in the future. Prior to our IPO, we entered into a TRA with the pre-IPO owners that requires us to pay the pre-IPO owners or their permitted assignees 85 % of the amount of cash savings, if any, in U.S. federal, state, and local income tax that we actually realize as a result of these exchanges. These benefits include (1) increases in the tax basis of tangible and intangible assets of Summit Holdings and certain other tax benefits related to entering into the TRA, (2) tax benefits attributable to payments under the TRA, or (3) under certain circumstances such as an early termination of the TRA, we are deemed to realize, as a result of the increases in tax basis in connection with exchanges by the pre-IPO owners described above and certain other tax benefits attributable to payments under the TRA.
As noted above, we periodically evaluate the realizability of the deferred tax assets resulting from the exchange of LP Units for Class A common stock. If the deferred tax assets are determined to be realizable, we then assess whether payment of amounts under the TRA have become probable. If so, we record a TRA liability equal to 85 % of such deferred tax assets. In subsequent periods, we assess the realizability of all of our deferred tax assets subject to the TRA. Should we determine a deferred tax asset with a valuation allowance is realizable in a subsequent period, the related valuation allowance will be released and consideration of a corresponding TRA liability will be assessed. The realizability of deferred tax assets, including those subject to the TRA, is dependent upon the generation of future taxable income during the periods in which those deferred tax assets become deductible and consideration of prudent and feasible tax-planning strategies.
The measurement of the TRA liability is accounted for as a contingent liability. Therefore, once we determine that a payment to a pre-IPO owner has become probable and can be estimated, the estimate of payment will be accrued.
Prior Year Reclassifications—We reclassified $1.2 million of other current assets to current assets held for sale for the year ended January 1, 2022 to be consistent with the current year presentation.
New Accounting Standards—In August 2018, the FASB issued ASU No. 2018-15, Intangibles-Goodwill and Other-Internal-Use Software (Subtopic 350-40): Customer’s Accounting for Implementation Costs Incurred in a Cloud Computing Arrangement That Is a Service Contract, which reduces the accounting complexity of implementing a cloud computing service arrangement. The ASU aligns the capitalization of implementation costs among hosting arrangements and costs incurred to develop internal-use software. We adopted this ASU in the first quarter of 2020 and the adoption of this ASU did not have a material impact on the consolidated financial statements.
In August 2018, the FASB issued ASU No. 2018-14, Compensation-Retirement Benefits-Defined Benefit Plans-General (Subtopic 715-20): Disclosure Framework Changes to The Disclosure Requirements for Defined Benefits Plans, which
78
(2) Acquisitions and Dispositions
The Company has completed numerous acquisitions since its formation. The operations of each acquisition have been included in the Company’s consolidated results of operations since the respective closing dates of the acquisitions. The Company measures all assets acquired and liabilities assumed at their acquisition-date fair value. Goodwill acquired during a business combination has an indefinite life and is not amortized. The following table summarizes the Company’s acquisitions by region and period:
| 2022 | 2021 | 2020 | ||||||||||||||||||
| West | ||||||||||||||||||||
| East | ||||||||||||||||||||
The purchase price allocation, primarily the valuation of property, plant and equipment for the acquisitions completed during the year end ended 2022 have not yet been finalized due to the recent timing of the acquisitions, status of the valuation of property, plant and equipment and finalization of related tax returns. The following table summarizes aggregated information regarding the fair values of the assets acquired and liabilities assumed as of the respective acquisition dates:
| 2022 | 2021 | |||||||||||||
| Financial assets | $ | $ | ||||||||||||
| Inventories | ||||||||||||||
| Property, plant and equipment | ||||||||||||||
| Intangible assets | ||||||||||||||
| Other assets | ||||||||||||||
| Financial liabilities | ( | ( | ||||||||||||
| Other long-term liabilities | ( | ( | ||||||||||||
| Net assets acquired | ||||||||||||||
| Goodwill | ||||||||||||||
| Purchase price | ||||||||||||||
| Acquisition-related liabilities | ( | ( | ||||||||||||
| Other | ||||||||||||||
| Net cash paid for acquisitions | $ | $ | ||||||||||||
Acquisition-Related Liabilities—A number of acquisition-related liabilities have been recorded subject to terms in the relevant purchase agreements, including deferred consideration and noncompete payments. Noncompete payments have been accrued where certain former owners of newly acquired companies have entered into standard noncompete arrangements. Subject to terms and conditions stated in these noncompete agreements, payments are generally made over a five-year period. Deferred consideration is purchase price consideration paid in the future as agreed to in the purchase agreement and is not contingent on future events. Deferred consideration is generally scheduled to be paid in years ranging from 5 to 20 years in annual installments. The remaining payments due under these noncompete and deferred consideration agreements are as follows:
79
| 2023 | $ | ||||
| 2024 | |||||
| 2025 | |||||
| 2026 | |||||
| 2027 | |||||
| Thereafter | |||||
| Total scheduled payments | |||||
| Present value adjustments | ( | ||||
| Total noncompete obligations and deferred consideration | $ | ||||
Accretion on the deferred consideration and noncompete obligations is recorded in interest expense.
During 2022, as part of the Company's Elevate Summit strategy to rationalize assets, the Company sold three businesses in the East segment, resulting in total cash proceeds of $373.1 million and a net gain on disposition of business of $172.4 million.
(3) Goodwill
As of December 31, 2022, the Company had 10 reporting units with goodwill for which the annual goodwill impairment test was completed. We perform the annual impairment test on the first day of the fourth quarter each year. In 2022, we performed a Step-1 analysis on all of our reporting units. Based on this analysis, it was determined that the reporting units’ fair values were greater than their carrying values and no impairment charges were recognized in 2022.
These estimates of a reporting unit’s fair value involve significant management estimates and assumptions, including but not limited to sales prices of similar assets, assumptions related to future profitability, cash flows, and discount rates. These estimates are based upon historical trends, management’s knowledge and experience and overall economic factors, including projections of future earnings potential. Developing discounted future cash flow estimates in applying the income approach required management to evaluate its intermediate to longer-term strategies, including, but not limited to, estimates about revenue growth, operating margins, capital requirements, inflation and working capital management. The development of appropriate rates to discount the estimated future cash flows required the selection of risk premiums, which can materially affect the present value of estimated future cash flows.
The following table presents goodwill by reportable segments and in total:
| West | East | Cement | Total | |||||||||||||||||||||||
| Balance—January 2, 2021 | $ | $ | $ | $ | ||||||||||||||||||||||
| Dispositions (1) | ( | ( | ( | |||||||||||||||||||||||
| Foreign currency translation adjustments | ||||||||||||||||||||||||||
| Balance—January 1, 2022 | $ | $ | $ | $ | ||||||||||||||||||||||
| Dispositions (1) | ( | ( | ||||||||||||||||||||||||
| Foreign currency translation adjustments | ( | ( | ||||||||||||||||||||||||
| Balance—December 31, 2022 | $ | $ | $ | $ | ||||||||||||||||||||||
______________________
(1)Reflects goodwill derecognition from dispositions completed during 2021 and 2022, respectively.
(4) Revenue Recognition
80
Revenue by product for the years ended December 31, 2022, January 1, 2022 and January 2, 2021 consisted of the following:
| 2022 | 2021 | 2020 | ||||||||||||||||||
| Revenue by product*: | ||||||||||||||||||||
| Aggregates | $ | $ | $ | |||||||||||||||||
| Cement | ||||||||||||||||||||
| Ready-mix concrete | ||||||||||||||||||||
| Asphalt | ||||||||||||||||||||
| Paving and related services | ||||||||||||||||||||
| Other | ||||||||||||||||||||
| Total revenue | $ | $ | $ | |||||||||||||||||
______________________
* Revenue from the liquid asphalt terminals is included in asphalt revenue.
The following table outlines the significant changes in contract assets and contract liability balances from January 1, 2022 to December 31, 2022. Also included in the table is the net change in the estimate as a percentage of aggregate revenue for such contracts:
| Costs and estimated | Billings in excess | ||||||||||
| earnings in | of costs and | ||||||||||
| excess of billings | estimated earnings | ||||||||||
| Balance—January 1, 2022 | $ | $ | |||||||||
| Changes in revenue billed, contract price or cost estimates | ( | ||||||||||
| Divestitures | ( | ( | |||||||||
| Other | ( | ( | |||||||||
| Balance—December 31, 2022 | $ | $ | |||||||||
Accounts receivable, net consisted of the following as of December 31, 2022 and January 1, 2022:
| 2022 | 2021 | |||||||||||||
| Trade accounts receivable | $ | $ | ||||||||||||
| Construction contract receivables | ||||||||||||||
| Retention receivables | ||||||||||||||
| Receivables from related parties | ||||||||||||||
| Accounts receivable | ||||||||||||||
| Less: Allowance for doubtful accounts | ( | ( | ||||||||||||
| Accounts receivable, net | $ | $ | ||||||||||||
Retention receivables are amounts earned by the Company but held by customers until paving and related service contracts and projects are near completion or fully completed. Amounts are generally billed and collected within one year .
(5) Inventories
Inventories consisted of the following as of December 31, 2022 and January 1, 2022:
| 2022 | 2021 | |||||||||||||
| Aggregate stockpiles | $ | $ | ||||||||||||
| Finished goods | ||||||||||||||
| Work in process | ||||||||||||||
| Raw materials | ||||||||||||||
| Total | $ | $ | ||||||||||||
(6) Property, Plant and Equipment, net and Intangibles, net
81
Property, plant and equipment, net consisted of the following as of December 31, 2022 and January 1, 2022:
| 2022 | 2021 | |||||||||||||
| Mineral bearing land and leased interests | $ | $ | ||||||||||||
| Land (non-mineral bearing) | ||||||||||||||
| Buildings and improvements | ||||||||||||||
| Plants, machinery and equipment | ||||||||||||||
| Mobile equipment and barges | ||||||||||||||
| Truck and auto fleet | ||||||||||||||
| Landfill airspace and improvements | ||||||||||||||
| Office equipment | ||||||||||||||
| Construction in progress | ||||||||||||||
| Property, plant and equipment | ||||||||||||||
| Less accumulated depreciation, depletion and amortization | ( | ( | ||||||||||||
| Property, plant and equipment, net | $ | $ | ||||||||||||
Depreciation on property, plant and equipment, including assets subject to capital leases, is generally computed on a straight-line basis. Depletion of mineral reserves and leased mineral interests are computed based on the portion of the reserves used during the period compared to the gross estimated value of proven and probable reserves, which is updated periodically as circumstances dictate. Leasehold improvements are amortized on a straight-line basis over the lesser of the asset’s useful life or the remaining lease term. The estimated useful lives are generally as follows:
| Buildings and improvements | years | |||||||
| Plant, machinery and equipment | years | |||||||
| Office equipment | years | |||||||
| Truck and auto fleet | years | |||||||
| Mobile equipment and barges | years | |||||||
| Landfill airspace and improvements | years | |||||||
| Other | years | |||||||
Depreciation, depletion and amortization expense of property, plant and equipment was $184.3 million, $195.1 million and $195.3 million in the years ended December 31, 2022, January 1, 2022 and January 2, 2021, respectively.
Property, plant and equipment at December 31, 2022 and January 1, 2022 included $32.1 million and $69.0 million, respectively, of finance leases for certain equipment and a building with accumulated amortization of $15.0 million and $31.4 million, respectively. The equipment leases generally have terms of less than five years and the building lease had an original term of 30 years. Approximately $7.0 million and $17.6 million of the future obligations associated with the finance leases are included in accrued expenses as of December 31, 2022 and January 1, 2022, respectively, and the present value of the remaining finance lease payments, $7.2 million and $15.0 million, respectively, is included in other noncurrent liabilities on the consolidated balance sheets. Future minimum rental commitments under long-term finance leases are $7.4 million, $2.8 million, $2.4 million, $1.0 million, and $0.8 million for the years ended 2023, 2024, 2025, 2026 and 2027, respectively.
Assets are assessed for impairment charges when identified for disposition. No material impairment charges have been recognized on assets held for use in fiscal 2022, 2021 or 2020.
Intangible Assets—The Company’s intangible assets subject to amortization are primarily composed of operating permits, mineral lease agreements and reserve rights. Operating permits relate to permitting and zoning rights acquired outside of a business combination. The assets related to mineral lease agreements reflect the submarket royalty rates paid under agreements, primarily for extracting aggregates. The values were determined as of the respective acquisition dates by a comparison of market-royalty rates. The reserve rights relate to aggregate reserves to which the Company has the rights of ownership, but does not own the reserves. The intangible assets are amortized on a straight-line basis over the lives of the leases or permits, or computed based on the portion of the reserves used during the period compared to the gross estimated value of proven and probable reserves. The following table shows intangible assets by type and in total:
82
| December 31, 2022 | January 1, 2022 | |||||||||||||||||||||||||||||||||||||
| Gross | Net | Gross | Net | |||||||||||||||||||||||||||||||||||
| Carrying | Accumulated | Carrying | Carrying | Accumulated | Carrying | |||||||||||||||||||||||||||||||||
| Amount | Amortization | Amount | Amount | Amortization | Amount | |||||||||||||||||||||||||||||||||
| Operating permits | $ | $ | ( | $ | $ | $ | ( | $ | ||||||||||||||||||||||||||||||
| Mineral leases | ( | ( | ||||||||||||||||||||||||||||||||||||
| Reserve rights | ( | ( | ||||||||||||||||||||||||||||||||||||
| Other | ( | ( | ||||||||||||||||||||||||||||||||||||
| Total intangible assets | $ | $ | ( | $ | $ | $ | ( | $ | ||||||||||||||||||||||||||||||
Amortization expense in fiscal 2022, 2021 and 2020 was $3.5 million, $3.7 million and $2.7 million, respectively. The estimated amortization expense for intangible assets for each of the next five years and thereafter is as follows:
| 2023 | $ | ||||
| 2024 | |||||
| 2025 | |||||
| 2026 | |||||
| 2027 | |||||
| Thereafter | |||||
| Total | $ | ||||
(7) Accrued Expenses
Accrued expenses consisted of the following as of December 31, 2022 and January 1, 2022:
| 2022 | 2021 | |||||||||||||
| Interest | $ | $ | ||||||||||||
| Payroll and benefits | ||||||||||||||
| Finance lease obligations | ||||||||||||||
| Insurance | ||||||||||||||
| Non-income taxes | ||||||||||||||
| Deferred asset purchase payments | ||||||||||||||
| Professional fees | ||||||||||||||
| Other (1) | ||||||||||||||
| Total | $ | $ | ||||||||||||
______________________
(1)Consists primarily of current portion of asset retirement obligations and miscellaneous accruals.
(8) Debt
Debt consisted of the following as of December 31, 2022 and January 1, 2022:
| 2022 | 2021 | |||||||||||||
| Term Loan, due 2027: | ||||||||||||||
$ | $ | $ | ||||||||||||
| 6 1⁄2% Senior Notes, due 2027 | ||||||||||||||
| 5 1⁄4% Senior Notes, due 2029 | ||||||||||||||
| Total | ||||||||||||||
| Current portion of long-term debt | ||||||||||||||
| Long-term debt | $ | $ | ||||||||||||
83
The contractual payments of long-term debt, including current maturities, for the five years subsequent to December 31, 2022, are as follows:
| 2023 | $ | ||||
| 2024 | |||||
| 2025 | |||||
| 2026 | |||||
| 2027 | |||||
| Thereafter | |||||
| Total | |||||
| Less: Original issue net discount | ( | ||||
| Less: Capitalized loan costs | ( | ||||
| Total debt | $ | ||||
Senior Notes—On September 27, 2021, Summit LLC and Summit Finance (together, the “Issuers”) redeemed all $300.0 million in aggregate principal amount of their 5.125 % senior notes due June 1, 2025 (the "2025 Notes") using existing cash on hand at a price equal to par plus an applicable premium and the indenture under which the 2025 Notes were issued was satisfied and discharged. As a result of the redemption, charges of $6.0 million were recognized in the quarter ended October 2, 2021, which included charges of $3.9 million for the applicable redemption premium and $2.1 million for the write-off of the deferred financing fees.
On August 11, 2020, the Issuers issued $700.0 million in aggregate principal amount of 5.250 % senior notes due January 15, 2029 (the “2029 Notes”). The 2029 Notes were issued at 100.0 % of their par value with proceeds of $690.4 million, net of related fees and expenses. The 2029 Notes were issued under an indenture dated August 11, 2020 (the "2020 Indenture"). The 2020 Indenture contains covenants limiting, among other things, Summit LLC and its restricted subsidiaries’ ability to incur additional indebtedness or issue certain preferred shares, pay dividends, redeem stock or make other distributions, make certain investments, sell or transfer certain assets, create liens, consolidate, merge, sell or otherwise dispose of all or substantially all of its assets, enter into certain transactions with affiliates, and designate subsidiaries as unrestricted subsidiaries. The 2020 Indenture also contains customary events of default. Interest on the 2029 Notes is payable semi-annually on January 15 and July 15 of each year commencing on January 15, 2021.
In August 2020, using the proceeds from the 2029 Notes, all of the outstanding $650.0 million 6.125 % senior notes due 2023 (the “2023 Notes”) were redeemed at a price equal to par and the indenture under which the 2023 Notes were issued was satisfied and discharged. As a result of the extinguishment, charges of $4.1 million were recognized in the quarter ended September 26, 2020, which included charges of $0.8 million for the write-off of original issue discount and $3.3 million for the write-off of deferred financing fees.
On March 15, 2019, the Issuers issued $300.0 million in aggregate principal amount of 6.500 % senior notes due March 15, 2027 (the “2027 Notes”). The 2027 Notes were issued at 100.0 % of their par value with proceeds of $296.3 million, net of related fees and expenses. The 2027 Notes were issued under an indenture dated March 25, 2019, the terms of which are generally consistent with the 2020 Indenture. Interest on the 2027 Notes is payable semi-annually on March 15 and September 15 of each year commencing on September 15, 2019.
As of December 31, 2022 and January 1, 2022, the Company was in compliance with all covenants under the applicable indentures.
Senior Secured Credit Facilities— Summit LLC has credit facilities that provide for term loans in an aggregate amount of $509.6 million and revolving credit commitments in an aggregate amount of $345.0 million (the “Senior Secured Credit Facilities”). Under the Senior Secured Credit Facilities, required principal repayments of 0.25 % of the refinanced aggregate amount of term debt are due on the last business day of each March, June, September and December, commencing with the March 2023 payment. The interest rate on the term loan is variable, and was 7.61 % as of December 31, 2022. In 2022, the Company repaid $95.6 million of its term loan under provisions related to divestitures of businesses. The unpaid principal balance is due in full on the maturity date, which is December 14, 2027.
On December 14, 2022, Summit Materials, LLC entered into Amendment No. 5 to the credit agreement governing the Senior Secured Credit Facilities (the “Credit Agreement”), which among other things, (a) refinanced the existing $509.6 million of existing term loans with new term loans under the Term Loan Facility bearing interest, at Summit LLC’s option, based on
84
either the base rate or Term SOFR rate and an applicable margin of (i) 2.00 % per annum with respect to base rate borrowings and a floor of 1.00 % per annum or (ii) 3.00 % per annum with respect to Term SOFR borrowings, with a SOFR adjustment of 0.10 % per annum and a floor of zero , and (b) extended the maturity date to December 14, 2027.
On January 10, 2023, Summit Materials, LLC entered into Amendment No. 6 to the Credit Agreement, which among other things, increased the maximum amount available to $395.0 million and extended the maturity date to January 10, 2028. The revolving credit agreement bears interest per annum equal to a Term SOFR Rate with a SOFR adjustment of 0.10 % per annum and a floor of zero .
As of December 31, 2022, the revolving credit facility bears interest per annum equal to, at Summit LLC’s option, either (i) a base rate determined by reference to the highest of (a) the federal funds rate plus 0.50 %, (b) the prime rate of Bank of America, N.A. and (c) LIBOR plus 1.00 %, plus an applicable margin of 2.00 % for base rate loans or (ii) a LIBOR rate determined by reference to Reuters prior to the interest period relevant to such borrowing adjusted for certain additional costs plus an applicable margin of 3.00 % for LIBOR rate loans.
There were no 325.2 million under the revolving credit facility, which is net of $19.8 million of outstanding letters of credit. The outstanding letters of credit are renewed annually and support required bonding on construction projects and the Company’s insurance liabilities.
Summit LLC’s Consolidated First Lien Net Leverage Ratio, as such term is defined in the Credit Agreement, should be no greater than 4.75 :1.0 as of each quarter-end. As of December 31, 2022 and January 1, 2022, Summit LLC was in compliance with all financial covenants under the Credit Agreement.
Summit LLC’s wholly-owned domestic subsidiary companies, subject to certain exclusions and exceptions, are named as subsidiary guarantors of the Senior Notes and the Senior Secured Credit Facilities. In addition, Summit LLC has pledged substantially all of its assets as collateral, subject to certain exclusions and exceptions, for the Senior Secured Credit Facilities.
The following table presents the activity for the deferred financing fees for the years ended December 31, 2022 and January 1, 2022:
| Deferred financing fees | |||||
| Balance—January 2, 2021 | $ | ||||
| Amortization | ( | ||||
| Write off of deferred financing fees | ( | ||||
| Balance—January 1, 2022 | $ | ||||
| Loan origination fees | |||||
| Amortization | ( | ||||
| Write off of deferred financing fees | ( | ||||
| Balance—December 31, 2022 | $ | ||||
Other—On January 15, 2015, the Company’s wholly-owned subsidiary in British Columbia, Canada entered into an agreement with HSBC, which was amended on November 30, 2020, for a (i) $6.0 million Canadian dollar (“CAD”) revolving credit commitment to be used for operating activities that bears interest per annum equal to the bank’s prime rate plus 0.20 %, (ii) $0.5 million CAD revolving credit commitment to be used for capital equipment that bears interest per annum at the bank’s prime rate plus 0.20 %, (iii) $1.5 million CAD revolving credit commitment to provide guarantees on behalf of that subsidiary and (iv) $10.0 million CAD revolving foreign exchange facility available to purchase foreign exchange forward contracts. There were no
(9) Income Taxes
Summit Inc.’s tax provision includes its proportional share of Summit Holdings’ tax attributes. Summit Holdings’ subsidiaries are primarily limited liability companies, but do include certain entities organized as C corporations and a Canadian subsidiary. The tax attributes related to the limited liability companies are passed on to Summit Holdings and then to its partners, including Summit Inc. The tax attributes associated with the C corporation and Canadian subsidiaries are fully reflected in the Company’s consolidated financial statements. For the years ended December 31, 2022, January 1, 2022 and January 2, 2021, income taxes consisted of the following:
85
| 2022 | 2021 | 2020 | ||||||||||||||||||
| Provision for income taxes: | ||||||||||||||||||||
| Current | $ | $ | $ | |||||||||||||||||
| Deferred | ( | |||||||||||||||||||
| Income tax expense (benefit) | $ | $ | $ | ( | ||||||||||||||||
The effective tax rate on pre-tax income differs from the U.S. statutory rate of 21% for 2022, 2021 and 2020, respectively, due to the following:
| 2022 | 2021 | 2020 | ||||||||||||||||||
| Income tax expense (benefit) at federal statutory tax rate | $ | $ | $ | |||||||||||||||||
| Less: Income tax benefit at federal statutory tax rate for LLC entities | ( | ( | ( | |||||||||||||||||
| State and local income taxes | ||||||||||||||||||||
| Permanent differences | ( | ( | ( | |||||||||||||||||
| Effective tax rate change | ( | |||||||||||||||||||
| Basis differences from divestitures | ||||||||||||||||||||
| Unrecognized tax benefits | ( | |||||||||||||||||||
| Tax receivable agreement (benefit) expense | ( | |||||||||||||||||||
| Change in valuation allowance | ( | |||||||||||||||||||
| Other | ( | ( | ||||||||||||||||||
| Income tax expense (benefit) | $ | $ | $ | ( | ||||||||||||||||
The following table summarizes the components of the net deferred income tax asset (liability) as December 31, 2022 and January 1, 2022:
| 2022 | 2021 | |||||||||||||
| Deferred tax assets (liabilities): | ||||||||||||||
| Net intangible assets | $ | $ | ||||||||||||
| Accelerated depreciation | ( | ( | ||||||||||||
| Net operating loss | ||||||||||||||
| Investment in limited partnership | ( | ( | ||||||||||||
| Mining reclamation reserve | ||||||||||||||
| Working capital (e.g., accrued compensation, prepaid assets) | ||||||||||||||
| Interest expense limitation carryforward | ||||||||||||||
| Less valuation allowance | ( | ( | ||||||||||||
| Deferred tax assets | ||||||||||||||
| Less foreign deferred tax liability (included in other noncurrent liabilities) | ( | ( | ||||||||||||
| Net deferred tax asset | $ | $ | ||||||||||||
As of December 31, 2022, $363.9 million of our deferred tax assets subject to our TRA are included in the net intangible assets and the net operating loss line items above.
Our income tax expense (benefit) was $85.5 million, $44.4 million and $(12.2 ) million in the fiscal years ended 2022, 2021 and 2020, respectively. Our effective income tax rate in 2021 and 2020 was impacted by the IRS interpretative guidance of the Tax Cuts and Jobs Act (the “TCJA”), a change in state tax rates and a change in the amount of our TRA liability.
The ultimate realization of deferred tax assets is dependent upon the generation of future taxable income during the periods in which those temporary differences become deductible, as well as consideration of tax-planning strategies we may seek to utilize net operating loss carryforwards that begin to expire in 2030. The Company updates the analysis, and adjusted the valuation allowance for interest expense carryforwards limited under the TCJA based on updated forecast models each year.
86
We had no
Our net operating loss carryforward deferred tax assets begin to expire in 2030 and are expected to reverse before expiration. Therefore, we have not given consideration to any potential tax planning strategies as a source of future taxable income to monetize those net operating loss carryforwards. The Company will continue to monitor facts and circumstances, including our analysis of other sources of taxable income, in the reassessment of the likelihood that the tax benefit of our deferred tax assets will be realized.
As of December 31, 2022, Summit Inc. had federal net operating loss carryforwards of $813 million, a portion of which expire between 2030 and 2038. As of December 31, 2022, $660 million of our federal net operating losses were under the terms of our TRA. As of December 31, 2022 and January 1, 2022, Summit Inc. had a valuation allowance on net deferred tax assets of $1.1 million and $1.7 million, respectively, where realization of our net operating losses are not more likely than not.
| 2022 | 2021 | |||||||||||||
| Valuation Allowance: | ||||||||||||||
| Beginning balance | $ | ( | $ | ( | ||||||||||
| Release of valuation allowance and other | ||||||||||||||
| Ending balance | $ | ( | $ | ( | ||||||||||
Tax Receivable Agreement— During 2015, the Company entered into a TRA with the holders of LP Units and certain other pre-initial public offering owners (“Investor Entities”) that provides for the payment by Summit Inc. to exchanging holders of LP Units of 85 % of the benefits, if any, that Summit Inc. actually realizes (or, under certain circumstances such as an early termination of the TRA, is deemed to realize) as a result of increases in the tax basis of tangible and intangible assets of Summit Holdings and certain other tax benefits related to entering into the TRA, including tax benefits attributable to payments under the TRA.
When LP Units are exchanged for an equal number of newly-issued shares of Summit Inc.’s Class A common stock, these exchanges result in new deferred tax assets. Using tax rates in effect as of each year end, $0.3 million and $13.7 million of deferred tax assets were created during the years ended December 31, 2022 and January 1, 2022, respectively, when LP Units were exchanged for shares of Class A common stock.
Each year, we update our estimate as to when TRA payments will be made. The timing and cash tax savings of those payments can cause variations in the future value of TRA tax attributes. As noted above, when payments are made under the TRA, a portion of the payment made will be characterized as imputed interest under IRS regulations. We also updated our estimate of the state income tax rate that will be in effect at the date the TRA payments are made. As a result of our updated state income tax rate, and the variance in TRA tax attributes noted above, we have increased our TRA liability by $1.6 million and decreased by $6.8 million as of December 31, 2022 and January 1, 2022, respectively.
Our TRA liability as of December 31, 2022 and January 1, 2022 was $328.4 million and $326.5 million, respectively.
Tax Distributions – The holders of Summit Holdings’ LP Units, including Summit Inc., incur U.S. federal, state and local income taxes on their share of any taxable income of Summit Holdings. The limited partnership agreement of
Summit Holdings provides for pro rata cash distributions (“tax distributions”) to the holders of the LP Units in an amount generally calculated to provide each holder of LP Units with sufficient cash to cover its tax liability in respect of the LP Units. In general, these tax distributions are computed based on Summit Holdings’ estimated taxable income allocated to Summit Inc. multiplied by an assumed tax rate equal to the highest effective marginal combined U.S. federal, state and local income tax rate applicable to a corporate resident in New York, New York.
For the years ended December 31, 2022 and January 1, 2022, Summit Holdings paid tax distributions totaling $0.7 million and zero , respectively, to holders of its LP Units, other than Summit Inc.
C Corporation Subsidiaries — The effective income tax rate for the C corporations differ from the statutory federal rate primarily due to (1) tax depletion expense (benefit) in excess of the expense recorded under U.S. GAAP, (2) state income taxes and the effect of graduated tax rates, (3) differences between book and tax basis for divested businesses, (4) various other items such as limitations on meals and entertainment and other costs and (5) unrecognized tax benefits. The effective income tax rate for the Canadian subsidiary is not significantly different from its historical effective tax rate.
87
(10) Earnings Per Share
Basic earnings per share is computed by dividing net earnings by the weighted average common shares outstanding and diluted net earnings is computed by dividing net earnings, adjusted for changes in the earnings allocated to Summit Inc. as a result of the assumed conversion of LP Units, by the weighted-average common shares outstanding assuming dilution.
The following table shows the calculation of basic income per share:
| 2022 | 2021 | 2020 | ||||||||||||||||||
| Net income attributable to Summit Inc. | $ | $ | $ | |||||||||||||||||
| Weighted average shares of Class A stock outstanding | ||||||||||||||||||||
| Add: Nonvested restricted stock awards of retirement eligible shares | ||||||||||||||||||||
| Weighted average shares outstanding | ||||||||||||||||||||
| Basic earnings per share | $ | $ | $ | |||||||||||||||||
| Diluted net income attributable to Summit Inc. | $ | $ | $ | |||||||||||||||||
| Weighted average shares outstanding | ||||||||||||||||||||
| Add: stock options | ||||||||||||||||||||
| Add: warrants | ||||||||||||||||||||
| Add: restricted stock units | ||||||||||||||||||||
| Add: performance stock units | ||||||||||||||||||||
| Weighted average dilutive shares outstanding | ||||||||||||||||||||
| Diluted earnings per share | $ | $ | $ | |||||||||||||||||
Excluded from the above calculations were the shares noted below as they were antidilutive:
| 2022 | 2021 | 2020 | ||||||||||||||||||
| Antidilutive shares: | ||||||||||||||||||||
| LP Units | ||||||||||||||||||||
| Warrants | ||||||||||||||||||||
(11) Stockholders’ Equity
Our capital stock consists of 1.0 billion shares of $0.01 par value Class A common stock authorized, of which 118,408,655 250 million shares of $0.01 par value Class B common stock, of which 99
In March 2022, our Board of Directors authorized a share repurchase program, whereby we can repurchase up to $250 million of our Class A common stock. During the nine months ended October 1, 2022, we repurchased 3.4 million shares of Class A common stock for $101 million. These shares were retired upon purchase.
From time to time, limited partners of Summit Holdings exchange their LP Units for shares of Class A common stock of Summit Inc. The following table summarizes the changes in our ownership of Summit Holdings:
88
| Summit Inc. Shares (Class A) | LP Units | Total | Summit Inc. Ownership Percentage | |||||||||||||||||||||||
| Balance — January 2, 2021 (1) | % | |||||||||||||||||||||||||
| Exchanges during period | ( | |||||||||||||||||||||||||
| Stock option exercises | — | |||||||||||||||||||||||||
| Other equity transactions | — | |||||||||||||||||||||||||
| Balance — January 1, 2022 (1) | % | |||||||||||||||||||||||||
| Exchanges during period | ( | |||||||||||||||||||||||||
| Stock option exercises | — | |||||||||||||||||||||||||
| Repurchases of common stock | ( | — | ( | |||||||||||||||||||||||
| Other equity transactions | — | |||||||||||||||||||||||||
| Balance — December 31, 2022 | % | |||||||||||||||||||||||||
______________________
(1)The December 28, 2019 and January 1, 2022 balances of Summit Inc. Class A Shares of 116,369,809 and 120,684,322 , respectively, are shown to reflect the retroactive application of 1,979,214 shares of Class A common stock issued as a stock dividend on December 29, 2022.
Accumulated other comprehensive income (loss) - The changes in each component of accumulated other comprehensive income (loss) consisted of the following:
| Accumulated | ||||||||||||||||||||
| Foreign currency | other | |||||||||||||||||||
| Change in | translation | comprehensive | ||||||||||||||||||
| retirement plans | adjustments | income (loss) | ||||||||||||||||||
| Balance — January 2, 2021 | $ | $ | $ | |||||||||||||||||
| Postretirement liability adjustment, net of tax | — | |||||||||||||||||||
| Foreign currency translation adjustment, net of tax | — | |||||||||||||||||||
| Balance — January 1, 2022 | $ | $ | $ | |||||||||||||||||
| Postretirement liability adjustment, net of tax | — | |||||||||||||||||||
| Foreign currency translation adjustment, net of tax | — | ( | ( | |||||||||||||||||
| Balance — December 31, 2022 | $ | $ | ( | $ | ||||||||||||||||
(12) Supplemental Cash Flow Information
Supplemental cash flow information for the years ended December 31, 2022, January 1, 2022 and January 2, 2021 was as follows:
| 2022 | 2021 | 2020 | ||||||||||||||||||
| Cash payments: | ||||||||||||||||||||
| Interest | $ | $ | $ | |||||||||||||||||
| Payments for income taxes, net | ||||||||||||||||||||
| Operating cash payments on operating leases | ||||||||||||||||||||
| Operating cash payments on finance leases | ||||||||||||||||||||
| Finance cash payments on finance leases | ||||||||||||||||||||
| Non cash investing and financing activities: | ||||||||||||||||||||
| Accrued liabilities for purchases of property, plant and equipment | $ | $ | $ | |||||||||||||||||
| Stock Dividend | ||||||||||||||||||||
| Right of use assets obtained in exchange for operating lease obligations | ||||||||||||||||||||
| Right of use assets obtained in exchange for finance leases obligations | ( | |||||||||||||||||||
| Exchange of LP Units to shares of Class A common stock | ||||||||||||||||||||
(13) Stock-Based Compensation
89
Prior to the IPO and related Reorganization, the capital structure of Summit Holdings consisted of six different classes of limited partnership units, each of which was subject to unique distribution rights. In connection with the IPO and the related Reorganization, the limited partnership agreement of Summit Holdings was amended and restated to, among other things, modify its capital structure by creating LP Units. Holders of the LP Units periodically exchange their LP Units for shares of Class A common Stock of Summit Inc.
Omnibus Incentive Plan
Our 2015 Omnibus Incentive Plan (the "Plan") allows for grants of equity-based awards in the form of stock options, stock appreciation rights, restricted stock, restricted stock units, performance units and other stock-based awards. The Plan authorizes the issuance of up to 17,500,000 shares of Class A common stock in the form of restricted stock units and stock options, of which 7.2 million shares of Class A common stock were available for future grants as of December 31, 2022.
Employee Stock Purchase Plan
At the May 2021 Annual Meeting, stockholders approved the Summit Materials, Inc. 2021 Employee Stock Purchase Plan (the “ESPP”), which authorized 5,500,000 shares of Class A common stock for issuance under the ESPP. All eligible employees may voluntarily enroll to purchase the Company’s Class A common stock through payroll deductions at a price equal to 85 % of the lower of the fair market values of the stock as of the beginning or the end of six-month offering periods. Compensation expense is measured as the discount the employee is entitled to upon purchase and is recognized over the offering period. As of December 31, 2022, 5.5 million shares of Class A common stock were reserved for future issuance through the ESPP, with 5.4 million shares available for issuance.
Restricted Stock
Restricted Stock with Service-Based Vesting—Under the Plan, the Compensation Committee of the Board of Directors (the “Compensation Committee”) has granted restricted stock to members of the Board of Directors, executive officers and other key employees. These awards contain service conditions associated with continued employment or service. The terms of the restricted stock provide voting and regular dividend rights to holders of the awards. Upon vesting, the restrictions on the restricted stock lapse and the shares are considered issued and outstanding for accounting purposes.
In each of 2022, 2021 and 2020, the Compensation Committee granted restricted stock to executives and key employees under the Plan as part of our annual equity award program, which vest over a or year period, subject to continued employment or service. From time to time, the Compensation Committee grants restricted stock to newly hired or promoted employees or other employees who have achieved extraordinary personal performance objectives.
Further, in each of 2022, 2021 and 2020, the Compensation Committee granted 30,520 , 34,672 and 42,736 shares, respectively, to non-employee members of the Board of Directors for their annual service as directors. These restricted stock grants vest over a one year period.
In measuring compensation expense associated with the grant of restricted stock, we use the fair value of the award, determined as the closing stock price for our Class A common stock on the date of grant. Compensation expense is recorded monthly over the vesting period of the award.
Restricted stock with Service, Market-Condition-Based and Performance Based Vesting—In 2022, 2021 and 2020, the Compensation Committee granted restricted stock to certain members of our executive team as part of their annual compensation package. The restricted stock vests at the end of a year performance period, based on our total stock return (“TSR”) ranking relative to companies in the S&P Building & Construction Select Industry Index, as well as increases in our return on invested capital, subject to continued employment.
Compensation expense is recorded monthly over the vesting period of the awards. The following table summarizes information for the equity awards granted in 2022:
90
| Options | Restricted Stock Units | Performance Stock Units | Warrants | |||||||||||||||||||||||||||||||||||||||||||||||
| Weighted | Weighted | Weighted | Weighted | |||||||||||||||||||||||||||||||||||||||||||||||
| average grant- | Number of | average grant- | Number of | average grant- | average grant- | |||||||||||||||||||||||||||||||||||||||||||||
| Number of | date fair value | restricted | date fair value | performance | date fair value | Number of | date fair value | |||||||||||||||||||||||||||||||||||||||||||
| options | per unit | stock units | per unit | stock units | per unit | warrants | per unit | |||||||||||||||||||||||||||||||||||||||||||
| Beginning balance—January 1, 2022 | $ | $ | $ | $ | ||||||||||||||||||||||||||||||||||||||||||||||
| Granted | ||||||||||||||||||||||||||||||||||||||||||||||||||
| Forfeited/ Canceled | ( | ( | ( | |||||||||||||||||||||||||||||||||||||||||||||||
| Exercised | ( | |||||||||||||||||||||||||||||||||||||||||||||||||
| Vested | ( | ( | ||||||||||||||||||||||||||||||||||||||||||||||||
| Balance—December 31, 2022 | $ | $ | $ | $ | ||||||||||||||||||||||||||||||||||||||||||||||
The fair value of the time-vesting options granted was estimated as of the grant date using the Black-Scholes-Merton model, which requires the input of subjective assumptions, including the expected volatility and the expected term. No The fair value of the performance stock units granted was estimated as of the grant date using Monte Carlo simulations, which requires the input of subjective assumptions, including the expected volatility and the expected term.
| Performance Stock Units | ||||||||||||||||||||
| 2022 | 2021 | 2020 | ||||||||||||||||||
| Risk-free interest rate | ||||||||||||||||||||
| Dividend yield | N/A | N/A | N/A | |||||||||||||||||
| Volatility | ||||||||||||||||||||
| Expected term | ||||||||||||||||||||
The risk-free rate is based on the yield at the date of grant of a U.S. Treasury security with a maturity period approximating the expected term. As Summit Holdings has not historically and does not plan to issue regular dividends, a dividend yield of zero
Compensation expense for time-vesting interests granted is based on the grant date fair value. The Company recognizes compensation costs on a straight-line basis over the service period, which is generally the vesting period of the award. Forfeitures are recognized as they occur. Share-based compensation expense, which is recognized in general and administrative expenses, totaled $18.3 million, $19.7 million and $28.9 million in the years ended December 31, 2022, January 1, 2022 and January 2, 2021, respectively. As of December 31, 2022, unrecognized compensation cost totaled $19.5 million. The weighted average remaining contractual term over which the unrecognized compensation cost is to be recognized is 1.7 years as of year-end 2022.
(14) Employee Benefit Plans
Defined Contribution Plan—The Company sponsors employee 401(k) savings plans for its employees, including certain union employees. The plans provide for various required and discretionary Company matches of employees’ eligible compensation contributed to the plans. The expense for the defined contribution plans was $12.1 million, $10.9 million and $12.1 million for the years ended December 31, 2022, January 1, 2022 and January 2, 2021, respectively.
91
Defined Benefit and Other Postretirement Benefits Plans—The Company’s subsidiary, Continental Cement, sponsors two noncontributory defined benefit pension plans for hourly and salaried employees. The plans are closed to new participants and benefits are frozen. Pension benefits for eligible hourly employees are based on a monthly pension factor for each year of credited service. Pension benefits for eligible salaried employees are generally based on years of service and average eligible compensation. Continental Cement also sponsors two unfunded healthcare and life insurance benefits plans for certain eligible retired employees.
The funded status of the pension and other postretirement benefit plans is recognized in the consolidated balance sheets as the difference between the fair value of plan assets and the benefit obligations. For defined benefit pension plans, the benefit obligation is the projected benefit obligation (“PBO”) and for the healthcare and life insurance benefits plans, the benefit obligation is the accumulated postretirement benefit obligation (“APBO”). The PBO represents the actuarial present value of benefits expected to be paid upon retirement based on estimated future compensation levels. However, since the plans’ participants are not subject to future compensation increases, the plans’ PBO equals the accumulated benefit obligation (“ABO”). The APBO represents the actuarial present value of postretirement benefits attributed to employee services already rendered. The fair value of plan assets represents the current market value of assets held by an irrevocable trust fund for the sole benefit of participants. The measurement of the benefit obligations is based on the Company’s estimates and actuarial valuations. These valuations reflect the terms of the plan and use participant-specific information, such as compensation, age and years of service, as well as certain assumptions that require significant judgment, including estimates of discount rates, expected return on plan assets and mortality rates.
The Company uses December 31 as the measurement date for its defined benefit pension and other postretirement benefit plans.
Obligations and Funded Status—The following information is as of December 31, 2022 and January 1, 2022 and for the years ended December 31, 2022, January 1, 2022 and January 2, 2021:
92
| 2022 | 2021 | |||||||||||||||||||||||||
| Pension | Healthcare | Pension | Healthcare | |||||||||||||||||||||||
| benefits | & Life Ins. | benefits | & Life Ins. | |||||||||||||||||||||||
| Change in benefit obligations: | ||||||||||||||||||||||||||
| Beginning of period | $ | $ | $ | $ | ||||||||||||||||||||||
| Service cost | ||||||||||||||||||||||||||
| Interest cost | ||||||||||||||||||||||||||
| Actuarial (gain) loss | ( | ( | ( | |||||||||||||||||||||||
| Change in plan provision | ( | |||||||||||||||||||||||||
| Benefits paid | ( | ( | ( | ( | ||||||||||||||||||||||
| End of period | $ | $ | $ | $ | ||||||||||||||||||||||
| Change in fair value of plan assets: | ||||||||||||||||||||||||||
| Beginning of period | $ | $ | $ | $ | ||||||||||||||||||||||
| Actual return on plan assets | ( | |||||||||||||||||||||||||
| Employer contributions | ||||||||||||||||||||||||||
| Benefits paid | ( | ( | ( | ( | ||||||||||||||||||||||
| End of period | $ | $ | $ | $ | ||||||||||||||||||||||
| Funded status of plans | $ | ( | $ | ( | $ | ( | $ | ( | ||||||||||||||||||
| Current liabilities | $ | $ | ( | $ | $ | ( | ||||||||||||||||||||
| Noncurrent liabilities | ( | ( | ( | ( | ||||||||||||||||||||||
| Liability recognized | $ | ( | $ | ( | $ | ( | $ | ( | ||||||||||||||||||
| Amounts recognized in accumulated other comprehensive income: | ||||||||||||||||||||||||||
| Net actuarial loss | $ | $ | $ | $ | ||||||||||||||||||||||
| Prior service cost | ( | ( | ||||||||||||||||||||||||
| Total amount recognized | $ | $ | ( | $ | $ | |||||||||||||||||||||
The amount recognized in accumulated other comprehensive income (“AOCI”) is the actuarial loss (gain) and prior service cost, which has not yet been recognized in periodic benefit cost.
| 2022 | 2021 | 2020 | ||||||||||||||||||||||||||||||||||||
| Pension | Healthcare | Pension | Healthcare | Pension | Healthcare | |||||||||||||||||||||||||||||||||
| benefits | & Life Ins. | benefits | & Life Ins. | benefits | & Life Ins. | |||||||||||||||||||||||||||||||||
| Amounts recognized in other comprehensive (income) loss: | ||||||||||||||||||||||||||||||||||||||
| Net actuarial (gain) loss | $ | ( | $ | ( | $ | ( | $ | $ | $ | |||||||||||||||||||||||||||||
| Prior service credit | ( | |||||||||||||||||||||||||||||||||||||
| Amortization of prior year service credit | ||||||||||||||||||||||||||||||||||||||
| Amortization of loss | ( | ( | ( | ( | ( | ( | ||||||||||||||||||||||||||||||||
| Total amount recognized | $ | ( | $ | ( | $ | ( | $ | $ | $ | |||||||||||||||||||||||||||||
The pension and postretirement healthcare and life programs experienced significant actuarial gains during the year ended December 31, 2022 due to the change in discount rate. This change was partially offset by lower than expected investment returns.
93
| 2022 | 2021 | 2020 | ||||||||||||||||||||||||||||||||||||
| Pension | Healthcare | Pension | Healthcare | Pension | Healthcare | |||||||||||||||||||||||||||||||||
| benefits | & Life Ins. | benefits | & Life Ins. | benefits | & Life Ins. | |||||||||||||||||||||||||||||||||
| Components of net periodic benefit cost: | ||||||||||||||||||||||||||||||||||||||
| Service cost | $ | $ | $ | $ | $ | $ | ||||||||||||||||||||||||||||||||
| Interest cost | ||||||||||||||||||||||||||||||||||||||
| Amortization of loss | ||||||||||||||||||||||||||||||||||||||
| Expected return on plan assets | ( | ( | ( | |||||||||||||||||||||||||||||||||||
| Amortization of prior service credit | ( | ( | ( | |||||||||||||||||||||||||||||||||||
| Net periodic benefit (expense) cost | $ | $ | $ | $ | $ | ( | $ | |||||||||||||||||||||||||||||||
Assumptions—Weighted-average assumptions used to determine the benefit obligations as of year-end 2022 and 2021 are:
| 2022 | 2021 | |||||||||||||||||||||||||
| Healthcare | Healthcare | |||||||||||||||||||||||||
| Pension benefits | & Life Ins. | Pension benefits | & Life Ins. | |||||||||||||||||||||||
| Discount rate | ||||||||||||||||||||||||||
| Expected long-term rate of return on plan assets | N/A | N/A | ||||||||||||||||||||||||
Weighted-average assumptions used to determine net periodic benefit cost for years ended December 31, 2022, January 1, 2022 and January 2, 2021:
| 2022 | 2021 | 2020 | ||||||||||||||||||||||||||||||||||||
| Healthcare | Healthcare | Healthcare | ||||||||||||||||||||||||||||||||||||
| Pension benefits | & Life Ins. | Pension benefits | & Life Ins. | Pension benefits | & Life Ins. | |||||||||||||||||||||||||||||||||
| Discount rate | ||||||||||||||||||||||||||||||||||||||
| Expected long-term rate of return on plan assets | N/A | N/A | N/A | |||||||||||||||||||||||||||||||||||
The expected long-term return on plan assets is based upon the Plans’ consideration of historical and forward-looking returns and the Company’s estimation of what a portfolio, with the target allocation described below, will earn over a long-term horizon. The discount rate is derived using the FTSE Above Median Pension Discount Curve.
The assumed health care cost trend rate for year end 2022 was 7.0 % grading to 4.46 % in 2042. As of year end 2021, the assumed trend rate was 7.0 % grading to 4.75 % in 2032. Assumed health care cost trend rates have a significant effect on the amounts reported for the Company’s healthcare and life insurance benefits plans.
Plan Assets—The defined benefit pension plans’ (the “Plans”) investment strategy is to minimize investment risk while generating acceptable returns. The Plans currently invest a relatively high proportion of the plan assets in fixed income securities, while the remainder is invested in equity securities, cash reserves and precious metals. The equity securities are diversified into funds with growth and value investment strategies. The target allocation for plan assets is as follows: equity securities—35 %; fixed income securities—55 %; cash reserves—5 %; alternatives—4 %; and precious metals—1 %. The Plans’ current investment allocations are within the tolerance of the target allocation. The Company had no Level 3 investments as of or for the years ended December 31, 2022 and January 1, 2022.
At year-end 2022 and 2021, the Plans’ assets were invested predominantly in fixed-income securities and publicly traded equities, but may be invested in other asset classes in the future subject to the parameters of the investment policy. The Plans’ investments in fixed-income assets include U.S. Treasury and U.S. agency securities and corporate bonds. The Plans’ investments in equity assets include U.S. and international securities and equity funds. The Company estimates the fair value of the Plans’ assets using various valuation techniques and, to the extent available, quoted market prices in active markets or observable market inputs. The descriptions and fair value methodologies for the Plans’ assets are as follows:
Fixed Income Securities—Corporate and government bonds are classified as Level 2 assets, as they are either valued at quoted market prices from observable pricing sources at the reporting date or valued based upon comparable securities with similar yields and credit ratings.
94
Equity Securities—Equity securities are valued at the closing market price reported on a U.S. exchange where the security is actively traded and are therefore classified as Level 1 assets.
Cash—The carrying amounts of cash approximate fair value due to the short-term maturity.
Precious Metals—Precious metals are valued at the closing market price reported on a U.S. exchange where the security is actively traded and are therefore classified as Level 1 assets.
The fair value of the Plans’ assets by asset class and fair value hierarchy level as of December 31, 2022 and January 1, 2022 are as follows:
| 2022 | ||||||||||||||||||||
| Quoted prices in active | ||||||||||||||||||||
| Total fair | markets for identical | Observable | ||||||||||||||||||
| value | assets (Level 1) | inputs (Level 2) | ||||||||||||||||||
| Fixed income securities: | ||||||||||||||||||||
| Intermediate—government | $ | $ | $ | |||||||||||||||||
| Intermediate—corporate | ||||||||||||||||||||
| Short-term—government | ||||||||||||||||||||
| Short-term—corporate | ||||||||||||||||||||
| International | ||||||||||||||||||||
| Equity securities: | ||||||||||||||||||||
| U.S. Large cap value | ||||||||||||||||||||
| U.S. Large cap growth | ||||||||||||||||||||
| U.S. Mid cap value | ||||||||||||||||||||
| U.S. Mid cap growth | ||||||||||||||||||||
| U.S. Small cap value | ||||||||||||||||||||
| U.S. Small cap growth | ||||||||||||||||||||
| International | ||||||||||||||||||||
| Emerging Markets | ||||||||||||||||||||
| Commodities Broad Basket | ||||||||||||||||||||
| Cash | ||||||||||||||||||||
| Total | $ | $ | $ | |||||||||||||||||
95
| 2021 | ||||||||||||||||||||
| Quoted prices in active | ||||||||||||||||||||
| Total fair | markets for identical | Observable | ||||||||||||||||||
| value | assets (Level 1) | inputs (Level 2) | ||||||||||||||||||
| Fixed income securities: | ||||||||||||||||||||
| Intermediate—government | $ | $ | $ | |||||||||||||||||
| Intermediate—corporate | ||||||||||||||||||||
| Short-term—government | ||||||||||||||||||||
| Short-term—corporate | ||||||||||||||||||||
| International | ||||||||||||||||||||
| Equity securities: | ||||||||||||||||||||
| U.S. Large cap value | ||||||||||||||||||||
| U.S. Large cap growth | ||||||||||||||||||||
| U.S. Mid cap value | ||||||||||||||||||||
| U.S. Mid cap growth | ||||||||||||||||||||
| U.S. Small cap value | ||||||||||||||||||||
| U.S. Small cap growth | ||||||||||||||||||||
| International | ||||||||||||||||||||
| Emerging Markets | ||||||||||||||||||||
| Commodities Broad Basket | ||||||||||||||||||||
| Cash | ||||||||||||||||||||
| Total | $ | $ | $ | |||||||||||||||||
Cash Flows—The Company does not expect to contribute to its pension plans during 2023 and expects to contribute $0.5 million to its postretirement healthcare and life insurance benefits plans.
The estimated benefit payments for each of the next five years and the five-year period thereafter are as follows:
| Pension | Healthcare and Life | |||||||||||||
| benefits | Insurance Benefits | |||||||||||||
| 2023 | $ | $ | ||||||||||||
| 2024 | ||||||||||||||
| 2025 | ||||||||||||||
| 2026 | ||||||||||||||
| 2027 | ||||||||||||||
| 2028 - 2032 | ||||||||||||||
Multiemployer Pension Plans— In 2018, through an acquisition, the Company assumed an obligation to contribute to a number of multiemployer defined benefit pension plans under the terms of collective-bargaining agreements that cover its union-represented employees. The risks of participating in multiemployer pension plans are different from single-employer plans. Assets contributed to a multiemployer plan by one employer may be used to provide benefits to employees of other participating employers. If a participating employer ceases contributing to the plan, the unfunded obligations of the plan are the responsibility of the remaining participating employers.
96
bargaining agreement(s) to which the plans are subject. There have been no significant changes that affect the comparability of 2022 and 2021 contributions.
| Expiration Date of | ||||||||||||||||||||||||||
| Pension Protection Act | FIP/RP Status | Contributions of Company | Collective- | |||||||||||||||||||||||
| Pension | EIN/ Pension | Zone Status | Pending/ | ($ in thousands) | Surcharge | Bargaining | ||||||||||||||||||||
| Trust Fund | Plan Number | 2022 | 2021 | Implemented | 2022 | 2021 | Imposed | Agreement | ||||||||||||||||||
| Construction Industry Laborers Pension Fund | 43-6060737/001 | Green - as of December 31, 2021 | Green - as of December 31, 2020 | None | $ | $ | No | 3/31/2026 | ||||||||||||||||||
| Operating Engineers Local 101 Pension Plan | 43-6059213/001 | Green - as of December 31, 2021 | Green - as of December 31, 2020 | None | No | 3/31/2026 | ||||||||||||||||||||
| Total Contributions | $ | $ | ||||||||||||||||||||||||
The Company was not listed as providing more than 5% of the total contributions for the Operating Engineers Local 101 Pension Plan or the Construction Industry Laborers Pension Fund for the plan years 2022 and 2021 per the plans' Forms 5500. As of the date of the filing of this annual report on Form 10-K, Forms 5500 were not available for the plan year ending December 31, 2022.
(15) Accrued Mining and Landfill Reclamation
The Company has asset retirement obligations arising from regulatory or contractual requirements to perform certain reclamation activities at the time that certain quarries and landfills are closed, which are primarily included in other noncurrent liabilities on the consolidated balance sheets. The current portion of the liabilities, $4.0 million and $7.4 million as of December 31, 2022 and January 1, 2022, respectively, is included in accrued expenses on the consolidated balance sheets. The total undiscounted anticipated costs for site reclamation as of December 31, 2022 and January 1, 2022 were $124.9 million and $112.4 million, respectively. The liabilities were initially measured at fair value and are subsequently adjusted for accretion expense, payments and changes in the amount or timing of the estimated cash flows. The corresponding asset retirement costs are capitalized as part of the carrying amount of the related long-lived asset and depreciated over the asset’s remaining useful life. The following table presents the activity for the asset retirement obligations for the years ended December 31, 2022 and January 1, 2022:
| 2022 | 2021 | |||||||||||||
| Beginning balance | $ | $ | ||||||||||||
| Acquired obligations | ||||||||||||||
| Change in cost estimate | ( | |||||||||||||
| Settlement of reclamation obligations | ( | ( | ||||||||||||
| Dispositions | ( | |||||||||||||
| Accretion expense | ||||||||||||||
| Ending balance | $ | $ | ||||||||||||
(16) Commitments and Contingencies
The Company is party to certain legal actions arising from the ordinary course of business activities. Accruals are recorded when the outcome is probable and can be reasonably estimated. While the ultimate results of claims and litigation cannot be predicted with certainty, management expects that the ultimate resolution of all current pending or threatened claims and litigation will not have a material effect on the Company’s consolidated financial position, results of operations or liquidity. The Company records legal fees as incurred.
In March 2018, we were notified of an investigation by the Canadian Competition Bureau (the “CCB”) into pricing practices by certain asphalt paving contractors in British Columbia, including Winvan Paving, Ltd. (“Winvan”). We believe the investigation is focused on time periods prior to our April 2017 acquisition of Winvan and we are cooperating with the CCB. Although we currently do not believe this matter will have a material adverse effect on our business, financial condition or results of operations, we are currently not able to predict the ultimate outcome or cost of the investigation.
97
Environmental Remediation and Site Restoration—The Company’s operations are subject to and affected by federal, state, provincial and local laws and regulations relating to the environment, health and safety and other regulatory matters. These operations require environmental operating permits, which are subject to modification, renewal and revocation. The Company regularly monitors and reviews its operations, procedures and policies for compliance with these laws and regulations. Despite these compliance efforts, risk of environmental liability is inherent in the operation of the Company’s business, as it is with other companies engaged in similar businesses and there can be no assurance that environmental liabilities or noncompliance will not have a material adverse effect on the Company’s consolidated financial condition, results of operations or liquidity.
Other—The Company is obligated under various firm purchase commitments for certain raw materials and services that are in the ordinary course of business. Management does not expect any significant changes in the market value of these goods and services during the commitment period that would have a material adverse effect on the financial condition, results of operations and cash flows of the Company. The terms of the purchase commitments generally approximate one year .
(17) Leases
We lease construction and office equipment, distribution facilities and office space. Leases with an initial term of 12 months or less, including month to month leases, are not recorded on the balance sheet. Lease expense for short-term leases is recognized on a straight line basis over the lease term. For lease agreements we have entered into or reassessed, we combine lease and nonlease components. While we also own mineral leases for mining operations, those leases are outside the scope of ASU No. 2016-2, Leases (Topic 842). Assets acquired under finance leases are included in property, plant and equipment.
Many of our leases include options to purchase the leased equipment. The depreciable life of assets and leasehold improvements are limited by the expected lease term, unless there is a transfer of title or purchase option reasonably certain of exercise. Our lease agreements do not contain any material residual value guarantees or material restrictive covenants. The components of lease expense were as follows:
98
| 2022 | 2021 | 2020 | |||||||||||||||
| Operating lease cost | $ | $ | $ | ||||||||||||||
| Variable lease cost | |||||||||||||||||
| Short-term lease cost | |||||||||||||||||
| Financing lease cost: | |||||||||||||||||
| Amortization of right-of-use assets | |||||||||||||||||
| Interest on lease liabilities | |||||||||||||||||
| Total lease cost | $ | $ | $ | ||||||||||||||
| 2022 | 2021 | ||||||||||||||||
| Supplemental balance sheet information related to leases: | |||||||||||||||||
| Operating leases: | |||||||||||||||||
| Operating lease right-of-use assets | $ | $ | |||||||||||||||
| Current operating lease liabilities | $ | $ | |||||||||||||||
| Noncurrent operating lease liabilities | |||||||||||||||||
| Total operating lease liabilities | $ | $ | |||||||||||||||
| Finance leases: | |||||||||||||||||
| Property and equipment, gross | $ | $ | |||||||||||||||
| Less accumulated depreciation | ( | ( | |||||||||||||||
| $ | $ | ||||||||||||||||
| $ | $ | ||||||||||||||||
| Total finance lease liabilities | $ | $ | |||||||||||||||
| 2022 | 2021 | ||||||||||||||||
| Weighted average remaining lease term (years): | |||||||||||||||||
| Operating leases | |||||||||||||||||
| Finance lease | |||||||||||||||||
| Weighted average discount rate: | |||||||||||||||||
| Operating leases | % | % | |||||||||||||||
| Finance leases | % | % | |||||||||||||||
| Maturities of lease liabilities, as of December 31, 2022, were as follows: | |||||||||||||||||
| Operating Leases | Finance Leases | ||||||||||||||||
| 2023 | $ | $ | |||||||||||||||
| 2024 | |||||||||||||||||
| 2025 | |||||||||||||||||
| 2026 | |||||||||||||||||
| 2027 | |||||||||||||||||
| Thereafter | |||||||||||||||||
| Total lease payments | |||||||||||||||||
| Less imputed interest | ( | ( | |||||||||||||||
| Present value of lease payments | $ | $ | |||||||||||||||
99
The Company has lease agreements associated with quarry facilities under which royalty payments are made. The payments are generally based on tons sold in a particular period; however, certain agreements have minimum annual payments. Royalty expense recorded in cost of revenue during the years ended December 31, 2022, January 1, 2022 and January 2, 2021 was $33.5 million, $34.8 million and $29.2 million, respectively. Minimum contractual commitments for the subsequent five years under royalty agreements are as follows:
| Royalty | |||||
| Agreements | |||||
| 2023 | $ | ||||
| 2024 | |||||
| 2025 | |||||
| 2026 | |||||
| 2027 | |||||
(18) Fair Value of Financial Instruments
Fair Value Measurements—Certain acquisitions made by the Company require the payment of contingent amounts of purchase consideration. These payments are contingent on specified operating results being achieved in periods subsequent to the acquisition and will only be made if earn-out thresholds are achieved. Contingent consideration obligations are measured at fair value each reporting period. Any adjustments to fair value are recognized in earnings in the period identified.
The fair value of contingent consideration as of December 31, 2022 and January 1, 2022 was:
| 2022 | 2021 | |||||||||||||
| Current portion of acquisition-related liabilities and Accrued expenses: | ||||||||||||||
| Contingent consideration | $ | $ | ||||||||||||
| Acquisition-related liabilities and Other noncurrent liabilities: | ||||||||||||||
| Contingent consideration | $ | $ | ||||||||||||
The fair value accounting guidance establishes the following fair value hierarchy that prioritizes the inputs used to measure fair value:
Level 1 — Quoted prices in active markets for identical assets and liabilities.
Level 2 — Observable inputs, other than quoted prices, for similar assets or liabilities in active markets.
Level 3 — Unobservable inputs, which includes the use of valuation models.
Financial Instruments—The Company’s financial instruments include debt and certain acquisition-related liabilities (deferred consideration and noncompete obligations). The carrying value and fair value of these financial instruments as of December 31, 2022 and January 1, 2022 were:
| December 31, 2022 | January 1, 2022 | |||||||||||||||||||||||||
| Fair Value | Carrying Value | Fair Value | Carrying Value | |||||||||||||||||||||||
| Level 1 | ||||||||||||||||||||||||||
| Long-term debt(1) | $ | $ | $ | $ | ||||||||||||||||||||||
| Level 3 | ||||||||||||||||||||||||||
| Current portion of deferred consideration and noncompete obligations(2) | ||||||||||||||||||||||||||
| Long term portion of deferred consideration and noncompete obligations(3) | ||||||||||||||||||||||||||
_____________________
(1)$5.1 million and $6.4 million was included in current portion of debt as of December 31, 2022 and January 1, 2022, respectively.
(2)Included in current portion of acquisition-related liabilities on the consolidated balance sheets.
(3)Included in acquisition-related liabilities on the consolidated balance sheets.
100
Level 1 fair values are used to value investments in publicly-traded entities and assumed obligations for publicly-traded long-term debt.
Level 2 fair values are typically used to value acquired receivables, inventories, machinery and equipment, land, buildings, deferred income tax assets and liabilities, liabilities for asset retirement obligations, environmental remediation and compliance obligations. Additionally, Level 2 fair values are typically used to value assumed contracts at other-than-market rates.
Level 3 fair values are used to value acquired mineral reserves and leased mineral interests and other identifiable intangible assets. The fair values of mineral reserves and leased mineral interests are determined using an excess earnings approach, which requires management to estimate future cash flows. The estimate of future cash flows is based on available historical information and forecasts determined by management, but is inherently uncertain. Key assumptions in estimating future cash flows include sales price, volumes and expected profit margins, net of capital requirements. The present value of the projected net cash flows represents the fair value assigned to mineral reserves and mineral interests. The discount rate is a significant assumption used in the valuation model and is based on the required rate of return that a hypothetical market participant would assume if purchasing the acquired business.
The Level 3 fair values of contingent consideration were based on projected probability-weighted cash payments and a 9.5 % discount rate, which reflects a market discount rate. Changes in fair value may occur as a result of a change in actual or projected cash payments, the probability weightings applied by the Company to projected payments or a change in the discount rate. Significant increases or decreases in any of these inputs in isolation could result in a lower, or higher, fair value measurement. There were no material adjustments to the fair value of contingent consideration in 2022 or 2021. The fair values of the deferred consideration and noncompete obligations were determined based on the cash payment terms in the purchase agreements and a discount rate reflecting the Company’s credit risk. The discount rate used is generally consistent with that used when the obligations were initially recorded.
Securities with a maturity of three months or less are considered cash equivalents and the fair value of these assets approximates their carrying value.
(19) Segment Information
The Company has three
The West and East segments have several acquired subsidiaries that are engaged in various activities including quarry mining, aggregate production and contracting. The Cement segment is engaged in the production of Portland cement. Assets employed by each segment include assets directly identified with those operations. Corporate assets consist primarily of cash, property, plant and equipment for corporate operations and other assets not directly identifiable with a reportable business segment. The accounting policies applicable to each segment are consistent with those used in the consolidated financial statements.
The following tables display selected financial data for the Company’s reportable business segments as of and for the years ended December 31, 2022, January 1, 2022 and January 2, 2021:
| 2022 | 2021 | 2020 | ||||||||||||||||||
| Revenue*: | ||||||||||||||||||||
| West | $ | $ | $ | |||||||||||||||||
| East | ||||||||||||||||||||
| Cement | ||||||||||||||||||||
| Total revenue | $ | $ | $ | |||||||||||||||||
______________________
* Intercompany sales are immaterial and the presentation above only reflects sales to external customers.
101
| 2022 | 2021 | 2020 | ||||||||||||||||||
| Income from operations before taxes | $ | $ | $ | |||||||||||||||||
| Interest expense | ||||||||||||||||||||
| Depreciation, depletion and amortization | ||||||||||||||||||||
| Accretion | ||||||||||||||||||||
| Loss on debt financings | ||||||||||||||||||||
| Tax receivable agreement expense (benefit) | ( | ( | ||||||||||||||||||
| Loss (gain) on sale of businesses | ( | ( | ||||||||||||||||||
| Non-cash compensation | ||||||||||||||||||||
| Other | ( | |||||||||||||||||||
| Total Adjusted EBITDA | $ | $ | $ | |||||||||||||||||
| Total Adjusted EBITDA by Segment: | ||||||||||||||||||||
| West | $ | $ | $ | |||||||||||||||||
| East | ||||||||||||||||||||
| Cement | ||||||||||||||||||||
| Corporate and other | ( | ( | ( | |||||||||||||||||
| Total Adjusted EBITDA | $ | $ | $ | |||||||||||||||||
| 2022 | 2021 | 2020 | ||||||||||||||||||
| Purchases of property, plant and equipment | ||||||||||||||||||||
| West | $ | $ | $ | |||||||||||||||||
| East | ||||||||||||||||||||
| Cement | ||||||||||||||||||||
| Total reportable segments | ||||||||||||||||||||
| Corporate and other | ||||||||||||||||||||
| Total purchases of property, plant and equipment | $ | $ | $ | |||||||||||||||||
| 2022 | 2021 | 2020 | ||||||||||||||||||
| Depreciation, depletion, amortization and accretion: | ||||||||||||||||||||
| West | $ | $ | $ | |||||||||||||||||
| East | ||||||||||||||||||||
| Cement | ||||||||||||||||||||
| Total reportable segments | ||||||||||||||||||||
| Corporate and other | ||||||||||||||||||||
| Total depreciation, depletion, amortization and accretion | $ | $ | $ | |||||||||||||||||
| 2022 | 2021 | 2020 | ||||||||||||||||||
| Total assets: | ||||||||||||||||||||
| West | $ | $ | $ | |||||||||||||||||
| East | ||||||||||||||||||||
| Cement | ||||||||||||||||||||
| Total reportable segments | ||||||||||||||||||||
| Corporate and other | ||||||||||||||||||||
| Total | $ | $ | $ | |||||||||||||||||
102
SUMMIT MATERIALS, LLC AND SUBSIDIARIES
CONSOLIDATED FINANCIAL STATEMENTS
The consolidated financial statements and notes thereto for Summit Materials, LLC and subsidiaries are included as Exhibit 99.1 to this Annual Report on Form 10-K and are incorporated by reference herein.
ITEM 9. CHANGES IN AND DISAGREEMENTS WITH ACCOUNTANTS ON ACCOUNTING AND FINANCIAL DISCLOSURE.
None.
ITEM 9A. CONTROLS AND PROCEDURES.
Disclosure Controls and Procedures
Summit Inc. and Summit LLC maintain disclosure controls and procedures (as such term is defined in Rules 13a-15(e) and 15d-15(e) under the Exchange Act, that are designed to ensure that information required to be disclosed in Summit Inc.’s reports under the Exchange Act, is recorded, processed, summarized and reported within the time periods specified in the SEC’s rules and forms, and that such information is accumulated and communicated to Summit Inc.’s and Summit LLC’s management, including its Chief Executive Officer and Chief Financial Officer, as appropriate, to allow timely decisions regarding required disclosure. Any controls and procedures, no matter how well designed and operated, can provide only reasonable, not absolute, assurance of achieving the desired control objectives. Summit Inc.’s and Summit LLC’s management, with the participation of its Chief Executive Officer and Chief Financial Officer, has evaluated the effectiveness of Summit Inc.’s disclosure controls and procedures as of December 31, 2022. Based upon that evaluation, Summit Inc.’s and Summit LLC’s Chief Executive Officer and Chief Financial Officer concluded that, as of December 31, 2022, Summit Inc.’s and Summit LLC’s disclosure controls and procedures were effective to accomplish their objectives at the reasonable assurance level.
103
Management’s Report on Internal Control Over Financial Reporting
The Stockholders of Summit Materials, Inc.:
The management of Summit Materials, Inc. and Summit Materials, LLC is responsible for establishing and maintaining adequate internal control over financial reporting and for its assessment of the effectiveness of internal control over financial reporting as defined in Rules 13a-15(f) and 15d-15(f) under the Exchange Act. Our internal control system was designed to provide reasonable assurance to our management and board of directors regarding the preparation and fair presentation of published financial statements.
Because of its inherent limitations, internal control over financial reporting may not prevent or detect misstatements. Also, projections of any evaluation of effectiveness to future periods are subject to the risk that controls may become inadequate because of changes in conditions, or that the degree of compliance with the policies or procedures may deteriorate.
Our management evaluated the effectiveness of our internal control over financial reporting as of December 31, 2022. In making this evaluation, we used the criteria set forth by the Committee of Sponsoring Organizations of the Treadway Commission (COSO) in Internal Control – Integrated Framework (2013). Based on our evaluation we believe that, as of December 31, 2022 our internal control over financial reporting is effective based on those criteria.
KPMG LLP has issued an audit report on the effectiveness of Summit Materials, Inc.’s internal control over financial reporting. The KPMG LLP report immediately follows this report. This annual report does not include an attestation report of Summit Materials, LLC’s independent registered public accounting firm regarding internal control over financial reporting. Management’s report was not subject to attestation by Summit Materials, LLC’s registered public accounting firm pursuant to rules of the Securities and Exchange Commission applicable to “non-accelerated filers.”
| /s/ Anne P. Noonan | /s/ Brian J. Harris | ||||
| Chief Executive Officer | Chief Financial Officer | ||||
104
Report of Independent Registered Public Accounting Firm
To the Stockholders and Board of Directors
Summit Materials, Inc.:
Opinion on Internal Control Over Financial Reporting
We have audited Summit Materials, Inc. and subsidiaries' (the Company) internal control over financial reporting as of December 31, 2022, based on criteria established in Internal Control – Integrated Framework (2013) issued by the Committee of Sponsoring Organizations of the Treadway Commission. In our opinion, the Company maintained, in all material respects, effective internal control over financial reporting as of December 31, 2022, based on criteria established in Internal Control – Integrated Framework (2013) issued by the Committee of Sponsoring Organizations of the Treadway Commission.
We also have audited, in accordance with the standards of the Public Company Accounting Oversight Board (United States) (PCAOB), the consolidated balance sheets of the Company as of December 31, 2022 and January 1, 2022, the related consolidated statements of operations, comprehensive income, cash flows, and changes in stockholders’ equity for each of the fiscal years in the three-year period ended December 31, 2022, and the related notes (collectively, the consolidated financial statements), and our report dated February 16, 2023 expressed an unqualified opinion on those consolidated financial statements.
Basis for Opinion
The Company’s management is responsible for maintaining effective internal control over financial reporting and for its assessment of the effectiveness of internal control over financial reporting, included in the accompanying Management's Report on Internal Control Over Financial Reporting. Our responsibility is to express an opinion on the Company’s internal control over financial reporting based on our audit. We are a public accounting firm registered with the PCAOB and are required to be independent with respect to the Company in accordance with the U.S. federal securities laws and the applicable rules and regulations of the Securities and Exchange Commission and the PCAOB.
We conducted our audit in accordance with the standards of the PCAOB. Those standards require that we plan and perform the audit to obtain reasonable assurance about whether effective internal control over financial reporting was maintained in all material respects. Our audit of internal control over financial reporting included obtaining an understanding of internal control over financial reporting, assessing the risk that a material weakness exists, and testing and evaluating the design and operating effectiveness of internal control based on the assessed risk. Our audit also included performing such other procedures as we considered necessary in the circumstances. We believe that our audit provides a reasonable basis for our opinion.
Definition and Limitations of Internal Control Over Financial Reporting
A company’s internal control over financial reporting is a process designed to provide reasonable assurance regarding the reliability of financial reporting and the preparation of financial statements for external purposes in accordance with generally accepted accounting principles. A company’s internal control over financial reporting includes those policies and procedures that (1) pertain to the maintenance of records that, in reasonable detail, accurately and fairly reflect the transactions and dispositions of the assets of the company; (2) provide reasonable assurance that transactions are recorded as necessary to permit preparation of financial statements in accordance with generally accepted accounting principles, and that receipts and expenditures of the company are being made only in accordance with authorizations of management and directors of the company; and (3) provide reasonable assurance regarding prevention or timely detection of unauthorized acquisition, use, or disposition of the company’s assets that could have a material effect on the financial statements.
Because of its inherent limitations, internal control over financial reporting may not prevent or detect misstatements. Also, projections of any evaluation of effectiveness to future periods are subject to the risk that controls may become inadequate because of changes in conditions, or that the degree of compliance with the policies or procedures may deteriorate.
| /s/ KPMG LLP | |||||
| Denver, Colorado | |||||
| February 16, 2023 | |||||
105
Changes in Internal Control over Financial Reporting
There was no change in Summit Materials, Inc.’s or Summit Materials, LLC’s internal control over financial reporting that occurred during their last fiscal quarter that has materially affected, or is reasonably likely to materially affect, their internal control over financial reporting.
ITEM 9B. OTHER INFORMATION.
None.
ITEM 9C. DISCLOSURE REGARDING FOREIGN JURISDICTIONS THAT PREVENT INSPECTIONS
Not applicable.
PART III
ITEM 10. DIRECTORS, EXECUTIVE OFFICERS AND CORPORATE GOVERNANCE
The information required by this item is incorporated by reference to our definitive proxy statement with respect to the 2023 annual meeting of stockholders to be filed with the SEC within 120 days of the fiscal year ended December 31, 2022 (the “2023 Proxy Statement”), except that certain information regarding our executive officers called for by Item 401(b) and (e) of Regulation S-K has been included in Part 1 of this Annual Report on Form 10-K.
ITEM 11. EXECUTIVE COMPENSATION
The information set forth under the heading “Our Pay” in our 2023 Proxy Statement is incorporated herein by reference.
ITEM 12. SECURITY OWNERSHIP OF CERTAIN BENEFICIAL OWNERS AND MANAGEMENT AND RELATED STOCKHOLDER MATTERS.
The information required to be set forth herein pursuant to Item 403 of Regulation S–K is included in the section entitled “Our Stockholders—Holdings of Major Stockholders” in our 2023 Proxy Statement is incorporated herein by reference. The information regarding certain Company equity compensation plans called for by Item 201(d) of Regulation S–K is set forth below.
Securities Authorized for Issuance Under Equity Compensation Plans
As of December 31, 2022 | ||||||||||||||||||||
| Number of securities | Number of securities | |||||||||||||||||||
| to be issued upon | Weighted-average | remaining available | ||||||||||||||||||
| exercise of | exercise price of | for future issuance | ||||||||||||||||||
| outstanding options | outstanding options | under equity | ||||||||||||||||||
| and rights | and rights | compensation plans | ||||||||||||||||||
| Equity compensation plan approved by stockholders(1) | 17,500,000 | $ | 19.75 | 7,192,873 | ||||||||||||||||
_______________________
(1)Relates only to the Omnibus Incentive Plan detailed below.
In connection with our IPO, the board of directors and our then sole voting stockholder adopted the Omnibus Incentive Plan under which 13,500,000 shares of common stock were reserved. At the May 2021 Annual Meeting, stockholders approved an increase to the number of shares of the Company’s Class A common stock that may be issued under the Plan by 4,000,000 shares of Class A common stock to a total of 17,500,000. The Omnibus Incentive Plan provides for the granting of stock options, stock appreciation rights, restricted stock, restricted stock units and other stock-based and performance compensation awards to eligible employees, officers, directors, consultants and advisors of the Company. If an award under the Omnibus Incentive Plan terminates, lapses or is settled without the payment of the full number of shares subject to the award, the undelivered shares may be granted again under the Omnibus Incentive Plan. As of December 31, 2022, there were no equity compensation plans not approved by stockholders of Summit Inc.
106
ITEM 13. CERTAIN RELATIONSHIPS AND RELATED TRANSACTIONS, AND DIRECTOR INDEPENDENCE.
The information required to be set forth herein is included in the sections entitled “Certain Relationships and Related Person Transactions” in our 2023 Proxy Statement is incorporated herein by reference.
ITEM 14. PRINCIPAL ACCOUNTANT FEES AND SERVICES.
The information provided under the heading “Item 3—Ratification of Appointment of KPMG” included in our 2023 Proxy Statement is incorporated herein by reference.
PART IV
ITEM 15. EXHIBITS AND FINANCIAL STATEMENT SCHEDULES.
1. Financial statements:
Financial statements for Summit Inc. and Summit LLC are included under Item 8 of this report, which incorporates Exhibit 99.1 with respect to Summit LLC.
2. Financial statement schedules:
Financial statement schedules are omitted because of the absence of conditions under which they are required or because the required information is provided in the financial statements or notes thereto.
3. Exhibits:
| 2.1 | |||||
| 2.2 | |||||
| 3.1 | |||||
| 3.2 | |||||
| 3.3 | |||||
| 3.4 | |||||
| 4.1 | |||||
| 4.2 | |||||
| 4.3 | |||||
| 4.4 | |||||
| 4.5 | |||||
107
| 10.1 | |||||
| 10.2 | |||||
| 10.3 | |||||
| 10.4 | |||||
| 10.5+ | |||||
| 10.6+ | |||||
| 10.7+ | |||||
| 10.8+ | |||||
| 10.9+ | |||||
| 10.10+ | |||||
| 10.11+ | |||||
| 10.12+ | |||||
| 10.13 | |||||
| 10.14 | |||||
| 10.15 | |||||
| 10.16 | |||||
| 10.17 | |||||
108
| 10.18 | |||||
| 10.19 | |||||
| 10.20 | |||||
| 10.21 | |||||
| 10.22 | |||||
| 10.23 | |||||
| 10.24 | |||||
| 10.25 | |||||
| 10.26+ | |||||
| 10.27+ | |||||
| 10.28+ | |||||
| 10.29 | |||||
109
| 10.30+ | |||||
| 10.31+ | |||||
| 10.32+ | |||||
| 10.33+ | |||||
| 10.34+ | |||||
| 10.35+ | |||||
| 10.36+ | |||||
| 10.37+ | |||||
| 10.38+ | |||||
| 10.39+ | |||||
| 10.40+ | |||||
| 10.41+ | |||||
| 10.42+ | |||||
| 10.43+ | |||||
| 10.44+* | |||||
| 21* | |||||
| 23.1* | |||||
| 23.2* | |||||
| 31.1* | |||||
| 31.2* | |||||
| 31.3* | |||||
| 31.4* | |||||
| 32.1** | |||||
| 32.2** | |||||
| 32.3** | |||||
| 32.4** | |||||
| 95.1* | |||||
110
| 99.1* | |||||
| 101.1NS* | Inline XBRL Instance Document | ||||
| 101.SCH* | Inline XBRL Taxonomy Extension Schema Document. | ||||
| 101.CAL* | Inline XBRL Taxonomy Extension Calculation Linkbase Document. | ||||
| 101.DEF* | Inline XBRL Taxonomy Extension Definition Linkbase Document. | ||||
| 101.LAB* | Inline XBRL Taxonomy Extension Label Linkbase Document. | ||||
| 101.PRE* | Inline XBRL Taxonomy Extension Presentation Linkbase Document. | ||||
| 104.1* | Cover Page Interactive Data File (embedded with the Inline XBRL document). | ||||
* Filed herewith
** Furnished herewith
+ Indicates management or compensating plan or arrangement
The agreements and other documents filed as exhibits to this report are not intended to provide factual information or other disclosure other than with respect to the terms of the agreements or other documents themselves, and you should not rely on them for that purpose. In particular, any representations and warranties made by us in these agreements or other documents were made solely within the specific context of the relevant agreement or document and may not describe the actual state of affairs as of the date they were made or at any other time.
ITEM 16. FORM 10-K SUMMARY
None.
111
SIGNATURES
Pursuant to the requirements of Section 13 or 15(d) of the Securities Exchange Act of 1934, the registrants have duly caused this report to be signed on their behalf by the undersigned, thereunto duly authorized.
| SUMMIT MATERIALS, INC. | |||||||||||
| SUMMIT MATERIALS, LLC | |||||||||||
| Date: | February 16, 2023 | By: | /s/ Anne P. Noonan | ||||||||
| Anne P. Noonan | |||||||||||
| Chief Executive Officer | |||||||||||
| (Principal Executive Officer) | |||||||||||
Pursuant to the requirements of the Securities Act of 1934, this report has been signed by the following persons in the capacities indicated on the 16th day of February 2023.
| Signature | Title | |||||||
| /s/ Anne P. Noonan | President and Chief Executive Officer; Director of Summit Materials, Inc. (Principal Executive Officer) | |||||||
| Anne P. Noonan | ||||||||
| /s/ Brian J. Harris | Chief Financial Officer (Principal Financial and Accounting Officer) | |||||||
| Brian J. Harris | ||||||||
| /s/ Joseph S. Cantie | Director of Summit Materials, Inc. | |||||||
| Joseph S. Cantie | ||||||||
| /s/ Anne M. Cooney | Director of Summit Materials, Inc. | |||||||
| Anne M. Cooney | ||||||||
| /s/ Susan A. Ellerbusch | Director of Summit Materials, Inc. | |||||||
| Susan A. Ellerbusch | ||||||||
| /s/ Howard L. Lance | Director of Summit Materials, Inc. | |||||||
| Howard L. Lance | ||||||||
| /s/ John R. Murphy | Director of Summit Materials, Inc. | |||||||
| John R. Murphy | ||||||||
| /s/ Tamla Oates-Forney | Director of Summit Materials, Inc. | |||||||
| Tamla Oates-Forney | ||||||||
| /s/ Anne K. Wade | Director of Summit Materials, Inc. | |||||||
| Anne K. Wade | ||||||||
| /s/ Steven H. Wunning | Director of Summit Materials, Inc. | |||||||
| Steven H. Wunning | ||||||||
112
ATTACHMENTS / EXHIBITS
XBRL TAXONOMY EXTENSION SCHEMA DOCUMENT
XBRL TAXONOMY EXTENSION CALCULATION LINKBASE DOCUMENT
XBRL TAXONOMY EXTENSION DEFINITION LINKBASE DOCUMENT
XBRL TAXONOMY EXTENSION LABEL LINKBASE DOCUMENT
Serious News for Serious Traders! Try StreetInsider.com Premium Free!
You May Also Be Interested In
- Meta shares dip on softer Q2 revenue guidance, elevated AI spending plans
- ETHARA: FORMULA 1 ETIHAD AIRWAYS ABU DHABI GRAND PRIX PROMISES BIGGEST RACE WEEKEND YET THIS DECEMBER AS SPORT CONTINUES ITS EXPONENTIAL GLOBAL GROWTH
- Rendeavour expands high-speed internet access to local communities around Tatu City, Kenya
Create E-mail Alert Related Categories
SEC FilingsSign up for StreetInsider Free!
Receive full access to all new and archived articles, unlimited portfolio tracking, e-mail alerts, custom newswires and RSS feeds - and more!
