

Form 10-K PLANTRONICS INC /CA/ For: Apr 02
 Tweet
Tweet Share
ShareUNITED STATES
SECURITIES AND EXCHANGE COMMISSION
Washington, D.C. 20549
FORM 10-K
(MARK ONE)
| ANNUAL REPORT PURSUANT TO SECTION 13 OR 15(d) OF THE SECURITIES EXCHANGE ACT OF 1934 | |||||
For the fiscal year ended April 2 , 2022
OR
| TRANSITION REPORT PURSUANT TO SECTION 13 OR 15(d) OF THE SECURITIES EXCHANGE ACT OF 1934 | |||||
For the transition period from ___________ to _____________
Commission file number: 1-12696

(Exact name of registrant as specified in its charter)
| (State or other jurisdiction of incorporation or organization) | (I.R.S. Employer Identification Number) | |||||||
(Address of principal executive offices)
(zip code)
(831 ) 420-3002
(Registrant's telephone number, including area code)
Securities registered pursuant to Section 12(b) of the Act:
| Title of each class | Trading Symbol | Name of each exchange on which registered | ||||||||||||
Securities registered pursuant to Section 12(g) of the Act:
NONE
(Title of Class)
Indicate by check mark if the Registrant is a well-known seasoned issuer, as defined in Rule 405 of the Securities Act.
Indicate by check mark if the Registrant is not required to file reports pursuant to Section 13 or Section 15(d) of the Act.
Yes ☐ No ☒
Indicate by check mark whether the Registrant (1) has filed all reports required to be filed by Section 13 or 15(d) of the Securities Exchange Act of 1934 during the preceding 12 months (or for such shorter period that the Registrant was required to file such reports), and (2) has been subject to such filing requirements for the past 90 days. Yes ☒ No ☐
Indicate by check mark whether the Registrant has submitted electronically every Interactive Data File required to be submitted and posted pursuant to Rule 405 of Regulation S-T during the preceding 12 months (or for such shorter period that the Registrant was required to submit such files). Yes ☒ No ☐
Indicate by check mark whether the Registrant is a large accelerated filer, an accelerated filer, a non-accelerated filer, or a smaller reporting company. See the definitions of “large accelerated filer,” “accelerated filer,” and “smaller reporting company” in Rule 12b-2 of the Exchange Act. (Check one).
| ☒ | Accelerated Filer | ☐ | |||||||||
| Non-accelerated Filer | ☐ | Smaller Reporting Company | |||||||||
| Emerging Growth Company | |||||||||||
If an emerging growth company, indicate by check mark if the registrant has elected not to use the extended transition period for complying with any new or revised financial accounting standards provided pursuant to Section 13(a) of the Exchange Act. ☐
Indicate by check mark whether the registrant has filed a report on and attestation to its management’s assessment of the effectiveness of its internal control over financial reporting under Section 404(b) of the Sarbanes-Oxley Act (15 U.S.C. 7262(b)) by the registered public accounting firm that prepared or issued its audit report. ☒
Indicate by check mark whether the Registrant is a shell company (as defined in Rule 12b-2 of the Act). Yes ☐ No ☒
The aggregate market value of the common stock held by non-affiliates of the Registrant, based upon the closing price of $25.88 for shares of the Registrant's common stock on October 1, 2021, the last trading day of the Registrant’s most recently completed second fiscal quarter as reported by the New York Stock Exchange, was approximately $1,089,670,087 . In calculating such aggregate market value, shares of common stock owned of record or beneficially by officers, directors, and persons known to the Registrant to own more than five percent of the Registrant's voting securities as of October 1, 2021 (other than such persons of whom the Registrant became aware only through the filing of a Schedule 13G filed with the Securities and Exchange Commission) were excluded because such persons may be deemed to be affiliates. This determination of affiliate status is for purposes of this calculation only and is not conclusive.
As of May 23, 2022, 43,699,939 shares of common stock were outstanding.
DOCUMENTS INCORPORATED BY REFERENCE
Portions of the Registrant's Proxy Statement for its 2022 Annual Meeting of Stockholders are incorporated by reference into Part III of this Form 10-K. Such proxy statement will be filed with the Securities and Exchange Commission within 120 days of the registrant’s fiscal year ended April 2, 2022.
Plantronics, Inc.
FORM 10-K
For the Year Ended April 2, 2022
TABLE OF CONTENTS
| Part I. | Page | ||||||||||
| Item 1. | |||||||||||
| Item 1A. | |||||||||||
| Item 1B. | |||||||||||
| Item 2. | |||||||||||
| Item 3. | |||||||||||
| Item 4. | |||||||||||
| Part II. | |||||||||||
| Item 5. | |||||||||||
| Item 6. | |||||||||||
| Item 7. | |||||||||||
| Item 7A. | |||||||||||
| Item 8. | |||||||||||
| Item 9. | |||||||||||
| Item 9A. | |||||||||||
| Item 9B. | |||||||||||
| Item 9C. | |||||||||||
| Part III. | |||||||||||
| Item 10. | |||||||||||
| Item 11. | |||||||||||
| Item 12. | |||||||||||
| Item 13. | |||||||||||
| Item 14. | |||||||||||
| Part IV. | |||||||||||
| Item 15. | |||||||||||
| Item 16. | |||||||||||
Plantronics, Poly, the Propeller design, the Poly logo, and Polycom are trademarks of Plantronics, Inc.
All other trademarks are the property of their respective owners.
PART I
Plantronics, Inc.'s (“Poly,” “Company,” “we,” “our,” or “us”) fiscal year ends on the Saturday closest to the last day of March. The years ended April 2, 2022 (“Fiscal Year 2022”), April 3, 2021 (“Fiscal Year 2021”), and March 28, 2020 (“Fiscal Year 2020”) had 52, 53, and 52 weeks, respectively. This Annual Report on Form 10-K is filed with respect to our Fiscal Year 2022.
CERTAIN FORWARD-LOOKING INFORMATION
This Annual Report on Form 10-K contains forward-looking statements within the meaning of Section 27A of the Securities Act of 1933, as amended, and Section 21E of the Securities Exchange Act of 1934, as amended, including statements relating to our intentions, beliefs, projections, outlook, analyses or current expectations that are subject to many risks and uncertainties. All of our forward-looking statements are subject to risks and uncertainties relating to our pending merger (the “Merger”) with HP, Inc. (“HP”) pursuant to an Agreement and Plan of Merger (the “Merger Agreement”) dated March 25, 2022, and corresponding impacts on our business, including (i) that the consummation of the Merger with HP is contingent upon the satisfaction of a number of conditions, including stockholder and regulatory approvals, that may be outside of our or HP’s control and that we and HP may be unable to satisfy or obtain or that may delay the consummation of the Merger or cause the parties to abandon the Merger; (ii) while the Merger is pending, we are subject to business uncertainties and contractual restrictions that could harm our financial condition, operating results, and business; (iii) uncertainty about the Merger may adversely affect relationships with our customers, suppliers and employees, whether or not the Merger is completed; (iv) as a result of the Merger, our current and prospective employees could experience uncertainty about their future with us, which may result in key employees departing because of issues relating to such uncertainty or a desire not to remain with HP following the completion of the Merger; (v) litigation has arisen and could continue to arise in connection with the Merger, which could be costly, prevent consummation of the Merger, divert management’s attention and otherwise materially harm our business; and (vi) the ability to complete the Merger is subject to the receipt of consents and approvals from government entities, which may impose conditions that could have an adverse effect on us or could cause us and/or HP to abandon the Merger. Additionally, such forward-looking statements and the associated risks and uncertainties include, but are not limited to: (i) our beliefs with respect to the length and severity of the COVID-19 pandemic, and its impact across our businesses, our operations and global supply chain, including, our expectations that the virus has caused, and will continue to cause, a shift to a hybrid work environment and that the elevated demand we have experienced in certain product lines, including our Video and Voice devices, will continue over the long term; (ii) risks related to global supply chain disruptions, including continued uncertainty and potential impact on future quarters relating to a shortage of adequate component supply, including integrated circuits and manufacturing capacity, long lead times for raw materials and components, increased costs to us and increased pass-through costs to our customers, increased purchase commitments and a delay in our ability to fulfill orders, including as a result of Russia's conflict with Ukraine, all of which has had, and may continue to have, an adverse impact on our business and operating results and which could continue to negatively affect our profitability and/or market share; (iii) expectations related to our ability to manage profitability and improve margins in light of supply chain challenges, including our efforts to implement productivity improvements in our Tijuana manufacturing facility, while making investments for long-term growth, including investments in strategic alliances and/or acquisitions, in light of the supply chain challenges; (iv) our expectations regarding growth objectives related to our strategic initiatives designed to expand our product and service offerings, including our expectations related to increased demand for our solutions to facilitate hybrid working in and out of offices for our enterprise customers, as well as our expectations related to building strategic alliances and key partnerships with providers of collaboration tools and platforms to drive revenue growth and market share, including expectations related to our expansion of our presence in China; (v) our belief that we will continue to experience increased customer and partner demand in collaboration endpoints, and that we will be able to design new product offerings to meet changes in demand due to a global hybrid work environment; (vi) expectations related to our ability to fulfill the backlog generated by supply constraints and to timely supply the number of products to fulfill current and future customer demand in a timely manner to satisfy perishable demand; (vii) risks associated with our dependence on manufacturing operations conducted in our own facility in Tijuana, Mexico and through contract manufacturers, original design manufacturers, and suppliers to manufacture our products, to timely obtain sufficient quantities of materials and/or finished products of acceptable quality, at acceptable prices, and in the quantities necessary for us to meet critical schedules for the delivery of our own products and services and fulfill our anticipated customer demand; (viii) risks associated with our ability to secure critical components from sole source suppliers or identify alternative suppliers and/or buy component parts on the open market or completed goods in quantities sufficient to meet our requirements on a timely basis, affecting our ability to deliver products and services to our customers; (ix) risks related to increased cost of goods sold, including increased freight and other costs associated with expediting shipment and delivery of high-demand products to key markets in order to meet customer demand; (x) risks associated with passing on increased costs through price increases to customers; (xi) the impact if global or regional economic conditions deteriorate further, on our customers and/or partners, including increased demand for pricing accommodations, delayed payments, delayed deployment plans, insolvency or other issues which may increase credit losses; (xii) risks associated with significant and/or abrupt changes in product demand which increases the complexity of management’s evaluation of potential excess or obsolete inventory; (xiii) expectations related to our Services reportable segment revenues, particularly as we introduce next-generation, less complex, product solutions, or as companies shift from on premises to work from home options for their workforce, which have resulted and may continue to result in decreased demand for our professional, installation and/or managed service offerings; (xiv) expectations related to our efforts to drive sales and
1
sustainable profitable revenue growth, to improve our profitability and cash flow, and accelerate debt reduction and de-levering; (xv) risks associated with forecasting sales and procurement demands, which are inherently difficult, particularly with continuing uncertainty in regional and global economic conditions; (xvi) our expectations regarding our ability to control costs, streamline operations and successfully implement our various cost-reduction activities and realize anticipated cost savings under such cost-reduction initiatives; (xvii) expectations relating to our financial projections, particularly as economic uncertainty, including, without limitation, uncertainty related to the continued impact of COVID-19, the current constraints in our ability to source key components for our products, continued uncertainty in the macro-economic climate and other external factors, puts further pressure on management judgments used to develop prospective financial information; (xviii) expectations related to United States generally accepted accounting principles (GAAP) and non-GAAP financial results for the full Fiscal Year 2022, including total net revenues, adjusted earnings before interest, tax, depreciation, and amortization (EBITDA), tax rates, intangibles amortization, diluted weighted average shares outstanding, and diluted earnings per share (EPS); (xix) our forecast and estimates with respect to tax matters, including expectations with respect to the valuation of our intellectual property or expectations regarding utilization of our deferred tax assets; and (xx) our expectations regarding pending and potential future litigation, in addition to other matters discussed in this Annual Report on Form 10-K that are not purely historical data. Such forward-looking statements are based on current expectations and assumptions and are subject to risks and uncertainties that may cause actual results to differ materially from the forward-looking statements. Factors that could cause actual results and events to differ materially from such forward-looking statements are included, but not limited to, those discussed in Part I, “Item 1A. Risk Factors” of this Annual Report on Form 10-K and other documents we have filed with the Securities and Exchange Commission (“SEC”). We undertake no obligation to update or revise publicly any forward-looking statements, whether as a result of new information, future events, or otherwise, except as required by applicable law. Given these risks and uncertainties, readers are cautioned not to place undue reliance on such forward-looking statements.
ITEM 1. BUSINESS
ACQUISITION BY HP INC.
On March 25, 2022, Poly entered into an Agreement and Plan of Merger (the “Merger Agreement”) with HP Inc. (“HP”) and Prism Subsidiary Corp. (“Merger Sub”), a wholly-owned subsidiary of HP, providing for the acquisition of Poly in an all-cash transaction by way of a merger of Merger Sub with and into Poly (the “Merger”), with Poly continuing as a wholly-owned subsidiary of HP. The descriptions of the Merger Agreement and the transactions contemplated thereby contained in this Annual Report are summaries only and are qualified in their entirety by reference to the full text of the Merger Agreement, which is attached as Annex A to the definitive proxy statement on Schedule 14A filed by us with the SEC on May 17, 2022 (the “Definitive Proxy Statement”).
The Merger Agreement and transactions contemplated by the Merger Agreement were approved by Poly's Board of Directors (the “Board”), which further resolved to recommend that Poly stockholders vote to adopt and approve the Merger Agreement. Under the Merger Agreement, at the effective time of the Merger, each issued and outstanding share of Poly’s common stock (except as otherwise set forth in the Merger Agreement) will be canceled and automatically converted into the right to receive $40.00 in cash, without interest and less any applicable withholding taxes.
Completion of the Merger is subject to the satisfaction of certain terms and conditions set forth in the Merger Agreement, including (i) adoption of the Merger Agreement by the requisite affirmative vote of our stockholders; (ii) the absence of any temporary restraining order, preliminary or permanent injunction or other judgment or order issued by a court of competent jurisdiction preventing, prohibiting or making illegal the consummation of the Merger; and (iii) the expiration or termination of the waiting period applicable to the Merger under the United States Hart-Scott Rodino Antitrust Improvements Act of 1976, as amended without the imposition of a burdensome effect (as defined in the Merger Agreement), and the obtaining or making of all consents, approvals and filings required under the competition laws of China, Colombia, the European Union and Mexico and the foreign direct investment law of France, in each case, without the imposition of a burdensome effect. The Merger is expected to close in calendar year 2022, subject to the satisfaction of applicable conditions. Upon consummation of the Merger, Poly will no longer have publicly listed or traded shares, nor will it be a reporting company under the SEC's rules and regulations.
COMPANY BACKGROUND
Poly is a leading global communications technology company that designs, manufactures, and markets integrated communications and collaboration solutions for professionals. We offer a comprehensive selection of premium audio and video products designed to work in an era where work is no longer a place and enterprise work forces are increasingly distributed. Our products and services are designed and engineered to connect people with high fidelity and incredible clarity. They are professional-grade, easy to use, and work seamlessly with major video and audio-conferencing platforms.
2
Our major product categories are Headsets, Voice, Video, and Services. Headsets include wired and wireless communication headsets; Voice includes open Session Initiation Protocol (“SIP”) and native ecosystem desktop phones, as well as conference room phones and speakerphones; Video includes conferencing solutions and peripherals, such as cameras, speakers, and microphones; Services includes a broad portfolio of offerings including video interoperability, maintenance and troubleshooting support for our solutions, as well as professional, hosted, and managed services that are grounded in our deep expertise aimed at helping our customers achieve their collaboration goals. Additionally, our cloud management and analytics software enables Information Technology (“IT”) administrators to configure and update firmware, monitor device usage, troubleshoot, and gain a deep understanding of user behavior.
All of our solutions are designed to integrate seamlessly with a wide range of Unified Communications & Collaboration (“UC&C”), Unified Communication as a Service (“UCaaS”), and Video as a Service (“VaaS”) platforms, allowing our customers the flexibility to use the communications platform of their choice.
We sell our products through a well-developed global network of distributors and channel partners, including value-added resellers, integrators, direct marketing resellers, and service providers, as well as through both traditional and online retailers, office supply distributors, and e-commerce channels. We have well-established distribution channels in the Americas, Europe, Middle East, Africa, and Asia Pacific, where use of our products is widespread.
The Company was originally founded and incorporated as Plantronics in 1961 and became a public company in 1994. In March 2019, the Company changed the name under which it markets itself to Poly. The Company is incorporated in the State of Delaware and was listed on the New York Stock Exchange (“NYSE”) originally under the ticker symbol “PLT.” The Company changed our symbol on the NYSE from "PLT" to "POLY" effective at the open of market trading on May 24, 2021.
Our principal executive office is located at 345 Encinal Street, Santa Cruz, California. Our telephone number is (831) 420-3002. Our Company website is www.poly.com.
In the Investor Relations section of our website, we provide free access to the following filings: Annual Reports on Form 10-K, Quarterly Reports on Form 10-Q, Current Reports on Form 8-K, and all amendments to those reports filed or furnished pursuant to Section 13(a) or 15(d) of the Exchange Act. This access is provided directly or through a link on our website shortly after these documents are electronically filed with, or furnished to, the SEC. In addition, documents regarding our corporate governance, code of conduct, and the charters of the standing committees of our Board are also accessible in the Investor Relations section of our website.
MARKET INFORMATION
General Industry Background
Poly operates predominantly in the unified communications industry and focuses on the design, manufacture, and distribution of headsets, voice, video, and content sharing solutions, as well as a comprehensive line of support and service solutions to ensure customer success. We develop enhanced communication products to work wherever and however work happens: offices, contact centers, and remote work environments, connecting to tools such as open SIP desktop phones, PCs, Macs, and a variety of mobile devices. We offer our products and services under the  , Plantronics and Polycom brands.
, Plantronics and Polycom brands. We believe the end market for professional-grade communications equipment is no longer “home” or “office.” It is “anywhere” and “everywhere,” as the digital transformation of the enterprise continues, creating a corresponding increase in the volume and sophistication of communications requirements, especially high-quality video and audio. Existing trends toward remote and hybrid work and the increasing adoption of video communications have dramatically accelerated, and the number of communications usage scenarios and product needs have permanently multiplied:
•The COVID-19 pandemic has served as a critical catalyst to change working habits, worldwide, and acted as a massive accelerant to the digital transformation already reshaping the working world.
•We believe this shift will be permanent. Gartner research estimates that “by 2024, remote workers will represent 30% of all employees worldwide… to number nearly 600 million.” Similarly, Frost & Sullivan analysis suggests post-pandemic, the number of remote workers will be six times greater, creating a massive demand for meeting technologies.
3
•The importance of durable solutions offering high-fidelity connectivity that are easy to use, work anywhere and everywhere, and are compatible with multiple communications platforms, is paramount to our customers.
•Looking ahead, the expansion of both communications applications (e.g., telehealth, government and civil services, education, professional and financial services) and the capabilities of the infrastructure supporting these applications (e.g., 5G network deployments, cloud computing, collaboration software) creates a structural tailwind we believe will create conditions for long-term, sustainable, and durable demand for our products.
•Additionally, the shift to hybrid work models is accelerating the transition of enterprise customers from on-premises to cloud-based call control platforms, which represents a significant market opportunity for Poly.
Our strategy is to offer best-in-class communications and collaboration solutions to meet the needs of customers ranging from the largest companies and governments in the world to individual professionals. Recent product launches and our product roadmap reflect this, as does our marketing and distribution strategy. We believe we are uniquely positioned as the UC&C ecosystem partner of choice through our strategic partnerships, support of open standards, innovative technology, multiple delivery modes, and customer-centric go-to-market capabilities, while at the same time we are establishing the distribution channels necessary to engage customers at the individual level.
We leverage state-of-the-art technologies in our solutions that can be easily used with our strategic partners’ tools and communication platforms in both personal and office settings. The increased adoption of technologies such as UC&C, Bluetooth, Voice over Internet Protocol (“VoIP”), Digital Signal Processing (“DSP”), Digital Enhanced Cordless Telecommunications (“DECT”), and Video-as-a-Service (“VaaS”), each of which is described below, has contributed to increased demand for our solutions:
•UC&C is the integration of voice, data, chat, and video-based communications systems enhanced with software applications and Internet Protocol (IP) networks. It includes more traditional unified communications consisting of on-premise IP telephony, such as e-mail, instant messaging, presence information, audio and video conferencing, and unified messaging; and more modern team collaboration consisting of cloud-based persistent chat and team workspaces, integrated UC and application integrations; as well as browser-based online meetings consisting of integrated audio, video, and web conferencing. UC&C seeks to provide seamless connectivity and user experience for enterprise workers regardless of their location and environment, improving overall business efficiency and providing more effective collaboration among an increasingly distributed workforce.
•Bluetooth wireless technology is a short-range communications protocol intended to replace the cables connecting portable and fixed devices while maintaining high levels of security. The key features of Bluetooth technology are ubiquity, low power, and low cost. The Bluetooth specification defines a uniform structure for a wide range of devices to connect and communicate with each other. Bluetooth standard has achieved global acceptance such that any Bluetooth enabled device, almost anywhere in the world, can connect to other Bluetooth enabled devices in proximity.
•VoIP is a technology that allows a person to communicate using a broadband internet connection instead of a regular (or analog) telephone line. VoIP converts the voice signal into a digital signal that travels over the internet or other packet-switched networks and then converts it back at the other end so that the caller can speak to anyone with another VoIP connection or a regular (or analog) phone line.
•DSP is a technology that delivers acoustic protection and optimal sound quality through noise reduction, echo cancellation, and other algorithms which improve transmission quality.
•DECT is a wireless communications technology that optimizes audio quality, lowers interference with other wireless devices, and digitally encrypts communication for heightened call security.
•VaaS is the delivery of multiparty, or point-to-point, videoconferencing capabilities over an IP network by a managed service provider.
Competitive Strengths
We believe we have a clear understanding of the future of business communications, and we have positioned our company to serve that future: the entirety of our offering, from hardware to software and services, is engineered to meet the communications demands that every enterprise, around the world, will have. We believe the combination of our products and services create the conditions that will allow us to be successful:
4
•Increasingly distributed, flexible, and digital work forces need competitively priced, well-designed, professional-grade communications equipment. We have expanded our product offering to provide a complete set of solutions - headsets, voice, and video - to the hybrid worker outfitting a remote workplace, as evidenced by the launch of the “Studio P Series” line of personal video conferencing solutions.
•Our products directly address “hardware-for-anywhere” demand, offering equipment that can be set up and used easily by anyone, in home offices or remote workplaces, without consuming time from IT departments. And our tools are platform agnostic. Our certified Microsoft Teams, Zoom, and Google desktop phone and video products deliver a native experience that fully integrate which each platform's collaboration features. Our customers don’t “fear the link” in their calendar, because our equipment works seamlessly across multiple platforms, and delivers professional results every time.
•The breadth and depth of our product portfolio makes us a one-stop outfitter for our customers. Our products are sophisticated, with innovative technologies to improve all aspects of collaborative communications: our webcams include finely-tuned optics for brilliant colors and incredible clarity regardless of environment, our audio products feature technologies including noise-canceling microphones, DSP, HD Voice, acoustic fencing and more, and we offer a line of fully integrated devices.
•Our products are supported by a global customer service organization. Poly is one of the few vendors with a complete portfolio of products that are supported by a global service organization designed to meet the needs of the largest and most demanding governments and enterprise customers. Dependable and reliable communications equipment is critical to any and every enterprise, and we provide enterprise-grade support.
Product Segment
Our audio and video solutions are designed to meet the needs of individuals in home offices (from front-line staff to executives), open offices workspaces (such as cubicles for knowledge workers and contact centers), meeting rooms (from huddle rooms to boardrooms), mobile workers (using laptops, mobile phones, and tablets in or out of the office), back-offices (for management, monitoring and analytics of our systems), and other highly specialized applications, such as tele-medicine, tele-education and remote management.
We serve these markets through our product categories listed below:
•Headsets - Within our Headsets category, we offer a broad range of solutions, including corded and wireless versions, stereo and mono, with or without active noise cancellation, and connection options such as USB, Bluetooth, and DECT. Our headsets are ergonomically designed to allow users to wear them for many hours without fatigue or discomfort. Certain models have incorporated advanced artificial intelligence and machine learning software to provide features such as acoustic fencing and noise blocking capabilities.
•Voice - Our Voice portfolio include open SIP desktop phones, conference phones, and personal speakerphones. Our certified Microsoft Teams, Zoom, and Google desktop phones deliver a native experience that fully-integrates with each platform’s collaboration features. Our desktop phones provide crystal-clear voice quality to users regardless of location. The Trio line of conference phones is a collaboration hub that has a modular approach to high quality audio, video and content sharing solution for rooms of all sizes. Audio-only versions of the Trio are available in multiple sizes and price points. Trio supports native Zoom, Microsoft Teams and Skype for Business interfaces, as well as connectivity to multiple popular voice and video platforms.
•Video - Our Video portfolio consists of our new Studio P Series, a family of professional-grade personal video devices for remote work, the Studio USB video bar for small room deployments, the Studio X video bars and G7500, which share a common Poly platform and can run native applications, like Zoom, Microsoft Teams, and Google, without the need for an external PC. These video solutions represent a complete portfolio designed to meet the needs of workers and IT administrators configuring solutions for a variety of applications from the home office to the boardroom. In addition, we continue to sell our RealPresence Group Series solutions, a portfolio of high-performance, integrator-ready video conferencing systems that also power our immersive telepresence video conferencing systems.
For customers that prefer on-premises video infrastructure, our RealPresence Clariti solution is a powerful collaboration software platform through which customers can host audio, video, and content collaboration sessions connecting any device from anywhere. The platform also provides best-in-class interoperability, allowing any standards-based device to connect into Microsoft Teams without having to be replaced.
5
Services Segment
Poly offers a complete suite of services that are designed to ensure our customers and partners can make their modern communications equipment work seamlessly. Our full range of service solutions include professional, managed, and cloud services. Our customers can mix and match different service levels to have the right level of assistance and expertise where and when needed. We provide these services directly, as well as through our channel partners globally. Poly’s services smooth the critical path of our customers' business processes, helping us forge stronger customer relationships. Our services solutions help our customers achieve their business goals, maximize their use of communications and collaboration solutions to enable employee productivity, and deliver a differentiated customer experience.
•Support Services - In order to keep UC&C solutions operating continuously, Poly provides maintenance services that include technical assistance center support, software upgrades and updates, parts exchange, on-site assistance, and direct access to engineers for real-time resolution. We also offer an online support portal for customers and a support community where customers can share information and access support 24 hours a day.
•Professional Services - Poly’s full suite of professional services enables customers to effectively plan, deploy, and optimize their communications solutions in a UC&C environment. With Poly’s offerings, we and our channel partners help customers each step of the way to more effectively leverage UC&C solutions to transform their businesses.
•Managed Services - Our managed services help customers maximize their collaboration investments. Working directly with customers or with our partners to jointly deliver services, our offerings allow customers to outsource day-to-day technology management responsibilities to our team of experts who can provide turn-key solutions as a strategic method to improve operations and accelerate a return on technology investments.
•Cloud Services - Our cloud services enable IT administrators to configure devices in advance, monitor during usage, troubleshoot, and perform quick updates. Poly Lens is our next generation cloud-based service that combines seamless management and updating tools with powerful insight into how Poly devices are being used to offer greater control and visibility to IT departments. Poly Lens supports the Poly G7500 and Studio X family of video bars, Studio P Series of personal video devices, Sync family of personal speakerphones, VVX and CCX families of desktop phones, Trio C60 conference phone, as well as a variety of popular headsets.
•Training Services - On-going training services for those customers and partners who prefer to self-manage their deployments.
FOREIGN OPERATIONS
In Fiscal Years 2022, 2021, and 2020, total net revenues outside the U.S. accounted for approximately 54%, 57%, and 52%, respectively, of our total net revenues. Total net revenues derived from foreign sales are generally subject to additional risks, such as fluctuations in exchange rates, increased tariffs, the imposition of other trade restrictions or barriers, adverse global economic conditions, and potential currency restrictions. In Fiscal Year 2022, consolidated total net revenues were favorably impacted by fluctuations in exchange rates resulting in an increase of approximately $11.9 million (net of the effects of hedging).
We continue to engage in hedging activities to limit our transaction and economic exposures, and to mitigate our exchange rate risks. We manage our economic exposure by hedging a portion of our anticipated Euro (“EUR”) and British Pound Sterling (“GBP”) denominated sales and our Mexican Peso (“MXN”) denominated expenditures, which together constitute the most significant portion of our currency exposure. In addition, we manage our balance sheet exposure by hedging EUR and GBP denominated cash, accounts receivable, and accounts payable balances. Excess foreign currencies not required for local operations are converted into U.S. Dollars (“USD”). While our existing hedges cover a certain amount of exposure for Fiscal Year 2023, long-term strengthening of the USD relative to the currencies of other countries in which we sell may have a material adverse impact on our financial results. In addition, our results may be adversely impacted by future changes in foreign currency exchange rates relative to original hedging contracts, which are generally secured over a 12-month period. See further discussion on our business risks associated with foreign operations under the risk titled, “We are exposed to differences and frequent fluctuations in foreign currency exchange rates, which may adversely affect our revenues, gross profit, and profitability” within “Item 1A. Risk Factors” in this Annual Report on Form 10-K.
6
Further information regarding our foreign operations, as required by Item 101(d) of Regulation S-K, can be found in Note 18, Segment Reporting and Geographic Information, of the accompanying notes to the consolidated financial statements included within “Part II. Item 8. Financial Statements and Supplementary Data” of this Annual Report on Form 10-K.
COMPETITION
We compete broadly in the UC&C market, where we have multiple competitors (depending on the product line) on a global basis. These competitors include Avaya Inc., Aver Information, Inc., Cisco Systems, Inc., DTEN, EPOS Group A/S, GN Group, Grandstream Networks, Inc., Huawei Technologies Co. Ltd., Huddly, Logitech International S.A., Neatframe, Inc., Vaddio, LLC, Yamaha Corporation/Revolabs, Inc., Yealink Network Technology Co. Ltd., and others. In some cases, we also cooperate and partner with these companies in programs and various industry initiatives. The market for our products is competitive and some of our competitors have greater financial resources than we do, as well as more substantial production, marketing, engineering, and other capabilities to develop, manufacture, market, and sell their products.
Our strategy of offering a best-in-class complete portfolio of UC&C Headset, Voice and Video solutions faces challenges from competitors, who can also create end-to-end device and service offerings, as well as low-cost competitors in specific categories, or other industry players, who are potentially able to develop unique technology or compete in a specific geography.
Some of our partners resell our maintenance and support services, while others sell their own branded services. To the extent that channel partners sell their own services, these partners compete with us; however, they typically purchase maintenance contracts from us to support these services. As we expand our professional services offering, we may compete more directly with partners in the future.
We believe the principal factors to be successful and competitive in each of the markets we serve are as follows:
•Understanding emerging trends and new communication technologies, such as UC&C and VaaS, and our ability to react quickly to the opportunities they provide
•Reliable supply chain to meet peak demands
•Alliances and integration/compatibility with major UC&C vendors
•Ability to design, manufacture, and sell products that deliver on performance, style, ease-of-use, comfort, features, sound quality, interoperability, simplicity, price, and reliability
•Ability to create and monetize software solutions that provide management and analytics and allow business to improve IT and employee performance through insights derived from our analytics
•Brand name recognition and reputation
•Superior global customer service, support, and warranty terms
•Global reach, including effective and efficient distribution channels
We believe our products and strategy enable us to compete effectively based on these factors.
RESEARCH AND DEVELOPMENT
The success of our new products is dependent on several factors, including identifying and designing products that meet anticipated market demand before it has developed and as it matures, timely development, and introduction of these products, cost-effective manufacturing, quality and durability, acceptance of new technologies, and general market acceptance of the products we develop. See further discussion regarding our business risks associated with our research and development under the risk titled, “We face risks associated with developing and marketing our products, including new product development and new product lines” within “Item 1A. Risk Factors” in this Annual Report on Form 10-K.
We conduct most of our research and development with an in-house staff and a limited use of contractors.
During Fiscal Year 2022, we developed and introduced innovative products that enabled us to better address changing customer demands and emerging market trends. Our goal is to bring the right products to customers at the right time, utilizing best-in-class development processes.
The products we develop require significant technological knowledge and the ability to rapidly develop the products in intensely competitive and transforming markets. We believe our extensive technological knowledge and portfolio of intellectual property gives us a competitive advantage. We furthermore continually strive to improve the efficiency of our development processes through, among other things, strategic architecting, common platforms, and increased use of software and test tools.
7
SALES AND DISTRIBUTION
We maintain a worldwide sales force to provide ongoing global customer support and service. To support our partners in the enterprise market and their customers' needs, we have well-established, two-tiered distribution networks.
Our global channel network includes enterprise distributors, direct and indirect resellers, retailers, network and systems integrators, service providers, wireless carriers, and mass merchants.
Our global channel network resells our commercial headsets, voice, and video endpoint products and related solutions and services. As we evolve into new markets and product categories, we expect to build new go-to-market models that best serve our end user customers.
In addition, we have built a strong foundation of alliance partners, which allow existing and future distribution and reseller partners to sell into Microsoft, Zoom, Google, and other service provider environments. Our commercial distribution channel maintains an inventory of our products. Our distribution of specialty products includes retail, government programs, customer service, hospitality and healthcare professionals. Poly branded headsets are sold through retailers to corporate customers, small businesses, and individuals who use them for a variety of personal and professional purposes.
Our commercial distributors and retailers represent our first and second largest sales channels in terms of total net revenues, respectively. Two customers, Ingram Micro Group and ScanSource, accounted for 25.0% and 18.4%, respectively, of total net revenues in Fiscal Year 2022. Two customers, Ingram Micro Group and ScanSource, accounted for 19.3% and 19.0%, respectively, of total net revenues in Fiscal Year 2021. Two customers, ScanSource and Ingram Micro Group, accounted for 19.8% and 17.3%, respectively, of total net revenues in Fiscal Year 2020.
Some of our products may also be purchased directly from our website at www.poly.com.
We continue to evaluate our logistics processes and implement new strategies to further reduce our transportation costs and improve lead-times to customers. Currently, we have distribution centers in the following locations:
•Tijuana, Mexico, which provides logistics services for products shipped to customers in the U.S., Canada, and Latin America regions
•Laem Chabang, Thailand, which provides logistics services for products shipped to customers in the Asia Pacific region, excluding Mainland China
•Prague, Czech Republic, which provides logistics services for products shipped to customers in the Europe, Africa and Middle East regions
•Suzhou, China, which provides logistics services for products shipped to customers in Mainland China
•San Diego, United States, which provides logistics services for products shipped to customers in the Americas region
With respect to the above locations, Thailand and the Czech Republic are third-party distribution centers. We operate the distribution centers in Mexico, China and the U.S.
BACKLOG
As a result of the COVID-19 pandemic and resulting global shift to a hybrid work environment, we experienced an increase in demand and backlog, which was compounded by the effects of recent global supply-chain constraints. However, the backlog of unfulfilled orders is subject to rescheduling and in some cases may be subject to cancellation, especially as we manage through supply-chain constraints, including shortages in key components, such as semiconductor chips, and COVID-19.
MANUFACTURING AND SOURCES OF MATERIALS
Poly relies on our facility in Tijuana, Mexico and various original design and contract manufacturers in Asia to meet our manufacturing needs.
We source components for our products primarily from suppliers in Asia, Mexico, and the U.S., including semiconductor chips, electrical and mechanical components, and sub-assemblies. For most of our hardware products, we have existing alternate or
8
dual sources of supply or such sources are readily available. However, we do depend on sole sources for certain of our hardware products.
The combination of our manufacturing and distribution capabilities enables Poly to optimize labor and material costs, adapt to changing trade and tax considerations, strengthen the resilience of our supply chain, and enhance our ability to respond to customer needs.
For a further discussion of the business risks associated with our manufacturing and sources of materials see the risk titled, “Disruptions in our supply chain, including the inability of our own manufacturing facilities and those of our contract manufacturers, original design manufacturers, suppliers and sub-suppliers, to provide and/or timely deliver sufficient quantities of key component parts and/or finished products, has adversely impacted, and may continue to adversely impact, our ability to fulfill customer demand which, in turn, has and may continue to adversely impact our growth, business, reputation and financial condition” within “Item 1A. Risk Factors” and “Part II. Item 7. Management's Discussion and Analysis of Financial Condition and Results of Operations” in this Annual Report on Form 10-K.
INTELLECTUAL PROPERTY
We obtain patent protection for our technologies when we believe it is commercially appropriate. As of April 2, 2022, we had over 2,000 worldwide utility and design patents in force, expiring between calendar years 2022 and 2047.
We intend to continue to capture rights to our intellectual property by seeking patents on our inventions and protecting trademarks and other IP rights as appropriate. Success will depend, in part, on our ability to obtain patents and preserve other intellectual property rights covering function, manufacture, and design of our products before the U.S. Patent and Trademark Office and a variety of international jurisdictions. We own trademark registrations in the U.S. and in a number of other countries, as well as the names of many of our products and product features. We currently have pending and issued U.S. and foreign trademark applications in connection with our Poly brand name and certain new products and product features. We may seek copyright protection when and where we believe appropriate. We also own a number of domain name registrations and intend to seek more, as business needs require. We further endeavor to protect our trade secrets and other proprietary information through comprehensive security measures, including agreements with our employees, consultants, customers, and suppliers. See further discussion of our business risks associated with intellectual property under the risks titled “Our intellectual property rights could be infringed on by others” and “Patents, copyrights, trademarks, and trade secrets are owned by third parties that may make claims or commence litigation based on allegations of infringement or other violations of intellectual property rights” within “Item 1A. Risk Factors” in this Annual Report on Form 10-K.
GOVERNMENTAL REGULATIONS
As a public company with global operations, we are subject to various federal, state, local, and foreign laws and regulations that involve matters central to our business. These laws and regulations, which may differ among jurisdictions, include, among others, those related to financial and other disclosures, accounting standards, privacy and data protection, intellectual property, corporate governance, tax, government contracting, trade, antitrust, employment, immigration and travel, import/export, anti-corruption, consumer protection, national security, and environmental regulatory compliance. Many of these laws and regulations are still evolving and could be interpreted or applied in ways that could limit our business or require us to make certain fundamental and potentially detrimental changes to the products and services we offer. For example, the introduction of new products or services in our existing markets and the expansion of our business to other countries may subject us to additional laws and regulations, among others, resulting from the need to obtain additional licenses and approvals to conduct our businesses as envisioned. The processes by which regulatory approvals are obtained from the U.S. and foreign regulatory authorities to market and sell our products are complex, and may require a number of years, depending upon the type, complexity, and novelty of the product candidate, and involve the expenditure of substantial resources for research, development, and testing. Additionally, from time to time, we are also subject to a wide range of reporting requirements, certifications and compliance as prescribed by various federal and state governmental agencies. Expenditures relating to such regulations are made in the normal course of our business and are neither material nor place us at any competitive disadvantage. We do not currently expect that compliance with such laws will require us to make material additional expenditures, however, there is no assurance that existing or future laws and regulations applicable to our operations, products, and services will not have a material adverse effect on our business.
We are subject to various domestic and international anti-corruption laws, such as the U.S. Foreign Corrupt Practices Act and the U.K. Bribery Act, as well as other similar anti-bribery and anti-kickback laws and regulations. These laws and regulations generally prohibit companies and their intermediaries from making improper payments to non-U.S. officials for the purpose of
9
obtaining or retaining business. Violations of the Foreign Corrupt Practices Act or other anti-corruption laws or export control, customs, or economic sanctions laws may result in severe criminal or civil sanctions and penalties.
We also are subject to provisions of the Dodd-Frank Wall Street Reform and Consumer Protection Act intended to improve transparency and accountability concerning the supply of certain minerals originating from the conflict zones of the Democratic Republic of the Congo or adjoining countries. We incur costs to comply with the disclosure requirements of this law and other costs relating to the sourcing and availability of minerals used in our products.
We are also subject to laws and regulations governing data privacy in the U.S. and other jurisdictions, such as the General Data Protection Regulation (“GDPR”) in the European Union. Our customers can use certain of our product offerings that provide product management and analytics, such as Poly Lens, that collect, use, and store certain personally identifiable information (“PII”) regarding a variety of individuals in connection with their operations. National, state, and local governments and agencies in the countries in which we or our customers operate have adopted, are considering adopting, or may adopt laws and regulations regarding the collection, use, storage, transfer, processing, protection, and disclosure of PII obtained from individuals. Privacy and data protection laws are particularly stringent, and the costs of compliance with and other burdens imposed by such laws, regulations, and standards, or any alleged or actual violation, may limit the use and adoption of our products and services. Further, complying with privacy laws, regulations, and other obligations relating to privacy, data protection, and information security have caused and will continue to cause us to incur substantial operational costs and may require us to periodically modify our data handling practices. Moreover, compliance may impact demand for our offerings and force us to bear the burden of more onerous obligations in our contracts. Non-compliance could result in proceedings against us by governmental entities or others, could result in substantial fines or other liability, and may otherwise impact our business, financial condition, and operating results.
Our operations also are subject to numerous stringent and complex laws and regulations governing health and safety aspects of our operations, or otherwise relating to human health and environmental protection. In addition to environmental and worker safety regulations, we are subject to regulation by numerous other governmental regulatory agencies, including the U.S. Department of Labor and other state, local, and international bodies regulating worker rights and labor conditions. In addition, we are subject to certain requirements to contribute to retirement funds or other benefit plans and laws in some jurisdictions in which we operate restrict our ability to dismiss employees. Failure to comply with these laws or regulations or to obtain or comply with permits may result in the assessment of administrative, civil and criminal penalties, imposition of remedial or corrective action requirements, and the imposition of injunctions to prohibit certain activities or force future compliance.
Also, we are subject to a variety of laws and regulations relating to import and export controls. Regulations limiting or banning sales from or into certain countries, including China, or to certain companies, have impacted our ability to transact business. These laws and regulations are complex and may change or develop over time, sometimes with limited notice. We may incur significant expenditures in future periods related to compliance, which could restrict our business operations. For example, we are subject to the regulations of the U.S. and certain other jurisdictions in selling or shipping our products and technology outside the U.S. and to foreign nationals, including tariffs, trade protection measures, import or export licensing requirements, sanctions, and other trade barriers, such as U.S. Export Administration regulations and “Entity List” restrictions imposed by the Bureau of Industry and Security (“BIS”) of the U.S. Department of Commerce. In this regard, the U.S. government recently imposed significant new tariffs on China related to the importation of certain product categories following the U.S. Trade Representative’s Section 301 investigation. In addition, effective June 29, 2020, BIS tightened export controls with respect to goods, software, and technology, including increasing the licensing requirements and due diligence expectations that apply to trade with, China, Russia, and Venezuela, when “military end users” or “military end uses” are involved. This rule expands the scope of the licensing requirement by redefining “military end use” more broadly and by increasing the number of products subject to the restriction. In addition, the White House, the Department of Commerce, and other executive branch agencies have implemented additional restrictions and may implement still further restrictions that would affect conducting business with certain Chinese companies. We cannot predict whether these rules and restrictions will be implemented and acted upon by the Biden administration, or modified, overturned, or vacated by legal action. Although we continue to work with our vendors to mitigate our exposure to current or potential tariffs, there can be no assurance that we will be able to offset any increased costs.
The trend in environmental regulation has been to impose increasingly stringent restrictions and limitations on activities that may impact the environment, and thus, any changes in environmental laws and regulations or in enforcement policies that result in more stringent and costly handling, storage, transport, disposal, or remediation requirements could have a material adverse effect on our operations and financial position. See “Environmental, Social and Governance Matters” below for a description of the federal, state, local, and foreign environmental regulations to which we are subject.
For more information on risks related to the laws and regulations to which we are subject, see the relevant discussions throughout “Item 1A, Risk Factors” of this Annual Report on Form 10-K.
10
ENVIRONMENTAL, SOCIAL, AND GOVERNANCE MATTERS
We are committed to creating the right kind of long-term impact in the world, not just because it matters to our employees, our customers, and our investors, but because it is part of who we are as a company. We know we are part of a larger global community and make decisions as good stewards of the earth, its resources, and its people.
Our Corporate and Social Responsibility (“CSR”) strategy focuses on the Environmental, Social and Governance (“ESG”) issues that we believe will positively impact our stakeholders and wider society and drive value for our business. The strategy focuses on three key priorities: delivering low carbon solutions, keeping people safe and secure, and being a destination employer. These three pillars are underpinned by strong governance and supported by our deeply ingrained culture, values, and behaviors.
Environmental and Climate Change
We are subject to various federal, state, local, and foreign environmental laws and regulations, including those regulations that are administered by the Occupational Safety and Health Administration of the U.S. Department of Labor and the U.S. Environmental Protection Agency, and other regulations governing the use, discharge, and disposal of hazardous substances in the ordinary course of our manufacturing process. We believe that our current manufacturing and other operations comply, in all material respects, with applicable environmental laws and regulations. We are required to comply, and we believe we are currently in compliance, with the European Union and other Directives on the Restrictions of the use of Certain Hazardous Substances in Electrical and Electronic Equipment (“RoHS”) and on Waste Electrical and Electronic Equipment (“WEEE”) requirements. Additionally, we believe we are compliant with the RoHS initiatives in China and Korea; however, it is possible that future environmental legislation may be enacted, or current environmental legislation may be interpreted to create an environmental liability with respect to our facilities, operations, or products. Moreover, in the U.S., our products are regulated by California's Proposition 65, which requires that clear and reasonable warnings be given to consumers who are exposed to certain chemicals. See further discussion of our business risks associated with environmental legislation under the risk titled, “We are subject to environmental laws and regulations that expose us to a number of risks and could result in significant liabilities and costs” within “Item 1A. Risk Factors” of this Annual Report on Form 10-K.
We also recognize that climate change is a global emergency that requires urgent action, and we may be subject to new and future requirements relating to climate change laws and regulations. Our California corporate offices have historically experienced, and are projected to continue to experience, climate-related events including wildfires and air quality impacts, power shut-offs associated with wildfire prevention, drought and water scarcity, and warmer temperatures. Although we maintain crisis management and disaster response plans, such events could make it difficult or impossible for us to deliver products and services to our customers and cause us to incur substantial expense.
Our goal is to deliver absolute emissions reductions across Poly, our products, and for our customers. Our new Low Carbon strategy reflects our commitments to measuring, monitoring, and reducing emissions from both our direct (Scopes 1 and 2) and indirect (Scope 3) operations. We are reporting on our progress and performance in reducing energy use and operational carbon emissions, which has been third-party verified. Our goals for energy usage and direct operational emissions reduction targets are as follows: 100% renewable energy used across all global sites by 2030; Carbon neutral emissions for scopes 1 and 2 by 2035; and net zero carbon emissions for scope 3 by 2050.
We also are committed to sustainable product design and perform life-cycle assessments (LCA’s), which include detailed greenhouse gas (“GHG”) emissions profiles for each key stage of development on three of our most popular products. We align these assessments to best practice guidelines and standards including PAS 2050:2011, a publicly available specification that provides a recognized method for assessing the life cycle GHG emissions of products. We use the findings to identify emissions hotspots and improve design where possible.
COVID-19 has been a critical catalyst to changing working habits, and a massive accelerant to the digital transformation already reshaping the working world. It has transformed the way people communicate, dramatically reducing the need for travel in the process. Hundreds of thousands of customers, companies, and institutions around the world use Poly products to come together and collaborate as if they were in the same place. Not only does this save them time and money, but it drastically reduces their impacts on climate change from travel.
11
Human Capital Management
The future success of our company depends on our ability to engage, attract, hire, motivate, grow, retain, and further develop top talent, including highly skilled technical, management, sales, and marketing personnel. Competition for such talent is intense and the salary, benefits, and other costs to employ the right people may make it difficult to achieve our financial goals. Consequently, our management team, with the support of our Board of Directors (“Board”), have increased focus and efforts in this area, including efforts to raise our employees' ambitions and inspire them to do more and go further, striving to make Poly an inclusive, diverse, accessible, and safe workplace with opportunities for our employees to grow and develop in their careers, supported by contemporary working practices and strong compensation, benefits, and health and wellness programs.
As of April 2, 2022, we employed approximately 6,500 people worldwide, including approximately 2,700 manufacturing/direct labor employees at our manufacturing facility in Tijuana, Mexico. Our employees are based in 39 different countries around the world. Our global work forces consist of diverse, highly skilled talent at all levels. During Fiscal Year 2022, our turnover rate was approximately 26%1.
Inclusion, Diversity, Education and Awareness (IDEA)
We embrace different cultures and perspectives, believing in respect for all human beings. IDEA at Poly is at the very heart of who we are and what we do. We encourage everyone to speak up and constructively challenge and nurture a culture of sensitive curiosity where diverse perspectives are valued and encouraged.
We foster a culture of allyship and growth mindset and are united by our collective purpose and common set of organizational values that are core to our mission and culture. To do that, our employees must feel empowered to bring their authentic selves to work. We lead with inclusion and empower everyone to do their best work as their best selves, regardless of their sex, gender identity or expression, race, age, religious creed, national origin, physical or mental disability, ancestry, color, marital status, sexual orientation, military or veteran status, status as a victim of domestic violence, sexual assault or stalking, medical condition, accessibility needs, genetic information, or any other protected class or category recognized by individual countries laws.
Our employee resource groups (PRIDE, Women’s Leadership Group, Accessibility and Inclusion, Veterans, Parents & Caregivers, and Hue (our under-represented minorities community)) are a critical force within Poly. They tell our story through events and experiences, play a key role in our recruitment strategy, drive an inclusive culture, and ensure that diversity is front and center at Poly.
To help us drive change and make sure the initiatives we create resonate across the globe in every country in which we operate, we created our IDEA Council. This global team collaborates to learn, create, strategize, and make sure our diversity and inclusion programs hit the mark with our employees around the world. They are our ambassadors for all things inclusion and diversity and are our agents of change.
We monitor our progress. We are setting aspirational goals for our executives and functions around changing their demographics using data to drive change. Poly has an organization-wide focus to improve recruitment and retention of women and ethnic minorities. As of April 2, 2022, Poly had the following attributes:
| Female % | Minority % | |||||||
| Employees | 48% | 33%2 | ||||||
| Executives3 | 33% | 22% | ||||||
We believe in a purposeful culture and encourage our employees to support their passions in the workplace, including their desire to create a healthier planet. Our CSR committee helps to ensure we are doing our part as a company, and we provide our employees with time off to volunteer for causes that are important to them. As a product company, we design our products with environmental benefits in mind.
Health, Safety, and Wellness
1 Includes voluntary and involuntary terminations, but excludes manufacturing/direct labor employees in our facility in Tijuana, Mexico.
2 Percentage of U.S. Employees.
3 Executives are employees who report directly to the Chief Executive Officer.
12
The health, safety, and wellness of our employees is a priority in which we continue to invest. These investments and the prioritization of employee health, safety (both physical and psychological), and wellness continued to be of particular significance also in Fiscal Year 2022 in light of COVID-19. We provide our employees and their families with access to a variety of innovative, flexible, and convenient health and wellness programs. Program benefits are intended to provide protection and security, so employees can have peace of mind concerning events that may require time away from work or that may impact their financial well-being. Additionally, we provide programs to help support employee physical and mental health by providing tools and resources to help them improve or maintain their health status, encourage engagement in healthy behaviors, and offer choices where possible so they are customized to meet their needs and the needs of their families.
In response to the COVID-19 pandemic, we implemented significant changes that we determined were in the best interest of our employees, as well as the communities in which we operate, in compliance with government regulations. This includes having the vast majority of our employees work from home whenever possible, while implementing additional safety measures for employees continuing critical on-site work. A number of employees critical to maintaining our essential engineering, manufacturing, repair, and logistics functions have continued to work from Poly locations globally. To protect and support our essential team members, we have implemented health and safety measures that included maximizing personal workspaces, changing shift schedules, providing personal protective equipment (PPE), and instituting mandatory screening before accessing buildings, including enhanced safety measures in our Tijuana manufacturing facility, which included those measures noted above, as well as providing COVID-19 vaccines to our employees and their immediate families, as well as other workers, at our manufacturing facility on a voluntary basis free of charge, on-premises medical staff, private bus transportation to and from the facility, routine temperature screenings, and increased sanitation measures.
Total Rewards
Our team is global, and we offer compelling global incentives to reinforce our leadership and performance-driven culture and attract and reward leading talent. We offer global competitive and meaningful total rewards programs that meet the diverse needs of our employees, while also reflecting local market practices.
Our total rewards approach is designed to deliver cash, equity, and benefit programs that are competitive with those offered by leading companies in the technology industry and reflect anticipated local market demands and evolving business needs. Other than the base salary program, all of our cash and equity programs are dependent upon the achievement of individual and company performance. In addition to competitive salaries and bonuses, we grant equity-based compensation to a significant portion of our employees. Equity serves as a key component in attracting, retaining, and motivating our employees. We also provide the opportunity for equity ownership through our employee stock purchase plan.
We provide market aligned benefits that include retirement planning, health care, parental leave, flexible paid time off, and appreciation events for employees. In addition, we offer benefits to support our employees’ physical and mental health by providing tools and resources in areas such as digital training programs to help people improve mental wellbeing, flexible fitness platforms for physical activity, and telehealth services. We also offer a support platform for maternity and family benefits and a caregiver solution providing support for families of children with learning, social, or behavioral challenges in selected locations.
We offer flexible work/life programs that embrace and engage our diverse population. We offer a unique peer to peer recognition program that reinforces our culture, values, leadership and operating principles.
Talent Development
We offer learning and development opportunities that enable our workforce to acquire and expand skills and knowledge and have a meaningful and fulfilling career. To help employees succeed in their current roles, we provide formal training programs and curriculums in addition to on-the-job training. Our learning and development portal provides our employees with valuable resources such as a comprehensive online learning management program with training and development tools on a broad range of topics and skills.
Governance
We are committed to strong governance systems and policies that ensure fair, transparent and efficient business practices. Our Board has tasked its Nominating and Corporate Governance Committee (“NCG”), along with senior leadership and support of the full Board, with oversight responsibility for our ESG strategy and related initiatives. The NCG periodically receives updates from management on, and reviews, significant ESG and other corporate social responsibility and sustainability initiatives,
13
policies and practices, and makes recommendations to the Board as appropriate. We also review and seek input from our investment community on their views on sustainability and ESG. The NCG's oversight responsibility also includes reviewing shareholder proposals, if any, received on ESG matters, and providing recommendations to the Board on the Company’s response to such proposals, as well as recommendations for processes that would be helpful for the Board in overseeing how the Company manages material ESG issues.
We have adopted a Code of Conduct with annual trainings and provisions related to global ethical behavior and compliance with applicable laws, human rights, sustainability, diversity and inclusion, anti-corruption and anti-bribery regulations, along with enforcement and other dimensions of ethical conduct. We offer our employees and others the opportunity to report violations on an anonymous basis through a third-party hosted hotline, and our Code of Conduct expressly provides for non-retaliation for good faith reporting. We expect Poly employees, officers, directors, and contractors, as well as everyone working on our behalf worldwide, to adhere to these standards.
We also are committed to responsible manufacturing of our products and responsible sourcing of materials. We require our suppliers to share in this commitment and have established the Supplier Code of Conduct, which outlines our expectations of Poly suppliers in conducting business in a legal, ethical, and responsible manner.
Information About Our Executive Officers
Set forth in the table below is certain information regarding the executive officers of the Company as of April 2, 2022:
| NAME | AGE | POSITION | ||||||||||||
| David M. Shull | 49 | President, Chief Executive Officer and member of the Board of Directors | ||||||||||||
| Charles D. Boynton | 54 | Executive Vice President, Chief Financial Officer | ||||||||||||
| Lisa Bodensteiner | 60 | Executive Vice President, Chief Legal and Compliance Officer, and Corporate Secretary | ||||||||||||
| Carl J. Wiese | 61 | Executive Vice President, Chief Revenue Officer | ||||||||||||
| Grant Hoffman | 49 | Executive Vice President, Chief Supply Chain Officer | ||||||||||||
Mr. Shull joined the Company in September 2020 as President, Chief Executive Officer and a member of the Board of Directors. Prior to joining the Company, Mr. Shull served as President and Chief Executive Officer of TiVo Corporation, where he gained significant consumer hardware experience and reinvigorated the image of the TiVo brand through a new corporate narrative and a cutting-edge streaming product. Prior to leading TiVo, he served as Chief Executive Officer of The Weather Channel. Mr. Shull brings over 15 years of senior leadership experience in digital media, commercial marketing, operations, and telecommunications. He also brings extensive global experience in operational transformation, complex business partnerships, corporate development and capital markets. Prior to serving as Chief Executive Officer of The Weather Channel, he held various executive roles at DISH Network/EchoStar for 10 years, including Executive Vice President and Chief Commercial Officer, Senior Vice President, Programming/Content Acquisition, Senior Vice President and Managing Director, Asia Operations, and Vice President, International. Mr. Shull holds an A.B. from Harvard University and an M.B.A. from Oxford University.
Mr. Boynton joined the Company in 2019 as Executive Vice President, Chief Financial Officer. Prior to joining the Company, Mr. Boynton served as Executive Vice President and Chief Financial Officer of SunPower Corporation, a global energy company and provider of solar power solutions, from March 2012 to May 2018 and continued as an Executive Vice President until July 2018. Mr. Boynton also served as the Chairman and Chief Executive Officer of 8point3 General Partner LLC, the general partner of 8point3 Energy Partners LP, an affiliate of SunPower, from March 2015 to June 2018. He also served as SunPower’s Principal Accounting Officer from October 2016 to March 2018. In March 2012, Mr. Boynton served as SunPower’s Acting Chief Financial Officer and from June 2010 to March 2012 he served as SunPower’s Vice President, Finance and Corporate Development, where he drove strategic investments, joint ventures, mergers and acquisitions, field finance and financial planning and analysis. Before joining SunPower in June 2010, Mr. Boynton was the Chief Financial Officer for ServiceSource, LLC from April 2008 to June 2010. Earlier in his career, Mr. Boynton held key financial positions at Intelliden, Commerce One, Inc., Kraft Foods, Inc., and Grant Thornton, LLP. Mr. Boynton earned his master’s degree in business administration at the Kellogg School of Management at Northwestern University and holds a Bachelor of Science degree in Accounting from the Kelley School of Business at Indiana University Bloomington.
Ms. Bodensteiner joined the Company in October 2020 as Executive Vice President, Chief Legal Officer, Compliance Officer and Corporate Secretary. Prior to joining the Company, Ms. Bodensteiner was a Principal with MDAC, LLC, a family-owned real estate management and development firm, from June 2016 to October 2020. Ms. Bodensteiner also served as Executive
14
Vice President, General Counsel and Chief Compliance Officer at SunPower Corporation, a global energy company and provider of solar power solutions, from June 2012 to May 2016. Before joining SunPower, Ms. Bodensteiner joined First Solar after its purchase of project development assets from OptiSolar Inc. where she was also on the leadership team, from October 2007 to April 2009. At First Solar, she was Vice President, Business Development and General Counsel, Project Development from October 2009 to June 2012. She also served as Executive Vice President, General Counsel, Secretary and Chief Compliance Officer at Calpine Corporation from February 1996 to April 2006. Ms. Bodensteiner holds a Juris Doctor degree from Santa Clara University School of Law and a Bachelor of Science in Business Administration in Accounting from the University of Nevada.
Mr. Wiese joined the Company in January 2020 as Executive Vice President, Chief Revenue Officer. Prior to joining the Company, Mr. Wiese served as the President of Global Sales and Service of Blackberry Limited, a smartphone hardware and service provider, from 2015 until March 2019. While at Blackberry, Mr. Wiese was responsible for leading the company’s enterprise software business. Prior to that, Mr. Wiese held two positions at Cisco Systems, Inc., a provider of telecommunications equipment and services, serving as its Vice President, Advanced Technology Sales, North America from 2002 through 2009, and then as its Senior Vice President World Wide Collaboration Sales, from 2011 until 2014. Earlier in his career, Mr. Wiese has also held key positions at Apple, Avaya, Lucent Technologies Inc. and Texas Instruments. He holds a Bachelor of Science degree in business from the Spears School of Business at Oklahoma State University.
Mr. Hoffman joined the Company in January 2021 as Executive Vice President, Chief Supply Chain Officer. Prior to joining the Company, Mr. Hoffman served as Vice President of Supply Chain for Lenovo's Mobile Phone business unit from June 2016 to December 2020. Before joining Lenovo, Mr. Hoffman held positions of increased responsibility at Motorola, Google, Continental Automotive Group and Del Monte Foods. Mr. Hoffman holds a masters degree in business administration and Bachelor of Science degree in Business Management from Northern Illinois University.
Executive officers serve at the discretion of the Board. There are no family relationships between any of the directors and executive officers of the Company.
15
ITEM 1A. RISK FACTORS
Risk Factors Summary
The following is a summary of the material risks and uncertainties we have identified, which should be read in conjunction with the more detailed description of each risk factor contained below.
1. Risks Related to Operations
• Disruptions in our supply chain, including the inability of our own manufacturing facilities and those of our contract manufacturers, original design manufacturers, suppliers and sub-suppliers, to provide and/or timely deliver sufficient quantities of key component parts and/or finished products, has adversely impacted, and may continue to adversely impact, our ability to fulfill customer demand which, in turn, has and may continue to adversely impact our growth, business, reputation and financial condition.
•COVID-19 has had, and may continue to have, a significant impact on our business and results of operations.
• We face risks related to our dependence on channel partners and strategic partners to sell our products.
• Failure to adequately service and support our product offerings, or a decline in demand for our service offerings, could harm our results of operations.
•Changes in our management may cause uncertainty in, or be disruptive to, our business, certain of our directors and management team members have been with us in those capacities for only a short time.
•Business interruptions due to manmade or natural disasters, or other significant disruptions in, or breaches in security of, our products, our website or information technology systems, including breaches of technology systems of our third-party suppliers, could adversely affect our business operations.
• Our ability to process purchase orders and ship products in a timely manner depends on our IT systems and performance of the systems and processes of third parties such as our suppliers, manufacturers, customers or other partners, as well as the interfaces between our systems and the systems of such third parties.
2. Risks Related to Strategic Initiatives
• Our failure to properly develop and manage strategic initiatives may adversely affect our financial position and results of operations.
•Competition in each of our markets is strong, and our inability to compete effectively could significantly harm our business and results of operations.
•Failure to successfully navigate the challenges associated with developing, introducing, and marketing our products could adversely impact our financial results.
• Our failure to effectively enhance and develop our sales strategy and sales force, may harm our revenues and financial outcomes as a result.
3. Risks Related to Our Regulatory and Litigation Environment
•Delays or loss of government contracts or failure to obtain or maintain required government certifications could have a material adverse effect on our business.
•We are subject to a variety of laws and regulations relating to the import and export of our product and service offerings. Any failure to comply with such regulations could result in governmental enforcement actions, fines, penalties, or other remedies, which could have a material adverse effect on our business, results of operations, and financial condition.
•Critical accounting estimates involve the use of judgements and if actual results vary from our estimates or assumptions underlying such estimates, our financial results could be negatively affected.
•We are regularly subject to a wide variety of litigation, including commercial and employment litigation, allegation of patent infringement, as well as claims related to alleged defects in the design and use of our products.
• We are subject to other legal and compliance risks that could have a material impact on our business.
4. Risks Related to Our Global Presence
•We operate in multiple tax jurisdictions globally. Our corporate tax rate may increase or we may incur additional tax liabilities, and/or changes in applicable tax regulations and resolutions of tax disputes could negatively impact our cash flow, financial condition, and results of operations.
•We are exposed to differences and frequent fluctuations in foreign currency exchange rates, which may adversely affect our revenues, gross profit, and profitability.
•We are exposed to the impact of macroeconomic and geopolitical trends and events, including the effects of inflation. In late February 2022, existing geopolitical tensions increased dramatically following Russia's military action against Ukraine. Following Russia’s actions, various countries, including the United States, Canada, the United Kingdom, Germany, and France, as well as the European Union, issued broad ranging economic sanctions against Russia, including the prohibition of doing business with certain Russian corporate entities, large financial institutions, officials and
16
oligarchs, and the freezing of Russian assets. Russia’s invasion, the responses of countries and political bodies to Russia’s actions, continuing or increased sanctioning efforts, and the potential for wider conflict could have a material adverse effect on Poly’s supply chain and may result in a higher cost of freight and a reduction in the sales of services and products in Russia and Eastern Europe.
5. Risks Related to Our Capital Structure
•Our operating results are difficult to predict, they could fluctuate, and our stock price could become more volatile and your investment could lose value.
•Our substantial indebtedness could adversely affect our financial condition and prevent us from fulfilling our obligations under the notes and our other debt instruments.
6. Risks Related to Our Merger with HP
•The consummation of the Merger with HP is contingent upon the satisfaction of a number of conditions, including stockholder and regulatory approvals, that may be outside of our or HP’s control and that we and HP may be unable to satisfy or obtain or that may delay the consummation of the Merger or cause the parties to abandon the Merger.
•While the Merger is pending, we are subject to business uncertainties and contractual restrictions that could harm our financial condition, operating results, and business.
•Uncertainty about the Merger may adversely affect relationships with our customers, suppliers and employees, whether or not the Merger is completed.
•As a result of the Merger, our current and prospective employees could experience uncertainty about their future with us. As a result, key employees may depart because of issues relating to such uncertainty or a desire not to remain with HP following the completion of the Merger.
•Litigation has arisen, and more could arise, in connection with the Merger, which could be costly, prevent consummation of the Merger, divert management’s attention and otherwise materially harm our business.
•The ability to complete the Merger is subject to the receipt of consents and approvals from government entities, which may impose conditions that could have an adverse effect on us or could cause either party to abandon the Merger.
Risk Factors
YOU SHOULD CAREFULLY CONSIDER THE RISKS DESCRIBED BELOW BEFORE MAKING AN INVESTMENT DECISION. THE RISKS DESCRIBED BELOW ARE NOT THE ONLY ONES WE FACE. ADDITIONAL RISKS THAT WE ARE NOT PRESENTLY AWARE OF OR THAT WE CURRENTLY BELIEVE ARE IMMATERIAL MAY ALSO IMPAIR OUR BUSINESS OPERATIONS. OUR BUSINESS COULD BE MATERIALLY HARMED BY ANY OR ALL OF THESE RISKS. THE TRADING PRICE OF OUR COMMON STOCK COULD DECLINE SIGNIFICANTLY DUE TO ANY OF THESE RISKS, AND YOU MAY LOSE ALL OR PART OF YOUR INVESTMENT. IN ASSESSING THESE RISKS, YOU SHOULD ALSO REFER TO THE OTHER INFORMATION CONTAINED OR INCORPORATED BY REFERENCE IN THIS ANNUAL REPORT ON FORM 10-K, INCLUDING OUR CONSOLIDATED FINANCIAL STATEMENTS AND RELATED NOTES.
1.Disruptions in our supply chain, including the inability of our own manufacturing facilities and those of our contract manufacturers, original design manufacturers, suppliers and sub-suppliers, to provide and/or timely deliver sufficient quantities of key component parts and/or finished products, has adversely impacted, and may continue to adversely impact, our ability to fulfill customer demand which, in turn, has and may continue to adversely impact our growth, business, reputation, and financial condition.
We depend on manufacturing operations conducted in our own facility in Tijuana, Mexico and through contract manufacturers, original design manufacturers, and suppliers to provide key component parts and/or manufacture and deliver finished products. Although we have contracts with certain contract manufacturers, original design manufactures, and suppliers, we also source components direct from suppliers and distributors. We depend on these relationships and parties to timely obtain sufficient quantities of component materials as well as finished products of acceptable quality, at acceptable prices, and in the quantities necessary for us to meet critical schedules for the delivery of our own products and services and to fulfill our anticipated customer demand. The Company and our contract manufacturers and original design manufacturers procure materials, components and sub-components from a long and often complex chains of sub-suppliers to assemble them into finished products. Given the wide variety of solutions that we offer, the large and diverse distribution of our manufacturers and suppliers, and the long lead times required to manufacture, assemble and deliver certain products, problems could arise in production, planning and inventory management that could seriously harm our business. For example, there has been a worldwide shortage of semiconductor, memory and other electronic components affecting many industries, from automotive to technology providers. This shortage has impacted us significantly and has caused us to experience extended lead times (in some cases over 52 weeks) which is anticipated to continue. Extended lead times and decreased availability of key components has caused a significant disruption to our production schedule and has had, and we expect to continue to have, an adverse effect on our financial condition or results of operations. We do not have any
17
guarantees of supply from our third-party suppliers, and in certain cases we have limited contractual arrangements or are relying on standard purchase orders or on component parts available on the open market, which has resulted in increased costs combined with reduced availability. Continued delay in our ability to produce and deliver our products could cause our customers to purchase alternative products from our competitors. Also, long-term supply and maintenance obligations to customers increase the duration for which specific components are required, which may further increase the risk of component shortages or increase the cost of carrying inventory. If component shortages continue, we will continue to experience supply interruption and/or may incur significant price increases from these suppliers.
Additionally, rapid increases in production levels to meet product demand, whether or not forecasted, has resulted and could in the future result in shipment delays, higher costs for materials and components, increased expenditures for freight to expedite delivery of required materials, late delivery penalties, and higher overtime costs and other expenses, which have negatively impacted our revenues, reduced our profit margins, and potentially harmed relationships with affected customers. Although historically, we have generally been able to secure additional supply or take other actions to mitigate supply disruptions, as the impact of the global shortages in key components, including semiconductors, impacts many industries worldwide, and particularly our supply chain, we could experience a material adverse effect on our business, results of operations, and financial condition for an extended period of time. In addition, in order to secure such necessary components, we have and may continue to purchase them from brokers in the open market at prices that are higher than those available from our normal vendors. If constraints were to occur in existing or future product lines, our ability to meet demand and our corresponding ability to sell affected products may be materially reduced. Moreover, our failure to timely deliver desirable products to meet demand may harm relationships with our customers. Further, if production is increased rapidly, manufacturing yields may decrease, which may also reduce our revenues or margins.
Additionally, although we use standard parts in many of our products, we are dependent on certain sole source and limited source suppliers. We currently purchase certain integrated circuits from single or limited sources which, combined with extended lead times, makes us further susceptible to shortages, quality issues or price fluctuations in our supply chain. Suppliers may choose not to renew their contracts with the Company or to discontinue supplying materials and components or finished products to us for a variety of reasons, including conflicting demands from their other customers, availability, price, and discontinuing production of such product. As our contract manufacturers acquire components on our behalf our direct purchases from original design manufacturers are reduced, in turn, reducing our influence in securing necessary quantities of supply. A lack of viable alternative sources of materials and components or the high development costs associated with existing and emerging wireless and other technologies may require us to work with a single source of supply for certain components. Additionally, with consolidation occurring with certain suppliers, there are also fewer sources for components available to us. This consolidation can negatively impact our ability to access certain parts and at reasonable prices, which impact our gross margin. Companies may elect not to continue their business relationship with us for reasons beyond our control, or may experience disruptions, impose price increases, or go out of business, any of which could negatively impact our ability to sell our products.
Additionally, in order to secure the quantities of supplies needed to meet customer demand, in some instances we have been required to increase purchase commitments and/or enter into longer-term contractual commitments. Increases in our purchase commitments and/or multi-year contractual arrangements to shorten lead times and or increase component or finished goods supply could also lead to excess and obsolete inventory charges if the demand for our products is less than our expectations. If we fail to anticipate customer demand properly, an oversupply of parts and finished goods could result in excess or obsolete inventory that could also adversely affect our gross margins.
Our inventory management systems and supply chain visibility tools may not enable us to accurately forecast and manage the supply of our products and components. If we determine that we have excess supply, we may have to reduce prices or write down inventory. Alternatively, insufficient supply levels may lead to a shortage of products to sell and less revenue.
We have significant reliance upon our manufacturing facility in Tijuana, Mexico which may cause disruption to the supply chain and change established supply chain relationships. We believe that a flexible supply chain allows us to effectively respond to customer demands, but it also requires continuous improvement efforts involving management, production employees, and suppliers. In addition, we have identified opportunities to migrate to less manual, more sophisticated assembly techniques, which may require a significant amount of capital investment and take time to implement. If we are unable to consistently and timely execute on our supply chain strategies, our ability to respond to customer demand timely may be harmed which, in turn, would have a negative impact on our financial results.
Moreover, our ongoing efforts to optimize the efficiency of our supply chain could cause supply disruptions and be more expensive, time-consuming and resource-intensive than expected. Given these component shortages, supply interruption and/or significant price increase from these suppliers may occur. In addition, we may not be able to develop alternate or second sources in a timely manner. It is time consuming and costly to qualify parties into our supply chain, which if we fail
18
to manage could cause delays, quality control issues, and disruption in our manufacturing. With more suppliers and locations to manage in our supply chain the complexity increases. If we are unable to buy these components in quantities sufficient to meet our requirements on a timely basis, we will not be able to deliver products and services to our customers, which would seriously affect present and future sales, and would, in turn, adversely affect our business, financial condition, and results of operations. Moreover, the loss of a source of supply, or lack of sufficient availability of key components, could require that we locate an alternate source or redesign our products, either of which could result in business interruption and increased costs and could negatively affect our product gross margin and results of operations.
A portion of the materials and components used in our products are provided by our suppliers on consignment. As such, we do not take title to, or risk of loss of, these materials and components until they are consumed in the production process. Our consignment agreements generally allow us to return parts in excess of maximum order quantities at the suppliers’ expense. Returns for other reasons are negotiated with suppliers on a case-by-case basis and are generally immaterial. If we are required or choose to purchase all or a material portion of the consigned materials and components or if a material number of our suppliers refuse to accept orders on consignment, our inventory turn rate may decline or we could incur material unanticipated expenses, including write-downs for excess and obsolete inventory.
We have experienced and expect to continue to experience volatility in prices from our suppliers, particularly in light of price fluctuations for integrated circuits, plastics, oil, gold, copper, and other materials and components in the U.S. and around the world, which could negatively affect our profitability or market share. We have recently implemented price increases on certain products to pass some of the cost increases to our customers. If we are unable to do so in the future, or if we cannot achieve operating efficiencies that offset further increases, our business, financial condition, and results of operations may be materially negatively affected.
2.COVID-19 has had, and may continue to have, a significant impact on our business and results of operations.
a.The full and long-term effects of the global COVID-19 pandemic on our business depend on future events that continue to be highly uncertain and cannot be predicted.
The novel strain of COVID-19 identified in late 2019 has spread globally and had a mixed effect and could in the future continue to have a mixed or adverse effect on our business, operations and financial condition.
The pandemic has resulted in government authorities implementing numerous measures to try to contain the virus, such as travel bans and restrictions, quarantines, shelter in place orders, on-site work restrictions, and shutdowns. These restrictions have led to a massive increase in remote work.
As companies continued to shift from in-office to work-from-home arrangements, we experienced elevated demand for certain Enterprise Headsets and Video devices, which support these arrangements, and a decline in demand for our Voice products and associated services, which support enterprise in-office work. The acceleration in customer and partner demand for our products that support remote work, remote learning, and telemedicine opportunities have led to increased sales and operating income. We expect the trend in these areas to continue. Such increased demand also has led, and may continue to lead, to increased competition, particularly in our headset and video categories. The full extent of the impact of the pandemic on our business and on our operational and financial performance and condition remains uncertain and will depend on many factors over which we have no control, including the length of the pandemic, government, business and individuals actions, the impact on global economic activity, variant strains, the availability of vaccines, and whether a hybrid work model will be adopted and maintained by businesses and customers over the long-term.
b. COVID-19 has caused supply chain issues, including a shortage of adequate component supply and manufacturing capacity and long lead times for raw materials and components. This has caused, and may continue to cause, a disruption in our supply chain, increased costs, increased purchase commitments and a delay in our ability to fulfill orders, which has had, and may continue to have, an adverse impact on our business and operating results.
From the initial outbreak of the virus and its spread globally, we have experienced disruptions and higher costs in our manufacturing, supply chain and logistics operations, and in some cases, increased sell-through, resulting in shortages of our products in our distribution channels and loss of market share and opportunities.
Manufacturing capacity, including much longer than usual lead times, and component supply constraints have caused, and could continue to cause, significant issues for us. As a result of COVID-19, our component suppliers are at capacity and are under pressure to allocate components and production to certain customers for business, regulatory or political reasons, including customers who are outside of our industry, such as the automotive industry, and/or
19
customers within the telecommunications industry who are much larger than us. In addition, based on this extraordinary demand for the same components, we have experienced and may continue to experience, increases in pricing as a condition of supply or worse, de-commits of supply.
Although we continue to work with our supply chain and dual source partners to take the necessary steps to mitigate disruption of supply, there can be no assurance that the ongoing disruptions due to COVID-19 will be resolved in the near term, which would negatively affect present and future sales, and would, in turn, adversely affect our business, financial condition, and results of operation. See Risk Factor 1 above entitled "Disruptions in our supply chain, including the inability of our own manufacturing facilities and those of our contract manufacturers, original design manufacturers, suppliers and sub-suppliers, to provide and/or timely deliver sufficient quantities of key component parts and/or finished products, has adversely impacted, and may continue to adversely impact, our ability to fulfill customer demand which, in turn, has and may continue to adversely impact our growth, business, reputation and financial condition" for more information.
c. Our future growth will depend on our diversified product and services offerings, and if we do not successfully execute on our growth opportunities, our operating results could be adversely affected.
COVID-19 has forced businesses around the world to shift their employees to remote work. As a result, we believe that businesses are moving to permanent remote work for some or all of their workforce. Due to this changing work environment, we are attempting to diversify our product category portfolio and focus more of our attention on hybrid work-related products, including new products in our headsets category which continue to include our noise cancellation in addition to other advanced artificial intelligence and machine learning features, and our new professional-grade personal video tools to meet the needs of remote workers and IT administrators configuring solutions for a variety of applications. Our operating results depend on our ability to develop and introduce new products and services into existing and emerging markets, including telehealth and tele-education verticals. While we are taking actions to develop new and/or increase the manufacturing of our existing collaboration tools that enable both in office and remote work, our failure to timely accommodate this rapidly shifting market demand, and/or failure of customers to purchase and/or renew our offerings, could negatively impact our financial results.
The COVID-19 pandemic may also result in both unpredictable short-term and long-term changes in customer needs for our products and services in various sectors, along with IT-related capital spending reductions, or shifts in spending focus, which could materially adversely affect us if we are unable to adjust our product and service offerings to match customer needs. The process of developing new technology is complex and uncertain, and if we fail to accurately predict customers’ changing needs and emerging technological trends, then our business could be harmed. We must commit significant resources, including the investments we have been making in our strategic priorities to developing new products and services, before knowing whether our investments will result in products and services the market will accept. In particular, if our model of the evolution of hybrid working and focus on the professional customer does not emerge as we believe it will, or if the industry does not evolve as we believe it will, or if our strategy for addressing this evolution is not successful, many of our strategic initiatives and investments may not meet our expectations. In addition, our business could be adversely affected in periods surrounding our new product introductions if customers delay purchasing decisions to qualify or otherwise evaluate the new product offerings. There can be no assurance that we will successfully identify new product and services opportunities, develop and bring new products and services to market in a timely manner, or achieve market acceptance of our products and services or that products, services and technologies developed by others will not render our products, services or technologies obsolete or noncompetitive.
As we expand into new product and service categories and/or go-to- market strategies in pursuit of growth, we will have to continue to build relationships with our existing channel partners, or may have to build relationships with new channel partners and/or directly with suppliers and manufacturers and adapt to evolving or new distribution and marketing models. These partners, suppliers, practices and models may require significant management attention and operational resources and may affect our accounting, including revenue recognition, gross margins, and the ability to make comparisons from period to period. If we are unable to maintain and/or build successful distribution channels or successfully market our products and services in these new categories, we may not be able to take advantage of the growth opportunities, and our business and our ability to grow our business could be adversely affected.
Additionally, customer demand for our product categories tends to be less predictable and tends to vary more across geographic markets. As a result, we may face higher up-front investments, inventory costs associated with attempting to anticipate customer preferences, and increased inventory write-offs.
d. COVID-19 has caused and may continue to cause unanticipated fluctuations in our gross margins, which can result in unanticipated fluctuations in our operating results.
20
Our gross margins can vary due to customer demand, competition, product pricing, product lifecycle, product mix, new product introductions, unit volumes, acquisitions and divestitures, commodity, supply chain and logistics costs, capacity utilization, geographic sales mix, currency exchange rates, trade policy and tariffs, and the complexity and functionality of new product innovations and other factors. If we are not able to introduce new products in a timely manner at the product cost we expect, or if customer demand for our products is less than we anticipate, or if there are product pricing, marketing and other initiatives by our competitors to which we need to react or that are initiated by us to drive sales that lower our margins, then our overall gross margin will be less than we project.
Moreover, growth in the hybrid work environment is likely to create greater pressures on us and our suppliers to accurately project overall and specific product categories of component and product demand and to establish optimal levels and manufacturing capacity. If we are unable to secure enough components and/or finished products at reasonable prices or of acceptable quality to build new products in a timely manner in the quantities or configurations needed, our revenue and gross margins could suffer until other sources can be developed.
In addition, our gross margins vary significantly by product line, sales geography and customer type, as well as within product lines. When the mix of products sold shifts from higher margin product lines to lower margin product lines, to lower margin sales geographies, or to lower margin products within product lines, our overall gross margins and our profitability may be adversely affected. In particular, early in this fiscal year we experienced increased demand for our headset products, which typically carry lower gross margins, and downward pressure on the sales of our audio and video solutions, which typically are used in office environments and carry higher gross margins. A continuation of the movement towards remote and/or flexible work practices could, over time, further erode the overall demand for office equipment and further erode sales of our Enterprise voice and video product lines, continuing downward margin pressure.
Moreover, as we expand within and into new product categories, our products in those categories may have lower gross margins than in our traditional product categories. If we are unable to offset these potentially lower margins by enhancing the margins in our more traditional product categories, our profitability may be adversely affected.
As our manufacturing is in Asia and Mexico and distributors located globally, we rely upon logistics providers to transport goods around the world. As supply chains have become more constrained, the need to expedite shipments to manufacturing facilities and customers has increased. Further, we continue to experience higher transportation and fuel costs which has resulted in decreased margins and may result in the future in increased inventory and further margin decline, which would adversely affect our results of operations and financial condition.
Changes in trade policy, including tariffs and the tariffs focused on China in particular, and currency exchange rates also have adverse impacts on our gross margins. The COVID-19 pandemic is putting pressure on our gross margins as well as causing us to face uncertain product demand and incur increased air freight and other costs to fulfill sell through demand, replenish channel inventory, and maintain market share.
The impact of these factors on gross margins can create unanticipated fluctuations in our operating results, which may cause volatility in the price of our stock.
e. We face risks related to COVID-19 related to our offices worldwide and our manufacturing facility in Mexico, which could significantly disrupt our operations.
In light of the uncertain and rapidly evolving situation relating to the spread of this virus and various government restrictions and guidelines, we have taken measures intended to mitigate the spread of the virus and minimize the risk to our employees and their families, channel partners, end-customers, and the communities in which we operate. Such measures included transitioning our in-office employee population to work remotely from home, adhering to public safety and shelter in place directives, physical distancing protocols within offices and manufacturing facilities for our essential workers, providing personal protective equipment, including face masks and hand sanitizers, conducting routine sanitation of facilities, requiring health monitoring before entry into Poly facilities and restricting the number of visitors to our sites. This has led to some operational, cybersecurity and other risks and cost that could have an adverse impact on the company’s results from operations. Our management team and employees have and continue to plan for and mitigate operational challenges and risks associated with COVID-19, shifting some of our focus from normal business, strategic planning, and other initiatives.
Although we continue to monitor the situation, precautionary measures that we have adopted could negatively affect our customer success efforts, sales and marketing efforts, delay and lengthen our sales cycles, and create operational or
21
other challenges, any of which could harm our business and results of operations. In addition, COVID-19 may disrupt the operations of our end-customers and channel partners for an indefinite period of time, including as a result of travel restrictions and/or business shutdowns, all of which could negatively impact our business and results of operations, including cash flows.
Further, disruptive activities from COVID-19 have caused (in April 2020), and may in the future cause, temporary closure of our manufacturing facility in Tijuana, Mexico. The extent to which COVID-19 may impact our operations at this facility in the future remains highly uncertain and cannot be predicted. As the COVID-19 vaccine is not readily available in Mexico, our production personnel are at heightened risk and if an outbreak of the virus occurs at this facility, we may be forced to shut down our operations, which would result in significant disruption in our supply chain and results of operations.
3. Our failure to properly develop and manage strategic initiatives may adversely affect our financial position and results of operations.
We operate in a rapidly evolving market. To continue focus on growing our business, we have identified strategic initiatives designed to expand our product and service offerings and target growth opportunities in various horizontal and vertical markets. Our success in managing these growth objectives will depend to a significant degree on our ability to: implement our business model and strategy and adapt and modify them as needed; increase awareness of our brand name, protect our reputation and develop customer loyalty; anticipate with any degree of certainty the behavioral and operational changes of our customers that have a significant impact on our business from time to time as they respond to evolving social, economic, regulatory and political changes; effectively manage our expanding operations and service offerings, including the integration of any acquisitions; maintain adequate control of our expenses; rely on our channel partners to align with our strategic objectives; adequately and efficiently operate, maintain, upgrade and develop our website and the other platforms and equipment we utilize in providing our services; improve and develop financial and management information systems, controls and procedures; attract, retain and motivate qualified personnel; and anticipate and adapt to changing conditions in the human resource, online and other markets in which we operate as well as the impact of any changes in government regulation, mergers and acquisitions involving our competitors, technological developments and other significant competitive and market dynamics.
Additionally, as part of our business strategy, if we are presented with appropriate opportunities, we may acquire or invest in businesses or assets to add complementary companies, products, and technologies, and specialized employees, as well as make investments in, and/or form strategic partnership alliances with, other companies in furtherance of our strategic objectives. Our ability to acquire and successfully integrate companies, products, and technologies in the past has been challenging, particularly our Acquisition of Polycom in 2018. Although the acquisition resulted in the achievement of certain benefits, including acceleration and expansion of our market opportunities, creation of a broader portfolio of communications and collaboration endpoints, and significant expansion of services offerings, the Acquisition also has presented certain challenges, including our inability to timely and efficiently integrate network infrastructures including pricing and ordering systems, which impacted the timing and processing of orders with suppliers, vendors, customers and end users. In addition, the Acquisition has had, and may continue to have, negative effects on the price of our common stock, particularly in light of the amount of debt incurred and the significant number of shares of our stock issued in the transaction. Moreover, we have experienced system implementations challenges and redundant operations in various countries, increasing our compliance costs, and may continue to experience additional and unforeseen expenses and working capital requirements as a result of the Acquisition.
Future acquisitions and investments may not achieve our goals, and could be viewed negatively by our customers, partners, or investors. In addition, such acquisitions, investments and/or partnerships may expose us to risks associated with unforeseen or hidden liabilities, risks that acquired or invested companies will not achieve anticipated performance levels, diversion of management attention and resources from our existing business or other priorities and budget limitations, difficulty in integrating the acquired businesses with our existing operational infrastructure, inability to generate sufficient revenues to offset the costs and expenses of acquisitions or investments, the length of development, and increased competition, all of which could adversely affect our financial condition and results of operations.
In addition, following completion of an acquisition or investment, our management and resources may be diverted from their core business activities due to the integration process, which diversion may harm the effective management of our business. Any difficulties encountered in the acquisition or investment and integration process may have an adverse effect on our ability to manage our business and harm our results of operations and financial condition. If a financial or strategic investment is unsuccessful, we may lose the value of our investment, which could have a material adverse effect on our financial condition and results of operations. Moreover, if we fail to successfully close transactions, integrate new teams, or integrate the products, technologies or other solutions associated with these transactions into our company, our business
22
could be seriously harmed. Any integration process may require significant time and resources, and we may not be able to manage the process successfully. We may not successfully evaluate or use the acquired products, technology, and personnel, or accurately forecast the financial impact of an acquisition, investment and/or partnership transaction, including accounting charges. We may have to pay cash, incur debt, or issue equity securities to pay for any acquisition or investment, any of which could seriously harm our business. Selling or issuing equity to finance or carry out any such acquisition or investment would also dilute our existing stockholders. Incurring debt would increase our fixed obligations and could also include covenants or other restrictions that would impede our ability to manage our operations.
In addition, members of the new U.S. administration and Congress have proposed new legislation that could limit, hinder, or delay the acquisition process and target opportunities. If we are unable to consummate key acquisition transactions essential to our corporate strategy, it may limit our ability to grow or compete effectively and our business may be seriously harmed.
Additionally, as we focus on growth opportunities, we continue to review our product portfolio and address our non-strategic product categories and products through various options including divestiture and cessation of operations like the sale of our consumer gaming assets. If we are unable to execute divestitures on favorable terms or if realignment is costlier or more distracting than we expect or has a negative effect on our organization, employees and retention, then our business and operating results may be adversely affected. Discontinuing products with service components may also cause us to continue to incur expenses to maintain services within the product life cycle or to adversely affect our customer and consumer relationships and brand. Divestitures may also involve warranties, indemnification or covenants that could restrict our business or result in litigation, additional expenses or liabilities. In addition, discontinuing product categories, even categories that we consider non-strategic, reduces the size and diversification of our business and causes us to be more dependent on a smaller number of product categories.
4. Competition in each of our markets is strong, and our inability to compete effectively could significantly harm our business and results of operations.
We face strong competition in all of the markets worldwide for our products, solutions and services. Market leadership changes may occur as a result of numerous factors, including new product and technology introductions, new market participants, pricing pressure on average selling prices and sales terms and conditions, and related to product performance and functionality. For a further description of our competitors and the markets in which we compete, see Item 1, Business, in this Form 10-K.
Our competitive landscape continues to rapidly evolve as the industry moves into new markets for collaboration such as mobile, browser-based, and cloud-delivered collaboration offerings. Competitors in these markets also continue to develop and introduce new technologies, sometimes proprietary or closed architectures, which may block or limit our ability to compete in certain markets. Many of our competitors are larger, offer broader product lines, may integrate their products and solutions with communications solutions, devices, and adapters manufactured or provided by them or others, offer products or solutions incompatible with our products, have established market positions, and have substantially greater financial, marketing, and other resources; all of which may increase pressure to reduce our pricing, increase our spending on sales and marketing, or both, which would correspondingly have a negative impact on our revenues and operating margins.
We may not be able to compete successfully against our current or future competitors. We expect our competitors to continue to improve the performance of their current products and to introduce new products or new technologies that provide improved performance. New product introductions by our current or future competitors, or our delay in bringing new products to market, could cause a significant decline in sales or loss of market acceptance of our products. We believe that ongoing competitive pressure may result in a reduction in the prices of our products and our competitors’ products. In addition, the introduction of additional lower priced competitive products or of new products or product platforms could render our existing products or technologies obsolete. We also believe we will face increasing competition from alternative UC&C endpoint solutions that employ new technologies or new combinations of technologies.
Simplification of certain product technology is leading to the availability of alternative, lower cost competitive products targeted to enterprises, consumers and small businesses, which could harm sales. If we do not distinguish our products, through distinctive, technologically advanced features and designs, as well as continue to build and strengthen our brand recognition, our products may become more difficult to sell or to sell at the desired prices and financial margins. In addition, failure to effectively market our products could lead to lower and more volatile revenue and earnings, excess inventory, and the inability to recover associated development costs, any of which could have a negative impact on our business, financial condition, results of operations, and cash flows.
23
We also face competition from companies, principally located in or originating from Asia, which may be state-owned or subsidized which enables such competitors to offer low-cost products, including products modeled on, direct copies of, or counterfeits of, our products. Online marketplaces make it easier for disreputable and fraudulent sellers to introduce their copies or counterfeit products into the stream of commerce by commingling legitimate products with copies and counterfeits; thereby making it extremely difficult to track and remove copies and counterfeits. The introduction of low-cost alternatives, copies and counterfeits has resulted in and will continue to cause market pricing pressure, customer dissatisfaction and harm to our reputation and brand name. If product prices are substantially reduced by new or existing market participants, our business, financial condition, or results of operations could be materially negatively affected.
Additionally, strategic partnerships and acquisitions are being formed and announced by our competitors on a regular basis, which increases competition and can result in increased downward pressure on our product prices. As a result, competition with larger combined companies with significantly greater financial, sales and marketing resources, a larger channel network and expanded product lines is a constant threat to our market share and revenues. Competitors can sell their communications solutions product lines in conjunction with proprietary network equipment or platform technology as a complete solution, making it more difficult to compete against them or to ascertain pricing on competitive products. In addition, some competitors may use their strengths in adjacent markets to foreclose competition in the UC&C solutions market. In some cases, proprietary solutions may also preclude our competitive products from being fully interoperable with our competitors' endpoints, infrastructure and/or network products. Acquisitions or partnerships made by one of our strategic partners could also limit the potential contribution of our strategic relationships to our business and restrict our ability to form strategic relationships with these companies in the future and, as a result, harm our business. Rumored or actual consolidation of our partners and competitors may cause uncertainty and disruption to our business and can cause our stock price to fluctuate.
5. Failure to successfully navigate the challenges associated with developing, introducing, and marketing our products may adversely impact our financial results.
a.Our success depends on our ability to assimilate new technologies in our products and to properly train our channel partners, sales force and end-user customers in the use of those products.
The markets for our products are characterized by rapidly changing technology, such as the demand for HD video technology and lower cost video infrastructure products, the shift from on premise-based equipment to a mix of solutions that includes hardware and software and the option for customers to have video delivered as a service from the cloud or through a browser, evolving industry standards and frequent new product introductions, including an increased emphasis on software products, new, lower cost hardware products, and development of artificial intelligence and machine learning solutions that may make all or a portion of our products or their functionality obsolete or unnecessary. Historically, our focus has been on premise-based solutions for the enterprise and public sector, targeted at vertical markets, including finance, manufacturing, government, education and healthcare. In addition, in response to emerging market trends, and the network effect driven by business-to-business and business-to-consumer adoption of UC&C, we are expanding our focus to capture opportunities within emerging markets including mobile, small and medium businesses (“SMBs”), and cloud-based delivery. If we are unable to successfully capture these markets to the extent anticipated, or to develop the new technologies and partnerships required to successfully compete in these markets, then our revenues may not grow as anticipated, and our business may ultimately be harmed. Given the competitive nature of the mobile industry, changing end user behaviors and other industry dynamics, these relationships may not evolve into fully developed product offerings or translate into any future revenues.
b. The success of our new products depends on several factors which, if not achieved, could adversely impact our financial results.
The success of our new product introductions depends on a number of factors, including proper new product definition, product cost, infrastructure for services and cloud delivery, timely completion and introduction of new products, proper positioning and pricing of new products in relation to our total product portfolio and their relative pricing, differentiation of new products from those of our competitors and other products in our own portfolio, market acceptance of these products and the ability to sell our products to customers as comprehensive UC&C solutions. Other factors that may affect our success include properly addressing the complexities associated with compatibility issues, channel partner and sales strategies, sales force integration and training, technical and sales support, and field support. As a result, it is possible that investments that we are making in developing new products and technologies may not yield the planned financial results.
24
We also need to continually educate and train our channel partners to avoid any confusion as to the desirability of new product offerings and solutions compared to our existing product offerings and to be able to articulate and differentiate the value of new offerings over those of our competitors. As the market evolves, our distribution model and channel partners may change as well. During the last few years, we have announced and launched several new product offerings, both independently and jointly with our strategic partners, including new software, hardware and cloud-based solutions, and these new products could cause confusion among our channel partners and end-users, thereby causing them to delay purchases of our new products until they determine their market acceptance, or as they consider a more comprehensive UC&C strategy versus point product or endpoint only deployments. Any delays in future purchases could adversely affect our revenues, gross margins and operating results in the period of the delay.
The communications market shift to fully- integrated solutions, cloud-based/hybrid offerings and new business models over time may require us to add new channel partners, enter new markets and gain new core technological competencies. We are attempting to address these needs and the need to develop new products through our internal development efforts, through joint developments with other companies and through acquisitions. However, we may not identify successful new product opportunities and develop and bring products to market in a timely manner. Further, as we introduce new products, these product transition cycles may not go smoothly, causing an increased risk of inventory obsolescence and relationship issues with our end-user customers and channel partners. The failure of our new product development efforts, any inability to service or maintain the necessary third-party interoperability licenses, our inability to properly manage product transitions or to anticipate new product demand, or our inability to enter new markets would harm our business and results of operations.
c. We may experience delays in product introductions and availability, and our products may contain defects which could seriously harm our results of operations.
We have experienced delays in the introduction of certain new products and enhancements in the past. The delays in product release dates that we experienced in the past have been due to factors such as unforeseen technology issues, third-party changes to technology, manufacturing ramping issues, availability of component parts, and other factors, which we believe negatively impacted our revenue in the relevant periods. In addition, we have experienced delays in product certifications required with respect to our new product releases. Any of these or other factors may occur again and delay our future product releases. As such, disruption due to geopolitical conflicts, public health, or natural disasters could create an increased risk of delays in new product introductions.
Our communications equipment includes both hardware and software and incorporates new technologies and component parts from different suppliers. Resolving product defect and technology and quality issues could cause delays in new product introductions. Further, some defects may not be detected or cured prior to a new product launch or may be detected after a product has already been launched and may be incurable or result in a product recall. The occurrence of any of these events could result in the failure of a partial or entire product line or a withdrawal of a product from the market. We may also have to invest significant capital and other resources to correct these problems, including product re-engineering expenses and inventory, warranty and replacement costs. These problems might also result in claims against us by our customers or others and could harm our reputation and adversely affect future sales of our products.
Any delays for new product offerings recently announced or currently under development, including product offerings for mobile, cloud-based delivery, software delivery or any product quality issues, product defect issues or product recalls could adversely affect the market acceptance of these products, our ability to compete effectively in the market, and our reputation with our customers, and therefore could lead to decreased product sales and could harm our business. We may also experience cancellation of orders, difficulty in collecting accounts receivable, increased service and warranty costs in excess of our estimates, diversion of resources and increased insurance costs and other losses to our business or to end-user customers.
d. We face risks related to building products dependent upon third-party platforms or technologies.
We have invested significant resources developing products that are dependent on third party unified communication as a service (UCaaS) and video conferencing as a service (VCaaS) platforms and software. We made the decision to design our products to work with different third-party platforms and software to offer customers greater choice and flexibility, while expanding our ecosystem partners and enhancing their unique value differentiation through our products. If these partners’ solutions do not gain adoption and growth, it could impact the sales of our endpoint devices. If other hardware manufacturers follow the Company’s strategy and enter into the market, thereby increasing competition, we could see less market demand or revenue for our products. Lastly, the third-party platforms may be, or become, competitors of ours who have chosen, or in the future may choose, to design competing products for their
25
platforms and offer features for their own hardware platforms to provide further differentiated features that may be perceived as better than our products, or they may choose not to work with us. If third parties are unwilling to provide us access to their platforms or technologies, or if such access is withdrawn, denied, or delayed, or if access is provided under terms that are not commercially reasonable, our business and operations could be adversely affected. We believe though that customers want the ability of choice and quality that Poly products provide.
In addition, we develop such products or make product enhancements based upon anticipated demand for new features and functionality. Our business and revenues may be harmed if: the use of our agnostic platform does not occur; we do not anticipate shifts in technology appropriately or rapidly enough; the development of suitable sales channels does not occur, or occurs more slowly than expected; our products are not priced competitively or are not readily adopted; or the adoption rates of the third-party software applications do not drive demand for our products as we anticipate.
Although we believe increased sales of these remote working solutions will drive increased demand for our hardware and software platform products, such increased demand may not occur, or we may not benefit to the same extent as our competitors. We also may not be successful in creating demand in our installed customer base for products that we develop that incorporate these new partner platforms.
e. Product obsolescence or discontinuance and excess inventory can negatively affect our results of operations.
The pace of change in technology and in the release of new products has increased and is expected to continue to increase, which can often render existing or developing technologies obsolete more quickly. In addition, the introduction of new products and any related actions to discontinue existing products can cause existing inventory to become obsolete. These obsolescence issues, or any failure by us to properly anticipate product life cycles, can require write-downs in inventory value. For each of our products, the potential exists for new products to render existing products obsolete, cause inventories of existing products to increase, cause us to discontinue a product or reduce the demand for existing products.
Further, we continually evaluate our product lines both strategically and in terms of potential growth rates and margins. Such evaluations could result in the discontinuance or divestiture of those products in the future, which could be disruptive and costly and may not yield the intended benefits.
f. The increased use of software in our products could impact the way we recognize revenue, which could adversely impact our financial results.
We are increasingly incorporating advanced software features and functionalities into our products, offering firmware and software fixes, updates, and upgrades and developing Internet based software-as-a-service offerings that provide additional value that complements our products. As the nature and extent of software integration in our products increases, or if sales of standalone software applications or services become material, the way we report revenue related to our products and services could be significantly affected. For example, we are increasingly required to evaluate whether our revenue transactions include multiple deliverables and, as such, whether the revenue generated by each transaction should be recognized upon delivery, over a period of time or apportioned and recognized based on a combination of the two. Moreover, the software and services revenue recognition rules are complex and dynamic. If we fail to accurately apply these complex rules and policies, particularly to new and unique products or services offerings, we may incorrectly report revenues in one or more reporting periods, which could materially and adversely impact our results for the affected periods, cause our stock price to decline, and result in securities class actions or other similar litigation.
g. Lower than expected market acceptance of our products, price competition and other price changes would negatively impact our business.
If the market does not accept our products, particularly our new product offerings on which we are relying for future revenues, such as product offerings for platform software, new hardware products and cloud-based delivery, our business and operating results could be harmed. Further, revenues relating to new product offerings are unpredictable and new products typically have lower gross margins for a period of time after their introduction and higher marketing and sales costs. As we introduce new products, they could increasingly become a higher percentage of our revenues. Our profitability could also be negatively affected in the future as a result of continuing competitive price pressures in the sale of UC&C solutions equipment and UC platform products. Further, in the past we have reduced prices in order to expand the market for our products, and in the future, we may further reduce prices, introduce new products that carry lower margins in order to expand the market or stimulate demand for our products, or discontinue existing products as a means of stimulating growth in a new product.
26
Finally, if we do not fully anticipate, understand and fulfill the needs of end-user customers in the vertical markets that we serve, we may not be able to fully capitalize on product sales into those markets and our revenues may, accordingly, fail to grow as anticipated or may be adversely impacted. We face similar risks as we expand and focus our business on the SMB and service provider markets. In light of COVID-19, there are shifts in end user needs, including for example, increased work from home, telemedicine, tele-education, and other remote services that are exacerbated in a pandemic, which may present opportunities for growth. However, if we fail to take advantage of such changes and they impact our products, we may risk missing a critical market shift.
6. Failure to adequately service and support our product offerings, or a decline in demand for our service offerings, could harm our results of operations.
In some instances, the complexity of our products and associated technologies has increased the need for enhanced product warranty and service capabilities, including integration services, which may require us to develop or acquire additional advanced service capabilities and make additional investments. If we cannot adequately develop and train our internal support organization or maintain our relationships with our outside technical support providers, it could adversely affect our business.
In addition, sales of our immersive telepresence solutions are complex sales transactions, and the end-user customer may purchase an enhanced level of support service from us to ensure that its significant investment can be fully operational and realized. This requires us to provide advanced services and project management in terms of resources and technical knowledge of the customer’s telecommunication network. If we are unable to provide the proper level of support on a cost-efficient basis, it may cause damage to our reputation in this market and may harm our business and results of operations.
In other instances, however, we are introducing new generation, less complex, product solutions, as companies shift from on premises to work from home options for their workforce. This shift in work environment has resulted in a decreased demand for our professional, installation and managed service offerings, which typically cater to on premises enterprise businesses. If we continue to experience a decline in our service offerings, our gross margins will experience downward pressure.
Additionally, we have invested and continue to invest in product management, analytics and personal device service offerings, such as Poly Lens and Poly+, to grow revenue, improve gross margins and drive increased profitability. Our future growth and profitability are tied to our ability to successfully bring to market these new and innovative services offerings, including cloud management and insights solutions. We are investing significant time, resources and money into our services offerings without expectation that they will provide material revenue in the near term and without any assurance they will succeed. Moreover, we expect that as we continue to explore, develop and refine new offerings they will continue to evolve, may not generate sufficient interest by end customers, may create channel conflicts with our existing hardware distribution partners, and we may be unable to compete effectively, generate significant revenues or achieve or maintain acceptable levels of profitability.
Additionally, our experience with cloud services offerings is limited. We are also substantively reliant on third-party service providers for significant aspects of our offerings and over whom we have little or no market power regarding pricing, support, service levels and compliance. If we do not successfully execute our cloud strategy or anticipate the needs of our customers, our credibility as a cloud services provider could be questioned and our prospects for future revenue growth and profitability may never materialize.
Moreover, if our new and evolving business model offerings achieve market acceptance, differences in revenue recognition treatment may cause short-term revenue declines or increase expenditures for operational, administrative and technical support. Accordingly, if we fail to successfully launch, manage and maintain our new and evolving services offerings future revenue growth and profitability may be limited and our business significantly harmed.
7. We face risks related to our dependence on channel partners and strategic partners to sell our products.
a.We rely on third parties to sell and distribute our products. Disruption of our relationship with these channel partners and/or our failure to manage our channel inventory, could adversely affect our business, results of operations, operating cash flows and financial condition.
We sell our products through a global network of distributors and channel partners, including value-added resellers, integrators, direct marketing resellers, service providers, wireless carriers as well as through both traditional and online retailers and e-commerce channels. The impact of economic conditions, labor issues, natural disasters, regional or
27
global pandemics, evolving customer preferences, and purchasing patterns on our distribution partners, or competition between our sales channels, could result in sales channel disruption.
Additionally, any loss of a major partner or distribution channel or other channel disruption, including continued consolidation of our distributors, could make us more dependent on alternate channels, could increase pricing and promotional pressures from other partners and distribution channels, increase our marketing costs, adversely impact buying and inventory patterns, payment terms or other contractual terms, sell-through or delivery of our products to consumers, could curtail our routes-to-market, and damage our reputation, brand equity, market share and profitability. Our sales channel partners also sell products offered by our competitors, and if competitors offer our sales channel partners more favorable terms, have more products available to meet their needs, or utilize the leverage of broader product lines sold through the channel, then our sales channel partners may de-emphasize or decline to carry our products, which would adversely affect our business.
The Company must manage both Company-owned and channel inventory effectively, particularly with respect to sales to distributors, which involves forecasting demand, pricing challenges, and analyzing point of sales information regarding sales to resellers and end users that our channel partners provide. Our forecasts may not accurately predict demand, and distributors may increase orders during periods of product shortages or may request to cancel orders or delay orders in anticipation of new products. Distributors also may adjust their orders in response to the supply of our products and the products of our competitors and seasonal fluctuations in end-user demand. The Company’s reliance upon our global channel network may reduce our visibility into inventory quantities, demand and pricing trends, and therefore make forecasting more difficult. If we have excess or obsolete inventory, we may need to reduce our prices and write down inventory. In addition, factors in different markets may cause differential discounting between the geographies where our products are sold, which makes it difficult to achieve global consistency in pricing and creates the opportunity for “grey market” sales. Additionally, if our sales channel partners have excess inventory of our products or those of our competitors, or decide to decrease their inventories for any reason, then they may decrease the amount of products they acquire in subsequent periods, causing disruption in our business and adversely affecting our forecasts and sales.
In addition, current and future restrictions or disruptions of transportation, such as reduced availability of air transport, port closures, key shipping lanes, including the most recent blockage of the Panama Canal due to the running aground of a large shipping container, and/or increased border controls or closures, may also impact our ability to meet customer demand and could materially adversely affect us. Our customers and channel partners have also experienced, and may continue to experience, disruptions in their operations including as a result of COVID-19, which can result in delayed, reduced, or canceled orders, and increased collection risks, and which may adversely affect our results of operations.
b. Our strategic partnerships with companies may not yield the desired results which could harm our business.
We are focusing on our strategic partnerships and alliances with traditional partners like Microsoft and Zoom and new partners, such as Google and others. Defining, managing and developing these partnerships is expensive and time-consuming and may not yield the desired results, impacting our ability to effectively compete in the market and to take advantage of anticipated future market growth. Because our products are platform agnostic and therefore intended to perform across multiple platforms, certain of our channel partners and strategic alliance partners may perceive conflicts in our business placing one strategic alliance partner versus another.
In addition, as we enter into agreements with these strategic partners to enable us to continue to expand our relationships with these partners, we may undertake additional obligations, such as development efforts and product certifications to our partner’s standards or requirements, which could trigger unintended penalty or other provisions in the event that we fail to fully perform our contractual commitments or could result in additional costs beyond those that are planned in order to meet these contractual obligations. We are reliant on certain strategic alliances to certify our products to work on their platform, which they withhold if we are unable to meet the time frames required, or if our competitors have certifications for competitive products for which we are not yet certified, our revenues and results of operations would be negatively impacted.
Moreover, we are investing in personnel and initiatives to grow our prosumer business, with offerings directly from our online platform and indirectly through third-party marketplaces, such as Amazon. If we are unable to build relationships with new channel partners and adapt to new distribution and marketing models, or if we fail to build product adoption with our targeted customer base, we could experience an adverse impact on our results of operations and financial condition.
28
c. Conflicts between our channel partners and strategic partners and us or between or among them could arise which could harm our business.
Some of our current and future products are directly competitive with the products sold by both our channel and strategic partners. For example, Cisco, Amazon, Google and Microsoft, have developed or may develop and offer, their own data integration solutions and some of these partners are currently, and others may in the future become, competitors. These strategic partners are among the largest and most well capitalized companies in the world and may have significant competitive advantages over us, including greater name recognition, larger customer bases, and greater financial, technical, marketing, public relations, sales, distribution and other resources than us. Such competitors may be more likely to promote and sell their own solutions over our products and they may ultimately be able to transition customers onto their competing solutions, which could materially and adversely affect our revenues and growth. Further, such competitors may cease their relationships with us. As a result of these conflicts, there is the potential for our channel and strategic partners to compete head-to-head with us or to significantly reduce or eliminate their orders of our products or design our technology out of their products. Moreover, because the market for optimized telecommunication offerings is evolving to support a hybrid work environment, we expect additional competition from other established and emerging companies if this market continues to develop and expand. Increased competition from our strategic partners or from other companies that may in future decide to enter and compete in our market may significantly adversely impact our financial performance.
Further, as a result of our increased efforts to sell through a direct sales model, we may alienate some of our channel partners or cause a shift in product sales from our traditional channel model. Due to these and other factors, channel conflicts could arise which cause channel partners to devote resources to the communications equipment and services of competitors, which would negatively affect our business and results of operations.
In addition, some of our products are reliant on strategic partnerships with call management providers and wireless UC&C platform providers. These partnerships result in interoperable features between products to deliver a total solution to our mutual end-user customers. Competition with our partners in all of the markets in which we operate is likely to increase, which would adversely affect our revenues and could potentially strain our existing relationships with these companies.
d. Changes to our channel partner programs or channel partner contracts may not be favorably received and as a result our channel partner relationships and results of operations may be negatively impacted.
Our channel partners are eligible to participate in various incentive programs, subject to their contractual arrangements with us. As part of these arrangements, we generally have the right to make changes in our programs and launch new programs as business conditions warrant. Further, from time to time, we may make changes to our channel partner contracts or realign our discount and rebate programs. Our channel partners may not be receptive to future changes, and we may not receive the positive benefits that we anticipate in making any program and contractual changes.
e. Termination of one or more contracts with our channel partners may harm our results of operations.
We cannot be certain as to future order levels from our channel partners. Our channel partner contracts typically provide for the right of termination for convenience by the channel partner. In the event of a termination of one of our major channel partners, we believe that the end-user customer would likely purchase from another one of our channel partners, but if this did not occur and we were unable to rapidly replace that revenue source, its loss would harm our results of operations.
f. Our channel partners are impacted by changes in customer purchasing preferences, which may negatively impact our traditional sales channels or the prices at which we may sell our products.
It is becoming easier for small online sellers of certain product categories to enter the market unburdened with physical locations, employees and support personnel which can force our larger traditional brick and mortar resellers to reduce their selling prices. In turn, our traditional resellers may demand lower selling prices from us, more cooperative and marketing incentives, reduce their sales support needed to maintain our premium brand image, discontinue carrying our products and other similar adverse actions. As we expand our service offerings, many of our historical channel partners may be unwilling or unable to market our services forcing us to establish new or different relationships. Further, increased competition among resellers may cause some of our resellers and partners to experience financial difficulties or force them to shut down, decreasing our channels to market. The inability to establish or maintain successful relationships with distributors, OEMs, retailers, and telephony service providers or to maintain quality
29
distribution channels and sales models could negatively affect our business, financial condition, or results of operations.
g. We are subject to risks associated with our channel partners’ sales reporting, product inventories and product sell-through.
We sell a significant amount of our products to channel partners who maintain their own inventory of our products for sale to resellers and end-users. Our revenue forecasts associated with products stocked by some of our channel partners are based largely on point-of-sale information regarding their sales to resellers and end users that our channel partners provide to us. To the extent that this sales-out and channel inventory data is inaccurate or not received timely, or if our channel partners fail to provide such data at all, our revenue forecasts for future periods may be less reliable. Further, if these channel partners are unable to sell an adequate amount of their inventory of our products in a given quarter or if channel partners decide to decrease their inventories for any reason, such as a recurrence of global economic uncertainty and downturn in technology spending, the volume of our sales to these channel partners and our revenues could be negatively affected. In addition, we also face the risk that some of our channel partners have inventory levels in excess of future anticipated sales. If such sales do not occur in the time frame anticipated by these channel partners for any reason, these channel partners may substantially decrease the amount of product they order from us in subsequent periods, or product returns may exceed historical or predicted levels, which would harm our business and create unexpected variations in our financial results.
h. We are subject to risks associated with the success of the businesses of our channel partners.
Some of our channel partners that carry our products, and from whom we derive significant revenues, are thinly capitalized. Although we perform ongoing evaluations of their creditworthiness, the failure of these businesses to establish and sustain profitability, obtain financing or adequately fund capital expenditures could have a significant negative effect on our future revenue levels and profitability and our ability to collect our receivables. In addition, global economic uncertainty, including uncertainty created by the impact of COVID-19, reductions in technology spending in the United States and other countries, and periodic ongoing challenges in the financial services industry have in the past restricted, and may again in the future restrict the availability of capital which may delay collections from our channel partners beyond our historical experience or may cause companies to file for bankruptcy, jeopardizing the collectability of our receivables from such channel partners and negatively impacting our future results.
i. If our channel partners fail to comply with laws or standards, our business could be harmed.
We require our channel partners to meet certain standards of conduct and to comply with applicable laws, such as global anti-corruption, anti-bribery, and import and export control laws. Noncompliance with standards or laws could harm our reputation and could result in termination of the channel partner and/or fines, penalties, injunctions, or other harm to our business and results of operations were we to become involved in an investigation due to non-compliance by a channel partner.
8. Delays or loss of government contracts or failure to obtain or maintain required government certifications could have a material adverse effect on our business.
We sell our products both directly and indirectly and provide services to governmental entities in accordance with certain regulated contractual arrangements. While reporting and compliance with government contracts is both our responsibility and the responsibility of our partners, a lack of reporting or compliance by us or our partners could have an impact on the sales of our products to government agencies. Further, the United States federal government has certain certification and product requirements for products sold to them. If we are unable to meet or maintain applicable certification or other requirements specified by the United States federal government or to do so within the time frames required, or if our competitors have certifications for competitive products for which we are not yet certified, our revenues and results of operations would be adversely impacted.
9. Our operating results are difficult to predict, they could fluctuate, and our stock price could become more volatile and your investment could lose value.
Our stock price is subject to speculation by investors, analysts and in the press, changes in recommendations or earnings estimates by equity research analysts, changes in investors’ or analysts’ valuation measures for our stock, changes in or announcements regarding our forecasts and guidance, our credit ratings, market trends unrelated to our performance, and sales of our common stock by us, our officers or directors or unaffiliated third-party investors, particularly considering the
30
concentrated ownership of our common stock, that may limit the ability for investors to acquire or sell meaningful quantities of our stock or cause speculation as to the acquisition or sale of our stock. As we experienced in the prior fiscal year, a drop in our stock price exposed us to a securities class action lawsuit, which has resulted in substantial costs and diversion of management’s attention and resources. We may experience further derivative lawsuits arising from the claims in the class action case. Moreover, if we in the future experience a significant drop in our stock price, we again may be exposed to further securities class action lawsuits, which could negatively affect our business.
Given the nature of the markets in which we compete, our revenues and profitability vary from quarter to quarter and are difficult to predict for many reasons, including the following: fluctuating optimal inventory levels; variations in the volume and timing of orders received during each quarter; our ability to execute on our strategic and operating plans; shifts in the timing, size and types of products ordered, as well as the mix of products and services, and the geographic locations of the customers placing orders, any of which could impact gross margins depending on the various margins of the products and services ordered and foreign currency exchange rates on both revenues and expenses; the timing of customers' sales promotions and campaigns or variations in sales rates by our channel partner customers to their customers; changes to our channel partner programs, contracts, pricing and go to market strategies that could result in a reduction in the number of channel partners, adversely impact our revenues and gross margins as we realign our discount and rebate programs for our channels, or cause more of our channel partners to add our competitors’ products to their portfolios; the timing of large end customer deployments, including UC&C infrastructure; the timing and market acceptance of new product introductions by us and our competitors and obsolescence or discontinuance of existing products; competition, including pricing pressure, product features and functionality, by us, our competitors or our customers; the level and mix of inventory that we hold to meet future demand; changes to our global organization and retention of or changes in key personnel; changes in effective tax rates which are difficult to predict due to, among other things, the timing and geographical mix of our earnings, the outcome of current or future tax audits and potential new rules and regulations; failure to timely introduce new products within projected costs and reduce costs as production increases; changes in technology and desired product features, including whether those changes occur as and when anticipated; general economic conditions in the U.S. and our international markets, including foreign currency fluctuations; customer cancellations and rescheduling; misalignment between supply chain ordering and demand by customers and systems to forecast demand; the impact of changing costs of freight and components used in the manufacturing of our products and the potential negative impact on our gross margins; investments in and the costs associated with strategic initiatives; changes in the underlying factors and assumptions used in determining stock-based compensation; changes in accounting rules or their interpretation; and other factors beyond our control, including popular uprisings, terrorism, war, natural disasters, and diseases, including COVID-19. As a result of these and potentially other factors, we believe that period-to-period comparisons of our historical results of operations are not necessarily a good predictor of our future performance. If our future operating results are below the expectations of stock market securities analysts or investors, or below any financial guidance we may provide to the market, our stock price may decline. Financial guidance beyond the current quarter is inherently subject to greater risk and uncertainty, and if the transitions in our markets accelerate, our ability to forecast becomes more difficult.
Moreover, our industry is characterized by rapid technological changes, evolving industry standards, frequent new product introductions, short-term customer commitments, decreasing product life cycles, and changes in demand. Production levels are generally forecasted based on customer forecasts, which is dynamic, and to some extent historic product demand and we often place orders with suppliers for materials, components and sub-assemblies (“materials and components”) as well as finished products many weeks in advance of projected customer orders. Actual customer demand depends on many factors and may vary significantly from forecasts. We may lose opportunities to increase revenues and profits and may incur increased costs and penalties including expedited shipping fees and late delivery penalties if we underestimate customer demand.
10. Our failure to effectively enhance and develop our sales strategy and sales force, may harm our revenues and financial outcomes as a result.
a.The Company is substantially dependent on our sales force to effectively execute our sales, pricing and business strategies.
The Company believes that there is significant competition for skilled sales personnel with technical knowledge. Our ability to grow our business depends on our success in recruiting, training, and retaining sales personnel to support the Company. We periodically adjust our sales organization and our compensation programs to optimize our sales operations, to increase revenue, and to support our business model. If we have not structured our sales organization or compensation for our sales personnel in a way that properly supports our Company’s objectives, or if we fail to make changes in a timely fashion or do not effectively manage changes, the Company’s performance could be adversely affected.
31
b. We have a number of large customers with substantial market power whose ability to demand pricing and promotion concessions as well as other unfavorable terms makes sales forecasting difficult which can harm our profitability.
Many customers with whom we conduct business are quite large with substantial buying power or who have strategic importance to our product marketing objectives. Many use their buying power or strategic importance to mandate terms and conditions favorable to them to conduct business, including unfavorable payment terms. If our compliance with these or similar future provisions are incorrect or inadequate, we could be liable for breach of contract damages or our reputation with one or more key customers could be harmed, either of which could have an adverse effect on our financial condition or results of operations.
c. A significant amount of our revenues are generated, and the majority of our product manufacturing and packaging occurs, internationally, which subjects our business to risks of international sales, operations and trade.
International sales and manufacturing, marketing and sales expenses represent a significant portion of our revenues and operating expenses. In fiscal year 2022, revenues derived from sales outside of the U.S. represented approximately 54% of our total revenues. International sales and operations are subject to certain inherent risks, which would be amplified if our international business grows as anticipated, including the following: recent economic sanctions imposed, and the potential for additional economic sanctions, by the United States as well as the actual and threatened retaliatory responses by impacted nations, some of which may affect or materially delay our ability to import or sell all or a portion of our products into impacted countries; adverse economic conditions in international markets, such as the restricted credit environment and sovereign credit concerns in E&A and reduced government spending and elongated sales cycles; information technology security, environmental and trade protection measures and other legal, regulatory and compliance obligations, some of which may result in fines, penalties and other legal sanctions or affect our ability to import our products, to export our products from, or sell our products in various countries where we are deemed to be in violation of our legal or contractual obligations; the impact of government-led initiatives to encourage the purchase of products from domestic vendors or discourage relationships with certain entities, which can affect the willingness of customers or partners to purchase products from, or collaborate to promote interoperability of products with, companies headquartered in the United States; unstable or uncertain political and economic situations such as the United Kingdom’s decision to leave the European Union commonly referred to as Brexit; the impact of changes in our international operations, including changes in key personnel; compliance with global anti-corruption laws such at the United States’ Foreign Corrupt Practices Act and United Kingdom’s Bribery Act, which may be exacerbated by cultural differences in the conduct of business in various regions; foreign currency exchange rate fluctuations, including the recent volatility of the U.S. dollar, and the impact of our underlying hedging programs; reduced intellectual property rights protections in some countries; unexpected changes in regulatory requirements and tariffs; longer payment cycles, greater difficulty in accounts receivable collection and longer collection periods; and changes in tax law or interpretations thereof that could lead to potentially adverse tax consequences, such as legislation on revenue and expense allocations and transfer pricing among the Company’s subsidiaries.
Furthermore, revenues derived from sales outside of the U.S. may fluctuate as a percentage of total revenues in the future as we introduce new products. These fluctuations primarily are the result of our practice of introducing new products in North America first and the additional time and costs required for product homologation and regulatory approvals of new products in international markets. To the extent we are unable to expand international sales in a timely and cost-effective manner, or maintain or meet current international market demand or increase such demand for our products, our business could be harmed.
11. We are subject to a variety of laws and regulations relating to the import and export of our product and service offerings. Our failure to comply with such regulations could result in governmental enforcement actions, fines, penalties, or other remedies, which could have a material adverse effect on our business, results of operations, and financial condition.
We are subject to laws and regulations governing our international operations, including applicable import and export control regulations, economic sanctions on countries and persons and customs requirements. Importing and exporting has involved more risk since the beginning of 2018, as there has been increasing rhetoric, in some cases coupled with legislative or executive action, from several United States and foreign leaders regarding tariffs against foreign imports of certain materials. For example, the U.S. government imposed significant tariffs on China related to the importation of certain product categories following the U.S. Trade Representative’s Section 301 investigation. Additionally, export of our product and service offerings also are subject to various “domestic and international” export control regulations (“Export Regulations”), some of which are described in more detail below, and may require a license from the U.S. Department of State, the U.S. Department of Commerce, or the U.S. Department of the Treasury. Any changes in these Export
32
Regulations may restrict the export of our products and/or services, and we may cease to be able to procure export licenses for our products and/or services under existing regulations. The area of Export Regulations remains fluid in terms of regulatory developments. Should we need an export license under existing regulations, the length of time required by the licensing process can vary, potentially delaying the shipment of products and the recognition of the corresponding revenue. We have no control over the time it takes to process an export license. Any restriction on the export of a significant product line or a significant amount of our products could cause a significant reduction in revenue.
In addition, effective June 29, 2020, the U.S. Commerce Department’s Bureau of Industry and Security (“BIS”) published regulations tightening export controls on China, Russia and Venezuela with respect to goods, software and technology, including increasing the licensing requirements and due diligence expectations that apply to trade with, China, Russia and Venezuela under the U.S. Export Administration Regulations (“EAR”) when “military end users” or “military end uses” are involved. This rule expands the scope of the licensing requirement by redefining “military end use” more broadly and by increasing the number of products subject to the restriction. This expanded military end use restriction has had a significant impact on trade with China and increase associated export control compliance burdens, costs and risks associated with such compliance. Moreover, it is possible that the U.S. government may take further measures in the future to impose stricter Export Regulations on items destined for China and other countries outside of the U.S. or impose additional duties on shipments made from such countries. The U.S. government also may add additional parties to the Entity List, which could harm our business, increase the cost of conducting our operations in countries outside of the U.S., particularly China, or result in retaliatory actions against U.S. interests.
We have had, and may discover in the future, deficiencies in our compliance with Export Regulations. Although we continue to enhance our compliance programs relating to Export Regulations, we cannot assure that any such enhancements will ensure that we are in compliance with applicable laws and regulations at all times, or that applicable authorities will not raise compliance concerns or perform audits to confirm our compliance with applicable laws and regulations. Any failure by us to comply with applicable laws and regulations could result in governmental enforcement actions, fines or penalties, criminal and/or civil proceedings, or other remedies, any of which could have a material adverse effect on our business, results of operations, and/or financial condition.
In addition, the U.S. government has exercised additional trade-related powers in a manner that could have a material adverse impact on our business, financial condition or results of operations. For example, on May 15, 2019, then-President Trump issued an executive order that invoked national emergency economic powers to implement a framework to regulate the acquisition or transfer of information communications technology in transactions that imposed undue national security risks. The executive order was subject to implementation by the Secretary of Commerce and purports to apply to contracts entered into prior to the effective date of the order. On January 19, 2021, the U.S. Department of Commerce published interim final rules in the Federal Register, subject to public notice and comment, which purport to permit the Department of Commerce to investigate transactions involving the use of information communications technology products or services provided by persons owned or controlled by certain nations, including China, and potentially to modify or prohibit those transactions. In addition, the White House, the Department of Commerce and other executive branch agencies have implemented additional restrictions and may implement still further restrictions that would affect conducting business with certain Chinese companies. We cannot predict whether these recent rules and restrictions will be implemented and acted upon by the Biden administration, modified, overturned or vacated by legal action. Although we continue to work with our vendors to mitigate our exposure to current or potential tariffs, there can be no assurance that we will be able to offset any increased costs.
Additionally, a significant portion of the products we sell is originally manufactured in countries other than the United States. International trade disputes that result in tariffs and other protectionist measures could adversely affect our business, including disruption in and cost increases for sourcing our merchandise and increased uncertainties in planning our sourcing strategies and forecasting our margins. Moreover, government policies on international trade and investments such as import quotas, capital controls, taxes or tariffs, whether adopted by individual governments or regional trade blocs, can delay or prohibit the import or export of our products, affect demand for our products and services, impact the competitiveness of our products or prevent us from manufacturing or selling products in certain countries.
The implementation of more restrictive trade policies, including the imposition of tariffs, the imposition of more restrictive trade compliance measures, or the renegotiation of existing trade agreements by the U.S. or by countries where we sell our products and services or procure supplies and other materials incorporated into our products, including in connection with the U.S. and Mexico border crisis, the increasing trade tensions and tariffs with China and Chinese threats of retaliation, the economic sanctions against Russia, and the U.K.'s withdrawal from the EU, could adversely affect our business. Any failure to comply with such regulations could result in governmental enforcement actions, fines, penalties, or other remedies, which could have a material adverse effect on our business, results of operations, and financial condition.
33
12. Changes in our management may cause uncertainty in, or be disruptive to, our business. Certain of our directors and management team members have been with us in those capacities for only a short time.
The Company’s success depends upon the continued services of executive officers and other key personnel, as well as its ability to effectively transition to their successors. We have recently experienced significant changes in our senior leadership, including the appointment of a new Chief Executive Officer, Chief Legal Officer, Chief Supply Chain Officer, and Vice President of Corporate Strategy, and established new positions reporting to the CEO, including a Senior Vice President of Public Affairs and a Chief Transformation Officer. Additionally, in Fiscal Year 2021, one of our directors resigned as a result of the sale by Siris Capital Group, LLC of its holdings in our stock, and another director retired. We hired one new director in Fiscal Year 2021 and one new director in Fiscal Year 2022. Although we have endeavored to implement any management and director transition in a non-disruptive manner, such transitions might impact our business, and give rise to uncertainty among our customers, investors, vendors, employees and others concerning our future direction and performance, which may materially and adversely affect our business, financial condition, results of operations and cash flows, and our ability to execute our business model.
In addition, because certain members of our management and Board have served in their respective capacities for only limited durations, we face the additional risks that these persons have limited familiarity with our past practices, our business and our industry and lack established track records in managing our business strategy.
In addition, the Company has recently experienced turnover in other key leadership roles. Any future changes to the executive management team, including hires or departures, could cause further disruption to the business and have a negative impact on operating performance, while these operational areas are in transition. The Company can provide no assurance that it will find suitable successors to key roles as transitions occur or that any identified successor will be successfully integrated into its management team.
We also believe that our future success will depend in large part upon our ability to attract, motivate and retain highly skilled technical, management, sales, and marketing personnel at all levels of the organization. Due to labor shortages and inflationary wage pressure, there is intense competition for qualified talent, which combined with the salary, benefits and other costs required to employ the right personnel, may make it difficult to achieve our financial goals. Consequently, we may not be successful in attracting, motivating and retaining such personnel, and our failure to do so could have a negative effect on our business including our ability to successfully develop, introduce, and market our products which may adversely impact our operating results, or financial condition.
13. Business interruptions due to manmade or natural disasters, or other significant disruptions in, or breaches in security of, our products, our website or information technology systems, including breaches of technology systems of our third-party suppliers, could adversely affect our business operations.
a.Factors or events outside of our control including, without limitation, war, terrorism, public health issues, natural disasters, or other business interruptions, whether in the U.S. or abroad, have caused or could cause damage or disruption to international commerce by creating economic and political uncertainties that may have a strong negative impact on the global economy, us, and our suppliers or customers.
Our major business operations and those of many of our vendors and their sub-suppliers are subject to interruption by disasters, including, without limitation, earthquakes, floods, and volcanic eruptions or other natural or manmade disasters, fire, power shortages, terrorist attacks and other hostile acts, public health issues, flu or similar epidemics or pandemics, and other events beyond our control and the control of our suppliers.
Our corporate headquarters are located in Northern California, a region known for seismic activity. A significant natural disaster, such as an earthquake, a fire (such as the recent extensive wildfires in California), localized extended outages of critical utilities (such as California’s public safety power shut-offs) or transportation systems, or any critical resource shortages, could cause a significant interruption in our business, damage or destroy our facilities and cause us to incur significant costs, any of which could harm our business, financial condition and results of operations. While we are partially insured for earthquake-related losses or floods, our operating results and financial condition could be materially affected in the event of a major earthquake or other natural or manmade disaster as the insurance we maintain against fires, earthquakes and other natural disasters may not be adequate to cover losses in any particular case.
In the case of our managed services business, any circuit failure or downtime could affect a significant portion of our customers. Since our ability to attract and retain customers depends on our ability to provide customers with highly reliable service, even minor interruptions could harm our reputation, require that we incur additional expense to
34
acquire alternative telecommunications capacity, or cause us to miss contractual obligations, which could have a material adverse effect on our operating results and our business.
Our website is an important presentation of our company, identity and brands and an important means of interaction with and source of information for our channel partners and end user customers alike. We also rely on our centralized information technology systems for product-related information and to store intellectual property, forecast our business, maintain financial records, manage operations and inventory, and operate other critical functions. The secure maintenance of this information and technology is critical to our business operations. We have implemented multiple layers of security measures designed to protect the confidentiality, integrity, availability and privacy of this data and the systems and devices that store and transmit such data. We utilize current security technologies, and our defenses are monitored and routinely tested internally and by external parties. Despite these efforts, threats from malicious persons and groups, new vulnerabilities and advanced new attacks against information systems create risk of cybersecurity incidents. These incidents can include, but are not limited to, gaining unauthorized access to digital systems for purposes of misappropriating assets or sensitive information, corrupting data, or causing operational disruption. Because the techniques used to obtain unauthorized access, disable or degrade service, or sabotage systems change frequently and may not immediately produce signs of intrusion, we may be unable to anticipate these incidents or techniques, timely discover them, or implement adequate preventative measures.
In addition, in the event that our or our service providers’ information technology systems or manufacturing or logistics abilities are hindered by any of the events discussed above, shipments could be delayed, resulting in missed financial targets, such as revenue and shipment targets, for a particular quarter.
b. Cyber-attacks on our networks, actual or perceived security vulnerabilities in our products and services, physical intrusion into our facilities, and loss of critical data and proprietary information could have a material negative impact on our business and results of operations.
There are numerous and evolving security risks, including cybersecurity and privacy, criminal hackers, state-sponsored intrusions, industrial espionage, employee malfeasance, cyber intrusion on the tools that we use in the performance of our business, and human or technological error. Computer hackers and others routinely attempt to breach the security of technology products, services, and systems such as ours, and those of customers, partners, third parties’ contractors and vendors, and some of those attempts may be successful. We are not immune to these types of intrusions.
For example, our customers can use certain of our product offerings that provide product management and analytics, such as Poly Lens, that collect, use, and store certain PII regarding a variety of individuals in connection with their operations. Our customers rely on our technologies for the secure transmission of such sensitive and confidential information in the conduct of their business. We are also subject to existing and proposed laws and regulations, as well as government policies and practices, related to cybersecurity, privacy and data protection worldwide. National, state, and local governments and agencies in the countries in which we or our customers operate have adopted, are considering adopting, or may adopt laws and regulations regarding the collection, use, storage, transfer, processing, protection, and disclosure of PII obtained from individuals. Privacy and data protection laws are particularly stringent, and the costs of compliance with and other burdens imposed by such laws, regulations, and standards, or any alleged or actual violation, may limit the use and adoption of our products and services. Further, complying with privacy laws, regulations, or other obligations relating to privacy, data protection, or information security have caused and will continue to cause us to incur substantial operational costs and may require us to periodically modify our data handling practices. Moreover, compliance may impact demand for our offerings and force us to bear the burden of more onerous obligations in our contracts. Non-compliance could result in proceedings against us by governmental entities or others, could result in substantial fines or other liability, and may otherwise impact our business, financial condition and operating results.
Although we take physical and cybersecurity seriously and devote significant resources and deploy protective network security tools and devices, data encryption and other security measures to prevent unwanted intrusions and to protect our systems, products and data, we have and will continue to experience attacks of varying degrees in the conduct of our business. Cyber attackers tend to target the most popular products, services and technology companies, which can include our products, services or networks. As a result, our network is subject to unauthorized access, viruses, embedded malware and other malicious software programs. In addition, outside parties may attempt to fraudulently induce employees or customers to disclose information in order to gain access to our employee, vendor or customer data. Unauthorized access to our network, data or systems could result in disclosure, modification, misuse, loss, or destruction of company, employee, customer, or other third-party data or systems, the theft of sensitive or confidential data including intellectual property and business and personal information, system disruptions, access to our financial
35
reporting systems, operational interruptions, product or shipment disruptions or delays, and delays in or cessation of the services we offer.
Any breaches or unauthorized access could ultimately result in significant legal and financial exposure, litigation, regulatory and enforcement action, and loss of valuable company intellectual property. Affected parties or government authorities could initiate legal or regulatory actions against us in connection with any security breaches or improper disclosure of data, which could cause us to incur significant expense and liability or result in orders or consent decrees forcing us to modify our business practices. Such breaches could also cause damage to our reputation, impact the market’s perception of us and of the products and services that we offer, and cause an overall loss of confidence in the security of our products and services, resulting in a negative impact on our business, revenues and results of operations, as well as customer attrition.
In addition, the cost and operational consequences of investigating, remediating, eliminating and putting in place additional information technology tools and devices designed to prevent actual or perceived security breaches, as well as the costs to comply with any notification obligations resulting from such a breach, could be significant and impact margins. Further, due to the growing sophistication of the techniques used to obtain unauthorized access to or to sabotage networks, systems, or our products, which change frequently and often are not detected immediately by existing anti-virus and other detection tools, we may be unable to anticipate these techniques or to implement adequate preventative measures. We can make no assurance that we will be able to detect, prevent, timely and adequately address or mitigate such cyber-attacks or security breaches.
c. Our ability to process purchase orders and ship products in a timely manner depends on our IT systems and performance of the systems and processes of third parties such as our suppliers, manufacturers, customers or other partners, as well as the interfaces between our systems and the systems of such third parties.
Some of our business processes depend upon our IT systems, the systems and processes of third parties, and the interfaces of our systems with the systems of third parties. For example, our order entry system feeds information into the systems of our manufacturing systems, which enables us and our supply chain to build and ship products. If these systems fail or are interrupted, our processes may operate at a diminished level or not at all. This could negatively impact our ability to ship products or otherwise operate our business, and our financial results could be harmed. Any systems failure or interruptions during the transition may impair communications with our manufacturers and customers, and, therefore, adversely affect our ability to build and ship our products. If our systems, the systems and processes of those third parties, or the interfaces between them experience delays or fail, our business processes and our ability to build and ship products could be impacted, and our financial results could be harmed.
14. Critical accounting estimates involve the use of judgements and if actual results vary from our estimates or assumptions underlying such estimates, our financial results could be negatively affected.
Our most critical accounting estimates are described in Management’s Discussion and Analysis found in Item 7 of this Annual Report on Form 10-K under the section entitled “Critical Accounting Estimates.” Because, by definition, these estimates and assumptions involve the use of judgment, our actual financial results may differ from these estimates. For example, we have assessed various accounting estimates and other matters, including those that require consideration of forecasted financial information, in context to the unknown future impacts of COVID-19 using information that is reasonably available at this time. The accounting estimates and other matters we have assessed include, but are not limited to, goodwill and other long-lived assets, allowance for doubtful accounts, valuation allowances for tax assets, inventory and related reserves, including purchase commitments, and revenue recognition. As COVID-19 continues to develop, we may make changes to these estimates and judgments, which could result in meaningful impacts to our financial statements in future periods. If our estimates or assumptions underlying such contingencies and reserves prove incorrect, we may be required to record additional adjustments or losses relating to such matters, which would negatively affect our financial results.
We have a significant amount of goodwill and intangible assets on our consolidated balance sheet as of April 2, 2022. Goodwill and intangible asset impairment analysis and measurement requires significant judgment on the part of management and may be impacted by a wide variety of factors, both within and beyond our control.
We are required to annually test goodwill to determine if impairment has occurred, either through a quantitative or qualitative analysis. Additionally, interim reviews must be performed whenever events or changes in circumstances indicate that impairment may have occurred. If the testing performed indicates that impairment has occurred, we are required to record a non-cash impairment charge for the difference between the carrying value of the goodwill and the implied fair value of the goodwill in the period the determination is made. Intangible assets with finite lives are reviewed
36
for recoverability whenever events or changes in circumstances indicate that the carrying amount of the related asset group may not be recoverable. Factors that may be considered when determining if the carrying value of our goodwill or intangible assets may not be recoverable include a significant decline in our expected future cash flows or a sustained, significant decline in our stock price and market capitalization.
In March 2020, we identified a triggering event which resulted in a non-cash impairment charge of $180 million relating to the Company’s Intangible Assets and Property, Plant, and Equipment related to long-lived assets in the Voice asset group, as well as a non-cash impairment charge of $484 million to Goodwill due to an overall decline in the Company’s earnings and sustained decrease in our stock price. If the factors triggering the impairment noted herein continue or worsen due to COVID-19 and other factors outside of the Company’s control, the Company may experience a further negative impact on its financial results as well as risks associated with our design and operation of internal controls.
15. We operate in multiple tax jurisdictions globally. Our corporate tax rate may increase, or we may incur additional tax liabilities, and/or changes in applicable tax regulations and resolutions of tax disputes could negatively impact our cash flow, financial condition and results of operations.
We have significant operations in various tax jurisdictions throughout the world, and a substantial portion of our taxable income has historically been generated in jurisdictions outside of the U.S. Changes in foreign tax laws that seek to impose withholding taxes on the repatriation of cash or increase foreign tax rates on overseas earnings could negatively impact our cash flow, financial condition and results of operations.
Various governmental tax authorities have recently increased their scrutiny of tax strategies employed by corporations and individuals. If U.S. or other foreign tax authorities change applicable tax laws or successfully challenge the manner in which our profits are currently recognized, our overall taxes could increase, and our business, cash flow, financial condition, and results of operations could be materially adversely affected. It is possible that tax authorities may disagree with certain positions we have taken, and any adverse outcome of such a review or audit could have a negative effect on our financial position and operating results.
We are also subject to examination by the Internal Revenue Service ("IRS") and other tax authorities, including state revenue agencies and foreign governments. While we regularly assess the likelihood of favorable or unfavorable outcomes resulting from examinations by the IRS and other tax authorities to determine the adequacy of our provision for income taxes, there can be no assurance that the actual outcome resulting from these examinations will not materially adversely affect our financial condition and results of operations.
The evolving global tax landscape applicable to multinational businesses may have a material impact to our business, cash flow from operating activities, or financial results. Such developments, for example, may include certain United States’ proposals as well as the Organization for Economic Co-operation and Development’s, the European Commission’s and certain major jurisdictions’ heightened interest in taxation. Furthermore, governments’ responses to the economic impact of COVID-19 may lead to tax rule changes that could materially and adversely affect our cash flows and financial results.
Additionally, as a global enterprise, we cannot be certain of the tax outcome related to many transactions and calculations. Uncertainties arise as a consequence of positions taken regarding valuation of deferred tax assets, net operating loss carryforwards and tax credit carryforwards that maybe used in certain tax jurisdictions to offset future taxable income and reduce income taxes payable. Each quarter, we determine the probability that the deferred tax assets will be realized. This determination involves judgment and the use of significant estimates and assumptions, including historical operating results, expectations of future taxable income and tax planning strategies. Realization of net deferred tax assets ultimately depends on the existence of sufficient taxable income. If unfavorable changes in the financial outlook of our operations continue or increase, our financial position could be negatively impacted. On the basis of this evaluation, as of April 2, 2022, a valuation allowance against our U.S. federal and state deferred tax assets continues to be maintained for the year ended April 2, 2022.
16. Our substantial indebtedness could adversely affect our financial condition and prevent us from fulfilling our obligations under the notes and our other debt instruments.
As a result of the Polycom Acquisition, we have a substantial amount of debt. As of April 2, 2022, we had $1,500.3 million of debt outstanding, which consisted of a $1,005.5 million term loan under our Credit Agreement and $494.7 million of outstanding senior notes, net of unamortized debt issuance costs.
On February 25, 2021, the company and Polycom entered into a purchase agreement (the “Purchase Agreement”) with Morgan Stanley & Co. LLC, as the representative of the several initial purchasers named therein (the “Initial Purchasers”), pursuant to which the Company agreed to sell, and subject to the terms and conditions set forth therein, the Initial
37
Purchasers, jointly and severally, agreed to buy $500,000,000 aggregate principal amount of the Company’s 4.750% Senior Notes due 2029 (the “4.75% Senior Notes”). On March 4, 2021, the Company completed its private offering of $500 million aggregate principal amount of its 4.75% Senior Notes in accordance with Rule 144A and Regulation S under the Securities Act of 1933, as amended (the “Securities Act”). The 4.75% Senior Notes were issued pursuant to an indenture (the “Indenture”), dated March 4, 2021, among the Company, the subsidiary guarantors party hereto from time to time and U.S. Bank National Association, as trustee. The Company used the proceeds from the offering of the 4.75% Senior Notes, along with cash on hand, to fund the redemption in full of the Company’s outstanding 5.50% Senior Notes due 2023 (the “5.50% Senior Notes”) and to pay related fees and expenses in May 2021.
Our ability to make scheduled payments or to refinance our obligations with respect to the notes and our other indebtedness under our Credit Agreement will depend on our financial and operating performance, which, in turn, is subject to prevailing economic and industry conditions and other factors, including the availability of financing in the banking and capital markets, beyond our control. If our cash flow and capital resources are insufficient to fund our debt service obligations and other commitments, then we could face substantial liquidity problems and may be forced to reduce or delay scheduled expansions and capital expenditures, sell material assets or operations, obtain additional capital, or restructure or refinance our indebtedness. We may be unable to effect any of these actions on a timely basis, on commercially reasonable terms or at all, or these actions may be insufficient to meet our capital requirements. In addition, any refinancing of our indebtedness could be at higher interest rates, particularly in the current environment of rising interest rates, and may require us to comply with more onerous covenants, which could further restrict our operations and impact directly our net income. If we cannot make scheduled payments on our indebtedness, we will be in default and, as a result, our debt holders could declare all outstanding principal and interest to be due and payable, and we could be forced into bankruptcy or liquidation.
Our current debt under the Credit Agreement has a floating interest rate that is based on variable and unpredictable U.S. and international economic risks and uncertainties and an increase in interest rates may negatively impact our financial results. We enter into interest rate hedging transactions that reduce, but do not eliminate, the impact of unfavorable changes in interest rates. There is no guarantee that our hedging efforts will be effective or, if effective in one period will continue to remain effective in future periods.
Our Credit Agreement utilizes London Interbank Offered Rate (LIBOR) to calculate the amount of accrued interest on any borrowings. Regulators in certain jurisdictions including the United Kingdom and the United States have announced the desire to phase out the use of LIBOR. The transition from LIBOR to a new replacement benchmark is uncertain at this time and the consequences of such developments cannot be entirely predicted but could result in an increase in the cost of our borrowings under our existing credit facility and any future borrowings.
In addition, the mandatory debt repayment schedule of the Credit Agreement may negatively impact our cash position, further reduce our financial flexibility, and cause concerns with analysts and investors. Furthermore, any changes by rating agencies to our credit rating in connection with such indebtedness may negatively impact the value and liquidity of our debt and equity securities.
Should any of the risks referenced above or related risks occur, our operations and financial results may be materially negatively impacted.
17. Our ability to process purchase orders and ship products in a timely manner depends on our IT systems and performance of the systems and processes of third parties such as our suppliers, manufacturers, customers or other partners, as well as the interfaces between our systems and the systems of such third parties.
Some of our business processes depend upon our IT systems, the systems and processes of third parties, and the interfaces of our systems with the systems of third parties. For example, our order entry system feeds information into the systems of our manufacturing systems, which enables us and our supply chain to build and ship products. If these systems fail or are interrupted, our processes may operate at a diminished level or not at all. This could negatively impact our ability to ship products or otherwise operate our business, and our financial results could be harmed. Any systems failure or interruptions during the transition may impair communications with our manufacturers and customers, and therefore, adversely affect our ability to build and ship our products. If our systems, the systems and processes of those third parties, or the interfaces between them experience delays or fail, our business processes and our ability to build and ship products could be impacted, and our financial results could be harmed.
18. We are regularly subject to a wide variety of litigation, including commercial and employment litigation, allegations of patent infringement, as well as claims related to alleged defects in the design and use of our products.
38
a.We are regularly subject to a wide variety of litigation including claims, lawsuits, and other similar proceedings involving our business practices and products, including product liability claims, labor and employment claims, patent infringement claims, and commercial disputes.
The number and significance of these disputes and inquiries have increased as we have grown larger, our business has expanded in scope and geographic reach, and our products and services have increased in complexity. Such lawsuits are more specifically described in Note 7, Commitments and Contingencies, of the accompanying Notes to the Consolidated Financial Statements included within “Item 8. Financial Statements and Supplementary Data” of this Annual Report on Form 10-K. Frequently, the outcome and impact of any claims, lawsuits, and other similar proceedings cannot be predicted with certainty. Moreover, regardless of the outcome such proceedings can have an adverse impact on us because of legal costs, diversion of management resources, and other factors. Determining reserves for our pending litigation is a complex, fact-intensive process that is subject to judgment. It is possible that a resolution of one or more such proceedings could require us to make substantial payments to satisfy judgments, penalties or to settle claims or proceedings, any of which could harm our business. These proceedings could also result in reputational harm, sanctions, consent decrees, or orders preventing us from offering certain products, or services, or requiring a change in our business practices in costly ways. Any of these consequences could materially harm our business.
b. Our intellectual property rights could be infringed on by others.
Our success depends, in part, on our ability to enforce our copyrights, patents, trademarks, trade dress, trade secrets, and other intellectual property, including our rights to certain domain names. We rely primarily on a combination of nondisclosure agreements and other contractual provisions as well as international patent, trademark, trade secret, and copyright laws to protect our intellectual rights. Effective protection and enforcement of our intellectual property rights may not be available in every country in which our products and media properties are distributed to customers. The process of acquiring intellectual property protection can be lengthy, expensive, and uncertain. Patents may not be granted in response to our applications, and any patents that are issued may be challenged, invalidated, or circumvented by others. If we are required to enforce our intellectual property rights through litigation, the costs and diversion of management's attention could be substantial. Furthermore, we may be counter-sued by an alleged infringer when we attempt to enforce our intellectual property rights, which may materially increase our costs, divert management attention, and result in injunctive or financial damages being awarded against us. In addition, existing patents, copyright registrations, trademarks, trade secrets and domain names may not provide competitive advantages or be adequate to safeguard and maintain our rights. If it is not feasible or possible to obtain, enforce, or protect our intellectual property rights, our business, financial condition, and results of operations could be negatively affected.
c. Patents, copyrights, trademarks, and trade secrets are owned by third parties that may make claims or commence litigation based on allegations of infringement or other violations of intellectual property rights.
Intellectual property claims or allegations may relate to products that we develop or be directed at materials or components incorporated in our products that are provided by one or more suppliers. As we have grown, intellectual property rights allegations against us and our suppliers have increased. There has also been a general increasing trend of intellectual property infringement claims against corporations that make and sell products. Our products, technologies and the components and materials contained in our products may be subject to certain third-party intellectual property claims and, regardless of the merits of the claim, such claims are often time-consuming and expensive to litigate, settle, or otherwise resolve. Many of our agreements with our distributors and resellers require us to indemnify them for certain third-party intellectual property infringement claims. Discharging our indemnity obligations may involve time-consuming and expensive litigation and result in substantial settlements or damages awards, our products being enjoined, and the loss of a distribution channel or retail partner, any of which may have a negative impact on our operating results. To the extent claims against us or our suppliers are successful, we may have to pay substantial monetary damages or discontinue the manufacture and distribution of products that are found to be in violation of another party's rights. We also may have to obtain, or renew on less favorable terms, licenses to manufacture and distribute our products or materials or components included in those products, which may significantly increase our operating expenses.
19. We are subject to other legal and compliance risks that could have a material impact on our business...
a.In foreign countries where we have operations, there are risks that our employees, contractors or agents could engage in business practices prohibited by U.S. laws and regulations applicable to us, such as the Foreign Corrupt Practices Act, or the laws and regulations of other countries, such as the UK Bribery Act.
39
We maintain a global policy prohibiting such business practices and have in place a global anti-corruption compliance program designed to require compliance with, and uncover violations of, these laws and regulations. Nonetheless, we remain subject to risk that one or more of our employees, contractors or agents, including those located in or from countries where practices that may violate U.S. laws and regulations or the laws and regulations of other countries may be customary, will engage in business practices that are prohibited by our policies, circumvent our compliance programs and, by doing so, violate such laws and regulations. Any such violations, even if prohibited by our internal policies, could adversely affect our business or financial performance and our reputation.
b. We must comply with various regulatory requirements, and changes in or new regulatory requirements that may adversely impact our gross margins, reduce our ability to generate revenues if we are unable to comply, or decrease demand for our products if the actual or perceived technical quality of our products are negatively impacted.
Our products must meet existing and new requirements set by regulatory authorities in each jurisdiction in which we sell them. For example, certain of our products must meet local phone system standards and certain of our wireless products must work within existing permitted radio frequency ranges.
As regulations and local laws change, new regulations are enacted, and competition increases, we may need to modify our products to address those changes, increasing the costs to design, manufacture, and sell our products, and thereby decreasing our margins or demand for our products if we attempt to pass along the costs. Regulations may also negatively affect our ability to procure or manufacture raw materials and components necessary for our products. Compliance with regulatory restrictions may impact the actual or perceived technical quality and capabilities of our products, reducing their marketability. In addition, if the products we supply to various jurisdictions fail to comply with the applicable local or regional regulations, if our customers or merchants transfer products into unauthorized jurisdictions or our products interfere with the proper operation of other devices, we or end users purchasing our products may be responsible for the damages that our products cause; thereby causing us to alter the performance of our products, pay substantial monetary damages or penalties, cause harm to our reputation, or cause other adverse consequences.
c. We are subject to environmental laws and regulations that expose us to a number of risks and could result in significant liabilities and costs.
We are subject to various federal, state, local, and foreign environmental laws and regulations, including those governing the use, discharge, and disposal of hazardous substances in the ordinary course of our manufacturing processes or the recycling of all or a portion of the components of our products. It is possible that future environmental legislation may be enacted, or current environmental legislation may be interpreted in any given country in a manner that creates environmental liability with respect to our facilities, operations, or products. We may also be required to implement new or modify existing policies, processes and procedures to meet such environmental laws. Although our management systems are designed to maintain compliance, we cannot assure you that we have been or will be at all times in complete compliance with such laws and regulations. If we violate or fail to comply with any of them, a range of consequences could result, including fines, import/export restrictions, sales limitations, criminal and civil liabilities or other sanctions. To the extent any new or modified policies, processes or procedures are difficult, time-consuming or costly to implement. we may incur claims for environmental matters exceeding reserves or insurance for environmental liability, our operating results could be negatively impacted
20. We are exposed to differences and frequent fluctuations in foreign currency exchange rates, which may adversely affect our revenues, gross profit, and profitability.
Fluctuations in foreign currency exchange rates impact our revenues and profitability because we report our financial statements in USD and purchase a majority of our component parts from our supply chain in USD, whereas a significant portion of our sales are transacted in other currencies, particularly the Euro and the GBP. If the USD strengthens further, it could further harm our financial condition and operating results in the future. Furthermore, fluctuations in foreign currency rates impact our global pricing strategy, which may result in our lowering or raising selling prices in one or more currencies to minimize disparities with USD prices and to respond to currency-driven competitive pricing actions. Should the dollar remain strong or strengthen further against foreign currencies, principally the Euro and the GBP, we may be compelled to raise prices for customers in the affected regions. Price increases may be unacceptable to our customers who could choose to replace our products with less costly alternatives in which case our sales and market share could be adversely impacted. If we reduce prices to stay competitive in the affected regions, our profitability may be harmed.
Large or frequent fluctuations in foreign currency rates, coupled with the ease of identifying global price differences for our products via the Internet, increases pricing pressure and allows unauthorized third-party “grey market” resellers to take
40
advantage of price disparities, thereby undermining our premium brand image, established sales channels, and support and operations infrastructure. We also have significant manufacturing operations in Mexico and fluctuations in the Mexican Peso exchange rate can impact our gross profit and profitability. Additionally, the majority of our suppliers are located internationally, principally in Asia, and volatile or sustained increases or decreases in exchange rates between the U.S. Dollar and Asian currencies may result in increased costs or reductions in the number of suppliers qualified to meet our standards.
Although we hedge currency exchange rate exposures we deem material, changes in exchange rates may nonetheless still have a negative impact on our financial results. Among the factors that may affect currency values are trade balances, the level of short-term interest rates, differences in relative values of similar assets in different currencies, long-term opportunities for investment and capital appreciation, decisions and actions of central banks and political developments.
We hedge a portion of our Euro and GBP forecasted revenue exposures for the future, typically over 12-month periods. In addition, we hedge a portion of our Mexican Peso forecasted cost of revenues and maintain foreign currency forward contracts denominated in Euros and GBP that hedge against a portion of our foreign-currency denominated assets and liabilities. Our foreign currency hedging contracts reduce, but do not eliminate, the impact of currency exchange rate movements, particularly if the fluctuations are significant or sustained, and we do not execute hedging contracts in all currencies in which we conduct business. There is no assurance that our hedging strategies will be effective. Additionally, even if our hedging techniques are successful in the periods during which the rates are hedged, our future revenues, gross profit, and profitability may be negatively affected both at current rates and by adverse fluctuations in currencies against the USD. See Item 7A for further quantitative information regarding potential foreign currency fluctuations.
21. The consummation of the Merger is contingent upon the satisfaction of a number of conditions, including stockholder and regulatory approvals, that may be outside of our or HP’s control and that we and HP may be unable to satisfy or obtain or that may delay the consummation of the Merger or result in the imposition of conditions that could cause the parties to abandon the Merger.
Consummation of the Merger is contingent upon the satisfaction of a number of conditions, some of which are beyond our and HP’s control, including, among others:
•the adoption of the Merger Agreement by the affirmative vote of the holders of a majority of the outstanding shares of our common stock;
•the expiration or termination of the waiting period applicable to the Merger under the Hart-Scott-Rodino Antitrust Improvements Act of 1976, as amended, without the imposition of a burdensome effect (as defined in the Merger Agreement); and
•the obtaining or making of all consents, approvals and filings required under the competition laws of China, Colombia, the European Union and Mexico and the foreign direct investment law of France, in each case without the imposition of burdensome effect.
The waiting period applicable to the consummation of the Merger under the Hart-Scott-Rodino Antitrust Improvements Act of 1976, as amended, expired at 11:59 pm New York City time on May 9, 2022.
Each party’s obligation to complete the Merger is also subject to the satisfaction or waiver of certain additional customary conditions, including:
•subject to certain exceptions, the accuracy of the representations and warranties of the other party; and
•performance in all material respects by the other party of its obligations under the Merger Agreement.
Further, HP's obligation to complete the Merger is conditioned upon the absence of any "material adverse effect" (as defined in the Merger Agreement) with respect to Poly.
These conditions to the closing of the Merger may not be fulfilled in a timely manner or at all, and, accordingly, the Merger may not be completed. In addition, each of HP and Poly may terminate the Merger Agreement under certain specified circumstances, including but not limited to, (i) if the Merger is not consummated by 11:59 p.m., Pacific time, on December 27, 2022 (as such date may be extended in accordance with the terms of the Merger Agreement), (ii) if any legal restraint that has the effect of preventing, prohibiting or making illegal the consummation of the Merger Agreement has become final and non-appealable or (iii) if, upon a vote at a duly held meeting of our stockholders to obtain the requisite approval of our stockholders, our stockholders fail to adopt the Merger Agreement . In addition, HP may terminate the Merger
41
Agreement in certain circumstances, including if our Board changes its recommendation to our stockholders to vote in favor of the adoption of the Merger Agreement or another adverse recommendation change (as defined in the Merger Agreement) occurs, or if we or certain others (as specified in the Merger Agreement) breach in any material respect the no-shop provisions of the Merger Agreement. If the Merger Agreement is terminated, we may be required to pay to HP a termination fee of up to $66.0 million under certain circumstances.
We and HP are and may be subject to additional lawsuits challenging the Merger, and adverse rulings in these lawsuits may delay or prevent the Merger from being completed or require us or HP to incur significant costs to defend or settle these lawsuits. Any delay in completing the Merger could cause us not to realize, or to be delayed in realizing, some or all of the benefits that we expect to achieve if the Merger is successfully completed within its expected time frame.
Even if successfully completed, there are certain risks to our stockholders from the Merger, including:
•the amount of cash to be paid under the Merger Agreement is fixed and will not be adjusted for changes in our business, assets, liabilities, prospects, outlook, financial condition or operating results or in the event of any change in the market price of, analyst estimates of, or projections relating to, our common stock;
•receipt of the all-cash per share merger consideration under the Merger Agreement is taxable to stockholders that are treated as U.S. holders for U.S. federal income tax purposes; and
•our stockholders will forego the opportunity to realize the potential long-term value of the successful execution of our current strategy as an independent company.
a.While the Merger is pending, we are subject to business uncertainties and contractual restrictions that could harm our financial condition, operating results, and business.
During the period prior to the closing of the Merger and pursuant to the terms of the Merger Agreement, our business is subject to certain inherent risks and contractual restrictions that could harm our financial condition, operating results, and business, including:
•Subject to certain exceptions, as detailed in the Merger Agreement, the possibility of disruption to our business and operations resulting from the announcement and pendency of the Merger, including diversion of management's attention and resources;
•Subject to certain exceptions, as detailed in the Merger Agreement, the inability to pursue alternative business opportunities or make changes to our business pending the completion of the Merger and other restrictions on our ability to conduct our business;
•Subject to certain exceptions, as detailed in the Merger Agreement, our inability to freely issue securities, incur indebtedness, declare or authorize any dividend or distribution, or make certain material capital expenditures without HP’s approval;
•Subject to certain exceptions, as detailed in the Merger Agreement, our inability to solicit other acquisition proposals during the pendency of the Merger;
•the amount of the costs, fees, expenses and charges related to the Merger Agreement and the Merger, which may materially and adversely affect our financial condition; and
•other developments beyond our control, including, but not limited to, changes in domestic or global economic conditions that may affect the timing or success of the Merger.
If any of these effects were to occur, it could materially and adversely impact our business, cash flow, results of operations or financial condition, as well as the market price of our common stock and our perceived value, regardless of whether the Merger is completed.
b.Uncertainty about the Merger may adversely affect relationships with our customers, suppliers and employees, whether or not the Merger is completed.
In response to the announcement of the Merger, our existing or prospective clients and business partners may:
•delay, defer, or cease purchasing our products, or additional seats or features from, or providing products or services to us, or purchase products and services from other providers;
42
•terminate their relationships with us;
•delay or defer other decisions concerning us; or
•seek to change the terms on which they do business with us.
Any such delays or changes to terms could materially harm our business.
Losses of customers, suppliers and employees or other important strategic relationships could have a material adverse effect on our business, results of operations, and financial condition. Such adverse effects could also be exacerbated by a delay in the completion of the Merger for any reason, including delays associated with obtaining requisite regulatory approvals or approvals of our stockholders.
c.As a result of the Merger, our current and prospective employees could experience uncertainty about their future with us. As a result, key employees may depart because of issues relating to such uncertainty or a desire not to remain with HP following the completion of the Merger.
As a result of the Merger, our current and prospective employees could experience uncertainty about their future with us or decide that they do not want to continue their employment. As a result, key employees may depart because of issues relating to such uncertainty or a desire not to remain with HP following the completion of the Merger. Losses of officers or employees could materially harm our business, results of operations, and financial condition. Such adverse effects could also be exacerbated by a delay in the completion of the Merger for any reason, including delays associated with obtaining requisite regulatory approvals or the requisite approval of our stockholders. We may also experience challenges in hiring new employees during the pendency of the Merger, or if the Merger Agreement is terminated, which could harm our ability to grow our business, execute on our business plans or enhance our operations. If the Merger is consummated, we may be less attractive to current and prospective employees, which could harm our business and prospects.
d.Litigation has arisen, and more could arise, in connection with the Merger, which could be costly, prevent consummation of the Merger, divert management’s attention, and otherwise materially harm our business.
As of the date of this Annual Report on Form 10-K, five complaints have been filed by purported Poly stockholders, each of which seeks to enjoin the Merger and other relief. The complaints assert claims against certain defendants under Section 14(a) of the Exchange Act and Rule 14a-9 promulgated thereunder for allegedly false and misleading statements in the preliminary proxy statement on Scheduled 14A filed by us with the SEC on May 2, 2022 (the "Preliminary Proxy Statement") and/or the Definitive Proxy Statement issued in connection with the Merger and against certain defendants under Section 20(a) of the Exchange Act for alleged “control person” liability with respect to such allegedly false and misleading statements. Poly believes the allegations in the complaints are without merit. Refer to Note 7, Commitments and Contingencies, of the accompanying Notes to the Consolidated Financial Statements included within “Item 8. Financial Statements and Supplementary Data” of this Annual Report on Form 10-K.
Regardless of the outcome of any litigation related to the Merger, such litigation may be time-consuming and expensive and may distract our management from running the day-to-day operations of our business. The litigation costs and diversion of management’s attention and resources to address the claims and potential counterclaims in any litigation related to the Merger may materially adversely affect our business, results of operations, prospects, and financial condition. If the Merger is not consummated for any reason, litigation could be filed in connection with the failure to consummate the Merger. Any litigation related to the Merger may result in negative publicity or an unfavorable impression of us, which could adversely affect the price of our common stock, impair our ability to recruit or retain employees, damage our relationships with our customers, suppliers, and other business partners, or otherwise materially harm our operations and financial performance.
e.The ability to complete the Merger is subject to the receipt of consents and approvals from government entities, which may impose conditions that could have an adverse effect on us or could cause either party to abandon the Merger.
Completion of the Merger is conditioned upon, among other things, the expiration or termination of the waiting period applicable to the Merger under the Hart-Scott-Rodino Antitrust Improvements Act of 1976, as amended, without the imposition of a burdensome effect (as defined in the Merger Agreement), and the obtaining or making of all consents, approvals and filings required under the competition laws of China, Colombia, the European Union and Mexico and the foreign direct investment law of France, in each case without the imposition of a burdensome effect. The relevant regulatory agencies may condition their approval of the Merger on HP’s or our agreement to various requirements,
43
limitations or costs, or require divestitures or place restrictions on the conduct of our business following the completion of the Merger. We cannot provide any assurance that we or HP will obtain the necessary approvals. In addition, these requirements, limitations, costs, divestitures or restrictions may result in the delay or abandonment of the Merger.
44
ITEM 1B. UNRESOLVED STAFF COMMENTS
None.
ITEM 2. PROPERTIES
Our principal executive offices are located in Santa Cruz, California, which provides 124,772 square feet of active space. We also own one building in Tijuana, Mexico with 470,472 square feet of space used for Engineering, Assembly, Administration, Logistic and Distribution Center, Design Center, Call Center, and Technical Assistance Center (“TAC”). Additionally, we own a building in Hoofddorp, Netherlands with 38,007 square feet of space used for Executive Briefing Center, Sales, Marketing, Administration, and TAC. We lease and sublease office space in the Americas, which is comprised of the U.S. and Mexico; EMEA, which is comprised of Europe, the Middle East and Africa; and Asia Pacific, which is comprised of China, India, Thailand and Singapore. The following table presents the location and square footage of our active leased office space as of April 2, 2022:
| Location | Square footage | |||||||
| Americas | 290,259 | |||||||
| EMEA | 249,829 | |||||||
| Asia Pacific | 77,462 | |||||||
| Total | 617,550 | |||||||
We believe our existing facilities, including both owned and leased properties, are in good condition and suitable for our current business needs. We also believe that our future growth can be accommodated by our current facilities or by leasing additional space if necessary.
ITEM 3. LEGAL PROCEEDINGS
We are presently engaged in various legal actions arising in the normal course of business. In addition, we are currently party to five lawsuits brought by purported Poly stockholders in connection with the Merger. We do not expect that any of these actions will have a material adverse impact on our operating results; however, because of the inherent uncertainties of litigation, the outcome of any of these actions could be unfavorable and could have a material adverse effect on our financial condition, results of operations, or cash flows. For additional information about our material legal proceedings, refer to Note 7, Commitments and Contingencies, of the accompanying notes to the consolidated financial statements included within “Part II. Item 8. Financial Statements and Supplementary Data” of this Annual Report on Form 10-K.
ITEM 4. MINE SAFETY DISCLOSURES
Not applicable.
45
PART II
ITEM 5. MARKET FOR REGISTRANT'S COMMON EQUITY, RELATED STOCKHOLDER MATTERS AND ISSUER REPURCHASES OF EQUITY SECURITIES
Market Information
The Company changed our symbol on the NYSE from "PLT" to "POLY" effective at the open of market trading on May 24, 2021.
Holders of Common Stock
As of May 23, 2022, there were approximately 58 stockholders of record of our common stock. Because many of our shares of common stock are held by brokers and other institutions on behalf of beneficial owners, we are unable to estimate the total number of beneficial owners, but we believe it is significantly higher than the number of record holders.
Stock Performance
The graph below compares the annual percentage change in the cumulative return to the stockholders of our common stock with the cumulative return of the NASDAQ/NYSE American/NYSE (US Companies) index and a peer group index for the period commencing on the morning of April 1, 2017 and ending on April 2, 2022. The information contained in the performance graph shall not be deemed to be "soliciting material" or be "filed" with the SEC, nor shall such information be incorporated by reference into any future filing under the Exchange Act, except to the extent that we specifically incorporate it by reference into such filing.
The graph assumes that $100 was invested on the morning of April 1, 2017 in our common stock (based on price at the close of trading on March 31, 2017) and in each index (based on prices at the close of trading on March 31, 2017), and that dividends, if any, were reinvested. The measurement date used for our common stock is the last day of our fiscal year for each period shown.
Past performance is no indication of future value and stockholder returns over the indicated period should not be considered indicative of future returns.
46
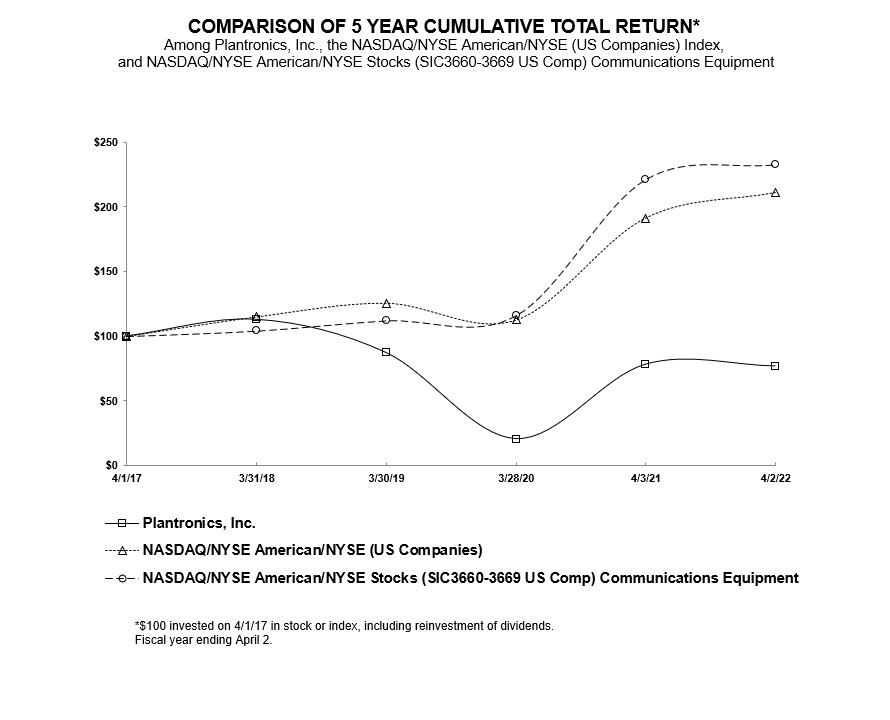
| Fiscal Year Ended | |||||||||||||||||||||||||||||||||||
| April 1, | March 31, | March 30, | March 28, | April 3, | April 2, | ||||||||||||||||||||||||||||||
| 2017 | 2018 | 2019 | 2020 | 2021 | 2022 | ||||||||||||||||||||||||||||||
| Plantronics, Inc. | $ | 100.00 | $ | 112.91 | $ | 87.14 | $ | 20.43 | $ | 78.17 | $ | 76.69 | |||||||||||||||||||||||
| NASDAQ/NYSE American/NYSE (US Companies) | $ | 100.00 | $ | 115.01 | $ | 125.62 | $ | 112.56 | $ | 191.34 | $ | 210.93 | |||||||||||||||||||||||
| NASDAQ/NYSE American/NYSE Stocks (SIC3660-3669 US Comp) Communications Equipment | $ | 100.00 | $ | 104.15 | $ | 112.11 | $ | 115.95 | $ | 221.19 | $ | 232.72 | |||||||||||||||||||||||
47
Stock Repurchase Programs
During the fourth quarter of Fiscal Year 2022, we did not repurchase any shares of our common stock. As of April 2, 2022, there remained 1,369,014 shares authorized for repurchase under the existing stock repurchase program. The following table presents information with respect to shares that were tendered to us in satisfaction of employee tax withholding obligations upon the vesting of restricted stock grants under our stock plans in the fourth quarter of Fiscal Year 2022:
Total Number of Shares Purchased(4) | Average Price Paid per Share (2) | Total Number of Shares Purchased as Part of Publicly Announced Plans or Programs (1) | Maximum Number of Shares that May Yet Be Purchased Under the Plans or Programs (3) | ||||||||||||||||||||
| January 2, 2022 to January 29, 2022 | 5,143 | N/A | — | 1,369,014 | |||||||||||||||||||
| January 30, 2022 to February 26, 2022 | 2,128 | N/A | — | 1,369,014 | |||||||||||||||||||
| February 27, 2022 to April 2, 2022 | 21,716 | N/A | — | 1,369,014 | |||||||||||||||||||
| (1) | On November 28, 2018, our Board of Directors approved a 1.0 million shares repurchase program expanding our capacity to repurchase shares to approximately 1.7 million shares. We may repurchase shares from time to time in open market transactions or through privately negotiated transactions. There is no expiration date associated with the repurchase authorization. | ||||
| (2) | "Average Price Paid per Share" reflects open market repurchases of common stock only. | ||||
| (3) | These shares reflect the available shares authorized for repurchase under the expanded repurchase program approved by the Board on November 28, 2018. | ||||
| (4) | Represents only shares that were tendered to us in satisfaction of employee tax withholding obligations upon the vesting of restricted stock grants under our stock plans. | ||||
For more information regarding our stock repurchase programs, refer to Note 11, Common Stock Repurchases, of the accompanying notes to the consolidated financial statements included within “Item 8. Financial Statements and Supplementary Data” of this Annual Report on Form 10-K.
ITEM 6. [Reserved]
Data responsive to Item 6 have not been presented in accordance with amendments to Item 301 of Regulation S-K.
48
ITEM 7. MANAGEMENT'S DISCUSSION AND ANALYSIS OF FINANCIAL CONDITION AND RESULTS OF OPERATIONS
The following discussion and analysis is intended to help you understand our results of operations and financial condition. It is provided as a supplement to, and should be read in conjunction with, our consolidated financial statements and related notes thereto included within “Item 8. Financial Statements and Supplementary Data” of this Annual Report on Form 10-K.
A discussion regarding our financial condition and results of operations for Fiscal Year 2022 compared to Fiscal Year 2021 is presented below under "Results of Operations." Discussions regarding our financial condition and results of operations for Fiscal Year 2021 compared to Fiscal Year 2020 have been omitted from this Annual Report on Form 10-K, but can be found in our Annual Report on Fiscal Year 2021 Form 10-K, filed with the SEC on May 18, 2021, which is available free of charge on the SEC's website at sec.gov and on our website at www.poly.com.
This discussion contains forward-looking statements. Please see the sections entitled "Certain Forward-Looking Information" and "Risk Factors" in Part I of this Annual Report on Form 10-K for discussions of the uncertainties, risks, and assumptions associated with these statements.
Our fiscal year ends on the Saturday closest to the last day of March. The years ended April 2, 2022 ("Fiscal Year 2022"), April 3, 2021 ("Fiscal Year 2021"), and March 28, 2020 ("Fiscal Year 2020") had 52, 53, and 52 weeks, respectfully.
OVERVIEW
Poly is a leading global communications technology company that designs, manufactures, and markets integrated communications and collaboration solutions for professionals. Our major product categories are Headsets, Video, Voice, and Services.
On March 25, 2022, the Company entered into an Agreement and Plan of Merger (the “Merger Agreement”) with HP Inc. (“HP”) and Prism Subsidiary Corp. (“Merger Sub”), a wholly-owned subsidiary of HP, providing for Poly's acquisition in an all-cash transaction for $40 per share by way of a merger of Merger Sub with and into Poly (the “Merger”), with Poly continuing as a wholly-owned subsidiary of HP. The Merger is expected to occur, subject to Poly stockholder approval, required regulatory clearances and the satisfaction of other customary closing conditions, in calendar year 2022.
Impact of the Current Environment, Supply Chain Disruptions, and COVID-19 on Our Business
We have experienced and continue to monitor limited supply and longer lead times for certain key components, such as semiconductor chips, necessary to complete production and meet customer demand, including fulfillment of our backlog. We do not manufacture these component parts and currently purchase certain parts, including semiconductor chips and sub-assemblies that require semiconductor chips, from single or limited sources. Additionally, constrained supply has resulted in price inflation for certain components, including semiconductor chips, increased spot market prices and purchases, increased transportation costs, inefficiencies at our owned manufacturing facility in Tijuana, Mexico, and inability to fulfill backlog for certain products timely. We continue to monitor our supply chain and are taking action against limited supply and increasing lead times, including increased spot market purchases, outreach to critical suppliers, and entering into contractual obligations that provide for increased costs, and multi-year commitments, to secure supply. For certain of our products, our additional supply increases our exposure to risks associated with significant and/or abrupt changes in product demand, which could result in potential excess of obsolete inventory. Additionally, to the extent we pass through increased costs to our customers, this may result in reduced demand. These factors, among others, are affecting and are expected to continue to affect total net revenue and gross margin rates.
In addition, COVID-19 has continued to spread globally and continues to add uncertainty and influence global economic activity, the global supply chain, and financial markets. The impact of the pandemic on our operations has varied by local conditions, government mandates, and business limitations, including travel bans, remote work, and other restrictions.
The COVID-19 pandemic led to a massive increase in remote work. As a result, during Fiscal Year 2020 we experienced elevated demand for certain enterprise Headsets and Video devices and a decline in demand for our Voice products and associated Services, as companies shifted from in-office to work-from-home arrangements for many of their office workers. Beginning in the fourth quarter of Fiscal Year 2021 and continuing throughout Fiscal Year 2022, we experienced elevated
49
demand for certain Video and Voice devices as companies began to shift from work-from-home arrangements to hybrid work models.
However, the impact of COVID-19 is fluid and uncertain, and it has caused, and may continue to cause, various negative effects as we continue to experience constraints in our supply chain, specifically the sourcing of certain components and raw materials, and increased logistics costs to meet customer demand, which, in turn, adversely impacts our gross margins. As a result, the impact of COVID-19 to date has had mixed effects on our results of operations.
The full extent and duration of the impact of the COVID-19 pandemic on our business continues to be uncertain and difficult to predict and will depend on many factors outside of our control, including the extent and duration of the pandemic, mutations, and variants of the virus, the development and availability of effective treatments, including the availability of vaccines for our global workforce, mandates of protective public safety measures, and the impact of the pandemic on the global economy, global supply chains, and demand for our products. It is not possible at this time to foresee whether or when the outbreak of COVID-19 or other events beyond our control will be effectively contained, nor can we estimate the entirety of the impact that COVID-19 or such other pandemics or natural or man-made disaster will have on the global economy, our business, customers, suppliers, or other business partners. As such, impacts from such events on Poly are highly uncertain and we will continue to assess the impact from such events on our consolidated financial statements.
In responding to this pandemic, employee safety continues to be a critical concern for Poly and we have taken measures to protect our employees globally by adherence to public safety and shelter in place directives, physical distancing protocols within offices and manufacturing facilities, providing personal protective equipment, including face masks and hand sanitizers, conducting routine sanitation of facilities, requiring health monitoring before entry into Poly facilities and restricting the number of visitors to our sites. The safety protocols implemented globally meet or exceed current regulations; however, we continue to monitor employees’ safety and evolving regulatory requirements. Although our manufacturing facility remains open and certain office employees may utilize our offices when necessary, the majority of all non-factory employees continue to work from home, using headsets and other Poly-issued equipment. We provided COVID-19 vaccines to our employees and their immediate families, as well as other workers, at our manufacturing facility on a voluntary basis free of charge.
Fiscal Year 2022 Highlights
Total net revenues for Fiscal Year 2022 were $1,681.1 million, a decrease of $46.5 million or 2.7%, compared to Fiscal Year 2021, primarily driven by decreased sales in our Headsets and Services product categories, partially offset by increased sales in our Video and Voice product categories.
Product gross margin for Fiscal Year 2022 decreased from 41.3% in the prior year to 37.0%, primarily driven by increased component costs, unfavorable product mix, and increased transportation costs.
In May 2021, we redeemed the outstanding principal and accrued interest on the 5.50% Senior Notes of $493.9 million. In June 2021, the Company entered into a three-year amortizing interest rate swap agreement with Bank of America, N.A. The swap has an initial notional amount of $680 million and matures on July 31, 2024. Refer to further discussion in Note 8, Debt, and Note 13, Derivatives, of the accompanying notes to the consolidated financial statements included within “Item 8. Financial Statements and Supplementary Data” of this Annual Report on Form 10-K.
During Fiscal Year 2022, we introduced our partnership with Appspace, a leading provider of workspace experience software, to deliver dynamic digital signage on Poly video OS devices to enhance the Return to Office experience for employees and visitors. The digital signage was available on Poly Studio X Series (including Poly Studio X30, X50, X70) and G7500 video conference devices with an Appspace subscription. We also announced the updated Poly Room Solutions for Microsoft Teams Rooms on Windows. The new lineup of Poly Studio Kits offers premium audio and video for focus, small, medium, and large rooms, and feature Poly's Director AI technology. We additionally introduced a number of next generation Voyager headsets. These products and offerings were available during the Fiscal Year 2022 and did not have a material impact on total net revenues.
50
RESULTS OF OPERATIONS
The Company’s reportable segments are Products and Services. Our Products reportable segment includes the Headsets, Voice, and Video product lines. Our Services reportable segment includes maintenance support on hardware devices, as well as professional, managed, and cloud services and solutions.
Total Net Revenues
The following table sets forth total net revenues by reportable segment for Fiscal Years 2022, 2021, and 2020:
| (in thousands, except percentages) | April 2, 2022 | Change | April 3, 2021 | Change | March 28, 2020 | |||||||||||||||||||||||||||
| Net revenues | ||||||||||||||||||||||||||||||||
| Products | $ | 1,455,785 | (1.0) | % | $ | 1,470,826 | 2.7 | % | $ | 1,432,736 | ||||||||||||||||||||||
| Services | 225,359 | (12.2) | % | 256,781 | (2.8) | % | 264,254 | |||||||||||||||||||||||||
| Total net revenues | $ | 1,681,144 | (2.7) | % | $ | 1,727,607 | 1.8 | % | $ | 1,696,990 | ||||||||||||||||||||||
Products
Total product net revenues decreased in Fiscal Year 2022 compared to the prior fiscal year primarily due to the following:
•Headsets product category net revenues decreased primarily due to constrained supply of certain components, such as semiconductor chips.
•Partially offset by increased Video and Voice product category net revenues driven by elevated demand for certain devices as companies began to shift from work-from-home arrangements to hybrid work models.
Services
Total services net revenues decreased in Fiscal Year 2022 compared to the prior fiscal year primarily due to the continued Video product mix shift from legacy Platform and Telepresence to Studio video bars, which are less complex, easier to install and operate, and carry optional service contracts.
Geographic Region
The following table sets forth total net revenues by geographic region for Fiscal Years 2022, 2021, and 2020:
| (in thousands, except percentages) | April 2, 2022 | Change | April 3, 2021 | Change | March 28, 2020 | |||||||||||||||||||||||||||
| United States | $ | 774,964 | 4.2 | % | $ | 743,870 | (8.2) | % | $ | 810,669 | ||||||||||||||||||||||
| Europe, Middle East, and Africa | 515,372 | (10.7) | % | 576,855 | 23.9 | % | 465,621 | |||||||||||||||||||||||||
| Asia Pacific | 277,258 | (3.0) | % | 285,755 | (3.2) | % | 295,336 | |||||||||||||||||||||||||
| Americas, excluding U.S. | 113,550 | (6.3) | % | 121,127 | (3.4) | % | 125,364 | |||||||||||||||||||||||||
| Total international net revenues | 906,180 | (7.9) | % | 983,737 | 11.0 | % | 886,321 | |||||||||||||||||||||||||
| Total net revenues | $ | 1,681,144 | (2.7) | % | $ | 1,727,607 | 1.8 | % | $ | 1,696,990 | ||||||||||||||||||||||
United States
U.S. total net revenues increased in Fiscal Year 2022 as compared to the prior fiscal year primarily due to increased net sales in the Video and Voice product categories, partially offset by decreased net sales in the Services category. U.S. Headsets total net revenues were materially unchanged in Fiscal Year 2022 compared to the prior fiscal year.
International
51
International total net revenues decreased in Fiscal Year 2022 as compared to the prior fiscal year primarily due to decreased net sales in the Headsets and Services product categories, partially offset by increased net sales in the Video product category. International Voice total net revenues were materially unchanged in Fiscal Year 2022 compared to the prior fiscal year.
Fiscal Year 2022 total net revenues were also favorably impacted by fluctuations in exchange rates which resulted in an increase of approximately $11.9 million, net of the effects of hedging.
Cost of Revenues and Gross Profit
Cost of revenues consists primarily of direct and contract manufacturing costs, amortization of acquired technology, freight, warranty, charges for excess and obsolete inventory, depreciation, duties, royalties, and overhead expenses.
| (in thousands, except percentages) | April 2, 2022 | Change | April 3, 2021 | Change | March 28, 2020 | |||||||||||||||||||||||||||
| Products | ||||||||||||||||||||||||||||||||
| Net revenues | $ | 1,455,785 | (1.0) | % | $ | 1,470,826 | 2.7 | % | $ | 1,432,736 | ||||||||||||||||||||||
| Cost of revenues | 917,511 | 6.3 | % | 863,529 | (17.7) | % | 1,049,826 | |||||||||||||||||||||||||
| Gross profit | $ | 538,274 | (11.4) | % | $ | 607,297 | 58.6 | % | $ | 382,910 | ||||||||||||||||||||||
| Gross profit % | 37.0 | % | 41.3 | % | 26.7 | % | ||||||||||||||||||||||||||
| Services | ||||||||||||||||||||||||||||||||
| Net revenues | $ | 225,359 | (12.2) | % | $ | 256,781 | (2.8) | % | $ | 264,254 | ||||||||||||||||||||||
| Cost of revenues | 77,540 | (11.4) | % | 87,527 | (7.8) | % | 94,929 | |||||||||||||||||||||||||
| Gross profit | $ | 147,819 | (12.7) | % | $ | 169,254 | — | % | $ | 169,325 | ||||||||||||||||||||||
| Gross profit % | 65.6 | % | 65.9 | % | 64.1 | % | ||||||||||||||||||||||||||
| Total | ||||||||||||||||||||||||||||||||
| Net revenues | $ | 1,681,144 | (2.7) | % | $ | 1,727,607 | 1.8 | % | $ | 1,696,990 | ||||||||||||||||||||||
| Cost of revenues | 995,051 | 4.6 | % | 951,056 | (16.9) | % | 1,144,755 | |||||||||||||||||||||||||
| Gross profit | $ | 686,093 | (11.6) | % | $ | 776,551 | 40.6 | % | $ | 552,235 | ||||||||||||||||||||||
| Gross profit % | 40.8 | % | 44.9 | % | 32.5 | % | ||||||||||||||||||||||||||
Products
Gross profit as a percentage of total product net revenues decreased in Fiscal Year 2022 as compared to the prior fiscal year, primarily due to increased component costs, unfavorable product mix, and increased transportation costs. The increase in component costs was primarily driven by increased spot market purchases of certain key components, such as semiconductor chips, due to global supply shortages. Transportation costs increased as a result of high global demand and limited capacity of air freight carriers and increased air freight usage to mitigate longer component lead times to meet our commitments to customers.
Services
Gross profit as a percentage of total services net revenues was materially unchanged in Fiscal Year 2022 as compared to the prior fiscal year.
52
Operating Expenses
Operating expenses for Fiscal Years 2022, 2021, and 2020 were as follows:
| (in thousands, except percentages) | April 2, 2022 | Change | April 3, 2021 | Change | March 28, 2020 | |||||||||||||||||||||||||||
| Research, development and engineering | $ | 183,553 | (12.3) | % | $ | 209,290 | (4.1) | % | $ | 218,277 | ||||||||||||||||||||||
| % of total net revenues | 10.9 | % | 12.1 | % | 12.9 | % | ||||||||||||||||||||||||||
| Selling, general, and administrative | 499,839 | 2.3 | % | 488,378 | (18.0) | % | 595,463 | |||||||||||||||||||||||||
| % of total net revenues | 29.7 | % | 28.3 | % | 35.1 | % | ||||||||||||||||||||||||||
| Impairment of goodwill and long-lived assets | — | — | % | — | (100.0) | % | 489,094 | |||||||||||||||||||||||||
| % of total net revenues | — | % | — | % | 28.8 | % | ||||||||||||||||||||||||||
| Loss (gain), net from litigation settlements | — | 100.0 | % | 17,561 | (2,535.6) | % | (721) | |||||||||||||||||||||||||
| % of total net revenues | — | % | 1.0 | % | — | % | ||||||||||||||||||||||||||
| Restructuring and other related charges | 34,937 | (28.3) | % | 48,704 | (10.1) | % | 54,177 | |||||||||||||||||||||||||
| % of total net revenues | 2.1 | % | 2.8 | % | 3.2 | % | ||||||||||||||||||||||||||
| Total operating expenses | $ | 718,329 | (6.0) | % | $ | 763,933 | (43.7) | % | $ | 1,356,290 | ||||||||||||||||||||||
| % of total net revenues | 42.7 | % | 44.2 | % | 79.9 | % | ||||||||||||||||||||||||||
Research, Development, and Engineering
Research, development, and engineering costs are expensed as incurred and consist primarily of compensation costs, outside services, expensed materials, and overhead expenses.
The decrease in research, development, and engineering expenses in Fiscal Year 2022 compared to the prior fiscal year was primarily due to lower compensation expense driven by reduction in headcount, cost control efforts, and lower incentive compensation.
Selling, General, and Administrative
Selling, general, and administrative costs are expensed as incurred and consist primarily of compensation costs, marketing costs, travel expenses, professional service fees, and overhead expenses.
The increase in selling, general, and administrative expenses in Fiscal Year 2022 compared to the prior fiscal year was primarily due to increased marketing activity and travel expenses, partially offset by lower incentive compensation.
Loss (gain), net from Litigation Settlements
During Fiscal Year 2021, we recorded litigation charges for settlements that occurred during the period with no similar activity recorded during Fiscal Year 2022. Refer to Note 7, Commitments and Contingencies, of the accompanying Notes to the Consolidated Financial Statements included within “Item 8. Financial Statements and Supplementary Data” of this Annual Report on Form 10-K.
Restructuring and Other Related Charges
During Fiscal Year 2022 and 2021, we recorded restructuring and other related charges to further reduce expenses and optimize our cost structure. These actions consisted of headcount reductions and office closures. Refer to Note 9, Restructuring and Other Related Charges, of the accompanying notes to the consolidated financial statements included within “Item 8. Financial Statements and Supplementary Data” of this Annual Report on Form 10-K.
53
Interest Expense
| (in thousands, except percentages) | April 2, 2022 | Change | April 3, 2021 | Change | March 28, 2020 | |||||||||||||||||||||||||||
| Interest expense | $ | 69,711 | (15.6) | % | $ | 82,606 | (10.8) | % | $ | 92,640 | ||||||||||||||||||||||
| % of total net revenues | 4.1 | % | 4.8 | % | 5.5 | % | ||||||||||||||||||||||||||
The decrease in interest expense in Fiscal Year 2022 compared to the prior fiscal year was primarily due to lower interest expense related to the 2023 Senior Notes and lower outstanding principal balance on the term loan facility, partially offset by the amortization of the remaining debt issuance costs related to the 2023 Senior Notes, which were redeemed during the first quarter of Fiscal Year 2022, and interest expense related to the 2029 Senior Notes, which were issued in the fourth quarter of Fiscal Year 2021. Refer to Note 8, Debt, of the accompanying notes to the consolidated financial statements included within “Item 8. Financial Statements and Supplementary Data” of this Annual Report on Form 10-K.
Other Non-Operating Expense (Income), Net
| (in thousands, except percentages) | April 2, 2022 | Change | April 3, 2021 | Change | March 28, 2020 | |||||||||||||||||||||||||||
| Other non-operating expense (income), net | $ | 291 | 105.7 | % | $ | (5,108) | (4,460.7) | % | $ | (112) | ||||||||||||||||||||||
| % of total net revenues | — | % | (0.3) | % | — | % | ||||||||||||||||||||||||||
During Fiscal Year 2022, other non-operating expense (income), net increase primarily due to lower unrealized gains on the deferred compensation asset portfolio and net foreign currency losses during the period compared to the prior year.
Income Tax Benefit
| (in thousands, except percentages) | April 2, 2022 | Change | April 3, 2021 | Change | March 28, 2020 | |||||||||||||||||||||||||||
| Loss before income taxes | $ | (102,238) | (57.6) | % | $ | (64,880) | 92.8 | % | $ | (896,583) | ||||||||||||||||||||||
| Income tax benefit | (120,155) | (1,491.7) | % | (7,549) | 89.1 | % | (69,401) | |||||||||||||||||||||||||
| Net income (loss) | $ | 17,917 | 131.3 | % | $ | (57,331) | 93.1 | % | $ | (827,182) | ||||||||||||||||||||||
| Effective tax rate | 117.5 | % | 11.6 | % | 7.7 | % | ||||||||||||||||||||||||||
The Company and its subsidiaries are subject to taxation in the U.S. and in various foreign and state jurisdictions.
In September 2021, we transferred certain non-Americas intellectual property (“IP”) rights between our wholly-owned subsidiaries (“IP transfer”) to align with our evolving business operations, resulting in the derecognition of a deferred tax asset (“DTA”) of $91.1 million and the recognition of a new DTA of $204.5 million, which represents the book and tax basis difference in the IP and was based on the fair value of the IP, in the respective subsidiaries. This results in a net discrete deferred tax benefit of $113.4 million. The impact of the IP transfer to net cash flows on the consolidated statements of cash flows during Fiscal Year 2022 was not material.
Management has concluded that an impairment for local statutory and tax reporting to the aforementioned IP is likely however any impairment loss would be deductible for local tax purposes. As such, a DTA related to net operating loss carryforward of $48.0 million was recognized based on the expected impairment which was offset by a corresponding decrease in the DTA related to the intangible asset by the same amount as of April 2, 2022. Because the IP intangible asset is the result of an intercompany transfer, there is no intangible asset recognized in the consolidated balance sheets. Accordingly, the aforementioned IP impairment hast no net impact our consolidated statements of operations, balance sheet, or cash flows.
Valuation allowances are established when necessary to reduce DTA's to the amounts that are more-likely-than-not expected to be realized. Management assesses the available positive and negative evidence to estimate whether sufficient future taxable income will be generated to permit use of the existing DTA's. Valuation allowances are established when necessary to reduce DTA's to the amounts that are more-likely-than-not to be realized. On the basis of this evaluation, as of April 2, 2022, a valuation allowance against our U.S. federal and state DTA's continues to be maintained.
54
As of April 2, 2022, we had approximately $215.0 million in non-U.S. net DTA's after valuation allowance. A significant portion of our DTA's relate to internal intellectual property restructuring between wholly owned subsidiaries and net operating losses. At this time, based on evidence currently available, we consider it more-likely-than-not that we will have sufficient taxable income in the future that will allow us to realize our DTA's.
The amount of the DTA's considered realizable, however, could be adjusted if estimates of future taxable income increase or decrease, or if objective negative evidence in the form of cumulative losses is no longer present and additional weight is given to subjective evidence, such as our future projections.
Our effective tax rate for Fiscal Years 2022, 2021, and 2020 differs from the statutory rate due to the impact of foreign operations taxed at different statutory rates, transfer of certain non-Americas IP, the goodwill impairment charge, income tax credits, state taxes, and other factors. Our future tax rate could be impacted by a shift in the mix of domestic and foreign income, tax treaties with foreign jurisdictions, changes in tax laws in the U.S. or internationally, or a change in estimate of future taxable income, which could result in a valuation allowance being required.
55
FINANCIAL CONDITION
Liquidity and Capital Resources
The following tables present selected financial information and statistics as of April 2, 2022 and April 3, 2021 and for Fiscal Year 2022 and Fiscal Year 2021 (in thousands):
| (in thousands) | April 2, 2022 | April 3, 2021 | ||||||||||||
| Cash and cash equivalents and short-term investments | 183,703 | 217,119 | ||||||||||||
| Property, plant, and equipment, net | 127,021 | 140,875 | ||||||||||||
| Current portion of long-term debt | — | 478,807 | ||||||||||||
| Long-term debt, net of issuance costs | 1,500,283 | 1,496,064 | ||||||||||||
| Working capital | 271,691 | 213,975 | ||||||||||||
| Fiscal Year Ended | ||||||||||||||
| April 2, 2022 | April 3, 2021 | |||||||||||||
| Cash (used in) provided by operating activities | (7,769) | 145,180 | ||||||||||||
| Cash used in investing activities | (33,808) | (18,877) | ||||||||||||
| Cash (used in) provided by financing activities | (481,970) | 353,319 | ||||||||||||
Our cash and cash equivalents as of April 2, 2022 consist of bank deposits and money market funds with third-party financial institutions. As of April 2, 2022, of our $183.7 million of cash and cash equivalents and short-term investments, $94.4 million was held domestically, while $89.4 million was held by foreign subsidiaries, and approximately 68% was based in USD-denominated instruments. As of April 2, 2022, our short-term investments were composed of mutual funds. An additional source of liquidity is $97.5 million of availability from our revolving credit facility, net of outstanding letters of credit.
Historically, we use cash provided by operating activities as our primary source of liquidity. We expect that cash provided by operating activities will fluctuate in future periods as a result of a number of factors, including fluctuations in our revenues, the timing of compensation-related payments, such as our annual bonus/variable compensation plan, interest payments on our long-term debt, product shipments, accounts receivable collections, inventory and supply chain management, and the timing and amount of tax and other payments.
During Fiscal Year 2022, cash used in operating activities of $(7.8) million was a result of $(121.6) million of cash used in net working capital, partially offset by $17.9 million of net income and $96.0 million in net non-cash charges. Cash used in investing activities of $(33.8) million consisted primarily of capital expenditures of $(29.7) million and other investing activities of $(6.0) million. Cash used in financing activities of $(482.0) million consisted primarily of $(480.7) million of repayments of long-term debt and $(13.1) million of employees' tax withheld and paid for restricted stock and restricted stock units, partially offset by $11.8 million of proceeds from stock-based compensation plans.
During Fiscal Year 2021, cash provided by operating activities of $145.2 million was a result of $(57.3) million of net loss, non-cash adjustments to net loss of $226.0 million and a decrease in the net change in operating assets and liabilities of $(23.5) million. Cash used in investing activities of $(18.9) million during Fiscal Year 2021 consisted primarily of capital expenditures of $(22.7) million, partially offset by proceeds from sale of investments of $2.5 million and proceeds from sale of property, plant, and equipment of $1.9 million. Cash provided by financing activities of $353.3 million during Fiscal Year 2021 consisted primarily of proceeds from debt issuance, net of issuance costs of $493.9 million and $12.3 million of proceeds from issuances under stock-based compensation plans. This was partially offset by $(147.0) million repayments of long-term debt and $(5.9) million for employees' tax withheld and paid for restricted stock and restricted stock units.
56
Capital Expenditures
We anticipate our current cash and cash flows from operating activities will be sufficient to fund our capital expenditures in Fiscal Year 2023, relating primarily to investments in our manufacturing capabilities, including tooling for new products, new IT investments, and facilities upgrades. We will continue to evaluate new business opportunities and new markets. As a result, our future growth within the existing business or new opportunities and markets may dictate the need for additional facilities and capital expenditures to support that growth.
Debt
In July 2018, in connection with the Polycom acquisition, the Company entered into a Credit Agreement with Wells Fargo Bank, National Association, as administrative agent, and the lenders party thereto and borrowed the full amount available under the term loan facility of $1.245 billion, net of approximately $30 million of discounts and issuance costs. During Fiscal Year 2022, we did not prepay any of our outstanding principal. As of April 2, 2022, we had $1.0 billion of principal outstanding.
In December 2021, the Company entered into an Amendment to the Credit Agreement in order to relax certain financial covenants on the revolving line of credit. The financial covenants under the Credit Agreement are for the benefit of the revolving credit lenders only and do not apply to any other debt of the Company. As of April 2, 2022, the Company has four outstanding letters of credit on the revolving credit facility for a total of $2.5 million and had $97.5 million available under the revolving credit facility. As of April 2, 2022, the Company was in compliance with the financial covenants.
In July 2018, the Company entered into a 4-year amortizing interest rate swap agreement with Bank of America, N.A. The swap has an initial notional amount of $831 million and matures on July 31, 2022. In June 2021, the Company entered into a three-year amortizing interest rate swap agreement with Bank of America, N.A. The swap has an initial notional amount of $680 million and matures on July 31, 2024. During Fiscal Year 2022, the Company reclassified into interest expense $9.5 million and recorded a $24.2 million unrealized gain on its interest rate swaps derivatives designated as a cash flow hedge.
In March 2021, the Company issued $500.0 million aggregate principal amount of 4.75% Senior Notes. The 4.75% Senior Notes mature on March 1, 2029, and bear interest at a rate of 4.75% per annum, payable semi-annually on March 1 and September 1 of each year. A portion of the proceeds from the 4.75% Senior Notes was used to redeem the outstanding principal and accrued interest on the 5.50% Senior Notes of $493.9 million in May 2021. As of April 2, 2022, $500 million of principal was outstanding.
Our ability to make scheduled payments or to refinance our obligations with respect to the Senior Notes and our other indebtedness under our Credit Agreement will depend on our financial and operating performance, which, in turn, is subject to prevailing economic and industry conditions and other factors, including the availability of financing in the banking and capital markets, beyond our control. In addition, any refinancing of our indebtedness may be at higher interest rates, particularly in the current environment of rising interest rates, and may require us to comply with more onerous covenants, which could further restrict our operations.
We may at any time and from time to time, depending on market conditions and prices, continue to retire or purchase our outstanding debt through cash purchases and/or exchanges for equity or debt, in open-market purchases, privately negotiated transactions or otherwise. Such repurchases or exchanges, if any, will be upon such terms and at such prices as we may determine, and will depend on prevailing market conditions, our liquidity requirements, contractual restrictions and other factors. Under the terms of the Merger Agreement, from the date of the Merger Agreement to the termination or consummation of the Merger, we are restricted in our ability to drawdown or incur additional indebtedness, under certain conditions, without the prior written consent of HP. See further discussion of our business risks associated with the Merger under the risk factor titled “While the Merger is pending, we are subject to business uncertainties and contractual restrictions that could harm our financial condition, operating results, and business” within “Item 1A. Risk Factors” in this Annual Report on Form 10-K.
57
In addition, our liquidity, capital resources, and results of operations in any period could be affected by repurchases of our common stock, the payment in the future of cash dividends if the Board determines to reinstate the dividend program, the exercise of outstanding stock options, restricted stock grants under stock plans, and the issuance of common stock under the Employee Stock Purchase Program ("ESPP"). The Acquisition of Polycom affected our liquidity and leverage ratios, and we are reducing our debt leverage ratios by prioritizing the repayment of the debt obtained to finance such Acquisition. We receive cash from the exercise of outstanding stock options under our stock plan and the issuance of shares under our ESPP. However, the resulting increase in the number of outstanding shares from these equity grants and issuances could affect our earnings per share. We cannot predict the timing or amount of proceeds from the sale or exercise of these securities or whether they will be exercised, forfeited, canceled, or will expire.
For further information regarding our debt issuances and related hedging activity refer to Note 8, Debt, and Note 13, Derivatives, of the accompanying notes to the consolidated financial statements included within “Item 8. Financial Statements and Supplementary Data” of this Annual Report on Form 10-K.
Dividends
The Company did not declare or pay cash dividends during Fiscal Years 2022 or 2021.
We believe that our current cash and cash equivalents, short-term investments, cash provided by operations, and availability of additional funds under the Credit Agreement, as amended from time to time, will be sufficient to fund our operations for one year from the issuance of these consolidated financial statements; however, any projections of future financial needs and sources of working capital are subject to uncertainty, particularly in light of the uncertainty resulting from the impact of COVID-19 on our financial results. Readers are cautioned to review the risks, uncertainties, and assumptions set forth in this Annual Report on Form 10-K, including the sections entitled “Part I. Certain Forward-Looking Information” and “Part I. Item 1A. Risk Factors” for factors that could affect our estimates for future financial needs and sources of working capital.
Contractual Obligations
The following table summarizes our future contractual obligations as of April 2, 2022 and the effect that such obligations are expected to have on our liquidity and cash flows in future periods:
| Payments Due by Period | ||||||||||||||||||||||||||||||||
| (in thousands) | Total | Less than 1 year | 1-3 years | 4-5 years | More than 5 years | |||||||||||||||||||||||||||
| Operating leases | $ | 63,096 | $ | 15,185 | $ | 30,694 | $ | 6,415 | $ | 10,802 | ||||||||||||||||||||||
| Unconditional purchase obligations | 617,798 | 583,801 | 33,596 | 401 | — | |||||||||||||||||||||||||||
Long-term debt (1) | 1,683,063 | 23,750 | 47,500 | 1,064,313 | 547,500 | |||||||||||||||||||||||||||
| Toll charge | 53,655 | 6,312 | 27,617 | 19,726 | — | |||||||||||||||||||||||||||
| Total contractual obligations | $ | 2,417,612 | $ | 629,048 | $ | 139,407 | $ | 1,090,855 | $ | 558,302 | ||||||||||||||||||||||
(1) Includes future interest on outstanding debt.
Operating Leases
We lease certain facilities under operating leases expiring through the year ended April 3, 2027. Certain of these leases provide for renewal options for periods ranging from one to five years and in the normal course of business. We may exercise the renewal options. In addition to the net minimum lease payments noted above, we are contractually obligated to pay certain operating expenses during the term of the lease such as maintenance, taxes and insurance.
Unconditional Purchase Obligations
We use several contract manufacturers to manufacture raw materials, components, and subassemblies for our products through our supply and demand information that can cover periods up to 78 weeks. The contract manufacturers use this information to acquire components and build products. We also obtain individual components for our products from a wide variety of individual suppliers using a combination of purchase orders, supplier contracts, including annual minimum purchase obligations, and open orders based on projected demand information.
58
A substantial portion of the raw materials, components, and subassemblies used in our products are provided by our suppliers on a consignment basis. These consigned inventories are not recorded on our consolidated balance sheets until we take title to the raw materials, components, and subassemblies, which occurs when they are consumed in the production process. Prior to consumption in the production process, our suppliers bear the risk of loss and retain title to the consigned inventory. The agreements allow us to return parts in excess of maximum order quantities to the suppliers at the supplier’s expense. Returns for other reasons are negotiated with the suppliers on a case-by-case basis and to date have been immaterial. If our suppliers were to discontinue financing consigned inventory, it would require us to make cash outlays and we could incur expenses which, if material, could negatively affect our business and financial results.
As of April 2, 2022, our unconditional purchase obligations were primarily comprised of third-party manufacturing and component purchase commitments, including $51.8 million of consigned inventories. We expect to consume unconditional purchase obligations in the normal course of business, net of an immaterial purchase commitments reserve. In certain instances, these agreements allow us the option to cancel, reschedule, and adjust our requirements based on our business needs in partnering with our suppliers given the current environment.
Toll Charge
As of April 2, 2022, our obligation associated with the deemed repatriation toll charge is $53.7 million, which we are paying over an eight year period in installments. For additional details regarding the Tax Cuts and Jobs Act and the toll charge, refer to Note 15, Income Taxes, of the accompanying notes to the consolidated financial statements included within “Item 8. Financial Statements and Supplementary Data” of this Annual Report on Form 10-K.
Unrecognized Tax Benefits
As of April 2, 2022, short-term and long-term income taxes payable reported on our consolidated balance sheet included unrecognized tax benefits and related interest of $14.4 million and $3.7 million, respectively. We are unable to reliably estimate the timing of unrecognized tax benefits, as such, they are not included in the contractual obligations table above. The reduction of $2.5 million of unrecognized tax benefits during the fourth quarter of Fiscal Year 2022 is primarily attributable to the lapse of applicable statute of limitations.
We have not entered into any transactions with unconsolidated entities whereby we have financial guarantees, subordinated retained interests, derivative instruments, or other contingent arrangements that expose us to material continuing risks, contingent liabilities, or any other obligation under a variable interest in an unconsolidated entity that provides us with financing and liquidity support, market risk, or credit risk support.
CRITICAL ACCOUNTING ESTIMATES
Our consolidated financial statements are prepared in accordance with generally accepted accounting principles in the United States of America ("U.S. GAAP"). In connection with the preparation of our consolidated financial statements, we are required to make assumptions and estimates about future events and apply judgments that affect the reported amounts of assets, liabilities, revenue, expenses and the related disclosures. We base our assumptions, estimates and judgments on historical experience, current trends, future expectations and other factors that management believes to be relevant at the time our consolidated financial statements are prepared. On an ongoing basis, we review the accounting policies, assumptions, estimates and judgments to ensure that our consolidated financial statements are presented fairly and in accordance with U.S. GAAP. Because future events and their effects cannot be determined with certainty, actual results could differ from our assumptions and estimates, and such differences could be material.
Our significant accounting policies are discussed in Note 2, Significant Accounting Policies, of the accompanying notes to the consolidated financial statements included within “Item 8. Financial Statements and Supplementary Data” of this Annual Report on Form 10-K. We believe the following accounting estimates are the most critical to aid in fully understanding and evaluating our reported financial results, and they require our most difficult, subjective, or complex judgments, resulting from the need to make estimates about the effect of matters that are inherently uncertain. We have reviewed these critical accounting estimates and related disclosures with the Audit Committee.
•Revenue Recognition and Related Allowances
•Inventory Valuation
•Income Taxes
•Goodwill, Purchased Intangibles, and Impairment
59
Revenue Recognition and Related Allowances
Our revenue consists of hardware, software, and services. Revenue is recognized when control for these offerings is transferred to our customers, in an amount that reflects the consideration we expect to be entitled to in exchange for products and services.
Our contracts with customers may include promises to provide multiple deliverables. Determining whether the offerings and services are considered distinct performance obligations that should be accounted for separately or as one combined performance obligation may require significant judgment. Judgment is required to determine the level of integration and interdependency between certain professional services and the related hardware and software. This determination influences whether the services are distinct and accounted for separately as a performance obligation.
Service revenue primarily includes maintenance support on hardware devices and is recognized ratably over the contract term as those services are delivered. Product, software, and certain other services are satisfied at a point in time when control is transferred or as the services are delivered to the customer.
Our indirect channel model includes both a two-tiered distribution structure, where we sell to distributors that subsequently sell to resellers, and a one-tiered structure where we sell directly to resellers. For these arrangements, transfer of control begins at the time access to our services is made available to our customer and entitlements have been contractually established, provided all other criteria for revenue recognition are met. Judgment is required to determine whether our distributors and resellers have the ability to honor their commitment to pay, regardless of whether they collect payment from their customers. If market conditions change significantly, including increased uncertainty of our channel partners liquidity as a result of COVID-19, it could change our assessment, causing a material change in the amount of revenue that we report in a particular period.
Sales through our distribution and retail channels are made primarily under agreements allowing for rights of return in limited circumstances, such as stock rotation, non-conforming products, and instances where the Company provides its approval. Certain agreements with retail customers may permit rights of return for additional reasons, such as customer satisfaction, in accordance with the terms of the particular contract. Our agreements typically provide for various sales incentive programs, such as back-end rebates, discounts, marketing development funds, price protection, and other sales incentives. We have an established sales history for these arrangements and we record the estimated reserves and allowances at the time the related revenue is recognized. Customer sales returns are estimated based on historical data, relevant current data, and the monitoring of inventory in the distribution channel. The partner incentives reduce revenue in the current period and are intended to drive hardware sell through. Depending on how the payments are made and whether we have right to offset, the reserves associated with the partner incentive programs are recorded on the consolidated balance sheet as either contra Accounts Receivable or Accounts Payable. For more details about revenue recognition see Note 17, Revenue and Major Customers, and the Risk Factors: "Failure to adequately service and support our product offerings, or a decline in demand for our service offerings, could harm our results of operations," and "The increased use of software in our products could impact the way we recognize revenue which could adversely impact our financial results" included within “Item 8. Financial Statements and Supplementary Data” and “Part I. Item 1A. Risk Factors" of this Annual Report on Form 10-K, respectively.
Inventory Valuation
Inventories are valued at the lower of cost or net realizable value. The Company holds inventory for both its products and services businesses. The Company writes down inventories that have become obsolete or are in excess of anticipated demand or net realizable value. Our estimate of write downs for excess and obsolete inventory is based on a detailed analysis of on hand inventory and purchase commitments in excess of forecasted demand. Our products require long-lead time parts available from a subset of vendors and, occasionally, last-time buys of raw materials for products with long lifecycles. The effects of demand variability, long-lead times, and last-time buys have historically contributed to inventory write-downs. Our demand forecast considers historical sales, sales price, projected future shipments, market conditions, inventory on hand, purchase commitments, product development plans and product life cycle, inventory on consignment, and other competitive factors. Significant and abrupt changes in product demand increases the complexity of management's evaluation of potential excess or obsolete inventory. During Fiscal Year 2022, the global supply chain constraints resulting from the COVID-19 pandemic was an incremental variable in assessing our risk profile with respect to demand changes. Refer to "Contractual Obligations" for additional details regarding consigned inventories.
60
We have not made any material changes in the accounting methodology we use to estimate our inventory write-downs or adverse purchase commitments during the periods presented. If the demand or market conditions for our products are less favorable than forecasted, including any market shifts or product demand due to the COVID-19 pandemic, or if unforeseen technological changes negatively impact the utility of our inventory, we may be required to record additional inventory write-downs or adverse purchase commitments, which would negatively affect our results of operations in the period the write-downs or adverse purchase commitments were recorded. For more details about purchased inventory valuation and inventory reserves see Note 5, Details of Certain Balance Sheet Accounts and the Risk Factors: "The success of our new products depends on several factors which, if not achieved, could adversely impact our financial results," and "Product obsolescence or discontinuance and excess inventory can negatively affect our results of operations" included within “Item 8. Financial Statements and Supplementary Data” and “Part I. Item 1A. Risk Factors" of this Annual Report on Form 10-K, respectively.
Income Taxes
We are subject to income taxes in the U.S. and various foreign jurisdictions and our income tax returns are periodically audited by domestic and foreign tax authorities. These audits may include questions regarding our tax filing positions, including the timing and amount of deductions and the allocation of income among various tax jurisdictions. At any one-time, multiple tax years may be subject to audit by various tax authorities. In evaluating the exposures associated with our various tax filing positions, we record a liability for such exposures. A number of years may elapse before a particular matter for which we have established a liability is audited and fully resolved or clarified.
To the extent we prevail in matters for which a liability has been established, or are required to pay amounts in excess of our established liability, our effective income tax rate in a given financial statement period could be materially affected. An unfavorable tax settlement would generally require use of our cash and may result in an increase in our effective income tax rate in the period of resolution. A favorable tax settlement may be recognized as a reduction in our effective income tax rate in the period of resolution.
We recognize the impact of an uncertain income tax position on income tax expense at the largest amount that is more-likely-than-not to be sustained. An unrecognized tax benefit will not be recognized unless it has a greater than 50% likelihood of being sustained. We adjust our tax liability for unrecognized tax benefits in the period in which an uncertain tax position is effectively settled, the statute of limitations expires for the relevant taxing authority to examine the tax position, or when more information becomes available. Our liability for unrecognized tax benefits contains uncertainties because management is required to make assumptions and apply judgment to estimate the exposures associated with our various filing positions.
We record a valuation allowance to reduce our deferred tax assets to the net amount that we believe is more-likely-than-not to be realized. We consider all available evidence, both positive and negative, including historical levels of income, expectations and risks associated with estimates of future taxable income, and ongoing tax planning strategies in assessing the need for a valuation allowance. For more details about income taxes see Note 15, Income Taxes, and the Risk Factor: "We operate in multiple tax jurisdictions globally. Our corporate tax rate may increase or we may incur additional tax liabilities, and/or changes in applicable tax regulations and resolutions of tax disputes could negatively impact our cash flow, financial condition, and results of operations" included within “Item 8. Financial Statements and Supplementary Data” and “Part I. Item 1A. Risk Factors" of this Annual Report on Form 10-K, respectively.
Goodwill, Purchased Intangibles, and Impairment
Goodwill has been measured as the excess of the cost of an acquisition over the amount assigned to tangible and identifiable intangible assets acquired, less liabilities assumed. At least annually, in the fourth quarter of each fiscal year, or more frequently if indicators of impairment exist, management performs a review to determine if the carrying value of goodwill is impaired. The identification and measurement of goodwill impairment involves the estimation of fair value at the Company’s reporting unit level. The Company determines its reporting units by assessing whether discrete financial information is available and if segment management regularly reviews the results of that component.
61
The Company performs an initial assessment of qualitative factors to determine whether the existence of events and circumstances leads to a determination that it is more-likely-than-not that the fair value of a reporting unit is less than its carrying amount. If, after assessing the totality of relevant events and circumstances, the Company determines that it is more-likely-than-not that the fair value of the reporting unit exceeds its carrying value and there is no indication of impairment, no further testing is performed. However, if the Company concludes otherwise, a quantitative impairment test must be performed by estimating the fair value of the reporting unit and comparing it with its carrying value, including goodwill. If the carrying amount of a reporting unit is greater than its estimated fair value, goodwill is written down by the excess amount, limited to the total amount of goodwill allocated to that reporting unit. The fair value of the Company's reporting units is estimated using a discounted cash flow model (income approach), which utilizes Level 3 inputs. The income approach includes assumptions for, among others, forecasted revenue, operating income, and discount rates, all of which require significant judgment by management. These assumptions also consider the current industry environment and outlook, and the resulting impact on the Company's expectations for the performance of its business.
Intangible assets other than goodwill are carried at cost and amortized over their estimated useful lives. The Company reviews identifiable finite-lived intangible assets to be held and used for impairment whenever events or changes in circumstances indicate that the carrying value of the related asset group may not be recoverable. Determination of recoverability is based on the lowest level of identifiable estimated undiscounted cash flows resulting from use of the asset group and its ultimate disposition. Measurement of any impairment loss is based on the amount by which the carrying value of the asset group exceeds its fair value. The fair value of an asset group is estimated using a discounted cash flow model (income approach), which utilizes Level 3 inputs. The income approach includes assumptions for, among others, forecasted revenue, operating income, and discount rates, all of which require significant judgment by management. For more details about impairment of goodwill and other intangible assets see Note 6, Goodwill and Purchased Asset Intangibles, and the Risk Factor: "Critical accounting estimates involve the use of judgements and if actual results vary from our estimates or assumptions underlying such estimates, our financial results could be negatively affected" included within “Item 8. Financial Statements and Supplementary Data” and “Part I. Item 1A. Risk Factors" of this Annual Report on Form 10-K, respectively.
RECENT ACCOUNTING PRONOUNCEMENTS
Recent accounting pronouncements issued by the FASB are not expected to have a material impact on the Company's financial position, results of operations, or cash flows. For a description of recent accounting pronouncements, including the expected dates of adoption and estimated effects, if any, on our Consolidated Financial Statements, see Note 3, Recent Accounting Pronouncements, of the accompanying Notes to the Consolidated Financial Statements included within “Item 8. Financial Statements and Supplementary Data” of this Annual Report on Form 10-K.
ITEM 7A. QUANTITATIVE AND QUALITATIVE DISCLOSURES ABOUT MARKET RISK
The discussion of our exposure to market risk related to changes in interest rates and foreign currency exchange rates contains forward-looking statements that are subject to risks and uncertainties. Actual results could vary materially as a result of a number of factors, including those discussed in Part I, "Item 1A. Risk Factors" in our Annual Report on Form 10-K for the fiscal year ended April 2, 2022, which could materially affect our business, financial position, or future results of operations..
INTEREST RATE RISK
Our exposure to market risk for changes in interest rates relates primarily to our floating-rate interest payments under our $1.275 billion term loan facility. Borrowings under the Credit Agreement bear interest at a variable rate equal to (i) LIBOR plus a specified margin, or (ii) the base rate (which is the highest of (a) the prime rate publicly announced from time to time by Wells Fargo Bank, National Association, (b) the federal funds rate plus 0.50% or (c) the sum of 1% plus one-month LIBOR plus a specified margin.
On July 30, 2018, we entered into a four-year amortizing interest rate swap agreement, and on June 15, 2021, we entered into a three-year amortizing interest swap agreement, both with Bank of America, N.A. as part of our overall strategy to manage our exposure to market risks associated with fluctuations in interest rates on the $1.275 billion term loan facility. As a matter of policy, we only enter into transactions that we believe will be highly effective at offsetting the underlying risk, and we do not use derivatives for trading or speculative purposes. Our objective is to mitigate the impact of interest expense fluctuations on our profitability related to interest rate changes by minimizing movements in future debt payments with these interest rate swaps.
62
The first swap has an initial notional amount of $831 million and matures on July 31, 2022. The second swap has an initial notional amount of $680 million and matures on July 31, 2024. These swaps involve the receipt of floating-rate interest payments for fixed interest rate payments over the life of the agreement. We have designated these interest rate swaps as cash flow hedges. Changes in the fair value of the derivatives are recorded to other comprehensive income on the consolidated statements of comprehensive income (loss) and are reclassified to interest expense over the life of the agreements. For additional details, refer to Note 13, Derivatives, of the accompanying notes to the consolidated financial statements within “Part II. Item 8. Financial Statements and Supplementary Data” of this Annual Report on Form 10-K. During Fiscal Year 2022, we made payments of approximately $9.6 million on our interest rate swaps and recognized $9.5 million within interest expense on the consolidated statement of operations. As of April 2, 2022, we had an immaterial amount of interest accrued within accrued liabilities on the consolidated balance sheet. A hypothetical 10% increase or decrease on market interest rates could result in a corresponding immaterial increase or decrease in annual interest expense due to the two interest rate swaps.
Interest rates were lower during Fiscal Year 2022 compared to the prior fiscal year. Interest income was not material during Fiscal Years 2022 and 2021.
FOREIGN CURRENCY EXCHANGE RATE RISK
We are a net receiver of currencies other than the United States Dollar ("USD.") Accordingly, changes in exchange rates, and in particular a strengthening of the USD, could negatively affect our total net revenues and gross margins, as expressed in USD. There is a risk that we will have to adjust local currency product pricing due to competitive pressures if there is significant volatility in foreign currency exchange rates.
The primary currency fluctuations to which we are exposed are the Euro ("EUR,") Great Britain Pound Sterling ("GBP,") and Mexican Peso ("MXN.") We use a hedging strategy to diminish, and make more predictable, the effect of currency fluctuations. All of our hedging activities are entered into with large financial institutions, which we periodically evaluate for credit risks. We hedge our balance sheet exposure by hedging EUR and GBP denominated cash, accounts receivable, and accounts payable balances, and our economic exposure by hedging a portion of anticipated EUR and GBP denominated sales and our MXN denominated expenditures. We can provide no assurance that our strategy will be successful in the future and that exchange rate fluctuations will not materially adversely affect our business. We do not hold or issue derivative financial instruments for speculative trading purposes. While our existing hedges cover a certain amount of exposure for the upcoming fiscal year, long-term strengthening of the USD relative to the currencies of other countries in which we sell may have a material adverse impact on our financial results. In addition, our results may be adversely impacted by future changes in foreign currency exchange rates relative to original hedging contracts.
The impact of changes in foreign currency rates recognized in other non-operating expense (income), net was immaterial in Fiscal Years 2022 and 2021. Although we hedge a portion of our foreign currency exchange exposure, the weakening of certain foreign currencies, particularly the EUR and GBP in comparison to the USD, could result in material foreign exchange losses in future periods.
Non-Designated Hedges
We hedge our EUR and GBP denominated cash, accounts receivable, and accounts payable balances by entering into foreign exchange forward contracts. The table below presents the impact on the foreign exchange gain (loss) of a hypothetical 10% appreciation and a 10% depreciation of the USD against the forward currency contracts as of April 2, 2022 (in millions):
| Currency - forward contracts | Position | USD Notional Value of Net Foreign Exchange Contracts | Foreign Exchange Gain From 10% Appreciation of USD | Foreign Exchange (Loss) From 10% Depreciation of USD | |||||||||||||||||||
| EUR | Sell EUR | $ | 72.9 | $ | 7.3 | $ | (7.3) | ||||||||||||||||
| GBP | Sell GBP | $ | 22.0 | $ | 2.2 | $ | (2.2) | ||||||||||||||||
63
Cash Flow Hedges
Costless Collars
The Company hedges a portion of the forecasted EUR and GBP denominated revenues with costless collars. On a monthly basis, the Company enters into option contracts with a six to 12-month term. Collar contracts are scheduled to mature at the beginning of each fiscal quarter, at which time the instruments convert to forward contracts. The Company also enters into cash flow forwards with a three-month term. Once the hedged revenues are recognized, the forward contracts become non-designated hedges to protect the resulting foreign monetary asset position for the Company.
Approximately 54%, 57%, and 52% of total net revenues in Fiscal Years 2022, 2021, and 2020, respectively, were derived from sales outside of the U.S. and were denominated primarily in EUR and GBP in each of the fiscal years.
As of April 2, 2022, we had foreign currency put and call option contracts with notional amounts of approximately €72.8 million and £14.2 million denominated in EUR and GBP, respectively. Collectively, our option contracts hedge against a portion of our forecasted foreign currency denominated sales. If the USD is subjected to either a 10% appreciation or 10% depreciation versus these net exposed currency positions, we could realize a gain of $8.1 million or incur a loss of $4.5 million, respectively. As of April 3, 2021, we had foreign currency put and call option contracts with notional amounts of approximately €91.4 million and £18.1 million, denominated in EUR and GBP, respectively.
The table below presents the impact on the Black-Scholes valuation of our currency option contracts of a hypothetical 10% appreciation and a 10% depreciation of the USD against the indicated option contract type for cash flow hedges as of April 2, 2022 (in millions):
| Derivative | USD Notional Value of Net Foreign Exchange Contracts | Foreign Exchange Gain From 10% Appreciation of USD | Foreign Exchange (Loss) From 10% Depreciation of USD | |||||||||||||||||
| Call options | $ | 106.2 | $ | 0.4 | $ | (4.3) | ||||||||||||||
| Put options | $ | 98.1 | $ | 6.8 | $ | (1.3) | ||||||||||||||
| Forwards | $ | 96.3 | $ | 9.3 | $ | (9.3) | ||||||||||||||
Collectively, our swap contracts hedge against a portion of our forecasted MXN denominated expenditures. As of April 2, 2022, we had cross-currency swap contracts with notional amounts of approximately MXN 572.4 million.
The table below presents the impact on the valuation of our cross-currency swap contracts of a hypothetical 10% appreciation and a 10% depreciation of the USD as of April 2, 2022 (in millions):
| Derivative | USD Notional Value of Cross-Currency Swap Contracts | Foreign Exchange (Loss) From 10% Appreciation of USD | Foreign Exchange Gain From 10% Depreciation of USD | |||||||||||||||||
| Position: Buy MXN | $ | 27.3 | $ | (2.7) | $ | 2.7 | ||||||||||||||
64
ITEM 8. FINANCIAL STATEMENTS AND SUPPLEMENTARY DATA
INDEX TO THE CONSOLIDATED FINANCIAL STATEMENTS
| Page | ||||||||
65
Report of Independent Registered Public Accounting Firm
To the Board of Directors and Stockholders of Plantronics, Inc.
Opinions on the Financial Statements and Internal Control over Financial Reporting
We have audited the accompanying consolidated balance sheets of Plantronics, Inc. and its subsidiaries (the “Company”) as of April 2, 2022 and April 3, 2021, and the related consolidated statements of operations, of comprehensive income (loss), of stockholders’ equity/(deficit) and of cash flows for each of the three years in the period ended April 2, 2022, including the related notes and financial statement schedule appearing under Item 15(a)(2) (collectively referred to as the “consolidated financial statements”). We also have audited the Company's internal control over financial reporting as of April 2, 2022, based on criteria established in Internal Control - Integrated Framework (2013) issued by the Committee of Sponsoring Organizations of the Treadway Commission (COSO).
In our opinion, the consolidated financial statements referred to above present fairly, in all material respects, the financial position of the Company as of April 2, 2022 and April 3, 2021, and the results of its operations and its cash flows for each of the three years in the period ended April 2, 2022 in conformity with accounting principles generally accepted in the United States of America. Also in our opinion, the Company maintained, in all material respects, effective internal control over financial reporting as of April 2, 2022, based on criteria established in Internal Control - Integrated Framework (2013) issued by the COSO.
Change in Accounting Principle
As discussed in Note 3 to the consolidated financial statements, the Company changed the manner in which it accounts for leases in fiscal year 2020.
Basis for Opinions
The Company's management is responsible for these consolidated financial statements, for maintaining effective internal control over financial reporting, and for its assessment of the effectiveness of internal control over financial reporting, included in Management’s Report on Internal Control over Financial Reporting appearing under Item 9A. Our responsibility is to express opinions on the Company’s consolidated financial statements and on the Company's internal control over financial reporting based on our audits. We are a public accounting firm registered with the Public Company Accounting Oversight Board (United States) (PCAOB) and are required to be independent with respect to the Company in accordance with the U.S. federal securities laws and the applicable rules and regulations of the Securities and Exchange Commission and the PCAOB.
We conducted our audits in accordance with the standards of the PCAOB. Those standards require that we plan and perform the audits to obtain reasonable assurance about whether the consolidated financial statements are free of material misstatement, whether due to error or fraud, and whether effective internal control over financial reporting was maintained in all material respects.
Our audits of the consolidated financial statements included performing procedures to assess the risks of material misstatement of the consolidated financial statements, whether due to error or fraud, and performing procedures that respond to those risks. Such procedures included examining, on a test basis, evidence regarding the amounts and disclosures in the consolidated financial statements. Our audits also included evaluating the accounting principles used and significant estimates made by management, as well as evaluating the overall presentation of the consolidated financial statements. Our audit of internal control over financial reporting included obtaining an understanding of internal control over financial reporting, assessing the risk that a material weakness exists, and testing and evaluating the design and operating effectiveness of internal control based on the assessed risk. Our audits also included performing such other procedures as we considered necessary in the circumstances. We believe that our audits provide a reasonable basis for our opinions.
66
Definition and Limitations of Internal Control over Financial Reporting
A company’s internal control over financial reporting is a process designed to provide reasonable assurance regarding the reliability of financial reporting and the preparation of financial statements for external purposes in accordance with generally accepted accounting principles. A company’s internal control over financial reporting includes those policies and procedures that (i) pertain to the maintenance of records that, in reasonable detail, accurately and fairly reflect the transactions and dispositions of the assets of the company; (ii) provide reasonable assurance that transactions are recorded as necessary to permit preparation of financial statements in accordance with generally accepted accounting principles, and that receipts and expenditures of the company are being made only in accordance with authorizations of management and directors of the company; and (iii) provide reasonable assurance regarding prevention or timely detection of unauthorized acquisition, use, or disposition of the company’s assets that could have a material effect on the financial statements.
Because of its inherent limitations, internal control over financial reporting may not prevent or detect misstatements. Also, projections of any evaluation of effectiveness to future periods are subject to the risk that controls may become inadequate because of changes in conditions, or that the degree of compliance with the policies or procedures may deteriorate.
Critical Audit Matters
The critical audit matter communicated below is a matter arising from the current period audit of the consolidated financial statements that was communicated or required to be communicated to the audit committee and that (i) relates to accounts or disclosures that are material to the consolidated financial statements and (ii) involved our especially challenging, subjective, or complex judgments. The communication of critical audit matters does not alter in any way our opinion on the consolidated financial statements, taken as a whole, and we are not, by communicating the critical audit matter below, providing a separate opinion on the critical audit matter or on the accounts or disclosures to which it relates.
Inventory Valuation - Product Inventory
As described in Notes 2 and 5 to the consolidated financial statements, inventories are valued at the lower of cost or net realizable value. Management writes down inventories that have become obsolete, are in excess of anticipated demand, or are greater than net realizable value. The Company has $234.1 million of inventory, net as of April 2, 2022 of which a portion relates to product inventory. As disclosed by management, the estimate of write downs for excess and obsolete inventory is based on a detailed analysis of on-hand inventory and purchase commitments in excess of forecasted demand. The estimate of the forecasted demand considers historical sales, sales price, projected future shipments, market conditions, inventory on hand, purchase commitments, product development plans and product life cycle, inventory on consignment, and other competitive factors.
The principal considerations for our determination that performing procedures relating to inventory valuation - product inventory is a critical audit matter are (i) the significant judgment by management when developing the estimate of write downs for excess and obsolete inventory; and (ii) a high degree of auditor judgment, subjectivity, and effort in performing procedures and evaluating the reasonableness of management's assumption related to forecasted demand.
Addressing the matter involved performing procedures and evaluating audit evidence in connection with forming our overall opinion on the consolidated financial statements. These procedures included testing the effectiveness of controls relating to management’s valuation of product inventory. These procedures also included, among others, (i) testing management’s process for developing the estimate of write downs for excess and obsolete inventory, (ii) evaluating the appropriateness of management’s methodology, (iii) evaluating the reasonableness of management’s assumption related to forecasted demand, and (iv) testing the completeness and accuracy of data used in developing the estimate. Evaluating the reasonableness of management’s assumption related to forecasted demand included evaluating historical sales, sales price, projected future shipments, market conditions, inventory on hand, purchase commitments, product development plans and product life cycle, inventory on consignment, and other competitive factors.
/s/ PricewaterhouseCoopers LLP
May 26, 2022
We have served as the Company’s auditor since 1988.
67
PLANTRONICS, INC.
CONSOLIDATED BALANCE SHEETS
(in thousands, except per share data)
| April 2, 2022 | April 3, 2021 | ||||||||||
| ASSETS | |||||||||||
| Current assets | |||||||||||
| Cash and cash equivalents | $ | $ | |||||||||
| Restricted cash | |||||||||||
| Short-term investments | |||||||||||
| Accounts receivable, net | |||||||||||
| Inventory, net | |||||||||||
| Other current assets | |||||||||||
| Total current assets | |||||||||||
| Non-current assets | |||||||||||
| Property, plant, and equipment, net | |||||||||||
| Purchased intangibles, net | |||||||||||
| Goodwill | |||||||||||
| Deferred tax assets | |||||||||||
| Other assets | |||||||||||
| Total assets | $ | $ | |||||||||
| LIABILITIES AND STOCKHOLDERS' EQUITY (DEFICIT) | |||||||||||
| Current liabilities | |||||||||||
| Accounts payable | $ | $ | |||||||||
| Accrued liabilities | |||||||||||
| Current portion of long-term debt | |||||||||||
| Total current liabilities | |||||||||||
| Non-current liabilities | |||||||||||
| Long-term debt, net of issuance costs | |||||||||||
| Long-term income taxes payable | |||||||||||
| Other long-term liabilities | |||||||||||
| Total liabilities | |||||||||||
| Commitments and contingencies (Note 7) | |||||||||||
| Stockholders' equity (deficit) | |||||||||||
Preferred stock, $ | |||||||||||
Common stock, $ | |||||||||||
| Additional paid-in capital | |||||||||||
| Accumulated other comprehensive income (loss) | ( | ||||||||||
| Accumulated deficit | ( | ( | |||||||||
| Total stockholders' equity before treasury stock | |||||||||||
Less: Treasury stock at cost ( | ( | ( | |||||||||
| Total stockholders' equity (deficit) | ( | ||||||||||
| Total liabilities and stockholders' equity (deficit) | $ | $ | |||||||||
The accompanying notes are an integral part of these consolidated financial statements.
68
PLANTRONICS, INC.
CONSOLIDATED STATEMENTS OF OPERATIONS
(in thousands, except per share data)
| Fiscal Year Ended | |||||||||||||||||
| April 2, 2022 | April 3, 2021 | March 28, 2020 | |||||||||||||||
| Net revenues | |||||||||||||||||
| Net product revenues | $ | $ | $ | ||||||||||||||
| Net service revenues | |||||||||||||||||
| Total net revenues | |||||||||||||||||
| Cost of revenues | |||||||||||||||||
| Cost of product revenues | |||||||||||||||||
| Cost of service revenues | |||||||||||||||||
| Total cost of revenues | |||||||||||||||||
| Gross profit | |||||||||||||||||
| Operating expenses | |||||||||||||||||
| Research, development, and engineering | |||||||||||||||||
| Selling, general, and administrative | |||||||||||||||||
| Impairment of goodwill and long-lived assets | |||||||||||||||||
| Loss (gain), net from litigation settlements | ( | ||||||||||||||||
| Restructuring and other related charges | |||||||||||||||||
| Total operating expenses | |||||||||||||||||
| Operating (loss) income | ( | ( | |||||||||||||||
| Interest expense | |||||||||||||||||
| Other non-operating expense (income), net | ( | ( | |||||||||||||||
| Loss before income taxes | ( | ( | ( | ||||||||||||||
| Income tax benefit | ( | ( | ( | ||||||||||||||
| Net income (loss) | $ | $ | ( | $ | ( | ||||||||||||
| Per share data | |||||||||||||||||
| Basic earnings (loss) per common share | $ | $ | ( | $ | ( | ||||||||||||
| Diluted earnings (loss) per common share | $ | $ | ( | $ | ( | ||||||||||||
| Basic shares used in computing earnings (loss) per common share | |||||||||||||||||
| Diluted shares used in computing earnings (loss) per common share | |||||||||||||||||
The accompanying notes are an integral part of these consolidated financial statements.
69
PLANTRONICS, INC.
CONSOLIDATED STATEMENTS OF COMPREHENSIVE INCOME (LOSS)
(in thousands)
| Fiscal Year Ended | ||||||||||||||||||||
| April 2, 2022 | April 3, 2021 | March 28, 2020 | ||||||||||||||||||
| Net income (loss) | $ | $ | ( | $ | ( | |||||||||||||||
| Other comprehensive income (loss), before tax | ||||||||||||||||||||
| Foreign currency translation adjustment | ( | |||||||||||||||||||
| Unrealized gains (losses) on cash flow hedges | ||||||||||||||||||||
| Unrealized cash flow hedge gains (losses) | ( | ( | ||||||||||||||||||
| Net (gains) losses reclassified into net revenues | ( | ( | ||||||||||||||||||
| Net gains reclassified into cost of revenues | ( | ( | ( | |||||||||||||||||
| Net losses reclassified into interest expense | ||||||||||||||||||||
| Net unrealized gains (losses) on cash flow hedges | $ | $ | $ | ( | ||||||||||||||||
| Income tax (expense) benefit in other comprehensive income | ( | ( | ||||||||||||||||||
| Other comprehensive income (loss) | ( | |||||||||||||||||||
| Comprehensive income (loss) | $ | $ | ( | $ | ( | |||||||||||||||
The accompanying notes are an integral part of these consolidated financial statements.
70
| Fiscal Year Ended | |||||||||||||||||
| April 2, 2022 | April 3, 2021 | March 28, 2020 | |||||||||||||||
| Cash flows from operating activities | |||||||||||||||||
| Net income (loss) | $ | $ | ( | $ | ( | ||||||||||||
| Adjustments to reconcile net income (loss) to net cash (used in) provided by operating activities: | |||||||||||||||||
| Depreciation and amortization | |||||||||||||||||
| Amortization of debt issuance costs | |||||||||||||||||
| Stock-based compensation | |||||||||||||||||
| Impairment of goodwill and long-lived assets | |||||||||||||||||
| Deferred income taxes | ( | ( | ( | ||||||||||||||
| Provision for excess and obsolete inventories | |||||||||||||||||
| Restructuring and other related charges | |||||||||||||||||
| Cash payments for restructuring charges | ( | ( | ( | ||||||||||||||
| Other operating activities | |||||||||||||||||
| Changes in assets and liabilities: | |||||||||||||||||
| Accounts receivable, net | ( | ( | |||||||||||||||
| Inventory, net | ( | ( | ( | ||||||||||||||
| Current and other assets | ( | ( | |||||||||||||||
| Accounts payable | ( | ||||||||||||||||
| Accrued liabilities | ( | ( | |||||||||||||||
| Income taxes | ( | ( | |||||||||||||||
| Net cash (used in) provided by operating activities | ( | ||||||||||||||||
| Cash flows from investing activities | |||||||||||||||||
| Proceeds from sales of short-term investments | |||||||||||||||||
| Purchases of short-term investments | ( | ( | ( | ||||||||||||||
| Capital expenditures | ( | ( | ( | ||||||||||||||
| Proceeds from sale of property, plant, and equipment | |||||||||||||||||
| Other investing activities | ( | ||||||||||||||||
| Net cash used in investing activities | ( | ( | ( | ||||||||||||||
| Cash flows from financing activities | |||||||||||||||||
| Employees' tax withheld and paid for restricted stock and restricted stock units | ( | ( | ( | ||||||||||||||
| Proceeds from issuances under stock-based compensation plans | |||||||||||||||||
| Payment of cash dividends | ( | ||||||||||||||||
| Proceeds from revolving line of credit | |||||||||||||||||
| Repayments of revolving line of credit | ( | ||||||||||||||||
| Repayments of long-term debt | ( | ( | ( | ||||||||||||||
| Proceeds from debt issuance, net of issuance costs | |||||||||||||||||
| Net cash (used in) provided by financing activities | ( | ( | |||||||||||||||
| Effect of exchange rate changes on cash, cash equivalents, and restricted cash | ( | ( | |||||||||||||||
| Net (decrease) increase in cash, cash equivalents, and restricted cash | ( | ||||||||||||||||
| Cash, cash equivalents, and restricted cash at beginning of year | |||||||||||||||||
| Cash, cash equivalents, and restricted cash at end of year | $ | $ | $ | ||||||||||||||
The accompanying notes are an integral part of these consolidated financial statements.
71
| Fiscal Year Ended | |||||||||||||||||
| Supplemental disclosures (in thousands) | April 2, 2022 | April 3, 2021 | March 28, 2020 | ||||||||||||||
| Cash paid for income taxes | $ | $ | $ | ||||||||||||||
| Cash paid for interest | |||||||||||||||||
The following table provides a reconciliation of cash and cash equivalents and restricted cash reported within the consolidated balance sheets that sum to the total of the same amounts shown in the consolidated statements of cash flows:
| (in thousands) | April 2, 2022 | April 3, 2021 | |||||||||
| Cash and cash equivalents | $ | $ | |||||||||
| Restricted cash | |||||||||||
| Total cash and cash equivalents and restricted cash shown in the consolidated statements of cash flows | $ | $ | |||||||||
The accompanying notes are an integral part of these consolidated financial statements.
72
PLANTRONICS, INC.
CONSOLIDATED STATEMENTS OF STOCKHOLDERS' EQUITY (DEFICIT)
(in thousands)
| Common Stock | Additional Paid-In Capital | Accumulated Other Comprehensive (Loss) Income | Retained Earnings (Accumulated Deficit) | Treasury Stock | Total Stockholders' Equity (Deficit) | ||||||||||||||||||||||||||||||||||||
| Shares | Amount | ||||||||||||||||||||||||||||||||||||||||
| Balances at March 30, 2019 | $ | $ | $ | ( | $ | $ | ( | $ | |||||||||||||||||||||||||||||||||
| Net loss | — | — | — | — | ( | — | ( | ||||||||||||||||||||||||||||||||||
| Foreign currency translation adjustments | — | — | — | ( | — | — | ( | ||||||||||||||||||||||||||||||||||
| Net unrealized losses on cash flow hedges, net of tax | — | — | — | ( | — | — | ( | ||||||||||||||||||||||||||||||||||
| Proceeds from issuances under stock-based compensation plans | — | — | — | ||||||||||||||||||||||||||||||||||||||
| Repurchase of restricted common stock | ( | — | — | — | — | — | |||||||||||||||||||||||||||||||||||
| Cash dividends, $0.45 per common share | — | — | — | — | ( | — | ( | ||||||||||||||||||||||||||||||||||
| Stock-based compensation | — | — | — | — | — | ||||||||||||||||||||||||||||||||||||
| Employees' tax withheld and paid for restricted stock and restricted stock units | ( | — | — | — | — | ( | ( | ||||||||||||||||||||||||||||||||||
| Proceeds from Employee Stock Purchase Plan | |||||||||||||||||||||||||||||||||||||||||
| Impact of new accounting standard adoption | — | — | — | — | ( | — | ( | ||||||||||||||||||||||||||||||||||
| Other equity changes | — | — | — | ( | — | ( | |||||||||||||||||||||||||||||||||||
| Balances at March 28, 2020 | ( | ( | ( | ( | |||||||||||||||||||||||||||||||||||||
| Net loss | — | — | — | — | ( | — | ( | ||||||||||||||||||||||||||||||||||
| Net unrealized gains on cash flow hedges, net of tax | — | — | — | — | — | ||||||||||||||||||||||||||||||||||||
| Proceeds from issuances under stock-based compensation plans | — | — | — | — | |||||||||||||||||||||||||||||||||||||
| Exercise of stock options | — | — | — | — | |||||||||||||||||||||||||||||||||||||
| Repurchase of restricted common stock | ( | — | — | — | — | — | |||||||||||||||||||||||||||||||||||
| Stock-based compensation | — | — | — | — | — | ||||||||||||||||||||||||||||||||||||
| Employees' tax withheld and paid for restricted stock and restricted stock units | ( | — | — | — | — | ( | ( | ||||||||||||||||||||||||||||||||||
| Proceeds from Employee Stock Purchase Plan | — | — | — | ||||||||||||||||||||||||||||||||||||||
| Other equity changes | — | — | ( | — | — | ( | |||||||||||||||||||||||||||||||||||
| Balances at April 3, 2021 | ( | ( | ( | ( | |||||||||||||||||||||||||||||||||||||
| Net income | — | — | — | — | — | ||||||||||||||||||||||||||||||||||||
| Net unrealized gains on cash flow hedges, net of tax | — | — | — | — | — | ||||||||||||||||||||||||||||||||||||
| Proceeds from issuances under stock-based compensation plans | — | — | — | — | |||||||||||||||||||||||||||||||||||||
| Stock-based compensation | — | — | — | — | — | ||||||||||||||||||||||||||||||||||||
| Employees' tax withheld and paid for restricted stock and restricted stock units | — | — | — | — | ( | ( | |||||||||||||||||||||||||||||||||||
| Proceeds from Employee Stock Purchase Plan | — | — | — | ||||||||||||||||||||||||||||||||||||||
| Balances at April 2, 2022 | $ | $ | $ | $ | ( | $ | ( | $ | |||||||||||||||||||||||||||||||||
The accompanying notes are an integral part of these consolidated financial statements.
73
PLANTRONICS, INC.
NOTES TO THE CONSOLIDATED FINANCIAL STATEMENTS
1. THE COMPANY
Plantronics, Inc. (“Poly,” the “Company”) is a leading global communications company that designs, manufactures, and markets integrated communications and collaboration solutions for professionals. The Company has two operating and reportable segments, Products and Services, and offers its products under the , Plantronics and Polycom brands.
, Plantronics and Polycom brands.Merger Agreement
On March 25, 2022, Poly entered into an Agreement and Plan of Merger (the “Merger Agreement”) with HP Inc. (“HP”) and Prism Subsidiary Corp. (“Merger Sub”), a wholly-owned subsidiary of HP, providing for Poly’s acquisition in an all-cash transaction by way of a merger of Merger Sub with and into Poly (the “Merger”), with Poly continuing as a wholly-owned subsidiary of HP.
The Merger Agreement and transactions contemplated by the Merger Agreement were approved by Poly's Board, which further resolved to recommend that Poly stockholders vote to adopt and approve the Merger Agreement. Under the Merger Agreement, at the effective time of the Merger, each issued and outstanding share of Poly’s common stock (except as otherwise set forth in the Merger Agreement) will be canceled and automatically converted into the right to receive $40.00 in cash, without interest and less any applicable withholding taxes.
Completion of the Merger is subject to the satisfaction of certain terms and conditions set forth in the Merger Agreement, including (i) adoption of the Merger Agreement by the requisite affirmative vote of our stockholders; (ii) the absence of any temporary restraining order, preliminary or permanent injunction or other judgment or order issued by a court of competent jurisdiction preventing, prohibiting or making illegal the consummation of the Merger; and (iii) the expiration or termination of the waiting period applicable to the Merger under the United States Hart-Scott Rodino Antitrust Improvements Act of 1976, as amended without the imposition of a burdensome effect (as defined in the Merger Agreement), and the obtaining or making of all consents, approvals and filings required under the competition laws of China, Colombia, the European Union and Mexico and the foreign direct investment law of France, in each case without the imposition of a burdensome effect. The Merger is expected to close in calendar year 2022, subject to the satisfaction of applicable conditions. Upon consummation of the Merger, Poly’s common stock will no longer be listed on any public market.
2. SIGNIFICANT ACCOUNTING POLICIES
Management's Use of Estimates and Assumptions
The Company's consolidated financial statements are prepared in accordance with generally accepted accounting principles in the United States of America ("U.S. GAAP.") The Company's reporting currency is United States Dollars ("USD.") In connection with the preparation of the consolidated financial statements, the Company is required to make assumptions and estimates about future events and apply judgments that affect the reported amounts of assets, liabilities, net revenues, expenses, and the related disclosures. The Company bases its assumptions, estimates, and judgments on historical experience, current trends, future expectations, and other factors that management believes to be relevant at the time the consolidated financial statements are prepared. On an ongoing basis, the Company reviews its accounting policies, assumptions, estimates, and judgments, including those related to revenues and related reserves and allowances, inventory valuation, product warranty obligations, the useful lives of long-lived assets, including property, plant, and equipment, investment fair values, stock-based compensation, the valuation of and assessment of recoverability of intangible assets and their useful lives, income taxes, contingencies, and restructuring charges, to ensure that the consolidated financial statements are presented fairly and in accordance with U.S. GAAP. Because future events and their effects cannot be determined with certainty, actual results could differ from the Company's assumptions and estimates.
74
Risks and Uncertainties
The Company is subject to a greater degree of uncertainty than normal in making the judgments and estimates needed to apply its significant accounting policies due to the ongoing supply chain disruptions and COVID-19 pandemic. The Company has assessed accounting estimates and other matters, including those using prospective financial information, using information that is reasonably available as of the issuance date of the consolidated financial statements. The accounting estimates and other matters the Company has assessed included, but were not limited to, impairment of goodwill and other long-lived assets, provisions for doubtful accounts, valuation allowances for deferred tax assets, inventory and related reserves, and revenue recognition and related reserves. The Company may make changes to these estimates and judgments, which could result in material impacts to the consolidated financial statements in future periods. The extent and duration of the impact of the COVID-19 pandemic and the shortage of adequate component supply on the Company's business is highly uncertain and difficult to predict. The Company relies on contract manufacturers and sourcing of materials from the Asia Pacific region, as well as its owned manufacturing facility in Mexico. The Company has experienced disruptions in both its own supply chain as well as those of its contract manufacturers and suppliers both as a result of COVID-19 as well as the global shortage of key components. Such disruptions have had, and may continue to have, a material impact on the Company's ability to source critical component parts, complete production of its products, fulfill customer orders, and adversely affect the ability to meet customer demands as companies utilize work-from-home and hybrid work models. Additionally, if a significant number of the Company's workforce employed in any of these manufacturing facilities or in the Company's offices were to contract the virus, the Company may experience delays or the inability to develop, produce, and deliver the Company's products on a timely basis. Furthermore, capital markets and economies worldwide have also been negatively impacted by the COVID-19 pandemic and the supply chain disruptions, and it is possible that it could cause a local and/or global economic recession.
The severity of the impact of the COVID-19 pandemic and supply chain disruptions on the Company's business will depend on a number of factors, including, but not limited to, the duration and severity of these factors and the extent and severity of the impact on its customers and suppliers, all of which are uncertain and cannot be predicted. The Company's future results of operations and liquidity could be adversely impacted by delays in payments of outstanding receivable amounts beyond normal payment terms, including potential write-offs due to financial weakness and/or bankruptcy of its customers, supply chain disruptions and uncertain demand, and the impact of any initiatives or programs that the Company may undertake to address financial and operational challenges faced by its customers and suppliers.
Principles of Consolidation
The consolidated financial statements include the accounts of the Company and its subsidiaries, all of which are wholly owned. The Company has included the results of operations of acquired companies from the date of acquisition. All significant intercompany balances and transactions have been eliminated. Unless the context indicates otherwise, references to "we," "us," and "our" refer to Plantronics, Inc. and its subsidiaries.
Fiscal Year
The Company's fiscal year ends on the Saturday closest to the last day of March. The years ended April 2, 2022 ("Fiscal Year 2022"), April 3, 2021 ("Fiscal Year 2021"), and March 28, 2020 ("Fiscal Year 2020") had 52, 53, 52 weeks, respectively.
Financial Instruments
Cash and Cash Equivalents and Short-term Investments
All highly liquid investments with original stated maturities of three months or less at the date of purchase are classified as cash equivalents.
The Company's short-term investments consist of publicly traded mutual funds. The specific identification method is used to determine the cost of investments. Gains and losses are recorded in other non-operating expense (income), net in the consolidated statements of operations. Investments are classified as either short-term or long-term based on each instrument's underlying effective maturity date and reasonable expectations with regard to sales and redemptions of the instruments. The Company may sell its investments prior to their stated maturities for strategic purposes, in anticipation of credit deterioration, or for duration management.
Derivative Financial Instruments
75
The Company measures all derivative instruments at fair value and reports them on the consolidated balance sheets as assets or liabilities. Changes in the fair value of derivatives are accounted for depending on the intended use of the derivative, designation of the hedging relationship, and whether or not the criteria to apply hedge accounting have been satisfied.
The Company has significant assets and liabilities denominated in foreign currencies subjecting it to foreign currency risk. The Company enters into foreign exchange forward contracts to reduce the impact of currency fluctuations on assets and liabilities denominated in foreign currencies. The Company does not elect to apply hedge accounting for these forward contracts. Foreign currency forward contracts are measured at fair value with changes in fair value recorded within other non-operating expense (income), net in the consolidated statements of operations. Foreign currency forward contracts are valued using pricing models that use observable inputs. Gains and losses on these contracts are intended to offset the impact of foreign exchange rate changes on the underlying foreign currency denominated assets and liabilities, and therefore, do not subject the Company to material balance sheet risk.
The Company has significant revenues and expenses denominated in foreign currencies subjecting it to foreign currency risk. The Company purchases foreign currency option contracts and cross-currency swaps that qualify as cash flow hedges, with maturities of up to 12 months, to reduce the volatility of cash flows related primarily to forecasted revenues and expenses. The designated derivative's gain or loss is initially recorded as a component of accumulated other comprehensive income (loss) and is subsequently reclassified into the line item in the consolidated statements of operations in which the hedged item is recorded, in the same period in which the transaction affects earnings. The cash flows from such hedges are presented in the same line item in the consolidated statements of cash flows as the items being hedged.
The Company has floating rate debt subjecting it to interest rate risk. On June 15, 2021, the Company entered into a three-year amortizing interest rate swap in order to hedge against changes in cash flow (interest payments) attributable to fluctuations in the Company's variable rate debt. Additionally, on July 30, 2018, the Company entered into a four-year amortizing interest rate swap in order to hedge against changes in cash flows (interest payments) attributable to fluctuations in the Company's variable rate debt. The designated interest rate swaps' gain or loss are initially recorded as a component of accumulated other comprehensive income and are subsequently reclassified into interest expense in the consolidated statements of operations over the life of the underlying debt, as interest on the Company's floating rate debt is accrued.
Provision for Doubtful Accounts
Inventory Valuation
Product Warranty Obligations
The Company’s products include a warranty that is typically one to two years in duration, depending on the product and region. The warranty provides assurance that the product complies with agreed-upon specifications and is not sold separately. The warranty qualifies as an assurance warranty and is not a separate performance obligation. The Company records a liability for the estimated costs of warranties at the time the related revenue is recognized. The specific warranty terms and conditions range from to two years , starting from the delivery date to the end user, and vary depending upon the product sold and the country in which the Company does business. Factors that affect warranty obligations include product failure rates, estimated return rates, the amount of time lapsed from the date of sale to the date of return, material usage, service- related costs incurred in correcting product failure claims, and knowledge of specific product failures that are outside of the Company’s typical experience.
76
Goodwill and Purchased Intangibles, net
Goodwill has been measured as the excess of the cost of acquisition over the amount assigned to tangible and identifiable intangible assets acquired, less liabilities assumed. At least annually, in the fourth quarter of each Fiscal Year, or more frequently if indicators of impairment exist, management performs a review to determine if the carrying value of goodwill is impaired. Impairment testing is performed at the reporting unit level. The Company determines its reporting units by assessing whether discrete financial information is available and if segment management regularly reviews the results of that component. Goodwill has been assigned to reporting units.
The Company performs an initial assessment of qualitative factors to determine whether the existence of events and circumstances leads to a determination that it is more-likely-than-not that the fair value of a reporting unit is less than its carrying amount. If, after assessing the totality of relevant events and circumstances, the Company determines that it is more-likely-than-not that the fair value of the reporting unit exceeds its carrying value and there is no indication of impairment, no further testing is performed. However, if the Company concludes otherwise, a quantitative impairment test must be performed by estimating the fair value of the reporting unit and comparing it with its carrying value, including goodwill. If the carrying amount of a reporting unit is greater than its estimated fair value, goodwill is written down by the excess amount, limited to the total amount of goodwill allocated to that reporting unit.
Purchased intangibles are carried at cost and are amortized on a straight-line basis over their estimated useful lives. The Company does not have intangible assets with indefinite useful lives other than goodwill.
The Company reviews its long-lived assets to be held and used, including property, plant, and equipment, right-of-use ("ROU") assets, and purchased intangibles, for impairment whenever events or changes in circumstances indicate that the carrying value of the related asset group may not be recoverable. Such conditions may include an economic downturn or a change in the assessment of future operations. The Company performs a recoverability test at the asset group level. Determination of recoverability is based on the lowest level of identifiable estimated undiscounted cash flows resulting from use of the asset group and its ultimate disposition. Measurement of any impairment loss is based on the amount by which the carrying value of the asset group exceeds its fair value.
Property, Plant, and Equipment
Property, plant, and equipment is stated at cost less accumulated depreciation and amortization. Depreciation is calculated using the straight-line method over the estimated useful lives of the respective assets, which range from one to 30 years. Amortization of leasehold improvements is computed using the straight-line method over the shorter of the estimated useful lives of the assets or the remaining contractual lease term. Capitalized software costs are amortized on a straight-line basis over the estimated useful life of the assets.
Leases
The Company’s lease portfolio consists primarily of real estate facilities under operating leases. The Company determines if an arrangement is or contains a lease at inception. ROU assets and lease liabilities are recognized at commencement based on the present value of the future minimum lease payments over the lease term. The Company applies its incremental borrowing rate, which approximates the rate at which the Company would borrow, on a secured basis, in the country where the lease was executed, to determine the present value of the future minimum lease payments when the respective lease does not provide an implicit rate. Certain of the Company’s lease agreements include options to extend or renew the lease terms. Such options are excluded from the minimum lease obligation unless they are reasonably certain to be exercised. Operating lease expense is recognized on a straight-line basis over the lease term.
77
Fair Value Measurements
Fair value is defined as the exit price, or the amount that would be received to sell an asset or paid to transfer a liability in an orderly transaction between market participants as of the measurement date. The authoritative guidance establishes a hierarchy for inputs used in measuring fair value that maximizes the use of observable inputs and minimizes the use of unobservable inputs by requiring that the most observable inputs be used when available. Observable inputs are from sources independent of the Company. Unobservable inputs reflect the Company’s assumptions about the factors market participants would use in valuing the asset or liability developed based upon the best information available in the circumstances. The categorization of financial assets and liabilities within the valuation hierarchy is based upon the lowest level of input that is significant to the fair value measurement. In determining fair value, we use various valuation approaches. The following is a summary of the hierarchy levels:
•Level 1: Inputs are quoted prices in active markets for identical assets or liabilities.
•Level 2: Inputs include quoted prices for similar assets or liabilities in active markets, quoted prices for identical or similar assets or liabilities in markets that are not active, and inputs (other than quoted prices) that are observable for the asset or liability, either directly or indirectly.
•Level 3: Inputs are unobservable for the asset or liability.
Revenue Recognition
Total net revenues include gross revenue less sales discounts, product returns, and sales incentives, all of which require us to make estimates for the portion of these allowances that have yet to be credited or paid to our customers. Performance obligations are promises in a contract to transfer a distinct good or service to the customer, and are the basis for determining how revenue is recognized. Revenue is recognized when performance obligations are satisfied. Generally, this occurs with the transfer of control of products or services. Revenue is measured as the amount of consideration the Company expects to receive in exchange for transferring goods or providing services. Revenue related to product shipments is generally recognized once title and risk of loss of the product are transferred to the customer. The Company believes that transfer of title and risk of loss best represent the moment at which the customer’s ability to direct the use of and obtain substantially all the benefits of an asset have been achieved. The Company has elected to recognize the cost for freight and shipping when control over products have transferred to the customer as an expense in cost of revenues in the consolidated statements of operations.
The Company's service revenue is recognized either over-time or at a point-in-time, depending on the nature of the offering. Revenues associated with non-cancelable maintenance and support contracts comprise approximately 81 % of the Company's net service revenues and are recognized ratably over the contract term, which typically ranges between one and three years. The Company believes this recognition period faithfully depicts the pattern of transfer of control for maintenance and support as the services are provided in relatively even increments. For certain products, support or maintenance are provided free of charge without the purchase of a separate service contract. If the free service is determined to rise to the level of a performance obligation, the Company allocates a portion of the transaction price to the implied performance obligation and recognizes service revenues over the estimated implied service period, which can range between one month to several years, depending on the circumstances. Revenues associated with professional services are recognized when the Company has objectively determined that the obligation has been satisfied, which is usually upon customer acceptance.
The Company's contracts with customers often include promises to transfer multiple products and services to a customer. Determining whether products and services are considered distinct performance obligations that should be accounted for separately versus together may require significant judgment. The Company allocates the transaction price of a contract to each identified performance obligation based on stand-alone selling price (“SSP.”) A fixed discount is always subject to allocation in this manner. If the transaction price is considered variable, the Company determines if the consideration is associated with one or many, but not all of the performance obligations, and allocates accordingly. Judgment is also required to determine the SSP for each distinct performance obligation. The Company derives SSP for its performance obligations through a stratification methodology and consider a number of characteristics, including consideration related to different service types, customers, and geographies. In instances where SSP is not directly observable, such as when the Company does not sell the product or service separately, the Company determines the SSP using information that may include market conditions and other observable inputs.
On occasion, the Company will fulfill only part of a purchase order due to lack of current availability for one or more items requested on an order. The Company's practice is to ship what is on hand, with the remaining goods shipped once the product is
78
Income Taxes
Deferred income taxes are determined based on the differences between the financial reporting and tax bases of assets and liabilities and are measured using the currently enacted tax rates and laws. The Company records a valuation allowance against particular deferred income tax assets if it is more-likely-than-not that those assets will not be realized. The provision for (benefit from) income taxes comprise the Company's current tax liability and changes in deferred income tax assets and liabilities.
Significant judgment is required in evaluating the Company's uncertain tax positions and determining its provision for (benefit from) income taxes. The Company establishes reserves for tax-related uncertainties based on estimates of whether, and the extent to which, additional taxes will be due. These reserves are established when the Company believes that certain positions might be challenged despite its belief that its tax return positions are in accordance with applicable tax laws. The Company adjusts these reserves in light of changing facts and circumstances, such as the closing of a tax audit, new tax legislation, or the change of an estimate. To the extent that the final tax outcome of these matters is different than the amounts recorded, such differences will affect the provision for income taxes in the period in which such determination is made. The provision for income taxes includes the effect of reserve provisions and changes to reserves that are considered appropriate, as well as the related net interest and penalties.
The Company is subject to income taxes in the U.S. and foreign jurisdictions. At any one-time, multiple tax years are subject to audit by various tax authorities.
The Company accounts for Global Intangible Low-Taxed Income as period costs when incurred.
Earnings (Loss) Per Share
The Company has stock-based compensation plans under which employees, non-employee directors, and consultants may be granted stock-based compensation awards. Basic earnings (loss) per share is calculated by dividing net income (loss) by the weighted-average number of common shares outstanding during the period. Diluted earnings (loss) per share includes the effect of outstanding stock options, restricted stock, and shares purchased under the 2002 ESPP in accordance with the treasury stock method, except when their effect is anti-dilutive. For further details refer to Note 16, Computation of Earnings (Loss) Per Common Share.
Comprehensive Income (Loss)
Comprehensive income (loss) consists of two components, net income (loss) and other comprehensive income (loss.) Other comprehensive income (loss) refers to income, expenses, gains, and losses that are recorded as an element of stockholders’ equity (deficit), but which are excluded from net income. Accumulated other comprehensive income (loss), as presented in the accompanying consolidated balance sheets, consists of foreign currency translation adjustments and unrealized gains and losses on cash flow hedges, net of tax.
79
Stock-Based Compensation Expense
The Company applies the provisions of Accounting Standards Codification (ASC) 718, Compensation - Stock Compensation, which requires the measurement and recognition of compensation expense for all stock-based compensation awards made to employees and non-employee directors based on estimated fair values as of the grant date. The Company recognizes compensation expense using the straight-line attribution approach over the service period for which the stock-based compensation is expected to vest. The Company estimates expected forfeitures at the time of grant based on historical activity, which the Company believes is indicative of expected future forfeitures.
Treasury Shares
Concentration of Credit Risk
Financial instruments that potentially subject the Company to concentrations of credit risk consist primarily of cash equivalents, short-term investments, and accounts receivable, net.
The Company’s investment policy limits investments to highly rated securities. In addition, the Company limits the amount of credit exposure to any one issuer and restricts placement of these investments to issuers evaluated as creditworthy. As of April 2, 2022, the Company's investments were composed solely of mutual funds and money market funds. As of April 3, 2021, the Company's investments were composed solely of mutual funds and money market funds.
Concentrations of credit risk with respect to accounts receivable, net are limited due to the large number of customers that comprise the Company’s customer base and their dispersion across different geographies and markets. Two customers, Ingram Micro Group and ScanSource, accounted for 38.7 % and 22.3 %, respectively, of total accounts receivable, net as of April 2, 2022. Two customers, ScanSource and Ingram Micro Group, accounted for 24.9 % and 24.7 %, respectively, of total accounts receivable, net as of April 3, 2021. The Company does not believe other significant concentrations of credit risk exist. The Company performs ongoing credit evaluations of its customers' financial condition and requires no collateral from its customers. The Company maintains a provision for doubtful accounts based upon expected collectability of all accounts receivable.
Certain inventory components required by the Company and our original design and contract manufacturers are only available from a limited number of suppliers. The rapid rate of technological change, the necessity of developing and manufacturing products with short lifecycles, and global supply and demand may intensify these risks. The inability to obtain components as required, or to develop alternative sources, as required in the future, could result in delays or reductions in product shipments, which in turn could have a material adverse effect on the Company’s business, financial condition, results of operations and cash flows. As a mitigation, the Company has ongoing efforts to identify alternative sourcing suppliers to eliminate reliance to the extent possible on one supplier.
Related Party
A vendor of the Company, Digital River, Inc. ("Digital River"), with whom the Company had an existing relationship prior to the Acquisition of Polycom for e-commerce services, is a wholly owned subsidiary of Siris Capital Group, LLC ("Siris"). Triangle Private Holdings II, LLC ("Triangle") is also a wholly owned subsidiary of Siris. Immediately prior to the Company's Acquisition of Polycom on July 2, 2018, Triangle was Polycom’s sole stockholder and pursuant to the Company's Stock Purchase Agreement with Triangle, Triangle owned approximately 17.8 % of the Company's issued and outstanding stock. However, Triangle sold all of its stock in two block sales to a broker-dealer on August 27, 2020 and November 23, 2020. As a result of the first block sale, one of the directors previously appointed to the Board resigned pursuant to the Stockholder Agreement with Triangle. The Board waived the resignation requirement with respect to a second director previously appointed in accordance with the Stockholder Agreement with Triangle. As a consequence of these relationships, Digital River is considered a related party under ASC 850, Related-Party Disclosures. The Company had immaterial transactions with Digital River during Fiscal Years 2022, 2021 and 2020. As of April 3, 2021, Triangle did not hold any of the Company's stock. For the Fiscal Year of 2022, Triangle and its related parent companies were not considered related parties.
80
Accounts Receivable Financing
The Company holds a financing agreement with an unrelated third-party financing company (the "Financing Agreement") whereby the Company offers distributors and resellers direct or indirect financing on their purchases of products and services. In return, the Company agrees to pay the financing company a fee based on a pre-defined percentage of the transaction amount financed. In certain instances, the Financing Agreement results in a transfer of the Company's receivables, without recourse, to the financing company. If the transaction meets the applicable criteria under ASC 860, Transfers and Servicing ("ASC 860"), and is accounted for as a sale of financial assets, the related accounts receivable is excluded from the balance sheet upon receipt of the third-party financing company's payment remittance. In certain legal jurisdictions, the arrangements that involve maintenance services or products bundled with maintenance at one price do not qualify as sales of financial assets in accordance with the authoritative guidance. Accordingly, accounts receivable related to these arrangements are accounted for as a secured borrowing in accordance with ASC 860 and the Company records a liability for any cash received, while maintaining the associated accounts receivable balance until the distributor or reseller remits payment to the third-party financing company.
In Fiscal Year 2022, total transactions entered pursuant to the terms of the Financing Agreement were approximately $53.9 million related to the transfer of a financial asset. The financing of these receivables accelerated the collection of cash and reduced the Company's credit exposure. Included in accounts receivable, net on the consolidated balance sheet as of April 2, 2022 was approximately $9.1 million due from the financing company. Total fees incurred pursuant to the Financing Agreement was $0.9 million for Fiscal Year 2022. These fees are recorded as a reduction of net revenues in the consolidated statement of operations.
Reclassifications
3. RECENT ACCOUNTING PRONOUNCEMENTS
In February 2016, the Financial Accounting Standards Board issued ASU 2016-02, Leases (“ASU 2016-02”). Under ASU 2016-02, lessees are required to recognize a lease liability and a corresponding ROU asset on the balance sheet for virtually all leases, essentially eliminating off-balance sheet financing. On March 31, 2019, the Company adopted ASU 2016-02 using the modified retrospective approach and recognized $57.3 million in ROU assets within Other Assets and $68.5 million in lease liabilities, of which $25.7 million and $42.8 million were included within Accrued Liabilities and Other Long-Term Liabilities, respectively, on the Consolidated Balance Sheet. The initial ROU assets recognized were adjusted for accrued rent and facility-related restructuring liabilities as of the adoption date. The adoption of ASU 2016-02 did not have a material impact on the Company's Consolidated Statements of Operations.
Recent accounting pronouncements issued by the FASB are not expected to have a material impact on the Company's financial position, results of operations, or cash flows.
4. DEFERRED COMPENSATION
81
5. DETAILS OF CERTAIN BALANCE SHEET ACCOUNTS
Accounts receivable, net
| (in thousands) | April 2, 2022 | April 3, 2021 | ||||||||||||
| Accounts receivable | $ | $ | ||||||||||||
| Provisions for promotions and rebates | ( | ( | ||||||||||||
| Provisions for doubtful accounts and sales allowances | ( | ( | ||||||||||||
| Accounts receivable, net | $ | $ | ||||||||||||
Inventory, net
| (in thousands) | April 2, 2022 | April 3, 2021 | ||||||||||||
| Raw materials | $ | $ | ||||||||||||
| Work in process | ||||||||||||||
| Finished goods | ||||||||||||||
| Inventory, net | $ | $ | ||||||||||||
Property, plant, and equipment, net
| (in thousands) | April 2, 2022 | April 3, 2021 | ||||||||||||
| Land | $ | $ | ||||||||||||
| Buildings and improvements (useful life: 7-30 years) | ||||||||||||||
| Machinery and equipment (useful life: 1-10 years) | ||||||||||||||
| Software (useful life: 3-6 years) | ||||||||||||||
| Construction in progress | ||||||||||||||
| Property, plant, and equipment, gross | ||||||||||||||
| Accumulated depreciation and amortization | ( | ( | ||||||||||||
| Property, plant, and equipment, net | $ | $ | ||||||||||||
Depreciation and amortization expense attributable to property, plant and equipment, net for Fiscal Years 2022, 2021, and 2020 was $34.6 million, $39.4 million, and $46.1 million, respectively.
Included in software are unamortized capitalized software costs relating to both purchased and internally developed software of $13.4 million and $13.2 million at April 2, 2022 and April 3, 2021, respectively. Amortization expense related to software in Fiscal Years 2022, 2021, and 2020 was $5.0 million, $6.4 million, and $10.1 million, respectively.
Included in construction in progress at April 2, 2022 was tooling for new products, machinery and equipment, building improvements, and IT-related expenditures. None of the items were individually material.
Accrued Liabilities
| (in thousands) | April 2, 2022 | April 3, 2021 | ||||||||||||
| Deferred revenue | $ | $ | ||||||||||||
| Employee compensation and benefits | ||||||||||||||
| Provision for returns | ||||||||||||||
| Operating lease liabilities, current | ||||||||||||||
| Accrued other | ||||||||||||||
| Accrued liabilities | $ | $ | ||||||||||||
82
| (in thousands) | April 2, 2022 | April 3, 2021 | ||||||||||||
| Warranty obligation at beginning of year | $ | $ | ||||||||||||
| Warranty provision related to products shipped | ||||||||||||||
| Deductions for warranty claims processed | ( | ( | ||||||||||||
| Adjustments related to preexisting warranties | ||||||||||||||
| Warranty obligation at end of year | $ | $ | ||||||||||||
Operating Leases
| (in thousands) | Balance Sheet Classification | April 2, 2022 | April 3, 2021 | |||||||||||||||||
| ASSETS | ||||||||||||||||||||
Operating right-of-use assets(1) | Other Assets | $ | $ | |||||||||||||||||
| LIABILITIES | ||||||||||||||||||||
Operating lease liabilities, current(2) | Accrued Liabilities | |||||||||||||||||||
| Operating lease liabilities, long-term | ||||||||||||||||||||
(1) During Fiscal Year 2022 and Fiscal Year 2021, the Company made $24.3 million and $27.3 million, respectively, in payments for operating leases included within cash provided by operating activities in the consolidated statements of cash flows.
(2) During Fiscal Year 2022 and Fiscal Year 2021, the Company recognized $12.1 million and $13.7 million, respectively, in operating lease expense, net of $5.6 million and $5.4 million in sublease income, respectively, within the consolidated statement of operations.
83
6. GOODWILL AND PURCHASED INTANGIBLE ASSETS
Goodwill
The carrying amount of goodwill allocated to the Company's reportable segments is as follows:
| (in thousands) | Products Reportable Segment | Services Reportable Segment | Total Consolidated | |||||||||||||||||
Balance as of April 2, 2022 and April 3, 2021(1) | $ | $ | $ | |||||||||||||||||
(1) Goodwill is net of accumulated impairment losses of $427.2 million and $56.5 million related to the Products segment and Services segment, respectively.
During the fourth quarters of Fiscal Year 2022 and 2021, the Company performed an initial assessment of qualitative factors to determine whether the existence of events and circumstances lead to a determination that it is more-likely-than-not that the fair value of a reporting unit is less than its carrying amount. After assessing the totality of relevant events and circumstances, the Company determined that it is more-likely-than-not that the fair value of all reporting units exceed carrying value. Therefore, no further impairment testing was performed and no impairment charges were recognized.
Purchased Intangibles, net
Purchased Intangibles, net consists primarily of existing technology, customer relationships, and trade names acquired in business combinations. Intangible assets with finite lives are reviewed for recoverability whenever events or changes in circumstances indicate that the carrying amount of the related asset group may not be recoverable. No impairment charges were recognized in Fiscal Year 2022 and in Fiscal Year 2021.
As of April 2, 2022 and April 3, 2021, the carrying value of purchased intangibles, excluding fully amortized assets and goodwill, is as follows:
| April 2, 2022 | April 3, 2021 | |||||||||||||||||||||||||||||||||||||||||||
| (in thousands) | Gross Carrying Value | Accumulated Amortization | Net Carrying Value | Weighted Average Remaining Useful Life | Gross Carrying Value | Accumulated Amortization | Net Carrying Amount | |||||||||||||||||||||||||||||||||||||
| Existing technology | $ | $ | ( | $ | $ | $ | ( | $ | ||||||||||||||||||||||||||||||||||||
| Customer relationships | ( | ( | ||||||||||||||||||||||||||||||||||||||||||
| Trade names/Trademarks | ( | ( | ||||||||||||||||||||||||||||||||||||||||||
| Total intangible assets | $ | $ | ( | $ | $ | $ | ( | $ | ||||||||||||||||||||||||||||||||||||
Intangibles are amortized on a straight-line basis over the respective estimated useful lives of the assets. Amortization is charged to cost of revenues and operating expenses in the consolidated statements of operations. The Company recognized $113.9 million and $124.9 million of amortization expense in Fiscal Year 2022 and Fiscal Year 2021, respectively.
84
As of April 2, 2022, expected amortization expense attributable to purchased intangible assets for each of the next five years and thereafter is as follows:
| in thousands | Amount | |||||||
| 2023 | $ | |||||||
| 2024 | ||||||||
| 2025 | ||||||||
| 2026 | ||||||||
| 2027 | ||||||||
| Thereafter | ||||||||
| Total | $ | |||||||
85
7. COMMITMENTS AND CONTINGENCIES
Future Minimum Lease Payments
Future minimum lease payments under non-cancelable operating leases as of April 2, 2022 were as follows:
| (in thousands) | Operating Leases (1) | |||||||
| 2023 | $ | |||||||
| 2024 | ||||||||
| 2025 | ||||||||
| 2026 | ||||||||
| 2027 | ||||||||
| Thereafter | ||||||||
| Total lease payments | $ | |||||||
Less: Imputed interest(2) | ( | |||||||
| Present value of lease liabilities | $ | |||||||
(1) The weighted average remaining lease term was 5.0 years as of April 2, 2022.
(2) The weighted average discount rate was 4.4 % as of April 2, 2022.
Unconditional Purchase Obligations
The Company's off-balance sheet unconditional purchase obligations are comprised of third-party manufacturing, component purchases, and other general and administrative commitments.
We use several contract manufacturers to manufacture raw materials, components, and subassemblies for our products through our supply and demand information that can cover periods up to 78 weeks. The contract manufacturers use this information to acquire components and build products. We also obtain individual components for our products from a wide variety of individual suppliers using a combination of purchase orders, supplier contracts, including annual minimum purchase obligations, and open orders based on projected demand information.
A substantial portion of the raw materials, components, and subassemblies used in our products are provided by our suppliers on a consignment basis. These consigned inventories are not recorded on our consolidated balance sheets until we take title to the raw materials, components, and subassemblies, which occurs when they are consumed in the production process. Prior to consumption in the production process, our suppliers bear the risk of loss and retain title to the consigned inventory. The agreements allow us to return parts in excess of maximum order quantities to the suppliers at the supplier’s expense. Returns for other reasons are negotiated with the suppliers on a case-by-case basis and to date have been immaterial. If our suppliers were to discontinue financing consigned inventory, it would require us to make cash outlays and we could incur expenses which, if material, could negatively affect our business and financial results.
As of April 2, 2022, the Company had off balance-sheet unconditional purchase obligations of $617.8 million, including third-party manufacturing and component purchases of $512.1 million net of consigned inventories of $51.8 million. We expect to consume unconditional purchase obligations in the normal course of business, net of an immaterial purchase commitments reserve. In certain instances, these agreements allow us the option to cancel, reschedule, and adjust our requirements based on our business needs in partnering with our suppliers given the current environment.
Other Guarantees and Obligations
In the ordinary course of business, the Company may provide indemnifications of varying scope and terms to customers, vendors, lessors, business partners, purchasers of assets or subsidiaries and other parties with respect to certain matters, including, but not limited to, losses arising out of the Company's breach of agreements or representations and warranties made by the Company, services to be provided by the Company, intellectual property infringement claims made by third parties or, with respect to the sale of assets of a subsidiary, matters related to the Company's conduct of business and tax matters prior to the sale. From time to time, the Company indemnifies customers against combinations of loss, expense, or liability arising from various triggering events relating to the sale and use of its products and services.
86
In addition, the Company also provides indemnification to customers against claims related to undiscovered liabilities, additional product liability, or environmental obligations. The Company has also entered into indemnification agreements with its directors, officers, and certain other personnel that will require the Company, among other things, to indemnify them against certain liabilities that may arise by reason of their status or service as directors or officers of the Company or certain of its affiliated entities. The Company maintains director and officer liability insurance, which may cover certain liabilities arising from its obligation to indemnify its directors, officers, and certain other personnel in certain circumstances. It is not possible to determine the aggregate maximum potential loss under these agreements due to the limited history of prior claims and the unique facts and circumstances involved in each particular claim. Such indemnification obligations might not be subject to maximum loss clauses. Historically, the Company has not incurred material costs as a result of obligations under these agreements and it has not accrued any liabilities related to such indemnification obligations in the consolidated financial statements.
As of April 2, 2022, the Company had $28.7 million in off balance-sheet contractual obligations related to advisory services performed in connection with the Merger Agreement which are contingent upon the close of the Merger.
Claims and Litigation
On January 23, 2018, FullView, Inc. filed a complaint in the United States District Court of the Northern District of California against Polycom, Inc. alleging infringement of two patents and thereafter filed a similar complaint in connection with the same patents in Canada. Polycom thereafter filed an inter partes reexamination ("IPR") of one of the patents, which was then appealed to Federal Circuit Court. Litigation in both matters in the United States and Canada, respectively, were stayed pending the results of that appeal. Polycom also filed an IPR of the second patent and the U.S. Patent Trial and Appeal Board (“PTAB”) denied institution of the IPR petition. FullView also initiated arbitration proceedings under a terminated license agreement with Polycom alleging that Polycom had failed to pay certain royalties due under that agreement. The arbitration panel awarded an immaterial amount to FullView. FullView filed a First and Second Amended Complaint and Polycom filed a motion to dismiss. The Court granted Polycom's partial motion to dismiss without prejudice and invalidated one of the patents in suit and granted FullView's motion of validity on the second patent. Litigation on this remaining patent is ongoing.
On June 21, 2018, directPacket Research Inc. filed a complaint alleging patent infringement by Polycom, Inc. in the United States District Court for the Eastern District of Virginia, Norfolk Division. The Court granted Polycom’s Motion to Transfer Venue to the Northern District of California. Polycom filed petitions for IPR of the asserted patents which were granted by the PTAB. The District Court matter was stayed pending resolution of the IPRs. After oral argument, the PTAB issued final written decisions invalidating two of the asserted patents. The remaining claims of the third patent were unasserted against the Company. DirectPacket appealed the PTAB decision regarding the '588 patent and Polycom appealed the PTAB's decision on the '978 patent to the United States Court of Appeals for the Federal Circuit. On December 13, 2021, the Court issued an affirmance of the decision regarding the invalidity of all asserted claims of the ‘978 patent. On January 27, 2022, the Court vacated the PTAB’s finding that certain claims were invalid as obvious and remanded the case for further proceedings at the PTAB. The PTAB agreed with Polycom that additional briefing is needed to decide the issue of invalidity in light of the Federal Circuit’s revised claim construction. The district court case remains stayed pending the PTAB decision.
On November 15, 2019, Felice Bassuk, individually and on behalf of others similarly situated, filed a complaint against the Company, its former CEO, Joseph Burton, its CFO, Charles Boynton, and its former CFO, Pamela Strayer, alleging various securities law violations. The Company disputes the allegations. The Court appointed lead plaintiff and lead counsel and renamed the action “In re Plantronics, Inc. Securities Litigation” on February 13, 2020. Plaintiffs filed the amended complaint on June 5, 2020 and the Company filed a Motion to Dismiss the Amended Complaint on August 7, 2020. The hearing scheduled for January 13, 2021 was vacated and on March 29, 2021, the Court issued its order granting the Company’s motion to dismiss, but allowing the Plaintiffs leave to amend their complaint. The Plaintiff filed its second amended complaint on June 22, 2021 and the Company filed its Motion to Dismiss on September 7, 2021. The court is expected to rule based on the briefs without a hearing and the parties are awaiting the court's ruling.
On December 17, 2019, Cisco Systems, Inc. filed a First Amended Complaint for Trade Secret Misappropriation against Plantronics, Inc. and certain individuals which amends a previously filed complaint against certain other individuals. The Company disputes the allegations. The Company filed a Motion to Dismiss and the Court granted the Motion with leave to amend as to defendants He, Chung and Williams, granted the Motion to Compel Arbitration for defendant Williams and granted in part and denied in part the Motion to Dismiss by defendants Puorro and the Company. Cisco filed an Amended Complaint and the defendants moved to dismiss or strike portions of the Amended Complaint. The Court granted in part and denied in part the Motion to Dismiss. On September 10, 2020, the Company filed a Motion for Protective Order and a Motion to Strike and Challenge the Sufficiency of Cisco’s Trade Secret Disclosure. On December 21, 2020, the Court granted in part and denied in part such Motions. On December 30, 2020, Cisco filed a motion for leave to file a Motion for Reconsideration. On January 11,
87
2021 the Company filed its opposition. The Court issued its Case Management and Pretrial order setting a settlement conference which occurred on April 1, 2021. During such mediation conference, the parties were unable to reach settlement. The Texas arbitration proceeding between Mr. Williams and Cisco was settled pursuant to an agreement by the parties, and Mr. Williams was dismissed with prejudice from both that proceeding and from the district court action. On August 13, 2021, Mr. He settled with Cisco pursuant to which he will be permanently enjoined and forever prohibited from receiving, using, and/or distributing Cisco Confidential Business Information except in limited circumstances. Discovery is ongoing.
On July 22, 2020, Koss Corporation filed a complaint alleging patent infringement by the Company and Polycom, Inc. in the United States District Court for the Western District of Texas, Waco Division. The Company answered the Complaint on October 1, 2020 disputing the claims. On December 18, 2020, the Company filed a Motion to Transfer Venue to the Northern District of California which was granted on May 20, 2021. On November 1, 2021, the Company filed a Motion to Dismiss the suit with the District Court on the grounds of non-patentable subject matter. The Court will rule based on the briefs without a hearing and the parties are awaiting the Court's ruling.
As of the date of this Annual Report on Form 10-K, five purported stockholders have commenced separate actions against the Company and its directors related to the Merger. Those cases are: Stein v. Plantronics, Inc., et al., Civil Action No. 22-cv-03574, filed in the United States District Court for the Southern District of New York on May 3, 2022; Whitfield v. Plantronics, Inc., et al., Civil Action No. 22-cv-02583, filed in the United States District Court for the Eastern District of New York on May 5, 2022; Vicknair v. Plantronics, Inc., et al., Civil Action No. 1:22-cv-02753, filed in the United States District Court for the Eastern District of New York on May 11, 2022; Justice, II v. Plantronics, Inc., et al., No. 2:22-cv-01861, filed in United States District Court for the Eastern District of Pennsylvania on May 12, 2022; and Hansen v. Plantronics, Inc., et al., Civil Action No. 5:22-cv-02989-VKD, filed in the United States District Court for the Northern District of California on May 20, 2022. We refer to the complaints referenced in this paragraph collectively as the “Complaints.” The Complaints assert claims against all defendants under Section 14(a) of the Exchange Act and Rule 14a-9 promulgated thereunder, and against the individual defendants under Section 20(a) of the Exchange Act for alleged “control person” liability, with respect to allegedly false or misleading statements in the Company’s preliminary proxy statement filed on May 2, 2022 and/or the Company’s definitive proxy statement filed on May 17, 2022. The Complaints seek, among other relief (1) to enjoin defendants from consummating the Merger; (2) to rescind the Merger or recover damages, if the Merger is completed; (3) to require the individual defendants to issue a revised proxy statement; (4) declaratory relief; and (5) attorneys’ fees and costs.
In addition to the specific matters discussed above, the Company is involved in various legal proceedings and investigations arising in the normal course of conducting business. Where applicable, in relation to the matters described above, the Company has accrued an amount that reflects the aggregate liability deemed probable and estimable, but this amount is not material to the Company's financial condition, results of operations, or cash flows. The Company is not able to estimate an amount or range of any reasonably possible loss, including in excess of any amount accrued, because of the preliminary nature of many of these proceedings, the difficulty in ascertaining the applicable facts relating to many of these proceedings, the variable treatment of claims made in many of these proceedings, and the difficulty of predicting the settlement value of many of these proceedings.
88
8. DEBT
The carrying value of the Company's outstanding debt as of April 2, 2022 and April 3, 2021 were as follows:
| (in thousands) | April 2, 2022 | April 3, 2021 | |||||||||
| 4.75% Senior Notes | $ | $ | |||||||||
| 5.50% Senior Notes | |||||||||||
| Term Loan Facility | |||||||||||
As of April 2, 2022, and April 3, 2021, the net unamortized discount and debt issuance costs on the Company's outstanding debt were $16.5 million and $22.6 million, respectively.
4.75% Senior Notes
On March 4, 2021, the Company issued $500.0 million aggregate principal amount of 4.75 % Senior Notes. The 4.75 % Senior Notes mature on March 1, 2029 and bear interest at a rate of 4.75 % per annum, payable semi-annually on March 1 and September 1 of each year, commencing on September 1, 2021. The Company received proceeds of $493.9 million from issuance of the 4.75 % Senior Notes, net of issuance costs of $6.1 million, which are presented in the consolidated balance sheets as a reduction to the outstanding amount payable and are being amortized to interest expense using the straight-line method, which approximates the effective interest method for this debt, over the term of the 4.75 % Senior Notes. A portion of the proceeds was used to repay the outstanding principal of the 5.50% Senior Notes on May 17, 2021.
The Company may redeem all or part of the 4.75 % Senior Notes, upon not less than a 15 -day or more than a 60 -day notice, however, the applicable redemption price will be determined as follows:
| Redemption Period Requiring Payment of: | Redemption Up To 40% Using Cash Proceeds From An Equity Offering (3) | ||||||||||||||||||||||
Make-Whole (1) | Premium (2) | Date | Specific Price | ||||||||||||||||||||
| 4.75% Senior Notes | Prior to March 1, 2024 | On or after March 1, 2024 | Prior to March 1, 2024 | ||||||||||||||||||||
(1) If the Company redeems the notes prior to the applicable date, the price is principal plus a make-whole premium, which means, the greater of (i) 1.0% of the principal or (ii) the excess of the present value of the redemption price at March 1, 2024 plus interest through March 1, 2024 over the principal amount.
(2) If the Company redeems the notes on or after the applicable date, the price is principal plus a premium which declines over time, as specified in the applicable indenture, together with accrued and unpaid interest.
In addition, upon the occurrence of certain change of control triggering events, the Company may be required to repurchase the 4.75 % Senior Notes, at a price equal to 101 % of their principal amount, plus accrued and unpaid interest to the date of repurchase. The 4.75 % Senior Notes contain restrictive covenants that, among other things, limit the ability of the Company and its restricted subsidiaries to incur or guarantee additional indebtedness, make certain investments and other restricted payments, transfer and sell assets, create liens, enter into transactions with affiliates, and engage in mergers, consolidations, or sales of assets.
5.50% Senior Notes
In May 2015, the Company issued $500.0 million aggregate principal amount of 5.50 % Senior Notes. The 5.50 % Senior Notes mature on May 31, 2023, and bear interest at a rate of 5.50 % per annum, payable semi-annually on May 15 and November 15 of each year, commencing on November 15, 2015. The Company received net proceeds of $488.4 million from issuance of the 5.50 % Senior Notes, net of issuance costs of $11.6 million, which are presented in the consolidated balance sheets as a reduction to the outstanding amount payable and are being amortized to interest expense over the term of the 5.50 % Senior Notes using the straight-line method, which approximates the effective interest method for this debt. A portion of the proceeds was used to repay all then-outstanding amounts under the Company's revolving line of credit agreement with Wells Fargo Bank and the remaining proceeds were used primarily for share repurchases.
89
On May 17, 2021, the Company used a portion of the proceeds from the 4.75% Senior Notes to redeem the outstanding principal and accrued interest of the 5.50% Senior Notes of $493.9 million.
Term Loan Facility
In connection with the acquisition of Polycom completed on July 2, 2018, the Company entered into a Credit Agreement with Wells Fargo Bank, National Association, as administrative agent, and the lenders party thereto (the “Credit Agreement.”) The Credit Agreement replaced the Company’s prior revolving credit facility in its entirety. The Credit Agreement provides for (i) a revolving credit facility with an initial maximum aggregate amount of availability of $100 million that matures in July 2023 and (ii) a $1.275 billion term loan facility priced at LIBOR plus 2.50% due in quarterly principal installments commencing on the last business day of March, June, September and December beginning with the first full fiscal quarter ending after the closing date under the Credit Agreement for the aggregate principal amount funded on the closing date under the Credit Agreement multiplied by 0.25 % (subject to prepayments outlined in the Credit Agreement) and all remaining outstanding principal due at maturity in July 2025. The Company has paid the full amount of term debt principal due prior to maturity. The Company borrowed the full amount available under the term loan facility of $1.245 billion, net of approximately $30 million of discounts and issuance costs which are being amortized to interest expense over the term of the Credit Agreement using the straight-line method, which approximates the effective interest method for this debt. The proceeds from the initial borrowing under the Credit Agreement were used to finance the acquisition of Polycom, to refinance certain debt of Polycom and to pay related fees, commissions and transaction costs. The Company has additional borrowing capacity under the Credit Agreement through the revolving credit facility, which could be used to provide ongoing working capital and capital for other general corporate purposes of the Company and its subsidiaries. The Company’s obligations under the Credit Agreement are currently guaranteed by Polycom and will from time to time be guaranteed by, subject to certain exceptions, any domestic subsidiaries that may become material in the future. Subject to certain exceptions, the Credit Agreement is secured by first-priority perfected lien on, and security interests in, substantially all of the personal property of the Company and each subsidiary guarantor and will from time to time also be secured by certain material real property that the Company or any subsidiary guarantor may acquire. Borrowings under the Credit Agreement bear interest due on a quarterly basis at a variable rate equal to (i) LIBOR plus a specified margin, or (ii) the base rate (which is the highest of (a) the prime rate publicly announced from time to time by Wells Fargo Bank, National Association, (b) the federal funds rate plus 0.50 % or (c) the sum of 1 % plus one-month LIBOR) plus a specified margin. The Company must also pay (i) an unused commitment fee ranging from 0.200 % to 0.300 % per annum of the average daily unused portion of the aggregate revolving credit commitments under the Credit Agreement, and (ii) a per annum fee equal to (a) for each performance standby letter of credit outstanding under the Credit Agreement with respect to non-financial contractual obligations, 50 % of the applicable margin over LIBOR under the revolving credit facility in effect from time to time multiplied by the daily amount available to be drawn under such letter of credit, and (b) for each other letter of credit outstanding under the Credit Agreement, the applicable margin over LIBOR under the revolving credit facility in effect from time to time multiplied by the daily amount available to be drawn under such letter of credit.
On December 29, 2021, the Company entered into Amendment No. 3 to Credit Agreement (“Amendment No. 3”) by and among the Company, the financial institutions party thereto as lenders, and Wells Fargo Bank, National Association, as administrative agent. Amendment No. 3 amended the Credit Agreement, as previously amended, to (i) increase the maximum Secured Net Leverage Ratio (as defined in the Credit Agreement) permitted to 3.75 to 1.00 as of the end of any fiscal quarter ending during the period beginning on January 2, 2022 through December 31, 2022 and to 3.00 to 1.00 as of the end of any fiscal quarter ending thereafter, except that the maximum Secured Net Leverage Ratio shall be deemed to be 3.00 to 1.00 at all times for purposes of determining pro forma compliance with each Specified Pro Forma Financial Covenant Test (as defined in the Credit Agreement).
Additionally, Amendment No. 3 modified the calculation of the Secured Net Leverage Ratio solely for purposes of determining compliance with Section 7.11(a) of the Credit Agreement for any fiscal quarter ending between January 2, 2022 through December 31, 2022 by amending the definition of Consolidated EBITDA to (a) limit the aggregate amount added back pursuant to clause (vii) thereof (relating to certain acquisition expenses) to the greater of $30,000,000 and 10 % of Consolidated EBITDA for such Measurement Period (as defined in the Credit Agreement) (calculated before giving effect to any such expenses to be added back pursuant to such clause (vii) for such Measurement Period), (b) limit the aggregate amount added back pursuant to clause (vii) thereof in respect of integration expenses related to the Polycom Acquisition (as defined in the Credit Agreement) to $30,000,000 , and (c) limit the aggregate amount added back pursuant to clause (viii) thereof (relating to certain non-recurring or unusual items reducing consolidated net income) to the greater of $30,000,000 and 10 % of Consolidated EBITDA for such Measurement Period (calculated before giving effect to any such items to be added back pursuant to such clause (viii) for such Measurement Period).
90
The financial covenants under the Credit Agreement, as amended, are for the benefit of the revolving credit lenders only and do not apply to any other debt of the Company. The Credit Agreement also contains various other restrictions and covenants, some of which have become more stringent over time, including restrictions on our, and certain of our subsidiaries, ability to consolidate or merge, create liens, incur additional indebtedness, dispose of assets, consummate acquisitions, make investments, and pay dividends and other distributions. The Company has the unilateral ability to terminate the revolving line of credit such that the financial covenants described above are no longer applicable. The Credit Agreement also contains customary events of default. If an event of default under the Credit Agreement occurs and is continuing, then the lenders may declare any outstanding obligations under the Credit Agreement to be immediately due and payable; provided, however, that the occurrence of an event of default as a result of a breach of a financial covenant under the Credit Agreement does not constitute a default or event of default with respect to any term facility under the Credit Agreement unless and until the required revolving lenders shall have terminated their revolving commitments and declared all amounts outstanding under the revolving credit facility to be due and payable. In addition, if the Company, any subsidiary guarantor or, with certain exceptions, any other subsidiary becomes the subject of voluntary or involuntary proceedings under any bankruptcy, insolvency or similar law, then any outstanding obligations under the Credit Agreement will automatically become immediately due and payable. Loans outstanding under the Credit Agreement will bear interest at a rate of 2.00 % per annum in excess of the otherwise applicable rate (i) while a payment or bankruptcy event of default exists or (ii) upon the lenders’ request, during the continuance of any other event of default. As of April 2, 2022, the Company was in compliance with all financial covenants.
The Company may prepay the loans and terminate the commitments under the Credit Agreement at any time without penalty. Additionally, the Company is subject to mandatory debt repayments five business days after the filing of its consolidated financial statements for any annual period in which the Company generates Excess Cash (as defined in the Credit Agreement). In accordance with the terms of the Credit Agreement, the Company did not generate Excess Cash during Fiscal Years 2022 or 2021 and therefore is not required to make any debt repayments in Fiscal Year 2022. During Fiscal Year 2022, the Company did not prepay any aggregate principal amount of the term loan facility. As of April 2, 2022, the Company had four letters of credit outstanding under the revolving credit facility for a total of $2.5 million.
Under the terms of the Merger Agreement, from the date of the Merger Agreement to the termination or consummation of the Merger, Poly is restricted in its ability to drawdown or incur additional indebtedness, under certain conditions, without the prior written consent of HP.
9. RESTRUCTURING AND OTHER RELATED CHARGES
Summary of Restructuring Plans
Fiscal Year 2022 Restructuring Plan
During Fiscal Year 2022, the Company committed to actions to reduce expenses to enable strategic investments in revenue growth. The costs incurred to date under this plan include severance benefits related to headcount reductions in the Company's global workforce and facility related charges due to the closure or consolidation of offices.
Fiscal Year 2021 Restructuring Plan
During Fiscal Year 2021, the Company committed to additional actions to reduce expenses and align its overall cost structure to better align with projected revenue levels as well as reorganize its executive management to align to its new Chief Executive Officer's management structure. The costs incurred to date under this plan include severance benefits related to headcount reductions in the Company's global workforce and facility related charges due to the closure or consolidation of leased offices.
Legacy Restructuring Plans
In connection with the Polycom acquisition, in Fiscal Years 2019 and 2020 the Company initiated actions to rationalize post-acquisition operations and realign its cost structure. These actions included streamlining the global workforce, closure or consolidation of leased offices and distribution centers, consumer product portfolio optimization efforts, and legal entity rationalization.
91
The following table summarizes the restructuring and other related charges recognized in the Company's consolidated statements of operations:
| Fiscal Year Ended | ||||||||||||||||||||
| (in thousands) | April 2, 2022 | April 3, 2021 | March 28, 2020 | |||||||||||||||||
| Severance | $ | $ | $ | |||||||||||||||||
| Facility | ( | |||||||||||||||||||
Other (1) | ||||||||||||||||||||
| Total cash charges | ||||||||||||||||||||
Non-cash charges (2) | ||||||||||||||||||||
| Total restructuring and other related charges | $ | $ | $ | |||||||||||||||||
(1) Other costs primarily represent associated legal and advisory services.
(2) Non-cash charges primarily represent accelerated depreciation due to the closure or consolidation of facilities.
The following table summarizes the Company's restructuring liabilities during Fiscal Year 2022:
| As of April 3, 2021 | Accruals (1) | Cash Payments | As of April 2, 2022 | |||||||||||
| Fiscal Year 2022 Plan | ||||||||||||||
| Severance | $ | $ | $ | ( | $ | |||||||||
| Facility | ||||||||||||||
| Other | ( | |||||||||||||
| Total Fiscal Year 2022 Plan | ( | |||||||||||||
| Fiscal Year 2021 Plan | ||||||||||||||
| Severance | $ | $ | ( | $ | ( | $ | ||||||||
| Facility | ( | ( | ||||||||||||
| Other | ( | ( | ||||||||||||
| Total Fiscal Year 2021 Plan | ( | ( | ||||||||||||
| Legacy Plans | ||||||||||||||
| Severance | ( | |||||||||||||
| Facility | ( | ( | ||||||||||||
| Other | ||||||||||||||
| Total Legacy Plans | ( | ( | ||||||||||||
| Severance | ( | |||||||||||||
| Facility | ( | ( | ||||||||||||
| Other | ( | |||||||||||||
| Total | $ | $ | $ | ( | $ | |||||||||
(1) Excludes non-cash charges of $9.7 million recorded in restructuring and other related charges in the consolidated statements of operations for Fiscal Year 2022.
10. STOCK PLANS AND STOCK-BASED COMPENSATION
2003 Stock Plan
On May 5, 2003, the Board adopted the Plantronics, Inc. 2003 Stock Plan ("2003 Stock Plan") which was approved by the stockholders on June 27, 2003. The 2003 Stock Plan, which will continue in effect until terminated by the Board, allows for the issuance of the Company's common stock through the granting of non-qualified stock options, restricted stock, restricted stock units, and performance shares with performance-based conditions on vesting. As of April 2, 2022, there have been 21,400,000 shares of common stock cumulatively reserved since inception of the 2003 Stock Plan for issuance to employees, non-employee directors, and consultants of the Company. The Company settles stock option exercises, grants of restricted stock, and releases of vested restricted stock units with newly issued common shares.
92
The exercise price of stock options may not be less than 100 % of the fair market value of the Company's common stock on the date of grant. The term of an option may not exceed seven years from the date it is granted. Stock options granted to employees vest over a three-year period and stock options granted to non-employee directors vest over a four year period.
Restricted stock ("RSAs") and restricted stock units ("RSUs") are granted to directors, executives, and employees. The estimated fair value of the restricted stock and restricted stock unit grants is determined based on the fair market value of our common stock on the date of grant. RSAs and RSUs granted to employees generally vest over a period and to non-employee directors over a one year period.
Performance-based restricted stock units ("PSUs") are granted to vice presidents and executives of the Company and contain a market condition based on Total Shareholder Return ("TSR.") The Leadership Development and Compensation ("LD&C") Committee of the Board sets a target and maximum value that each executive could earn based on an annual comparison of the total stockholder return on the Company's common stock against the iShares S&P North American Tech-Multimedia Networking Index ("Index"), an index the LD&C Committee determined appropriate to compare to the total stockholder return on its stock. PSUs will be delivered in common stock over the vesting period of three years based on the Company’s actual performance compared to the target performance criteria. Awards granted prior to May 6, 2019 may equal from zero percent (0%) to 150% of the target award, and awards granted subsequent to May 6, 2019 may equal from zero percent (0%) to 200% of the target award. The fair value of PSUs is estimated on the grant date of award using a Monte Carlo simulation model to estimate the total return ranking of the Company’s stock among the Index companies over each performance period.
At April 2, 2022, options to purchase 44,000 shares of common stock and 3,158,855 shares of unvested restricted stock and restricted stock units were outstanding. There were 3,125,877 shares available for future grant under the 2003 Stock Plan.
2020 Inducement Equity Incentive Plan
On September 14, 2020, the Board adopted the 2020 Inducement Equity Incentive Plan (the "Inducement Plan.") The 2020 Inducement Plan, which will continue in effect until terminated by the Board, allows for the issuance of the Company's common stock through the granting of non-statutory stock options, restricted stock, restricted stock units, and performance shares with performance-based conditions on vesting. As of April 2, 2022, there have been 1,000,000 shares of common stock cumulatively reserved since inception of the Inducement Plan for issuance to employees, non-employee directors, and consultants of the Company. The Company settles stock option exercises, grants of restricted stock, and release of vested restricted stock units with newly issued common stock.
The exercise price of stock options may not be less than 100% of the fair market value of the Company's common stock on the date of grant. The term of an option may not exceed seven years from the date it is granted. Stock options granted to employees vest over a three year period and stock options granted to non-employee directors vest over a four year period.
RSAs and RSUs are granted to directors, executives, and employees. The estimated fair value of the restricted stock and restricted stock unit grants is determined based on the fair market value of our common stock on the date of grant. RSAs and RSUs granted to employees generally vest over a three year period and to non-employee directors over a one year period.
PSUs are granted to vice presidents and executives of the Company and contain a market condition based on TSR. The LD&C Committee of the Board sets a target and maximum value that each executive could earn based on an annual comparison of the total stockholder return on the Company's common stock against the Index, an index the Committee determined appropriate to compare to the total stockholder return on its stock. PSUs will be delivered in common stock over the vesting period of three years based on the Company’s actual performance compared to the target performance criteria. Awards granted subsequent to May 6, 2019 may equal from zero percent (0%) to 200% of the target award. The fair value of PSUs is estimated on the grant date of award using a Monte Carlo simulation model to estimate the total return ranking of the Company’s stock among the Index companies over each performance period.
At April 2, 2022, there were no options granted to purchase shares of common stock and 271,601 shares of unvested restricted stock and restricted stock units outstanding. There were 601,000 shares available for future grant under the Inducement Plan.
93
2002 Employee Stock Purchase Plan ("ESPP")
On June 10, 2002, the Board adopted the 2002 ESPP, which was approved by the stockholders on July 17, 2002, to provide eligible employees with an opportunity to purchase the Company's common stock through payroll deductions. The ESPP qualifies as an employee stock purchase plan under Section 423 of the Internal Revenue Code. Under the ESPP, which is effective until terminated by the Board, the purchase price of the Company's common stock is equal to 85 % of the lesser of the closing price of the common stock on (i) the first day of the offering period or (ii) the last day of the offering period. Each offering period is six months long. There were 468,553 , 822,748 , and 736,184 , shares issued under the ESPP in Fiscal Years 2022, 2021, and 2020, respectively. At April 2, 2022, there were 1,708,704 shares reserved for future issuance under the ESPP. The total cash received from employees as a result of stock issuances under the ESPP during Fiscal Year 2022 was $11.8 million, net of taxes.
Stock-based Compensation Expense
The following table summarizes the amount of stock-based compensation expense included in the consolidated statements of operations:
| Fiscal Year Ended | ||||||||||||||||||||
| (in thousands) | April 2, 2022 | April 3, 2021 | March 28, 2020 | |||||||||||||||||
| Cost of revenues | $ | $ | $ | |||||||||||||||||
| Research, development and engineering | ||||||||||||||||||||
| Selling, general, and administrative | ||||||||||||||||||||
| Operating expenses | ||||||||||||||||||||
| Total stock-based compensation expense | ||||||||||||||||||||
| Income tax benefit | ( | ( | ( | |||||||||||||||||
| Total stock-based compensation expense, net of tax | $ | $ | $ | |||||||||||||||||
Stock Plan Activity
Stock Options
As of April 2, 2022, all stock options outstanding were fully vested resulting in no unrecognized compensation cost.
The total intrinsic value of options exercised during all periods presented was immaterial. Intrinsic value is defined as the amount by which the fair value of the underlying stock exceeds the exercise price at the time of option exercise.
Restricted Stock
Restricted stock consists of RSAs and RSUs. The following table summarizes the changes in unvested restricted stock for Fiscal Year 2022:
| Number of Shares | Weighted Average Grant Date Fair Value | ||||||||||
| (in thousands) | |||||||||||
| Unvested at April 3, 2021 | $ | ||||||||||
| Granted | $ | ||||||||||
| Vested | ( | $ | |||||||||
| Forfeited | ( | $ | |||||||||
| Non-vested at April 2, 2022 | $ | ||||||||||
94
The weighted average grant-date fair value of restricted stock is based on the quoted market price of the Company's common stock on the date of grant. The weighted average grant-date fair values of restricted stock granted during Fiscal Years 2022, 2021, and 2020 were $30.39 , $15.42 , and $33.77 , respectively. The total grant-date fair values of restricted stock that vested during Fiscal Years 2022, 2021, and 2020 were $29.0 million, $39.5 million, and $38.2 million, respectively.
As of April 2, 2022, the total unrecognized compensation cost related to non-vested restricted stock was $40.8 million and is expected to be recognized over a weighted average period of 1.6 years. Under the terms of the Merger Agreement, at or immediately prior to the consummation of the Merger, (i) each then-outstanding share of restricted stock will immediately vest and be converted into the right to receive $40 per share, (ii) each then-outstanding RSU that was granted prior to the date of the Merger Agreement will be canceled and converted into the right to receive $40 per share underlying such RSU and (iii) each then-outstanding RSU that was granted on or after the date of the Merger Agreement will either (in the discretion of HP) be assumed by HP and converted into restricted stock units of HP or canceled and converted into the right to receive restricted cash, payable in accordance with the same vesting schedule , in each case as further detailed in the Merger Agreement.
Performance-based Restricted Stock
The following table summarizes the changes in unvested PSUs for Fiscal Year 2022:
| Number of Shares | Weighted Average Grant Date Fair Value | ||||||||||
| (in thousands) | |||||||||||
| Unvested at April 3, 2021 | $ | ||||||||||
| Granted | $ | ||||||||||
| Vested | ( | $ | |||||||||
| Forfeited | ( | $ | |||||||||
| Non-vested at April 2, 2022 | $ | ||||||||||
The weighted average grant-date fair values of PSUs granted during Fiscal Years 2022, 2021, and 2020 were $53.65 , $22.83 , and $57.16 , respectively. The total grant-date fair values of PSUs that vested during Fiscal Years 2022 and 2021 were $2.7 million and $5.7 million, respectively. The total grant-date fair value of PSUs that vested during Fiscal Year 2020 was immaterial.
As of April 2, 2022, the total unrecognized compensation cost related to non-vested PSU awards was $15.5 million and is expected to be recognized over a weighted average period of 0.8 years.
Valuation Assumptions
The Company estimates the fair value of ESPP shares using a Black-Scholes option valuation model. At the date of grant, the Company estimates the fair value of purchase rights granted under the ESPP using the following weighted average assumptions:
| Fiscal Year Ended | ||||||||||||||||||||
| April 2, 2022 | April 3, 2021 | March 28, 2020 | ||||||||||||||||||
| Expected volatility | % | % | % | |||||||||||||||||
| Risk-free interest rate | % | % | % | |||||||||||||||||
| Expected dividends | % | % | % | |||||||||||||||||
| Expected life (in years) | ||||||||||||||||||||
| Weighted-average grant date fair value | $ | $ | $ | |||||||||||||||||
95
11. ACCUMULATED OTHER COMPREHENSIVE INCOME (LOSS)
The components of accumulated other comprehensive income (loss), net of tax, were as follows:
| (in thousands) | April 2, 2022 | April 3, 2021 | ||||||||||||
| Accumulated unrealized gain (loss) on cash flow hedges | $ | $ | ( | |||||||||||
| Accumulated foreign currency translation adjustments | ||||||||||||||
| Accumulated other comprehensive income (loss) | $ | $ | ( | |||||||||||
12. EMPLOYEE BENEFIT PLANS
13. DERIVATIVES
Foreign Currency Derivatives
The Company's foreign currency derivatives consist primarily of foreign currency forward and option contracts. The Company does not purchase derivative financial instruments for speculative trading purposes. The derivatives expose the Company to credit risk to the extent the counterparties may be unable to meet the terms of the derivative instrument. The Company's maximum exposure to loss as a result of credit risk was equal to the carrying value of the Company's derivative assets as of April 2, 2022 and April 3, 2021. The Company seeks to mitigate such risk by limiting its counterparties to large financial institutions. In addition, the Company monitors the potential risk of loss with any one counterparty resulting from this type of credit risk on an ongoing basis.
The Company enters into master netting arrangements with counterparties to mitigate credit risk in derivative transactions, when possible. A master netting arrangement may allow each counterparty to net settle amounts owed between the Company and the counterparty as a result of multiple, separate derivative transactions. As of April 2, 2022, the Company had International Swaps and Derivatives Association ("ISDA") agreements with five applicable banks and financial institutions which contained netting provisions. The Company has elected to present the fair value of derivative assets and liabilities within the Company's consolidated balance sheets on a gross basis even when derivative transactions are subject to master netting arrangements and may otherwise qualify for net presentation. Derivatives not subject to master netting agreements are not eligible for net presentation. As of April 2, 2022 and April 3, 2021, no cash collateral had been received or pledged related to these derivative instruments.
96
Offsetting of Financial Assets/Liabilities under Master Netting Agreements with Derivative Counterparties
As of April 2, 2022:
| Gross Amount of Derivative Assets Presented in the Consolidated Balance Sheets | Gross Amounts Not Offset in the Consolidated Balance Sheet that are Subject to Master Netting Agreements | |||||||||||||
| (in thousands) | Gross Amount of Eligible Offsetting Recognized Derivative Liabilities | Cash Collateral Received | Net Amount of Derivative Assets | |||||||||||
| Derivatives subject to master netting agreements | $ | $ | ( | $ | $ | |||||||||
| Derivatives not subject to master netting agreements | ||||||||||||||
| Total | $ | $ | ||||||||||||
| Gross Amount of Derivative Liabilities Presented in the Consolidated Balance Sheets | Gross Amounts Not Offset in the Consolidated Balance Sheet that are Subject to Master Netting Agreements | |||||||||||||
| (in thousands) | Gross Amount of Eligible Offsetting Recognized Derivative Assets | Cash Collateral Received | Net Amount of Derivative Liabilities | |||||||||||
| Derivatives subject to master netting agreements | $ | ( | $ | $ | $ | |||||||||
| Derivatives not subject to master netting agreements | ||||||||||||||
| Total | $ | ( | $ | |||||||||||
As of April 3, 2021:
| Gross Amount of Derivative Assets Presented in the Consolidated Balance Sheets | Gross Amounts Not Offset in the Consolidated Balance Sheet that are Subject to Master Netting Agreements | |||||||||||||
| (in thousands) | Gross Amount of Eligible Offsetting Recognized Derivative Liabilities | Cash Collateral Received | Net Amount of Derivative Assets | |||||||||||
| Derivatives subject to master netting agreements | $ | $ | ( | $ | $ | |||||||||
| Derivatives not subject to master netting agreements | ||||||||||||||
| Total | $ | $ | ||||||||||||
| Gross Amount of Derivative Liabilities Presented in the Consolidated Balance Sheets | Gross Amounts Not Offset in the Consolidated Balance Sheet that are Subject to Master Netting Agreements | |||||||||||||
| (in thousands) | Gross Amount of Eligible Offsetting Recognized Derivative Assets | Cash Collateral Received | Net Amount of Derivative Liabilities | |||||||||||
| Derivatives subject to master netting agreements | $ | ( | $ | $ | $ | ( | ||||||||
| Derivatives not subject to master netting agreements | ||||||||||||||
| Total | $ | ( | $ | ( | ||||||||||
97
The gross fair value of the Company's outstanding derivative contracts at April 2, 2022 and April 3, 2021 was as follows:
| (in thousands) | April 2, 2022 | April 3, 2021 | ||||||||||||
Derivative assets(1) | ||||||||||||||
| Non-designated hedges | $ | $ | ||||||||||||
| Cash flow hedges | ||||||||||||||
| Interest rate swaps | ||||||||||||||
| Total derivative assets | $ | $ | ||||||||||||
Derivative liabilities(2) | ||||||||||||||
| Non-designated hedges | $ | $ | ||||||||||||
| Cash flow hedges | ||||||||||||||
| Interest rate swaps | ||||||||||||||
| Accrued interest | ||||||||||||||
| Total derivative liabilities | $ | $ | ||||||||||||
(1) Short-term derivative assets are recorded in other current assets and long-term derivative assets are recorded in other non-current assets on the consolidated balance sheets. As of April 2, 2022, the portion of derivative assets classified as long-term was $16.1 million. As of April 3, 2021, the portion of derivative assets classified as long-term was $0.1 million.
(2) Short-term derivative liabilities are recorded in accrued liabilities and long-term derivative liabilities are recorded in other non-current liabilities on the consolidated balance sheets. As of April 2, 2022, the portion of derivative liabilities classified as long-term was $0.1 million. As of April 3, 2021, the portion of derivative liabilities classified as long-term was $2.0 million.
Non-Designated Hedges
As of April 2, 2022, the Company had foreign currency forward contracts denominated in Euro ("EUR") and Great Britain Pound Sterling ("GBP.") The Company does not elect to obtain hedge accounting for these forward contracts. These forward contracts hedge against a portion of the Company’s foreign currency-denominated cash balances, accounts receivables, and accounts payables. The following table summarizes the notional value of the Company’s outstanding foreign exchange currency contracts and approximate USD equivalent at April 2, 2022:
| (in thousands) | Local Currency | USD Equivalent | Position | Maturity | |||||||||||||||||||
| EUR | € | $ | |||||||||||||||||||||
| GBP | £ | $ | |||||||||||||||||||||
Effect of Non-Designated Derivative Contracts on the Consolidated Statements of Operations
The effect of non-designated derivative contracts on results of operations recognized in other non-operating expense (income), net in the consolidated statements of operations was as follows:
| Fiscal Year Ended | ||||||||||||||||||||
| (in thousands) | April 2, 2022 | April 3, 2021 | March 28, 2020 | |||||||||||||||||
| Gain (loss) on foreign exchange contracts | $ | $ | ( | $ | ||||||||||||||||
Cash Flow Hedges
Costless Collars
The Company hedges a portion of the forecasted EUR and GBP denominated revenues with costless collars. On a monthly basis, the Company enters into option contracts with a to twelve-month term. Collar contracts are scheduled to mature at the beginning of each fiscal quarter, at which time the instruments convert to forward contracts. The Company also enters into cash flow forwards with a three-month term. Once the hedged revenues are recognized, the forward contracts become non-designated hedges to protect the resulting foreign monetary asset position for the Company.
98
The notional value of the Company's outstanding EUR and GBP option and forward contracts at the end of each period was as follows:
| April 2, 2022 | April 3, 2021 | |||||||||||||||||||||||||
| (in millions) | EUR | GBP | EUR | GBP | ||||||||||||||||||||||
| Option contracts | € | £ | € | £ | ||||||||||||||||||||||
| Forward contracts | € | £ | € | £ | ||||||||||||||||||||||
The Company will reclassify all related amounts in accumulated other comprehensive income (loss) into earnings within the next twelve months.
Cross-currency Swaps
The Company hedges a portion of the forecasted Mexican Peso ("MXN") denominated expenditures with a cross-currency swap. As of April 2, 2022, and April 3, 2021, the Company had foreign currency swap contracts of approximately MXN 572.4 million and MXN 564.3 million, respectively.
The following table summarizes the notional value of the Company's outstanding MXN currency swaps and approximate USD Equivalent at April 2, 2022.
| (in thousands) | Local Currency | USD Equivalent | Position | Maturity | |||||||||||||||||||
| MXN | $ | Buy MXN | Monthly over a twelve -month period | ||||||||||||||||||||
The Company will reclassify all related amounts in accumulated other comprehensive income (loss) into earnings within the next twelve months.
Interest Rate Swaps
On June 15, 2021, the Company entered into a three-year amortizing interest rate swap agreement with Bank of America, N.A. The swap has an initial notional amount of $680 million and matures on July 31, 2024. The swap involves the receipt of floating-rate interest payments for fixed interest rate payments at a rate of 0.39 % over the life of the agreement. Additionally, on July 30, 2018, the Company entered into a four-year amortizing interest rate swap agreement with Bank of America, N.A. The swap has an initial notional amount of $831 million and matures on July 31, 2022. The swap involves the receipt of floating-rate interest payments for fixed interest rate payments at a rate of 2.78 % over the life of the agreement.
The Company has designated the interest rate swaps as cash flow hedges. The purpose of the interest rate swaps is to hedge against changes in cash flows (interest payments) attributable to fluctuations in the Company's variable rate debt. The swaps are valued based on prevailing LIBOR rate curves on the date of measurement. The Company also evaluates counterparty credit risk when it calculates the fair value of the interest rate swaps. Changes in the fair value of the interest rate swaps are recorded to other comprehensive income and are reclassified to interest expense over the life of the underlying debt as interest is accrued. During Fiscal Year 2022, the Company reclassified into interest expense $9.5 million and had a $24.2 million unrealized gain on its interest rate swap derivatives designated as cash flow hedges.
The Company will reclassify approximately $8.3 million in accumulated other comprehensive income into earnings within the next twelve months.
99
Effect of Designated Derivative Contracts on Accumulated Other Comprehensive Income (Loss) and the Consolidated Statements of Operations
The following table presents the pre-tax effects of derivative instruments designated as cash flow hedges on accumulated other comprehensive income (loss) and the consolidated statements of operations for Fiscal Years 2022, 2021 and 2020:
| Fiscal Year Ended | ||||||||||||||||||||
| (in thousands) | April 2, 2022 | April 3, 2021 | March 28, 2020 | |||||||||||||||||
| Loss included in accumulated other comprehensive income (loss), as of beginning of period | $ | ( | $ | ( | $ | ( | ||||||||||||||
| Gain (loss) recognized in other comprehensive income (loss) | ( | ( | ||||||||||||||||||
| Loss/(gain) reclassified from accumulated other comprehensive loss to the consolidated statements of operations | ||||||||||||||||||||
| Amount of (gain) loss reclassified from accumulated other comprehensive income (loss) into net revenues | ( | ( | ||||||||||||||||||
| Amount of gain reclassified from accumulated other comprehensive income (loss) into cost of revenues | ( | ( | ( | |||||||||||||||||
| Amount of loss reclassified from accumulated other comprehensive income (loss) into interest expense | ||||||||||||||||||||
| Total amount of loss reclassified from accumulated other comprehensive income (loss) to the consolidated statements of operations | ||||||||||||||||||||
| Gain (loss) included in accumulated other comprehensive income (loss), as of end of period | $ | $ | ( | $ | ( | |||||||||||||||
100
14. FAIR VALUE MEASUREMENTS
The following tables summarize the carrying value and fair value of the Company's cash and cash equivalents, short-term investments, derivative instruments and long-term debt as of April 2, 2022 and April 3, 2021:
| Carrying Value at April 2, 2022 | Fair Value at April 2, 2022 Using Inputs Considered as: | ||||||||||||||||
| (in thousands) | Level 1 | Level 2 | Level 3 | ||||||||||||||
| Assets: | |||||||||||||||||
| Cash and cash equivalents | $ | $ | $ | $ | |||||||||||||
| Short-term investments | |||||||||||||||||
| Derivative instruments | |||||||||||||||||
| Liabilities: | |||||||||||||||||
| Derivative instruments | $ | $ | $ | $ | |||||||||||||
| Long-term debt | |||||||||||||||||
| Carrying Value at April 3, 2021 | Fair Value at April 3, 2021 Using Inputs Considered as: | ||||||||||||||||
| (in thousands) | Level 1 | Level 2 | Level 3 | ||||||||||||||
| Assets: | |||||||||||||||||
| Cash and cash equivalents | $ | $ | $ | $ | |||||||||||||
| Restricted cash | |||||||||||||||||
| Short-term investments | |||||||||||||||||
| Derivative instruments | |||||||||||||||||
| Liabilities: | |||||||||||||||||
| Derivative instruments | $ | $ | $ | $ | |||||||||||||
| Current portion of long-term debt | |||||||||||||||||
| Long-term debt | |||||||||||||||||
Valuation Techniques
•Cash and cash equivalents, short-term investments, and restricted cash are classified within Level 1 of the fair value hierarchy. Financial instruments classified as Level 1 are based on quoted market prices in active markets. The types of financial instruments the Company classifies within Level 1 include bank deposits, money market securities, and publicly traded mutual funds. Restricted cash represents the cash held in trust and restricted for use to redeem the 5.50% Senior Notes. Refer to Note 8, Debt.
•The Company estimates the fair value of derivatives using pricing models that use observable market inputs. The significant Level 2 inputs used in the valuation of derivatives include spot rates and forward rates. These inputs were obtained from pricing services, broker quotes, and other sources.
•The fair value of long-term debt was determined based on inputs that were observable in the market, including the trading price, when available.
As of April 2, 2022 and April 3, 2021, the Company's short-term investments consisted of assets related to its deferred compensation plans. The assets are reported at fair value, with unrealized gains and losses included in current period earnings. For more information regarding the Company's deferred compensation plan, see Note 4, Deferred Compensation.
The Company did not incur any material realized or unrealized gains or losses during Fiscal Years 2022 and 2021.
There were no transfers between fair value measurement levels during Fiscal Years 2022 and 2021.
101
15. INCOME TAXES
Income tax benefit for Fiscal Years 2022, 2021, and 2020 consisted of the following:
| Fiscal Year Ended | ||||||||||||||||||||
| (in thousands) | April 2, 2022 | April 3, 2021 | March 28, 2020 | |||||||||||||||||
| Current | ||||||||||||||||||||
| Federal | $ | ( | $ | ( | $ | |||||||||||||||
| State | ||||||||||||||||||||
| Foreign | ||||||||||||||||||||
| Total current income tax expense | ||||||||||||||||||||
| Deferred | ||||||||||||||||||||
| Federal | ( | |||||||||||||||||||
| State | ( | |||||||||||||||||||
| Foreign | ( | ( | ( | |||||||||||||||||
| Total deferred income tax benefit | ( | ( | ( | |||||||||||||||||
| Income tax benefit | $ | ( | $ | ( | $ | ( | ||||||||||||||
The components of loss before income taxes for Fiscal Years 2022, 2021, and 2020 are as follows:
| Fiscal Year Ended | ||||||||||||||||||||
| (in thousands) | April 2, 2022 | April 3, 2021 | March 28, 2020 | |||||||||||||||||
| United States | $ | ( | $ | ( | $ | ( | ||||||||||||||
| Foreign | ( | |||||||||||||||||||
| Loss before income taxes | $ | ( | $ | ( | $ | ( | ||||||||||||||
The following is a reconciliation between statutory federal income taxes and the income tax benefit for Fiscal Years 2022, 2021, and 2020:
| Fiscal Year Ended | ||||||||||||||||||||
| (in thousands) | April 2, 2022 | April 3, 2021 | March 28, 2020 | |||||||||||||||||
| Tax benefit at statutory rate | $ | ( | $ | ( | $ | ( | ||||||||||||||
| Foreign operations taxed at different rates | ( | ( | ||||||||||||||||||
| State taxes, net of federal benefit | ( | ( | ( | |||||||||||||||||
| Research and development credit | ( | ( | ( | |||||||||||||||||
| U.S. tax on foreign earnings | ||||||||||||||||||||
| Reserve expirations | ( | |||||||||||||||||||
| Goodwill impairment | ||||||||||||||||||||
| Stock-based compensation | ||||||||||||||||||||
| Internal restructuring related benefit | ( | ( | ||||||||||||||||||
| Valuation allowance change | ||||||||||||||||||||
| Altera accrual | ||||||||||||||||||||
| Tax rate change | ( | |||||||||||||||||||
| Nondeductible compensation | ||||||||||||||||||||
| Tax on unremitted earnings of certain subsidiaries | ( | ( | ||||||||||||||||||
| Nondeductible expenses | ||||||||||||||||||||
| Provision to return | ( | |||||||||||||||||||
| Other, net | ( | ( | ||||||||||||||||||
| Income tax benefit | $ | ( | $ | ( | $ | ( | ||||||||||||||
102
Deferred tax assets and liabilities represent the tax effects of temporary differences between the carrying amounts of assets and liabilities for financial reporting and income tax purposes. Significant components of the Company's deferred tax assets and liabilities as of April 2, 2022 and April 3, 2021 are as follows:
| (in thousands) | April 2, 2022 | April 3, 2021 | ||||||||||||
| Deferred tax assets | ||||||||||||||
| Accruals and other reserves | $ | $ | ||||||||||||
| Deferred compensation | ||||||||||||||
| Net operating loss carry forward | ||||||||||||||
| Stock-based compensation | ||||||||||||||
| Interest expense | ||||||||||||||
| Tax credits | ||||||||||||||
| Capitalized R&D costs | ||||||||||||||
| Intangible assets | ||||||||||||||
| Other deferred tax assets | ||||||||||||||
| Unearned revenue | ||||||||||||||
| Property, plant, and equipment depreciation | ||||||||||||||
| Total deferred tax assets, before valuation allowance | ||||||||||||||
Valuation allowance(1) | ( | ( | ||||||||||||
| Total deferred tax assets, net | ||||||||||||||
| Deferred tax liabilities | ||||||||||||||
| Deferred gains on sales of properties | ( | ( | ||||||||||||
| Purchased intangibles | ( | ( | ||||||||||||
| Unremitted earnings of certain subsidiaries | ( | ( | ||||||||||||
| Right-of-use assets | ( | ( | ||||||||||||
| Total deferred tax liabilities | ( | ( | ||||||||||||
| Net deferred tax assets | $ | $ | ||||||||||||
(1) Valuation allowance on federal and state deferred tax assets is net of federal tax impact.
Valuation allowances are established when necessary to reduce deferred tax assets to the amounts that are more-likely-than-not expected to be realized. Management evaluates and weighs all available positive and negative evidence such as historic results, projected future taxable income, future reversals of existing deferred tax liabilities, as well as prudent and feasible tax-planning strategies. On the basis of this evaluation, the Company maintains a 100 % valuation allowance against its U.S. Federal and State deferred tax assets of $122.3 million.
In September 2021, the Company transferred certain non-Americas intellectual property (“IP”) rights between our wholly-owned subsidiaries ("IP transfer") to align with its evolving business operations, resulting in the derecognition of a deferred tax asset (DTA) of $91.1 million and the recognition of a new DTA of $204.5 million, which represents the book and tax basis difference in the IP and was based on the fair value of the IP, in the respective subsidiaries. This results in a net discrete deferred tax benefit of $113.4 million. The impact of the IP transfer to net cash flows on the consolidated statements of cash flows during Fiscal Year 2022 was not material.
Management has concluded that an impairment for local statutory and tax reporting to the aforementioned IP is likely however any impairment loss would be deductible for local tax purposes. As such, a DTA related to net operating loss carryforward of $48.0 million was recognized based on the expected impairment which was offset by a corresponding decrease in the DTA related to the intangible asset by the same amount as of April 2, 2022. Because the IP intangible asset is the result of an intercompany transfer, there is no intangible asset recognized in the consolidated balance sheets. Accordingly, the aforementioned IP impairment has no net impact to the Company’s consolidated statements of operations, balance sheet, or cash flows.
The impact of an uncertain income tax position on income tax expense must be recognized at the largest amount that is more-likely-than-not to be sustained. An uncertain income tax position will not be recognized unless it has a greater than 50% likelihood of being sustained. The Company adjusts these reserves in light of changing facts and circumstances, such as the closing of a tax audit, new tax legislation, or the change of an estimate. As of April 2, 2022 and April 3, 2021, the Company
103
had unrecognized tax benefits of $14.4 million and $149.5 million, respectively. The reduction in gross unrecognized tax benefits is primarily attributable to the aforementioned IP transfer between wholly owned subsidiaries. The unrecognized tax benefits as of April 2, 2022 would favorably impact the effective tax rate in future periods if recognized.
A reconciliation of the change in the amount of gross unrecognized income tax benefits for the periods is as follows:
| Fiscal Year Ended | ||||||||||||||||||||
| (in thousands) | April 2, 2022 | April 3, 2021 | March 28, 2020 | |||||||||||||||||
| Balance at beginning of period | $ | $ | $ | |||||||||||||||||
| Increase related to prior fiscal years | ||||||||||||||||||||
| Increase related to business combinations | ||||||||||||||||||||
| Increase related to current year income statement | ||||||||||||||||||||
| Reductions related to settlements with taxing authorities | ( | ( | ( | |||||||||||||||||
| Reductions related to lapse of applicable statute of limitations | ( | ( | ( | |||||||||||||||||
| Balance at end of period | $ | $ | $ | |||||||||||||||||
The Company recognizes interest and penalties related to income tax matters in income tax expense. The interest related to unrecognized tax benefits was $3.7 million and $3.6 million as of April 2, 2022 and April 3, 2021, respectively. No penalties have been accrued.
The Company and its subsidiaries are subject to taxation in various foreign and state jurisdictions, including the U.S. The Federal statute is open from Calendar Year 2015. Foreign and State income tax matters for material tax jurisdictions have been concluded for tax years prior to Fiscal Year 2015. Within the next twelve months, we believe that the resolution of certain U.S. and foreign tax examinations and negotiations is reasonably possible and that a change in estimate, reducing unrecognized tax benefits, may occur. It is not possible to provide a range of the potential change until the tax examinations and negotiations progress further or the related statutes of limitations expire.
The Company's U.S. federal and state net operating losses carryforwards as of April 2, 2022, were $0.3 million and $1.5 million, respectively. The U.S. federal net operating losses will expire between 2024 and 2026, and the state net operating losses will expire at various dates through 2042. The federal credit of $8.8 million will expire between 2031 and 2042. The state credits of $11.2 million are related to California R&D credits, which do not expire.
104
16. COMPUTATION OF EARNINGS (LOSS) PER COMMON SHARE
The following table presents the computation of basic and diluted earnings (loss) per common share:
| Fiscal Year Ended | ||||||||||||||||||||
| (in thousands, except per share data) | April 2, 2022 | April 3, 2021 | March 28, 2020 | |||||||||||||||||
| Numerator: | ||||||||||||||||||||
| Net income (loss) | $ | $ | ( | $ | ( | |||||||||||||||
| Denominator: | ||||||||||||||||||||
| Weighted-average basic shares outstanding | ||||||||||||||||||||
| Weighted-average diluted shares outstanding | ||||||||||||||||||||
| Basic earnings (loss) per common share | $ | $ | ( | $ | ( | |||||||||||||||
Diluted earnings (loss) per common share(1) | $ | $ | ( | $ | ( | |||||||||||||||
| Potentially dilutive securities excluded from diluted earnings (loss) per share because their effect is anti-dilutive | ||||||||||||||||||||
(1) The potentially dilutive effect of all outstanding stock options, restricted stock, and shares purchased under the 2002 ESPP are excluded from the computation of diluted loss per share in periods when the Company incurs a net loss, as their effect is anti-dilutive.
17. REVENUE AND MAJOR CUSTOMERS
105
The following table disaggregates revenues by major product category for Fiscal Years 2022, 2021 and 2020:
| Fiscal Year Ended | ||||||||||||||||||||
| (in thousands) | April 2, 2022 | April 3, 2021 | March 28, 2020 | |||||||||||||||||
| Net revenues | ||||||||||||||||||||
| Headsets | $ | $ | $ | |||||||||||||||||
| Voice | ||||||||||||||||||||
| Video | ||||||||||||||||||||
| Services | ||||||||||||||||||||
| Total net revenues | $ | $ | $ | |||||||||||||||||
For reporting purposes, revenue is attributed to each geographic region based on the location of the customer. Other than the U.S., no country accounted for 10% or more of the Company's total net revenues for the Fiscal Years 2022, 2021 or 2020. The following table presents total net revenues by geography:
| Fiscal Year Ended | ||||||||||||||||||||
| (in thousands) | April 2, 2022 | April 3, 2021 | March 28, 2020 | |||||||||||||||||
| Net product revenues | ||||||||||||||||||||
| U.S. | $ | $ | $ | |||||||||||||||||
| Europe, Middle East, and Africa | ||||||||||||||||||||
| Asia Pacific | ||||||||||||||||||||
| Americas, excluding U.S. | ||||||||||||||||||||
| Total international net product revenues | ||||||||||||||||||||
| Total net product revenues | $ | $ | $ | |||||||||||||||||
| Net service revenues | ||||||||||||||||||||
| U.S. | $ | $ | $ | |||||||||||||||||
| Europe, Middle East, and Africa | ||||||||||||||||||||
| Asia Pacific | ||||||||||||||||||||
| Americas, excluding U.S. | ||||||||||||||||||||
| Total international net service revenues | ||||||||||||||||||||
| Total service net revenues | ||||||||||||||||||||
| Total net revenues | $ | $ | $ | |||||||||||||||||
Deferred revenue is primarily comprised of non-cancelable maintenance support performance obligations on hardware devices which are typically billed in advance and recognized ratably over the contract term as the services are delivered. The Company's deferred revenue balance was $193.1 million as of April 2, 2022, which represents 11.5 % of total net revenues for Fiscal Year 2022 and was $213.8 million as of April 3, 2021, which represents 12.4 % of total net revenues for Fiscal Year 2021. During Fiscal Year 2022, the Company recognized $141.4 million in total net revenues that were recorded in deferred revenue at the beginning of the period.
106
The table below represents aggregate amount of the transaction price allocated to the performance obligations that are unsatisfied (or partially unsatisfied) as of April 2, 2022:
| April 2, 2022 | ||||||||||||||||||||
| (in thousands) | Current | Non-current | Total | |||||||||||||||||
| Unsatisfied (or partially unsatisfied) performance obligations | $ | $ | $ | |||||||||||||||||
Upon establishment of creditworthiness, the Company may extend credit terms to its customers which typically ranges between 30 and 90 days from the date of invoice depending on geographic region and type of customer. The Company typically bills upon product hardware shipment, at time of software activation, upon the start of service entitlement, or upon completion of services. Revenue is not generally recognized in advance of billings. The balance of contract assets was $4.3 million and $4.1 million as of April 2, 2022 and April 3, 2021, respectively. None of the Company's contracts are deemed to have significant financing components.
Sales, value add, and other taxes collected concurrently with revenue producing activities are excluded from revenue.
The Company's indirect channel model includes both a two-tiered distribution structure, where the Company sells to distributors that subsequently sell to resellers, and a one-tiered structure where the Company sells directly to resellers. For these arrangements, transfer of control begins at the time access to the Company's services is made available to the end customer and entitlements have been contractually established, provided all other criteria for revenue recognition are met.
Commercial distributors and retailers represent the Company's largest sources of net revenues. Sales through its distribution and retail channels are made primarily under agreements allowing for rights of return and include various sales incentive programs, such as back-end rebates, discounts, marketing development funds, price protection, and other sales incentives. The Company has an established sales history for these arrangements and the Company records the estimated reserves at the inception of the contract as a reflection of the reduced transaction price. Customer sales returns are estimated based on historical data, relevant current data, and the monitoring of inventory build-up in the distribution channel. Revenue reserves represent a reasonable estimation made by management and are subject to significant judgment. Estimated reserves may differ from actual returns or incentives provided, due to unforeseen customer return or claim patterns or changes in circumstances. For certain customer contracts which has historically demonstrated variability, the Company has considered the likelihood of being under-reserved and have considered a constraint accordingly. Provisions for sales returns are presented within accrued liabilities in the Company's consolidated balance sheets. Provisions for promotions, rebates, and other sales incentives are presented as a reduction of accounts receivable unless there is no identifiable right to offset, in which case they are presented within accrued liabilities on the consolidated balance sheets. See Note 5, Details of Certain Balance Sheet Accounts.
18. SEGMENT REPORTING AND GEOGRAPHIC INFORMATION
The Company's Chief Executive Officer is identified as its Chief Operating Decision Maker ("CODM"). The CODM has organized the Company, manages resource allocations, and measures performance among its two operating segments: Products and Services.
The Products reportable segment includes the Headsets, Voice and Video product lines. The Services reportable segment includes maintenance support on hardware devices as well as professional, managed and cloud services and solutions.
In managing the two operating segments the CODM uses information about their revenue and gross margin after adjustments to exclude certain non-cash transactions and activities that are not reflective of the Company's ongoing or core operations as further described below. The CODM does not review asset information by segment.
107
Asset impairment: During the fourth quarter of Fiscal 2020, the Company determined certain of its long-lived assets, primarily related to purchased intangibles recorded in connection with the acquisition of Polycom, were not recoverable and as a result recorded impairment charges representing the excess carrying amount over the estimated fair value (see Note 6, Goodwill and Purchased Intangible Assets).
Purchase accounting amortization: Represents the amortization of purchased intangible assets recorded in connection with the acquisition of Polycom.
Deferred revenue purchase accounting: Represents the impact of fair value purchase accounting adjustments related to deferred revenue recorded in connection with the acquisition of Polycom. The Company's deferred revenue primarily relates to service revenue associated with non-cancelable maintenance support on hardware devices which are typically billed in advance and recognized ratably over the contract term as those services are delivered. This adjustment represents the amount of additional revenue that would have been recognized during the period absent the write-down to fair value required under purchase accounting guidelines.
Consumer optimization: Represents charges related to inventory reserves and supplier liabilities for excess and obsolete inventory incurred in connection with the Company's strategic actions to optimize its Consumer product portfolio.
Acquisition and integration fees: Represents charges incurred in connection with the acquisition and integration of Polycom such as system implementations, legal and accounting fees.
Stock-based compensation: Represents the non-cash expense associated with the Company's grant of stock-based awards to employees and non-employee directors.
108
The following table presents segment results for revenue and gross margin, as reviewed by the CODM, and the related reconciliation to the Company's consolidated GAAP results:
| Fiscal Year Ended | ||||||||||||||||||||
| (in thousands) | April 2, 2022 | April 3, 2021 | March 28, 2020 | |||||||||||||||||
| Segment revenues, as reviewed by CODM | ||||||||||||||||||||
| Products | $ | $ | ||||||||||||||||||
| Services | ||||||||||||||||||||
| Total segment revenues, as reviewed by CODM | $ | $ | $ | |||||||||||||||||
| Segment gross profit, as reviewed by CODM | ||||||||||||||||||||
| Products | $ | $ | $ | |||||||||||||||||
| Services | ||||||||||||||||||||
| Total segment gross profit, as reviewed by CODM | $ | $ | $ | |||||||||||||||||
| Fiscal Year Ended | ||||||||||||||||||||
| (in thousands) | April 2, 2022 | April 3, 2021 | March 28, 2020 | |||||||||||||||||
| Total segment revenues, as reviewed by CODM | $ | $ | $ | |||||||||||||||||
| Deferred revenue purchase accounting | ( | ( | ( | |||||||||||||||||
| GAAP net revenues | $ | $ | $ | |||||||||||||||||
Total segment gross profit, as reviewed by CODM (1) | $ | $ | $ | |||||||||||||||||
| Asset impairment | ( | |||||||||||||||||||
| Purchase accounting amortization | ( | ( | ( | |||||||||||||||||
| Deferred revenue purchase accounting | ( | ( | ( | |||||||||||||||||
| Consumer optimization | ( | |||||||||||||||||||
| Integration and rebranding costs | ( | |||||||||||||||||||
| Stock-based compensation | ( | ( | ( | |||||||||||||||||
| GAAP gross profit | $ | $ | $ | |||||||||||||||||
The following table presents long-lived assets by geographic area on a consolidated basis:
| (in thousands) | April 2, 2022 | April 3, 2021 | ||||||||||||
| United States | $ | $ | ||||||||||||
| Netherlands | ||||||||||||||
| Mexico | ||||||||||||||
| United Kingdom | ||||||||||||||
| China | ||||||||||||||
| Other countries | ||||||||||||||
| Total long-lived assets | $ | $ | ||||||||||||
ITEM 9. CHANGES IN AND DISAGREEMENTS WITH ACCOUNTANTS ON ACCOUNTING AND FINANCIAL DISCLOSURE
There have been no disagreements with accountants on any matter of accounting principles and practices or financial disclosure.
109
ITEM 9A. CONTROLS AND PROCEDURES
Evaluation of disclosure controls and procedures
Our management evaluated, with the participation of our Chief Executive Officer and our Chief Financial Officer, the effectiveness of our disclosure controls and procedures as of the end of the period covered by this Annual Report on Form 10-K. Based on this evaluation, our Chief Executive Officer and our Chief Financial Officer have concluded that our disclosure controls and procedures are effective at the reasonable assurance level to ensure that information we are required to disclose in reports that we file or submit under the Securities Exchange Act of 1934 (i) is recorded, processed, summarized and reported within the time periods specified in Securities and Exchange Commission rules and forms, and (ii) is accumulated and communicated to the Company’s management, including our Chief Executive Officer and our Chief Financial Officer, as appropriate, to allow timely decisions regarding required disclosure.
Our disclosure controls and procedures are designed to provide reasonable assurance that such information is accumulated and communicated to our management. Our disclosure controls and procedures include components of our internal control over financial reporting. Management’s assessment of the effectiveness of our internal control over financial reporting is expressed at the level of reasonable assurance because a control system, no matter how well designed and operated, can provide only reasonable, but not absolute, assurance that the control system’s objectives will be met.
Management’s Report on Internal Control Over Financial Reporting
Our management is responsible for establishing and maintaining adequate internal control over financial reporting (as defined in Rule 13a-15(f) under the Securities Exchange Act of 1934, as amended). Our management conducted an evaluation of the effectiveness of our internal control over financial reporting based on the criteria set forth in Internal Control-Integrated Framework (2013) issued by the Committee of Sponsoring Organizations of the Treadway Commission (“COSO”). Based on this evaluation, our management has concluded that our internal control over financial reporting was effective as of April 2, 2022.
The effectiveness of the Company's internal control over financial reporting as of April 2, 2022 has been audited by PricewaterhouseCoopers LLP, an independent registered public accounting firm, as stated in their report which appears in Part II, Item 8 of this Annual Report on Form 10-K.
Changes in internal control over financial reporting
There have been no changes in the Company’s internal control over financial reporting that have materially affected, or are reasonably likely to materially affect, our internal control over financial reporting.
ITEM 9B. OTHER INFORMATION
None.
ITEM 9C. DISCLOSURE REGARDING FOREIGN JURISDICTIONS THAT PREVENT INSPECTIONS
None.
110
PART III
ITEM 10. DIRECTORS, EXECUTIVE OFFICERS AND CORPORATE GOVERNANCE
The information regarding the identification and business experience of our directors will be included under the captions "Nominees" and “Business Experience and Qualifications of Directors/Nominees” under the main caption "Proposal One – Election of Directors" in our definitive 2022 Proxy Statement for the 2022 Annual Meeting of Stockholders (“2022 Proxy Statement”), is incorporated in this Item 10 by reference. For information regarding the identification and business experience of our executive officers, see "Executive Officers of the Registrant" at the end of Item 1 in Part I of this Form 10-K. Information regarding the audit committee and names of the financial expert(s) serving on the audit committee, under the caption "Corporate Governance” subheading “Audit Committee" in our 2022 Proxy Statement is incorporated into this Item 10 by reference. Information concerning filing requirements applicable to our executive officers and directors under the caption "Section 16(a) Beneficial Ownership Reporting Compliance” in our 2022 Proxy Statement is incorporated into this Item 10 by reference.
There have been no materials changes to the procedures by which stockholders can recommend nominees to the Company's Board.
ITEM 11. EXECUTIVE COMPENSATION
The information required under this item will be included under the captions "Executive Compensation", "Compensation of Directors", “Report of the Leadership Development and Compensation Committee of the Board of Directors” and “Leadership Development and Compensation Committee Interlocks and Insider Participation” in our 2022 Proxy Statement and is incorporated herein by reference.
ITEM 12. SECURITY OWNERSHIP OF CERTAIN BENEFICIAL OWNERS AND MANAGEMENT AND RELATED STOCKHOLDER MATTERS
The information required by this item will be included under the captions “Equity Compensation Plan Information” and "Security Ownership of Principal Stockholders and Management" under the main caption "Additional Information" in our 2022 Proxy Statement and is incorporated into this Item 12 by this reference.
ITEM 13. CERTAIN RELATIONSHIPS AND RELATED TRANSACTIONS, AND DIRECTOR INDEPENDENCE
The information required by this item will be included under the caption "Corporate Governance” subheading “Director Independence and Certain Relationships and Related Transactions" in the 2022 Proxy Statement and is incorporated into this Item 13 by this reference.
ITEM 14. PRINCIPAL ACCOUNTING FEES AND SERVICES
The information required by this item will be included under the caption "Proposal Four - Ratification of Appointment of Independent Registered Public Accounting Firm" in our 2022 Proxy Statement and is incorporated in this Item 14 by this reference.
111
PART IV
ITEM 15. EXHIBITS AND FINANCIAL STATEMENT SCHEDULES
(a) The following documents are filed as part of this Form 10-K:
(1)Financial Statements. The consolidated financial statements of the Company are listed in the Index to the Consolidated Financial Statements in Item 8.
(2)Financial Statement Schedule.
PLANTRONICS, INC.
SCHEDULE II: VALUATION AND QUALIFYING
ACCOUNTS
(in thousands)
| Balance at Beginning of Year | Other (4) | Charged to Expenses or Other Accounts | Deductions | Balance at End of Year | ||||||||||||||||||||||||||||
| Provision for doubtful accounts and sales allowances: | (1) | |||||||||||||||||||||||||||||||
| Year ended March 28, 2020 | 4,956 | — | (2,297) | (518) | 2,141 | |||||||||||||||||||||||||||
| Year ended April 3, 2021 | 2,141 | — | 577 | (389) | 2,329 | |||||||||||||||||||||||||||
| Year ended April 2, 2022 | 2,329 | — | 677 | (1,685) | 1,321 | |||||||||||||||||||||||||||
| Provision for promotions and rebates: | (2) | |||||||||||||||||||||||||||||||
| Year ended March 28, 2020 | 123,053 | (224) | 441,250 | (452,705) | 111,374 | |||||||||||||||||||||||||||
| Year ended April 3, 2021 | 111,374 | 4,619 | 378,777 | (397,592) | 97,178 | |||||||||||||||||||||||||||
| Year ended April 2, 2022 | 97,178 | — | 432,592 | (409,978) | 119,792 | |||||||||||||||||||||||||||
| Valuation allowance for deferred tax assets: | (3) | |||||||||||||||||||||||||||||||
| Year ended March 28, 2020 | 15,787 | — | 71,561 | (5,912) | 81,436 | |||||||||||||||||||||||||||
| Year ended April 3, 2021 | 81,436 | — | 21,087 | (783) | 101,740 | |||||||||||||||||||||||||||
| Year ended April 2, 2022 | 101,740 | — | 29,665 | 237 | 131,642 | |||||||||||||||||||||||||||
(1) Amounts charged to expenses or other accounts related to the provision for doubtful accounts are recorded as part of selling, general, and administrative expenses and amounts related to sales allowances are recorded as a reduction to total net revenues in the consolidated statements of operations.
(2) Amounts charged to expenses or other accounts are recorded as a reduction to total net revenues in the in the consolidated statements of operations.
(3) Amounts charged to expenses or other accounts are recorded as part of income tax benefit in the consolidated statements of operations.
(4) Amounts represent changes in the accounts due to the impact from adoption of ASC 606.
All other schedules have been omitted because the required information is either not present or not present in the amounts sufficient to require submission of the schedule, or because the information required is included in the consolidated financial statements or notes thereto.
(3) Exhibits. See Item 15(b) below.
(b) Exhibits
We have filed, or incorporated by reference into this Report, the exhibits listed on the accompanying Index to Exhibits immediately preceding the signature page of this Form 10-K.
112
(c) Financial Statement Schedules
See Items 8 and 15(a) (2) above.
113
EXHIBITS INDEX
| Incorporation by Reference | ||||||||||||||||||||||||||||||||||||||
| Exhibit Number | Exhibit Description | Form | File No. | Exhibit | Filing Date | Filed Herewith | ||||||||||||||||||||||||||||||||
| 2.1 | 8-K | 001-12696 | 2.1 | 7/2/2018 | ||||||||||||||||||||||||||||||||||
| 2.2*** | 8-K | 001-12696 | 2.1 | 3/28/2022 | ||||||||||||||||||||||||||||||||||
| 3.1 | 8-K | 001-12696 | 3.1 | 1/20/2009 | ||||||||||||||||||||||||||||||||||
| 3.2 | 10-K | 001-12696 | 3.2 | 6/8/2020 | ||||||||||||||||||||||||||||||||||
| 4.1 | 8-K | 001-12696 | 4.1 | 6/3/2015 | ||||||||||||||||||||||||||||||||||
| 4.2 | 8-K | 001-12696 | 4.1 | 3/4/2021 | ||||||||||||||||||||||||||||||||||
| 4.3 | 8-K | 001-12696 | 4.2 | 6/3/2015 | ||||||||||||||||||||||||||||||||||
| 4.4 | 8-K | 001-12696 | 4.3 | 7/2/2018 | ||||||||||||||||||||||||||||||||||
| 4.4.1 | 8-K | 001-12696 | 4.3.1 | 2/21/2020 | ||||||||||||||||||||||||||||||||||
| 4.4.2 | 8-K | 001-12696 | 10.1 | 12/29/2021 | ||||||||||||||||||||||||||||||||||
| 4.5 | X | |||||||||||||||||||||||||||||||||||||
| 10.1 | 8-K | 001-12696 | 10.1 | 7/2/2018 | ||||||||||||||||||||||||||||||||||
| 10.1.1 | 8-K | 001-12696 | 10.1 | 2/11/2020 | ||||||||||||||||||||||||||||||||||
| 10.2* | 10-K | 001-12696 | 10.2 | 5/31/2005 | ||||||||||||||||||||||||||||||||||
| 10.3* | 10-K | 001-12696 | 10.3 | 5/17/2019 | ||||||||||||||||||||||||||||||||||
| 10.4* | 8-K | 001-12696 | 10.2 | 8/3/2018 | ||||||||||||||||||||||||||||||||||
| 10.5* | 8-K | 001-12696 | 10.2 | 6/28/2019 | ||||||||||||||||||||||||||||||||||
| 10.6* | 8-K | 001-12696 | 10.2 | 7/27/2020 | ||||||||||||||||||||||||||||||||||
| 10.7* | 10-K | 001-12696 | 10.7 | 5/18/2021 | ||||||||||||||||||||||||||||||||||
| 10.8* | 10-K | 001-12696 | 10.8 | 5/18/2021 | ||||||||||||||||||||||||||||||||||
| 10.9* | 10-K | 001-12696 | 10.9 | 5/18/2021 | ||||||||||||||||||||||||||||||||||
| 10.10* | 8-K | 001-12696 | 10.2 | 7/27/2021 | ||||||||||||||||||||||||||||||||||
| 10.11* | X | |||||||||||||||||||||||||||||||||||||
| 10.12* | X | |||||||||||||||||||||||||||||||||||||
114
| Incorporation by Reference | ||||||||||||||||||||||||||||||||||||||
| Exhibit Number | Exhibit Description | Form | File No. | Exhibit | Filing Date | Filed Herewith | ||||||||||||||||||||||||||||||||
| 10.13* | 8-K | 001-12696 | 10.1 | 8/3/2018 | ||||||||||||||||||||||||||||||||||
| 10.14* | 8-K | 001-12696 | 10.1 | 6/28/2019 | ||||||||||||||||||||||||||||||||||
| 10.15* | 8-K | 001-12696 | 10.1 | 7/27/2020 | ||||||||||||||||||||||||||||||||||
| 10.16* | 8-K | 001-12696 | 10.1 | 7/27/2021 | ||||||||||||||||||||||||||||||||||
| 10.17* | 10-Q | 001-12696 | 10.2 | 2/8/2022 | ||||||||||||||||||||||||||||||||||
| 10.18* | Trust Agreement Under the Plantronics, Inc. Basic Deferred Stock Compensation Plan | S-8 | 333-19351 | 4.6 | 3/25/1997 | |||||||||||||||||||||||||||||||||
| 10.19* | Plantronics, Inc. Basic Deferred Compensation Plan Participant Election | S-8 | 333-19351 | 4.7 | 3/25/1997 | |||||||||||||||||||||||||||||||||
| 10.20* | S-8 | 333-188868 | 4.1 | 5/24/2013 | ||||||||||||||||||||||||||||||||||
| 10.21* | S-8 | 333-248775 | 10.1 | 9/14/2020 | ||||||||||||||||||||||||||||||||||
| 10.22** | 10-Q | 001-12696 | 10.2 | 10/30/2020 | ||||||||||||||||||||||||||||||||||
| 10.23* | 10-Q | 001-12696 | 10.3 | 10/30/2020 | ||||||||||||||||||||||||||||||||||
| 10.24* | 10-K | 001-12696 | 10.13 | 6/8/2020 | ||||||||||||||||||||||||||||||||||
| 10.25* | 10-K | 001-12696 | 10.10 | 5/17/2019 | ||||||||||||||||||||||||||||||||||
| 10.26* | 10-K | 001-12696 | 10.11 | 5/17/2019 | ||||||||||||||||||||||||||||||||||
| 10.27* | 10-K | 001-12696 | 10.12 | 5/17/2019 | ||||||||||||||||||||||||||||||||||
| 10.28* | 10-Q | 001-12696 | 10.2 | 2/6/2020 | ||||||||||||||||||||||||||||||||||
| 10.29* | 10-Q | 001-12696 | 10.3 | 2/6/2020 | ||||||||||||||||||||||||||||||||||
| 10.30** | 10-K | 001-12696 | 10.26 | 6/8/2020 | ||||||||||||||||||||||||||||||||||
| 10.31* | 10-K | 001-12696 | 10.27 | 6/8/2020 | ||||||||||||||||||||||||||||||||||
| 10.32** | 10-Q | 001-12696 | 10.1 | 7/30/2021 | ||||||||||||||||||||||||||||||||||
| 10.33* | 10-Q | 001-12696 | 10.2 | 7/30/2021 | ||||||||||||||||||||||||||||||||||
| 10.34 | 10-K | 001-12696 | 10.13.6 | 5/26/2009 | ||||||||||||||||||||||||||||||||||
| 10.35 | 8-K | 001-12696 | 10.1 | 5/26/2015 | ||||||||||||||||||||||||||||||||||
| 10.36 | 8-K | 001-12696 | 4.1 | 2/26/2021 | ||||||||||||||||||||||||||||||||||
| 21.1 | X | |||||||||||||||||||||||||||||||||||||
| 23 | X | |||||||||||||||||||||||||||||||||||||
| 24.1 | Power of Attorney – Power of Attorney (incorporated by reference to the signature page of this Annual Report on Form 10-K.) | |||||||||||||||||||||||||||||||||||||
115
| Incorporation by Reference | ||||||||||||||||||||||||||||||||||||||
| Exhibit Number | Exhibit Description | Form | File No. | Exhibit | Filing Date | Filed Herewith | ||||||||||||||||||||||||||||||||
| 31.1 | X | |||||||||||||||||||||||||||||||||||||
| 31.2 | X | |||||||||||||||||||||||||||||||||||||
| 32.1 | X | |||||||||||||||||||||||||||||||||||||
| 101 INS | XBRL Instance Document | X | ||||||||||||||||||||||||||||||||||||
| 101 SCH | XBRL Taxonomy Extension Schema Document | X | ||||||||||||||||||||||||||||||||||||
| 101 CAL | XBRL Taxonomy Extension Calculation Linkbase Document | X | ||||||||||||||||||||||||||||||||||||
| 101 LAB | XBRL Taxonomy Extension Label Linkbase Document | X | ||||||||||||||||||||||||||||||||||||
| 101 PRE | XBRL Taxonomy Extension Presentation Linkbase Document | X | ||||||||||||||||||||||||||||||||||||
| 101 DEF | XBRL Taxonomy Definition Linkbase Document | X | ||||||||||||||||||||||||||||||||||||
| 104 | Cover Page Interactive Data File, (formatted as Inline XBRL and contained in Exhibit 101) | X | ||||||||||||||||||||||||||||||||||||
| * | Indicates a management contract or compensatory plan, contract or arrangement in which any Director or any Executive Officer participates. | |||||||||||||||||||||||||||||||||||||
| ** | Confidential treatment has been granted with respect to certain portions of this Exhibit. | |||||||||||||||||||||||||||||||||||||
| *** | Schedules and exhibits omitted pursuant to Item 601(b)(2) of Regulation S-K. The Company will furnish supplementally a copy of any omitted schedule or exhibit to the SEC upon request. The Company may request confidential treatment for any schedules or exhibits so furnished. | |||||||||||||||||||||||||||||||||||||
ITEM 16. FORM 10-K SUMMARY
None.
116
SIGNATURES
Pursuant to the requirements of the Securities Exchange Act of 1934, the registrant has duly caused this report to be signed on its behalf by the undersigned hereunto duly authorized.
| May 26, 2022 | PLANTRONICS, INC. | ||||||||||
| By: | /s/ David M. Shull | ||||||||||
| Name: | David M. Shull | ||||||||||
| Title: | President and Chief Executive Officer (Principal Executive Officer) | ||||||||||
POWER OF ATTORNEY
KNOW ALL PERSONS BY THESE PRESENTS:
That the undersigned officers and directors of Plantronics, Inc., a Delaware corporation, do hereby constitute and appoint David M. Shull and Charles D. Boynton, or either of them, the lawful attorney-in-fact, with full power of substitution, for him in any and all capacities, to sign any amendments to this report on Form 10-K and to file the same, with exhibits thereto and other documents in connection therewith, with the Securities and Exchange Commission, hereby ratifying and confirming all that said attorney-in-fact or his substitute or substitutes may do or cause to be done by virtue hereof.
Pursuant to the requirements of the Securities Exchange Act of 1934, this report has been signed below by the following persons on behalf of the Registrant and in the capacities and on the dates indicated.
117
| Signature | Title | Date | ||||||
| /s/ David M. Shull | ||||||||
| (David M. Shull) | President, Chief Executive Officer and Director (Principal Executive Officer) | May 26, 2022 | ||||||
| /s/ Charles D. Boynton | ||||||||
| (Charles D. Boynton) | Executive Vice President and Chief Financial Officer (Principal Financial Officer and Principal Accounting Officer) | May 26, 2022 | ||||||
| /s/ Robert C. Hagerty | ||||||||
| (Robert C. Hagerty) | Chairman of the Board and Director | May 26, 2022 | ||||||
| /s/ Marv Tseu | ||||||||
| (Marv Tseu) | Vice Chairman of the Board and Director | May 26, 2022 | ||||||
| /s/ Kathy Crusco | ||||||||
| (Kathy Crusco) | Director | May 26, 2022 | ||||||
| /s/ Brian Dexheimer | ||||||||
| (Brian Dexheimer) | Director | May 26, 2022 | ||||||
| /s/ Gregg Hammann | ||||||||
| (Gregg Hammann) | Director | May 26, 2022 | ||||||
| /s/ Guido Jouret | ||||||||
| (Guido Jouret) | Director | May 26, 2022 | ||||||
| /s/ Talvis Love | ||||||||
| (Talvis Love) | Director | May 26, 2022 | ||||||
| /s/ Marshall Mohr | ||||||||
| (Marshall Mohr) | Director | May 26, 2022 | ||||||
| /s/ Daniel Moloney | ||||||||
| (Daniel Moloney) | Director | May 26, 2022 | ||||||
| /s/ Yael Zheng | ||||||||
| (Yael Zheng) | Director | May 26, 2022 | ||||||
118
Serious News for Serious Traders! Try StreetInsider.com Premium Free!
You May Also Be Interested In
- Blackwell 3D Acquires Operating Dubai LLC, Inches Closer to Project Readiness
- Phillips Edison & Company Reports First Quarter 2024 Results and Affirms Full Year Earnings Guidance
- Lincoln Avenue Communities Breaks Ground on Affordable Housing Development in Casa Grande, Arizona
Create E-mail Alert Related Categories
SEC FilingsSign up for StreetInsider Free!
Receive full access to all new and archived articles, unlimited portfolio tracking, e-mail alerts, custom newswires and RSS feeds - and more!
