

Form 10-K PATRICK INDUSTRIES INC For: Dec 31
 Tweet
Tweet Share
ShareUNITED STATES SECURITIES AND EXCHANGE COMMISSION
WASHINGTON, D.C. 20549
FORM 10-K
ANNUAL REPORT PURSUANT TO SECTION 13 OR 15(d) OF THE SECURITIES EXCHANGE ACT OF 1934 | |||||
For the Fiscal Year Ended December 31 , 2021
or
TRANSITION REPORT PURSUANT TO SECTION 13 OR 15(d) OF THE SECURITIES EXCHANGE ACT OF 1934 | |||||
For the transition period from ……………… to ………………
Commission file number 000-03922

(Exact name of registrant as specified in its charter)
| (State or other jurisdiction of incorporation or organization) | (I.R.S. Employer Identification No.) | ||||||||||
| (Address of principal executive offices) | (Zip Code) | ||||||||||
Registrant’s telephone number, including area code: (574 ) 294-7511
Securities registered pursuant to Section 12(b) of the Act:
| (Title of each class) | (Trading Symbol) | (Name of each exchange on which registered) | ||||||
Securities registered pursuant to Section 12(g) of the Act: None
Indicate by check mark if the registrant is a well-known seasoned issuer, as defined in Rule 405 of the Securities Act. Yes ☒ No ☐
Indicate by check mark if the registrant is not required to file reports pursuant to Section 13 or Section 15(d) of the Act. Yes ☐ No ☒
Indicate by check mark whether the registrant (1) has filed all reports required to be filed by Section 13 or 15(d) of the Securities Exchange Act of 1934 during the preceding 12 months (or for such shorter period that the registrant was required to file such reports), and (2) has been subject to such filing requirements for the past 90 days. Yes ☒ No ☐
Indicate by check mark whether the registrant has submitted electronically, every Interactive Data File required to be submitted pursuant to Rule 405 of Regulation S-T (§ 232.405 of this chapter) during the preceding 12 months (or for such shorter period that the registrant was required to submit such files). Yes ☒ No ☐
Indicate by check mark whether the registrant is a large accelerated filer, an accelerated filer, a non-accelerated filer, a smaller reporting company, or emerging growth company. See the definitions of “large accelerated filer,” “accelerated filer,” “smaller reporting company,” and "emerging growth company" in Rule 12b-2 of the Exchange Act.
If an emerging growth company, indicate by check mark if the registrant has elected not to use the extended transition period for complying with any new or revised financial accounting standards provided pursuant to Section 13(a) of the Exchange Act. ☐
Indicate by check mark whether the registrant has filed a report on and attestation to its management’s assessment of
the effectiveness of its internal control over financial reporting under Section 404(b) of the Sarbanes-Oxley Act (15 U.S.C.
7262(b)) by the registered public accounting firm that prepared or issued its audit report. ☒
Indicate by check mark whether the registrant is a shell company (as defined in Rule 12b-2 of the Act). Yes ☐ No ☒
As of June 25, 2021, the last business day of the registrant's most recently completed second fiscal quarter, the aggregate market value of the common stock of the registrant held by non-affiliates was $1.7 billion. As of February 11, 2022, there were 23,353,136 shares of the registrant’s common stock outstanding.
DOCUMENTS INCORPORATED BY REFERENCE
Portions of the registrant’s Proxy Statement for its Annual Meeting of Shareholders to be held on May 12, 2022 are incorporated by reference into Part III of this Form 10-K.
PATRICK INDUSTRIES, INC.
FORM 10-K
FISCAL YEAR ENDED DECEMBER 31, 2021
Table of Contents
| ITEM 16. | FORM 10-K SUMMARY | ||||||||||
FINANCIAL SECTION
F-1 | ||||||||
| Report of Independent Registered Public Accounting Firm, Deloitte & Touche LLP | F-2 | |||||||
| F-5 | ||||||||
| F-6 | ||||||||
| Consolidated Balance Sheets | F-7 | |||||||
| Consolidated Statements of Cash Flows | F-8 | |||||||
| F-9 | ||||||||
F-10 | ||||||||
| Exhibits | ||||||||
2
INFORMATION CONCERNING FORWARD-LOOKING STATEMENTS
This Annual Report on Form 10-K contains certain “forward-looking statements” within the meaning of the Private Securities Litigation Reform Act of 1995 with respect to financial condition, results of operations, business strategies, operating efficiencies or synergies, competitive position, industry growth and projections, growth opportunities for existing products, plans and objectives of management, markets for the common stock of Patrick Industries, Inc. (the “Company” or “Patrick”) and other matters. Statements in this Form 10-K as well as other statements contained in the annual report and statements contained in future filings with the Securities and Exchange Commission (“SEC”) and publicly disseminated press releases, and statements which may be made from time to time in the future by management of the Company in presentations, which are not historical facts, are forward-looking statements that involve risks and uncertainties that could cause actual results to differ materially from those set forth in the forward-looking statements.
There are a number of factors, many of which are beyond the control of the Company, which could cause actual results and events to differ materially from those described in the forward-looking statements. Many, but not all, of these factors are identified in the “Risk Factors” section of this Form 10-K as set forth in Part I, Item 1A, and include, without limitation, the impact of any economic downturns especially in the residential housing market, a decline in discretionary consumer spending, pricing pressures due to competition, costs and availability of raw materials and commodities, the imposition of restrictions and taxes on imports of raw materials and components used in our products, information technology performance and cyber-related risks, the availability of commercial credit, the availability of retail and wholesale financing for recreational vehicles, watercraft, and residential and manufactured homes, the availability and costs of labor, inventory levels of retailers and manufacturers, the financial condition of our customers, retention and concentration of material customers, the ability to generate cash flow or obtain financing to fund growth, future growth rates in the Company's core businesses, the seasonality and cyclicality in the industries to which our products are sold, realization and impact of efficiency improvements and cost reductions, the successful integration of acquisitions and other growth initiatives, increases in interest rates and oil and gasoline prices, the ability to retain key management personnel, adverse weather conditions impacting retail sales, our ability to remain in compliance with our credit agreement covenants, the impact of the COVID-19 pandemic on the economy, our end markets and our operations, and national and regional economic, market and political conditions. You should consider forward-looking statements, therefore, in light of various important factors, including those set forth in the reports and documents that the Company files with the SEC, including this Annual Report on Form 10-K for the year ended December 31, 2021.
Any projections of financial performance or statements concerning expectations as to future developments should not be construed in any manner as a guarantee that such results or developments will, in fact, occur. There can be no assurance that any forward-looking statement will be realized or that actual results will not be materially different from that set forth in such forward-looking statement. The Company does not undertake to publicly update or revise any forward-looking statements. See Part I, Item 1A “Risk Factors” below for further discussion.
3
PART I
ITEM 1. BUSINESS
Unless the context otherwise requires, the terms “Company,” “Patrick,” “we,” “our,” or “us” refer to Patrick Industries, Inc. and its subsidiaries.
Company Overview
Patrick is a leading component solutions provider for the recreational vehicle ("RV"), marine, manufactured housing (MH") and various industrial markets – including single and multi-family housing, hospitality, institutional and commercial markets.
The Company operates through a nationwide network that includes, as of December 31, 2021, 174 manufacturing plants and 64 warehouse and distribution facilities located in 23 states, with a small presence in China and Canada. The Company operates within two reportable segments, Manufacturing and Distribution, through a nationwide network of manufacturing and distribution centers for its products, thereby reducing in-transit delivery time and cost to the regional manufacturing footprint of its customers. The Manufacturing and Distribution segments accounted for 72% and 28%, respectively, of the Company’s consolidated net sales for 2021. Financial information about these operating segments is included in Note 18 of the Notes to Consolidated Financial Statements included in this Annual Report on Form 10-K (the "Form 10-K") and incorporated herein by reference.
The Company’s strategic and capital allocation strategy is to optimally manage and utilize its resources and leverage its platform of operating brands to continue to grow and reinvest in its business. Through strategic acquisitions, expansion both geographically and into new product lines and investment in infrastructure and capital expenditures, Patrick seeks to ensure that its operating network contains capacity, technology and innovative thought processes to support anticipated growth needs, effectively respond to changes in market conditions, inventory and sales levels, and successfully integrate manufacturing, distribution and administrative functions.
Over the last three years, we have executed on a number of new product initiatives and invested approximately $880 million in acquisitions that directly complement our core competencies and existing product lines as well as expand our presence in our primary end markets.
The Company was incorporated in 1959 in Indiana. The Company's principal executive and administrative offices are located at 107 West Franklin Street, Elkhart, Indiana 46515 and the telephone number is (574) 294-7511; Internet website address: www.patrickind.com. The information on Patrick's website is not incorporated by reference into this Form 10-K. The Company makes available free of charge through the website its Annual Report on Form 10-K, Quarterly Reports on Form 10-Q, Current Reports on Form 8-K and all amendments to those reports filed with the SEC as soon as reasonably practicable after such material is electronically filed with or furnished to the SEC.
4
Major Product Lines
Patrick manufactures and distributes a variety of products within its reportable segments including:
| Manufacturing | Distribution | ||||
| Laminated products for furniture, shelving, walls and countertops | Pre-finished wall and ceiling panels | ||||
| Decorative vinyl, wrapped vinyl, paper laminated panels and vinyl printing | Drywall and drywall finishing products | ||||
| Solid surface, granite and quartz countertops | Interior and exterior lighting products | ||||
| Fabricated aluminum products | Wiring, electrical and plumbing products | ||||
| Wrapped vinyl, paper and hardwood profile mouldings | Transportation and logistics services | ||||
| Electrical systems components including instrument and dash panels | Electronics and audio systems components | ||||
| Slide-out trim and fascia | Cement siding | ||||
| Cabinet products, doors, components and custom cabinetry | Raw and processed lumber | ||||
| Hardwood furniture | Fiber reinforced polyester (“FRP”) products | ||||
| Fiberglass bath fixtures and tile systems | Interior passage doors | ||||
| Specialty bath and closet building products | Roofing products | ||||
| Boat covers, towers, tops, trailers, and frames | Laminate and ceramic flooring | ||||
| Softwoods lumber | Shower doors | ||||
| Interior passage doors | Fireplaces and surrounds | ||||
| Wiring and wire harnesses | Appliances | ||||
| CNC molds and composite parts | Tile | ||||
| Aluminum and plastic fuel tanks | Marine hardware and accessories | ||||
| Slotwall panels and components | Other miscellaneous products | ||||
| RV painting | |||||
| Thermoformed shower surrounds | |||||
| Fiberglass and plastic components including front and rear caps and marine helms | |||||
| Polymer-based and other flooring | |||||
| Air handling products | |||||
| Marine hardware and accessories | |||||
| Treated, untreated and laminated plywood | |||||
| RV and marine furniture | |||||
| Adhesives and sealants | |||||
| Audio systems and accessories, including amplifiers, tower speakers, soundbars, and subwoofers | |||||
| Marine non-slip foam flooring, padding, and accessories | |||||
| Other miscellaneous products | |||||
5
Primary Markets
Patrick manufactures and distributes its products for four primary end markets. Our operating facilities generally are strategically located in proximity to the customers they serve. The Company’s sales by market are as follows:
| 2021 | 2020 | |||||||||||||
| RV | 59 | % | 56 | % | ||||||||||
| Marine | 16 | % | 14 | % | ||||||||||
| MH | 14 | % | 17 | % | ||||||||||
| Industrial | 11 | % | 13 | % | ||||||||||
| Total | 100 | % | 100 | % | ||||||||||
Recreational Vehicles
The Company’s RV products are sold primarily to major manufacturers of RVs, smaller OEMs, and to a lesser extent, manufacturers in adjacent industries. The principal types of recreational vehicles include (1) towables: conventional travel trailers, fifth wheels, folding camping trailers, and truck campers; and (2) motorized: class A (large motor homes), class B (van campers), and class C (small-to-mid size motor homes). The RV market is primarily dominated by Thor Industries, Inc. (“Thor”), Forest River, Inc. (“Forest River”) and Winnebago Industries, Inc. ("Winnebago") which combined held approximately 89% of retail market share for towables and 86% for motorized units for 2021 as reported per Statistical Surveys, Inc. ("SSI").
In the late first quarter and early second quarter of 2020, we temporarily curtailed production at certain of our facilities in alignment with the temporary production shutdowns by our RV OEM customers in response to the COVID-19 pandemic. In the second half of 2020, OEM production improved sharply in response to a strong increase in retail and wholesale demand for RV units, and our sales to our RV OEM customers correspondingly improved. These strong demand trends continued in 2021, with wholesale industry unit shipments increasing by 39% according to the Recreational Vehicle Industry Association (the “RVIA”), while RV retail unit sales increased by 8% according to SSI.
We estimate that our mix of RV revenues related to towable units and motorized units is consistent with the overall RV industry production mix. In 2021, according to the RVIA, towable and motorized unit shipments represented approximately 91% and 9%, respectively, of total RV industry wholesale shipments with wholesale unit shipments increasing 40% in the towable sector and 38% in the motorized sector in 2021 compared to the prior year.
Recreational vehicle purchases are generally consumer discretionary income purchases, and therefore, any situation which causes concerns related to discretionary income can have a negative impact on this market. The Company believes that industry-wide retail sales and the related production levels of RVs will continue to be dependent on the overall strength of the economy, consumer confidence levels, equity securities market trends, fluctuations in dealer inventories, the level of disposable income, and other demographic trends.
Demographic and ownership trends continue to point to favorable market growth in the long term in the recreational vehicle market, as there is a shift toward outdoor, nature-based tourism activities, with a large segment of the population’s “millennials” and "Gen Xers" embracing this outdoor lifestyle and entering into the RV marketplace as well as an increasing percentage of new campers from more diverse groups. At the same time, the COVID-19 pandemic has contributed to increased consumer interest in the RV lifestyle. According to the 2021 KOA North American Camping Report, based on surveys of North American leisure travelers, camping trips and road trips are viewed as the safest forms of travel activities in the current COVID-19 environment, and spending time outdoors with family is the leading motivating factor to return to traveling among leisure travelers and campers.
Detailed narrative information about the Company’s sales to the RV industry is included in Item 7. “Management’s Discussion and Analysis of Financial Condition and Results of Operations” (the "MD&A") of this Form 10-K.
Marine
The marine industry reflects the active, outdoor leisure-based, family-oriented lifestyle and the Company has increased its focus and expanded its presence in this market through recent acquisitions, particularly within the last two years. Consumer demand in the marine market is generally driven by the popularity of the recreational and leisure lifestyle and by economic conditions. Similar to our RV market, the marine industry was impacted by COVID-19 disruptions in 2020 with our plants experiencing temporary shutdowns in the late first quarter and early second quarter of 2020, which were then followed by
6
sharp increases in marine demand in the second half of 2020, which we believe is driven in part by an increased interest in outdoor activities, including marine activities, as a result of the COVID-19 pandemic and its impact on leisure preferences that continued into 2021.
According to the National Marine Manufacturers Association ("NMMA"), per its 2020 U.S. Recreational Boating Statistical Abstract (the "Abstract"), total U.S. retail expenditures on boats, engines, accessories, and related costs totaled approximately $49.4 billion in 2020, up approximately 14% from 2019 as stated in the Abstract. The average age of pre-owned boats currently in use is approximately 21 years compared to an average useful life of 30 years.
The Company’s sales to the marine industry are primarily focused on the powerboat sector of the market which is comprised of four main categories: fiberglass, aluminum fishing, pontoon and ski & wake. Based on current available data per SSI through December 2021, within the powerboat sector for 2021, fiberglass units accounted for approximately 38% of retail unit sales, aluminum 26%, pontoon 30% and ski & wake 6%. Based on current available data per SSI through December 2021, marine powerboat retail unit shipments decreased approximately 9% in 2021 compared to 2020, while marine wholesale unit shipments increased approximately 11% in 2021 compared to 2020. Additional information about the Company’s sales to the marine industry is included in the MD&A of this Form 10-K.
Manufactured Housing
The Company’s manufactured housing products are sold primarily to major manufacturers of manufactured homes, other OEMs, and to a lesser extent, to manufacturers in adjacent industries. In the aggregate, the top three manufacturers produced approximately 78% of MH market retail unit shipments in 2021 per SSI.
Although wholesale unit shipments have increased in the MH industry from a low of approximately 49,800 units in 2009 to 105,800 units in 2021, they are still trending well below historical levels. The Company believes there is upside potential for this market in the long term driven by pent-up demand, multi-family housing capacity, improving consumer credit and financing conditions, residential housing market conditions, higher consumer confidence levels, increased affordability and quality, demographic trends such as first-time home buyers and urban-to-suburban trends, new home pricing, and improved consumer savings levels.
Factors that may favorably impact production levels further in this industry include improving quality credit standards in the residential housing market, new jobs growth, consumer confidence, favorable changes in financing regulations, a narrowing in the difference between interest rates on MH loans and mortgages on traditional residential "stick-built" housing, and any improvement in conditions in the asset-backed securities markets for manufactured housing loans.
The MH industry was impacted by disruptions related to the COVID-19 pandemic in 2020, which resulted in plant shutdowns in the late first quarter and early second quarter of 2020, followed by a recovery that, compared to our RV and marine end markets, emerged more slowly as a result of MH OEM labor and supply disruptions that did not begin to subside until late 2020. This recovery continued into 2021 with growing demand despite continued supply disruptions.
In addition, MH loan program initiatives by Fannie Mae are expected to increase MH loan availability and reduce the total cost of MH borrowing, with a potential resulting increase in MH demand.
Additional information about the Company’s sales to the MH industry is included in the MD&A of this Form 10-K.
Industrial Markets
We estimate that approximately 65% of our industrial net sales in 2021 were associated with the U.S. residential housing market. We believe that there is a direct correlation between the demand for our products in this market and new residential housing construction and remodeling activities. Patrick's sales to the industrial market generally lag new housing starts by four to six months as our industrial products are generally among the last components installed in new unit construction and will vary based on differences in regional economic prospects.
Many of Patrick's core manufacturing products are also utilized in the kitchen cabinet, high-rise, office and household furniture, hospitality, and fixtures and commercial furnishings markets. These markets are generally categorized by a more performance-than-price driven customer base, and provide an opportunity for the Company to diversify its customer base. Additionally, other residential and commercial segments have been less vulnerable to import competition, and therefore, provide opportunities for increased sales penetration and market share gains. Over the past three years, the residential housing
7
market in particular has benefited from a low interest rate environment and tight housing market conditions across the country, and that trend is expected to continue in 2022.
Additional information about the Company’s sales to the industrial markets is included in the MD&A of this Form 10-K.
Strategic Acquisitions
The Company is focused on driving growth in its primary markets through the acquisition of companies with strong management teams having a strategic fit with Patrick’s core values, business model and customer presence, as well as additional product lines, facilities, or other assets to complement or expand its existing businesses. The Company may explore strategic acquisition opportunities that are not directly tied to the four primary markets it serves in order to further leverage its core competencies in manufacturing and distribution and to diversify its end market exposure and presence.
In 2021, the Company invested approximately $520 million in acquisitions and over the last three years has completed approximately $880 million of acquisitions. See Note 4 of the Notes to Consolidated Financial Statements included elsewhere in this Form 10-K for further discussion of acquisitions completed by the Company in 2021, 2020 and 2019.
Competition
The RV, marine, MH and industrial markets are highly competitive, both among manufacturers and the suppliers of various components. The barriers to entry for each industry are generally low and include compliance with industry standards, codes and safety requirements, and the initial capital investment required to establish manufacturing operations. In addition, the Company competes with manufacturers of manufactured homes with vertically integrated operations. Across the Company’s range of products and services, competition exists primarily on price, product features and innovation, timely and reliable delivery, quality and customer service. Several competitors compete with Patrick in each product line on a regional and local basis. However, in order for a competitor to compete with Patrick on a national basis, the Company believes that a substantial capital commitment and investment in personnel and facilities would be required.
Capacity and Plant Expansions
Patrick has the ability to fulfill demand for certain products in excess of capacity at certain facilities by shifting production to other facilities. Capital expenditures for 2021 consisted of $64.8 million of investments primarily to provide more advanced manufacturing automation, replace and upgrade production equipment, expand facilities outside of core Midwest markets to align with OEM expansions, and increase capacity to meet consumer needs and trends. Management regularly monitors capacity at its facilities and reallocates existing resources where needed to maintain production efficiencies throughout all of its operations and capitalize on commercial and industrial synergies in key regions to support profitable growth, grow its customer base, and expand its geographical product reach outside its core Midwest market.
Branding
New product development is a key component of the Company’s efforts to grow its market share and revenue base, adapt to changing market conditions, and proactively address customer demand. The Company has expanded its product and service offerings with the integration of new and innovative product lines into its operations that bring additional value to customers and create additional scale advantages.
The Studio
The Company's Design/Innovation Center and Showroom, The Studio, is located in Elkhart, Indiana. The Studio presents the latest design trends and products in the markets served by Patrick, and provides a creative environment for customers to design products and enhance their brand. The 45,000 square foot facility includes a 25,000 square foot showroom devoted to the display of products, capabilities and services offered by each of Patrick’s business units, in addition to offices and conference rooms. The Company’s specialized team of designers, engineers and graphic artists works with RV, marine, MH and industrial customers to meet their creative design and product needs, including creating new styles and utilizing new colors, patterns, products, and materials for panels and mouldings, cabinet doors, furniture, lighting and other products. Other services provided at The Studio include product development, 3D CAD illustration, 3D printing, photography and marketing.
8
Marine Studio
The Company's Marine Studio, which was opened in February 2020 and is located in Sarasota, Florida, is a comprehensive marine studio showroom, design and engineering center, which provides engineering and integrated design solutions for our marine customers. The 14,000 square foot facility includes a showroom that displays the Company's marine products as well as the marine design and engineering capabilities and services offered by our marine businesses.
Operating Brands
Through its operating brands, the Company provides customers with specific product knowledge, expertise and support that are tailored to their needs. The Company strives to be the supplier of choice for its customers by elevating the customer purchasing experience with expert product line managers, and support staff and strategic partnerships for each operating brand, which help drive efficiency and maximize value for its customers.
Patrick has no material licenses, franchises, or concessions and does not conduct material research and development activities.
Marketing and Distribution
As of December 31, 2021, the Company had over 3,700 active customers. Its revenues from the RV market include sales to two major manufacturers of RVs that each account for over 10% of the Company's net sales, Forest River and Thor. Both Forest River and Thor have multiple businesses and brands that operate independently under the parent company and these multiple businesses and brands generally purchase our products independently from one another. The Company’s sales to the various businesses of Forest River and Thor, on a combined basis, accounted for 42%, 39% and 40% of our consolidated net sales, for the years ended December 31, 2021, 2020 and 2019, respectively.
The Company generally maintains supplies of various commodity products in its warehouses to ensure that it has product on hand at all times for its distribution customers. The Company purchases a majority of its distribution segment products in railcar, container, or truckload quantities, which are warehoused prior to their sale to customers. Approximately 8%, 12%, and 12% of the Company's distribution segment’s sales were from products shipped directly from the suppliers to Patrick customers in 2021, 2020, 2019, respectively. Typically, there is a two to four-week period between Patrick receiving a purchase order and the delivery of products to its warehouses or customers and, as a result, the Company has no material backlog of orders. However, this can fluctuate depending on overall market factors and each specific end market we serve. In periods of declining market conditions, customer order rates can decline, resulting in less efficient logistics planning and fulfillment and thus increasing delivery costs due to increased numbers of shipments with fewer products in each shipment.
Raw Materials
Patrick has arrangements with certain suppliers that specify exclusivity in certain geographic areas, pricing structures and rebate agreements among other terms.
Raw materials are primarily commodity products, such as lauan, gypsum, particleboard and other softwood and hardwood lumber products, aluminum, copper, plastic resin, fiberglass and overlays, among others which are available from many suppliers. Our customers do not maintain long-term supply contracts, and therefore, the Company bears the risk of accurate forecasting of customer orders. Our sales in the short-term could be negatively impacted in the event any unforeseen negative circumstances were to affect our major suppliers. In addition, demand changes in certain market sectors can result in fluctuating costs of certain more commodity-oriented raw materials and other products that are utilized and distributed.
As a result of COVID-19 and other factors, the supply chain has been impacted by increasing commodity prices as well as increasing lead times and transportation costs, which has resulted in increased raw material pricing from several of our suppliers. Patrick has taken steps to mitigate these supply chain constraints by carrying increased levels of inventory and partnering with suppliers to help secure adequate supplies of materials. Additionally, the Company continually explores alternative sources of raw materials and components, both domestically and from outside the U.S. Alternate sources of supply are available for all of its material purchases.
9
Regulation and Environmental Quality
The Company’s operations are subject to environmental laws and regulations administered by federal, state, and local regulatory authorities including requirements relating to air, water, land and noise pollution. Additionally, these requirements regulate the Company's use, storage, discharge and disposal of hazardous chemicals used or generated during specific manufacturing processes.
Select products are subject to various legally binding or voluntary standards. For example, the composite wood substrate materials that Patrick utilizes in the production process in the RV marketplace have been certified as to compliance with applicable emission standards developed by the California Air Resources Board (“CARB”). All suppliers and manufacturers of composite wood materials are required to comply with the current CARB regulations.
The Company is certified to sell Forestry Stewardship Council (“FSC”) materials to its customers at certain of its manufacturing branches. The FSC certification provides a link between responsible production and consumption of materials from the world’s forests and assists the Company’s customers in making socially and environmentally responsible buying decisions on the products they purchase. Upholstered products and mattresses provided by the Company for RVs must comply with Federal Motor Vehicle Safety Standards regulated by the National Highway Traffic Safety Administration regarding flammability.
The Company also produces and provides products for manufactured homes that must comply with performance and construction regulations promulgated by the U.S. Department of Housing and Urban Development (“HUD”).
Seasonality
Manufacturing operations in the RV, marine and MH industries historically have been seasonal and at their highest levels when the weather is moderate. Accordingly, the Company’s sales and profits had generally been the highest in the second quarter and lowest in the fourth quarter. Seasonal industry trends in the past several years have included the impact related to the addition of major RV manufacturer open houses for dealers in the August-September timeframe and marine open houses in the December-February timeframe, resulting in dealers delaying certain restocking purchases until new product lines are introduced at these shows. In addition, recent seasonal industry trends have been, and future trends may be, different than in prior years due to the impact of COVID-19, volatile economic conditions, interest rates, access to financing, cost of fuel, national and regional economic conditions and consumer confidence on retail sales of RVs and marine units and other products for which the Company sells its components, as well as fluctuations in RV and marine dealer inventories, increased volatility in demand from RV and marine dealers, the timing of dealer orders, and from time to time, the impact of severe weather conditions on the timing of industry-wide wholesale shipments.
Human Capital Management
Our people are the heart of our business, and we allocate substantial resources to foster the well-being, success and growth of our team members in an inclusive and diverse environment which we believe is fundamental to our values and our service to our customers. At December 31, 2021, our team members totaled approximately 11,000, of which 85% are hourly team members who serve our customers by producing and distributing products in our RV, marine, MH and industrial end markets, and 15% who are salaried employees who manage the resources, capital allocations, business decisions, and customer relationships of our end markets.
The majority of our team members work in our facilities to produce or distribute products for our customers. Our investment in human capital resources focuses on this environment to ensure their well-being and success. Our primary commitment to our team members in the production environment is to their safety, well-being and progress, and in this regard our human capital management programs focus on the following, in addition to our health care insurance and other employment benefits:
•Free assistance programs available to all team members and their families to address mental health and others matters which arise, which we believe are essential during the unique pressures and uncertainties during the COVID-19 pandemic;
•Tuition reimbursement programs available to all team members as they pursue educational opportunities;
•Leadership programs available to all employees that are designed to foster leadership and communication skills to advance team members to the next stage of their careers;
10
•Job safety analysis, which identifies risks unique to each production environment, training and empowering our team members to mitigate risks and develop workplace best practices;
•OSHA preparedness, which involves site specific training development to educate and enable our team members to work safely and effectively;
•Industrial hygiene audits and testing, ensuring that our team members work in healthy environments with respect to air quality and noise reduction;
•Machine guarding and work area audits, which identify mechanical and non-mechanical improvements in the safety and well-being of the production environment;
•Train-the-trainer programs, which foster best-practice operational techniques for our team members to advance their capabilities to operate our facilities in the safest and most effective manner;
•Site-specific training development, which tailors customized training and consulting to the unique needs of the production environment;
•Ergonomic assessments for all team members, which accommodate each individual to work in the most effective and comfortable manner;
•Patrick Connect, our social media platform to share ongoing events, communicate leadership messages, share success stories, and provide a platform of mutual communication; and
•Community involvement initiatives, such as our participation in Military Makeover and Care Camps, which provides our team members opportunities to give back to the communities in which we do business.
Our success is dependent on our ability to hire, retain, and engage highly qualified team members who serve our customers. In this regard, we aspire to be a merit-based organization that is inclusive and diverse, building a culture where our team members feel they belong. Our leadership development programs bring a diverse and energetic source of talent to lead the future of our organization, and our recruitment efforts strive to foster an inclusive culture that we believe strengthens our organization and our ability to serve our customers.
The organization is built on our six core foundational values of being BETTER Together:
•Balance - We work to build a healthy work environment that encourages excellence, happiness, and peace in both our work and our home life.
•Excellence - We strive to meet the highest possible standards of achievement in our work and our relationships.
•Trust - We do what we say we will do every time - and communicate with all stakeholders if a commitment evolves.
•Teamwork - We challenge, encourage, equip, empower, and inspire the individuals we work with.
•Empowerment - We give our team the information, tools, and trust they need to grow as leaders and achieve results.
•Respect - We treat our teammates and partners with the utmost honor and dignity.
11
Executive Officers of the Company
The following table sets forth our executive officers as of January 1, 2022:
| Officer | Position | Age | ||||||||||||
| Todd M. Cleveland | Executive Chairman of the Board | 53 | ||||||||||||
| Andy L. Nemeth | Chief Executive Officer | 52 | ||||||||||||
| Jeffrey M. Rodino | President | 51 | ||||||||||||
| Kip B. Ellis | Executive Vice President-Operations and Chief Operating Officer | 47 | ||||||||||||
| Jacob R. Petkovich | Executive Vice President-Finance, Chief Financial Officer, and Treasurer | 48 | ||||||||||||
| Joel D. Duthie | Executive Vice President-Chief Legal Officer and Secretary | 47 | ||||||||||||
Todd M. Cleveland was appointed Executive Chairman of the Board of the Company in January 2020. Prior to that, Mr. Cleveland was Chairman of the Board from May 2018 to December 2019 and Chief Executive Officer from February 2009 until December 2019. Mr. Cleveland was President of the Company from May 2008 to December 2015, and Chief Operating Officer from May 2008 to March 2013. Prior to that, Mr. Cleveland served as Executive Vice President of Operations and Sales and Chief Operating Officer from August 2007 to May 2008 following the acquisition of Adorn Holdings, Inc. by Patrick in May 2007. Mr. Cleveland has over 31 years of manufactured housing, recreational vehicle, marine and industrial experience in various leadership capacities.
Andy L. Nemeth was appointed Chief Executive Officer of the Company in January 2020. Mr. Nemeth previously served as President of the Company from January 2016 to July 2021, Executive Vice President of Finance and Chief Financial Officer from May 2004 to December 2015, and Secretary-Treasurer from 2002 to 2015. Mr. Nemeth has over 30 years of manufactured housing, recreational vehicle, marine and industrial experience in various financial and managerial capacities.
Jeffrey M. Rodino was appointed President of the Company in July 2021 and was Chief Sales Officer of the Company from September 2016 to July 2021. Mr. Rodino served as the Executive Vice President of Sales from December 2011 to July 2021. Prior to that, he was the Chief Operating Officer of the Company from March 2013 to September 2016, and Vice President of Sales for the Midwest from August 2009 to December 2011. Mr. Rodino has over 28 years of experience in serving the recreational vehicle, manufactured housing, marine and industrial markets.
Kip B. Ellis was appointed Executive Vice President of Operations and Chief Operating Officer of the Company in September 2016. He was elected an officer in September 2016. Mr. Ellis joined the Company as Vice President of Market Development in April 2016. Prior to his role at Patrick, Mr. Ellis served as Vice President of Aftermarket Sales for the Dometic Group from 2015 to 2016. Prior to his tenure at Dometic, Mr. Ellis served as Vice President of Global Sales and Marketing from 2007 to 2015 at Atwood Mobile Products. Mr. Ellis has over 25 years of experience serving the recreational vehicle, marine, manufactured housing, industrial and automotive markets.
Jacob R. Petkovich was appointed as Executive Vice President of Finance, Chief Financial Officer, and Treasurer of the Company in November 2020. Prior to joining Patrick, Mr. Petkovich served as Managing Director in the Leveraged Finance Group of Wells Fargo Securities and predecessor Wachovia Securities from 2004 to 2020, performing in various senior leadership roles responsible for leading, underwriting, structuring and arranging financing solutions to support issuers’ access to the capital markets for acquisition financings, recapitalizations, refinancings and restructurings.
Joel D. Duthie was appointed as Executive Vice President, Chief Legal Officer and Secretary in May 2021. Mr. Duthie joined the Company as General Counsel in November 2020. Prior to joining Patrick, Mr. Duthie was a partner with Barnes & Thornburg LLP, and practiced law at the firm from 2000 to 2002 and 2007 to 2020. As a corporate lawyer, Mr. Duthie focused on mergers and acquisitions, supply chain management and commercial contract counseling. Mr. Duthie served as an assistant general counsel for a privately-held manufacturer of flow control products from 2002 to 2006.
12
Website Access to Company Reports
We make available free of charge through our website, www.patrickind.com, our Annual Report on Form 10-K, quarterly reports on Form 10-Q, current reports on Form 8-K, and all amendments to those reports as soon as reasonably practicable after such material is electronically filed with or furnished to the SEC. The charters of our Audit, Compensation, and Corporate Governance and Nominations Committees, our Corporate Governance Guidelines and our Code of Ethics and Business Conduct are also available on the “Corporate Governance” portion of our website. Our website and the information contained therein or incorporated therein are not intended to be incorporated into this Annual Report on Form 10-K.
ITEM 1A. RISK FACTORS
In addition to the other information set forth in this report, you should carefully consider the following factors which could materially affect our business, financial condition or results of operations. The risks described below are not the only risks we face. Additional factors not presently known to us or that we currently deem to be immaterial also may materially adversely affect our business, cash flows, financial condition or results of operations in future periods.
COVID-19 Risks
The global spread of the COVID-19 virus, its related variants, and measures implemented to combat them have previously had, and could potentially have, a material adverse effect on our business in the future.
The global spread of the novel coronavirus (COVID-19) in 2020 and 2021 has negatively impacted the global economy, disrupted global supply chains and created material volatility and disruption in financial markets. The impact of this pandemic has created material uncertainty in the global economy. The impact of COVID-19 on our end markets was experienced primarily in the last two weeks of the first quarter of 2020 and in the first six weeks of the second quarter of 2020 as certain of our OEM customers implemented plant shutdowns in response to the COVID-19 pandemic. While our end markets appear to have resumed business operations that are similar to pre-COVID activities in the second half of 2020 and through 2021, our OEM customers continue to experience labor and supply chain disruptions related to the pandemic. Uncertainties related to the impact of COVID-19 could in the future have a material adverse effect on our business, employees, suppliers, OEM customers and our end markets in general. The duration and magnitude of the impact of the COVID-19 pandemic cannot be precisely estimated at this time, as each is affected by a number of factors, many of which are outside of our control. As a result of the COVID-19 pandemic and potential future pandemic outbreaks, we face material risks including, but not limited to:
•Decreases in consumer confidence and disposable income and increases in unemployment could reduce demand for our products by our customers in all of our end markets.
•Tightening credit standards could negatively impact credit availability to consumers which could have an adverse effect on all of our end markets.
•Supply chain and shipping interruptions and constraints, volatility in demand for our products caused by sudden and material changes in production levels by our customers or other restrictions affecting our business could adversely impact our planning and forecasting, our revenues and our operations.
•Disruptions in our manufacturing and supply arrangements caused by the loss or disruption of essential manufacturing and supply elements such as raw materials or other finished product components, transportation, workforce, or other manufacturing and distribution capabilities could result in shortages of materials, inflationary pressures, and our inability to meet our end market customer needs and achieve cost targets.
•Material changes in the conditions in markets in which we manufacture, sell or distribute our products, including additional or expanded quarantines or "stay at home" orders, governmental or regulatory actions, closures or other restrictions that further limit or close our operating and manufacturing facilities, restrict our employees’ ability to travel or perform necessary business functions, restrict or prevent consumers from having access to our products, or otherwise prevent our suppliers or customers from sufficiently staffing operations, could adversely impact operations necessary for the production, distribution, sale, and support of our products.
•Failure of third parties on which we rely, including our customers, suppliers, distributors, commercial banks, and other external business partners, to meet their obligations to the Company or to timely meet those obligations, or
13
material disruptions in their ability to do so, which may be caused by their own financial or operational difficulties, may adversely impact our operations.
•Certain of our customers may experience financial difficulties, including bankruptcy or insolvency, as a result of the impact of COVID-19. If any of our customers suffer material financial difficulties, they may be unable to pay amounts due to us fully, partially, or timely. Further, we may have to negotiate material discounts and/or extended financing terms with these customers in such a situation. If we are unable to collect our accounts receivable as they come due, our financial condition, results of operations and cash flows may be materially and adversely affected.
•If we are unable to maintain normal operations, or subsequently are unable to resume normal operations in a timely fashion, our cash flows could be adversely affected, making it difficult to maintain adequate liquidity or meet debt covenants. As a result, the Company may be required to pursue additional sources of financing to meet our financial obligations and fund our operations and obtaining such financing is not guaranteed and is largely dependent upon market conditions and other factors.
•Disruptions to our operations related to COVID-19 as a result of absenteeism by infected or ill members of management or other employees, or absenteeism by members of management and other employees who elect not to come to work due to the illness affecting others at our facilities, or due to quarantines.
•The COVID-19 pandemic has led to and could continue to lead to severe disruption and volatility in the United States and global capital markets, which could increase our cost of capital and adversely affect our ability to access the capital markets in the future. In addition, trading prices in the public equity markets, including prices of our common stock, have been highly volatile as a result of the COVID-19 pandemic.
•Sustained adverse impacts to the Company, certain suppliers, and customers may also affect the Company’s future valuation of certain assets and therefore may increase the likelihood of an impairment charge, write-off, or reserve associated with such assets, including goodwill, indefinite and finite-lived intangible assets, property and equipment, inventories, accounts receivable, tax assets, and other assets.
•Increasing raw material and labor costs relating to the pandemic may also affect our profitability.
The ultimate impact of the COVID-19 pandemic on our business, results of operations, financial condition and cash flows is highly uncertain and cannot be accurately predicted and is dependent on future developments, including the duration of the pandemic and the length of its impact on the global economy, as well as any new information that may emerge concerning the COVID-19 pandemic and the actions taken to contain it or mitigate its impact. The continued impact on our business as a result of the COVID-19 pandemic could materially adversely affect our business, results of operations, financial condition, cash flows, prospects and the trading prices of our securities in 2021 and beyond.
Risks Related to our Business
Economic and business conditions beyond Patrick's control, including cyclicality and seasonality in the industries it sells products, could lead to fluctuations in and negatively impact operating results.
The RV, MH, marine and industrial markets in which we operate are subject to cycles of growth and contraction in consumer demand, and volatility in production levels, shipments, sales and operating results, due to external factors such as general economic conditions, consumer confidence, employment rates, financing availability, interest rates, inflation, fuel prices, and other economic conditions affecting consumer demand and discretionary spending. Periods of economic recession and downturns have adversely affected our business and operating results in the past, and have potential to adversely impact our future results. Consequently, the results for any prior period may not be indicative of results for any future period. In addition, fluctuation in demand could adversely affect our management of inventory, which could lead to an inability to meet customer needs or a charge for obsolete inventory.
14
Manufacturing operations in the RV, marine and MH industries historically have been seasonal and at their highest levels when the weather is moderate. Accordingly, the Company’s sales and profits had generally been the highest in the second quarter and lowest in the fourth quarter. Seasonal industry trends in the past several years have included the impact related to the addition of major RV manufacturer open houses for dealers in the August-September timeframe and marine open houses in the December-February timeframe, resulting in dealers delaying certain restocking purchases until new product lines are introduced at these shows. In addition, recent seasonal industry trends have been, and future trends may be, different than in prior years due to the impact of COVID-19, volatile economic conditions, interest rates, access to financing, cost of fuel, national and regional economic conditions and consumer confidence on retail sales of RVs and marine units and other products for which the Company sells its components, as well as fluctuations in RV and marine dealer inventories, increased volatility in demand from RV and marine dealers, the timing of dealer orders, and from time to time, the impact of severe weather conditions on the timing of industry-wide wholesale shipments.
If the financial condition of our customers and suppliers deteriorates, our business and operating results could suffer.
The markets we serve have been highly sensitive to changes in the economic environment. Weakening conditions in the economy, or the lack of available financing in the credit market, could cause the financial condition of our customers and suppliers to deteriorate, which could negatively affect our business through the loss of sales or the inability to meet our commitments. Many of our customers participate in highly competitive markets and their financial condition may deteriorate as a result. In addition, a decline in the financial condition of our customers could hinder our ability to collect amounts owed by customers.
Our sales are materially concentrated with two customers, the loss of either of which could have a material adverse impact on our operating results and financial condition.
Two customers in the RV market accounted for a combined 42% of our consolidated net sales in 2021. The loss of either of these customers could have a material adverse impact on our operating results and financial condition. We do not have long-term agreements with our customers and cannot predict that we will maintain our current relationships with these customers or that we will continue to supply them at current levels.
Changes in consumer preferences relating to our products could adversely impact our sales levels and our operating results.
Changes in consumer preferences, or our inability to anticipate changes in consumer preferences for RVs, marine models or manufactured homes, or for the products we make could reduce demand for our products and adversely affect our operating results and financial condition.
A material percentage of the Company’s sales are concentrated in the RV industry, and declines in the level of RV unit shipments or reductions in industry growth could reduce demand for our products and adversely impact our operating results and financial condition.
In 2021 and 2020, the Company's net sales to the RV industry were approximately 59% and 56%, respectively, of consolidated net sales. While the Company measures its RV segment sales against industry-wide wholesale shipment statistics, the underlying health of the RV industry is determined by retail demand. Retail sales of RVs historically have been closely tied to general economic conditions and consumer confidence. Declines in RV unit shipment levels or reductions in industry growth could materially reduce the Company’s revenue from the RV industry and have a material adverse impact on its operating results in 2022 and other future periods.
The RV, MH, marine and industrial industries are highly competitive and some of our competitors may have greater resources than we do.
We operate in a highly competitive business environment and our sales could be negatively impacted by our inability to maintain or increase prices, changes in regional demand or product mix, or the decision of our customers to purchase our competitors’ products or to produce in-house products that we currently produce. We compete not only with other suppliers to the RV, MH, marine and industrial producers, but also with suppliers to traditional site-built homebuilders and suppliers of cabinetry and countertops. Sales could also be affected by pricing, purchasing, financing, advertising, operational, promotional, or other decisions made by purchasers of our products. Additionally, we cannot control the decisions made by
15
suppliers of our distributed and manufactured products and therefore, our ability to maintain our distribution arrangements may be adversely impacted.
Some of our competitors have greater financial resources or lower levels of debt or financial leverage and this may enable them to commit larger amounts of capital in response to changing market conditions. Further, competitors may develop innovative new products that could put the Company at a competitive disadvantage. If we are unable to compete successfully against other manufacturers and suppliers to the RV, marine and MH industries as well as to the industrial markets we serve, we could lose customers and sales could decline, or we may not be able to improve or maintain profit margins on sales to customers or be able to continue to compete successfully in our core markets.
Conditions in the credit market could limit the ability of consumers and wholesale customers to obtain retail and wholesale financing for RVs, manufactured homes, and marine products, resulting in reduced demand for our products.
Restrictions on the availability of consumer and wholesale financing for RVs, manufactured homes and marine products and increases in the costs of such financing have in the past limited, and could again limit, the ability of consumers and wholesale customers to purchase such products, which would result in reduced production by our customers, and therefore reduce demand for our products.
Loans used to finance the purchase of manufactured homes usually have shorter terms and higher interest rates, and are more difficult to obtain, than mortgages for site-built homes. Historically, lenders required a higher down payment, higher credit scores and other criteria for these loans. Current lending criteria are more stringent than historical criteria, and many potential buyers of manufactured homes may not qualify.
The availability, cost, and terms of these manufactured housing loans are also dependent on economic conditions, lending practices of financial institutions, government policies, and other factors, all of which are beyond our control. Reductions in the availability of financing for manufactured homes and increases in the costs of this financing have limited, and could continue to limit, the ability of consumers and wholesale customers to purchase manufactured homes, resulting in reduced production of manufactured homes by our customers, and therefore reduced demand for our products. In addition, certain provisions of the Dodd-Frank Act, which regulate financial transactions, could make certain types of loans more difficult to obtain, including those historically used to finance the purchase of manufactured homes.
The manufactured housing industry has experienced a material long-term decline in shipments, which has led to reduced demand for our products.
The MH industry, which accounted for 14% and 17% of the Company's consolidated net sales for 2021 and 2020, respectively, has experienced a material decline in production of new homes compared to the last peak production level in 1998. The downturn was caused, in part, by limited availability and high cost of financing for manufactured homes and was exacerbated by economic and political conditions during the 2008 financial crisis. Although industry-wide wholesale production of manufactured homes has improved somewhat in recent years, annual production remains well below historical averages and a worsening of conditions in the MH market could have a material adverse impact on our operating results.
Fuel shortages or high prices for fuel could have an adverse impact on our operations.
The products produced by the RV and marine industries typically require gasoline or diesel fuel for their operation, or the use of a vehicle requiring gasoline or diesel fuel for their operation. There can be no assurance that the supply of gasoline and diesel fuel will continue uninterrupted or that the price or tax on fuel will not materially increase in the future. Shortages of gasoline and diesel fuel, and substantial increases in the price of fuel, have had a material adverse effect on our business and the RV and marine industries as a whole in the past and could have a material adverse effect on our business in the future.
Our operating results can be adversely affected by inflation, changes in the cost or availability of raw materials, energy, transportation and other necessary supplies and services.
We are currently experiencing inflationary pressures on our operating costs. The prices of key raw materials, consisting primarily of lauan, gypsum, fiberglass, particleboard, aluminum, softwoods and hardwoods lumber, resin, and petroleum-based products, are influenced by supply and demand and other factors specific to these commodities as well as general inflationary pressures, including those driven by supply chain and logistical disruptions. Pricing and availability of finished goods, raw materials, energy, transportation and other necessary supplies and services for use in the Company’s businesses
16
can be volatile due to numerous factors beyond its control, including general, domestic and international economic conditions, natural disasters, labor costs, production levels, competition, consumer demand, import duties and tariffs, currency exchange rates, international treaties, and changes in laws, regulations, and related interpretations. Evolving trade policies could continue to make sourcing products from foreign countries difficult and costly, as the Company sources a significant amount of its products from outside of the United States. Prices of certain raw materials have historically been volatile and continued to fluctuate in 2021. During periods of volatile raw materials, energy and transportation costs, we have generally been able to pass both cost increases and decreases to our customers in the form of price adjustments, however, there can be no assurance future cost increases or decreases, if any, can be partially or fully passed on to customers, or that the timing of such sales price increases or decreases will match raw materials, energy and transportation costs increases or decreases. Sustained price increases may lead to declines in volume as competitors may not adjust their prices or customers may decide not to pay the higher prices, which could lead to sales declines and loss of market share. While we seek to project tradeoffs between price increases and volume, our projections may not accurately predict the volume impact of price increases. As a result, fluctuations in raw materials, energy and transportation costs could have a material adverse effect on the Company’s business, results of operations and financial condition.
If we cannot effectively manage the challenges and risks associated with doing business internationally, our revenues and profitability may suffer.
We purchase a material portion of our raw materials and other supplies from suppliers located in Indonesia, China, Malaysia and Canada. As a result, our ability to obtain raw materials and supplies on favorable terms and in a timely fashion are subject to a variety of risks, including fluctuations in foreign currencies, changes in the economic strength of the foreign countries in which we do business, difficulties in enforcing contractual obligations and intellectual property rights, compliance burdens associated with a wide variety of international and U.S. import laws, and social, political, and economic instability. Our business with our international suppliers could be adversely affected by restrictions on travel to and from any of the countries in which we do business due to a health epidemic or outbreak, such as the COVID-19 pandemic, or other event. Additional risks associated with our foreign business include restrictive trade policies, imposition of duties, taxes, or government royalties by foreign governments, and compliance with the Foreign Corrupt Practices Act and local anti-bribery laws. Any measures, or proposals to implement such measures, could negatively impact our relations with our international suppliers and the volume of shipments to the U.S. from these countries, which could have a materially adverse effect on our business and operating results. We maintain limited operations in Canada and China but are nevertheless exposed to risks of operating in those countries associated with: (i) the difficulties and costs of complying with a wide variety of complex laws, treaties and regulations; (ii) unexpected changes in political or regulatory environments; (iii) earnings and cash flows that may be subject to tax withholding requirements or the imposition of tariffs, exchange controls, or other restrictions; (iv) political, economic, and social instability; (v) import and export restrictions and other trade barriers; (vi) responding to disruptions in existing trade agreements or increased trade tensions between countries or political or economic unions; (vii) maintaining overseas subsidiaries and managing international operations; and (viii) fluctuations in foreign currency exchange rates.
Supply chain issues, including financial problems of manufacturers or suppliers, or a shortage of adequate materials or manufacturing capacity that increase our costs or cause a delay in our ability to fulfill orders, could have an adverse impact on our business and operating results, and our failure to estimate customer demand properly may result in excess or obsolete inventory, which could adversely affect our gross margins.
Generally, our raw materials, supplies and energy requirements are obtained from various sources. These purchases include unformed materials and rough and finished parts. We are reliant on our extended supply chain and any disruption in this supply chain could have an adverse impact on our ability to deliver products to our customers on a timely and cost-effective basis. While alternative sources are available, our business would be material adversely affected if we are unable to find alternative sources on a timely and cost-effective basis. A reduction or interruption in supply; a significant increase in the price of one or more materials; a failure to adequately authorize procurement of inventory by our manufacturers; or a failure to appropriately cancel, reschedule, or adjust our requirements based on our business and customer needs; could materially adversely affect our business, operating results, and financial condition and could materially damage customer relationships. If there are shortages of materials we need to manufacture our products, the price of these materials may increase, or these materials may not be available at all, and we may also encounter shortages if we do not accurately anticipate our needs. We may not be able to secure enough materials at reasonable prices or of acceptable quality to build new products in a timely manner in the quantities or configurations needed. Accordingly, our revenue and gross margins could suffer until other sources can be developed. Our operating results would also be adversely affected if, anticipating greater demand than actually
17
develops, we commit to the purchase of more materials than we need, which is more likely to occur in a period of demand uncertainties such as we are currently experiencing. There can be no assurance that we will not encounter these problems in the future. In addition, if any of our suppliers seek bankruptcy relief or otherwise cannot continue their business as anticipated, the availability or price of these requirements could be adversely affected. A global economic downturn and related market uncertainty could negatively impact the availability of materials from one or more of these sources of these materials, especially during times such as we have recently seen when there are supplier constraints based on labor and other actions due to the COVID-19 pandemic. We may not be able to diversify sources in a timely manner, which could harm our ability to deliver products to customers and seriously impact present and future sales. In addition, when facing component supply-related challenges, we have increased our efforts in procuring materials in order to meet customer expectations which in turn contribute to an increase in purchase commitments. Increases in our purchase commitments to shorten lead times could also lead to excess and obsolete inventory charges if the demand for our products is less than our expectations. If we fail to anticipate customer demand properly, an oversupply of parts could result in excess or obsolete components that could adversely affect our gross margins.
If we are unable to manage our inventory, our operating results could be materially and adversely affected.
We generally do not have long-term supply contracts with our customers and, therefore, we must bear the risk of certain inventory commitments, based on our projections of future customer orders. We maintain an inventory to support these customers’ needs. Some of our customers have adjusted the amount of inventory that they carry during the COVID-19 pandemic and it is uncertain whether these levels of inventory will continue in the future. If we are unable to adjust to our customers’ changing inventory positions, our business could be adversely affected. Changes in demand, market conditions and/or product specifications could result in material obsolescence and a lack of alternative markets for certain of our customer specific products and could negatively impact operating results.
We could incur charges for impairment of assets, including goodwill and other long-lived assets, due to potential declines in the fair value of those assets or a decline in expected profitability of the Company or individual reporting units of the Company.
Approximately 63% of our total assets as of December 31, 2021 were comprised of goodwill, intangible assets, operating lease right-of-use assets and property, plant and equipment. Under generally accepted accounting principles, each of these assets is subject to periodic review and testing to determine whether the asset is recoverable or realizable. The events or changes that could require us to test these assets for impairment include changes in our estimated future cash flows, changes in rates of growth in our industry or in any of our businesses, and decreases in our stock price and market capitalization.
In the future, if sales demand or market conditions change from those projected by management, asset write-downs may be required. Material impairment charges, although not always affecting current cash flow, could have a material effect on our operating results and balance sheet.
Increases in demand for our products could make it more difficult for us to obtain additional skilled labor, which may adversely impact our operating efficiencies.
In certain geographic regions in which we have operating facilities, we have experienced shortages of qualified employees, in some cases due to COVID-19 related employee absenteeism, which negatively impacted our costs. While we are taking certain steps to automate aspects of our production and distribution, labor shortages and continued competition for qualified employees may increase the cost of our labor and create employee retention and recruitment challenges, especially during improving economic times, as employees with knowledge and experience have the ability to change employers more easily.
If demand for employees continues to increase, we may not be able to increase production to timely satisfy demand, and may initially incur higher labor and production costs, which could adversely impact our financial condition and operating results.
Our ability to integrate acquired businesses may adversely affect operations.
As part of our business and strategic plan, we look for strategic acquisitions to provide shareholder value. Any acquisition will require the effective integration of an existing business and certain of its administrative, financial, sales and marketing, manufacturing, distribution and other functions to maximize synergies. Acquired businesses involve a number of risks that may affect our financial performance, including increased leverage, diversion of management resources, assumption of
18
liabilities of the acquired businesses, financial reporting systems which do not integrate with the Company's existing financial reporting systems and possible corporate culture conflicts. If we are unable to successfully integrate these acquisitions, we may not realize the benefits identified in our due diligence process, and our financial results may be negatively impacted. Additionally, material unexpected liabilities could arise from these acquisitions.
We may incur material charges or be adversely impacted by the consolidation and/or closure of all or part of a manufacturing or distribution facility.
We periodically assess the cost structure of our operating facilities to distribute and/or manufacture products in the most efficient manner. We may make capital investments to move, discontinue manufacturing and/or distribution capabilities, or products and product lines, sell or close all or part of additional manufacturing and/or distribution facilities in the future. These changes could result in material future charges or disruptions in our operations, and we may not achieve the expected benefits from these changes, which could result in an adverse impact on our operating results, cash flows, and financial condition.
We are subject to governmental and environmental regulations, and failure in our compliance efforts, changes to such laws and regulations or events beyond our control could result in damages, expenses or liabilities that individually, or in the aggregate, would have a material adverse effect on our financial condition and results of operations.
Some of our manufacturing processes involve the use, handling, storage and contracting for recycling or disposal of hazardous or toxic substances or wastes. Accordingly, we are subject to various governmental and environmental laws and regulations regarding these substances, as well as environmental requirements relating to land, air, water and noise pollution. The implementation of new laws and regulations or amendments to existing regulations could materially increase the cost of the Company’s products. We cannot presently determine what, if any, legislation may be adopted by federal, state or local governing bodies, or the effect any such legislation may have on our customers or us. Failure to comply with present or future regulations could result in fines or potential civil or criminal liability, which could negatively impact our results of operations or financial condition.
We are subject to federal, state, local and certain international tax regulation. Changes thereto can have impacts on taxes paid, exposure to liabilities, and financial results of the Company.
While we seek to ensure the Company remains compliant with tax regulations in all jurisdictions in which we operate, new legislation or changes in existing legislation may result in changes to amounts owed for income, personal and real property taxes. These changes may negatively affect our results of operations, financial condition, and cash flows or increase the Company's effective tax rate.
We are also subject to the examination of our tax returns and other tax matters by the U.S. Internal Revenue Service, states in which we conduct business, and other tax authorities. If our effective tax rates were to increase, or if the ultimate determination of our taxes owed is for an amount in excess of amounts previously accrued, our financial condition, operating results and cash flows could be adversely affected.
The inability to attract and retain qualified executive officers and key personnel may adversely affect our operations.
While we include succession planning as part of our ongoing talent development and management process to help ensure the continuity of our business model, the loss of any of our executive officers or other key personnel could reduce our ability to manage our business and strategic plan in the short-term and could cause our sales and operating results to decline. In addition, our future success will depend on, among other factors, our ability to attract and retain executive management, key employees, and other qualified personnel.
19
Risks Related to Indebtedness
Our level and terms of indebtedness could adversely affect our ability to raise additional capital to fund our operations and take advantage of new business opportunities and prevent us from meeting our obligations under our debt instruments.
As of December 31, 2021, we had $1.36 billion of total long-term debt, including current maturities and exclusive of deferred financing costs and debt discount, outstanding under our 2021 Credit Facility, 4.75% Senior Notes, 7.50% Senior Notes, 1.75% Convertible Notes and 1.00% Convertible Notes (all as defined herein).
Our level of indebtedness could have adverse consequences on our future operations, including making it more difficult for us to meet our payments on outstanding debt, and we may not be able to find alternative financing sources to replace our indebtedness in such an event. Our level of indebtedness could: (i) reduce the availability of our cash flow to fund working capital, capital expenditures, acquisitions and other general corporate purposes, and limit our ability to obtain additional financing for these purposes; (ii) limit our flexibility in planning for, or reacting to, and increase our vulnerability to, changes in our business and the industry in which we operate; (iii) place us at a competitive disadvantage compared to our competitors that have less debt or are less leveraged; and (iv) create concerns about our credit quality which could result in the loss of supplier contracts and/or customers.
In addition, our debt could have important consequences to us, including:
•increase our vulnerability to general economic and industry conditions;
•require a substantial portion of our cash flow from operations to be dedicated to the payment of principal and interest on our indebtedness, therefore reducing our liquidity and our ability to use our cash flow to fund our operations, capital expenditures and future business opportunities;
•expose us to the risk of increased interest rates. and corresponding increased interest expense, because borrowings under our 2021 Credit Agreement (as defined herein) are at variable rates of interest;
•reduce funds available for working capital, capital expenditures, acquisitions and other general corporate purposes, due to the costs and expenses associated with such debt;
•limit our ability to obtain additional financing for working capital, capital expenditures, debt service requirements, acquisitions, and general corporate or other purposes; and
•limit our ability to adjust to changing marketplace conditions and placing us at a competitive disadvantage compared to our competitors who may have less debt.
If our cash flows and capital resources are insufficient to fund our debt service obligations, we may be forced to reduce or delay capital expenditures, sell assets, seek additional capital, or restructure or refinance our indebtedness. These alternative measures may not be successful and may not permit us to meet our scheduled debt service obligations, which could cause us to default on our debt obligations and impair our liquidity. In the event of a default under any of our indebtedness, the holders of the defaulted debt could elect to declare all the funds borrowed to be due and payable, together with accrued and unpaid interest, which in turn could result in cross-defaults under our other indebtedness The lenders under our 2021 Credit Agreement could also elect to terminate their commitments thereunder and cease making further loans, and such lenders could institute foreclosure proceedings against their collateral, and we could be forced into bankruptcy or liquidation. Our ability to satisfy our debt obligations will depend on our future operating performance which may be affected by factors beyond our control.
Despite our current level of indebtedness, we may be able to incur substantially more debt and enter into other transactions which could further exacerbate the risks to our financial condition described above. We may be able to incur significant additional indebtedness in the future. Although the 2021 Credit Agreement and other debt instruments contain restrictions on the incurrence of additional indebtedness and entering into certain types of other transactions, these restrictions are subject to a number of qualifications and exceptions. Additional indebtedness incurred in compliance with these restrictions could be substantial. These restrictions also do not prevent us from incurring obligations, such as certain trade payables, that do not constitute indebtedness as defined under our debt instruments. To the extent we incur additional indebtedness or other obligations, the risks described in the risk factors related to our indebtedness and others described herein may increase.
20
The agreements covering our indebtedness contain various financial performance and other covenants. If we do not remain in compliance with these covenants, we could be in breach of our debt agreements and the amounts outstanding thereunder could become immediately due and payable.
The agreements governing our indebtedness contain financial and non-financial covenants with which we must comply that place restrictions on us. These restrictions will limit our ability and the ability of our subsidiaries to, among other things:
•incur additional indebtedness (including guarantee obligations);
•incur liens;
•engage in mergers, consolidations and certain other fundamental changes;
•dispose of assets;
•make advances, investments and loans;
•engage in sale and leaseback transactions;
•engage in certain transactions with affiliates;
•enter into contractual arrangements that encumber or restrict the ability to (A) (i) pay dividends or make distributions, (ii) pay indebtedness, (iii) make loans or advances, or (iv) sell, lease or transfer property, in each case to us, or (B) incur liens;
•pay dividends, distributions and other payments in respect of capital stock or subordinated debt, and repurchase or retire capital stock, warrants or options or subordinated debt; and
•amend the terms of the documents governing, or make payments prior to the scheduled maturity date of, certain other indebtedness, as applicable.
As a result of these restrictions, we will be limited as to how we conduct our business and we may not be able to raise additional debt or equity financing to compete effectively or to take advantage of new business opportunities. A potential failure to comply with these financial and other restrictive covenants in our debt instruments, which, among other things, require us to maintain specified financial ratios could, if not cured or waived, have a material adverse effect on our ability to fulfill our obligations under our indebtedness and on our business and prospects generally.
Our 2021 Credit Agreement contains covenants that require that we comply with a maximum level of a consolidated secured net leverage ratio and a minimum level of a consolidated fixed charge coverage ratio (both covenants as described in Note 8 of the Notes to Consolidated Financial Statements included elsewhere in this Form 10-K). There can be no assurance that we will maintain compliance with the financial and other covenants under our 2021 Credit Agreement and other agreements governing our indebtedness. If we fail to comply with the covenants contained in our 2021 Credit Agreement, the lenders could cause our debt to become due and payable prior to maturity or it could result in our having to refinance the indebtedness under unfavorable terms. In the event of a default under any of our indebtedness, the holders of the defaulted debt could elect to declare all the funds borrowed to be due and payable, together with accrued and unpaid interest, which in turn could result in cross-defaults under our other indebtedness. If our debt were accelerated, our assets might not be sufficient to repay our debt in full and there can be no assurance that we would be able to refinance any or all of this indebtedness.
Due to industry conditions and our operating results, there have been times in the past when we have had limited access to sources of capital. If we are unable to locate suitable sources of capital when needed, we may be unable to maintain or expand our business.
We depend on our cash balances, our cash flows from operations, our 2021 Credit Facility and other financing vehicles to finance our operating requirements, capital expenditures and other needs. If a material economic recession occurred, such as the recession that impacted the economy in 2007-2010, production of RVs, marine units and manufactured homes could decline materially, resulting in reduced demand for our products. A decline in our operating results could negatively impact our liquidity. If our cash balances, cash flows from operations, and availability under our 2021 Credit Facility are insufficient to finance our operations and alternative capital is not available, we may not be able to expand our business and make acquisitions, or we may need to curtail or limit our existing operations.
We have letters of credit representing collateral for our casualty insurance programs and for general operating purposes that have been issued under our 2021 Credit Agreement. The inability to retain our current letters of credit, to obtain alternative
21
letter of credit sources, or to retain our 2021 Credit Agreement to support these programs could require us to post cash collateral, reduce the amount of cash available for our operations, or cause us to curtail or limit existing operations.
The conditional conversion feature of the 1.00% Convertible Notes due 2023 that we issued in January 2018 or 1.75% Convertible Notes due 2028 that we issued in December 2021, if triggered, may adversely affect our financial condition and operating results.
In the event the conditional conversion feature of the 1.00% Convertible Senior Notes due 2023 (the "1.00% Convertible Notes") or 1.75% Convertible Senior Notes due 2028 (the "1.75% Convertible Notes") is triggered, holders of 1.00% Convertible Notes or 1.75% Convertible Senior Notes will be entitled to convert the 1.00% Convertible Notes or 1.75% Convertible Senior Notes at any time during specified periods at their option. If one or more holders elect to convert their 1.00% Convertible Notes, unless we elect to satisfy our conversion obligation by delivering solely shares of our common stock (other than paying cash in lieu of delivering any fractional share), we would be required to settle a portion or all of our conversion obligation through the payment of cash, which could adversely affect our liquidity. If one or more holders elect to convert their 1.75% Convertible Notes, we would be required to settle our conversion obligation equal to the aggregate principal amount of such converted notes through the payment of cash, which could adversely affect our liquidity. In addition, even if holders do not elect to convert their 1.00% Convertible Notes or 1.75% Convertible Senior Notes, we could be required under applicable accounting rules to reclassify all or a portion of the outstanding principal of the 1.00% Convertible Notes or 1.75% Convertible Senior Notes as a current rather than long-term liability. See Notes 8 and 9 of the Notes to Consolidated Financial Statements included elsewhere in this Form 10-K for additional details.
The convertible note hedge and warrant transactions may affect the value of the 1.00% Convertible Notes or 1.75% Convertible Notes and our common stock.
In connection with the pricing of the 1.00% Convertible Notes and 1.75% Convertible Senior Notes, we entered into convertible note hedge transactions with certain of the initial purchasers and/or their respective affiliates (the “option counterparties”). At the same time, we entered into warrant transactions with the option counterparties. The convertible note hedge transactions are expected generally to reduce the potential dilution upon conversion of the 1.00% Convertible Notes or 1.75% Convertible Senior Notes and/or offset any cash payments we are required to make in excess of the principal amount of converted notes, as the case may be. However, the warrant transactions could separately have a dilutive effect on our common stock to the extent that the market price per share of our common stock exceeds the strike price of the warrants.
In addition, the option counterparties or their respective affiliates may modify their hedge positions by entering into or unwinding various derivatives with respect to our common stock and/or purchasing or selling our common stock or other securities of ours in secondary market transactions following the pricing of the 1.00% Convertible Notes or 1.75% Convertible Senior Notes and prior to the maturity of the 1.00% Convertible Notes or 1.75% Convertible Senior Notes (and are likely to do so during any observation period related to a conversion of 1.00% Convertible Notes or 1.75% Convertible Senior Notes). This activity could cause or avoid an increase or a decrease in the market price of our common stock or the 1.00% Convertible Notes or 1.75% Convertible Senior Notes, which could affect a holder's ability to convert the 1.00% Convertible Notes or 1.75% Convertible Senior Notes and, to the extent the activity occurs during any observation period related to a conversion of 1.00% Convertible Notes or 1.75% Convertible Senior Notes, it could affect the number of shares and value of the consideration that a holder will receive upon conversion of the 1.00% Convertible Notes or 1.75% Convertible Senior Notes.
22
Risks Related to Information Security, Cybersecurity and Data Privacy
If our information technology systems fail to perform adequately, our operations could be disrupted and could adversely affect our business, reputation and results of operations.
We are increasingly dependent on digital technology, including information systems and related infrastructure, to process and record financial and operating data, manage inventory and communicate with our employees and business partners. We rely on our information technology systems to effectively manage our business data, inventory, supply chain, order entry and fulfillment, manufacturing, distribution, warranty administration, invoicing, collection of payments, and other business processes. Our systems are subject to damage or interruption from power outages, telecommunications or internet failures, computer viruses and malicious attacks, security breaches and catastrophic events. If our systems are damaged or fail to function properly or reliably, we may incur substantial repair or replacement costs or experience data loss or theft and impediments to our ability to manage our business, which could adversely affect our results of operations. Any such events could result in legal claims or proceedings, liability or penalties under privacy laws, disruption in operations, and damage to our reputation, which could adversely affect our business.
In addition, we may be required to make material technology investments to maintain and update our existing information technology systems. Implementing material system changes increases the risk of computer system disruption. The potential problems and interruptions associated with implementing technology initiatives could disrupt or reduce our operational efficiency.
A cyber incident or data breach could result in information theft, data corruption, operational disruption, and/or financial loss.
Our technologies, systems, networks, and those of our business partners have in the past been, and may in the future become, the target of cyber-attacks or information security breaches that could result in the unauthorized release, gathering, monitoring, misuse, loss, or destruction of proprietary and other information, or other disruption of our business operations. A cyber-attack could include gaining unauthorized access to digital systems for purposes of misappropriating assets or sensitive information, corrupting data, or causing operational disruption or destruction due to ransom attacks or malware or result in denial of service on websites. We have programs in place to detect, contain and respond to data security incidents. However, because the techniques used to obtain unauthorized access, disable or degrade service, or sabotage systems change frequently and may be difficult to detect for long periods of time, we may be unable to anticipate these techniques or implement adequate preventive measures. Unauthorized parties may also attempt to gain access to our systems or facilities, or those of third parties with whom we do business, through fraud, trickery, or other forms of deceiving our team members, contractors, vendors, and temporary staff. In addition, hardware, software, or applications we develop or procure from third parties may contain defects in design or manufacture or other problems that could unexpectedly compromise information security. Any cyber-attack on our business could materially harm our business and operating results. The Company currently carries insurance to cover exposure to this type of incident, but this coverage may not be sufficient to cover all potential losses. As cyber threats continue to evolve, we may be required to expend material additional resources to continue to modify or enhance our protective measures or to investigate and remediate any information security vulnerabilities. If we or our suppliers experience additional material data security breaches or fail to detect and appropriately respond to material data security breaches, we could be exposed to costly government enforcement actions and private litigation and our business and operating results could suffer.
Other Risks
Certain provisions in our Articles of Incorporation and Amended and Restated By-laws may delay, defer or prevent a change in control that our shareholders might consider to be in their best interest.
Our Articles of Incorporation and Amended and Restated By-laws contain provisions that are intended to deter coercive takeover practices and inadequate takeover bids. These provisions may delay, defer or prevent a change in control that our shareholders might consider to be in their best interest.
23
Conditions within the insurance markets could impact our ability to negotiate favorable terms and conditions for various liability coverage and could potentially result in uninsured losses.
We generally negotiate our insurance contracts annually for property, casualty, workers compensation, general liability, health insurance, and directors and officers liability coverage. Due to conditions within these insurance markets and other factors beyond our control, future coverage limits, terms and conditions and the amount of the related premiums could have a negative impact on our operating results. While we continually measure the risk/reward of policy limits and coverage, the lack of coverage in certain circumstances could result in potential uninsured losses.
Risks Related to Ownership of our Common Stock
A variety of factors, many of which are beyond our control, could influence fluctuations in the market price for our common stock.
The stock market, in general, experiences volatility that has often been unrelated to the underlying operating performance of companies. If this volatility continues, the trading price of our common stock could decline materially, independent of our actual operating performance. The market price of our common stock could fluctuate materially in response to a number of factors, many of which are beyond our control, including the following:
•variations in our customers' and our competitors’ operating results;
•high concentration of shares held by institutional investors;
•announcements by us or our competitors of material contracts, acquisitions, strategic partnerships, joint ventures or capital commitments;
•announcements by us or our competitors of technological improvements or new products;
•the gain or loss of material customers;
•additions or departures of key personnel;
•events affecting other companies that the market deems comparable to us;
•changes in investor perception of our business and/or management;
•changes in global economic conditions or general market conditions in the industries in which we operate;
•sales of our common stock held by certain equity investors or members of management;
•issuance of our common stock or debt securities by the Company; and
•the occurrence of other events that are described in these risk factors.
ITEM 1B. UNRESOLVED STAFF COMMENTS
None.
24
ITEM 2. PROPERTIES
In 2021, the Company operated in 23 states in the U.S., China and Canada. At December 31, 2021, the Company leased approximately 9.3 million square feet of manufacturing, distribution and corporate facilities and owned approximately 3.2 million square feet, as listed below.
| Leased | Owned | |||||||||||||||||||||||||
| Purpose / Nature | # of Properties | Square Footage | # of Properties | Square Footage | ||||||||||||||||||||||
| Manufacturing | 139 | 7,177,000 | 32 | 2,138,000 | ||||||||||||||||||||||
| Distribution | 48 | 1,442,000 | 15 | 712,000 | ||||||||||||||||||||||
| Manufacturing & Distribution (shared space) | 3 | 567,000 | 1 | 94,000 | ||||||||||||||||||||||
| Corporate & Other | 15 | 113,000 | 2 | 210,000 | ||||||||||||||||||||||
| Total | 205 | 9,299,000 | 50 | 3,154,000 | ||||||||||||||||||||||
Pursuant to the terms of the Company’s 2021 Credit Agreement, all owned real property subject to the existing security documents is subject to a security interest.
The Company`s leased properties have lease expiration dates ranging from 2022 to 2031, with the exception of one property with a lease term expiring in 2039. Patrick believes the facilities occupied as of December 31, 2021 are adequate for the purposes for which they are currently being used and are well-maintained. The Company may, as part of its strategic operating plan, further consolidate and/or close certain owned facilities and may not renew leases on property with near-term lease expirations. Use of our manufacturing and distribution facilities may vary with seasonal, economic, and other business conditions.
ITEM 3. LEGAL PROCEEDINGS
We are subject to claims and lawsuits in the ordinary course of business. In management's opinion, currently pending legal proceedings and claims against the Company will not, individually or in the aggregate, have a material adverse effect on its financial condition, results of operations, or cash flows.
See Note 16 of the Notes to Consolidated Financial Statements included elsewhere in this Form 10-K for further discussion of legal matters in relation to commitments and contingencies.
ITEM 4. MINE SAFETY DISCLOSURES
Not applicable.
PART II
ITEM 5. MARKET FOR REGISTRANT’S COMMON EQUITY, RELATED STOCKHOLDER MATTERS, AND ISSUER PURCHASES OF EQUITY SECURITIES
Market Information
The Company's common stock is listed on The NASDAQ Global Stock MarketSM under the symbol PATK.
Holders of Common Stock
As of February 11, 2022, there were 278 shareholders of record. A number of shares are held in broker and nominee names on behalf of beneficial owners.
25
Dividends
In December 2019, the Company's Board of Directors (the "Board") adopted a dividend policy under which it plans to declare regular quarterly cash dividends. The Company paid cash dividends of $1.17 and $1.03 per share, or $27.0 million and $23.6 million in the aggregate, in 2021 and 2020, respectively. Any future determination to pay cash dividends will be made by the Board in light of the Company’s earnings, financial position, capital requirements, and restrictions under the Company’s 2021 Credit Agreement, and such other factors as the Board deems relevant.
Purchases of Equity Securities by the Issuer
(c)Issuer Purchases of Equity Securities for the three months ended December 31, 2021.
| Period | Total Number of Shares Purchased (1) | Average Price Paid Per Share (1) | Total Number of Shares Purchased as Part of Publicly Announced Plans or Programs (2) | Maximum Dollar Value of Shares that May Yet Be Purchased Under the Plans or Programs (2) | ||||||||||||||||||||||
| Sep. 28 - Oct. 25, 2021 | — | $ | — | — | $ | 39,605,258 | ||||||||||||||||||||
| Oct. 26 - Nov. 29, 2021 | 78,145 | 80.65 | 46,514 | 35,916,949 | ||||||||||||||||||||||
| Nov. 30 - Dec. 31, 2021 | 236,495 | 77.48 | 176,882 | 22,609,957 | ||||||||||||||||||||||
| Total | 314,640 | 223,396 | ||||||||||||||||||||||||
(1)Amount includes 91,244 shares of common stock purchased by the Company in aggregate in November and December 2021 for the sole purpose of satisfying the minimum tax withholding obligations of employees upon the exercise of stock options and the vesting of stock awards held by the employees.
(2)See Note 13 and Note 20 of the Notes to Consolidated Financial Statements included elsewhere in this Form 10-K for additional information about the Company's stock repurchase program.
26
Stock Performance Graph
The following graph compares the cumulative 5-year total return to shareholders of the Company’s common stock relative to the cumulative total returns of the Russell 2000 index and a customized peer group of companies, which includes Brunswick Corporation, Cavco Industries, Inc., LCI Industries, Malibu Boats, Inc., Thor Industries, Inc., Winnebago Industries, Inc., and Wabash National Corporation. This graph assumes an initial investment of $100 (with reinvestment of all dividends) was made in our common stock, in the index and in the peer group on December 31, 2016 and its relative performance is tracked through December 31, 2021.
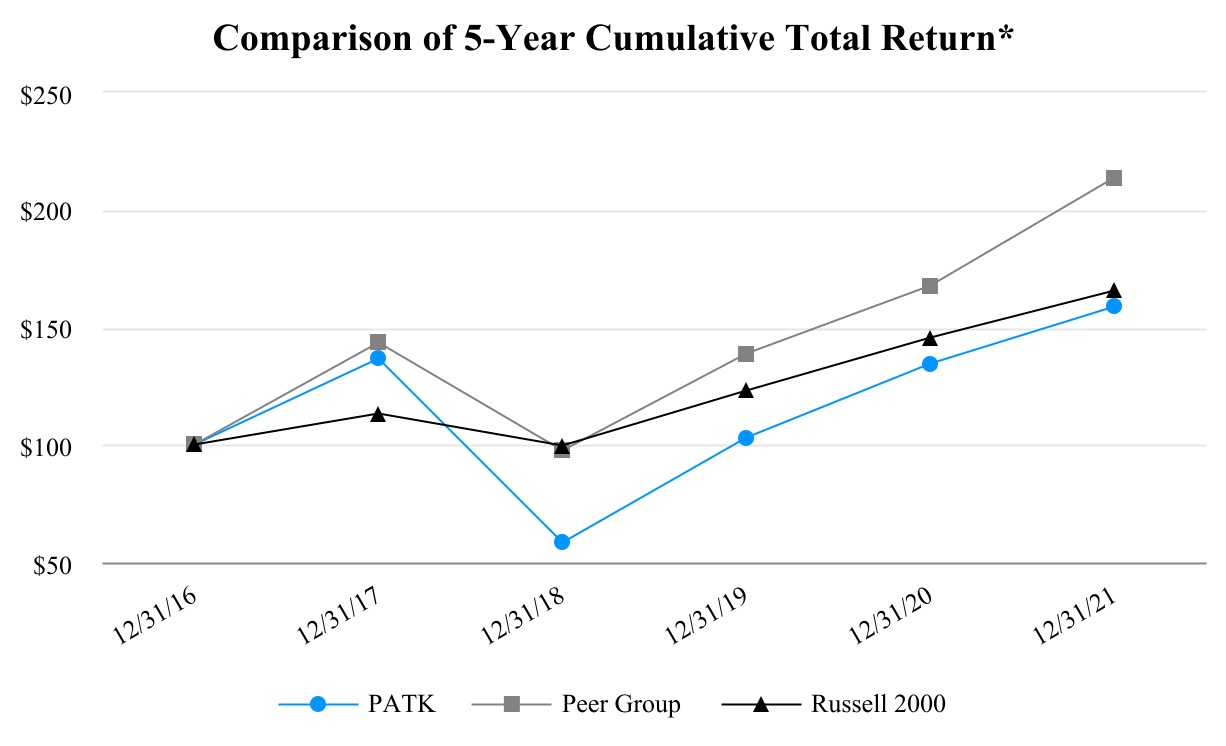
| ($) | 12/31/2016 | 12/31/2017 | 12/31/2018 | 12/31/2019 | 12/31/2020 | 12/31/2021 | ||||||||||||||
| Patrick Industries, Inc. | 100.00 | 136.53 | 58.21 | 103.07 | 134.37 | 158.63 | ||||||||||||||
| Peer Group | 100.00 | 143.32 | 97.44 | 138.76 | 167.78 | 213.69 | ||||||||||||||
| Russell 2000 | 100.00 | 113.14 | 99.37 | 122.94 | 145.52 | 165.45 | ||||||||||||||
*The stock price performance included in this graph is not necessarily indicative of future stock price performance.
27
ITEM 6. SELECTED FINANCIAL DATA
| As of or for the Year Ended December 31 | |||||||||||||||||
| 2021 | 2020 | 2019 | 2018 | 2017 | |||||||||||||
| (thousands except per share amounts) | |||||||||||||||||
| Operating Data: | |||||||||||||||||
Net sales (1) | $ | 4,078,092 | $ | 2,486,597 | $ | 2,337,082 | $ | 2,263,061 | $ | 1,635,653 | |||||||
| Gross profit | 801,194 | 459,017 | 422,871 | 415,866 | 278,915 | ||||||||||||
Operating income (1) | 351,712 | 173,373 | 154,442 | 178,415 | 121,900 | ||||||||||||
| Net income | 224,915 | 97,061 | 89,566 | 119,832 | 85,718 | ||||||||||||
| Basic net income per common share | $ | 9.87 | $ | 4.27 | $ | 3.88 | $ | 4.99 | $ | 3.54 | |||||||
| Diluted net income per common share | $ | 9.63 | $ | 4.20 | $ | 3.85 | $ | 4.93 | $ | 3.48 | |||||||
| Cash dividends paid per common share | $ | 1.17 | $ | 1.03 | $ | 0.25 | $ | — | $ | — | |||||||
| Financial Data: | |||||||||||||||||
Total assets (1) (2) | $ | 2,650,731 | $ | 1,753,435 | $ | 1,470,993 | $ | 1,231,231 | $ | 866,644 | |||||||
| Cash and cash equivalents | 122,849 | 44,767 | 139,390 | 6,895 | 2,767 | ||||||||||||
Total short-term and long-term debt (3) | 1,360,625 | 840,000 | 705,000 | 661,082 | 354,357 | ||||||||||||
| Shareholders' equity | 767,557 | 559,441 | 497,481 | 408,754 | 370,685 | ||||||||||||
| Cash flows from operating activities | 252,130 | 160,153 | 192,410 | 200,013 | 99,901 | ||||||||||||
(1) See Note 4 of the Notes to Consolidated Financial Statements included elsewhere in this Form 10-K for information regarding revenues, operating income and net assets of businesses acquired in fiscal years 2021, 2020 and 2019.
(2) See Note 15 of the Notes to the Consolidated Financial Statements included elsewhere in this Form 10-K for information regarding operating lease right-of-use assets reflected on the Company's balance sheet with the adoption of a new lease accounting standard in 2019.
(3) Total short-term and long-term debt for each of the periods presented in the table above is not presented net of deferred financing costs or debt discount.
ITEM 7. MANAGEMENT’S DISCUSSION AND ANALYSIS OF FINANCIAL CONDITION AND RESULTS OF OPERATIONS
This Management’s Discussion and Analysis of Financial Condition and Results of Operations (“MD&A”) should be read in conjunction with the Company’s Consolidated Financial Statements and Notes thereto included in Item 8 of this Report. In addition, this MD&A contains certain statements relating to future results that are forward-looking statements as that term is defined in the Private Securities Litigation Reform Act of 1995. See “Information Concerning Forward-Looking Statements” on page 3 of this Report.
EXECUTIVE SUMMARY
Overview of Markets and Related Industry Performance
Recreational Vehicle ("RV") Industry
The RV industry is our primary market and comprised 59% of the Company’s consolidated net sales in 2021. Sales to the RV industry increased 73% in 2021 compared to 2020. An approximate 6-week operations shutdown occurred in the late first quarter and early second quarter of 2020 in certain of our RV facilities in alignment with production shutdowns by certain OEM customers in response to the COVID-19 pandemic. In the second half of 2020, OEM production improved sharply in response to a strong increase in retail and wholesale demand for RVs, and our sales to RV OEMs also improved for 2020, with demand continuing through 2021.
28
According to the Recreation Vehicle Industry Association (“RVIA”), wholesale industry shipments totaled approximately 600,200 units in 2021, an increase of 39% compared to 430,400 units in 2020. RV industry retail unit sales totaled approximately 564,400 units in 2021, an increase of 8% compared to 2020 retail unit sales of 520,500 units according to Statistical Surveys, Inc ("SSI").
Marine Industry
Sales to the marine industry, which represented approximately 16% of the Company's consolidated net sales in 2021, increased 96% in 2021 compared to 2020. Our marine revenue is generally correlated to marine wholesale powerboat unit shipments, which increased 11% to approximately 138,400 units in 2021 compared to approximately 124,200 units in 2020, according to the National Marine Manufacturers Association. Estimated marine retail powerboat shipments totaled approximately 214,200 units in 2021, a decrease of 9% compared to 2020 retail powerboat shipments of approximately 234,800 units.
Manufactured Housing ("MH") Industry
Sales to the MH industry, which represented 14% of the Company’s consolidated net sales in 2021, increased 26% in 2021 compared to 2020. MH sales are generally correlated to MH industry wholesale unit shipments. Based on industry data from the Manufactured Housing Institute, MH wholesale industry unit shipments totaled 105,800 units in 2021, an increase of 12% compared to 2020 MH wholesale industry unit shipments of 94,400 units.
Industrial Market
The industrial market is comprised primarily of the solid surface countertop industry, kitchen cabinet industry, high-rise, hospitality, retail and commercial fixtures market, office and household furniture market and regional distributors. Sales to this market represented 11% of our consolidated net sales in 2021, increasing 43% in 2021 compared to 2020. Overall, our revenues in these markets are focused on the residential housing, hospitality, high-rise housing and office, commercial construction and institutional furniture markets. We estimate that approximately 70% of our industrial business is directly tied to the residential housing market, with the remaining 30% directly tied to the non-residential and commercial markets.
Combined new housing starts increased 16% in 2021 compared to 2020, with single family housing starts increasing 13% and multifamily residential starts increasing 23% for the same period. Our industrial products are generally among the last components installed in new unit construction and as such our related sales typically trail new housing starts by four to six months.
CONSOLIDATED OPERATING RESULTS
The following table sets forth the percentage relationship to net sales of certain items on the Company’s consolidated statements of income for the years ended December 31, 2021, 2020 and 2019.
| Year Ended December 31, | |||||||||||||||||||||||||||||
| (thousands) | 2021 | 2020 | 2019 | ||||||||||||||||||||||||||
| Net sales | $ | 4,078,092 | 100.0 | % | $ | 2,486,597 | 100.0 | % | $ | 2,337,082 | 100.0 | % | |||||||||||||||||
| Cost of goods sold | 3,276,898 | 80.4 | 2,027,580 | 81.5 | 1,914,211 | 81.9 | |||||||||||||||||||||||
| Gross profit | 801,194 | 19.6 | 459,017 | 18.5 | 422,871 | 18.1 | |||||||||||||||||||||||
| Warehouse and delivery expenses | 139,606 | 3.4 | 98,400 | 4.0 | 98,055 | 4.2 | |||||||||||||||||||||||
| Selling, general and administrative expenses | 253,547 | 6.2 | 146,376 | 5.9 | 134,466 | 5.8 | |||||||||||||||||||||||
| Amortization of intangible assets | 56,329 | 1.4 | 40,868 | 1.6 | 35,908 | 1.5 | |||||||||||||||||||||||
| Operating income | 351,712 | 8.6 | 173,373 | 7.0 | 154,442 | 6.6 | |||||||||||||||||||||||
| Interest expense, net | 57,890 | 1.4 | 43,001 | 1.7 | 36,616 | 1.6 | |||||||||||||||||||||||
| Income taxes | 68,907 | 1.7 | 33,311 | 1.4 | 28,260 | 1.2 | |||||||||||||||||||||||
| Net income | $ | 224,915 | 5.5 | $ | 97,061 | 3.9 | $ | 89,566 | 3.8 | ||||||||||||||||||||
29
Year Ended December 31, 2021 Compared to 2020
Net Sales. Net sales in 2021 increased approximately $1.59 billion, or 64%, to $4.08 billion from $2.49 billion in 2020. The increase was attributable to a 73% increase in sales to our RV end market, a 96% increase in sales to our marine end market, a 26% increase in sales to our MH end market, and a 43% increase in sales to our industrial end market.
In 2021 and 2020, net sales attributable to acquisitions completed in each of those years was $259.9 million and $81.9 million, respectively. Net sales in 2020 were adversely impacted by the COVID-19 pandemic and the related approximate 6-week operations shutdown that occurred in the late first quarter and early second quarter of 2020 in certain of our facilities in alignment with production shutdowns by certain OEM customers in response to the COVID-19 pandemic.
The Company’s RV content per wholesale unit for 2021 increased 24% to $4,006 from $3,235 in 2020. Marine powerboat content per wholesale unit for 2021 increased 76% to $3,632 from $2,069 in 2020. The Company's MH content per wholesale unit for 2021 increased 13% to $5,153 in 2021 from $4,580 in 2020.
Cost of Goods Sold. Cost of goods sold increased $1.25 billion, or 62%, to $3.28 billion in 2021 from $2.03 billion in 2020. As a percentage of net sales, cost of goods sold decreased 110 basis points during 2021 to 80.4% from 81.5% in 2020.
Cost of goods sold as a percentage of net sales decreased for 2021 compared to 2020 primarily as a result of (i) continued cost reduction and automation initiatives we deployed throughout 2020 and 2021, (ii) volume-driven efficiencies as a result of leveraging fixed overhead, (iii) a recovery from the production inefficiencies experienced while operating in a COVID-19 environment, and (iv) synergies and different cost profiles from our 2021 and 2020 acquisitions, partially offset by an increase in labor costs and certain labor inefficiencies, the impact of supply-chain constraints, and an increase in certain commodity cost inputs. In general, the Company's cost of goods sold percentage can be impacted by demand changes in certain market sectors that can result in fluctuating costs of certain raw materials and commodity-based components that are utilized in the production of our products.
Gross Profit. Gross profit increased $342.2 million or 75%, to $801.2 million in 2021 from $459.0 million in 2020. As a percentage of net sales, gross profit increased to 19.6% in 2021 from 18.5% in 2020. The increase in gross profit as a percentage of net sales in 2021 compared to 2020 reflects the impact of the factors discussed above under “Cost of Goods Sold”.
Economic or industry-wide factors affecting the profitability of our RV, marine, MH and industrial businesses include the costs of commodities and supply chain constraints and the labor used to manufacture our products, the competitive environment and the impact of different gross margin profiles of acquired companies, all of which can cause gross margins to fluctuate from quarter-to-quarter and year-to-year.
Warehouse and Delivery Expenses. Warehouse and delivery expenses increased $41.2 million, or 42%, to $139.6 million in 2021 from $98.4 million in 2020. As a percentage of net sales, warehouse and delivery expenses were 3.4% in 2021 and 4.0% in 2020. The increase in warehouse and delivery expenses is attributable to the significant increase in sales. The decrease of warehouse and delivery expenses as a percentage of net sales in 2021 compared to 2020 was primarily attributable to the lower proportion of MH industry net sales in 2021 compared to 2020, which have higher warehousing and delivery costs as a percentage of net sales. In addition, the percentage of warehousing and delivery expenses as a percentage of sales decreased as we leveraged certain fixed warehousing costs in proportion to our overall sales growth.
Selling, General and Administrative ("SG&A") Expenses. SG&A expenses increased $107.1 million, or 73.2%, to $253.5 million in 2021 from $146.4 million in 2020. As a percentage of net sales, SG&A expenses were 6.2% in 2021 and 5.9% in 2020.
The increase in SG&A expenses in 2021 is primarily due to (i) the increase in net sales; (ii) increases in the breadth and depth of corporate resources, specifically our investments in human capital and other technological initiatives to support the size and growth of the Company, (iii) the comparison to the prior year, which includes SG&A cost reduction measures implemented in the second quarter of 2020 that continued into the third quarter of 2020, and (iv) increased incentive compensation. As a percentage of sales, SG&A expenses increased 30 basis points for 2021 compared 2020. This increase is primarily a result of the aforementioned investment in human capital and incentive compensation.
30
Amortization of Intangible Assets. Amortization of intangible assets increased $15.5 million, or 38%, in 2021 compared to 2020. The increase in 2021 compared to 2020 primarily reflects the impact of intangible assets of businesses acquired in 2021 and 2020.
Operating Income. Operating income increased $178.2 million, or 103%, to $351.7 million in 2021 from $173.4 million in 2020. Operating income in 2021 and 2020 included $25.0 million and $10.7 million, respectively, from the businesses acquired in each respective year. Operating income as a percentage of net sales increased 160 basis points to 8.6% in 2021 from 7.0% in 2020. The increase in operating income and operating margin is primarily attributable to the items discussed above as well as the operating margin profiles of businesses acquired in 2021 and 2020.
Interest Expense, Net. Interest expense, net, increased $14.9 million, or 35%, to $57.9 million in 2021 from $43.0 million in 2020. The increase in interest expense reflects (i) increased borrowings related to 2021 and 2020 acquisitions and (ii) the Company's issuance of its 4.75% Senior Notes (as defined herein) in April 2021 and 1.75% Convertible Notes (as defined herein) in December 2021.
Income Taxes. Income tax expense increased $35.6 million, or 107%, to $68.9 million in 2021 from $33.3 million in 2020, attributed to an increase in pre-tax income. For 2021, the effective tax rate was 23.5% compared to 25.6% in 2020. The decrease in the effective tax rate in 2021 was mostly attributable to increased benefits from stock-based compensation as well as a decrease in certain state tax rates.
See our Form 10-K for the year ended December 31, 2020 for a discussion of our consolidated operating results for the year ended December 31, 2020 compared to 2019.
Use of Financial Metrics
Our MD&A includes financial metrics, such as RV, marine and MH content per unit, which we believe are important measures of the Company's business performance. Content per unit metrics are generally calculated using our market sales divided by third-party industry volume metrics. These metrics should not be considered alternatives to U.S. GAAP. Our computations of content per unit may differ from similarly titled measures used by others. These metrics should not be considered in isolation or as substitutes for an analysis of our results as reported under U.S. GAAP. Beginning in the third quarter of 2020, we calculate marine content per unit based on estimated wholesale powerboat unit shipments, which we believe better represents the relationship between our sales and marine OEM production, rather than based on estimated retail powerboat unit sales.
BUSINESS SEGMENTS
The Company's reportable segments, manufacturing and distribution, are based on its method of internal reporting. The Company regularly evaluates the performance of the manufacturing and distribution segments and allocates resources to them based on a variety of indicators including net sales and operating income. The Company does not measure profitability at the end market (RV, marine, MH and industrial) level.
•Manufacturing – This segment includes the following products: laminated products that are utilized to produce furniture, shelving, walls, countertops and cabinet products; cabinet doors; fiberglass bath fixtures and tile systems; hardwood furniture; vinyl printing; RV and marine furniture; audio systems and accessories, including amplifiers, tower speakers, soundbars, and subwoofers; decorative vinyl and paper laminated panels; solid surface, granite, and quartz countertop fabrication; RV painting; fabricated aluminum products; fiberglass and plastic components; fiberglass bath fixtures and tile systems; softwoods lumber; custom cabinetry; polymer-based and other flooring; electrical systems components including instrument and dash panels; wrapped vinyl, paper and hardwood profile mouldings; interior passage doors; air handling products; slide-out trim and fascia; thermoformed shower surrounds; specialty bath and closet building products; fiberglass and plastic helm systems and components products; treated, untreated and laminated plywood; wiring and wire harnesses; adhesives and sealants; boat covers, towers, tops, trailers and frames; marine hardware and accessories; aluminum and plastic fuel tanks; CNC molds and composite parts; slotwall panels and components; and other products.
31
•Distribution – This segment includes the distribution of pre-finished wall and ceiling panels; drywall and drywall finishing products; electronics and audio systems components; appliances; marine accessories and components; wiring, electrical and plumbing products; fiber reinforced polyester products; cement siding; raw and processed lumber; interior passage doors; roofing products; laminate and ceramic flooring; tile; shower doors; furniture; fireplaces and surrounds; interior and exterior lighting products; and other miscellaneous products in addition to providing transportation and logistics services.
Net sales pertaining to the manufacturing and distribution segments as stated in the table below and in the following discussions include intersegment sales. Gross profit includes the impact of intersegment operating activity.
The table below presents information about the net sales, gross profit, and operating income of the Company’s segments. Reconciliations of the amounts below to consolidated totals are presented in Note 18 of the Notes to Consolidated Financial Statements included elsewhere in this Form 10-K.
| Year Ended December 31, | |||||||||||||||||
| (thousands) | 2021 | 2020 | 2019 | ||||||||||||||
| Sales | |||||||||||||||||
| Manufacturing | $ | 3,002,107 | $ | 1,765,818 | $ | 1,673,486 | |||||||||||
| Distribution | 1,154,654 | 762,472 | 699,159 | ||||||||||||||
| Gross Profit | |||||||||||||||||
| Manufacturing | 598,942 | 324,938 | 307,362 | ||||||||||||||
| Distribution | 211,241 | 133,291 | 110,957 | ||||||||||||||
| Operating Income | |||||||||||||||||
| Manufacturing | 379,885 | 190,518 | 174,913 | ||||||||||||||
| Distribution | 106,241 | 54,376 | 38,953 | ||||||||||||||
Year Ended December 31, 2021 Compared to 2020
Manufacturing
Net Sales. Sales increased $1.23 billion, or 70%, to $3.00 billion in 2021 from $1.77 billion in 2020. This segment accounted for approximately 72% of the Company’s consolidated net sales in 2021 compared to approximately 70% of the Company's consolidated net sales in 2020. The sales increase reflected increased net sales across all of our end markets.
In 2021 and 2020, net sales attributable to acquisitions completed in each of those periods was approximately $202.2 million and $52.5 million, respectively.
Gross Profit. Gross profit increased $274.0 million, or 84%, to $598.9 million in 2021 from $324.9 million in 2020. As a percentage of net sales, gross profit was 20.0% in 2021 compared to 18.4% in 2020.
Gross profit margin increased in 2021 compared to 2020 primarily due to (i) an improvement in manufacturing overhead expense as a percentage of net sales, and (ii) an improvement in direct labor as a percentage of net sales, partially offset by an increase in material costs as a percentage of net sales.
Operating Income. Operating income increased $189.4 million, or 99%, to $379.9 million in 2021 from $190.5 million in 2020. Operating income for the manufacturing segment attributable to acquisitions completed in 2021 and 2020 was approximately $14.5 million and $7.0 million, respectively. The increase in operating income primarily reflects the increase in gross profit mentioned above.
Distribution
Net Sales. Sales increased $392.2 million, or 51%, to $1,154.7 million in 2021 from $762.5 million in 2020. This segment accounted for approximately 28% of the Company’s consolidated net sales for 2021 compared to 30% of the Company's
32
consolidated net sales in 2020. The increase in net sales in 2021 is attributed to an increase in sales across all end markets. In 2021 and 2020, net sales attributable to acquisitions completed in each of those periods was approximately $57.7 million and $29.4 million, respectively.
Gross Profit. Gross profit increased $77.9 million, or 58%, to $211.2 million in 2021 from $133.3 million in 2020. As a percentage of net sales, gross profit was 18.3% in 2021 compared to 17.5% in 2020. The increase in gross profit as a percentage of net sales for 2021 is primarily attributed to the higher margin profiles of certain 2021 and 2020 acquisitions as well as the benefit of leveraging certain fixed costs on increased net sales.
Operating Income. Operating income in 2021 increased $51.9 million, or 95%, to $106.2 million from $54.4 million in 2020. Operating income for the Distribution segment attributable to acquisitions completed in 2021 and 2020 was approximately $10.4 million and $3.7 million, respectively. The overall improvement in operating income in 2021 primarily reflects the items discussed above.
Unallocated Corporate Expenses
As presented in Note 18 of the Notes to Consolidated Financial Statements included elsewhere in this Form 10-K, unallocated corporate expenses in 2021 increased $47.4 million, or 155%, to $78.1 million from $30.7 million in 2020. The increase in 2021 was mostly attributed to an increase in professional fees, administrative wages and incentive compensation.
LIQUIDITY AND CAPITAL RESOURCES
The Company's primary sources of liquidity are cash flow from operations, which includes selling its products and collecting receivables, available cash reserves and borrowing capacity available under the 2021 Credit Facility (as defined below). Principal uses of cash are to support working capital demands, meet debt service requirements and support the Company's capital allocation strategy, which includes acquisitions, capital expenditures, dividends and repurchases of the Company’s common stock, among others.
Cash Flows
Year Ended December 31, 2021 Compared to 2020
Operating Activities
Cash flows from operating activities are one of the Company's primary sources of liquidity, representing the net income the Company earned in the reported periods, adjusted for non-cash items and changes in operating assets and liabilities.
Net cash provided by operating activities increased $91.9 million, or 57%, to $252.1 million in 2021 from $160.2 million in 2020 primarily due to: (i) an increase in net income of $127.8 million; (ii) an increase in cash from accounts payable, accrued liabilities and other of $129.1 million; and (iii) an increase in depreciation and amortization of $31.5 million. Partially offsetting these sources of cash was an increase in cash used for the purchase of inventory of $197.9 million as we strategically secured inventory to support a strong increase in end market demand for our products.
Investing Activities
Net cash used in investing activities increased $236.8 million, or 70%, to $574.7 million in 2021 from $337.9 million in 2020 primarily due to an increase in cash used in business acquisitions of $202.1 million and an increase in capital expenditures of $32.7 million.
Financing Activities
Net cash flows provided by financing activities increased $317.6 million, or 382%, to $400.7 million in 2021 from $83.1 million in 2020 primarily due to: (i) proceeds of $350.0 million from the Company's issuance of its 4.75% Senior Notes; (ii) proceeds of $258.8 million from the Company's issuance of 1.75% Convertible Notes; and (iii) an additional $51.9 million in term loan borrowings, net of repayments. These sources of cash were partially offset by (i) $140.0 million of net revolver repayments in 2021 versus $140.0 million of net revolver borrowings in 2020, and (ii) a $29.2 million increase in stock repurchases and dividends to shareholders.
33
See our Form 10-K for the year ended December 31, 2020 for a discussion of cash flows for the year ended December 31, 2020 compared to 2019.
Summary of Liquidity and Capital Resources
At December 31, 2021, the Company's existing cash and cash equivalents, cash generated from operations, and available borrowings under its 2021 Credit Facility are expected to be sufficient to meet anticipated cash needs for working capital and capital expenditures for at least the next 12 months, exclusive of any acquisitions, based on its current cash flow budgets and forecast of short-term and long-term liquidity needs.
Following the issuance of the 4.75% Senior Notes, the Company amended and restated its credit agreement to establish a new $700 million senior secured credit facility consisting of a $550 million revolving credit facility and a $150 million term loan facility (the "2021 Credit Facility"). The maturity date for borrowings under the 2021 Credit Facility is April 2026. The ability to access unused borrowing capacity under the 2021 Credit Facility as a source of liquidity is dependent on maintaining compliance with the financial covenants as specified under the terms of the credit agreement that established the 2021 Credit Facility (the "2021 Credit Agreement"). See Note 8 of the Notes to Consolidated Financial Statements included elsewhere in this Form 10-K for aggregate maturities of total long-term debt for the next five fiscal years and thereafter.
As of and for the reporting period ended December 31, 2021, the Company was in compliance with its financial covenants as required under the terms of its 2021 Credit Agreement. The required maximum consolidated secured net leverage ratio and the required minimum consolidated fixed charge coverage ratio, as such ratios are defined in the 2021 Credit Agreement, compared to the actual amounts as of December 31, 2021 and for the fiscal period then ended are as follows:
| Required | Actual | |||||||||||||
| Consolidated secured net leverage ratio (12-month period) | 2.75 | 0.29 | ||||||||||||
| Consolidated fixed charge coverage ratio (12-month period) | 1.50 | 5.83 | ||||||||||||
In addition, as of December 31, 2021, the Company's consolidated total net leverage ratio (12-month period) was 2.33. While this ratio was a covenant under the Company’s previous credit agreement and is not a covenant under the 2021 Credit Agreement, it is used in the determination of the applicable borrowing margin under the 2021 Credit Agreement.
Working capital requirements vary from period to period depending on manufacturing volumes primarily related to the RV, MH, marine and industrial markets we serve, the timing of deliveries, and the payment cycles of customers. In the event that operating cash flow is inadequate and one or more of the Company's capital resources were to become unavailable, the Company would seek to revise its operating strategies accordingly. The Company will continue to assess its liquidity position and potential sources of supplemental liquidity in view of operating performance, current economic and capital market conditions, and other relevant circumstances.
In April 2021, we issued $350.0 million aggregate principal amount of 4.75% Senior Notes due 2029 (the "4.75% Senior Notes"), which accrue interest at a rate of 4.75% per annum and mature on May 1, 2029. The Company may redeem the 4.75% Senior Notes, in whole or in part, at any time (a) prior to May 1, 2024, at a price equal to 100% of the principal amount thereof, plus the applicable premium described in the associated indenture and accrued and unpaid interest and (b) on or after May 1, 2024 at specified redemption prices set forth in the indenture, plus accrued and unpaid interest. In addition, prior to May 1, 2024, the Company may redeem, in one or more transactions, up to an aggregate of 40% of the original principal amount of the 4.75% Senior Notes at a redemption price equal to 104.75% of the principal amount thereof, plus accrued and unpaid interest, with the net cash proceeds of one or more equity offerings.
In December 2021, we completed the issuance of $258.8 million aggregate principal amount of 1.75% Convertible Senior Notes due 2028 (the “1.75% Convertible Notes”). The net proceeds from the issuance of the 1.75% Convertible Notes were approximately $249.7 million, after deducting the initial purchasers’ discounts and commissions and offering expenses payable by the Company, but before deducting the net cost of the 1.75% Convertible Note Hedge Transactions and the Warrant Transactions (each as defined herein) of $13.8 million described in Note 9 of the Notes to Consolidated Financial Statements included elsewhere in this Form 10-K.
The 1.75% Convertible Notes are senior unsecured obligations of the Company, accrue interest at 1.75% per annum and mature on December 1, 2028. The 1.75% Convertible Notes are convertible, in certain circumstances and subject to certain
34
conditions, into cash, or a combination of cash and common stock, at the Company’s election. The initial conversion rate for the 1.75% Convertible Notes is 9.9887 shares of the Company’s common stock per $1,000 principal amount of 1.75% Convertible Notes (equal to an initial conversion price of $100.11 per share). Prior to June 1, 2028, the 1.75% Convertible Notes may be converted at the option of the holders only upon the occurrence of specified events and during certain periods, and thereafter until the close of business on the second scheduled trading day immediately preceding the maturity date, the Notes may be converted at any time. The Company will satisfy any conversion by paying cash up to the aggregate principal amount of the 1.75% Convertible Notes to be converted and by paying or delivering, as the case may be, cash, shares of the Company’s common stock, or a combination of cash and shares of the Company’s common stock, at its election, in respect of the remainder, if any, of its conversion obligation in excess of the aggregate principal amount of the 1.75% Convertible Notes being converted. The Company may redeem for cash all or any portion of the 1.75% Convertible Notes, at its option, on or after December 5, 2025 if the closing sale price per share of the Company’s common stock exceeds 130% of the conversion price of the 1.75% Convertible Notes for a specified period of time.
Off-Balance Sheet Arrangements
None.
CRITICAL ACCOUNTING POLICIES
The preparation of financial statements in conformity with accounting principles generally accepted in the U.S. requires management to make estimates and assumptions that affect the reported amounts of assets and liabilities, the disclosure of contingent assets and liabilities at the date of the financial statements and the reported amounts of revenues and expenses during the reporting period. The SEC has defined a company’s critical accounting policies as those that are most important to the portrayal of its financial condition and results of operations, and which require the Company to make its most difficult and subjective judgments, often as a result of the need to make estimates of matters that are inherently uncertain. Although management believes that its estimates and assumptions are reasonable, they are based upon information available when they are made. Actual results may differ materially from these estimates under different assumptions or conditions. The Company has identified the following critical accounting policies and estimates:
Goodwill and Other Intangible Assets. The Company’s acquisitions include purchased goodwill and other intangible assets. Goodwill represents the excess of cost over the fair value of the net assets acquired. Other intangible assets acquired are classified as customer relationships, non-compete agreements, patents and trademarks.
Goodwill and indefinite-lived intangible assets, representing acquired trademarks, are not amortized but are subject to an annual (or under certain circumstances more frequent) impairment test in the fourth quarter based on their estimated fair value. We test more frequently, if there are indicators of impairment, or whenever such circumstances suggest that the carrying value of goodwill or trademarks may not be recoverable. These indicators include a sustained material decline in our share price and market capitalization, a decline in expected future cash flows, or a material adverse change in the business climate. A material adverse change in the business climate could result in a material loss of market share or the inability to achieve previously projected revenue growth.
Impairment reviews of goodwill are performed at the reporting unit level. The Company’s reporting units are defined as one level below our operating segments, Manufacturing and Distribution, which are the same as our reportable segments. In evaluating goodwill for impairment, either a qualitative or quantitative assessment is performed. If the qualitative assessment indicates it is more likely than not that the fair value of the reporting unit is less than its carrying value, the Company performs a quantitative assessment. When estimating reporting unit fair value with the quantitative assessment, the Company uses a combination of market and income-based methodologies. The market approach includes a comparison of the multiple of a reporting unit's carrying value to its earnings before interest, taxes, depreciation and amortization with the multiples of similar businesses or guideline companies whose securities are actively traded in the public markets. When calculating the present value of future cash flows under the income approach, the Company takes into consideration multiple variables, including forecasted sales volumes and operating income, current industry and economic conditions, and historical results. The income approach fair value estimate also includes estimates of long-term growth rates and discount rates that are commensurate with the risks and uncertainty inherent in the respective reporting units and internally-developed forecasts.
Impairment reviews of indefinite-lived intangible assets (trademarks) consist of a comparison of the fair value of the trademark to its carrying value. Fair value is measured using a relief-from-royalty approach, a form of discounted cash flow
35
method. Estimated royalty rates applied to projected revenues are based on comparable industry studies and consideration of operating margins. Discount rates are derived in a manner similar to what is done in testing goodwill for impairment.
Based on the results of the Company's analyses, the estimated fair value of each of the Company's reporting units and trademarks was determined to exceed the carrying value for each of the years ended December 31, 2021, 2020 and 2019 and so no impairments were recognized. Further, based on the results of the impairment analyses, none of the Company’s reporting units or trademarks were at risk of failing the impairment assessments discussed above that would have a material effect on the Company’s Consolidated Financial Statements for any period presented.
Business Combinations. From time to time, we may enter into business combinations. We recognize the identifiable assets acquired and the liabilities assumed at their fair values as of the date of acquisition. We measure goodwill as the excess of consideration transferred, which we also measure at fair value, over the net of the acquisition date fair values of the identifiable assets acquired and liabilities assumed. The acquisition method of accounting requires us to make significant estimates and assumptions regarding the fair values of the elements of a business combination as of the date of acquisition, including the fair values of property, plant and equipment, identifiable intangible assets, contingent consideration and other financial assets and liabilities. Significant estimates and assumptions include subjective and/or complex judgments regarding items such as discount rates, customer attrition rates, royalty rates, and other factors, including estimated future cash flows that we expect to generate from the acquired assets.
The acquisition method of accounting also requires us to refine these estimates over a measurement period not to exceed one year to reflect new information obtained about facts and circumstances that existed as of the acquisition date that, if known, would have affected the measurement of the amounts recognized as of that date. If we are required to adjust provisional amounts that we have recorded for the fair values of assets and liabilities in connection with acquisitions, these adjustments could have a material impact on our financial condition and results of operations. No changes in the year ended December 31, 2021 to provisional fair value estimates of assets acquired and liabilities assumed in acquisitions were material. If the subsequent actual results and updated projections of the underlying business activity change compared with the assumptions and projections used to develop the acquisition date fair value estimates, we could record future impairment charges. In addition, we estimate the economic lives of certain acquired assets and these lives are used to calculate depreciation and amortization expense. If our estimates of the economic lives change, depreciation or amortization expenses could be increased or decreased, or the acquired assets could be impaired.
ITEM 7A. QUANTITATIVE AND QUALITATIVE DISCLOSURES ABOUT MARKET RISK
Debt Obligations
At December 31, 2021, our total debt obligations under our 2021 Credit Agreement were under LIBOR-based interest rates. A 100 basis point increase in the underlying LIBOR rates would result in additional annual interest cost of approximately $0.8 million, assuming average borrowings, including the Term Loan, subject to variable rates of $79.4 million, which was the amount of such borrowings outstanding at December 31, 2021, excluding deferred financing costs related to the term loan and $200.0 million of borrowings outstanding under the revolver and term loan that are hedged at a fixed interest rate through interest rate swaps.
Commodity Volatility
The prices of key raw materials, consisting primarily of lauan, gypsum, fiberglass, particleboard, aluminum, softwoods and hardwoods lumber, resin, and petroleum-based products, are influenced by demand and other factors specific to these commodities as well as general inflationary pressures, including those driven by supply chain and logistical disruptions. Prices of certain commodities have historically been volatile and continued to fluctuate in 2021. During periods of volatile commodity prices, we have generally been able to pass both price increases and decreases to our customers in the form of price adjustments. We are exposed to risks during periods of commodity volatility because there can be no assurance future cost increases or decreases, if any, can be partially or fully passed on to customers, or that the timing of such sales price increases or decreases will match raw material cost increases or decreases. We do not believe that commodity price volatility had a material effect on results of operations for the periods presented.
36
ITEM 8. FINANCIAL STATEMENTS AND SUPPLEMENTARY DATA
The information required by this item is set forth in Item 15(a)(1) of Part IV of this Annual Report on Form 10-K.
ITEM 9. CHANGES IN AND DISAGREEMENTS WITH ACCOUNTANTS ON ACCOUNTING AND FINANCIAL DISCLOSURE
None.
ITEM 9A. CONTROLS AND PROCEDURES
Disclosure Controls and Procedures
The Company maintains “disclosure controls and procedures”, as such term is defined under Securities Exchange Act Rule 13a-15(e), that are designed to ensure that information required to be disclosed in our Securities Exchange Act of 1934, as amended (the “Exchange Act”) reports is recorded, processed, summarized and reported within the time periods specified in the SEC’s rules and forms, and that such information is accumulated and communicated to our management, including our Chief Executive Officer and Chief Financial Officer, as appropriate to allow for timely decisions regarding required disclosures. In designing and evaluating the disclosure controls and procedures, the Company’s management recognizes that any controls and procedures, no matter how well designed and operated, can provide only reasonable assurance of achieving the desired control objectives and the Company’s management necessarily is required to apply its judgment in evaluating the cost-benefit relationship of possible controls and procedures.
Under the supervision and with the participation of our senior management, including our Chief Executive Officer and Chief Financial Officer, the Company conducted an evaluation of the effectiveness of the design and operation of our disclosure controls and procedures as of the end of the period covered by this report (the “Evaluation Date”). Based on this evaluation, our Chief Executive Officer and Chief Financial Officer concluded as of the Evaluation Date that our disclosure controls and procedures were effective such that the information relating to the Company, including consolidated subsidiaries, required to be disclosed in our reports filed under the Exchange Act is recorded, processed, summarized, and reported within the time periods specified in the SEC’s rules and forms, and is accumulated and communicated to Company’s management, including our Chief Executive Officer and Chief Financial Officer, as appropriate to allow timely decisions regarding required disclosure.
Management’s Annual Report on Internal Control Over Financial Reporting
We are responsible for establishing and maintaining adequate internal control over financial reporting, as defined in Rule 13a-15(f) and 15d-15(f) under the Exchange Act. Our internal control system was designed to provide reasonable assurance regarding the fair and reliable preparation and presentation of our published financial statements. We continually evaluate our system of internal control over financial reporting to determine if changes are appropriate based upon changes in our operations or the business environment in which we operate.
All internal control systems, no matter how well designed, have inherent limitations. Therefore, even those systems determined to be effective can provide only reasonable assurance with respect to financial statement preparation and presentation.
Under the supervision and with the participation of our management, including our Chief Executive Officer and Chief Financial Officer, we conducted an assessment of the effectiveness of our internal control over financial reporting based on the framework in the 2013 Internal Control - Integrated Framework issued by the Committee of Sponsoring Organizations of the Treadway Commission (COSO). This assessment included a review of the documentation of controls, an assessment of the design effectiveness of controls, testing of the operating effectiveness of controls, and a conclusion on this evaluation. As permitted under SEC guidance, management’s assessment of and conclusion regarding the design and effectiveness of internal control over financial reporting excluded the internal control over financial reporting of the operations of businesses acquired in 2021, which are described in Note 4 of the Notes to Consolidated Financial Statements included elsewhere in this
37
Form 10-K. Businesses acquired in 2021 represented less than 7% of consolidated net sales for the year ended December 31, 2021 and approximately 8% of consolidated total assets as of December 31, 2021. Based on our assessment, we have concluded that our internal control over financial reporting was effective as of December 31, 2021.
The Company’s independent registered public accounting firm, Deloitte & Touche LLP, audited our internal control over financial reporting as of December 31, 2021, as stated in their report in the section entitled “Report of Independent Registered Public Accounting Firm” included elsewhere in this Form 10-K, which expresses an unqualified opinion on the effectiveness of the Company’s internal control over financial reporting as of December 31, 2021.
Changes in internal control over financial reporting
There have been no changes in our internal control over financial reporting that occurred during the fourth quarter ended December 31, 2021 or subsequent to the date the Company completed its evaluation, that have materially affected, or are reasonably likely to materially affect, our internal control over financial reporting.
ITEM 9B. OTHER INFORMATION
None.
PART III
ITEM 10. DIRECTORS, EXECUTIVE OFFICERS AND CORPORATE GOVERNANCE
Directors of the Company
The information required by this item with respect to directors is set forth in our Proxy Statement for the Annual Meeting of Shareholders to be held on May 12, 2022, under the captions “Election of Directors” and “Delinquent Section 16(a) Reports,” which information is hereby incorporated herein by reference.
Executive Officers of the Registrant
The information required by this item is set forth under the caption “Executive Officers of the Company” in Part I of this Annual Report on Form 10-K.
Audit Committee
Information on our Audit Committee is contained under the caption “Audit Committee” in our Proxy Statement for the Annual Meeting of Shareholders to be held on May 12, 2022 and is incorporated herein by reference.
Code of Ethics and Business Conduct
We have adopted a Code of Ethics and Business Conduct Policy applicable to all employees. Our Code of Ethics and Business Conduct Policy is available on the Company’s web site at www.patrickind.com under “For Investors”. We intend to post on our web site any substantive amendments to, or waivers from, our Code of Ethics and Business Conduct Policy as well as our Corporate Governance Guidelines. We will provide shareholders with a copy of these policies without charge upon written request directed to the Company’s Corporate Secretary at the Company’s address.
Corporate Governance
Information on our corporate governance practices is contained under the caption “Corporate Governance” in our Proxy Statement for the Annual Meeting of Shareholders to be held on May 12, 2022 and incorporated herein by reference.
38
ITEM 11. EXECUTIVE COMPENSATION
The information required by this item is set forth in the Company’s Proxy Statement for the Annual Meeting of Shareholders to be held on May 12, 2022, under the caption “Executive Compensation," "Compensation Committee Interlocks and Director Participation," and "Compensation Committee Report," and is incorporated herein by reference.
ITEM 12. SECURITY OWNERSHIP OF CERTAIN BENEFICIAL OWNERS AND MANAGEMENT AND RELATED STOCKHOLDER MATTERS
The information required by this item is set forth in our Proxy Statement for the Annual Meeting of Shareholders to be held on May 12, 2022, under the captions “Equity Compensation Plan Information” and “Security Ownership of Certain Beneficial Owners and Management,” and is incorporated herein by reference.
ITEM 13. CERTAIN RELATIONSHIPS AND RELATED TRANSACTIONS, AND DIRECTOR INDEPENDENCE
The information required by this item is set forth in our Proxy Statement for the Annual Meeting of Shareholders to be held on May 12, 2022, under the captions “Related Party Transactions” and “Corporate Governance”, and is incorporated herein by reference.
ITEM 14. PRINCIPAL ACCOUNTING FEES AND SERVICES
The information required by this item is set forth in our Proxy Statement for the Annual Meeting of Shareholders to be held on May 12, 2022, under the heading “Independent Public Accountants,” and is incorporated herein by reference.
39
PART IV
ITEM 15. EXHIBITS AND FINANCIAL STATEMENT SCHEDULES
| (a) | (1) The financial statements listed in the accompanying Index to the Financial Statements on page F-1 of the separate financial section of this Report are incorporated herein by reference. | |||||||
| (3) The exhibits required to be filed as part of this Annual Report on Form 10-K are listed under (c) below. | ||||||||
| (c) | Exhibits | |||||||
40
| 10.7* | ||||||||
| 10.8* | ||||||||
| 10.9 | ||||||||
| 10.10 | ||||||||
| 10.11 | ||||||||
| 10.12 | ||||||||
| 10.13 | ||||||||
| 10.14 | ||||||||
| 10.15 | ||||||||
| 10.16 | ||||||||
| 10.17 | ||||||||
| 10.18 | ||||||||
| 10.19 | ||||||||
| 10.20 | ||||||||
| 10.21 | ||||||||
41
| 10.22 | ||||||||
| 10.23 | ||||||||
| 10.24 | ||||||||
| 10.25 | ||||||||
| 10.26 | ||||||||
| 10.27 | ||||||||
| 10.28 | ||||||||
| 10.29 | ||||||||
| 21** | ||||||||
| 23.1** | ||||||||
| 31.1** | ||||||||
| 31.2** | ||||||||
| 32** | ||||||||
42
XBRL Exhibits.
Interactive Data Files. The following materials are filed electronically with this Annual Report on Form 10-K:
| 101.INS | XBRL Instance Document | ||||
| 101.SCH | XBRL Taxonomy Schema Document | ||||
| 101.CAL | XBRL Taxonomy Calculation Linkbase Document | ||||
| 101.DEF | XBRL Taxonomy Definition Linkbase Document | ||||
| 101.LAB | XBRL Taxonomy Label Linkbase Document | ||||
| 101.PRE | XBRL Taxonomy Presentation Linkbase Document | ||||
Attached as Exhibits 101 to this report are the following financial statements from the Company’s Annual Report on Form 10-K for the year ended December 31, 2021 formatted in XBRL (“eXtensible Business Reporting Language”): (i) the Consolidated Balance Sheet; (ii) the Consolidated Statements of Income; (iii) the Consolidated Statements of Comprehensive Income; (iv) the Consolidated Statements of Shareholders’ Equity; and (v) the Consolidated Statements of Cash Flows, and the related Notes to these financial statements in detail tagging format.
*Management contract or compensatory plan or arrangement.
**Filed herewith.
All other financial statement schedules are omitted because they are not applicable or the required information is immaterial or is shown in the Notes to Consolidated Financial Statements.
ITEM 16. FORM 10-K SUMMARY
None.
43
SIGNATURES
Pursuant to the requirements of Section 13 or 15(d) of the Securities Exchange Act of 1934, the registrant has duly caused this report to be signed on its behalf by the undersigned, thereunto duly authorized
| PATRICK INDUSTRIES, INC. | ||||||||
Date: February 25, 2022 | By: | /s/ Andy L. Nemeth | ||||||
| Andy L. Nemeth | ||||||||
| Chief Executive Officer | ||||||||
Pursuant to the Requirements of the Securities Exchange Act of 1934, this report has been signed below by the following persons on behalf of the registrant and in the capacities and on the dates indicated.
| Signature | Title | Date | ||||||||||||
| /s/ Andy L. Nemeth | Chief Executive Officer | February 25, 2022 | ||||||||||||
| Andy L. Nemeth | (Principal Executive Officer) | |||||||||||||
| Director | ||||||||||||||
| /s/ Jacob R. Petkovich | Executive Vice President Finance, | February 25, 2022 | ||||||||||||
| Jacob R. Petkovich | Chief Financial Officer and Treasurer | |||||||||||||
| (Principal Financial Officer) | ||||||||||||||
| /s/ James E. Rose | Vice President Finance | February 25, 2022 | ||||||||||||
| James E. Rose | and Principal Accounting Officer | |||||||||||||
| (Principal Accounting Officer) | ||||||||||||||
| /s/ Joseph M. Cerulli | Director | February 25, 2022 | ||||||||||||
| Joseph M. Cerulli | ||||||||||||||
| /s/ Todd M. Cleveland | Executive Chairman of the Board | February 25, 2022 | ||||||||||||
| Todd M. Cleveland | ||||||||||||||
| /s/ John A. Forbes | Director | February 25, 2022 | ||||||||||||
| John A. Forbes | ||||||||||||||
| /s/ Michael A. Kitson | Director | February 25, 2022 | ||||||||||||
| Michael A. Kitson | ||||||||||||||
| /s/ Pamela R. Klyn | Director | February 25, 2022 | ||||||||||||
| Pamela R. Klyn | ||||||||||||||
| /s/ Derrick B. Mayes | Director | February 25, 2022 | ||||||||||||
| Derrick B. Mayes | ||||||||||||||
| /s/ Denis G. Suggs | Director | February 25, 2022 | ||||||||||||
| Denis G. Suggs | ||||||||||||||
| /s/ M. Scott Welch | Lead Director | February 25, 2022 | ||||||||||||
| M. Scott Welch | ||||||||||||||
44
PATRICK INDUSTRIES, INC.
Index to the Financial Statements
Report of Independent Registered Public Accounting Firm, Deloitte & Touche LLP (Firm ID No. | F-2 | ||||
Financial Statements: | |||||
| F-5 | |||||
| F-6 | |||||
| F-7 | |||||
| F-8 | |||||
| F-9 | |||||
| F-10 | |||||
F-1
Report of Independent Registered Public Accounting Firm
To the shareholders and the Board of Directors of Patrick Industries, Inc.
Opinions on the Financial Statements and Internal Control over Financial Reporting
We have audited the accompanying consolidated balance sheets of Patrick Industries, Inc. and subsidiaries (the "Company") as of December 31, 2021 and 2020, the related consolidated statements of income, comprehensive income, shareholders' equity, and cash flows, for each of the three years in the period ended December 31, 2021, and the related notes (collectively referred to as the "financial statements"). We also have audited the Company’s internal control over financial reporting as of December 31, 2021, based on criteria established in Internal Control — Integrated Framework (2013) issued by the Committee of Sponsoring Organizations of the Treadway Commission (COSO).
In our opinion, the financial statements referred to above present fairly, in all material respects, the financial position of the Company as of December 31, 2021 and 2020, and the results of its operations and its cash flows for each of the three years in the period ended December 31, 2021, in conformity with accounting principles generally accepted in the United States of America. Also, in our opinion, the Company maintained, in all material respects, effective internal control over financial reporting as of December 31, 2021, based on criteria established in Internal Control — Integrated Framework (2013) issued by COSO.
As described in the accompanying Management's Annual Report on Internal Control Over Financial Reporting, management excluded from its assessment the internal control over financial reporting at the operations of businesses acquired in 2021, which are described in Note 4, whose financial statements constitute less than 7% of consolidated net sales for the year ended December 31, 2021 and approximately 8% of consolidated total assets as of December 31, 2021. Accordingly, our audit did not include the internal control over financial reporting at these businesses.
Basis for Opinions
The Company’s management is responsible for these financial statements, for maintaining effective internal control over financial reporting, and for its assessment of the effectiveness of internal control over financial reporting, included in Management's Annual Report on Internal Control Over Financial Reporting. Our responsibility is to express an opinion on these financial statements and an opinion on the Company’s internal control over financial reporting based on our audits. We are a public accounting firm registered with the Public Company Accounting Oversight Board (United States) (PCAOB) and are required to be independent with respect to the Company in accordance with the U.S. federal securities laws and the applicable rules and regulations of the Securities and Exchange Commission and the PCAOB.
We conducted our audits in accordance with the standards of the PCAOB. Those standards require that we plan and perform the audits to obtain reasonable assurance about whether the financial statements are free of material misstatement, whether due to error or fraud, and whether effective internal control over financial reporting was maintained in all material respects.
Our audits of the financial statements included performing procedures to assess the risks of material misstatement of the financial statements, whether due to error or fraud, and performing procedures to respond to those risks. Such procedures included examining, on a test basis, evidence regarding the amounts and disclosures in the financial statements. Our audits also included evaluating the accounting principles used and significant estimates made by management, as well as evaluating the overall presentation of the financial statements. Our audit of internal control over financial reporting included obtaining an understanding of internal control over financial reporting, assessing the risk that a material weakness exists, and testing and evaluating the design and operating effectiveness of internal control based on the assessed risk. Our audits also included performing such other procedures as we considered necessary in the circumstances. We believe that our audits provide a reasonable basis for our opinions.
Definition and Limitations of Internal Control over Financial Reporting
A company’s internal control over financial reporting is a process designed to provide reasonable assurance regarding the reliability of financial reporting and the preparation of financial statements for external purposes in accordance with generally accepted accounting principles. A company’s internal control over financial reporting includes those policies and procedures that (1) pertain to the maintenance of records that, in reasonable detail, accurately and fairly reflect the transactions and dispositions of the assets of the company; (2) provide reasonable assurance that transactions are recorded as necessary to
F-2
permit preparation of financial statements in accordance with generally accepted accounting principles, and that receipts and expenditures of the company are being made only in accordance with authorizations of management and directors of the company; and (3) provide reasonable assurance regarding prevention or timely detection of unauthorized acquisition, use, or disposition of the company’s assets that could have a material effect on the financial statements.
Because of its inherent limitations, internal control over financial reporting may not prevent or detect misstatements. Also, projections of any evaluation of effectiveness to future periods are subject to the risk that controls may become inadequate because of changes in conditions, or that the degree of compliance with the policies or procedures may deteriorate.
Critical Audit Matter
The critical audit matter communicated below is a matter arising from the current-period audit of the financial statements that was communicated or required to be communicated to the audit committee and that (1) relates to accounts or disclosures that are material to the financial statements and (2) involved our especially challenging, subjective, or complex judgments. The communication of critical audit matters does not alter in any way our opinion on the financial statements, taken as a whole, and we are not, by communicating the critical audit matter below, providing a separate opinion on the critical audit matter or on the accounts or disclosures to which it relates.
Acquisitions—Refer to Note 4 to the financial statements
Critical Audit Matter Description
The Company completed several acquisitions during the year ended December 31, 2021. One of these acquisitions included total consideration of approximately $163 million. The Company accounted for this acquisition under the acquisition method of accounting for business combinations and allocated the purchase price to the assets acquired and liabilities assumed based on their respective fair values.
The purchase price allocation included a customer relationships intangible asset of $48 million and a trademark intangible asset of $28 million. The Company estimated the value of the customer relationships using the multi-period excess earnings method. The Company estimated the value of the trademark using the relief-from-royalty method. The fair value determination of these intangible assets required management to make significant estimates and assumptions related to future cash flows and the selection of the discount rate, customer attrition rate, and royalty rate.
We identified this acquisition as a critical audit matter because of the significant estimates and assumptions management made to determine the fair value of the intangible assets discussed above. This required a high degree of auditor judgment and an increased extent of effort, including the need to involve our fair value specialists, when performing audit procedures to evaluate management’s valuation methodologies and the reasonableness of management’s assumptions related to future cash flows and the selection of the discount rate, customer attrition rate, and royalty rate.
How the Critical Audit Matter was Addressed in the Audit
Our audit procedures related to the fair value of the acquired intangible assets discussed above included the following, among others:
•We tested the effectiveness of controls over the purchase price allocation, including management’s controls over the appropriateness of the valuation methodology, forecasts of future cash flows and selection of the discount rate, customer attrition rate, and royalty rate.
•With the assistance of our internal fair value specialists, we evaluated the reasonableness of the valuation methodology, the discount rate, customer attrition rate, and royalty rate by:
◦Testing the source information underlying the determination of these rates and testing the mathematical accuracy of the calculations.
◦Developing ranges of independent estimates and comparing those to the rates selected by management.
F-3
•We assessed the reasonableness of management’s forecast of future cash flows by comparing the projections to historical results and certain peer companies. We also evaluated whether the estimated future cash flows were consistent with evidence obtained in other areas of the audit.
/s/ Deloitte & Touche LLP
February 25, 2022
We have served as the Company's auditor since 2019.
F-4
PATRICK INDUSTRIES, INC.
CONSOLIDATED STATEMENTS OF INCOME
| (thousands except per share data) | Year Ended December 31, | ||||||||||||||||
| 2021 | 2020 | 2019 | |||||||||||||||
| NET SALES | $ | $ | $ | ||||||||||||||
| Cost of goods sold | |||||||||||||||||
| GROSS PROFIT | |||||||||||||||||
| Operating Expenses: | |||||||||||||||||
| Warehouse and delivery | |||||||||||||||||
| Selling, general and administrative | |||||||||||||||||
| Amortization of intangible assets | |||||||||||||||||
| Total operating expenses | |||||||||||||||||
| OPERATING INCOME | |||||||||||||||||
| Interest expense, net | |||||||||||||||||
| Income before income taxes | |||||||||||||||||
| Income taxes | |||||||||||||||||
| NET INCOME | $ | $ | $ | ||||||||||||||
| BASIC NET INCOME PER COMMON SHARE | $ | $ | $ | ||||||||||||||
| DILUTED NET INCOME PER COMMON SHARE | $ | $ | $ | ||||||||||||||
| Weighted average shares outstanding - Basic | |||||||||||||||||
| Weighted average shares outstanding - Diluted | |||||||||||||||||
See accompanying Notes to Consolidated Financial Statements.
F-5
PATRICK INDUSTRIES, INC.
CONSOLIDATED STATEMENTS OF COMPREHENSIVE INCOME
| (thousands) | Year Ended December 31, | ||||||||||||||||
| 2021 | 2020 | 2019 | |||||||||||||||
| NET INCOME | $ | $ | $ | ||||||||||||||
| Other comprehensive income (loss), net of tax: | |||||||||||||||||
| Change in unrealized gain (loss) of hedge derivatives | ( | ( | |||||||||||||||
| Foreign currency translation gain (loss) | ( | ||||||||||||||||
| Other | ( | ( | |||||||||||||||
| Total other comprehensive income (loss) | ( | ( | |||||||||||||||
| COMPREHENSIVE INCOME | $ | $ | $ | ||||||||||||||
See accompanying Notes to Consolidated Financial Statements.
F-6
PATRICK INDUSTRIES, INC.
CONSOLIDATED BALANCE SHEETS
| December 31, | ||||||||||||||
| (thousands except share data) | 2021 | 2020 | ||||||||||||
| ASSETS | ||||||||||||||
| Current Assets | ||||||||||||||
| Cash and cash equivalents | $ | $ | ||||||||||||
| Trade and other receivables, net | ||||||||||||||
| Inventories | ||||||||||||||
| Prepaid expenses and other | ||||||||||||||
| Total current assets | ||||||||||||||
| Property, plant and equipment, net | ||||||||||||||
| Operating lease right-of-use-assets | ||||||||||||||
| Goodwill | ||||||||||||||
| Intangible assets, net | ||||||||||||||
| Other non-current assets | ||||||||||||||
| TOTAL ASSETS | $ | $ | ||||||||||||
| LIABILITIES AND SHAREHOLDERS’ EQUITY | ||||||||||||||
| Current Liabilities | ||||||||||||||
| Current maturities of long-term debt | $ | $ | ||||||||||||
| Current operating lease liabilities | ||||||||||||||
| Accounts payable | ||||||||||||||
| Accrued liabilities | ||||||||||||||
| Total current liabilities | ||||||||||||||
| Long-term debt, less current maturities, net | ||||||||||||||
| Long-term operating lease liabilities | ||||||||||||||
| Deferred tax liabilities, net | ||||||||||||||
| Other long-term liabilities | ||||||||||||||
| TOTAL LIABILITIES | ||||||||||||||
| COMMITMENTS AND CONTINGENCIES | ||||||||||||||
| SHAREHOLDERS’ EQUITY | ||||||||||||||
Preferred stock, | ||||||||||||||
Common stock, issued and outstanding 2021 - issued and outstanding 2020 - | ||||||||||||||
| Additional paid-in-capital | ||||||||||||||
| Accumulated other comprehensive loss | ( | ( | ||||||||||||
| Retained earnings | ||||||||||||||
| TOTAL SHAREHOLDERS’ EQUITY | ||||||||||||||
| TOTAL LIABILITIES AND SHAREHOLDERS’ EQUITY | $ | $ | ||||||||||||
See accompanying Notes to Consolidated Financial Statements.
F-7
PATRICK INDUSTRIES, INC.
CONSOLIDATED STATEMENTS OF CASH FLOWS
| (thousands) | Year Ended December 31, | ||||||||||||||||
| 2021 | 2020 | 2019 | |||||||||||||||
| CASH FLOWS FROM OPERATING ACTIVITIES | |||||||||||||||||
| Net income | $ | $ | $ | ||||||||||||||
| Adjustments to reconcile net income to net cash provided by operating activities: | |||||||||||||||||
| Depreciation and amortization | |||||||||||||||||
| Amortization of convertible notes debt discount | |||||||||||||||||
| Stock-based compensation expense | |||||||||||||||||
| Deferred income taxes | ( | ||||||||||||||||
| Other | ( | ||||||||||||||||
| Change in operating assets and liabilities, net of acquisitions of businesses: | |||||||||||||||||
| Trade and other receivables, net | ( | ( | |||||||||||||||
| Inventories | ( | ( | |||||||||||||||
| Prepaid expenses and other assets | ( | ( | ( | ||||||||||||||
| Accounts payable, accrued liabilities and other | |||||||||||||||||
| Net cash provided by operating activities | |||||||||||||||||
| CASH FLOWS FROM INVESTING ACTIVITIES | |||||||||||||||||
| Capital expenditures | ( | ( | ( | ||||||||||||||
| Proceeds from sale of property, equipment, facility and other | |||||||||||||||||
| Business acquisitions, net of cash acquired | ( | ( | ( | ||||||||||||||
| Other investing activities | ( | ||||||||||||||||
| Net cash used in investing activities | ( | ( | ( | ||||||||||||||
| CASH FLOWS FROM FINANCING ACTIVITIES | |||||||||||||||||
| Term debt borrowings | |||||||||||||||||
| Term debt repayments | ( | ( | ( | ||||||||||||||
| Borrowing on revolver | |||||||||||||||||
| Repayments on revolver | ( | ( | ( | ||||||||||||||
| Proceeds from senior notes offering | |||||||||||||||||
| Proceeds from convertible notes offering | |||||||||||||||||
| Purchase of convertible notes hedges | ( | ||||||||||||||||
| Proceeds from sale of warrants | |||||||||||||||||
| Cash dividends paid to shareholders | ( | ( | ( | ||||||||||||||
| Stock repurchases under buyback program | ( | ( | ( | ||||||||||||||
| Taxes paid for share-based payment arrangements | ( | ( | ( | ||||||||||||||
| Payment of deferred financing costs | ( | ( | ( | ||||||||||||||
| Payment of contingent consideration from business acquisitions | ( | ( | ( | ||||||||||||||
Proceeds from exercise of common stock options | |||||||||||||||||
| Net cash provided by financing activities | |||||||||||||||||
| Increase (decrease) in cash and cash equivalents | ( | ||||||||||||||||
| Cash and cash equivalents at beginning of year | |||||||||||||||||
| Cash and cash equivalents at end of year | $ | $ | $ | ||||||||||||||
See accompanying Notes to Consolidated Financial Statements.
F-8
PATRICK INDUSTRIES, INC.
CONSOLIDATED STATEMENTS OF SHAREHOLDERS' EQUITY
| (thousands except share data) | Common Stock | Additional Paid-in- Capital | Accumulated Other Comprehensive Income (Loss) | Treasury Stock | Retained Earnings | Total | ||||||||||||||||||||||||||||||||
| Balance January 1, 2019 | $ | $ | $ | ( | $ | $ | $ | |||||||||||||||||||||||||||||||
| Net income | — | — | — | — | ||||||||||||||||||||||||||||||||||
| Dividends declared | — | — | — | — | ( | ( | ||||||||||||||||||||||||||||||||
| Other comprehensive loss, net of tax | — | — | ( | — | — | ( | ||||||||||||||||||||||||||||||||
| Stock repurchases under buyback program | ( | ( | — | — | ( | ( | ||||||||||||||||||||||||||||||||
| Issuance of shares upon exercise of common stock options | — | — | — | — | ||||||||||||||||||||||||||||||||||
| Shares used to pay taxes on stock grants | ( | — | — | — | — | ( | ||||||||||||||||||||||||||||||||
| Stock-based compensation expense | — | — | — | — | ||||||||||||||||||||||||||||||||||
| Balance December 31, 2019 | $ | $ | $ | ( | $ | $ | $ | |||||||||||||||||||||||||||||||
| Net income | — | — | — | — | ||||||||||||||||||||||||||||||||||
| Dividends declared | — | — | — | — | ( | ( | ||||||||||||||||||||||||||||||||
| Other comprehensive loss, net of tax | — | — | ( | — | — | ( | ||||||||||||||||||||||||||||||||
| Stock repurchases under buyback program | ( | ( | — | — | ( | ( | ||||||||||||||||||||||||||||||||
| Issuance of shares upon exercise of common stock options | — | — | — | — | ||||||||||||||||||||||||||||||||||
| Repurchase of shares for tax payments related to the vesting and exercise of share-based grants | ( | — | — | — | — | ( | ||||||||||||||||||||||||||||||||
| Stock-based compensation expense | — | — | — | — | ||||||||||||||||||||||||||||||||||
| Balance December 31, 2020 | $ | $ | $ | ( | $ | $ | $ | |||||||||||||||||||||||||||||||
| Net income | — | — | — | — | ||||||||||||||||||||||||||||||||||
| Dividends declared | — | — | — | — | ( | ( | ||||||||||||||||||||||||||||||||
| Other comprehensive income, net of tax | — | — | — | — | ||||||||||||||||||||||||||||||||||
| Share repurchases under buyback program | ( | ( | — | ( | ( | ( | ||||||||||||||||||||||||||||||||
| Retirement of treasury stock | ( | ( | — | ( | ||||||||||||||||||||||||||||||||||
| Issuance of shares upon exercise of common stock options | — | — | — | — | ||||||||||||||||||||||||||||||||||
| Issuance of shares in connection with a business combination | — | — | — | — | ||||||||||||||||||||||||||||||||||
| Repurchase of shares for tax payments related to the vesting and exercise of share-based grants | ( | — | — | — | — | ( | ||||||||||||||||||||||||||||||||
| Stock-based compensation expense | — | — | — | — | ||||||||||||||||||||||||||||||||||
Purchase of convertible notes hedges, net of tax of $ | — | ( | — | — | — | ( | ||||||||||||||||||||||||||||||||
| Proceeds from sale of warrants | — | — | — | — | ||||||||||||||||||||||||||||||||||
Equity component of convertible note issuance, net of tax of $ | — | — | — | — | ||||||||||||||||||||||||||||||||||
| Balance December 31, 2021 | $ | $ | $ | ( | $ | $ | $ | |||||||||||||||||||||||||||||||
See accompanying Notes to Consolidated Financial Statements.
F-9
PATRICK INDUSTRIES, INC.
NOTES TO CONSOLIDATED FINANCIAL STATEMENTS
1. BASIS OF PRESENTATION AND SIGNIFICANT ACCOUNTING POLICIES
Nature of Business
Patrick Industries, Inc. (“Patrick” or the “Company”) operations consist of the manufacture and distribution of component products and materials for use primarily by the recreational vehicle (“RV”), marine, manufactured housing (“MH”) and industrial markets for customers throughout the United States and Canada. At December 31, 2021, the Company maintained 174 manufacturing plants and 64 distribution facilities located in 23 states with a small presence in China and Canada. Patrick operates in two business segments: Manufacturing and Distribution.
Principles of Consolidation
The accompanying consolidated financial statements have been prepared pursuant to the rules and regulations of the Securities and Exchange Commission and in accordance with accounting principles generally accepted in the United States of America (“U.S. GAAP”). The consolidated financial statements include the accounts of Patrick and its wholly owned subsidiaries. All intercompany accounts and transactions have been eliminated in consolidation.
Financial Periods
The Company maintains its financial records on the basis of a fiscal year ending on December 31, with the fiscal quarters spanning thirteen weeks, with the first, second and third quarters ending on the Sunday closest to the end of the first, second and third 13-week periods, respectively. The first three quarters of fiscal year 2021 ended on March 28, 2021, June 27, 2021 and September 26, 2021. The first three quarters of fiscal year 2020 ended on March 29, 2020, June 28, 2020 and September 27, 2020. The first three quarters of fiscal year 2019 ended on March 31, 2019, June 30, 2019 and September 29, 2019.
Use of Estimates
The preparation of the consolidated financial statements in conformity with U.S. GAAP requires management to make estimates and assumptions that affect the amounts reported in the consolidated financial statements and accompanying notes. Estimates include the valuation of goodwill and indefinite-lived intangible assets, the valuation of long-lived assets, the allowance for doubtful accounts, excess and obsolete inventories, assets acquired and liabilities assumed in a business combination, the valuation of estimated contingent consideration and deferred tax asset valuation allowances. Actual results could differ from the amounts reported.
See Note 3 for further information on our revenue recognition accounting policies.
Costs and Expenses
Cost of goods sold includes material costs, direct and indirect labor, depreciation, overhead expenses, inbound freight charges, inspection costs, internal transfer costs, receiving costs, and other costs.
F-10
Net Income Per Common Share
Basic net income per common share is computed by dividing net income by the weighted-average number of common shares outstanding. Diluted net income per common share is computed by dividing net income by the weighted-average number of common shares outstanding, plus the dilutive effect of stock options, SARS, and certain restricted stock awards (collectively, “Common Stock Equivalents”). The dilutive effect of Common Stock Equivalents is calculated under the treasury stock method using the average market price for the period. Common Stock Equivalents are not included in the computation of diluted net income per common share if their effect would be anti-dilutive. See Note 14 for the calculation of both basic and diluted net income per common share.
Cash and Cash Equivalents
The Company considers all highly liquid investments with a maturity of three months or less at the time of purchase to be cash equivalents.
Allowance for doubtful accounts was immaterial at December 31, 2021 and 2020, and changes in the allowance were immaterial for the years ended December 31, 2021, 2020, and 2019.
Inventories
Inventories are generally stated at the lower of cost (first-in, first-out method or, for certain inventories, average costing method) and net realizable value. Based on the inventory aging and other considerations for realizable value, the Company writes down the carrying value to net realizable value where appropriate. The Company reviews inventory on-hand and records provisions for excess and obsolete inventory based on current assessments of future demand, market conditions, and related management initiatives. The cost of manufactured inventories includes raw materials, inbound freight, labor and overhead. The Company’s distribution inventories include the cost of materials purchased for resale and inbound freight.
F-11
Prepaid Expenses and Other
Prepaid expenses and other consists of the following at December 31, 2021 and 2020:
| (thousands) | 2021 | 2020 | ||||||||||||
| Vendor rebates receivable | $ | $ | ||||||||||||
| Prepaid expenses | ||||||||||||||
| Vendor and other deposits | ||||||||||||||
| Total | $ | $ | ||||||||||||
Property, Plant and Equipment
Property, plant and equipment (“PP&E”) is generally recorded at cost. Depreciation is computed primarily by the straight-line method applied to individual items based on estimated useful lives, which generally range from 10 to 30 years for buildings and improvements, and from to seven years for machinery, equipment and transportation equipment. Leasehold improvements are amortized over the lesser of their useful lives or the related lease term. The recoverability of PP&E is evaluated whenever events or changes in circumstances indicate that the carrying amount of the assets may not be recoverable, primarily based on estimated selling price, appraised value or projected future cash flows.
Goodwill and Intangible Assets
Goodwill and indefinite-lived intangible assets are not amortized but are subject to an annual impairment test based on their estimated fair value. The Company performs the required test for goodwill and indefinite-lived intangible assets for impairment in the fourth quarter, or more frequently, if events or changes in circumstances indicate that the carrying value may exceed the fair value. As part of the annual goodwill test, we estimate the fair value of our reporting units using both an income and market based approach. The market approach includes a comparison of multiples of earnings before interest, taxes, depreciation and amortization for the reporting units to similar businesses or guideline companies whose securities are actively traded in public markets. The income approach calculates the present value of expected cash flows to determine the estimated fair value of our reporting units. Additionally, the income approach requires us to estimate future cash flows, the timing of these cash flows, and a discount rate (based on a weighted average cost of capital), which represents the time value of money and the inherent risk and uncertainty of the future cash flows. The assumptions we use to estimate future cash flows are consistent with the assumptions that our reporting units use for internal planning purposes. When calculating the present value of future cash flows under the income approach, we take into consideration multiple variables, including forecasted sales volumes and operating income, current industry and economic conditions, and historical results.
Impairment of Long-Lived Assets
When events or conditions warrant, the Company evaluates the recoverability of long-lived assets other than goodwill and indefinite-lived intangible assets and considers whether these assets are impaired. The Company assesses the recoverability of these assets based upon several factors, including management's intention with respect to the assets and their projected future undiscounted cash flows. If projected undiscounted cash flows are less than the carrying amount of the assets, the Company adjusts the carrying amounts of such assets to their estimated fair value. A significant adverse change in the Company’s business climate in future periods could result in a significant loss of market share or the inability to achieve previously projected revenue growth and could lead to a required assessment of the recoverability of the Company’s long-lived assets, which may subsequently result in an impairment charge. Definite-lived intangible assets are amortized over their useful lives, as detailed further in Note 7, and are also subject to an impairment test based on estimated undiscounted cash flows when impairment indicators exist.
F-12
Fair Value and Financial Instruments
The Company accounts for certain assets and liabilities at fair value. The fair values are separated into three broad levels (Levels 1, 2 and 3) based on the assessment of the availability of observable market data and the significance of non-observable data used to determine fair value. Each fair value measurement must be assigned to a level corresponding to the lowest level input that is significant to the fair value measurement in its entirety. The three levels are as follows:
•Level 1 inputs, which are quoted prices (unadjusted) in active markets for identical assets or liabilities that the reporting entity has the ability to access at the measurement date.
•Level 2 inputs, which are inputs other than quoted prices included within Level 1 that are observable for the asset or liability, either directly or indirectly. If the asset or liability has a specified (contractual) term, a Level 2 input must be observable for substantially the full term of the asset or liability.
•Level 3 inputs, which are unobservable inputs for the asset or liability. These unobservable inputs reflect the entity’s own assumptions about the assumptions that market participants would use in pricing the asset or liability, and are developed based on the best information available in the circumstances (which might include the reporting entity’s own data).
| 2021 | 2020 | |||||||||||||||||||||||||
| (in millions) | Level 1 | Level 2 | Level 3 | Level 1 | Level 2 | Level 3 | ||||||||||||||||||||
Cash equivalents(1) | $ | $ | $ | $ | $ | $ | ||||||||||||||||||||
Term loan due 2026(3) | ||||||||||||||||||||||||||
Revolver due 2026(3) | ||||||||||||||||||||||||||
Interest rate swaps(4) | ||||||||||||||||||||||||||
Contingent consideration(5) | ||||||||||||||||||||||||||
(1) The carrying amounts of cash equivalents, representing government and other money market funds traded in an active market with relatively short maturities, are reported on the consolidated balance sheet as of December 31, 2021 as a component of "Cash and cash equivalents".
(2) The amounts of these notes listed above are the fair values for disclosure purposes only, and they are recorded in the Company's consolidated balance sheets as of December 31, 2021 and 2020 using the interest rate method.
(3) The carrying amounts of our term loan and revolver approximate fair value as of December 31, 2021 and 2020 based upon their terms and conditions in comparison to the terms and conditions of debt instruments with similar terms and conditions available at those dates.
(4) The interest rate swaps are discussed further in Note 9.
(5) The estimated fair value of the Company's contingent consideration is discussed further in Note 4.
Income Taxes
Income tax expense is calculated based on statutory tax rates of the federal, state, and international jurisdictions in which the Company operates and income earned or apportioned to each of these respective jurisdictions, as well as any additional tax planning available to the Company in these jurisdictions. Certain income and expenses are not reported in tax returns and financial statements in the same year. The tax effect of such temporary differences is reported as deferred income taxes.
Deferred taxes are provided on an asset and liability method whereby deferred taxes are recognized based on temporary differences between the reported amounts of assets and liabilities and their tax basis. Deferred tax assets are reduced by a valuation allowance when it is more likely than not that some portion or all of the deferred tax assets may not be realized.
F-13
Reclassified Amounts
Certain amounts have been reclassified in prior year financial statements to conform with current year presentation, and these reclassifications have no impact on the overall financial information.
2. RECENTLY ISSUED ACCOUNTING PRONOUNCEMENTS
Income Taxes
In December 2019, the FASB issued ASU 2019-12, "Income Taxes (Topic 740): Simplifying the Accounting for Income Taxes", a new standard to simplify the accounting for income taxes. The guidance eliminates certain exceptions related to the approach for intraperiod tax allocation, the methodology for calculating income taxes in an interim period, and the recognition of deferred tax liabilities for outside basis differences related to changes in ownership of equity method investments and foreign subsidiaries. The guidance also simplifies aspects of accounting for franchise taxes and enacted changes in tax laws or rates, and clarifies the accounting for transactions that result in a step-up in the tax basis of goodwill. The standard was effective for fiscal years beginning after December 15, 2020, with early adoption permitted. The Company adopted ASU 2019-12 on January 1, 2021 and the adoption did not have a material effect on its consolidated financial statements.
Reference Rate Reform
In March 2020, the FASB issued ASU 2020-04, "Reference Rate Reform (Topic 848)", a new standard providing final guidance to provide temporary optional expedients and exceptions to the U.S. GAAP guidance on contract modifications and hedge accounting to ease the financial reporting burdens of the expected market transition from LIBOR and other interbank offered rates to alternative reference rates, such as SOFR. Entities can elect not to apply certain modification accounting requirements to contracts affected by what the guidance calls reference rate reform, if certain criteria are met. An entity that makes this election would not have to remeasure the contracts at the modification date or reassess a previous accounting determination. Entities can elect various optional expedients that would allow them to continue applying hedge accounting for hedging relationships affected by reference rate reform, if certain criteria are met. The guidance was effective upon issuance and generally can be applied through December 31, 2022. The Company is currently evaluating the impact of this standard on our consolidated financial statements.
Accounting for Convertible Instruments and Contracts in an Entity's Own Equity
In August 2020, the FASB issued ASU 2020-06, "Accounting for Convertible Instruments and Contracts in an Entity's Own Equity", a new standard that simplifies certain accounting treatments for convertible debt instruments. The guidance eliminates certain requirements that require separate accounting for embedded conversion features and simplifies the settlement assessment that entities are required to perform to determine whether a contract qualifies for equity classification. In addition, the new guidance requires entities use the if-converted method for certain convertible instruments in the diluted net income per share calculation and include the effect of potential share settlement for instruments that may be settled in cash or shares, with certain exceptions. Furthermore, the guidance requires new disclosures about events that occur during the reporting period that cause conversion contingencies to be met and about the fair value of convertible debt at the instrument level, among other things. The guidance is effective for fiscal years beginning after December 15, 2021, with early adoption permitted. We expect to adopt ASU 2020-06 using a modified transition approach. The primary impact on our consolidated financial statements as a result of the adoption of ASU 2020-06 will be a reduction in non-cash interest expense for our 1.00 % Convertible Notes due 2023 (described in Note 8) as well as a reduction in diluted net income per share attributable to the application of the if-converted method for our 1.00 % Convertible Notes due 2023.
F-14
3. REVENUE RECOGNITION
The Company is a major manufacturer and distributor of component products and materials serving original equipment manufacturers and other customers in the RV, MH, marine, and industrial industries. Revenue is recognized when or as control of the promised goods transfers to the Company's customers in an amount that reflects the consideration the Company expects to be entitled to in exchange for those goods. The Company’s contracts typically consist of a single performance obligation to manufacture and provide the promised goods. To the extent a contract is deemed to have multiple performance obligations, the Company allocates the transaction price of the contract to each performance obligation using the standalone selling price of each distinct good in the contract. The transaction price for contracts may include reductions to the transaction price for estimated volume discounts and rebates and other customer incentives.
Manufacturing segment revenue is recognized when control of the products transfers to the customer which is the point when the customer gains the ability to direct the use of and obtain substantially all the remaining benefits from the asset, which is generally upon delivery of goods, or upon shipment of goods in certain circumstances. In limited circumstances, where the products are customer specific with no alternative use to the Company, and the Company has a legally enforceable right to payment for performance to date with a reasonable margin, revenue is recognized over the contract term based on the cost-to-cost method. However, such revenue is not material to the consolidated financial statements.
F-15
In the following table, revenue from contracts with customers, net of intersegment sales, is disaggregated by market type and by reportable segment, consistent with how the Company believes the nature, amount, timing, and uncertainty of revenue and cash flows are affected by economic factors:
| Year Ended December 31, 2021 | ||||||||||||||||||||
| (thousands) | Manufacturing | Distribution | Total | |||||||||||||||||
| Market type: | ||||||||||||||||||||
| Recreational Vehicle | $ | $ | $ | |||||||||||||||||
| Marine | ||||||||||||||||||||
| Manufactured Housing | ||||||||||||||||||||
| Industrial | ||||||||||||||||||||
| Total | $ | $ | $ | |||||||||||||||||
| Year Ended December 31, 2020 | ||||||||||||||||||||
| (thousands) | Manufacturing | Distribution | Total | |||||||||||||||||
| Market type: | ||||||||||||||||||||
| Recreational Vehicle | $ | $ | $ | |||||||||||||||||
| Marine | ||||||||||||||||||||
| Manufactured Housing | ||||||||||||||||||||
| Industrial | ||||||||||||||||||||
| Total | $ | $ | $ | |||||||||||||||||
| Year Ended December 31, 2019 | ||||||||||||||||||||
| (thousands) | Manufacturing | Distribution | Total | |||||||||||||||||
| Market type: | ||||||||||||||||||||
| Recreational Vehicle | $ | $ | $ | |||||||||||||||||
| Marine | ||||||||||||||||||||
| Manufactured Housing | ||||||||||||||||||||
| Industrial | ||||||||||||||||||||
| Total | $ | $ | $ | |||||||||||||||||
Sales and other taxes collected concurrent with revenue-producing activities are excluded from net sales.
The Company records freight billed to customers in net sales. The corresponding costs incurred for shipping and handling related to these customer billed freight costs are accounted for as costs to fulfill the contract and are included in warehouse and delivery expenses.
The Company’s contracts across each of its businesses typically do not result in situations where there is a time period greater than one year between performance under the contract and collection of the related consideration. The Company does not account for a significant financing component when the Company expects, at contract inception, that the period between the Company's transfer of a promised good or service to a customer and the customer’s payment for that good or service will be one year or less.
The Company recognizes the incremental costs of obtaining contracts as an expense when incurred if the amortization period of the incurred costs that the Company otherwise would have capitalized is one year or less. These costs, representing primarily sales commissions, are included in selling, general and administrative expenses.
The Company does not disclose information about the transaction price being allocated to the remaining performance obligations at period end, as the Company does not have material contracts that have original expected durations of more than one year.
F-16
4. ACQUISITIONS
The Company completed the acquisitions discussed below during the years ended December 31, 2021, 2020 and 2019. The acquisitions were funded through cash on hand, issuance of shares, or borrowings under the Company’s credit facility in existence at the time of acquisition. For each of the acquisitions discussed, we either acquired the assets and assumed the liabilities of the business, or acquired 100 % of the equity interests. Assets acquired and liabilities assumed in the individual acquisitions were recorded on the Company’s consolidated balance sheet at their estimated fair values as of the respective dates of acquisition. For each acquisition, the Company completes its allocation of the purchase price to the fair value of acquired assets and liabilities within a one-year measurement period. For those acquisitions where the purchase price allocation is provisional, which includes certain acquisitions completed in 2021, the Company is still in the process of finalizing the fair values of acquired intangible assets and fixed assets. In general, the acquisitions described below provided the opportunity for the Company to either establish a new presence in a particular market and/or expand its product offerings in an existing market and increase its market share and per unit content.
For each acquisition, the excess of the purchase consideration over the fair value of the net assets acquired is recorded as goodwill, which generally represents the combined value of the Company’s existing purchasing, manufacturing, sales, and systems resources with the organizational talent and expertise of the acquired companies’ respective management teams to maximize efficiencies, revenue impact, market share growth and net income.
For the years ended December 31, 2021, 2020 and 2019, revenue of approximately $259.9 million, $81.9 million and $8.3 million, respectively, was included in the Company’s consolidated statements of income pertaining to the businesses acquired in each such respective year.
For the years ended December 31, 2021, 2020 and 2019, operating income of approximately $25.0 million, $10.7 million and $0.9 million, respectively, was included in the Company’s consolidated statements of income pertaining to the businesses acquired in each such respective year. Acquisition-related costs associated with the businesses acquired in 2021, 2020 and 2019 were immaterial in each respective year.
Contingent Consideration
In connection with certain acquisitions, if certain financial results for the acquired businesses are achieved, the Company is required to pay additional cash consideration. The Company records a liability for the fair value of the contingent consideration related to each of these acquisitions as part of the initial purchase price based on the present value of the expected future cash flows and the probability of future payments at the date of acquisition.
The aggregate fair value of the contingent consideration as of December 31, 2021 was $12.3 million, $7.0 million of which is included in the line item "Accrued liabilities" and $5.3 million is included in “Other long-term liabilities” on the consolidated balance sheet. At December 31, 2020, the fair value was $6.9 million, $1.6 million of which was included in the line item "Accrued liabilities" and $5.3 million was included in "Other long-term liabilities". The liability for contingent consideration expires at various dates through December 2023. The contingent consideration arrangements are subject to a maximum payment amount of up to $19.6 million in the aggregate as of December 31, 2021. In 2021, the Company recorded a $3.4 million in non-cash increases to contingent consideration liabilities, which is included within selling, general and administrative expense in the consolidated statement of income, representing changes in the amount of consideration expected to be paid. These charges relate to changes in projected performance of certain acquisitions compared to the projected performance originally used in calculating the projected fair values of the contingent consideration of such acquisitions. In 2021, the Company made cash payments of approximately $2.5 million related to contingent consideration liabilities, recording a corresponding reduction to accrued liabilities.
F-17
2021 Acquisitions
The Company completed the following seven previously announced acquisitions in the year ended December 31, 2021 (together with six acquisitions not described below, the "2021 Acquisitions"):
| Company | Segment | Description | ||||||||||||
| Sea-Dog Corporation & Sea-Lect Plastics (collectively, "Sea-Dog") | Distribution & Manufacturing | Distributor of a variety of marine and powersports hardware and accessories to distributors, wholesalers, retailers, and manufacturers and provider of plastic injection molding, design, product development and expert tooling to companies and government entities, based in Everett, Washington, acquired in March 2021. | ||||||||||||
| Hyperform, Inc. | Manufacturing | Manufacturer of high-quality, non-slip foam flooring, operating under the SeaDek brand name, for the marine original equipment manufacturer ("OEM") market and aftermarket as well as serving the pool and spa, powersports and utility markets under the SwimDek and EndeavorDek brand names, with manufacturing facilities in Rockledge, Florida and Cocoa, Florida, acquired in April 2021. | ||||||||||||
| Alpha Systems, LLC | Manufacturing & Distribution | Manufacturer and distributor of component products and accessories for the RV, marine, manufactured housing and industrial end markets that includes adhesives, sealants, rubber roofing, roto/blow molding and injection molding products, flooring, insulation, shutters, skylights, and various other products and accessories, operating out of | ||||||||||||
| Coyote Manufacturing Company | Manufacturing | Designer, fabricator, and manufacturer of a variety of steel and aluminum products, including boat trailers, towers, T-tops, leaning posts, and other custom components primarily for the marine OEM market, based in Nashville, Georgia, acquired in August 2021. | ||||||||||||
| Tumacs Covers | Manufacturing | Manufacturer of custom designed boat covers, canvas frames, and bimini tops, primarily serving large marine OEMs and dealers, headquartered in Pittsburgh, Pennsylvania, with manufacturing facilities in Indiana and Pennsylvania, and a distribution/service center in Michigan, acquired in August 2021. | ||||||||||||
| Wet Sounds, Inc. & Katalyst Industries LLC (collectively "Wet Sounds") | Manufacturing | Designer, engineer, and fabricator of innovative audio systems and accessories, including amplifiers, tower speakers, soundbars, and subwoofers sold directly to OEMs and consumers, and to dealers and retailers, primarily within the marine market as well as to the home audio and powersports markets and aftermarkets, based in Rosenburg, Texas, acquired in November 2021. | ||||||||||||
| Williamsburg Marine LLC & Williamsburg Furniture, Inc. (collectively "Williamsburg") | Manufacturing | Manufacturer of seating for the RV and marine end markets sold primarily to OEMs, based in Milford and Nappanee, Indiana, acquired in November 2021. | ||||||||||||
Total cash consideration for the 2021 Acquisitions was approximately $509.8 million, plus contingent consideration over a to three-year period based on future performance in connection with certain acquisitions. The preliminary purchase price allocations are subject to valuation activities being finalized, and thus certain purchase accounting adjustments are subject to change within the measurement period as the Company finalizes its estimates. Changes to preliminary purchase accounting estimates recorded in 2021 related to the 2021 Acquisitions were immaterial.
F-18
2020 Acquisitions
The Company completed the following seven previously announced acquisitions in the year ended December 31, 2020 (together with four acquisitions not mentioned below, the "2020 Acquisitions"):
| Company | Segment | Description | ||||||||||||
| Maple City Woodworking Corporation | Manufacturing | Manufacturer of hardwood cabinet doors and fascia for the RV market based in Goshen, Indiana, acquired in March 2020. | ||||||||||||
| SEI Manufacturing, Inc. | Manufacturing | Manufacturer of towers, T-Tops, hardtops, rails, gates and other aluminum exterior products for the marine market located in Cromwell, Indiana, acquired in March 2020. | ||||||||||||
| Inland Plywood Company | Manufacturing | Supplier, laminator, and wholesale distributor of treated, untreated, and laminated plywood, medium density overlay panels, and other specialty products, primarily serving the marine market as well as the RV and industrial markets headquartered in Pontiac, Michigan with an additional facility in Cocoa, Florida, acquired in August 2020. | ||||||||||||
| Synergy RV Transport | Distribution | Transportation and logistics service provider primarily for original equipment manufacturers and dealers in the RV market located in Goshen, Indiana, acquired in August 2020. | ||||||||||||
| Front Range Stone | Manufacturing | Fabricator and installer of natural stone, quartz, solid surface, and laminate countertops, primarily serving big box home improvement retailers, home builders and commercial contractors in the industrial market based in Englewood, Colorado, acquired in September 2020. | ||||||||||||
| Geremarie Corporation | Manufacturing | Designer, manufacturer, and fabricator of a full suite of high-precision aluminum components serving the marine industry, in addition to the medical, aerospace, defense, commercial and industrial markets located in Lake Zurich, Illinois, acquired in November 2020. | ||||||||||||
| Taco Metals, LLC | Manufacturing | Manufacturer of boating products including rub rail systems, canvas and tower components, sport fishing and outrigger systems, helm chairs and pedestals, and specialty hardware for leading OEMs in the recreational boating industry and the related aftermarket headquartered in Miami, Florida, with manufacturing facilities in Tennessee and Florida, and distribution centers in Tennessee, Florida, South Carolina, and Massachusetts, acquired in November 2020. | ||||||||||||
Total cash consideration for the 2020 Acquisitions was approximately $307.0 million, plus contingent consideration over a to three-year period based on future performance in connection with certain acquisitions. One acquisition in 2020 accounted for $129.7 million in cash consideration, contingent consideration with an initial fair value of $3.4 million (subject to a $10.0 million maximum), $1.6 million in accounts receivable, $2.9 million in inventory, $49.0 million in fixed assets, $49.1 million in intangible assets (composed of $42.6 million in customer relationships, $0.6 million in non-competition agreements, and $5.9 million in trademarks), $2.6 million in accounts payable and accrued liabilities, $4.9 million in operating lease right-of-use assets and liabilities, and $32.9 million in goodwill. Purchase price allocations and all valuation activities in connection with the 2020 Acquisitions have been finalized. Changes to preliminary purchase accounting estimates recorded in 2021 related to the 2020 Acquisitions were immaterial and relate primarily to the valuation of intangible and fixed assets.
2019 Acquisitions
The Company completed the following two previously announced acquisitions in the year ended December 31, 2019 (together with two acquisitions not mentioned below, the "2019 Acquisitions"):
| Company | Segment | Description | ||||||||||||
| G.G. Schmitt & Sons, Inc. | Manufacturing | Designer and manufacturer of customized hardware and structural components for the marine industry based in Sarasota, Florida, acquired in September 2019. | ||||||||||||
| Topline Counters, LLC | Manufacturing | Designer and manufacturer of kitchen and bathroom countertops for residential and commercial markets based in Sumner, Washington, acquired in December 2019. | ||||||||||||
Total cash consideration for the 2019 Acquisitions was $53.3 million, plus contingent consideration over a one year period based on future performance in connection with one acquisition. Purchase price allocations and all valuation activities in connection with the 2019 Acquisitions have been finalized.
F-19
The following table summarizes the fair values of the assets acquired and liabilities assumed as of the date of the acquisition for 2021, 2020 and 2019 Acquisitions:
| 2021 Acquisitions | 2020 Acquisitions | 2019 Acquisitions | ||||||||||||||||||||||||||||||||||||||||||
| (thousands) | A | B | All Others | Total | ||||||||||||||||||||||||||||||||||||||||
| Consideration | ||||||||||||||||||||||||||||||||||||||||||||
| Cash, net of cash acquired | $ | $ | $ | $ | $ | $ | ||||||||||||||||||||||||||||||||||||||
Working capital holdback and other, net(1) | ||||||||||||||||||||||||||||||||||||||||||||
Common stock issuance(2) | ||||||||||||||||||||||||||||||||||||||||||||
Contingent consideration(3) | ||||||||||||||||||||||||||||||||||||||||||||
| Total consideration | ||||||||||||||||||||||||||||||||||||||||||||
| Assets Acquired | ||||||||||||||||||||||||||||||||||||||||||||
| Trade receivables | $ | $ | $ | $ | $ | $ | ||||||||||||||||||||||||||||||||||||||
| Inventories | ||||||||||||||||||||||||||||||||||||||||||||
| Prepaid expenses & other | ||||||||||||||||||||||||||||||||||||||||||||
| Property, plant & equipment | ||||||||||||||||||||||||||||||||||||||||||||
| Operating lease right-of-use assets | ||||||||||||||||||||||||||||||||||||||||||||
| Identifiable intangible assets | ||||||||||||||||||||||||||||||||||||||||||||
| Liabilities Assumed | ||||||||||||||||||||||||||||||||||||||||||||
| Current portion of operating lease obligations | ( | ( | ( | ( | ( | ( | ||||||||||||||||||||||||||||||||||||||
| Accounts payable & accrued liabilities | ( | ( | ( | ( | ( | ( | ||||||||||||||||||||||||||||||||||||||
| Operating lease obligations | ( | ( | ( | ( | ( | ( | ||||||||||||||||||||||||||||||||||||||
| Deferred tax liabilities | ( | ( | ( | ( | ||||||||||||||||||||||||||||||||||||||||
| Total fair value of net assets acquired | ||||||||||||||||||||||||||||||||||||||||||||
Goodwill(4) | ||||||||||||||||||||||||||||||||||||||||||||
| $ | $ | $ | $ | $ | $ | |||||||||||||||||||||||||||||||||||||||
(1) Certain acquisitions contain working capital holdbacks which are typically settled in a 90 -day period following the close of the acquisition. This value represents the remaining amounts due to (from) sellers as of December 31, 2021.
(2) In connection with one acquisition, the Company issued 113,961 shares of common stock at a closing price of $89.60 as of the acquisition date.
(3) These amounts reflect the acquisition date fair value of contingent consideration based on future results relating to certain acquisitions. Contingent consideration associated with Company A is valued at $3.5 million, but subject to a $6.0 million maximum.
F-20
We estimate the value of acquired property, plant, and equipment using a combination of the income, cost, and market approaches, such as estimates of future income growth, capitalization rates, discount rates, and capital expenditure needs of the acquired businesses.
The following table presents our estimates of identifiable intangibles for the 2021, 2020, and 2019 Acquisitions:
| (thousands except year data) | Estimated Useful Life (in years) | 2021 Acquisitions | 2020 Acquisitions | 2019 Acquisitions | ||||||||||||||||||||||
| Customer relationships | $ | $ | $ | |||||||||||||||||||||||
| Non-compete agreements | ||||||||||||||||||||||||||
| Patents | ||||||||||||||||||||||||||
| Trademarks | Indefinite | |||||||||||||||||||||||||
| $ | $ | $ | ||||||||||||||||||||||||
We estimate the value of customer relationships using the multi-period excess earnings method, which is a variation of the income approach, calculating the present value of incremental after-tax cash flows attributable to the asset. Non-compete agreements are valued using a discounted cash flow approach, which is a variation of the income approach, with and without the individual counterparties to the non-compete agreements. Trademarks and patents are valued using the relief-from-royalty method, which applies an estimated royalty rate to forecasted future cash flows, discounted to present value.
For the first of our 2021 Acquisitions individually outlined in the purchase price allocation table above, the $85.0 million in identifiable intangible assets consists of $47.7 million in customer relationships, $1.2 million in non-compete agreements, $8.6 million in patents (estimated useful life of 12 to 14 years), and $27.5 million in trademarks. For the second of our 2021 Acquisitions individually outlined in the purchase price allocation table above, the $78.3 million in identifiable intangible assets consists of provisional estimates of $51.8 million in customer relationships, $1.7 million in non-compete agreements, $13.5 million in patents (estimated useful life of 10 to 12 years), and $11.4 million in trademarks.
Pro Forma Information (Unaudited)
The following pro forma information assumes the 2021 Acquisitions and 2020 Acquisitions occurred as of the beginning of the year immediately preceding each such acquisition. The pro forma information contains the actual operating results of each of the 2021 Acquisitions and 2020 Acquisitions, combined with the results prior to their respective acquisition dates, adjusted to reflect the pro forma impact of the acquisitions occurring as of the beginning of the year immediately preceding each such acquisition.
The pro forma information includes financing and interest expense charges based on the actual incremental borrowings incurred in connection with each transaction as if it occurred as of the beginning of the year immediately preceding each such acquisition.
In addition, the pro forma information includes incremental amortization expense related to intangible assets acquired of $10.5 million and $27.3 million for the years ended December 31, 2021 and 2020, respectively, in connection with the acquisitions as if they occurred as of the beginning of the year immediately preceding each such acquisition.
| (thousands except per share data) | 2021 | 2020 | ||||||||||||
| Net sales | $ | $ | ||||||||||||
| Net income | ||||||||||||||
| Basic net income per common share | ||||||||||||||
| Diluted net income per common share | ||||||||||||||
The pro forma information is presented for informational purposes only and is not necessarily indicative of the results of operations that actually would have been achieved had the acquisitions been consummated as of that time, nor is it intended to be a projection of future results.
F-21
5. INVENTORIES
Inventories as of December 31, 2021 and 2020 consist of the following:
| (thousands) | 2021 | 2020 | ||||||||||||
| Raw materials | $ | $ | ||||||||||||
| Work in process | ||||||||||||||
| Finished goods | ||||||||||||||
| Less: reserve for inventory excess and obsolescence | ( | ( | ||||||||||||
| Total manufactured goods, net | ||||||||||||||
| Materials purchased for resale (distribution products) | ||||||||||||||
| Less: reserve for inventory excess and obsolescence | ( | ( | ||||||||||||
| Total materials purchased for resale (distribution products), net | ||||||||||||||
| Total inventories | $ | $ | ||||||||||||
6. PROPERTY, PLANT AND EQUIPMENT
Property, plant and equipment, net, consists of the following at December 31, 2021 and 2020:
| (thousands) | 2021 | 2020 | ||||||||||||
| Land and improvements | $ | $ | ||||||||||||
| Building and improvements | ||||||||||||||
| Machinery and equipment | ||||||||||||||
| Transportation equipment | ||||||||||||||
| Leasehold improvements | ||||||||||||||
| Property, plant and equipment, at cost | ||||||||||||||
| Less: accumulated depreciation and amortization | ( | ( | ||||||||||||
| Property, plant and equipment, net | $ | $ | ||||||||||||
Total depreciation expense for property, plant and equipment for fiscal 2021, 2020, and 2019 was $48.5 million, $32.3 million and $26.9 million, respectively.
7. GOODWILL AND INTANGIBLE ASSETS
Changes in the carrying amount of goodwill for the years ended December 31, 2021 and 2020 by segment are as follows:
| (thousands) | Manufacturing | Distribution | Total | |||||||||||||||||
| Balance - January 1, 2020 | $ | $ | $ | |||||||||||||||||
| Acquisitions | ||||||||||||||||||||
| Adjustment to prior year preliminary purchase price allocation | ( | ( | ||||||||||||||||||
| Balance - December 31, 2020 | ||||||||||||||||||||
| Acquisitions | ||||||||||||||||||||
| Adjustment to prior year preliminary purchase price allocation | ||||||||||||||||||||
| Balance - December 31, 2021 | $ | $ | $ | |||||||||||||||||
As of December 31, 2021 and 2020, accumulated impairment of goodwill in the Manufacturing segment was $27.4
F-22
Intangible assets, net consist of the following at December 31, 2021 and 2020:
| (thousands) | 2021 | 2020 | ||||||||||||
| Customer relationships | $ | $ | ||||||||||||
| Non-compete agreements | ||||||||||||||
| Patents | ||||||||||||||
| Trademarks | ||||||||||||||
| Less: accumulated amortization | ( | ( | ||||||||||||
| Intangible assets, net | $ | $ | ||||||||||||
Changes in the carrying value of intangible assets for the years ended December 31, 2021 and 2020 by segment are as follows:
| (thousands) | Manufacturing | Distribution | Total | |||||||||||||||||
| Balance - January 1, 2020 | $ | $ | $ | |||||||||||||||||
| Acquisitions | ||||||||||||||||||||
| Amortization | ( | ( | ( | |||||||||||||||||
Impairment of intangible assets (1) | ( | ( | ( | |||||||||||||||||
| Adjustment to prior year preliminary purchase price allocation | ( | |||||||||||||||||||
| Balance - December 31, 2020 | ||||||||||||||||||||
| Acquisitions | ||||||||||||||||||||
| Amortization | ( | ( | ( | |||||||||||||||||
| Adjustment to prior year preliminary purchase price allocation | ( | ( | ||||||||||||||||||
| Balance - December 31, 2021 | $ | $ | $ | |||||||||||||||||
(1) Certain operations permanently ceased activities during the year ended December 31, 2020. As a result, we recorded approximately $2.0 million in pre-tax impairment of customer relationships and trademarks of these operations after determining the net carrying value of the assets was no longer recoverable. The impairment was calculated using our internal projections of discounted cash flows, which rely on Level 3 inputs in the fair value hierarchy based on the unobservable nature of the underlying data. The impairment was recorded in selling, general and administrative in our consolidated statements of income for the year ended December 31, 2020.
Amortization expense for the next five fiscal years ending December 31 related to definite-lived intangible assets as of December 31, 2021 is estimated to be as follows (in thousands):
| 2022 | $ | ||||
| 2023 | |||||
| 2024 | |||||
| 2025 | |||||
| 2026 | |||||
F-23
8. DEBT
A summary of total debt outstanding at December 31, 2021 and 2020 is as follows:
| (thousands) | 2021 | 2020 | ||||||||||||
| Long-term debt: | ||||||||||||||
| $ | $ | |||||||||||||
| Term loan due 2026 | ||||||||||||||
| Revolver due 2026 | ||||||||||||||
| Total long-term debt | ||||||||||||||
| Less: convertible notes debt discount, net | ( | ( | ||||||||||||
| Less: term loan deferred financing costs, net | ( | ( | ||||||||||||
| Less: senior notes deferred financing costs, net | ( | ( | ||||||||||||
| Less: current maturities of long-term debt | ( | ( | ||||||||||||
| Total long-term debt, less current maturities, net | $ | $ | ||||||||||||
In December 2021, the Company issued $258.75 million aggregate principal amount of 1.75 % Convertible Senior Notes due 2028 (the “1.75 % Convertible Notes”). The total debt discount of $56.1 million at issuance consisted of two components: (i) the conversion option component, recorded to shareholders' equity, in the amount of $48.8 million, representing the difference between the principal amount of the 1.75 % Convertible Notes upon issuance less the present value of the future cash flows of the 1.75 % Convertible Notes using a borrowing rate for a similar non-convertible debt instrument and (ii) debt issuance costs of $7.3 million. The conversion option component of the 1.75 % Convertible Notes was valued using Level 2 inputs under the fair value hierarchy. The unamortized portion of the total debt discount is being amortized to interest expense over the life of the 1.75 % Convertible Notes. The effective interest rate on the 1.75 % Convertible Notes, which includes the non-cash interest expense of debt discount amortization and debt issuance costs, was 4.97
The net proceeds from the issuance of the 1.75 % Convertible Notes were approximately $249.7 million, after deducting the initial purchasers’ discounts and commissions and offering expenses payable by the Company, but before deducting the net cost of the 1.75 % Convertible Note Hedge Transactions and the Warrant Transactions (each as defined herein) described in Note 9. The 1.75 % Convertible Notes are senior unsecured obligations of the Company and pay interest semi-annually in arrears on June 1 and December 1 of each year at an annual rate of 1.75 %. The 1.75 % Convertible Notes will mature on December 1, 2028 unless earlier repurchased or converted in accordance with their terms. Prior to June 1, 2028, the 1.75 % Convertible Notes may be converted at the option of the holders only upon the occurrence of specified events and during certain periods, and thereafter until the close of business on the second scheduled trading day immediately preceding the maturity date. The Company will satisfy any conversion by paying cash up to the aggregate principal amount of the 1.75 % Convertible Notes to be converted and by paying or delivering, as the case may be, cash, shares of the Company’s common stock, or a combination of cash and shares of the Company’s common stock, at its election, in respect of the remainder, if any, of its conversion obligation in excess of the aggregate principal amount of the 1.75 % Convertible Notes being converted. The initial conversion rate for the 1.75 % Convertible Notes is 9.9887 shares of the Company's common stock per $1,000 principal amount of the 1.75 % Convertible Notes (or 2,584,578 shares in the aggregate) and is equal to an initial conversion price of approximately $100.11 per share. If an event of default on the 1.75 % Convertible Notes occurs, the principal amount of the 1.75 % Convertible Notes, plus accrued and unpaid interest (including additional interest, if any) may be declared immediately due and payable, subject to certain conditions.
F-24
The 1.75 % Convertible Notes are senior unsecured indebtedness of the Company and are guaranteed by each of the Company’s subsidiaries that guarantee the obligations of the Company under the 2021 Credit Facility (as defined herein). 1.75 % Convertible Notes holders may convert their Convertibles Notes on or after June 28, 2028 at any time at their option. Holders may convert 1.75 % Convertible Notes prior to June 28, 2028, only under the following circumstances: (i) during any calendar quarter, if the last reported sale price of the Company's common stock for at least 20 trading days (whether or not consecutive) during a period of 30 consecutive trading days ending on the last trading day of the immediately preceding calendar quarter is greater than or equal to 130 % of the conversion price on each applicable trading day, (ii) during the five business day period after any five consecutive trading day period in which the trading price per $1,000 principal amount of notes for each trading day of the measurement period was less than 98 % of the product of the last reported sale price of our common stock and the conversion rate on each such trading day and (iii) upon the occurrence of certain specified distributions or corporate events.
In April 2021, the Company issued $350.0 million aggregate principal amount of 4.75 % Senior Notes due 2029 (the "4.75 % Senior Notes"). The 4.75 % Senior Notes will mature on May 1, 2029. Interest on the 4.75 % Senior Notes started accruing April 20, 2021 and is payable semi-annually in cash in arrears May 1 and November 1 of each year, beginning on November 1, 2021. The effective interest rate on the 4.75 % Senior Notes, which includes debt issuance costs, is approximately 4.97 %. In connection with the issuance of the 4.75 % Senior Notes, the Company incurred and capitalized as a reduction of the principal amount of the 4.75 % Senior Notes approximately $5.1 million in deferred financing costs which are being amortized using the effective interest rate over the term of the 4.75 % Senior Notes.
The 4.75 % Senior Notes are senior unsecured indebtedness of the Company and are guaranteed by each of the Company’s subsidiaries that guarantee the obligations of the Company under the 2021 Credit Facility. If the Company experiences specific kinds of changes of control, the Company must offer to repurchase all of the 4.75 % Senior Notes (unless otherwise redeemed) at a price equal to 101 % of the aggregate principal amount thereof, plus accrued and unpaid interest. The Company may redeem the 4.75 % Senior Notes, in whole or in part, at any time (a) prior to May 1, 2024, at a price equal to 100 % of the principal amount thereof, plus the applicable premium described in the associated indenture and accrued and unpaid interest and (b) on or after May 1, 2024 at specified redemption prices set forth in the indenture, plus accrued and unpaid interest. In addition, prior to May 1, 2024, the Company may redeem, in one or more transactions, up to an aggregate of 40 % of the original principal amount of the 4.75 % Senior Notes at a redemption price equal to 104.75 % of the principal amount thereof, plus accrued and unpaid interest, with the net cash proceeds of one or more equity offerings.
In September 2019, the Company issued $300 million aggregate principal amount of 7.50 % Senior Notes due 2027 (the “7.50 % Senior Notes”). The 7.50 % Senior Notes will mature on October 15, 2027. Interest on the 7.50 % Senior Notes is payable semi-annually in cash in arrears on April 15 and October 15 of each year. The effective interest rate on the 7.50 % Senior Notes, which includes debt issuance costs, is 7.82 %. In connection with the issuance of the 7.50 % Senior Notes, the Company incurred and capitalized as a reduction of the principal amount of the 7.50 % Senior Notes approximately $5.8 million in deferred financing costs which is amortized using the effective interest rate over the term of the 7.50 % Senior Notes.
The 7.50 % Senior Notes are senior unsecured indebtedness of the Company and are guaranteed by each of the Company’s subsidiaries that guarantee the obligations of the Company under the 2021 Credit Facility. The Company may redeem the 7.50 % Senior Notes, in whole or in part, at any time (a) prior to October 15, 2022, at a price equal to 100 % of the principal amount thereof, plus the applicable premium described in the associated indenture and accrued and unpaid interest and (b) on or after October 15, 2022 at specified redemption prices set forth in the indenture, plus accrued and unpaid interest. In addition, prior to October 15, 2022, the Company may redeem, in one or more transactions, up to an aggregate of 40 % of the original principal amount of the 7.50 % Senior Notes at a redemption price equal to 107.5 % of the principal amount thereof, plus accrued and unpaid interest, with the net cash proceeds of one or more equity offerings. If the Company experiences specific kinds of changes of control, the Company must offer to repurchase all of the 7.50 % Senior Notes (unless otherwise redeemed) at a price equal to 101 % of the aggregate principal amount thereof, plus accrued and unpaid interest.
F-25
2021 Credit Facility
Simultaneously with the issuance of the 4.75 % Senior Notes, the Company entered into the Fourth Amended and Restated Credit Agreement (the "2021 Credit Agreement"). The 2021 Credit Agreement amended and extended the Company's 2019 Credit Agreement (as defined herein) and consists of a $550 million senior secured revolver (the "2021 Revolver") and a $150 million senior secured term loan (the "2021 Term Loan" and together with the 2021 Revolver, the "2021 Credit Facility"). The maturity date for borrowings under the 2021 Credit Agreement is April 20, 2026. Upon the satisfaction of certain conditions, and obtaining incremental commitments from its lenders, the Company may be able to increase the borrowing capacity of the 2021 Credit Facility by up to $250.0 million for acquisitions.
The Company determined that the terms of the 2021 Credit Agreement were not substantially different from the terms of the Company’s 2019 Credit Agreement. Accordingly, debt modification accounting treatment was applied and the related impacts were immaterial.
Borrowings under the 2021 Credit Facility are secured by substantially all personal property assets of the Company and any domestic subsidiary guarantors. Pursuant to the 2021 Credit Agreement:
•The 2021 Term Loan is due in consecutive quarterly installments in the following amounts: (i) beginning June 30, 2021, through and including March 31, 2024, $1,875,000 and (ii) beginning June 30, 2024, and each quarter thereafter, $3,750,000 , with the remaining balance due at maturity;
•The interest rates for borrowings under the 2021 Revolver and the 2021 Term Loan are the Prime Rate or LIBOR plus a margin, which ranges from 0.00 % to 0.75 % for Prime Rate loans and from 1.00 % to 1.75 % for LIBOR loans depending on the Company's consolidated total leverage ratio, as defined below. The Company is required to pay fees on unused but committed portions of the 2021 Revolver, which range from 0.15 % to 0.225 %; and
•Covenants include requirements as to a maximum consolidated secured net leverage ratio (2.75 :1.00, increasing to 3.25 :1.00 in certain circumstances in connection with Company acquisitions) and a minimum consolidated fixed charge coverage ratio (1.50 :1.00) that are tested on a quarterly basis, a minimum liquidity requirement applicable during the six-month period preceding the maturity of the Company's 1.00 % Convertible Notes due 2023, and other customary covenants.
The total face value of the 2021 Term Loan is $150.0 million. Total available borrowing capacity under the 2021 Revolver is $550.0 million. At December 31, 2021, the Company had $144.4 million outstanding under the 2021 Term Loan under the LIBOR-based option, and borrowings outstanding under the 2021 Revolver of $135.0 million under the LIBOR-based option. The interest rate for incremental borrowings at December 31, 2021 was LIBOR plus 1.50 % (or 1.63 %) for the LIBOR-based option. The fee payable on committed but unused portions of the 2021 Revolver was 0.20 % at December 31, 2021.
2019 Credit Facility
The Company's previous credit agreement (the "2019 Credit Agreement") was amended by the 2021 Credit Agreement in April 2021 as discussed above. The 2019 Credit Agreement consisted of a $550 million senior secured revolver (the “2019 Revolver”) and a $100 million senior secured term loan (the “2019 Term Loan” and together with the 2019 Revolver, the “2019 Credit Facility”).
In January 2018, the Company issued $172.5 million aggregate principal amount of 1.00 % Convertible Senior Notes due 2023 (the “1.00 % Convertible Notes”). The total debt discount of $36.2 million at issuance consisted of two components: (i) the conversion option component, recorded to shareholders' equity, in the amount of $31.9 million, representing the difference between the principal amount of the 1.00 % Convertible Notes upon issuance less the present value of the future cash flows of the 1.00 % Convertible Notes using a borrowing rate for a similar non-convertible instrument and (ii) debt issuance costs of $4.3 million. The unamortized portion of the total debt discount is being amortized to interest expense over the life of the 1.00 % Convertible Notes. The effective interest rate on the 1.00 % Convertible Notes, which includes the non-cash interest expense of debt discount amortization and debt issuance costs, was 5.25
The net proceeds from the issuance of the 1.00 % Convertible Notes were approximately $167.5 million, after deducting the initial purchasers’ discounts and commissions and offering expenses payable by the Company, but before deducting the net
F-26
cost of the 1.00 % Convertible Note Hedge Transactions and the Warrant Transactions (each as defined herein) described in Note 9. The 1.00 % Convertible Notes are senior unsecured obligations of the Company and pay interest semi-annually in arrears on February 1 and August 1 of each year at an annual rate of 1.00 %. The 1.00 % Convertible Notes will mature on February 1, 2023 unless earlier repurchased or converted in accordance with their terms. The 1.00 % Convertible Notes are convertible by the noteholders, in certain circumstances and subject to certain conditions, into cash, shares of common stock of the Company, or a combination thereof, at the Company’s election. The initial conversion rate for the 1.00 % Convertible Notes is 11.3785 shares of the Company's common stock per $1,000 principal amount of the 1.00 % Convertible Notes (or 1,962,790 shares in the aggregate) and is equal to an initial conversion price of approximately $87.89 per share. If an event of default on the 1.00 % Convertible Notes occurs, the principal amount of the 1.00 % Convertible Notes, plus accrued and unpaid interest (including additional interest, if any) may be declared immediately due and payable, subject to certain conditions.
The 1.00 % Convertible Notes are senior unsecured indebtedness of the Company and are guaranteed by each of the Company’s subsidiaries that guarantee the obligations of the Company under the 2021 Credit Facility. 1.00 % Convertible Notes holders may convert their 1.00 % Convertibles Notes on or after August 1, 2022 at any time at their option. Holders may convert 1.00 % Convertible Notes prior to August 1, 2022, only under the following circumstances: (i) during any calendar quarter, if the last reported sale price of the Company's common stock for at least 20 trading days (whether or not consecutive) during a period of 30 consecutive trading days ending on the last trading day of the immediately preceding calendar quarter is greater than or equal to 130 % of the conversion price on each applicable trading day, (ii) during the five business day period after any five consecutive trading day period in which the trading price per $1,000 principal amount of notes for each trading day of the measurement period was less than 98 % of the product of the last reported sale price of our common stock and the conversion rate on each such trading day and (iii) upon the occurrence of certain specified distributions or corporate events.
Debt Maturities
As of December 31, 2021, the aggregate maturities of total long-term debt for the next five fiscal years and thereafter are as follows (in thousands):
| 2022 | $ | ||||
| 2023 | |||||
| 2024 | |||||
| 2025 | |||||
| 2026 | |||||
| Thereafter | |||||
| Total | $ | ||||
Letters of credit totaling $5.4 million were outstanding at December 31, 2021 that exist to meet credit requirements for the Company’s insurance providers.
Cash paid for interest for the years ended December 31, 2021, 2020 and 2019 was $45.0 million, $36.1 million and $22.1 million, respectively.
9. DERIVATIVE FINANCIAL INSTRUMENTS
In December 2021, in connection with the 1.75 % Convertible Notes offering, the Company entered into privately negotiated convertible note hedge transactions (together, the “1.75 % Convertible Note Hedge Transactions”) with each of Bank of America, N.A., Wells Fargo Bank, National Association and Nomura Global Financial Products, Inc. (together, the “1.75 % Convertible Note Hedge Counterparties”). Pursuant to the 1.75 % Convertible Note Hedge Transactions, the Company acquired options to purchase the same number of shares of the Company's common stock (or 2,584,578 shares) initially underlying the 1.75 % Convertible Notes at an initial strike price equal to the initial strike price of the 1.75 % Convertible Notes of approximately $100.11 per share, subject to customary anti-dilution adjustments. The options expire on December 1, 2028, subject to earlier exercise.
F-27
At the same time, the Company also entered into separate, privately negotiated warrant transactions (the “1.75 % Convertible Note Warrant Transactions”) with each of the 1.75 % Convertible Note Hedge Counterparties, pursuant to which the Company sold warrants to purchase the same number of shares of the Company's common stock (or 2,584,578 shares) underlying the 1.75 % Convertible Notes, at an initial strike price of approximately $123.22 per share, subject to customary anti-dilution adjustments. The warrants have a final expiration date of July 25, 2029.
The Company paid $57.4 million associated with the cost of the 1.75 % Convertible Note Hedge Transactions and received proceeds of $43.7 million related to the 1.75 % Convertible Note Warrant Transactions. The 1.75 % Convertible Note Hedge Transactions are expected generally to reduce potential dilution to the Company’s common stock upon any conversion of the 1.75 % Convertible Notes and/or offset any cash payments the Company is required to make in excess of the principal amount of converted 1.75 % Convertible Notes. However, the 1.75 % Convertible Note Warrant Transactions could separately have a dilutive effect on the Company's common stock to the extent that the market price per share of the common stock exceeds the strike price of the warrants.
As these transactions meet certain accounting criteria, the 1.75 % Convertible Note Hedge Transactions and 1.75 % Convertible Note Warrant Transactions are recorded in stockholders’ equity and are not accounted for as derivatives.
In January 2018, in connection with the 1.00 % Convertible Notes offering, the Company entered into privately negotiated convertible note hedge transactions (together, the “1.00 % Convertible Note Hedge Transactions”) with each of Bank of America, N.A. and Wells Fargo Bank, National Association (together, the “1.00 % Convertible Note Hedge Counterparties”). Pursuant to the 1.00 % Convertible Note Hedge Transactions, the Company acquired options to purchase the same number of shares of the Company's common stock (or 1,962,790 shares) initially underlying the 1.00 % Convertible Notes at an initial strike price equal to the initial strike price of the 1.00 % Convertible Notes of approximately $87.89 per share, subject to customary anti-dilution adjustments. The options expire on February 1, 2023, subject to earlier exercise.
At the same time, the Company also entered into separate, privately negotiated warrant transactions (the “1.00 % Convertible Note Warrant Transactions”) with each of the 1.00 % Convertible Note Hedge Counterparties, pursuant to which the Company sold warrants to purchase the same number of shares of the Company’s common stock (or 1,962,790 shares) underlying the 1.00 % Convertible Notes, at an initial strike price of approximately $113.93 per share, subject to customary anti-dilution adjustments. The warrants have a final expiration date of September 20, 2023.
The Company paid $31.5 million associated with the cost of the 1.00 % Convertible Note Hedge Transactions and received proceeds of $18.1 million related to the 1.00 % Convertible Note Warrant Transactions. The 1.00 % Convertible Note Hedge Transactions are expected generally to reduce potential dilution to the Company’s common stock upon any conversion of the 1.00 % Convertible Notes and/or offset any cash payments the Company is required to make in excess of the principal amount of converted 1.00 % Convertible Notes. However, the 1.00 % Convertible Note Warrant Transactions could separately have a dilutive effect on the Company's common stock to the extent that the market price per share of the common stock exceeds the strike price of the warrants.
As these transactions meet certain accounting criteria, the 1.00 % Convertible Note Hedge Transactions and 1.00 % Convertible Note Warrant Transactions are recorded in stockholders’ equity and are not accounted for as derivatives.
Interest Rate Swaps
The Company's credit facility exposes the Company to risks associated with the variability in interest expense associated with fluctuations in LIBOR. To partially mitigate this risk, the Company entered into interest rate swaps in 2018. As of December 31, 2021, the Company had a combined notional principal amount of $200.0 million of interest rate swap agreements, all of which are designated as cash flow hedges. These swap agreements effectively convert the interest expense associated with a portion of the Company's variable rate debt from variable interest rates to fixed interest rates and have maturities ranging from February 2022 to March 2022.
F-28
The following table summarizes the fair value of derivative contracts included in the accompanying consolidated balance sheet (in thousands):
| Fair value of derivative liabilities | ||||||||||||||||||||
| Derivatives accounted for as cash flow hedges | Balance sheet location | December 31, 2021 | December 31, 2020 | |||||||||||||||||
| Interest rate swaps | Accrued liabilities | $ | $ | — | ||||||||||||||||
| Interest rate swaps | Other long-term liabilities | $ | — | $ | ||||||||||||||||
10. ACCUMULATED OTHER COMPREHENSIVE LOSS
Accumulated other comprehensive loss primarily includes unrealized gains and losses on derivatives that qualify as hedges of cash flows and cumulative foreign currency translation adjustments. The activity in accumulated other comprehensive loss for the years ended December 31, 2021 and 2020 was as follows:
| (thousands) | Cash Flow Hedges | Other | Foreign Currency Translation | Total | ||||||||||||||||||||||
| Balance at January 1, 2020 | $ | ( | $ | ( | $ | ( | $ | ( | ||||||||||||||||||
| Other comprehensive income (loss) before reclassifications, net of tax | ( | ( | ||||||||||||||||||||||||
| Amounts reclassified from accumulated other comprehensive loss, net of tax | ||||||||||||||||||||||||||
| Net current period other comprehensive income (loss) | ( | ( | ||||||||||||||||||||||||
| Balance at December 31, 2020 | $ | ( | $ | ( | $ | $ | ( | |||||||||||||||||||
| Other comprehensive income (loss) before reclassifications, net of tax | ( | ( | ( | |||||||||||||||||||||||
| Amounts reclassified from accumulated other comprehensive loss, net of tax | ||||||||||||||||||||||||||
| Net current period other comprehensive income (loss) | ( | |||||||||||||||||||||||||
| Balance at December 31, 2021 | $ | ( | $ | ( | $ | $ | ( | |||||||||||||||||||
11. ACCRUED LIABILITIES
Accrued liabilities as of December 31, 2021 and 2020 include the following:
| (thousands) | 2021 | 2020 | ||||||||||||
| Employee compensation and benefits | $ | $ | ||||||||||||
| Property taxes | ||||||||||||||
| Customer incentives | ||||||||||||||
| Accrued interest | ||||||||||||||
| Accrued warranty | ||||||||||||||
| Income tax payable | ||||||||||||||
| Other | ||||||||||||||
| Total accrued liabilities | $ | $ | ||||||||||||
F-29
Changes in our accrued warranty liabilities for the years ended December 31, 2021, 2020, and 2019 are as follows:
| (thousands) | 2021 | 2020 | 2019 | |||||||||||||||||
| Beginning balance | $ | $ | $ | |||||||||||||||||
| Provision | ||||||||||||||||||||
| Payments | ( | ( | ( | |||||||||||||||||
| Acquisitions | ||||||||||||||||||||
| Ending balance | $ | $ | $ | |||||||||||||||||
Accrued warranty and provision as of and for the year ended December 31, 2021 includes the cost of the recall matter discussed in Note 16.
12. INCOME TAXES
The provision for income taxes for the years ended December 31, 2021, 2020 and 2019 consists of the following:
| (thousands) | 2021 | 2020 | 2019 | |||||||||||||||||
| Current: | ||||||||||||||||||||
| Federal | $ | $ | $ | |||||||||||||||||
| State | ||||||||||||||||||||
| Foreign | ( | |||||||||||||||||||
| Total current | ||||||||||||||||||||
| Deferred: | ||||||||||||||||||||
| Federal | ( | |||||||||||||||||||
| State | ( | ( | ||||||||||||||||||
| Total deferred | ( | |||||||||||||||||||
| Income taxes | $ | $ | $ | |||||||||||||||||
The Company has accounted for in its 2021, 2020 and 2019 income tax provision the impact of Global Intangible Low-Taxed Income, base-erosion anti-abuse tax, interest expense limitations under Section 163(j), and foreign-derived intangible income deductions, although such provisions were either not applicable or resulted in a zero or immaterial impact to the consolidated financial statements.
A reconciliation of the differences between the actual provision for income taxes and income taxes at the federal statutory income tax rate of 21% for the years ended December 31, 2021, 2020 and 2019 is as follows:
| (thousands) | 2021 | 2020 | 2019 | ||||||||||||||||||||||||||
| Rate applied to pretax income | $ | % | $ | % | $ | % | |||||||||||||||||||||||
| State taxes, net of federal tax effect | % | % | % | ||||||||||||||||||||||||||
| Research and development tax credits | ( | ( | % | ( | ( | % | ( | ( | % | ||||||||||||||||||||
| Section 162(m) permanent addback | % | % | % | ||||||||||||||||||||||||||
| Excess tax benefit on stock-based compensation | ( | ( | % | ( | ( | % | ( | ( | % | ||||||||||||||||||||
| Other | ( | ( | % | ( | % | ( | ( | % | |||||||||||||||||||||
| Income taxes | $ | % | $ | % | $ | % | |||||||||||||||||||||||
F-30
The composition of the deferred tax assets and liabilities as of December 31, 2021 and 2020 is as follows:
| (thousands) | 2021 | 2020 | ||||||||||||
| Long-term deferred income tax assets (liabilities): | ||||||||||||||
| Trade receivables allowance | $ | $ | ||||||||||||
| Inventory capitalization | ||||||||||||||
| Accrued expenses | ||||||||||||||
| Deferred compensation | ||||||||||||||
| Inventory reserves | ||||||||||||||
| Federal NOL carryforwards | ||||||||||||||
| State NOL carryforwards | ||||||||||||||
| Valuation allowance - NOL | ( | ( | ||||||||||||
| Share-based compensation | ||||||||||||||
| Operating lease right-of-use assets | ( | ( | ||||||||||||
| Operating lease liabilities | ||||||||||||||
| Other | ||||||||||||||
| Intangibles | ( | ( | ||||||||||||
| Depreciation expense | ( | ( | ||||||||||||
| Prepaid expenses | ( | ( | ||||||||||||
| Net deferred tax liabilities | $ | ( | $ | ( | ||||||||||
Cash paid by the Company for income taxes was $46.2 million, $7.9 million and $36.1 million in 2021, 2020 and 2019, respectively.
As of December 31, 2021 and December 31, 2020, the Company had gross federal, state, and foreign net operating losses, of approximately $25.5 million and $26.2 million, respectively. These loss carryforwards generally expire between tax years ending December 31, 2022 and December 31, 2039. The components of the valuation allowance relate to certain acquired federal, state and foreign net operating loss carryforwards that the Company anticipates will not be utilized prior to their expiration, either due to income limitations or limitations under Section 382. The tax effected values of these net operating losses are $1.9 million and $2.3 million at December 31, 2021 and 2020, respectively, exclusive of valuation allowances of $0.7 million and $0.8 million at December 31, 2021 and 2020, respectively.
13. STOCK REPURCHASE PROGRAMS
In March 2020, the Company's Board of Directors ("the Board") approved an increase in the amount of the Company's common stock that may be acquired over 24 months under the current stock repurchase program to $50.0 million, including amounts remaining under previous authorizations. In August 2021, the Board approved a new stock repurchase program for up to $50.0 million of its common stock, including amounts remaining under previous authorizations. Approximately $22.6 million of common stock repurchases remains available at December 31, 2021 as part of this authorization. Under the stock repurchase plans, the Company made repurchases of common stock for 2021, 2020 and 2019 as follows:
| 2021 | 2020 | 2019 | ||||||||||||||||||
| Shares repurchased | ||||||||||||||||||||
| Average price | $ | $ | $ | |||||||||||||||||
| Aggregate cost (in millions) | $ | $ | $ | |||||||||||||||||
F-31
14. NET INCOME PER COMMON SHARE
Income per common share is calculated for the years ended December 31, 2021, 2020 and 2019 as follows:
| (thousands except per share data) | 2021 | 2020 | 2019 | |||||||||||||||||
| Net income | $ | $ | $ | |||||||||||||||||
| Weighted average common shares outstanding - basic | ||||||||||||||||||||
| Effect of potentially dilutive securities | ||||||||||||||||||||
| Weighted average common shares outstanding - diluted | ||||||||||||||||||||
| Basic net income per common share | $ | $ | $ | |||||||||||||||||
| Diluted net income per common share | $ | $ | $ | |||||||||||||||||
| Cash dividends paid per common share | $ | $ | $ | |||||||||||||||||
15. LEASES
We lease certain facilities, trailers, forklifts and other assets. Leases with an initial term of 12 months or less are not recorded on the balance sheet and expense related to these short-term leases was immaterial for the years ended December 31, 2021, 2020 and 2019. Variable lease expense, principally related to trucks, forklifts, and index-related facility rent escalators, was immaterial for the years ended December 31, 2021, 2020 and 2019. Leases have remaining lease terms of one year to eighteen years . Certain leases include options to renew for an additional term. Where there is reasonable certainty to utilize a renewal option, we include the renewal option in the lease term used to calculate operating lease right-of-use assets and lease liabilities.
Lease expense, supplemental cash flow information, and other information related to leases for the years ended December 31, 2021, 2020 and 2019 were as follows:
| (thousands) | 2021 | 2020 | 2019 | |||||||||||||||||
| Operating lease cost | $ | $ | $ | |||||||||||||||||
| Cash paid for amounts included in the measurement of lease liabilities: | ||||||||||||||||||||
| Operating cash flows for operating leases | $ | $ | $ | |||||||||||||||||
| Right-of-use assets obtained in exchange for lease obligations: | ||||||||||||||||||||
| Operating leases | $ | $ | $ | |||||||||||||||||
F-32
Balance sheet information related to leases as of December 31, 2021 and 2020 was as follows:
| (thousands, except lease term and discount rate) | 2021 | 2020 | ||||||||||||
| Assets | ||||||||||||||
| Operating lease right-of-use assets | $ | $ | ||||||||||||
| Liabilities | ||||||||||||||
| Operating lease liabilities, current portion | $ | $ | ||||||||||||
| Long-term operating lease liabilities | ||||||||||||||
| Total lease liabilities | $ | $ | ||||||||||||
| Weighted average remaining lease term, operating leases (in years) | ||||||||||||||
| Weighted average discount rate, operating leases | % | % | ||||||||||||
Maturities of operating lease liabilities were as follows at December 31, 2021 (in thousands):
| 2022 | $ | |||||||
| 2023 | ||||||||
| 2024 | ||||||||
| 2025 | ||||||||
| 2026 | ||||||||
| Thereafter | ||||||||
| Total lease payments | ||||||||
| Less imputed interest | ( | |||||||
| Total | $ | |||||||
The Company has additional operating leases that have not yet commenced as of December 31, 2021, and therefore, approximately $2.4 million in operating lease right-of-use assets and corresponding operating lease liabilities were not included in our consolidated balance sheet at December 31, 2021. These leases will commence through the second quarter of fiscal 2022 with lease terms of 5 to 10 years.
16. COMMITMENTS AND CONTINGENCIES
The Company is subject to proceedings, lawsuits, audits, and other claims arising in the normal course of business. All such matters are subject to uncertainties and outcomes that are not predictable with assurance. Accruals for these items, when applicable, have been provided to the extent that losses are deemed probable and are reasonably estimable. These accruals are adjusted from time to time as developments warrant.
Although the ultimate outcome of these matters cannot be ascertained, on the basis of present information, amounts already provided, availability of insurance coverage and legal advice received, it is the opinion of management that the ultimate resolution of these proceedings, lawsuits, and other claims will not have a material adverse effect on the Company’s consolidated balance sheet, results of operations, or cash flows.
In August 2019, a group of companies calling itself the Lusher Site Remediation Group (the “Group”) commenced litigation against the Company in Lusher Site Remediation Group v. Sturgis Iron & Metal Co., Inc., et al., Case Number 3:18-cv-00506, pending in the U.S. District Court for the Northern District of Indiana, relating to a site owned by the Company (the "Lusher Street Site"). The Group’s Second Amended Complaint, which was the first to assert claims against Patrick, asserted claims under the federal Comprehensive Environmental Response, Compensation, and Liability Act (“CERCLA”), 42 U.S.C. § 9601 et seq., an Indiana state environmental statute and Indiana common law. One defendant in the case, Sturgis Iron & Metal Co., Inc. (“Sturgis”), subsequently filed two cross claims against Patrick, asserting against the Company a claim for (i) contribution under CERCLA and (ii) contractual indemnity. The Company moved to dismiss the Group’s claims and also moved to dismiss Sturgis’s cross claims. On August 21, 2020, the court granted Patrick’s two motions to dismiss. The Group subsequently moved for reconsideration of the court’s decision.
F-33
On March 19, 2021, the Company received a General Notice of Potential Liability from the U.S. Environmental Protection Agency (the “EPA”), pursuant to Section 107(a) of CERCLA (the “Notice”). The Notice provides that the EPA has incurred and will likely incur additional costs relative to conducting a Remedial Investigation/Feasibility Study ("RI/FS"), conducting Remedial Design/Remedial Action ("RD/RA"), and other investigation, planning, response, oversight, and enforcement activities related to the Lusher Street Site. Because the Company was the owner of and former operator within the Lusher Street Site and as such may be a potentially responsible party pursuant to CERCLA, the Company received the Notice and an indication that it may have a responsibility to contribute to the costs of RI/FS, RD/RA or additional mitigation efforts incurred or to be incurred by the EPA.
On September 15, 2021, the Court granted the parties Joint Motion to Stay Proceedings Pending Negotiations with the EPA. The proceedings remain subject to the Court-approved stay.
On January 26, 2022, the Company closed on the sale of certain parcels of real property that are subject to the litigation (the “Divested Properties”). The purchaser agreed to indemnify, defend and hold the Company harmless for all liability and exposure, both private and to all EPA claims, concerning and relating to the Divested Properties, including as it concerns this litigation.
As to the remaining real properties that were not among the Divested Properties but remain the subject of the Lusher Street Site litigation, the Company does not currently believe that this matter is likely to have a material adverse impact on its financial condition, results of operations, or cash flows. However, any litigation is inherently uncertain, and any judgment or injunctive relief entered against us or any adverse settlement could materially and adversely impact our business, results of operations, financial condition, and prospects.
17. COMPENSATION PLANS
Stock-Based Compensation
The Company has various stock option and stock-based incentive plans and various agreements whereby stock options, restricted stock awards, and SARS were made available to certain key employees, directors, and others based upon meeting various individual, divisional or company-wide performance criteria and time-based criteria. All such awards qualify and are accounted for as equity awards. Equity incentive plan awards, which are granted under the Company's 2009 Omnibus Incentive Plan, are intended to retain and reward key employees for outstanding performance and efforts as they relate to the Company’s short-term and long-term objectives and its strategic plan. At December 31, 2021, approximately 1.4 million common shares remain available for stock-based compensation grants.
Stock-based compensation expense was $22.9 million, $16.0 million and $15.4 million for the years ended December 31, 2021, 2020 and 2019, respectively. Income tax benefit for stock-based compensation expense was $5.8 million, $4.1 million and $3.9 million for the years ended December 31, 2021, 2020 and 2019, respectively. As of December 31, 2021, there was approximately $26.1 million of total unrecognized compensation cost related to share-based compensation arrangements granted under incentive plans. That cost is expected to be recognized over a weighted-average period of approximately 15.7 months.
Stock Options:
Stock options vest ratably over either or four years and have nine-year contractual terms.
F-34
The following table summarizes the Company’s option activity during the years ended December 31, 2021, 2020 and 2019:
| Years ended December 31 | 2021 | 2020 | 2019 | |||||||||||||||||
| (shares in thousands) | Shares | Weighted Average Exercise Price | Shares | Weighted Average Exercise Price | Shares | Weighted Average Exercise Price | ||||||||||||||
| Outstanding beginning of year | $ | $ | $ | |||||||||||||||||
| Granted during the year | ||||||||||||||||||||
| Forfeited during the year | ( | ( | ||||||||||||||||||
| Exercised during the year | ( | ( | ( | |||||||||||||||||
| Outstanding end of year | $ | $ | $ | |||||||||||||||||
| Vested Options: | ||||||||||||||||||||
| Vested during the year | $ | $ | $ | |||||||||||||||||
| Eligible end of year for exercise | $ | $ | $ | |||||||||||||||||
| Aggregate intrinsic value ($ in thousands): | ||||||||||||||||||||
| Total options outstanding | $ | $ | $ | |||||||||||||||||
| Options exercisable | $ | $ | $ | |||||||||||||||||
| Options exercised | $ | $ | $ | |||||||||||||||||
| Weighted average fair value of options granted during the year | N/A | $ | N/A | |||||||||||||||||
The aggregate intrinsic value (excess of market value over the option exercise price) in the table above is before income taxes, and assuming the Company’s closing stock price of $80.69 , $68.35 and $52.43 per share as of December 31, 2021, 2020 and 2019, respectively, is the price that would have been received by the option holders had those option holders exercised their options as of that date. At December 31, 2021, the weighted average remaining contractual term for options outstanding was 7.1 years and the weighted average remaining contractual term for options exercisable was 5.8 years.
The cash received from the exercise of stock options was $4.9 million and $0.6 million in 2021 and 2020, respectively, and immaterial in 2019. The income tax benefit related to the stock options exercised was $6.7 million in 2021, and immaterial in 2020 and 2019. The grant date fair value of stock options vested in 2021, 2020 and 2019 was $11.6 million, $5.8 million and $5.8 million, respectively.
The following table presents assumptions used in the Black-Scholes model for the stock options granted in 2020. There were no
| 2020 | ||||||||
| Dividend rate | % | |||||||
| Risk-free interest rate | % | |||||||
| Expected option life (years) | ||||||||
| Price volatility | % | |||||||
As of December 31, 2021, there was approximately $3.1 million of total unrecognized compensation expense related to the stock options, which is expected to be recognized over a weighted-average remaining life of approximately 17 months.
F-35
Stock Appreciation Rights (SARS):
| Years ended December 31 | 2021 | 2020 | 2019 | |||||||||||||||||
| (shares in thousands) | Shares | Weighted Average Exercise Price | Shares | Weighted Average Exercise Price | Shares | Weighted Average Exercise Price | ||||||||||||||
| Total SARS: | ||||||||||||||||||||
| Outstanding beginning of year | $ | $ | $ | |||||||||||||||||
| Granted during the year | ||||||||||||||||||||
| Forfeited during the year | ( | |||||||||||||||||||
| Exercised during the year | ( | ( | ||||||||||||||||||
| Outstanding end of year | $ | $ | $ | |||||||||||||||||
| Vested SARS: | ||||||||||||||||||||
| Vested during the year | $ | $ | $ | |||||||||||||||||
| Eligible end of year for exercise | $ | $ | $ | |||||||||||||||||
| Aggregate intrinsic value ($ in thousands): | ||||||||||||||||||||
| Total SARS outstanding | $ | $ | $ | |||||||||||||||||
| SARS exercisable | $ | $ | $ | |||||||||||||||||
| SARS exercised | $ | $ | $ | |||||||||||||||||
| Weighted average fair value of SARS granted during the year | N/A | N/A | N/A | |||||||||||||||||
The aggregate intrinsic value (excess of market value over the SARS exercise price) in the table above is before income taxes, and assuming the Company’s closing stock price of $80.69 , $68.35 and $52.43 per share as of December 31, 2021, 2020 and 2019, respectively, is the price that would have been received by the SARS holder had that SARS holder exercised the SARS as of that date. SARS vest ratably over four years and have nine-year contractual terms. All SARS outstanding as of December 31, 2021 were fully vested.
As of December 31, 2021, there was no unrecognized compensation expense related to the SARS.
Restricted Stock:
The Company’s stock-based awards include restricted stock awards. As of December 31, 2021, there was approximately $23.0 million of total unrecognized compensation expense related to restricted stock, which is expected to be recognized over a weighted-average remaining life of approximately 15.5 months.
Restricted stock awards possess voting rights, are included in the calculation of actual shares outstanding, and include both performance- and time-based contingencies. The grant date fair value of the awards is expensed over the related service or performance period. Time-based shares cliff vest at the conclusion of the required service period, which ranges from less than one year to seven years . The performance contingent shares are earned based on the achievement of a cumulative financial performance target, which ranges from less than one year to a seven-year period and vest at the conclusion of the measurement period.
F-36
The following table summarizes the activity for restricted stock for the years ended December 31, 2021, 2020 and 2019:
| 2021 | 2020 | 2019 | ||||||||||||||||||
| (shares in thousands) | Shares | Weighted-Average Grant Date Stock Price | Shares | Weighted-Average Grant Date Stock Price | Shares | Weighted-Average Grant Date Stock Price | ||||||||||||||
| Unvested beginning of year | $ | $ | $ | |||||||||||||||||
| Granted during the year | ||||||||||||||||||||
| Vested during the year | ( | ( | ( | |||||||||||||||||
| Forfeited during the year | ( | ( | ( | |||||||||||||||||
| Unvested end of year | $ | $ | $ | |||||||||||||||||
18. SEGMENT INFORMATION
The Company has two reportable segments, Manufacturing and Distribution, which are based on its method of internal reporting, which segregates its businesses based on the way in which its chief operating decision maker allocates resources, evaluates financial results, and determines compensation. The Company does not measure profitability at the end market (RV, marine, MH and industrial) level.
A description of the Company’s reportable segments is as follows:
Manufacturing – This segment includes the following products: laminated products that are utilized to produce furniture, shelving, walls, countertops and cabinet products; cabinet doors; fiberglass bath fixtures and tile systems; hardwood furniture; vinyl printing; RV and marine furniture; audio systems and accessories, including amplifiers, tower speakers, soundbars, and subwoofers; decorative vinyl and paper laminated panels; solid surface, granite, and quartz countertop fabrication; RV painting; fabricated aluminum products; fiberglass and plastic components; fiberglass bath fixtures and tile systems; softwoods lumber; custom cabinetry; polymer-based and other flooring; electrical systems components including instrument and dash panels; wrapped vinyl, paper and hardwood profile mouldings; interior passage doors; air handling products; slide-out trim and fascia; thermoformed shower surrounds; specialty bath and closet building products; fiberglass and plastic helm systems and components products; treated, untreated and laminated plywood; wiring and wire harnesses; adhesives and sealants; boat covers, towers, tops, trailers and frames; marine hardware and accessories; aluminum and plastic fuel tanks; CNC molds and composite parts; slotwall panels and components; and other products.
Distribution – The Company distributes pre-finished wall and ceiling panels; drywall and drywall finishing products; electronics and audio systems components; appliances; marine accessories and components; wiring, electrical and plumbing products; fiber reinforced polyester products; cement siding; raw and processed lumber; interior passage doors; roofing products; laminate and ceramic flooring; tile; shower doors; furniture; fireplaces and surrounds; interior and exterior lighting products; and other miscellaneous products in addition to providing transportation and logistics services.
The accounting policies of the segments are the same as those described in Note 1, except that segment data includes intersegment sales. Assets are identified to the segments except for cash, prepaid expenses, land and buildings, and certain deferred assets, which are identified with the corporate division. The corporate division charges rents to the segments for use of the land and buildings based upon estimated market rates. The Company accounts for intersegment sales similar to third party transactions, which reflect current market prices. The Company also records certain income from purchase incentive agreements at the corporate division. The Company evaluates the performance of its segments and allocates resources to them based on a variety of indicators including but not limited to sales and operating income as presented in the tables below.
F-37
The tables below present information that is provided to the chief operating decision maker of the Company as of December 31, 2021 and 2020 and for the years ended December 31, 2021, 2020 and 2019 (in thousands):
| 2021 | |||||||||||||||||
| Manufacturing | Distribution | Total | |||||||||||||||
| Net outside sales | $ | $ | $ | ||||||||||||||
| Intersegment sales | |||||||||||||||||
| Total sales | |||||||||||||||||
| Operating income | |||||||||||||||||
| Total assets | |||||||||||||||||
| Capital expenditures | |||||||||||||||||
| Depreciation and amortization | |||||||||||||||||
| 2020 | |||||||||||||||||
| Manufacturing | Distribution | Total | |||||||||||||||
| Net outside sales | $ | $ | $ | ||||||||||||||
| Intersegment sales | |||||||||||||||||
| Total sales | |||||||||||||||||
| Operating income | |||||||||||||||||
| Total assets | |||||||||||||||||
| Capital expenditures | |||||||||||||||||
| Depreciation and amortization | |||||||||||||||||
| 2019 | |||||||||||||||||
| Manufacturing | Distribution | Total | |||||||||||||||
| Net outside sales | $ | $ | $ | ||||||||||||||
| Intersegment sales | |||||||||||||||||
| Total sales | |||||||||||||||||
| Operating income | |||||||||||||||||
| Capital expenditures | |||||||||||||||||
| Depreciation and amortization | |||||||||||||||||
F-38
A reconciliation of certain line items pertaining to the total reportable segments to the consolidated financial statements as of December 31, 2021 and 2020 and for the years ended December 31, 2021, 2020 and 2019 is as follows (in thousands):
| 2021 | 2020 | 2019 | |||||||||||||||
| Net sales: | |||||||||||||||||
| Total sales for reportable segments | $ | $ | $ | ||||||||||||||
| Elimination of intersegment sales | ( | ( | ( | ||||||||||||||
| Consolidated net sales | $ | $ | $ | ||||||||||||||
| Operating income: | |||||||||||||||||
| Operating income for reportable segments | $ | $ | $ | ||||||||||||||
| Unallocated corporate expenses | ( | ( | ( | ||||||||||||||
| Amortization | ( | ( | ( | ||||||||||||||
| Consolidated operating income | $ | $ | $ | ||||||||||||||
| Total assets: | |||||||||||||||||
| Identifiable assets for reportable segments | $ | $ | |||||||||||||||
| Corporate assets unallocated to segments | |||||||||||||||||
| Cash and cash equivalents | |||||||||||||||||
| Consolidated total assets | $ | $ | |||||||||||||||
| Depreciation and amortization: | |||||||||||||||||
| Depreciation and amortization for reportable segments | $ | $ | $ | ||||||||||||||
| Corporate depreciation and amortization | |||||||||||||||||
| Consolidated depreciation and amortization | $ | $ | $ | ||||||||||||||
| Capital expenditures: | |||||||||||||||||
| Capital expenditures for reportable segments | $ | $ | $ | ||||||||||||||
| Corporate capital expenditures | |||||||||||||||||
| Consolidated capital expenditures | $ | $ | $ | ||||||||||||||
Amortization expense related to intangible assets in the Manufacturing segment for the years ended December 31, 2021, 2020 and 2019 was $46.7 million, $33.5 million and $29.5 million, respectively. Intangible assets amortization expense in the Distribution segment was $9.6 million, $7.4 million and $6.4 million in 2021, 2020 and 2019, respectively.
Unallocated corporate expenses include corporate general and administrative expenses comprised of wages, insurance, taxes, supplies, travel and entertainment, professional fees and other.
F-39
Major Customers
The Company had two major customers that accounted for the following sales in our Manufacturing and Distribution segments for the years ended December 31, 2021, 2020, 2019 and trade receivables balances at December 31, 2021 and 2020 as shown in the table below:
| 2021 | 2020 | 2019 | ||||||||||||||||||
| Customer 1 | ||||||||||||||||||||
| Net sales | % | % | % | |||||||||||||||||
| Trade receivables | % | % | ||||||||||||||||||
| Customer 2 | ||||||||||||||||||||
| Net sales | % | % | % | |||||||||||||||||
| Trade receivables | % | % | ||||||||||||||||||
19. QUARTERLY FINANCIAL DATA (UNAUDITED)
Selected quarterly financial data for the years ended December 31, 2021 and 2020 is as follows:
| (thousands except per share data) | 1Q | 2Q | 3Q | 4Q | 2021 | |||||||||||||||||||||||||||
| Net sales | $ | $ | $ | $ | $ | |||||||||||||||||||||||||||
| Gross profit | ||||||||||||||||||||||||||||||||
| Net income | ||||||||||||||||||||||||||||||||
Net income per common share(1) | ||||||||||||||||||||||||||||||||
| Basic | $ | $ | $ | $ | $ | |||||||||||||||||||||||||||
| Diluted | ||||||||||||||||||||||||||||||||
| Cash dividends paid per common share | $ | $ | $ | $ | $ | |||||||||||||||||||||||||||
| (thousands except per share data) | 1Q | 2Q | 3Q | 4Q | 2020 | |||||||||||||||||||||||||||
| Net sales | $ | $ | $ | $ | $ | |||||||||||||||||||||||||||
| Gross profit | ||||||||||||||||||||||||||||||||
| Net income | ||||||||||||||||||||||||||||||||
Net income per common share(1) | ||||||||||||||||||||||||||||||||
| Basic | $ | $ | $ | $ | $ | |||||||||||||||||||||||||||
| Diluted | ||||||||||||||||||||||||||||||||
| Cash dividends paid per common share | $ | $ | $ | $ | $ | |||||||||||||||||||||||||||
(1) Basic and diluted net income per common share are computed independently for each of the quarters presented. Therefore, the sum of quarterly basic and diluted net income per common share information may not equal annual basic and diluted net income per common share.
F-40
20. SUBSEQUENT EVENTS
In January 2022, the Company announced that the Board of Directors authorized an increase in the amount of the Company's common stock that may be acquired over the next 24 months under the current stock repurchase program to $100.0 million, including the $11.0 million remaining under the previous authorization.
In February 2022, we signed a definitive agreement under which Arizona-based Rockford Corporation (“Rockford”) will become a wholly-owned subsidiary of Patrick by merger. Rockford, through its brand Rockford Fosgate®, designs and distributes audio systems and components, primarily serving the powersports and the automotive aftermarkets. The transaction is expected to close in March 2022.
F-41
Serious News for Serious Traders! Try StreetInsider.com Premium Free!
You May Also Be Interested In
- Patrick Industries, Inc. Announces First Quarter 2024 Earnings Release and Conference Call Webcast on May 2, 2024
- Faraday Future Receives Letter from Nasdaq Regarding Form 10-K Filing
- Avis Budget Group to Announce First Quarter 2024 Results on May 1st
Create E-mail Alert Related Categories
SEC FilingsSign up for StreetInsider Free!
Receive full access to all new and archived articles, unlimited portfolio tracking, e-mail alerts, custom newswires and RSS feeds - and more!
