

Form 10-K OLIN Corp For: Dec 31
 Tweet
Tweet Share
ShareUNITED STATES
SECURITIES AND EXCHANGE COMMISSION
WASHINGTON, D.C. 20549
Form 10-K
(Mark One)
| ANNUAL REPORT PURSUANT TO SECTION 13 OR 15(d) OF THE SECURITIES EXCHANGE ACT OF 1934 | |||||
For the fiscal year ended December 31, 2021
OR
| TRANSITION REPORT PURSUANT TO SECTION 13 OR 15(d) OF THE SECURITIES EXCHANGE ACT OF 1934 | |||||
For the transition period from to
Commission file number 1-1070

(Exact name of registrant as specified in its charter)
| (State or other jurisdiction of incorporation or organization) | (I.R.S. Employer Identification No.) | |||||||||||||
| (Address of principal executive offices) | (Zip code) | |||||||||||||
Registrant’s telephone number, including area code: (314 ) 480-1400
Securities registered pursuant to Section 12(b) of the Act:
| Title of each class: | Trading symbol: | Name of each exchange on which registered: | ||||||||||||
Indicate by check mark if the registrant is a well-known seasoned issuer, as defined in Rule 405 of the Securities Act. Yes ☒ No ☐
Indicate by check mark if the registrant is not required to file reports pursuant to Section 13 or Section 15(d) of the Act. Yes ☐ No ☒
Indicate by check mark whether the registrant: (1) has filed all reports required to be filed by Section 13 or 15(d) of the Securities Exchange Act of 1934 during the preceding 12 months (or for such shorter period that the registrant was required to file such reports), and (2) has been subject to such filing requirements for the past 90 days. Yes ☒ No ☐
Indicate by check mark whether the registrant has submitted electronically every Interactive Data File required to be submitted pursuant to Rule 405 of Regulation S-T (§ 232.405 of this chapter) during the preceding 12 months (or for such shorter period that the registrant was required to submit such files). Yes ☒ No ☐
Indicate by check mark whether the registrant is a large accelerated filer, an accelerated filer, a non-accelerated filer, a smaller reporting company, or an emerging growth company. See the definitions of “large accelerated filer,” “accelerated filer,” “smaller reporting company,” and “emerging growth company” in Rule 12b-2 of the Exchange Act. Large accelerated filer ☒ Accelerated filer ☐ Non-accelerated filer ☐ Smaller reporting company ☐ Emerging growth company ☐
If an emerging growth company, indicate by check mark if the registrant has elected not to use the extended transition period for complying with any new or revised financial accounting standards provided pursuant to Section 13(a) of the Exchange Act. ☐
Indicate by check mark whether the registrant has filed a report on and attestation to its management’s assessment of the effectiveness of its internal control over financial reporting under Section 404(b) of the Sarbanes-Oxley Act (15 U.S.C. 7262(b)) by the registered public accounting firm that prepared or issued its audit report. ☒
Indicate by check mark whether the registrant is a shell company (as defined in Rule 12b-2 of the Act). Yes ☐ No ☒
As of June 30, 2021, the aggregate market value of registrant’s common stock, $1.00 par value per share, held by non-affiliates of registrant was approximately $7,365,032,087 based on the closing sale price as reported on the New York Stock Exchange.
As of January 31, 2022, 156,083,829 shares of the registrant’s common stock were outstanding.
DOCUMENTS INCORPORATED BY REFERENCE
Portions of the following document are incorporated by reference in this Form 10-K as indicated herein:
| Document | Part of 10-K into which incorporated | |||||||
| Proxy Statement relating to Olin’s Annual Meeting of Shareholders to be held in 2022 | Part III | |||||||
| TABLE OF CONTENTS FOR FORM 10-K | Page | |||||||
| Item 1. | ||||||||
| Item 1A. | ||||||||
| Item 1B. | ||||||||
| Item 2. | ||||||||
| Item 3. | ||||||||
| Item 4. | ||||||||
| Item 5. | ||||||||
| Item 6. | ||||||||
| Item 7. | ||||||||
| Item 7A. | ||||||||
| Item 8. | ||||||||
| Item 9. | ||||||||
| Item 9A. | ||||||||
| Item 9B. | ||||||||
| Item 9C. | ||||||||
| Item 10. | ||||||||
| Item 11. | ||||||||
| Item 12. | ||||||||
| Item 13. | ||||||||
| Item 14. | ||||||||
| Item 15. | ||||||||
| Item 16. | ||||||||
2
PART I
Item 1. BUSINESS
GENERAL
Olin Corporation (Olin) is a Virginia corporation, incorporated in 1892, having its principal executive offices in Clayton, MO. We are a manufacturer concentrated in three business segments: Chlor Alkali Products and Vinyls, Epoxy and Winchester. The Chlor Alkali Products and Vinyls segment manufactures and sells chlorine and caustic soda, ethylene dichloride and vinyl chloride monomer, methyl chloride, methylene chloride, chloroform, carbon tetrachloride, perchloroethylene, hydrochloric acid, hydrogen, bleach products and potassium hydroxide, which represent 46% of 2021 sales. The Epoxy segment produces and sells a full range of epoxy materials and precursors, including aromatics (acetone, bisphenol, cumene and phenol), allyl chloride, epichlorohydrin, liquid epoxy resins, solid epoxy resins and downstream products such as converted epoxy resins and additives, which represent 36% of 2021 sales. The Winchester segment produces and sells sporting ammunition, reloading components, small caliber military ammunition and components, and industrial cartridges, which represent 18% of 2021 sales. See our discussion of our segment disclosures contained in Item 7—“Management’s Discussion and Analysis of Financial Condition and Results of Operations.”
GOVERNANCE
We maintain an Internet website at www.olin.com. Our reports on Form 10-K, Form 10-Q and Form 8-K, as well as amendments to those reports, are available free of charge on our website, as soon as reasonably practicable after we file the reports with the Securities and Exchange Commission (SEC). Also, a copy of our electronically filed materials can be obtained at www.sec.gov. Our Principles of Corporate Governance, Committee Charters and Code of Conduct are available on our website at www.olin.com in the Leadership & Governance Section under Governance Documents and Committees.
In May 2021, our Chief Executive Officer (CEO) executed the annual Section 303A.12(a) CEO Certification required by the New York Stock Exchange (NYSE), certifying that he was not aware of any violation of the NYSE’s corporate governance listing standards by us. Additionally, our Chief Executive Officer and Chief Financial Officer (CFO) executed the required Sarbanes-Oxley Act of 2002 Sections 302 and 906 certifications relating to this Annual Report on Form 10-K, which are filed with the SEC as exhibits to this Annual Report on Form 10-K.
PRODUCTS, SERVICES AND STRATEGIES
Chlor Alkali Products and Vinyls
Products and Services
We have been involved in the chlor alkali industry for approximately 130 years and consider ourselves the leading global chlor alkali and derivatives producer. Chlorine, caustic soda and hydrogen are co-produced commercially by the electrolysis of salt. These co-produced products are produced simultaneously, and in a fixed ratio of 1.0 ton of chlorine to 1.1 tons of caustic soda and 0.03 tons of hydrogen. The industry refers to this as an Electrochemical Unit or ECU.
Chlorine is used as a raw material in the production of thousands of products, including vinyls, urethanes, epoxy, water treatment chemicals and a variety of other organic and inorganic chemicals. A significant portion of chlorine production is consumed in the manufacture of ethylene dichloride (EDC) and vinyl chloride monomer (VCM), both of which our Chlor Alkali Products and Vinyls segment produces. A large portion of our EDC production is utilized in the production of VCM, but we are also one of the largest global participants in merchant EDC sales. In addition to marketing Olin produced EDC, we also purchase EDC for re-sale on a global basis. EDC and VCM are precursors for polyvinyl chloride (PVC), a material used in applications such as vinyl siding, pipe, pipe fittings and automotive parts.
Our Chlor Alkali Products and Vinyls segment is one of the largest global marketers of caustic soda, including caustic soda produced by Olin, as well as globally produced material purchased by Olin for re-sale. The diversity of caustic soda sourcing allows us to cost effectively supply customers worldwide. Caustic soda has a wide variety of end-use applications, the largest of which includes water treatment, alumina, pulp and paper, urethanes, detergents and soaps and a variety of other organic and inorganic chemicals.
Our Chlor Alkali Products and Vinyls segment also includes our chlorinated organics business which is the largest global producer of chlorinated organic products that include chloromethanes (methyl chloride, methylene chloride and chloroform)
3
and chloroethanes (perchloroethylene and carbon tetrachloride). Our chlorinated organics business participates in both the solvent segment, as well as the intermediate segment of the global chlorocarbon industry with a focus on sustainable applications and in applications where we can benefit from our cost advantages. Intermediate products are used as feedstocks in the production of fluoropolymers, fluorocarbon refrigerants and blowing agents, silicones, cellulosics and agricultural chemicals. Solvent products are sold into end uses such as surface preparation, dry cleaning, pharmaceuticals and regeneration of refining catalysts. This business’s unique technology allows us to utilize both hydrochloric acid and chlorinated hydrocarbon byproducts (RCls), produced by our other production processes, as raw materials in an integrated system.
We also manufacture and sell other chlor alkali-related products, including hydrochloric acid, sodium hypochlorite (bleach) and potassium hydroxide. The production of these products, chlorinated organics products and epoxy resins generally consume chlorine as a raw material creating downstream applications that upgrade the value of chlorine and enable caustic soda production. Our industry leadership in the production of chlorinated organics and epoxy resins, as well as other products, offer us eighteen integrated outlets for our captive chlorine.
The Chlor Alkali Products and Vinyls segment’s products are delivered by pipeline, marine vessel, deep-water and coastal barge, railcar and truck. Our logistics and terminal infrastructure provides us with geographically advantaged storage capacity and provides us with a private fleet of trucks, tankers and trailers that expands our geographic coverage and enhances our service capabilities. At our largest integrated product sites, our deep-water access enables us to reach global markets.
Our Chlor Alkali Products and Vinyls segment currently maintains a reliable supply of key raw materials. Electricity, salt, ethylene and methanol are the major purchased raw materials for our Chlor Alkali Products and Vinyls segment. Electricity is the single largest raw material component in the production of Chlor Alkali Products and Vinyls’ products. Approximately 72% of our electricity is generated from natural gas or hydroelectric sources. We satisfy our electricity needs through a combination of long-term power supply contracts and the operation of our own power assets, which allow for cost differentiation at specific U.S. manufacturing sites. Approximately 73% of our salt requirements are met by internal supply. Ethylene is primarily supplied for the vinyls business under a long-term supply arrangement whereby we receive ethylene at integrated producer economics. Methanol is sourced domestically and internationally primarily from large producers. The high volume nature of the chlor alkali industry places an emphasis on cost management, and we believe that our scale, integration and raw material positions make us one of the low cost producers in the industry.
4
The following table lists principal products and services of our Chlor Alkali Products and Vinyls segment.
| Products & Services | Major End Uses | Plants & Facilities | Major Raw Materials & Components for Products/Services | |||||||||||||||||
| Chlorine/caustic soda | Pulp & paper processing, chemical manufacturing, water purification, vinyl chloride manufacturing, bleach, swimming pool chemicals and urethane chemicals | Becancour, Canada Charleston, TN Freeport, TX McIntosh, AL Niagara Falls, NY Plaquemine, LA St. Gabriel, LA | salt, electricity | |||||||||||||||||
| Ethylene dichloride/vinyl chloride monomer | Precursor to polyvinyl chloride used in vinyl siding, plumbing and automotive parts | Freeport, TX Plaquemine, LA | chlorine, ethylene, ethylene dichloride | |||||||||||||||||
| Chlorinated organics intermediates | Used as feedstocks in the production of fluoropolymers, fluorocarbon refrigerants and blowing agents, silicones, cellulosics and agricultural chemicals | Freeport, TX Plaquemine, LA Stade, Germany | chlorine, ethylene dichloride, hydrochloric acid, methanol, RCls | |||||||||||||||||
| Chlorinated organics solvents | Surface preparation, dry cleaning and pharmaceuticals | Freeport, TX Plaquemine, LA Stade, Germany | chlorine, ethylene dichloride, hydrochloric acid, RCls | |||||||||||||||||
| Sodium hypochlorite (bleach) | Household cleaners, laundry bleaching, swimming pool sanitizers, semiconductors, water treatment, textiles, pulp & paper and food processing | Augusta, GA Becancour, Canada Charleston, TN Freeport, TX Henderson, NV Lemont, IL McIntosh, AL* Niagara Falls, NY* Santa Fe Springs, CA Tracy, CA** | caustic soda, chlorine | |||||||||||||||||
| Hydrochloric acid | Steel, oil & gas, plastics, organic chemical synthesis, water & wastewater treatment, brine treatment, artificial sweeteners, pharmaceuticals, food processing and ore & mineral processing | Becancour, Canada Charleston, TN Freeport, TX McIntosh, AL Niagara Falls, NY | chlorine, hydrogen | |||||||||||||||||
| Potassium hydroxide | Fertilizer manufacturing, soaps, detergents & cleaners, battery manufacturing, food processing chemicals and deicers | Charleston, TN | electricity, potassium chloride | |||||||||||||||||
| Hydrogen | Fuel source, hydrogen peroxide and hydrochloric acid | Becancour, Canada Charleston, TN Freeport, TX McIntosh, AL Niagara Falls, NY Plaquemine, LA St. Gabriel, LA | electricity, salt | |||||||||||||||||
| * Includes low salt, high strength bleach manufacturing. ** On January 19, 2022, Olin announced that we will discontinue bleach manufacturing at our Tracy, CA facility by June 30, 2022. | ||||||||||||||||||||
Strategies
Maximize returns to the ECU. Leverage our diverse and flexible chlor alkali derivatives portfolio via our strategic operating model to continually mitigate exposure and maximize value from the entire ECU by managing our production rates to the prevailing weaker side of the ECU.
Participate in global trade flow of the products we market. Access excess product available for global trade, complementing our internal produced product to serve a growing customer demand at the highest value.
Continually drive down costs through productivity. Our advantaged cost position is derived from low cost energy, scale, integration, and deep water ports. Maintaining a strong discipline on areas such as cost management, capital outlays, and asset maintenance are key to creating greater operating flexibility to maximize returns to the ECU.
5
Epoxy
Products and Services
The Epoxy business was one of the first major manufacturers of epoxy products, and has continued to build on more than half a century of history through product innovation and technical excellence. We believe the Epoxy segment is one of the largest fully integrated global producers of epoxy resins, curing agents and intermediates. The Epoxy segment has a favorable manufacturing cost position driven by a combination of scale and integration into low cost feedstocks (including chlorine, caustic soda, allylics and aromatics). With its advantaged cost position, the Epoxy segment is among the lowest cost producers in the world. The Epoxy segment produces and sells a full range of epoxy materials and precursors, including upstream products such as aromatics (acetone, bisphenol (BisA), cumene and phenol), allyl chloride (Allyl) and epichlorohydrin (EPI), midstream products such as liquid epoxy resins (LER) and solid epoxy resins (SER) and downstream products such as converted epoxy resins (CER) and additives.
The Epoxy segment serves a diverse array of applications, including wind energy, electrical laminates, consumer goods and composites, as well as numerous applications in civil engineering and protective coatings. The Epoxy segment has important relationships with established customers, some of which span decades. The Epoxy segment’s primary geographies are North America and Western Europe. The segment products are delivered primarily by marine vessel, deep-water and coastal barge, railcar and truck.
Allyl is used not only as a feedstock in the production of EPI, but also as a chemical intermediate in multiple industries and applications, including water purification chemicals. EPI is primarily produced as a feedstock for use in the business’s epoxy resins, and is also sold in the merchant market. LER is manufactured in liquid form and cures with the addition of a hardener into a three-dimensional thermoset solid material offering a distinct combination of structural strength, adhesion, electrical insulation, thermal or chemical resistance and corrosion protection that is well-suited to coatings and composites applications. SER is processed further with BisA to meet specific end market applications. While LER and SER are sold externally, a significant portion of LER production is further converted into CER where value-added modifications produce higher margin resins.
Our Epoxy segment maintains a reliable supply of certain key raw materials, such as benzene and propylene, under long-term, cost based contracts. The Epoxy segment’s production economics benefit from its integration into chlor alkali and aromatics which are key inputs in epoxy production. This fully integrated structure provides both access to low cost materials and significant operational flexibility. The Epoxy segment operates an integrated aromatics production chain producing cumene, phenol, acetone and BisA for internal consumption and external sale. The Epoxy segment’s consumption of chlorine enables the Chlor Alkali Products and Vinyls segment to generate caustic soda production and sales. Chlorine used in our Epoxy segment is transferred at cost from the Chlor Alkali Products and Vinyls segment.
The following table lists principal products and services of our Epoxy segment.
| Products & Services | Major End Uses | Plants & Facilities | Major Raw Materials & Components for Products/Services | |||||||||||||||||
| Allylics (allyl chloride, epichlorohydrin and glycerin) & aromatics (acetone, bisphenol, cumene and phenol) | Manufacturers of polymers, resins and other plastic materials and water purification | Freeport, TX Stade, Germany Terneuzen, Netherlands | benzene, caustic soda, chlorine, propylene | |||||||||||||||||
| Liquid epoxy resin/solid epoxy resin | Adhesives, marine and protective coatings, composites and flooring | Freeport, TX Guaruja, Brazil Stade, Germany | bisphenol, caustic soda, epichlorohydrin | |||||||||||||||||
| Converted epoxy resins and additives | Electrical laminates, paint and coatings, wind blades, electronics and construction | Baltringen, Germany Freeport, TX Guaruja, Brazil Gumi, South Korea Pisticci, Italy Rheinmunster, Germany Roberta, GA Stade, Germany Zhangjiagang, China | liquid epoxy resins, solid epoxy resins | |||||||||||||||||
6
Strategies
Focus on Return to the ECU. The Epoxy segment is focused on maximizing return to the ECU by targeting participation and improving margins in EPI, LER, and derivative applications with the highest return to the ECU.
Drive Productivity to Sustain Our Cost Advantage. The Epoxy segment continues to drive productivity cost improvements through the entire supply chain to build on our position as the low cost producer of EPI and LER in the Americas and Europe.
Capitalize on Aromatics Assets. The Epoxy segment utilizes our Aromatics position as a low-cost feedstock for LER and derivative applications while seeking the highest return opportunities for Aromatics assets.
Winchester
Products and Services
In 2022, Winchester is in its 156th year of operation and its 92nd year as part of Olin. Winchester is a premier developer and manufacturer of small caliber ammunition for sale to domestic and international retailers (commercial customers), law enforcement agencies and domestic and international militaries. We believe we are a leading U.S. producer of ammunition for recreational shooters, hunters, law enforcement agencies and the U.S. Armed Forces. Winchester also manufactures industrial products that have various applications in the construction industry.
On October 1, 2020, Winchester assumed full management and operational control of the Lake City Army Ammunition Plant (Lake City) in Independence, MO. The United States Army selected Winchester to operate and manage Lake City in September 2019. The contract is for the production of small caliber military ammunition, including 5.56mm, 7.62mm, and .50 caliber rounds, as well as certain cartridges and casings. The contract also allows for the production of certain ammunition for commercial customers. The contract has an initial term of seven years and may be extended by the United States Army for up to three additional years.
Our legendary Winchester® product line includes all major gauges and calibers of shotgun shells, rimfire and centerfire ammunition for pistols and rifles, reloading components and industrial cartridges. We believe we are a leading U.S. supplier of small caliber commercial ammunition.
Winchester has strong relationships throughout the sales and distribution chain and strong ties to traditional dealers and distributors. Winchester has also built its business with key high-volume mass merchants and specialty sporting goods and outdoor merchandise retailers. Winchester has consistently developed industry-leading ammunition, which is recognized in the industry for manufacturing excellence, design innovation and consumer value.
In November 2021, Winchester introduced Shoot UnitedTM, a dynamic initiative designed to promote the shooting sports and drive increased participation. Shoot United embodies engaging content that will be shared nationwide through mainstream media and on ShootUnited.com. The content is meant to entertain, inform and foster a healthy and transparent dialogue. In addition, grassroots events will be coordinated throughout the U.S. for people to join, with the mission to drive awareness and introduce new participants to the sport.
During 2021, Winchester received the exclusive .308 Winchester/7.62x51 NATO FBI sniper contract, the first of its kind in this caliber, as well as a 9mm duty and training contract.
In May 2021, Winchester was recognized with the Overall Supplier of the Year award by Academy Sports and Outdoors, Incorporated (Academy), one of the nation’s largest retailers of sporting goods products and outdoor merchandise. The Overall Supplier of the Year is Academy’s highest merchandising supplier award across all categories and departments; Winchester was chosen from more than 1,800 merchandise suppliers for superior performance, consistent reliability, valued relationships at all levels, and overall contribution to the company during 2020.
In October 2021, Winchester was recognized by the National Association of Sporting Goods Wholesalers (NASGW) with the group’s 2021 Ammunition Manufacturer of the Year award for providing outstanding value and service to NASGW distributor members.
Winchester’s new ammunition products continue to receive awards from major industry publications and organizations, with recent awards including: American Rifleman magazine’s Golden Bullseye Award as “Ammunition Product of the Year” in 2020 and 2022; Guns & Ammo magazine’s “Ammunition of the Year” award in 2019 and 2021; National Association of
7
Sporting Goods Wholesalers in partnership with the Professional Outdoor Media Association’s Caliber Award for “Best New Ammunition” in 2019.
Winchester purchases raw materials such as copper-based strip and ammunition cartridge case cups and lead from vendors based on a conversion charge or premium. These conversion charges or premiums are in addition to the market prices for metal as posted on exchanges such as the Commodity Exchange, or COMEX, and London Metals Exchange, or LME. Winchester’s other main raw material is propellant, which is purchased predominantly from one of the U.S.’s largest propellant suppliers.
The following table lists principal products and services of our Winchester segment.
| Products & Services | Major End Uses | Plants & Facilities | Major Raw Materials & Components for Products/Services | |||||||||||||||||
Winchester® sporting ammunition (shotshells, small caliber centerfire & rimfire ammunition) | Hunters & recreational shooters, law enforcement agencies | East Alton, IL Independence, MO* Oxford, MS | brass, lead, steel, plastic, propellant, explosives | |||||||||||||||||
| Small caliber military ammunition | Infantry and mounted weapons | East Alton, IL Independence, MO* Oxford, MS | brass, lead, propellant, explosives | |||||||||||||||||
| Industrial products (8 gauge loads & powder-actuated tool loads) | Maintenance applications in power & concrete industries, powder-actuated tools in construction industry | East Alton, IL Oxford, MS | brass, lead, plastic, propellant, explosives | |||||||||||||||||
*Government-owned, contractor-operated (GOCO) facility
Strategies
Maximize Existing Strengths. Winchester will increase our value by strengthening our leadership position in small caliber ammunition through all of the customer segments that we serve – Commercial, Military, Law Enforcement, and Industrial. Through our Shoot UnitedTM strategic initiative, Winchester will focus on promoting shooting sports and drive increased participation. With one of the world’s largest small caliber ammunition manufacturing footprints, we will leverage employee engagement, engineering, and process excellence across our three production sites.
Innovative Solutions. Winchester will continue building on our strong reputation as an industry innovator with a long record of meeting the needs of recreational shooters, first responders, and the modern warfighter. We will drive value for our business through developing market driven new products and delivering engineered solutions for our customers.
Productivity Improvement. Winchester will leverage our continuous improvement process to increase productivity through optimizing our people, processes, and equipment. We will continue to modernize our facilities and equipment for productivity as well as improved safety and environmental impact.
INTERNATIONAL OPERATIONS
Olin has an international presence, including the geographic regions of Europe, Asia Pacific and Latin America. Approximately 41% of Olin’s 2021 sales were generated outside of the U.S., including 31% of our Chlor Alkali Products and Vinyls 2021 segment sales, 71% of our Epoxy 2021 segment sales and 5% of our Winchester 2021 segment sales. See Note 19 “Segment Information” of the notes to consolidated financial statements contained in Item 8, for geographic segment data. We are incorporating our segment information from that Note into this section of our Form 10-K.
CUSTOMERS AND DISTRIBUTION
Products we sell to industrial or commercial users or distributors for use in the production of other products constitute a major part of our total sales. We sell some of our products, such as epoxy resins, caustic soda and sporting ammunition, to a large number of users or distributors, while we sell other products, such as chlorine and chlorinated organics, in substantial quantities to a relatively small number of industrial users. During 2021, no single customer accounted for more than 10% of sales.
We market most of our products and services primarily through our sales force and sell directly to various industrial customers, mass merchants, retailers, wholesalers, other distributors and the U.S. Government and its prime contractors.
8
Sales to all U.S. Government agencies and sales under U.S. Government contracting activities in total accounted for approximately 4% of sales in 2021. Because we engage in some government contracting activities and make sales to the U.S. Government, we are subject to extensive and complex U.S. Government procurement laws and regulations. These laws and regulations provide for ongoing government audits and reviews of contract procurement, performance and administration. Failure to comply, even inadvertently, with these laws and regulations and with laws governing the export of munitions and other controlled products and commodities could subject us or one or more of our businesses to civil and criminal penalties, and under certain circumstances, suspension and debarment from future government contracts and the exporting of products for a specified period of time.
BACKLOG
The total amount of estimated backlog was approximately $1,928 million and $2,175 million as of January 31, 2022 and 2021, respectively. The backlog orders are associated with contractual orders in our Winchester business. Backlogs in our other businesses are not significant. Backlog is comprised of all open customer orders which have been received, but not yet shipped. The backlog was estimated based on expected volume to be shipped from firm contractual orders, which are subject to customary terms and conditions, including cancellation and modification provisions. During 2020 and 2021, consumer purchases of ammunition increased significantly above historic demand levels. Our ability to fulfill the backlog could be constrained due to limitations on our production capacity. Approximately 81% of contracted backlog as of January 31, 2022 is expected to be fulfilled during 2022, with the remainder expected to be fulfilled during 2023.
COMPETITION
We are in active competition with businesses producing or distributing the same or similar products, as well as, in some instances, with businesses producing or distributing different products designed for the same uses.
Chlor alkali manufacturers in North America, with approximately 16 million tons of chlorine and 17 million tons of caustic soda capacity, account for approximately 16% of worldwide chlor alkali production capacity. In 2021, we have the largest chlor alkali capacity in North America and globally. While the technologies to manufacture and transport chlorine and caustic soda are widely available, the production facilities require large capital investments, and are subject to significant regulatory and permitting requirements. Approximately 68% of the total North American chlor alkali capacity is located in the U.S. Gulf Coast region. There is a worldwide market for caustic soda, which attracts imports and allows exports depending on market conditions. This industry includes large diversified producers in North America and abroad, including multiple producers located in China. Other large chlor alkali producers in North America include The Occidental Petroleum Corporation (Oxy) and Westlake Chemical Corporation (Westlake).
We are also a leading integrated global producer of chlorinated organic products with a strong cost position due to our scale and access to chlor alkali feedstocks. This industry includes large diversified producers such as Oxy, Westlake, Inovyn (an Ineos company), and KEM ONE Group SAS, as well as multiple producers located in China.
We are a major global fully integrated epoxy producer, with access to key low cost feedstocks and a cost advantaged infrastructure. With its advantaged cost position, the Epoxy segment is among the lowest cost producers in the world. The markets in which our Epoxy segment operates are highly competitive and are dependent on significant capital investment, the development of proprietary technology and maintenance of product research and development. Among our competitors are Huntsman Corporation (Huntsman), Hexion, Inc. (Hexion), Kukdo Chemical Co. Ltd. (Kukdo) and Kumho P&B Chemicals (Kumho) as well as multiple other producers located in Asia. Westlake announced that it has completed the acquisition of Hexion’s global epoxy business.
We believe our Winchester business is one of the largest global manufacturers of commercial small caliber ammunition. Our Winchester business and Vista Outdoor Inc. (Vista) are among the largest commercial ammunition manufacturers in the U.S. The ammunition industry is highly competitive with Olin, Vista and numerous smaller domestic manufacturers and foreign producers competing for sales to the commercial ammunition customers. Many factors influence our ability to compete successfully, including price, delivery, service, performance, product innovation and product recognition and quality, depending on the product involved.
9
HUMAN CAPITAL
At Olin, we believe that our employees are critical to our success. In 2021 we established our Lifting People core principle with three distinct pillars - Opportunity & Fulfillment, Communication & Connection, and Trust. Lifting People is about creating work environments for our global workforce that are inclusive, supportive, and empowering while encouraging and incentivizing the highest level of performance. We support our global workforce through a variety of factors, including benefits and compensation, recognition and rewards, a focus on diversity and inclusion, and professional development, all of which are included in the overall employee value proposition. We strive to provide our employees with a safe and supportive environment and maintain a steadfast commitment to safely producing and distributing our products, both of which we believe are fundamental in achieving our goals.
Olin senior management provides oversight for the benefits programs and compensation of our workforce in a variety of ways, including periodic compensation benchmarking, implementation of various health and other employee benefit programs review of certain employee post-retirement benefits and accessibility of employee assistance programs. Our human resources department oversees these programs to ensure our benefits and compensation programs are competitive. We have both salaried and hourly employee structures in place to compensate employees. Our benefits and compensation structures allow Olin to attract and retain a talented workforce which fosters achievement of Olin’s goals and objectives. Separately, our Board of Directors maintains a Compensation Committee which sets policies, develops and monitors strategies for and administers the programs that are used to compensate our CEO and other senior executives.
Olin is committed to lifting people through diversity and inclusion and maintaining work environments where all employees are comfortable bringing their authentic selves to work each day. We believe the insights provided by our workforce through their unique skills, backgrounds and experiences will lead us to future innovations that will reduce costs, reduce our environmental footprint, improve our ability to serve the world and keep our employees healthier and safer. We uphold the diversity of our employees to embolden inclusive dialogue, creative ideas, and innovative solutions to cultivate lasting, positive impacts for our customers, employees, communities, and shareholders. Our largest concentration of employees is located in the U.S., of which 29% are minorities. In our support of diversity and inclusion objectives, approximately 26% of our global workforce is comprised of women, and approximately 27% of our management roles are held by women, and 14% by minority employees in the U.S. Our goal is to expand women in leadership positions to approximately 30% by 2025, an increase of approximately 10% against a 2018 baseline.
We also strive for continued professional development of our workforce. We never stop learning and Olin provides a wide range of employee development and productivity programs. These programs help our employees improve and grow, and ensure that each employee understands our values. Our learning platform focuses on providing a variety of educational opportunities that support career development for our people. As part of our commitment to professional development, we offer undergraduate and graduate tuition assistance to eligible employees up to a maximum of $10,000 per year. We regularly review talent development and succession plans to identify and develop a pipeline of talent to maintain and continuously improve business operations. We make purposeful moves to accelerate the development of high potential employees. We also have a well-established performance management process, which encourages ongoing feedback throughout the year and includes, at a minimum, annual year-end reviews and development discussions.
As of December 31, 2021, we had approximately 7,750 employees, with 6,555 working in the U.S., and approximately 1,195 working in foreign countries. Of our total global workforce, approximately 9% are located in Europe, Middle East, Africa, and India, 3% in Asia Pacific, 2% in Canada, and 2% in Latin America. Approximately 48% of our total employees are employed in our Chlor Alkali Products and Vinyls and Epoxy businesses, 49% are employed in our Winchester business, including approximately 1,540 employees at the Lake City Army Ammunition Plant, which is a Government Owned Contractor Operated (GOCO) facility, and 3% are employed in Corporate functions. Various labor unions represent a significant number of our hourly-paid employees for collective bargaining purposes. In the U.S., bargaining unit employees comprise 35% of the total workforce. In 2022, we have no labor agreements that are due to expire in the U.S.
10
RESEARCH ACTIVITIES; PATENTS
Our research activities are conducted on a product-group basis at a number of facilities. Company-sponsored research expenditures were $20.4 million, $16.6 million and $16.5 million in 2021, 2020 and 2019, respectively.
We own or license a number of patents, patent applications and trade secrets covering our products and processes. We believe that, in the aggregate, the rights under our patents and licenses are important to our operations, but we do not consider any individual patent, license or group of patents and licenses related to a specific process or product to be of material importance to our total business.
SEASONALITY
Our sales are affected by economic downturns and the seasonality of several industries we serve, including building and construction, coatings, oil and gas, infrastructure, electronics, automotive, water treatment, refrigerants and ammunition. The seasonality of the ammunition business is typically driven by the U.S. fall hunting season. Our chlor alkali businesses generally experience their highest level of activity during the spring and summer months, particularly when construction, refrigerants, coatings and infrastructure activity is higher. Our Epoxy segment also serves a number of applications which experience their highest level of activity during the spring and summer months, particularly civil engineering and protective coatings and other construction materials, including composites and flooring.
RAW MATERIALS AND ENERGY
Basic raw materials are processed through an integrated manufacturing process to produce a number of products that are sold at various points throughout the process. We purchase a portion of our raw material requirements and also utilize internal resources and finished goods as raw materials for downstream products. We believe we have reliable sources of supply for our raw materials under normal market conditions. However, we cannot predict the likelihood or impact of any future raw material shortages.
The principal basic raw materials for our production of Chlor Alkali Products and Vinyls’ products are electricity, salt, ethylene and methanol. Electricity is the predominant energy source for our manufacturing facilities. Approximately 72% of our electricity is generated from natural gas or hydroelectric sources. We satisfy our electricity needs through a combination of long-term power supply contracts and the operation of our own power assets, which allow for cost differentiation at specific U.S. manufacturing sites. A portion of our purchases of raw materials, including ethylene, are made under long-term supply agreements, while approximately 73% of the salt used in our Chlor Alkali Products and Vinyls segment is produced from internal resources. Methanol is sourced domestically and internationally primarily from large producers.
The Epoxy segment’s principal raw materials are chlorine, benzene, propylene and aromatics, which consist of cumene, phenol, acetone and BisA. A portion of our purchases of raw materials, including benzene, propylene and a portion of our aromatics requirements, are made under long-term supply agreements, while a portion of our aromatics requirements are produced from our integrated production chain. Chlorine is predominately sourced from our Chlor Alkali Products and Vinyls segment.
Lead, brass and propellant are the principal raw materials used in the Winchester business. We typically purchase our ammunition cartridge case cups and copper-based strip, and propellants pursuant to multi-year contracts.
We provide additional information with respect to specific raw materials in the tables set forth under “Products and Services.”
11
ENVIRONMENTAL AND TOXIC SUBSTANCES CONTROLS
As is common in our industry, we are subject to environmental laws and regulations related to the use, storage, handling, generation, transportation, emission, discharge, disposal and remediation of, and exposure to, hazardous and non-hazardous substances and wastes in all of the countries in which we do business.
The establishment and implementation of national, state or provincial and local standards to regulate air, water and land quality affect substantially all of our manufacturing locations around the world. Laws providing for regulation of the manufacture, transportation, use and disposal of hazardous and toxic substances, and remediation of contaminated sites have imposed additional regulatory requirements on industry, particularly the chemicals industry. In addition, implementation of environmental laws has required and will continue to require new capital expenditures and will increase operating costs.
We are a party to various government and private environmental actions associated with former waste disposal sites and past manufacturing facilities. Charges to income for investigatory and remedial efforts were $16.2 million, $20.9 million and $25.3 million for the years ended December 31, 2021, 2020 and 2019, respectively. These charges may be material to operating results in future years. These charges do not include insurance recoveries for costs incurred and expensed in prior periods.
See our discussion of our environmental matters contained in Note 20 “Environmental” of the notes to consolidated financial statements contained in Item 8 and under the heading “Environmental Matters” in Item 7—“Management’s Discussion and Analysis of Financial Condition and Results of Operations.”
CORPORATE RESPONSIBILITY
At Olin, we are committed to corporate responsibility to ensure the long-term success of our business, our collective global society and the well-being of our environment. We focus our corporate responsibility efforts on the areas of: (1) environment, health, safety and security stewardship, (2) sustainability and governance and (3) product stewardship. We value collaboration and commit to working with other organizations to encourage collective action for improving corporate responsibility. Additional information related to our corporate responsibility initiatives, practices, activities, goals and related information, as well as future updates, can be found in the Corporate Responsibility section of our website at www.olin.com, including our 2020 Sustainability Report under the section Sustainability Success. Our progress against ESG and sustainability targets is included with our public quarterly earnings review materials and can be referenced under the Investor Relations section of our website. The contents of our website referenced in this section are not, and should not be considered to be, part of this report.
Environment, Health, Safety and Security Stewardship
Olin is strongly committed to excellence in protecting the environment, health, safety and security of our employees and those who live and work around our plants. Our operations worldwide comply with all local requirements and implement other standards as required to protect the environment, health, safety and security of our operations. We use our management system to drive continuous improvement and achieve excellence in environmental, health, safety, process safety and security performance. Our safety, health and environmental strategy and goals are designed to sustain our drive to zero incidents. Relentlessly and responsibly, we constantly emphasize the importance of monitoring the safety, security and environmental impact of our plants and processes. Through our day-to-day vigilance, Olin strives to continue to be recognized as one of the industry’s best performers.
Our corporate values — Act with Integrity, Drive Innovation and Improvement and Lift Olin People — are part of our culture. These values are also reflected in our Environment, Health, Safety and Security (EHS&S) policy and practice. Olin leadership visibly performs and guides the organization to conduct business in a manner that protects and increasingly benefits our employees, business partners and the communities in which we live. All employees have responsibilities within our management systems necessary to sustain our drive to zero incidents. Olin continues to achieve targeted safety reductions, resulting in a downward trend in total safety and environmental incidents.
Sustainability and Governance
We strongly believe in meeting the needs of the present without compromising the needs of future generations. We recognize the impact our company has on our natural resources and our responsibility to stewardship of people and the planet. This means striving for a company culture responsible to the ongoing economic, social and governance ideals of our employees and shareholders.
12
At Olin, we integrate sustainability in everything we do as a responsible corporate citizen. We value and respect our people, the communities in which we operate, our customers and the environment. We commit to making a contribution to the protection of the world and its future condition through the safety and efficiency of our business practices - from supply to manufacture to delivery and ultimately the end-use of our products. Our focus on continuous improvement throughout our history drives our business. Our Sustainability Report describes our core tenets in this area. Focused on four pillars, we are challenging ourselves to advance those opportunities where our impact on the planet, our operations and our people and communities is most meaningful:
Energy and Climate Mindfulness
Olin systematically and strategically manages our energy and carbon footprint, driving greater efficiency and increasing utilization of renewable resources.
Resource Efficiency
Olin effectively manages critical resources to minimize consumption and waste, increase reuse and recycle of materials, drive operations efficiency, and be good stewards of protection for the environment.
Product Sustainability and Commercial Outreach
Olin’s products and processes contribute to sustainable opportunities and innovation, enabling safe handling and distribution throughout the supply chain.
Employee and Community Care
Olin provides equal opportunities to employees and ensures the ongoing safety and livelihood of our people and communities.
We have developed a strategy and global initiative to manage and track our greenhouse gas (GHG) emissions, water usage, waste disposal and energy consumption and efficiency at our facilities. We are committed to improving our use of resources, acting on opportunities to reduce our environmental footprint and setting targets for improvement. We understand that maintaining safe, sustainable operations has an impact on us, our communities, the environment and our collective future. We continue to invest to develop safer, cleaner and more efficient products and processes. Our social and governance practices drive safety, equality and fairness for our operations and ensure transparency of our practices.
Product Responsibility
We take great pride in distributing and handling our products safely and enabling our customers to do the same. Our product stewardship and quality practices are aligned with our core values and other globally recognized standards. We apply these standards to our chemical business segments and relevant subsidiaries to ensure compliance with applicable global regulations, evaluation, continuous improvement and transparency of relevant production and product or formulation information. Additionally, Winchester ammunition is designed and manufactured in accordance with the voluntary industry standards published by the Sporting Arms and Ammunition Manufacturers’ Institute. We are deeply committed to ammunition education and advocate strongly for the belief that it is important to take the necessary steps to be trained and educated when handling and using a firearm for recreational purposes, both for experienced and novice participants. Our goal is to meet or exceed guidelines in every instance. Olin Leadership demonstrates its commitment to these standards through active participation and communication concerning product safety, within our organization and to external stakeholders.
13
Item 1A. RISK FACTORS
In addition to the other information in this Form 10-K, the following factors should be considered in evaluating Olin and our business. All of our forward-looking statements should be considered in light of these factors. Additional risks and uncertainties that we are unaware of or that we currently deem immaterial also may become important factors that affect us.
Business, Industry and Operational Risks
Sensitivity to Global Economic Conditions—Our operating results could be negatively affected during economic and industry downturns.
Our industries and the businesses of most of our customers have historically experienced periodic downturns. These economic, seasonal and industry downturns have been characterized by diminished product demand, excess manufacturing capacity and, in some cases, lower average selling prices. Therefore, any significant downturn in our customers’ businesses or in global economic conditions could result in a reduction in demand for our products and could adversely affect our results of operations or financial condition.
Although a majority of our sales are within North America, a large part of our financial performance is dependent upon a healthy economy beyond North America because we have a significant amount of sales abroad and our customers sell their products abroad. As a result, our business is and will continue to be affected by general economic conditions and other factors in Europe, Asia Pacific, particularly China, and Latin America, including fluctuations in interest rates, customer demand, labor and energy costs, currency changes and other factors beyond our control, such as public health epidemics. The demand for our products and our customers’ products is directly affected by such fluctuations. In addition, our customers could decide to move some or all of their production to locations that are more remote from our facilities, and this could reduce demand for our products. We cannot assure you that events having an adverse effect on the industries in which we operate will not occur or continue, such as a downturn in the European, Asian Pacific, particularly Chinese, Latin American, or other world economies, increases in interest rates, unfavorable currency fluctuations or prolonged effects of the 2019 Novel Coronavirus (COVID-19) pandemic. Economic conditions in other regions of the world, predominantly Asia and Europe, can adversely impact the balance between global supply and demand for our chemical products and increase the amount of products produced and made available for export to North America. Any significant increased product supply could put downward pressure on our product pricing, negatively impacting our profitability.
Pricing Pressure—Our profitability could be reduced by declines in average selling prices of our products, particularly chlorine and chlorine derivatives and caustic soda.
Our industries and each of our business segments experience fluctuating supply and demand, particularly in our Chlor Alkali Products and Vinyls segment, which can result in changes in selling prices. Periods of high demand, tight supply and increasing operating margins tend to result in increases in capacity and production until supply exceeds demand, generally followed by periods of oversupply and declining prices. We believe our strategic operating model will mitigate pricing pressure historically experienced during periods of supply exceeding demand. Nevertheless, we cannot assure you that increased pricing pressure will not impact our operating results in the future during these periods. Another factor influencing demand and pricing for chemical products is the price of natural gas. Higher natural gas prices increase our customers’ and competitors’ manufacturing costs, and depending on the ratio of crude oil to natural gas prices, could make our customers less competitive in world markets.
In the chemical industries in which we operate, price is one of the major supplier selection criterion. Pricing is subject to a variety of factors, some of which are outside of our control. Decreases in the average selling prices of our products could have a material adverse effect on our profitability. While we strive to maintain or increase our profitability by executing our strategic operating model and by reducing costs through improving production efficiency, emphasizing higher margin products and by controlling transportation, selling and administration expenses, we cannot assure you that these efforts will be sufficient to fully offset the effect of possible decreases in pricing on operating results.
Chlorine and caustic soda are produced simultaneously and in a fixed ratio of 1.0 ton of chlorine to 1.1 tons of caustic soda. An imbalance in customer demand may require Olin to reduce production of both chlorine and caustic soda or take other steps to correct the imbalance. Since we cannot store large quantities of chlorine, we may not be able to respond to an imbalance in customer demand for these products quickly or efficiently. To mitigate exposure and maximize value from the entire ECU, we continually take a number of actions, including, managing our production rates to the prevailing weaker side of the ECU, leveraging our portfolio of chlorine and chlorine derivatives outlets and entering into purchase for re-sale transactions. If our efforts are not successful and a substantial imbalance occurred, we might need to take actions that could have a material adverse impact on our business, results of operations and financial condition.
We cannot assure you that pricing or profitability in the future will be comparable to any particular historical period, including the most recent period shown in our operating results. We cannot assure you that the chemical industry will not
14
experience adverse trends in the future, or that our business, financial condition, and results of operations will not be adversely affected by them.
Our Winchester segment is also subject to pricing pressures. Selling prices of ammunition are affected by changes in raw material costs and availability, customer demand and industry production capacity. Declines in average selling prices of products of our Winchester segment could adversely affect our business, financial condition, and results of operations.
Change in Operating Model—Our operating results could be negatively impacted if we do not successfully execute our operating model in our chemicals businesses.
In late 2020, we adopted a strategic operating model in our chemicals businesses that prioritizes ECU margins over sales volume. This model represents a change to our Chlor Alkali Products and Vinyls and Epoxy businesses. To mitigate exposure and maximize value from the entire ECU, the model necessitates managing production rates to the weaker side of the ECU. The execution of the model may not be successful. For example, we may not be able to consistently achieve higher margins or the margin improvement achieved might be more than offset by the impact from lower sales volumes, either of which could have a material adverse effect on our operating results and cash flows. In addition, we take actions from time to time designed to complement our operating model, such as purchase for re-sale transactions (which we sometimes refer to as “parlaying activities”) that may not improve our operating results and could adversely impact our business if these activities are not successfully implemented.
Some of our assets were designed to operate at consistently high operating rates. If we operate at lower operating rates for extended periods or make frequent changes to operating rates, our assets may become less reliable or may require additional maintenance or capital investment, which could have a material adverse impact on our operating results and cash flows. Additionally, we may not be able to attract, develop, or retain the skills necessary to effectively execute the strategic operating model. Our model is dependent on implementing changes to the way we transact business with customers and other third parties. Customers or third parties may not be willing to transact with us on terms acceptable to us or at all. If we fail to effectively execute our strategic operating model, our operating results may fail to meet expectations and our business, financial condition, and results of operations could be adversely impacted.
Cost Control—Our profitability could be reduced if we experience increasing raw material, utility, transportation or logistics costs, or if we fail to achieve targeted cost reductions.
Our operating results and profitability are dependent upon our continued ability to control, and in some cases reduce, our costs. If we are unable to do so, or if costs outside of our control, particularly our costs of raw materials, utilities, transportation and similar costs, increase beyond anticipated levels, our profitability will decline. In addition, an increase in costs generally as a result of rising inflation, or in a particular sector such as the energy or transportation sector, could result in rising costs which we cannot fully mitigate through product price increases or cost reductions, which could also adversely affect our profitability.
For example, if our feedstock and energy costs increase, and we are unable to pass the increased costs on to customers, our profitability in our Chlor Alkali Products and Vinyls and Epoxy segments would be negatively affected. Similarly, costs of commodity metals and other materials used in our Winchester business, such as copper and lead, can vary. If we experience significant increases in these costs and are unable to raise our prices to offset the higher costs, the profitability in our Winchester business would be negatively affected.
Suppliers—We rely on a limited number of third-party suppliers for specified feedstocks and services.
We obtain a significant portion of our raw materials from a few key suppliers. If any of these suppliers fail to meet their obligations under present or any future supply agreements, we may be forced to pay higher prices or incur higher costs to obtain the necessary raw materials. Any interruption of supply or any price increase of raw materials could have a material adverse effect on our business, financial condition and results of operations. Certain of our facilities are dependent on feedstocks, services, and related infrastructure provided by third parties, which are provided pursuant to long-term contracts. Any failure of those third parties to perform their obligations under those agreements or disagreements regarding the performance under those agreements could adversely affect the operation of the affected facilities and our business, financial condition and results of operations, or result in diversion of management’s attention or our resources from other business matters. If we are required to obtain an alternate source for these feedstocks or services, we may not be able to obtain equally favorable pricing and terms. Additionally, we may be forced to pay additional transportation costs or to invest in capital projects for pipelines or alternate facilities to accommodate railcar or other delivery methods or to replace other services.
A vendor may choose, subject to existing contracts, to modify its relationship due to general economic concerns or concerns relating to the vendor or us, at any time. Any significant change in the terms that we have with our key suppliers could materially and adversely affect our business, financial condition and results of operations, as could significant additional requirements from suppliers that we provide them additional security in the form of prepayments or posting letters of credit.
15
Raw Materials—Availability of purchased feedstocks and energy, and the volatility of these costs, impact our operating costs and add variability to earnings.
Purchased feedstock, including propylene and benzene, and energy costs account for a substantial portion of our total production costs and operating expenses. We purchase certain raw materials as feedstocks.
Feedstock and energy costs generally follow price trends in crude oil and natural gas, which are sometimes volatile. Ultimately, the ability to pass on underlying cost increases in a timely manner or at all is partially dependent on market conditions. Conversely, when feedstock and energy costs decline, selling prices generally decline as well. As a result, volatility in these costs could impact our business, financial condition and results of operations.
If the availability of any of our principal feedstocks is limited or we are unable to obtain natural gas or energy from any of our energy sources, we may be unable to produce some of our products in the quantities demanded by our customers, which could have a material adverse effect on plant utilization and our sales of products requiring such raw materials. We have long-term supply contracts with various third parties for certain raw materials, including ethylene, electricity, propylene and benzene. As these contracts expire, we may be unable to renew these contracts or obtain new long-term supply agreements on terms comparable or as favorable to us, depending on market conditions, which may have a material adverse effect on our business, financial condition and results of operations. In addition, many of our long-term contracts contain provisions that allow our suppliers to limit the amount of raw materials shipped to us below the contracted amount in force majeure or similar circumstances. If we are required to obtain alternate sources for raw materials because our suppliers are unwilling or unable to perform under raw material supply agreements or if a supplier terminates its agreements with us, we may not be able to obtain these raw materials from alternative suppliers or obtain new long-term supply agreements on terms comparable or as favorable to us.
Third-Party Transportation—We rely heavily on third-party transportation, which subjects us to risks and costs that we cannot control, and which risks and costs may have a material adverse effect on our financial position or results of operations.
We rely heavily on railroad, truck, marine vessel, barge and other shipping companies to transport finished products to customers and to transport raw materials to the manufacturing facilities used by each of our businesses. These transport operations are subject to various hazards and risks, including extreme weather conditions, work stoppages and operating hazards, as well as domestic and international transportation and maritime regulations. In addition, the methods of transportation we utilize, including shipping chlorine and other chemicals by railroad and by barge, may be subject to additional, more stringent and more costly regulations in the future. If we are delayed or unable to ship finished products or unable to obtain raw materials as a result of any such new or modified regulations or public policy changes related to transportation safety, or these transportation companies’ failure to operate properly, or if there are significant changes in the cost of these services due to new additional regulations, or otherwise, we may not be able to arrange efficient alternatives and timely means to obtain raw materials or ship goods, which could result in a material adverse effect on our business, financial position or results of operations. If any third-party railroad that we utilize to transport chlorine and other chemicals ceases to transport certain hazardous materials, or if there are significant changes in the cost of shipping hazardous materials by rail or otherwise, we may not be able to arrange efficient alternatives and timely means to deliver our products or at all, which could result in a material adverse effect on our business, financial position or results of operations.
Production Hazards—Our facilities are subject to operating hazards, which may disrupt our business.
We are dependent upon the continued safe and reliable operation of our production facilities. Our production facilities are subject to hazards associated with the manufacture, handling, storage and transportation of chemical materials and products and ammunition, including leaks and ruptures, explosions, fires, inclement weather and natural disasters, unexpected utility disruptions or outages, unscheduled downtime, equipment failure, information technology systems interruptions or failures, terrorism, transportation interruptions, transportation incidents involving our chemical products, chemical spills and other discharges or releases of toxic or hazardous substances or gases and environmental hazards. Due to the integrated nature of our large chemical sites, an event at one plant could impact production across multiple plants at a facility. From time to time in the past, we have had incidents that have temporarily shut down or otherwise disrupted our manufacturing, causing production delays and resulting in liability for workplace injuries and fatalities. Some of our operations involve the manufacture and/or handling of a variety of explosive and flammable materials. Use of our products by our customers could also result in liability if an explosion, fire, spill or other accident were to occur. We cannot assure you that we will not experience these types of incidents in the future or that these incidents will not result in production delays or otherwise have a material adverse effect on our business, financial condition or results of operations. Major hurricanes, or other weather-related events, have caused significant disruption in our operations on the U.S. Gulf Coast, logistics across the region and the supply of certain raw materials, which have had an adverse impact on volume and cost for some of our products. Due to the substantial presence we have on the U.S. Gulf Coast, similar severe weather conditions or other natural phenomena in the future could negatively affect our results of operations, for which we may not be fully insured.
16
Information Security—A failure of our information technology systems, or an interruption in their operation due to internal or external factors including cyber-attacks, could have a material adverse effect on our business, financial condition or results of operations.
Our operations are dependent on our ability to protect our information systems, computer equipment and information databases from systems failures. We rely on both internal information technology systems and certain external services and service providers to manage the day-to-day operation of our business, operate elements of our manufacturing facilities, manage relationships with our employees, customers and suppliers, fulfill customer orders and maintain our financial and accounting records. Failure of any one or more than one of our information technology systems could be caused by internal or external events, such as incursions by intruders or hackers, computer viruses, cyber-attacks, failures in hardware or software, or power or telecommunication fluctuations or failures. The failure of our information technology systems to perform as anticipated for any reason or any significant breach of security could disrupt our business and result in numerous adverse consequences, including reduced effectiveness and efficiency of operations, increased costs or loss of important information, any of which could have a material adverse effect on our business, financial condition or results of operations. We have technology and information security processes, periodic external service and service provider reviews, insurance policies and disaster recovery plans in place to mitigate our risk to these vulnerabilities. However, these measures may not be adequate to ensure that our operations will not be disrupted or our financial impact minimized, should such an event occur.
Ability to Attract and Retain Qualified Employees—We must attract, retain and motivate key employees, and the failure to do so may adversely affect our business, financial condition or results of operations.
We feel our success depends on hiring, retaining and motivating key employees, including executive officers. Our future success depends in part on our ability to identify and develop talent throughout the organization who adopt and successfully execute our strategic operating model. The development and retention of key personnel and appropriate senior management succession planning will continue to be important to the successful execution of our strategies. We may have difficulty locating and hiring qualified personnel. In addition, we may have difficulty retaining such personnel once hired, and key people may leave and compete against us. The loss of key personnel or our failure to attract and retain other qualified and experienced personnel could disrupt or materially adversely affect our business, financial condition or results of operations. In addition, our operating results could be adversely affected by increased costs due to increased competition for employees or higher employee turnover, which may result in the loss of significant customer business or increased costs.
Acquisitions and Joint Ventures—We may not be able to complete future acquisitions or joint venture transactions or successfully integrate them into our business, which could adversely affect our business or results of operations.
As part of our growth strategy, we intend to pursue acquisitions and joint venture opportunities consistent with or complementary to our existing business strategies. Successful accomplishment of this objective may be limited by the availability and suitability of acquisition candidates, the ability to obtain regulatory approvals necessary to complete a planned transaction, and by our financial resources. Acquisitions and joint venture transactions involve numerous risks, including difficulty determining appropriate valuation, integrating operations, technologies, services and products of the acquired businesses, personnel turnover and the diversion of management’s attention from other business matters. In addition, we may be unable to achieve anticipated benefits from these transactions in the time frame that we anticipate, or at all, which could adversely impact our business, financial condition and results of operations.
Indebtedness—Our indebtedness could adversely affect our financial condition.
As of December 31, 2021, we had $2,779.3 million of indebtedness outstanding. Outstanding indebtedness does not include amounts that could be borrowed under our $800.0 million senior revolving credit facility, under which $799.6 million was available for borrowing as of December 31, 2021 because we had issued $0.4 million of letters of credit. As of December 31, 2021, our indebtedness represented 51.2% of our total capitalization and $201.1 million of our indebtedness was due within one year. Despite our level of indebtedness, we expect to continue to have the ability to borrow additional debt, but we cannot be certain that additional debt will be available on terms acceptable to us or at all.
Our indebtedness could have important consequences, including but not limited to:
•limiting our ability to fund working capital, capital expenditures, and other general corporate purposes;
•limiting our ability to accommodate growth by reducing funds otherwise available for other corporate purposes, which in turn could prevent us from fulfilling our obligations under our indebtedness;
•limiting our operational flexibility due to the covenants contained in our debt agreements;
•to the extent that our debt is subject to floating interest rates, increasing our vulnerability to fluctuations in market interest rates;
•limiting our ability to pay cash dividends;
•limiting our flexibility for, or reacting to, changes in our business or industry or economic conditions, thereby limiting our ability to compete with companies that are not as highly leveraged; and
17
•increasing our vulnerability to economic downturns.
Our ability to generate sufficient cash flow from operations to make scheduled payments on our debt will depend on a range of economic, competitive and business factors, many of which are outside our control. There can be no assurance that our business will generate sufficient cash flow from operations to make these payments. If we are unable to meet our expenses and debt obligations, we may need to refinance all or a portion of our indebtedness before maturity, sell assets or issue additional equity. We may not be able to refinance any of our indebtedness, sell assets or issue additional equity on commercially reasonable terms or at all, which could cause us to default on our obligations and impair our liquidity. Our inability to generate sufficient cash flow to satisfy our debt obligations, or to refinance our debt obligations on commercially reasonable terms, would have a material adverse effect on our business, financial condition and results of operations, as well as on our ability to satisfy our debt obligations.
International Sales and Operations—We are subject to risks associated with our international sales and operations that could have a material adverse effect on our business or results of operations.
Olin has an international presence, including the geographic regions of Europe, Asia Pacific, Latin America and Canada. In 2021, approximately 41% of our sales were generated outside of the United States. These international sales and operations expose us to risks, including:
•difficulties and costs associated with complying with complex and varied laws, treaties, and regulations;
•tariffs and trade barriers;
•outbreaks of serious disease, such as COVID-19, which could cause us and our suppliers and/or customers to temporarily suspend operations in affected areas, restrict the ability of Olin to distribute our products or cause economic downturns that could affect demand for our products;
•changes in laws and regulations, including the imposition of economic or trade sanctions affecting international commercial transactions;
•risk of non-compliance with anti-bribery laws and regulations, such as the U.S. Foreign Corrupt Practices Act;
•restrictions on, or difficulties and costs associated with, the repatriation of cash from foreign countries to the United States;
•unfavorable currency fluctuations;
•changes in local economic conditions, including inflation levels exceeding that of the U.S.;
•unexpected changes in political or regulatory environments;
•labor compliance and costs associated with a global workforce;
•data privacy regulations;
•difficulties in maintaining overseas subsidiaries and international operations; and
•challenges in protecting intellectual property rights.
Any one or more of the above factors could have a material adverse effect on our business, financial condition or results of operations.
COVID-19 Pandemic—The COVID-19 pandemic and the global response to the pandemic, including without limitation complying with governmental mandates, could have a material adverse impact on our business, financial condition, or results of operations.
The COVID-19 global pandemic, and the various governmental, business, and consumer responses to this pandemic, have caused significant disruptions in the U.S. and global economies, which negatively impacted the demand for several of the products produced by our Chlor Alkali Products and Vinyls and Epoxy businesses during 2020 resulting in lower volumes and pricing. As a result, the COVID-19 pandemic has significantly impacted our results of operations and could continue to have negative impacts on our business. These impacts could include plant closures or operating reductions, volatility and decrease in demand for our products, and supply chain interruptions. These impacts could become more widespread or prolonged as the pandemic continues. The extent to which the COVID-19 pandemic impacts our results will depend on future developments that are outside of our control and highly uncertain, including the severity and duration of the pandemic, emerging variants, vaccine and booster effectiveness, the domestic and international actions that are taken in response, including mandates implemented at the local, state and federal levels, and the extent and severity of any resulting economic or industry downturn.
Credit Facility—Weak industry conditions could affect our ability to comply with the financial maintenance covenants in our senior credit facility.
Our senior credit facility includes certain financial maintenance covenants requiring us to not exceed a maximum leverage ratio and to maintain a minimum coverage ratio.
18
Depending on the magnitude and duration of economic or industry downturns affecting our businesses, including deterioration in prices and volumes, there can be no assurance that we will continue to be in compliance with these ratios. If we fail to comply with either of these covenants in a future period and are not able to obtain waivers from the lenders, we would need to refinance our current senior credit facility. However, there can be no assurance that such refinancing would be available to us on terms that would be acceptable to us or at all.
Credit and Capital Market Conditions—Adverse conditions in the credit and capital markets may limit or prevent our ability to borrow or raise capital.
While we believe we have facilities in place that should allow us to borrow funds as needed to meet our ordinary course business activities, adverse conditions in the credit and financial markets could prevent us from obtaining financing, if the need arises, or result in our creditors terminating their funding commitments. Our ability to invest in our businesses and refinance or repay maturing debt obligations could require access to the credit and capital markets and sufficient bank credit lines to support cash requirements. Our ability to access credit and capital markets can also depend on our credit rating as determined by reputable credit rating agencies. A significant downgrade in our credit rating could affect our ability to refinance or repay maturing debt obligations, result in increased borrowing costs, decrease the availability of capital from financial institutions or require our subsidiaries to post letters of credit, cash or other assets as collateral with certain counterparties. If we are unable to access the credit and capital markets on commercially reasonable terms, we could experience a material adverse effect on our business, financial position or results of operations.
Pension Plans—The impact of declines in global equity and fixed income markets on asset values and any declines in interest rates and/or improvements in mortality assumptions used to value the liabilities in our pension plans may result in higher pension costs and the need to fund the pension plans in future years in material amounts.
We sponsor domestic and foreign defined benefit pension plans for eligible employees and retirees. Substantially all domestic defined benefit pension plan participants are no longer accruing benefits. However, a portion of our bargaining hourly employees continue to participate in our domestic qualified defined benefit pension plans under a flat-benefit formula. Our funding policy for the qualified defined benefit pension plans is consistent with the requirements of federal laws and regulations. Our foreign subsidiaries maintain pension and other benefit plans, which are consistent with local statutory practices. The determinations of pension expense and pension funding are based on a variety of rules and regulations along with economic factors which are outside of our control. These factors include returns on invested assets, the level of certain market interest rates, the discount rates used to determine pension obligations and mortality assumptions used to value liabilities in our pension plans. Changes in these rules and regulations or unfavorable changes to the factors which are used to value the assets and liabilities in our pension plans could impact the calculation of funded status of our pension plans. They may also result in higher pension costs and the need for additional pension plan funding. See “Pension and Postretirement Benefits” contained in Item 7—“Management’s Discussion and Analysis of Financial Condition and Results of Operations.”
19
Asset Impairment—If our goodwill, other intangible assets or property, plant and equipment become impaired in the future, we may be required to record non-cash charges to earnings, which could be significant.
The process of impairment testing for our goodwill involves a number of judgments and estimates made by management including future cash flows, discount rates, profitability assumptions and terminal growth rates with regards to our reporting units. Our internally generated long-range plan includes assumptions regarding pricing and operating forecasts for the chlor alkali industry. If the judgments and estimates used in our analysis are not realized or are affected by external factors, then actual results may not be consistent with these judgments and estimates, and we may be required to record a goodwill impairment charge in the future, which could be significant and have an adverse effect on our financial position and results of operations. During the third quarter of 2020, the carrying values of our Chlor Alkali Products and Vinyls and Epoxy reporting units exceeded the fair values which resulted in pre-tax goodwill impairment charges of $557.6 million and $142.2 million, respectively. The goodwill impairment charge was calculated as the amount that the carrying value of the reporting unit, including any goodwill, exceeded its fair value and therefore the carrying value of our reporting units equal their fair value upon completion of the goodwill impairment test.
We review long-lived assets, including property, plant and equipment and identifiable amortizing intangible assets, for impairment whenever changes in circumstances or events may indicate that the carrying amounts are not recoverable. If the fair value is less than the carrying amount of the asset, an impairment is recognized for the difference. Factors which may cause an impairment of long-lived assets include significant changes in the manner of use of these assets, negative industry or market trends, a significant underperformance relative to historical or projected future operating results, extended period of idleness or a likely sale or disposal of the asset before the end of its estimated useful life. If our property, plant and equipment and identifiable amortizing intangible assets are determined to be impaired in the future, we may be required to record non-cash charges to earnings during the period in which the impairment is determined, which could be significant and have an adverse effect on our financial position and results of operations.
Legal, Environmental and Regulatory Risks
Effects of Regulation—Changes in or failure to comply with applicable laws or government regulations or policies could have a material adverse effect on our financial position or results of operations.
Legislation or regulations that may be adopted or modified by U.S. or foreign governments, including legislation or regulations intended to address climate change, antitrust and competition laws, tax regulation, import and export duties and quotas and anti-dumping measures and related tariffs could significantly affect the sales, costs and profitability of our business.
The chemical and ammunition industries are subject to legislative and regulatory actions, which could have a material adverse effect on our business, financial position or results of operations. Many of our products and operations are subject to chemical control laws of the countries in which they are located. These laws include regulation of chemical substances and inventories under the U.S. Toxic Substances Control Act of 1976 (TSCA) in the U.S. and the Registration, Evaluation and Authorization of Chemicals (REACH) regulation in Europe. TSCA was amended in 2016, and the EPA is currently evaluating several of our products for additional regulation under the amended law. Certain of our products, or inputs into our manufacturing process, are subject to regulation under current TSCA regulations, and other chemicals or ingredients may be regulated under the law in the future. Under REACH, additional testing requirements, documentation, risk assessments and registrations are occurring and will continue to occur and may adversely affect our costs of products produced in or imported into the European Union.
Compliance with current or future TSCA, REACH, or other regulations may limit or hinder our ability to manufacture our products and/or cause us to incur expenditures that are material to our business, financial condition or results of operations. Additionally, changes to government regulations and laws, including TSCA and REACH, or changes in their interpretation may reduce the demand for our products, impact our ability to use or manufacture certain products, or limit our ability to implement our strategies, any of which could have a material adverse effect on our business, financial condition and results of operations. A material change in tax laws, treaties or regulations in the jurisdictions in which we operate or a change in their interpretation or application could have a material adverse effect on our business, financial condition and results of operations.
20
Security and Chemicals Transportation—New regulations on the transportation of hazardous chemicals and/or the security of chemical manufacturing facilities and public policy changes related to transportation safety could result in significantly higher operating costs.
The transportation of our products and feedstocks, including transportation by pipeline, and the security of our chemical manufacturing facilities are subject to extensive regulation. Government authorities at the local, state and federal levels could implement new or stricter regulations, or change their interpretations of existing regulations, that would impact the security of chemical plant locations and the transportation of hazardous chemicals. Our Chlor Alkali Products and Vinyls and Epoxy segments could be adversely impacted by the cost of complying with any new regulations. Our business also could be adversely affected if an incident were to occur at one of our facilities or while transporting products. The extent of the impact would depend on the requirements of future regulations and the nature of an incident, which are unknown at this time.
Legal and Regulatory Claims and Proceedings—We are subject to legal and regulatory claims and proceedings, which could cause us to incur significant expenses.
We are subject to legal and regulatory claims and proceedings relating to our present and former operations and could become subject to additional claims in the future, some of which could be material. These proceedings may be brought by the government or private parties and may arise out of a number of matters, including, antitrust claims, contract disputes, product liability claims, including ammunition and firearms, and proceedings alleging injurious exposure of plaintiffs to various chemicals and other substances (including proceedings based on alleged exposures to asbestos). Frequently, the proceedings alleging injurious exposure involve claims made by numerous plaintiffs against many defendants. Defense of these claims can be costly and time-consuming even if ultimately successful. Because of the inherent uncertainties of legal proceedings, we are unable to predict their outcome and therefore cannot determine whether the financial impact, if any, will be material to our financial position, cash flows or results of operations. We have included additional information with respect to pending legal and regulatory proceedings in Part II, Item 8, under the heading of “Legal Matters” within Note 22, “Commitments and Contingencies,” of our Notes to Consolidated Financial Statements.
Environmental Costs—We have ongoing environmental costs, which could have a material adverse effect on our financial position or results of operations.
Our operations and assets are subject to extensive environmental, health and safety regulations, including laws and regulations related to air emissions, water discharges, waste disposal and remediation of contaminated sites. The nature of our operations and products, including the raw materials we handle, exposes us to the risk of liabilities, obligations or claims under these laws and regulations due to the production, storage, use, transportation and sale of materials that can adversely impact the environment or cause personal injury, including, in the case of chemicals, unintentional releases into the environment. Environmental laws may have a significant effect on the costs of use, transportation, handling and storage of raw materials and finished products, as well as the costs of storage, handling, treatment, transportation and disposal of wastes. In addition, we are party to various government and private environmental actions associated with past manufacturing facilities and former waste disposal sites. We have incurred, and expect to incur, significant costs and capital expenditures in complying with environmental laws and regulations.
The ultimate costs and timing of environmental liabilities are difficult to predict. Liabilities under environmental laws relating to contaminated sites can be imposed retroactively and on a joint and several basis. One liable party could be held responsible for all costs at a site, regardless of fault, percentage of contribution to the site or the legality of the original disposal. We could incur significant costs, including clean-up costs, natural resource damages, civil or criminal fines and sanctions and third-party lawsuits claiming, for example, personal injury and/or property damage, as a result of past or future violations of, or liabilities under, environmental or other laws.
In addition, future events, such as changes to environmental laws, changes in the interpretation or implementation of current environmental laws or new information about the extent of remediation required, could require us to make additional expenditures, modify or curtail our operations and/or install additional pollution control equipment. It is possible that regulatory agencies may identify new chemicals of concern or enact new or more stringent clean-up standards for existing chemicals of concern. This could lead to expenditures for environmental remediation in the future that are additional to existing estimates.
Accordingly, it is possible that some of the matters in which we are involved or may become involved may be resolved unfavorably to us, which could materially and adversely affect our business, financial position, cash flows or results of operations. See “Environmental Matters” contained in Item 7—“Management’s Discussion and Analysis of Financial Condition and Results of Operations.”
21
Governmental Contract Compliance and Deliverables—Various risks associated with our Lake City contract and performance under other government contracts could adversely affect our business, financial condition and results of operations.
Our Winchester business currently operates and manages the Lake City Army Ammunition Plant in Independence, MO under a multi-year contract with the United States Army. The contract has an initial term of seven years, starting on October 1, 2020, and may be extended for up to three additional years. Additionally, our Winchester business is engaged to perform various deliverables under other government contract arrangements. The Lake City facility also allows, under certain conditions, for Winchester to utilize the facility to produce commercial ammunition. The operation of the Lake City facility and our other U.S. government contracts require compliance with numerous contract provisions and government regulations. U.S. government contracts often reserve the right to audit our contract costs and conduct inquiries and investigations of our business practices and compliance with government contract requirements. Our failure to comply with any one of these contract provisions and regulations could have a material adverse impact on our business, financial position, and results of operations.
A large portion of our government contracts contain fixed-price deliverables while a smaller portion are performed under cost-plus arrangements. While certain of these contracts contain price escalation and other price adjustment provisions, if we are unable to control costs related to these contracts or if our assumptions regarding the fixed pricing on one or multiple of these contracts is incorrect, we may experience lower profitability, adversely affecting our business, financial condition and results of operations.
Environmental, Social and Governance (ESG)—ESG issues and related regulation, including those related to climate change and sustainability, may have an adverse effect on our business, financial condition and results of operations and damage our reputation.
Companies across all industries are facing increased scrutiny related to their ESG policies. Increased focus and activism related to ESG may hinder our access to credit and capital markets, as investors may reconsider their investment as a result of their assessment of our ESG practices. In particular, customers, consumers, investors and other stakeholders are increasingly focusing on environmental issues, including climate change, energy and water use, greenhouse gas (GHG) emissions and other sustainability concerns. Change in public sentiment may result in changing demands for our customers’ products and the products which we produce in light of their perceived environmental impacts or other related issues. These demand changes could cause changes in the market dynamics of our existing products, impacting pricing, or we may incur additional costs to make changes to our operations to comply with such demand changes.
Concern over climate change, greenhouse gas (GHG) emissions in particular, may result in new or increased legal and regulatory requirements to reduce or mitigate impacts to the environment. Increased regulatory requirements or demands for enhanced mitigation of environmental impacts may result in increased compliance costs, higher energy and raw materials input costs or compliance with more stringent emissions standards, which may cause disruptions in the manufacture of our products or an increase in operating costs. Any failure to achieve our ESG goals, or a perception of our failure to act responsibly with respect to the environment or to effectively respond to new, or updated, legal or regulatory requirements concerning environmental or other ESG matters, or increased operating or manufacturing costs due to increased regulation or efforts to mitigate environmental impacts could adversely affect our business, financial condition, results of operations and reputation.
If we do not adapt to or comply with new regulations or fail to meet the ESG goals or evolving investor, industry or stakeholder expectations and standards, or if we are perceived to have not responded appropriately to the growing concern for ESG issues, customers may choose to stop purchasing our products or purchase products from a competitor, and our reputation, financial condition and results of operations may be adversely affected.
Labor Matters—We cannot assure that we can conclude future labor contracts or any other labor agreements without work stoppages.
Various labor unions represent a significant number of our hourly paid employees for collective bargaining purposes. No significant labor contracts are expected to be negotiated during 2022 or early 2023. In addition, a large number of our employees are located in countries in which employment laws provide greater bargaining or other rights to employees than the laws of the U.S. Such employment rights require us to work collaboratively with the legal representatives of those employees to effect any changes to labor arrangements. For example, most of our employees in Europe are represented by works councils that must approve any changes in conditions of employment, including salaries and benefits and staff changes, and may impede efforts to restructure our workforce. While we believe our relations with our employees and their various representatives are generally satisfactory, we cannot assure that we can conclude any labor agreements without work stoppages and cannot assure that any work stoppages will not have a material adverse effect on our business, financial condition or results of operations.
22
Item 1B. UNRESOLVED STAFF COMMENTS
Not applicable.
Item 2. PROPERTIES
Information concerning our principal locations from which our products and services are manufactured, distributed or marketed are included in the tables set forth under the caption “Products and Services” contained in Item 1—“Business.” Generally, these facilities are well maintained, in good operating condition, and suitable and adequate for their use. Our two largest facilities are co-located with a site partner. The land on which these facilities are located is leased with a 99-year initial term that commenced in 2015. Additionally, we lease warehouses, terminals and distribution offices and space for executive and branch sales offices and service departments. We believe our current facilities are adequate to meet the requirements of our present operations.
On October 1, 2020, Winchester assumed full management and operational control of the Lake City Army Ammunition Plant in Independence, MO, which is a government-owned, contractor operated facility. The United States Army selected Winchester to operate and manage Lake City in September 2019. The contract is for the production of small caliber military ammunition, including 5.56mm, 7.62mm, and .50 caliber rounds, as well as certain cartridges and casings. The contract also allows for the production of certain ammunition for commercial customers. The contract has an initial term of seven years and may be extended by the United States Army for up to three additional years.
Item 3. LEGAL PROCEEDINGS
Discussion of legal matters is incorporated by reference from Part II, Item 8, under the heading of “Legal Matters” within Note 22, “Commitments and Contingencies,” and should be considered an integral part of Part I, Item 3, “Legal Proceedings.”
Item 4. MINE SAFETY DISCLOSURES
Not applicable.
23
PART II
Item 5. MARKET FOR REGISTRANT’S COMMON EQUITY, RELATED STOCKHOLDER MATTERS AND ISSUER PURCHASES OF EQUITY SECURITIES
As of January 31, 2022, we had 3,175 record holders of our common stock.
Our common stock is traded on the NYSE under the “OLN” ticker symbol.
A dividend of $0.20 per common share was paid during each of the four quarters in 2021 and 2020.
Issuer Purchases of Equity Securities
| Period | Total Number of Shares (or Units) Purchased(1) | Average Price Paid per Share (or Unit) | Total Number of Shares (or Units) Purchased as Part of Publicly Announced Plans or Programs | Maximum Dollar Value of Shares (or Units) that May Yet Be Purchased Under the Plans or Programs | |||||||||||||||||||||||||
| October 1-31, 2021 | 174,195 | $ | 49.24 | 174,195 | |||||||||||||||||||||||||
| November 1-30, 2021 | 1,540,815 | 60.26 | 1,540,815 | ||||||||||||||||||||||||||
| December 1-31, 2021 | 1,485,507 | 55.35 | 1,485,507 | ||||||||||||||||||||||||||
| Total | $ | 1,052,210,241 | (1) | ||||||||||||||||||||||||||
(1)On April 26, 2018, our board of directors authorized a share repurchase program for the purchase of shares of common stock at an aggregate price of up to $500.0 million (the 2018 Repurchase Authorization). This program will terminate upon the purchase of $500.0 million of our common stock. On November 1, 2021, our board of directors authorized an additional share repurchase program for the purchase of shares of common stock at an aggregate price of up to $1.0 billion (the 2021 Repurchase Authorization). This program will terminate upon the purchase of $1.0 billion of our common stock. Through December 31, 2021, 14,743,977 shares had been repurchased at a total value of $447,789,759 and $52,210,241 of common stock remained available for purchase under the 2018 Repurchase Authorization. As of December 31, 2021, there have been no repurchases under the 2021 Repurchase Authorization program and $1.0 billion of common stock remained authorized to be repurchased under this plan.
24
Performance Graph
This graph compares the total shareholder return on our common stock with the cumulative total return of the Standard & Poor’s (S&P) 500 Index, S&P 500 Chemicals Index and S&P Composite 1500 Commodity Chemicals Index (S&P 1500 Commodity Chemicals Index).
| COMPARISON OF FIVE YEAR CUMULATIVE TOTAL RETURN | ||||||||||||||
| Among Olin Corporation, the S&P 500 Index, | ||||||||||||||
| S&P 500 Chemicals Index and the S&P 1500 Commodity Chemicals Index | ||||||||||||||
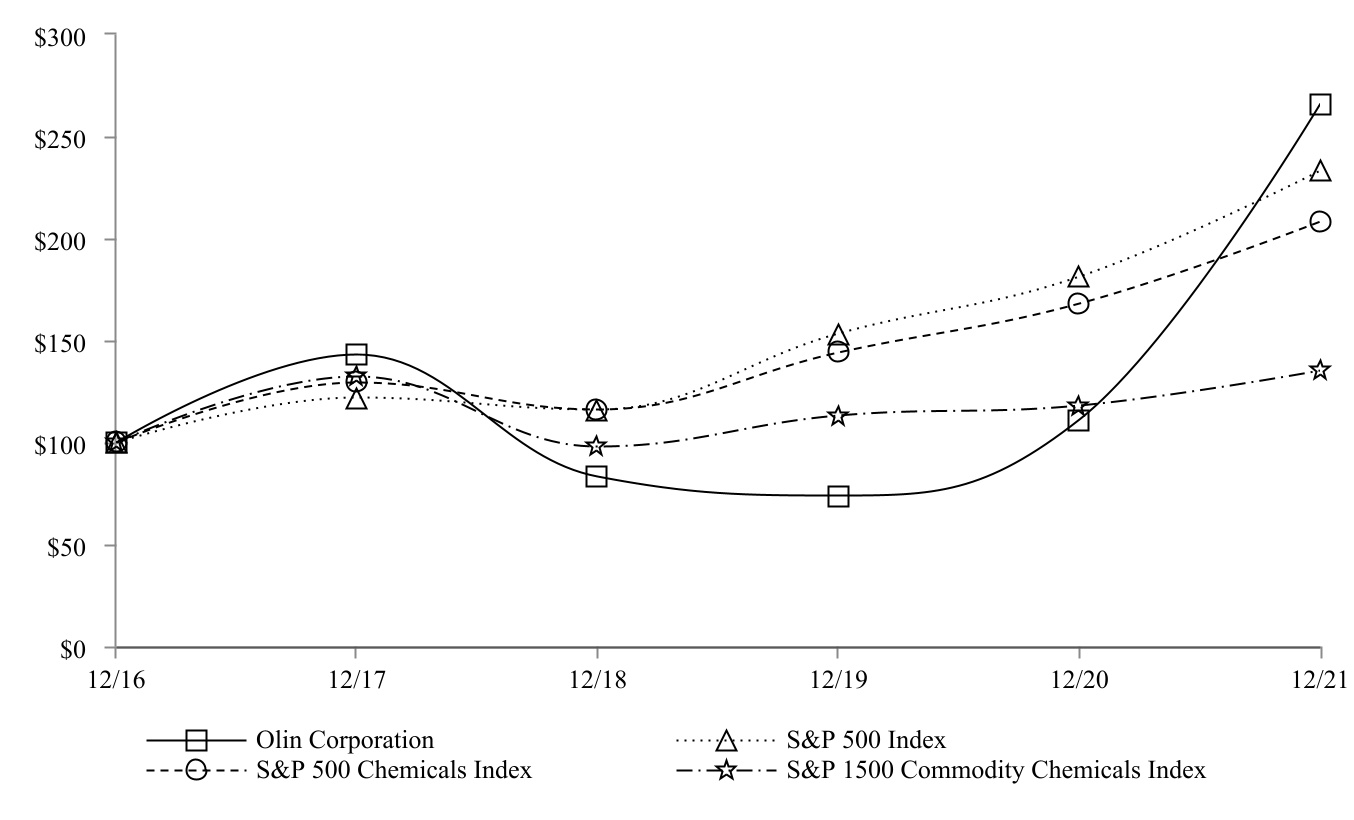
| 12/16 | 12/17 | 12/18 | 12/19 | 12/20 | 12/21 | |||||||||||||||
| Olin Corporation | 100 | 143 | 83 | 74 | 111 | 266 | ||||||||||||||
| S&P 500 Index | 100 | 122 | 116 | 153 | 181 | 233 | ||||||||||||||
| S&P 500 Chemicals Index | 100 | 129 | 116 | 144 | 168 | 208 | ||||||||||||||
| S&P 1500 Commodity Chemicals Index | 100 | 132 | 98 | 113 | 118 | 135 | ||||||||||||||
| Copyright© 2021 Standard & Poor’s, a division of S&P Global. All rights reserved. | ||||||||||||||||||||
Data is for the five-year period from December 31, 2016 through December 31, 2021. The cumulative return includes reinvestment of dividends. The performance graph assumes an investment of $100 on December 31, 2016.
25
FIVE-YEAR SUMMARY OF SELECTED FINANCIAL DATA
| 2021 | 2020 | 2019 | 2018 | 2017 | ||||||||||||||||||||||||||||
| Operations | ($ and shares in millions, except per share data) | |||||||||||||||||||||||||||||||
| Sales | $ | 8,911 | $ | 5,758 | $ | 6,110 | $ | 6,946 | $ | 6,268 | ||||||||||||||||||||||
| Cost of goods sold | 6,616 | 5,375 | 5,439 | 5,822 | 5,555 | |||||||||||||||||||||||||||
| Selling and administration | 417 | 422 | 417 | 431 | 369 | |||||||||||||||||||||||||||
| Restructuring charges | 28 | 9 | 76 | 22 | 38 | |||||||||||||||||||||||||||
| Acquisition-related costs | — | — | — | 1 | 13 | |||||||||||||||||||||||||||
| Goodwill impairment | — | 700 | — | — | — | |||||||||||||||||||||||||||
| Other operating income | 1 | 1 | — | 6 | 3 | |||||||||||||||||||||||||||
| Earnings (losses) of non-consolidated affiliates | — | — | — | (20) | 2 | |||||||||||||||||||||||||||
| Interest expense | 348 | 293 | 243 | 243 | 217 | |||||||||||||||||||||||||||
| Interest income and other income | — | 1 | 12 | 2 | 2 | |||||||||||||||||||||||||||
| Non-operating pension income | 36 | 19 | 16 | 22 | 34 | |||||||||||||||||||||||||||
| Income (loss) before taxes | 1,539 | (1,020) | (37) | 437 | 117 | |||||||||||||||||||||||||||
| Income tax provision (benefit) | 242 | (50) | (26) | 109 | (432) | |||||||||||||||||||||||||||
| Net income (loss) | $ | 1,297 | $ | (970) | $ | (11) | $ | 328 | $ | 549 | ||||||||||||||||||||||
| Financial position | ||||||||||||||||||||||||||||||||
| Cash and cash equivalents | $ | 181 | $ | 190 | $ | 221 | $ | 179 | $ | 218 | ||||||||||||||||||||||
| Working capital, excluding cash and cash equivalents | 386 | 329 | 411 | 410 | 527 | |||||||||||||||||||||||||||
| Property, plant and equipment, net | 2,914 | 3,171 | 3,324 | 3,482 | 3,576 | |||||||||||||||||||||||||||
| Total assets | 8,518 | 8,271 | 9,188 | 8,997 | 9,218 | |||||||||||||||||||||||||||
| Capitalization: | ||||||||||||||||||||||||||||||||
| Short-term debt | 201 | 26 | 2 | 126 | 1 | |||||||||||||||||||||||||||
| Long-term debt | 2,578 | 3,838 | 3,339 | 3,104 | 3,611 | |||||||||||||||||||||||||||
| Shareholders’ equity | 2,652 | 1,451 | 2,418 | 2,832 | 2,754 | |||||||||||||||||||||||||||
| Total capitalization | $ | 5,431 | $ | 5,315 | $ | 5,759 | $ | 6,062 | $ | 6,366 | ||||||||||||||||||||||
| Total debt to total capitalization | 51.2 | % | 72.7 | % | 58.0 | % | 53.3 | % | 56.7 | % | ||||||||||||||||||||||
| Per share data | ||||||||||||||||||||||||||||||||
| Net income (loss): | ||||||||||||||||||||||||||||||||
| Basic | $ | 8.15 | $ | (6.14) | $ | (0.07) | $ | 1.97 | $ | 3.31 | ||||||||||||||||||||||
| Diluted | $ | 7.96 | $ | (6.14) | $ | (0.07) | $ | 1.95 | $ | 3.26 | ||||||||||||||||||||||
| Cash dividends paid per common share | $ | 0.80 | $ | 0.80 | $ | 0.80 | $ | 0.80 | $ | 0.80 | ||||||||||||||||||||||
| Other | ||||||||||||||||||||||||||||||||
| Capital expenditures | $ | 201 | $ | 299 | $ | 386 | $ | 385 | $ | 294 | ||||||||||||||||||||||
| Depreciation and amortization | 583 | 568 | 597 | 601 | 559 | |||||||||||||||||||||||||||
| Common stock dividends paid | 128 | 126 | 129 | 134 | 133 | |||||||||||||||||||||||||||
| Repurchases of common stock | 252 | — | 146 | 50 | — | |||||||||||||||||||||||||||
| Current ratio | 1.3 | 1.4 | 1.6 | 1.5 | 1.8 | |||||||||||||||||||||||||||
| Effective tax rate | 15.7 | % | 4.9 | % | 69.4 | % | 25.0 | % | (368.9) | % | ||||||||||||||||||||||
| Average common shares outstanding - diluted | 163.0 | 157.9 | 162.3 | 168.4 | 168.5 | |||||||||||||||||||||||||||
Employees(1) | 7,750 | 8,000 | 6,500 | 6,500 | 6,400 | |||||||||||||||||||||||||||
(1) Beginning October 1, 2020, total employees include employees at Lake City which is a government-owned, contractor-operated facility.
Item 6. [RESERVED]
26
Item 7. MANAGEMENT’S DISCUSSION AND ANALYSIS OF FINANCIAL CONDITION AND RESULTS OF OPERATIONS
BUSINESS BACKGROUND
Olin Corporation (Olin) is a Virginia corporation, incorporated in 1892, having its principal executive offices in Clayton, MO. We are a leading vertically-integrated global manufacturer and distributor of chemical products and a leading U.S. manufacturer of ammunition. Our operations are concentrated in three business segments: Chlor Alkali Products and Vinyls, Epoxy and Winchester. All of our business segments are capital intensive manufacturing businesses. The Chlor Alkali Products and Vinyls segment manufactures and sells chlorine and caustic soda, ethylene dichloride and vinyl chloride monomer, methyl chloride, methylene chloride, chloroform, carbon tetrachloride, perchloroethylene, hydrochloric acid, hydrogen, bleach products and potassium hydroxide. The Epoxy segment produces and sells a full range of epoxy materials and precursors, including aromatics (acetone, bisphenol, cumene and phenol), allyl chloride, epichlorohydrin, liquid epoxy resins, solid epoxy resins and downstream products such as converted epoxy resins and additives. The Winchester segment produces and sells sporting ammunition, reloading components, small caliber military ammunition and components, and industrial cartridges.
RECENT DEVELOPMENTS AND HIGHLIGHTS
Winter Storm Uri
Olin’s Freeport, TX facility was affected by Winter Storm Uri and was forced to halt production due to the lack of electrical power, natural gas, and other raw materials. All of Olin’s Freeport operations were impacted. In addition, production at Olin’s Plaquemine, LA; St. Gabriel, LA; Oxford, MS; and McIntosh, AL facilities were also negatively impacted. As a result, by February 18, 2021, Olin declared Force Majeure on all chemical product shipments from North America. Our facilities had returned to operation by March 31, 2021.
The 2021 results included a net pretax favorable impact of $99.9 million associated with Winter Storm Uri due to Olin’s customary financial hedges and contracts maintained to provide protection from rapid and dramatic changes in energy costs, partially offset by unabsorbed fixed manufacturing costs and storm-related maintenance costs. During 2021, Chlor Alkali Products and Vinyls segment results included a favorable impact of $121.4 million and Epoxy segment results included an unfavorable impact of $21.5 million associated with Winter Storm Uri.
2021 Overview
Net income was $1,296.7 million for the year ended 2021 compared to net loss of $969.9 million for 2020. The increase in results from the prior year was due to improved operating results across all our business segments. The prior year results were also impacted by a $699.8 million pretax goodwill impairment charge.
Chlor Alkali Products and Vinyls generated segment income of $997.8 million for 2021 compared to $3.5 million for 2020. Chlor Alkali Products and Vinyls segment results were higher than in the prior year due to higher pricing across all products, partially offset by higher raw material and operating costs.
Epoxy reported segment income of $616.5 million for 2021 compared to $40.8 million for 2020. Epoxy segment results were higher than in the prior year primarily due to higher product prices, partially offset by higher raw materials costs, primarily benzene and propylene.
Winchester reported segment income of $412.1 million for 2021 compared to $92.3 million for 2020. On October 1, 2020, Winchester assumed full management and operational control of Lake City. Winchester segment results were higher than in the prior year primarily due to increased commercial ammunition pricing and higher volumes, which includes ammunition produced at Lake City. Winchester segment results were also negatively impacted by higher commodity costs compared to the prior year.
During 2021, we repaid approximately $1.1 billion of long-term debt. In connection with these financing transactions, we recognized a loss on extinguishment of debt of $152.2 million, which includes the payment of early redemption premiums of $137.7 million.
During 2021, we repurchased and retired 4.7 million shares of common stock at a cost of $251.9 million. As of December 31, 2021, we have $52.2 million of remaining authorized common stock to be purchased under our 2018 Repurchase
27
Authorization program and $1.0 billion of remaining authorized common stock to be purchased under our 2021 Repurchase Authorization program.
COVID-19
The 2019 Novel Coronavirus (COVID-19) global pandemic, and the various governmental, business and consumer responses to this pandemic, significantly impacted our results during 2020. We have taken measures to protect the health and safety of our employees, work with our customers and suppliers to minimize potential disruptions and support our communities during this global pandemic. Our operations are among businesses that were considered “essential” by government and public health authorities. We are following all federal, state and local health department guidelines and the costs associated with these safety procedures were not material. We continue to safely maintain plant operations and focus on business continuity. All Olin manufacturing facilities worldwide continue to operate, with the exception of those undergoing planned maintenance turnarounds.
The spread of the pandemic and the associated response has caused significant disruptions and increased volatility in the U.S. and global economies, resulting in the disruption of the supply and demand fundamentals of our Chemicals businesses. During 2020, the various governmental, business and consumer responses to the pandemic negatively impacted the demand for several of the products produced by our Chlor Alkali Products and Vinyls and Epoxy businesses resulting in lower volumes and pricing. We initiated several actions during 2020 that partially mitigated the impact of economic decline on our financial performance, but also enhanced our position, financially and structurally, to take advantage of the eventual global economic recovery. These actions were primarily focused around liquidity and specific actions to reduce our costs in 2020. We continue to monitor the changing business environment, volatility and heightened degree of uncertainty resulting from the response to COVID-19, including compliance with certain federal, state and local governmental mandates. At the current time, we are unable to fully determine its future impact on our business. We continue to work with our customers, employees, suppliers and communities to address the impacts of COVID-19 and we continue to assess possible implications to our business, supply chain and customers, and to take actions in an effort to mitigate adverse consequences.
28
CONSOLIDATED RESULTS OF OPERATIONS
| Years ended December 31, | |||||||||||||||||
| 2021 | 2020 | 2019 | |||||||||||||||
| ($ in millions, except per share data) | |||||||||||||||||
| Sales | $ | 8,910.6 | $ | 5,758.0 | $ | 6,110.0 | |||||||||||
| Cost of goods sold | 6,616.4 | 5,374.6 | 5,439.2 | ||||||||||||||
| Gross margin | 2,294.2 | 383.4 | 670.8 | ||||||||||||||
| Selling and administration | 416.9 | 422.0 | 416.9 | ||||||||||||||
| Restructuring charges | 27.9 | 9.0 | 76.5 | ||||||||||||||
| Goodwill impairment | — | 699.8 | — | ||||||||||||||
| Other operating income | 1.4 | 0.7 | 0.4 | ||||||||||||||
| Operating income (loss) | 1,850.8 | (746.7) | 177.8 | ||||||||||||||
| Interest expense | 348.0 | 292.7 | 243.2 | ||||||||||||||
| Interest income | 0.2 | 0.5 | 1.0 | ||||||||||||||
| Non-operating pension income | 35.7 | 18.9 | 16.3 | ||||||||||||||
| Other income | — | — | 11.2 | ||||||||||||||
| Income (loss) before taxes | 1,538.7 | (1,020.0) | (36.9) | ||||||||||||||
| Income tax provision (benefit) | 242.0 | (50.1) | (25.6) | ||||||||||||||
| Net income (loss) | $ | 1,296.7 | $ | (969.9) | $ | (11.3) | |||||||||||
| Net income (loss) per common share: | |||||||||||||||||
| Basic | $ | 8.15 | $ | (6.14) | $ | (0.07) | |||||||||||
| Diluted | $ | 7.96 | $ | (6.14) | $ | (0.07) | |||||||||||
2021 Compared to 2020
Sales for 2021 were $8,910.6 million compared to $5,758.0 million in 2020, an increase of $3,152.6 million, or 55%. Chlor Alkali Products and Vinyls sales increased by $1,180.9 million, primarily due to higher pricing across all products. Epoxy sales increased by $1,315.5 million, primarily due to higher product prices. Winchester sales increased by $656.2 million, primarily due to increased commercial ammunition pricing and higher commercial and military sales volumes, which included ammunition produced at Lake City.
Gross margin increased $1,910.8 million from 2020. Chlor Alkali Products and Vinyls gross margin increased by $986.1 million, primarily due to higher pricing and the effect of Winter Storm Uri. Epoxy gross margin increased by $578.6 million, primarily due to higher product prices, partially offset by higher raw material costs and the effect of Winter Storm Uri. Winchester gross margin increased by $336.1 million, primarily due to increased commercial ammunition pricing and higher sales volumes, which included ammunition produced at Lake City. Gross margin as a percentage of sales increased to 26% in 2021 from 7% in 2020.
Selling and administration expenses in 2021 decreased $5.1 million, or 1%, from 2020. The decrease was primarily due to the absence of $73.9 million of costs associated with a multi-year implementation of new enterprise resource planning, manufacturing and engineering systems, and related infrastructure (collectively, the Information Technology Project), which was completed in late 2020. This decrease was partially offset by higher variable incentive compensation expense of $49.4 million, which includes mark-to-market adjustments on stock-based compensation expense, and inclusion of a full year of selling and administration expenses associated with Lake City operations of $18.6 million. Selling and administration expenses as a percentage of sales decreased to 5% in 2021 from 7% in 2020.
Restructuring charges for 2021 were $27.9 million compared to $9.0 million in 2020. The increase in charges was primarily due to a productivity initiative to align the organization with our new operating model and improve efficiencies, which was completed during the second quarter of 2021, and the 2021 decisions to permanently close our diaphragm-grade chlor alkali capacity, representing 400,000 tons, at our McIntosh, AL facility.
Goodwill impairment includes non-cash pretax impairment charges of $557.6 million related to the Chlor Alkali Products and Vinyls segment and $142.2 million related to the Epoxy segment recorded during the third quarter of 2020.
29
Interest expense increased by $55.3 million for the year ended December 31, 2021. Interest expense for 2021 included $137.7 million of bond redemption premiums and $14.5 million for write-off of deferred debt issuance costs, write-off of bond original issue discount, and recognition of deferred fair value interest rate swap losses. Interest expense for 2020 included $14.6 million of bond redemption premiums, $5.8 million for write-off of deferred debt issuance costs and $4.0 million of accretion expense related to the 2020 ethylene payment discount. Interest expense for 2021 and 2020 was reduced by capitalized interest of $3.2 million and $6.4 million, respectively. Without these items, interest expense decreased by $75.7 million, primarily due to a lower level of debt outstanding and lower average interest rates.
Non-operating pension income includes all components of pension and other postretirement income (costs) other than service costs. Non-operating pension income was higher for the year ended December 31, 2021 primarily due to a decrease in the discount rate used to determine interest costs.
The effective tax rate for 2021 included benefits from a net decrease in the valuation allowance related to deferred tax assets in foreign jurisdictions and domestic tax credits, a benefit associated with prior year tax positions, a benefit associated with stock-based compensation, an expense from remeasurement of deferred taxes due to an increase in our state effective tax rates and an expense from a change in tax contingencies. These factors resulted in a net $103.6 million tax benefit. After giving consideration to these items, the effective tax rate for 2021 of 22.5% was higher than the 21% U.S. federal statutory rate primarily due to state taxes, foreign income inclusions and foreign income taxes, partially offset by a net decrease in the valuation allowance related to utilization of losses in foreign jurisdictions and favorable permanent salt depletion deductions. The effective tax rate for 2020 included expenses associated with a net increase in the valuation allowance related to foreign and domestic tax credits and deferred tax assets in foreign jurisdictions, a remeasurement of deferred taxes due to an increase in our state effective tax rates and a change in tax contingencies, and stock-based compensation, partially offset by a benefit associated with prior year tax positions. These factors resulted in a net $27.9 million tax expense. For 2020, a tax benefit of $10.8 million was recognized associated with the $699.8 million goodwill impairment charge. After giving consideration to these items, including the goodwill impairment charge on Olin’s loss before taxes, the effective tax rate for 2020 of 21.0% was equal to the 21.0% U.S. federal statutory rate as foreign income taxes, foreign income inclusions and a net increase in the valuation allowance related to losses in foreign jurisdictions were offset by state taxes and favorable permanent salt depletion deductions.
2020 Compared to 2019
Sales for 2020 were $5,758.0 million compared to $6,110.0 million in 2019, a decrease of $352.0 million, or 6%. Chlor Alkali Products and Vinyls sales decreased by $460.2 million, primarily due to lower caustic soda and EDC pricing and lower caustic soda volumes. Epoxy sales decreased by $153.9 million, primarily due to lower product prices. Winchester sales increased by $262.1 million, primarily due to higher commercial and military sales volumes, which included ammunition produced at Lake City, and increased commercial ammunition pricing.
Gross margin for 2020 decreased $287.4 million, or 43%, from 2019. Chlor Alkali Products and Vinyls gross margin decreased by $327.3 million, primarily due to lower caustic soda and EDC pricing and lower caustic soda volumes, partially offset by lower costs, primarily raw materials. Epoxy gross margin decreased $9.5 million, primarily due to lower product prices, partially offset by lower raw material costs. Winchester gross margin increased $73.5 million, primarily due to higher sales volumes, which included ammunition produced at Lake City, and increased commercial pricing. Gross margin as a percentage of sales decreased to 7% in 2020 from 11% in 2019.
Selling and administration expenses in 2020 increased $5.1 million, or 1%, from 2019. The increase was primarily due to Lake City operations and higher transition costs relating to the Lake City contract of $22.4 million and higher stock-based compensation expense of $14.7 million, which includes mark-to-market adjustments. These increases were partially offset by lower salaries and benefits of $13.9 million, consulting and contract services of $7.9 million and travel-related expenses of $8.1 million. Selling and administration expenses for the years ended December 31, 2020 and 2019 included costs associated with the Information Technology Project of $73.9 million and $77.0 million, respectively. Selling and administration expenses as a percentage of sales were 7% in both 2020 and 2019.
Restructuring charges in 2020 and 2019 were primarily associated with the March 2016 closure of 433,000 tons of chlor alkali capacity across three separate locations. Restructuring charges for the years ended December 31, 2020 and 2019 were also associated with the closure of a chlor alkali plant and a VDC production facility, both in Freeport, TX, and included $58.9 million of non-cash impairment charges for equipment and facilities for the year ended December 31, 2019. Restructuring charges for the year ended December 31, 2019 also included costs associated with permanently closing the ammunition assembly operations at our Geelong, Australia facility in December 2018.
30
Goodwill impairment includes non-cash pretax impairment charges of $557.6 million related to the Chlor Alkali Products and Vinyls segment and $142.2 million related to the Epoxy segment recorded during the third quarter of 2020.
Interest expense increased by $49.5 million for the year ended December 31, 2020, primarily due to a higher level of debt outstanding and higher interest rates. Interest expense included $14.6 million of expense related to the 2023 Notes redemption premium and $5.8 million for write-off of deferred debt issuance costs for financing transactions during 2020. Interest expense for the years ended December 31, 2020 and 2019 included $4.0 million and $17.0 million, respectively, of accretion expense related to the ethylene payment discount. Interest expense was reduced by capitalized interest of $6.4 million and $10.8 million for 2020 and 2019, respectively.
Non-operating pension income includes all components of pension and other postretirement income (costs) other than service costs. Non-operating pension income was higher for the year ended December 31, 2020, primarily due to a decrease in the amortization of actuarial losses associated with our domestic qualified defined benefit pension plan.
The effective tax rate for 2020 included expenses associated with a net increase in the valuation allowance related to foreign and domestic tax credits and deferred tax assets in foreign jurisdictions, a remeasurement of deferred taxes due to an increase in our state effective tax rates and a change in tax contingencies, and stock-based compensation, partially offset by a benefit associated with prior year tax positions. These factors resulted in a net $27.9 million tax expense. For 2020, a tax benefit of $10.8 million was recognized associated with the $699.8 million goodwill impairment charge. After giving consideration to these items, including the goodwill impairment charge on Olin’s loss before taxes, the effective tax rate for 2020 of 21.0% was equal to the 21% U.S. federal statutory rate as foreign income taxes, foreign income inclusions and a net increase in the valuation allowance related to losses in foreign jurisdictions were offset by state taxes and favorable permanent salt depletion deductions. The effective tax rate for 2019 included benefits associated with the finalization of the IRS review of years 2013 to 2015 U.S. income tax claims, stock-based compensation, prior year tax positions, foreign tax law changes, a remeasurement of deferred taxes due to a decrease in our state effective tax rates and a change in tax contingencies. The effective tax rate also included expenses associated with a net increase in the valuation allowance primarily related to foreign deferred tax assets and liabilities. These factors resulted in a net $19.4 million tax benefit. After giving consideration to these items, the effective tax rate for 2019 of 16.8% was lower than the 21% U.S. federal statutory rate primarily due to state taxes and a net increase in the valuation allowance related to losses in foreign jurisdictions, partially offset by foreign income taxes and favorable permanent salt depletion deductions.
31
SEGMENT RESULTS
We define segment results as income (loss) before interest expense, interest income, goodwill impairment charges, other operating income (expense), non-operating pension income, other income and income taxes. We have three operating segments: Chlor Alkali Products and Vinyls, Epoxy and Winchester. The three operating segments reflect the organization used by our management for purposes of allocating resources and assessing performance. Chlorine used in our Epoxy segment is transferred at cost from the Chlor Alkali Products and Vinyls segment.
| Years ended December 31, | |||||||||||||||||
| 2021 | 2020 | 2019 | |||||||||||||||
| Sales: | ($ in millions) | ||||||||||||||||
| Chlor Alkali Products and Vinyls | $ | 4,140.8 | $ | 2,959.9 | $ | 3,420.1 | |||||||||||
| Epoxy | 3,186.0 | 1,870.5 | 2,024.4 | ||||||||||||||
| Winchester | 1,583.8 | 927.6 | 665.5 | ||||||||||||||
| Total sales | $ | 8,910.6 | $ | 5,758.0 | $ | 6,110.0 | |||||||||||
| Income (loss) before taxes: | |||||||||||||||||
| Chlor Alkali Products and Vinyls | $ | 997.8 | $ | 3.5 | $ | 336.7 | |||||||||||
| Epoxy | 616.5 | 40.8 | 53.9 | ||||||||||||||
| Winchester | 412.1 | 92.3 | 40.1 | ||||||||||||||
| Corporate/Other: | |||||||||||||||||
Environmental expense(1) | (14.0) | (20.9) | (20.5) | ||||||||||||||
Other corporate and unallocated costs(2) | (135.1) | (154.3) | (156.3) | ||||||||||||||
Restructuring charges(3) | (27.9) | (9.0) | (76.5) | ||||||||||||||
| Goodwill impairment | — | (699.8) | — | ||||||||||||||
Other operating income(4) | 1.4 | 0.7 | 0.4 | ||||||||||||||
Interest expense(5) | (348.0) | (292.7) | (243.2) | ||||||||||||||
| Interest income | 0.2 | 0.5 | 1.0 | ||||||||||||||
| Non-operating pension income | 35.7 | 18.9 | 16.3 | ||||||||||||||
Other income(6) | — | — | 11.2 | ||||||||||||||
| Income (loss) before taxes | $ | 1,538.7 | $ | (1,020.0) | $ | (36.9) | |||||||||||
(1)Environmental expense for the years ended December 31, 2021 and 2019 included $2.2 million and $4.8 million, respectively, of insurance recoveries for environmental costs incurred and expensed in prior periods. Environmental expense is included in cost of goods sold in the consolidated statements of operations.
(2)Other corporate and unallocated costs for the years ended December 31, 2020 and 2019 included costs associated with the implementation of the Information Technology Project of $73.9 million and $77.0 million, respectively.
(3)Restructuring charges for the year ended December 31, 2021 were primarily due to a productivity initiative to align the organization with our new operating model and improve efficiencies, which was completed during the second quarter of 2021, and the 2021 decisions to permanently close our diaphragm-grade chlor alkali capacity, representing 400,000 tons, at our McIntosh, AL facility. Restructuring charges for the years ended December 31, 2020 and 2019 were primarily associated with the closure of a chlor alkali plant and a VDC production facility, both in Freeport, TX, and included $58.9 million of non-cash impairment charges for equipment and facilities for the year ended December 31, 2019.
(4)Other operating income for the year ended December 31, 2021 included a $1.4 million gain on the sale of a terminal facility. Other operating income for the year ended December 31, 2020 included an $0.8 million gain on the sale of land.
(5)Interest expense for the year ended December 31, 2021 included a loss on extinguishment of debt of $152.2 million which includes bond redemption premiums, write-off of deferred debt issuance costs, bond original issue discount, and recognition of deferred fair value interest rate swap losses associated with the optional prepayment of existing debt. Interest expense for the year ended December 31, 2020 included a loss on extinguishment of debt of $20.4 million which includes bond redemption premiums and write-off of deferred debt issuance costs. Interest expense for the years ended 2020 and 2019 included $4.0 million and $17.0 million, respectively, of accretion expense related to the ethylene
32
payment discount. Interest expense was reduced by capitalized interest of $3.2 million, $6.4 million and $10.8 million for the years ended December 31, 2021, 2020 and 2019, respectively.
(6)Other income for the year ended December 31, 2019 included a gain of $11.2 million on the sale of our equity interest in a non-consolidated affiliate.
Chlor Alkali Products and Vinyls
2021 Compared to 2020
Chlor Alkali Products and Vinyls sales for 2021 were $4,140.8 million compared to $2,959.9 million for 2020, an increase of $1,180.9 million, or 40%. The sales increase was primarily due to higher pricing across all product lines. Chlor Alkali Products and Vinyls sales increase was also due to higher VCM sales as a result of our primary VCM contract transitioning from a toll manufacturing arrangement to a direct customer sale agreement beginning on January 1, 2021.
Chlor Alkali Products and Vinyls generated segment income of $997.8 million for 2021 compared to $3.5 million for 2020, an increase of $994.3 million. The increase in Chlor Alkali Products and Vinyls segment results was primarily due to higher product prices ($1,128.0 million) and the favorable impact of Winter Storm Uri ($121.4 million), partially offset by higher raw material and operating costs ($132.8 million) and increased costs associated with product purchased from other parties ($122.3 million). The impact of Winter Storm Uri includes a net one-time benefit associated with Olin’s customary financial hedges and contracts maintained to provide protection from rapid and dramatic changes in energy costs, partially offset by unabsorbed fixed manufacturing costs and storm-related maintenance costs. Chlor Alkali Products and Vinyls segment results included depreciation and amortization expense of $466.4 million and $451.4 million in 2021 and 2020, respectively.
2020 Compared to 2019
Chlor Alkali Products and Vinyls sales for 2020 were $2,959.9 million compared to $3,420.1 million for 2019, a decrease of $460.2 million, or 13%. The sales decrease was primarily due to lower caustic soda and EDC pricing and lower volumes, primarily caustic soda.
Chlor Alkali Products and Vinyls generated segment income of $3.5 million for 2020 compared to $336.7 million for 2019, a decrease of $333.2 million. The decrease in Chlor Alkali Products and Vinyls segment results was primarily due to lower product prices ($318.5 million), primarily caustic soda and EDC, and lower volumes ($143.1 million), primarily caustic soda. Partially offsetting these decreases were lower raw material costs ($83.8 million) and lower maintenance turnaround and operating costs ($44.6 million). Chlor Alkali Products and Vinyls segment results included depreciation and amortization expense of $451.4 million and $470.4 million in 2020 and 2019, respectively.
Epoxy
2021 Compared to 2020
Epoxy sales were $3,186.0 million for 2021 compared to $1,870.5 million for 2020, an increase of $1,315.5 million, or 70%. The sales increase was primarily due to higher product prices ($1,211.0 million), a favorable effect of foreign currency translation ($74.9 million), and higher volumes ($29.6 million).
Epoxy reported segment income of $616.5 million for 2021 compared to $40.8 million for 2020, an increase of $575.7 million. The increase in segment results was primarily due to higher product prices ($1,211.0 million) and increased volumes ($11.5 million), partially offset by higher raw material costs ($554.4 million), primarily benzene and propylene, higher operating and maintenance turnaround costs ($70.9 million) and the unfavorable impact of Winter Storm Uri ($21.5 million). A significant percentage of our Euro denominated sales are of products manufactured within Europe. As a result, the impact of foreign currency translation on revenue is primarily offset by the impact of foreign currency translation on raw materials and manufacturing costs also denominated in Euros. Epoxy segment results included depreciation and amortization expense of $86.1 million and $90.7 million in 2021 and 2020, respectively.
33
2020 Compared to 2019
Epoxy sales were $1,870.5 million for 2020 compared to $2,024.4 million for 2019, a decrease of $153.9 million, or 8%. The sales decrease was primarily due to lower product prices ($180.0 million) and an unfavorable effect of foreign currency translation ($6.1 million), partially offset by higher volumes ($32.2 million).
Epoxy reported segment income of $40.8 million for 2020 compared to $53.9 million for 2019, a decrease of $13.1 million, or 24%. The decrease in segment results was primarily due to lower product prices ($180.0 million) and an unfavorable product mix ($24.4 million), partially offset by lower raw material costs ($162.5 million), primarily benzene and propylene, and lower operating costs ($38.8 million). Epoxy segment results were also negatively affected by a first quarter 2020 force majeure declaration by a European phenol supplier, which reduced epoxy resin and epoxy resin precursor production, and Epoxy manufacturing plant closures and operating reductions in Asia due to COVID-19 ($10.0 million). A significant percentage of our Euro denominated sales are of products manufactured within Europe. As a result, the impact of foreign currency translation on revenue is primarily offset by the impact of foreign currency translation on raw materials and manufacturing costs also denominated in Euros. Epoxy segment results included depreciation and amortization expense of $90.7 million and $100.1 million in 2020 and 2019, respectively.
Winchester
2021 Compared to 2020
Winchester sales were $1,583.8 million for 2021 compared to $927.6 million for 2020, an increase of $656.2 million, or 71%. The increase was due to higher ammunition sales to commercial customers ($463.6 million) and military customers ($179.2 million), both of which include ammunition produced at Lake City, and law enforcement agencies ($13.4 million).
Winchester reported segment income of $412.1 million for 2021 compared to $92.3 million for 2020, an increase of $319.8 million. The increase in segment results was due to higher product pricing ($221.6 million) and increased sales volumes ($134.1 million), which includes ammunition produced at Lake City, partially offset by higher commodity and operating costs ($49.4 million). Segment results in 2020 were also impacted by transition costs relating to the Lake City contract ($13.5 million). Winchester segment results included depreciation and amortization expense of $23.3 million and $20.1 million in 2021 and 2020, respectively.
2020 Compared to 2019
Winchester sales were $927.6 million for 2020 compared to $665.5 million for 2019, an increase of $262.1 million, or 39%. The increase was due to higher ammunition sales to commercial customers ($199.2 million) and military customers ($51.9 million), both of which include ammunition produced at Lake City, and law enforcement agencies ($11.0 million).
Winchester reported segment income of $92.3 million for 2020 compared to $40.1 million for 2019, an increase of $52.2 million, or 130%. The increase in segment results was due to increased sales volumes ($49.2 million), which includes ammunition produced at Lake City, and higher product pricing ($23.4 million), partially offset by higher transition costs relating to the Lake City contract ($12.9 million) and higher operating costs ($7.5 million). Winchester segment results included depreciation and amortization expense of $20.1 million in both 2020 and 2019.
Corporate/Other
2021 Compared to 2020
For the year ended December 31, 2021, charges to income for environmental investigatory and remedial activities were $14.0 million, which includes $2.2 million of insurance recoveries for environmental costs incurred and expensed in prior periods. Without these recoveries, charges to income for environmental investigatory and remedial activities for the year ended December 31, 2021 would have been $16.2 million, compared to $20.9 million for the year ended December 31, 2020. These charges related primarily to expected future investigatory and remedial activities associated with past manufacturing operations and former waste disposal sites.
For 2021, other corporate and unallocated costs were $135.1 million compared to $154.3 million for 2020, a decrease of $19.2 million, or 12%. The decrease was primarily due to the absence of $73.9 million of costs associated with the implementation of the Information Technology Project, which was completed in late 2020, partially offset by higher variable
34
incentive compensation costs of $45.7 million, which includes mark-to-market adjustments on stock-based compensation expense, and an unfavorable foreign currency impact of $7.0 million.
2020 Compared to 2019
For the year ended December 31, 2020, charges to income for environmental investigatory and remedial activities were $20.9 million compared to $20.5 million for the year ended December 31, 2019. These charges related primarily to expected future investigatory and remedial activities associated with past manufacturing operations and former waste disposal sites. The year ended December 31, 2019 includes a $4.8 million environmental insurance-related settlement gain.
For 2020, other corporate and unallocated costs were $154.3 million compared to $156.3 million for 2019, a decrease of $2.0 million, or 1%. The decrease was primarily due to lower salary and benefit costs of $12.2 million and lower travel-related expenses of $2.1 million, partially offset by higher stock-based compensation expense of $14.8 million, which includes mark-to-market adjustments. Other corporate and unallocated costs included costs associated with the implementation of the Information Technology Project for the year ended December 31, 2020 and 2019 of $73.9 million and $77.0 million, respectively.
Restructurings
Olin committed to a productivity initiative to align the organization with our new operating model and improve efficiencies (collectively, Productivity Plan). These actions and related activities were completed during the second quarter of 2021. For the year ended December 31, 2021, we recorded pretax restructuring charges of $10.3 million for employee severance and related benefit costs related to these actions. We do not expect to incur additional restructuring charges related to these actions.
On May 18, 2021, we announced that we had made the decision to permanently close approximately 20% of our diaphragm-grade chlor alkali capacity, representing 225,000 tons, at our Plaquemine, LA facility (Plaquemine Plan). The closure was completed in the second quarter of 2021. We do not expect to incur restructuring charges related to this action.
On March 15, 2021, we announced that we had made the decision to permanently close approximately 50% of our diaphragm-grade chlor alkali capacity, representing 200,000 tons, at our McIntosh, AL facility. The closure was completed in the first quarter of 2021. On October 21, 2021, we announced that we had made a decision to permanently cease operations of the remaining 50% of our diaphragm-grade chlor alkali capacity, representing an additional 200,000 tons, at our McIntosh, AL facility (collectively, McIntosh Plans). The closure is expected to be completed by the end of the third quarter of 2022. For the year ended December 31, 2021, we recorded pretax restructuring charges of $5.6 million for lease and other contract termination costs related to these actions. We expect to incur additional restructuring charges through 2026 of approximately $35 million related to these actions.
On January 18, 2021, we announced we had made the decision to permanently close our trichloroethylene and anhydrous hydrogen chloride liquefaction facilities in Freeport, TX, which was completed in the fourth quarter of 2021. For the year ended December 31, 2021, we recorded pretax restructuring charges of $6.5 million for facility exit costs related to these actions. We expect to incur restructuring charges through 2024 of approximately $20 million related to these actions.
2022 OUTLOOK
In 2022, we expect to continue to benefit from Olin’s strategic operating model of optimizing value across our Chemicals and Winchester businesses. In 2022, we expect operating results to improve across all our business segments compared to 2021. In early 2022, we expect sequentially higher raw material and operating costs, mainly increased natural gas and electrical power costs. As a result, we expect the first quarter 2022 results from our Chemicals businesses to be similar to fourth quarter 2021 levels. We expect our Winchester business first quarter 2022 results to increase sequentially from fourth quarter 2021.
Other Corporate and Unallocated costs in 2022 are expected to be lower than the $135.1 million in 2021.
During 2022, we anticipate environmental expenses in the $25 million to $30 million range compared to $14.0 million in 2021.
We expect non-operating pension income in 2022 to be in the $40 million to $45 million range compared to $35.7 million in 2021. Based on our plan assumptions and estimates, we will not be required to make any cash contributions to our domestic qualified defined benefit pension plan in 2022. We have several international qualified defined benefit pension plans for which we anticipate cash contributions of less than $5 million in 2022.
35
In 2022, we currently expect our capital spending to be in the $200 million to $250 million range. We expect 2022 depreciation and amortization expense to be in the $575 million to $600 million range.
We currently believe the 2022 effective and cash tax rates will be in the 25% to 30% range.
PENSION AND POSTRETIREMENT BENEFITS
We recorded an after-tax benefit of $188.5 million ($249.7 million pretax) to shareholders’ equity as of December 31, 2021 for our pension and other postretirement plans. This benefit primarily reflected a 50-basis point increase in the domestic pension plans’ discount rate and favorable performance on plan assets during 2021. In 2020, we recorded an after-tax benefit of $14.8 million ($26.6 million pretax) to shareholders’ equity as of December 31, 2020 for our pension and other postretirement plans. This benefit primarily reflected favorable performance on plan assets during 2020, partially offset by an 80-basis point decrease in the domestic pension plans’ discount rate. In 2019, we recorded an after-tax charge of $150.2 million ($183.9 million pretax) to shareholders’ equity as of December 31, 2019 for our pension and other postretirement plans. This charge primarily reflected a 100-basis point decrease in the domestic pension plans’ discount rate, partially offset by favorable performance on plan assets during 2019. These non-cash charges to shareholders’ equity do not affect our ability to borrow under our senior credit facility.
During 2019, we made a discretionary cash contribution to our domestic qualified defined benefit pension plan of $12.5 million. Based on our plan assumptions and estimates, we will not be required to make any cash contributions to the domestic qualified defined benefit pension plan at least through 2022.
In connection with international qualified defined benefit pension plans, we made cash contributions of $1.1 million, $2.1 million and $2.4 million in 2021, 2020 and 2019, respectively, and we anticipate less than $5 million of cash contributions to international qualified defined benefit pension plans in 2022.
At December 31, 2021, the projected benefit obligation of $2,883.0 million exceeded the market value of assets in our qualified defined benefit pension plans by $377.3 million, as calculated under ASC 715.
Components of net periodic benefit (income) costs were:
| Years ended December 31, | |||||||||||||||||
| 2021 | 2020 | 2019 | |||||||||||||||
| ($ in millions) | |||||||||||||||||
| Pension benefits | $ | (27.5) | $ | (11.7) | $ | (8.8) | |||||||||||
| Other postretirement benefit costs | 4.5 | 4.9 | 4.9 | ||||||||||||||
The service cost component of net periodic benefit (income) costs related to employees of the operating segments are allocated to the operating segments based on their respective estimated census data.
We have included additional information with respect our defined benefit pension plans and other postretirement benefit plans within Note 12 “Pension Plans” and Note 13 “Postretirement Benefits” of our Notes to Consolidated Financial Statements.
ENVIRONMENTAL MATTERS
| Years ended December 31, | |||||||||||||||||
| 2021 | 2020 | 2019 | |||||||||||||||
| Cash outlays: | ($ in millions) | ||||||||||||||||
| Remedial and investigatory spending (charged to reserve) | $ | 16.4 | $ | 12.8 | $ | 12.2 | |||||||||||
| Capital spending | 4.1 | 3.8 | 1.2 | ||||||||||||||
| Plant operations (charged to cost of goods sold) | 194.9 | 182.8 | 188.4 | ||||||||||||||
| Total cash outlays | $ | 215.4 | $ | 199.4 | $ | 201.8 | |||||||||||
Cash outlays for remedial and investigatory activities associated with former waste sites and past operations were not charged to income but instead were charged to reserves established for such costs identified and expensed to income in prior years. Cash outlays for normal plant operations for the disposal of waste and the operation and maintenance of pollution
36
control equipment and facilities to ensure compliance with mandated and voluntarily imposed environmental quality standards were charged to income.
Total environmental-related cash outlays for 2022 are estimated to be approximately $215 million, of which approximately $25 million is expected to be spent on investigatory and remedial efforts, approximately $5 million on capital projects and approximately $185 million on normal plant operations. Remedial and investigatory spending is anticipated to be higher in 2022 than 2021 due to the timing of continuing remedial action plans and investigations. Historically, we have funded our environmental capital expenditures through cash flow from operations and expect to do so in the future.
Annual environmental-related cash outlays for site investigation and remediation, capital projects and normal plant operations are expected to range between $200 million to $220 million over the next several years, $20 million to $30 million of which is for investigatory and remedial efforts, which are expected to be charged against reserves recorded on our consolidated balance sheet. While we do not anticipate a material increase in the projected annual level of our environmental-related cash outlays for site investigation and remediation, there is always the possibility that such an increase may occur in the future in view of the uncertainties associated with environmental exposures.
Our liabilities for future environmental expenditures were as follows:
| December 31, | |||||||||||||||||
| 2021 | 2020 | 2019 | |||||||||||||||
| ($ in millions) | |||||||||||||||||
| Beginning balance | $ | 147.2 | $ | 139.0 | $ | 125.6 | |||||||||||
| Charges to income | 16.2 | 20.9 | 25.3 | ||||||||||||||
| Remedial and investigatory spending | (16.4) | (12.8) | (12.2) | ||||||||||||||
| Foreign currency translation adjustments | 0.3 | 0.1 | 0.3 | ||||||||||||||
| Ending balance | $ | 147.3 | $ | 147.2 | $ | 139.0 | |||||||||||
As is common in our industry, we are subject to environmental laws and regulations related to the use, storage, handling, generation, transportation, emission, discharge, disposal and remediation of, and exposure to, hazardous and non-hazardous substances and wastes in all of the countries in which we do business.
The establishment and implementation of national, state or provincial and local standards to regulate air, water and land quality affect substantially all of our manufacturing locations around the world. Laws providing for regulation of the manufacture, transportation, use and disposal of hazardous and toxic substances, and remediation of contaminated sites, have imposed additional regulatory requirements on industry, particularly the chemicals industry. In addition, implementation of environmental laws has required and will continue to require new capital expenditures and will increase plant operating costs. We employ waste minimization and pollution prevention programs at our manufacturing sites.
We are party to various government and private environmental actions associated with past manufacturing facilities and former waste disposal sites. Associated costs of investigatory and remedial activities are provided for in accordance with generally accepted accounting principles governing probability and the ability to reasonably estimate future costs. Our ability to estimate future costs depends on whether our investigatory and remedial activities are in preliminary or advanced stages. With respect to unasserted claims, we accrue liabilities for costs that, in our experience, we expect to incur to protect our interests against those unasserted claims. Our accrued liabilities for unasserted claims amounted to $9.0 million at December 31, 2021. With respect to asserted claims, we accrue liabilities based on remedial investigation, feasibility study, remedial action and operation, maintenance and monitoring (OM&M) expenses that, in our experience, we expect to incur in connection with the asserted claims. Required site OM&M expenses are estimated and accrued in their entirety for required periods not exceeding 30 years, which reasonably approximates the typical duration of long-term site OM&M.
37
Environmental provisions charged to income, which are included in cost of goods sold, were as follows:
| Years ended December 31, | |||||||||||||||||
| 2021 | 2020 | 2019 | |||||||||||||||
| ($ in millions) | |||||||||||||||||
| Provisions charged to income | $ | 16.2 | $ | 20.9 | $ | 25.3 | |||||||||||
| Insurance recoveries for costs incurred and expensed | (2.2) | — | (4.8) | ||||||||||||||
| Environmental expense | $ | 14.0 | $ | 20.9 | $ | 20.5 | |||||||||||
These charges relate primarily to remedial and investigatory activities associated with past manufacturing operations and former waste disposal sites and may be material to operating results in future years.
Environmental expense for the years ended December 31, 2021 and 2019 included $2.2 million and $4.8 million, respectively, of insurance recoveries for environmental costs incurred and expensed in prior periods. Environmental expense is included in cost of goods sold in the consolidated statement of operations.
We have included additional information with respect to environmental matters within Note 20, “Environmental,” of our Notes to Consolidated Financial Statements.
LEGAL MATTERS AND CONTINGENCIES
Please see the discussion of legal matters and contingencies within Item 8, under the heading of “Legal Matters” within Note 23, “Commitments and Contingencies.”
LIQUIDITY AND CAPITAL RESOURCES
Cash Flow Data
| Years ended December 31, | |||||||||||||||||
| 2021 | 2020 | 2019 | |||||||||||||||
| Provided by (used for) | ($ in millions) | ||||||||||||||||
| Net operating activities | $ | 1,741.0 | $ | 433.0 | $ | 617.3 | |||||||||||
| Capital expenditures | (200.6) | (298.9) | (385.6) | ||||||||||||||
| Payments under long-term supply contracts | — | (536.8) | — | ||||||||||||||
| Proceeds from disposition of non-consolidated affiliate | — | — | 20.0 | ||||||||||||||
| Net investing activities | (197.4) | (835.7) | (365.6) | ||||||||||||||
| Long-term debt (repayments) borrowings, net | (1,103.1) | 520.3 | 80.8 | ||||||||||||||
| Debt early redemption premium | (137.7) | (14.6) | — | ||||||||||||||
| Stock options exercised | 72.4 | 1.9 | 1.7 | ||||||||||||||
| Common stock repurchased and retired | (251.9) | — | (145.9) | ||||||||||||||
| Net financing activities | (1,552.0) | 371.0 | (209.3) | ||||||||||||||
Operating Activities
For 2021, cash provided by operating activities increased by $1,308.0 million from 2020, primarily due to an increase in operating results, partially offset by working capital increases to support operations. For 2021, working capital increased $243.1 million, compared to a decrease of $141.6 million in 2020. The working capital increase primarily reflects a higher sales level. Receivables increased by $360.0 million from December 31, 2020, primarily as a result of higher sales in the fourth quarter of 2021. For the year ended December 31, 2021, our days sales outstanding (DSO), which was calculated by dividing period end accounts receivable by average daily sales for the period, improved from the comparable prior year period. Inventories increased by $206.0 million from December 31, 2020 and accounts payable and accrued liabilities increased $240.1 million, which were both primarily as a result of increased raw material costs.
38
For 2020, cash provided by operating activities decreased by $184.3 million from 2019, primarily due to a decrease in operating results, partially offset by a decrease in the investment in working capital from the prior year. During 2020, we executed a strategy to improve our working capital and manage our balance sheet to maximize our financial flexibility. For 2020, working capital decreased $141.6 million, which included an approximately $67 million investment in working capital to support Lake City operations, compared to a decrease of $11.0 million in 2019. In 2020, inventories decreased by $28.6 million, primarily as a result of lower raw material costs and lower Winchester inventory due to improved commercial ammunition demand, partially offset by the investment in Lake City inventory. Accounts payable and accrued liabilities increased by $149.3 million as a result of specific actions taken by management to improve Olin’s working capital.
Investing Activities
Capital spending was $200.6 million and $298.9 million in 2021 and 2020, respectively. In 2022, we expect our capital spending to be in the $200.0 million to $250.0 million range.
In 2017, we began a multi-year implementation of the Information Technology Project. The project standardized business processes across the chemicals businesses with the objective of maximizing cost effectiveness, efficiency and control across our global operations. The project was completed in 2020. Our results for the years ended December 31, 2020 and 2019 include $41.0 million and $56.0 million, respectively, of capital spending and $73.9 million and $77.0 million, respectively, of expenses associated with this project.
For the year ended December 31, 2020, a payment of $461.0 million was made associated with long-term supply contracts to reserve additional ethylene at producer economics and a payment of $75.8 million was made associated with the resolution of a dispute over the allocation to Olin of certain capital costs incurred at our Plaquemine, LA site.
Financing Activities
During 2021 and 2020, activity of our outstanding debt included:
| Long-term Debt Borrowings (Repayments) | Debt Early Redemption Premiums Paid | Long-term Debt Borrowings (Repayments) | Debt Early Redemption Premiums Paid | |||||||||||||||||||||||
| Year Ended December 31, 2021 | Year Ended December 31, 2020 | |||||||||||||||||||||||||
| Debt Instrument | ($ in millions) | |||||||||||||||||||||||||
| Borrowings: | ||||||||||||||||||||||||||
| Senior Term Loans | $ | 315.0 | $ | 675.0 | ||||||||||||||||||||||
| Receivables Financing Agreement | 225.0 | 655.0 | ||||||||||||||||||||||||
| 9.50% senior notes due 2025 | — | 497.5 | ||||||||||||||||||||||||
| Total borrowings | $ | 540.0 | $ | 1,827.5 | ||||||||||||||||||||||
| Repayments: | ||||||||||||||||||||||||||
| 10.00% senior notes due 2025 | $ | (500.0) | $ | 25.0 | $ | — | $ | — | ||||||||||||||||||
| 9.50% senior notes due 2025 | (391.4) | 99.4 | — | — | ||||||||||||||||||||||
| 9.75% senior notes due 2023 | (120.0) | 2.9 | (600.0) | 14.6 | ||||||||||||||||||||||
| 5.625% senior notes due 2029 | (80.7) | 8.0 | — | — | ||||||||||||||||||||||
| 5.00% senior notes due 2030 | (34.7) | 2.4 | — | — | ||||||||||||||||||||||
| Senior Term Loans | (465.0) | — | (175.0) | — | ||||||||||||||||||||||
| Receivables Financing Agreement | (50.0) | — | (530.0) | — | ||||||||||||||||||||||
| Finance leases | (1.3) | — | (2.2) | — | ||||||||||||||||||||||
| Total repayments | $ | (1,643.1) | $ | 137.7 | $ | (1,307.2) | $ | 14.6 | ||||||||||||||||||
| Long-term debt (repayments) borrowings, net | $ | (1,103.1) | $ | 520.3 | ||||||||||||||||||||||
In 2021, we paid debt issuance costs of $3.9 million, primarily for the amendments to our Senior Credit Facility. In 2020, we paid debt issuance costs of $10.3 million, primarily for the issuance of the 2025 Notes and amendments to our Senior Credit Facility and Receivables Financing Agreement.
39
In 2021, we repurchased and retired 4.7 million shares of common stock with a total value of $251.9 million. In 2020, no shares were repurchased.
We issued 3.4 million and 0.1 million shares representing stock options exercised for the year ended December 31, 2021 and 2020, respectively, with a total value of $72.4 million and $1.9 million, respectively.
The percent of total debt to total capitalization decreased to 51.2% at December 31, 2021 compared to 72.7% at December 31, 2020, as a result of a lower level of debt outstanding and higher shareholders’ equity primarily resulting from our operating results.
Dividends per common share were $0.80 in 2021 and 2020. Total dividends paid on common stock amounted to $127.8 million and $126.3 million in 2021 and 2020, respectively. On February 22, 2022, our board of directors declared a dividend of $0.20 per share on our common stock, payable on March 11, 2022 to shareholders of record on March 4, 2022.
The payment of cash dividends is subject to the discretion of our board of directors and will be determined in light of then-current conditions, including our earnings, our operations, our financial condition, our capital requirements and other factors deemed relevant by our board of directors. In the future, our board of directors may change our dividend policy, including the frequency or amount of any dividend, in light of then-existing conditions.
40
Liquidity and Other Financing Arrangements
Our principal sources of liquidity are from cash and cash equivalents, cash flow from operations and borrowings under our Senior Revolving Credit Facility, Receivables Financing Agreement and AR Facilities. Additionally, we believe that we have access to the high yield debt and equity markets.
In 2021, we repaid approximately $1.1 billion of our outstanding debt using cash generated from operations. During 2021, activity of our outstanding debt included:
| Long-term Debt Borrowings (Repayments) | ||||||||
| Year Ended December 31, 2021 | ||||||||
| Debt Instrument | ($ in millions) | |||||||
| Borrowings: | ||||||||
| Senior Term Loans | $ | 315.0 | ||||||
| Receivables Financing Agreement | 225.0 | |||||||
| Total borrowings | $ | 540.0 | ||||||
| Repayments: | ||||||||
| 10.00% senior notes due 2025 (Blue Cube 2025 Notes) | $ | (500.0) | ||||||
| 9.50% senior notes due 2025 (2025 Notes) | (391.4) | |||||||
| 9.75% senior notes due 2023 (2023 Notes) | (120.0) | |||||||
| 5.625% senior notes due 2029 (2029 Notes) | (80.7) | |||||||
| 5.00% senior notes due 2030 (2030 Notes) | (34.7) | |||||||
| Senior Term Loans | (465.0) | |||||||
| Receivables Financing Agreement | (50.0) | |||||||
| Finance leases | (1.3) | |||||||
| Total repayments | $ | (1,643.1) | ||||||
| Long-term debt repayments, net | $ | (1,103.1) | ||||||
On February 24, 2021, we entered into a $1,615.0 million senior secured credit facility (Senior Credit Facility) that amended our existing $1,300.0 million senior secured credit facility. On July 28, 2021, the liens on the collateral provided under the Senior Credit Facility were released based on the achievement of a net leverage ratio below 3.50 for the prior two consecutive fiscal quarters. The Senior Credit Facility includes a senior delayed-draw term loan facility with aggregate commitments of $315.0 million (Delayed Draw Term Loan), a senior term loan facility with aggregate commitments of $500.0 million (2020 Term Loan and together with the Delayed Draw Term Loan, the Senior Term Loans) and a senior revolving credit facility with aggregate commitments in an amount equal to $800.0 million (Senior Revolving Credit Facility). The maturity date for the Senior Credit Facility is July 16, 2024. The amendment modified the pricing grid for the Senior Credit Facility by reducing applicable interest rates on the borrowings under the facility.
On March 30, 2021, Olin drew the entire $315.0 million of the Delayed Draw Term Loan and used the proceeds to fund the redemption of the 10.00% senior notes due October 15, 2025. During the year ended December 31, 2021, we repaid $465.0 million of the Senior Term Loans. These repayments satisfied all future required quarterly installments of the Senior Term Loans. The Senior Revolving Credit Facility includes a $100.0 million letter of credit subfacility. At December 31, 2021, we had $799.6 million available under our $800.0 million Senior Revolving Credit Facility because we had issued $0.4 million of letters of credit.
Under the Senior Credit Facility, we may select various floating-rate borrowing options. The actual interest rate paid on borrowings under the Senior Credit Facility is based on a pricing grid which is dependent upon the net leverage ratio as calculated under the terms of the applicable facility for the prior fiscal quarter. The Senior Credit Facility includes various customary restrictive covenants, including restrictions related to the ratio of debt to earnings before interest expense, taxes, depreciation and amortization (net leverage ratio) and the ratio of earnings before interest expense, taxes, depreciation and amortization to interest expense (coverage ratio). The calculation of debt in our net leverage ratio excludes borrowings under
41
the Receivables Financing Agreement, up to a maximum of $250.0 million, and is reduced by all unrestricted cash and cash equivalents. Compliance with these covenants is determined quarterly. We were in compliance with all covenants and restrictions under all our outstanding credit agreements as of December 31, 2021, and no event of default had occurred that would permit the lenders under our outstanding credit agreements to accelerate the debt if not cured. In the future, our ability to generate sufficient operating cash flows, among other factors, will determine the amounts available to be borrowed under these facilities. As a result of our restrictive covenant related to the net leverage ratio, the maximum additional borrowings available to us could be limited in the future. The limitation, if an amendment or waiver from our lenders is not obtained, could restrict our ability to borrow the maximum amounts available under the Senior Revolving Credit Facility and the Receivables Financing Agreement. As of December 31, 2021, there were no covenants or other restrictions that limited our ability to borrow.
The overall cash decrease of $9.2 million in 2021 primarily reflects our debt repayments, capital spending, dividends paid and share repurchases funded primarily through our operating results. We believe, based on current and projected levels of cash flow from our operations, together with our cash and cash equivalents on hand and the availability to borrow under our Senior Revolving Credit Facility, Receivables Financing Agreement and AR Facilities, we have sufficient liquidity to meet our short-term and long-term needs to make required payments of interest on our debt, fund our operating needs, working capital, and capital expenditure requirements and comply with the financial ratios in our debt agreements.
On April 26, 2018, our board of directors authorized a share repurchase program for the purchase of shares of common stock at an aggregate price of up to $500.0 million. This program will terminate upon the purchase of $500.0 million of our common stock. On November 1, 2021, our board of directors authorized an additional share repurchase program for the purchase of shares of common stock at an aggregate price of up to $1.0 billion. This program will terminate upon the purchase of $1.0 billion of our common stock. For the year ended December 31, 2021, 4.7 million shares have been repurchased and retired at a cost of $251.9 million. For the year ended December 31, 2020, there were no shares repurchased. As of December 31, 2021, a total of 14.7 million shares were repurchased and retired at a cost of $447.8 million under the 2018 Repurchase Authorization program and $52.2 million of common stock remained authorized to be repurchased under this plan. As of December 31, 2021, there have been no repurchases under the 2021 Repurchase Authorization program and $1.0 billion of common stock remained authorized to be repurchased under this plan.
During 2021, we amended our existing $250.0 million Receivables Financing Agreement which expanded the borrowing capacity to $300.0 million (Receivables Financing Agreement) and extended the maturity to September 28, 2024. The Receivables Financing Agreement includes a minimum borrowing requirement of 50% of the facility limit or available borrowing capacity, whichever is less. The administrative agent for our Receivables Financing Agreement is PNC Bank, National Association. Under the Receivables Financing Agreement, our eligible trade receivables are used for collateralized borrowings and continue to be serviced by us. In addition, the Receivables Financing Agreement incorporates the leverage covenant that is contained in the Senior Credit Facility. As of December 31, 2021 and 2020, we had $300.0 million and $125.0 million, respectively, drawn under the agreement. As of December 31, 2021, $556.2 million of our trade receivables were pledged as collateral and we had no additional borrowing capacity under the Receivables Financing Agreement.
Olin also has trade accounts receivable factoring arrangements (AR Facilities) and pursuant to the terms of the AR Facilities, certain of our domestic subsidiaries may sell their accounts receivable up to a maximum of $250.0 million and certain of our foreign subsidiaries may sell their accounts receivable up to a maximum of €43.4 million. We will continue to service the outstanding accounts sold. These receivables qualify for sales treatment under ASC 860 “Transfers and Servicing” and, accordingly, the proceeds are included in net cash provided by operating activities in the consolidated statements of cash flows. The gross amount of receivables sold for the years ended December 31, 2021 and 2020 totaled $673.4 million and $854.3 million, respectively. The factoring discount paid under the AR Facilities is recorded as interest expense on the consolidated statements of operations. The factoring discount for the years ended December 31, 2021 and 2020 was $1.1 million and $1.5 million, respectively. The agreements are without recourse and therefore no recourse liability has been recorded as of December 31, 2021. As of December 31, 2021 and 2020, $65.7 million and $48.8 million, respectively, of receivables qualifying for sales treatment were outstanding and will continue to be serviced by us.
We have registered an undetermined amount of securities with the SEC, so that, from time-to-time, we may issue debt securities, preferred stock and/or common stock and associated warrants in the public market under that registration statement.
Supplemental Guarantor Financial Information
On May 14, 2021, following the redemption of the remaining Blue Cube 2025 Notes, all subsidiary guarantees of the 2025 Notes, 5.125% senior notes due 2027, 2029 Notes and 2030 Notes (collectively, the Senior Notes) were released in accordance with the terms of the indentures governing the Senior Notes. Our obligations under the Senior Notes are no longer
42
guaranteed by any of Olin’s subsidiaries and there are no outstanding debt securities issued by any of Olin’s subsidiaries that are guaranteed by Olin or any other of Olin’s subsidiaries.
Contractual Obligations
Our current debt structure is used to fund our business operations. As of December 31, 2021, we had long-term borrowings, including the current installment and finance lease obligations, of $2,779.3 million, of which $805.9 million was at variable rates. We expect to meet our contractual obligations through our normal sources of liquidity and believe we have the financial resources to satisfy these contractual obligations.
We have several defined benefit pension and defined contribution plans, as described in Note 12 “Pension Plans” and Note 16 “Contributing Employee Ownership Plan” in the notes to consolidated financial statements contained in Item 8. We fund the defined benefit pension plans based on the minimum amounts required by law plus such amounts we deem appropriate. Given the inherent uncertainty as to actual minimum funding requirements for qualified defined benefit pension plans, no amounts are included in this table for any period beyond one year. Based on the current funding requirements, we will not be required to make any cash contributions to the domestic qualified defined benefit pension plan at least through 2022. We also have postretirement healthcare plans that provide health and life insurance benefits to certain retired employees and their beneficiaries, as described in Note 13 “Postretirement Benefits” in the notes to consolidated financial statements contained in Item 8. The defined contribution and other postretirement plans are not pre-funded and expenses are paid by us as incurred. Our long-term contractual commitments associated with debt, contingent tax liabilities, pension and other postretirement benefits consisted of the following:
| Payments Due by Period | |||||||||||||||||||||||||||||
| Less than 1 Year | 1-3 Years | 3-5 Years | More than 5 Years | Total | |||||||||||||||||||||||||
| ($ in millions) | |||||||||||||||||||||||||||||
Debt obligations, including finance lease obligations(1) | $ | 201.1 | $ | 721.8 | $ | 194.7 | $ | 1,684.5 | $ | 2,802.1 | |||||||||||||||||||
Interest payments under debt obligations(2) | 116.5 | 214.8 | 183.9 | 195.0 | 710.2 | ||||||||||||||||||||||||
| Contingent tax liability | 13.5 | 5.9 | 19.6 | 4.4 | 43.4 | ||||||||||||||||||||||||
International qualified pension plan contributions(3) | 1.6 | 7.9 | 10.5 | 283.6 | 303.6 | ||||||||||||||||||||||||
| Non-qualified pension plan payments | 0.8 | 0.7 | 0.7 | 3.1 | 5.3 | ||||||||||||||||||||||||
| Postretirement benefit payments | 3.4 | 6.2 | 5.8 | 35.1 | 50.5 | ||||||||||||||||||||||||
| Total | $ | 336.9 | $ | 957.3 | $ | 415.2 | $ | 2,205.7 | $ | 3,915.1 | |||||||||||||||||||
(1)Excludes unamortized debt issuance costs and unamortized bond original issue discount of $22.8 million at December 31, 2021. All debt obligations are assumed to be held until maturity.
(2)For the purposes of this table, we have assumed for all periods presented that there are no changes in the rates from those in effect at December 31, 2021 which ranged from 0.2% to 9.5%.
(3)These amounts are only estimated payments assuming for our foreign qualified pension plans a weighted average annual expected rate of return on pension plan assets of 4.2% and a discount rate on pension plan obligations of 1.4%. These estimated payments are subject to significant variation and the actual payments may be more than the amounts estimated. In connection with international qualified defined benefit pension plans we made cash contributions of $1.1 million, $2.1 million and $2.4 million in 2021, 2020 and 2019, respectively, and we anticipate less than $5 million of cash contributions to international qualified defined benefit pension plans in 2022.
Non-cancelable operating leases and purchasing commitments are utilized in our normal course of business for our projected needs. Our operating lease commitments as described in Note 21 “Leases” are primarily for railroad cars, but also include logistics, manufacturing, office and storage facilities and equipment, information technology equipment and land. Virtually none of our lease agreements contain escalation clauses or step rent provisions. We also have supply contracts with various third parties for certain raw materials, including ethylene, electricity, propylene and benzene. These contracts have initial terms ranging from several to 20 years. Our long-term contractual commitments associated with operating leases and purchasing commitments consisted of the following:
43
| Payments Due by Period | |||||||||||||||||||||||||||||
| Less than 1 Year | 1-3 Years | 3-5 Years | More than 5 Years | Total | |||||||||||||||||||||||||
| ($ in millions) | |||||||||||||||||||||||||||||
| Operating leases | 86.1 | 125.8 | 80.8 | 149.1 | 441.8 | ||||||||||||||||||||||||
| Purchasing commitments: | |||||||||||||||||||||||||||||
| Raw materials | 1,237.4 | 1,923.3 | 1,114.1 | 3,057.9 | 7,332.7 | ||||||||||||||||||||||||
| Capital expenditures | 6.5 | — | — | — | 6.5 | ||||||||||||||||||||||||
| Utilities | $ | 0.1 | $ | 0.2 | $ | — | $ | — | 0.3 | ||||||||||||||||||||
| Total Purchasing Commitments | $ | 1,244.0 | $ | 1,923.5 | $ | 1,114.1 | $ | 3,057.9 | $ | 7,339.5 | |||||||||||||||||||
Other Guarantees
We also have standby letters of credit of $81.1 million of which $0.4 million have been issued through our Senior Revolving Credit Facility. The letters of credit were used to support certain long-term debt, certain workers compensation insurance policies, certain plant closure and post-closure obligations, certain international payment obligations and certain international pension funding requirements. At December 31, 2021, we had $799.6 million available under our Senior Revolving Credit Facility because we had issued $0.4 million of letters of credit.
CRITICAL ACCOUNTING ESTIMATES
Our discussion and analysis of our financial condition and results of operations are based upon our consolidated financial statements, which have been prepared in accordance with accounting principles generally accepted in the United States. The preparation of these financial statements requires us to make estimates and judgments that affect the reported amounts of assets, liabilities, sales and expenses, and related disclosure of contingent assets and liabilities. Significant estimates in our consolidated financial statements include goodwill recoverability, environmental, restructuring and other unusual items, litigation, income tax reserves including deferred tax asset valuation allowances, pension, postretirement and other benefits and allowance for doubtful accounts. We base our estimates on prior experience, current facts and circumstances and other assumptions. Actual results may differ from these estimates.
We believe the following critical accounting estimates are the more significant judgments used in the preparation of the consolidated financial statements.
Goodwill
Goodwill is not amortized, but is reviewed for impairment annually in the fourth quarter and/or when circumstances or other events indicate that impairment may have occurred. ASC 350 “Intangibles—Goodwill and Other” (ASC 350) permits entities to make a qualitative assessment of whether it is more likely than not that a reporting unit’s fair value is less than its carrying amount before applying the goodwill impairment test. Circumstances that are considered as part of the qualitative assessment and could trigger a quantitative impairment test include, but are not limited to: a significant adverse change in the business climate; a significant adverse legal judgment; adverse cash flow trends; an adverse action or assessment by a government agency; unanticipated competition; sustained decline in our stock price; and a significant restructuring charge within a reporting unit. We define reporting units at the business segment level or one level below the business segment level. For purposes of testing goodwill for impairment, goodwill has been allocated to our reporting units to the extent it relates to each reporting unit.
It is our practice, at a minimum, to perform a quantitative goodwill impairment test in the fourth quarter every three years. We use a discounted cash flow approach to develop the estimated fair value of a reporting unit when a quantitative review is performed. Management judgment is required in developing the assumptions for the discounted cash flow model. We also corroborate our discounted cash flow analysis by evaluating a market-based approach that considers earnings before interest, taxes, depreciation and amortization (EBITDA) multiples from a representative sample of comparable public companies. As a further indicator that each reporting unit has been valued appropriately using a discounted cash flow model, the aggregate fair value of all reporting units is reconciled to the total market value of Olin. An impairment would be recorded if the carrying amount of a reporting unit exceeded the estimated fair value.
Fair value determinations require considerable judgment and are sensitive to changes in underlying assumptions, estimates and market factors. The discount rate, profitability assumptions and terminal growth rate of our reporting units and
44
the supply and demand fundamentals of the chlor alkali industry were the material assumptions utilized in the discounted cash flow model used to estimate the fair value of each reporting unit. The discount rate reflects a weighted-average cost of capital, which is calculated, in part based on observable market data. Some of this data (such as the risk free or treasury rate and the pretax cost of debt) are based on the market data at a point in time. Other data (such as the equity risk premium) are based upon market data over time for a peer group of companies in the chemical manufacturing or distribution industries with a market capitalization premium added, as applicable. Also factoring into the discount rate was a market participant’s perceived risk (such as the company specific risk premium) in the valuation implied by the sustained reduction in our stock price.
The discounted cash flow analysis requires estimates, assumptions and judgments about future events. Our analysis uses our internally generated long-range plan. Specifically, the assumptions in our long-range plan about terminal growth rates, forecasted capital expenditures and changes in future working capital requirements are used to determine the implied fair value of each reporting unit. The long-range plan reflects management judgment, supplemented by independent chemical industry analyses which provide multi-year chlor alkali industry operating and pricing forecasts.
As a further indicator that each reporting unit has been valued appropriately using a discounted cash flow model, the aggregate fair value of all reporting units is reconciled to the total market value of Olin. We believe the assumptions used in our goodwill impairment analysis are appropriate and result in reasonable estimates of the implied fair value of each reporting unit. However, given the economic environment and the uncertainties regarding the impact on our business, there can be no assurance that our estimates and assumptions, made for purposes of our goodwill impairment testing, will prove to be an accurate prediction of the future.
Environmental
Accruals (charges to income) for environmental matters are recorded when it is probable that a liability has been incurred and the amount of the liability can be reasonably estimated, based upon current law and existing technologies. These amounts, which are not discounted and are exclusive of claims against third parties, are adjusted periodically as assessments and remediation efforts progress or additional technical or legal information becomes available. Environmental costs are capitalized if the costs increase the value of the property and/or mitigate or prevent contamination from future operations. Environmental costs and recoveries are included in costs of goods sold.
Environmental exposures are difficult to assess for numerous reasons, including the identification of new sites, developments at sites resulting from investigatory studies, advances in technology, changes in environmental laws and regulations and their application, changes in regulatory authorities, the scarcity of reliable data pertaining to identified sites, the difficulty in assessing the involvement and financial capability of other PRPs and our ability to obtain contributions from other parties and the lengthy time periods over which site remediation occurs. It is possible that some of these matters (the outcomes of which are subject to various uncertainties) may be resolved unfavorably to us, which could materially adversely affect our financial position, cash flows or results of operations.
NEW ACCOUNTING PRONOUNCEMENTS
Discussion of new accounting pronouncements can be referred to under Item 8, within Note 3, “Recent Accounting Pronouncements.”
DERIVATIVE FINANCIAL INSTRUMENTS
We are exposed to market risk in the normal course of our business operations due to our purchases of certain commodities, our ongoing investing and financing activities and our operations that use foreign currencies. The risk of loss can be assessed from the perspective of adverse changes in fair values, cash flows and future earnings. We have established policies and procedures governing our management of market risks and the use of financial instruments to manage exposure to such risks. ASC 815 requires an entity to recognize all derivatives as either assets or liabilities in the consolidated balance sheets and measure those instruments at fair value. In accordance with ASC 815, we designate derivative contracts as cash flow hedges of forecasted purchases of commodities and forecasted interest payments related to variable-rate borrowings and designate certain interest rate swaps as fair value hedges of fixed-rate borrowings. We do not enter into any derivative instruments for trading or speculative purposes.
Energy costs, including electricity and natural gas, and certain raw materials used in our production processes are subject to price volatility. Depending on market conditions, we may enter into futures contracts, forward contracts, commodity swaps and put and call option contracts in order to reduce the impact of commodity price fluctuations. The majority of our commodity derivatives expire within one year.
45
For derivative instruments that are designated and qualify as a cash flow hedge, the change in fair value of the derivative is recognized as a component of other comprehensive income (loss) until the hedged item is recognized in earnings.
We use cash flow hedges for certain raw material and energy costs such as copper, zinc, lead, ethane, electricity and natural gas to provide a measure of stability in managing our exposure to price fluctuations associated with forecasted purchases of raw materials and energy used in our manufacturing process. Settlements on commodity derivative contracts resulted in gains (losses) of $180.1 million, $(14.9) million, and $31.1 million in 2021, 2020, and 2019, respectively which were included in cost of goods sold. At December 31, 2021, we had open derivative notional contract positions through 2027 totaling $224.3 million (2020—$214.1 million). If all open futures contracts had been settled on December 31, 2021, we would have recognized a pretax gain of $30.3 million.
If commodity prices were to remain at December 31, 2021 levels, approximately $17.3 million of deferred gains, net of tax, would be reclassified into earnings during the next twelve months. The actual effect on earnings will be dependent on actual commodity prices when the forecasted transactions occur.
We use interest rate swaps as a means of minimizing cash flow fluctuations that may arise from volatility in interest rates of our variable-rate borrowings. For the year ended December 31, 2019, $4.3 million of income was recorded to interest expense on the accompanying consolidated statements of operations related to these swap agreements.
We also use interest rate swaps as a means of managing interest expense and floating interest rate exposure to optimal levels. For derivative instruments that are designated and qualify as a fair value hedge, the gain or loss on the derivative as well as the offsetting loss or gain on the hedged item attributable to the hedged risk are recognized in current earnings. We include the gain or loss on the hedged items (fixed-rate borrowings) in the same line item, interest expense, as the offsetting loss or gain on the related interest rate swaps.
In August 2019, we terminated the interest rate swaps designated as fair value hedges which resulted in a loss of $2.3 million that was deferred as an offset to the carrying value of the related debt and was subsequently recognized to interest expense. In 2021, we redeemed the 2025 Notes which resulted in recognition of the outstanding deferred swap loss. For the years ended December 31, 2021, 2019 and 2018, $1.8 million, $0.4 million and $2.6 million, respectively, of expense was recorded to interest expense on the accompanying consolidated statements of operations related to these swap agreements.
We actively manage currency exposures that are associated with net monetary asset positions, currency purchases and sales commitments denominated in foreign currencies and foreign currency denominated assets and liabilities created in the normal course of business. We enter into forward sales and purchase contracts to manage currency risk to offset our net exposures, by currency, related to the foreign currency denominated monetary assets and liabilities of our operations. At December 31, 2021, we had outstanding forward contracts to buy foreign currency with a notional value of $199.0 million and to sell foreign currency with a notional value of $124.4 million. All of the currency derivatives expire within one year and are for U.S. dollar (USD) equivalents. The counterparties to the forward contracts are large financial institutions; however, the risk of loss to us in the event of nonperformance by a counterparty could impact our financial position or results of operations. At December 31, 2020, we had outstanding forward contracts to buy foreign currency with a notional value of $169.9 million and to sell foreign currency with a notional value of $113.6 million.
Our foreign currency forward contracts and certain commodity derivatives did not meet the criteria to qualify for hedge accounting. The effect on operating results of items not qualifying for hedge accounting was a (loss) gain of $(22.0) million, $17.7 million and $(4.0) million in 2021, 2020 and 2019, respectively.
46
The fair value of our derivative asset and liability balances were:
| December 31, | |||||||||||
| 2021 | 2020 | ||||||||||
| ($ in millions) | |||||||||||
| Other current assets | $ | 26.8 | $ | 24.2 | |||||||
| Other assets | 7.9 | 7.2 | |||||||||
| Total derivative asset | $ | 34.7 | $ | 31.4 | |||||||
| Accrued liabilities | $ | 3.5 | $ | 0.1 | |||||||
| Other liabilities | 0.3 | 0.6 | |||||||||
| Total derivative liability | $ | 3.8 | $ | 0.7 | |||||||
Item 7A. QUANTITATIVE AND QUALITATIVE DISCLOSURES ABOUT MARKET RISK
We are exposed to market risk in the normal course of our business operations due to our purchases of certain commodities, our ongoing investing and financing activities and our operations that use foreign currencies. The risk of loss can be assessed from the perspective of adverse changes in fair values, cash flows and future earnings. We have established policies and procedures governing our management of market risks and the use of financial instruments to manage exposure to such risks.
Energy costs, including electricity and natural gas, and certain raw materials used in our production processes are subject to price volatility. Depending on market conditions, we may enter into futures contracts, forward contracts, commodity swaps and put and call option contracts in order to reduce the impact of commodity price fluctuations. As of December 31, 2021, we maintained open positions on commodity contracts with a notional value totaling $224.3 million ($214.1 million at December 31, 2020). Assuming a hypothetical 10% increase in commodity prices, which are currently hedged, as of December 31, 2021, we would experience a $22.4 million ($21.4 million at December 31, 2020) increase in our cost of inventory purchased, which would be substantially offset by a corresponding increase in the value of related hedging instruments.
We transact business in various foreign currencies other than the USD which exposes us to movements in exchange rates which may impact revenue and expenses, assets and liabilities and cash flows. Our significant foreign currency exposure is denominated with European currencies, primarily the Euro, although exposures also exist in other currencies of Asia Pacific, Latin America, Middle East and Africa. For all derivative positions, we evaluated the effects of a 10% shift in exchange rates between those currencies and the USD, holding all other assumptions constant. Unfavorable currency movements of 10% would negatively affect the fair values of the derivatives held to hedge currency exposures by $32.3 million. These unfavorable changes would generally have been offset by favorable changes in the values of the underlying exposures.
We are exposed to changes in interest rates primarily as a result of our investing and financing activities. Our current debt structure is used to fund business operations, and commitments from banks under our Senior Revolving Credit Facility, Receivables Financing Agreement and AR Facilities are sources of liquidity. As of December 31, 2021, we had long-term borrowings, including current installments of long-term debt and finance lease obligations, of $2,779.3 million ($3,863.8 million at December 31, 2020) of which $805.9 million ($155.9 million at December 31, 2020) was issued at variable rates. Included within long-term borrowings on the consolidated balance sheets were deferred debt issuance costs and unamortized bond original issue discount.
Assuming no changes in the $805.9 million of variable-rate debt levels from December 31, 2021, we estimate that a hypothetical change of 100-basis points in the LIBOR interest rates from 2021 would impact annual interest expense by $8.1 million.
If the actual changes in commodities, foreign currency or interest pricing is substantially different than expected, the net impact of commodity risk, foreign currency risk or interest rate risk on our cash flow may be materially different than that disclosed above.
We do not enter into any derivative financial instruments for speculative purposes.
47
CAUTIONARY STATEMENT ABOUT FORWARD-LOOKING STATEMENTS
This report includes forward-looking statements. These statements relate to analyses and other information that are based on management’s beliefs, certain assumptions made by management, forecasts of future results and current expectations, estimates and projections about the markets and economy in which we and our various segments operate. The statements contained in this report that are not statements of historical fact may include forward-looking statements that involve a number of risks and uncertainties.
We have used the words “anticipate,” “intend,” “may,” “expect,” “believe,” “outlook,” “should,” “plan,” “project,” “estimate,” “forecast,” “optimistic,” “target,” and variations of such words and similar expressions in this annual report to identify such forward-looking statements. These statements are not guarantees of future performance and involve certain risks, uncertainties and assumptions, which are difficult to predict and many of which are beyond our control. Therefore, actual outcomes and results may differ materially from those matters expressed or implied in such forward-looking statements. We undertake no obligation to update publicly any forward-looking statements, whether as a result of future events, new information or otherwise. The payment of cash dividends is subject to the discretion of our board of directors and will be determined in light of then-current conditions, including our earnings, our operations, our financial conditions, our capital requirements and other factors deemed relevant by our board of directors. In the future, our board of directors may change our dividend policy, including the frequency or amount of any dividend, in light of then-existing conditions.
The risks, uncertainties and assumptions involved in our forward-looking statements include those discussed under Item 1A—“Risk Factors.” You should consider all of our forward-looking statements in light of these factors. In addition, other risks and uncertainties not presently known to us or that we consider immaterial could affect the accuracy of our forward-looking statements.
48
Item 8. CONSOLIDATED FINANCIAL STATEMENTS AND SUPPLEMENTARY DATA
MANAGEMENT REPORT ON INTERNAL CONTROL OVER FINANCIAL REPORTING
The management of Olin Corporation is responsible for establishing and maintaining adequate internal control over financial reporting. Olin’s internal control system was designed to provide reasonable assurance to the company’s management and board of directors regarding the preparation and fair presentation of published financial statements.
All internal control systems, no matter how well designed, have inherent limitations. Therefore, even those systems determined to be effective can provide only reasonable assurance with respect to financial statement preparation and presentation, and may not prevent or detect all misstatements.
The management of Olin Corporation has assessed the effectiveness of the company’s internal control over financial reporting as of December 31, 2021. In making this assessment, we used the criteria set forth by the Committee of Sponsoring Organizations of the Treadway Commission (COSO) in Internal Control - Integrated Framework (2013) to guide our analysis and assessment. Based on our assessment as of December 31, 2021, the company’s internal control over financial reporting was effective based on those criteria.
Our independent registered public accountants, KPMG LLP, have audited and issued a report on our internal control over financial reporting, which appears in this Form 10-K.
/s/ Scott Sutton
Chairman, President and Chief Executive Officer
/s/ Todd A. Slater
Vice President and Chief Financial Officer
49
REPORT OF INDEPENDENT REGISTERED PUBLIC ACCOUNTING FIRM
To the Shareholders and Board of Directors
Olin Corporation:
Opinions on the Consolidated Financial Statements and Internal Control Over Financial Reporting
We have audited the accompanying consolidated balance sheets of Olin Corporation and subsidiaries (the Company) as of December 31, 2021 and 2020, the related consolidated statements of operations, comprehensive income (loss), shareholders’ equity, and cash flows for each of the years in the three-year period ended December 31, 2021, and the related notes (collectively, the consolidated financial statements). We also have audited the Company’s internal control over financial reporting as of December 31, 2021, based on criteria established in Internal Control - Integrated Framework (2013) issued by the Committee of Sponsoring Organizations of the Treadway Commission.
In our opinion, the consolidated financial statements referred to above present fairly, in all material respects, the financial position of the Company as of December 31, 2021 and 2020, and the results of its operations and its cash flows for each of the years in the three-year period ended December 31, 2021, in conformity with U.S. generally accepted accounting principles. Also in our opinion, the Company maintained, in all material respects, effective internal control over financial reporting as of December 31, 2021 based on criteria established in Internal Control - Integrated Framework (2013) issued by the Committee of Sponsoring Organizations of the Treadway Commission.
Basis for Opinions
The Company’s management is responsible for these consolidated financial statements, for maintaining effective internal control over financial reporting, and for its assessment of the effectiveness of internal control over financial reporting, included in the accompanying Management Report on Internal Control Over Financial Reporting. Our responsibility is to express an opinion on the Company’s consolidated financial statements and an opinion on the Company’s internal control over financial reporting based on our audits. We are a public accounting firm registered with the Public Company Accounting Oversight Board (United States) (PCAOB) and are required to be independent with respect to the Company in accordance with the U.S. federal securities laws and the applicable rules and regulations of the Securities and Exchange Commission and the PCAOB.
We conducted our audits in accordance with the standards of the PCAOB. Those standards require that we plan and perform the audits to obtain reasonable assurance about whether the consolidated financial statements are free of material misstatement, whether due to error or fraud, and whether effective internal control over financial reporting was maintained in all material respects.
Our audits of the consolidated financial statements included performing procedures to assess the risks of material misstatement of the consolidated financial statements, whether due to error or fraud, and performing procedures that respond to those risks. Such procedures included examining, on a test basis, evidence regarding the amounts and disclosures in the consolidated financial statements. Our audits also included evaluating the accounting principles used and significant estimates made by management, as well as evaluating the overall presentation of the consolidated financial statements. Our audit of internal control over financial reporting included obtaining an understanding of internal control over financial reporting, assessing the risk that a material weakness exists, and testing and evaluating the design and operating effectiveness of internal control based on the assessed risk. Our audits also included performing such other procedures as we considered necessary in the circumstances. We believe that our audits provide a reasonable basis for our opinions.
Definition and Limitations of Internal Control Over Financial Reporting
A company’s internal control over financial reporting is a process designed to provide reasonable assurance regarding the reliability of financial reporting and the preparation of financial statements for external purposes in accordance with generally accepted accounting principles. A company’s internal control over financial reporting includes those policies and procedures that (1) pertain to the maintenance of records that, in reasonable detail, accurately and fairly reflect the transactions and dispositions of the assets of the company; (2) provide reasonable assurance that transactions are recorded as necessary to permit preparation of financial statements in accordance with generally accepted accounting principles, and that receipts and expenditures of the company are being made only in accordance with authorizations of management and directors of the company; and (3) provide reasonable assurance regarding prevention or timely detection of unauthorized acquisition, use, or disposition of the company’s assets that could have a material effect on the financial statements.
50
Because of its inherent limitations, internal control over financial reporting may not prevent or detect misstatements. Also, projections of any evaluation of effectiveness to future periods are subject to the risk that controls may become inadequate because of changes in conditions, or that the degree of compliance with the policies or procedures may deteriorate.
Critical Audit Matter
The critical audit matter communicated below is a matter arising from the current period audit of the consolidated financial statements that was communicated or required to be communicated to the audit committee and that: (1) relates to accounts or disclosures that are material to the consolidated financial statements and (2) involved our especially challenging, subjective, or complex judgments. The communication of a critical audit matter does not alter in any way our opinion on the consolidated financial statements, taken as a whole, and we are not, by communicating the critical audit matter below, providing a separate opinion on the critical audit matter or on the accounts or disclosures to which it relates.
Evaluation of environmental obligations
As discussed in Notes 2 and 20 to the consolidated financial statements, the Company has recorded liabilities for future environmental expenditures of $147.3 million as of December 31, 2021. The Company accrues a liability for environmental matters when it is probable that a liability has been incurred and the amount of the liability can be reasonably estimated based upon current law and existing technologies. The liability is adjusted periodically as assessment and remediation efforts progress or as additional technical or legal information becomes available.
We identified the evaluation of the environmental liabilities as a critical audit matter. This required challenging auditor judgment due to the nature of the estimate and assumptions, including judgments in determining required remediation activities designed to consider future events and uncertainties and the time period over which remediation activities will occur.
The following are the primary procedures that we performed to address this critical audit matter. We evaluated the design and tested the operating effectiveness of certain internal controls over the Company’s process to estimate environmental obligations, including controls related to the monitoring of the liability as compared to remedial activities required by regulatory authorities. We involved an environmental professional with specialized skills and knowledge who assisted in evaluating the Company’s planned remediation activities for certain sites, the time period over which remediation will occur, and changes in the liability and assumptions from those used in the prior period, including comparing the Company’s planned remediation activities to those communicated to regulatory authorities and to those commonly observed in conducting remediation.
/s/ KPMG LLP
We have served as the Company’s auditor since 1954.
St. Louis, Missouri
February 24, 2022
51
CONSOLIDATED BALANCE SHEETS
December 31
(In millions, except per share data)
| Assets | 2021 | 2020 | |||||||||
| Current assets: | |||||||||||
| Cash and cash equivalents | $ | $ | |||||||||
| Receivables, net | |||||||||||
| Income taxes receivable | |||||||||||
| Inventories, net | |||||||||||
| Other current assets | |||||||||||
| Total current assets | |||||||||||
| Property, plant and equipment, net | |||||||||||
| Operating lease assets, net | |||||||||||
| Deferred income taxes | |||||||||||
| Other assets | |||||||||||
| Intangible assets, net | |||||||||||
| Goodwill | |||||||||||
| Total assets | $ | $ | |||||||||
| Liabilities and Shareholders’ Equity | |||||||||||
| Current liabilities: | |||||||||||
| Current installments of long-term debt | $ | $ | |||||||||
| Accounts payable | |||||||||||
| Income taxes payable | |||||||||||
| Current operating lease liabilities | |||||||||||
| Accrued liabilities | |||||||||||
| Total current liabilities | |||||||||||
| Long-term debt | |||||||||||
| Operating lease liabilities | |||||||||||
| Accrued pension liability | |||||||||||
| Deferred income taxes | |||||||||||
| Other liabilities | |||||||||||
| Total liabilities | |||||||||||
| Commitments and contingencies | |||||||||||
| Shareholders’ equity: | |||||||||||
| Common stock, $1.00 par value per share: | |||||||||||
| Authorized, 240.0 shares; issued and outstanding, 156.8 and 158.0 shares | |||||||||||
| Additional paid-in capital | |||||||||||
| Accumulated other comprehensive loss | ( | ( | |||||||||
| Retained earnings (accumulated deficit) | ( | ||||||||||
| Total shareholders’ equity | |||||||||||
| Total liabilities and shareholders’ equity | $ | $ | |||||||||
The accompanying notes to consolidated financial statements are an integral part of the consolidated financial statements.
52
CONSOLIDATED STATEMENTS OF OPERATIONS
Years ended December 31
(In millions, except per share data)
| 2021 | 2020 | 2019 | |||||||||||||||
| Sales | $ | $ | $ | ||||||||||||||
| Operating expenses: | |||||||||||||||||
| Cost of goods sold | |||||||||||||||||
| Selling and administration | |||||||||||||||||
| Restructuring charges | |||||||||||||||||
| Goodwill impairment | |||||||||||||||||
| Other operating income | |||||||||||||||||
| Operating income (loss) | ( | ||||||||||||||||
| Interest expense | |||||||||||||||||
| Interest income | |||||||||||||||||
| Non-operating pension income | |||||||||||||||||
| Other income | |||||||||||||||||
| Income (loss) before taxes | ( | ( | |||||||||||||||
| Income tax provision (benefit) | ( | ( | |||||||||||||||
| Net income (loss) | $ | $ | ( | $ | ( | ||||||||||||
| Net income (loss) per common share: | |||||||||||||||||
| Basic | $ | $ | ( | $ | ( | ||||||||||||
| Diluted | $ | $ | ( | $ | ( | ||||||||||||
| Average common shares outstanding: | |||||||||||||||||
| Basic | |||||||||||||||||
| Diluted | |||||||||||||||||
The accompanying notes to consolidated financial statements are an integral part of the consolidated financial statements.
53
CONSOLIDATED STATEMENTS OF COMPREHENSIVE INCOME (LOSS)
Years ended December 31
(In millions)
| 2021 | 2020 | 2019 | |||||||||||||||
| Net income (loss) | $ | $ | ( | $ | ( | ||||||||||||
| Other comprehensive income (loss), net of tax: | |||||||||||||||||
| Foreign currency translation adjustments, net | ( | ( | |||||||||||||||
| Unrealized gains (losses) on derivative contracts, net | ( | ||||||||||||||||
| Pension and postretirement liability adjustments, net | ( | ||||||||||||||||
| Amortization of prior service costs and actuarial losses, net | |||||||||||||||||
| Total other comprehensive income (loss), net of tax | ( | ||||||||||||||||
| Comprehensive income (loss) | $ | $ | ( | $ | ( | ||||||||||||
The accompanying notes to consolidated financial statements are an integral part of the consolidated financial statements.
54
CONSOLIDATED STATEMENTS OF SHAREHOLDERS’ EQUITY
Years ended December 31
(In millions, except per share data)
| 2021 | 2020 | 2019 | |||||||||||||||
| Common Stock | |||||||||||||||||
| Balance at beginning of year | $ | $ | $ | ||||||||||||||
| Common stock repurchased and retired | ( | ( | |||||||||||||||
| Common stock issued for: | |||||||||||||||||
| Stock options exercised | |||||||||||||||||
| Other transactions | |||||||||||||||||
| Balance at end of year | $ | $ | $ | ||||||||||||||
| Additional Paid-In Capital | |||||||||||||||||
| Balance at beginning of year | $ | $ | $ | ||||||||||||||
| Common stock repurchased and retired | ( | ( | |||||||||||||||
| Common stock issued for: | |||||||||||||||||
| Stock options exercised | |||||||||||||||||
| Other transactions | |||||||||||||||||
| Stock-based compensation | |||||||||||||||||
| Balance at end of year | $ | $ | $ | ||||||||||||||
| Accumulated Other Comprehensive Loss | |||||||||||||||||
| Balance at beginning of year | $ | ( | $ | ( | $ | ( | |||||||||||
| Other comprehensive income (loss) | ( | ||||||||||||||||
| Balance at end of year | $ | ( | $ | ( | $ | ( | |||||||||||
| Retained Earnings (Accumulated Deficit) | |||||||||||||||||
| Balance at beginning of year | $ | ( | $ | $ | |||||||||||||
| Lease accounting adoption adjustment | |||||||||||||||||
| Net income (loss) | ( | ( | |||||||||||||||
| Common stock dividends paid | ( | ( | ( | ||||||||||||||
| Balance at end of year | $ | $ | ( | $ | |||||||||||||
| Total Shareholders’ Equity | $ | $ | $ | ||||||||||||||
| Dividends declared per share of common stock | $ | $ | $ | ||||||||||||||
The accompanying notes to consolidated financial statements are an integral part of the consolidated financial statements.
55
CONSOLIDATED STATEMENTS OF CASH FLOWS
Years ended December 31
(In millions)
| 2021 | 2020 | 2019 | |||||||||||||||
| Operating Activities | |||||||||||||||||
| Net income (loss) | $ | $ | ( | $ | ( | ||||||||||||
| Adjustments to reconcile net income (loss) to net cash and cash equivalents provided by (used for) operating activities: | |||||||||||||||||
| Goodwill impairment | |||||||||||||||||
| Gain on disposition of non-consolidated affiliate | ( | ||||||||||||||||
| Gains on disposition of property, plant and equipment | ( | ||||||||||||||||
| Stock-based compensation | |||||||||||||||||
| Loss on debt extinguishment | |||||||||||||||||
| Depreciation and amortization | |||||||||||||||||
| Deferred income taxes | ( | ( | ( | ||||||||||||||
| Write-off of equipment and facility included in restructuring charges | |||||||||||||||||
| Qualified pension plan contributions | ( | ( | ( | ||||||||||||||
| Qualified pension plan income | ( | ( | ( | ||||||||||||||
| Change in assets and liabilities: | |||||||||||||||||
| Receivables | ( | ( | |||||||||||||||
| Income taxes receivable/payable | ( | ( | |||||||||||||||
| Inventories | ( | ||||||||||||||||
| Other current assets | ( | ( | |||||||||||||||
| Accounts payable and accrued liabilities | ( | ||||||||||||||||
| Other assets | ( | ( | ( | ||||||||||||||
| Other noncurrent liabilities | |||||||||||||||||
| Other operating activities | |||||||||||||||||
| Net operating activities | |||||||||||||||||
| Investing Activities | |||||||||||||||||
| Capital expenditures | ( | ( | ( | ||||||||||||||
| Payments under ethylene long-term supply contracts | ( | ||||||||||||||||
| Payments under other long-term supply contracts | ( | ||||||||||||||||
| Proceeds from disposition of property, plant and equipment | |||||||||||||||||
| Proceeds from disposition of non-consolidated affiliate | |||||||||||||||||
| Net investing activities | ( | ( | ( | ||||||||||||||
| Financing Activities | |||||||||||||||||
| Long-term debt: | |||||||||||||||||
| Borrowings | |||||||||||||||||
| Repayments | ( | ( | ( | ||||||||||||||
| Debt early redemption premiums | ( | ( | |||||||||||||||
| Common stock repurchased and retired | ( | ( | |||||||||||||||
| Stock options exercised | |||||||||||||||||
| Dividends paid | ( | ( | ( | ||||||||||||||
| Debt issuance costs | ( | ( | ( | ||||||||||||||
| Net financing activities | ( | ( | |||||||||||||||
| Effect of exchange rate changes on cash and cash equivalents | ( | ( | |||||||||||||||
| Net (decrease) increase in cash and cash equivalents | ( | ( | |||||||||||||||
| Cash and cash equivalents, beginning of year | |||||||||||||||||
| Cash and cash equivalents, end of year | $ | $ | $ | ||||||||||||||
| Cash paid (received) for interest and income taxes: | |||||||||||||||||
| Interest, net | $ | $ | $ | ||||||||||||||
| Income taxes, net of refunds | $ | $ | ( | $ | |||||||||||||
The accompanying notes to consolidated financial statements are an integral part of the consolidated financial statements.
56
NOTES TO CONSOLIDATED FINANCIAL STATEMENTS
NOTE 2. ACCOUNTING POLICIES
The preparation of the consolidated financial statements requires estimates and assumptions that affect amounts reported and disclosed in the financial statements and related notes. Actual results could differ from those estimates.
Basis of Presentation
The consolidated financial statements include the accounts of Olin and all majority-owned subsidiaries. Investment in our affiliates are accounted for on the equity method. Accordingly, we include only our share of earnings or losses of these affiliates in consolidated net income (loss). Certain reclassifications were made to prior year amounts to conform to the 2021 presentation.
Revenue Recognition
We derive our revenues primarily from the manufacturing and delivery of goods to customers. Revenues are recognized on sales of goods at the time when control of those goods is transferred to our customers at an amount that reflects the consideration to which we expect to be entitled in exchange for those goods. We primarily sell our goods directly to customers, and to a lesser extent, through distributors. Payment terms are typically 30 to 90 days from date of invoice. Our contracts do not typically have a significant financing component. Right to payment is determined at the point in time in which control has transferred to the customer.
A performance obligation is a promise in a contract to transfer a distinct good to the customer. At contract inception, we assess the goods promised in our contracts with customers and identify a performance obligation for each promise to transfer to the customer a good (or bundle of goods) that is distinct. A contract’s transaction price is based on the price stated in the contract and allocated to each distinct performance obligation and revenue is recognized when the performance obligation is satisfied. Substantially all of our contracts have a single distinct performance obligation or multiple performance obligations which are distinct and represent individual promises within the contract. Substantially all of our performance obligations are satisfied at a single point in time, when control is transferred, which is generally upon shipment or delivery as stated in the contract terms.
All taxes assessed by governmental authorities that are both imposed on and concurrent with our revenue-producing transactions and collected from our customers are excluded from the measurement of the transaction price. Shipping and handling fees billed to customers are included in revenue and are considered activities to fulfill the promise to transfer the good. Allowances for estimated returns, discounts and rebates are considered variable consideration, which may be constrained, and are estimated and recognized when sales are recorded. The estimates are based on various market data, historical trends and information from customers. Actual returns, discounts and rebates have not been materially different from estimates. For all contracts that have a duration of one year or less at contract inception, we do not adjust the promised amount of consideration for the effects of a significant financing component.
Substantially all of our revenue is derived from contracts with an original expected length of time of one year or less and for which we recognize revenue for the amount in which we have the right to invoice at the point in time in which control has transferred to the customer. However, a portion of our revenue is derived from long-term contracts which have contract periods that vary between one to multi-year. Certain of these contracts represent contracts with minimum purchase obligations, which
57
Cost of Goods Sold and Selling and Administration Expenses
Cost of goods sold includes the costs of inventory sold, related purchasing, distribution and warehousing costs, costs incurred for shipping and handling, depreciation and amortization expense related to these activities and environmental remediation costs and recoveries. Selling and administration expenses include personnel costs associated with sales, marketing and administration, research and development, legal and legal-related costs, consulting and professional services fees, advertising expenses, depreciation expense related to these activities, foreign currency translation and other similar costs.
Foreign Currency Translation
Our worldwide operations utilize the U.S. dollar (USD) or local currency as the functional currency, where applicable. For foreign entities where the USD is the functional currency, gains and losses resulting from balance sheet translations are included in selling and administration. For foreign entities where the local currency is the functional currency, assets and liabilities denominated in local currencies are translated into USD at end-of-period exchange rates and the resultant translation adjustments are included in accumulated other comprehensive loss. Assets and liabilities denominated in other than the local currency are remeasured into the local currency prior to translation into USD and the resultant exchange gains or losses are included in income in the period in which they occur. Income and expenses are translated into USD using an approximation of the average rate prevailing during the period. We change the functional currency of our separate and distinct foreign entities only when significant changes in economic facts and circumstances indicate clearly that the functional currency has changed.
Cash and Cash Equivalents
All highly liquid investments, with a maturity of three months or less at the date of purchase, are considered to be cash equivalents.
58
Allowance for Doubtful Accounts Receivable
We evaluate the collectibility of financial instruments based on our current estimate of credit losses expected to be incurred over the life of the financial instrument. The only significant financial instrument which creates exposure to credit losses are customer accounts receivables. We measure credit losses on uncollected accounts receivable through an allowance for doubtful accounts receivable which is based on a combination of factors including both historical collection experience and reasonable estimates that affect the expected collectibility of the receivable. These factors include historical bad debt experience, industry conditions of the customer or group of customers, geographical region, credit ratings and general market conditions. We group receivables together for purposes of estimating credit losses when customers have similar risk characteristics; otherwise, the estimation is performed on the individual receivable.
This estimate is periodically adjusted when we become aware of a specific customer’s inability to meet its financial obligations (e.g., bankruptcy filing) or as a result of changes in the overall aging of accounts receivable. While we have a large number of customers that operate in diverse businesses and are geographically dispersed, a general economic downturn in any of the industry segments in which we operate could result in higher than expected defaults, and, therefore, the need to revise estimates for the provision for doubtful accounts could occur.
Inventories
Inventories are valued at the lower of cost and net realizable value. For U.S. inventories, inventory costs are determined principally by the last-in, first-out (LIFO) method of inventory accounting while for international inventories, inventory costs are determined principally by the first-in, first-out (FIFO) method of inventory accounting. Costs for other inventories have been determined principally by the average-cost method (primarily operating supplies, spare parts and maintenance parts). Elements of costs in inventories include raw materials, direct labor and manufacturing overhead.
Property, Plant and Equipment
Property, plant and equipment are recorded at cost. Depreciation is computed on a straight-line basis over the estimated useful lives of the related assets. Interest costs incurred to finance expenditures for major long-term construction projects are capitalized as part of the historical cost and included in property, plant and equipment and are depreciated over the useful lives of the related assets. Leasehold improvements are amortized over the term of the lease or the estimated useful life of the improvement, whichever is shorter. Start-up costs are expensed as incurred. Expenditures for maintenance and repairs are charged to expense when incurred while the costs of significant improvements, which extend the useful life of the underlying asset, are capitalized.
Property, plant and equipment are reviewed for impairment when conditions indicate that the carrying values of the assets may not be recoverable. Such impairment conditions include an extended period of idleness or a plan of disposal. If such impairment indicators are present or other factors exist that indicate that the carrying amount of an asset may not be recoverable, we determine whether impairment has occurred through the use of an undiscounted cash flow analysis at the lowest level for which identifiable cash flows exist. For our Chlor Alkali Products and Vinyls, Epoxy and Winchester segments, the lowest level for which identifiable cash flows exist is the operating facility level or an appropriate grouping of operating facilities level. The amount of impairment loss, if any, is measured by the difference between the net book value of the assets and the estimated fair value of the related assets.
Leases
In February 2016, the Financial Accounting Standards Board (FASB) issued Accounting Standards Update (ASU) 2016-02 “Leases,” (ASU 2016-02) which supersedes Accounting Standards Codification (ASC) 840 “Leases” and creates a new topic, ASC 842 “Leases” (ASC 842). Subsequent to the issuance of ASU 2016-02, ASC 842 was amended by various
59
updates that amend and clarify the impact and implementation of the aforementioned update. We adopted these updates on January 1, 2019 using the optional transition method, which requires application of these updates beginning on the date of adoption with the cumulative effect of initially applying these updates recognized at the date of initial adoption. In addition, we elected the following practical expedients:
•We elected the package of practical expedients permitted under the transition guidance within the new standard, which among other things, allowed us to carry forward the historical lease classification.
•We elected the practical expedient related to land easements, allowing us to carry forward our accounting treatment for land easements on existing agreements.
•We elected the short-term practical expedient for all classes of lease assets, which allows us to not record leases with an initial term of 12 months or less on the balance sheet, and instead recognize the expense straight-line over the lease term.
•We elected the practical expedient to not separate lease components from non-lease components for all asset classes.
Adoption of these updates resulted in the recording of operating lease assets and lease liabilities on our consolidated balance sheet of $291.9 million as of January 1, 2019. Our assets and liabilities for finance leases remained unchanged. We also recognized the cumulative effect of applying these updates as an adjustment to retained earnings of $11.2 million, net of tax, which was primarily related to the recognition of previously deferred sale/leaseback gains. Our consolidated statements of operations and cash flows, along with our compliance with all covenants and restrictions under all our outstanding credit agreements, were not impacted by this adoption.
We determine if an arrangement is a lease at inception of the contract. Operating lease assets represent our right to use an underlying asset for the lease term and lease liabilities represent our obligation to make lease payments arising from the lease. Operating lease assets and liabilities are recognized at commencement date based on the present value of fixed lease payments over the lease term. Our lease commitments are primarily for railcars, but also include logistics, manufacturing, storage, real estate and information technology assets. Leases with an initial term of 12 months or less are not recorded on the balance sheet; instead, we recognize lease expense for these leases on a straight-line basis over the lease term. We do not account for lease components (e.g., fixed payments to use the underlying lease asset) separately from the non-lease components (e.g., fixed payments for common-area maintenance costs and other items that transfer a good or service). Some of our leases include variable lease payments, which primarily result from changes in consumer price and other market-based indices, which are generally updated annually, and maintenance and usage charges. These variable payments are excluded from the calculation of our lease assets and liabilities.
Most leases include one or more options to renew, with renewal terms that can extend the lease term from one to many years. The exercise of lease renewal options is typically at our sole discretion. Certain leases also include options to purchase the leased asset. We do not include options to renew or purchase leased assets in the measurement of lease liabilities unless those options are highly certain of exercise. The depreciable life of assets and leasehold improvements are limited by the expected lease term, unless there is a transfer of title or purchase option reasonably certain of exercise. We have operating leases with terms that require us to guarantee a portion of the residual value of the leased assets upon termination of the lease as well as other guarantees. These residual value guarantees consist primarily of leases for railcars. Residual value guarantee payments that become probable and estimable are accrued as part of the lease liability and recognized over the remaining life of the applicable lease. Our current expectation is that the likelihood of material residual guarantee payments is remote. We utilize the interest rate implicit in the lease to determine the lease liability when the interest rate can be determined. As most of our leases do not provide an implicit rate, we use our incremental borrowing rate based on the information available at the lease commencement date in determining the present value of lease payments. We estimate the incremental borrowing rate based on the geographic region for which we would borrow, on a secured basis of the lease asset, at an amount equal to the lease payments over a similar time period as the lease term. We have no additional restrictions or covenants imposed by our lease contracts.
Asset Retirement Obligations
We record the fair value of an asset retirement obligation associated with the retirement of a tangible long-lived asset as a liability in the period incurred. The liability is measured at discounted fair value and is adjusted to its present value in subsequent periods as accretion expense is recorded. The corresponding asset retirement costs are capitalized as part of the carrying amount of the related long-lived asset and depreciated over the asset’s useful life. Asset retirement obligations are reviewed annually in the fourth quarter and/or when circumstances or other events indicate that changes underlying retirement assumptions may have occurred.
60
The activities of our asset retirement obligations were as follows:
| December 31, | |||||||||||
| 2021 | 2020 | ||||||||||
| ($ in millions) | |||||||||||
| Beginning balance | $ | $ | |||||||||
| Accretion | |||||||||||
| Spending | ( | ( | |||||||||
| Foreign currency translation adjustments | |||||||||||
| Adjustments | |||||||||||
| Ending balance | $ | $ | |||||||||
At December 31, 2021 and 2020, our consolidated balance sheets included an asset retirement obligation of $56.8 million and $47.0 million, respectively, which were classified as other noncurrent liabilities.
In 2021 and 2020, we had net adjustments that increased the asset retirement obligation by $10.1 million and $1.9 million, respectively, which were primarily comprised of increases in estimated costs for certain assets.
Goodwill
Goodwill is not amortized, but is reviewed for impairment annually in the fourth quarter and/or when circumstances or other events indicate that impairment may have occurred. ASC 350 “Intangibles—Goodwill and Other” (ASC 350) permits entities to make a qualitative assessment of whether it is more likely than not that a reporting unit’s fair value is less than its carrying amount before applying the goodwill impairment test. Circumstances that are considered as part of the qualitative assessment and could trigger a quantitative impairment test include, but are not limited to: a significant adverse change in the business climate; a significant adverse legal judgment; adverse cash flow trends; an adverse action or assessment by a government agency; unanticipated competition; sustained decline in our stock price; and a significant restructuring charge within a reporting unit. We define reporting units at the business segment level or one level below the business segment level. For purposes of testing goodwill for impairment, goodwill has been allocated to our reporting units to the extent it relates to each reporting unit.
It is our practice, at a minimum, to perform a quantitative goodwill impairment test in the fourth quarter every three years. We use a discounted cash flow approach to develop the estimated fair value of a reporting unit when a quantitative test is performed. Management judgment is required in developing the assumptions for the discounted cash flow model. We also corroborate our discounted cash flow analysis by evaluating a market-based approach that considers earnings before interest, taxes, depreciation and amortization (EBITDA) multiples from a representative sample of comparable public companies. As a further indicator that each reporting unit has been valued appropriately using a discounted cash flow model, the aggregate fair value of all reporting units is reconciled to the total market value of Olin. An impairment would be recorded if the carrying amount of a reporting unit exceeded the estimated fair value. See Note 10 “Goodwill and Intangible Assets” for additional information.
Intangible Assets
In conjunction with our acquisitions, we have obtained access to the customer contracts and relationships, trade names, acquired technology and other intellectual property of the acquired companies. These relationships are expected to provide economic benefit for future periods. Amortization expense is recognized on a straight-line basis over the estimated lives of the related assets. The amortization period of customer contracts and relationships, trade names, acquired technology and other intellectual property represents our best estimate of the expected usage or consumption of the economic benefits of the acquired assets, which is based on the company’s historical experience.
61
Environmental Liabilities and Expenditures
Accruals (charges to income) for environmental matters are recorded when it is probable that a liability has been incurred and the amount of the liability can be reasonably estimated, based upon current law and existing technologies. These amounts, which are not discounted and are exclusive of claims against third parties, are adjusted periodically as assessment and remediation efforts progress or additional technical or legal information becomes available. Environmental costs are capitalized if the costs increase the value of the property and/or mitigate or prevent contamination from future operations.
Income Taxes
Deferred taxes are provided for differences between the financial statement and tax basis of assets and liabilities using enacted tax rates in effect for the year in which the differences are expected to reverse. A valuation allowance is provided to offset deferred tax assets if, based on the available evidence, it is more likely than not that some or all of the value of the deferred tax assets will not be realized.
Derivative Financial Instruments
We are exposed to market risk in the normal course of our business operations due to our purchases of certain commodities, our ongoing investing and financing activities and our operations that use foreign currencies. The risk of loss can be assessed from the perspective of adverse changes in fair values, cash flows and future earnings. We have established policies and procedures governing our management of market risks and the use of financial instruments to manage exposure to such risks. We use hedge accounting treatment for a significant amount of our business transactions whose risks are covered using derivative instruments. The hedge accounting treatment provides for the deferral of gains or losses on derivative instruments until such time as the related transactions occur.
Concentration of Credit Risk
Accounts receivable is the principal financial instrument which subjects us to a concentration of credit risk. Credit is extended based upon the evaluation of a customer’s financial condition and, generally, collateral is not required. Concentrations of credit risk with respect to receivables are somewhat limited due to our large number of customers, the diversity of these customers’ businesses and the geographic dispersion of such customers. Our accounts receivable are predominantly derived from sales denominated in USD or the Euro. We maintain an allowance for doubtful accounts based upon the expected collectibility of all trade receivables.
Fair Value
Fair value is defined as the price at which an asset could be exchanged in a current transaction between knowledgeable, willing parties or the amount that would be paid to transfer a liability to a new obligor, not the amount that would be paid to settle the liability with the creditor. Where available, fair value is based on observable market prices or parameters or derived from such prices or parameters. Where observable prices or inputs are not available, valuation models are applied. These valuation techniques involve some level of management estimation and judgment, the degree of which is dependent on the price transparency for the instruments or market and the instruments’ complexity.
62
Assets and liabilities recorded at fair value in the consolidated balance sheets are categorized based upon the level of judgment associated with the inputs used to measure their fair value. Hierarchical levels, defined by ASC 820 “Fair Value Measurement” (ASC 820), and directly related to the amount of subjectivity associated with the inputs to fair valuation of these assets and liabilities, are as follows:
Level 1 — Inputs were unadjusted, quoted prices in active markets for identical assets or liabilities at the measurement date.
Level 2 — Inputs (other than quoted prices included in Level 1) were either directly or indirectly observable for the asset or liability through correlation with market data at the measurement date and for the duration of the instrument’s anticipated life.
Level 3 — Inputs reflected management’s best estimate of what market participants would use in pricing the asset or liability at the measurement date. Consideration was given to the risk inherent in the valuation technique and the risk inherent in the inputs to the model.
Retirement-Related Benefits
We account for our defined benefit pension plans and non-pension postretirement benefit plans using actuarial models required by ASC 715 “Compensation—Retirement Benefits” (ASC 715). These models use an attribution approach that generally spreads the financial impact of changes to the plan and actuarial assumptions over the average remaining service lives of the employees in the plan. Changes in liability due to changes in actuarial assumptions such as discount rate, rate of compensation increases and mortality, as well as annual deviations between what was assumed and what was experienced by the plan are treated as actuarial gains or losses. The principle underlying the required attribution approach is that employees render service over their average remaining service lives on a relatively smooth basis and, therefore, the accounting for benefits earned under the pension or non-pension postretirement benefits plans should follow the same relatively smooth pattern. Substantially all domestic defined benefit pension plan participants are no longer accruing benefits; therefore, actuarial gains and losses are amortized based upon the remaining life expectancy of the inactive plan participants. For the years ended December 31, 2021 and 2020, the average remaining life expectancy of the inactive participants in the domestic defined benefit pension plan were 17 years and 18 years, respectively.
One of the key assumptions for the net periodic pension calculation is the expected long-term rate of return on plan assets, used to determine the “market-related value of assets.” The “market-related value of assets” recognizes differences between the plan’s actual return and expected return over a five year period. The required use of an expected long-term rate of return on the market-related value of plan assets may result in recognized pension income that is greater or less than the actual returns of those plan assets in any given year. Over time, however, the expected long-term returns are designed to approximate the actual long-term returns and, therefore, result in a pattern of income and expense recognition that more closely matches the pattern of the services provided by the employees. As differences between actual and expected returns are recognized over five years, they subsequently generate gains and losses that are subject to amortization over the average remaining life expectancy of the inactive plan participants, as described in the preceding paragraph.
We use long-term historical actual return information, the mix of investments that comprise plan assets, and future estimates of long-term investment returns and inflation by reference to external sources to develop the expected long-term rate of return on plan assets as of December 31.
The discount rate assumptions used for pension and non-pension postretirement benefit plan accounting reflect the rates available on high-quality fixed-income debt instruments on December 31 of each year. The rate of compensation increase is based upon our long-term plans for such increases. For retiree medical plan accounting, we review external data and our own historical trends for healthcare costs to determine the healthcare cost trend rates.
63
We measure the cost of employee services received in exchange for an award of equity instruments, such as stock options, performance shares and restricted stock, based on the grant-date fair value of the award. This cost is recognized over the period during which an employee is required to provide service in exchange for the award, the requisite service period (usually the vesting period). An initial measurement is made of the cost of employee services received in exchange for an award of liability instruments based on its current fair value and the value of that award is subsequently remeasured at each reporting date through the settlement date. Changes in fair value of liability awards during the requisite service period are recognized as compensation cost over that period.
The fair value of each option granted, which typically vests ratably over three years , but not less than one year , was estimated on the date of grant, using the Black-Scholes option-pricing model with the following assumptions:
| 2021 | 2020 | 2019 | |||||||||||||||
| Dividend yield | % | % | % | ||||||||||||||
| Risk-free interest rate | % | % | % | ||||||||||||||
| Expected volatility | % | % | % | ||||||||||||||
| Expected life (years) | |||||||||||||||||
| Weighted-average grant fair value (per option) | $ | $ | $ | ||||||||||||||
| Weighted-average exercise price | $ | $ | $ | ||||||||||||||
| Shares granted | |||||||||||||||||
Dividend yield was based on our current dividend yield as of the option grant date. Risk-free interest rate was based on zero coupon U.S. Treasury securities rates for the expected life of the options. Expected volatility was based on our historical stock price movements, as we believe that historical experience is the best available indicator of the expected volatility. Expected life of the option grant was based on historical exercise and cancellation patterns, as we believe that historical experience is the best estimate for future exercise patterns.
Performance share awards are denominated in shares of our stock and are paid half in cash and half in stock. Payouts for performance share awards are based on two criteria: (1) 50 % of the award is based on Olin’s total shareholder returns (TSR) over the applicable three -year performance cycle in relation to the TSR over the same period among a portfolio of public companies which are selected in concert with outside compensation consultants and (2) 50 % of the award is based on Olin’s net income over the applicable three -year performance cycle in relation to the net income goal for such period as set by the compensation committee of Olin’s board of directors. The expense associated with performance shares is recorded based on our estimate of our performance relative to the respective target. The fair value of each performance stock award based on net income was estimated on the date of grant, using the current stock price. The fair value of each performance stock award based on TSR was estimated on the date of grant, using a Monte Carlo simulation model with the following weighted average assumptions:
| Grant date | 2021 | ||||
| Risk-free interest rate | % | ||||
| Expected volatility of Olin common stock | % | ||||
| Expected average volatility of peer companies | % | ||||
| Average correlation coefficient of peer companies | |||||
| Expected life (years) | |||||
| Grant date fair value (TSR based award) | $ | ||||
| Grant date fair value (net income based award) | $ | ||||
| Awards granted | |||||
Risk-free interest rate was based on zero coupon U.S. Treasury securities rates for the expected life of the performance stock awards. Expected volatility of Olin common stock and peer companies was based on historical stock price movements, as we believe that historical experience is the best available indicator of the expected volatility. The average correlation coefficient of peer companies was determined based on historical trends of Olin’s common stock price compared to the peer companies. Expected life of the performance stock award grant was based on historical exercise and cancellation patterns, as we believe that historical experience is the best estimate of future exercise patterns.
64
NOTE 3. RECENT ACCOUNTING PRONOUNCEMENTS
In March 2020, the FASB issued ASU 2020-04, “Facilitation of the Effects of Reference Rate Reform on Financial Reporting” (ASU 2020-04) which creates a new topic, ASC 848 “Reference Rate Reform” (ASC 848). Subsequent to the issuance of ASU 2020-04, ASC 848 was amended by ASU 2021-01, “Scope” which amended and clarified the application and scope aforementioned update. This update provides optional guidance to ease the potential accounting burden associated with transition away from reference rates that are expected to be discontinued at the end of 2021, at which time financial institutions will no longer be required to report information that is currently used to determine the London Interbank Offered Rate (LIBOR) and other reference rates. This update allows companies to treat contract amendments to existing contracts for the purpose of establishing a new reference rate as continuations of those contracts without additional analysis, as long as the modification was made to establish a new reference rate. This update applies prospectively to contract modifications. The optional guidance was effective on March 12, 2020 and can be adopted beginning January 1, 2020 or any date thereafter until December 31, 2022, at which time the optional guidance can no longer be applied to contract amendments to existing contracts. We adopted the provisions of this update on January 1, 2020 and will apply this guidance prospectively to contract modifications that are entered into for the purpose of establishing a new reference rate. The adoption of this update did not have a material impact on our consolidated financial statements.
NOTE 4. RESTRUCTURING CHARGES
Olin committed to a productivity initiative to align the organization with our new operating model and improve efficiencies (collectively, Productivity Plan). These actions and related activities were completed during the second quarter of 2021. For the year ended December 31, 2021, we recorded pretax restructuring charges of $10.3 million for employee severance and related benefit costs related to these actions. We do not expect to incur additional restructuring charges related to these actions.
May 18, 2021, we announced that we had made the decision to permanently close approximately 20 % of our diaphragm-grade chlor alkali capacity, representing 225,000 tons, at our Plaquemine, LA facility (Plaquemine Plan). The closure was completed in the second quarter of 2021. We do not expect to incur restructuring charges related to these actions.
On March 15, 2021, we announced that we had made the decision to permanently close approximately 50 % of our diaphragm-grade chlor alkali capacity, representing 200,000 tons, at our McIntosh, AL facility. The closure was completed in the first quarter of 2021. On October 21, 2021, we announced that we had made a decision to permanently cease operations of the remaining 50 % of our diaphragm-grade chlor alkali capacity, representing an additional 200,000 tons, at our McIntosh, AL facility (collectively, McIntosh Plan). The closure is expected to be completed by the end of the third quarter of 2022. For the year ended December 31, 2021, we recorded pretax restructuring charges of $5.6 million for lease and other contract termination costs related to these actions. We expect to incur additional restructuring charges through 2026 of approximately $35 million related to these actions.
On January 18, 2021, we announced we had made the decision to permanently close our trichloroethylene and anhydrous hydrogen chloride liquefaction facilities in Freeport, TX (collectively, Freeport 2021 Plan), which were completed in the fourth quarter of 2021. For the year ended December 31, 2021, we recorded pretax restructuring charges of $6.5 million for facility exit costs related to these actions. We expect to incur additional restructuring charges through 2024 of approximately $20 million related to these actions.
65
On December 11, 2019, we announced that we had made the decision to permanently close a chlor alkali plant with a capacity of 230,000 tons and our VDC production facility, both in Freeport, TX (collectively, Freeport 2019 Plan). The VDC facility and related chlor alkali plant were closed during the fourth quarter of 2020 and second quarter of 2021, respectively. For the year ended December 31, 2021, we recorded pretax restructuring charges of $3.9 million for facility exit costs and employee severance and related benefit costs related to these actions. For the year ended December 31, 2020, we recorded pretax restructuring charges of $3.8 million for non-cash impairment of equipment and facilities related to these actions. We expect to incur additional restructuring charges through 2025 of approximately $40 million related to these actions.
On December 10, 2018, we announced that we had made the decision to permanently close the ammunition assembly operations at our Winchester facility in Geelong, Australia. Subsequent to the facility’s closure, products for customers in the region are sourced from Winchester manufacturing facilities located in the United States. For the year ended December 31, 2019, we recorded pretax restructuring charges of $0.4 million for the write-off of equipment and facility costs, employee severance and related benefit costs, lease and other contract termination costs and facility exit costs related to this action. For the year ended December 31, 2019, we also recorded additional pretax restructuring charges of $1.4 million for employee severance and related benefit costs related to our Winchester operations.
On March 21, 2016, we announced that we had made the decision to close a combined total of 433,000 tons of chlor alkali capacity across three separate locations (collectively, Chlor Alkali 2016 Plan). Associated with this action, we have permanently closed our Henderson, NV chlor alkali plant with 153,000 tons of capacity and have reconfigured the site to manufacture bleach and distribute caustic soda and hydrochloric acid. Also, the capacity of our Niagara Falls, NY chlor alkali plant has been reduced from 300,000 tons to 240,000 tons and the chlor alkali capacity at our Freeport, TX facility was reduced by 220,000 tons. This 220,000 ton reduction was entirely from diaphragm cell capacity. For the years ended December 31, 2021, 2020 and 2019, we recorded pretax restructuring charges of $1.6 million, $5.2 million and $15.8 million, respectively, for the lease and other contract termination costs, employee severance and related benefit costs and facility exit costs related to these actions. We expect to incur additional restructuring charges through 2022 of approximately $1 million related to these capacity reductions.
The following table summarizes the 2021, 2020 and 2019 activities by major component of these restructuring actions and the remaining balances of accrued restructuring costs as of December 31, 2021, 2020 and 2019:
| Employee severance and related benefit costs | Lease and other contract termination costs | Facility exit costs | Write-off of equipment and facility | Total | |||||||||||||||||||||||||
| ($ in millions) | |||||||||||||||||||||||||||||
| Balance at January 1, 2019 | $ | $ | $ | $ | $ | ||||||||||||||||||||||||
| Restructuring charges | |||||||||||||||||||||||||||||
| Amounts utilized | ( | ( | ( | ( | ( | ||||||||||||||||||||||||
| Balance at December 31, 2019 | |||||||||||||||||||||||||||||
| Restructuring charges | |||||||||||||||||||||||||||||
| Amounts utilized | ( | ( | ( | ( | |||||||||||||||||||||||||
| Balance at December 31, 2020 | |||||||||||||||||||||||||||||
| Restructuring charges | |||||||||||||||||||||||||||||
| Amounts utilized | ( | ( | ( | ( | |||||||||||||||||||||||||
| Balance at December 31, 2021 | $ | $ | $ | $ | $ | ||||||||||||||||||||||||
66
The following table summarizes the cumulative restructuring charges of these restructuring actions by major component through December 31, 2021:
| Chlor Alkali Products and Vinyls | Corporate/other | Total | |||||||||||||||||||||||||||||||||
| McIntosh Plan | Freeport 2021 Plan | Freeport 2019 Plan | Chlor Alkali 2016 Plan | Productivity Plan | |||||||||||||||||||||||||||||||
| ($ in millions) | |||||||||||||||||||||||||||||||||||
| Write-off of equipment and facility | $ | $ | $ | $ | $ | $ | |||||||||||||||||||||||||||||
| Employee severance and related benefit costs | |||||||||||||||||||||||||||||||||||
| Facility exit costs | |||||||||||||||||||||||||||||||||||
| Employee relocation costs | |||||||||||||||||||||||||||||||||||
| Lease and other contract termination costs | |||||||||||||||||||||||||||||||||||
| Total cumulative restructuring charges | $ | $ | $ | $ | $ | $ | |||||||||||||||||||||||||||||
As of December 31, 2021, we have incurred cash expenditures of $120.9 million and non-cash charges of $138.1 million related to these restructuring actions. The remaining balance of $12.3 million is expected to be paid out through 2028.
NOTE 5. EARNINGS PER SHARE
Basic and diluted net income (loss) per share are computed by dividing net income (loss) by the weighted-average number of common shares outstanding. Diluted net income (loss) per share reflects the dilutive effect of stock-based compensation.
| Years ended December 31, | |||||||||||||||||
| 2021 | 2020 | 2019 | |||||||||||||||
| Computation of Net Income (Loss) per Share | (In millions, except per share data) | ||||||||||||||||
| Net income (loss) | $ | $ | ( | $ | ( | ||||||||||||
| Basic shares | |||||||||||||||||
| Basic net income (loss) per share | $ | $ | ( | $ | ( | ||||||||||||
| Diluted shares: | |||||||||||||||||
| Basic shares | |||||||||||||||||
| Stock-based compensation | |||||||||||||||||
| Diluted shares | |||||||||||||||||
| Diluted net income (loss) per share | $ | $ | ( | $ | ( | ||||||||||||
The computation of dilutive shares from stock-based compensation does not include 0.1 million, 10.0 million and 7.8 million shares in 2021, 2020 and 2019, respectively, as their effect would have been anti-dilutive.
NOTE 6. ACCOUNTS RECEIVABLES
During 2021, we amended our existing $250.0 million Receivables Financing Agreement which expanded the borrowing capacity to $300.0 million (Receivables Financing Agreement) and extended the maturity to September 24, 2024. The Receivables Financing Agreement includes a minimum borrowing requirement of 50 % of the facility limit or available borrowing capacity, whichever is less. The administrative agent for our Receivables Financing Agreement is PNC Bank, National Association. Under the Receivables Financing Agreement, our eligible trade receivables are used for collateralized borrowings and continue to be serviced by us. In addition, the Receivables Financing Agreement incorporates the net leverage ratio covenant that is contained in the $1,615.0 million senior credit facility. As of December 31, 2021 and 2020, we had $300.0 million and $125.0 million, respectively, drawn under the agreement. As of December 31, 2021, $556.2 million of our trade receivables were pledged as collateral and we had no additional borrowing capacity under the Receivables Financing Agreement.
67
Olin also has trade accounts receivable factoring arrangements (AR Facilities) and pursuant to the terms of the AR Facilities, certain of our domestic subsidiaries may sell their accounts receivable up to a maximum of $250.0 million and certain of our foreign subsidiaries may sell their accounts receivable up to a maximum of €43.4 million. We will continue to service the outstanding accounts sold. These receivables qualify for sales treatment under ASC 860 “Transfers and Servicing” and, accordingly, the proceeds are included in net cash provided by operating activities in the consolidated statements of cash flows. The following table summarizes the AR Facilities activity:
| December 31, | |||||||||||
| 2021 | 2020 | ||||||||||
| ($ in millions) | |||||||||||
| Beginning Balance | $ | $ | |||||||||
| Gross receivables sold | |||||||||||
| Payments received from customers on sold accounts | ( | ( | |||||||||
| Ending Balance | $ | $ | |||||||||
The factoring discount paid under the AR Facilities is recorded as interest expense on the consolidated statements of operations. The factoring discount for the years ended December 31, 2021, 2020 and 2019 was $1.1 million, $1.5 million and $2.9 million, respectively. The agreements are without recourse and therefore no recourse liability has been recorded as of December 31, 2021.
Our consolidated balance sheets included an allowance for doubtful accounts receivables of $12.3 million, $12.3 million and $11.9 million and other receivables of $65.3 million, $62.4 million and $87.4 million at December 31, 2021, 2020 and 2019, respectively, which were included in receivables, net.
NOTE 7. INVENTORIES
| December 31, | |||||||||||
| 2021 | 2020 | ||||||||||
| ($ in millions) | |||||||||||
| Supplies | $ | $ | |||||||||
| Raw materials | |||||||||||
| Work in process | |||||||||||
| Finished goods | |||||||||||
| LIFO reserve | ( | ( | |||||||||
| Inventories, net | $ | $ | |||||||||
Inventories valued using the LIFO method comprised 58 % and 51 % of the total inventories at December 31, 2021 and 2020, respectively. The replacement cost of our inventories would have been approximately $106.5 million and $48.2 million higher than that reported at December 31, 2021 and 2020, respectively.
68
NOTE 8. PROPERTY, PLANT AND EQUIPMENT
| December 31, | |||||||||||||||||
| Useful Lives | 2021 | 2020 | |||||||||||||||
| ($ in millions) | |||||||||||||||||
| Land and improvements to land | 10-20 Years(1) | $ | $ | ||||||||||||||
| Buildings and building equipment | 10-30 Years | ||||||||||||||||
| Machinery and equipment | 3-20 Years | ||||||||||||||||
| Leasehold improvements | 3-11 Years | ||||||||||||||||
| Construction in progress | |||||||||||||||||
| Property, plant and equipment | |||||||||||||||||
| Accumulated depreciation | ( | ( | |||||||||||||||
| Property, plant and equipment, net | $ | $ | |||||||||||||||
(1) Useful life is exclusively related to improvements to land as land is not depreciated.
The weighted-average useful life of machinery and equipment at December 31, 2021 was 11 years. Depreciation expense was $443.3 million, $445.4 million and $493.3 million for 2021, 2020 and 2019, respectively. Interest capitalized was $3.2 million, $6.4 million and $10.8 million for 2021, 2020 and 2019, respectively.
The consolidated statements of cash flows for the years ended December 31, 2021, 2020 and 2019, included increases of $6.4 million and $31.0 million and a decrease of $5.7 million, respectively, to capital expenditures, with the corresponding change to accounts payable and accrued liabilities, related to purchases of property, plant and equipment included in accounts payable and accrued liabilities at December 31, 2021, 2020 and 2019.
NOTE 9. OTHER ASSETS
Included in other assets were the following:
| December 31, | |||||||||||
| 2021 | 2020 | ||||||||||
| ($ in millions) | |||||||||||
| Supply contracts | $ | $ | |||||||||
| Other | |||||||||||
| Other assets | $ | $ | |||||||||
We have entered into various arrangements for the long-term supply of ethylene and electricity. A payment of $461.0 million was made during the second quarter of 2020 associated with a previously executed option to reserve additional ethylene at producer economics. The original liability was discounted and recorded at present value as of March 31, 2017. For the years ended December 31, 2020 and 2019, $4.0 million and $17.0 million, respectively, of interest expense was recorded for accretion of the 2020 payment liability discount.
During the year ended December 31, 2020, a payment of $75.8 million was made associated with the resolution of a dispute over the allocation to Olin of certain capital costs incurred at our Plaquemine, LA site.
The weighted-average useful life of long-term supply contracts at December 31, 2021 was 20 years. For the years ended December 31, 2021, 2020 and 2019, amortization expense of $69.4 million, $56.0 million and $39.9 million, respectively, was recognized within cost of goods sold related to our supply contracts and is reflected in depreciation and amortization on the consolidated statements of cash flows. We estimate that amortization expense will be approximately $70 million in 2022, 2023, 2024, 2025 and 2026 related to our long-term supply contracts. The long-term supply contracts are monitored for impairment each reporting period.
On January 1, 2019, we sold our 9.1 20.0 million. The sale closed on February 7, 2019 which resulted in a gain of $11.2 million for the year ended December 31, 2019 which was recorded to other income in the consolidated statements of operations.
69
NOTE 10. GOODWILL AND INTANGIBLE ASSETS
Changes in the carrying value of goodwill were as follows:
| Chlor Alkali Products and Vinyls | Epoxy | Total | |||||||||||||||
| ($ in millions) | |||||||||||||||||
| Balance at January 1, 2020 | $ | $ | $ | ||||||||||||||
| Goodwill impairment | ( | ( | ( | ||||||||||||||
| Foreign currency translation adjustment | |||||||||||||||||
| Balance at December 31, 2020 | |||||||||||||||||
| Foreign currency translation adjustment | |||||||||||||||||
| Balance at December 31, 2021 | $ | $ | $ | ||||||||||||||
During the fourth quarter of 2021, we performed our qualitative assessment of goodwill. Based upon our qualitative assessment, it is more likely than not that the fair value of our reporting units are greater than their carrying amounts as of December 31, 2021. No impairment charges were recorded for 2021.
During the first quarter of 2020, our market capitalization declined significantly compared to the fourth quarter of 2019. Over the same period, the equity value of our peer group companies and the overall U.S. stock market also declined significantly amid market volatility. These declines were driven by the uncertainty surrounding the outbreak of the 2019 Novel Coronavirus (COVID-19) global pandemic and other macroeconomic events impacting the various industries in which Olin and our peers participate. Additionally, the various governmental, business and consumer responses to the pandemic were expected to have a negative impact on the near-term demand for several of the products produced by our Chlor Alkali Products and Vinyls and Epoxy businesses. The full extent and duration of the impact of COVID-19 on our operations and financial performance was unknown at the time. As a result of these events, we identified triggering events associated with a significant overall decrease in our stock price, a significant adverse change in the business climate and a significant reduction in near-term cash flow projections and performed a quantitative goodwill impairment test during the first quarter of 2020. We used a discounted cash flow approach to develop the estimated fair value of our reporting units. Based on the aforementioned analysis, the estimated fair value of our reporting units exceeded the carrying value of the reporting units and no impairment charges were recorded.
Throughout the second and third quarters of 2020, the spread of the COVID-19 pandemic and the associated response had caused significant disruptions in the U.S. and global economies, resulting in the disruption of the supply and demand fundamentals of our Chemicals businesses. The various governmental, business and consumer responses to the pandemic continued to negatively impact the demand for several of the products produced by our Chlor Alkali Products and Vinyls and Epoxy businesses resulting in lower volumes and pricing during 2020 compared to 2019. Due to these factors, the triggering events identified in the first quarter associated with a significant adverse change in the business climate and a significant adverse reduction in near-term cash flow projections had persisted during 2020. Throughout the second and third quarters of 2020, the equity value of our peer group companies and the overall U.S. stock market improved significantly while Olin’s stock price remained low. During the three months ended September 30, 2020, we identified a triggering event associated with a sustained significant overall decrease in our stock price. As a result, we performed an updated quantitative goodwill impairment test during the third quarter of 2020. We used a discounted cash flow approach to develop the estimated fair value of our reporting units.
Fair value determinations require considerable judgment and are sensitive to changes in underlying assumptions, estimates and market factors. The discount rate, profitability assumptions and terminal growth rate of our reporting units and the supply and demand fundamentals of the chlor alkali industry were the material assumptions utilized in the discounted cash flow model used to estimate the fair value of each reporting unit. The discount rate reflects a weighted-average cost of capital, which is calculated, in part based on observable market data. Some of this data (such as the risk free or treasury rate and the pretax cost of debt) are based on the market data at a point in time. Other data (such as the equity risk premium) are based upon market data over time for a peer group of companies in the chemical manufacturing or distribution industries with a market capitalization premium added, as applicable. Also factoring into the discount rate was a market participant’s perceived risk (such as the company specific risk premium) in the valuation implied by the sustained reduction in our stock price.
70
The discounted cash flow analysis requires estimates, assumptions and judgments about future events. Our analysis uses our internally generated long-range plan. Specifically, the assumptions in our long-range plan about terminal growth rates, forecasted capital expenditures and changes in future working capital requirements are used to determine the implied fair value of each reporting unit. The long-range plan reflects management judgment, supplemented by independent chemical industry analyses which provide multi-year industry operating and pricing forecasts.
As a further indicator that each reporting unit has been valued appropriately using a discounted cash flow model, the aggregate fair value of all reporting units is reconciled to the total market value of Olin. Due to the sustained decline in our stock price, the decrease in the value of our reporting units reflects a market participant’s perceived risk in the valuation implied by the sustained reduction in our stock price. As a result of this assessment, the carrying values of our Chlor Alkali Products and Vinyls and Epoxy reporting units exceeded the fair values which resulted in pre-tax goodwill impairment charges of $557.6 million and $142.2 million, respectively, for the year ended December 31, 2020. The goodwill impairment charge was calculated as the amount that the carrying value of the reporting unit, including any goodwill, exceeded its fair value and therefore the carrying value of our reporting units equaled their fair value upon completion of the goodwill impairment test.
We believe the assumptions used in our goodwill impairment analysis are appropriate and result in reasonable estimates of the implied fair value of each reporting unit. However, given the economic environment and the uncertainties regarding the impact on our business, there can be no assurance that our estimates and assumptions, made for purposes of our goodwill impairment testing, will prove to be an accurate prediction of the future. If our assumptions regarding future performance are not achieved, or if our stock price experiences further sustained declines, we may be required to record additional goodwill impairment charges in future periods. It is not possible at this time to determine if any such future impairment charge would result or, if it does, whether such charge would be material.
During the fourth quarter of 2019, we performed our triennial quantitative goodwill impairment test for our reporting units. Based on the analysis, the estimated fair value of our reporting units exceeded the carrying value of the reporting units. No impairment charges were recorded for 2019.
Intangible assets consisted of the following:
| December 31, | |||||||||||||||||||||||||||||||||||||||||
| 2021 | 2020 | ||||||||||||||||||||||||||||||||||||||||
| Useful Lives | Gross Amount | Accumulated Amortization | Net | Gross Amount | Accumulated Amortization | Net | |||||||||||||||||||||||||||||||||||
| ($ in millions) | |||||||||||||||||||||||||||||||||||||||||
| Customers, customer contracts and relationships | 10-15 Years | $ | $ | ( | $ | $ | $ | ( | $ | ||||||||||||||||||||||||||||||||
| Acquired technology | 5-7 Years | ( | ( | ||||||||||||||||||||||||||||||||||||||
| Other | 10 Years | ( | ( | ||||||||||||||||||||||||||||||||||||||
| Total intangible assets | $ | $ | ( | $ | $ | $ | ( | $ | |||||||||||||||||||||||||||||||||
Amortization expense relating to intangible assets was $63.1 million, $62.9 million and $62.8 million in 2021, 2020 and 2019, respectively. We estimate that amortization expense will be approximately $55 million in 2022, approximately $37 million in both 2023 and 2024, approximately $36 million in 2025 and approximately $35 million in 2026.
71
NOTE 11. DEBT
| December 31, | |||||||||||
| 2021 | 2020 | ||||||||||
| Notes payable: | ($ in millions) | ||||||||||
| Variable-rate Senior Term Loans, due 2024 (1.604% and 4.125% at December 31, 2021 and 2020, respectively) | $ | $ | |||||||||
| Variable-rate Recovery Zone bonds, due 2024-2035 (1.100% and 3.625% at December 31, 2021 and 2020, respectively) | |||||||||||
| Variable-rate Go Zone bonds, due 2024 (1.100% and 3.625% at December 31, 2021 and 2020, respectively) | |||||||||||
| Variable-rate Industrial development and environmental improvement obligations, due 2025 (0.17% and 0.21% at December 31, 2021 and 2020, respectively) | |||||||||||
| 10.00% senior notes, due 2025 | |||||||||||
| 9.75% senior notes, due 2023 | |||||||||||
| 9.50% senior notes, due 2025 | |||||||||||
| 5.625% senior notes, due 2029 | |||||||||||
| 5.50% senior notes, due 2022 | |||||||||||
| 5.125% senior notes, due 2027 | |||||||||||
| 5.00% senior notes, due 2030 | |||||||||||
| Receivables Financing Agreement (See Note 6) | |||||||||||
| Finance lease obligations | |||||||||||
| Total notes payable | |||||||||||
| Deferred debt issuance costs | ( | ( | |||||||||
| Unamortized bond original issue discount | ( | ( | |||||||||
| Interest rate swaps | ( | ||||||||||
| Total debt | |||||||||||
| Amounts due within one year | |||||||||||
| Total long-term debt | $ | $ | |||||||||
Senior Credit Facility
On February 24, 2021, we entered into a $1,615.0 million senior secured credit facility (Senior Credit Facility) that amended our existing $1,300.0 million senior secured credit facility. On July 28, 2021, the liens on the collateral provided under the Senior Credit Facility were released based on the achievement of a net leverage ratio below 3.50 for the prior two consecutive fiscal quarters. The Senior Credit Facility includes a senior delayed-draw term loan facility with aggregate commitments of $315.0 million (2021 Delayed Draw Term Loan), a senior term loan facility with aggregate commitments of $500.0 million (2020 Term Loan and together with the 2021 Delayed Draw Term Loan, the Senior Term Loans) and a senior revolving credit facility with aggregate commitments in an amount equal to $800.0 million (Senior Revolving Credit Facility). The maturity date for the Senior Credit Facility is July 16, 2024. The amendment modified the pricing grid for the Senior Credit Facility by reducing applicable interest rates on the borrowings under the facility.
On March 30, 2021, Olin drew the entire $315.0 million of the 2021 Delayed Draw Term Loan and used the proceeds to fund the redemption of the 10.00 % senior notes due October 15, 2025. During the year ended December 31, 2021, we repaid $465.0 million of the Senior Term Loans. These repayments satisfied all future required quarterly installments of the Senior Term Loans. The Senior Revolving Credit Facility includes a $100.0 million letter of credit subfacility. At December 31, 2021, we had $799.6 million available under our $800.0 million Senior Revolving Credit Facility because we had issued $0.4 million of letters of credit.
72
On May 8, 2020, we entered into a $1,300.0 million senior secured credit facility (Senior Secured Credit Facility) that amended our then existing five-year, $2,000.0 million senior credit facility. The Senior Secured Credit Facility included a senior secured delayed-draw term loan facility with aggregate commitments of $500.0 million (2020 Delayed Draw Term Loan) and a senior secured revolving credit facility with aggregate commitments in an amount equal to $800.0 million (Senior Secured Revolving Credit Facility). The maturity date for the Senior Secured Credit Facility was July 16, 2024. The amendment modified the financial covenants of the Senior Secured Credit Facility to be less restrictive and expanded the permitted use of proceeds of the 2020 Delayed Draw Term Loan to include general corporate purposes.
The amendment also required that the obligations under the Senior Secured Credit Facility be guaranteed by certain of our domestic subsidiaries, which were also guarantors of Olin’s outstanding notes, with the exception of the $200.0 million senior notes due 2022. The obligations under the Senior Secured Credit Facility were also secured by liens on substantially all of Olin’s and the subsidiary guarantors’ personal property (Collateral), other than certain principal properties and capital stock of subsidiaries, and subject to certain other exceptions. The amendment provided that substantially all guarantees under the Senior Secured Credit Facility and liens on the Collateral could be released when our net leverage ratio was below 3.50 to 1.00 for two consecutive fiscal quarters.
On October 15, 2020, Olin drew the entire $500.0 million of the 2020 Delayed Draw Term Loan. The 2020 Delayed Draw Term Loan included principal amortization amounts payable beginning the quarter ending after the facility was fully drawn at a rate of 5.0 % per annum for the first two years, increasing to 7.5 % per annum for the following year and to 10.0 % per annum for the last two years.
Under the Senior Credit Facility, we may select various floating-rate borrowing options. The actual interest rate paid on borrowings under the Senior Credit Facility is based on a pricing grid which is dependent upon the net leverage ratio as calculated under the terms of the applicable facility for the prior fiscal quarter. The Senior Credit Facility includes various customary restrictive covenants, including restrictions related to the ratio of debt to earnings before interest expense, taxes, depreciation and amortization (net leverage ratio) and the ratio of earnings before interest expense, taxes, depreciation and amortization to interest expense (coverage ratio). The calculation of debt in our net leverage ratio excludes borrowings under the Receivables Financing Agreement, up to a maximum of $250.0 million, and is reduced by all unrestricted cash and cash equivalents. Compliance with these covenants is determined quarterly. We were in compliance with all covenants and restrictions under all our outstanding credit agreements as of December 31, 2021, and no event of default had occurred that would permit the lenders under our outstanding credit agreements to accelerate the debt if not cured. In the future, our ability to generate sufficient operating cash flows, among other factors, will determine the amounts available to be borrowed under these facilities. As a result of our restrictive covenant related to the net leverage ratio, the maximum additional borrowings available to us could be limited in the future. The limitation, if an amendment or waiver from our lenders is not obtained, could restrict our ability to borrow the maximum amounts available under the Senior Revolving Credit Facility and the Receivables Financing Agreement. As of December 31, 2021, there were no covenants or other restrictions that limited our ability to borrow.
Senior Notes and Other Financing
73
| Long-term Debt Borrowings (Repayments) | Loss on Debt Extinguishment(1) | Long-term Debt Borrowings (Repayments) | Loss on Debt Extinguishment(1) | |||||||||||||||||||||||
| Year Ended December 31, 2021 | Year Ended December 31, 2020 | |||||||||||||||||||||||||
| Debt Instrument | ($ in millions) | |||||||||||||||||||||||||
| Borrowings: | ||||||||||||||||||||||||||
| Senior Term Loans | $ | $ | ||||||||||||||||||||||||
| Receivables Financing Agreement | ||||||||||||||||||||||||||
| 9.50% senior notes due 2025 | ||||||||||||||||||||||||||
| Total borrowings | $ | $ | ||||||||||||||||||||||||
| Repayments: | ||||||||||||||||||||||||||
| 10.00% senior notes due 2025 | $ | ( | $ | $ | $ | |||||||||||||||||||||
| 9.50% senior notes due 2025 | ( | |||||||||||||||||||||||||
| 9.75% senior notes due 2023 | ( | ( | ||||||||||||||||||||||||
| 5.625% senior notes due 2029 | ( | |||||||||||||||||||||||||
| 5.00% senior notes due 2030 | ( | |||||||||||||||||||||||||
| Senior Term Loans | ( | ( | ||||||||||||||||||||||||
| Receivables Financing Agreement | ( | ( | ||||||||||||||||||||||||
| Finance leases | ( | ( | ||||||||||||||||||||||||
| Total repayments | $ | ( | $ | $ | ( | $ | ||||||||||||||||||||
| Long-term debt (repayments) borrowings, net | $ | ( | $ | |||||||||||||||||||||||
(1) Loss on debt extinguishment is included as interest expense in the consolidated statements of operations. The loss includes the payment of bond redemption premiums of $137.7 million and $14.6 million for the years ended December 31, 2021 and 2020, respectively, as well as the write-off of deferred debt issuance costs, write-off of bond original issue discount and recognition of deferred fair value interest rate swap losses of $14.5 million and $5.8 million for the years ended December 31, 2021 and 2020, respectively, associated with the optional prepayment of existing debt. The cash payments related to the early redemption premiums for the debt extinguishments are classified as cash outflows from financing activities on the consolidated statements of cash flows for year ended December 31, 2021 and 2020. The consolidated statements of cash flows for the year ended December 31, 2020 reflects the correction of previously presented early redemption premiums, which increased cash flows from net operating activities and decreased cash flows from net financing activities by $14.6 million.
In the fourth quarter of 2021, we completed a cash tender offer to purchase a principal amount of $391.4 million of the outstanding 9.50 % Senior Notes due 2025 (2025 Notes). This action resulted in total redemption premiums of $99.4 million. The 2025 Notes were redeemed by drawing $150.0 million of the Receivables Financing Agreement along with utilizing cash on hand.
During the year ended December 31, 2021, we repurchased, through open market transactions, a principal amount of $80.7 million of the outstanding aggregate principal amount of 5.625 % senior notes due August 1, 2029 (2029 Notes) and $34.7 million of the outstanding aggregate principal amount of 5.00 % senior notes due February 1, 2030 (2030 Notes). These actions resulted in total redemption premiums of $10.4 million.
On March 31, 2021, Olin redeemed $315.0 million of the outstanding 10.00 % senior notes due October 15, 2025 (Blue Cube 2025 Notes) and on May 14, 2021, Olin redeemed the remaining $185.0 million of the outstanding Blue Cube 2025 Notes. The Blue Cube 2025 Notes were redeemed at 105.00 % of the principal amount of the Blue Cube 2025 Notes, resulting in a redemption premium of $25.0 million. The Blue Cube 2025 Notes were redeemed by drawing $315.0 million of the Delayed Draw Term Loan along with utilizing cash on hand.
On January 15, 2021, Olin redeemed the remaining $120.0 million of the outstanding 9.75 % senior notes due 2023 (2023 Notes). The 2023 Notes were redeemed at 102.438 % of the principal amount of the 2023 Notes, resulting in a redemption premium of $2.9 million. The remaining 2023 Notes were redeemed by utilizing $122.9 million of cash on hand.
74
On October 15, 2020, Olin redeemed $600.0 million of the outstanding 2023 Notes. The 2023 Notes were redeemed at 102.438 % of the principal amount of the 2023 Notes, resulting in a redemption premium of $14.6 million. The 2023 Notes were redeemed by drawing $500.0 million of the Delayed Draw Term Loan Facility along with utilizing $114.6 million of cash on hand.
On May 19, 2020, Olin issued $500.0 million aggregate principal amount of 9.50 % senior notes due June 1, 2025 (2025 Notes). The 2025 Notes were issued at 99.5 % of par value, the discount from which is included within long-term debt in the consolidated balance sheets. Interest on the 2025 Notes is payable semi-annually beginning on December 1, 2020. Proceeds from the 2025 Notes were used for general corporate purposes.
For the years ended December 31, 2021, 2020 and 2019, we recognized interest expense of $14.5 million, $5.8 million and $2.8 million, respectively, for the write-off of deferred debt issuance costs, write-off of bond original issue discount and recognition of deferred fair value interest rate swap losses.
For the years ended December 31, 2021, 2020 and 2019, we paid debt issuance costs of $3.9 million, $10.3 million and $16.6 million, respectively, related to financing transactions.
At December 31, 2021, we had total letters of credit of $81.1 million outstanding, of which $0.4 million were issued under our Senior Revolving Credit Facility. The letters of credit are used to support certain long-term debt, certain workers compensation insurance policies, certain plant closure and post-closure obligations, certain international payment obligations and certain international pension funding requirements.
Annual maturities of long-term debt, including finance lease obligations, are $201.1 million in 2022, $1.0 million in 2023, $720.8 million in 2024, $111.7 million in 2025, $83.0 million in 2026 and a total of $1,684.5 million thereafter.
NOTE 12. PENSION PLANS
We sponsor domestic and foreign defined benefit pension plans for eligible employees and retirees. Most of our domestic employees participate in defined contribution plans. However, a portion of our bargaining hourly employees continue to participate in our domestic qualified defined benefit pension plans under a flat-benefit formula. Our funding policy for the qualified defined benefit pension plans is consistent with the requirements of federal laws and regulations. Our foreign subsidiaries maintain pension and other benefit plans, which are consistent with local statutory practices.
Our domestic qualified defined benefit pension plan provides that if, within three years following a change of control of Olin, any corporate action is taken or filing made in contemplation of, among other things, a plan termination or merger or other transfer of assets or liabilities of the plan, and such termination, merger or transfer thereafter takes place, plan benefits would automatically be increased for affected participants (and retired participants) to absorb any plan surplus (subject to applicable collective bargaining requirements).
During 2019, we made a discretionary cash contribution to our domestic qualified defined benefit pension plan of $12.5 million. Based on our plan assumptions and estimates, we will not be required to make any cash contributions to the domestic qualified defined benefit pension plan at least through 2022.
We have international qualified defined benefit pension plans to which we made cash contributions of $1.1 million, $2.1 million and $2.4 million in 2021, 2020 and 2019, respectively, and we anticipate less than $5 million of cash contributions to international qualified defined benefit pension plans in 2022.
75
Pension Obligations and Funded Status
Changes in the benefit obligation and plan assets were as follows:
| December 31, 2021 | December 31, 2020 | ||||||||||||||||||||||||||||||||||
| U.S. | Foreign | Total | U.S. | Foreign | Total | ||||||||||||||||||||||||||||||
| Change in Benefit Obligation | ($ in millions) | ||||||||||||||||||||||||||||||||||
| Benefit obligation at beginning of year | $ | $ | $ | $ | $ | $ | |||||||||||||||||||||||||||||
| Service cost | |||||||||||||||||||||||||||||||||||
| Interest cost | |||||||||||||||||||||||||||||||||||
| Actuarial (gain) loss | ( | ( | ( | ||||||||||||||||||||||||||||||||
| Benefits paid | ( | ( | ( | ( | ( | ( | |||||||||||||||||||||||||||||
| Plan participant’s contributions | |||||||||||||||||||||||||||||||||||
| Plan amendments | ( | ( | ( | ( | |||||||||||||||||||||||||||||||
| Foreign currency translation adjustments | ( | ( | |||||||||||||||||||||||||||||||||
| Benefit obligation at end of year | $ | $ | $ | $ | $ | $ | |||||||||||||||||||||||||||||
| December 31, 2021 | December 31, 2020 | ||||||||||||||||||||||||||||||||||
| U.S. | Foreign | Total | U.S. | Foreign | Total | ||||||||||||||||||||||||||||||
| Change in Plan Assets | ($ in millions) | ||||||||||||||||||||||||||||||||||
| Fair value of plans’ assets at beginning of year | $ | $ | $ | $ | $ | $ | |||||||||||||||||||||||||||||
| Actual return on plans’ assets | ( | ||||||||||||||||||||||||||||||||||
| Employer contributions | |||||||||||||||||||||||||||||||||||
| Benefits paid | ( | ( | ( | ( | ( | ( | |||||||||||||||||||||||||||||
| Foreign currency translation adjustments | ( | ( | |||||||||||||||||||||||||||||||||
| Fair value of plans’ assets at end of year | $ | $ | $ | $ | $ | $ | |||||||||||||||||||||||||||||
| December 31, 2021 | December 31, 2020 | ||||||||||||||||||||||||||||||||||
| U.S. | Foreign | Total | U.S. | Foreign | Total | ||||||||||||||||||||||||||||||
| Funded Status | ($ in millions) | ||||||||||||||||||||||||||||||||||
| Qualified plans | $ | ( | $ | ( | $ | ( | $ | ( | $ | ( | $ | ( | |||||||||||||||||||||||
| Non-qualified plans | ( | ( | ( | ( | ( | ( | |||||||||||||||||||||||||||||
| Total funded status | $ | ( | $ | ( | $ | ( | $ | ( | $ | ( | $ | ( | |||||||||||||||||||||||
We recorded a $185.6 million after-tax benefit ($245.9 million pretax) to shareholders’ equity as of December 31, 2021 for our pension plans. This benefit primarily reflected a 50 -basis point increase in the domestic pension plans’ discount rate and favorable performance on plan assets during 2021. In 2020, we recorded a $17.9 million after-tax benefit ($30.7 million pretax) to shareholders’ equity as of December 31, 2020 for our pension plans. This benefit primarily reflected favorable performance on plan assets during 2020, partially offset by an 80 -basis point decrease in the domestic pension plans’ discount rate.
The $205.4 million actuarial gain for 2021 was primarily due to a 50 -basis point increase in the domestic pension plans’ discount rate. The $235.1 million actuarial loss for 2020 was primarily due to an 80 -basis point decrease in the domestic pension plans’ discount rate.
76
Amounts recognized in the consolidated balance sheets consisted of:
| December 31, 2021 | December 31, 2020 | ||||||||||||||||||||||||||||||||||
| U.S. | Foreign | Total | U.S. | Foreign | Total | ||||||||||||||||||||||||||||||
| ($ in millions) | |||||||||||||||||||||||||||||||||||
| Accrued benefit in current liabilities | $ | ( | $ | ( | $ | ( | $ | ( | $ | ( | $ | ( | |||||||||||||||||||||||
| Accrued benefit in noncurrent liabilities | ( | ( | ( | ( | ( | ( | |||||||||||||||||||||||||||||
| Accumulated other comprehensive loss | |||||||||||||||||||||||||||||||||||
| Net balance sheet impact | $ | $ | ( | $ | $ | $ | ( | $ | |||||||||||||||||||||||||||
At December 31, 2021 and 2020, the benefit obligation of non-qualified pension plans was $5.3 million and $5.9 million, respectively, and was included in the above pension benefit obligation. There were no plan assets for these non-qualified pension plans. Benefit payments for the non-qualified pension plans are expected to be as follows: 2022—$0.8 million; 2023—$0.4 million; 2024—$0.3 million; 2025—$0.3 million; and 2026—$0.4 million. Benefit payments for the qualified plans are projected to be as follows: 2022—$149.3 million; 2023—$146.6 million; 2024—$146.5 million; 2025—$145.5 million; and 2026—$143.4 million.
| December 31, | |||||||||||
| 2021 | 2020 | ||||||||||
| ($ in millions) | |||||||||||
| Projected benefit obligation | $ | $ | |||||||||
| Accumulated benefit obligation | |||||||||||
| Fair value of plans’ assets | |||||||||||
| Years Ended December 31, | |||||||||||||||||
| 2021 | 2020 | 2019 | |||||||||||||||
| Components of Net Periodic Benefit Income | ($ in millions) | ||||||||||||||||
| Service cost | $ | $ | $ | ||||||||||||||
| Interest cost | |||||||||||||||||
| Expected return on plans’ assets | ( | ( | ( | ||||||||||||||
| Amortization of prior service cost | ( | ( | |||||||||||||||
| Recognized actuarial loss | |||||||||||||||||
| Net periodic benefit income | $ | ( | $ | ( | $ | ( | |||||||||||
| Included in Other Comprehensive Income (Loss) (Pretax) | |||||||||||||||||
| Liability adjustment | $ | ( | $ | ( | $ | ||||||||||||
| Amortization of prior service costs and actuarial losses | ( | ( | ( | ||||||||||||||
The service cost component of net periodic benefit (income) cost related to the employees of the operating segments are allocated to the operating segments based on their respective estimated census data.
77
Pension Plan Assumptions
Certain actuarial assumptions, such as discount rate and long-term rate of return on plan assets, have a significant effect on the amounts reported for net periodic benefit cost and accrued benefit obligation amounts. We use a measurement date of December 31 for our pension plans.
| U.S. Pension Benefits | Foreign Pension Benefits | ||||||||||||||||||||||||||||||||||
| Weighted-Average Assumptions | 2021 | 2020 | 2019 | 2021 | 2020 | 2019 | |||||||||||||||||||||||||||||
| Discount rate—periodic benefit cost | % | (1) | % | % | % | % | % | ||||||||||||||||||||||||||||
| Expected return on assets | % | % | % | % | % | % | |||||||||||||||||||||||||||||
| Rate of compensation increase | % | % | % | % | % | % | |||||||||||||||||||||||||||||
| Discount rate—benefit obligation | % | % | % | % | % | % | |||||||||||||||||||||||||||||
(1) The discount rate—periodic benefit cost for our domestic qualified pension plan is comprised of the discount rate used to determine interest costs of 1.8 % and the discount rate used to determine service costs of 2.5 %.
The discount rate is based on a hypothetical yield curve represented by a series of annualized individual zero-coupon bond spot rates for maturities ranging from one-half to thirty years. The bonds used in the yield curve must have a rating of AA or better per Standard & Poor’s, be non-callable, and have at least $250 million par outstanding. The yield curve is then applied to the projected benefit payments from the plan. Based on these bonds and the projected benefit payment streams, the single rate that produces the same yield as the matching bond portfolio is used as the discount rate.
The long-term expected rate of return on plan assets represents an estimate of the long-term rate of returns on the investment portfolio consisting of equities, fixed income and alternative investments. We use long-term historical actual return information, the allocation mix of investments that comprise plan assets and forecast estimates of long-term investment returns, including inflation rates, by reference to external sources. The historic rates of return on plan assets have been 11.1 % for the last 5 years, 9.1 % for the last 10 years and 9.8 % for the last 15 years. The following rates of return by asset class were considered in setting the long-term rate of return assumption:
| U.S. equities | to | ||||||||||||||||
| Non-U.S. equities | to | ||||||||||||||||
| Fixed income/cash | to | ||||||||||||||||
| Alternative investments | to | ||||||||||||||||
Plan Assets
Our pension plan asset allocations at December 31, 2021 and 2020 by asset class were as follows:
| Percentage of Plan Assets | |||||||||||
| Asset Class | 2021 | 2020 | |||||||||
| U.S. equities | % | % | |||||||||
| Non-U.S. equities | % | % | |||||||||
| Fixed income/cash | % | % | |||||||||
| Alternative investments | % | % | |||||||||
| Total | % | % | |||||||||
The Alternative Investments asset class includes hedge funds, real estate and private equity investments. The Alternative Investments class is intended to help diversify risk and increase returns by utilizing a broader group of assets.
A master trust was established by our pension plan to accumulate funds required to meet benefit payments of our plan and is administered solely in the interest of our plan’s participants and their beneficiaries. The master trust’s investment horizon is long term. Its assets are managed by professional investment managers or invested in professionally managed investment vehicles.
Our pension plan maintains a portfolio of assets designed to achieve an appropriate risk adjusted return. The portfolio of assets is also structured to manage risk by diversifying assets across asset classes whose return patterns are not highly
78
correlated, investing in passively and actively managed strategies and in value and growth styles, and by periodic rebalancing of asset classes, strategies and investment styles to objectively set targets.
As of December 31, 2021, the following target allocation and ranges have been set for each asset class:
| Asset Class | Target Allocation | Target Range | |||||||||
U.S. equities(1) | % | 10-30 | |||||||||
Non-U.S. equities(1) | % | 0-35 | |||||||||
Fixed income/cash(1) | % | 25-90 | |||||||||
| Alternative investments | % | 0-40 | |||||||||
(1) The target allocation for these asset classes include alternative investments, primarily hedge funds, based on the underlying investments in each hedge fund.
Determining which hierarchical level an asset or liability falls within requires significant judgment. The following table summarizes our domestic and foreign defined benefit pension plan assets measured at fair value as of December 31, 2021:
| Asset Class | Investments Measured at Net Asset Value | Quoted Prices In Active Markets for Identical Assets (Level 1) | Significant Other Observable Inputs (Level 2) | Significant Unobservable Inputs (Level 3) | Total | ||||||||||||||||||||||||
| Equity securities | ($ in millions) | ||||||||||||||||||||||||||||
| U.S. equities | $ | $ | $ | $ | $ | ||||||||||||||||||||||||
| Non-U.S. equities | |||||||||||||||||||||||||||||
| Fixed income/cash | |||||||||||||||||||||||||||||
| Cash | |||||||||||||||||||||||||||||
| Government treasuries | |||||||||||||||||||||||||||||
| Corporate debt instruments | |||||||||||||||||||||||||||||
| Asset-backed securities | |||||||||||||||||||||||||||||
| Alternative investments | |||||||||||||||||||||||||||||
| Hedge fund of funds | |||||||||||||||||||||||||||||
| Real estate funds | |||||||||||||||||||||||||||||
| Private equity funds | |||||||||||||||||||||||||||||
| Total assets | $ | $ | $ | $ | $ | ||||||||||||||||||||||||
79
The following table summarizes our domestic and foreign defined benefit pension plan assets measured at fair value as of December 31, 2020:
| Asset Class | Investments Measured at Net Asset Value | Quoted Prices In Active Markets for Identical Assets (Level 1) | Significant Other Observable Inputs (Level 2) | Significant Unobservable Inputs (Level 3) | Total | ||||||||||||||||||||||||
| Equity securities | ($ in millions) | ||||||||||||||||||||||||||||
| U.S. equities | $ | $ | $ | $ | $ | ||||||||||||||||||||||||
| Non-U.S. equities | |||||||||||||||||||||||||||||
| Fixed income/cash | |||||||||||||||||||||||||||||
| Cash | |||||||||||||||||||||||||||||
| Government treasuries | |||||||||||||||||||||||||||||
| Corporate debt instruments | |||||||||||||||||||||||||||||
| Asset-backed securities | |||||||||||||||||||||||||||||
| Alternative investments | |||||||||||||||||||||||||||||
| Hedge fund of funds | |||||||||||||||||||||||||||||
| Real estate funds | |||||||||||||||||||||||||||||
| Private equity funds | |||||||||||||||||||||||||||||
| Total assets | $ | $ | $ | $ | $ | ||||||||||||||||||||||||
U.S. equities—This class included actively and passively managed equity investments in common stock and commingled funds comprised primarily of large-capitalization stocks with value, core and growth strategies.
Non-U.S. equities—This class included actively managed equity investments in commingled funds comprised primarily of international large-capitalization stocks from both developed and emerging markets.
Fixed income and cash—This class included commingled funds comprised of debt instruments issued by the U.S. and Canadian Treasuries, U.S. Agencies, corporate debt instruments, asset- and mortgage-backed securities and cash.
Hedge fund of funds—This class included a hedge fund which invests in the following types of hedge funds:
Event driven hedge funds—This class included hedge funds that invest in securities to capture excess returns that are driven by market or specific company events including activist investment philosophies and the arbitrage of equity and private and public debt securities.
Market neutral hedge funds—This class included investments in U.S. and international equities and fixed income securities while maintaining a market neutral position in those markets.
Other hedge funds—This class primarily included long-short equity strategies and a global macro fund which invested in fixed income, equity, currency, commodity and related derivative markets.
Real estate funds—This class included several funds that invest primarily in U.S. commercial real estate.
Private equity funds—This class included several private equity funds that invest primarily in infrastructure and U.S. power generation and transmission assets.
U.S. equities and non-U.S. equities are primarily valued at the net asset value provided by the independent administrator or custodian of the commingled fund. The net asset value is based on the value of the underlying equities, which are traded on an active market. U.S. equities are also valued at the closing price reported in an active market on which the individual securities are traded. A portion of our fixed income investments are valued at the net asset value provided by the independent administrator or custodian of the fund. The net asset value is based on the underlying assets, which are valued using inputs such as the closing price reported, if traded on an active market, values derived from comparable securities of issuers with similar credit ratings, or under a discounted cash flow approach that utilizes observable inputs, such as current yields of similar instruments, but includes adjustments for risks that may not be observable such as certain credit and liquidity risks. Alternative
80
NOTE 13. POSTRETIREMENT BENEFITS
We provide certain postretirement healthcare (medical) and life insurance benefits for eligible active and retired domestic employees. The healthcare plans are contributory with participants’ contributions adjusted annually based on medical rates of inflation and plan experience. We use a measurement date of December 31 for our postretirement plans.
Other Postretirement Benefits Obligations and Funded Status
Changes in the benefit obligation were as follows:
| December 31, 2021 | December 31, 2020 | ||||||||||||||||||||||||||||||||||
| U.S. | Foreign | Total | U.S. | Foreign | Total | ||||||||||||||||||||||||||||||
| Change in Benefit Obligation | ($ in millions) | ||||||||||||||||||||||||||||||||||
| Benefit obligation at beginning of year | $ | $ | $ | $ | $ | $ | |||||||||||||||||||||||||||||
| Service cost | |||||||||||||||||||||||||||||||||||
| Interest cost | |||||||||||||||||||||||||||||||||||
| Actuarial (gain) loss | ( | ( | ( | ||||||||||||||||||||||||||||||||
| Benefits paid | ( | ( | ( | ( | ( | ( | |||||||||||||||||||||||||||||
| Foreign currency translation adjustments | |||||||||||||||||||||||||||||||||||
| Benefit obligation at end of year | $ | $ | $ | $ | $ | $ | |||||||||||||||||||||||||||||
| December 31, 2021 | December 31, 2020 | ||||||||||||||||||||||||||||||||||
| U.S. | Foreign | Total | U.S. | Foreign | Total | ||||||||||||||||||||||||||||||
| ($ in millions) | |||||||||||||||||||||||||||||||||||
| Funded status | $ | ( | $ | ( | $ | ( | $ | ( | $ | ( | $ | ( | |||||||||||||||||||||||
We recorded a $2.9 million after-tax benefit ($3.8 million pretax) to shareholders’ equity as of December 31, 2021 for our other postretirement plans. In 2020, we recorded an after-tax charge of $3.1 million ($4.1 million pretax) to shareholders’ equity as of December 31, 2020 for our other postretirement plans.
Amounts recognized in the consolidated balance sheets consisted of:
| December 31, 2021 | December 31, 2020 | ||||||||||||||||||||||||||||||||||
| U.S. | Foreign | Total | U.S. | Foreign | Total | ||||||||||||||||||||||||||||||
| ($ in millions) | |||||||||||||||||||||||||||||||||||
| Accrued benefit in current liabilities | $ | ( | $ | ( | $ | ( | $ | ( | $ | ( | $ | ( | |||||||||||||||||||||||
| Accrued benefit in noncurrent liabilities | ( | ( | ( | ( | ( | ( | |||||||||||||||||||||||||||||
| Accumulated other comprehensive loss | |||||||||||||||||||||||||||||||||||
| Net balance sheet impact | $ | ( | $ | ( | $ | ( | $ | ( | $ | ( | $ | ( | |||||||||||||||||||||||
81
| Years Ended December 31, | |||||||||||||||||
| 2021 | 2020 | 2019 | |||||||||||||||
| Components of Net Periodic Benefit Cost | ($ in millions) | ||||||||||||||||
| Service cost | $ | $ | $ | ||||||||||||||
| Interest cost | |||||||||||||||||
| Amortization of prior service cost | |||||||||||||||||
| Recognized actuarial loss | |||||||||||||||||
| Net periodic benefit cost | $ | $ | $ | ||||||||||||||
| Included in Other Comprehensive Income (Loss) (Pretax) | |||||||||||||||||
| Liability adjustment | $ | ( | $ | $ | |||||||||||||
| Amortization of prior service costs and actuarial losses | ( | ( | ( | ||||||||||||||
The service cost component of net periodic postretirement benefit cost related to the employees of the operating segments are allocated to the operating segments based on their respective estimated census data.
Other Postretirement Benefits Plan Assumptions
Certain actuarial assumptions, such as discount rate, have a significant effect on the amounts reported for net periodic benefit cost and accrued benefit obligation amounts.
| December 31, | |||||||||||||||||
| Weighted-Average Assumptions | 2021 | 2020 | 2019 | ||||||||||||||
| Discount rate—periodic benefit cost | % | % | % | ||||||||||||||
| Discount rate—benefit obligation | % | % | % | ||||||||||||||
The discount rate is based on a hypothetical yield curve represented by a series of annualized individual zero-coupon bond spot rates for maturities ranging from one-half to thirty years. The bonds used in the yield curve must have a rating of AA or better per Standard & Poor’s, be non-callable, and have at least $250 million par outstanding. The yield curve is then applied to the projected benefit payments from the plan. Based on these bonds and the projected benefit payment streams, the single rate that produces the same yield as the matching bond portfolio is used as the discount rate.
We review external data and our own internal trends for healthcare costs to determine the healthcare cost for the post retirement benefit obligation. The assumed healthcare cost trend rates for pre-65 retirees were as follows:
| December 31, | |||||||||||
| 2021 | 2020 | ||||||||||
| Healthcare cost trend rate assumed for next year | % | % | |||||||||
| Rate that the cost trend rate gradually declines to | % | % | |||||||||
| Year that the rate reaches the ultimate rate | |||||||||||
For post-65 retirees, we provide a fixed dollar benefit, which is not subject to escalation.
We expect to make payments of approximately $3 million for each of the next five years under the provisions of our other postretirement benefit plans.
82
NOTE 14. INCOME TAXES
| Years ended December 31, | |||||||||||||||||
| 2021 | 2020 | 2019 | |||||||||||||||
| Components of Income (Loss) Before Taxes | ($ in millions) | ||||||||||||||||
| Domestic | $ | $ | ( | $ | ( | ||||||||||||
| Foreign | ( | ||||||||||||||||
| Income (loss) before taxes | $ | $ | ( | $ | ( | ||||||||||||
| Components of Income Tax Provision (Benefit) | |||||||||||||||||
| Current provision (benefit): | |||||||||||||||||
| Federal | $ | $ | ( | $ | |||||||||||||
| State | |||||||||||||||||
| Foreign | |||||||||||||||||
| ( | |||||||||||||||||
| Deferred provision (benefit): | |||||||||||||||||
| Federal | ( | ( | |||||||||||||||
| State | ( | ( | |||||||||||||||
| Foreign | ( | ( | |||||||||||||||
| ( | ( | ( | |||||||||||||||
| Income tax provision (benefit) | $ | $ | ( | $ | ( | ||||||||||||
The following table accounts for the difference between the actual tax provision and the amounts obtained by applying the statutory U.S. federal income tax rate to the income (loss) before taxes.
| Years ended December 31, | |||||||||||||||||
| Effective Tax Rate Reconciliation (Percent) | 2021 | 2020 | 2019 | ||||||||||||||
| Statutory federal tax rate | % | % | % | ||||||||||||||
| State income taxes, net | ( | ||||||||||||||||
| Foreign rate differential | ( | ||||||||||||||||
| U.S. tax on foreign earnings | ( | ||||||||||||||||
| Salt depletion | ( | ||||||||||||||||
| Change in valuation allowance | ( | ( | ( | ||||||||||||||
| Remeasurement of U.S. state deferred taxes | ( | ||||||||||||||||
| Change in tax contingencies | |||||||||||||||||
| Share-based payments | ( | ||||||||||||||||
| Dividends paid to Contributing Employee Ownership Plan | |||||||||||||||||
| Return to provision | ( | ||||||||||||||||
| U.S. federal tax credits | |||||||||||||||||
| Goodwill impairment charge | ( | ||||||||||||||||
| Other, net | ( | ||||||||||||||||
| Effective tax rate | % | % | % | ||||||||||||||
The effective tax rate for 2021 included benefits from a net decrease in the valuation allowance related to deferred tax assets in foreign jurisdictions and domestic tax credits, a benefit associated with prior year tax positions, a benefit associated with stock-based compensation, an expense from remeasurement of deferred taxes due to an increase in our state effective tax rates and an expense from a change in tax contingencies. These factors resulted in a net $103.6 million tax benefit. After giving consideration to these items, the effective tax rate for 2021 of 22.5 % was higher than the 21 % U.S. federal statutory rate primarily due to state taxes, foreign income inclusions and foreign income taxes, partially offset by a net decrease in the valuation allowance related to utilization of losses in foreign jurisdictions and favorable permanent salt depletion deductions.
83
The effective tax rate for 2020 included expenses associated with a net increase in the valuation allowance related to foreign and domestic tax credits and deferred tax assets in foreign jurisdictions, a remeasurement of deferred taxes due to an increase in our state effective tax rates and a change in tax contingencies, and stock-based compensation, partially offset by a benefit associated with prior year tax positions. These factors resulted in a net $27.9 million tax expense. For 2020, a tax benefit of $10.8 million was recognized associated with the $699.8 million goodwill impairment charge. After giving consideration to these items, including the goodwill impairment charge on Olin’s loss before taxes, the effective tax rate for 2020 of 21.0 % was equal to the 21.0 % U.S. federal statutory rate as foreign income taxes, foreign income inclusions and a net increase in the valuation allowance related to losses in foreign jurisdictions were offset by state taxes and favorable permanent salt depletion deductions.
The effective tax rate for 2019 included benefits associated with the finalization of the Internal Revenue Service (IRS) review of years 2013 to 2015 U.S. income tax claims, stock-based compensation, prior year tax positions, foreign tax law changes, a remeasurement of deferred taxes due to a decrease in our state effective tax rates and a change in tax contingencies. The effective tax rate also included expenses associated with a net increase in the valuation allowance primarily related to foreign deferred tax assets and liabilities. These factors resulted in a net $19.4 million tax benefit. After giving consideration to these items, the effective tax rate for 2019 of 16.8 % was lower than the 21.0 % U.S. federal statutory rate primarily due to state taxes and a net increase in the valuation allowance related to losses in foreign jurisdictions, partially offset by foreign income taxes and favorable permanent salt depletion deductions.
| December 31, | |||||||||||
| Components of Deferred Tax Assets and Liabilities | 2021 | 2020 | |||||||||
| Deferred tax assets: | ($ in millions) | ||||||||||
| Pension and postretirement benefits | $ | $ | |||||||||
| Environmental reserves | |||||||||||
| Asset retirement obligations | |||||||||||
| Accrued liabilities | |||||||||||
| Lease liabilities | |||||||||||
| Tax credits | |||||||||||
| Net operating losses | |||||||||||
| Capital loss carryforward | |||||||||||
| Interest deduction limitation | |||||||||||
| Total deferred tax assets | |||||||||||
| Valuation allowance | ( | ( | |||||||||
| Net deferred tax assets | |||||||||||
| Deferred tax liabilities: | |||||||||||
| Property, plant and equipment | |||||||||||
| Right-of-use lease assets | |||||||||||
| Intangible amortization | |||||||||||
| Inventory and prepaids | |||||||||||
| Partnerships | |||||||||||
| Taxes on unremitted earnings | |||||||||||
| Other miscellaneous items | |||||||||||
| Total deferred tax liabilities | |||||||||||
| Net deferred tax liability | $ | ( | $ | ( | |||||||
Realization of the net deferred tax assets, irrespective of indefinite-lived deferred tax liabilities, is dependent on future reversals of existing taxable temporary differences and adequate future taxable income, exclusive of reversing temporary differences and carryforwards. Although realization is not assured, we believe that it is more likely than not that the net deferred tax assets will be realized.
At December 31, 2021, we had deferred state tax assets of $14.2 million relating to state NOLs, which will expire in years 2022 through 2042, if not utilized.
84
At December 31, 2021, we had deferred state tax assets of $21.2 million relating to state tax credits, which will expire in years 2022 through 2036, if not utilized.
At December 31, 2021, we had a capital loss carryforward of $2.2 million (representing $0.5 million of deferred tax assets) which is available to offset future consolidated capital gains that will expire in years 2022 through 2025, if not utilized.
At December 31, 2021, we had foreign tax credits of $18.5 million, that will expire in years 2027 through 2031, if not utilized.
At December 31, 2021, we had NOLs of approximately $39.2 million (representing $8.4 million of deferred tax assets) in various foreign jurisdictions. Of these, $30.8 million (representing $7.0 million of deferred tax assets) expire in various years from 2023 to 2031. The remaining $8.4 million (representing $1.4 million of deferred tax assets) do not expire.
As of December 31, 2021, we had recorded a valuation allowance of $70.1 million, compared to $239.6 million as of December 31, 2020. The decrease of $169.5 million is primarily due to a release of the $156.9 million valuation allowance related to deferred tax assets of our German operations, of which $103.8 million was released in the second quarter of 2021. As a result of significant taxable income during the first six months of 2021, our German operations reported cumulative income before tax (adjusted for permanent items) over the previous twelve quarters. Additionally, we projected taxable income in our German operations for the remainder of 2021 and we expected that net operating loss carryovers and other deductible amounts in Germany would ultimately be realizable against future income. We concluded, based upon the preponderance of positive evidence over negative evidence and the anticipated ability to use the deferred tax assets, that it was more likely than not that the deferred tax assets in Germany would be realizable due to U.S. GAAP forecasted income. If there are unfavorable changes to actual operating results or to projections of future income, we may determine that it is more likely than not such deferred tax assets may not be realizable. All German net operating loss carryovers were realized in 2021.
We continue to have net deferred tax assets in several jurisdictions which we expect to realize, assuming sufficient taxable income can be generated to utilize these deferred tax benefits, which is based on certain estimates and assumptions. If these estimates and related assumptions change in the future, we may be required to reduce the value of the deferred tax assets resulting in additional tax expense.
The activity of our deferred income tax valuation allowance was as follows:
| December 31, | |||||||||||
| 2021 | 2020 | ||||||||||
| ($ in millions) | |||||||||||
| Beginning balance | $ | $ | |||||||||
| Increases to valuation allowances | |||||||||||
| Decreases to valuation allowances | ( | ( | |||||||||
| Foreign currency translation adjustments | ( | ||||||||||
| Ending balance | $ | $ | |||||||||
85
As of December 31, 2021, we had $43.4 million of gross unrecognized tax benefits, which would have a net $43.6 million impact on the effective tax rate, if recognized. As of December 31, 2020, we had $21.3 million of gross unrecognized tax benefits, which would have a net $21.2 million impact on the effective tax rate, if recognized. The change for both 2021 and 2020 primarily relates to additional gross unrecognized benefits for current and prior year tax positions, as well as decreases for prior year tax positions. The amounts of unrecognized tax benefits were as follows:
| December 31, | |||||||||||
| 2021 | 2020 | ||||||||||
| ($ in millions) | |||||||||||
| Beginning balance | $ | $ | |||||||||
| Increase for current year tax positions | |||||||||||
| Increase for prior year tax positions | |||||||||||
| Decrease for prior year tax positions | ( | ( | |||||||||
| Reduction due to lapse in statute of limitations | ( | ||||||||||
| Foreign currency translation adjustments | ( | ||||||||||
| Ending balance | $ | $ | |||||||||
We recognize interest and penalty expense related to unrecognized tax positions as a component of the income tax provision. As of December 31, 2021 and 2020, interest and penalties accrued were $0.5 million and $0.1 million, respectively. For 2021, 2020 and 2019, we recorded expense (benefit) related to interest and penalties of $0.5 million, $(0.1 ) million and $(1.5 ) million, respectively.
As of December 31, 2021, we believe it is reasonably possible that our total amount of unrecognized tax benefits will decrease by approximately $13.5 million over the next twelve months. The anticipated reduction primarily relates to settlements with tax authorities and the expiration of federal, state and foreign statutes of limitation.
We operate globally and file income tax returns in numerous jurisdictions. Our tax returns are subject to examination by various federal, state and local tax authorities. Additionally, examinations are ongoing in various states and foreign jurisdictions. We believe we have adequately provided for all tax positions; however, amounts asserted by taxing authorities could be greater than our accrued position. For our primary tax jurisdictions, the tax years that remain subject to examination are as follows:
| Tax Years | |||||
| U.S. federal income tax | 2018 - 2020 | ||||
| U.S. state income tax | 2012 - 2020 | ||||
| Canadian federal income tax | 2013 - 2020 | ||||
| Brazil | 2015 - 2020 | ||||
| Germany | 2015 - 2020 | ||||
| China | 2014 - 2020 | ||||
| The Netherlands | 2015 - 2020 | ||||
86
NOTE 15. ACCRUED LIABILITIES
Included in accrued liabilities were the following:
| December 31, | |||||||||||
| 2021 | 2020 | ||||||||||
| ($ in millions) | |||||||||||
| Accrued compensation and payroll taxes | $ | $ | |||||||||
| Tax-related accruals | |||||||||||
| Accrued interest | |||||||||||
| Legal and professional costs | |||||||||||
| Accrued employee benefits | |||||||||||
| Manufacturing related accruals | |||||||||||
| Environmental (current portion only) | |||||||||||
| Asset retirement obligation (current portion only) | |||||||||||
| Restructuring reserves (current portion only) | |||||||||||
| Other | |||||||||||
| Accrued liabilities | $ | $ | |||||||||
NOTE 16. CONTRIBUTING EMPLOYEE OWNERSHIP PLAN
The Contributing Employee Ownership Plan (CEOP) is a defined contribution plan available to essentially all domestic employees. We provide a contribution to an individual retirement contribution account maintained with the CEOP equal to an amount of between 5.0 % and 7.5 % of the employee’s eligible compensation. The defined contribution plan expense was $35.4 million, $30.6 million and $29.9 million for 2021, 2020 and 2019, respectively.
Company matching contributions are invested in the same investment allocation as the employee’s contribution. Our matching contributions for eligible employees amounted to $14.2 million, $3.7 million and $15.8 million in 2021, 2020 and 2019, respectively. Effective January 1, 2020, we suspended the match on all salaried and non-bargaining hourly employees’ contributions, and moved to a discretionary contribution model with contributions contingent upon company-wide financial performance. For the year ended December 31, 2020, we did not make a discretionary matching contribution. Effective January 1, 2021, we reinstated the match on all salaried and non-bargaining hourly employees’ contributions, which provides for a maximum 3 % matching contribution based on the level of participant contributions.
Employees generally become vested in the value of the contributions we make to the CEOP according to a schedule based on service. After 2 years of service, participants are 25 % vested. They vest in increments of 25 % for each additional year and after 5 years of service, they are 100 % vested in the value of the contributions that we have made to their accounts.
Employees may transfer any or all of the value of the investments, including Olin common stock, to any one or combination of investments available in the CEOP. Employees may transfer balances daily and may elect to transfer any percentage of the balance in the fund from which the transfer is made. However, when transferring out of a fund, employees are prohibited from trading out of the fund to which the transfer was made for calendar days. This limitation does not apply to trades into the money market fund or the Olin Common Stock Fund.
87
NOTE 17. STOCK-BASED COMPENSATION
Stock-based compensation expense was allocated to the operating segments for the portion related to employees whose compensation would be included in cost of goods sold with the remainder recognized in corporate/other. There were no significant capitalized stock-based compensation costs. Stock-based compensation granted includes stock options, performance stock awards, restricted stock awards and deferred directors’ compensation. Stock-based compensation expense was as follows:
| Years ended December 31, | |||||||||||||||||
| 2021 | 2020 | 2019 | |||||||||||||||
| ($ in millions) | |||||||||||||||||
| Stock-based compensation | $ | $ | $ | ||||||||||||||
| Mark-to-market adjustments | ( | ||||||||||||||||
| Total expense | $ | $ | $ | ||||||||||||||
Stock Plans
Under the stock option and long-term incentive plans, options may be granted to purchase shares of our common stock at an exercise price not less than fair market value at the date of grant, and are exercisable for a period not exceeding ten years from that date. Stock options, restricted stock and performance shares typically vest over three years . We issue shares to settle stock options, restricted stock and share-based performance awards. In 2021, 2020 and 2019, long-term incentive awards included stock options, performance share awards and restricted stock. The stock option exercise price was set at the fair market value of common stock on the date of the grant, and the options have a ten-year term.
Stock option transactions were as follows:
| Exercisable | |||||||||||||||||||||||||||||
| Shares | Option Price | Weighted-Average Option Price | Options | Weighted-Average Exercise Price | |||||||||||||||||||||||||
| Outstanding at January 1, 2021 | $13.14-32.94 | $ | $ | ||||||||||||||||||||||||||
| Granted | 28.99-58.59 | ||||||||||||||||||||||||||||
| Exercised | ( | 13.14-32.94 | |||||||||||||||||||||||||||
| Canceled | ( | 13.14-32.94 | |||||||||||||||||||||||||||
| Outstanding at December 31, 2021 | 13.14-58.59 | $ | $ | ||||||||||||||||||||||||||
At December 31, 2021, the average exercise period for all outstanding and exercisable options was 79 months and 66 months, respectively. At December 31, 2021, the aggregate intrinsic value (the difference between the exercise price and market value) for outstanding options was $189.6 million, which includes exercisable options of $115.7 million. The total intrinsic value of options exercised during the years ended December 31, 2021, 2020 and 2019 was $73.1 million, $0.6 million and $1.3 million, respectively.
The total unrecognized compensation cost related to unvested stock options at December 31, 2021 was $9.9 million and was expected to be recognized over a weighted-average period of 1.2 years.
The following table provides certain information with respect to stock options exercisable at December 31, 2021:
| Range of Exercise Prices | Options Exercisable | Weighted-Average Exercise Price | Options Outstanding | Weighted-Average Exercise Price | ||||||||||||||||||||||
| Under $22.00 | $ | $ | ||||||||||||||||||||||||
| $22.00 - $28.00 | ||||||||||||||||||||||||||
| Over $28.00 | ||||||||||||||||||||||||||
88
At December 31, 2021, common shares reserved for issuance and available for grant or purchase under the following plans consisted of:
| Number of Shares | |||||||||||
| Stock Option Plans | Reserved for Issuance | Available for Grant or Purchase(1) | |||||||||
| 2000 long term incentive plan | |||||||||||
| 2003 long term incentive plan | |||||||||||
| 2006 long term incentive plan | |||||||||||
| 2009 long term incentive plan | |||||||||||
| 2014 long term incentive plan | |||||||||||
| 2016 long term incentive plan | |||||||||||
| 2018 long term incentive plan | |||||||||||
| 2021 long term incentive plan | |||||||||||
| Total under stock option plans | |||||||||||
| Number of Shares | |||||||||||
| Stock Purchase Plans | Reserved for Issuance | Available for Grant or Purchase | |||||||||
| 1997 stock plan for non-employee directors | |||||||||||
(1)All available to be issued as stock options, but includes a sub-limit for all types of stock awards of 2,952,130 shares.
Under the stock purchase plans, our non-employee directors may defer certain elements of their compensation into shares of our common stock based on fair market value of the shares at the time of deferral. Non-employee directors annually receive stock grants as a portion of their director compensation. Of the shares reserved under the stock purchase plans at December 31, 2021, 243,225 shares were committed.
Performance share awards are denominated in shares of our stock and are paid half in cash and half in stock. Payouts for performance share awards are based on two criteria: (1) 50% of the award is based on Olin’s total shareholder returns over the applicable three -year performance cycle in relation to the total shareholder return over the same period among a portfolio of public companies which are selected in concert with outside compensation consultants and (2) 50% of the award is based on Olin’s net income over the applicable three -year performance cycle in relation to the net income goal for such period as set by the compensation committee of Olin’s board of directors. The expense associated with performance shares is recorded based on our estimate of our performance relative to the respective target. If an employee leaves the company before the end of the performance cycle, the performance shares may be prorated based on the number of months of the performance cycle worked and are settled in cash instead of half in cash and half in stock when the three-year performance cycle is completed. Granted shares reflects changes in assumptions associated with the expected achievement of the aforementioned criteria. Performance share transactions were as follows:
| To Settle in Cash | To Settle in Shares | ||||||||||||||||||||||
| Shares | Weighted-Average Fair Value per Share | Shares | Weighted-Average Fair Value per Share | ||||||||||||||||||||
| Outstanding at January 1, 2021 | $ | $ | |||||||||||||||||||||
| Granted | |||||||||||||||||||||||
| Paid/Issued | ( | ( | |||||||||||||||||||||
| Converted from shares to cash | ( | ||||||||||||||||||||||
| Canceled | ( | ( | |||||||||||||||||||||
| Outstanding at December 31, 2021 | $ | $ | |||||||||||||||||||||
| Total vested at December 31, 2021 | $ | $ | |||||||||||||||||||||
89
The summary of the status of our unvested performance shares to be settled in cash were as follows:
| Shares | Weighted-Average Fair Value per Share | ||||||||||
| Unvested at January 1, 2021 | $ | ||||||||||
| Granted | |||||||||||
| Vested | ( | ||||||||||
| Canceled | ( | ||||||||||
| Unvested at December 31, 2021 | $ | ||||||||||
At December 31, 2021, the liability recorded for performance shares to be settled in cash totaled $34.1 million. The total unrecognized compensation cost related to unvested performance shares at December 31, 2021 was $15.4 million and was expected to be recognized over a weighted-average period of 1.7 years.
NOTE 18. SHAREHOLDERS’ EQUITY
On April 26, 2018, our board of directors authorized a share repurchase program for the purchase of shares of common stock at an aggregate price of up to $500.0 million. This program will terminate upon the purchase of $500.0 million of our common stock. On November 1, 2021, our board of directors authorized an additional share repurchase program for the purchase of shares of common stock at an aggregate price of up to $1.0 billion. This program will terminate upon the purchase of $1.0 billion of our common stock.
For the year ended December 31, 2021, 4.7 million were repurchased and retired at a cost of $251.9 million. On August 5, 2019, we entered into an accelerated share repurchase (ASR) agreement with Goldman Sachs & Co. LLC, a third-party financial institution, to repurchase $100.0 million of Olin’s common stock. This authorization was granted under the April 26, 2018 share repurchase program and reduced the remaining authorized repurchase amount under that program by $100.0 million. In connection with this agreement, we repurchased a total of 5.7 million shares under this ASR agreement. For the year ended December 31, 2019, 8.0 million shares were repurchased and retired at a cost of $145.9 million.
As of December 31, 2021, a cumulative total of 14.7 million shares were repurchased and retired at a cost of $447.8 million and $52.2 million of common stock remained authorized to be repurchased under the 2018 Repurchase Authorization program. As of December 31, 2021, there have been no repurchases under the 2021 Repurchase Authorization program and $1.0 billion of common stock remained authorized to be repurchased under this plan.
During 2021, 2020 and 2019, we issued 3.4 million, 0.1 million and 0.1 million shares, respectively, with a total value of $72.4 million, $1.9 million and $1.7 million, respectively, representing stock options exercised.
We have registered an undetermined amount of securities with the SEC, so that, from time-to-time, we may issue debt securities, preferred stock and/or common stock and associated warrants in the public market under that registration statement.
90
The following table represents the activity included in accumulated other comprehensive loss:
| Foreign Currency Translation Adjustment (net of taxes) | Unrealized Gains (Losses) on Derivative Contracts (net of taxes) | Pension and Other Postretirement Benefits (net of taxes) | Accumulated Other Comprehensive Loss | ||||||||||||||||||||
| ($ in millions) | |||||||||||||||||||||||
| Balance at January 1, 2019 | $ | $ | $ | ( | $ | ( | |||||||||||||||||
| Unrealized losses | ( | ( | ( | ( | |||||||||||||||||||
| Reclassification adjustments of losses into income | |||||||||||||||||||||||
| Tax benefit | |||||||||||||||||||||||
| Net change | ( | ( | ( | ( | |||||||||||||||||||
| Balance at December 31, 2019 | ( | ( | ( | ( | |||||||||||||||||||
| Unrealized gains | |||||||||||||||||||||||
| Reclassification adjustments of losses into income | |||||||||||||||||||||||
| Tax provision | ( | ( | ( | ||||||||||||||||||||
| Net change | |||||||||||||||||||||||
| Balance at December 31, 2020 | ( | ( | |||||||||||||||||||||
| Unrealized (losses) gains | ( | ||||||||||||||||||||||
| Reclassification adjustments of (gains) losses into income | ( | ( | |||||||||||||||||||||
| Tax provision | ( | ( | ( | ||||||||||||||||||||
| Net change | ( | ||||||||||||||||||||||
| Balance at December 31, 2021 | $ | ( | $ | $ | ( | $ | ( | ||||||||||||||||
Net income (loss), interest expense and cost of goods sold included reclassification adjustments for realized gains and losses on derivative contracts from accumulated other comprehensive loss.
Net income (loss) and non-operating pension income included the amortization of prior service costs and actuarial losses from accumulated other comprehensive loss.
91
NOTE 19. SEGMENT INFORMATION
We define segment results as income (loss) before interest expense, interest income, goodwill impairment charges, other operating income (expense), non-operating pension income, other income and income taxes, and includes the operating results of non-consolidated affiliates. Consistent with the guidance in ASC 280 “Segment Reporting,” we have determined it is appropriate to include the operating results of non-consolidated affiliates in the relevant segment financial results. We have three operating segments: Chlor Alkali Products and Vinyls, Epoxy and Winchester. The three operating segments reflect the organization used by our management for purposes of allocating resources and assessing performance. Chlorine used in our Epoxy segment is transferred at cost from the Chlor Alkali Products and Vinyls segment.
| Years ended December 31, | |||||||||||||||||
| 2021 | 2020 | 2019 | |||||||||||||||
| Sales: | ($ in millions) | ||||||||||||||||
| Chlor Alkali Products and Vinyls | $ | $ | $ | ||||||||||||||
| Epoxy | |||||||||||||||||
| Winchester | |||||||||||||||||
| Total sales | $ | $ | $ | ||||||||||||||
| Income (loss) before taxes: | |||||||||||||||||
| Chlor Alkali Products and Vinyls | $ | $ | $ | ||||||||||||||
| Epoxy | |||||||||||||||||
| Winchester | |||||||||||||||||
| Corporate/Other: | |||||||||||||||||
| Environmental expense | ( | ( | ( | ||||||||||||||
| Other corporate and unallocated costs | ( | ( | ( | ||||||||||||||
| Restructuring charges | ( | ( | ( | ||||||||||||||
| Goodwill impairment | ( | ||||||||||||||||
| Other operating income | |||||||||||||||||
| Interest expense | ( | ( | ( | ||||||||||||||
| Interest income | |||||||||||||||||
| Non-operating pension income | |||||||||||||||||
| Other income | |||||||||||||||||
| Income (loss) before taxes | $ | $ | ( | $ | ( | ||||||||||||
| Depreciation and amortization expense: | |||||||||||||||||
| Chlor Alkali Products and Vinyls | $ | $ | $ | ||||||||||||||
| Epoxy | |||||||||||||||||
| Winchester | |||||||||||||||||
| Corporate/Other | |||||||||||||||||
| Total depreciation and amortization expense | $ | $ | $ | ||||||||||||||
| Capital spending: | |||||||||||||||||
| Chlor Alkali Products and Vinyls | $ | $ | $ | ||||||||||||||
| Epoxy | |||||||||||||||||
| Winchester | |||||||||||||||||
| Corporate/Other | |||||||||||||||||
| Total capital spending | $ | $ | $ | ||||||||||||||
92
Segment assets include only those assets which are directly identifiable to an operating segment. Assets of the corporate/other segment include primarily such items as cash and cash equivalents, deferred taxes and other assets.
| December 31, | |||||||||||
| 2021 | 2020 | ||||||||||
| Assets: | ($ in millions) | ||||||||||
| Chlor Alkali Products and Vinyls | $ | $ | |||||||||
| Epoxy | |||||||||||
| Winchester | |||||||||||
| Corporate/Other | |||||||||||
| Total assets | $ | $ | |||||||||
Property, plant and equipment is attributed to geographic areas based on asset location and sales are attributed to geographic areas based on customer location.
| December 31, | |||||||||||
| 2021 | 2020 | ||||||||||
| Property, plant and equipment: | ($ in millions) | ||||||||||
| United States | $ | $ | |||||||||
| Foreign | |||||||||||
| Total property, plant and equipment | $ | $ | |||||||||
| Years ended December 31, | |||||||||||||||||
| 2021 | 2020 | 2019 | |||||||||||||||
| Sales by geography: | ($ in millions) | ||||||||||||||||
| Chlor Alkali Products and Vinyls | |||||||||||||||||
| United States | $ | $ | $ | ||||||||||||||
| Europe | |||||||||||||||||
| Other foreign | |||||||||||||||||
| Total Chlor Alkali Products and Vinyls | |||||||||||||||||
| Epoxy | |||||||||||||||||
| United States | |||||||||||||||||
| Europe | |||||||||||||||||
| Other foreign | |||||||||||||||||
| Total Epoxy | |||||||||||||||||
| Winchester | |||||||||||||||||
| United States | |||||||||||||||||
| Europe | |||||||||||||||||
| Other foreign | |||||||||||||||||
| Total Winchester | |||||||||||||||||
| Total | |||||||||||||||||
| United States | |||||||||||||||||
| Europe | |||||||||||||||||
| Other foreign | |||||||||||||||||
| Total sales | $ | $ | $ | ||||||||||||||
93
| Years ended December 31, | |||||||||||||||||
| 2021 | 2020 | 2019 | |||||||||||||||
| Sales by product line: | ($ in millions) | ||||||||||||||||
| Chlor Alkali Products and Vinyls | |||||||||||||||||
| Caustic soda | $ | $ | $ | ||||||||||||||
| Chlorine, chlorine derivatives and other products | |||||||||||||||||
| Total Chlor Alkali Products and Vinyls | |||||||||||||||||
| Epoxy | |||||||||||||||||
| Aromatics and allylics | |||||||||||||||||
| Epoxy resins | |||||||||||||||||
| Total Epoxy | |||||||||||||||||
| Winchester | |||||||||||||||||
| Commercial | |||||||||||||||||
| Military and law enforcement | |||||||||||||||||
| Total Winchester | |||||||||||||||||
| Total sales | $ | $ | $ | ||||||||||||||
NOTE 20. ENVIRONMENTAL
As is common in our industry, we are subject to environmental laws and regulations related to the use, storage, handling, generation, transportation, emission, discharge, disposal and remediation of, and exposure to, hazardous and non-hazardous substances and wastes in all of the countries in which we do business.
The establishment and implementation of national, state or provincial and local standards to regulate air, water and land quality affect substantially all of our manufacturing locations around the world. Laws providing for regulation of the manufacture, transportation, use and disposal of hazardous and toxic substances, and remediation of contaminated sites, have imposed additional regulatory requirements on industry, particularly the chemicals industry. In addition, implementation of environmental laws has required and will continue to require new capital expenditures and will increase plant operating costs. We employ waste minimization and pollution prevention programs at our manufacturing sites.
We are party to various government and private environmental actions associated with past manufacturing facilities and former waste disposal sites. Associated costs of investigatory and remedial activities are provided for in accordance with generally accepted accounting principles governing probability and the ability to reasonably estimate future costs. Our ability to estimate future costs depends on whether our investigatory and remedial activities are in preliminary or advanced stages. With respect to unasserted claims, we accrue liabilities for costs that, in our experience, we expect to incur to protect our interests against those unasserted claims. Our accrued liabilities for unasserted claims amounted to $9.0 million at December 31, 2021. With respect to asserted claims, we accrue liabilities based on remedial investigation, feasibility study, remedial action and operation, maintenance and monitoring (OM&M) expenses that, in our experience, we expect to incur in connection with the asserted claims. Required site OM&M expenses are estimated and accrued in their entirety for required periods not exceeding 30 years, which reasonably approximates the typical duration of long-term site OM&M.
Our liabilities for future environmental expenditures were as follows:
| December 31, | |||||||||||
| 2021 | 2020 | ||||||||||
| ($ in millions) | |||||||||||
| Beginning balance | $ | $ | |||||||||
| Charges to income | |||||||||||
| Remedial and investigatory spending | ( | ( | |||||||||
| Foreign currency translation adjustments | |||||||||||
| Ending balance | $ | $ | |||||||||
94
At December 31, 2021 and 2020, our consolidated balance sheets included environmental liabilities of $122.3 million and $128.2 million, respectively, which were classified as other noncurrent liabilities. Our environmental liability amounts do not take into account any discounting of future expenditures or any consideration of insurance recoveries or advances in technology. These liabilities are reassessed periodically to determine if environmental circumstances have changed and/or remediation efforts and our estimate of related costs have changed. As a result of these reassessments, future charges to income may be made for additional liabilities. Of the $147.3 million included on our consolidated balance sheet at December 31, 2021 for future environmental expenditures, we currently expect to utilize $75.1 million of the reserve for future environmental expenditures over the next 5 years, $39.9 million for expenditures 6 to 10 years in the future, and $32.3 million for expenditures beyond 10 years in the future.
Our total estimated environmental liability at December 31, 2021 was attributable to 58 sites, 14 of which were United States Environmental Protection Agency National Priority List sites. Nine sites accounted for 81 % of our environmental liability and, of the remaining 49 sites, no one site accounted for more than 3 % of our environmental liability. At seven of the nine sites, part of the site is in the long-term OM&M stage. At seven of the nine sites, a remedial action plan is being developed for part of the site. At five of the nine sites, a remedial design is being developed at part of the site and at four of the nine sites, part of the site is subject to a remedial investigation. All nine sites are either associated with past manufacturing operations or former waste disposal sites. None of the nine largest sites represents more than 22 % of the liabilities reserved on our consolidated balance sheet at December 31, 2021 for future environmental expenditures.
Environmental provisions charged to income, which are included in cost of goods sold, were as follows:
| Years ended December 31, | |||||||||||||||||
| 2021 | 2020 | 2019 | |||||||||||||||
| ($ in millions) | |||||||||||||||||
| Provisions charged to income | $ | $ | $ | ||||||||||||||
| Insurance recoveries for costs incurred and expensed | ( | ( | |||||||||||||||
| Environmental expense | $ | $ | $ | ||||||||||||||
Environmental expense for the years ended December 31, 2021 and 2019 included $2.2 million and $4.8 million, respectively, of insurance recoveries for environmental costs incurred and expensed in prior periods.
These charges relate primarily to remedial and investigatory activities associated with past manufacturing operations and former waste disposal sites and may be material to operating results in future years.
Annual environmental-related cash outlays for site investigation and remediation are expected to range between approximately $20 million to $30 million over the next several years, which are expected to be charged against reserves recorded on our consolidated balance sheet. While we do not anticipate a material increase in the projected annual level of our environmental-related cash outlays for site investigation and remediation, there is always the possibility that such an increase may occur in the future in view of the uncertainties associated with environmental exposures. Environmental exposures are difficult to assess for numerous reasons, including the identification of new sites, developments at sites resulting from investigatory studies, advances in technology, changes in environmental laws and regulations and their application, changes in regulatory authorities, the scarcity of reliable data pertaining to identified sites, the difficulty in assessing the involvement and financial capability of other Potentially Responsible Parties (PRPs), our ability to obtain contributions from other parties and the lengthy time periods over which site remediation occurs. It is possible that some of these matters (the outcomes of which are subject to various uncertainties) may be resolved unfavorably to us, which could materially adversely affect our financial position or results of operations. At December 31, 2021, we estimate that it is reasonably possible that we may have additional contingent environmental liabilities of $70 million in addition to the amounts for which we have already recorded as a reserve.
NOTE 21. LEASES
Our lease commitments are primarily for railcars, but also include logistics, manufacturing, storage, real estate and information technology assets. Our leases have remaining lease terms of up to 93 years (16 years excluding land leases), some of which may include options to extend the leases for up to five years , and some of which may include options to terminate the leases within one year .
95
The amounts for leases included in our consolidated balance sheet include:
| December 31, | ||||||||||||||
| 2021 | 2020 | |||||||||||||
| Lease assets: | Balance sheet location: | ($ in millions) | ||||||||||||
| Operating | Operating lease assets, net | $ | $ | |||||||||||
| Finance | Property, plant and equipment, less accumulated depreciation(1) | |||||||||||||
| Total lease assets | $ | $ | ||||||||||||
| Lease liabilities: | ||||||||||||||
| Current | ||||||||||||||
| Operating | Current operating lease liabilities | $ | $ | |||||||||||
| Finance | Current installments of long-term debt | |||||||||||||
| Long-term | ||||||||||||||
| Operating | Operating lease liabilities | |||||||||||||
| Finance | Long-term debt | |||||||||||||
| Total lease liabilities | $ | $ | ||||||||||||
(1) As of December 31, 2021 and 2020, assets recorded under finance leases were $7.6 million and $8.0 million, respectively, and accumulated depreciation associated with finance leases was $4.3 million and $3.5 million, respectively.
The components of lease expense are recorded to cost of goods sold and selling and administration expenses in the consolidated statement of operations, excluding interest on finance lease liabilities which is recorded to interest expense. The components of lease expense were as follows:
| Years Ended December 31, | |||||||||||||||||
| 2021 | 2020 | 2019 | |||||||||||||||
| Lease expense: | ($ in millions) | ||||||||||||||||
| Operating | $ | $ | $ | ||||||||||||||
Other operating lease expense(1) | |||||||||||||||||
| Finance: | |||||||||||||||||
| Depreciation of leased assets | |||||||||||||||||
| Interest on lease liabilities | |||||||||||||||||
| Total lease expense | $ | $ | $ | ||||||||||||||
(1) Includes costs associated with short-term leases and variable lease expenses.
96
The maturities of lease liabilities were as follows:
| December 31, 2021 | |||||||||||||||||
| Operating leases | Finance leases | Total | |||||||||||||||
| ($ in millions) | |||||||||||||||||
| 2022 | $ | $ | $ | ||||||||||||||
| 2023 | |||||||||||||||||
| 2024 | |||||||||||||||||
| 2025 | |||||||||||||||||
| 2026 | |||||||||||||||||
| Thereafter | |||||||||||||||||
| Total lease payments | |||||||||||||||||
Less: Imputed interest(1) | ( | ( | ( | ||||||||||||||
| Present value of lease liabilities | $ | $ | $ | ||||||||||||||
(1) Calculated using the discount rate for each lease.
Other information related to leases was as follows:
| Years Ended December 31, | |||||||||||||||||
| 2021 | 2020 | 2019 | |||||||||||||||
| Supplemental cash flows information: | ($ in millions) | ||||||||||||||||
| Cash paid for amounts included in the measurement of lease liabilities: | |||||||||||||||||
| Operating cash flows from operating leases | $ | $ | $ | ||||||||||||||
| Operating cash flows from finance leases | |||||||||||||||||
| Financing cash flows from finance leases | |||||||||||||||||
| Non-cash increase in lease assets and lease liabilities: | |||||||||||||||||
| Operating leases | $ | $ | $ | ||||||||||||||
| Finance leases | |||||||||||||||||
| December 31, | |||||||||||||||||
| Weighted-average remaining lease term: | 2021 | 2020 | 2019 | ||||||||||||||
| Operating leases | |||||||||||||||||
| Finance leases | |||||||||||||||||
| Weighted-average discount rate: | |||||||||||||||||
| Operating leases | % | % | % | ||||||||||||||
| Finance leases | % | % | % | ||||||||||||||
As of December 31, 2021, we have additional operating leases for railcars that have not yet commenced of approximately $28 million which are expected to commence during 2022 and 2023 with lease terms between 3 years and 10 years. We also have additional operating leases for logistics equipment and real estate that have not yet commenced of approximately $6 million which are expected to commence during 2022 with lease terms between 3 years and 5 years.
97
NOTE 22. COMMITMENTS AND CONTINGENCIES
The following table summarizes our contractual commitments under purchase contracts as of December 31, 2021:
| Purchase Commitments | |||||
| ($ in millions) | |||||
| 2022 | $ | ||||
| 2023 | |||||
| 2024 | |||||
| 2025 | |||||
| 2026 | |||||
| Thereafter | |||||
| Total commitments | $ | ||||
The above purchase commitments include raw material, capital expenditure and utility purchasing commitments utilized in our normal course of business for our projected needs.
Legal Matters
Olin, K.A. Steel Chemicals (a wholly owned subsidiary of Olin) and other alleged caustic soda producers were named as defendants in six purported class action civil lawsuits filed March 22, 25 and 26, 2019 and April 12, 2019 in the U.S. District Court for the Western District of New York on behalf of the respective named plaintiffs and a putative class comprised of all persons and entities who purchased caustic soda in the U.S. directly from one or more of the defendants, their parents, predecessors, subsidiaries or affiliates at any time on or after October 1, 2015. Olin, K.A. Steel Chemicals and other caustic soda producers were also named as defendants in two purported class action civil lawsuits filed July 25 and 29, 2019 in the U.S. District Court for the Western District of New York on behalf of the respective named plaintiffs and a putative class comprised of all persons and entities who purchased caustic soda in the U.S. indirectly from distributors at any time on or after October 1, 2015. The other defendants named in the lawsuits are Occidental Petroleum Corporation, Occidental Chemical Corporation d/b/a OxyChem, Westlake Chemical Corporation, Shin-Etsu Chemical Co., Ltd., Shintech Incorporated, Formosa Plastics Corporation, and Formosa Plastics Corporation, U.S.A. The lawsuits allege the defendants conspired to fix, raise, maintain and stabilize the price of caustic soda, restrict domestic (U.S.) supply of caustic soda and allocate caustic soda customers. Plaintiffs seek an unspecified amount of damages and injunctive relief.
Olin, K.A. Steel Chemical, Olin Canada ULC, 3229897 Nova Scotia Co. (wholly owned subsidiaries of Olin) and other alleged caustic soda producers were named as defendants in a proposed class action civil lawsuit filed on October 7, 2020 in the Quebec Superior Court (Province of Quebec) on behalf of the respective named plaintiff and a putative class comprised of all Canadian persons and entities who, between October 1, 2015 and the date of the eventual class action certification, directly or indirectly purchased caustic soda or products containing caustic soda, produced by one or more of the defendants. Olin, K.A. Steel Chemical, Olin Canada ULC, 3229897 Nova Scotia Co. and other alleged caustic soda producers were also named as defendants in a proposed class action civil lawsuit filed November 13, 2020 in the Federal Court of Canada on behalf of the respective named plaintiff and a putative class comprised of all legal persons in Canada who, at any time on or after October 1, 2015 to the present, directly or indirectly purchased caustic soda. The other defendants named in the two Canadian lawsuits are Occidental Petroleum Corporation, Occidental Chemical Corporation, Oxy Canada Sales, Inc., Westlake Chemical Corporation, Axiall Canada, Inc., Shin-Etsu Chemical Co., Ltd., Shintech Incorporated, Formosa Plastics Corporation, and Formosa Plastics Corporation, U.S.A. The lawsuits allege the defendants conspired to fix, raise, maintain control, and stabilize the price of caustic soda, divide and allocate markets, sales, customers and territories, fix, maintain, control, prevent, restrict, lessen or eliminate production and supply of caustic soda, and agree to idle capacity of production and/or refrain from increasing their production capacity. Plaintiffs seek an unspecified amount of damages, including punitive damages.
We believe we have meritorious legal positions and will continue to represent our interests vigorously in these matters. Any losses related to these matters are not currently estimable because of unresolved questions of fact and law, but if resolved unfavorably to Olin, could have a material adverse effect on our financial position, cash flows or results of operations.
We, and our subsidiaries, are defendants in various other legal actions (including proceedings based on alleged exposures to asbestos) incidental to our past and current business activities. At December 31, 2021 and 2020, our consolidated balance sheets included liabilities for these other legal actions of $14.2 million and $13.5 million, respectively. These liabilities do not
98
include costs associated with legal representation. Based on our analysis, and considering the inherent uncertainties associated with litigation, we do not believe that it is reasonably possible that these other legal actions will materially adversely affect our financial position, cash flows or results of operations.
During the ordinary course of our business, contingencies arise resulting from an existing condition, situation or set of circumstances involving an uncertainty as to the realization of a possible gain contingency. In certain instances such as environmental projects, we are responsible for managing the clean-up and remediation of an environmental site. There exists the possibility of recovering a portion of these costs from other parties. We account for gain contingencies in accordance with the provisions of ASC 450 “Contingencies” and therefore do not record gain contingencies and recognize income until it is earned and realizable.
NOTE 23. DERIVATIVE FINANCIAL INSTRUMENTS
We are exposed to market risk in the normal course of our business operations due to our purchases of certain commodities, our ongoing investing and financing activities and our operations that use foreign currencies. The risk of loss can be assessed from the perspective of adverse changes in fair values, cash flows and future earnings. We have established policies and procedures governing our management of market risks and the use of financial instruments to manage exposure to such risks. ASC 815 requires an entity to recognize all derivatives as either assets or liabilities in the consolidated balance sheets and measure those instruments at fair value. In accordance with ASC 815, we designate derivative contracts as cash flow hedges of forecasted purchases of commodities and forecasted interest payments related to variable-rate borrowings and designate certain interest rate swaps as fair value hedges of fixed-rate borrowings. We do not enter into any derivative instruments for trading or speculative purposes.
Energy costs, including electricity and natural gas, and certain raw materials used in our production processes are subject to price volatility. Depending on market conditions, we may enter into futures contracts, forward contracts, commodity swaps and put and call option contracts in order to reduce the impact of commodity price fluctuations. The majority of our commodity derivatives expire within one year.
We actively manage currency exposures that are associated with net monetary asset positions, currency purchases and sales commitments denominated in foreign currencies and foreign currency denominated assets and liabilities created in the normal course of business. We enter into forward sales and purchase contracts to manage currency risk to offset our net exposures, by currency, related to the foreign currency denominated monetary assets and liabilities of our operations. At December 31, 2021, we had outstanding forward contracts to buy foreign currency with a notional value of $199.0 million and to sell foreign currency with a notional value of $124.4 million. All of the currency derivatives expire within one year and are for USD equivalents. The counterparties to the forward contracts are large financial institutions; however, the risk of loss to us in the event of nonperformance by a counterparty could impact our financial position or results of operations. At December 31, 2020, we had outstanding forward contracts to buy foreign currency with a notional value of $169.9 million and to sell foreign currency with a notional value of $113.6 million.
Cash Flow Hedges
For derivative instruments that are designated and qualify as a cash flow hedge, the change in fair value of the derivative is recognized as a component of other comprehensive income (loss) until the hedged item is recognized in earnings.
We had the following notional amounts of outstanding commodity contracts that were entered into to hedge forecasted purchases:
| December 31, | |||||||||||
| 2021 | 2020 | ||||||||||
| ($ in millions) | |||||||||||
| Natural gas | $ | $ | |||||||||
| Ethane | |||||||||||
| Metals | |||||||||||
| Total notional | $ | $ | |||||||||
99
As of December 31, 2021, the counterparties to these commodity contracts were Wells Fargo Bank, N.A., Citibank, N.A., JPMorgan Chase Bank, National Association, and Bank of America Corporation, all of which are major financial institutions.
We use cash flow hedges for certain raw material and energy costs such as copper, zinc, lead, ethane, electricity and natural gas to provide a measure of stability in managing our exposure to price fluctuations associated with forecasted purchases of raw materials and energy used in our manufacturing process. At December 31, 2021, we had open derivative contract positions through 2027. If all open futures contracts had been settled on December 31, 2021, we would have recognized a pretax gain of $30.3 million.
If commodity prices were to remain at December 31, 2021 levels, approximately $17.3 million of deferred gains, net of tax, would be reclassified into earnings during the next twelve months. The actual effect on earnings will be dependent on actual commodity prices when the forecasted transactions occur.
We use interest rate swaps as a means of minimizing cash flow fluctuations that may arise from volatility in interest rates of our variable-rate borrowings. In July 2019, we terminated the remaining interest rate swaps designated as cash flow hedges which resulted in a gain of $1.8 million that was recognized in interest expense for the year ended December 31, 2019. For the year ended December 31, 2019, $4.3 million of income was recorded to interest expense on the accompanying consolidated statements of operations related to these swap agreements.
Fair Value Hedges
We use interest rate swaps as a means of managing interest expense and floating interest rate exposure to optimal levels. For derivative instruments that are designated and qualify as a fair value hedge, the gain or loss on the derivative as well as the offsetting loss or gain on the hedged item attributable to the hedged risk are recognized in current earnings. We include the gain or loss on the hedged items (fixed-rate borrowings) in the same line item, interest expense, as the offsetting loss or gain on the related interest rate swaps.
In August 2019, we terminated the interest rate swaps designated as fair value hedges which resulted in a loss of $2.3 million that was deferred as an offset to the carrying value of the related debt and was subsequently recognized to interest expense. In 2021, we redeemed the 2025 Notes, which resulted in recognition of the outstanding deferred swap loss. For the years ended December 31, 2021, 2020 and 2019, $1.8 million, $0.4 million and $2.6 million, respectively, of expense was recorded to interest expense on the accompanying consolidated statements of operations related to these swap agreements.
100
Financial Statement Impacts
We present our derivative assets and liabilities in our consolidated balance sheets on a net basis whenever we have a legally enforceable master netting agreement with the counterparty to our derivative contracts. We use these agreements to manage and substantially reduce our potential counterparty credit risk.
The following table summarizes the location and fair value of the derivative instruments on our consolidated balance sheets. The table disaggregates our net derivative assets and liabilities into gross components on a contract-by-contract basis before giving effect to master netting arrangements:
| December 31, | |||||||||||
| 2021 | 2020 | ||||||||||
| Asset Derivatives: | ($ in millions) | ||||||||||
| Other current assets | |||||||||||
| Derivatives designated as hedging instruments: | |||||||||||
| Commodity contracts - gains | $ | $ | |||||||||
| Commodity contracts - losses | ( | ( | |||||||||
| Derivatives not designated as hedging instruments: | |||||||||||
| Foreign exchange contracts - gains | |||||||||||
| Foreign exchange contracts - losses | ( | ( | |||||||||
| Total other current assets | |||||||||||
| Other assets | |||||||||||
| Derivatives designated as hedging instruments: | |||||||||||
| Commodity contracts - gains | |||||||||||
| Commodity contracts - losses | ( | ||||||||||
| Total other assets | |||||||||||
Total Asset Derivatives(1) | $ | $ | |||||||||
| Liability Derivatives: | |||||||||||
| Accrued liabilities | |||||||||||
| Derivatives designated as hedging instruments: | |||||||||||
| Commodity contracts - losses | $ | $ | |||||||||
| Commodity contracts - gains | ( | ( | |||||||||
| Derivatives not designated as hedging instruments: | |||||||||||
| Foreign exchange contracts - losses | |||||||||||
| Foreign exchange contracts - gains | ( | ||||||||||
| Total accrued liabilities | |||||||||||
| Other liabilities | |||||||||||
| Derivatives designated as hedging instruments: | |||||||||||
| Commodity contract - losses | |||||||||||
| Commodity contract - gains | ( | ||||||||||
| Total other liabilities | |||||||||||
Total Liability Derivatives(1) | $ | $ | |||||||||
(1) Does not include the impact of cash collateral received from or provided to counterparties.
101
The following table summarizes the effects of derivative instruments on our consolidated statements of operations:
| Amount of Gain (Loss) | |||||||||||||||||||||||
| Years Ended December 31, | |||||||||||||||||||||||
| Location of Gain (Loss) | 2021 | 2020 | 2019 | ||||||||||||||||||||
| Derivatives – Cash Flow Hedges | ($ in millions) | ||||||||||||||||||||||
| Recognized in other comprehensive income (loss): | |||||||||||||||||||||||
| Commodity contracts | ——— | $ | $ | $ | ( | ||||||||||||||||||
| Interest rate contracts | ——— | ( | |||||||||||||||||||||
| $ | $ | $ | ( | ||||||||||||||||||||
| Reclassified from accumulated other comprehensive loss into income: | |||||||||||||||||||||||
| Interest rate contracts | Interest expense | $ | $ | $ | |||||||||||||||||||
| Commodity contracts | Cost of goods sold | ( | ( | ||||||||||||||||||||
| $ | $ | ( | $ | ( | |||||||||||||||||||
| Derivatives – Fair Value Hedges | |||||||||||||||||||||||
| Interest rate contracts | Interest expense | $ | ( | $ | ( | $ | ( | ||||||||||||||||
| Derivatives Not Designated as Hedging Instruments | |||||||||||||||||||||||
| Foreign exchange contracts | Selling and administration | $ | ( | $ | $ | ( | |||||||||||||||||
Credit Risk and Collateral
By using derivative instruments, we are exposed to credit and market risk. If a counterparty fails to fulfill its performance obligations under a derivative contract, our credit risk will equal the fair value gain in a derivative. Generally, when the fair value of a derivative contract is positive, this indicates that the counterparty owes us, thus creating a repayment risk for us. When the fair value of a derivative contract is negative, we owe the counterparty and, therefore, assume no repayment risk. We minimize the credit (or repayment) risk in derivative instruments by entering into transactions with high-quality counterparties. We monitor our positions and the credit ratings of our counterparties, and we do not anticipate non-performance by the counterparties.
Based on the agreements with our various counterparties, cash collateral is required to be provided when the net fair value of the derivatives, with the counterparty, exceeds a specific threshold. If the threshold is exceeded, cash is either provided by the counterparty to us if the value of the derivatives is our asset, or cash is provided by us to the counterparty if the value of the derivatives is our liability. As of December 31, 2021 and 2020, this threshold was not exceeded. In all instances where we are party to a master netting agreement, we offset the receivable or payable recognized upon payment of cash collateral against the fair value amounts recognized for derivative instruments that have also been offset under such master netting agreements.
102
NOTE 24. FAIR VALUE MEASUREMENTS
Assets and liabilities recorded at fair value in the consolidated balance sheets are categorized based upon the level of judgment associated with the inputs used to measure their fair value. Hierarchical levels are directly related to the amount of subjectivity associated with the inputs to fair valuation of these assets and liabilities. We are required to separately disclose assets and liabilities measured at fair value on a recurring basis, from those measured at fair value on a nonrecurring basis. Nonfinancial assets measured at fair value on a nonrecurring basis are intangible assets and goodwill, which are reviewed for impairment annually in the fourth quarter and/or when circumstances or other events indicate that impairment may have occurred. Determining which hierarchical level an asset or liability falls within requires significant judgment. The following table summarizes the assets and liabilities measured at fair value in the consolidated balance sheets:
| Balance at December 31, 2021 | Quoted Prices in Active Markets for Identical Assets (Level 1) | Significant Other Observable Inputs (Level 2) | Significant Unobservable Inputs (Level 3) | Total | |||||||||||||||||||
| Assets | ($ in millions) | ||||||||||||||||||||||
| Commodity contracts | $ | $ | $ | $ | |||||||||||||||||||
| Foreign exchange contracts | |||||||||||||||||||||||
| Total Assets | $ | $ | $ | $ | |||||||||||||||||||
| Liabilities | |||||||||||||||||||||||
| Commodity contracts | $ | $ | $ | $ | |||||||||||||||||||
| Foreign exchange contracts | |||||||||||||||||||||||
| Total Liabilities | $ | $ | $ | $ | |||||||||||||||||||
| Balance at December 31, 2020 | |||||||||||||||||||||||
| Assets | |||||||||||||||||||||||
| Commodity contracts | $ | $ | $ | $ | |||||||||||||||||||
| Foreign exchange contracts | |||||||||||||||||||||||
| Total Assets | $ | $ | $ | $ | |||||||||||||||||||
| Liabilities | |||||||||||||||||||||||
| Commodity contracts | $ | $ | $ | $ | |||||||||||||||||||
| Total Liabilities | $ | $ | $ | $ | |||||||||||||||||||
Commodity Contracts
Commodity contract financial instruments were valued primarily based on prices and other relevant information observable in market transactions involving identical or comparable assets or liabilities including both forward and spot prices for commodities. We use commodity derivative contracts for certain raw materials and energy costs such as copper, zinc, lead, ethane, electricity and natural gas to provide a measure of stability in managing our exposure to price fluctuations.
Foreign Currency Contracts
Foreign currency contract financial instruments were valued primarily based on relevant information observable in market transactions involving identical or comparable assets or liabilities including both forward and spot prices for currencies. We enter into forward sales and purchase contracts to manage currency risk resulting from purchase and sale commitments denominated in foreign currencies.
Financial Instruments
The carrying values of cash and cash equivalents, accounts receivable and accounts payable approximated fair values due to the short-term maturities of these instruments. Since our long-term debt instruments may not be actively traded, the inputs used to measure the fair value of our long-term debt are based on current market rates for debt of similar risk and maturities and is classified as Level 2 in the fair value measurement hierarchy. As of December 31, 2021 and 2020, the fair value measurements of debt were $2,921.0 million and $4,177.2 million, respectively.
103
Item 9. CHANGES IN AND DISAGREEMENTS WITH ACCOUNTANTS ON ACCOUNTING AND FINANCIAL DISCLOSURE
Not applicable.
Item 9A. CONTROLS AND PROCEDURES
Our chief executive officer and our chief financial officer evaluated the effectiveness of our disclosure controls and procedures as of December 31, 2021. Based on that evaluation, our chief executive officer and chief financial officer have concluded that, as of such date, our disclosure controls and procedures were effective to ensure that information Olin is required to disclose in the reports that it files or submits with the SEC under the Securities Exchange Act of 1934 is recorded, processed, summarized and reported within the time periods specified in the Commission’s rules and forms, and to ensure that information we are required to disclose in such reports is accumulated and communicated to our management, including our chief executive officer and chief financial officer, as appropriate to allow timely decisions regarding required disclosure.
There have been no changes in our internal control over financial reporting that occurred during the quarter ended December 31, 2021, that have materially affected, or are reasonably likely to materially affect, our internal control over financial reporting.
Management’s report on internal control over financial reporting and the related report of Olin’s independent registered public accounting firm, KPMG LLP, are included in Item 8—“Consolidated Financial Statements and Supplementary Data.”
Item 9B. OTHER INFORMATION
Not applicable.
Item 9C. DISCLOSURE REGARDING FOREIGN JURISDICTIONS THAT PREVENT INSPECTIONS
Not applicable.
PART III
Item 10. DIRECTORS, EXECUTIVE OFFICERS AND CORPORATE GOVERNANCE
We incorporate the biographical information relating to our Directors under the heading ITEM 1—“PROPOSAL FOR THE ELECTION OF DIRECTORS” in our Proxy Statement relating to our 2022 Annual Meeting of Shareholders (the “Proxy Statement”) by reference in this Report. We incorporate the biographical information regarding executive officers under the heading “EXECUTIVE OFFICERS” in our Proxy Statement by reference in this report. We incorporate the information regarding compliance with Section 16 of the Securities Exchange Act of 1934, as amended, under the heading entitled “DELINQUENT SECTION 16(a) REPORTS” in our Proxy Statement by reference in this Report.
The information with respect to our audit committee, including the audit committee financial expert, is incorporated by reference in this Report to the information contained in the paragraph entitled “CORPORATE GOVERNANCE MATTERS—What Are the Committees of our Board?” in our Proxy Statement. We incorporate by reference in this Report information regarding procedures for shareholders to nominate a director for election, in the Proxy Statement under the headings
104
“MISCELLANEOUS—How can I directly nominate a director for election to the board at the 2023 annual meeting?” and “CORPORATE GOVERNANCE MATTERS—What Is Olin’s Director Nomination Process?”.
We have adopted a code of business conduct and ethics for directors, officers and employees, known as the Code of Conduct. The Code of Conduct is available in the About, Our Values section of our website at www.olin.com. Olin intends to satisfy disclosure requirements under Item 5.05 of Form 8-K regarding an amendment to, or waiver from, any provision of the Code of Conduct with respect to its executive officers or directors by posting such amendment or waiver on its website.
Item 11. EXECUTIVE COMPENSATION
The information in the Proxy Statement under the heading “CORPORATE GOVERNANCE MATTERS—Compensation Committee Interlocks and Insider Participation,” and the information under the heading “COMPENSATION DISCUSSION AND ANALYSIS” through the information under the heading “COMPENSATION COMMITTEE REPORT,” are incorporated by reference in this Report.
Item 12. SECURITY OWNERSHIP OF CERTAIN BENEFICIAL OWNERS AND MANAGEMENT AND RELATED STOCKHOLDER MATTERS
We incorporate the information concerning holdings of our common stock by certain beneficial owners contained under the heading “CERTAIN BENEFICIAL OWNERS” in our Proxy Statement, and the information concerning beneficial ownership of our common stock by our directors and officers under the heading “SECURITY OWNERSHIP OF DIRECTORS AND OFFICERS” in our Proxy Statement by reference in this Report.
| Equity Compensation Plan Information | ||||||||||||||||||||
| (a) | (b) | (c) | ||||||||||||||||||
| Plan Category | Number of securities to be issued upon exercise of outstanding options, warrants and rights (1) | Weighted-average exercise price of outstanding options, warrants and rights | Number of securities remaining available for future issuance under equity compensation plans excluding securities reflected in column (a)(1) | |||||||||||||||||
| Equity compensation plans approved by security holders (2) | 7,511,121 | (3) | $ | 24.65 | (3) | 7,684,482 | ||||||||||||||
| Equity compensation plans not approved by security holders | N/A | N/A | N/A | |||||||||||||||||
| Total | 7,511,121 | $ | 24.65 | (3) | 7,684,482 | |||||||||||||||
(1)Number of shares is subject to adjustment for changes in capitalization for stock splits and stock dividends and similar events.
(2)Consists of the 2000 Long Term Incentive Plan, the 2003 Long Term Incentive Plan, The 2006 Long Term Incentive Plan, the 2009 Long Term Incentive Plan, the 2014 Long Term Incentive Plan, the 2016 Long Term Incentive Plan, the 2018 Long Term Incentive Plan, the 2021 Long Term Incentive Plan and the 1997 Stock Plan for Non-employee Directors.
(3)Includes:
•5,980,236 shares issuable upon exercise of options with a weighted-average exercise price of $25.88, and a weighted-average remaining term of 6.6 years,
•220,260 shares issuable under restricted stock unit grants, with a weighted-average remaining term of 1.1 years,
•1,067,400 shares issuable in connection with outstanding performance share awards, with a weighted-average term of 1.8 years remaining in the performance measurement period, and
•243,225 shares under the 1997 Stock Plan for Non-employee Directors which represent stock grants for retainers, other board and committee fees and dividends on deferred stock under the plan.
105
Item 13. CERTAIN RELATIONSHIPS AND RELATED TRANSACTIONS AND DIRECTOR INDEPENDENCE
We incorporate the information under the headings “CERTAIN RELATIONSHIPS AND RELATED TRANSACTIONS” and “CORPORATE GOVERNANCE MATTERS—Which Board Members Are Independent?” in our Proxy Statement by reference in this Report.
Item 14. PRINCIPAL ACCOUNTING FEES AND SERVICES
Our independent registered public accounting firm is KPMG LLP , St. Louis, MO , Auditor Firm ID: 185 .
We incorporate the information concerning the accounting fees and services of our independent registered public accounting firm, KPMG LLP, under the heading ITEM 4—“PROPOSAL TO RATIFY APPOINTMENT OF INDEPENDENT REGISTERED PUBLIC ACCOUNTING FIRM” in our Proxy Statement by reference in this Report.
106
PART IV
Item 15. EXHIBITS AND CONSOLIDATED FINANCIAL STATEMENT SCHEDULES
(a) 1. Consolidated Financial Statements
Consolidated financial statements of the registrant are included in Item 8 above.
2. Financial Statement Schedules
Schedules not included herein are omitted because they are inapplicable or not required or because the required information is given in the consolidated financial statements and notes thereto.
3. Exhibits
The following exhibits are filed with this Annual Report on Form 10-K, unless incorporated by reference. Management contracts and compensatory plans and arrangements are listed as Exhibits 10.1 through 10.25. We are party to a number of other instruments defining the rights of holders of long-term debt. No such instrument authorizes an amount of securities in excess of 10% of the total assets of Olin and its subsidiaries on a consolidated basis. Olin agrees to furnish a copy of each instrument to the Commission upon request.
| Exhibit | Exhibit Description | ||||
| 1 | |||||
| 2 | |||||
| 3.1 | |||||
| 3.2 | |||||
| 4.1 | |||||
| 4.2 | |||||
| 4.3 | |||||
| 4.4 | |||||
| 4.5 | |||||
| 4.6 | |||||
| 4.7 | |||||
| 4.8 | |||||
| 4.9 | |||||
| 4.10 | |||||
| 4.11 | |||||
| 4.12 | |||||
| 4.13 | |||||
107
| 4.14 | |||||
| 4.15 | |||||
| 4.16 | |||||
| 4.17 | |||||
| 4.18 | |||||
| 4.19 | |||||
| 4.20 | |||||
| 4.21 | |||||
| 4.22 | |||||
| 4.23 | |||||
| 4.24 | |||||
| 4.25 | |||||
| 4.26 | |||||
| 4.27 | |||||
| 4.28 | |||||
| 4.29 | |||||
| 4.3 | |||||
| 4.31 | |||||
| 4.32 | |||||
| 4.33 | |||||
108
109
| 10.1 | |||||
| 10.2 | |||||
| 10.3 | |||||
| 10.4 | |||||
| 10.5 | |||||
| 10.6 | |||||
| 10.7 | |||||
| 10.8 | |||||
| 10.9 | |||||
| 10.10 | |||||
| 10.11 | |||||
| 10.12 | |||||
| 10.13 | |||||
| 10.14 | |||||
| 10.15 | |||||
| 10.16 | |||||
| 10.17 | |||||
| 10.18 | |||||
| 10.19 | |||||
| 10.20 | |||||
| 10.21 | |||||
| 10.22 | |||||
| 10.23 | |||||
| 10.24 | |||||
| 10.25 | |||||
| 10.26 | |||||
| 10.27 | |||||
| 10.28 | |||||
| 10.29 | |||||
| 10.30 | |||||
110
| 10.31 | |||||
| 10.32 | |||||
| 10.33 | |||||
| 10.34 | |||||
| 10.35 | |||||
| 10.36 | |||||
| 10.37 | |||||
| 10.38 | |||||
| 10.39 | |||||
| 10.40 | |||||
| 10.41 | |||||
| 10.42 | |||||
| 10.43 | |||||
| 10.44 | |||||
| 10.45 | |||||
| 10.46 | |||||
| 10.47 | |||||
| 10.48 | |||||
| 10.49 | |||||
| 10.50 | |||||
| 21 | |||||
| 23 | |||||
| 31.1 | |||||
| 31.2 | |||||
| 32 | |||||
| 101.INS | XBRL Instance Document (the instance document does not appear in the Interactive Data File because its XBRL tags are embedded within the XBRL document) | ||||
111
| 101.SCH | XBRL Taxonomy Extension Schema Document | ||||
| 101.CAL | XBRL Taxonomy Extension Calculation Linkbase Document | ||||
| 101.DEF | XBRL Taxonomy Extension Definition Linkbase Document | ||||
| 101.LAB | XBRL Taxonomy Extension Label Linkbase Document | ||||
| 101.PRE | XBRL Taxonomy Extension Presentation Linkbase Document | ||||
| 104 | Cover Page Interactive Data File (embedded in the Exhibit 101 Interactive Data Files) | ||||
*Previously filed as indicated and incorporated herein by reference. Exhibits incorporated by reference are located in SEC file No. 1-1070 unless otherwise indicated.
Any exhibit is available from Olin by writing to the Secretary, Olin Corporation, 190 Carondelet Plaza, Suite 1530, Clayton, MO 63105 USA.
Shareholders may obtain information from EQ Shareowner Services, our registrar and transfer agent, who also manages our Automatic Dividend Reinvestment Plan by writing to: EQ Shareowner Services, 1110 Centre Pointe Curve, Suite 101, Mendota Heights, MN 55120 USA, by telephone from the United States at 800-401-1957 or outside the United States at 651-450-4064 or via the Internet under “Contact Us” at www.shareowneronline.com.
Item 16. FORM 10-K SUMMARY
None.
112
SIGNATURES
Pursuant to the requirements of Section 13 or 15(d) of the Securities Exchange Act of 1934, the registrant has duly caused this report to be signed on its behalf by the undersigned, thereunto duly authorized.
| OLIN CORPORATION | |||||||||||
| By: | /s/ Scott Sutton | ||||||||||
| Scott Sutton | |||||||||||
| Chairman, President and Chief Executive Officer | |||||||||||
Date: February 24, 2022
Pursuant to the requirements of the Securities Exchange Act of 1934, this report has been signed below by the following persons on behalf of the registrant and in the capacities and on the date indicated.
| Signature | Title | Date | ||||||||||||
| /s/ SCOTT SUTTON | Chairman, President and Chief Executive Officer (Principal Executive Officer) and Director | February 24, 2022 | ||||||||||||
| Scott Sutton | ||||||||||||||
| /s/ HEIDI S. ALDERMAN | Director | February 24, 2022 | ||||||||||||
| Heidi S. Alderman | ||||||||||||||
| /s/ BEVERLEY A. BABCOCK | Director | February 24, 2022 | ||||||||||||
| Beverley A. Babcock | ||||||||||||||
/s/ C. ROBERT BUNCH | Director | February 24, 2022 | ||||||||||||
C. Robert Bunch | ||||||||||||||
| /s/ MATTHEW S. DARNALL | Director | February 24, 2022 | ||||||||||||
| Matthew S. Darnall | ||||||||||||||
| /s/ SCOTT D. FERGUSON | Director | February 24, 2022 | ||||||||||||
| Scott D. Ferguson | ||||||||||||||
| /s/ EARL L. SHIPP | Director | February 24, 2022 | ||||||||||||
| Earl L. Shipp | ||||||||||||||
| /s/ WILLIAM H. WEIDEMAN | Director | February 24, 2022 | ||||||||||||
| William H. Weideman | ||||||||||||||
| /s/ W. ANTHONY WILL | Director | February 24, 2022 | ||||||||||||
| W. Anthony Will | ||||||||||||||
| /s/ CAROL A. WILLIAMS | Director | February 24, 2022 | ||||||||||||
| Carol A. Williams | ||||||||||||||
/s/ TODD A. SLATER | Vice President and Chief Financial Officer (Principal Financial Officer) | February 24, 2022 | ||||||||||||
Todd A. Slater | ||||||||||||||
| /s/ RANDEE N. SUMNER | Vice President and Controller (Principal Accounting Officer) | February 24, 2022 | ||||||||||||
| Randee N. Sumner | ||||||||||||||
113
Serious News for Serious Traders! Try StreetInsider.com Premium Free!
You May Also Be Interested In
- Worksport Signals Undervalued Status, Eyes Major 2024 Growth
- BioVie Presents Data Showing Potential for Bezisterim (NE3107) to Reduce Inflammation and Restore Homeostasis in a Manner Correlated with Alzheimer’s Disease and Biomarker Endpoints
- Tricon Residential Inc. Announces Receipt of Investment Canada Act Approval for Take Private by Blackstone Real Estate
Create E-mail Alert Related Categories
SEC FilingsSign up for StreetInsider Free!
Receive full access to all new and archived articles, unlimited portfolio tracking, e-mail alerts, custom newswires and RSS feeds - and more!
