

Form 10-K M.D.C. HOLDINGS, INC. For: Dec 31
 Tweet
Tweet Share
ShareUNITED STATES
SECURITIES AND EXCHANGE COMMISSION
Washington, D.C. 20549
__________________________________________
FORM 10-K
ANNUAL REPORT PURSUANT TO SECTION 13 OR 15(d) OF THE SECURITIES EXCHANGE ACT OF 1934 | |||||
For the fiscal year ended December 31 , 2021
OR
TRANSITION REPORT PURSUANT TO SECTION 13 OR 15(d) OF THE SECURITIES EXCHANGE ACT OF 1934 | |||||
For the Transition period from _____ to _____
Commission file number 1-08951
__________________________________________
(Exact name of Registrant as specified in its charter)
(State or other jurisdiction of incorporation or organization) | (I.R.S. Employer Identification No.) | |||||||
(Zip code) | ||||||||
(Address of principal executive offices) | ||||||||
(303 ) 773-1100
(Registrant's telephone number, including area code)
Securities registered pursuant to Section 12(b) of the Act:
Title of each class | Trading Symbol(s) | Name of each exchange on which registered | |||||||||
Securities registered pursuant to Section 12(g) of the Act: None
Indicate by check mark if the Registrant is a well-known seasoned issuer, as defined in Rule 405 of the Securities Act. Yes ☒ No ☐
Indicate by check mark if the Registrant is not required to file reports pursuant to Section 13 or Section 15(d) of the Exchange Act. Yes ☐ No ☒
Indicate by check mark whether the Registrant (1) has filed all reports required to be filed by Section 13 or 15(d) of the Securities Exchange Act of 1934 during the preceding 12 months (or for such shorter period that the Registrant was required to file such reports) and (2) has been subject to such filing requirements for the past 90 days. Yes x No o
Indicate by check mark whether the Registrant has submitted electronically every Interactive Data File required to be submitted pursuant to Rule 405 of Regulation S-T (§232.405 of this chapter) during the preceding 12 months (or for such shorter period that the Registrant was required to submit such files). Yes x No o
Indicate by check mark whether the Registrant is a large accelerated filer, an accelerated filer, a non-accelerated filer, a smaller reporting company or an emerging growth company. See the definitions of "large accelerated filer," "accelerated filer," "smaller reporting company," and “emerging growth company” in Rule 12b-2 of the Exchange Act.
| ☒ | Accelerated Filer | ☐ | Emerging Growth Company | ||||||||||||||
| Non-Accelerated Filer | ☐ | Smaller Reporting Company | |||||||||||||||
If an emerging growth company, indicate by check mark if the Registrant has elected not to use the extended transition period for complying with any new or revised financial accounting standards provided pursuant to Section 13(a) of the Exchange Act. ☐
Indicate by check mark whether the Registrant has filed a report on and attestation to its management's assessment of the effectiveness of its internal control over financial reporting under Section 404(b) of the Sarbanes-Oxley Act (15 U.S.C. 726(b)) by the registered public accounting firm that prepared or issued its audit report. ☒
Indicate by check mark whether the Registrant is a shell company (as defined in Rule 12b-2 of the Exchange Act). Yes ☐ No ☒
As of June 30, 2021, the aggregate market value of the Registrant's common stock held by non-affiliates of the Registrant was $2.9 billion based on the closing sales price of $50.60 per share as reported on the New York Stock Exchange on June 30, 2021.
As of December 31, 2021, the number of shares outstanding of Registrant's common stock was 70,668,093 .
M.D.C. HOLDINGS, INC.
FORM 10-K
For the Year Ended December 31, 2021
Table of Contents
Page No. | ||||||||
| F - 1 | ||||||||
(i)
M.D.C. HOLDINGS, INC.
FORM 10-K
PART I
Forward-Looking Statements
Certain statements in this Annual Report on Form 10-K, as well as statements made by us in periodic press releases, oral statements made by our officials in the course of presentations about the Company and conference calls in connection with quarterly earnings releases, constitute “forward-looking statements” within the meaning of the Private Securities Litigation Reform Act of 1995. These forward-looking statements include statements regarding our business, financial condition, results of operation, cash flows, strategies and prospects. These forward-looking statements may be identified by terminology such as “likely,” “may,” “will,” “should,” “expects,” “plans,” “anticipates,” “believes,” “estimates,” “predicts,” “potential” or “continue,” or the negative of such terms and other comparable terminology. Although we believe that the expectations reflected in the forward-looking statements contained in this Report are reasonable, we cannot guarantee future results. These statements involve known and unknown risks, uncertainties and other factors that may cause the actual results, performance or achievements of the Company to be materially different from those expressed or implied by the forward-looking statements. We undertake no obligation to publicly update any forward-looking statements, whether as a result of new information, future events or otherwise. However, any further disclosures made on related subjects in subsequent reports on Forms 10-K, 10-Q and 8-K should be considered.
Item 1. Business.
(a) General Development of Business
M.D.C. Holdings, Inc. is a Delaware corporation. We refer to M.D.C. Holdings, Inc. as the “Company,” “MDC,” “we” or “our” in this Annual Report on Form 10-K, and these designations include our subsidiaries unless we state otherwise. We have two primary operations, homebuilding and financial services. Our homebuilding operations consist of wholly owned subsidiary companies that generally purchase finished lots or develop lots to the extent necessary for the construction and sale primarily of single-family detached homes to first-time and first-time move-up homebuyers under the name “Richmond American Homes.” Our homebuilding operations are comprised of various homebuilding divisions that we consider to be our operating segments. For financial reporting, we have aggregated our homebuilding operating segments into reportable segments as follows: (1) West (includes operating segments located in Arizona, California, Nevada, New Mexico, Oregon, Texas and Washington); (2) Mountain (includes operating segments located in Colorado, Idaho and Utah); and (3) East (includes operating segments located in the mid-Atlantic, which includes Maryland, Pennsylvania and Virginia, Florida, and Tennessee).
Our financial services operations consist of (1) HomeAmerican Mortgage Corporation (“HomeAmerican”), which originates mortgage loans primarily for our homebuyers, (2) Allegiant Insurance Company, Inc., A Risk Retention Group (“Allegiant”), which provides insurance coverage primarily to our homebuilding subsidiaries on homes that have been delivered and most of our subcontractors for completed work on those delivered homes, (3) StarAmerican Insurance Ltd. ("StarAmerican"), which is a re-insurer of Allegiant claims, (4) American Home Insurance Agency, Inc., which offers third-party insurance products to our homebuyers, and (5) American Home Title and Escrow Company, which provides title agency services to our homebuilding subsidiaries and our customers in certain states. For financial reporting, we have aggregated our financial services operating segments into reportable segments as follows: (1) mortgage operations (represents HomeAmerican only) and (2) other (all remaining operating segments).
(c) Description of Business
Our business consists of two primary operations, homebuilding and financial services. Our homebuilding subsidiaries build and sell primarily single-family detached homes that are designed and built to meet local customer preferences. Each homebuilding subsidiary is the general contractor for its projects and retains subcontractors for land development and home construction. Our homebuilding subsidiaries build a variety of home styles in each of their markets, targeting primarily first-time and first-time move-up homebuyers.
1
For 2021, the percentage of our home deliveries and home sale revenues by state were as follows:
| Percentage of Deliveries | Percentage of Home Sale Revenues | ||||||||||
| Arizona | 16 | % | 12 | % | |||||||
| California | 23 | % | 27 | % | |||||||
| Nevada | 11 | % | 11 | % | |||||||
| Oregon | 3 | % | 3 | % | |||||||
| Washington | 5 | % | 5 | % | |||||||
| West | 58 | % | 58 | % | |||||||
| Colorado | 23 | % | 26 | % | |||||||
| Utah | 5 | % | 5 | % | |||||||
| Mountain | 28 | % | 31 | % | |||||||
| Maryland | 2 | % | 3 | % | |||||||
| Virginia | 2 | % | 2 | % | |||||||
| Florida | 10 | % | 6 | % | |||||||
| East | 14 | % | 11 | % | |||||||
| Total | 100 | % | 100 | % | |||||||
Our financial services operations include subsidiaries that provide mortgage financing, place title insurance and homeowner insurance for our homebuyers, and provide general liability insurance for our subsidiaries and most of our subcontractors.
Homebuilding Operations
Operating Divisions. The primary functions of our homebuilding segments include land acquisition and development, home construction, sales and marketing, and customer service. Operating decisions are made by our local management teams under the oversight of our Chief Operating Decision Maker (“CODM”), or decision-making group, defined as two key executives - our Executive Chairman and Chief Executive Officer. Our organizational structure (i.e., the grouping and reporting of divisions) changes based upon the current needs of the Company. We had 21 active homebuilding operating divisions at the end of December 31, 2021. We had 17 active homebuilding operating divisions at the end of December 31, 2020 and 15 active homebuilding operating divisions at the end of December 31, 2019.
Corporate Management. Our homebuilding business is managed primarily through members of senior management in our Corporate segment and our four Asset Management Committees (“AMCs”), three for reviewing real estate transactions and one for reviewing corporate transactions. Each real estate AMC is comprised of the Chief Executive Officer, Chief Financial Officer and one of our other corporate officers, with the corporate AMC comprised of our Chief Executive Officer and Chief Financial Officer. All real estate acquisition transactions are reviewed to confirm that the transaction is projected to achieve the objectives established by our decision-making group and must be approved by one of the real estate AMCs. Generally, the role of our senior management team and/or AMC includes:
•review and approval of division business plans and budgets;
•oversight of land and home inventory levels;
•review of major personnel decisions; and
•review of capital allocation decisions.
Additionally, our corporate executives and corporate departments generally are responsible for establishing and monitoring compliance with our policies and procedures. Among other things, the corporate office has primary responsibility for:
•asset management and capital allocation;
•treasury;
•insurance and risk management;
•merchandising and marketing;
•national purchasing contracts;
•accounting, tax and internal audit functions;
2
•legal matters;
•human resources and payroll;
•information technology; and
•training and development.
Housing. Generally, our homebuilding subsidiaries build single-family detached homes in a number of standardized series, designed to provide variety in the size and style of homes for our potential homebuyers. In certain markets, our homebuilding subsidiaries build and sell duplexes. Within each series of our single-family detached homes, our homebuilding subsidiaries build several different floor plans offering standard and optional features (such as upgraded appliances, cabinetry, flooring, etc.). Differences in sales prices of similar models from market-to-market depend primarily upon homebuyer demand, home prices offered by our competitors, market conditions (such as home inventory supply levels), location, cost of land, optional features and design specifications. The series of homes offered at a particular location is based on perceived customer preferences, lot size, area demographics and, in certain cases, the requirements of major land sellers and local municipalities. In general, our homebuilding subsidiaries focus on selling “build-to-order,” also referred to as “dirt sales,” and limit the number of homes started without a contract, also known as “spec homes.”
Land Acquisition and Development. Our homebuilding subsidiaries acquire lots with the intention of constructing and selling homes on the acquired land. Generally, we prefer to purchase finished lots using option contracts, in phases or in bulk for cash. However, because there often is significant competition for finished lots, more than one-half of the lots we purchase require some level of development. In making land purchases, we consider a number of factors, including projected rates of return, estimated gross margins from home sales, sales prices of the homes to be built, mortgage loan limits within the respective county, population and employment growth patterns, proximity to developed areas, estimated cost and complexity of development including environmental and geological factors, quality of schools, estimated levels of competition and demographic trends.
In their option contracts, our homebuilding subsidiaries generally obtain the right to purchase lots in consideration for an option deposit in the form of cash or letters of credit. In the event they elect not to purchase the lots within a specified period of time, they may be required to forfeit the option deposit. Our option contracts do not contain provisions requiring our specific performance.
Our homebuilding subsidiaries may own or have the right under option contracts to acquire undeveloped parcels of real estate that they intend to develop into finished lots. They generally develop our land in phases in order to limit our risk in a particular subdivision and to efficiently employ available capital resources. Generally, building permits and utilities are available and zoning is suitable for the current intended use of substantially all of our undeveloped land. When developed, these lots generally will be used in our homebuilding activities. See “Forward-Looking Statements” above.
Labor and Raw Materials. Materials used in our homebuilding operations are mainly standard items carried by major suppliers. We generally contract for our materials and labor at a fixed price for the anticipated construction period of our homes. This allows us to mitigate the risks associated with increases in the cost of building materials and labor between the time construction begins on a home and the time it is closed. Increases in the cost of building materials and subcontracted labor may reduce gross margins from home sales to the extent that market conditions prevent the recovery of increased costs through higher home sales prices. From time to time and to varying degrees, we may experience shortages in the availability of building materials and/or labor in each of our markets. These shortages and delays may result in delays in the delivery of homes under construction, reduced gross margins from home sales, or both. See “Forward-Looking Statements” above. Current shortages in the availability of building materials and labor are described in more detail in our description of Risk Factors under the heading "Supply shortages and other risks related to the demand for skilled labor and building materials could continue to increase costs and delay deliveries."
Warranty. Our homebuilding subsidiaries sell their homes with limited third-party warranties that generally provide for ten years of structural coverage, two years of coverage for plumbing, electrical, heating, ventilation and air conditioning systems, and one year of coverage for workmanship and materials. Under our agreement with the issuer of the third-party warranties, our homebuilding subsidiaries perform all of the work for the first two years of the warranty coverage and pay for substantially all of the work required to be performed during years three through ten of the warranties.
Seasonal Nature of Business. The homebuilding industry can experience noticeable seasonality and quarter-to-quarter variability in homebuilding activity levels. The seasonal nature of our business is described in more detail in our description of Risk Factors under the heading “Because of the seasonal nature of our business, our quarterly operating results can fluctuate.”
3
Backlog. At December 31, 2021 and 2020, homes under contract but not yet delivered (“backlog”) totaled 7,640 and 6,655, respectively, with an estimated sales value of $4.30 billion and $3.26 billion, respectively. We anticipate that homes in backlog at December 31, 2021 generally will close during 2022 under their existing home order contracts or through the replacement of an existing contract with a new home order contract. The estimated backlog sales value at December 31, 2021 may be impacted by, among other things, subsequent home order cancellations, incentives provided, and/or options and upgrades selected. See “Forward-Looking Statements” above.
Customer Service and Quality Control. Our homebuilding divisions are responsible for pre-closing quality control inspections and responding to customers’ post-closing needs. We have a product service and quality control program, focused on improving and/or maintaining the quality of our customers’ complete home buying and homeownership experience.
Sales and Marketing. Our sales and marketing programs are designed to attract homebuyers in a cost effective manner. We have a centralized in-house advertising and marketing department, including digital marketing, that oversees our efforts to communicate the inherent value of our homes to our prospective homebuyers and distinguish our Richmond American Homes brand from our competitors or other home buying opportunities. The main objective of this team is to generate homebuyer leads, which are actively pursued by our community sales associates. Our centralized in-house merchandising team furnishes our model homes and sales offices.
Another important part of our marketing presentation takes place in our design centers (also known as Home Galleries). Here, homebuyers are able to personalize their homes with a variety of options and upgrades. These locations also serve as an information center for prospective homebuyers and real estate agents who may opt to receive personalized attention from one of our new home specialists, resulting in a more focused and efficient home search across all of our Richmond American communities in a given market place. We believe that the services provided by our Home Galleries represent a key competitive advantage in attracting and retaining prospective homebuyers.
Competition. The homebuilding industry is fragmented and highly competitive. The competitive nature of our business is described in more detail in our description of Risk Factors.
Regulation. Our homebuilding operations are subject to compliance with applicable laws and regulations, which are described in more detail in our description of Risk Factors.
Financial Services Operations
Mortgage Lending Operations
General. HomeAmerican is a full-service mortgage lender and the principal originator of mortgage loans for our homebuyers. HomeAmerican has a centralized loan processing center where it originates mortgage loans, primarily for our homebuyers.
HomeAmerican is authorized to originate Federal National Mortgage Association (“Fannie Mae”), Federal Home Loan Mortgage Corporation (“Freddie Mac”) (together “the government-sponsored enterprises”), Federal Housing Administration-insured (“FHA”), and Department of Veterans Affairs-guaranteed (“VA”) mortgages and is an authorized issuer of Government National Mortgage Association (“Ginnie Mae”) mortgage-backed securities. Furthermore, HomeAmerican also is an authorized loan servicer for Fannie Mae, Freddie Mac and Ginnie Mae and, as such, is subject to the rules and regulations of these entities.
HomeAmerican uses a mortgage repurchase facility, internally generated funds, and temporary financing provided by its parent, to finance the origination of mortgage loans until they are sold. HomeAmerican sells originated mortgage loans to third-party purchasers on either a bulk or flow basis. Mortgage loans sold on a bulk basis include the sale of a package of substantially similar originated mortgage loans, while sales of mortgage loans on a flow basis are completed as HomeAmerican originates each loan. Mortgage loans sold to third-party purchasers include HomeAmerican’s representations and warranties with respect to certain borrower payment defaults, credit quality issues and/or misrepresentations made by HomeAmerican or our homebuyers. Substantially all of the mortgage loans originated by HomeAmerican are sold to third-party purchasers, generally between 5 to 35 days of origination.
Pipeline. HomeAmerican’s mortgage loans in process for which a rate and price commitment had been made to a borrower that had not closed (the “locked pipeline”) at December 31, 2021 and 2020 had an aggregate principal balance of approximately $268.8 million and $230.5 million, respectively, and were under interest rate lock commitments at an average interest rate of 2.91% and 2.69% respectively.
4
Forward Sales Commitments. HomeAmerican is exposed to market risks related to fluctuations in interest rates. HomeAmerican creates certain derivative instruments in the normal course of business, which primarily include commitments to originate mortgage loans (interest rate lock commitments or locked pipeline). HomeAmerican uses forward sales of mortgage-backed securities and commitments from third-parties to purchase loans to hedge the interest rate risk inherent with the locked pipeline, as well as its loan inventory held for sale. The market related risks in our business are described in more detail in our description of Risk Factors.
Competition. HomeAmerican has significant competition with other mortgage bankers to arrange financing for our homebuyers. However, in selling its originated mortgages to third parties, HomeAmerican has benefited from an increased number of smaller non-bank entities entering the third-party purchaser space, resulting in better prices and a potentially wider array of product options. The competitive nature of our mortgage business is described in more detail in our description of Risk Factors.
Regulation. Our mortgage lending operations are subject to compliance with applicable laws and regulations, which are described in more detail in our description of Risk Factors.
Insurance Operations
General. Allegiant and StarAmerican were formed to provide insurance coverage of homebuilding risks for our homebuilding subsidiaries and most of our homebuilding subcontractors. Allegiant was organized as a risk retention group under the Federal Liability Risk Retention Act of 1981. Allegiant, which began operations in June of 2004, is licensed as a Class 3 Stock Insurance Company by the Division of Insurance of the State of Hawaii and is subject primarily to the regulations of its state of incorporation. StarAmerican is a single parent captive insurance company licensed by the Division of Insurance of the State of Hawaii. Pursuant to agreements executed on an annual basis since June of 2004, StarAmerican has re-insured Allegiant for all claims in excess of $50,000 per occurrence up to $3.0 million per occurrence, subject to various aggregate limits.
Allegiant generates premium revenue generally by providing to its customers, comprised of the Company’s homebuilding subsidiaries and most subcontractors of the Company’s homebuilding subsidiaries, general liability insurance on homes sold by our homebuilding subsidiaries and for work performed in completed subdivisions. Allegiant seeks to provide to its customers coverage and insurance rates that are competitive with other insurers. StarAmerican generates premium revenue by providing re-insurance coverage to Allegiant. Allegiant and StarAmerican incur expenses for actual losses and loss adjustment expenses and for reserves established based on actuarial studies including known facts, such as our experience with similar insurance cases and historical trends involving insurance claim payment patterns, pending levels of unpaid insurance claims, claim severity, claim frequency patterns and interpretations of circumstances including changing regulatory and legal environments.
Regulation. Allegiant and StarAmerican are licensed in the State of Hawaii and, therefore, are subject to regulation by the Hawaii Insurance Division. This regulation includes restrictions and oversight regarding: types of insurance provided; investment options; required capital and surplus; financial and information reporting; use of auditors, actuaries and other service providers; periodic examinations; and other operational items. Additionally, as a risk retention group, Allegiant is also registered in other states where certain MDC homebuilding subsidiaries do business.
Insurance Agency Operations
American Home Insurance is an insurance agency that sells primarily homeowners’ personal property and casualty insurance products in the same markets where our homebuilding subsidiaries operate and primarily to our homebuyers.
Title Operations
American Home Title provides title agency services to the Company and its homebuyers in Colorado, Florida, Maryland, Nevada, Pennsylvania and Virginia.
5
Human Capital Resources
The table below summarizes the approximate number of employees for our combined Homebuilding, combined Financial Services and Corporate segments at December 31, 2021 and 2020.
| December 31, | |||||||||||
| 2021 | 2020 | ||||||||||
| Homebuilding | 1,580 | 1,350 | |||||||||
| Financial Services | 222 | 185 | |||||||||
| Corporate | 278 | 238 | |||||||||
| Total | 2,080 | 1,773 | |||||||||
We believe our employees are one of our greatest assets and our Company is made up of diverse, talented and dedicated employees working together to achieve common and rewarding goals. We value integrity, hard work, dedication, energy and teamwork. Our goal is to promote an environment where employees are encouraged to do their best work with high professional standards, team collaboration and customer excellence.
At MDC we are committed to fostering a diverse and inclusive workplace. Our management teams and all of our employees are expected to exhibit and promote honest, ethical and respectful conduct in the workplace. We have implemented and maintained a corporate compliance program to provide guidance for everyone associated with the Company, including its employees, officers and directors (the "Code"). Annual review of the Code is required and it, in summary, prohibits unlawful or unethical activity, including discrimination, and directs our employees, officers, and directors to avoid actions that, even if not unlawful or unethical, might create an appearance of illegality or impropriety. In addition, the Code includes required annual training on preventing, identifying, reporting and stopping any type of unlawful discrimination.
We recognize that we are in a competitive marketplace when it comes to finding top talent. As a result, talent acquisition and the retention of employees continue to be a priority initiative for the Company. Our leaders across all levels of the organization consistently review their business metrics to determine appropriate workforce planning goals. We offer a variety of career paths for our employees; which includes consistent training and development through online resources, job shadowing, mentoring, etc. Our employees may participate in a robust benefits program, which includes a focus on health and wellness, and we offer a variety of other employee perks. We believe our compensation packages and benefits are competitive with others in our industry. We are committed to consistently evaluating total compensation across all positions within the Company.
As we look to the future, we will continue to leverage the core principles and practices that contributed to our past achievements, while welcoming new perspectives that allow our organization to evolve with the changing economic landscape. We will maintain our commitment to quality craftsmanship, providing excellent customer service, hiring from within when possible and fostering an internal culture that supports collaboration and teamwork as well as work-life balance.
In response to the COVID-19 pandemic, we implemented safety protocols and procedures to protect our employees, our subcontractors and our customers. These protocols include complying with social distancing and other health and safety standards as mandated by state and local government agencies, taking into consideration guidance from the Centers for Disease Control and Prevention and other public health authorities. Certainly, there has been a significant shift to moving much of our workforce to a work from home/remote environment, particularly in Corporate and Division offices, to minimize in-person interactions. In addition, we have instituted a mandatory COVID-19 vaccination policy at our Corporate office, which was expanded to customer facing sales and home gallery personnel in January 2022.
(e) Available Information
We make our Annual Report on Form 10-K, Quarterly Reports on Form 10-Q, Current Reports on Form 8-K and amendments to those reports filed or furnished pursuant to Section 13(a) or 15(d) of the Securities Exchange Act of 1934, available free of charge on our website as soon as reasonably practicable after we file or furnish the materials electronically with the Securities and Exchange Commission (“SEC”). To obtain any of this information, go to our website, www.mdcholdings.com, and select “SEC Filings” from the menu. Our website includes our: (1) Corporate Governance Guidelines; (2) Corporate Code of Conduct; (3) Rules for Senior Financial Officers; (4) Audit Committee Procedures for Handling Confidential Complaints; (5) charters for the Audit, Compensation, Legal and Corporate Governance/Nominating Committees; (6) Director Standards of Independence; and (7) Lead Director Description. These materials may be obtained, free of charge, at www.mdcholdings.com (select “Governance”).
6
Item 1A. Risk Factors.
Public health issues such as the global Coronavirus/COVID-19 pandemic could harm business and results of operations of the Company.
Demand for our homes is dependent on a variety of macroeconomic factors, such as employment levels, availability of financing for homebuyers, interest rates, consumer confidence, wage growth, household formations, levels of new and existing homes for sale, cost of land, labor and construction materials, demographic trends and housing demand. These factors, in particular consumer confidence, can be significantly and adversely affected by a variety of factors beyond our control. In response to the pandemic, many state and local governments instituted restrictions that substantially limited the operations of non-essential businesses and the activities of individuals. As economic activity resumed upon the restrictive orders relating to COVID-19 being eased, demand for our homes improved significantly during the remainder of fiscal 2020 and remained strong throughout fiscal 2021. There is still significant uncertainty as a result of the pandemic and its continuing potential to negatively impact the U.S. economy. The degree to which the pandemic will impact our financial results in the coming periods depends on future developments that are highly uncertain, including new information that may emerge concerning the severity of the pandemic, whether there are additional outbreaks of COVID-19 and related variants and the actions taken to contain or address the virus. If the pandemic continues to cause significant negative impacts to the U.S. economy and consumer confidence, our results of operations, financial condition and cash flows could be significantly and adversely impacted.
Changes in general economic, real estate and other business conditions may have an adverse effect on the homebuilding and mortgage industries, which could have a negative impact on our business.
The homebuilding industry is cyclical and is significantly affected by changes in industry conditions, the national political environment and general economic conditions such as:
•employment levels;
•availability of financing for homebuyers;
•interest rates;
•consumer confidence;
•wage growth;
•household formations;
•levels of new and existing homes for sale;
•cost of land, labor and construction materials;
•demographic trends; and
•housing demand.
These conditions may exist on a national level or may affect some of the regions or markets in which we operate more than others. When adverse conditions affect any of our larger markets, they could have a proportionately greater impact on us than on some other homebuilding companies.
Changes to monetary policy or other actions by the Federal Reserve could have an adverse effect on interest rates (including mortgage interest rates), equity markets and consumer confidence. Such effects could cause us to experience declines in the market value of our inventory and the demand for our homes, resulting in a negative impact to our financial position, results of operations and cash flows.
An oversupply of alternatives to new homes, including foreclosed homes, homes held for sale or rent by investors and speculators, other existing homes, and rental properties, can also reduce our ability to sell new homes, depress new home prices
7
and reduce our margins on the sale of new homes. High levels of foreclosures and short-sales not only contribute to additional inventory available for sale, but also can reduce appraisal valuations for new homes, potentially resulting in lower sales prices.
Terrorist attacks, acts of war, other acts of violence or threats to national security, and any corresponding response by the United States or others, or related domestic or international instability, may adversely affect general economic conditions or cause a slowdown of the economy.
As a result of the foregoing matters, potential customers may be less willing or able to buy our homes. In the future, our pricing strategies may be limited by market conditions. We may be unable to change the mix of our home offerings, reduce the costs of the homes we build or offer more affordable homes to maintain our gross margins or satisfactorily address changing market conditions in other ways. In addition, cancellations of home sales contracts in backlog may increase as homebuyers choose to not honor their contracts.
Additionally, the factors discussed above may increase our counterparty risk, which may include, among others, banks under our credit facilities and mortgage purchasers who may not be willing or able to perform on obligations to us. To the extent a third-party is unable or unwilling to meet its obligations, our financial position, results of operations and cash flows could be negatively impacted.
Our mortgage operations are closely related to our homebuilding business, as HomeAmerican originates mortgage loans principally to purchasers of the homes we build. Therefore, a decrease in the demand for our homes because of the preceding matters may also adversely affect the financial results of this segment of our business. Furthermore, any adverse changes in the economic conditions discussed previously could increase the default rate on the mortgages we originate, which may adversely affect our ability to sell the mortgages, the pricing we receive upon the sale of mortgages, or our potential exposure to recourse regarding mortgage loan sales.
These challenging conditions are complex and interrelated. We cannot predict their occurrence or severity, nor can we provide assurance that our responses would be successful.
Increased competition levels in the homebuilding and mortgage lending industries could have a negative impact on our homebuilding and mortgage operations.
The homebuilding industry is fragmented and highly competitive. Our homebuilding subsidiaries compete with numerous public and private homebuilders, including a number that are substantially larger than us and may have greater financial resources than we do. Our homebuilding subsidiaries also compete with subdivision developers and land development companies, some of which are themselves homebuilders or affiliates of homebuilders. Homebuilders compete for customers, land, building materials, subcontractor labor and desirable financing. Competition for home orders is based primarily on home sales price, location of property, home style, financing available to prospective homebuyers, quality of homes built, customer service and general reputation in the community, and may vary market-by-market and/or submarket-by-submarket. Additionally, competition within the homebuilding industry can be impacted by an excess supply of new and existing homes available for sale resulting from a number of factors, including, among other things, increases in the number of new home communities, increases in speculative homes available for sale and increases in home foreclosures. Increased competition can result in a decrease in our net new home orders, a decrease in our home sales prices and/or an increase in our home sales incentives in an effort to generate new home sales and maintain homes in backlog until they close. These competitive pressures may negatively impact our financial position, results of operations and cash flows.
Our mortgage lending subsidiary, HomeAmerican, experiences competition from numerous banks and other mortgage bankers and brokers, many of which are larger and may have greater financial resources. As a result, these competitors may be able to offer better pricing and/or mortgage loan terms, more relaxed underwriting criteria and a greater range of products, which could negatively impact the financial position, results of operations and cash flows of our mortgage operations.
If land is not available at reasonable prices or terms, we could be required to scale back our operations in a given market and/or we may operate at lower levels of profitability.
Our operations depend on our homebuilding subsidiaries’ ability to obtain land for the development of our residential communities at reasonable prices and with terms that meet our underwriting criteria. Our ability to obtain land for new residential communities may be adversely affected by changes in the general availability of land, the willingness of land sellers to sell land at reasonable prices, competition for available land, availability of financing to acquire land, zoning, regulations that limit housing density, and other market conditions. If the supply of land, and especially finished lots, appropriate for development of residential communities is limited because of these factors, or for any other reason, the number of homes that
8
our homebuilding subsidiaries build and sell may decline. To the extent that we are unable to purchase land timely or enter into new contracts for the purchase of land at reasonable prices, due to the lag time between the time we acquire land and the time we begin selling homes, we may be required to scale back our operations in a given market and/or we may operate at lower levels of profitability. As a result, our financial position, results of operations and cash flows could be negatively impacted.
Supply shortages and other risks related to the demand for skilled labor and building materials could continue to increase costs and delay deliveries.
The residential construction industry experiences price fluctuations and shortages in labor and materials from time to time. Shortages in labor can be due to: competition for labor, work stoppages, labor disputes, shortages in qualified trades people, lack of availability of adequate utility infrastructure and services, or our need to rely on local subcontractors who may not be adequately capitalized or insured. Labor and material shortages can be more severe during periods of strong demand for housing or during periods in which the markets where we operate experience natural disasters that have a significant impact on existing residential and commercial structures. Additionally, we could experience labor shortages as a result of subcontractors going out of business or leaving the residential construction market due to low levels of housing production and volumes. Pricing for labor and materials can be affected by the factors discussed above, changes in energy prices, and various other national, regional and local economic factors. In addition, environmental and other regulations and import tariffs and trade restrictions have had, and in the future could continue to have, an adverse impact on the cost of certain raw materials such as lumber. Recalls of materials driven by manufacturing defects can drive shortages in materials and delay the delivery of homes. Any of these circumstances could give rise to delays in the start or completion of our residential communities, increase the cost of developing one or more of our residential communities and/or increase the construction cost of our homes. The effects of the pandemic combined with the strong demand for new homes has caused disruptions in our supply chain and has resulted in shortages of certain building materials and increased demand in the labor market, which has caused our land development and construction cycle times to lengthen and the costs of building materials and labor to increase.
We generally are unable to pass on increases in construction costs to customers who have already entered into sales contracts, as those sales contracts fix the price of the homes at the time the contracts are signed, which generally is in advance of the construction of the home. To the extent that market conditions prevent the recovery of increased costs, including, among other things, subcontracted labor, finished lots, building materials, and other resources, through higher selling prices, our financial position, cash flows and operating results, including our gross margin from home sales, could be negatively impacted.
If mortgage interest rates rise, if down payment requirements are increased, if loan limits are decreased, or if mortgage financing otherwise becomes less available, it could adversely affect our business.
Mortgage liquidity influenced by governmental entities like the FHA, VA, USDA and Ginnie Mae or government-sponsored enterprises (“GSEs”) like Fannie Mae and Freddie Mac continue to be an important factor in marketing our homes. Financial losses or other factors may limit, restrict or otherwise curtail their ability or willingness to insure mortgage loans, offer insurance at rates and on terms that are not prohibitive, or purchase mortgage loans. Should this occur, it may negatively impact the availability of mortgage financing and our sales of new homes.
We believe that the liquidity provided by Fannie Mae, Freddie Mac and Ginnie Mae to the mortgage industry has been very important to the housing market. The future of Fannie Mae and Freddie Mac are in question and any reduction in the availability of the liquidity provided by these institutions could adversely affect interest rates, mortgage availability and our sales of new homes and mortgage loans.
Loans sold to or insured by the GSEs are subject to various loan limits. Decreases in these loan limits may require homebuyers to make larger down payments or obtain more restrictive non-conforming or “jumbo” mortgages, which could adversely impact on our financial position, results of operations and cash flows.
Even if potential customers do not need financing, changes in the availability of mortgage products may make it harder for them to sell their current homes to potential buyers who need financing.
If interest rates increase, the costs of owning a home may be affected and could result in further reductions in the demand for our homes.
Changes to tax laws, incentives or credits currently available to our customers may negatively impact our business.
Many homeowners receive substantial tax benefits in the form of tax deductions against their personal taxable income for mortgage interest and property tax payments and the loss or reduction of these deductions could affect homeowners’ net
9
cost of owning a home. Significant changes to existing tax laws, such as the ability to deduct mortgage interest and real property taxes, may result in an increase in the total cost of home ownership and may make the purchase of a home less attractive to buyers. This could adversely impact demand for and/or sales prices of new homes, which would have a negative impact on our business.
A decline in the market value of our homes or carrying value of our land would have a negative impact on our business.
Our homebuilding subsidiaries acquire land for the replacement of land inventory and/or expansion within our current markets and may, from time to time, purchase land for expansion into new markets. The fair value of our land and land under development inventory and housing completed or under construction inventory depends on market conditions. Factors that can impact our determination of the fair value of our inventory primarily include home sale prices, levels of home sale incentives and home construction and land costs. Our home sale prices and/or levels of home sale incentives can be impacted by, among other things, uncertainty in the homebuilding and mortgage industries or the United States/global economy overall, decreased demand for new homes, decreased home prices offered by our competitors, home foreclosure and short-sale levels, decreased ability of our homebuyers to obtain suitable mortgage loan financing and high levels of home order cancellations. Under such circumstances, we may be required to record impairments of our inventory. Any such inventory impairments would have a negative impact on our financial position and results of operations.
Natural disasters could cause an increase in home construction costs, as well as delays, and could negatively impact our business.
The climates and geology of many of the markets in which we operate present increased risks of natural disasters. To the extent that hurricanes, severe storms, earthquakes, droughts, floods, heavy or prolonged precipitation, wildfires or other natural disasters or similar events occur, the financial position, results of operations and cash flows of our business may be negatively impacted.
Changes in energy prices or regulations may have an adverse effect on our cost of building homes.
Some of the markets in which we operate are impacted by regulations related to energy, such as setbacks required from oil / gas drilling operations or restrictions on the use of land. To the extent that these regulations are modified, the value of land we already own or the availability of land we are looking to purchase may decline, which may adversely impact the financial position, results of operations and cash flows of our business. Furthermore, pricing offered by our suppliers and subcontractors can be adversely affected by increases in various energy costs resulting in a negative impact to our financial position, results of operations and cash flows of our business.
We have financial needs that we meet through the capital markets, including the debt and secondary mortgage markets, and disruptions in these markets could have an adverse impact on the results of our business.
We have financial needs that we meet through the capital markets, including the debt and secondary mortgage markets. Our requirements for additional capital, whether to finance operations or to service or refinance our existing indebtedness, fluctuate as market conditions and our financial performance and operations change. We cannot provide assurance that we will maintain cash reserves and generate sufficient cash flow from operations in an amount to enable us to service our debt or to fund other liquidity needs.
The availability of additional capital, whether from private capital sources or the public capital markets, fluctuates as our financial condition and market conditions in general change. There may be times when the private capital markets and the public debt or equity markets lack sufficient liquidity or when our securities cannot be sold at attractive prices, in which case we would not be able to access capital from these sources. Additionally, any reduction in our credit ratings and/or a weakening of our financial condition, could adversely affect our ability to obtain necessary funds. Even if financing is available, it could be costly or have other adverse consequences.
In addition, the sources and terms and conditions of our mortgage repurchase facility are subject to change. These changes may impact, among other things, availability of capital, cost of borrowings, collateral requirements and collateral advance rates.
Our business is subject to numerous federal, state and local laws and regulations concerning land development, construction of homes, sales, mortgage lending, environmental and other aspects of our business. These laws and regulations could give rise to additional liabilities or expenditures, or restrictions on our business.
10
Our operations are subject to continuing compliance requirements mandated by applicable federal, state and local statutes, ordinances, rules and regulations, including zoning and land use ordinances, building, plumbing and electrical codes, contractors’ licensing laws, state insurance laws, federal and state human resources laws and regulations, and health and safety laws and regulations. Various localities in which we operate have imposed (or may impose in the future) fees on developers to fund schools, road improvements and low and moderate-income housing.
Availability of and costs related to permit, water/sewer tap, and impact fees can impact our homebuilding operations. From time to time, various municipalities in which our homebuilding subsidiaries operate restrict or place moratoria on the availability of utilities, including water and sewer taps. Additionally, certain jurisdictions in which our homebuilding subsidiaries operate have proposed or enacted “slow growth” or “no growth” initiatives and other measures that may restrict the number of building permits available in any given year. These initiatives or other similar measures could reduce our ability to open new subdivisions and build and sell homes in the affected markets. The availability issues previously discussed and any increases in costs of these fees may negatively impact our financial position, results of operations and cash flows.
Our homebuilding operations also are affected by regulations pertaining to availability of water, municipal sewage treatment capacity, land use, dust controls, oil and gas operations, building materials, population density and preservation of endangered species, natural terrain and vegetation.
We are subject to growing local, state and federal statutes, ordinances, rules and regulations concerning the protection of public health and the environment. These include regulating the emission or discharge of materials into the environment such as greenhouse gas emissions, storm water runoff, the handling, use, storage and disposal of hazardous substances, and impacts to wetlands and other sensitive environments. These restrictions and requirements could increase our operating costs and require additional capital investment, which could negatively impact our financial position, results of operations and cash flows. Further, we have extensive operations in the western United States, where some of the most extensive environmental laws and building construction standards in the country have been enacted. We believe we are in compliance in all material respects with existing governmental environment restrictions, standards and regulations applicable to our business, and such compliance has not had a material impact on our business. Given the emerging and rapid changes of environmental laws and other matters that may arise that are not currently known, we cannot predict our future exposure, and our future costs to achieve compliance or remedy potential violations could be significant.
The particular environmental laws and regulations that apply to any given homebuilding project vary greatly according to a particular site’s location, the site’s environmental conditions and the present and former uses. These environmental laws may result in project delays, cause us to incur substantial compliance and other costs and/or prohibit or severely restrict homebuilding activity in certain environmentally sensitive locations. Environmental laws and regulations may also have a negative impact on the availability and price of certain raw materials, such as lumber.
Our revolving credit facility contains representations regarding anti-corruption and sanctions laws, a violation of which could result in an event of default.
We also are subject to rules and regulations with respect to originating, processing, selling and servicing mortgage loans, which, among other things: prohibit discrimination and establish underwriting guidelines; provide for audits and inspections; require appraisals and/or credit reports on prospective borrowers and disclosure of certain information concerning credit and settlement costs; establish maximum loan amounts; prohibit predatory lending practices; and regulate the referral of business to affiliated entities.
The regulatory environment for mortgage lending is complex and ever changing and has led to an increase in the number of audits and examinations in the industry. These examinations can include consumer lending practices, sales of mortgages to financial institutions and other investors and the practices in the financial services segments of homebuilding companies. New rules and regulations or revised interpretations of existing rules and regulations applicable to our mortgage lending operations could result in more stringent compliance standards, which may substantially increase costs of compliance.
In the ordinary course of business, we are required to obtain surety bonds, the unavailability of which could adversely affect our business.
As is customary in the homebuilding industry, we often are required to provide surety bonds to secure our performance under construction contracts, development agreements and other arrangements. Our ability to obtain surety bonds primarily depends upon our credit rating, capitalization, working capital, past performance, management expertise and certain external factors, including the overall capacity of the surety market and the underwriting practices of surety bond issuers. The ability to
11
obtain surety bonds also can be impacted by the willingness of insurance companies to issue surety bonds. If we are unable to obtain surety bonds when required, our financial position, results of operations and cash flows could be adversely impacted.
Product liability litigation and warranty claims that arise in the ordinary course of business may be costly.
As a homebuilder, we are subject to construction defect and home warranty claims, as well as claims associated with the sale and financing of our homes arising in the ordinary course of business. These types of claims can be costly. The costs of insuring against or directly paying for construction defect and product liability claims can be high and the amount of coverage offered by insurance companies may be limited. If we are not able to obtain adequate insurance against these claims, we may incur additional expenses that would have a negative impact on our results of operations in future reporting periods. Additionally, changes in the facts and circumstances of our pending litigation matters could have a material impact on our financial position, results of operations and cash flows.
Repurchase requirements associated with HomeAmerican’s sale of mortgage loans, could negatively impact our business.
We are subject to risks associated with mortgage loans, including conventional mortgage loans, FHA and VA mortgage loans, second mortgage loans, high loan-to-value mortgage loans and jumbo mortgage loans (mortgage loans with principal balances that exceed various thresholds in our markets). These risks may include, among other things, compliance with mortgage loan underwriting criteria and the associated homebuyers’ performance, which could require HomeAmerican to repurchase certain of those mortgage loans or provide indemnification. Repurchased mortgage loans and/or the settlement of claims associated with such loans could have a negative impact on HomeAmerican’s financial position, results of operations and cash flows.
Because of the seasonal nature of our business, our quarterly operating results can fluctuate.
We may experience noticeable seasonality and quarter-to-quarter variability in homebuilding activity levels. In general, the number of homes delivered and the associated home sale revenues increase during the third and fourth quarters, compared with the first and second quarters. We believe that this type of seasonality reflects the historical tendency of homebuyers to purchase new homes in the spring and summer with deliveries scheduled in the fall or winter, as well as the scheduling of construction to accommodate seasonal weather conditions in certain markets.
We are dependent on the services of key employees, and the loss of their services could hurt our business.
Although we believe that we have made provision for adequately staffing current operations, because of competition for experienced homebuilding industry personnel, retaining our skilled people is an important area of focus. Our future success depends, in part, on our ability to attract, train and retain skilled personnel. If we are unable to retain our key employees or attract, train and retain other skilled personnel in the future, it could have an adverse impact on our financial position, results of operations and cash flows.
The interests of certain controlling shareholders may be adverse to other investors
Larry A. Mizel and David D. Mandarich beneficially own, directly or indirectly through their affiliates, in the aggregate, approximately 23% of our common stock. To the extent they and their affiliates vote their shares in the same manner, their combined stock ownership may effectively give them the power to influence the election of members of our board of directors and other matters reserved for our shareholders.
Information technology failures and data security breaches could harm our business.
We use information technology and other computer resources to carry out important operational activities and to maintain our business records. These information technology systems are dependent upon electronic systems and other aspects of the internet infrastructure. A material breach in the security of our information technology systems or other data security controls could result in third parties obtaining or corrupting customer, employee or company data. To date, we have not had a material breach of data security, however such occurrences could have a material and adverse effect on our financial position, results of operations and cash flows.
Item 1B. Unresolved Staff Comments.
None.
12
Item 2. Properties.
Our corporate office is located at 4350 South Monaco Street, Denver, Colorado 80237, where we lease all 144,000 square feet of office space in the building. In many of our markets, our homebuilding divisions and other MDC subsidiaries lease additional office space. While we are currently satisfied with the suitability and capacity of our office locations to meet our current business needs, we continue to evaluate them in view of market conditions and the size of our operations.
Item 3. Legal Proceedings.
Because of the nature of the homebuilding business, we and certain of our subsidiaries and affiliates have been named as defendants in various claims, complaints and other legal actions arising in the ordinary course of business, including product liability claims and claims associated with the sale and financing of our homes. In the opinion of management, the outcome of these ordinary course matters will not have a material adverse effect upon our financial condition, results of operations or cash flows.
Item 4. Mine Safety Disclosures.
Not applicable.
13
PART II
Item 5. Market for Registrant's Common Equity, Related Stockholder Matters and Issuer Purchases of Equity Securities.
At December 31, 2021, we had 546 shareholders of record. The shares of our common stock are traded on the New York Stock Exchange under the trading symbol MDC. On January 28, 2019, the Company declared an 8% stock dividend that was distributed on February 28, 2019 to shareholders of record on February 14, 2019. On January 25, 2021, the Company declared an 8% stock dividend that was distributed on March 17, 2021 to shareholders of record on March 3, 2021. In accordance with Accounting Standards Codification Topic 260, “Earnings per Share”, basic and diluted earnings per share amounts, weighted-average shares outstanding, and dividends declared per share have been restated for all periods presented to reflect the effect of these stock dividends.
The table below sets forth the cash dividends declared and paid in 2021, 2020 and 2019
Date of Declaration | Date of Payment | Dividend per Share | Total Dividends Paid | ||||||||||||||||||||
(In thousands) | |||||||||||||||||||||||
| 2021 | |||||||||||||||||||||||
First Quarter | 01/25/21 | 02/24/21 | $ | 0.37 | $ | 25,978 | |||||||||||||||||
Second Quarter | 04/26/21 | 05/26/21 | 0.40 | 28,249 | |||||||||||||||||||
Third Quarter | 07/26/21 | 08/25/21 | 0.40 | 28,276 | |||||||||||||||||||
Fourth Quarter | 10/25/21 | 11/24/21 | 0.50 | 35,339 | |||||||||||||||||||
| $ | 1.67 | $ | 117,842 | ||||||||||||||||||||
| 2020 | |||||||||||||||||||||||
| First Quarter | 01/27/20 | 02/26/20 | $ | 0.31 | $ | 20,768 | |||||||||||||||||
| Second Quarter | 04/01/20 | 05/20/20 | 0.31 | 20,914 | |||||||||||||||||||
| Third Quarter | 07/27/20 | 08/26/20 | 0.31 | 21,374 | |||||||||||||||||||
| Fourth Quarter | 10/26/20 | 11/24/20 | 0.37 | 25,952 | |||||||||||||||||||
| $ | 1.29 | $ | 89,008 | ||||||||||||||||||||
| 2019 | |||||||||||||||||||||||
| First Quarter | 01/28/19 | 02/27/19 | $ | 0.26 | $ | 17,019 | |||||||||||||||||
| Second Quarter | 04/29/19 | 05/29/19 | 0.28 | 18,521 | |||||||||||||||||||
| Third Quarter | 07/22/19 | 08/21/19 | 0.28 | 18,700 | |||||||||||||||||||
| Fourth Quarter | 10/28/19 | 11/27/19 | 0.28 | 18,780 | |||||||||||||||||||
| $ | 1.09 | $ | 73,020 | ||||||||||||||||||||
14
The following table provides information about our repurchases of common stock during the Three Months Ended December 31, 2021:
| Period: | Total Number of Shares Purchased (1) | Average Price Paid Per Share | Total Number of Shares Purchased as Part of Publicly Announced Plan or Program (2) | Maximum Number of Shares that may yet be Purchased under the Plan or Program (2) | ||||||||||||||||||||||
| October 1 to October 31, 2021 | — | N/A | — | 4,000,000 | ||||||||||||||||||||||
| November 1 to November 30, 2021 | — | N/A | — | 4,000,000 | ||||||||||||||||||||||
| December 1 to December 31, 2021 | 11,872 | $ | 55.83 | — | 4,000,000 | |||||||||||||||||||||
__________________________________
(1) Represents shares of common stock withheld by us to cover withholding taxes due upon the vesting of restricted stock award shares, at the election of certain holders of nonvested shares, with market value approximating the amount of withholding taxes due.
(2) We are authorized to repurchase up to 4,000,000 shares of our common stock. There were no shares of MDC common stock repurchased under this repurchase program during the years ended December 31, 2021, 2020 or 2019. This repurchase authorization has no expiration.
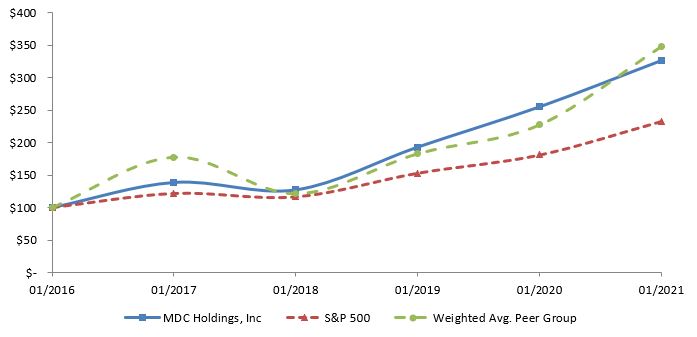
Performance Graph
Set forth below is a graph comparing the yearly change in the cumulative total return of MDC's common stock with the cumulative total return of the S&P 500® Stock Index and with that of a peer group of other homebuilders over the five-year period ended December 31, 2021, weighted as of the beginning of that period.
It is assumed in the graph that $100 was invested (1) in our common stock; (2) in the stocks of the companies in the S&P 500® Stock Index; and (3) in the stocks of the peer group companies, just prior to the commencement of the period and that all dividends received within a quarter were reinvested in that quarter. The peer group index is composed of the following companies: Beazer Homes USA, Inc., D.R. Horton, Inc., Hovnanian Enterprises, Inc., KB Home, Lennar Corporation, M/I Homes, Inc., Meritage Homes Corporation, NVR, Inc., PulteGroup, Inc. and Toll Brothers, Inc.
The stock price performance shown on the following graph is not indicative of future price performance.
Item 6. [Reserved]
15
Item 7. Management's Discussion and Analysis of Financial Condition and Results of Operations.
The following discussion should be read in conjunction with, and is qualified in its entirety by, the Consolidated Financial Statements and Notes thereto included elsewhere in this Annual Report on Form 10-K. This item contains forward-looking statements that involve risks and uncertainties. Actual results may differ materially from those indicated in such forward-looking statements. Factors that may cause such a difference include, but are not limited to, those discussed in “Item 1A, Risk Factors Relating to our Business.” This section of this Form 10-K generally discusses 2021 and 2020 items and year-to-year comparisons between 2021 and 2020. Discussions of 2019 items and year-to-year comparisons between 2020 and 2019 that are not included in this Form 10-K can be found in “Management’s Discussion and Analysis of Financial Condition and Results of Operations” in Part II, Item 7 of the Company’s Annual Report on Form 10-K for the fiscal year ended December 31, 2020.
| 2021 | 2020 | 2019 | |||||||||||||||
| (Dollars in thousands, except per share amounts) | |||||||||||||||||
| Homebuilding: | |||||||||||||||||
| Home sale revenues | $ | 5,102,456 | $ | 3,765,379 | $ | 3,205,248 | |||||||||||
| Home cost of sales | (3,924,093) | (2,982,668) | (2,600,196) | ||||||||||||||
| Inventory impairments | (1,600) | — | (935) | ||||||||||||||
| Total cost of sales | (3,925,693) | (2,982,668) | (2,601,131) | ||||||||||||||
| Gross profit | 1,176,763 | 782,711 | 604,117 | ||||||||||||||
| Gross margin % | 23.1 | % | 20.8 | % | 18.8 | % | |||||||||||
| Selling, general and administrative expenses | (493,993) | (403,218) | (362,790) | ||||||||||||||
| Loss on debt retirement | (23,571) | — | — | ||||||||||||||
| Interest and other income | 5,965 | 4,233 | 9,070 | ||||||||||||||
| Other expense | (5,476) | (5,209) | (5,635) | ||||||||||||||
| Homebuilding pretax income | 659,688 | 378,517 | 244,762 | ||||||||||||||
| Financial Services: | |||||||||||||||||
| Revenues | 152,212 | 135,832 | 88,005 | ||||||||||||||
| Expenses | (64,477) | (52,465) | (45,001) | ||||||||||||||
| Other income (expense), net | 4,271 | (4,372) | 17,223 | ||||||||||||||
| Financial services pretax income | 92,006 | 78,995 | 60,227 | ||||||||||||||
| Income before income taxes | 751,694 | 457,512 | 304,989 | ||||||||||||||
| Provision for income taxes | (178,037) | (89,930) | (66,677) | ||||||||||||||
| Net income | $ | 573,657 | $ | 367,582 | $ | 238,312 | |||||||||||
| Earnings per share: | |||||||||||||||||
| Basic | $ | 8.13 | $ | 5.33 | $ | 3.56 | |||||||||||
| Diluted | $ | 7.83 | $ | 5.17 | $ | 3.44 | |||||||||||
| Weighted average common shares outstanding: | |||||||||||||||||
| Basic | 70,174,281 | 68,531,856 | 66,546,347 | ||||||||||||||
| Diluted | 72,854,601 | 70,676,581 | 68,798,879 | ||||||||||||||
| Cash dividends declared per share | $ | 1.67 | $ | 1.29 | $ | 1.09 | |||||||||||
| Cash provided by (used in): | |||||||||||||||||
| Operating Activities | $ | (207,990) | $ | (23,095) | $ | 57,833 | |||||||||||
| Investing Activities | $ | (27,679) | $ | 21,685 | $ | (28,785) | |||||||||||
| Financing Activities | $ | 335,156 | $ | 31,170 | $ | (24,975) | |||||||||||
16
EXECUTIVE SUMMARY
Overview
Industry Conditions and Outlook for MDC*
The Coronavirus/COVID-19 pandemic began impacting the U.S. economy during the latter part of March 2020, adversely affecting consumer demand, financial markets and employment levels. The homebuilding industry was not immune to the impact of the pandemic as we experienced an industry-wide decrease in traffic and order activity as well as increased cancellation levels during the months of March and April 2020. As economic activity resumed and restrictive orders relating to COVID-19 were eased, demand for our homes improved significantly during the remainder of 2020. While we have seen a return of more normal seasonal patterns during 2021, demand has remained strong throughout the year, driven by an improving economy, low interest rates and a continued focus on suburban homeownership. We believe many of these factors will continue to support new home demand in future periods. In contrast, the supply of new and existing homes has remained constrained, due in large part to the underproduction of new homes over the past decade. As a result of this supply-demand imbalance, we raised sales prices in the majority of our communities throughout the year in order to (1) offset cost increases, which have been significant due to cost inflation and labor and material shortages; (2) improve the profitability per home closed given current demand and limits on construction capacity, and; (3) reduce our sales absorption rate to keep our backlog at a level that is manageable for our construction personnel and trade suppliers.
Like many within the industry, we continue to experience shortages of certain building materials and tightness in labor markets for a variety of reasons, including the current supply-demand imbalance and disruptions caused by the pandemic. These disruptions have caused both our construction and land development times to extend. For instance, our average sale-to-close cycle time during the fourth quarter of 2021 was over nine months as compared to our more typical build time of six to eight months. We do not expect material or labor conditions to significantly improve in the near term.
Despite these challenges, we achieved record levels of home sale revenues and consolidated net income for the full year ended December 31, 2021. Our backlog at December 31, 2021 was 7,640 homes with an estimated dollar value of $4.30 billion, up 15% and 32%, respectively, as compared to our backlog at December 31, 2020. This was our highest ever year-end backlog in both units and dollars. In addition, we approved over 20,000 lots for acquisition during the year, resulting in a 29% year-over-year increase in lots owned and optioned to approximately 38,000 lots as of year-end. These metrics bode well for our growth prospects, as does our strategic entry into the Boise, Nashville, Austin and Albuquerque markets during the year. Financial services pretax income reached record levels in 2021, driven largely by our mortgage operations, which has benefited from increased profitability per loan originated during 2020 and early 2021. As competition in the primary mortgage market has increased, we have seen these profit margins return to more historical levels. Overall, we remain cautious and continue to closely monitor developments related to COVID-19, which are highly uncertain and could adversely and materially impact our operations and financial results in future periods.
We ended the year with total liquidity of $1.75 billion following the optional redemption in December 2021 of the remaining $126.4 million of our 5.500% senior notes, which were scheduled to mature in January 2024. This lowered our debt to capital ratio quarter-over-quarter to 36.5% as of December 31, 2021. We believe that our financial position ranks among the best in the homebuilding industry and provides us with the capital resources to drive the continued growth of our business.
Results for the Twelve Months Ended December 31, 2021
For the year ended December 31, 2021, we reported net income of $573.7 million, or $7.83 per diluted share, a 56% increase compared to net income of $367.6 million, or $5.17 per diluted share, for the prior year period. Both our homebuilding and financial services businesses contributed to these year-over-year improvements, as pretax income from our homebuilding operations increased $281.2 million, or 74%, and our financial services pretax income increased $13.0 million, or 16%. The increase in homebuilding pretax income was the result of a 330 basis point increase in our operating margin and a 36% increase in home sale revenues. These increases were partially offset by a loss on debt retirement of $23.6 million. The increase in operating margin is the result of our improved pricing over the last twelve months as well as better operating leverage as we continue to grow our homebuilding operations, partially offset by increased supply costs. The increase in financial services pretax income was primarily due to the overall increase in volume of our homebuilding operations. Additionally, $8.3 million of net losses on equity securities were recognized in the prior year period, further impacting the year-over-year increase in financial services pretax income.
17
The dollar value of our net new home orders increased 11% from the prior year, due to a 11% increase in the average selling price of orders. The increase in the average selling price was the result of price increases implemented over the past twelve months.
* See “Forward-Looking Statements” above.
Homebuilding
Pretax Income (Loss)
| Year Ended December 31, | |||||||||||||||||||||||||||||||||||||||||
| 2021 | Change | 2020 | Change | 2019 | |||||||||||||||||||||||||||||||||||||
| Amount | % | Amount | % | ||||||||||||||||||||||||||||||||||||||
| (Dollars in thousands) | |||||||||||||||||||||||||||||||||||||||||
| West | $ | 463,302 | $ | 233,351 | 101 | % | $ | 229,951 | $ | 66,882 | 41 | % | $ | 163,069 | |||||||||||||||||||||||||||
| Mountain | 231,523 | 56,522 | 32 | % | 175,001 | 38,688 | 28 | % | 136,313 | ||||||||||||||||||||||||||||||||
| East | 59,494 | 39,488 | 197 | % | 20,006 | 10,149 | 103 | % | 9,857 | ||||||||||||||||||||||||||||||||
| Corporate | (94,631) | (48,190) | 104 | % | (46,441) | 18,036 | (28) | % | (64,477) | ||||||||||||||||||||||||||||||||
| Total homebuilding pretax income | $ | 659,688 | $ | 281,171 | 74 | % | $ | 378,517 | $ | 133,755 | 55 | % | $ | 244,762 | |||||||||||||||||||||||||||
Homebuilding pretax income for 2021 was $659.7 million, an increase of $281.2 million from $378.5 million for the year ended December 31, 2020. The increase was primarily attributable to a 36% increase in home sale revenues, a 230 basis point improvement in gross margin from home sales and a 100 basis point decrease in our selling, general and administrative expenses as a percentage of revenue.
Our West segment experienced a $233.4 million year-over-year increase in pretax income, due to a 41% increase in home sale revenues and an improved gross margin. Our Mountain segment experienced a $56.5 million increase in pretax income from the prior year, as a result of a 21% increase in home sale revenues and an improved gross margin. Our East segment experienced a $39.5 million increase in pretax income from the prior year, primarily due to a 56% increase in home sale revenues and an improved gross margin. Each of our homebuilding segments also benefited from decreased selling, general and administrative expenses as a percentage of revenue driven by improved operating leverage. Our Corporate segment experienced an $48.2 million increase in pretax loss, due to the $23.6 million loss on retirement of debt recognized in the current year, increased stock-based and deferred compensation expenses, increased payroll expense due to higher headcount and increased bonus expense.
Assets
| December 31, | Change | ||||||||||||||||||||||
| 2021 | 2020 | Amount | % | ||||||||||||||||||||
| (Dollars in thousands) | |||||||||||||||||||||||
| West | $ | 2,472,378 | $ | 1,855,567 | $ | 616,811 | 33 | % | |||||||||||||||
| Mountain | 1,072,717 | 905,007 | 167,710 | 19 | % | ||||||||||||||||||
| East | 450,675 | 274,937 | 175,738 | 64 | % | ||||||||||||||||||
| Corporate | 547,364 | 470,909 | 76,455 | 16 | % | ||||||||||||||||||
| Total homebuilding assets | $ | 4,543,134 | $ | 3,506,420 | $ | 1,036,714 | 30 | % | |||||||||||||||
Total homebuilding assets increased 30% from December 31, 2020 to December 31, 2021. Increases in each of our homebuilding segments were the result of increases in our inventory balances. These increases were driven by an increase in homes completed or under construction as of period end and, with the exception of our Mountain segment, a greater number of lots acquired during the period than those delivered to homebuyers. The increase in our Corporate segment was due to the proceeds from the issuance of senior notes during the year. This increase was partially offset by the funding of land acquisitions and construction activity by our Corporate Segment as well as the retirement of our $250 million 5.500% senior notes, which were scheduled to mature in January 2024.
18
New Home Deliveries & Home Sale Revenues:
Changes in home sale revenues are impacted by changes in the number of new homes delivered and the average selling price of those delivered homes. Commentary for each of our segments on significant changes in these two metrics is provided below.
December 31, | |||||||||||||||||||||||||||||||||||||||||||||||||||||
| 2021 | 2020 | % Change | |||||||||||||||||||||||||||||||||||||||||||||||||||
Homes | Dollar Value | Average Price | Homes | Dollar Value | Average Price | Homes | Dollar Value | Average Price | |||||||||||||||||||||||||||||||||||||||||||||
(Dollars in thousands) | |||||||||||||||||||||||||||||||||||||||||||||||||||||
West | 5,732 | $ | 2,964,766 | $ | 517.2 | 4,412 | $ | 2,106,241 | $ | 477.4 | 30 | % | 41 | % | 8 | % | |||||||||||||||||||||||||||||||||||||
Mountain | 2,770 | 1,567,198 | 565.8 | 2,530 | 1,293,779 | 511.4 | 9 | % | 21 | % | 11 | % | |||||||||||||||||||||||||||||||||||||||||
East | 1,480 | 570,492 | 385.5 | 1,216 | 365,359 | 300.5 | 22 | % | 56 | % | 28 | % | |||||||||||||||||||||||||||||||||||||||||
Total | 9,982 | $ | 5,102,456 | $ | 511.2 | 8,158 | $ | 3,765,379 | $ | 461.6 | 22 | % | 36 | % | 11 | % | |||||||||||||||||||||||||||||||||||||
December 31, | |||||||||||||||||||||||||||||||||||||||||||||||||||||
| 2020 | 2019 | % Change | |||||||||||||||||||||||||||||||||||||||||||||||||||
Homes | Dollar Value | Average Price | Homes | Dollar Value | Average Price | Homes | Dollar Value | Average Price | |||||||||||||||||||||||||||||||||||||||||||||
(Dollars in thousands) | |||||||||||||||||||||||||||||||||||||||||||||||||||||
West | 4,412 | $ | 2,106,241 | $ | 477.4 | 3,763 | $ | 1,771,061 | $ | 470.7 | 17 | % | 19 | % | 1 | % | |||||||||||||||||||||||||||||||||||||
Mountain | 2,530 | 1,293,779 | 511.4 | 2,242 | 1,131,568 | 504.7 | 13 | % | 14 | % | 1 | % | |||||||||||||||||||||||||||||||||||||||||
East | 1,216 | 365,359 | 300.5 | 969 | 302,619 | 312.3 | 25 | % | 21 | % | (4) | % | |||||||||||||||||||||||||||||||||||||||||
Total | 8,158 | $ | 3,765,379 | $ | 461.6 | 6,974 | $ | 3,205,248 | $ | 459.6 | 17 | % | 17 | % | — | % | |||||||||||||||||||||||||||||||||||||
For the year ended December 31, 2021, the number of new homes delivered in each of our segments was negatively impacted by an increase in construction cycle times. Our average sale-to-close cycle time during the year ended December 31, 2021 was approximately 36 weeks. Cycle times increased approximately five weeks year-over-year, from the year-ended December 31, 2020 to the year-ended December 31, 2021. This increase was primarily the result of extended permitting times, supply chain disruptions and labor shortages as a result of the pandemic as well as the increased demand for new homes.
West Segment Commentary
For the year ended December 31, 2021, the increase in new home deliveries was the result of an increase in the number of homes in backlog to begin the year. This increase was partially offset by a decrease in backlog conversion rates in most of our markets within this segment as a result of the increased construction cycle times discussed above. The average selling price of homes delivered increased as a result of price increases implemented over the last twelve months as well as a shift in geographic mix of homes delivered from Arizona to Southern California. These increases were partially offset by a shift in mix to lower priced communities.
Mountain Segment Commentary
For the year ended December 31, 2021, the increase in new home deliveries was the result of an increase in the number of homes in backlog to begin the year. This increase was partially offset by a decrease in backlog conversion rates as a result of the increased construction cycle times discussed above. The average selling price of homes delivered increased as a result of price increases implemented over the last twelve months.
East Segment Commentary
For the year ended December 31, 2021, the increase in new home deliveries was the result of an increase in the number of homes in backlog to begin the year. This increase was partially offset by a decrease in backlog conversion rates as a result of the increased construction cycle times discussed above. The average selling price of homes delivered increased as a result of price increases implemented over the last twelve months. Additionally, we experienced a shift in mix within several markets to higher priced communities.
19
Gross Margin
Our gross margin from home sales for the year ended December 31, 2021 increased 230 basis points year-over-year from 20.8% to 23.1%. Gross margin from home sales increased across each of our segments driven by price increases implemented across nearly all of our communities over the past twelve months. Our gross margin from home sales was also positively impacted by a decrease in our capitalized interest in cost of sales as a percentage of home sale revenues. These improvements were partially offset by an increase in building material and labor costs year-over-year.
Inventory Impairments
Inventory impairments recognized by segment for the years ended December 31, 2021, 2020 and 2019 are shown in the table below.
| Year Ended December 31, | |||||||||||||||||
| 2021 | 2020 | 2019 | |||||||||||||||
| (Dollars in thousands) | |||||||||||||||||
| Housing Completed or Under Construction: | |||||||||||||||||
| West | $ | 1,600 | $ | — | $ | 100 | |||||||||||
| Mountain | — | — | 0 | ||||||||||||||
| East | — | — | 435 | ||||||||||||||
| Subtotal | 1,600 | — | 535 | ||||||||||||||
| Land and Land Under Development: | |||||||||||||||||
| West | — | — | — | ||||||||||||||
| Mountain | — | — | 400 | ||||||||||||||
| East | — | — | — | ||||||||||||||
| Subtotal | — | — | 400 | ||||||||||||||
| Total Inventory Impairments | $ | 1,600 | $ | — | $ | 935 | |||||||||||
The table below provides quantitative data, for the periods presented, where applicable, used in determining the fair value of the impaired inventory.
| Impairment Data | Quantitative Data | ||||||||||||||||||||||||||||||||||||||||||||||
| Three Months Ended | Number of Subdivisions Impaired | Inventory Impairments | Fair Value of Inventory After Impairments | Discount Rate | |||||||||||||||||||||||||||||||||||||||||||
| (Dollars in thousands) | |||||||||||||||||||||||||||||||||||||||||||||||
| December 31, 2021 | 1 | 1,600 | $ | 6,903 | N/A | ||||||||||||||||||||||||||||||||||||||||||
| Total | $ | 1,600 | |||||||||||||||||||||||||||||||||||||||||||||
| March 31, 2019 | 2 | $ | 610 | $ | 10,476 | N/A | |||||||||||||||||||||||||||||||||||||||||
| December 31, 2019 | 2 | 325 | 3,948 | N/A | |||||||||||||||||||||||||||||||||||||||||||
| Total | $ | 935 | |||||||||||||||||||||||||||||||||||||||||||||
20
Selling, General and Administrative Expenses
| Year Ended December 31, | |||||||||||||||||||||||||||||
| 2021 | Change | 2020 | Change | 2019 | |||||||||||||||||||||||||
| (Dollars in thousands) | |||||||||||||||||||||||||||||
| General and administrative expenses | $246,042 | $61,322 | $184,720 | $9,693 | $175,027 | ||||||||||||||||||||||||
General and administrative expenses as a percentage of home sale revenues | 4.8% | (10) bps | 4.9% | (60) bps | 5.5% | ||||||||||||||||||||||||
| Marketing expenses | $104,435 | $9,332 | $95,103 | $13,488 | $81,615 | ||||||||||||||||||||||||
Marketing expenses as a percentage of home sale revenues | 2.0% | (50) bps | 2.5% | 0 bps | 2.5% | ||||||||||||||||||||||||
| Commissions expenses | $143,516 | $20,121 | $123,395 | $17,247 | $106,148 | ||||||||||||||||||||||||
Commissions expenses as a percentage of home sale revenues | 2.8% | (50) bps | 3.3% | 0 bps | 3.3% | ||||||||||||||||||||||||
| Total selling, general and administrative expenses | $493,993 | $90,775 | $403,218 | $40,428 | $362,790 | ||||||||||||||||||||||||
Total selling, general and administrative expenses as a percentage of home sale revenues (SG&A Rate) | 9.7% | (100) bps | 10.7% | (60) bps | 11.3% | ||||||||||||||||||||||||
For the year ended December 31, 2021, the increase in our general and administrative expenses was primarily due to (1) increased stock-based and deferred compensation expenses, (2) increased bonus expense and (3) increased salary related expenses due to higher average headcount.
For the year ended December 31, 2021, marketing expenses increased as a result of increased deferred selling amortization and master marketing fees resulting from increased closings.
For the year ended December 31, 2021, commissions expenses increased as a result of the increase in home sale revenues year-over-year.
21
Other Homebuilding Operating Data
Net New Orders and Active Subdivisions:
Changes in the dollar value of net new orders are impacted by changes in the number of net new orders and the average selling price of those homes. Commentary for each of our segments on significant changes in these two metrics is provided below
| December 31, | |||||||||||||||||||||||||||||||||||||||||||||||||||||||||||||||||||||||
| 2021 | 2020 | % Change | |||||||||||||||||||||||||||||||||||||||||||||||||||||||||||||||||||||
| Homes | Dollar Value | Average Price | Monthly Absorption Rate * | Homes | Dollar Value | Average Price | Monthly Absorption Rate * | Homes | Dollar Value | Average Price | Monthly Absorption Rate * | ||||||||||||||||||||||||||||||||||||||||||||||||||||||||||||
| (Dollars in thousands) | |||||||||||||||||||||||||||||||||||||||||||||||||||||||||||||||||||||||
| West | 6,238 | $ | 3,417,437 | $ | 547.8 | 5.25 | 6,099 | $ | 3,078,584 | $ | 504.8 | 5.29 | 2 | % | 11 | % | 9 | % | (1) | % | |||||||||||||||||||||||||||||||||||||||||||||||||||
| Mountain | 2,926 | 1,831,755 | 626.0 | 4.33 | 3,337 | 1,818,833 | 545.1 | 4.46 | (12) | % | 1 | % | 15 | % | (3) | % | |||||||||||||||||||||||||||||||||||||||||||||||||||||||
| East | 1,803 | 789,810 | 438.1 | 4.05 | 1,576 | 562,419 | 356.9 | 4.27 | 14 | % | 40 | % | 23 | % | (5) | % | |||||||||||||||||||||||||||||||||||||||||||||||||||||||
| Total | 10,967 | $ | 6,039,002 | $ | 550.7 | 4.75 | 11,012 | $ | 5,459,836 | $ | 495.8 | 4.85 | — | % | 11 | % | 11 | % | (2) | % | |||||||||||||||||||||||||||||||||||||||||||||||||||
| December 31, | |||||||||||||||||||||||||||||||||||||||||||||||||||||||||||||||||||||||
| 2020 | 2019 | % Change | |||||||||||||||||||||||||||||||||||||||||||||||||||||||||||||||||||||
| Homes | Dollar Value | Average Price | Monthly Absorption Rate * | Homes | Dollar Value | Average Price | Monthly Absorption Rate * | Homes | Dollar Value | Average Price | Monthly Absorption Rate * | ||||||||||||||||||||||||||||||||||||||||||||||||||||||||||||
| (Dollars in thousands) | |||||||||||||||||||||||||||||||||||||||||||||||||||||||||||||||||||||||
| West | 6,099 | $ | 3,078,584 | $ | 504.8 | 5.29 | 4,263 | $ | 1,963,489 | $ | 460.6 | 3.91 | 43 | % | 57 | % | 10 | % | 35 | % | |||||||||||||||||||||||||||||||||||||||||||||||||||
| Mountain | 3,337 | 1,818,833 | 545.1 | 4.46 | 2,410 | 1,189,193 | 493.4 | 3.04 | 38 | % | 53 | % | 10 | % | 47 | % | |||||||||||||||||||||||||||||||||||||||||||||||||||||||
| East | 1,576 | 562,419 | 356.9 | 4.27 | 1,166 | 342,469 | 293.7 | 3.68 | 35 | % | 64 | % | 22 | % | 16 | % | |||||||||||||||||||||||||||||||||||||||||||||||||||||||
| Total | 11,012 | $ | 5,459,836 | $ | 495.8 | 4.85 | 7,839 | $ | 3,495,151 | $ | 445.9 | 3.56 | 40 | % | 56 | % | 11 | % | 36 | % | |||||||||||||||||||||||||||||||||||||||||||||||||||
*Calculated as total net new orders in period ÷ average active communities during period ÷ number of months in period
| Active Subdivisions | Average Active Subdivisions | ||||||||||||||||||||||||||||||||||
| December 31, | Year Ended December 31, | ||||||||||||||||||||||||||||||||||
| 2021 | 2020 | % Change | 2021 | 2020 | % Change | ||||||||||||||||||||||||||||||
| West | 96 | 103 | (7) | % | 99 | 96 | 3 | % | |||||||||||||||||||||||||||
| Mountain | 54 | 60 | (10) | % | 56 | 62 | (10) | % | |||||||||||||||||||||||||||
| East | 37 | 31 | 19 | % | 37 | 31 | 19 | % | |||||||||||||||||||||||||||
| Total | 187 | 194 | (4) | % | 192 | 189 | 2 | % | |||||||||||||||||||||||||||
West Segment Commentary
For the year ended December 31, 2021, the increase in average selling price was due to price increases implemented over the past twelve months within nearly all of our communities. This increase was slightly offset by a shift in mix to lower priced communities.
Mountain Segment Commentary
For the year ended December 31, 2021, the decrease in net new orders was due to a decrease in average active subdivisions within our Colorado markets. The increase in average selling price was due to price increases implemented over the last twelve months within nearly all of our communities.
East Segment Commentary
For the year ended December 31, 2021, the increase in net new orders was due to an increase in average active subdivisions within our Florida markets. This increase was partially offset by a decrease in the monthly sales absorption rate. The increase in average selling price was due to price increases implemented over the last twelve months within nearly all of our communities. Additionally, we experienced a shift in mix within several markets to higher priced communities.
22
Cancellation Rate:
Cancellations As a Percentage of Gross Sales | |||||||||||||||||||||||||||||
December 31, | |||||||||||||||||||||||||||||
| 2021 | Change | 2020 | Change | 2019 | |||||||||||||||||||||||||
West | 16 | % | (1) | % | 17 | % | (1) | % | 18 | % | |||||||||||||||||||
Mountain | 18 | % | (4) | % | 22 | % | (2) | % | 24 | % | |||||||||||||||||||
East | 18 | % | (6) | % | 24 | % | — | % | 24 | % | |||||||||||||||||||
Total | 17 | % | (2) | % | 19 | % | (2) | % | 21 | % | |||||||||||||||||||
Our cancellations as a percentage of gross sales (“cancellation rate”) decreased from 19% for the year ended December 31, 2020 to 17% for the year ended December 31, 2021. This was driven by the higher cancellation rates incurred during the first and second quarter of 2020 as a result of general economic uncertainty surrounding the pandemic.
Consistent with our quarterly homebuilding operating data provided, we have also included below the cancellations as a percentage of homes in beginning backlog for each quarter during the years ended December 31, 2021 and 2020.
Cancellations As a Percentage of Homes in Beginning Backlog | |||||||||||||||||||||||||||||||||||||||||||||||
| 2021 | 2020 | ||||||||||||||||||||||||||||||||||||||||||||||
Three Months Ended | |||||||||||||||||||||||||||||||||||||||||||||||
Dec 31 | Sep 30 | Jun 30 | Mar 31 | Dec 31 | Sep 30 | Jun 30 | Mar 31 | ||||||||||||||||||||||||||||||||||||||||
West | 9 | % | 8 | % | 5 | % | 7 | % | 7 | % | 11 | % | 14 | % | 15 | % | |||||||||||||||||||||||||||||||
Mountain | 8 | % | 7 | % | 5 | % | 8 | % | 9 | % | 12 | % | 20 | % | 22 | % | |||||||||||||||||||||||||||||||
East | 10 | % | 7 | % | 9 | % | 13 | % | 10 | % | 18 | % | 22 | % | 23 | % | |||||||||||||||||||||||||||||||
Total | 9 | % | 7 | % | 6 | % | 8 | % | 8 | % | 12 | % | 17 | % | 18 | % | |||||||||||||||||||||||||||||||
Backlog:
December 31, | |||||||||||||||||||||||||||||||||||||||||||||||||||||
| 2021 | 2020 | % Change | |||||||||||||||||||||||||||||||||||||||||||||||||||
Homes | Dollar Value | Average Price | Homes | Dollar Value | Average Price | Homes | Dollar Value | Average Price | |||||||||||||||||||||||||||||||||||||||||||||
(Dollars in thousands) | |||||||||||||||||||||||||||||||||||||||||||||||||||||
West | 4,216 | $ | 2,328,949 | $ | 552.4 | 3,710 | $ | 1,831,205 | $ | 493.6 | 14 | % | 27 | % | 12 | % | |||||||||||||||||||||||||||||||||||||
Mountain | 2,174 | 1,402,052 | 644.9 | 2,018 | 1,090,557 | 540.4 | 8 | % | 29 | % | 19 | % | |||||||||||||||||||||||||||||||||||||||||
East | 1,250 | 567,695 | 454.2 | 927 | 341,439 | 368.3 | 35 | % | 66 | % | 23 | % | |||||||||||||||||||||||||||||||||||||||||
Total | 7,640 | $ | 4,298,696 | $ | 562.7 | 6,655 | $ | 3,263,201 | $ | 490.3 | 15 | % | 32 | % | 15 | % | |||||||||||||||||||||||||||||||||||||
At December 31, 2021, we had 7,640 homes in backlog with a total value of $4.30 billion, representing respective increases of 15% and 32% from December 31, 2020. The increase in the number of homes in backlog is primarily a result of an increase in cycle times within nearly all of our markets. The increase in the average selling price of homes in backlog is due to price increases implemented over the past twelve months in nearly all of our communities as well as a shift in our net new order mix in our East segment as discussed above. Our ability to convert backlog into closings could be adversely and materially impacted in future periods by the pandemic, the extent to which is highly uncertain and depends on future developments.
23
Homes Completed or Under Construction:
December 31, | |||||||||||||||||
| 2021 | 2020 | % Change | |||||||||||||||
Unsold: | |||||||||||||||||
Completed | 25 | 48 | (48) | % | |||||||||||||
Under construction | 312 | 131 | 138 | % | |||||||||||||
Total unsold started homes | 337 | 179 | 88 | % | |||||||||||||
Sold homes under construction or completed | 6,379 | 4,797 | 33 | % | |||||||||||||
Model homes under construction or completed | 479 | 498 | (4) | % | |||||||||||||
Total homes completed or under construction | 7,195 | 5,474 | 31 | % | |||||||||||||
The increase in sold homes under construction or completed is due to the year-over-year increase in the number of homes in backlog noted above as well as a 1,100 basis point decrease year-over-year in the number of homes in backlog that were sold but where construction had not yet started as of period end.
Lots Owned and Optioned (including homes completed or under construction):
| December 31, 2021 | December 31, 2020 | ||||||||||||||||||||||||||||||||||||||||
Lots Owned | Lots Optioned | Total | Lots Owned | Lots Optioned | Total | Total % Change | |||||||||||||||||||||||||||||||||||
West | 15,968 | 4,534 | 20,502 | 12,335 | 3,460 | 15,795 | 30 | % | |||||||||||||||||||||||||||||||||
Mountain | 6,660 | 4,171 | 10,831 | 6,279 | 2,591 | 8,870 | 22 | % | |||||||||||||||||||||||||||||||||
East | 4,304 | 2,443 | 6,747 | 2,868 | 1,936 | 4,804 | 40 | % | |||||||||||||||||||||||||||||||||
Total | 26,932 | 11,148 | 38,080 | 21,482 | 7,987 | 29,469 | 29 | % | |||||||||||||||||||||||||||||||||
Our total owned and optioned lots at December 31, 2021 were 38,080, up 29% from December 31, 2020. We believe that our total lot supply can support growth in future periods. See "Forward-Looking Statements" above.
Financial Services
| Year Ended December 31, | |||||||||||||||||||||||||||||||||||||||||
| Change | Change | ||||||||||||||||||||||||||||||||||||||||
| 2021 | Amount | % | 2020 | Amount | % | 2019 | |||||||||||||||||||||||||||||||||||
| (Dollars in thousands) | |||||||||||||||||||||||||||||||||||||||||
| Financial services revenues | |||||||||||||||||||||||||||||||||||||||||
| Mortgage operations | $ | 107,535 | $ | 5,860 | 6 | % | $ | 101,675 | $ | 46,453 | 84 | % | $ | 55,222 | |||||||||||||||||||||||||||
| Other | 44,677 | 10,520 | 31 | % | 34,157 | 1,374 | 4 | % | 32,783 | ||||||||||||||||||||||||||||||||
| Total financial services revenues | $ | 152,212 | $ | 16,380 | 12 | % | $ | 135,832 | $ | 47,827 | 54 | % | $ | 88,005 | |||||||||||||||||||||||||||
| Financial services pretax income | |||||||||||||||||||||||||||||||||||||||||
| Mortgage operations | $ | 69,455 | $ | (1,562) | (2) | % | $ | 71,017 | $ | 41,705 | 142 | % | $ | 29,312 | |||||||||||||||||||||||||||
| Other | 22,551 | 14,573 | 183 | % | 7,978 | (22,937) | (74) | % | 30,915 | ||||||||||||||||||||||||||||||||
| Total financial services pretax income | $ | 92,006 | $ | 13,011 | 16 | % | $ | 78,995 | $ | 18,768 | 31 | % | $ | 60,227 | |||||||||||||||||||||||||||
For the year ended December 31, 2021, our financial services revenues increased $16.4 million, or 12% from the same period in the previous year. The increase was due to our other financial services segment, which saw an increase in revenue of $10.5 million. This increase was the result of increased volume during 2021. The increase in our mortgage operations segment was $5.9 million. This increase was the result of increased homebuilding volume, mostly offset by increased competition in the primary mortgage market.
For the year ended December 31, 2021, our financial services pretax income increased $13.0 million or 16% from the same period in the prior year. The increase was due to our other financial services segment, which saw an increase in pretax income of $14.6 million. This increase was the result of $8.3 million of net losses on equity securities recognized during the prior year period and to a lesser extent the increase in volume of our homebuilding operations. The decrease to our mortgage
24
operations was due to increased compensation related costs, partially offset by a $3.5 million gain recognized on the sale of conventional mortgage servicing rights during the period and increased homebuilding volume.
The table below sets forth information for our mortgage operations relating to mortgage loans originated and capture rate.
| Year Ended December 31, | |||||||||||||||||||||||||||||
| 2021 | % or Percentage Change | 2020 | % or Percentage Change | 2019 | |||||||||||||||||||||||||
| (Dollars in thousands) | |||||||||||||||||||||||||||||
| Total Originations: | |||||||||||||||||||||||||||||
| Loans | 6,247 | 10 | % | 5,688 | 30 | % | 4,361 | ||||||||||||||||||||||
| Principal | $ | 2,622,158 | 23 | % | $ | 2,140,229 | 35 | % | $ | 1,585,487 | |||||||||||||||||||
| Capture Rate Data: | |||||||||||||||||||||||||||||
| Capture rate as % of all homes delivered | 62 | % | (7) | % | 69 | % | 7 | % | 62 | % | |||||||||||||||||||
| Capture rate as % of all homes delivered (excludes cash sales) | 65 | % | (7) | % | 72 | % | 5 | % | 67 | % | |||||||||||||||||||
| Mortgage Loan Origination Product Mix: | |||||||||||||||||||||||||||||
| FHA loans | 16 | % | (6) | % | 22 | % | 3 | % | 19 | % | |||||||||||||||||||
| Other government loans (VA & USDA) | 19 | % | (2) | % | 21 | % | 1 | % | 20 | % | |||||||||||||||||||
| Total government loans | 35 | % | (8) | % | 43 | % | 4 | % | 39 | % | |||||||||||||||||||
| Conventional loans | 65 | % | 8 | % | 57 | % | (4) | % | 61 | % | |||||||||||||||||||
| 100 | % | — | % | 100 | % | — | % | 100 | % | ||||||||||||||||||||
| Loan Type: | |||||||||||||||||||||||||||||
| Fixed rate | 100 | % | — | % | 100 | % | 2 | % | 98 | % | |||||||||||||||||||
| ARM | — | % | — | % | — | % | (2) | % | 2 | % | |||||||||||||||||||
| Credit Quality: | |||||||||||||||||||||||||||||
| Average FICO Score | 740 | 1 | % | 735 | — | % | 738 | ||||||||||||||||||||||
| Other Data: | |||||||||||||||||||||||||||||
| Average Combined LTV ratio | 84 | % | (1) | % | 85 | % | 2 | % | 83 | % | |||||||||||||||||||
| Full documentation loans | 100 | % | — | % | 100 | % | — | % | 100 | % | |||||||||||||||||||
| Loans Sold to Third Parties: | |||||||||||||||||||||||||||||
| Loans | 6,210 | 10 | % | 5,620 | 33 | % | 4,217 | ||||||||||||||||||||||
| Principal | $ | 2,563,637 | 22 | % | $ | 2,104,624 | 37 | % | $ | 1,532,214 | |||||||||||||||||||
Income Taxes
We recorded an income tax provision of $178.0 million, $89.9 million and $66.7 million for the years ended December 31, 2021, 2020 and 2019, respectively, and our resulting effective income tax rates were 23.7%, 19.7% and 21.9%, respectively. Our tax provision and effective tax rate is driven by (i) pre-tax book income for the full year, adjusted for items that are deductible/non-deductible for tax purposes only (i.e., permanent items); (ii) benefits from federal energy credits; (iii) taxable income generated in state jurisdictions that varies from consolidated income and (iv) stock based compensation windfalls recorded as discrete items. The difference between our effective tax rate for the year ended December 31, 2021 and the federal statutory rate was primarily due to 3.5% in state taxes and 2.0% for limitations on deductible executive compensation, partially offset by (1.9)% in benefits for federal energy credits and (0.5)% in benefits for the reversal of uncertain tax positions related to expiration of statutory limitations.
25
LIQUIDITY AND CAPITAL RESOURCES
We use our liquidity and capital resources to (1) support our operations, including the purchase of land, land development and construction of homes; (2) provide working capital; and (3) provide mortgage loans for our homebuyers. Our liquidity includes our cash and cash equivalents, Revolving Credit Facility (as defined below) and Mortgage Repurchase Facility (as defined below). Additionally, we have an existing effective shelf registration statement that allows us to issue equity, debt or hybrid securities up to $2.0 billion, of which $1.0 billion remains.
Material Cash Requirements
We are a party to many contractual obligations involving commitments to make payments to third parties. These obligations impact our short-term and long-term liquidity and capital resource needs. Certain contractual obligations are reflected on the Consolidated Balance Sheet as of December 31, 2021, while others are considered future commitments. Our contractual obligations primarily consist of long-term debt and related interest payments, payments due on our Mortgage Repurchase Facility, purchase obligations related to expected acquisition of land under purchase agreements and land development agreements (many of which are secured by letters of credit or surety bonds) and operating leases. Other material cash requirements include land acquisition and development costs not yet contracted for, home construction costs, operating expenses, including our selling, general and administrative expenses, investments and funding of capital improvements and dividend payments.
At December 31, 2021, we had outstanding senior notes with varying maturities totaling an aggregate principal amount of $1.5 billion, with none payable within 12 months. Future interest payments associated with the notes total $1.4 billion, with $64.2 million payable within 12 months. As of December 31, 2021, we had $34.7 million of required operating lease future minimum payments.
At December 31, 2021, we had deposits of $41.6 million in the form of cash and $19.6 million in the form of letters of credit that secured option contracts to purchase 11,148 lots for a total estimated purchase price of $1.0 billion.
At December 31, 2021, we had outstanding surety bonds and letters of credit totaling $371.3 million and $215.5 million, respectively, including $175.4 million in letters of credit issued by HomeAmerican. The estimated cost to complete obligations related to these bonds and letters of credit were approximately $201.7 million and $161.6 million, respectively. We expect that the obligations secured by these performance bonds and letters of credit generally will be performed in the ordinary course of business and in accordance with the applicable contractual terms. To the extent that the obligations are performed, the related performance bonds and letters of credit should be released and we should not have any continuing obligations. However, in the event any such performance bonds or letters of credit are called, our indemnity obligations could require us to reimburse the issuer of the performance bond or letter of credit. We have made no material guarantees with respect to third-party obligations.
Capital Resources
Our capital structure is primarily a combination of (1) permanent financing, represented by stockholders’ equity; (2) long-term financing, represented by our 3.850% senior notes due 2030, 2.500% senior notes due 2031, 6.000% senior notes due 2043, and 3.966% senior notes due 2061; (3) our Revolving Credit Facility and (4) our Mortgage Repurchase Facility. During the year-ended December 31, 2021, we accelerated the retirement of all of our $250 million 5.500% senior notes, which were scheduled to mature in January 2024 (see Note 16, Lines of Credit and Total Debt Obligations, in the notes to the financial statements for further discussion). Because of our current balance of cash, cash equivalents, ability to access the capital markets, and available capacity under both our Revolving Credit Facility and Mortgage Repurchase Facility, we believe that our capital resources are adequate to satisfy our short and long-term capital requirements, including meeting future payments on our senior notes as they become due. See “Forward-Looking Statements” above.
We may from time to time seek to retire or purchase our outstanding senior notes through cash purchases, whether through open market purchases, privately negotiated transactions or otherwise. Such repurchases, if any, will depend on prevailing market conditions, our liquidity requirements, contractual restrictions and other factors. The amounts involved may be material.
Senior Notes, Revolving Credit Facility and Mortgage Repurchase Facility
Senior Notes. Our senior notes are not secured and, while the senior note indentures contain some restrictions on secured debt and other transactions, they do not contain financial covenants. Our senior notes are fully and unconditionally
26
guaranteed on an unsecured basis, jointly and severally, by most of our homebuilding segment subsidiaries. We believe that we are in compliance with the representations, warranties and covenants in the senior note indentures.
Revolving Credit Facility. We have an unsecured revolving credit agreement (“Revolving Credit Facility”) with a group of lenders, which may be used for general corporate purposes. This agreement was amended on December 28, 2020 to (1) increase the aggregate commitment from $1.0 billion to $1.2 billion (the "Commitment"), (2) extend the Revolving Credit Facility maturity of $1.125 billion of the Commitments to December 18, 2025 with the remaining Commitment continuing to terminate on December 18, 2023 and (3) provide that the aggregate amount of the commitments may increase to an amount not to exceed $1.7 billion upon our request, subject to receipt of additional commitments from existing or additional lenders and, in the case of additional lenders, the consent of the co-administrative agents. As defined in the Revolving Credit Facility, interest rates on base rate borrowings are equal to the highest of (1) 0.0%, (2) a prime rate, (3) a federal funds effective rate plus 1.50%, and (4) a specified eurocurrency rate plus 1.00% and, in each case, plus a margin that is determined based on our credit ratings and leverage ratio. Interest rates on eurocurrency borrowings are equal to a specified eurocurrency rate plus a margin that is determined based on our credit ratings and leverage ratio. At any time at which our leverage ratio, as of the last day of the most recent calendar quarter, exceeds 55%, the aggregate principal amount of all consolidated senior debt borrowings outstanding may not exceed the borrowing base. There is no borrowing base requirement if our leverage ratio, as of the last day of the most recent calendar quarter, is 55% or less.
The Revolving Credit Facility provides for a transition from the eurocurrency rate to a benchmark replacement upon the occurrence of certain events.
The Revolving Credit Facility is fully and unconditionally guaranteed, jointly and severally, by most of our homebuilding segment subsidiaries. The facility contains various representations, warranties and covenants that we believe are customary for agreements of this type. The financial covenants include a consolidated tangible net worth test and a leverage test, along with a consolidated tangible net worth covenant, all as defined in the Revolving Credit Facility. A failure to satisfy the foregoing tests does not constitute an event of default, but can trigger a “term-out” of the facility. A breach of the consolidated tangible net worth covenant (but not the consolidated tangible net worth test) or a violation of anti-corruption or sanctions laws would result in an event of default.
The Revolving Credit Facility is subject to acceleration upon certain specified events of default, including breach of the consolidated tangible net worth covenant, a violation of anti-corruption or sanctions laws, failure to make timely payments, breaches of certain representations or covenants, failure to pay other material indebtedness, or another person becoming beneficial owner of 50% or more of our outstanding common stock. We believe we were in compliance with the representations, warranties and covenants included in the Revolving Credit Facility as of December 31, 2021.
As of December 31, 2021, we had $10.0 million in borrowings and $40.1 million in letters of credit outstanding under the Revolving Credit Facility, leaving remaining borrowing capacity of $1.15 billion.
Mortgage Repurchase Facility. HomeAmerican has a Master Repurchase Agreement (the “Mortgage Repurchase Facility”) with U.S. Bank National Association (“USBNA”). The Mortgage Repurchase Facility provides liquidity to HomeAmerican by providing for the sale of up to an aggregate of $75 million (subject to increase by up to $75 million under certain conditions) of eligible mortgage loans to USBNA with an agreement by HomeAmerican to repurchase the mortgage loans at a future date. Until such mortgage loans are transferred back to HomeAmerican, the documents relating to such loans are held by USBNA, as custodian, pursuant to the Custody Agreement (“Custody Agreement”), dated as of November 12, 2008, by and between HomeAmerican and USBNA. In the event that an eligible mortgage loan becomes ineligible, as defined under the Mortgage Repurchase Facility, HomeAmerican may be required to repurchase the ineligible mortgage loan immediately. The Mortgage Repurchase Facility was amended on September 24, 2020, March 25, 2021, May 20, 2021, and December 21, 2021 to adjust the commitments to purchase for specific time periods. As part of the amendments, the commitments to purchase (subject to increase by up to $75 million under certain conditions) were increased as follows: (1) $200 million for the periods December 22, 2020 through February 4, 2021, (2) $175 million for the periods March 25, 2021 through April 22, 2021, June 23, 2021 through July 22, 2021, September 22, 2021 through October 21, 2021, and March 23, 2022 through April 21, 2022 and (3) $400 million for the period December 21, 2021 through February 15, 2022. The Mortgage Repurchase Facility is scheduled to terminate on May 19, 2022.
The maximum aggregate commitment of the Mortgage Repurchase Facility was not temporarily increased as of December 31, 2021. The maximum aggregate commitment of the Mortgage Repurchase Facility was temporarily increased by $50 million on December 28, 2020 effective through January 27, 2021. At December 31, 2021 and 2020, HomeAmerican had $256.3 million and $202.4 million, respectively, of mortgage loans that HomeAmerican was obligated to repurchase under the Mortgage Repurchase Facility. Mortgage loans that HomeAmerican is obligated to repurchase under the Mortgage Repurchase
27
Facility are accounted for as a debt financing arrangement and are reported as mortgage repurchase facility in the consolidated balance sheets. The Mortgage Repurchase Facility was amended on December 21, 2021 to provide for a transition from a pricing rate based on the London Interbank Offered Rate (LIBOR) to one based on the Secured Overnight Financing Rate (SOFR).
The Mortgage Repurchase Facility contains various representations, warranties and affirmative and negative covenants that we believe are customary for agreements of this type. The negative covenants include, among others, (i) a minimum Adjusted Tangible Net Worth requirement, (ii) a maximum Adjusted Tangible Net Worth ratio, (iii) a minimum adjusted net income requirement, and (iv) a minimum Liquidity requirement. The foregoing capitalized terms are defined in the Mortgage Repurchase Facility. We believe HomeAmerican was in compliance with the representations, warranties and covenants included in the Mortgage Repurchase Facility as of December 31, 2021.
Dividends
In the years ended December 31, 2021 and 2020, we paid dividends of $1.67 per share and $1.29 per share, respectively. In addition to the cash dividends paid, the Company distributed a stock dividend of 8% during 2021.
MDC Common Stock Repurchase Program
At December 31, 2021, we were authorized to repurchase up to 4,000,000 shares of our common stock. We did not repurchase any shares of our common stock under this repurchase program during the year ended December 31, 2021.
Consolidated Cash Flow
Our operating cash flows are primarily impacted by: (1) land purchases and construction of homes; (2) closing homes and the associated timing of collecting receivables from home closings; (3) sales of mortgage loans originated by HomeAmerican; (4) payments on accounts payables and accrued liabilities; and (5) funding for payroll. When we close on the sale of a house, our homebuilding subsidiaries will generally receive the proceeds from the sale of the homes within a few days of the home being closed. Therefore, our home sales receivable balance can increase or decrease from period to period based upon the timing of our home closings. Additionally, the amount of mortgage loans held-for-sale can be impacted period to period based upon the number of mortgage loans that were originated by HomeAmerican that have not been sold to third party purchasers and by the timing of fundings by third party mortgage purchasers. Accordingly, mortgage loans held-for-sale may increase if HomeAmerican originates more homes towards the end of one reporting period when compared with the same period in the previous year. HomeAmerican will generally sell mortgage loans it originates between 5 to 35 days after origination.
Operating Cash Flow Activities
For the year ended December 31, 2021, net cash used in operating activities was $208.0 million compared with net cash used in operating activities of $23.1 million in the prior year. Cash used to increase housing completed or under construction was $431.9 million and $449.9 million for the year ended December 31, 2021 and December 31, 2020, respectively, as our homes in inventory increased significantly during both periods. During the year ended December 31, 2021, cash used to increase land and land under development was $497.4 million compared to $15.0 million in the prior year. The increase was driven by the acquisition of 15,435 lots during the year ended December 31, 2021 compared to 11,195 lots during the year ended December 31, 2020. Cash used because of an increase in trade and other receivables for the year ended December 31, 2021 and 2020 was $25.3 million and $12.8 million, respectively, due to the year-over-year increases in home deliveries during both periods. Cash provided by the change in accounts payable and accrued liabilities for the year ended December 31, 2021 and 2020 was $126.4 million and $91.3 million, respectively, due to the increased construction spend during both periods as a result of the year-over-year increases in home deliveries as well as the increase in homes in inventory at both period ends. The most significant source of cash provided by operating activities in both years was net income.
Investing Cash Flow Activities
For the year ended December 31, 2021, net cash used in investing activities was $27.7 million compared with net cash provided by investing activities of $21.7 million in the prior year. The primary driver of this increase in cash from investing activities relates to $48.5 million in net cash provided by the sale of marketable securities during the prior year. Cash used to purchase property and equipment remained materially consistent year-over-year.
28
Financing Cash Flow Activities
For the year ended December 31, 2021, net cash provided by financing activities was $335.2 million compared with $31.2 million in the prior year. The primary driver of this increase in cash provided by financing activities is the proceeds from the issuance of senior notes of $694.7 million during the year ended December 31, 2021, which was partially offset by $277.0 million used to accelerate the retirement of our unsecured notes scheduled to mature in January 2024. Net proceeds from the issuance of senior notes was $48.1 million during the year ended December 31, 2020. Cash used to fund dividend payments increased year-over year as a result of the 25% increase in the cash dividend declared in October 2021 and the 8% stock dividend declared in January 2021.
CRITICAL ACCOUNTING ESTIMATES AND POLICIES
The preparation of financial statements in conformity with accounting principles generally accepted in the United States of America requires management to make estimates and assumptions that affect the reported amounts of assets and liabilities at the date of the consolidated financial statements and the reported amounts of revenue and expenses during the reporting period. Management bases its estimates and judgments on historical experience and on various other factors that are believed to be reasonable under the circumstances, the results of which form the basis for making judgments about the carrying value of assets and liabilities that are not readily apparent from other sources. Management evaluates such estimates and judgments on an on-going basis and makes adjustments as deemed necessary. Actual results could differ from these estimates if conditions are significantly different in the future. See “Forward-Looking Statements” above.
Listed below are those estimates and policies that we believe are critical and require the use of complex judgment in their application. Our critical accounting estimates and policies are as follows and should be read in conjunction with the Notes to our Consolidated Financial Statements.
Homebuilding Inventory Valuation. Refer to Note 1, Summary of Significant Accounting Policies, in the notes to the financial statements for information on the composition of the inventory balances.
In accordance with Accounting Standards Codification (“ASC”) Topic 360, Property, Plant, and Equipment (“ASC 360”), homebuilding inventories, excluding those classified as held for sale, are carried at cost unless events and circumstances indicate that the carrying value of the underlying subdivision may not be recoverable. We evaluate inventories for impairment at each quarter end on a subdivision level basis as each such subdivision represents the lowest level of identifiable cash flows. In making this determination, we review, among other things, the following for each subdivision:
•actual and trending “Operating Margin” (which is defined as home sale revenues less home cost of sales and all incremental costs associated directly with the subdivision, including sales commissions and marketing costs);
•estimated future undiscounted cash flows and Operating Margin;
•forecasted Operating Margin for homes in backlog;
•actual and trending net home orders;
•homes available for sale;
•market information for each sub-market, including competition levels, home foreclosure levels, the size and style of homes currently being offered for sale and lot size; and
•known or probable events indicating that the carrying value may not be recoverable.
If events or circumstances indicate that the carrying value of our inventory may not be recoverable, assets are reviewed for impairment by comparing the undiscounted estimated future cash flows from an individual subdivision (including capitalized interest) to its carrying value. We generally determine the estimated fair value of each subdivision by calculating the present value of the estimated future cash flows using discount rates, which are Level 3 inputs (see Note 6, Fair Value Measurements, in the notes to the financial statements for definitions of fair value inputs), that are commensurate with the risk of the subdivision under evaluation. The evaluation for the recoverability of the carrying value of the assets for each individual subdivision can be impacted significantly by our estimates of future home sale revenues, home construction costs, and development costs per home, all of which are Level 3 inputs. These estimates of undiscounted future cash flows are dependent on specific market or sub-market conditions for each subdivision. While we consider available information to determine what we believe to be our best estimates as of the end of a reporting period, these estimates are subject to change in future reporting periods as facts and circumstances change. Local market-specific conditions that may impact these estimates for a subdivision include:
•historical subdivision results, and actual and trending Operating Margin, base selling prices and home sales incentives;
29
•forecasted Operating Margin for homes in backlog;
•the intensity of competition within a market or sub-market, including publicly available home sales prices and home sales incentives offered by our competitors;
•increased levels of home foreclosures;
•the current sales pace for active subdivisions;
•subdivision specific attributes, such as location, availability and size of lots in the sub-market, desirability and uniqueness of subdivision location and the size and style of homes currently being offered;
•potential for alternative home styles to respond to local market conditions;
•changes by management in the sales strategy of a given subdivision; and
•current local market economic and demographic conditions and related trends and forecasts.
These and other local market-specific conditions that may be present are considered by personnel in our homebuilding divisions as they prepare or update the forecasted assumptions for each subdivision. Quantitative and qualitative factors other than home sales prices could significantly impact the potential for future impairments. The sales objectives can differ among subdivisions, even within a given sub-market. For example, facts and circumstances in a given subdivision may lead us to price our homes with the objective of yielding a higher sales absorption pace, while facts and circumstances in another subdivision may lead us to price our homes to minimize deterioration in our gross margins from home sales, even though this could result in a slower sales absorption pace. Furthermore, the key assumptions included in our estimated future undiscounted cash flows may be interrelated. For example, a decrease in estimated base sales price or an increase in home sales incentives may result in a corresponding increase in sales absorption pace. Additionally, a decrease in the average sales price of homes to be sold and closed in future reporting periods for one subdivision that has not been generating what management believes to be an adequate sales absorption pace may impact the estimated cash flow assumptions of a nearby subdivision. Changes in our key assumptions, including estimated construction and land development costs, absorption pace and selling strategies could materially impact future cash flow and fair value estimates. Due to the number of possible scenarios that would result from various changes in these factors, we do not believe it is possible to develop a sensitivity analysis with a level of precision that would be meaningful to an investor.
If the undiscounted future cash flows of a subdivision are less than its carrying value, the carrying value of the subdivision is written down to its then estimated fair value. We determine the estimated fair value of each subdivision either: (1) by determining the present value of the estimated future cash flows at discount rates that are commensurate with the risk of the subdivision under evaluation; or (2) assessing the market value of the land in its current condition by considering the estimated price a willing buyer would pay for the land (other than in a forced liquidation), and recent land purchase transactions that we believe are indicators of fair value. The estimated future cash flows are the same for both our recoverability and fair value assessments. Factors we consider when determining the discount rate to be used for each subdivision include, among others:
•the number of lots in a given subdivision;
•the amount of future land development costs to be incurred;
•risks associated with the home construction process, including the stage of completion for the entire subdivision and the number of owned lots under construction; and
•the estimated remaining lifespan of the subdivision.
We allocate the impairments recorded between housing completed or under construction and land and land under development for each impaired subdivision based upon the status of construction of a home on each lot (i.e., if the lot is in housing completed or under construction, the impairment for that lot is recorded against housing completed or under construction). The allocation of impairment is the same with respect to each lot in a given subdivision. Changes in management’s estimates, particularly the timing and amount of the estimated future cash inflows and outflows and forecasted average selling prices of homes to be sold and closed can materially affect any impairment calculation. Because our forecasted cash flows are impacted significantly by changes in market conditions, it is reasonably possible that actual results could differ significantly from those estimates. Please see the “Inventory Impairments” section for a detailed discussion and analysis of our asset impairments.
If land is classified as held for sale, we measure it at the lower of the carrying value or fair value less estimated costs to sell. In determining fair value, we primarily rely upon the most recent negotiated price. If a negotiated price is not available, we will consider several factors including, but not limited to, current market conditions, recent comparable sales transactions and market analysis studies. If the fair value less estimated costs to sell is lower than the current carrying value, the land is impaired down to its estimated fair value less costs to sell.
30
Warranty Accrual. Our homes are sold with limited third-party warranties. We record expenses and warranty accruals for general and structural warranty claims, as well as accruals for known, unusual warranty-related expenditures. A warranty accrual is recorded for each home closed based upon historical payment experience in an amount estimated to be adequate to cover expected costs of materials and outside labor during warranty periods. The determination of the warranty accrual rate for closed homes and the evaluation of our warranty accrual balance at period end are based on an internally developed analysis that includes known facts and interpretations of circumstances, including, among other things, our trends in historical warranty payment levels and warranty payments for claims not considered to be normal and recurring. Actual future warranty costs could differ from currently estimated amounts. A 10% change in the historical warranty rates used to estimate our warranty accrual would not result in a material change in our accrual.
Insurance Reserves. The establishment of reserves for estimated losses associated with insurance policies issued by Allegiant and re-insurance agreements issued by StarAmerican are based on actuarial studies that include known facts and interpretations of circumstances, including our experience with similar cases and historical trends involving claim payment patterns, pending levels of unpaid claims, product mix or concentration, claim severity, frequency patterns depending on the business conducted, and changing regulatory and legal environments. Historical trends in claim severity and frequency patterns have been inconsistent and we believe they may continue to fluctuate. It is possible that changes in the insurance payment experience used in estimating our ultimate insurance losses could have a material impact on our insurance reserves. A 10% increase in both the claim frequency and the average cost per claim used to estimate the reserves would result in an increase in our insurance reserves and an associated increase in expense of approximately $15.3 million. A 10% decrease in both the claim frequency and the average cost per claim would result in a decrease in our insurance reserves and an associated reduction in expense of $13.9 million.
Litigation Accruals. In the normal course of business, we are a defendant in claims primarily relating to premises liability, product liability and personal injury claims. These claims seek relief from us under various theories, including breach of implied and express warranty, negligence, strict liability, misrepresentation and violation of consumer protection statutes. We have accrued for losses that may be incurred with respect to legal claims based upon information provided by our legal counsel, including counsel’s on-going evaluation of the merits of the claims and defenses and the level of estimated insurance coverage. Due to uncertainties in the estimation process, actual results could vary from those accruals and could have a material impact on our results of operations.
Revenue Recognition for Homebuilding Segments. We recognize home sale revenues from home deliveries when we have satisfied the performance obligations within the sales agreement, which is generally when title to and possession of the home are transferred to the buyer at the home closing date. Revenue from a home delivery includes the base sales price and any purchased options and upgrades and is reduced for any sales price incentives.
In certain states where we build, we are not always able to complete certain outdoor features (such as landscaping or pools) prior to closing the home. To the extent these separate deliverables are not complete upon the closing of a home, we defer home sale revenues related to incomplete outdoor features, and recognize that revenue upon completion of the outdoor features.
Revenue Recognition for HomeAmerican: Revenues recorded by HomeAmerican primarily reflect (1) origination fees and (2) the corresponding sale, or expected future sale, of a loan, which will include the estimated earnings from either the release or retention of a loan’s servicing rights. Origination fees are recognized when a loan is originated. When an interest rate lock commitment is made to a customer, we record the expected gain on sale of the mortgage, plus the estimated earnings from the expected sale of the associated servicing rights, adjusted for a pull-through percentage (which is defined as the likelihood that an interest rate lock commitment will be originated), as revenue. As the interest rate lock commitment gets closer to being originated, the expected gain on the sale of that loan plus its servicing rights is updated to reflect current market value and the increase or decrease in the fair value of that interest rate lock commitment is recorded through revenues. At the same time, the expected pull-through percentage of the interest rate lock commitment to be originated is updated (typically an increase as the interest lock commitment gets closer to origination) and, if there has been a change, revenues are adjusted as necessary. After origination, our mortgage loans, generally including their servicing rights, are sold to third-party purchasers in accordance with sale agreements entered into by us with a third-party purchaser of the loans. We make representations and warranties with respect to the status of loans transferred in the sale agreements. The sale agreements generally include statements acknowledging the transfer of the loans is intended by both parties to constitute a sale. Sale of a mortgage loan has occurred when the following criteria, among others, have been met: (1) fair consideration has been paid for transfer of the loan by a third party in an arms-length transaction, (2) all the usual risks and rewards of ownership that are in substance a sale have been transferred by us to the third party purchaser; and (3) we do not have a substantial continuing involvement with the mortgage loan.
31
We carry interest rate lock commitments and mortgage loans held-for-sale at fair value.
Home Cost of Sales. Refer to the Note 1, Summary of Significant Accounting Policies, in the notes to the financial statements for information on the composition of home cost of sales. When a home is closed, we generally have not yet paid or incurred all costs necessary to complete the construction of the home and certain land development costs. At the time of a home closing, we compare the home construction budgets to actual recorded costs to determine the additional estimated costs remaining to be paid on each closed home. For amounts not incurred or paid as of the time of closing a home, we record an estimated accrual associated with certain home construction and land development costs. Generally, these accruals are established based upon contracted work which has yet to be paid, open work orders not paid at the time of home closing, as well as land completion costs more likely than not to be incurred, and represent estimates believed to be adequate to cover the expected remaining home construction and land development costs. We monitor the adequacy of these accruals on a house-by-house basis and in the aggregate on both a market-by-market and consolidated basis.
Stock-Based Compensation. ASC Topic 718, Compensation—Stock Compensation (“ASC 718”) requires that share-based compensation expense be measured and recognized at an amount equal to the fair value of share-based payments granted under compensation arrangements. Determining the appropriate fair value model and calculating the fair value of stock option awards requires judgment, including estimating stock price volatility, annual forfeiture rates and the expected life of an award. For stock option awards granted with just service and/or performance conditions, we estimate the fair value using a Black-Scholes option pricing model. For any stock option awards granted that contain a market condition, we estimate the fair value using a Monte Carlo simulation model. Both the Black-Scholes option pricing model and Monte Carlo simulation utilize the following inputs to calculate the estimated fair value of stock options: (1) closing price of our common stock on the measurement date (generally the date of grant); (2) exercise price; (3) expected stock option life; (4) expected volatility; (5) risk-free interest rate; and (6) expected dividend yield rate. The expected life of employee stock options represents the period for which the stock options are expected to remain outstanding and is derived primarily from historical exercise patterns. The expected volatility is determined based on our review of the implied volatility that is derived from the price of exchange traded options of the Company. The risk-free interest rate assumption is determined based upon observed interest rates appropriate for the expected term of our employee stock options. The expected dividend yield assumption is based on our historical dividend payouts. We determine the estimated fair value of the stock option awards on the date they were granted. The fair values of previously granted stock option awards are not adjusted as subsequent changes in the foregoing assumptions occur; for example, an increase or decrease in the price of our common stock. However, changes in the foregoing inputs, particularly the price of our common stock, expected stock option life and expected volatility, significantly change the estimated fair value of future grants of stock options.
An annual forfeiture rate is estimated at the time of grant, and revised if necessary, in subsequent periods if the actual forfeiture rate differs from our estimate.
RECENTLY ISSUED ACCOUNTING STANDARDS
See Note 2, Recently Issued Accounting Standards, in our consolidated financial statements.
32
Item 7A. Quantitative and Qualitative Disclosures About Market Risk.
We have a cash and investment policy that enables us to achieve our strategy with an appropriate investment return while preserving principal and managing risk. Under this policy, our cash and cash equivalents may include U.S. government securities, commercial bank deposits, commercial paper, certificates of deposit, money market funds, and time deposits, with maturities of three months or less. Our marketable securities under this policy may include holdings in corporate U.S. government securities with a maturity of more than three months, equity securities and corporate debt securities.
The market value and/or income derived from equity securities may go up or down, sometimes rapidly or unpredictably. Equity securities may decline in value due to factors affecting equity securities markets generally, particular industries represented in those markets, or the issuer itself. The values of equity securities may decline due to general market conditions that are not specifically related to a particular company, such as real or perceived adverse economic conditions, changes in the general outlook for corporate earnings, changes in interest or currency rates or adverse investor sentiment generally. They may also decline due to factors that affect a particular industry or industries, such as labor shortages or increased production costs and competitive conditions within an industry. The value of equity securities may also decline for a number of other reasons that directly relate to the issuer, such as management performance, financial leverage, the issuer’s historical and prospective earnings, the value of its assets and reduced demand for its goods and services. Equity securities generally have greater price volatility than bonds and other debt securities.
As of December 31, 2021, our cash and cash equivalents included commercial bank deposits and money market funds, with maturities of three months or less.
We are exposed to market risks related to fluctuations in interest rates on mortgage loans held-for-sale, mortgage interest rate lock commitments and debt. Derivative instruments utilized in the normal course of business by HomeAmerican include interest rate lock commitments and forward sales of mortgage-backed securities, which are used to manage the price risk on fluctuations in interest rates on our mortgage loans in inventory and interest rate lock commitments to originate mortgage loans. Such contracts are the only significant financial derivative instruments utilized by MDC. HomeAmerican’s mortgage loans in process for which a rate and price commitment had been made to a borrower that had not closed at December 31, 2021 had an aggregate principal balance of $268.8 million, all of which were under interest rate lock commitments at an average interest rate of 2.91%. In addition, HomeAmerican had mortgage loans held-for-sale with an aggregate principal balance of $276.9 million at December 31, 2021, of which $122.3 million had not yet been committed to a mortgage purchaser and had an average interest rate of 2.74%. In order to hedge the changes in fair value of interest rate lock commitments and mortgage loans held-for-sale which had not yet been committed to a mortgage purchaser, HomeAmerican had forward sales of securities totaling $275.6 million and $203.0 million at December 31, 2021 and 2020, respectively.
HomeAmerican provides mortgage loans that generally are sold forward and subsequently delivered to a third-party purchaser between 5 and 35 days. Forward commitments are used for non-trading purposes to sell mortgage loans and hedge price risk due to fluctuations in interest rates on rate-locked mortgage loans in process that have not closed. Due to this economic hedging philosophy, the market risk associated with these mortgages is limited. For forward sales commitments, as well as commitments to originate mortgage loans that are still outstanding at the end of a reporting period, we record the fair value of the derivatives in the consolidated statements of operations and comprehensive income with an offset to either derivative assets or liabilities, depending on the nature of the change.
We utilize our Revolving Credit Facility, our Mortgage Repurchase Facility and senior notes in our financing strategy. For fixed rate debt, changes in interest rates generally affect the fair value of the debt instrument, but do not affect our earnings or cash flows. We do not have an obligation to prepay our senior notes prior to maturity and, as a result, interest rate risk and changes in fair value do not have an impact on our financial position, results of operations or cash flows. For variable rate debt such as our Revolving Credit Facility and Mortgage Repurchase Facility, changes in interest rates generally do not affect the fair value of the outstanding borrowing on the debt facilities, but does affect our earnings and cash flows. See “Forward-Looking Statements” above.
33
At December 31, 2021, we had $256.3 million of mortgage loans that HomeAmerican is obligated to repurchase under the Mortgage Repurchase Facility. Mortgage loans that HomeAmerican is obligated to repurchase under the Mortgage Repurchase Facility are accounted for as a debt financing arrangement and are reported under Mortgage Repurchase Facility in the consolidated balance sheets. The following table provides the maturities, average interest rate and estimated fair value of significant financial instruments that are sensitive to changes in interest rates at December 31, 2021.
| Maturities through December 31, | Estimated Fair Value | ||||||||||||||||||||||||||||||||||||||||||||||
| 2022 | 2023 | 2024 | 2025 | 2026 | Thereafter | Total | |||||||||||||||||||||||||||||||||||||||||
| (Dollars in thousands) | |||||||||||||||||||||||||||||||||||||||||||||||
| Assets: | |||||||||||||||||||||||||||||||||||||||||||||||
Mortgage loans held for sale (1) | |||||||||||||||||||||||||||||||||||||||||||||||
| Fixed Rate | $ | 276,939 | $ | — | $ | — | $ | — | $ | — | $ | — | $ | 276,939 | $ | 282,529 | |||||||||||||||||||||||||||||||
| Average interest rate | 2.74 | % | 2.74 | % | |||||||||||||||||||||||||||||||||||||||||||
| Liabilities: | |||||||||||||||||||||||||||||||||||||||||||||||
| Fixed rate debt | $ | — | $ | — | $ | — | $ | — | $ | — | $ | 1,500,000 | $ | 1,500,000 | $ | 1,623,351 | |||||||||||||||||||||||||||||||
| Average interest rate | 4.28 | % | 4.28 | % | |||||||||||||||||||||||||||||||||||||||||||
| Mortgage facility | $ | 256,300 | $ | — | $ | — | $ | — | $ | — | $ | — | $ | 256,300 | $ | 256,300 | |||||||||||||||||||||||||||||||
| Average interest rate | 1.89 | % | 1.89 | % | |||||||||||||||||||||||||||||||||||||||||||
Derivative Financial Instruments: | |||||||||||||||||||||||||||||||||||||||||||||||
| Commitments to originate mortgage loans | |||||||||||||||||||||||||||||||||||||||||||||||
| Notional amount | $ | 268,796 | $ | — | $ | — | $ | — | $ | — | $ | — | $ | 268,796 | $ | 5,862 | |||||||||||||||||||||||||||||||
| Average interest rate | 2.91 | % | 2.91 | % | |||||||||||||||||||||||||||||||||||||||||||
| Forward sales of mortgage backed securities | |||||||||||||||||||||||||||||||||||||||||||||||
| Notional amount | $ | 275,600 | $ | — | $ | — | $ | — | $ | — | $ | — | $ | 275,600 | $ | (166) | |||||||||||||||||||||||||||||||
| Average interest rate | 2.17 | % | 2.17 | % | |||||||||||||||||||||||||||||||||||||||||||
__________________________________
(1)All the amounts in this line reflect the expected 2022 disposition of these loans rather than the actual scheduled maturity dates of these mortgages.
34
Item 8. Financial Statements and Supplementary Data
M.D.C. HOLDINGS, INC.
INDEX TO CONSOLIDATED FINANCIAL STATEMENTS
Page | |||||
Consolidated Financial Statements | |||||
Report of Independent Registered Public Accounting Firm (PCAOB 000 | F - 2 | ||||
F - 4 | |||||
F - 5 | |||||
F - 6 | |||||
F - 7 | |||||
F - 8 | |||||
F - 1
Report of Independent Registered Public Accounting Firm
To the Stockholders and the Board of Directors of M.D.C. Holdings, Inc.
Opinion on the Financial Statements
We have audited the accompanying consolidated balance sheets of M.D.C. Holdings, Inc. (the Company) as of December 31, 2021 and 2020, the related consolidated statements of operations and comprehensive income, stockholders' equity and cash flows for each of the three years in the period ended December 31, 2021, and the related notes (collectively referred to as the “consolidated financial statements”). In our opinion, the consolidated financial statements present fairly, in all material respects, the financial position of the Company at December 31, 2021 and 2020, and the results of its operations and its cash flows for each of the three years in the period ended December 31, 2021, in conformity with U.S. generally accepted accounting principles.
We also have audited, in accordance with the standards of the Public Company Accounting Oversight Board (United States) (PCAOB), the Company's internal control over financial reporting as of December 31, 2021, based on criteria established in Internal Control-Integrated Framework issued by the Committee of Sponsoring Organizations of the Treadway Commission (2013 framework), and our report dated February 1, 2022 expressed an unqualified opinion thereon.
Basis for Opinion
These financial statements are the responsibility of the Company's management. Our responsibility is to express an opinion on the Company’s financial statements based on our audits. We are a public accounting firm registered with the PCAOB and are required to be independent with respect to the Company in accordance with the U.S. federal securities laws and the applicable rules and regulations of the Securities and Exchange Commission and the PCAOB.
We conducted our audits in accordance with the standards of the PCAOB. Those standards require that we plan and perform the audit to obtain reasonable assurance about whether the financial statements are free of material misstatement, whether due to error or fraud. Our audits included performing procedures to assess the risks of material misstatement of the financial statements, whether due to error or fraud, and performing procedures that respond to those risks. Such procedures included examining, on a test basis, evidence regarding the amounts and disclosures in the financial statements. Our audits also included evaluating the accounting principles used and significant estimates made by management, as well as evaluating the overall presentation of the financial statements. We believe that our audits provide a reasonable basis for our opinion.
Critical Audit Matter
The critical audit matter communicated below is a matter arising from the current period audit of the financial statements that was communicated or required to be communicated to the audit committee and that: (1) relates to accounts or disclosures that are material to the financial statements and (2) involved our especially challenging, subjective or complex judgments. The communication of the critical audit matter does not alter in any way our opinion on the consolidated financial statements, taken as a whole, and we are not, by communicating the critical audit matter below, providing a separate opinion on the critical audit matter or on the accounts or disclosures to which it relates.
| Evaluation of Insurance Reserves | |||||
| Description of the Matter | At December 31, 2021, the insurance reserves totaled $72.9 million for the estimated incurred cost of construction defect claims. As more fully described in Note 1 to the consolidated financial statements, the Company establishes the reserves for estimated losses based on actuarial studies that include known facts and interpretations of circumstances. | ||||
Auditing the Company’s estimate of the reserves is especially challenging because the estimate is based on actuarial projections of future claims derived from historical claims data. There is significant uncertainty in the actuarial projections as the potential claim payments will be made over a long period of time, they assume that historical claims are a reasonable proxy of future claims, and the claim amounts can be significantly impacted by changes in product mix, quality of construction, units sold, and geographic location of sold units. | |||||
| How We Addressed the Matter in Our Audit | We tested the Company’s internal controls over the estimation of the reserves. For example, we tested controls over the appropriateness of management’s review of the actuary’s analysis, including the underlying data used by the actuary and the consideration by management over whether historical claim information requires adjustment. | ||||
F - 2
To test the estimate of reserves, our audit procedures included, among others, utilizing an internal actuarial specialist to evaluate the actuarial study utilized by management and to perform independent calculations to determine a range of reasonable reserves and to compare this range to the recorded insurance reserves. Additionally, we tested the completeness and accuracy of the underlying claims data provided to management's actuarial specialist, evaluated the change in the reserves from the prior year based upon current year trends in claim data, and performed hindsight reviews of past estimates compared to actual claim payments. | |||||
/s/ Ernst & Young LLP
We have served as the Company’s auditor since 2000.
February 1, 2022
F - 3
M.D.C. HOLDINGS, INC.
Consolidated Balance Sheets
| December 31, 2021 | December 31, 2020 | ||||||||||
(Dollars in thousands, except per share amounts) | |||||||||||
ASSETS | |||||||||||
Homebuilding: | |||||||||||
Cash and cash equivalents | $ | $ | |||||||||
Restricted cash | |||||||||||
Trade and other receivables | |||||||||||
Inventories: | |||||||||||
Housing completed or under construction | |||||||||||
Land and land under development | |||||||||||
Total inventories | |||||||||||
Property and equipment, net | |||||||||||
Deferred tax assets, net | |||||||||||
| Prepaids and other assets | |||||||||||
Total homebuilding assets | |||||||||||
Financial Services: | |||||||||||
Cash and cash equivalents | |||||||||||
Mortgage loans held-for-sale, net | |||||||||||
Other assets | |||||||||||
Total financial services assets | |||||||||||
Total Assets | $ | $ | |||||||||
LIABILITIES AND EQUITY | |||||||||||
Homebuilding: | |||||||||||
Accounts payable | $ | $ | |||||||||
Accrued and other liabilities | |||||||||||
Revolving credit facility | |||||||||||
Senior notes, net | |||||||||||
Total homebuilding liabilities | |||||||||||
Financial Services: | |||||||||||
Accounts payable and accrued liabilities | |||||||||||
Mortgage repurchase facility | |||||||||||
Total financial services liabilities | |||||||||||
Total Liabilities | |||||||||||
Stockholders' Equity | |||||||||||
Preferred stock, $ | |||||||||||
Common stock, $ | |||||||||||
Additional paid-in-capital | |||||||||||
Retained earnings | |||||||||||
Total Stockholders' Equity | |||||||||||
Total Liabilities and Stockholders' Equity | $ | $ | |||||||||
The accompanying Notes are an integral part of these Consolidated Financial Statements.
F - 4
M.D.C. HOLDINGS, INC.
Consolidated Statements of Operations and Comprehensive Income
| Year Ended December 31, | |||||||||||||||||
| 2021 | 2020 | 2019 | |||||||||||||||
| (Dollars in thousands, except per share amounts) | |||||||||||||||||
| Homebuilding: | |||||||||||||||||
| Home sale revenues | $ | $ | $ | ||||||||||||||
| Home cost of sales | ( | ( | ( | ||||||||||||||
| Inventory impairments | ( | ( | |||||||||||||||
| Total cost of sales | ( | ( | ( | ||||||||||||||
| Gross margin | |||||||||||||||||
| Selling, general and administrative expenses | ( | ( | ( | ||||||||||||||
| Loss on debt retirement | ( | ||||||||||||||||
| Interest and other income | |||||||||||||||||
| Other expense | ( | ( | ( | ||||||||||||||
| Homebuilding pretax income | |||||||||||||||||
| Financial Services: | |||||||||||||||||
| Revenues | |||||||||||||||||
| Expenses | ( | ( | ( | ||||||||||||||
| Other income (expense), net | ( | ||||||||||||||||
| Financial services pretax income | |||||||||||||||||
| Income before income taxes | |||||||||||||||||
| Provision for income taxes | ( | ( | ( | ||||||||||||||
| Net income | $ | $ | $ | ||||||||||||||
| Comprehensive income | $ | $ | $ | ||||||||||||||
| Earnings per share: | |||||||||||||||||
| Basic | $ | $ | $ | ||||||||||||||
| Diluted | $ | $ | $ | ||||||||||||||
| Weighted average common shares outstanding | |||||||||||||||||
| Basic | |||||||||||||||||
| Diluted | |||||||||||||||||
The accompanying Notes are an integral part of these Consolidated Financial Statements.
F - 5
M.D.C. HOLDINGS, INC.
Consolidated Statements of Stockholders' Equity
(Dollars in thousands, except share amounts)
| Common Stock | Additional Paid-in Capital | Retained Earnings | Accumulated Other Comprehensive Income | Total | |||||||||||||||||||||||||||||||
| Shares | Amount | ||||||||||||||||||||||||||||||||||
| Balance at December 31, 2018 | $ | $ | $ | $ | $ | ||||||||||||||||||||||||||||||
| Cumulative effect of newly adopted accounting standards (Note 2) | — | — | — | ( | — | ( | |||||||||||||||||||||||||||||
| Balance at January 1, 2019 | $ | $ | $ | $ | $ | ||||||||||||||||||||||||||||||
| Net Income | — | — | — | — | |||||||||||||||||||||||||||||||
| Shares issued under stock-based compensation programs, net | — | ||||||||||||||||||||||||||||||||||
| Cash dividends declared | — | — | — | ( | — | ( | |||||||||||||||||||||||||||||
| Stock dividend declared | ( | — | ( | ||||||||||||||||||||||||||||||||
| Stock-based compensation expense | — | — | — | — | |||||||||||||||||||||||||||||||
| Forfeiture of restricted stock | ( | — | — | — | — | ||||||||||||||||||||||||||||||
| Balance at December 31, 2019 | $ | $ | $ | $ | $ | ||||||||||||||||||||||||||||||
| Cumulative effect of newly adopted accounting standards (Note 2) | — | — | — | ( | — | ( | |||||||||||||||||||||||||||||
| Balance at January 1, 2020 | $ | $ | $ | $ | $ | ||||||||||||||||||||||||||||||
| Net Income | — | — | — | — | |||||||||||||||||||||||||||||||
| Shares issued under stock-based compensation programs, net | — | — | |||||||||||||||||||||||||||||||||
| Cash dividends declared | — | — | — | ( | — | ( | |||||||||||||||||||||||||||||
| Stock-based compensation expense | — | — | — | — | |||||||||||||||||||||||||||||||
| Forfeiture of restricted stock | ( | — | — | — | — | ||||||||||||||||||||||||||||||
| Balance at December 31, 2020 | $ | $ | $ | $ | $ | ||||||||||||||||||||||||||||||
| Net Income | — | — | — | — | |||||||||||||||||||||||||||||||
| Shares issued under stock-based compensation programs, net | ( | — | — | ( | |||||||||||||||||||||||||||||||
| Cash dividends declared | — | — | — | ( | — | ( | |||||||||||||||||||||||||||||
| Stock dividend declared | ( | — | ( | ||||||||||||||||||||||||||||||||
| Stock-based compensation expense | — | — | — | — | |||||||||||||||||||||||||||||||
| Forfeiture of restricted stock | ( | — | — | — | — | ||||||||||||||||||||||||||||||
| Balance at December 31, 2021 | $ | $ | $ | $ | $ | ||||||||||||||||||||||||||||||
The accompanying Notes are an integral part of these Consolidated Financial Statements.
F - 6
M.D.C. HOLDINGS, INC.
Consolidated Statements of Cash Flows
| Year Ended December 31, | |||||||||||||||||
| 2021 | 2020 | 2019 | |||||||||||||||
| (Dollars in thousands) | |||||||||||||||||
| Operating Activities: | |||||||||||||||||
| Net income | $ | $ | $ | ||||||||||||||
| Adjustments to reconcile net income to net cash provided by (used in) operating activities: | |||||||||||||||||
| Stock-based compensation expense | |||||||||||||||||
| Depreciation and amortization | |||||||||||||||||
| Inventory impairments | |||||||||||||||||
| Net (gain) loss on marketable equity securities | ( | ||||||||||||||||
| Gain on sale of other assets | ( | ||||||||||||||||
| Loss on retirement of debt | |||||||||||||||||
| Deferred income tax expense | ( | ||||||||||||||||
| Net changes in assets and liabilities: | |||||||||||||||||
| Trade and other receivables | ( | ( | ( | ||||||||||||||
| Mortgage loans held-for-sale | ( | ( | ( | ||||||||||||||
| Housing completed or under construction | ( | ( | ( | ||||||||||||||
| Land and land under development | ( | ( | ( | ||||||||||||||
| Prepaids and other assets | ( | ( | |||||||||||||||
| Accounts payable and accrued liabilities | |||||||||||||||||
| Net cash provided by (used in) operating activities | ( | ( | |||||||||||||||
| Investing Activities: | |||||||||||||||||
| Purchases of marketable securities | ( | ( | |||||||||||||||
| Sales of marketable securities | |||||||||||||||||
| Proceeds from sale of other assets | |||||||||||||||||
| Purchases of property and equipment | ( | ( | ( | ||||||||||||||
| Net cash provided by (used in) investing activities | ( | ( | |||||||||||||||
| Financing Activities: | |||||||||||||||||
| Advances on mortgage repurchase facility, net | |||||||||||||||||
| Payments on homebuilding line of credit, net | ( | ||||||||||||||||
| Payments of senior notes | ( | ( | |||||||||||||||
| Proceeds from issuance of senior notes | |||||||||||||||||
| Dividend payments | ( | ( | ( | ||||||||||||||
| Payments of deferred debt issuance costs | ( | ( | |||||||||||||||
| Issuance of shares under stock-based compensation programs, net | ( | ||||||||||||||||
| Net cash provided by (used in) financing activities | ( | ||||||||||||||||
| Net increase in cash, cash equivalents and restricted cash | |||||||||||||||||
| Cash, cash equivalents and restricted cash: | |||||||||||||||||
| Beginning of year | |||||||||||||||||
| End of year | $ | $ | $ | ||||||||||||||
| Reconciliation of cash, cash equivalents and restricted cash: | |||||||||||||||||
| Homebuilding: | |||||||||||||||||
| Cash and cash equivalents | $ | $ | $ | ||||||||||||||
| Restricted cash | |||||||||||||||||
| Financial Services: | |||||||||||||||||
| Cash and cash equivalents | |||||||||||||||||
| Total cash, cash equivalents and restricted cash | $ | $ | $ | ||||||||||||||
The accompanying Notes are an integral part of these Consolidated Financial Statements
.
F - 7
1. Summary of Significant Accounting Policies
Description of Business. We have homebuilding operations in Arizona, California, Colorado, Florida, Idaho, Maryland, New Mexico, Nevada, Oregon, Pennsylvania, Tennessee, Texas, Utah, Virginia and Washington. The primary functions of our homebuilding operations include land acquisition and development, home construction, purchasing, marketing, merchandising, sales and customer service. We build and sell primarily single-family detached homes, which are designed and built to meet local customer preferences. We are the general contractor for all of our projects and retain subcontractors for site development and home construction.
Our financial services operations consist of HomeAmerican Mortgage Corporation (“HomeAmerican”), which originates mortgage loans, primarily for our homebuyers, American Home Insurance Agency, Inc. (“American Home Insurance”), which offers third-party insurance products to our homebuyers, and American Home Title and Escrow Company (“American Home Title”), which provides title agency services to the Company and our homebuyers in Colorado, Florida, Maryland, Nevada, Pennsylvania and Virginia. The financial services operations also include Allegiant Insurance Company, Inc., A Risk Retention Group (“Allegiant”), which provides insurance coverage primarily to our homebuilding subsidiaries on homes that have been delivered and most of our subcontractors for completed work on those delivered homes, and StarAmerican Insurance Ltd. (“StarAmerican”), a wholly owned subsidiary of MDC, which is a re-insurer of Allegiant claims.
F - 8
Inventories. Our inventories are primarily associated with communities where we intend to construct and sell homes, including models and unsold homes. Components of housing completed or under construction primarily include: (1) land costs transferred from land and land under development; (2) direct construction costs associated with a house; (3) real property taxes, engineering fees, permits and other fees; (4) capitalized interest; and (5) indirect construction costs, which include field construction management salaries and benefits, utilities and other construction related costs. Costs capitalized to land and land under development primarily include: (1) land costs; (2) land development costs; (3) entitlement costs; (4) capitalized interest; (5) engineering fees; and (6) title insurance, real property taxes and closing costs directly related to the purchase of the land parcel. Land costs are transferred from land and land under development to housing completed or under construction at the point in time that construction of a home on an owned lot begins.
In accordance with Accounting Standards Codification (“ASC”) Topic 360, Property, Plant, and Equipment (“ASC 360”), homebuilding inventories, excluding those classified as held for sale, are carried at cost unless events and circumstances indicate that the carrying value of the underlying subdivision may not be recoverable. We evaluate inventories for impairment at each quarter end on a subdivision level basis as each such subdivision represents the lowest level of identifiable cash flows. In making this determination, we review, among other things, the following for each subdivision:
•actual and trending “Operating Margin” (which is defined as home sale revenues less home cost of sales and all incremental costs associated directly with the subdivision, including sales commissions and marketing costs);
•estimated future undiscounted cash flows and Operating Margin;
•forecasted Operating Margin for homes in backlog;
•actual and trending net home orders;
•homes available for sale;
•market information for each sub-market, including competition levels, home foreclosure levels, the size and style of homes currently being offered for sale and lot size; and
•known or probable events indicating that the carrying value may not be recoverable.
If events or circumstances indicate that the carrying value of our inventory may not be recoverable, assets are reviewed for impairment by comparing the undiscounted estimated future cash flows from an individual subdivision (including capitalized interest) to its carrying value. If the undiscounted future cash flows are less than the subdivision’s carrying value, the carrying value of the subdivision is written down to its then estimated fair value. We generally determine the estimated fair value of each subdivision by calculating the present value of the estimated future cash flows using discount rates, which are Level 3 inputs (see Note 6, Fair Value Measurements, in the notes to the financial statements for definitions of fair value inputs), that are commensurate with the risk of the subdivision under evaluation. The evaluation for the recoverability of the carrying value of the assets for each individual subdivision can be impacted significantly by our estimates of future home sale revenues, home construction costs, and development costs per home, all of which are Level 3 inputs.
If land is classified as held for sale, in accordance with ASC 360, we measure it at the lower of the carrying value or fair value less estimated costs to sell. In determining fair value, we primarily rely upon the most recent negotiated price which is a Level 2 input (see Note 6, Fair Value Measurements, for definitions of fair value inputs). If a negotiated price is not available, we will consider several factors including, but not limited to, current market conditions, recent comparable sales transactions and market analysis studies. If the fair value less estimated costs to sell is lower than the current carrying value, the land is impaired down to its estimated fair value less costs to sell.
F - 9
lives of the related assets, which range from 2 to 29 years. Depreciation and amortization expense for property and equipment was $30.2 million, $26.1 million and $22.8 million for the years ended December 31, 2021, 2020 and 2019, respectively which is recorded in selling, general and administrative expenses in the homebuilding or expenses in the financial services sections of our consolidated statements of operations and comprehensive income.
| Cost | Accumulated Depreciation and Amortization | Carrying Value | ||||||||||||||||||
| December 31, 2021: | (Dollars in thousands) | |||||||||||||||||||
| Sales facilities | $ | $ | ( | $ | ||||||||||||||||
| Airplane | ( | |||||||||||||||||||
| Computer software and equipment | ( | |||||||||||||||||||
| Leasehold improvements | ( | |||||||||||||||||||
| Other | ( | |||||||||||||||||||
| Total | $ | $ | ( | $ | ||||||||||||||||
| December 31, 2020: | ||||||||||||||||||||
| Sales facilities | $ | $ | ( | $ | ||||||||||||||||
| Airplane | ( | |||||||||||||||||||
| Computer software and equipment | ( | |||||||||||||||||||
| Leasehold improvements | ( | |||||||||||||||||||
| Other | ( | |||||||||||||||||||
| Total | $ | $ | ( | $ | ||||||||||||||||
Goodwill. In accordance with ASC Topic 350, Intangibles–Goodwill and Other (“ASC 350”), we evaluate goodwill for possible impairment annually or more frequently if events or changes in circumstances indicate that the carrying amount of such assets may not be recoverable. We use a three-step process to assess the realizability of goodwill. The first step is a qualitative assessment that analyzes current economic indicators associated with a particular reporting unit. For example, we analyze changes in economic, market and industry conditions, business strategy, cost factors, and financial performance, among others, to determine if there are indicators of a significant decline in the fair value of a particular reporting unit. If the qualitative assessment indicates a stable or improved fair value, no further testing is required.
If a qualitative assessment indicates it is more likely than not that the fair value of a reporting unit is less than its carrying amount, we will proceed to the second step where we calculate the fair value of a reporting unit based on discounted future probability-weighted cash flows. If this step indicates that the carrying value of a reporting unit is in excess of its fair
F - 10
value, we will proceed to the third step where the fair value of the reporting unit will be allocated to assets and liabilities as they would in a business combination. Impairment occurs when the carrying amount of goodwill exceeds its estimated fair value calculated in the third step.
Based on our analysis, we have concluded that as of December 31, 2021 and 2020, our goodwill was no
Liability for Unrecognized Tax Benefits. ASC Topic 740, Income Taxes, regarding liabilities for unrecognized tax benefits provides guidance for the recognition and measurement in financial statements of uncertain tax positions taken or expected to be taken in a tax return.
The evaluation of a tax position is a two-step process, the first step being recognition. We determine whether it is more-likely-than-not that a tax position will be sustained upon tax examination, including resolution of any related appeals or litigation, based on the technical merits of the position. The technical merits of a tax position derive from both statutory and judicial authority (legislation and statutes, legislative intent, regulations, rulings, and case law) and their applicability to the facts and circumstances of the tax position. If a tax position does not meet the more-likely-than-not recognition threshold, the benefit of that position is not recognized in the financial statements.
The second step is measurement. A tax position that meets the more-likely-than-not recognition threshold is measured to determine the amount of benefit to recognize in the financial statements. The tax position is measured as the largest amount of benefit that is greater than 50 percent likely of being realized upon ultimate resolution with a taxing authority. Once the gross unrecognized tax benefit is determined, we also accrue for any interest and penalties, as well as any offsets expected from resultant amendments to federal or state tax returns. We record the aggregate effect of these items in income tax expense in the consolidated statements of operations and comprehensive income. To the extent this tax position would be offset against a similar deferred tax asset for a net operating loss carryforward, a similar tax loss or a tax credit carryforward if such settlement is required or expected in the event the uncertain tax position is disallowed, the liability is treated as a reduction to the related deferred tax asset for a net operating loss carryforward, a similar tax loss or a tax credit carryforward. Otherwise, we record the corresponding liability in accrued and other liabilities in our consolidated balance sheets.
Warranty Accrual. Our homes are sold with limited third-party warranties. Under our agreement with the issuer of the third-party warranties, we are responsible for performing all of the work for the first two years of the warranty coverage and paying for substantially all of the work required to be performed during years through of the warranties. We record accruals for general and structural warranty claims, as well as accruals for known, unusual warranty-related expenditures. Our warranty accrual is recorded based upon historical payment experience in an amount estimated to be adequate to cover expected costs of materials and outside labor during warranty periods. The determination of the warranty accrual rate for closed homes and the evaluation of our warranty accrual balance at period end are based on an internally developed analysis that includes known facts and interpretations of circumstances, including, among other things, our trends in historical warranty payment levels and warranty payments for claims not considered to be normal and recurring.
Warranty payments are recorded against the warranty accrual. Additional reserves may be established for known, unusual warranty-related expenditures not covered through the independent warranty accrual analysis performed by us. Warranty payments incurred for an individual house may differ from the related reserve established for the home at the time it was closed. The actual disbursements for warranty claims are evaluated in the aggregate to determine if an adjustment to the historical warranty accrual should be recorded.
We assess the reasonableness and adequacy of the reserve and the per-unit reserve amount originally included in home cost of sales, as well as the timing of the reversal of any excess reserve on a quarterly basis, using historical payment data and other relevant information. Our warranty accrual is included in accrued and other liabilities in the homebuilding section of our consolidated balance sheets and adjustments to our warranty accrual are recorded as an increase or reduction to home cost of sales in the homebuilding section of our consolidated statements of operations and comprehensive income. See Note 12 to the Consolidated Financial Statements.
F - 11
Derivative Financial Instruments. The derivative instruments we utilize in the normal course of business are interest rate lock commitments and forward sales of mortgage-backed securities, both of which typically are short-term in nature. Forward sales of mortgage-backed securities are utilized to hedge changes in fair value of our interest rate lock commitments as well as mortgage loans held-for-sale that are not under commitments to sell. For forward sales of mortgage-backed securities, as well as interest rate lock commitments that are still outstanding at the end of a reporting period, we record the changes in fair value of the derivatives in revenues in the financial services section of our consolidated statements of operations and comprehensive income with an offset to other assets or accounts payable and accrued liabilities in the financial services section of our consolidated balance sheets, depending on the nature of the change.
At December 31, 2021 and 2020, we had interest rate lock commitments with aggregate principal balances of $268.8 million and $230.5 million, respectively, at average interest rates of 2.91 % and 2.69 % respectively. In addition, we had $122.3 million and $91.1 million of mortgage loans held-for-sale at December 31, 2021 and 2020, respectively, that had not yet been committed to a mortgage purchaser. In order to economically hedge the changes in fair value of our interest rate lock commitments and mortgage loans held-for-sale which had not yet been committed to a mortgage purchaser, we had forward sales of securities totaling $275.6 million and $203.0 million at December 31, 2021 and 2020, respectively.
For the years ended December 31, 2021, 2020 and 2019, we recorded net gains (losses) on our derivatives of $(1.7 ) million, $4.7 million and $0.3 million, respectively. For further discussion of our policies regarding interest rate lock commitments, see our “Revenue Recognition for HomeAmerican” accounting policy section below.
Revenue Recognition for Homebuilding Segments. We recognize home sale revenues from home deliveries when we have satisfied the performance obligations within the sales agreement, which is generally when title to and possession of the home are transferred to the buyer at the home closing date. Revenue from a home delivery includes the base sales price and any purchased options and upgrades and is reduced for any sales price incentives.
In certain states where we build, we are not always able to complete certain outdoor features (such as landscaping or pools) prior to closing the home. To the extent these separate deliverables are not complete upon the closing of a home, we defer home sale revenues related to incomplete outdoor features, and recognize that revenue upon completion of the outdoor features.
Revenue expected to be recognized in any future year related to remaining performance obligations (if any) and contract liabilities expected to be recognized as revenue, excluding revenue pertaining to contracts that have an original expected duration of one year or less, is not material.
Revenue Recognition for HomeAmerican. Revenues recorded by HomeAmerican primarily reflect (1) origination fees and (2) the corresponding sale, or expected future sale, of a loan, which will include the estimated earnings from either the release or retention of a loan’s servicing rights. Origination fees are recognized when a loan is originated. When an interest rate lock commitment is made to a customer, we record the expected gain on sale of the mortgage, plus the estimated earnings from the expected sale of the associated servicing rights, adjusted for a pull-through percentage (which is defined as the likelihood that an interest rate lock commitment will be originated), as revenue. As the interest rate lock commitment gets closer to being originated, the expected gain on the sale of that loan plus its servicing rights is updated to reflect current market value and the increase or decrease in the fair value of that interest rate lock commitment is recorded through revenues. At the same time, the expected pull-through percentage of the interest rate lock commitment to be originated is updated (typically an increase as the interest lock commitment gets closer to origination) and, if there has been a change, revenues are adjusted as necessary. After origination, our mortgage loans, generally including their servicing rights, are sold to third-party purchasers in accordance with sale agreements entered into by us with a third-party purchaser of the loans. We make representations and warranties with respect to the status of loans transferred in the sale agreements. The sale agreements generally include statements
F - 12
acknowledging the transfer of the loans is intended by both parties to constitute a sale. Sale of a mortgage loan has occurred when the following criteria, among others, have been met: (1) fair consideration has been paid for transfer of the loan by a third party in an arms-length transaction, (2) all the usual risks and rewards of ownership that are in substance a sale have been transferred by us to the third party purchaser; and (3) we do not have a substantial continuing involvement with the mortgage loan.
We measure mortgage loans held-for-sale at fair value with the changes in fair value being reported in earnings at each reporting date. The impact of recording changes in fair value to earnings did not have a material impact on our financial position, results of operations or cash flows during the years ended December 31, 2021, 2020 or 2019. Our net gains on the sale of mortgage loans were $90.9 million, $93.3 million and $55.3 million for the years ended December 31, 2021, 2020 and 2019, respectively, and are included as a component of revenues in the financial services section of the consolidated statements of operations and comprehensive income.
Home Cost of Sales. Home cost of sales includes the specific construction costs of each home and all applicable land acquisition, land development and related costs, warranty costs and finance and closing costs, including closing cost incentives. We use the specific identification method for the purpose of accumulating home construction costs and allocate costs to each lot within a subdivision associated with land acquisition and land development based upon relative fair value of the lots prior to home construction. Lots within a subdivision typically have comparable fair values, and, as such, we generally allocate costs equally to each lot within a subdivision. We record all home cost of sales when a home is closed and performance obligations have been completed on a house-by-house basis.
When a home is closed, we may not have paid for all costs necessary to complete the construction of the home. This includes (1) construction that has been completed on a house but has not yet been billed or (2) work still to be performed on a home (such as limited punch-list items or certain outdoor features). For each of these items, we create an estimate of the total expected costs to be incurred and, with the exclusion of outdoor features, the estimated total costs for those items, less any amounts paid to date, are included in home cost of sales. Actual results could differ from such estimates. For incomplete outdoor features, we will defer the revenue and any cost of sales on this separate stand-alone deliverable until complete.
Stock-Based Compensation Expense. In accordance with ASC Topic 718, Compensation—Stock Compensation (“ASC 718”), stock-based compensation expense for all share-based payment awards is based on the grant date fair value. For stock option awards granted with just service and/or performance conditions, we estimate the fair value using a Black-Scholes option pricing model. For any stock option awards granted that contain a market condition, we estimate the fair value using a Monte Carlo simulation model. We recognize expense for share-based payment awards based on their varying vesting conditions as follows:
•Awards with service-based vesting conditions only – Expense is recognized on a straight-line basis over the requisite service period of the award.
•Awards with performance-based vesting conditions – Expense is not recognized until it is determined that it is probable the performance-based conditions will be met. When achievement of a performance-based condition is probable, a catch-up of expense will be recorded as if the award had been vesting on a straight-line basis from the award date. The award will continue to be expensed on a straight-line basis until the probability of achieving the performance-based condition changes, if applicable.
An annual forfeiture rate is estimated at the time of grant for all share-based payment awards that contain service and/or performance conditions. That rate is revised, if necessary, in subsequent periods if the actual forfeiture rate differs from our estimate.
F - 13
2. Recently Issued Accounting Standards
Adoption of New Accounting Standards
In June 2016, the Financial Accounting Standards Board ("FASB") issued ASU 2016-13, Financial Instruments—Credit Losses (Topic 326): Measurement of Credit Losses on Financial Instruments (“ASU 2016-13”), which requires measurement and recognition of expected credit losses for financial assets held. The amendments in ASU 2016-13 eliminate the probable threshold for initial recognition of a credit loss in current GAAP and reflect an entity’s current estimate of all expected credit losses. On January 1, 2020, we adopted ASU 2016-13 using the modified retrospective transition method, resulting in a cumulative effect adjustment that decreased the opening balance of retained earnings by less than $0.1 million. The standard did not materially impact our consolidated statements of operations and comprehensive income or consolidated cash flows.
In March 2020, the Securities and Exchange Commission ("SEC") adopted amendments to the financial disclosure requirements applicable to registered debt offerings that include credit enhancements, such as subsidiary guarantees, in Rule 3-10 of Regulation S-X. The amended rule focuses on providing material, relevant and decision-useful information regarding guarantees and other credit enhancements, while eliminating certain prescriptive requirements. The rule is effective January 4, 2021 but earlier compliance is permitted. The Company adopted these amendments on June 30, 2020. As the combined assets, liabilities and results of operations of M.D.C. Holdings, Inc. and the Guarantor Subsidiaries (the “Obligor Group”) are not materially different from those in the homebuilding section of our consolidated balance sheets and consolidated statements of operations and comprehensive income, separate summarized financial information of the Obligor Group has not been included. See Note 22, Supplemental Guarantor Information, for further information regarding subsidiary guarantees.
ASU 2016-02, Leases (“ASU 2016-02”) is codified in ASC 842, Leases (“ASC 842”). ASC 842 supersedes current lease guidance in ASC 840 and requires a lessee to recognize a right-of-use asset and a corresponding lease liability for substantially all leases. The lease liability is equal to the present value of the remaining lease payments while the right-of-use asset is similarly calculated and then adjusted for initial direct costs. In addition, ASC 842 expands the disclosure requirements to increase the transparency and comparability of the amount, timing and uncertainty of cash flows arising from leases. On January 1, 2019, we adopted ASC 842 using the modified retrospective transition method. We elected available practical expedients permitted under the transition guidance within the new standard, which among other items, allowed the Company to carry forward its historical lease classification and not reassess existing leases under the new definition of a lease in ASC 842. In addition, we will account for lease and non-lease components as a single lease component.
The adoption of ASC 842 resulted in the recording of additional net lease assets and lease liabilities of $34.2 million and $34.3 million, respectively, as of January 1, 2019. The difference between the additional lease assets and lease liabilities, net of the deferred tax impact, was recorded as an adjustment to retained earnings. The operating lease right-of-use asset and lease liability is included as a component of prepaids and other assets and accrued and other liabilities, respectively, in the homebuilding section and other assets and accounts payable and accrued liabilities, respectively, in the financial services section of our consolidated balance sheet. The standard did not materially impact our consolidated statements of operations and comprehensive income or consolidated cash flows.
F - 14
3. Supplemental Income Statement and Cash Flow Disclosure
| Year Ended December 31, | |||||||||||||||||
| 2021 | 2020 | 2019 | |||||||||||||||
Homebuilding | (Dollars in thousands) | ||||||||||||||||
Interest and other income | |||||||||||||||||
Interest income | $ | $ | $ | ||||||||||||||
Other income | |||||||||||||||||
Total | $ | $ | $ | ||||||||||||||
Financial Services | |||||||||||||||||
Other income (expense), net | |||||||||||||||||
Interest income | $ | $ | $ | ||||||||||||||
Dividend income | |||||||||||||||||
Gain (loss) on marketable equity securities, net | ( | ||||||||||||||||
Total | $ | $ | ( | $ | |||||||||||||
| Year Ended December 31, | |||||||||||||||||
| 2021 | 2020 | 2019 | |||||||||||||||
| (Dollars in thousands) | |||||||||||||||||
| Cash paid for: | |||||||||||||||||
| Interest, net of interest capitalized | $ | $ | $ | ||||||||||||||
| Income taxes | $ | $ | $ | ||||||||||||||
4. Segment Reporting
An operating segment is defined as a component of an enterprise for which discrete financial information is available and is reviewed regularly by the Chief Operating Decision Maker (“CODM”), or decision-making group, to evaluate performance and make operating decisions. We have identified our CODM as two key executives—the Executive Chairman and the Chief Executive Officer (“CEO”).
We have identified each homebuilding division as an operating segment. Our homebuilding operating segments have been aggregated into the reportable segments noted below because they are similar in the following regards: (1) economic characteristics; (2) housing products; (3) class of homebuyer; (4) regulatory environments; and (5) methods used to construct and sell homes. Our homebuilding reportable segments are as follows:
•West (Arizona, California, Nevada, New Mexico, Oregon, Texas and Washington)
•Mountain (Colorado, Idaho and Utah)
•East (Florida, mid-Atlantic, which includes Maryland, Pennsylvania and Virginia, and Tennessee)
Our financial services business consists of the following operating segments: (1) HomeAmerican; (2) Allegiant; (3) StarAmerican; (4) American Home Insurance; and (5) American Home Title. Due to its contributions to consolidated pretax income we consider HomeAmerican to be a reportable segment (“mortgage operations”). The remaining operating segments have been aggregated into one reportable segment (“other”) because they do not individually exceed 10 percent of (1) consolidated revenue; (2) the greater of (a) combined reported profit of all operating segments that did not report a loss or (b) the positive value of the combined reported loss of all operating segments that reported losses; or (3) consolidated assets.
Corporate is a non-operating segment that develops and implements strategic initiatives and supports our operating divisions by centralizing key administrative functions such as finance, treasury, information technology, insurance, risk management, litigation and human resources. Corporate also provides the necessary administrative functions to support MDC as a publicly traded company. A portion of the expenses incurred by Corporate are allocated to the homebuilding operating
F - 15
segments based on their respective percentages of assets, and to a lesser degree, a portion of Corporate expenses are allocated to the financial services segments. A majority of Corporate’s personnel and resources are primarily dedicated to activities relating to the homebuilding segments, and, therefore, the balance of any unallocated Corporate expenses is included in the homebuilding operations section of our consolidated statements of operations and comprehensive income.
On a periodic basis, we assess our Corporate cost allocation estimates. Our prior year assessment resulted in increases in Corporate cost allocations to both our homebuilding and financial services segments beginning January 1, 2020, to reflect the use of centralized administrative functions. Applying the most recent cost allocation estimate to the year ended December 31, 2019 would have resulted in decreased pretax income for our homebuilding and financial services segments of approximately $11.1 million and $1.6 million, respectively, with corresponding decrease in our Corporate segment pretax loss. Additionally, beginning January 1, 2020, we have reflected the expense associated with all homebuilding employee bonuses in the respective homebuilding segment to which the employee reports, consistent with how the CODM is now evaluating homebuilding division performance and making operating decisions. Had these bonuses been reflected in a similar manner during the year ended December 31, 2019, pretax income for our homebuilding segments would have decreased by an additional $13.1 million with a corresponding decrease in our Corporate segment pretax loss. There was no change in our Corporate cost allocation estimates in the year ended December 31, 2021.
| Year Ended December 31, | |||||||||||||||||
| 2021 | 2020 | 2019 | |||||||||||||||
| (Dollars in thousands) | |||||||||||||||||
| Homebuilding | |||||||||||||||||
| West | $ | $ | $ | ||||||||||||||
| Mountain | |||||||||||||||||
| East | |||||||||||||||||
| Total homebuilding revenues | $ | $ | $ | ||||||||||||||
| Financial Services | |||||||||||||||||
| Mortgage operations | $ | $ | $ | ||||||||||||||
| Other | |||||||||||||||||
| Total financial services revenues | $ | $ | $ | ||||||||||||||
| Total revenues | $ | $ | $ | ||||||||||||||
| Year Ended December 31, | |||||||||||||||||
| 2021 | 2020 | 2019 | |||||||||||||||
| (Dollars in thousands) | |||||||||||||||||
| Homebuilding | |||||||||||||||||
| West | $ | $ | $ | ||||||||||||||
| Mountain | |||||||||||||||||
| East | |||||||||||||||||
| Corporate | ( | ( | ( | ||||||||||||||
| Total homebuilding pretax income | $ | $ | $ | ||||||||||||||
| Financial Services | |||||||||||||||||
| Mortgage operations | $ | $ | $ | ||||||||||||||
| Other | |||||||||||||||||
| Total financial services pretax income | $ | $ | $ | ||||||||||||||
| Total pretax income | $ | $ | $ | ||||||||||||||
F - 16
| December 31, | |||||||||||
| 2021 | 2020 | ||||||||||
| (Dollars in thousands) | |||||||||||
| Homebuilding Assets | |||||||||||
| West | $ | $ | |||||||||
| Mountain | |||||||||||
| East | |||||||||||
| Corporate | |||||||||||
| Total homebuilding assets | $ | $ | |||||||||
| Financial Services | |||||||||||
| Mortgage operations | $ | $ | |||||||||
| Other | |||||||||||
| Total financial services assets | $ | $ | |||||||||
| Total assets | $ | $ | |||||||||
F - 17
5. Earnings Per Share
On January 28, 2019, MDC’s board of directors approved an 8 % stock dividend that was distributed on February 28, 2019 to shareholders of record on February 14, 2019. On January 25, 2021, the Company declared an 8 % stock dividend that was distributed on March 17, 2021 to shareholders of record on March 3, 2021. In accordance with ASC 260, basic and diluted earnings per share amounts, weighted-average shares outstanding, and dividends declared per share have been restated for all appropriate periods presented to reflect the effect of these stock dividends. The following table shows our basic and diluted EPS calculations:
| Year Ended December 31, | |||||||||||||||||
| 2021 | 2020 | 2019 | |||||||||||||||
| (Dollars in thousands, except per share amounts) | |||||||||||||||||
| Numerator | |||||||||||||||||
| Net income | $ | $ | $ | ||||||||||||||
| Less: distributed earnings allocated to participating securities | ( | ( | ( | ||||||||||||||
| Less: undistributed earnings allocated to participating securities | ( | ( | ( | ||||||||||||||
| Net income attributable to common stockholders (numerator for basic earnings per share) | |||||||||||||||||
| Add back: undistributed earnings allocated to participating securities | |||||||||||||||||
| Less: undistributed earnings reallocated to participating securities | ( | ( | ( | ||||||||||||||
| Numerator for diluted earnings per share under two class method | $ | $ | $ | ||||||||||||||
| Denominator | |||||||||||||||||
| Weighted-average common shares outstanding | |||||||||||||||||
| Add: dilutive effect of stock options | |||||||||||||||||
| Add: dilutive effect of contingently issuable equity awards | |||||||||||||||||
| Denominator for diluted earnings per share under two class method | |||||||||||||||||
| Basic Earnings Per Common Share | $ | $ | $ | ||||||||||||||
| Diluted Earnings Per Common Share | $ | $ | $ | ||||||||||||||
Diluted EPS for the years ended December 31, 2021, 2020 and 2019 excluded options to purchase approximately 15,000 , 400,000 , 400,000 shares, respectively, of common stock because the effect of their inclusion would be anti-dilutive.
6. Fair Value Measurements
ASC Topic 820, Fair Value Measurements (“ASC 820”), defines fair value, establishes guidelines for measuring fair value and requires disclosures regarding fair value measurements. ASC 820 establishes a three-tier fair value hierarchy, which prioritizes the inputs used in measuring fair value. These tiers include: Level 1, defined as observable inputs such as quoted prices in active markets; Level 2, defined as inputs, other than quoted prices in active markets, that are either directly or indirectly observable; and Level 3, defined as unobservable inputs for which little or no market data exists, therefore requiring an entity to develop its own assumptions.
Fair Value | ||||||||||||||||||||
Financial Instrument | Hierarchy | December 31, 2021 | December 31, 2020 | |||||||||||||||||
(Dollars in thousands) | ||||||||||||||||||||
Mortgage loans held-for-sale, net | Level 2 | $ | $ | |||||||||||||||||
F - 18
The following methods and assumptions were used to estimate the fair value of each class of financial instruments as of December 31, 2021 and 2020.
Cash and cash equivalents (excluding debt securities with an original maturity of three months or less), restricted cash, trade and other receivables, prepaids and other assets, accounts payable, accrued and other liabilities and borrowings on our revolving credit facility. Fair value approximates carrying value.
Equity securities. Our equity securities consisted of holdings in common stock stock and exchange traded funds and were recorded at fair value as with all changes in fair value recorded to other income (expense), net in the financial services section of our consolidated statements of operations and comprehensive income. We did not have any investments in equity securities at December 31, 2021 and 2020.
| Year Ended December 31, | |||||||||||
| 2021 | 2020 | ||||||||||
(Dollars in thousands) | |||||||||||
Net gain (loss) recognized during the period on equity securities | $ | $ | ( | ||||||||
Less: Net gain (loss) recognized during the period on equity securities sold during the period | ( | ||||||||||
Unrealized gain (loss) recognized during the reporting period on equity securities still held at the reporting date | $ | $ | |||||||||
Mortgage Loans Held-for-Sale, Net. Our mortgage loans held-for-sale, which are measured at fair value on a recurring basis include (1) mortgage loans held-for-sale that are under commitments to sell and (2) mortgage loans held-for-sale that were not under commitments to sell. At December 31, 2021 and 2020, we had $157.7 million and $137.3 million, respectively, in fair value of mortgage loans held-for-sale that were under commitments to sell. The fair value for those loans was based on quoted market prices for those mortgage loans, which are Level 2 fair value inputs. At December 31, 2021 and 2020, we had $124.9 million and $95.3 million, respectively, in fair value of mortgage loans held-for-sale that were not under commitments to sell. The fair value for those loans was primarily based upon the estimated market price received from an outside party, which is a Level 2 fair value input. The unpaid principal balances of all mortgage loans held for sale at December 31, 2021 and 2020 were $276.9 million and $222.3 million, respectively.
Mortgage Repurchase Facility. The debt associated with our Mortgage Repurchase Facility (see Note 16, Lines of Credit and Total Debt Obligations, for further discussion) is at floating rates that approximate current market rates and have relatively short-term maturities, generally within 30 days. The fair value approximates carrying value and is based on Level 2 inputs.
Senior Notes. The estimated values of the senior notes in the following table are based on Level 2 inputs, which primarily reflect estimated prices for our senior notes which were provided by multiple sources.
| December 31, 2021 | December 31, 2020 | ||||||||||||||||||||||
| Carrying Amount | Fair Value | Carrying Amount | Fair Value | ||||||||||||||||||||
| (Dollars in thousands) | |||||||||||||||||||||||
$ | $ | $ | $ | $ | |||||||||||||||||||
$ | |||||||||||||||||||||||
$ | |||||||||||||||||||||||
$ | |||||||||||||||||||||||
$ | |||||||||||||||||||||||
| Total | $ | $ | $ | $ | |||||||||||||||||||
On September 17, 2021, we accelerated the retirement of $123.6 million of our 5.500 % senior notes scheduled to mature in January 2024 through a cash tender offer. We accelerated the retirement of the remaining $126.4 million of our 5.500 % senior notes on December 23, 2021, pursuant to their optional redemption provisions. These retirements resulted in a loss on retirement of debt of $23.6 million during the year ended December 31, 2021.
F - 19
7. Inventories
| December 31, 2021 | December 31, 2020 | ||||||||||
(Dollars in thousands) | |||||||||||
Housing Completed or Under Construction: | |||||||||||
West | $ | $ | |||||||||
Mountain | |||||||||||
East | |||||||||||
Subtotal | |||||||||||
Land and Land Under Development: | |||||||||||
West | |||||||||||
Mountain | |||||||||||
East | |||||||||||
Subtotal | |||||||||||
Total Inventories | $ | $ | |||||||||
| Year Ended December 31, | |||||||||||||||||
| 2021 | 2020 | 2019 | |||||||||||||||
(Dollars in thousands) | |||||||||||||||||
Housing Completed or Under Construction: | |||||||||||||||||
West | $ | $ | $ | ||||||||||||||
Mountain | |||||||||||||||||
East | |||||||||||||||||
Subtotal | |||||||||||||||||
Land and Land Under Development: | |||||||||||||||||
West | |||||||||||||||||
Mountain | |||||||||||||||||
East | |||||||||||||||||
Subtotal | |||||||||||||||||
Total Inventory Impairments | $ | $ | $ | ||||||||||||||
Impairment Data | Quantitative Data | |||||||||||||||||||||||||||||||||||||
Three Months Ended | Number of Subdivisions Impaired | Inventory Impairments | Fair Value of Inventory After Impairments | Discount Rate | ||||||||||||||||||||||||||||||||||
(Dollars in thousands) | ||||||||||||||||||||||||||||||||||||||
| December 31, 2021 | $ | $ | N/A | |||||||||||||||||||||||||||||||||||
| Total | $ | |||||||||||||||||||||||||||||||||||||
| March 31, 2019 | $ | $ | N/A | |||||||||||||||||||||||||||||||||||
| December 31, 2019 | N/A | |||||||||||||||||||||||||||||||||||||
Total | $ | |||||||||||||||||||||||||||||||||||||
F - 20
8. Capitalization of Interest
| Year Ended December 31, | |||||||||||||||||
| 2021 | 2020 | 2019 | |||||||||||||||
| (Dollars in thousands) | |||||||||||||||||
| Homebuilding interest incurred | $ | $ | $ | ||||||||||||||
| Less: Interest capitalized | ( | ( | ( | ||||||||||||||
| Homebuilding interest expensed | $ | $ | $ | ||||||||||||||
| Interest capitalized, beginning of period | $ | $ | $ | ||||||||||||||
| Plus: Interest capitalized during period | |||||||||||||||||
| Less: Previously capitalized interest included in home and land cost of sales | ( | ( | ( | ||||||||||||||
| Interest capitalized, end of period | $ | $ | $ | ||||||||||||||
9. Homebuilding Prepaids and Other Assets
| December 31, | |||||||||||
| 2021 | 2020 | ||||||||||
(Dollars in thousands) | |||||||||||
| Operating lease right-of-use asset (Note 2 and Note 10) | $ | $ | |||||||||
Land option deposits | |||||||||||
| Prepaids | |||||||||||
Goodwill | |||||||||||
Deferred debt issuance costs on revolving credit facility, net | |||||||||||
Other | |||||||||||
Total | $ | $ | |||||||||
10. Leases
We lease certain property, land and equipment, the majority of which comprise property related leases to provide office space where we operate our business. Leases with an initial term of 12 months or less are not recorded on the balance sheet. We recognize lease expense for these leases on a straight-line basis over the lease term.
Our property related leases typically have terms of between and five years , with the exception of the lease governing the Company’s headquarters. All of our property leases are classified as operating leases. These leases do not contain any residual value guarantees or restrictive covenants and do not include variable lease payments, except for the payment of common area maintenance and real estate taxes. Many of our property related leases give us the option to extend the lease term for a period of time, generally consistent with the initial lease term. These options are excluded from our calculation of the right-of-use asset and lease liability until such time as we determine it is reasonably certain that the option will be exercised.
The property related lease for the Company’s headquarters in Denver, Colorado is ten years in length with an expiration date of October 31, 2026 and contains a ten year option to extend the term of the lease through 2036. This option has been excluded from our calculation of the right-of-use asset and lease liability as it is not currently considered reasonably certain that the option will be exercised.
F - 21
Operating lease expense is included as a component of selling, general and administrative expenses and expenses in the homebuilding and financial services sections of our consolidated statements of operations and comprehensive income, respectively.
Components of operating lease expense were as follows:
| Year Ended December 31, | |||||||||||||||||
| 2021 | 2020 | 2019 | |||||||||||||||
| (Dollars in thousands) | |||||||||||||||||
Operating lease cost 1 | $ | $ | $ | ||||||||||||||
| Sublease income (Note 15) | ( | ( | ( | ||||||||||||||
| Net lease cost | $ | $ | $ | ||||||||||||||
1 Includes variable lease costs, which are immaterial.
| Year Ended December 31, | |||||||||||||||||
| 2021 | 2020 | 2019 | |||||||||||||||
(Dollars in thousands) | |||||||||||||||||
Cash paid for amounts included in the measurement of lease liabilities: | |||||||||||||||||
Operating cash flows from operating leases | $ | $ | $ | ||||||||||||||
Leased assets obtained in exchange for new operating lease liabilities | $ | $ | $ | ||||||||||||||
Supplemental cash flow information related to non-cash transactions also includes the recognition of operating lease right-of-use assets of $33.5 million and operating lease liabilities of $34.3 million upon adoption of ASC 842 during the year ended December 31, 2019.
| December 31, 2021 | December 31, 2020 | |||||||
Weighted-average remaining lease term (years) | ||||||||
Weighted-average discount rate | ||||||||
Maturities of operating lease liabilities were as follows:
| Year Ended December 31, | |||||
| (Dollars in thoursands) | |||||
| 2022 | $ | ||||
| 2023 | |||||
| 2024 | |||||
| 2025 | |||||
| 2026 | |||||
Thereafter | |||||
Total operating lease payments 1 | $ | ||||
Less: Interest | ( | ||||
Present value of operating lease liabilities 2 | $ | ||||
____________________________
1 Operating lease payments exclude $4.5 million of legally binding lease payments for leases signed but not yet commenced.
2 Homebuilding and financial services operating lease liabilities of $26.4 million and $0.3 million, respectively, are included as a component of accrued and other liabilities and accounts payable and accrued liabilities, respectively, in the homebuilding and financial services section of our consolidated balance sheets at December 31, 2021.
F - 22
11. Homebuilding Accrued and Other Liabilities and Financial Services Accounts Payable and Accrued Liabilities
| December 31, | |||||||||||
| 2021 | 2020 | ||||||||||
(Dollars in thousands) | |||||||||||
Accrued compensation and related expenses | $ | $ | |||||||||
Customer and escrow deposits | |||||||||||
Warranty accrual | |||||||||||
| Lease liability (Note 2 and Note 10) | |||||||||||
Accrued interest | |||||||||||
Construction defect claim reserves | |||||||||||
Land development and home construction accruals | |||||||||||
Other accrued liabilities | |||||||||||
Total accrued and other liabilities | $ | $ | |||||||||
| December 31, | |||||||||||
| 2021 | 2020 | ||||||||||
(Dollars in thousands) | |||||||||||
Insurance reserves | $ | $ | |||||||||
Accounts payable and other accrued liabilities | |||||||||||
Total accounts payable and accrued liabilities | $ | $ | |||||||||
12. Warranty Accrual
| Year Ended December 31, | |||||||||||||||||
| 2021 | 2020 | 2019 | |||||||||||||||
| (Dollars in thousands) | |||||||||||||||||
| Balance at beginning of period | $ | $ | $ | ||||||||||||||
| Expense provisions | |||||||||||||||||
| Cash payments | ( | ( | ( | ||||||||||||||
| Adjustments | ( | ( | |||||||||||||||
| Balance at end of period | $ | $ | $ | ||||||||||||||
F - 23
13. Insurance and Construction Defect Claim Reserves
The following table summarizes our insurance and defect claim reserves activity for the years ended December 31, 2021, 2020 and 2019. These reserves are included as a component of accounts payable and accrued liabilities and accrued and other liabilities in either the financial services or homebuilding sections of the consolidated balance sheets, respectively.
| December 31, | |||||||||||||||||
| 2021 | 2020 | 2019 | |||||||||||||||
| (Dollars in thousands) | |||||||||||||||||
| Balance at beginning of period | $ | $ | $ | ||||||||||||||
| Expense provisions | |||||||||||||||||
| Cash payments, net of recoveries | ( | ( | ( | ||||||||||||||
| Adjustments | |||||||||||||||||
| Balance at end of period | $ | $ | $ | ||||||||||||||
We recorded a $1.0 million adjustment to increase our insurance and construction defect claim reserves in 2019 due to greater than expected expenditures by our homebuilding subsidiaries. No
In the ordinary course of business, we make payments from our insurance and construction defect claim reserves to settle litigation claims arising primarily from our homebuilding activities. These payments are irregular in both their timing and their magnitude. As a result, the cash payments, net of recoveries shown for the years ended December 31, 2021, 2020 and 2019, are not necessarily indicative of what future cash payments will be for subsequent periods.
F - 24
14. Income Taxes
| Year Ended December 31, | |||||||||||||||||
| 2021 | 2020 | 2019 | |||||||||||||||
| (Dollars in thousands) | |||||||||||||||||
| Current tax provision: | |||||||||||||||||
| Federal | $ | $ | $ | ||||||||||||||
| State | |||||||||||||||||
| Total current | |||||||||||||||||
| Deferred tax provision: | |||||||||||||||||
| Federal | ( | ||||||||||||||||
| State | |||||||||||||||||
| Total deferred | ( | ||||||||||||||||
| Provision for income taxes | $ | $ | $ | ||||||||||||||
| Year Ended December 31, | |||||||||||||||||
| 2021 | 2020 | 2019 | |||||||||||||||
| (Dollars in thousands) | |||||||||||||||||
| Tax expense computed at federal statutory rate | $ | $ | $ | ||||||||||||||
| State income tax expense, net of federal benefit | |||||||||||||||||
| Limitation on executive compensation | |||||||||||||||||
| Tax expense (benefit) related to an increase (decrease) in unrecognized tax benefits | ( | ( | |||||||||||||||
| Stock based compensation (windfall)/shortfall | ( | ( | ( | ||||||||||||||
| Federal energy credits | ( | ( | ( | ||||||||||||||
| Rate changes | ( | ||||||||||||||||
| Change in valuation allowance | ( | ( | |||||||||||||||
| Other | |||||||||||||||||
| Provision for income taxes | $ | $ | $ | ||||||||||||||
| Effective tax rate | % | % | % | ||||||||||||||
F - 25
Deferred income taxes reflect the net tax effects of temporary differences between the carrying amounts of the assets and liabilities for financial reporting purposes and the amounts used for income tax purposes. The tax effects of significant temporary differences that give rise to the net deferred tax asset are as follows:
| December 31, | |||||||||||
| 2021 | 2020 | ||||||||||
| (Dollars in thousands) | |||||||||||
| Deferred tax assets: | |||||||||||
| State net operating loss carryforwards | $ | $ | |||||||||
| Stock-based compensation expense | |||||||||||
| Warranty, litigation and other reserves | |||||||||||
| Accrued compensation | |||||||||||
| Asset impairment charges | |||||||||||
| Inventory, additional net costs capitalized for tax purposes | |||||||||||
| Other, net | |||||||||||
| Total deferred tax assets | |||||||||||
| Valuation allowance | ( | ( | |||||||||
| Total deferred tax assets, net of valuation allowance | |||||||||||
| Deferred tax liabilities: | |||||||||||
| Property, equipment and other assets | |||||||||||
| Deferral of profit on home sales | |||||||||||
| Other, net | |||||||||||
| Total deferred tax liabilities | |||||||||||
| Net deferred tax asset | $ | $ | |||||||||
At December 31, 2021, we had no federal net operating loss or alternative minimum tax carryforwards. However, we had $3.4 million in tax-effected state net operating loss carryforwards. The state operating loss carryforwards, if unused, begin expiring in 2024.
At December 31, 2021, we had a valuation allowance of $3.3 million, a decrease of $1.1 million from the prior year. The valuation allowance is related to various state net operating loss carryforwards where realization is uncertain at this time due to the limited carryforward periods coupled with minimal activity that exists in certain states.
At December 31, 2021 and 2020, our total liability for uncertain tax positions including interest and penalties was $0.4 million and $9.3 million, respectively. The following table summarizes activity for the gross unrecognized tax benefit component of our total liability for uncertain tax positions for the years ended December 31, 2021, 2020 and 2019:
| Year Ended December 31, | |||||||||||||||||
| 2021 | 2020 | 2019 | |||||||||||||||
| (Dollars in thousands) | |||||||||||||||||
| Gross unrecognized tax benefits at beginning of year | $ | $ | $ | ||||||||||||||
| Increases related to prior year tax positions | |||||||||||||||||
| Decreases related to prior year tax positions | |||||||||||||||||
| Lapse of applicable statute of limitations | ( | ( | ( | ||||||||||||||
| Gross unrecognized tax benefits at end of year | $ | $ | $ | ||||||||||||||
During the year ended December 31, 2021, we experienced a reduction in the uncertain tax positions due to the lapse of the statute of limitations of $8.3 million, of which approximately $3.2 million reduced our effective tax rate. Interest and penalties associated with the statute of limitations lapse were approximately $0.9 million. At December 31, 2021 and 2020, there was $0.4 million and $3.5 million, respectively, of unrecognized tax benefits that if recognized, would reduce our effective tax rate.
F - 26
The interest and penalties, net of federal benefit for the years ended December 31, 2021, 2020 and 2019 was $(0.8 ) million, $0.5 million and $(1.5 ) million, respectively, and are included in provision for income taxes in the consolidated statements of operations and comprehensive income. We are not aware of any tax positions for which it is reasonably possible that the total amounts of unrecognized tax benefits will change materially in the next twelve months.
The Company and its subsidiaries file income tax returns in the U.S. federal jurisdiction and various state jurisdictions. We are subject to U.S. federal income tax examination for calendar tax years ending 2018 through 2021. Additionally, we are subject to various state income tax examinations for the 2017 through 2021 calendar tax years.
15. Related Party Transactions
16. Lines of Credit and Total Debt Obligations
Revolving Credit Facility. We have an unsecured revolving credit agreement (“Revolving Credit Facility”) with a group of lenders, which may be used for general corporate purposes. This agreement was amended on December 28, 2020 to (1) increase the aggregate commitment from $1.0 billion to $1.2 billion (the “Commitment”), (2) extend the Revolving Credit Facility maturity of $1.125 billion of the Commitments to December 18, 2025 with the remaining Commitment continuing to terminate on December 18, 2023 and (3) provide that the aggregate amount of the commitments may increase to an amount not to exceed $1.7 billion upon our request, subject to receipt of additional commitments from existing or additional lenders and, in the case of additional lenders, the consent of the co-administrative agents. As defined in the Revolving Credit Facility, interest rates on base rate borrowings are equal to the highest of (1) 0.0 %, (2) a prime rate, (3) a federal funds effective rate plus 1.50 %, and (4) a specified eurocurrency rate plus 1.00 % and, in each case, plus a margin that is determined based on our credit ratings and leverage ratio. Interest rates on eurocurrency borrowings are equal to a specified eurocurrency rate plus a margin that is determined based on our credit ratings and leverage ratio. At any time at which our leverage ratio, as of the last day of the most recent calendar quarter, exceeds 55 %, the aggregate principal amount of all consolidated senior debt borrowings outstanding may not exceed the borrowing base. There is no borrowing base requirement if our leverage ratio, as of the last day of the most recent calendar quarter, is 55 % or less.
The Revolving Credit Facility provides for a transition from the eurocurrency rate to a benchmark replacement upon the occurrence of certain events.
The Revolving Credit Facility is fully and unconditionally guaranteed, jointly and severally, by most of our homebuilding segment subsidiaries. The facility contains various representations, warranties and covenants that we believe are customary for agreements of this type. The financial covenants include a consolidated tangible net worth test and a leverage test, along with a consolidated tangible net worth covenant, all as defined in the Revolving Credit Facility. A failure to satisfy the foregoing tests does not constitute an event of default, but can trigger a “term-out” of the facility. A breach of the consolidated tangible net worth covenant (but not the consolidated tangible net worth test) or a violation of anti-corruption or sanctions laws would result in an event of default.
The Revolving Credit Facility is subject to acceleration upon certain specified events of default, including breach of the consolidated tangible net worth covenant, a violation of anti-corruption or sanctions laws, failure to make timely payments, breaches of certain representations or covenants, failure to pay other material indebtedness, or another person becoming beneficial owner of 50 % or more of our outstanding common stock. We believe we were in compliance with the representations, warranties and covenants included in the Revolving Credit Facility as of December 31, 2021.
We incur costs associated with unused commitment fees pursuant to the terms of the Revolving Credit Facility. At December 31, 2021 and 2020, there were $40.1 million and $25.1 million, respectively, in letters of credit outstanding, which reduced the amounts available to be borrowed under the Revolving Credit Facility. We had $10.0 million and $10.0 million outstanding under the Revolving Credit Facility as of December 31, 2021 and 2020, respectively. As of December 31, 2021, availability under the Revolving Credit Facility was approximately $1.15 billion.
F - 27
Mortgage Repurchase Facility. HomeAmerican has a Master Repurchase Agreement (the “Mortgage Repurchase Facility”) with U.S. Bank National Association (“USBNA”). The Mortgage Repurchase Facility provides liquidity to HomeAmerican by providing for the sale of up to an aggregate of $75 million (subject to increase by up to $75 million under certain conditions) of eligible mortgage loans to USBNA with an agreement by HomeAmerican to repurchase the mortgage loans at a future date. Until such mortgage loans are transferred back to HomeAmerican, the documents relating to such loans are held by USBNA, as custodian, pursuant to the Custody Agreement (“Custody Agreement”), dated as of November 12, 2008, by and between HomeAmerican and USBNA. In the event that an eligible mortgage loan becomes ineligible, as defined under the Mortgage Repurchase Facility, HomeAmerican may be required to repurchase the ineligible mortgage loan immediately. The Mortgage Repurchase Facility was amended on September 24, 2020, March 25, 2021, May 20, 2021, and December 21, 2021 to adjust the commitments to purchase for specific time periods. As part of the amendments, the commitments to purchase (subject to increase by up to $75 million under certain conditions) were increased as follows: (1) $200 million for the periods December 22, 2020 through February 4, 2021, (2) $175 million for the periods March 25, 2021 through April 22, 2021, June 23, 2021 through July 22, 2021, September 22, 2021 through October 21, 2021, and March 23, 2022 through April 21, 2022 and (3) $400 million for the period December 21, 2021 through February 15, 2022. The Mortgage Repurchase Facility terminates on May 19, 2022.
There was no increase to the maximum aggregate commitment of the Mortgage Repurchase Facility as of December 31, 2021. The maximum aggregate commitment of the Mortgage Repurchase Facility was temporarily increased by $50 million on December 28, 2020 effective through January 27, 2021. At December 31, 2021 and 2020, HomeAmerican had $256.3 million and $202.4 million, respectively, of mortgage loans that HomeAmerican was obligated to repurchase under the Mortgage Repurchase Facility. Mortgage loans that HomeAmerican is obligated to repurchase under the Mortgage Repurchase Facility are accounted for as a debt financing arrangement and are reported as mortgage repurchase facility in the consolidated balance sheets. The December 21, 2021 amendment also provides for a transition from a pricing rate based on the London Interbank Offered Rate (LIBOR) to one based on the Secured Overnight Financing Rate (SOFR).
Senior Notes. Our senior notes are not secured and, while the senior note indentures contain some restrictions on secured debt and other transactions, they do not contain financial covenants. Our senior notes are fully and unconditionally guaranteed on an unsecured basis, jointly and severally, by most of our homebuilding segment subsidiaries. We believe that we are in compliance with the representations, warranties and covenants in the senior note indentures.
| December 31, | |||||||||||
| 2021 | 2020 | ||||||||||
| (Dollars in thousands) | |||||||||||
$ | $ | $ | |||||||||
$ | |||||||||||
$ | |||||||||||
$ | |||||||||||
$ | |||||||||||
| Total | $ | $ | |||||||||
In January 2021, we completed an offering of $350 million of 2.500 % senior notes due January 2031 at 100 % of par. In August 2021, the Company issued $350 million of 3.966 % senior notes due August 2061 at 100 % of par. We used the net proceeds for general corporate purposes, which included the retirement of our 5.500 % senior notes discussed further below, which were scheduled to mature in January 2024.
In September 2021, we accelerated the retirement of $123.6 million of our 5.500 % senior notes scheduled to mature in January 2024 through a cash tender offer. The retirement resulted in a loss of $12.2 million, which included the write-off of debt issuance costs and transaction fees. In December 2021, we accelerated the retirement of the remaining $126.4 million of our 5.500 % senior notes pursuant to their optional redemption provisions. The retirement resulted in a loss of $11.4 million, which included the write-off of debt issuance costs and transaction fees.
F - 28
17. Commitments and Contingencies
Surety Bonds and Letters of Credit. We are required to obtain surety bonds and letters of credit in support of our obligations for land development and subdivision improvements, homeowner association dues, warranty work, contractor license fees and earnest money deposits. At December 31, 2021, we had outstanding surety bonds and letters of credit totaling $371.3 million and $215.5 million, respectively, including $175.4 millions in letters of credit issued by HomeAmerican. The estimated cost to complete obligations related to these bonds and letters of credit were approximately $201.7 million and $161.6 million, respectively. All letters of credit as of December 31, 2021, excluding those issued by HomeAmerican, were issued under our unsecured Revolving Credit Facility (see Note 16, Lines of Credit and Total Debt Obligations, for further discussion of the Revolving Credit Facility). We expect that the obligations secured by these performance bonds and letters of credit generally will be performed in the ordinary course of business and in accordance with the applicable contractual terms. To the extent that the obligations are performed, the related performance bonds and letters of credit should be released and we should not have any continuing obligations. However, in the event any such performance bonds or letters of credit are called, our indemnity obligations could require us to reimburse the issuer of the performance bond or letter of credit.
We have made no material guarantees with respect to third-party obligations.
Litigation Reserves. Because of the nature of the homebuilding business, we have been named as defendants in various claims, complaints and other legal actions arising in the ordinary course of business, including product liability claims and claims associated with the sale and financing of homes. In the opinion of management, the outcome of these ordinary course matters will not have a material adverse effect upon our financial condition, results of operations or cash flows. At both December 31, 2021 and 2020, we had $1.6
Loan Origination Liabilities. HomeAmerican sold to financial institutions certain loans originated prior to 2009 that were subsequently included by such financial institutions in residential mortgage-backed securities offerings or other securitizations issued by those financial institutions. In connection with such sales, we were put on notice by one institution of a claim for indemnification or breach of contract relating to certain loans that were included in securitizations. The claim related to alleged misrepresentations by borrowers on certain residential mortgage loans originated by HomeAmerican and/or alleged lack of conformity of certain loans to applicable underwriting guidelines promulgated by the financial institution. This matter was settled as of December 31, 2019 and did not have a material impact on our results of operations, financial position, or cash flows.
Lot Option Contracts. In the ordinary course of business, we enter into lot option purchase contracts (“Option Contracts”), generally through a deposit of cash or a letter of credit, for the right to purchase land or lots at a future point in time with predetermined terms. The use of such land option and other contracts generally allow us to reduce the risks associated with direct land ownership and development, reduces our capital and financial commitments, and minimizes the amount of land inventories on our consolidated balance sheets. In certain cases, these contracts will be settled shortly following the end of the period. Our obligation with respect to Option Contracts is generally limited to forfeiture of the related deposits. At December 31, 2021, we had cash deposits and letters of credit totaling $38.1 million and $17.3 million, respectively, at risk associated with options to purchase 11,148 lots.
Coronavirus/COVID-19 Pandemic. In response to the pandemic, many state and local governments instituted restrictions that substantially limited the operations of non-essential businesses and the activities of individuals. While some of these restrictions have been eased, there is still significant uncertainty around the extent and duration of those still in place and the possibility for restrictions to be increased again in the future. We continue to construct, market and sell homes in all markets in which we operate, but increased restrictions could have a negative impact on traffic at our sales centers and model homes, cancellation rates and our ability to physically construct homes. While the extent to which the pandemic will impact our financial results in the coming periods depends on future developments, including whether there are additional outbreaks of COVID-19 and the actions taken to contain or address the virus, the pandemic and its associated impact on the U.S. economy and consumer confidence could have a material impact to the Company’s future results of operations, financial condition and cash flows.
F - 29
18. Concentration of Third-Party Mortgage Purchasers
| Year Ended December 31, | |||||||||||||||||
| 2021 | 2020 | 2019 | |||||||||||||||
| PennyMac Loan Services, LLC | % | % | % | ||||||||||||||
| Fannie Mae | % | % | % | ||||||||||||||
| Chase Manhattan Mortgage | % | % | % | ||||||||||||||
| Ginnie Mae | % | % | % | ||||||||||||||
| Wells Fargo Funding, Inc. | % | % | % | ||||||||||||||
19. Stockholders' Equity
Cash Dividends. In each of the years ended December 31, 2021, 2020 and 2019, we paid dividends of $1.67 per share, $1.29 per share and $1.09 per share, respectively
Stock Dividends. On January 28, 2019, MDC’s board of directors approved an 8 % stock dividend that was distributed on February 28, 2019 to shareholders of record on February 14, 2019. On January 25, 2021, the Company declared an 8 % stock dividend that was distributed on March 17, 2021 to shareholders of record on March 3, 2021.
Common Stock Repurchase Program. At December 31, 2021, we were authorized to repurchase up to 4,000,000 shares of our common stock. We did no no t hold any treasury stock at December 31, 2021.
20. Equity Incentive and Employee Benefit Plans
A summary of our equity incentive plans, restated as applicable for stock dividends, follows.
Employee Equity Incentive Plans. On April 27, 2011, our shareholders approved the M.D.C Holdings, Inc. 2011 Equity Incentive Plan (the “2011 Equity Incentive Plan”) which provided for the grant of non-qualified stock options, incentive stock options, stock appreciation rights, restricted stock, restricted stock units and other equity awards to employees of the Company. Stock options granted under the 2011 Equity Incentive Plan had an exercise price that is at least equal to the fair market value of our common stock on the date the stock option is granted, generally vested in periods up to five years and expired ten years after the date of grant. On April 27, 2021, the 2011 Equity Incentive Plan terminated and awards outstanding at the time the plan terminated remain outstanding in accordance with the terms and conditions of the plan and award agreement. There are 5.6 million remaining shares of MDC common stock reserved for issuance under the 2011 Equity Incentive Plan as of December 31, 2021.
On April 26, 2021, our shareholders approved the M.D.C Holdings, Inc. 2021 Equity Incentive Plan (the "2021 Equity Incentive Plan") which provides for the grant of non-qualified stock options, incentive stock options, stock appreciation rights, restricted stock, restricted stock units and other stock-based and cash awards to employees of the Company. Stock options granted under the 2021 Equity Incentive Plan have an exercise price that is at least equal to the fair market value of our common stock on the date the stock option is granted, generally vest in periods up to five years and expire ten years after the date of grant. At December 31, 2021, a total of 3.0 million shares of MDC common stock were reserved for issuance under the 2021 Equity Incentive Plan, of which 2.2 million shares remained available for grant under this plan as of December 31, 2021.
Director Equity Incentive Plans. Effective April 27, 2011, our shareholders approved the M.D.C. Holdings, Inc. 2011 Stock Option Plan for Non-Employee Directors (the “2011 Director Stock Option Plan”), which provided for the grant of non-qualified stock options to non-employee directors of the Company. Effective March 29, 2016, our shareholders approved an amendment to the 2011 Director Stock Option Plan to provide the non-employee directors with an alternative to elect to receive an award of restricted stock in lieu of a stock option. Pursuant to the 2011 Director Stock Option Plan as amended, on August 1 of each year, each non-employee director is granted either (1) an option to purchase 25,000 shares of MDC common stock or (2) shares of restricted stock having an expense to the Company that is equivalent to the stock option. Effective April 20, 2020, our shareholders approved an amendment and restatement of the 2011 Director Stock Option Plan to (1) rename the 2011
F - 30
Director Stock Option Plan as the M.D.C. Holdings, Inc. 2020 Equity Plan for Non-Employee Directors (such amended and restated 2011 Director Plan, the "2020 Director Equity Plan"), (2) increase the number of shares covered by the annual grant of each stock option (without increasing the total number of shares authorized under the plan) to reflect, on a going forward basis, the stock dividends declared by the Company, (3) provide that the number of shares covered by the annual grant shall be proportionally increased or decreased in the future for any increase or decrease in the number of shares of stock outstanding on account of any recapitalization, split, reverse split, combination, exchange, dividend or other distribution payable in shares of stock, and (4) extend the 2020 Director Equity Plan's termination date to April 20, 2030. Each option granted under the 2020 Director Equity Plan vests immediately, becomes exercisable six months after grant, and expires ten years from the date of grant. The option exercise price must be equal to the fair market value (as defined in the plan) of our common stock on the date of grant of the option. Each restricted stock award granted under the 2020 Equity Plan vests seven months after the grant date. At December 31, 2021, a total of 0.6 million shares of MDC common stock were reserved for issuance under the 2020 Director Equity Plan and 0.4 million shares remained available for grant under this plan as of December 31, 2021.
Employee Benefit Plan. We have a defined contribution plan pursuant to Section 401(k) of the Internal Revenue Code where each employee may elect to make contributions up to the current tax limits. Effective for 2018 and thereafter, we match employee contributions at a rate of 50 % of the first 6 % of compensation and, as of December 31, 2021, we had accrued $3.6 million related to the match that is to be contributed in the first quarter of 2022 for 2021 activity. At December 31, 2020, we had accrued $3.0 million related to the match that was contributed in the first quarter of 2021 for 2020 activity. At December 31, 2019, we had accrued $2.6 million related to the match that was contributed during the first quarter of 2020 for 2019 activity.
21. Stock Based Compensation
Determining Fair Value of Share-Based Option Awards. Most options that we grant contain only a service condition (“Service-Based” option) and therefore vest over a specified number of years as long as the employee is employed by the Company. For Service-Based options, we use the Black-Scholes option pricing model to determine the grant date fair value.
| Year Ended December 31, | |||||||||||||||||
| 2021 | 2020 | 2019 | |||||||||||||||
| Expected lives of options (years) | |||||||||||||||||
| Expected volatility | % | % | % | ||||||||||||||
| Risk free interest rate | % | % | % | ||||||||||||||
| Dividend yield rate | % | % | % | ||||||||||||||
Based on calculations using the Black-Scholes option pricing model, the weighted-average grant date fair values of stock options granted, restated as applicable for stock dividends, during 2021, 2020 and 2019 were $14.66 , $8.73 and $7.30 , respectively. The expected life of options in the table above represents the weighted-average period for which the options are expected to remain outstanding and are derived primarily from historical exercise patterns. The expected volatility is determined based on our review of the implied volatility that is derived from the price of exchange traded options of the Company. The risk-free interest rate assumption is determined based upon observed interest rates appropriate for the expected term of our employee stock options. The dividend yield assumption is based on our history of dividend payouts.
F - 31
Stock Option Award Activity. Stock option activity under our option plans, restated as applicable for stock dividends, for the years ended December 31, 2021, 2020 and 2019 were as follows.
| Year Ended December 31, | |||||||||||||||||||||||||||||||||||
| 2021 | 2020 | 2019 | |||||||||||||||||||||||||||||||||
| Number of Shares | Weighted- Average Exercise Price | Number of Shares | Weighted- Average Exercise Price | Number of Shares | Weighted- Average Exercise Price | ||||||||||||||||||||||||||||||
| Outstanding Stock Option Activity | |||||||||||||||||||||||||||||||||||
| Outstanding, beginning of year | $ | $ | $ | ||||||||||||||||||||||||||||||||
| Granted | |||||||||||||||||||||||||||||||||||
| Exercised | ( | ( | ( | ||||||||||||||||||||||||||||||||
| Forfeited | N/A | N/A | N/A | ||||||||||||||||||||||||||||||||
| Cancelled | N/A | N/A | N/A | ||||||||||||||||||||||||||||||||
| Outstanding, end of year | $ | $ | $ | ||||||||||||||||||||||||||||||||
| Year Ended December 31, | |||||||||||||||||||||||||||||||||||
| 2021 | 2020 | 2019 | |||||||||||||||||||||||||||||||||
| Number of Shares | Weighted- Average Fair Value | Number of Shares | Weighted- Average Fair Value | Number of Shares | Weighted- Average Fair Value | ||||||||||||||||||||||||||||||
| Unvested Stock Option Activity | |||||||||||||||||||||||||||||||||||
| Outstanding, beginning of year | $ | $ | $ | ||||||||||||||||||||||||||||||||
| Granted | |||||||||||||||||||||||||||||||||||
| Vested | ( | ( | ( | ||||||||||||||||||||||||||||||||
| Forfeited | — | — | N/A | ||||||||||||||||||||||||||||||||
| Unvested, end of year | $ | $ | $ | ||||||||||||||||||||||||||||||||
The total intrinsic value of options (difference between price per share as of the exercise date and the exercise price, times the number of options outstanding) exercised during the years ended December 31, 2021, 2020 and 2019 was $5.1 million, $40.2 million and $8.2 million, respectively.
| Exercisable or expected to vest | |||||
| Number outstanding | |||||
| Weighted-average exercise price | $ | ||||
| Aggregate intrinsic value (in thousands) | $ | ||||
| Weighted-average remaining contractual term (years) | |||||
| Exercisable | |||||
| Number outstanding | |||||
| Weighted-average exercise price | $ | ||||
| Aggregate intrinsic value (in thousands) | $ | ||||
| Weighted-average remaining contractual term (years) | |||||
The aggregate intrinsic values in the tables above represent the total pretax intrinsic values (the difference between the closing price of MDC’s common stock on the last trading day of fiscal 2021 and the exercise price, multiplied by the number of in-the-money stock option shares) that would have been received by the option holders had all in-the-money outstanding stock options been exercised on December 31, 2021.
F - 32
| Options Outstanding | Options Exercisable | |||||||||||||||||||||||||||||||||||||||||||||||||
| Range of Exercise Price | Number Outstanding | Weighted- Average Remaining Contractual Life (in years) | Weighted- Average Exercise Price | Number Outstanding | Weighted- Average Remaining Contractual Life (in years) | Weighted- Average Exercise Price | ||||||||||||||||||||||||||||||||||||||||||||
| $ | - | $ | $ | $ | ||||||||||||||||||||||||||||||||||||||||||||||
| $ | - | $ | ||||||||||||||||||||||||||||||||||||||||||||||||
| $ | - | $ | ||||||||||||||||||||||||||||||||||||||||||||||||
| $ | - | $ | ||||||||||||||||||||||||||||||||||||||||||||||||
| $ | - | $ | ||||||||||||||||||||||||||||||||||||||||||||||||
| Total | $ | $ | ||||||||||||||||||||||||||||||||||||||||||||||||
Total compensation expense relating to stock options was $3.0 million, $2.9 million and $1.5 million for the years ended December 31, 2021, 2020 and 2019, respectively. Our recognized tax benefit from this expense for the years ended December 31, 2021, 2020 and 2019 was $0.1 million, $0.0 million and $0.0 million , respectively.
As of December 31, 2021, $2.2 million of total unrecognized compensation cost related to stock options was expected to be recognized as an expense by the Company in the future over a weighted-average period of approximately 1.0 year.
For the years ended December 31, 2021, 2020 and 2019 the Company received cash from the exercise of stock option awards of $2.6 million, $37.9 million and $25.3 million, respectively. Our realized tax benefit from stock options exercised for the years ended December 31, 2021, 2020 and 2019 was $1.1 million, $7.2 million and $0.2 million, respectively.
Restricted Stock Award Activity. Non-vested restricted stock awards, restated as applicable for stock dividends, at December 31, 2021, 2020 and 2019 and changes during those years were as follows:
| Year Ended December 31, | |||||||||||||||||||||||||||||||||||
| 2021 | 2020 | 2019 | |||||||||||||||||||||||||||||||||
| Number of Shares | Weighted- Average Grant Date Fair Value | Number of Shares | Weighted- Average Grant Date Fair Value | Number of Shares | Weighted- Average Grant Date Fair Value | ||||||||||||||||||||||||||||||
| Unvested, beginning of year | $ | $ | $ | ||||||||||||||||||||||||||||||||
| Granted | |||||||||||||||||||||||||||||||||||
| Vested | ( | ( | ( | ||||||||||||||||||||||||||||||||
| Forfeited | ( | ( | ( | ||||||||||||||||||||||||||||||||
| Unvested, end of year | $ | $ | $ | ||||||||||||||||||||||||||||||||
Total compensation expense relating to restricted stock awards was $10.1 million, $8.2 million and $4.8 million for the years ended December 31, 2021, 2020 and 2019, respectively. Our recognized tax benefit from this expense for the years ended December 31, 2021, 2020 and 2019 was $1.4 million, $1.2 million and $0.7 million, respectively.
At December 31, 2021, there was $6.9 million of unrecognized compensation expense related to non-vested restricted stock awards that is expected to be recognized as an expense by us in the future over a weighted-average period of approximately 1.4 years. The total intrinsic value of unvested restricted stock awards (the closing price of MDC’s common stock on the last trading day of fiscal 2021 multiplied by the number of unvested awards) at December 31, 2021 was $19.4 million. The total intrinsic value of restricted stock which vested during each of the years ended December 31, 2021, 2020 and 2019 was $13.4 million, $8.6 million and $5.3 million, respectively.
F - 33
Performance Share Unit Awards. The Company has made annual grants of long term performance share unit awards (" PSUs") to each of the Executive Chairman, CEO and the Chief Financial Officer ("CFO"), as detailed in the table below. The PSUs are earned based upon the Company’s performance, over a period of three years (the “Performance Period”), measured by increasing home sale revenues over a “Base Period.” Each award is conditioned upon the Company achieving an average gross margin from home sales (excluding impairments) of at least fifteen percent (15 %) over the Performance Period. Target goals will be earned if the Company’s three year average home sale revenues over the Performance Period (“Performance Revenues”) exceed the home sale revenues over the Base Period (“Base Revenues”) by at least 10 % but less than 20 %. If Performance Revenues exceed the Base Revenues by at least 5 % but less than 10 %, 50 % of the Target Goals will be earned (“Threshold Goals”). If Performance Revenues exceed the Base Revenues by at least 20 %, 200 % of the Target Goals will be earned (“Maximum Goals”). The number of PSUs earned shall be adjusted to be proportional to the partial performance between the Threshold Goals, Target Goals and Maximum Goals. Details for each defined term above for each grant have been provided in the table below.
| Threshold Goal | Target Goal | Maximum Goal | Maximum Potential Expense to be Recognized * | Maximum Remaining Expense to be Recognized * | ||||||||||||||||||||||||||||||||||||||||||||||||||||||||||||||||||||||
| Date of Award | Performance Period | Base Period | Base Period Revenues | PSUs | Home Sale Revenues | PSUs | Home Sale Revenues | PSUs | Home Sale Revenues | Fair Value per Share | ||||||||||||||||||||||||||||||||||||||||||||||||||||||||||||||||
| May 23, 2018 | April 1, 2018 - March 31, 2021 | April 1, 2017 - March 31, 2018 | $ | $ | $ | $ | $ | $ | $ | |||||||||||||||||||||||||||||||||||||||||||||||||||||||||||||||||
| Aug 5, 2019 | January 1, 2019 - December 31, 2021 | January 1, 2018 - December 31, 2018 | $ | $ | $ | $ | $ | $ | $ | |||||||||||||||||||||||||||||||||||||||||||||||||||||||||||||||||
| Aug 20, 2020 | January 1, 2020 - December 31, 2022 | January 1, 2019 - December 31, 2019 | $ | $ | $ | $ | $ | $ | $ | |||||||||||||||||||||||||||||||||||||||||||||||||||||||||||||||||
| Jul 14, 2021 | January 1, 2021 - December 31, 2023 | January 1, 2020 - December 31, 2020 | $ | $ | $ | $ | $ | $ | $ | |||||||||||||||||||||||||||||||||||||||||||||||||||||||||||||||||
_______________________
* Dollars in thousands
In accordance with ASC 718, the PSUs were valued on the date of grant at their fair value. The fair value of these grants was equal to the closing price of MDC stock on the date of grant less the discounted cash flows of expected future dividends over the respective vesting period (as these PSUs do not participate in dividends). The grant date fair value and maximum potential expense if the Maximum Goals were met for these awards has been provided in the table above. ASC 718 does not permit recognition of expense associated with performance-based stock awards until achievement of the performance targets are probable of occurring.
2016 PSU Grants. The 2016 PSU awards vested on August 7, 2019. For the year ended December 31, 2019 the Company recorded share-based award expense of $1.8 million related to these awards.
2017 PSU Grants. The 2017 PSU awards vested on May 5, 2020. For the years ended December 31, 2020 and 2019 the Company recorded share-based award expense of $1.4 million and $11.7 million, respectively, related to these awards.
2018 PSU Grants. The 2018 PSU awards vested on April 29, 2021. For the years ended December 31, 2021, 2020 and 2019 the Company recorded share-based award expense of $1.3 million, $7.3 million and $6.3 million, respectively, related to these awards.
2019 PSU Grants. For the years ended December 31, 2021 and 2020 the Company recorded the required share-based award expense related to the awards of $7.3 million and $10.3 million, respectively, based on its assessment of the probability for achievement of the performance targets. As of December 31, 2019, the Company concluded that achievement of any of the performance metrics had not met the level of probability required to record compensation expense and as such, no expense related to these awards was recognized in year-ended 2019.
2020 PSU Grants. For the year ended December 31, 2021, the Company recorded the required share-based award expense related to the awards of $13.4 million, based on its assessment of the probability for achievement of the performance targets. As of December 31, 2020, the Company concluded that achievement of any of the performance metrics had not met the
F - 34
level of probability required to record compensation expense and as such, no expense related to these awards was recognized in year-ended 2020.
2021 PSU Grants. For the year ended December 31, 2021, the Company recorded the required share-based award expense related to the awards of $4.4 million, based on its assessment of the probability for achievement of the performance targets.
22. Supplemental Guarantor Information
Our senior notes are fully and unconditionally guaranteed on an unsecured basis, jointly and severally, by the following subsidiaries (collectively, the "Guarantor Subsidiaries"), which are 100 %-owned subsidiaries of the Company.
•M.D.C. Land Corporation
•RAH of Florida, Inc.
•Richmond American Construction, Inc.
•Richmond American Construction NM, Inc.
•Richmond American Homes of Arizona, Inc.
•Richmond American Homes of Colorado, Inc.
•Richmond American Homes of Florida, LP
•Richmond American Homes of Idaho, Inc. (formerly known as Richmond American Homes of Illinois, Inc.)
•Richmond American Homes of Maryland, Inc.
•Richmond American Homes of Nevada, Inc.
•Richmond American Homes of New Mexico, Inc.
•Richmond American Homes of Oregon, Inc.
•Richmond American Homes of Pennsylvania, Inc.
•Richmond American Homes of Tennessee (formerly known as Richmond American Homes of New Jersey, Inc.)
•Richmond American Homes of Texas, Inc.
•Richmond American Homes of Utah, Inc.
•Richmond American Homes of Virginia, Inc.
•Richmond American Homes of Washington, Inc.
The senior note indentures do not provide for a suspension of the guarantees. Other than for the senior notes due 2061, the senior note indentures, provide that any Guarantor may be released from its guarantee so long as (1) no default or event of default exists or would result from release of such guarantee, (2) the Guarantor being released has consolidated net worth of less than 5 % of the Company’s consolidated net worth as of the end of the most recent fiscal quarter, (3) the Guarantors released from their guarantees in any year-end period comprise in the aggregate less than 10 % (or 15 % if and to the extent necessary to permit the cure of a default) of the Company’s consolidated net worth as of the end of the most recent fiscal quarter, (4) such release would not have a material adverse effect on the homebuilding business of the Company and its subsidiaries and (5) the Guarantor is released from its guarantee(s) under all Specified Indebtedness (other than by reason of payment under its guarantee of Specified Indebtedness). The indenture for the senior notes due 2061 provides that, if a Guarantor is released under its guarantees of our credit facilities or other publicly traded debt securities, the Guarantor will also be released under its guarantee of the senior notes due 2061. Upon delivery of an officers’ certificate and an opinion of counsel stating that all conditions precedent provided for in the indenture relating to such transactions have been complied with and the release is authorized, the guarantee will be automatically and unconditionally released. “Specified Indebtedness” means indebtedness under the senior notes, the Company’s Indenture dated as of December 3, 2002, the Revolving Credit Facility, and any refinancing, extension, renewal or replacement of any of the foregoing.
F - 35
F - 36
Item 9. Changes in and Disagreements with Accountants on Accounting and Financial Disclosure.
None.
Item 9A. Controls and Procedures.
Conclusion Regarding the Effectiveness of Disclosure Controls and Procedures
An evaluation of the effectiveness of the design and operation of our disclosure controls and procedures was performed under the supervision, and with the participation, of our management, including the principal executive officer and the principal financial officer. Based on that evaluation, our management, including the principal executive officer and principal financial officer, concluded that our disclosure controls and procedures were effective as of the end of the period covered by this report.
Management's Report on Internal Control Over Financial Reporting
Management is responsible for establishing and maintaining adequate internal control over financial reporting. Under the supervision and with the participation of our management, including the principal executive officer and the principal financial officer, we conducted an evaluation of the effectiveness of our internal control over financial reporting based on the framework in the Internal Control—Integrated Framework (2013 framework) issued by the Committee of Sponsoring Organizations of the Treadway Commission. Based on our evaluation under this framework, management concluded that our internal control over financial reporting was effective at December 31, 2021
Ernst & Young LLP, the independent registered public accounting firm that audited the consolidated financial statements included in this annual report on Form 10-K, has issued an attestation report on our internal control over financial reporting, which is included herein.
Changes in Internal Control over Financial Reporting
There were no changes in our internal control over financial reporting that occurred during the fourth quarter that have materially affected, or are reasonably likely to materially affect, our internal control over financial reporting.
34
Report of Independent Registered Public Accounting Firm
To the Stockholders and the Board of Directors of M.D.C. Holdings, Inc.
Opinion on Internal Control Over Financial Reporting
We have audited M.D.C. Holdings, Inc.’s internal control over financial reporting as of December 31, 2021, based on criteria established in Internal Control—Integrated Framework issued by the Committee of Sponsoring Organizations of the Treadway Commission (2013 framework) (the COSO criteria). In our opinion, M.D.C. Holdings, Inc. (the Company) maintained, in all material respects, effective internal control over financial reporting as of December 31, 2021, based on the COSO criteria.
We also have audited, in accordance with the standards of the Public Company Accounting Oversight Board (United States) (PCAOB), the consolidated balance sheets of the Company as of December 31, 2021 and 2020, the related consolidated statements of operations and comprehensive income, stockholders’ equity and cash flows for each of the three years in the period ended December 31, 2021, and the related notes and our report dated February 1, 2022 expressed an unqualified opinion thereon.
Basis for Opinion
The Company’s management is responsible for maintaining effective internal control over financial reporting and for its assessment of the effectiveness of internal control over financial reporting included in the accompanying Management’s Report on Internal Control Over Financial Reporting. Our responsibility is to express an opinion on the Company’s internal control over financial reporting based on our audit. We are a public accounting firm registered with the PCAOB and are required to be independent with respect to the Company in accordance with the U.S. federal securities laws and the applicable rules and regulations of the Securities and Exchange Commission and the PCAOB.
We conducted our audit in accordance with the standards of the PCAOB. Those standards require that we plan and perform the audit to obtain reasonable assurance about whether effective internal control over financial reporting was maintained in all material respects.
Our audit included obtaining an understanding of internal control over financial reporting, assessing the risk that a material weakness exists, testing and evaluating the design and operating effectiveness of internal control based on the assessed risk, and performing such other procedures as we considered necessary in the circumstances. We believe that our audit provides a reasonable basis for our opinion.
Definition and Limitations of Internal Control Over Financial Reporting
A company’s internal control over financial reporting is a process designed to provide reasonable assurance regarding the reliability of financial reporting and the preparation of financial statements for external purposes in accordance with generally accepted accounting principles. A company’s internal control over financial reporting includes those policies and procedures that (1) pertain to the maintenance of records that, in reasonable detail, accurately and fairly reflect the transactions and dispositions of the assets of the company; (2) provide reasonable assurance that transactions are recorded as necessary to permit preparation of financial statements in accordance with generally accepted accounting principles, and that receipts and expenditures of the company are being made only in accordance with authorizations of management and directors of the company; and (3) provide reasonable assurance regarding prevention or timely detection of unauthorized acquisition, use, or disposition of the company’s assets that could have a material effect on the financial statements.
Because of its inherent limitations, internal control over financial reporting may not prevent or detect misstatements. Also, projections of any evaluation of effectiveness to future periods are subject to the risk that controls may become inadequate because of changes in conditions, or that the degree of compliance with the policies or procedures may deteriorate.
/s/ Ernst & Young LLP
Denver, Colorado
February 1, 2022
35
Item 9B. Other Information.
None.
Item 9C. Disclosure Regarding Foreign Jurisdictions that Prevent Inspections.
Not applicable.
PART III
Item 10. Directors, Executive Officers and Corporate Governance.
Information not disclosed below that is required by this Item is incorporated herein by reference, when filed, from our proxy statement (the “Proxy Statement”) for the Annual Meeting of Shareholders to be held on or about April 25, 2022, to be filed with the Securities and Exchange Commission pursuant to Regulation 14A under the Exchange Act. Please see the Table of Contents to the Proxy Statement.
We will provide to any shareholders or other person without charge, upon request, a copy of our Corporate Code of Conduct, Corporate Governance Guidelines, code of ethics applicable to our principal executive officer, principal financial officer, principal accounting officer or controller, or persons performing similar functions (collectively “senior financial officers”) and the charters for our Audit Committee, Compensation Committee, Legal Committee and Corporate Governance/Nominating Committee. You may obtain these documents on our website at www.mdcholdings.com, under our Investor Relations section or by contacting our Investor Relations department at 1-866-424-3395. Our intention is to post on our website any amendments to or waivers from our code of ethics applicable to our senior financial officers if such disclosure is required.
Item 11. Executive Compensation.
Information required to be set forth hereunder has been omitted and will be incorporated by reference, when filed, from our Proxy Statement. Please see the Table of Contents to the Proxy Statement.
Item 12. Security Ownership of Certain Beneficial Owners and Management and Related Stockholder Matters.
Information required to be set forth hereunder has been omitted and will be incorporated by reference, when filed, from our Proxy Statement. Please see the Table of Contents to the Proxy Statement.
Item 13. Certain Relationships and Related Transactions, and Director Independence.
Information required to be set forth hereunder has been omitted and will be incorporated by reference, when filed, from our Proxy Statement. Please see the Table of Contents to the Proxy Statement.
Item 14. Principal Accountant Fees and Services.
Information required to be set forth hereunder has been omitted and will be incorporated by reference, when filed, from our Proxy Statement. Please see the Table of Contents to the Proxy Statement.
36
PART IV
Item 15. Exhibits and Financial Statement Schedules.
(a)(1) Financial Statements.
The following Consolidated Financial Statements of the Company and its subsidiaries are included in Part II, Item 8.
| Page | |||||
| M.D.C. Holdings, Inc. and Subsidiaries | |||||
F-2 | |||||
F-4 | |||||
F-5 | |||||
F-6 | |||||
F-7 | |||||
F-8 | |||||
(a)(2) Financial Statement Schedules.
All schedules are omitted because they are not applicable, not material, not required or the required information is included in the applicable Consolidated Financial Statements or notes thereto.
(a)(3) Exhibits.
INDEX TO EXHIBITS
| Exhibit Number | Description | |||||||
| 3.1 | ||||||||
| 3.2 | ||||||||
| 3.3 | ||||||||
| 4.1 | ||||||||
| 4.2 | ||||||||
| 4.3 | ||||||||
| 4.4 | ||||||||
| 4.5 | ||||||||
| 4.6 | ||||||||
37
| 4.7 | ||||||||
| 4.8 | ||||||||
| 4.9 | ||||||||
| 4.10 | ||||||||
| 10.1 | ||||||||
| 10.2 | ||||||||
| 10.3 | ||||||||
| 10.4 | ||||||||
| 10.5 | ||||||||
| 10.6 | ||||||||
| 10.7 | ||||||||
| 10.8 | ||||||||
| 10.9 | ||||||||
| 10.10 | ||||||||
| 10.11 | ||||||||
| 10.12 | ||||||||
| 10.13 | ||||||||
| 10.14 | ||||||||
| 10.15 | ||||||||
38
| 10.16 | ||||||||
| 10.17 | ||||||||
| 10.18 | ||||||||
| 10.19 | ||||||||
| 10.20 | ||||||||
| 10.21 | ||||||||
| 10.22 | ||||||||
| 10.23 | ||||||||
| 10.24 | ||||||||
| 10.25 | ||||||||
| 10.26 | ||||||||
| 10.27 | ||||||||
| 10.28 | ||||||||
| 10.29 | ||||||||
| 10.30 | ||||||||
| 10.31 | ||||||||
| 10.32 | ||||||||
| 10.33 | ||||||||
| 10.34 | ||||||||
| 10.35 | ||||||||
39
| 10.36 | ||||||||
| 10.37 | ||||||||
| 10.38 | ||||||||
| 10.39 | ||||||||
| 10.40 | ||||||||
| 10.41 | ||||||||
| 10.42 | ||||||||
| 10.43 | ||||||||
| 10.44 | ||||||||
| 10.45 | ||||||||
| 10.46 | ||||||||
| 10.47 | ||||||||
| 10.48 | ||||||||
| 10.49 | ||||||||
| 10.50 | ||||||||
| 10.51 | ||||||||
| 10.52 | ||||||||
| 10.53 | ||||||||
| 10.54 | ||||||||
| 10.55 | ||||||||
| 10.56 | ||||||||
| 10.57 | ||||||||
| 10.58 | ||||||||
40
| 10.59 | ||||||||
| 10.60 | ||||||||
| 10.61 | ||||||||
| 10.62 | ||||||||
| 10.63 | ||||||||
| 10.64 | ||||||||
| 10.65 | ||||||||
| 10.66 | ||||||||
| 10.67 | ||||||||
| 10.68 | ||||||||
| 10.69 | ||||||||
| 10.70 | ||||||||
| 10.71 | ||||||||
| 21 | ||||||||
| 22 | ||||||||
| 23 | ||||||||
| 31.1 | ||||||||
| 31.2 | ||||||||
| 32.1 | ||||||||
| 32.2 | ||||||||
| 101 | The following financial statements, formatted in Inline Extensible Business Reporting Language (iXBRL): (i) Consolidated Balance Sheets at December 31, 2021 and December 31, 2020, (ii) Consolidated Statements of Operations and Comprehensive Income for each of the three years in the period ended December 31, 2021, (iii) Consolidated Statements of Stockholders’ Equity for each of the three years in the period ended December 31, 2021, (iv) Consolidated Statements of Cash Flows for each of the three years in the period ended December 31, 2021; and (iv) Notes to the Consolidated Financial Statements, tagged as blocks of text. | |||||||
41
| 104 | Cover Page Interactive Data File (formatted as iXBRL and contained in Exhibit 101) | |||||||
____________________
*Incorporated by reference.
42
Item 16. Form 10-K Summary.
Not applicable.
SIGNATURES
Pursuant to the requirements of Section 13 or 15(d) of the Securities Exchange Act of 1934, the Registrant has duly caused this report to be signed on its behalf by the undersigned, thereunto duly authorized.
| M.D.C. HOLDINGS, INC. (Registrant) | ||||||||
| Date: February 1, 2022 | By: | /s/ Robert N. Martin | ||||||
| Robert N. Martin | ||||||||
| Senior Vice President and Chief Financial Officer (principal financial officer and duly authorized officer) | ||||||||
43
POWER OF ATTORNEY
KNOW ALL BY THESE PRESENTS, that the undersigned officers and/or directors of the Registrant, by virtue of their signatures to this report, appearing below, hereby constitute and appoint Larry A. Mizel and David D. Mandarich, or any one of them, with full power of substitution, as attorneys-in-fact in their names, places and steads to execute any and all amendments to this report in the capacities set forth opposite their names and hereby ratify all that said attorneys-in-fact do by virtue hereof.
Pursuant to the requirements of the Securities Exchange Act of 1934, this report has been signed below by the following persons on behalf of the Registrant and in the capacities and on the dates indicated.
| Signature | Title | Date | ||||||
| /s/ Larry A. Mizel | Executive Chairman | February 1, 2022 | ||||||
| Larry A. Mizel | (principal executive officer) | |||||||
| /s/ David D. Mandarich | Director, President and Chief Executive Officer | February 1, 2022 | ||||||
| David D. Mandarich | ||||||||
| /s/ Robert N. Martin | Senior Vice President and Chief Financial Officer | February 1, 2022 | ||||||
| Robert N. Martin | (principal financial officer and principal accounting officer) | |||||||
| /s/ Raymond T. Baker | Director | February 1, 2022 | ||||||
| Raymond T. Baker | ||||||||
| /s/ Michael A. Berman | Director | February 1, 2022 | ||||||
| Michael A. Berman | ||||||||
| /s/ David E. Blackford | Director | February 1, 2022 | ||||||
| David E. Blackford | ||||||||
| /s/ Herbert T. Buchwald | Director | February 1, 2022 | ||||||
| Herbert T. Buchwald | ||||||||
| /s/ Courtney L. Mizel | Director | February 1, 2022 | ||||||
| Courtney L. Mizel | ||||||||
| /s/ Paris G. Reece III | Director | February 1, 2022 | ||||||
| Paris G. Reece III | ||||||||
| /s/ David Siegel | Director | February 1, 2022 | ||||||
| David Siegel | ||||||||
44
Serious News for Serious Traders! Try StreetInsider.com Premium Free!
You May Also Be Interested In
- NOVAGOLD Announces Date of its 2024 Virtual Annual General Meeting of Shareholders
- Aterian Sets Date for First Quarter 2024 Earnings Announcement & Investor Conference Call
- Galway Metals Announces Closing of Private Placement of Flow-Through Units
Create E-mail Alert Related Categories
SEC FilingsSign up for StreetInsider Free!
Receive full access to all new and archived articles, unlimited portfolio tracking, e-mail alerts, custom newswires and RSS feeds - and more!
