

Form 10-K IES Holdings, Inc. For: Sep 30
 Tweet
Tweet Share
ShareUNITED STATES
SECURITIES AND EXCHANGE COMMISSION
WASHINGTON, D.C. 20549
FORM 10-K
(Mark One)
| ANNUAL REPORT PURSUANT TO SECTION 13 OR 15(d) OF THE SECURITIES EXCHANGE ACT OF 1934 | ||||||||
| For the fiscal year ended | ||||||||
| OR | ||||||||
| TRANSITION REPORT PURSUANT TO SECTION 13 OR 15(d) OF THE SECURITIES EXCHANGE ACT OF 1934 | ||||||||
For the transition period from to | ||||||||
Commission file number 001-13783
(Exact name of registrant as specified in its charter)
| (State or other jurisdiction of incorporation or organization) | (I.R.S. Employer Identification No.) | ||||
(Address of principal executive offices and zip code)
Registrant’s telephone number, including area code: (713 ) 860-1500
Securities registered pursuant to Section 12(b) of the Act:
| Title of each class | Trading Symbol | Name of each exchange on which registered | ||||||||||||
Securities registered pursuant to Section 12(g) of the Act: None
Indicate by check mark if the registrant is a well-known seasoned issuer, as defined in Rule 405 of the Securities Act. Yes ☐ No ☑
Indicate by check mark if the registrant is not required to file reports pursuant to Section 13 or 15(d) of the Act. Yes ☐ No ☑
Indicate by check mark whether the registrant (1) has filed all reports required to be filed by Section 13 or 15(d) of the Securities Exchange Act of 1934 during the preceding 12 months (or for such shorter period that the registrant was required to file such reports), and (2) has been subject to such filing requirements for the past 90 days. Yes ☑ No ☐
Indicate by check mark whether the registrant has submitted electronically every Interactive Data File required to be submitted pursuant to Rule 405 of Regulation S-T (§ 232.405 of this chapter) during the preceding 12 months (or for such shorter period that the registrant was required to submit such files). Yes ☑ No ☐
Indicate by check mark whether the registrant is a large accelerated filer, an accelerated filer, a non-accelerated filer, a smaller reporting company, or an emerging growth company. See the definitions of “large accelerated filer”, “accelerated filer”, “smaller reporting company” and “emerging growth company” in Rule 12b-2 of the Exchange Act.:
| Large accelerated filer | ☐ | ☑ | ||||||||||||
| Non-accelerated filer | ☐ | Smaller reporting company | ||||||||||||
| Emerging growth company | ||||||||||||||
If an emerging growth company, indicate by check mark if the registrant has elected not to use the extended transition period for complying with any new or revised financial accounting standards provided pursuant to Section 13(a) of the Exchange Act ☐
Indicate by check mark whether the registrant has filed a report on and attestation to its management's assessment of the effectiveness of its internal control over financial reporting under Section 404(b) of the Sarbanes-Oxley Act (15 U.S.C. 7262(b)) by the registered public accounting firm that prepared or issued its audit report ☑
Indicate by check mark whether the registrant is a shell company (as defined in Rule 12b-2 of the Act). Yes ☐ No ☑
The aggregate market value of the voting stock of the registrant held by non-affiliates as of March 31, 2021, was approximately $450.9 million. On December 1, 2021, there were 20,702,565 shares of common stock outstanding.
DOCUMENTS INCORPORATED BY REFERENCE
FORM 10-K
IES HOLDINGS, INC. AND SUBSIDIARIES
INDEX
| Page | ||||||||
PART I
DEFINITIONS
In this Annual Report on Form 10-K, the words “IES”, the “Company”, the “Registrant”, “we”, “our”, “ours” and “us” refer to IES Holdings, Inc. and, except as otherwise specified herein, to our subsidiaries.
DISCLOSURE REGARDING FORWARD-LOOKING STATEMENTS
This Annual Report on Form 10-K includes certain statements that may be deemed “forward-looking statements” within the meaning of Section 27A of the Securities Act of 1933, as amended, and Section 21E of the Securities Exchange Act of 1934, as amended, all of which are based upon various estimates and assumptions that the Company believes to be reasonable as of the date hereof. In some cases, you can identify forward-looking statements by terminology such as “may,” “will,” “could,” “should,” “expect,” “plan,” “project,” “intend,” “anticipate,” “believe,” “seek,” “estimate,” “predict,” “potential,” “pursue,” “target,” “continue,” the negative of such terms or other comparable terminology. These statements involve risks and uncertainties that could cause the Company’s actual future outcomes to differ materially from those set forth in such statements. Such risks and uncertainties include, but are not limited to:
•the impact of the COVID-19 outbreak or future pandemics on our business, including the potential for new or continued job site closures or work stoppages, supply chain disruptions, delays in awarding new project bids, construction delays, reduced demand for our services, delays in our ability to collect from our customers, the impact of third party vaccine mandates on employee recruiting and retention, or illness of management or other employees;
•competition in the industries in which we operate, both from third parties and former employees, which could result in the loss of one or more customers or lead to lower margins on new projects;
•our ability to successfully manage projects, the cost and availability of qualified labor and the ability to maintain positive labor relations, and our ability to pass along increases in the cost of commodities used in our business, in particular, copper, aluminum, steel, fuel, electrical components and certain plastics;
•potential supply chain disruptions due to our suppliers' access to materials and labor, their ability to ship products timely, or credit or liquidity problems they may face;
•our ability to enter into, and the terms of, future contracts;
•the inability to carry out plans and strategies as expected, including the inability to identify and complete acquisitions that meet our investment criteria in furtherance of our corporate strategy, or the subsequent underperformance of those acquisitions;
•challenges integrating new businesses into the Company or new types of work, products or processes into our segments;
•a general reduction in the demand for our products or services;
•backlog that may not be realized or may not result in profits;
•failure to adequately recover on contract change orders or claims against customers;
•closures or sales of facilities resulting in significant future charges, including potential warranty losses or other unexpected liabilities, or a significant disruption of our operations;
•the impact of seasonality, adverse weather conditions, and climate change;
•an increased cost of surety bonds affecting margins on work and the potential for our surety providers to refuse bonding or require additional collateral at their discretion;
•fluctuations in operating activity due to downturns in levels of construction or the housing market, seasonality and differing regional economic conditions;
1
•increases in bad debt expense and days sales outstanding due to liquidity problems faced by our customers;
•accidents resulting from the physical hazards associated with our work and the potential for accidents;
•the possibility that our current insurance coverage may not be adequate or that we may not be able to obtain policies at acceptable rates;
•the effect of litigation, claims and contingencies, including warranty losses, damages or other latent defect claims in excess of our existing reserves and accruals;
•interruptions to our information systems and cyber security or data breaches;
•liabilities under laws and regulations protecting the environment, including those laws related to climate change;
•expenditures to comply with future changes in environmental laws and regulations, including those relating to climate change;
•loss of key personnel and effective transition of new management, or inability to transfer, renew and obtain electrical and other professional licenses;
•the possibility that certain tax benefits of our net operating losses may be restricted or reduced in a change in ownership or a decrease in the federal tax rate;
•the recognition of tax benefits related to uncertain tax positions and the potential for disagreements with taxing authorities with regard to tax positions we have adopted;
•the potential recognition of valuation allowances or write-downs on deferred tax assets;
•limitations on the availability of sufficient credit or cash flow to fund our working capital needs and capital expenditures, complete acquisitions, and for debt service;
•credit and capital market conditions, including changes in interest rates that affect the cost of construction financing and mortgages, and the inability of some of our customers to retain sufficient financing, which could lead to project delays or cancellations;
•difficulty in fulfilling the covenant terms of our revolving credit facility, including liquidity, and other financial requirements, which could result in a default and acceleration of any indebtedness under such revolving credit facility;
•inaccurate estimates used when entering into fixed-priced contracts, the possibility of errors when estimating revenue and progress to date on percentage-of-completion contracts, and complications associated with the incorporation of new accounting, control and operating procedures;
•uncertainties inherent in estimating future operating results, including revenues, operating income or cash flow;
•the recognition of potential goodwill, long-lived assets and other investment impairments;
•the existence of a controlling shareholder, who has the ability to take action not aligned with other shareholders or to dispose of all or any portion of the shares of our common stock it holds, which could trigger certain change of control provisions in a number of our material agreements, including our financing and surety arrangements and our executive severance plan;
•the relatively low trading volume of our common stock, as a result of which it could be more difficult for shareholders to sell a substantial number of shares for the same price at which shareholders could sell a smaller number of shares;
•the possibility that we issue additional shares of common stock, preferred stock or convertible securities that will dilute the percentage ownership interest of existing stockholders and may dilute the value per share of our common stock;
•the potential for substantial sales of our common stock, which could adversely affect our stock price;
2
•the impact of increasing scrutiny and changing expectations from investors and customers, or new or changing regulations, with respect to environmental, social and governance practices;
•the cost or effort required for our shareholders to bring certain claims or actions against us, as a result of our designation of the Court of Chancery of the State of Delaware as the sole and exclusive forum for certain types of actions and proceedings; and
•the possibility that our internal controls over financial reporting and our disclosure controls and procedures may not prevent all possible errors that could occur.
You should understand that the foregoing, as well as other risk factors discussed in this document, including those listed in Part I, Item 1A of this report under the heading “Risk Factors,” could cause future outcomes to differ materially from those experienced previously or those expressed in such forward-looking statements. We undertake no obligation to publicly update or revise any information, including information concerning our controlling shareholder, net operating losses, borrowing availability or cash position, or any forward-looking statements to reflect events or circumstances that may arise after the date of this report. Forward-looking statements are provided in this Annual Report on Form 10-K pursuant to the safe harbor established under the Private Securities Litigation Reform Act of 1995 and should be evaluated in the context of the estimates, assumptions, uncertainties and risks described herein.
Item 1. Business
OVERVIEW
IES Holdings, Inc. designs and installs integrated electrical and technology systems and provides infrastructure products and services to a variety of end markets. Our operations are organized into four principal business segments, based upon the nature of our services:
•Communications – Nationwide provider of technology services, including the design, build, and maintenance of the infrastructure within data centers for co-location and managed hosting customers, for both large corporations and independent businesses.
•Residential – Regional provider of electrical installation services for single-family housing and multi-family apartment complexes, as well as heating, ventilation and air conditioning, (HVAC) and plumbing installation services in certain markets.
•Infrastructure Solutions – Provider of electro-mechanical solutions for industrial operations, including apparatus repair and custom-engineered products, such as generator enclosures used in data centers and other industrial applications.
•Commercial & Industrial – Provider of electrical and mechanical design, construction, and maintenance services to the commercial and industrial markets in various regional markets and nationwide in certain areas of expertise, such as the power infrastructure market and data centers.
While sharing common goals and values, each of the Company’s segments manages its own day-to-day operations. Our corporate office is focused on significant capital allocation decisions, investment activities and selection of segment leadership. The corporate office also assists with strategic and operational improvement initiatives, talent development, sharing of best practices across the organization and the establishment and monitoring of risk management practices within our segments.
IES Holdings, Inc. is a Delaware corporation established in 1997 and headquartered in Houston, Texas, with an executive office in Greenwich, Connecticut.
CORPORATE STRATEGY
We seek to create shareholder value by growing our business through increasing our market share, geographic and market expansion and adding to our capabilities, as well as improving operating margins and generating free cash flow, by investing in our existing businesses and completing acquisitions. We primarily seek to acquire businesses that strategically complement our existing business segments. In addition, we may seek to acquire or invest in stand-alone platform companies based in North America. In evaluating potential acquisition candidates, we seek to invest in businesses with, among other characteristics:
•proven management with a willingness to continue post-acquisition;
•low technological and/or product obsolescence risk;
3
•established market position and sustainable competitive advantages; and
•strong cash flow characteristics.
We believe that acquisitions provide an opportunity to expand into new or related services, products, end markets or geographic areas and diversify our revenue and profit streams, which we expect will allow us to maximize the value of our significant net operating loss tax carry forwards (“NOLs”). While we may use acquisitions to build our presence in the industries we serve, we will also consider potential acquisitions in other industries, which could result in changes in our operations from those historically conducted by us.
OPERATING SEGMENTS
The Company’s reportable segments consist of the consolidated business segments identified above, which offer different services and are managed separately. The table below describes the percentage of our total revenues attributable to each of our four segments over each of the last three years (percentage columns may not add due to rounding):
| Year Ended September 30, | ||||||||||||||||||||||||||||||||||||||
| 2021 | 2020 | 2019 | ||||||||||||||||||||||||||||||||||||
| $ | % | $ | % | $ | % | |||||||||||||||||||||||||||||||||
| (Dollars in thousands, Percentage of revenues) | ||||||||||||||||||||||||||||||||||||||
| Communications | $ | 445,968 | 29.0 | % | $ | 395,141 | 33.2 | % | $ | 321,246 | 29.8 | % | ||||||||||||||||||||||||||
| Residential | 687,347 | 44.7 | % | 411,790 | 34.6 | % | 313,336 | 29.1 | % | |||||||||||||||||||||||||||||
| Infrastructure Solutions | 146,980 | 9.6 | % | 128,379 | 10.8 | % | 136,790 | 12.7 | % | |||||||||||||||||||||||||||||
| Commercial & Industrial | 256,198 | 16.7 | % | 255,546 | 21.5 | % | 305,624 | 28.4 | % | |||||||||||||||||||||||||||||
| Total Consolidated | $ | 1,536,493 | 100.0 | % | $ | 1,190,856 | 100.0 | % | $ | 1,076,996 | 100.0 | % | ||||||||||||||||||||||||||
For additional financial information by segment, see Note 11, “Operating Segments” in the notes to our Consolidated Financial Statements.
Communications
Business Description
Originally established in 1984, our Communications segment is a leading provider of network infrastructure solutions for data centers and other mission critical environments. Our services include the design, installation and maintenance of network infrastructure for leading and recognizable global technology, social networking and e-commerce brands, including many Fortune 100 and 500 corporations. We serve a variety of industries and end-markets, including data centers for co-location and managed hosting customers; corporate, educational, financial, hospitality and healthcare buildings; e-commerce distribution centers; and high-tech manufacturing facilities. We also provide the design and installation of audio/visual, telephone, fire, wireless access and intrusion alarm systems, as well as design/build, service and maintenance of data network systems. We perform services across the United States from our 17 offices, which includes the segment headquarters located in Tempe, Arizona, and also provide dedicated onsite teams at our customers’ sites.
Industry Overview
Our Communications segment is driven by demand increases for computing and storage resources as a result of technology advancements and obsolescence and changes in data consumption patterns. Growth in the data center market remains strong, and the need for structured cabling services for applications such as data centers and distribution centers is growing rapidly. Additionally, we are continuing to expand our offerings in this market to broaden our customer base. Demand has also been strong for our audio-visual and other building technology offerings. Nevertheless, due to economic, technological and other factors, there can be no assurance that demand will continue to increase.
Sales and Marketing
Our sales strategy relies on a concentrated business development effort, with centralized marketing programs and direct end-customer communications and relationships. Due to the mission critical nature of the facilities we service, our end-customers significantly rely upon our past performance record, technical expertise and specialized knowledge. A significant portion of our Communications business volume is generated from long-term, repeat customers, some of whom use IES as a preferred provider for major projects.
Our long-term strategy is to improve our position as a preferred solutions and services provider to large national corporations and strategic local companies. Key elements of our long-term strategy include continued investment in our employees’ technical expertise
4
and expansion of our on-site maintenance and recurring revenue model, as well as opportunistic acquisitions of businesses that serve our markets, consistent with our stated corporate strategy.
Competition
Our competition consists of both large national or regional competitors and small, privately owned contractors who generally have limited access to capital. We compete on quality of service and/or price and seek to emphasize our financial capabilities and long history of delivering high quality solutions to our customers.
Seasonality and Quarterly Fluctuations
The effects of seasonality on our Communications business are not significant, as work generally is performed inside structures protected from the weather. Our service and maintenance business is also generally not affected by seasonality. However, communications infrastructure spending has historically been highly cyclical. Our volume of business may be adversely affected by declines in projects resulting from adverse regional or national economic conditions. Quarterly results may also be materially affected by the timing of new construction projects. Accordingly, operating results for any fiscal period are not necessarily indicative of results that may be achieved for any subsequent fiscal period.
Residential
Business Description
Originally established in 1973, our Residential segment is a leading provider of electrical installation services for single-family housing and multi-family apartment complexes, as well as HVAC and plumbing installation services in certain markets, and cable television installations for residential and light commercial applications. The Residential segment also provides services for the installation of residential solar power, both for new construction and existing residences. The Residential segment is made up of 50 total locations, which include the segment headquarters in Houston, Texas. These locations geographically cover the Sun-Belt, Western, Mid-Atlantic and Northeastern regions of the United States.
Industry Overview
Our Residential business is closely correlated to the single and multi-family housing market. Although demand for both single-family and multi-family housing has increased in recent years, due to economic, technological or other factors, there can be no assurance that overall construction and demand will continue to increase in the future.
Sales and Marketing
Demand for our Residential services is highly dependent on the number of single-family and multi-family home starts in the markets we serve. Although we operate in multiple states throughout the Sun-Belt, Mid-Atlantic, Northeastern and Western regions of the United States, the majority of our single-family revenues are derived from services provided in Texas and Florida. The Texas market also remains an important part of our multi-family business; however, the majority of our multi-family revenue is earned across the Mid-Atlantic and Southeast. Our sales efforts include a variety of strategies, including a concentrated focus on national and regional homebuilders and multi-family developers and a local sales strategy for single and multi-family housing projects. Our cable and solar revenues are typically generated through third parties specializing in these industries who select us as a preferred provider of installation services. A significant portion of our Residential business volume is generated from long-term, repeat customers, some of whom use IES as a preferred provider for major projects.
Our long-term strategy is to continue to be a leading provider of electrical services to the residential market, and to continue to expand our offerings of plumbing and HVAC services. The key elements of our long-term strategy include a continued focus on maintaining a low and variable cost structure and cash generation, allowing us to effectively scale according to the housing cycle, and to opportunistically increase our market share.
Competition
Our competition primarily consists of small, privately owned contractors who generally have limited access to capital. We believe that we have a competitive advantage over these smaller competitors due to our key employees’ long-standing customer relationships, our financial capabilities, our employee training program, and our local market knowledge and competitive pricing. There are few barriers to entry for electrical contracting services in the residential markets.
Seasonality and Quarterly Fluctuations
Results of operations from our Residential segment can be seasonal, depending on weather trends, with typically higher revenues generated during spring and summer and lower revenues during fall and winter. In addition, the construction industry has historically been highly cyclical. Our volume of business may be adversely affected by declines in multi-family occupancy rates as well as single-family housing starts within our operational footprint. Quarterly results may also be materially affected by the timing of new
5
construction projects. Accordingly, operating results for any fiscal period are not necessarily indicative of results that may be achieved for any subsequent fiscal period.
Infrastructure Solutions
Business Description
Our Infrastructure Solutions segment provides electro-mechanical solutions for industrial operations to domestic and international customers. Our Custom Power Solutions business includes the manufacture of custom commercial and industrial generator enclosures and the manufacture of custom-engineered power distribution equipment, including metal enclosed bus duct solutions used in power distribution. Our Industrial Services business includes the maintenance and repair of alternating current (AC) and direct current (DC) electric motors and generators, as well as power generating and distribution equipment; the manufacture, re-manufacture, and repair of industrial lifting magnets; and maintenance and repair of railroad main and auxiliary generators, main alternators, and traction motors.
This segment serves the steel, railroad, marine, petrochemical, pipeline, pulp and paper, wind energy, mining, automotive, power generation, scrap yards, data center, and utility industries. Our Infrastructure Solutions segment is comprised of 11 locations in Alabama, Georgia, Illinois, Indiana, Ohio, Oklahoma and West Virginia, and is headquartered in Massillon, Ohio.
Industry Overview
Given the diverse end-markets of Infrastructure Solutions’ customers, we are subject to many economic trends. In general, demand for our services has been driven by growth in industries, such as data centers, in-house maintenance departments continuing to outsource maintenance and repair work, output levels and equipment utilization at heavy industrial facilities, railroad companies’ and mass transit authorities’ capital investments and repair needs, investment in the United States’ aging energy and industrial infrastructure, demand for critical power applications that have high power demands and require dependable power supplies, the need for electrical or pipeline infrastructure improvements and the overall health of the economy.
Sales and Marketing
Our sales efforts are primarily driven by personnel based at our operating locations, as well as independent sales representatives. Our custom-engineered power distribution, bus system and generator enclosure products and services are principally sold in partnership with an original equipment manufacturer (“OEM”) or to an engineering, procurement and construction firm on behalf of the end-user. Regarding our apparatus repair services, the majority of our customers are located within a 200-mile radius of our facilities, and we believe that the locations of our facilities allow us to rapidly address and respond to the needs of our customers. Our long-term strategy is to be a leader in custom-engineered metal enclosed bus systems and generator enclosures and the preferred solutions provider of outsourced electro-mechanical services, repairs, and manufacturing to our select markets.
Competition
Our competition ranges from small, single location service centers to large, multi-national companies. Our Custom Power Solutions business competes with domestic and international manufacturers and distributors. We believe that we have a competitive advantage due to our specific product offerings, geographic proximity to customer sites, and our ability to design high quality products to meet each customer's unique requirements. Our Industrial Services business competes with small, specialized manufacturing and repair shops, a limited number of other multi-location providers of electric motor repair, engineering and maintenance services, and various OEMs. Participants in this industry compete primarily on the basis of capabilities, service, quality, timeliness and price. We believe that we have a competitive advantage due to our breadth of capabilities, focus on quality, technical support, customer service, and financial resources.
Seasonality and Quarterly Fluctuations
Infrastructure Solutions’ revenues from its custom-engineered bus systems and generator enclosures are affected by the timing of customers' capital spending projects. Revenues from industrial services may be affected by the timing of scheduled outages at its industrial customers’ facilities and by weather conditions with respect to projects conducted outdoors, but the effects of seasonality on revenues in its industrial services business are not significant. Infrastructure Solutions’ quarterly results may fluctuate, and the results of one fiscal quarter may not be representative of the results of any other quarter or of the full fiscal year.
Commercial & Industrial
Business Description
Our Commercial & Industrial segment provides electrical and mechanical design, service, and construction services to commercial and industrial markets. Our construction services range from the initial planning and procurement to installation and start-up and are offered to a variety of new and remodel construction projects, ranging from the construction of office buildings and industrial facilities to transmission and distribution projects. Our design services range from budget assistance to providing design-build and LEED
6
(Leadership in Energy & Environmental Design) solutions to our end customers. Our maintenance and emergency services include critical plant shutdown, troubleshooting, emergency testing, preventative maintenance, and constant presence. We also provide mechanical services such as maintenance agreements, installation, or replacement of mechanical equipment for commercial and industrial facilities.
This segment provides services for a variety of project types, including office buildings, manufacturing facilities, data centers, chemical plants, refineries, wind farms, solar facilities, municipal infrastructure and health care facilities. The Commercial & Industrial segment consists of 19 locations, which includes the segment headquarters in Houston, Texas. Geographically, these locations cover Texas, Nebraska, Oregon, Wisconsin, and the Southeast and Mid-Atlantic regions.
Industry Overview
Given the diverse end-markets of our Commercial & Industrial customers, which include both commercial buildings, such as offices, healthcare facilities and schools, and industrial projects, such as power, agricultural and food processing, and heavy manufacturing facilities, we are subject to many trends within the construction industry. In general, demand for our Commercial & Industrial services is driven by construction and renovation activity levels, economic growth, and availability of bank or other financing. The construction industry has been impacted by the ongoing COVID-19 pandemic, which has caused some customers to delay the award or start of new projects. Although many of these delayed projects are now underway, there could be further delays in ongoing projects, or in the awarding of new projects, as a result of the pandemic. Due to economic, technological or other factors, there can be no assurance that construction and demand will increase.
Sales and Marketing
Our sales focus varies by location, but is primarily based upon regional and local relationships and a demonstrated expertise in certain areas, such as heavy industrial, design-build, agricultural, or transmission and distribution. Our maintenance and certain renovation and upgrade work tends to be either recurring or experience lower sensitivity to economic cycles, or both. A significant portion of our larger projects is awarded from long-term, repeat customers. From time to time, we are contracted on projects with completion times extending beyond one year or over several years, which are generally more complex and difficult to estimate.
With a focus on quality service offerings, our long-term strategy is to continue to be one of the preferred providers of electrical and mechanical services in the markets where we have demonstrated expertise and/or are a local market leader. Key elements of our long-term strategy include leveraging our expertise in certain niche markets, expanding our service and maintenance business, attracting and retaining highly qualified employees, and maintaining our focus on returns on risk adjusted capital through an emphasis on reducing costs and managing working capital.
Competition
The electrical and mechanical contracting services industry is generally highly competitive and includes a number of regional or small privately-held local firms. Traditionally, competitors in certain parts of this market have faced few barriers to entry. Therefore, we seek to pursue projects where our access to capital and expertise provide a competitive advantage.
Industry expertise, project size, location and past performance will determine our bidding strategy, the level of involvement from competitors and our level of success in winning awards. Our primary advantages vary by location and market, but mostly are based upon local individual relationships with key customers or a demonstrated industry expertise. Additionally, due to the size of many of our projects, our financial resources help us compete effectively against local competitors.
Seasonality and Quarterly Fluctuations
The effects of seasonality on our Commercial & Industrial business are not significant, as most of our work generally is performed inside structures protected from the weather. However, we do perform some work outdoors, which can be affected by the weather. Most of our service and maintenance business is also generally not affected by seasonality. However, the construction industry has historically been highly cyclical. Our volume of business may be adversely affected by declines in construction projects resulting from adverse regional or national economic conditions. Quarterly results may also be materially affected by the timing of new construction projects. Accordingly, operating results for any fiscal period are not necessarily indicative of results that may be achieved for any subsequent fiscal period.
7
SOURCES OF SUPPLY
The raw materials and components we use within our segments include, but are not limited to, electrical fixtures and system components, copper, aluminum, raw steel, and certain plastics. These raw materials and components are generally available from a variety of domestic suppliers at competitive prices. Delivery times are typically short for most raw materials and standard components, but during periods of peak demand, may extend to one month or more. However, during fiscal 2021, primarily as a result of the COVID-19 pandemic and its aftermath, certain materials became more difficult to procure, and significantly more expensive, and order lead times have lengthened, as supply chain interruptions have become increasingly common. We expect these supply challenges to continue during 2022. In response, we are currently carrying higher levels of inventory than has historically been typical for us, and we expect to continue to do so until supply levels and delivery times normalize. Our strategy to reduce commodity cost exposure includes early buying of commodities for particular projects or general inventory, as well as including escalation and escape provisions in project bids, quotes and contracts wherever possible. However, such protections may not be included in every contract or project, and in such cases, we may not be fully reimbursed for increases in commodity prices by our customers and may be exposed to commodity price volatility on longer-term projects where we have prepaid for commodities.
RISK MANAGEMENT
The primary risks in our existing operations include project bidding and management, bodily injury, property and environmental damage, and construction defects. We monitor project bidding and management practices at various levels within the Company. We maintain automobile, general liability and construction defect insurance for third-party health, bodily injury and property damage, as well as pollution coverage and workers’ compensation coverage, which we consider appropriate to insure against these risks. Our third-party insurance is subject to deductibles for which we establish reserves. In light of these risks, we are also committed to a strong safety and environmental compliance culture. We have a robust safety program, and seek to maintain standardized safety and environmental policies and procedures. We are also subject to cyber security and information theft risks in our operations, which we seek to manage through a cyber and information security program, training and insurance coverage. Given the dynamic and evolving nature of cyber threats, we cannot be assured that we are protected against all such threats.
In the electrical contracting industry, our ability to post surety bonds provides us with an advantage over competitors that are smaller or have fewer financial resources. We believe that the strength of our balance sheet, as well as a good relationship with our bonding providers, enhances our ability to obtain adequate financing and surety bonds, although there can be no assurance that surety bonding coverage will be available when we need it. For a further discussion of our risks, please refer to Item 1A. “Risk Factors” of this Annual Report on Form 10-K.
CUSTOMERS
We have a diverse customer base. During each of the years ended September 30, 2021, 2020 and 2019, no single customer accounted for more than 10% of our consolidated revenues. We emphasize developing and maintaining relationships with our customers by providing superior, high-quality service. Management at each of our segments is responsible for determining sales strategies and sales activities.
CONTROLLING SHAREHOLDER
A majority of our outstanding common stock is owned by Tontine Associates, L.L.C. ("Tontine Associates") and its affiliates (collectively, “Tontine”). Based on a Form 4 filed by Tontine with the United States Securities and Exchange Commission (the “SEC”) on November 18, 2021, Tontine owned approximately 56 percent of our outstanding common stock as of December 1, 2021. As a result, Tontine can control most of our affairs, including most actions requiring the approval of shareholders, such as the approval of any potential merger or sale of all or substantially all of the Company's assets or business segments, or the Company itself. Most of Tontine’s shares are registered for resale on a shelf registration statement filed by the Company with the SEC. Tontine’s sale of all or any portion of its shares could result in a change of control of the Company, which would trigger the change of control provisions in a number of our material agreements, including our credit agreement, bonding agreements with our sureties and our executive severance plan. For more information, see Note 3, “Controlling Shareholder” in the notes to our Consolidated Financial Statements.
NET OPERATING LOSS TAX CARRYFORWARDS
The Company and certain of its subsidiaries have an estimated federal net operating loss (“NOL”) of approximately $120.2 million at September 30, 2021, including approximately $103.7 million resulting from net operating losses on which a deferred tax asset is not
8
recorded. Any future change in the federal statutory tax rate could impact the economic benefit of the NOLs and other deferred tax assets available to us and result in a charge or benefit to adjust the book value of the deferred tax asset recorded on our Consolidated Balance Sheets.
A change in ownership, as defined by Internal Revenue Code Section 382, could reduce the availability of NOLs for federal and state income tax purposes. Should Tontine sell or otherwise dispose of all or a portion of its position in IES, a change in ownership could occur. In addition, a change in ownership could result from the purchase of common stock by an existing or a new 5% shareholder as defined by Internal Revenue Code Section 382. Should a change in ownership occur, all NOLs incurred prior to the change in ownership would be subject to limitation imposed by Internal Revenue Code Section 382, which would substantially reduce the amount of NOLs available to offset future taxable income. For more information see Note 3, “Controlling Shareholder” in the notes to our Consolidated Financial Statements.
REMAINING PERFORMANCE OBLIGATIONS AND BACKLOG
Remaining performance obligations represent the unrecognized revenue value of our contract commitments. While backlog is not a defined term under accounting principles generally accepted in the United States of America ("GAAP"), it is a common measurement used in our industry, and we believe it improves our ability to forecast future results and identify operating trends that may not otherwise be apparent. Backlog is a measure of revenue that we expect to recognize from work that has yet to be performed on uncompleted contracts and from work that has been contracted but has not started, exclusive of short-term projects. While all of our backlog is supported by documentation from customers, backlog is not a guarantee of future revenues, as contractual commitments may change and our performance may vary. Not all of our work is performed under contracts included in backlog; for example, most of the apparatus repair work that is completed by our Infrastructure Solutions segment is performed under master service agreements on an as-needed basis. Additionally, electrical installation services for single-family housing at our Residential segment are completed on a short-term basis and are therefore excluded from backlog. The table below summarizes our remaining performance obligations and backlog by segment:
| Year Ended September 30, | |||||||||||||||||||||||
| 2021 | 2020 | ||||||||||||||||||||||
| Remaining Performance Obligations | Agreements without an enforceable obligation (1) | Backlog | Remaining Performance Obligations | Agreements without an enforceable obligation (1) | Backlog | ||||||||||||||||||
| (Dollars in millions) | |||||||||||||||||||||||
| Communications | $ | 219 | $ | 37 | $ | 256 | $ | 169 | $ | 33 | $ | 202 | |||||||||||
| Residential | 260 | 78 | 338 | 170 | 51 | 221 | |||||||||||||||||
| Infrastructure Solutions | 65 | 63 | 128 | 43 | 9 | 52 | |||||||||||||||||
| Commercial & Industrial | 169 | 9 | 178 | 123 | 4 | 127 | |||||||||||||||||
| Total | $ | 713 | $ | 187 | $ | 900 | $ | 505 | $ | 97 | $ | 602 | |||||||||||
(1) Our backlog includes signed agreements and letters of intent that we do not have a legal right to enforce prior to beginning work. These agreements are excluded from remaining performance obligations until work begins.
We expect that $651 million of our September 30, 2021 backlog will result in revenue during fiscal 2022, with the remaining $249 million expected to be realized in fiscal 2023; however, there can be no assurance that this backlog will be completed within expected time frames or at all. The increase in our backlog year over year was primarily driven by strong demand and increased market share within our Communications, Residential and Infrastructure Solutions segments. Additionally, the backlog at our Commercial & Industrial segment at September 30, 2021 reflected the awarding of projects that had been deferred or otherwise delayed during the year ended September 30, 2020 as a result of the COVID-19 pandemic.
REGULATIONS
Our operations are subject to various federal, state and local laws and regulations, including:
•licensing requirements applicable to electricians, plumbers, and mechanical service technicians;
•building and electrical codes;
9
•regulations relating to worker safety, labor relations and protection of the environment;
•regulations relating to consumer protection, including those governing residential service agreements; and
•qualifications of our business legal structure in the jurisdictions where we do business.
Many state and local regulations governing electricians and mechanical services require permits and licenses to be held by individuals. In some cases, a required permit or license held by a single individual may be sufficient to authorize specified activities for all our electricians or mechanical service technicians who work in the state or county that issued the permit or license. While we seek permits or licenses, where available, that may be material to our operations in a particular geographic area to be held by multiple employees within that area, given the large number of permits and licenses required, we are unable to ensure that multiple employees hold such required permits and licenses.
We believe that we have all licenses required to conduct our operations and are in material compliance with applicable regulatory requirements. Failure to comply with applicable regulations could result in substantial fines or revocation of our operating licenses or an inability to perform government work.
CAPITAL FACILITIES
During fiscal year 2021, the Company maintained a revolving credit facility, as further described in Item 7. “Management’s Discussion and Analysis of Financial Condition and Results of Operations — Liquidity and Capital Resources” of this Annual Report on Form 10-K. For a discussion of the Company’s capital resources, see Item 7. “Management’s Discussion and Analysis of Financial Condition and Results of Operations — Liquidity and Capital Resources” of this Annual Report on Form 10-K.
FINANCIAL INFORMATION
For the Company’s financial information by segment, see Note 11, “Operating Segments” in the notes to our Consolidated Financial Statements.
HUMAN CAPITAL MANAGEMENT
At IES, we believe that attracting and retaining highly qualified and motivated employees at all levels is a key driver of our continued growth and success. Our human capital management objectives include recruiting, retaining, developing, incentivizing and integrating our current and prospective employees as well as prioritizing and protecting their safety.
Our Employees
At September 30, 2021, we had 6,845 employees, of which 6,781 were full-time employees. We are party to two collective bargaining agreements covering fewer than 30 employees within our Infrastructure Solutions segment. We have not experienced, and do not expect, any work stoppage, and we believe that our relationship with our employees is strong.
We are committed to diversity and inclusion in the workplace, and our policies prohibit discrimination based on race, color, creed, gender, gender identity, sexual orientation, religion, marital status, national origin, disability, protected veteran status and relatives of protected veterans and any other status protected by local, state or federal law. This commitment applies to all aspects of employment, including recruitment, hiring, training, compensation, job assignment, advancement, performance feedback and separation.
We strive to support our employees’ and their families’ health by offering comprehensive benefits programs, including medical, dental, vision and prescription insurance. We also offer our employees a 401(k) plan, and life and disability insurance plans.
Recruiting and Training
A key factor in IES’s long-term strategy is the recruitment and retention of high-quality employees. We use both internal and external resources to recruit employees, including monitoring competitive compensation levels in the markets in which we operate.
Our Communications segment has entered into a partnership with the U.S. Army to guarantee job interviews to those who have completed Army Reserve training or a first term of active duty service, and we value the leadership and work ethic military veterans bring to the Company.
We have invested significant resources in development opportunities for employees. For example, our Residential segment has established the IES Residential Education Center, a dedicated facility that trains employees from around the country in the technical
10
skills necessary for a successful career in residential electrical contracting. At all of our segments, partly as a result of the COVID-19 pandemic, we have recently expanded our online training offerings to help meet the needs of our changing workplaces. We believe our investment in training supports employee motivation and retention at the same time that it improves productivity and performance.
Safety
We are committed to fostering a strong safety culture that supports the health, safety and wellness of our employees, and this commitment is reflected in our track record of workplace safety that exceeds industry averages. Our regional safety managers, under the supervision of our Senior Vice President of Safety, seek to maintain standardized safety and environmental policies, programs and procedures and provide personal protective equipment relevant to each segment, including programs to train new employees. Our safety leadership continuously monitors and addresses safety performance, provides regular training and educational programs on safety and participates in numerous industry safety organizations.
In response to the COVID-19 pandemic, we assembled a task force and implemented numerous measures aimed at protecting the health and safety of our employees including additional personal protective equipment, on-site health screenings in some locations, social distancing, deep cleaning protocols and travel restrictions. The Company continues to monitor evolving health and safety guidelines and regulations.
LOCATIONS
As of September 30, 2021, we have 99 domestic locations serving the United States. In addition to our two executive and corporate offices, as of September 30, 2021, we have 17 locations within our Communications business, 50 locations within our Residential business, 11 locations within our Infrastructure Solutions business and 19 locations within our Commercial & Industrial business. This geographic diversity helps to reduce our exposure to unfavorable economic developments in any given region.
EXECUTIVE OFFICERS OF THE REGISTRANT
Certain information with respect to each executive officer is as follows:
Jeffrey, L. Gendell, 62, has served as the Company's Chief Executive Officer since October 1, 2020; he previously served as Interim Chief Executive Officer from July 31, 2020 to September 30, 2020. Mr. Gendell has also served as the Chairman of the Board since November 2016. Mr. Gendell is the founder and managing member of Tontine Associates, which together with its affiliates is the Company's majority shareholder. Mr. Gendell formed Tontine in 1995 and manages all of the investment decisions at the firm. Prior to forming Tontine, Mr. Gendell held senior investment management positions at several other private investment firms, including Odyssey Partners, L.P., and began his career in investment banking over 35 years ago at Smith Barney, Harris Upham & Co., where he was involved in capital markets, corporate finance and M&A activity.
Tracy A. McLauchlin, 52, has served as Senior Vice President, Chief Financial Officer and Treasurer of the Company since May 2015. She previously served as Vice President and Chief Accounting Officer of the Company since February 2014. Prior to joining IES, Ms. McLauchlin served as Vice President and Chief Accounting Officer of Rockwater Energy Solutions, Inc. from June 2011 to November 2013. From June 2004 to June 2011, Ms. McLauchlin was with Dynegy Inc., where she served as Senior Vice President and Controller from March 2009 to June 2011 and from June 2004 to March 2009 served in various other capacities in finance and accounting. She began her career with PricewaterhouseCoopers LLP after receiving her Master of Accounting from Rice University. Ms. McLauchlin is a Certified Public Accountant.
We have adopted a Code of Ethics for Financial Executives that applies to our principal executive officer, principal financial officer and principal accounting officer. The Code of Ethics may be found on our website at www.ies-corporate.com/corporate-governance. If we make any substantive amendments to the Code of Ethics or grant any waiver, including any implicit waiver, from a provision of the Code of Ethics to our principal executive officer, principal financial officer or principal accounting officer, we will disclose the nature of such amendment or waiver on that website or in a Current Report on Form 8-K. Paper copies of these documents are also available free of charge upon written request to us.
AVAILABLE INFORMATION
General information about us can be found on our website at www.ies-co.com under “Investor Relations.” We file our interim and annual financial reports, as well as other reports required by the Securities Exchange Act of 1934, as amended (the “Exchange Act”), with the SEC.
11
Our Annual Report on Form 10-K, Quarterly Reports on Form 10-Q and Current Reports on Form 8-K, as well as any amendments and exhibits to those reports are available free of charge through our website as soon as it is reasonably practicable after we file them with, or furnish them to, the SEC. You may also contact our Investor Relations department which will provide you with a copy of these reports, or you may find them at www.ies-corporate.com/sec-filings. The materials that we file with the SEC are also available free of charge through the SEC’s website at www.sec.gov.
In addition to the Code of Ethics for Financial Executives, we have adopted a Code of Business Conduct and Ethics for directors, officers and employees (the Legal Compliance and Corporate Policy Manual), and established Corporate Governance Guidelines and adopted charters outlining the duties of our Audit, Human Resources and Compensation and Nominating/Governance Committees, copies of which may be found on our website. Paper copies of these documents are also available free of charge upon written request to us.
Item 1A. Risk Factors
You should consider carefully the risks described below, as well as the other information included in this document before making an investment decision. Our business, results of operations or financial condition could be materially and adversely affected by any of these risks, and the value of your investment may decrease due to any of these risks.
Risks Relating to the Operations of our Business
The Coronavirus Disease 2019 ("COVID-19") pandemic has adversely impacted, and could have a future materially adverse impact on, our business, including our financial condition, cash flows and results of operations.
The COVID-19 pandemic and its ongoing impact on markets, the supply chain, and availability of labor continue to influence trends affecting our business. We continue to experience increased prices, longer delivery times, or limited availability for certain materials necessary for our projects, notably copper, aluminum, steel, electrical components, fuel, and certain plastics.
The COVID-19 pandemic and related responses are continuing to evolve and, therefore, continue to present potential new risks to our business, particularly in light of new variants of the virus. To date, the COVID-19 pandemic has had a number of adverse impacts on our results of operations. Factors that may affect our results of operations in the future include, but are not limited to, the potential impacts of illness on our workforce, management, or Board of Directors; the shut-down of job sites; a reduced demand for our services; increases in operating costs due to disruptions, the cost of complying with vaccine or testing mandates, personal protective equipment requirements and other increased employment-related costs; potential supply chain disruptions; increased material prices; and limitations on the ability of our customers to pay us on a timely basis. We may also be more vulnerable to security breaches, cyber-attacks, computer viruses, ransomware, or other similar events, particularly with respect to employees working remotely.
We are continuing to monitor conditions affecting our business and will take actions as may be necessary to protect the health and safety of our employees and to serve our customers. The ultimate impact and the extent to which the COVID-19 pandemic will continue to affect our business, results of operations and financial condition are difficult to predict and depend on numerous evolving factors outside our control including: emergence of new variants of the virus; government, social, business and other actions that have been and will be taken in response to the pandemic; any additional waves of COVID-19 infections; the efficacy of vaccines on new variants of the virus; the effect of government or customer vaccine or testing requirements on employee retention and recruitment; and the effect of the pandemic on short- and long-term general economic conditions.
The highly competitive nature of our industries could affect our profitability by reducing our revenues or profit margins.
With respect to contracting services, the industries in which we compete are highly fragmented and are generally served by many small, owner-operated private companies. There are also several large private regional companies and a small number of large public companies from which we face competition in these industries. In the future, we could also face competition from new competitors entering these markets because certain segments, such as our electrical contracting services, have a relatively low barrier for entry while other segments, such as our services for mission critical infrastructure, have attractive growth and profitability characteristics. Some of our competitors in certain markets offer a greater range of services, including mechanical construction, facilities management, plumbing and heating, ventilation and air conditioning services. Competition in our markets depends on a number of factors, including price. Some of our competitors may have lower overhead cost structures and may, therefore, be able to provide services comparable to ours at lower rates than we do. If we are unable to offer our services at competitive prices or if we have to reduce our prices to remain competitive, our profitability would be impaired.
The markets in which Infrastructure Solutions does business are highly competitive, and we do not expect the level of competition that we face to decrease in the future. An increase in competitive pressures in these markets or our failure to compete effectively (including
12
efficiently managing future capital expenditures and refurbishment, repair and upgrade costs) may result in pricing reductions, reduced gross margins, and loss of market share. Some of our competitors have longer operating histories, greater name recognition, more customers, and significantly greater financial, marketing, technical, and other competitive resources than we have. These competitors may be able to adapt more quickly to new technologies and changes in customer needs or devote greater resources to the development, promotion, and sale of their services. While we believe Infrastructure Solutions’ overall product and service offerings distinguish it from its competitors, these competitors could develop new products or services that could directly compete with Infrastructure Solutions’ services.
We generate a significant portion of our revenues under fixed price contracts. The estimates we use in placing bids and changes in commodity and labor costs could have an adverse effect on our ability to maintain our profitability.
We currently generate, and expect to continue to generate, a significant portion of our revenues under fixed price contracts. The cost of fuel, labor and materials, including copper wire or other commodities, may vary significantly from the costs we originally estimate. Variations from estimated contract costs along with other risks inherent in performing fixed price contracts, including our ability to successfully manage projects, may result in actual revenue and gross profits for a project differing from those we originally estimated and could result in losses on projects. Depending upon the size of a particular project, variations from estimated contract costs can have a significant impact on our operating results.
If the costs associated with labor and commodities, such as copper, aluminum, steel, electrical components, fuel, and certain plastics, increase due to low supply or other forces, losses may be incurred. Some of our materials have been and may continue to be subject to sudden and significant price increases. Depending on competitive pressures and customer resistance, we may not be able to pass on these cost increases to our customers, which would reduce our gross profit margins and, in turn, make it more difficult for us to maintain our profitability. We have a work force of over 6,700 employees, and our labor costs may fluctuate based on availability of and demand for workers as well as other labor related risks, including risks related to collective bargaining agreements, benefits arrangements, wage and hour claims and other compensation arrangements.
A failure to secure new contracts may adversely affect our cash flows and financial results.
Much of our revenue is derived from projects that are awarded through a competitive bid process. Contract bidding and negotiations are affected by a number of factors, including our own cost structure and bidding policies. In addition, our ability to secure new contracts depends on our ability to maintain all required electrical, construction, mechanical and business licenses. If we fail to successfully transfer, renew or obtain such licenses where applicable, we may be unable to compete for new business. The failure to bid and be awarded projects, cancellations of projects or delays in project start dates could affect our ability to deploy our assets profitably. Further, when we are awarded contracts, we face additional risks that could affect whether, or when, work will begin. We could experience a decrease in profitability if we are unable to replace canceled, completed or expired contracts with new work.
Our inability to carry out plans and strategies as expected, including our inability to identify and complete acquisitions and investments that meet our investment criteria in furtherance of our corporate strategy or the subsequent underperformance of those acquisitions and investments, may adversely impact our future growth and profitability.
Our corporate strategy includes creating shareholder value through acquiring businesses that we believe will strategically complement our existing business segments or acquiring or investing in stand-alone platform companies based in North America. While we believe that acquisitions will provide an opportunity to expand into new or related services, products, end-markets or geographic areas and diversify our revenue and profit streams, potential acquisitions could result in changes in our operations from those historically conducted by us and introduce the requirement for new controls. Alternatively, our failure to diversify from existing markets may limit our future growth. In addition, we have made, and may continue to make, strategic investments in debt or equity securities of publicly traded and privately held companies, including early-stage companies and more established companies. We are subject to risks associated with these investments, including the inability to dispose of these investments due to lack of an active market for or contractual limitations on our ability to sell a particular investment, and the partial or complete loss of invested capital, and significant changes in the fair value of our investment portfolio could adversely impact our financial results. Further, valuations of non-marketable debt and equity investments are inherently complex due to the lack of readily available market data. In addition, our acquisitions and investments may not perform as expected or may not generate a positive return on investment due to factors we could not predict prior to the acquisition or due to incorrect investment assumptions.
13
We may be unsuccessful at integrating other companies that we may acquire, or new types of work, products or processes into our segments.
We are actively seeking to engage in acquisitions of operations, assets and investments, or to develop new types of work or processes, and we may seek to engage in dispositions of certain operations, assets or investments from time to time. If we are unable to successfully integrate newly acquired assets or operations or if we make untimely or unfavorable investments or dispositions, it could negatively impact our financial condition, results of operations and the market value of our common stock. Additionally, any future acquisition, investment or disposition may result in significant changes in the composition of our assets and liabilities, and as a result, our financial condition, results of operations and the market value of our common stock following any such acquisition, investment or disposition may be affected by factors different from those currently affecting our financial condition, results of operations and market value of our common stock.
The difficulties of integrating a business, assets or operations may include, among other things:
•geographically separated organizations and possible differences in corporate cultures and management philosophies;
•significant demands on management resources, which may distract management’s attention from day-to-day business;
•differences in the disclosure systems, compliance requirements, accounting systems, and accounting controls and procedures of the acquired company, which may interfere with our ability to make timely and accurate public disclosure; and
•the demands of managing new locations, new personnel and new lines of business acquired.
Demand for our services is cyclical and vulnerable to economic downturns affecting the industries we serve.
Demand for our services has been, and will likely continue to be, cyclical in nature and vulnerable to downturns in the general economy, as well as in the construction industry and the housing market. Many of our customers depend on the availability of credit to purchase our services or electrical and mechanical products. In the past, when the general level of economic activity has been reduced from historical levels, certain of our customers have delayed or cancelled projects or capital spending, thereby reducing our revenues and profitability. General concerns about the fundamental soundness of the economy may cause customers to defer projects, even if they have credit available to them. Prolonged uncertainties in, or the return of, constrained credit market conditions could have adverse effects on our customers, which would adversely affect our financial condition and results of operations.
Backlog may not be realized or may not result in profits.
Customers often have no obligation under our contracts to assign or release work to us, and many contracts may be terminated on short notice. Reductions in backlog due to cancellation of one or more contracts by a customer or for other reasons could significantly reduce the revenue and profit we actually receive from contracts included in backlog. In the event of a project cancellation, we may be reimbursed for certain costs, but typically have no contractual right to the total revenues reflected in our backlog.
We may fail to adequately recover on contract change orders or claims brought by us against customers.
From time to time, we may pursue claims against our customers to recover costs incurred on a project in excess of the original contract amount. Such additional costs may be incurred in connection with project delays caused by our customers or third parties, including other trades, or changes in project scope or specifications. While we generally negotiate with the customer for additional compensation, we may be unable to obtain, through negotiation, arbitration, litigation or otherwise, adequate compensation for the additional work performed or expenses incurred. The process of pursuing a claim may be lengthy, result in significant legal fees, and negatively impact our relationships with customers. Furthermore, we may be required to invest significant working capital to fund cost overruns while the resolution of a claim is pending, and our additional costs may not be recovered until the claim is resolved, if at all. Unfavorable resolution of these matters can result in a reduction of revenues and profit recognized in prior periods or the recognition of a loss, which could have a material adverse effect on our business, financial condition, results of operations and cash flows.
We may incur significant charges or be adversely impacted by the closure or sale of facilities or assets.
In the past, we incurred significant costs associated with the closure or disposition of facilities, and we expect from time to time to evaluate the need for future facility closures or dispositions of assets. If we were to elect to dispose of a substantial portion of any of our segments, facilities, or assets, the realized values of such assets could be substantially less than current book values, which would likely result in a material adverse impact on our financial results. In addition, we may have warranty claims or other unexpected liabilities from closed facilities beyond the closing date, which could adversely impact our financial returns.
The availability and cost of surety bonds affect our ability to enter into new contracts and our margins on those engagements.
Many of our customers require us to post performance and payment bonds issued by a surety. Those bonds guarantee the customer that we will perform under the terms of a contract and that we will pay subcontractors and vendors. We obtain surety bonds from two
14
primary surety providers; however, there is no commitment from these providers to guarantee our ability to issue bonds for projects as they are required. Our ability to access this bonding capacity is at the sole discretion of our surety providers. Accordingly, if we were to experience an interruption or reduction in our availability of bonding capacity, we may be unable to compete for, or work on, certain projects.
We are subject to risks associated with seasonality, adverse weather conditions, and climate change.
Our business is subject to seasonal variations in operations and demand that affect the construction business, particularly in the Residential and Commercial & Industrial segments. Adverse weather conditions, including rain, heat, ice, cold or snow may not only delay our work and contribute to project inefficiency, but may negatively impact our schedules and profitability by delaying the work of other trades on a construction site. Extreme weather conditions (such as storms, droughts, extreme heat or cold, wildfires and floods) may limit the availability of resources, increase our costs, or may cause projects to be cancelled. To the extent climate change results in an increase in extreme weather events and adverse weather conditions, the likelihood of a negative impact on our results of operations may increase.
Due to differing regional economic conditions, our results may fluctuate from period to period.
Our quarterly results may also be affected by regional economic conditions that affect the construction market. In particular, a prolonged period of weak demand in the oil and gas industry or increased regulatory restrictions on the industry could dampen the housing market in certain regions, resulting in reduced demand for the services provided by our Residential segment. Infrastructure Solutions’ revenues from industrial services may be affected by the timing of scheduled outages or capital projects at its industrial customers’ facilities, by demand for design, construction and site support of data centers, and by changes in spending in public infrastructure, power and steel markets. Industrial and rail customers may also be affected by volatility in oil prices. Accordingly, our performance in any particular quarter may not be indicative of the results that can be expected for any other quarter or for the entire year.
We may experience difficulties in managing our billings and collections.
Our billings under fixed price contracts in our contracting business are generally based upon achieving certain milestones and will only be accepted by the customer once we demonstrate those milestones have been met. If we are unable to demonstrate compliance with billing requests, or if we fail to issue a project billing, our likelihood of collection could be delayed or impaired, which, if experienced across several large projects, could have a material adverse effect on our results of operations. Further, some of our customers may be highly leveraged or may be subject to their own operating and regulatory risks, which may also limit their ability to pay.
Our operations are subject to numerous physical hazards. If an accident occurs, it could result in an adverse effect on our business.
Hazards related to our industry include, but are not limited to, electrocutions, fires, injuries involving ladders, machinery-caused injuries, mechanical failures and transportation accidents. These hazards can cause personal injury and loss of life, severe damage to or destruction of property and equipment, and suspension of operations. Our insurance does not cover all types or amounts of liabilities. In addition, if our safety record were to substantially deteriorate over time, our customers could cancel our contracts or not award us future business.
Our current insurance coverage may not be adequate, and we may not be able to obtain insurance at acceptable rates, or at all.
We maintain insurance coverage in part because some of our contracts require us to carry certain levels of insurance coverage, which is common in the industries in which we operate. Our third-party insurance is subject to deductibles for which we establish reserves. No assurance can be given that our insurance or our provisions for incurred claims and incurred but not reported claims will be adequate to cover all losses or liabilities we may incur in our operations; nor can we provide assurance that we will be able to maintain adequate insurance at reasonable rates.
15
Litigation and claims can cause unexpected losses.
In all of our businesses, we are subject to potential claims and litigation, including contractual disputes, warranty claims, and claims related to our compliance with legal and regulatory requirements. Such claims and litigation are common in the construction and electrical and mechanical maintenance businesses and may be related to contract delays, changes in the scope of work or alleged defects. There are also inherent claims and litigation risks associated with the number of people that work on construction sites and the fleet of vehicles on the road every day. In our Infrastructure Solutions businesses, we also may be subject to product liability litigation. Claims are sometimes made and lawsuits filed for amounts in excess of their value or in excess of the amounts for which they are eventually resolved. Claims and litigation normally follow a predictable course of time to resolution. However, there may be periods of time in which a disproportionate amount of our claims and litigation are concluded in the same quarter or year. If multiple matters are resolved during a given period, then the cumulative effect of these matters may be higher than the ordinary level in any one reporting period.
Latent defect litigation is normal for residential home builders in some parts of the country, as well as in certain areas of the commercial market. Any increases in our latent defect claims and litigation could place pressure on the profitability of the Residential and Commercial & Industrial segments of our business.
Disruptions to the proper functioning of our information technology systems or security breaches of our critical data, sensitive information or information technology systems could disrupt operations and cause increases in costs, decreases in revenues and/or harm to our reputation.
Our Company continues to increase its dependence on information technology systems, networks, and infrastructure to conduct our day-to-day operations and manage the way we provide services to our customers. Disruptions to our information technology systems or our failure to adequately protect critical data, sensitive information, and information technology systems could materially affect our business or result in harm to our reputation. Our critical accounting, project management, estimating, and financial information systems, some of which are third-party platforms, all rely on the proper functioning and security of our information technology environment and are critical to the successful operation of our business. We also collect and retain information about our customers, stockholders, vendors, and employees, with the expectation by such third parties being that we will adequately protect such information. Although our information technology systems, networks and infrastructure are protected through our policies, procedures and physical and software safeguards, our information technology environment is still vulnerable to natural disasters, power losses, telecommunication failures, deliberate intrusions, inadvertent user misuse or error, computer viruses, malicious code, ransomware attacks, acts of terrorism and other cyber security risks, which could cause a loss of critical data, or release of sensitive information. If critical information systems fail or are otherwise unavailable, or if sensitive information is released, we could experience reputational harm, loss of customers and revenue, loss of proprietary data, regulatory actions and scrutiny, statutory penalties, and litigation.
We have from time to time experienced cybersecurity incidents, such as ransomware attacks or unauthorized parties gaining access to our information technology systems, and privacy incidents, such as potential exposure of data. While to date such incidents have not had a material impact on our business, there can be no assurance that future incidents would not have an adverse effect on our business or reputation. Additionally, the process of integrating the information systems of the businesses we acquire is complex and exposes us to additional risk as we might not adequately identify weaknesses in the acquired business’s information systems or information handling, privacy and security policies and protocols, which could expose us to unexpected liabilities or make our own systems and data more vulnerable to attack.
We may be required to conduct environmental remediation activities, which could be expensive and inhibit the growth of our business and our ability to maintain profitability, particularly in our Infrastructure Solutions business.
We are subject to a number of environmental laws and regulations, including those concerning the handling, treatment, storage, and disposal of hazardous materials. These laws predominantly affect our Infrastructure Solutions business but may impact our other businesses. These environmental laws generally impose liability on current and former owners and operators, transporters and generators of hazardous materials for remediation of contaminated properties. We could be held liable for such contamination created not only from our own activities but also from the historical activities of companies we have acquired, or the activities of others on properties that we own or lease. There can be no assurance that the discovery of currently unknown problems or conditions will not require substantial additional expenditures. In addition, if we do not comply with these laws and regulations, we could be subject to material administrative, civil or criminal penalties, or other substantial liabilities.
Compliance with future changes in environmental laws and regulations, including those relating to climate change, could require significant expenditures.
Increasing concerns about climate change and other environmental issues may result in additional environmental regulations and restrictions, and we cannot predict the nature, scope or effect of legislation or regulatory requirements that could be imposed, or how
16
existing or future laws or regulations will be administered or interpreted. Compliance with more stringent laws or regulations, as well as more vigorous enforcement policies of the regulatory agencies, could increase the costs of projects for us or our customers, potentially resulting in reduced profitability or a reduced demand for our services, or require us to incur substantial costs of compliance.
The loss of a group or several key personnel, either at the corporate or operating level, or general labor constraints could adversely affect our business.
The loss of key personnel or the inability to hire and retain qualified employees could have an adverse effect on our business, financial condition and results of operations. Our operations depend on the continued efforts of our executive officers, senior management and management personnel at our segments. As a service organization, relationships with significant customers can be dependent on certain employees within our organization, and our ability to meet our contractual obligations to our customers and support our growth strategy may be limited by our ability to retain and train necessary personnel. We cannot guarantee that any member of management at the corporate or operating segment level will continue in their capacity for any particular period of time, and there is significant competition in our industry for managerial personnel. We have a severance plan in place that covers certain of our senior leaders; however, this plan can neither guarantee that we will not lose key employees, nor prevent them from competing against us, which is often dependent on state and local employment laws. If we lose a group of key personnel or even one key person at a segment, we may not be able to recruit suitable replacements at comparable salaries or at all, which could adversely affect our operations. Additionally, we generally do not maintain key man life insurance for members of our management.
Our business is labor intensive, and many of our operations experience a high rate of employee turnover. We also may be constrained in hiring and retaining sufficient qualified employees to support our growth strategy due to general labor shortages in our industries, including potential employee attrition in connection with government or customer COVID-19 vaccine or testing mandates. In addition, a lack of skilled labor or increased turnover rates within our employee base could lead to increased costs, such as increased overtime to meet demand and increased wage rates to attract and retain employees. Continued labor constraints may limit our ability to grow and may limit our profitability due to the impact of rising wages.
Risks Relating to our Financial Results, Financing and Liquidity
Availability of net operating losses may be reduced by a change in ownership.
A change in ownership, as defined by Internal Revenue Code Section 382, could reduce the availability of NOLs for federal and state income tax purposes. Should Tontine sell or otherwise dispose of all or a portion of its position in IES, a change in ownership could occur. A change in ownership could also result from the purchase of common stock by an existing or a new 5% shareholder as defined by Internal Revenue Code Section 382. As of September 30, 2021, we have approximately $120.2 million of federal NOLs that are available to use to offset future taxable income, including approximately $103.7 million resulting from net operating losses on which a deferred tax asset is not recorded. Should a change in ownership occur, all NOLs incurred prior to the change in ownership would be subject to limitation imposed by Internal Revenue Code Section 382, which would substantially reduce the amount of NOLs currently available to offset taxable income.
We have adopted tax positions that a taxing authority may view differently. If a taxing authority differs with our tax positions, our results may be adversely affected.
Our effective tax rate, cash paid for taxes and the availability of our NOLs are impacted by the tax positions that we have adopted. Taxing authorities may not always agree with the positions we have taken. We have established reserves for tax positions that we have determined to be less than likely to be sustained by taxing authorities. However, there can be no assurance that our results of operations will not be adversely affected in the event that disagreement over our tax positions does arise.
We have recognized deferred tax assets based upon our estimates of future taxable income, and we may recognize tax expense if there is a reduction in the statutory tax rate or if future taxable income is lower than our estimates.
As of September 30, 2021, we have a net deferred tax asset of $19.0 million on our Consolidated Balance Sheets, which includes $6.4 million attributable to NOLs. To realize the full benefit of this deferred tax asset attributable to NOLs, we must generate sufficient taxable income within the applicable carry forward period to offset against NOLs. Under GAAP, we are required to assess whether we believe the benefit of the deferred tax asset is more likely than not to be realized based on our expectation of generating sufficient future taxable income, and we are required to record a valuation allowance, or offset, against our deferred tax asset based on the portion of the deferred tax asset that we believe is not more likely than not to be realized. Any future change in the federal statutory tax rate could impact the economic benefit of the NOLs and other deferred tax assets available to us and result in a charge or benefit to adjust the book value of the deferred tax asset recorded on our Consolidated Balance Sheets.
17
If we are unable to generate sufficient taxable income in the future to utilize our NOLs, then we could be required to record valuation allowances, resulting in an increase in income tax expense and a reduction of our consolidated net income. Failure to generate sufficient taxable income in the future could also result in the inability to utilize certain NOLs before they expire.
To fund our working capital requirements, complete acquisitions and service any debt we may incur, we may require a significant amount of cash. Our ability to generate cash depends on many factors that are beyond our control.
Our ability to continue to grow our business, including through acquisitions and the funding of working capital requirements, as well as our ability to make payments on or refinance any indebtedness we may incur, will depend on our ability to generate cash in the future. This is subject to our operational performance, as well as general economic, financial, competitive, legislative, regulatory and other factors that are beyond our control.
We cannot provide assurance that our business will generate sufficient cash flow from operations or asset sales or that future borrowings will be available to us under our credit facility in an amount sufficient to enable us to complete acquisitions, to service any debt we may incur or to fund our other liquidity needs. We may need to refinance our credit facility on or before maturity. We cannot provide assurance that we will be able to refinance our credit facility on commercially reasonable terms or at all. Our inability to access capital on commercially reasonable terms could have a material adverse effect on our business.
Negative conditions in the credit and capital markets may adversely impact our ability to operate our business.
In the past, the level of demand from our customers for our services has been adversely impacted by slowdowns in our customers' industries as well as in the economy in general. A number of economic factors, including financing conditions for our customers' industries, have, in the past, adversely affected our customers and their ability or willingness to fund expenditures. Many of our customers depend on the availability of credit to help finance their capital and maintenance projects. At times, tightened availability of credit and changes in interest rates that affect the cost of construction financing and mortgages have negatively impacted the ability of existing and prospective customers to obtain sufficient financing and fund projects we might otherwise perform. As a result, our customers may defer such projects for an unknown, and perhaps lengthy, period. Any such deferrals would inhibit our growth and would adversely affect our results of operations.
In a weak economic environment, particularly in a period of restrictive credit markets, we may experience greater difficulties in collecting payments from, and negotiating change orders and/or claims with, our customers due to, among other reasons, a diminution in our ultimate customers’ access to the credit markets. If clients delay in paying or fail to pay a significant amount of our outstanding receivables, or we fail to successfully negotiate a significant portion of our change orders and/or claims with customers, it could have an adverse effect on our liquidity, results of operations, and financial position.
We have restrictions and covenants under our credit agreement and the failure to meet these covenants, including liquidity and other financial requirements, could result in a default under our credit agreement.
We may not be able to remain in compliance with the covenants in our credit agreement, including financial covenants which, among other things, require minimum levels of liquidity and require us to maintain a specified fixed charge coverage ratio as defined under our credit agreement. A failure to fulfill the terms and requirements of our credit agreement may result in a default under our credit agreement and acceleration of any indebtedness we may incur, as well as a default under one or more of our material agreements, any of which could have a material adverse effect on our ability to conduct our operations and our financial condition.
Our use of percentage-of-completion accounting could result in a reduction or elimination of previously reported profits, and we may be adversely impacted by new accounting, control and operating procedures.
A significant portion of our revenue is recognized using the percentage-of-completion method of accounting, utilizing the cost-to-cost method, which results in our recognizing contract revenues and earnings ratably over the contract term in proportion to contract costs incurred. The earnings or losses recognized on individual contracts are based on estimates of contract revenues, costs and profitability. We review our estimates of contract revenue, costs and profitability on an ongoing basis. Prior to contract completion, we may adjust our estimates on one or more occasions as a result of change orders to the original contract, collection disputes with the customer on amounts invoiced or claims against the customer for increased costs incurred by us due to customer-induced delays and other factors. Contract losses are recognized in full when determined to be probable and reasonably estimable. Although we have historically made reasonably reliable estimates of the progress towards completion of our construction contracts, the uncertainties inherent in the estimating process make it possible for actual costs to vary materially from estimates, including reductions or reversals of previously recorded revenues and profits. In addition, we may be adversely impacted by new accounting pronouncements which change our revenue recognition or other accounting practices or otherwise alter how we report our financial results, or which require that we change our control and operating procedures, which we may be unable to do in a timely manner.
18
Our reported operating results could be adversely affected as a result of goodwill impairment charges.
GAAP accounting requires that goodwill attributable to each of our reporting units be tested at least annually, or when changes in circumstance indicate the carrying value of our reporting units may not be recoverable. At September 30, 2021, we had recorded $92 million of goodwill on our Consolidated Balance Sheets. Factors that could lead to impairment of current goodwill in the future include significant adverse changes in the business climate, declines in the financial condition of our business, and actual or projected future operating results affecting the Company as a whole or affecting any particular reporting unit. On an ongoing basis, we expect to perform impairment tests at least annually as of September 30. Impairment adjustments, if any, are required to be recognized as operating expenses. We cannot assure that we will not have future impairment adjustments to our recorded goodwill.
Risks Relating to Our Common Stock
Existence of a controlling shareholder.
A majority of our outstanding common stock is owned by Tontine, and Jeffrey Gendell, founder and managing member of Tontine, serves as our Chief Executive Officer and as Chairman of our Board of Directors. Based on a Form 4 filed by Tontine with the SEC on November 18, 2021, Tontine owned approximately 56 percent of the Company’s outstanding common stock as of December 1, 2021. As a result, Tontine can control most of our affairs, including the election of our directors, who in turn appoint executive management and can control most actions requiring the approval of shareholders, including the adoption of amendments to our corporate charter and approval of any potential merger or sale of all or substantially all of the Company's assets or business segments or the Company itself. This control also gives Tontine the ability to bring matters to a shareholder vote that may not be in the best interest of our other shareholders or stakeholders. Additionally, Tontine is in the business of investing in companies and may, from time to time, acquire and hold interests in businesses that compete directly or indirectly with us or act as suppliers or customers of the Company. Pursuant to a resale shelf registration statement filed by the Company, Tontine has the ability to resell any or all of its registered shares from time to time in one or more offerings as long as the registration statement remains effective and the Company remains eligible to use it, as described further in the registration statement and in any prospectus supplement filed in connection with an offering pursuant to the shelf registration statement. Tontine’s sale of all or any portion of its shares could result in a change of control of the Company, which would trigger the change of control provisions in a number of our material agreements, including our credit agreement, bonding agreements with our sureties, and our executive severance plan, and could trigger limitations on the availability of our NOLs under Internal Revenue Code Section 382.
Our common stock has less liquidity than many other stocks listed on the Nasdaq Global Market.
Historically, the trading volume of our common stock has been relatively low when compared to other companies listed on the Nasdaq Global Market or other stock exchanges. While we have experienced increased liquidity in our stock during recent years compared with historical levels, we cannot say with certainty that a more active and liquid trading market for our common stock will continue to develop. Because of this, it may be more difficult for shareholders to sell a substantial number of shares for the same price at which shareholders could sell a smaller number of shares.
We may issue additional shares of common stock, preferred stock or convertible securities that will dilute the percentage ownership interest of existing stockholders and may dilute the book value per share of our common stock.
Our authorized capital includes 100,000,000 shares of common stock and 10,000,000 shares of preferred stock. As of September 30, 2021, we had 22,049,529 shares of common stock issued, 20,732,531 shares of common stock outstanding and no shares of preferred stock issued or outstanding. As of September 30, 2021, we had the ability to issue 817,452 shares of common stock, including upon the exercise of options, as future grants under our existing equity compensation plans.
Although we currently do not have any intention of issuing additional common stock (other than pursuant to our equity compensation plans) or preferred stock, we may do so in the future in order to meet our capital needs. Subject to applicable Nasdaq Listing Rules, our Board of Directors generally has the authority, without action by or vote of the stockholders, to issue all or part of any authorized but unissued shares of common stock or preferred stock for any corporate purpose. We may seek additional equity capital in the future as we develop our business and expand our operations. Any issuance of additional shares of common stock, preferred stock, or convertible securities will dilute the percentage ownership interest of our stockholders and may dilute the book value per share of our common stock.
19
Substantial sales of our common stock could adversely affect our stock price.
Most of Tontine's shares are registered for resale on a resale shelf registration statement filed by the Company with the SEC. Sales of a substantial number of shares of our common stock by holders of our common stock, including Tontine, or the perception that such sales could occur, could adversely affect the market price of our common stock by introducing a large number of shares into the market. Such sales, or the perception that such sales could occur, could cause the market price of our common stock to decline. We cannot predict whether future sales of our common stock, or the availability of our common stock for sale, will adversely affect the market price for our common stock or our ability to raise capital by offering equity securities.
Increasing scrutiny and changing expectations from investors and customers with respect to our environmental, social and governance practices may impose additional costs on us or expose us to reputational or other risks.
Investors have increased their emphasis on the environmental, social and governance ("ESG") practices of companies across all industries, including the environmental impact of operations and human capital management. Certain stockholders use third-party benchmarks or scores to measure a company’s ESG practices and decide whether to invest in its common stock or engage with the company to require changes to its practices. In addition, our customers may evaluate our ESG practices or require that we adopt certain ESG policies as a condition of awarding contracts.
A failure to comply with investor or customer expectations and standards, which are evolving and vary considerably, or the perception that we have not responded appropriately to the growing concern for ESG issues, could result in reputational harm to our business and could have an adverse effect on us.
In addition, organizations that provide ratings information to investors on ESG matters may assign unfavorable ratings to IES or our industries, which may lead to negative investor sentiment and the diversion of investment capital to other companies or industries, which could have a negative impact on our stock price and our costs of capital.
Our bylaws designate the Court of Chancery of the State of Delaware as the sole and exclusive forum for certain types of actions and proceedings that may be initiated by our shareholders, which could increase the costs for our shareholders to bring claims, discourage our shareholders from bringing claims, or limit our shareholders’ ability to obtain a favorable judicial forum for disputes with us or our current or former directors, officers, employees or shareholders in such capacity.
In April 2021, we amended our bylaws to provide that, unless we consent in writing to the selection of an alternative forum, the Court of Chancery of the State of Delaware will, to the fullest extent permitted by law, be the sole and exclusive forum for claims, including derivative claims that are based upon a violation of a duty by a current or former director, officer, employee or shareholder in such capacity or as to which the Delaware General Corporation Law confers jurisdiction upon the Court of Chancery. The exclusive forum provision may increase the costs for a shareholder to bring a claim or limit a shareholder’s ability to bring a claim in a judicial forum that the shareholder finds favorable for disputes with us or our directors, officers, employees or shareholders in such capacity, which may discourage such lawsuits against us and such persons. Alternatively, if a court were to find these provisions of our bylaws inapplicable to, or unenforceable in respect of, the claims as to which they are intended to apply, then we may incur additional costs associated with resolving such matters in other jurisdictions, which could adversely affect our business, financial position or results of operations. While the exclusive forum provision applies to state and federal law claims, our shareholders will not be deemed to have waived our compliance with, and the exclusive forum provision will not preclude or contract the scope of exclusive federal or concurrent jurisdiction for actions brought under, the federal securities laws, including the Securities Exchange Act of 1934, as amended, or the Securities Act of 1933, as amended, and the rules and regulations promulgated thereunder.
General Risks
Our internal controls over financial reporting and our disclosure controls and procedures may not prevent all possible errors that could occur. Internal controls over financial reporting and disclosure controls and procedures, no matter how well designed and operated, can provide only reasonable, not absolute, assurance that the control system’s objective will be met.
On a quarterly basis, we evaluate our internal controls over financial reporting and our disclosure controls and procedures, which include a review of the objectives, design, implementation and effectiveness of the controls and the information generated for use in our periodic reports. In the course of our controls evaluation, we sought (and seek) to identify data errors, control problems and to confirm that appropriate corrective actions, including process improvements, are being undertaken. This type of evaluation is conducted on a quarterly basis so that the conclusions concerning the effectiveness of our controls can be reported in our periodic reports.
A control system, no matter how well designed and operated, can provide only reasonable, not absolute, assurance that the control system’s objectives will be satisfied. Internal controls over financial reporting and disclosure controls and procedures are designed to
20
give reasonable assurance that they are effective and achieve their objectives. We cannot provide absolute assurance that all possible future control issues have been detected. These inherent limitations include the possibility that our judgments can be faulty and that isolated breakdowns can occur because of human error or mistake. The design of our system of controls is based in part upon certain assumptions about the likelihood of future events, and there can be no assurance that any design will succeed absolutely in achieving our stated goals under all potential future or unforeseeable conditions. Because of the inherent limitations in a cost-effective control system, misstatements due to error could occur without being detected.
Item 1B. Unresolved Staff Comments
None.
Item 2. Properties
At September 30, 2021, we maintained branch offices, warehouses, sales facilities and administrative offices at 99 locations. Substantially all of our facilities are leased. We lease our executive office located in Greenwich, Connecticut and our corporate office located in Houston, Texas. We believe that our properties are adequate for our current needs and that suitable additional or replacement space will be available as required. For a breakdown of our offices by segment, see Item 1. “Business —Operating Segments” of this Annual Report on Form 10-K.
Item 3. Legal Proceedings
For further information regarding legal proceedings, see Note 18, “Commitments and Contingencies — Legal Matters” in the notes to our Consolidated Financial Statements.
Item 4. Mine Safety Disclosures
None.
21
PART II
Item 5. Market for Registrant’s Common Equity; Related Stockholder Matters and Issuer Purchases of Equity Securities
Our common stock trades on the Nasdaq Global Market under the ticker symbol “IESC.”
As of December 1, 2021, the closing market price of our common stock was $48.21 per share and there were approximately 324 holders of record.
We have never declared or paid dividends on our common stock. We intend to retain any future earnings and do not expect to pay cash dividends in the foreseeable future.
Stock Repurchase Program
In 2015, our Board of Directors authorized a stock repurchase program for the purchase from time to time of up to 1.5 million shares of the Company’s common stock, and on May 2, 2019, authorized the repurchase from time to time of up to an additional 1.0 million shares of the Company's common stock under the stock repurchase program. Share purchases are made for cash in open market transactions at prevailing market prices or in privately negotiated transactions or otherwise. The timing and amount of purchases under the program are determined based upon prevailing market conditions, our liquidity requirements, contractual restrictions and other factors. All or part of the repurchases may be implemented under a Rule 10b5-1 trading plan, which allows repurchases under pre-set terms at times when the Company might otherwise be prevented from purchasing under insider trading laws or because of self-imposed blackout periods. The program does not require the Company to purchase any specific number of shares and may be modified, suspended or reinstated at any time at the Company’s discretion and without notice. During the year ended September 30, 2021, we repurchased 124,205 shares of common stock at an average price of $44.40 per share for a total aggregate purchase price of $5.5 million. The Company had 869,620 shares remaining under its stock repurchase authorization at September 30, 2021.
The following table presents information with respect to purchases of common stock by the Company during the three months ended September 30, 2021:
| Period | Total Number of Shares Purchased | Average Price Paid Per Share | Total Number of Shares Purchased as Part of a Publicly Announced Plan | Maximum Number of Shares That May Yet Be Purchased Under the Publicly Announced Plan as of September 30, 2021 | ||||||||||
| July 1, 2021 – July 31, 2021 | — | $— | — | 993,825 | ||||||||||
| August 1, 2021 – August 31, 2021 | 2,005 | $47.84 | 2,005 | 991,820 | ||||||||||
| September 1, 2021 – September 30, 2021 | 122,200 | $44.34 | 122,200 | 869,620 | ||||||||||
| Total | 124,205 | $44.40 | 124,205 | 869,620 | ||||||||||
Five-Year Stock Performance Graph
The graph below compares the cumulative five year total return provided shareholders on IES Holdings, Inc.'s common stock relative to the cumulative total returns of the Russell 2000 index, a customized peer group of four companies that includes Comfort Systems USA Inc., MYR Group Inc., Sterling Construction Company Inc. and Team Inc. (the "Peer Group (Old)") and a revised customized peer group of four companies that includes: Comfort Systems USA Inc., MYR Group Inc., Sterling Construction Company Inc. and Primoris (the "Peer Group (New)"). The change from the Peer Group (Old) to the Peer Group (New) is being made to better reflect companies relevant to the Company's current business. An investment of $100 (with reinvestment of all dividends) is assumed to have been made in our common stock, in the Russell 2000 index, and in the two peer groups on September 30, 2016, and its relative performance is tracked through September 30, 2021.
22
Comparison of Five Year Cumulative Total Return*
Among IES Holdings, Inc., the Russell 2000 Index, and a Peer Group
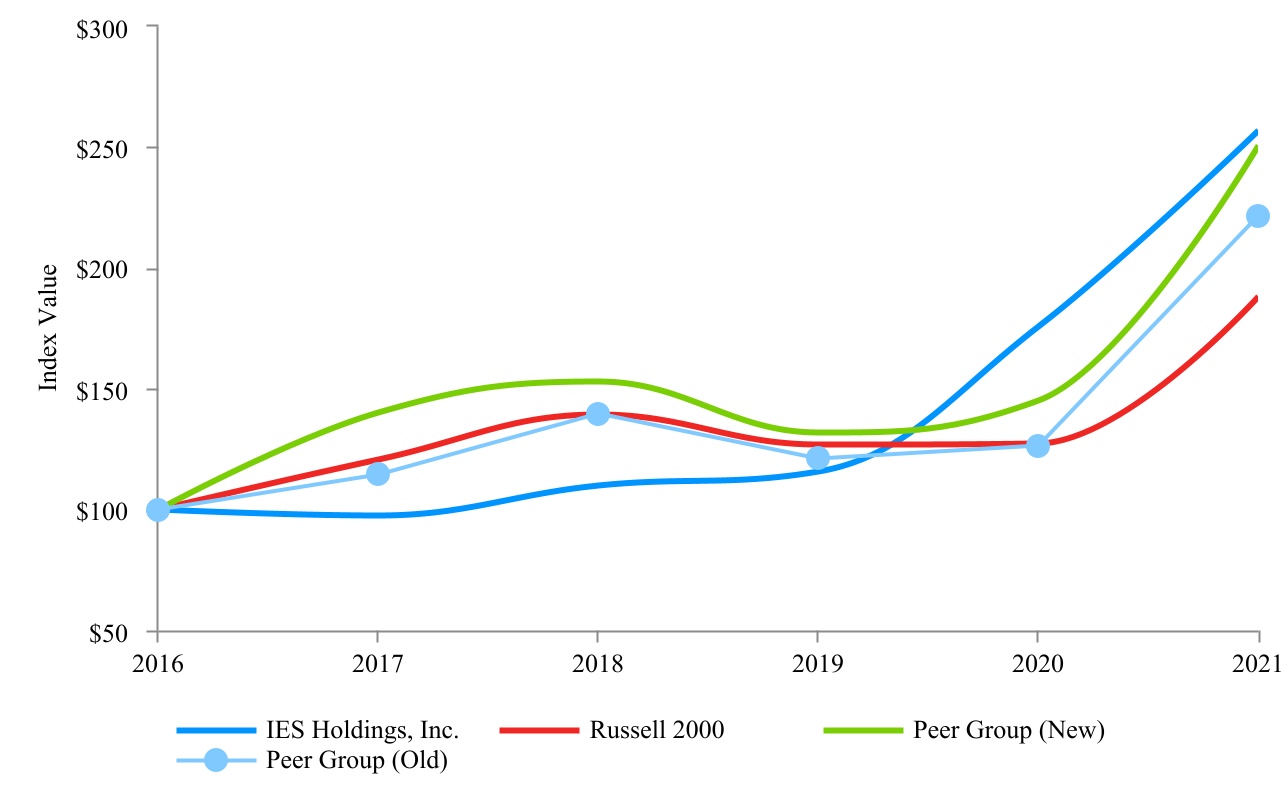
*$100 invested on 9/30/16 in stock or index, including reinvestment of dividends.
Fiscal year ending September 30.
| Year Ended September 30, | |||||||||||||||||||||||||||||||||||
| 2016 | 2017 | 2018 | 2019 | 2020 | 2021 | ||||||||||||||||||||||||||||||
| IES Holdings, Inc. | $ | 100.00 | 97.25 | 109.61 | 115.74 | 175.58 | 256.83 | ||||||||||||||||||||||||||||
| Russell 2000 | 100.00 | 120.74 | 139.14 | 126.77 | 127.27 | 187.95 | |||||||||||||||||||||||||||||
| Peer Group (Old) | 100.00 | 114.32 | 139.42 | 120.88 | 126.25 | 221.50 | |||||||||||||||||||||||||||||
| Peer Group (New) | 100.00 | 140.13 | 152.89 | 131.61 | 144.91 | 250.50 | |||||||||||||||||||||||||||||
Item 7. Management’s Discussion and Analysis of Financial Condition and Results of Operations
The following discussion and analysis should be read in conjunction with our Consolidated Financial Statements and the notes thereto, set forth in Item 8.“Financial Statements and Supplementary Data” of this Annual Report on Form 10-K. For additional information, see “Disclosure Regarding Forward Looking Statements” in Part I of this Annual Report on Form 10-K.
OVERVIEW
Executive Overview
Please refer to Item 1. “Business” of this Annual Report on Form 10-K for a discussion of the Company’s services and corporate strategy. IES Holdings, Inc., a Delaware corporation, designs and installs integrated electrical and technology systems and provides infrastructure products and services to a variety of end markets, including data centers, residential housing, and commercial and industrial facilities. Our operations are organized into four principal business segments: Communications, Residential, Infrastructure Solutions and Commercial & Industrial.
23
Industry Trends
Our performance is affected by a number of trends that drive the demand for our services. In particular, the markets in which we operate are exposed to many regional and national trends such as the demand for single and multi-family housing, the need for mission critical facilities as a result of technology-driven advancements, the degree to which in-house maintenance departments outsource maintenance and repair work, demand for back-up power, output levels and equipment utilization at heavy industrial facilities, demand for our rail and infrastructure services and custom engineered products, and changes in commercial, institutional, public infrastructure and electric utility spending. Over the long term, we believe that there are numerous factors that could positively drive demand and affect growth within the industries in which we operate, including (i) population growth, which will increase the need for commercial and residential facilities, (ii) aging public infrastructure, which must be replaced or repaired, (iii) an increasing demand for data storage, and (iv) increased emphasis on environmental and energy efficiency, which may lead to increased public and private spending. However, there can be no assurance that we will not experience a decrease in demand for our services due to economic, technological or other factors beyond our control, including weakness in the oil and gas sector, interest rate changes, increases in copper, aluminum, steel, fuel, electrical components, certain plastics, and other commodity prices and other economic factors, which may reduce the demand for housing in the regions where our Residential division operates, and may impact levels of construction. For a further discussion of the industries in which we operate, please see Item 1. “Business - Operating Segments” of this Annual Report on Form 10-K.
Business Outlook
While there are differences among the Company’s segments, on an overall basis, increased demand for the Company’s services and the Company’s previous investment in growth initiatives and other business-specific factors discussed below resulted in aggregate year-over-year revenue growth in fiscal 2021 as compared to fiscal 2020. In addition, revenue growth during fiscal 2021 at our Residential and Infrastructure Solutions segments reflects the contribution of acquisitions completed during fiscal 2021.
Provided that no significant deterioration in general economic conditions occurs, the Company expects total revenues from existing businesses to increase on a year-over-year basis during fiscal 2022 due to an increase in overall demand for the services we provide, efforts to increase our market share, and current backlog levels. We remain focused on controlled growth within many of our markets, which continue to experience highly competitive margins and increasing costs.
To continue to grow our business, including through acquisitions and the funding of working capital, we may require a significant amount of cash. Our ability to generate cash depends on many externally influenced factors, including demand for our services, the availability of projects at margins acceptable to us, the ultimate collectability of our receivables, our ability to borrow on our credit facility, and our ability to raise funds in the capital markets, among many other factors. We anticipate that the combination of cash on hand, cash flows from operations and available capacity under our credit facility will provide sufficient cash to enable us to meet our working capital needs, debt service requirements and capital expenditures for property and equipment through the next 12 months. We expect our capital expenditures, including the expected expansion and improvement of certain of our operating facilities in fiscal 2022, will range from $30.0 million to $35.0 million for the year ending on September 30, 2022.
Impact of COVID-19 on Our Business
The COVID-19 pandemic and its ongoing impact on markets and the supply chain continue to influence trends affecting our business. We are seeing indicators that some of our customers that delayed projects or reduced operations during the pandemic are resuming normal levels of activity. However, we continue to experience elevated prices or limited availability for certain materials necessary for our projects, notably copper, aluminum, steel, fuel, electrical components, and certain plastics.
The COVID-19 pandemic and related responses are continuing to evolve and, therefore, continue to present potential new risks to our business, particularly in light of new variants of the virus. To date, the COVID-19 pandemic has had a number of adverse impacts on our results of operations. We continue to monitor and implement evolving health and safety protocols, including vaccine or testing mandates imposed by either governmental entities or our customers and the prohibitions on vaccine mandates adopted by certain of the states in which we operate that may conflict with federal vaccine mandates. Factors that we expect will continue to affect our results of operations in the future include, but are not limited to, the potential impacts on our workforce of either illness or the shut-down of job sites; the impact of government or customer vaccine or testing mandates on employee recruiting and retention; a reduced demand for our services; increases in operating costs due to disruptions, personal protective equipment requirements and other increased employment-related costs; supply chain disruptions; increased material prices; and limitations on the ability of our customers to pay us on a timely basis. We may also be more vulnerable to security breaches, cyber-attacks, computer viruses, ransomware, or other similar events, particularly with respect to employees working remotely.
We are continuing to monitor conditions affecting our business and will take actions as may be necessary to protect the health and safety of our employees and to serve our customers. The ultimate impact and the extent to which the COVID-19 pandemic will
24
continue to affect our business, results of operations and financial condition are difficult to predict and depend on numerous evolving factors outside our control including: emergence of new variants of the virus; government, social, business and other actions that have been and will be taken in response to the pandemic; any additional waves of COVID-19 infections; vaccine efficacy on new variants of the virus; the impact of government or customer vaccine or testing mandates on employee recruiting and retention; and the effect of the pandemic on short- and long-term general economic conditions.
We are continuing to experience elevated prices for commodities such as copper and steel, as well as electrical components. Some materials, such as certain plastics, have also become more difficult to procure due to increased demand or limited availability. We seek to mitigate supply chain risk by maintaining relationships with multiple vendors, and to recoup higher materials costs through adjusted pricing. However, we may not be able to pass on all increased costs, and our suppliers may be unable to provide the materials we require. An inability to procure materials in a timely manner, or to reflect higher materials costs in our pricing to customers, could result in a loss of revenue or lower profit margins, and could have a significant impact on our operating results. Please refer to Part I. Item 1A. "Risk Factors" of this Annual Report on Form 10-K for further information.
RESULTS OF OPERATIONS
We report our operating results across our four operating segments: Communications, Residential, Infrastructure Solutions and Commercial & Industrial. Expenses associated with our corporate office are classified separately. The following table presents selected historical results of operations of IES, as well as the results of acquired businesses from the dates acquired.
| Year Ended September 30, | |||||||||||||||||||||||||||||||||||||||||
| 2021 | 2020 | 2019 | |||||||||||||||||||||||||||||||||||||||
| $ | % | $ | % | $ | % | ||||||||||||||||||||||||||||||||||||
| (Dollars in thousands, Percentage of revenues) | |||||||||||||||||||||||||||||||||||||||||
| Revenues | $ | 1,536,493 | 100.0 | % | $ | 1,190,856 | 100.0 | % | $ | 1,076,996 | 100.0 | % | |||||||||||||||||||||||||||||
| Cost of services | 1,248,495 | 81.3 | % | 962,897 | 80.9 | % | 894,893 | 83.1 | % | ||||||||||||||||||||||||||||||||
| Gross profit | 287,998 | 18.7 | % | 227,959 | 19.1 | % | 182,103 | 16.9 | % | ||||||||||||||||||||||||||||||||
| Selling, general and administrative expenses | 202,251 | 13.2 | % | 170,911 | 14.4 | % | 140,575 | 13.1 | % | ||||||||||||||||||||||||||||||||
| Goodwill impairment expense | — | — | % | 6,976 | 0.7 | % | — | — | % | ||||||||||||||||||||||||||||||||
| Contingent consideration | 211 | — | % | (11) | — | % | (374) | — | % | ||||||||||||||||||||||||||||||||
| Loss (gain) on sale of assets | (47) | — | % | — | — | % | 52 | — | % | ||||||||||||||||||||||||||||||||
| Operating income | 85,583 | 5.6 | % | 50,083 | 4.2 | % | 41,850 | 3.9 | % | ||||||||||||||||||||||||||||||||
| Interest and other expense, net | 676 | — | % | 789 | 0.1 | % | 1,709 | 0.2 | % | ||||||||||||||||||||||||||||||||
| Operating income before income taxes | 84,907 | 5.5 | % | 49,294 | 4.1 | % | 40,141 | 3.7 | % | ||||||||||||||||||||||||||||||||
| Provision for income taxes | 16,231 | 1.1 | % | 8,740 | 0.7 | % | 6,663 | 0.6 | % | ||||||||||||||||||||||||||||||||
| Net income | 68,676 | 4.5 | % | 40,554 | 3.4 | % | 33,478 | 3.1 | % | ||||||||||||||||||||||||||||||||
| Net (income) loss attributable to noncontrolling interest | (2,018) | (0.1) | % | 1,045 | 0.1 | % | (272) | — | % | ||||||||||||||||||||||||||||||||
| Net income attributable to IES Holdings, Inc. | $ | 66,658 | 4.3 | % | $ | 41,599 | 3.5 | % | $ | 33,206 | 3.1 | % | |||||||||||||||||||||||||||||
2021 Compared to 2020
Consolidated revenues for the year ended September 30, 2021, were $345.6 million higher than for the year ended September 30, 2020, an increase of 29.0% with increases across all segments, driven by strong demand and the contribution of acquired businesses.
Our overall gross profit percentage decreased to 18.7% during the year ended September 30, 2021, as compared to 19.1% during the year ended September 30, 2020. Gross profit as a percentage of revenue increased at our Infrastructure Solutions and Commercial & Industrial segments, but decreased at our Communications and Residential segments. See further discussion below of changes in gross margin for our individual segments.
Selling, general and administrative expenses include costs not directly associated with performing work for our customers. These costs consist primarily of compensation and benefits related to corporate, business segment and branch management (including incentive-based compensation), occupancy and utilities, training, professional services, information technology costs, consulting fees, travel and certain types of depreciation and amortization. We allocate certain corporate selling, general and administrative costs across our segments as we believe this more accurately reflects the costs associated with operating each segment.
25
During the year ended September 30, 2021, our selling, general and administrative expenses were $202.3 million, an increase of $31.3 million, or 18.3% over the year ended September 30, 2020, driven by increased personnel costs at our Communications and Residential operating segments in connection with their growth, increased incentive compensation in connection with improved results at those segments, and the impact of businesses acquired during fiscal 2021. Selling, general and administrative expenses as a percentage of revenue decreased to 13.2% for the year ended September 30, 2021 from 14.4% for the year ended September 30, 2020.
As described below, for the year ended September 30, 2020, we recognized a non-cash goodwill impairment charge of $7.0 million relating to our Commercial & Industrial segment.
2020 Compared to 2019
Consolidated revenues for the year ended September 30, 2020, were $113.9 million higher than for the year ended September 30, 2019, an increase of 10.6% with increases at our Communications and Residential segments, driven by strong demand.
Our overall gross profit percentage increased to 19.1% during the year ended September 30, 2020, as compared to 16.9% during the year ended September 30, 2019. Gross profit as a percentage of revenue increased at our Communications, Infrastructure Solutions and Residential segments but decreased at our Commercial & Industrial segment, as discussed in further detail with respect to each segment below.
During the year ended September 30, 2020, our selling, general and administrative expenses were $170.9 million, an increase of $30.3 million, or 21.6% over the year ended September 30, 2019, driven by increased personnel costs at our operating segments in connection with their growth, as well as an increase in certain selling, general and administrative expenses at our Commercial & Industrial segment as described below. This increase also includes a $1.8 million increase in expenses at the corporate level, primarily related to a severance payment to our former CEO, who stepped down in July 2020. As a percentage of revenue, selling, general and administrative expenses increased to 14.4% for the year ended September 30, 2020 from 13.1% for the year ended September 30, 2019.
For the year ended September 30, 2020, we recognized a non-cash goodwill impairment charge of $7.0 million relating to our Commercial & Industrial segment.
Communications
2021 Compared to 2020
| Year Ended September 30, | |||||||||||||||||||||||
| 2021 | 2020 | ||||||||||||||||||||||
| $ | % | $ | % | ||||||||||||||||||||
| (Dollars in thousands, Percentage of revenues) | |||||||||||||||||||||||
| Revenues | $ | 445,968 | 100.0 | % | $ | 395,141 | 100.0 | % | |||||||||||||||
| Cost of services | 361,197 | 81.0 | % | 317,013 | 80.2 | % | |||||||||||||||||
| Gross Profit | 84,771 | 19.0 | % | 78,128 | 19.8 | % | |||||||||||||||||
| Selling, general and administrative expenses | 41,373 | 9.3 | % | 37,674 | 9.5 | % | |||||||||||||||||
| (Gain)/Loss on sale of assets | (4) | — | % | 8 | — | % | |||||||||||||||||
| Operating Income | 43,402 | 9.7 | % | 40,446 | 10.2 | % | |||||||||||||||||
Revenue. Our Communications segment’s revenues increased by $50.8 million, or 12.9%, during the year ended September 30, 2021, compared to the year ended September 30, 2020. This increase primarily resulted from increased demand from our data center and distribution center customers. Revenues in our Communications segment can vary from period to period based on the capital spending cycles of our customers.
Gross Profit. Our Communications segment’s gross profit during the year ended September 30, 2021, increased $6.6 million, or 8.5%, as compared to the year ended September 30, 2020. Gross profit as a percentage of revenue decreased from 19.8% for the year ended September 30, 2020 to 19.0% for the year ended September 30, 2021, as we invested in hiring and training personnel, particularly in estimating and project management, to grow the business. Additionally, during the fourth fiscal quarter of 2020, we benefited from some larger than typical efficiency gains from strong project execution.
Selling, General and Administrative Expenses. Our Communications segment’s selling, general and administrative expenses increased $3.7 million, or 9.8% during the year ended September 30, 2021, as compared to the year ended September 30, 2020. The increase
26
was a result of higher personnel cost, particularly related to continuing investment to support the growth of the business, along with higher incentive compensation expense in connection with improved profitability and cash flows. Selling, general and administrative expenses as a percentage of revenues in the Communications segment decreased from 9.5% for the year ended September 30, 2020 to 9.3% of segment revenue during the year ended September 30, 2021, as we benefited from the increased scale of our operations.
2020 Compared to 2019
| Year Ended September 30, | |||||||||||||||||||||||
| 2020 | 2019 | ||||||||||||||||||||||
| $ | % | $ | % | ||||||||||||||||||||
| (Dollars in thousands, Percentage of revenues) | |||||||||||||||||||||||
| Revenues | $ | 395,141 | 100.0 | % | $ | 321,246 | 100.0 | % | |||||||||||||||
| Cost of services | 317,013 | 80.2 | % | 264,746 | 82.4 | % | |||||||||||||||||
| Gross Profit | 78,128 | 19.8 | % | 56,500 | 17.6 | % | |||||||||||||||||
| Selling, general and administrative expenses | 37,674 | 9.5 | % | 31,850 | 9.9 | % | |||||||||||||||||
| Contingent consideration | — | — | % | (97) | — | % | |||||||||||||||||
| (Gain)/Loss on sale of assets | 8 | — | % | (6) | — | % | |||||||||||||||||
| Operating Income | 40,446 | 10.2 | % | 24,753 | 7.7 | % | |||||||||||||||||
Revenue. Our Communications segment’s revenues increased by $73.9 million, or 23.0%, during the year ended September 30, 2020, compared to the year ended September 30, 2019. This increase primarily resulted from increased demand from our data center and distribution center customers. Revenues in our Communications segment can vary from period to period based on the capital spending cycles of our customers.
Gross Profit. Our Communications segment’s gross profit during the year ended September 30, 2020, increased $21.6 million, or 38.3%, as compared to the year ended September 30, 2019. Gross profit as a percentage of revenue increased to 19.8% from 17.6% for the year ended September 30, 2020, as we took on a larger proportion of fixed-cost arrangements and we benefited efficiency gains from strong project execution.
Selling, General and Administrative Expenses. Our Communications segment’s selling, general and administrative expenses increased $5.8 million, or 18.3% during the year ended September 30, 2020, as compared to the year ended September 30, 2019. The increase was a result of higher personnel cost, particularly related to continuing investment to support the growth of the business, along with higher incentive compensation in connection with improved profitability and cash flows. Selling, general and administrative expenses as a percentage of revenues in the Communications segment decreased from 9.9% for the year ended September 30, 2019 to 9.5% of segment revenue during the year ended September 30, 2020, as we benefited from the increased scale of our operations, as well as a temporary reduction in travel expense.
Residential
2021 Compared to 2020
| Year Ended September 30, | |||||||||||||||||||||||
| 2021 | 2020 | ||||||||||||||||||||||
| $ | % | $ | % | ||||||||||||||||||||
| (Dollars in thousands, Percentage of revenues) | |||||||||||||||||||||||
| Revenues | $ | 687,347 | 100.0 | % | $ | 411,790 | 100.0 | % | |||||||||||||||
| Cost of services | 553,546 | 80.5 | % | 318,034 | 77.2 | % | |||||||||||||||||
| Gross Profit | 133,801 | 19.5 | % | 93,756 | 22.8 | % | |||||||||||||||||
| Selling, general and administrative expenses | 92,761 | 13.5 | % | 63,668 | 15.5 | % | |||||||||||||||||
| Contingent consideration | 211 | — | % | — | — | % | |||||||||||||||||
| Loss on sale of assets | 86 | — | % | 2 | — | % | |||||||||||||||||
| Operating Income | 40,743 | 5.9 | % | 30,086 | 7.3 | % | |||||||||||||||||
Revenue. Our Residential segment’s revenues increased by $275.6 million, or 66.9%, during the year ended September 30, 2021, as compared to the year ended September 30, 2020, reflecting the revenue contribution of businesses acquired in fiscal 2021, strong demand for single-family and multi-family housing and the impact of price increases in connection with a higher cost of materials. We
27
acquired K.E.P. Electric, Inc. (“KEP”), Bayonet Plumbing, Heating & Air-Conditioning, LLC ("Bayonet"), and Edmonson Electric, LLC ("Edmonson") during the year ended September 30, 2021. Collectively, these acquired businesses contributed $172.6 million of revenue for the year ended September 30, 2021. Inclusive of these acquired businesses, revenue in our single-family business increased by $215.3 million for the year ended September 30, 2021, compared to the year ended September 30, 2020, while multi-family and other revenue increased by $60.2 million. Excluding the impact of the businesses acquired during fiscal 2021, our Residential segment's revenues grew by 25.0% for the year ended September 30, 2021.
Gross Profit. During the year ended September 30, 2021, our Residential segment experienced a $40.0 million, or 42.7%, increase in gross profit as compared to the year ended September 30, 2020. The increase in gross profit was driven primarily by $27.9 million contributed by the businesses acquired in fiscal 2021, as well as higher volumes, partly offset by increased commodity prices. Gross margin as a percentage of revenue decreased from 22.8% for the year ended September 30, 2020 to 19.5% during the year ended September 30, 2021, primarily as a result of higher commodity prices.
Selling, General and Administrative Expenses. Our Residential segment's selling, general and administrative expenses increased $29.1 million, or 45.7%, during the year ended September 30, 2021, compared to the year ended September 30, 2020. Selling, general and administrative expenses incurred at the businesses acquired during fiscal 2021, including amortization of intangible assets, contributed $20.1 million of the increase. The remaining increase was driven by higher personnel cost in connection with business growth, including incentive profit sharing for division management. Selling, general and administrative expenses as a percentage of revenues in the Residential segment decreased from 15.5% during the year ended September 30, 2020 to 13.5% during the year ended September 30, 2021, as we benefited from the increased scale of our operations.
2020 Compared to 2019
| Year Ended September 30, | |||||||||||||||||||||||
| 2020 | 2019 | ||||||||||||||||||||||
| $ | % | $ | % | ||||||||||||||||||||
| (Dollars in thousands, Percentage of revenues) | |||||||||||||||||||||||
| Revenues | $ | 411,790 | 100.0 | % | $ | 313,336 | 100.0 | % | |||||||||||||||
| Cost of services | 318,034 | 77.2 | % | 248,562 | 79.3 | % | |||||||||||||||||
| Gross Profit | 93,756 | 22.8 | % | 64,774 | 20.7 | % | |||||||||||||||||
| Selling, general and administrative expenses | 63,668 | 15.5 | % | 46,864 | 15.0 | % | |||||||||||||||||
| (Gain)/Loss on sale of assets | 2 | — | % | (17) | — | % | |||||||||||||||||
| Operating Income | 30,086 | 7.3 | % | 17,927 | 5.7 | % | |||||||||||||||||
Revenue. Our Residential segment’s revenues increased by $98.5 million, or 31.4%, during the year ended September 30, 2020, as compared to the year ended September 30, 2019. The increase was driven by increases in our single-family business, where revenues increased by $26.8 million, and our multi-family businesses, where revenues excluding those provided by current year business acquisitions, increased by $61.0 million for the year ended September 30, 2020, compared with the year ended September 30, 2019. In February 2020, we acquired Aerial Lighting & Electric, Inc., ("Aerial") which contributed $9.3 million in revenue during the year ended September 30, 2020 subsequent to our acquisition of the business.
Gross Profit. During the year ended September 30, 2020, our Residential segment experienced a $29.0 million, or 44.7%, increase in gross profit as compared to the year ended September 30, 2019. The increase in gross profit was driven primarily by higher volumes and improved commodity prices. Gross margin as a percentage of revenue increased from 20.7% to 22.8% during the year ended September 30, 2020, as compared with the year ended September 30, 2019, as we benefited from improved commodity prices and the increased scale of our operations. Our newly acquired Aerial business contributed $1.7 million in gross profit during the year ended September 30, 2020 subsequent to our acquisition of the business.
Selling, General and Administrative Expenses. Our Residential segment experienced a $16.8 million, or 35.9%, increase in selling, general and administrative expenses during the year ended September 30, 2020, compared to the year ended September 30, 2019. This increase was driven by increased compensation expense in connection with a growing business, including both incentive profit sharing for division management and increased headcount, as well as $2.3 million in selling, general and administrative expenses incurred at Aerial during the year ended September 30, 2020 subsequent to our acquisition of the business, including amortization of intangible assets. Selling, general and administrative expenses as a percentage of revenues in the Residential segment increased from 15.0% to 15.5% of segment revenue during the year ended September 30, 2020.
28
Infrastructure Solutions
2021 Compared to 2020
| Year Ended September 30, | |||||||||||||||||||||||
| 2021 | 2020 | ||||||||||||||||||||||
| $ | % | $ | % | ||||||||||||||||||||
| (Dollars in thousands, Percentage of revenues) | |||||||||||||||||||||||
| Revenues | $ | 100.0 | % | $ | 100.0 | % | |||||||||||||||||
| Cost of services | 72.2 | % | 72.7 | % | |||||||||||||||||||
| Gross Profit | 27.8 | % | 27.3 | % | |||||||||||||||||||
| Selling, general and administrative expenses | 16.3 | % | 15.9 | % | |||||||||||||||||||
| (Gain)/Loss on sale of assets | ( | — | % | — | % | ||||||||||||||||||
| Operating Income | 11.5 | % | 11.3 | % | |||||||||||||||||||
Revenue. Revenues in our Infrastructure Solutions segment increased by $18.6 million, or 14.5% during the year ended September 30, 2021 compared to the year ended September 30, 2020. Increased demand for our custom power solutions was partially offset by lower revenue from our industrial services business. The demand for our motor repair services continues to be affected by reduced demand from customers in the steel and rail industries. During the year ended September 30, 2021, we acquired Wedlake Fabricating, Inc. (“Wedlake”), which contributed $7.1 million of revenue for the year ended September 30, 2021.
Gross Profit. Our Infrastructure Solutions segment’s gross profit for the year ended September 30, 2021, increased by $5.9 million, as compared to the year ended September 30, 2020, reflecting improved overall operational efficiencies. Gross profit as a percent of revenue increased to 27.8% for the year ended September 30, 2021 compared to 27.3% for the year ended September 30, 2020, largely as the result of those efficiencies, as management has continued to focus on procurement, engineering, and quality.
Selling, General and Administrative Expenses. Our Infrastructure Solutions segment’s selling, general and administrative expenses during the year ended September 30, 2021, increased $3.5 million compared to the year ended September 30, 2020. The increase in fiscal 2021 includes $1.6 million of expenses incurred, including amortization of intangible assets, at our newly acquired Wedlake business. The selling, general and administrative expenses as a percentage of revenue increased from 15.9% for the year ended September 30, 2020, to 16.3% for the year ended September 30, 2021, primarily as a result of the increase in expenses, including amortization expense, related to Wedlake.
2020 Compared to 2019
| Year Ended September 30, | |||||||||||||||||||||||
| 2020 | 2019 | ||||||||||||||||||||||
| $ | % | $ | % | ||||||||||||||||||||
| (Dollars in thousands, Percentage of revenues) | |||||||||||||||||||||||
| Revenues | $ | 100.0 | % | $ | 100.0 | % | |||||||||||||||||
| Cost of services | 72.7 | % | 77.4 | % | |||||||||||||||||||
| Gross Profit | 27.3 | % | 22.6 | % | |||||||||||||||||||
| Selling, general and administrative expenses | 15.9 | % | 13.6 | % | |||||||||||||||||||
| Contingent consideration | — | % | ( | (0.2) | % | ||||||||||||||||||
| Loss on sale of assets | — | % | 0.1 | % | |||||||||||||||||||
| Operating Income | 11.3 | % | 9.1 | % | |||||||||||||||||||
Revenue. Revenues in our Infrastructure Solutions segment decreased by $8.4 million during the year ended September 30, 2020, a decrease of 6.1% compared to the year ended September 30, 2019. The decrease in revenue was driven primarily by the timing of project schedules at certain of our large customers, compared to unusually strong demand in the prior year. We also experienced a decrease in demand for our motor repair services, as several of our large customers temporarily shut down facilities in response to the COVID-19 pandemic. Plant Power and Control Systems, L.L.C. ("PPCS") contributed $12.6 million in revenue during the year ended September 30, 2020 subsequent to our acquisition of the business.
29
Gross Profit. Our Infrastructure Solutions segment’s gross profit during the year ended September 30, 2020, increased by $4.1 million, as compared to the year ended September 30, 2019. Gross profit as a percent of revenue increased from 22.6% for the year ended September 30, 2019 to 27.3% for the year ended September 30, 2020 primarily as a result of successful project execution as well as our continued focus on procurement, engineering, and quality which resulted in a decrease in operating costs. Our newly acquired PPCS business contributed $3.4 million in gross profit during the year ended September 30, 2020 subsequent to our acquisition of the business.
Selling, General and Administrative Expenses. Our Infrastructure Solutions segment’s selling, general and administrative expenses during the year ended September 30, 2020, increased by $1.8 million compared to the year ended September 30, 2019, driven by $2.0 million of expense, including amortization of intangible assets, incurred at our newly acquired PPCS business. Expenses incurred at PPCS were partly offset by a decrease in travel and healthcare costs. The selling, general and administrative expenses as a percentage of revenue increased from 13.6% for the year ended September 30, 2019, to 15.9% for the year ended September 30, 2020.
Commercial & Industrial
2021 Compared to 2020
| Year Ended September 30, | |||||||||||||||||||||||
| 2021 | 2020 | ||||||||||||||||||||||
| $ | % | $ | % | ||||||||||||||||||||
| (Dollars in thousands, Percentage of revenues) | |||||||||||||||||||||||
| Revenue | $ | 100.0 | % | $ | 100.0 | % | |||||||||||||||||
| Cost of services | 227,704 | 88.9 | % | 234,492 | 91.8 | % | |||||||||||||||||
| Gross Profit | 11.1 | % | 8.2 | % | |||||||||||||||||||
| Selling, general and administrative expenses | 28,172 | 11.0 | % | 32,128 | 12.6 | % | |||||||||||||||||
| Goodwill impairment expense | — | % | 6,976 | 2.7 | % | ||||||||||||||||||
| Contingent consideration | — | % | ( | — | % | ||||||||||||||||||
| Gain on sale of assets | ( | — | % | ( | — | % | |||||||||||||||||
| Operating Income | 0.2 | % | ( | (7.0) | % | ||||||||||||||||||
Revenue. Revenues in our Commercial & Industrial segment increased $0.7 million, or 0.3%, during the year ended September 30, 2021, compared to the year ended September 30, 2020. The market for our Commercial & Industrial segment's services remains highly competitive, and disruptions caused by the COVID-19 pandemic resulted in some delays in the awarding of new projects and the progress of certain existing projects, as well as decreased demand for new construction in certain sectors we serve, particularly through the first six months of fiscal 2021. However, we have seen an increase in activity during the past few months, as many of our customers have reverted to more typical levels of activity.
Gross Profit. Our Commercial & Industrial segment’s gross profit during the year ended September 30, 2021 increased by $7.4 million, or 35.3%, as compared to the year ended September 30, 2020. We have improved project efficiency, enhanced our procurement process, and focused on controlling costs. As a result, gross profit as a percent of revenues increased from 8.2% for the year ended September 30, 2020, to 11.1% for the year ended September 30, 2021.
Selling, General and Administrative Expenses. Our Commercial & Industrial segment’s selling, general and administrative expenses during the year ended September 30, 2021 decreased $4.0 million, or 12.3%, compared to the year ended September 30, 2020. The higher expense in fiscal 2020 primarily reflected a write-off recorded in 2020 related to a commercial dispute, as well as costs incurred in 2020 to improve our procurement process. Selling, general and administrative expenses as a percentage of revenue decreased from 12.6% for the year ended September 30, 2020 to 11.0% for the year ended September 30, 2021.
30
2020 Compared to 2019
| Year Ended September 30, | |||||||||||||||||||||||
| 2020 | 2019 | ||||||||||||||||||||||
| $ | % | $ | % | ||||||||||||||||||||
| (Dollars in thousands, Percentage of revenues) | |||||||||||||||||||||||
| Revenues | $ | 100.0 | % | $ | 100.0 | % | |||||||||||||||||
| Cost of services | 234,492 | 91.8 | % | 275,722 | 90.2 | % | |||||||||||||||||
| Gross Profit | 8.2 | % | 9.8 | % | |||||||||||||||||||
| Selling, general and administrative expenses | 32,128 | 12.6 | % | 27,815 | 9.1 | % | |||||||||||||||||
| Goodwill impairment expense | 6,976 | 2.7 | % | — | — | % | |||||||||||||||||
| Contingent consideration | ( | — | % | — | % | ||||||||||||||||||
| Gain on sale of assets | ( | — | % | ( | — | % | |||||||||||||||||
| Operating Income (Loss) | ( | (7.0) | % | 0.7 | % | ||||||||||||||||||
Revenue. Revenues in our Commercial & Industrial segment decreased $50.1 million, or 16.4%, during the year ended September 30, 2020, compared to the year ended September 30, 2019. The decrease was largely driven by lower demand for large, industrial projects, particularly in the agricultural and food processing sectors. We also experienced a reduction in demand for time-and-material work. The market for this segment’s services remains highly competitive, and disruptions caused by the COVID-19 pandemic resulted in some delays in the awarding of new projects, as well as the progress of certain existing projects.
Gross Profit. Our Commercial & Industrial segment’s gross profit during the year ended September 30, 2020 decreased by $8.8 million, or 29.6%, as compared to the year ended September 30, 2019. This was driven primarily by a decrease in volume as discussed above, and certain project inefficiencies. As a percentage of revenue, gross profit decreased from 9.8% for the year ended September 30, 2019, to 8.2% for the year ended September 30, 2020, as a result of certain project inefficiencies, as well as a less efficient absorption of branch level overhead in connection with lower volumes.
Selling, General and Administrative Expenses. Our Commercial & Industrial segment’s selling, general and administrative expenses during the year ended September 30, 2020, increased $4.3 million, or 15.5%, compared to the year ended September 30, 2019. The increased expense for the year ended September 30, 2020 includes a reserve for credit losses related to a commercial dispute, as well as an increase in legal fees. Additionally, we invested in our procurement process and incurred costs in connection with changes to our organization structure, with the goal of improving gross margins in the future. Selling, general and administrative expenses as a percentage of revenue increased to 12.6% from 9.1%, reflecting the impact of the decreased scale of our operations.
Goodwill Impairment Expense. Throughout 2020, our Commercial & Industrial segment continued to experience operating losses. Although the business maintained a focus on operational improvements and cost reductions, its performance continued to be affected by the ongoing COVID-19 pandemic and other market factors, which continued to impact customer decisions on awarding of new work. In this increasingly competitive and uncertain environment, demand for new construction in market sectors such as retail, office, and hospitality declined, and our backlog decreased. As a result of these developments, and continuing operational difficulties, we concluded in performing our annual goodwill impairment assessment that the fair value of our Commercial & Industrial reporting unit was less than its carrying amount, which resulted in the recognition of a non-cash goodwill impairment charge of $7.0 million for the year ended September 30, 2020.
31
INTEREST AND OTHER EXPENSE, NET
| Year Ended September 30, | |||||||||||||||||
| 2021 | 2020 | 2019 | |||||||||||||||
| (In thousands) | |||||||||||||||||
| Interest expense | $ | 764 | $ | 625 | $ | 1,539 | |||||||||||
| Deferred financing charges | 198 | 152 | 318 | ||||||||||||||
| Total interest expense | 962 | 777 | 1,857 | ||||||||||||||
| Other (income) expense, net | (286) | 12 | (148) | ||||||||||||||
| Total interest and other expense, net | 676 | 789 | 1,709 | ||||||||||||||
During the year ended September 30, 2021, we incurred interest expense of $1.0 million primarily comprised of interest expense from our revolving credit facility with Wells Fargo Bank, N.A. (“Wells Fargo”) and fees on an average letter of credit balance of $5.7 million under our revolving credit facility and an average unused line of credit balance of $77.4 million. This compares to interest expense of $0.8 million for the year ended September 30, 2020 primarily comprised of interest expense from our revolving credit facility with Wells Fargo and fees on an average letter of credit balance of $6.9 million under our revolving credit facility and an average unused line of credit balance of $89.6 million.
During the year ended September 30, 2019, we incurred interest expense of $1.9 million primarily comprised of interest expense from our revolving credit facility with Wells Fargo and fees on an average letter of credit balance of $6.6 million under our revolving credit facility and an average unused line of credit balance of $73.7 million.
PROVISION FOR INCOME TAXES
For the year ended September 30, 2021, we recorded income tax expense of $16.2 million, which reflects a $5.1 million benefit related to the recognition of previously unrecognized tax benefits.
For the year ended September 30, 2020, we recorded income tax expense of $8.7 million, which reflects a $3.2 million benefit related to the recognition of previously unrecognized tax benefits as well as a $3.3 million benefit related to the release of valuation allowance on certain state net operating loss carryforwards.
For the year ended September 30, 2019, we recorded income tax expense of $6.7 million, which reflects a $4.0 million benefit related to the recognition of previously unrecognized tax benefits.
WORKING CAPITAL
During the year ended September 30, 2021, working capital exclusive of cash increased by $74.1 million from September 30, 2020, reflecting a $143.2 million increase in current assets excluding cash and a $69.2 million increase in current liabilities during the period.
During the year ended September 30, 2021, our current assets exclusive of cash increased to $461.1 million, as compared to $317.9 million as of September 30, 2020, primarily as a result of a $73.7 million increase in trade accounts receivable, and a $43.7 million increase in inventory. Certain materials we carry in inventory, particularly copper wire, have increased in price. Further, we have increased the quantity of inventory we are currently carrying to manage procurement risks, as some of our key suppliers have increased lead times necessary to fill our orders. We also acquired $13.2 million of inventory in business combinations during the year ended September 30, 2021. Prepaid expenses and other current assets increased by $11.9 million, largely as a result of deposits made to secure future deliveries of materials. Increased levels of business activity, as well as the addition of accounts receivable at acquired businesses, drove the increase in trade accounts receivable. Days sales outstanding reduced to 57 as of September 30, 2021 from 61 as of September 30, 2020. While the rate of collections may vary, our typically secured position, resulting from our ability in general to secure liens against our customers’ overdue receivables, offers some protection that collection will occur eventually to the extent that our security retains value.
During the year ended September 30, 2021, our total current liabilities increased by $69.2 million to $311.6 million, compared to $242.4 million as of September 30, 2020, primarily related to an increase in accounts payable and accrued liabilities. An increase in levels of business activity, as well as current liabilities at businesses acquired, drove the increase in accounts payable and accrued liabilities.
32
Surety
Many customers, particularly in connection with new construction, require us to post performance and payment bonds issued by a surety. These bonds provide a guarantee to the customer that we will perform under the terms of our contract and that we will pay our subcontractors and vendors. If we fail to perform under the terms of our contract or to pay subcontractors and vendors, the customer may demand that the surety make payments or provide services under the bond. We must reimburse the sureties for any expenses or outlays they incur on our behalf. To date, we have not been required to make any reimbursements to our sureties for bond-related costs.
As is common in the surety industry, sureties issue bonds on a project-by-project basis and can decline to issue bonds at any time. We believe that our relationships with our sureties will allow us to provide surety bonds as they are required. However, current market conditions, as well as changes in our sureties' assessment of our operating and financial risk, could cause our sureties to decline to issue bonds for our work. If our sureties decline to issue bonds for our work, our alternatives would include posting other forms of collateral for project performance, such as letters of credit or cash, seeking bonding capacity from other sureties, or engaging in more projects that do not require surety bonds. In addition, if we are awarded a project for which a surety bond is required but we are unable to obtain a surety bond, the result could be a claim for damages by the customer for the costs of replacing us with another contractor.
As of September 30, 2021, the estimated cost to complete our bonded projects was approximately $80.3 million. We believe the bonding capacity currently provided by our sureties is adequate for our current operations and will be adequate for our operations for the foreseeable future.
LIQUIDITY AND CAPITAL RESOURCES
As of September 30, 2021, we had cash and cash equivalents of $23.1 million and $55.1 million of availability under our revolving credit facility. We anticipate that the combination of cash on hand, cash flows from operations and available capacity under our revolving credit facility will provide sufficient cash to enable us to meet our working capital needs, debt service requirements and capital expenditures for property and equipment through the next twelve months. Our ability to generate cash flow is dependent on many factors, including demand for our services, the availability of projects at margins acceptable to us, the ultimate collectability of our receivables, and our ability to borrow on our revolving credit facility or raise funds in the capital markets, if needed.
The Revolving Credit Facility
We maintain a revolving credit facility pursuant to an agreement with Wells Fargo (as amended, the “Prior Credit Agreement”). On December 2, 2021, we amended the Prior Credit Agreement (the “Ninth Amendment” and the Prior Credit Agreement as so amended, the “Amended Credit Agreement”) to, among other things, increase the size of the facility from $100 million to $125 million, decrease the required minimum Liquidity (as defined in the Amended Credit Facility) from $20 million to $12.5 million, and extend the maturity date from September 30, 2024 to September 30, 2026. The Ninth Amendment also replaced the Daily Three Month London Interbank Offered Rate ("LIBOR") with the Daily Three Month Secured Overnight Financing Rate ("SOFR") (each as defined in the Amended Credit Agreement) as the benchmark rate for establishing the interest rate applicable to our borrowings under the Amended Credit Agreement. Please see note 20 - "Subsequent Events" in the Notes to Consolidated Financial Statements included in this Form 10-K for further information about the terms of the Ninth Amendment.
Borrowings under the credit facility may not exceed a “borrowing base” that is determined monthly by Wells Fargo based on available collateral, primarily certain accounts receivables, inventories, and equipment. Under the terms of the Prior Credit Agreement, amounts outstanding bore interest at a per annum rate equal to a Daily Three Month LIBOR (as defined in the Prior Credit Agreement and subject to replacement with a new benchmark as set forth therein), plus an interest rate margin, determined quarterly, based on the following thresholds:
| Level | Thresholds | Interest Rate Margin | ||||||||||||
| I | If Liquidity is less than 35% of the Maximum Revolver Amount (as defined in the Amended Credit Agreement) at any time during the period | 1.75 percentage points | ||||||||||||
| II | If Liquidity is greater than or equal to 35% of the Maximum Revolver Amount at all times during the period and less than 50% of the Maximum Revolver Amount at any time during the period | 1.50 percentage points | ||||||||||||
| III | If Liquidity is greater than or equal to 50% of the Maximum Revolver Amount at all times during the period | 1.25 percentage points | ||||||||||||
33
Effective December 2, 2021, under the Ninth Amendment, amounts outstanding bear interest at a per annum rate equal to Daily Three Month SOFR (as defined in the Amended Credit Agreement), plus an interest rate margin, which is determined quarterly, based on the following thresholds:
Level | Thresholds | Interest Rate Margin | ||||||||||||
I | If Liquidity is less than 35% of the Maximum Revolver Amount at any time during the period | 2.00 percentage points | ||||||||||||
II | If Liquidity is greater than or equal to 35% of the Maximum Revolver Amount at all times during the period and less than 50% of the Maximum Revolver Amount at any time during the period | 1.75 percentage points | ||||||||||||
III | If Liquidity is greater than or equal to 50% of the Maximum Revolver Amount at all times during the period | 1.50 percentage points | ||||||||||||
In addition, we are charged monthly in arrears for (1) an unused commitment fee of 0.25% per annum, (2) a collateral monitoring fee of $5 thousand per quarter, (3) a letter of credit fee based on the then-applicable interest rate margin (4) appraisal fees, costs and expenses and (5) certain other fees and charges as specified in the Amended Credit Agreement.
The Prior Credit Agreement and the Amended Credit Agreement contain customary affirmative, negative and financial covenants, as well as customary events of default.
As of September 30, 2021, we were in compliance with the financial covenants under the Prior Credit Agreement in effect as of such date, requiring that we maintain:
• a Fixed Charge Coverage Ratio (as defined in the Prior Credit Agreement), measured quarterly on a trailing
four-quarter basis at the end of each quarter, of at least 1.1 to 1.0; and
• minimum Liquidity of at least twenty percent (20%) of the Maximum Revolver Amount, or $20 million; with, for purposes of this covenant, at least fifty percent (50%) of our Liquidity comprised of Excess Availability.
At September 30, 2021, our Liquidity was $78.2 million and our Excess Availability was $55.1 million (or greater than 50% of minimum Liquidity), and our Fixed Charge Coverage Ratio was 12.0:1.0.
Our Fixed Charge Coverage Ratio is calculated as follows (with capitalized terms as defined in the Amended Credit Agreement): (i) our trailing twelve month EBITDA, less Non-Financed Capital Expenditures (other than capital expenditures financed by means of an advance under the credit facility), cash taxes and all Restricted Junior Payments consisting of certain Pass-Through Tax Liabilities, divided by (ii) the sum of our cash interest (other than interest paid-in-kind, amortization of financing fees, and other non-cash interest expense) and principal debt payments (other than repayment of principal on advances under the credit facility and including cash payments with respect to capital leases), any management, consulting, monitoring, and advisory fees paid to an affiliate, and all Restricted Junior Payments (other than Pass-Through Tax Liabilities) and other cash distributions; provided, that if we make an acquisition consented to by Wells Fargo, the components of the Fixed Charge Coverage Ratio will be calculated for such fiscal period after giving pro forma effect to the acquisition assuming that such transaction has occurred on the first day of such period (including pro forma adjustments arising out of events which are directly attributable to such acquisition, are factually supportable, and are expected to have a continuing impact, in each case to be reasonably agreed to by Wells Fargo).
As defined in the Amended Credit Agreement, EBITDA is calculated as consolidated net income (or loss), less extraordinary gains, interest income, non-operating income and income tax benefits and decreases in any change in LIFO reserves, plus stock compensation expense, non-cash extraordinary losses (including, but not limited to, a non-cash impairment charge or write-down), Interest Expense, income taxes, depreciation and amortization, and increases in any change in LIFO reserves for such period, determined on a consolidated basis in accordance with GAAP.
There was no change to the Fixed Charge Coverage Ratio covenant under the Ninth Amendment. The Ninth Amendment reduced the minimum Liquidity requirement from twenty percent (20%) to ten percent (10%) of the Maximum Revolver Amount, or $12.5 million. If in the future our Liquidity falls below $12.5 million (or Excess Availability falls below 50% of our minimum Liquidity), our Fixed Charge Coverage Ratio is less than 1.1:1.0, or if we otherwise fail to perform or otherwise comply with certain of our covenants or other agreements under the Amended Credit Agreement, it would result in an event of default under the Amended Credit Agreement, which could result in some or all of our then-outstanding indebtedness becoming immediately due and payable.
At September 30, 2021, we had $4.5 million in outstanding letters of credit with Wells Fargo and $40.3 million of outstanding borrowings under our revolving credit facility.
34
Investments
From time to time, the Company invests in non-controlling positions in the debt or equity securities of other businesses. Our Board of Directors has approved an investment policy that permits the Company to invest our cash in liquid and marketable securities that include equities and fixed income securities, subject to size limits on investments individually and in the aggregate. Equity securities may include unrestricted, publicly traded stock that is listed on a major exchange or a national, over-the-counter market and that is appropriate for our portfolio objectives, and fixed income securities are required to have an investment grade credit quality at the time of purchase.
Operating Activities
Our cash flow from operations is not only influenced by cyclicality, demand for our services, operating margins and the type of services we provide, but can also be influenced by working capital needs such as the timing of our receivable collections. Working capital needs are generally lower during our fiscal first and second quarters due to the seasonality that we experience in many regions of the country; however, a seasonal decline in working capital may be offset by needs associated with higher growth or acquisitions.
Operating activities provided net cash of $37.9 million during the year ended September 30, 2021, as compared to $76.7 million of net cash provided in the year ended September 30, 2020. The decrease in operating cash flow resulted from an increase in working capital, particularly related to inventory. As commodity prices increased, we also experienced longer lead times for deliveries, and reduced availability for certain products we procure, particularly copper wire. As a result, we increased the amount of inventory we are currently carrying in an effort to ensure the availability of materials to serve our customers. This increase in working capital was partly offset by higher earnings during the year ended September 30, 2021.
Operating activities provided net cash of $76.7 million during the year ended September 30, 2020, as compared to $38.7 million of net cash provided in the year ended September 30, 2019. The increase in operating cash flow resulted primarily from an increase in earnings, as well as a $9.0 million benefit from the deferral of payroll taxes as permitted by the Coronavirus Aid, Relief, and Economic Security (CARES) Act, and a decrease in working capital.
Investing Activities
In the year ended September 30, 2021, net cash used in investing activities was $99.6 million, as compared to $33.6 million of net cash used in investing activities in the year ended September 30, 2020. Investing activities for the year ended September 30, 2021 include $7.4 million of capital expenditures and $92.5 million for the acquisition of businesses. Investing activities for the year ended September 30, 2020 include $4.7 million of capital expenditures and $29.0 million for the acquisition of businesses.
In the year ended September 30, 2020, net cash used in investing activities was $33.6 million, as compared to $5.7 million of net cash used in investing activities in the year ended September 30, 2019. Investing activities for the year ended September 30, 2020 include $4.7 million of capital expenditures and $29.0 million for the acquisition of businesses.
Financing Activities
Net cash provided by financing activities was $31.2 million in the year ended September 30, 2021, compared to $8.5 million used in the year ended September 30, 2020. For the year ended September 30, 2021, we borrowed a net $40.0 million on our revolving credit facility. In addition, we used $7.0 million to repurchase our shares under our stock repurchase program, as well as to satisfy statutory withholding requirements upon the vesting of employee stock compensation.
Net cash used in financing activities was $8.5 million in the year ended September 30, 2020, compared to $40.3 million used in the year ended September 30, 2019. For the year ended September 30, 2020, we used $7.7 million to repurchase our shares under our stock repurchase program, as well as to satisfy statutory withholding requirements upon the vesting of employee stock compensation.
CONTROLLING SHAREHOLDER
Tontine is the Company’s controlling shareholder, owning approximately 56 percent of the Company’s outstanding common stock as of December 1, 2021, based on a Form 4 filed by Tontine with the SEC on November 18, 2021. Accordingly, Tontine has the ability to exercise significant control over our affairs, including the election of directors and most actions requiring the approval of shareholders.
35
We are a party to a sublease agreement with Tontine Associates for corporate office space in Greenwich, Connecticut. The sublease extends through February 27, 2023, with monthly payments due in the amount of approximately $8 thousand. The lease has terms at market rates, and payments by the Company are at a rate consistent with that paid by Tontine Associates to its landlord.
On December 6, 2018, the Company entered into a Board Observer Letter Agreement (the "Observer Agreement") with Tontine Associates in order to assist Tontine in managing its investment in the Company. Subject to the terms and conditions set forth in the Observer Agreement, the Company granted Tontine the right, at any time that Tontine holds at least 20% of the outstanding common stock of the Company, to appoint a representative to serve as an observer to the Board (the “Board Observer”). The Board Observer, who shall serve at the discretion of and must be reasonably acceptable to those members of the Board who are not affiliates of Tontine, shall have no voting rights or other decision making authority. Subject to the terms and conditions set forth in the Observer Agreement, so long as Tontine has the right to appoint a Board Observer, the Board Observer will have the right to attend and participate in meetings of the Board and the committees thereof, subject to confidentiality requirements, and to receive reimbursement for reasonable out-of-pocket expenses incurred in his or her capacity as a Board Observer and such rights to coverage under the Company’s directors’ and officers’ liability insurance policy as are available to directors.
Jeffrey L. Gendell was appointed Chief Executive Officer of the Company effective October 1, 2020, having served as the Company's Interim Chief Executive Officer since July 31, 2020. Mr. Gendell also serves as Chairman of the Board of Directors, a position he has held since November 2016. He is the managing member and founder of Tontine, and the brother of David B. Gendell, who has served as a member of our Board of Directors since February 2012, and who previously served as Interim Director of Operations from November 2017 to January 2019, as Vice Chairman of the Board from November 2016 to November 2017 and as Chairman of the Board from January 2015 to November 2016. David B. Gendell was an employee of Tontine from 2004 until December 31, 2017.
OFF-BALANCE SHEET ARRANGEMENTS AND CONTRACTUAL OBLIGATIONS
As is common in our industry, we have entered into certain off-balance sheet arrangements that expose us to increased risk. Our significant off-balance sheet transactions include letter of credit obligations, firm commitments for materials and surety guarantees.
Some of our customers and vendors may require us to post letters of credit as a means of guaranteeing performance under our contracts and ensuring payment by us to subcontractors and vendors. If our customer has reasonable cause to effect payment under a letter of credit, we would be required to reimburse our creditor for the letter of credit.
Some of the underwriters of our casualty insurance program require us to post letters of credit as collateral, as is common in the insurance industry. To date, we have not had a situation where an underwriter has had reasonable cause to effect payment under a letter of credit. At September 30, 2021, $4.3 million of our outstanding letters of credit were to collateralize our insurance programs.
From time to time, we may enter into firm purchase commitments for materials such as copper wire and aluminum wire, which we expect to use in the ordinary course of business. These commitments are typically for terms of less than one year and require us to buy minimum quantities of materials at specified intervals at a fixed price over the term. As of September 30, 2021, we had commitments of $12.3 million outstanding under such agreements to purchase copper wire and other materials over the next 12 months in the ordinary course of business.
Many of our customers require us to post performance and payment bonds issued by a surety. Those bonds guarantee the customer that we will perform under the terms of a contract and that we will pay subcontractors and vendors. In the event that we fail to perform under a contract or pay subcontractors and vendors, the customer may demand the surety to pay or perform under our bond. Our relationship with our sureties is such that we will indemnify the sureties for any expenses they incur in connection with any of the bonds they issue on our behalf and may be required to post collateral to support the bonds. To date, we have not incurred any material costs to indemnify our sureties for expenses they incurred on our behalf.
CRITICAL ACCOUNTING POLICIES
The discussion and analysis of our financial condition and results of operations are based on our Consolidated Financial Statements, which have been prepared in accordance with GAAP. The preparation of our Consolidated Financial Statements requires us to make estimates and assumptions that affect the reported amounts of assets and liabilities, disclosures of contingent assets and liabilities known to exist as of the date the Consolidated Financial Statements, and the reported amounts of revenues and expenses recognized during the periods presented. We review all significant estimates affecting our Consolidated Financial Statements on a recurring basis and record the effect of any necessary adjustments prior to their publication. Judgments and estimates are based on our beliefs and assumptions derived from information available at the time such judgments and estimates are made. Uncertainties with respect to such
36
estimates and assumptions are inherent in the preparation of financial statements. There can be no assurance that actual results will not differ from those estimates.
Accordingly, we have identified the accounting principles which we believe are most critical to our reported financial status by considering accounting policies that involve the most complex or subjective decisions or assessments. We identified our most critical accounting policies to be those related to revenue recognition, accounting for business combinations, the assessment of goodwill and asset impairment, our allowance for credit losses, the recording of our insurance liabilities and estimation of the valuation allowance for deferred tax assets, and unrecognized tax benefits. These accounting policies, as well as others, are described in Note 2, “Summary of Significant Accounting Policies” in the notes to our Consolidated Financial Statements and at relevant sections in this discussion and analysis.
Revenue Recognition. We enter into contracts principally on the basis of competitive bids. We frequently negotiate the final terms and prices of those contracts with the customer. Although the terms of our contracts vary considerably, approximately 91% of our revenues are based on either a fixed price or unit price basis in which we agree to do the work for a fixed amount for the entire project (fixed price) or for units of work performed (unit price). Approximately 9% of our revenues are earned from contracts where we are paid on a time and materials basis. Our most significant cost drivers are the cost of labor and materials. These costs may vary from the costs we originally estimated. Variations from estimated contract costs along with other risks inherent in performing fixed price and unit price contracts may result in actual revenue and gross profits or interim projected revenue and gross profits for a project differing from those we originally estimated and could result in losses on projects. Depending on the size of a particular project, variations from estimated project costs could have a significant impact on our operating results for any fiscal quarter or year.
We complete most of our projects within one year. We frequently provide service and maintenance work under open-ended, unit price master service agreements which are renewable annually. We recognize revenue on service, time and material work when services are performed. Work performed under a construction contract generally provides that the customers accept completion of progress to date and compensate us for services rendered, measured in terms of units installed, hours expended or some other measure of progress. Revenues from construction contracts are recognized on the percentage-of-completion method. Revenues recognized on a percentage-of-completion basis, all of which are fixed price or cost plus arrangements, comprised approximately 55% of our total revenue for the year ended September 30, 2021. The percentage-of-completion method for construction contracts is measured principally by the percentage of costs incurred and accrued to date for each contract to the estimated total costs for each contract at completion. We generally consider contracts substantially complete upon departure from the work site and acceptance by the customer. Contract costs include all direct material and labor costs and those indirect costs related to contract performance, such as indirect labor, supplies, tools, repairs and depreciation costs. Changes in job performance, job conditions, estimated contract costs, profitability and final contract settlements may result in revisions to costs and income, and the effects of such revisions are recognized in the period in which the revisions are determined. Provisions for total estimated losses on uncompleted contracts are made in the period in which such losses are determined.
We generally do not incur significant costs related to obtaining or fulfilling a contract prior to the start of a project. When significant pre‑contract costs are incurred, they will be capitalized and amortized on a percentage of completion basis over the life of the contract.
The current asset “Costs and estimated earnings in excess of billings” represents revenues recognized in excess of amounts billed that management believes will be billed and collected within the next twelve months. The current liability “Billings in excess of costs and estimated earnings” represents billings in excess of revenues recognized. Costs and estimated earnings in excess of billings are amounts considered recoverable from customers based on different measures of performance, including achievement of specific milestones, completion of specified units or completion of the contract. Also included in this asset, from time to time, are claims and unapproved change orders, which include amounts that we are in the process of collecting from our customers or agencies for changes in contract specifications or design, contract change orders in dispute or unapproved as to scope and price, or other related causes of unanticipated additional contract costs. Claims and unapproved change orders are recorded at estimated realizable value when collection is probable and can be reasonably estimated. We do not recognize profits on construction costs incurred in connection with claims. Claims made by us involve negotiation and, in certain cases, litigation. Such litigation costs are expensed as incurred.
Business Combinations. In accounting for business combinations, certain assumptions and estimates are employed in determining the fair value of assets acquired, evaluating the fair value of liabilities assumed, as well as in determining the allocation of goodwill to the appropriate reporting unit. These estimates may be affected by factors such as changing market conditions affecting the industries in which we operate. The most significant assumptions requiring judgment involve identifying and estimating the fair value of intangible assets and the associated useful lives for establishing amortization periods. To finalize purchase accounting for significant intangible assets and liabilities, we utilize the services of independent valuation specialists to assist in the determination of the fair value.
Valuation Allowance for Deferred Tax Assets. We regularly evaluate valuation allowances established for deferred tax assets for which future realization is uncertain. We perform this evaluation quarterly. The estimation of required valuation allowances includes estimates of future taxable income. In assessing the realizability of deferred tax assets at September 30, 2021, we concluded, based
37
upon the assessment of positive and negative evidence, that it is more likely than not that the Company will generate sufficient taxable income within the applicable NOL carryforward periods to realize $19.0 million of its deferred tax assets. We considered the scheduled reversal of deferred tax liabilities, projected future taxable income and tax planning strategies in making this assessment.
An inability to generate sufficient taxable income in future periods to realize our deferred tax assets may lead to a future need for a valuation allowance and a corresponding reduction in GAAP net income. In addition, any reduction in the federal statutory tax rate in the future could also cause a reduction in the economic benefit of the NOL available to us and a corresponding charge to reduce the book value of the deferred tax asset recorded on our Consolidated Balance Sheets.
Income Taxes. GAAP specifies the methodology by which a company must identify, recognize, measure and disclose in its financial statements the effects of any uncertain tax return reporting positions that it has taken or expects to take. GAAP requires financial statement reporting of the expected future tax consequences of uncertain tax return reporting positions on the presumption that all relevant tax authorities possess full knowledge of those tax reporting positions, as well as all of the pertinent facts and circumstances, but it prohibits discounting of any of the related tax effects for the time value of money.
The evaluation of a tax position is a two-step process. The first step is the recognition process to determine if it is more likely than not that a tax position will be sustained upon examination by the appropriate taxing authority, based on the technical merits of the position. The second step is a measurement process whereby a tax position that meets the more likely than not recognition threshold is calculated to determine the amount of benefit/expense to recognize in the financial statements. The tax position is measured at the largest amount of benefit/expense that is more likely than not of being realized upon ultimate settlement.
The tax years ended September 30, 2018 and forward are subject to federal audit as are prior tax years, to the extent of unutilized net operating losses generated in those years.
We anticipate that approximately $0.2 million in liabilities for unrecognized tax benefits, including accrued interest, may be reversed in the next twelve months. This reversal is predominantly due to the expiration of the statutes of limitation for unrecognized tax benefits.
New Accounting Pronouncements. Recent accounting pronouncements are described in Note 2, “Summary of Significant Accounting Policies — New Accounting Pronouncements” in the notes to our Consolidated Financial Statements and at relevant sections in this discussion and analysis.
Item 7A. Quantitative and Qualitative Disclosures About Market Risk
Management is actively involved in monitoring exposure to market risk and continues to develop and utilize appropriate risk management techniques. Our exposure to significant market risks includes fluctuations in labor costs and commodity prices for copper, aluminum, steel and fuel. Commodity price risks may have an impact on our results of operations due to the fixed price nature of many of our contracts. We are also exposed to interest rate risk with respect to our outstanding debt obligations on our credit facility. For additional information see “Risk Factors” in Item 1A of this Annual Report on Form 10-K.
Commodity Risk
Our exposure to significant market risks includes fluctuations in commodity prices for copper, aluminum, steel, electrical components, fuel, and certain plastics. Commodity price risks may have an impact on our results of operations due to the fixed nature of many of our contracts. Over the long-term, we expect to be able to pass along a portion of these costs to our customers, as market conditions in the construction industry will allow.
Interest Rate Risk
Floating rate debt, where the interest rate fluctuates periodically, exposes us to short-term changes in market interest rates. All of the long-term debt outstanding under our revolving credit facility is structured on floating rate terms. We currently do not maintain any hedging contracts that would limit our exposure to variable rates of interest when we have outstanding borrowings under our revolving credit facility. On December 2, 2021, we entered into an amendment to our credit agreement which replaces LIBOR with SOFR as the benchmark for establishing the interest rate charged on our borrowings. If SOFR were to increase, our interest payment obligations on any then-outstanding borrowings would increase, having a negative effect on our cash flow and financial condition. A one percentage point increase in the interest rate on our long-term debt outstanding under the credit facility of $40.3 million as of September 30, 2021 would cause a $0.4 million pre-tax annual increase in interest expense.
38
Item 8. Financial Statements and Supplementary Data
INDEX TO CONSOLIDATED FINANCIAL STATEMENTS
| Page | |||||
39
REPORT OF INDEPENDENT REGISTERED PUBLIC ACCOUNTING FIRM
To the Stockholders and the Board of Directors of IES Holdings, Inc. and subsidiaries
Opinion on the Financial Statements
We have audited the accompanying consolidated balance sheets of IES Holdings, Inc. and subsidiaries (the Company) as of September 30, 2021 and 2020, the related consolidated statements of comprehensive income (loss), stockholders' equity and cash flows for each of the three years in the period ended September 30, 2021, and the related notes (collectively referred to as the “consolidated financial statements”). In our opinion, the consolidated financial statements present fairly, in all material respects, the financial position of the Company at September 30, 2021 and 2020, and the results of its operations and its cash flows for each of the three years in the period ended September 30, 2021, in conformity with U.S. generally accepted accounting principles.
We also have audited, in accordance with the standards of the Public Company Accounting Oversight Board (United States) (PCAOB), the Company's internal control over financial reporting as of September 30, 2021, based on criteria established in Internal Control-Integrated Framework issued by the Committee of Sponsoring Organizations of the Treadway Commission (2013 framework) and our report dated December 3, 2021 expressed an unqualified opinion thereon.
Basis for Opinion
These financial statements are the responsibility of the Company's management. Our responsibility is to express an opinion on the Company’s financial statements based on our audits. We are a public accounting firm registered with the PCAOB and are required to be independent with respect to the Company in accordance with the U.S. federal securities laws and the applicable rules and regulations of the Securities and Exchange Commission and the PCAOB.
We conducted our audits in accordance with the standards of the PCAOB. Those standards require that we plan and perform the audit to obtain reasonable assurance about whether the financial statements are free of material misstatement, whether due to error or fraud. Our audits included performing procedures to assess the risks of material misstatement of the financial statements, whether due to error or fraud, and performing procedures that respond to those risks. Such procedures included examining, on a test basis, evidence regarding the amounts and disclosures in the financial statements. Our audits also included evaluating the accounting principles used and significant estimates made by management, as well as evaluating the overall presentation of the financial statements. We believe that our audits provide a reasonable basis for our opinion.
Critical Audit Matter
The critical audit matter communicated below is a matter arising from the current period audit of the financial statements that was communicated or required to be communicated to the audit committee and that: (1) relates to accounts or disclosures that are material to the financial statements and (2) involved our especially challenging, subjective or complex judgments. The communication of the critical audit matter does not alter in any way our opinion on the consolidated financial statements, taken as a whole, and we are not, by communicating the critical audit matter below, providing a separate opinion on the critical audit matter or on the accounts or disclosures to which it relates.
| Revenue recognition for certain fixed-price contracts | |||||
| Description of the matter | As described in Notes 2 and 4 to the consolidated financial statements, the Company generally recognizes revenue for fixed price contracts over time using costs incurred as a percentage of the estimated total costs at completion to determine the extent of progress of performance obligations. Revenue recognition under this method is subject to judgment as the determination of progress towards completion requires management to prepare estimates of the total project costs to complete. | ||||
Auditing management’s estimate of the progress towards completion for certain projects which are larger in size and longer in duration was complex and subjective, requiring considerable judgment to evaluate management’s determination of the forecasted costs to complete, specifically as it relates to labor productivity. | |||||
| How we addressed the matter in our audit | We obtained an understanding, evaluated the design and tested the operating effectiveness of controls over the Company's cost estimating process, including controls over management's review of cost estimates for significant inputs such as labor. | ||||
| Our audit procedures included, among others, evaluating the appropriate application of the Company's revenue recognition method; testing significant assumptions used to develop the estimated costs to complete; and testing the completeness and accuracy of the underlying data. To assess the reasonableness of management's estimated costs, we performed audit procedures that included, among others, agreeing the estimates to supporting documentation; conducting interviews with project personnel; attending select project review meetings; and performing sensitivity analyses or retrospective review using historical actual costs and trends. | |||||
/s/ ERNST & YOUNG LLP
We have served as the Company’s auditor since 2002
Houston, Texas
December 3, 2021
40
REPORT OF INDEPENDENT REGISTERED PUBLIC ACCOUNTING FIRM
To the Stockholders and the Board of Directors of IES Holdings, Inc. and subsidiaries
Opinion on Internal Control Over Financial Reporting
We have audited IES Holdings, Inc. and subsidiaries’ internal control over financial reporting as of September 30, 2021, based on criteria established in Internal Control—Integrated Framework issued by the Committee of Sponsoring Organizations of the Treadway Commission (2013 framework) (the COSO criteria). In our opinion, IES Holdings, Inc. and subsidiaries (the Company) maintained, in all material respects, effective internal control over financial reporting as of September 30, 2021, based on the COSO criteria.
As indicated in the accompanying Management’s Report on Internal Controls over Financial Reporting, management’s assessment of and conclusion on the effectiveness of internal control over financial reporting did not include the internal controls of Bayonet Plumbing, Heating & Air-Conditioning, LLC, Edmonson Electric, LLC, K.E.P. Electric, Inc., and Wedlake Fabricating, Inc., which are included in the 2021 consolidated financial statements of the Company and constituted 11% of total assets, excluding goodwill and intangible assets, as of September 30, 2021 and 12% of consolidated revenues for the year then ended. Our audit of internal control over financial reporting of the Company also did not include an evaluation of the internal control over financial reporting of Bayonet Plumbing, Heating & Air-Conditioning, LLC, Edmonson Electric, LLC, K.E.P. Electric, Inc., and Wedlake Fabricating, Inc.
We also have audited, in accordance with the standards of the Public Company Accounting Oversight Board (United States) (PCAOB), the consolidated balance sheets of the Company as of September 30, 2021 and 2020, the related consolidated statements of comprehensive income (loss), stockholders’ equity and cash flows for each of the three years in the period ended September 30, 2021, and the related notes and our report dated December 3, 2021 expressed an unqualified opinion thereon.
Basis for Opinion
The Company’s management is responsible for maintaining effective internal control over financial reporting and for its assessment of the effectiveness of internal control over financial reporting included in the accompanying Management’s Report on Internal Control over Financial Reporting. Our responsibility is to express an opinion on the Company’s internal control over financial reporting based on our audit. We are a public accounting firm registered with the PCAOB and are required to be independent with respect to the Company in accordance with the U.S. federal securities laws and the applicable rules and regulations of the Securities and Exchange Commission and the PCAOB.
We conducted our audit in accordance with the standards of the PCAOB. Those standards require that we plan and perform the audit to obtain reasonable assurance about whether effective internal control over financial reporting was maintained in all material respects.
Our audit included obtaining an understanding of internal control over financial reporting, assessing the risk that a material weakness exists, testing and evaluating the design and operating effectiveness of internal control based on the assessed risk, and performing such other procedures as we considered necessary in the circumstances. We believe that our audit provides a reasonable basis for our opinion.
Definition and Limitations of Internal Control Over Financial Reporting
A company’s internal control over financial reporting is a process designed to provide reasonable assurance regarding the reliability of financial reporting and the preparation of financial statements for external purposes in accordance with generally accepted accounting principles. A company’s internal control over financial reporting includes those policies and procedures that (1) pertain to the maintenance of records that, in reasonable detail, accurately and fairly reflect the transactions and dispositions of the assets of the company; (2) provide reasonable assurance that transactions are recorded as necessary to permit preparation of financial statements in accordance with generally accepted accounting principles, and that receipts and expenditures of the company are being made only in accordance with authorizations of management and directors of the company; and (3) provide reasonable assurance regarding prevention or timely detection of unauthorized acquisition, use, or disposition of the company’s assets that could have a material effect on the financial statements.
Because of its inherent limitations, internal control over financial reporting may not prevent or detect misstatements. Also, projections of any evaluation of effectiveness to future periods are subject to the risk that controls may become inadequate because of changes in conditions, or that the degree of compliance with the policies or procedures may deteriorate.
/s/ ERNST & YOUNG LLP
Houston, Texas
December 3, 2021
41
IES HOLDINGS, INC. AND SUBSIDIARIES
Consolidated Balance Sheets
(In Thousands, Except Share Information)
| September 30, | ||||||||||||||||||||
| 2021 | 2020 | |||||||||||||||||||
| ASSETS | ||||||||||||||||||||
| CURRENT ASSETS: | ||||||||||||||||||||
| Cash and cash equivalents | $ | $ | ||||||||||||||||||
| Accounts receivable: | ||||||||||||||||||||
| Trade, net of allowance | ||||||||||||||||||||
| Retainage | ||||||||||||||||||||
| Inventories | ||||||||||||||||||||
| Costs and estimated earnings in excess of billings | ||||||||||||||||||||
| Prepaid expenses and other current assets | ||||||||||||||||||||
| Total current assets | ||||||||||||||||||||
| Property and equipment, net | ||||||||||||||||||||
| Goodwill | ||||||||||||||||||||
| Intangible assets, net | ||||||||||||||||||||
| Deferred tax assets | ||||||||||||||||||||
| Operating right of use assets | ||||||||||||||||||||
| Other non-current assets | ||||||||||||||||||||
| Total assets | $ | $ | ||||||||||||||||||
| LIABILITIES AND STOCKHOLDERS’ EQUITY | ||||||||||||||||||||
| CURRENT LIABILITIES: | ||||||||||||||||||||
| Accounts payable and accrued expenses | ||||||||||||||||||||
| Billings in excess of costs and estimated earnings | ||||||||||||||||||||
| Total current liabilities | ||||||||||||||||||||
| Long-term debt | ||||||||||||||||||||
| Operating long-term lease liabilities | ||||||||||||||||||||
| Other non-current liabilities | ||||||||||||||||||||
| Total liabilities | ||||||||||||||||||||
| Noncontrolling interest | ||||||||||||||||||||
| STOCKHOLDERS’ EQUITY: | ||||||||||||||||||||
Preferred stock, $ | ||||||||||||||||||||
| and outstanding | ||||||||||||||||||||
Common stock, $ | ||||||||||||||||||||
issued and | ||||||||||||||||||||
Treasury stock, at cost, | ( | ( | ||||||||||||||||||
| Additional paid-in capital | ||||||||||||||||||||
| Retained earnings | ||||||||||||||||||||
| Total stockholders’ equity | ||||||||||||||||||||
| Total liabilities and stockholders’ equity | $ | $ | ||||||||||||||||||
The accompanying notes are an integral part of these Consolidated Financial Statements.
42
IES HOLDINGS, INC. AND SUBSIDIARIES
Consolidated Statements of Comprehensive Income (Loss)
(In Thousands, Except Share Information)
| Year Ended September 30, | |||||||||||||||||||||||
| 2021 | 2020 | 2019 | |||||||||||||||||||||
| Revenues | $ | $ | $ | ||||||||||||||||||||
| Cost of services | |||||||||||||||||||||||
| Gross profit | |||||||||||||||||||||||
| Selling, general and administrative expenses | |||||||||||||||||||||||
| Goodwill impairment expense | |||||||||||||||||||||||
| Contingent consideration | ( | ( | |||||||||||||||||||||
| Loss (gain) on sale of assets | ( | ||||||||||||||||||||||
| Operating income | |||||||||||||||||||||||
| Interest and other (income) expense: | |||||||||||||||||||||||
| Interest expense | |||||||||||||||||||||||
| Other (income) expense, net | ( | ( | |||||||||||||||||||||
| Income from operations before income taxes | |||||||||||||||||||||||
| Provision for income taxes | |||||||||||||||||||||||
| Net income | |||||||||||||||||||||||
| Net (income) loss attributable to noncontrolling interest | ( | ( | |||||||||||||||||||||
| Comprehensive income attributable to IES Holdings, Inc. | $ | $ | $ | ||||||||||||||||||||
| Earnings per share attributable to common stockholders of IES Holdings, Inc.: | |||||||||||||||||||||||
| Basic | $ | $ | $ | ||||||||||||||||||||
| Diluted | $ | $ | $ | ||||||||||||||||||||
| Shares used in the computation of earnings per share: | |||||||||||||||||||||||
| Basic | |||||||||||||||||||||||
| Diluted | |||||||||||||||||||||||
The accompanying notes are an integral part of these Consolidated Financial Statements.
43
IES HOLDINGS, INC. AND SUBSIDIARIES
Consolidated Statements of Stockholders’ Equity
(In Thousands, Except Share Information)
| Common Stock | Treasury Stock | Additional Paid-In Capital | Retained Earnings | Total Stockholders' Equity | ||||||||||||||||||||||||||||||||||||||||
| Shares | Amount | Shares | Amount | |||||||||||||||||||||||||||||||||||||||||
| BALANCE, September 30, 2018 | $ | ( | $ | ( | $ | $ | $ | |||||||||||||||||||||||||||||||||||||
| Issuance of share-based compensation | — | — | ( | — | ||||||||||||||||||||||||||||||||||||||||
| Acquisition of treasury stock | — | — | ( | ( | — | — | ( | |||||||||||||||||||||||||||||||||||||
| Options exercised | — | — | ( | — | ||||||||||||||||||||||||||||||||||||||||
| Non-cash compensation | — | — | — | — | — | |||||||||||||||||||||||||||||||||||||||
| Cumulative effect adjustment from adoption of new accounting standard | — | — | — | — | — | |||||||||||||||||||||||||||||||||||||||
| Net income attributable to IES Holdings, Inc. | — | — | — | — | — | |||||||||||||||||||||||||||||||||||||||
| BALANCE, September 30, 2019 | $ | ( | $ | ( | $ | $ | $ | |||||||||||||||||||||||||||||||||||||
| Issuance of share-based compensation | — | — | ( | — | ||||||||||||||||||||||||||||||||||||||||
| Acquisition of treasury stock | — | — | ( | ( | — | ( | ||||||||||||||||||||||||||||||||||||||
| Options exercised | — | — | ( | — | ||||||||||||||||||||||||||||||||||||||||
| Non-cash compensation | — | — | — | — | — | |||||||||||||||||||||||||||||||||||||||
| Increase in noncontrolling interest | — | — | — | — | — | ( | ( | |||||||||||||||||||||||||||||||||||||
| Net income attributable to IES Holdings, Inc. | — | — | — | — | — | |||||||||||||||||||||||||||||||||||||||
| BALANCE, September 30, 2020 | $ | ( | $ | ( | $ | $ | $ | |||||||||||||||||||||||||||||||||||||
| Issuance of share-based compensation | — | — | ( | — | ||||||||||||||||||||||||||||||||||||||||
| Acquisition of treasury stock | — | — | ( | ( | — | ( | ||||||||||||||||||||||||||||||||||||||
| Options exercised | — | — | — | |||||||||||||||||||||||||||||||||||||||||
| Non-cash compensation | — | — | — | — | — | |||||||||||||||||||||||||||||||||||||||
| Increase in noncontrolling interest | — | — | — | — | — | ( | ( | |||||||||||||||||||||||||||||||||||||
| Cumulative effect adjustment from adoption of new accounting standard | — | — | — | — | — | ( | ( | |||||||||||||||||||||||||||||||||||||
| Net income attributable to IES Holdings, Inc. | — | — | — | — | — | |||||||||||||||||||||||||||||||||||||||
| BALANCE, September 30, 2021 | $ | ( | $ | ( | $ | $ | $ | |||||||||||||||||||||||||||||||||||||
The accompanying notes are an integral part of these Consolidated Financial Statements.
44
IES HOLDINGS, INC. AND SUBSIDIARIES
Consolidated Statements of Cash Flows
(In Thousands)
| Year Ended September 30, | |||||||||||||||||
| 2021 | 2020 | 2019 | |||||||||||||||
| CASH FLOWS FROM OPERATING ACTIVITIES: | |||||||||||||||||
| Net income (loss) | $ | $ | $ | ||||||||||||||
| Adjustments to reconcile net income (loss) to net cash provided by operating activities: | |||||||||||||||||
| Bad debt expense | |||||||||||||||||
| Deferred financing cost amortization | |||||||||||||||||
| Depreciation and amortization | |||||||||||||||||
| Loss (gain) on sale of assets | ( | ||||||||||||||||
| Non-cash compensation expense | |||||||||||||||||
| Goodwill impairment expense | |||||||||||||||||
| Deferred income taxes | |||||||||||||||||
| Changes in operating assets and liabilities | |||||||||||||||||
| Accounts receivable | ( | ( | ( | ||||||||||||||
| Inventories | ( | ( | ( | ||||||||||||||
| Costs and estimated earnings in excess of billings | ( | ||||||||||||||||
| Prepaid expenses and other current assets | ( | ( | ( | ||||||||||||||
| Other non-current assets | ( | ||||||||||||||||
| Accounts payable and accrued expenses | |||||||||||||||||
| Billings in excess of costs and estimated earnings | |||||||||||||||||
| Other non-current liabilities | ( | ||||||||||||||||
| Net cash provided by operating activities | |||||||||||||||||
| CASH FLOWS FROM INVESTING ACTIVITIES: | |||||||||||||||||
| Purchases of property and equipment | ( | ( | ( | ||||||||||||||
| Proceeds from sales of assets | |||||||||||||||||
| Cash received (paid) in conjunction with business combinations or dispositions | ( | ( | |||||||||||||||
| Net cash used in investing activities | ( | ( | ( | ||||||||||||||
| CASH FLOWS FROM FINANCING ACTIVITIES: | |||||||||||||||||
| Borrowings of debt | |||||||||||||||||
| Repayments of debt | ( | ( | ( | ||||||||||||||
| Finance lease payment | ( | ( | |||||||||||||||
| Contingent consideration payment | ( | ||||||||||||||||
| Purchase of noncontrolling interest | ( | — | — | ||||||||||||||
| Distribution to noncontrolling interest | ( | ( | ( | ||||||||||||||
| Purchase of treasury stock | ( | ( | ( | ||||||||||||||
| Issuance of shares | |||||||||||||||||
| Net cash provided by (used in) financing activities | ( | ( | |||||||||||||||
| NET INCREASE (DECREASE) IN CASH AND CASH EQUIVALENTS | ( | ( | |||||||||||||||
| CASH, CASH EQUIVALENTS, beginning of period | |||||||||||||||||
| CASH, CASH EQUIVALENTS, end of period | $ | $ | $ | ||||||||||||||
| SUPPLEMENTAL DISCLOSURE OF CASH FLOW INFORMATION: | |||||||||||||||||
| Cash paid for interest | $ | $ | $ | ||||||||||||||
| Cash paid for income taxes (net) | $ | $ | $ | ||||||||||||||
The accompanying notes are an integral part of these Consolidated Financial Statements.
45
IES HOLDINGS, INC.
Notes to the Consolidated Financial Statements
(All Amounts in Thousands Except Share Amounts)
1. BUSINESS
Description of the Business
IES Holdings, Inc. designs and installs integrated electrical and technology systems and provides infrastructure products and services across a variety of end markets, including data centers, residential housing and commercial and industrial facilities. Our operations are organized into four principal business segments, based upon the nature of our services:
•Communications – Nationwide provider of technology infrastructure services, including the design, build, and maintenance of the communications infrastructure within data centers for co-location and managed hosting customers for both large corporations and independent businesses.
•Residential – Regional provider of electrical installation services for single-family housing and multi-family apartment complexes, as well as heating, ventilation and air conditioning (HVAC) and plumbing installation services in certain markets.
•Infrastructure Solutions – Provider of electro-mechanical solutions for industrial operations, including apparatus repair and custom-engineered products such as generator enclosures to be used in data centers and other industrial applications.
•Commercial & Industrial – Provider of electrical and mechanical design, construction, and maintenance services to the commercial and industrial markets in various regional markets and nationwide in certain areas of expertise, such as the power infrastructure market and data centers.
The words “IES”, the “Company”, “we”, “our”, and “us” refer to IES Holdings, Inc. and, except as otherwise specified herein, to our consolidated subsidiaries.
2. SUMMARY OF SIGNIFICANT ACCOUNTING POLICIES
Principles of Consolidation
The accompanying Consolidated Financial Statements include the accounts of IES Holdings, Inc. and its consolidated subsidiaries. All significant intercompany accounts and transactions have been eliminated in consolidation.
Asset Impairment
During the fiscal year ended September 30, 2021, the Company recorded no asset impairment charges. At September 30, 2020, we recorded an impairment charge of $6,976 to Goodwill related to our Commercial & Industrial segment. During the fiscal year ended September 30, 2019, the Company recorded no asset impairment charges. Please refer to Note 17, “Goodwill and Intangible Assets” for further discussion.
Use of Estimates
The preparation of financial statements in conformity with accounting principles generally accepted in the United States of America (“GAAP”) requires the use of estimates and assumptions by management in determining the reported amounts of assets and liabilities, disclosures of contingent liabilities at the date of the financial statements and the reported amounts of revenues and expenses during the reporting period. Actual results could differ from those estimates. Estimates are primarily used in our revenue recognition of construction in progress, fair value assumptions in accounting for business combinations and analyzing goodwill, intangible assets and long-lived asset impairments and adjustments, allowance for credit losses, stock-based compensation, reserves for legal matters, realizability of deferred tax assets, unrecognized tax benefits and self-insured claims liabilities and related reserves.
Cash and Cash Equivalents
We consider all highly liquid investments purchased with an original maturity of three months or less to be cash equivalents.
46
Inventories
Inventories consist of raw materials, work in process, finished goods, and parts and supplies held for use in the ordinary course of business. Inventory is valued at the lower of cost or net realizable value generally using the historical average cost or first-in, first-out (FIFO) method. When circumstances dictate, we write down inventory to its estimated net realizable value based on assumptions about future demand, market conditions, plans for disposal, and physical condition of the product. Where shipping and handling costs on inventory purchases are borne by us, these charges are included in inventory and charged to cost of services upon use in our projects or the providing of services.
Property and Equipment
Additions of property and equipment are recorded at cost, and depreciation is computed using the straight-line method over the estimated useful life of the related asset. Leasehold improvements are capitalized and depreciated over the lesser of the life of the lease or the estimated useful life of the asset.
Expenditures for repairs and maintenance are charged to expense when incurred. Expenditures for major renewals and betterments, which extend the useful lives of existing property and equipment, are capitalized and depreciated. Upon retirement or disposition of property and equipment, the capitalized cost and related accumulated depreciation are removed from the accounts and any resulting gain or loss is recognized in the statements of comprehensive income in the caption (gain) loss on sale of assets.
Goodwill
Goodwill attributable to each reporting unit is tested for impairment either by comparing the fair value of each reporting unit with its carrying value or by a qualitative assessment. These impairment tests are required to be performed at least annually. On an ongoing basis (absent any impairment indicators), we perform an impairment test annually using a measurement date of September 30. In evaluating goodwill for impairment, we have the option to first assess qualitative factors to determine whether it is more likely than not that the fair value of a reporting unit is greater than its carrying value. If we determine that it is more likely than not that the carrying value of a reporting unit is greater than its fair value, then we perform an impairment test by calculating the fair value of the reporting unit and comparing this calculated fair value with the carrying value of the reporting unit.
We estimate the fair value of the reporting unit based on both a market approach and an income approach, using discounted estimated future cash flows. The market approach uses market multiples of enterprise value to earnings before interest, taxes, depreciation and amortization for comparable publicly traded companies. The income approach relies on significant estimates for future cash flows, projected long-term growth rates, and the weighted average cost of capital.
Intangible Assets
Intangible assets with definite lives are amortized over their estimated useful lives based on expected economic benefit with no residual value.
Debt Issuance Costs
Debt issuance costs are included as a reduction of our debt outstanding, or alternately classified within other non-current assets if we have no borrowings drawn on our credit facility at the balance sheet date, and are amortized to interest expense over the scheduled maturity of the debt. Amortization expense of debt issuance costs was $198 , $152 and $318 , respectively, for the years ended 2021, 2020 and 2019. Remaining unamortized capitalized debt issuance costs were $656 and $736 at September 30, 2021, and 2020, respectively.
Revenue Recognition
Revenue is recognized from a contract with a customer when: (i) it has approval and commitment from both parties, (ii) the rights of the parties are identified, (iii) payment terms are identified, (iv) the contract has commercial substance, and (v) collectability of consideration is probable. We consider the start of a project to be when the above criteria have been met and we have written authorization from the customer to proceed.
We recognize revenue on project contracts over time using the percentage of completion method. Project contracts generally provide that customers accept completion of progress to date and compensate us for services rendered measured in terms of units installed, hours expended or some other measure of progress. We recognize revenue on both signed contracts and change orders. A discussion of our treatment of claims and unapproved change orders is described later in this section. Percentage of completion for construction contracts is measured principally by the percentage of costs incurred and accrued to date for each contract to the estimated total cost for each contract at completion. We generally consider contracts to be substantially complete upon departure from the work site and acceptance by the customer. Contract costs include all direct material, labor and insurance costs and those indirect costs related to contract performance, such as indirect labor, supplies, tools, repairs and depreciation costs. Changes in job performance, job
47
conditions, estimated contract costs and profitability and final contract settlements can result in change orders under which the customer agrees to pay additional contract price. Revisions can also result in claims we might make against the customer to recover additional costs that have not been resolved through change orders with the customer. We do not recognize revenue or margin based on change orders or claims if it is probable such revenue will be reversed. The amount of revenue associated with unapproved change orders and claims was immaterial for the years ended September 30, 2021, 2020 and 2019. Provisions for total estimated losses on uncompleted contracts are made in the period in which such losses are determined. The balances billed but not paid by customers pursuant to retainage provisions in project contracts are typically due upon completion of the contracts and acceptance by the customer. Based on our experience, the retention balance at each balance sheet date will be collected within the subsequent fiscal year.
Certain divisions in the Residential and Infrastructure Solutions segments recognize revenue as of a point-in-time at the completion of the contract ("completed contract") because the duration of their contracts is short in nature. We recognize revenue on completed contracts when the project is complete and billable to the customer. Provisions for estimated losses on these contracts are recorded in the period such losses are determined.
Accounts Receivable and Allowance for Credit Losses
As described below under “Accounting Standards Recently Adopted”, we adopted the new accounting standard for measuring credit losses effective October 1, 2020. We record accounts receivable for all amounts billed and not collected and amounts for which we have an unconditional right to bill our customers. Additionally, we provide an allowance for credit losses based on historical company-specific uncollectable accounts, as well as current and expected market conditions. From time to time, we establish additional allowance for credit losses for financial asset balances with specific customers where collectability has been determined to be improbable based on specific facts and circumstances. Such allowances are established as deemed necessary in the period such determination is made. As is common in our industry, some of these receivables are in litigation or require us to exercise our contractual lien rights in order to collect. Our allowance for credit losses at September 30, 2021 and 2020 was $2,387 and $2,613 , respectively.
Comprehensive Income (Loss)
Comprehensive income (loss) includes all changes in equity during a period except those resulting from investments by and distributions to stockholders.
Income Taxes
We follow the liability method of accounting for income taxes. Under this method, deferred income tax assets and liabilities are recorded for the future income tax consequences of temporary differences between the financial reporting and income tax bases of assets and liabilities, and are measured using enacted tax rates and laws.
We regularly evaluate valuation allowances established for deferred tax assets for which future realization is uncertain. We perform this evaluation on a quarterly basis. The estimation of required valuation allowances includes estimates of future taxable income. In assessing the realizability of deferred tax assets, we must consider whether it is more likely than not some portion, or all, of the deferred tax assets will not be realized. We consider all available evidence, both positive and negative, in determining whether a valuation allowance is required. At September 30, 2021, we concluded, based upon the assessment of positive and negative evidence, that it is more likely than not that the Company will generate sufficient taxable income within the applicable net operating loss ("NOL") carryforward periods to realize its net deferred tax assets of $19,009 . We considered the scheduled reversal of deferred tax liabilities, projected future taxable income and tax planning strategies in making this assessment. If actual future taxable income is different from these estimates, our results could be affected.
We record reserves for income taxes related to certain tax positions when management considers it more likely than not that additional taxes may be due in excess of amounts reflected on income tax returns filed. When recording these reserves, we assume that taxing authorities have full knowledge of the position and all relevant facts. We continually review exposure to additional tax obligations, and as further information is known or events occur, changes in tax reserves may be recorded. To the extent interest and penalties may be assessed by taxing authorities on any underpayment of income tax, such amounts have been accrued and included in the provision for income taxes.
Risk Management
We retain the risk for workers’ compensation, employer’s liability, automobile liability, construction defects, general liability and employee group health claims, as well as pollution coverage, resulting from uninsured deductibles per accident or occurrence which are generally subject to annual aggregate limits. Our general liability program provides coverage for bodily injury and property damage. In many cases, we insure third parties, including general contractors, as additional insureds under our insurance policies. Losses are accrued based upon our known claims incurred and an estimate of claims incurred but not reported. Each year, we compile our historical data pertaining to the insurance experiences and actuarially develop the ultimate loss associated with our insurance
48
programs other than pollution coverage for our Infrastructure Solutions segment. We believe that the actuarial valuation provides the best estimate of the ultimate losses to be expected under these programs.
The undiscounted ultimate losses of our workers’ compensation, auto and general liability insurance reserves at September 30, 2021 and 2020, were $3,266 and $3,886 , respectively. Based on historical payment patterns, we expect payments of undiscounted ultimate losses to be made as follows:
| Year Ending September 30: | ||||||||||||||
| 2022 | $ | |||||||||||||
| 2023 | ||||||||||||||
| 2024 | ||||||||||||||
| 2025 | ||||||||||||||
| 2026 | ||||||||||||||
| Thereafter | ||||||||||||||
| Total | $ | |||||||||||||
We elect to discount the ultimate losses above to present value using an approximate risk-free rate over the average life of our insurance claims. For the years ended September 30, 2021 and 2020, the discount rate used was 1.0 percent and 0.3 percent, respectively. The present value of all insurance reserves for the workers’ compensation, auto and general liability recorded at September 30, 2021 and 2020 was $3,234 and $3,832 , respectively. Our undiscounted reserves for employee group health claims at September 30, 2021 and 2020 were $2,553 and $2,422 , respectively, and are anticipated to be resolved within the year ending September 30, 2022.
We had letters of credit totaling $4,327 outstanding at September 30, 2021 to collateralize certain of our high deductible insurance obligations.
Realization of Long-Lived Assets
We evaluate the recoverability of property and equipment and other long-lived assets as facts and circumstances indicate that any of those assets might be impaired. If an evaluation is required for our assets we plan to hold and use, the estimated future undiscounted cash flows associated with the asset are compared to the asset’s carrying amount to determine if an impairment of such property has occurred. The effect of any impairment would be to expense the difference between the fair value of such property and its carrying value. Estimated fair values are determined based on expected future cash flows discounted at a rate we believe incorporates the time value of money, the expectations about future cash flows and an appropriate risk premium.
For the years ended September 30, 2021 and 2019, no indicators of impairments were identified, and no impairment charges were recorded. At September 30, 2020, we performed an asset impairment test for all long-lived assets within our Commercial & Industrial segment and determined no impairment charge was necessary.
Risk Concentration
Financial instruments, which potentially subject us to concentrations of credit risk, consist principally of cash deposits and accounts receivable. Through delayed payment terms, we at times grant credit, usually without collateral, to our customers, who are generally large public companies, contractors and homebuilders throughout the United States. Consequently, we are subject to potential credit risk related to changes in business and economic factors throughout the United States, specifically within the construction, homebuilding and mission critical facility markets. However, we are entitled to payment for work performed and generally have certain lien rights in that work. Further, management believes that its contract acceptance, billing and collection policies are adequate to manage potential credit risk. We routinely maintain cash balances in financial institutions in excess of federally insured limits. We periodically assess the financial condition of these institutions where these funds are held and believe the credit risk is minimal. We maintain the majority of our cash and cash equivalents in money market mutual funds. There can be no assurance, however, that we will not be adversely affected by credit risks we face.
No single customer accounted for more than 10% of our consolidated revenues or accounts receivable for the years ended September 30, 2021, 2020 and 2019.
Fair Value of Financial Instruments
49
Our financial instruments consist of cash and cash equivalents, accounts receivable, accounts payable, and a loan agreement. We believe that the carrying value of financial instruments approximates their fair value due to their short-term nature. The carrying value of our debt approximates fair value, as debt incurs interest at a variable rate.
Deferred Compensation Plans
The Company maintains a rabbi trust to fund certain deferred compensation plans. The securities held by the trust are classified as trading securities. The investments are recorded at fair value and are classified as other non-current assets in the accompanying Consolidated Balance Sheets as of September 30, 2021 and 2020. The changes in fair values are recorded as a component of other income (expense) in the Consolidated Statements of Comprehensive Income (Loss).
The corresponding deferred compensation liability is included in other non-current liabilities on the Consolidated Balance Sheets and changes in this obligation are recognized as adjustments to compensation expense in the period in which they are determined.
Noncontrolling Interest
In connection with our acquisitions of Edmonson Electric, LLC ("Edmonson") and Bayonet Plumbing, Heating & Air-Conditioning, LLC ("Bayonet") in fiscal 2021, NEXT Electric, LLC ("NEXT") in fiscal 2017, and STR Mechanical, LLC ("STR") in fiscal 2016, we acquired an 80 percent interest in each of the entities, with the remaining 20 percent interest in each such entity being retained by the respective third party sellers. The interests retained by those third party sellers are identified on our Consolidated Balance Sheets as noncontrolling interest, classified outside of permanent equity. Under the terms of each entity’s operating agreement, after five years from the date of the acquisition, we may elect to purchase, or the third party seller may require us to purchase, part or all of the remaining 20 percent interest in the applicable entity. The purchase price is variable, based on a multiple of earnings as defined in the operating agreements. Therefore, this noncontrolling interest is carried at the greater of the balance determined under Accounting Standards Codification (“ASC”) 810 and the redemption amounts assuming the noncontrolling interests were redeemable at the balance sheet date. During the year ended September 30, 2021, we acquired the noncontrolling interest in STR for $1,188 . If all of the noncontrolling interests remaining outstanding at September 30, 2021 had been redeemable at that date, the redemption amount would have been $18,262 . For the year ended September 30, 2021, we recorded a decrease to Retained Earnings of $315 to increase the carrying amount of noncontrolling interest in NEXT and STR to their redemption amounts. For the year ended September 30, 2020, we recorded a decrease to Retained Earnings of $194 to increase the carrying amount of noncontrolling interest in NEXT to its redemption amount.
Leases
We enter into various contractual arrangements for the right to use facilities, vehicles and equipment. We evaluate whether each of these arrangements contains a lease and classify all identified leases as either operating or finance. If the arrangement is subsequently modified, we re-evaluate our classification. The lease term generally ranges from two to ten years for facilities and three to five years for vehicles and equipment. Our lease terms may include the exercise of renewal or termination options when it is reasonably certain these options will be exercised. Our lease agreements do not contain any material residual value guarantees or restrictive covenants.
Upon commencement of the lease, we recognize a lease liability and corresponding right-of-use ("ROU") asset for all leases with an initial term greater than twelve months. Lease liabilities represent the present value of our future lease payments over the expected lease term. As most of our leases do not provide an implicit rate, we generally use our incremental borrowing rate as the discount rate in calculating the present value of the lease payments. The incremental borrowing rate is determined by identifying a synthetic credit rating for the consolidated company, where treasury functions are centrally managed, and adjusting the interest rates from associated indexes for differences in credit risk and interest rate risk. We have elected to combine the lease and nonlease components in the recognition of our lease liabilities across all classes of underlying assets. ROU assets represent our right to control the use of the leased asset during the lease and are recognized in an amount equal to the lease liability with adjustments for prepaid or accrued rent, lease incentives or unamortized initial direct costs. Costs associated with ROU assets are recognized on a straight-line basis over the term of the lease. Our lease assets are tested for impairment in the same manner as long-lived assets used in operations.
Certain lease contracts include obligations to pay for other services, such as operations and maintenance. Where the costs of these services can be identified as fixed or fixed-in-substance, the costs are included as part of the future lease payments. If the cost is not fixed at the inception of the lease, the cost is recorded as a variable cost in the period incurred.
50
Accounting Standards Not Yet Adopted
In December 2019, the Financial Accounting Standards Board ("FASB") issued Accounting Standard Update No. 2019-12, “Income Taxes (Topic 740): Simplifying the Accounting for Income Taxes.” This standard simplifies the accounting for income taxes by eliminating certain exceptions to the guidance in Topic 740 related to the approach for intraperiod tax allocation, the methodology for calculating income taxes in an interim period and the recognition of deferred tax liabilities for outside basis differences. The standard also simplifies aspects of the accounting for franchise taxes and enacted changes in tax laws or rates and clarifies the accounting for transactions that result in a step-up in the tax basis of goodwill. This update is effective for fiscal years beginning after December 15, 2020 and for interim periods within that year. Early adoption is permitted. We adopted this standard as of October 1, 2021, and do not expect it to have a material impact on our Consolidated Financial Statements.
Accounting Standards Recently Adopted
In June 2016, FASB issued Accounting Standard Update No. 2016-13, Financial Instruments – Credit Losses (“ASU 2016-13”), which requires companies to consider historical experiences, current market conditions and reasonable and supportable forecasts in the measurement of expected credit losses, with further clarifications made in April 2019 and May 2019 with the issuances of Accounting Standard Updates No. 2019-04 and 2019-05. This update is effective for fiscal years beginning after December 15, 2019 and for interim periods within those fiscal years. We adopted this standard on October 1, 2020, using a modified retrospective transition method through a cumulative-effect adjustment to beginning retained earnings in the period of adoption. As a result, we recorded an increase in the Allowance for Credit Losses of $284 , an increase to Deferred Tax Assets of $70 , and a decrease to Retained Earnings of $214 .
ASU 2016-13 requires the recognition of expected credit losses on financial assets measured at amortized cost basis. In calculating our expected credit losses, we considered trade receivables, retainage, and costs and estimated earnings in excess of billings, all of which constitute a homogenous portfolio, and therefore, to measure the expected credit loss, they have been grouped together.
We have elected to calculate an expected credit loss based on loss rates from historical data. Each segment groups financial assets with similar risk characteristics and collectively assesses the expected credit losses. If an individual asset experiences credit deterioration to the extent the credit risk is no longer characteristic of the other assets in the group, it will be analyzed individually. The loss rates for our portfolios include our history of credit loss expense, the aging of our receivables, our expectation of payments and adjustment for forward-looking factors specific to the macroeconomic trends in the U.S. construction market.
Activity in our allowance for credit losses consists of the following:
| Year Ended September 30, | |||||||||||
| 2021 | 2020 | ||||||||||
| Balance at beginning of period | $ | $ | |||||||||
| Additions to costs and expenses, inclusive of ASU 2016-13 adoption adjustment | |||||||||||
| Deductions for uncollectible receivables written off, net of recoveries | ( | ( | |||||||||
| Balance at end of period | $ | $ | |||||||||
Other than trade receivables due in one year or less, we do not have any other financial assets that are past due or are on non-accrual status.
In August 2018, the FASB issued Accounting Standard Update No. 2018-13, Fair Value Measurement Disclosure Framework (“ASU 2018-13”), to modify certain disclosure requirements for fair value measurements. Under the new guidance, registrants will need to disclose weighted average information for significant unobservable inputs for all Level 3 fair value measurements. The guidance does not specify how entities should calculate the weighted average, but requires them to explain their calculation. The new guidance also requires disclosing the changes in unrealized gains and losses for the period included in other comprehensive income for recurring Level 3 fair value measurements of instruments held at the end of the reporting period. This guidance is effective for fiscal years beginning after December 15, 2019 and for interim periods within those fiscal years. We adopted this standard on October 1, 2020, with no impact on our Consolidated Financial Statements.
51
In February 2016, the FASB issued Accounting Standard Update No. 2016-02, Leases (“ASU 2016-02”). Under ASU 2016-02, lessees need to recognize a ROU asset and a lease liability on their balance sheets for all leases, other than those that meet the definition of a short-term lease. For income statement purposes, leases must be classified as either operating or finance. Operating leases result in straight-line expense, while finance leases are accounted for similar to capital leases under the previous lease accounting standard. We adopted ASU 2016-02 on October 1, 2019 using a modified retrospective transition approach. Using the optional transition method allowed under Accounting Standard Update No. 2018-11, prior period amounts were not adjusted retrospectively and continue to be reported using the previous accounting standards in effect for the period presented. We elected to utilize all of the available practical expedients with the exception of the practical expedient permitting the use of hindsight when determining the lease term and assessing impairment of ROU assets. Therefore, we did not reassess whether any of our existing or expired contracts contained leases or the classification of or initial direct costs included in our existing or expired leases.
The adoption of ASU 2016-02 resulted in the recognition of ROU assets of approximately $32,434 and operating lease liabilities of approximately $32,237 on our Consolidated Balance Sheets at the adoption date. The difference between the ROU assets and lease liabilities was primarily due to previously accrued rent expense relating to periods prior to October 1, 2019. The adoption did not have a significant impact on our Consolidated Statements of Comprehensive Income or Cash Flows. See Note 9, “Leases” for additional discussion of our lease accounting policies and expanded disclosures.
In June 2018, the FASB issued Accounting Standard Update No. 2018-07, Compensation—Stock Compensation (“ASU 2018-07”), to simplify the accounting for share-based payments to nonemployees by aligning it with the accounting for share-based payments for employees, with certain exceptions. Under the new guidance, the cost for nonemployee awards may be lower and less volatile than under current GAAP because the measurement generally will occur earlier and will be fixed at the grant date. This update was adopted as of October 1, 2019 with no impact to our financial statements.
3. CONTROLLING SHAREHOLDER
Tontine Associates, L.L.C. ("Tontine Associates"), together with its affiliates (collectively, "Tontine") is the Company's controlling shareholder, owning approximately 56 percent of the Company’s outstanding common stock as of December 1, 2021, based on Form 4 filed by Tontine with the SEC on November 18, 2021. Accordingly, Tontine has the ability to exercise significant control over our affairs, including the election of directors and most actions requiring the approval of shareholders.
While Tontine is subject to certain restrictions under federal securities laws on sales of its shares as an affiliate, the Company has filed a shelf registration statement to register all of the shares of IES common stock owned by Tontine at the time of registration. As long as the shelf registration statement remains effective and the Company remains eligible to use it, Tontine has the ability to resell any or all of its registered shares from time to time in one or more offerings, as described in the shelf registration statement and in any prospectus supplement filed in connection with an offering pursuant to the shelf registration statement.
Should Tontine sell or otherwise dispose of all or a portion of its position in IES, a change in ownership of IES could occur. A change in ownership, as defined by Internal Revenue Code Section 382, could reduce the availability of the Company’s NOLs for federal and state income tax purposes. Furthermore, a change of control would trigger the change of control provisions in a number of our material agreements, including our credit agreement, bonding agreements with our sureties and our executive severance plan. The Company previously had in place a tax benefit protection plan (the “NOL Rights Plan”), designed to deter an acquisition of the Company's stock in excess of a threshold amount that could trigger a change in ownership within the meaning of Internal Revenue Code Section 382. However, on May 7, 2021, we amended the NOL Rights Plan, accelerating the expiration of the plan from December 31, 2021 to May 21, 2021. As a result of this amendment, the NOL Rights Plan has now expired.
Jeffrey L. Gendell was appointed as Chief Executive Officer of the Company effective October 1, 2020, having served as the Company's Interim Chief Executive Officer since July 31, 2020. Mr. Gendell also serves as Chairman of the Board of Directors, a position he has held since November 2016. He is the managing member and founder of Tontine, and the brother of David B. Gendell, who has served as a member of our Board of Directors since February 2012, and who previously served as Interim Director of Operations from November 2017 to January 2019, as Vice Chairman of the Board from November 2016 to November 2017 and as Chairman of the Board from January 2015 to November 2016. David B. Gendell was an employee of Tontine from 2004 until December 31, 2017.
The Company is party to a sublease agreement with Tontine Associates for corporate office space in Greenwich, Connecticut. The sublease extends through February 27, 2023, with monthly payments due in the amount of approximately $8 . Payments by the Company are at a rate consistent with that paid by Tontine Associates to its landlord.
On December 6, 2018, the Company entered into a Board Observer Letter Agreement (the "Observer Agreement") with Tontine Associates, in order to assist Tontine in managing its investment in the Company. Subject to the terms and conditions set forth in the
52
4. REVENUE RECOGNITION
Contracts
Our revenue is derived from contracts with customers, and we determine the appropriate accounting treatment for each contract at its inception. Our contracts primarily relate to electrical and mechanical contracting services, technology infrastructure products and services, and electro-mechanical solutions for industrial operations. Revenue is earned based upon an agreed fixed price or actual costs incurred plus an agreed upon percentage.
We account for a contract when: (i) it has approval and commitment from both parties, (ii) the rights of the parties are identified, (iii) payment terms are identified, (iv) the contract has commercial substance, and (v) collectability of consideration is probable. We consider the start of a project to be when the above criteria have been met and we have written authorization from the customer to proceed.
Performance Obligations
A performance obligation is a promise in a contract to transfer a distinct good or service to the customer. A contract’s transaction price is allocated to each distinct performance obligation and recognized as revenue when, or as, the performance obligation is satisfied.
We recognize revenue over time for the majority of the services we perform as (i) control continuously transfers to the customer as work progresses at a project location controlled by the customer and (ii) we have the right to bill the customer as costs are incurred. Within our Infrastructure Solutions segment, we often perform work inside our own facilities, where control does not continuously transfer to the customer as work progresses. In such cases, we evaluate whether we have the right to bill the customer as costs are incurred. Such assessment involves an evaluation of contractual termination clauses. Where we have a contractual right to payment for work performed to date, we recognize revenue over time. If we do not have such a right, we recognize revenue upon completion of the contract, when control of the work transfers to the customer.
For fixed price arrangements, we use the percentage of completion method of accounting under which revenue recognized is measured principally by the costs incurred and accrued to date for each contract as a percentage of the estimated total cost for each contract at completion. Contract costs include all direct material, labor and indirect costs related to contract performance. Changes in job performance, job conditions, estimated contract costs and profitability and final contract settlements may result in revisions to costs and income, and the effects of these revisions are recognized in the period in which the revisions are determined. Provisions for estimated losses on uncompleted contracts are made in the period in which such losses are determined. This measurement and comparison process requires updates to the estimate of total costs to complete the contract, and these updates may include subjective assessments and judgments.
Variable Consideration
The transaction price for our contracts may include variable consideration, which includes changes to transaction price for approved and unapproved change orders, claims and incentives. Change orders, claims and incentives are generally not distinct from the existing contract due to the significant integration service provided in the context of the contract and are accounted for as a modification of the existing contract and performance obligation. We estimate variable consideration for a performance obligation at the probability weighted value we expect to receive (or the most probable amount we expect to incur in the case of liquidated damages, if any), utilizing estimation methods that best predict the amount of consideration to which we will be entitled (or will be incurred in the case of liquidated damages, if any). We include variable consideration in the estimated transaction price to the extent it is probable that a significant reversal of cumulative revenue recognized will not occur or when the uncertainty associated with the variable consideration is resolved. Our estimates of variable consideration and determination of whether to include estimated amounts in transaction price are based largely on an assessment of our anticipated performance and all information (historical, current and forecasted) that is reasonably available to us. The effect of variable consideration on the transaction price of a performance obligation is recognized as an adjustment to revenue on a cumulative catch-up basis. To the extent unapproved change orders and claims reflected in transaction price (or accounted for as a reduction of the transaction price in the case of liquidated damages) are not resolved in our favor, or to the
53
extent incentives reflected in transaction price are not earned, there could be reductions in, or reversals of, previously recognized revenue.
Disaggregation of Revenue
We disaggregate our revenue from contracts with customers by activity and contract type, as these categories reflect how the nature, amount, timing and uncertainty of our revenue and cash flows are affected by economic factors. Our consolidated 2021, 2020, and 2019 revenue was derived from the following activities. See details in the following tables:
| Year Ended September 30, | |||||||||||||||||
| 2021 | 2020 | 2019 | |||||||||||||||
| Communications | $ | $ | $ | ||||||||||||||
| Residential | |||||||||||||||||
| Single-family | |||||||||||||||||
| Multi-family and Other | |||||||||||||||||
| Total Residential | |||||||||||||||||
| Infrastructure Solutions | |||||||||||||||||
| Industrial Services | |||||||||||||||||
| Custom Power Solutions | |||||||||||||||||
| Total Infrastructure Solutions | |||||||||||||||||
| Commercial & Industrial | |||||||||||||||||
| Total Revenue | $ | $ | $ | ||||||||||||||
| Year Ended September 30, 2021 | |||||||||||||||||||||||||||||||||||
| Communications | Residential | Infrastructure Solutions | Commercial & Industrial | Total | |||||||||||||||||||||||||||||||
| Fixed-price | $ | $ | $ | $ | $ | ||||||||||||||||||||||||||||||
| Time-and-material | |||||||||||||||||||||||||||||||||||
| Total revenue | $ | $ | $ | $ | $ | ||||||||||||||||||||||||||||||
| Year Ended September 30, 2020 | |||||||||||||||||||||||||||||||||||
| Communications | Residential | Infrastructure Solutions | Commercial & Industrial | Total | |||||||||||||||||||||||||||||||
| Fixed-price | $ | $ | $ | $ | $ | ||||||||||||||||||||||||||||||
| Time-and-material | |||||||||||||||||||||||||||||||||||
| Total revenue | $ | $ | $ | $ | $ | ||||||||||||||||||||||||||||||
| Year Ended September 30, 2019 | |||||||||||||||||||||||||||||||||||
| Communications | Residential | Infrastructure Solutions | Commercial & Industrial | Total | |||||||||||||||||||||||||||||||
| Fixed-price | $ | $ | $ | $ | $ | ||||||||||||||||||||||||||||||
| Time-and-material | |||||||||||||||||||||||||||||||||||
| Total revenue | $ | $ | $ | $ | $ | ||||||||||||||||||||||||||||||
54
Accounts Receivable
Accounts receivable include amounts which we have billed or have an unconditional right to bill our customers. As of September 30, 2021, accounts receivable included $20,445 of unbilled receivables for which we have an unconditional right to bill.
Contract Assets and Liabilities
Project contracts typically provide for a schedule of billings on percentage of completion of specific tasks inherent in the fulfillment of our performance obligation(s). The schedules for such billings usually do not precisely match the schedule on which costs are incurred. As a result, contract revenue recognized in the statement of operations can and usually does differ from amounts that can be billed to the customer at any point during the contract. Amounts by which cumulative contract revenue recognized on a contract as of a given date exceeds cumulative billings and unbilled receivables to the customer under the contract are reflected as a current asset in our Consolidated Balance Sheets under the caption “Costs and estimated earnings in excess of billings”. Amounts by which cumulative billings to the customer under a contract as of a given date exceed cumulative contract revenue recognized are reflected as a current liability in our Consolidated Balance Sheets under the caption “Billings in excess of costs and estimated earnings”.
During the years ended September 30, 2021 and 2020, we recognized revenue of $47,906 and $34,035 related to our contract liabilities at October 1, 2020 and 2019, respectively.
We did not have any impairment losses recognized on our receivables or contract assets for the years ended September 30, 2021, 2020, or 2019.
Remaining Performance Obligations
Remaining performance obligations represent the unrecognized revenue value of our contract commitments. New awards represent the total expected revenue value of new contract commitments undertaken during a given period, as well as additions to the scope of existing contract commitments. Our new performance obligations vary significantly each reporting period based on the timing of our major new contract commitments. At September 30, 2021, we had remaining performance obligations of $713,274 . The Company expects to recognize revenue on approximately $650,500 of the remaining performance obligations over the next 12 months, with the remaining recognized thereafter.
For the year ended September 30, 2021, net revenue recognized from our performance obligations satisfied in previous periods was not material.
5. PROPERTY AND EQUIPMENT
Property and equipment consists of the following:
| Estimated Useful Lives in Years | Year Ended September 30, | |||||||||||||||||||
| 2021 | 2020 | |||||||||||||||||||
| Land | N/A | $ | $ | |||||||||||||||||
| Buildings and improvements | - | |||||||||||||||||||
| Machinery and equipment | - | |||||||||||||||||||
| Information systems | - | |||||||||||||||||||
| Furniture and fixtures | - | |||||||||||||||||||
| $ | $ | |||||||||||||||||||
| Less-Accumulated depreciation | ( | ( | ||||||||||||||||||
| Construction in progress | ||||||||||||||||||||
| Property and equipment, net | $ | $ | ||||||||||||||||||
Depreciation expense was $8,090 , $6,084 and $5,607 , respectively, for the years ended September 30, 2021, 2020 and 2019.
55
6. PER SHARE INFORMATION
Basic earnings per share is calculated as income (loss) available to common stockholders, divided by the weighted average number of common shares outstanding during the period. If the effect is dilutive, participating securities are included in the computation of basic earnings per share. Our participating securities do not have a contractual obligation to share in the losses in any given period. As a result, these participating securities will not be allocated any losses in the periods of net losses, but will be allocated income in the periods of net income using the two-class method.
The following table reconciles the components of the basic and diluted earnings per share for the years ended September 30, 2021, 2020 and 2019:
| Year Ended September 30, | |||||||||||||||||
| 2021 | 2020 | 2019 | |||||||||||||||
| Numerator: | |||||||||||||||||
| Net income attributable to IES Holdings, Inc. | $ | $ | $ | ||||||||||||||
| Increase in noncontrolling interest | ( | ( | |||||||||||||||
| Net income attributable to restricted shareholders of IES Holdings, Inc. | ( | ( | ( | ||||||||||||||
| Net income attributable to common shareholders of IES Holdings, Inc. | $ | $ | $ | ||||||||||||||
| Denominator: | |||||||||||||||||
| Weighted average common shares outstanding — basic | |||||||||||||||||
| Effect of dilutive stock options and non-vested securities | |||||||||||||||||
| Weighted average common and common equivalent shares outstanding — diluted | |||||||||||||||||
| Earnings per share attributable to common shareholders of IES Holdings, Inc.: | |||||||||||||||||
| Basic | $ | $ | $ | ||||||||||||||
| Diluted | $ | $ | $ | ||||||||||||||
For the years ended September 30, 2021, 2020, and 2019, the average price of our common shares exceeded the exercise price of outstanding options; therefore, outstanding stock options were included in the computation of diluted earnings per share.
7. DETAIL OF CERTAIN BALANCE SHEET ACCOUNTS
Accounts payable and accrued expenses consist of the following:
| Year Ended September 30, | |||||||||||
| 2021 | 2020 | ||||||||||
| Accounts payable, trade | $ | $ | |||||||||
| Accrued compensation and benefits | |||||||||||
| Accrued insurance liabilities | |||||||||||
| Current operating lease liabilities | |||||||||||
| Other accrued expenses | |||||||||||
| $ | $ | ||||||||||
56
Other non-current assets are comprised of the following:
| Year Ended September 30, | |||||||||||
| 2021 | 2020 | ||||||||||
| Executive Savings Plan assets | $ | $ | |||||||||
| Securities and equity investments | |||||||||||
| Right of use asset - finance leases | |||||||||||
| Other | |||||||||||
| Total | $ | $ | |||||||||
8. DEBT
Debt consists of the following:
| Year Ended September 30, | |||||||||||
| 2021 | 2020 | ||||||||||
| Revolving loan (long-term debt) | $ | $ | |||||||||
Debt issuance costs (1) | ( | — | |||||||||
| Other long-term debt | |||||||||||
| Total debt | $ | $ | |||||||||
(1) At September 30, 2020, the remaining unamortized debt issuance costs of $736 , were reclassified to Other non-current assets on the Consolidated Balance Sheets.
At September 30, 2021, we had $40,339 of outstanding borrowings, $4,527 in outstanding letters of credit and $55,134 of availability under our revolving credit facility with Wells Fargo Bank, N.A. ("Wells Fargo"). Following the amendment discussed below of our Prior Credit Agreement (as defined below) on December 2, 2021, all amounts outstanding under our revolving credit facility are due and payable in September 2026, upon expiration of our revolving credit facility, and all amounts described as available are available without triggering our financial covenants under the Amended Credit Agreement (as defined below).
The interest rate on outstanding borrowings under our revolving credit facility was 1.38 % at September 30, 2021. For the years ended September 30, 2021, 2020 and 2019, we incurred interest expense of $962 , $777 and $1,857 , respectively.
The Revolving Credit Facility
We maintain a revolving credit facility pursuant to an agreement with Wells Fargo (as amended, the "Prior Credit Agreement"). On December 2, 2021, we amended the Prior Credit Agreement (the "Ninth Amendment" and the Prior Credit Agreement as so amended, the "Amended Credit Agreement") to, among other things, increase the size of the facility from $100,000 to $125,000 , reduce our required minimum Liquidity (as defined in the Amended Credit Agreement) from $20,000 to $12,500 , and extend the maturity date from September 30, 2024 to September 30, 2026. Please see Note 20 - "Subsequent Events" for further information about the terms of the Ninth Amendment.
Terms of the Prior Credit Agreement
The Prior Credit Agreement contains customary affirmative, negative and financial covenants, as well as customary events of default.
As of September 30, 2021, we were in compliance with the financial covenants in effect as of that date under the Prior Credit Agreement, requiring that we maintain:
• a Fixed Charge Coverage Ratio (as defined in the Prior Credit Agreement), measured quarterly on a trailing four-quarter basis at the end of each quarter, of at least 1.1 to 1.0; and
• minimum Liquidity of at least twenty percent (20%) of the Maximum Revolver Amount (as defined in the Prior Credit Agreement), or $20,000; with, for purposes of this covenant, at least fifty percent (50%) of our Liquidity comprised of Excess Availability (as defined in the Prior Credit Agreement).
At September 30, 2021, our Liquidity was $78,239 , our Excess Availability was $55,134 (or greater than 50% of minimum Liquidity), and our Fixed Charge Coverage Ratio was 12.0 :1.0.
57
9. LEASES
We enter into various contractual arrangements for the right to use facilities, vehicles and equipment. The lease term generally ranges from two to ten years for facilities and three to five years for vehicles and equipment. Our lease terms may include the exercise of renewal or termination options when it is reasonably certain these options will be exercised. Our lease agreements do not contain any material residual value guarantees or restrictive covenants.
Current operating and finance liabilities of $13,973 and $1,033 , respectively, were included in "" in the Consolidated Balance Sheets as of September 30, 2021. Non-current finance lease liabilities and finance lease right-of-use assets were included in the "" and "", respectively, in the Consolidated Balance Sheets.
The maturities of our lease liabilities as of September 30, 2021, are as follows:
| Operating Leases | Finance Leases | Total | |||||||||||||||
| 2022 | $ | $ | $ | ||||||||||||||
| 2023 | |||||||||||||||||
| 2024 | |||||||||||||||||
| 2025 | |||||||||||||||||
| 2026 | |||||||||||||||||
| Thereafter | |||||||||||||||||
| Total undiscounted lease payments | $ | $ | $ | ||||||||||||||
| Less: imputed interest | |||||||||||||||||
| Present value of lease liabilities | $ | $ | $ | ||||||||||||||
The total future undiscounted cash flows related to lease agreements committed to but not yet commenced as of September 30, 2021, is $7,296 .
Lease cost recognized in our Consolidated Statements of Comprehensive Income is summarized as follows:
| Year Ended September 30, | |||||||||||
| 2021 | 2020 | ||||||||||
| Operating lease cost | $ | $ | |||||||||
| Finance lease cost | |||||||||||
| Amortization of lease assets | |||||||||||
| Interest on lease liabilities | |||||||||||
| Finance lease cost | |||||||||||
| Short-term lease cost | |||||||||||
| Variable lease cost | |||||||||||
| Total lease cost | $ | $ | |||||||||
58
| Year Ended September 30, | |||||||||||
| 2021 | 2020 | ||||||||||
| Operating cash flows used for operating leases | $ | $ | |||||||||
| Operating cash flows used for finance leases | |||||||||||
| Right-of-use assets obtained in exchange for new operating lease liabilities | |||||||||||
| Right-of-use assets obtained in exchange for new finance lease liabilities | |||||||||||
| Year Ended September 30, | |||||||||||
| 2021 | 2020 | ||||||||||
| Weighted-average remaining lease term - operating leases | |||||||||||
| Weighted-average remaining lease term - finance leases | |||||||||||
| Weighted-average discount rate - operating leases | % | % | |||||||||
| Weighted-average discount rate - finance leases | % | % | |||||||||
For a discussion of leases with certain related parties which are included above, see Note 13, “Related-Party Transactions.”
10. INCOME TAXES
Federal and state income tax provisions are as follows:
| Year Ended September 30, | |||||||||||||||||
| 2021 | 2020 | 2019 | |||||||||||||||
| Federal: | |||||||||||||||||
| Current | $ | $ | ( | $ | ( | ||||||||||||
| Deferred | |||||||||||||||||
| State: | |||||||||||||||||
| Current | |||||||||||||||||
| Deferred | ( | ( | |||||||||||||||
| Total provision for income taxes | $ | $ | $ | ||||||||||||||
Actual income tax expense differs from income tax expense computed by applying the U.S. federal statutory corporate rate to income (loss) before income taxes as follows:
| Year Ended September 30, | |||||||||||||||||
| 2021 | 2020 | 2019 | |||||||||||||||
| Provision at the federal statutory rate | $ | $ | $ | ||||||||||||||
| Increase resulting from: | |||||||||||||||||
| Non-deductible expenses | |||||||||||||||||
| State income taxes, net of federal deduction | |||||||||||||||||
| Other | |||||||||||||||||
| Decrease resulting from: | |||||||||||||||||
| Share-based compensation | ( | ( | ( | ||||||||||||||
| Change in valuation allowance | ( | ( | ( | ||||||||||||||
| Contingent tax liabilities | ( | ( | ( | ||||||||||||||
| Component 2 goodwill utilization | ( | ( | ( | ||||||||||||||
| Other | ( | ( | |||||||||||||||
| Total provision for income taxes | $ | $ | $ | ||||||||||||||
Deferred income tax provisions result from temporary differences in the recognition of income and expenses for financial reporting purposes and for income tax purposes. The income tax effects of these temporary differences, representing deferred income tax assets and liabilities, result principally from the following:
59
| Year Ended September 30, | |||||||||||
| 2021 | 2020 | ||||||||||
| Deferred income tax assets: | |||||||||||
| Allowance for credit losses | $ | $ | |||||||||
| Accrued expenses | |||||||||||
| Net operating loss carryforward | |||||||||||
| Various reserves | |||||||||||
| Equity losses in affiliate | |||||||||||
| Share-based compensation | |||||||||||
| Capital loss carryforward | |||||||||||
| Lease asset | |||||||||||
| Other | |||||||||||
| Subtotal | |||||||||||
| Less valuation allowance | |||||||||||
| Total deferred income tax assets | |||||||||||
| Deferred income tax liabilities: | |||||||||||
| Property and equipment | |||||||||||
| Intangible assets | |||||||||||
| Lease liability | |||||||||||
| Other | |||||||||||
| Total deferred income tax liabilities | |||||||||||
| Net deferred income tax assets | $ | $ | |||||||||
In fiscal 2021 and 2020, the valuation allowance on our deferred tax assets decreased by $118 and $3,334 , respectively, which is included in “Provision (benefit) for income taxes” in our Consolidated Comprehensive Income Statement.
As of September 30, 2021, we had available approximately $120,248 of federal net tax operating loss carry forward for federal income tax purposes, including $103,681 from net operating losses on which no tax benefit has been recognized and has not been recorded as a deferred tax asset. This carry forward, which may provide future tax benefits, will begin to expire in 2029. As of September 30, 2021, we had available approximately $61,396 state net tax operating loss carry forwards, including $5,398 from net operating losses on which no tax benefit has been recognized and has not been recorded as a deferred tax asset. The significant majority of these carry forwards, which may provide future tax benefits, will not begin to expire until 2026. We have provided valuation allowances on all net operating losses where it is determined it is more likely than not that they will expire without being utilized.
In assessing the realizability of deferred tax assets at September 30, 2021, we considered whether it was more likely than not that some portion or all of the deferred tax assets will not be realized. Our realization of deferred tax assets is dependent upon the generation of future taxable income during the periods in which these temporary differences become deductible. As a result, we have recorded a net deferred tax asset of $19,009 on our Consolidated Balance Sheets. We will continue to evaluate the appropriateness of our remaining deferred tax assets and need for valuation allowances on a quarterly basis.
As a result of a 2006 reorganization and related adjustment to the book basis in goodwill, we have tax basis in excess of book basis in amortizable goodwill of approximately $3,869 . The tax basis in amortizable goodwill in excess of book basis is not reflected as a deferred tax asset. To the extent the amortization of the excess tax basis results in a cash tax benefit, the benefit will first go to reduce goodwill, then other long-term intangible assets, and then tax expense.
GAAP requires financial statement reporting of the expected future tax consequences of uncertain tax return reporting positions on the presumption that all relevant tax authorities possess full knowledge of those tax reporting positions, as well as all of the pertinent facts and circumstances, but it prohibits discounting of any of the related tax effects for the time value of money. The evaluation of a tax position is a two-step process. The first step is the recognition process to determine if it is more likely than not that a tax position will be sustained upon examination by the appropriate taxing authority, based on the technical merits of the position. The second step is a measurement process whereby a tax position that meets the more likely than not recognition threshold is calculated to determine the amount of benefit/expense to recognize in the financial statements. The tax position is measured at the largest amount of benefit/expense that is more likely than not of being realized upon ultimate settlement.
A reconciliation of the beginning and ending balances of unrecognized tax benefit is as follows:
60
| Year Ended September 30, | |||||||||||
| 2021 | 2020 | ||||||||||
| Balance at beginning of period | $ | $ | |||||||||
| Additions for position related to current year | |||||||||||
| Additions for positions of prior years | |||||||||||
| Reduction resulting from the lapse of the applicable statutes of limitations | |||||||||||
| Balance at end of period | $ | $ | |||||||||
As of September 30, 2021 and 2020, $21,879 and $24,861 , respectively, of unrecognized tax benefits would result in a decrease in the provision for income tax expense. We anticipate that approximately $159 in liabilities for unrecognized tax benefits, including accrued interest, primarily from net operating losses on which no tax benefit has been recognized, may be reversed in the next twelve months. The reversal is predominately due to the expiration of the statutes of limitation for unrecognized tax benefits.
We had approximately $50 and $55 accrued for the payment of interest and penalties at September 30, 2021, and 2020, respectively. We recognize interest and penalties related to unrecognized tax benefits as part of the provision for income taxes.
The tax years ended September 30, 2018, and forward are subject to federal audit as are tax years prior to September 30, 2018, to the extent of unutilized net operating losses generated in those years. The tax years ended September 30, 2017, and forward are subject to state audits as are tax years prior to September 30, 2017, to the extent of unutilized net operating losses generated in those years.
11. OPERATING SEGMENTS
We manage and measure performance of our business in four distinct operating segments: Communications, Residential, Infrastructure Solutions and Commercial & Industrial. These segments are reflective of how the Company’s Chief Operating Decision Maker (“CODM”) reviews operating results for the purposes of allocating resources and assessing performance. The Company’s CODM is its Chief Executive Officer.
Transactions between segments, if any, are eliminated in consolidation. Our corporate office provides general and administrative services, as well as support services, to our four operating segments. Management allocates certain shared costs among segments for selling, general and administrative expenses and depreciation expense.
Segment information for the years ended September 30, 2021, 2020 and 2019 is as follows:
| Year Ended September 30, 2021 | ||||||||||||||||||||||||||||||||||||||
| Communications | Residential | Infrastructure Solutions | Commercial & Industrial | Corporate | Total | |||||||||||||||||||||||||||||||||
| Revenues | $ | $ | $ | $ | $ | $ | ||||||||||||||||||||||||||||||||
| Cost of services | ||||||||||||||||||||||||||||||||||||||
| Gross profit | ||||||||||||||||||||||||||||||||||||||
| Selling, general and administrative | ||||||||||||||||||||||||||||||||||||||
| Contingent consideration | ||||||||||||||||||||||||||||||||||||||
| Loss (gain) on sale of assets | ( | ( | ( | ( | ( | |||||||||||||||||||||||||||||||||
| Income (loss) from operations | $ | $ | $ | $ | $ | ( | $ | |||||||||||||||||||||||||||||||
| Other data: | ||||||||||||||||||||||||||||||||||||||
| Depreciation and amortization expense | $ | $ | $ | $ | $ | $ | ||||||||||||||||||||||||||||||||
| Capital expenditures | $ | $ | $ | $ | $ | $ | ||||||||||||||||||||||||||||||||
| Total assets | $ | $ | $ | $ | $ | $ | ||||||||||||||||||||||||||||||||
61
| Year Ended September 30, 2020 | ||||||||||||||||||||||||||||||||||||||
| Communications | Residential | Infrastructure Solutions | Commercial & Industrial | Corporate | Total | |||||||||||||||||||||||||||||||||
| Revenues | $ | $ | $ | $ | $ | $ | ||||||||||||||||||||||||||||||||
| Cost of services | ||||||||||||||||||||||||||||||||||||||
| Gross profit | ||||||||||||||||||||||||||||||||||||||
| Selling, general and administrative | ||||||||||||||||||||||||||||||||||||||
| Goodwill impairment expense | ||||||||||||||||||||||||||||||||||||||
| Contingent consideration | ( | ( | ||||||||||||||||||||||||||||||||||||
| Loss (gain) on sale of assets | ( | |||||||||||||||||||||||||||||||||||||
| Income (loss) from operations | $ | $ | $ | $ | ( | $ | ( | $ | ||||||||||||||||||||||||||||||
| Other data: | ||||||||||||||||||||||||||||||||||||||
| Depreciation and amortization expense | $ | $ | $ | $ | $ | $ | ||||||||||||||||||||||||||||||||
| Capital expenditures | $ | $ | $ | $ | $ | $ | ||||||||||||||||||||||||||||||||
| Total assets | $ | $ | $ | $ | $ | $ | ||||||||||||||||||||||||||||||||
| Year Ended September 30, 2019 | ||||||||||||||||||||||||||||||||||||||
| Communications | Residential | Infrastructure Solutions | Commercial & Industrial | Corporate | Total | |||||||||||||||||||||||||||||||||
| Revenues | $ | $ | $ | $ | $ | $ | ||||||||||||||||||||||||||||||||
| Cost of services | ||||||||||||||||||||||||||||||||||||||
| Gross profit | ||||||||||||||||||||||||||||||||||||||
| Selling, general and administrative | ||||||||||||||||||||||||||||||||||||||
| Contingent consideration | ( | ( | ( | |||||||||||||||||||||||||||||||||||
| Loss (gain) on sale of assets | ( | ( | ( | |||||||||||||||||||||||||||||||||||
| Income (loss) from operations | $ | $ | $ | $ | $ | ( | $ | |||||||||||||||||||||||||||||||
| Other data: | ||||||||||||||||||||||||||||||||||||||
| Depreciation and amortization expense | $ | $ | $ | $ | $ | $ | ||||||||||||||||||||||||||||||||
| Capital expenditures | $ | $ | $ | $ | $ | $ | ||||||||||||||||||||||||||||||||
| Total assets | $ | $ | $ | $ | $ | $ | ||||||||||||||||||||||||||||||||
12. STOCKHOLDERS’ EQUITY
Equity Incentive Plan
The Company’s 2006 Equity Incentive Plan, as amended and restated (the “Equity Incentive Plan”), provides for grants of stock options as well as grants of stock, including restricted stock. Approximately 3.0 million shares of common stock are authorized for issuance under the Equity Incentive Plan, of which approximately 817,452 shares were available for issuance at September 30, 2021.
We measure and record compensation expense for all share-based payment awards based on the fair value of the awards granted at the date of grant. The fair value of restricted stock awards and phantom stock unit awards is determined based on the number of shares granted and the closing price of IES’s common stock on the date of grant. For awards vesting upon achievement of a market condition, the likelihood of achieving that market condition is considered in determining the fair value of the grant, which we expense ratably over the vesting period. For awards vesting upon achievement of a performance condition, we record expense based on the grant date fair value when it becomes probable the performance condition will be achieved. Forfeitures are recorded in the period in which they occur. The resulting compensation expense is recognized on a straight-line basis over the requisite service period, which is generally the vesting period.
Stock Repurchase Program
In 2015, our Board authorized a stock repurchase program for the purchase from time to time of up to 1.5 million shares of the Company’s common stock, and on May 2, 2019, our Board authorized the repurchase from time to time of an additional 1.0 million
62
shares of the Company's common stock under the stock repurchase program. Share purchases are made for cash in open market transactions at prevailing market prices or in privately negotiated transactions or otherwise. The timing and amount of purchases under the program are determined based upon prevailing market conditions, our liquidity requirements, contractual restrictions and other factors. All or part of the repurchases may be implemented under a Rule 10b5-1 trading plan, which allows repurchases under predetermined terms at times when the Company might otherwise be prevented from purchasing under insider trading laws or because of self-imposed blackout periods. The program does not require the Company to purchase any specific number of shares and may be modified, suspended or reinstated at any time at the Company’s discretion and without notice.
We repurchased 124,205 shares of our common stock during the year ended September 30, 2021, in open market transactions at an average price of $44.40 per share.
We repurchased 263,160 shares of our common stock during the year ended September 30, 2020, in open market transactions at an average price of $23.29 per share.
Treasury Stock
During the year ended September 30, 2021, we issued 140,280 shares of common stock from treasury and repurchased 32,323 shares of common stock from our employees to satisfy statutory tax withholding requirements upon the vesting of certain performance phantom stock units under the Equity Incentive Plan. We also repurchased 124,205 shares of common stock on the open market pursuant to our stock repurchase program, and 13,996 shares were forfeited by former employees and returned to treasury stock. During the year ended September 30, 2021, we issued 380 unrestricted shares of common stock from treasury to members of our Board of Directors as part of their overall compensation.
During the year ended September 30, 2020, we issued 113,408 shares of common stock from treasury and repurchased 56,806 shares of common stock from our employees to satisfy statutory tax withholding requirements upon the vesting of certain performance phantom stock units under the Equity Incentive Plan. We also repurchased 263,160 shares of common stock on the open market pursuant to our stock repurchase program, and 208,597 shares were forfeited by former employees and returned to treasury stock. During the year ended September 30, 2020, we issued 6,789 unrestricted shares of common stock from treasury to members of our Board of Directors as part of their overall compensation and 5,750 unrestricted shares to satisfy the exercise of outstanding options.
Restricted Stock
During the years ended September 30, 2021, 2020, and 2019, we recognized $145 , $2,441 , and $776 , respectively, in compensation expense related to our restricted stock awards. During the year ended September 30, 2020, $1,100 of the compensation expense was settled with cash. At September 30, 2021, the unamortized compensation cost related to outstanding unvested restricted stock was $167 . A summary of restricted stock awards for the years ended September 30, 2021, 2020, and 2019 is provided in the table below:
| Year Ended September 30, | |||||||||||||||||
| 2021 | 2020 | 2019 | |||||||||||||||
| Unvested at beginning of year | |||||||||||||||||
| Granted | |||||||||||||||||
| Vested | ( | ( | |||||||||||||||
| Forfeited | ( | ( | |||||||||||||||
| Unvested at end of year | |||||||||||||||||
The fair value of shares vesting during the years ended September 30, 2021, 2020, and 2019 was $308 , $2,984 and zero , respectively. Fair value was calculated as the number of shares vested times the market price of shares on the date of vesting. The weighted average grant date fair value of unvested restricted stock at September 30, 2021 was $21.56 .
All the restricted shares granted under the Equity Incentive Plan (vested or unvested) participate in dividends issued to common shareholders, if any.
Director Phantom Stock Units
Director phantom stock units (“Director PSUs”) are primarily granted to the members of the Board of Directors as part of their overall compensation. These Director PSUs are contractual rights to receive one share of the Company's common stock and are paid via unrestricted stock grants to each director upon their departure from the Board of Directors. We record compensation expense for the full value of the grant on the date of grant. For the years ended September 30, 2021, 2020, and 2019, we recognized $376 , $390 , and $300 , respectively, in compensation expense related to these grants.
63
Employee Phantom Stock Units
An employee phantom stock unit (an “Employee PSU”) is a contractual right to receive one share of the Company’s common stock. Depending on the terms of each grant, Employee PSUs may vest upon the achievement of certain specified performance objectives and continued performance of services, or may vest based on continued performance of services through the vesting date.
As of September 30, 2020, the Company had outstanding Employee PSUs, which, subject to the achievement of certain performance metrics, could have resulted in the issuance of 204,501 shares of common stock. During the year ended September 30, 2021, 13,402 Employee PSUs were forfeited and 71,420 vested, and the Company granted additional Employee PSUs, which, subject to the achievement of certain performance metrics, could result in the issuance of 163,264 shares of common stock. As of September 30, 2021, a maximum of 282,942 shares of common stock may be issued under outstanding Employee PSUs.
13. RELATED-PARTY TRANSACTIONS
The Company is a party to a sublease agreement with Tontine Associates, for corporate office space in Greenwich, Connecticut. The lease was renewed in November 2019, with monthly rent of approximately $8 . Payments by the Company are at a rate consistent with that paid by Tontine Associates to its landlord. See Note 3, “Controlling Shareholder” for additional information regarding Tontine.
14. EMPLOYEE BENEFIT PLANS
401(k) Plan
In November 1998, we established the IES Holdings, Inc. 401(k) Retirement Savings Plan. All full-time IES employees are eligible to participate on the first day of the month subsequent to completing sixty days of service and attaining age twenty-one. Participants become vested in our matching contributions following three years of service. We also maintain several subsidiary retirement savings plans. We recognized $3,386 , $2,326 , and $2,144 in matching expenses in fiscal years 2021, 2020, and 2019, respectively.
Executive Savings Plan
Under the Executive Deferred Compensation Plan adopted on July 1, 2004 (the “Executive Savings Plan”), certain employees are permitted to defer a portion (up to 75%) of their base salary and/or bonus for a plan year. The Human Resources and Compensation Committee of the Board of Directors may, in its sole discretion, credit one or more participants with an employer deferral (contribution) in such amount as the Committee may choose (“Employer Contribution”). The Employer Contribution, if any, may be a fixed dollar amount, a fixed percentage of the participant’s compensation, base salary, or bonus, or a “matching” amount with respect to all or part of the participant’s elective deferrals for such plan year, and/or any combination of the foregoing as the Committee may choose. No compensation earned during the years ended September 30, 2021, 2020, or 2019 was deferred under this plan.
Multiemployer Pension Plan
The Infrastructure Solutions segment participates in a multiemployer direct benefit pension plan for employees covered under one of our collective bargaining agreements. We do not administer the plan. We do not significantly participate in this plan. As of December 31, 2020, this plan was funded at 84.38 %.
15. FAIR VALUE MEASUREMENTS
Fair value is considered the price to sell an asset, or transfer a liability, between market participants on the measurement date. Fair value measurements assume that (1) the asset or liability is exchanged in an orderly manner, (2) the exchange is in the principal market for that asset or liability, and (3) the market participants are independent, knowledgeable, able and willing to transact an
64
exchange. Fair value accounting and reporting establishes a framework for measuring fair value by creating a hierarchy for observable independent market inputs and unobservable market assumptions and expands disclosures about fair value measurements. Judgment is required to interpret the market data used to develop fair value estimates. As such, the estimates presented herein are not necessarily indicative of the amounts that could be realized in a current exchange. The use of different market assumptions and/or estimation methods could have a material effect on the estimated fair value.
Financial assets and liabilities measured at fair value on a recurring basis as of September 30, 2021 and 2020, are summarized in the following tables by the type of inputs applicable to the fair value measurements:
| September 30, 2021 | |||||||||||||||||
| Total Fair Value | Quoted Prices (Level 1) | Significant Unobservable (Level 3) | |||||||||||||||
| Executive savings plan assets | $ | $ | $ | — | |||||||||||||
| Executive savings plan liabilities | ( | ( | — | ||||||||||||||
| Contingent consideration liability | ( | — | ( | ||||||||||||||
| Total | $ | ( | $ | $ | ( | ||||||||||||
| September 30, 2020 | |||||||||||||||||
| Total Fair Value | Quoted Prices (Level 1) | Significant Unobservable (Level 3) | |||||||||||||||
| Executive savings plan assets | $ | $ | $ | — | |||||||||||||
| Executive savings plan liabilities | ( | ( | — | ||||||||||||||
| Total | $ | $ | $ | ||||||||||||||
In fiscal year 2021, we entered into a contingent consideration arrangement related to the acquisition of Bayonet. At September 30, 2021, we estimated the fair value of this contingent consideration liability at $4,181 . The table below presents the fair value of this obligation, which used significant unobservable inputs (Level 3).
In fiscal years 2016, 2017, and 2018, we entered into contingent consideration arrangements related to certain acquisitions. Please see Note 19, “Business Combinations” for further discussion. At September 30, 2021, we estimated the fair value of these contingent consideration liabilities at zero . The table below presents a reconciliation of the fair value of these obligations, which used significant unobservable inputs (Level 3).
| Contingent Consideration Agreement | |||||
| Fair Value at September 30, 2019 | $ | ||||
| Issuances | — | ||||
| Settlements | — | ||||
| Net adjustments to fair value | ( | ||||
| Fair Value at September 30, 2020 | $ | ||||
| Acquisitions | ( | ||||
| Net adjustments to fair value | ( | ||||
| Fair Value at September 30, 2021 | $ | ( | |||
Below is a description of the inputs used to value the assets summarized in the preceding tables:
Level 1 — Inputs represent unadjusted quoted prices for identical assets exchanged in active markets.
Level 2 — Inputs include directly or indirectly observable inputs other than Level 1 inputs such as quoted prices for similar assets exchanged in active or inactive markets; quoted prices for identical assets exchanged in inactive markets; and other inputs that are considered in fair value determinations of the assets.
65
16. INVENTORY
Inventories consist of the following components:
| September 30, | |||||||||||
| 2021 | 2020 | ||||||||||
| Raw materials | $ | $ | |||||||||
| Work in process | |||||||||||
| Finished goods | |||||||||||
| Parts and supplies | |||||||||||
| Total inventories | $ | $ | |||||||||
17. GOODWILL AND INTANGIBLE ASSETS
Goodwill
The following summarizes changes in the carrying value of goodwill by segment for the years ended September 30, 2021 and 2020:
| Communications | Residential | Infrastructure Solutions | Commercial & Industrial | Total | |||||||||||||||||||||||||
| Balance at September 30, 2019 | $ | $ | $ | $ | $ | ||||||||||||||||||||||||
| Acquisitions (Note 19) | — | — | |||||||||||||||||||||||||||
| Goodwill impairment | — | — | ( | ( | |||||||||||||||||||||||||
| Balance at September 30, 2020 | |||||||||||||||||||||||||||||
| Acquisitions (Note 19) | — | — | |||||||||||||||||||||||||||
| Balance at September 30, 2021 | $ | $ | $ | $ | $ | ||||||||||||||||||||||||
Based on the results of our annual goodwill impairment assessment at September 30, 2021, we concluded the fair value of each of our reporting units exceeded its book value, and therefore we recorded no impairment charges for the year ended September 30, 2021.
In 2020, our Commercial & Industrial reporting unit experienced operating losses. Our performance was affected by the COVID-19 pandemic and other market factors which delayed the awarding of new projects, decreased demand for new construction in market sectors such as retail, office, and hospitality, and negatively impacted our revenue, profitability and backlog. As a result of this increasingly competitive and uncertain environment, and the financial performance of this reporting unit, we concluded in performing our annual goodwill impairment assessment as of September 30, 2020 that the fair value of our Commercial & Industrial reporting unit was less than its carrying amount, which resulted in the recognition of a non-cash goodwill impairment charge of $6,976 for the year ended September 30, 2020.
Intangible Assets
Intangible assets consist of the following:
| September 30, 2021 | |||||||||||||||||||||||||||||
| Estimated Useful Lives (in Years) | Gross Carrying Amount | Accumulated Amortization | Net | ||||||||||||||||||||||||||
| Trademarks/trade names | - | $ | $ | ( | $ | ||||||||||||||||||||||||
| Technical library | ( | ||||||||||||||||||||||||||||
| Customer relationships | - | ( | |||||||||||||||||||||||||||
| Non-competition arrangements | ( | ||||||||||||||||||||||||||||
| Backlog and construction contracts | ( | ||||||||||||||||||||||||||||
| Total | $ | $ | ( | $ | |||||||||||||||||||||||||
66
| September 30, 2020 | |||||||||||||||||||||||||||||
| Estimated Useful Lives (in Years) | Gross Carrying Amount | Accumulated Amortization | Net | ||||||||||||||||||||||||||
| Trademarks/trade names | - | $ | $ | ( | $ | ||||||||||||||||||||||||
| Technical library | ( | ||||||||||||||||||||||||||||
| Customer relationships | - | ( | |||||||||||||||||||||||||||
| Non-competition arrangements | ( | ||||||||||||||||||||||||||||
| Backlog and construction contracts | ( | ||||||||||||||||||||||||||||
| Total | $ | $ | ( | $ | |||||||||||||||||||||||||
For the years ended September 30, 2021, 2020, and 2019, amortization expense of intangible assets was $13,191 , $6,424 and $3,950 , respectively. Our estimated future amortization expense for years ending September 30 is as follows:
| Year Ending September 30, | |||||
| 2022 | $ | ||||
| 2023 | |||||
| 2024 | |||||
| 2025 | |||||
| 2026 | |||||
| Thereafter | |||||
| Total | $ | ||||
18. COMMITMENTS AND CONTINGENCIES
Legal Matters
From time to time we are a party to various claims, lawsuits and other legal proceedings that arise in the ordinary course of business. We maintain various insurance coverages to minimize financial risk associated with these proceedings. None of these proceedings, separately or in the aggregate, are expected to have a material adverse effect on our financial position, results of operations or cash flows. With respect to all such proceedings, we record reserves when it is probable that a liability has been incurred and the amount of loss can be reasonably estimated. We expense routine legal costs related to these proceedings as they are incurred.
On June 22, 2021, the United States Department of Labor Wage and Hour Division (the “DOL”) notified IES Residential, Inc. (“IESR”), our subsidiary, that the DOL had commenced an administrative investigation of IESR’s compliance with laws regulating employee wage payment. The inquiry concerned overtime calculations and record keeping with respect to certain Arizona employees who are paid on a piece rate basis. In response to certain DOL requests, IESR produced documents and made employees available for interviews.
On November 10, 2021, the DOL indicated that it believes IESR piece rate employees did not record all hours worked, and therefore IESR was not in compliance with the Fair Labor Standards Act. We dispute this claim, and plan to vigorously defend ourselves. To date, the Company has not established a reserve with respect to this matter, as we believe the likelihood of our responsibility for damages is not probable and a potential range of exposure is not reasonably estimable.
Risk Management
We retain the risk for workers’ compensation, employer’s liability, automobile liability, construction defects, general liability and employee group health claims, as well as pollution coverage, resulting from uninsured deductibles per accident or occurrence which are generally subject to annual aggregate limits. Our general liability program provides coverage for bodily injury and property damage. In many cases, we insure third parties, including general contractors, as additional insured parties under our insurance policies. Losses are accrued based upon our known claims incurred and an estimate of claims incurred but not reported. As a result, many of our claims are effectively self-insured. Many claims against our insurance are in the form of litigation. At September 30, 2021 and 2020, we had $5,787 and $6,254 , respectively, accrued for self-insurance liabilities. We are also subject to construction defect liabilities, primarily within our Residential segment. As of September 30, 2021 and 2020, we had $8 and $36 , respectively, reserved
67
for these claims. Because the reserves are based on judgment and estimates, and involve variables that are inherently uncertain, such as the outcome of litigation and an assessment of insurance coverage, there can be no assurance that the ultimate liability will not be higher or lower than such estimates or that the timing of payments will not create liquidity issues for the Company.
Some of the underwriters of our casualty insurance program require us to post letters of credit as collateral. This is common in the insurance industry. To date, we have not had a situation where an underwriter has had reasonable cause to effect payment under a letter of credit. At September 30, 2021 and 2020, $4,327 and $5,464 , respectively, of our outstanding letters of credit was utilized to collateralize our insurance program.
Surety
As of September 30, 2021, the estimated cost to complete our bonded projects was approximately $80,285 . We evaluate our bonding requirements on a regular basis, including the terms offered by our sureties. We believe the bonding capacity presently provided by our current sureties is adequate for our current operations and will be adequate for our operations for the foreseeable future. Posting letters of credit in favor of our sureties reduces the borrowing availability under our revolving credit facility.
Other Commitments and Contingencies
Some of our customers and vendors require us to post letters of credit, or provide intercompany guarantees, as a means of guaranteeing performance under our contracts and ensuring payment by us to subcontractors and vendors. If our customer has reasonable cause to effect payment under a letter of credit, we would be required to reimburse our creditor for the letter of credit.
19. BUSINESS COMBINATIONS
Fiscal 2021
The Company completed four acquisitions during the year ended September 30, 2021 for a total aggregate cash consideration of $92,463 .
•Edmonson Electric, LLC ("Edmonson") - On May 18, 2021, we acquired an 80% ownership interest in Edmonson, a Land O'Lakes, Florida-based provider of residential electric, low voltage, and heating, ventilation and air conditioning (HVAC) installation services. The acquisition of Edmonson expanded our presence in the Florida market and added electrical to our Florida service offerings. Edmonson is part of our Residential segment and continues to operate under the Edmonson name.
•Bayonet Plumbing, Heating & Air-Conditioning, LLC ("Bayonet") - On December 21, 2020, we acquired an 80% ownership interest in Bayonet, a Hudson, Florida-based provider of residential HVAC and plumbing installation and maintenance services. The acquisition of Bayonet allowed us to expand into the Florida market, while adding plumbing and HVAC to our service offerings. Bayonet is part of our Residential segment and continues to operate under the Bayonet name.
•Wedlake Fabricating, Inc. (“Wedlake”) - On November 19, 2020, we acquired Wedlake, a Tulsa, Oklahoma-based manufacturer of custom generator enclosures that are primarily used by data centers and large commercial and industrial facilities. The acquisition of Wedlake expanded our generator enclosures business and our geographic footprint. Wedlake is part of our Infrastructure Solutions segment and continues to operate under the Wedlake name.
•K.E.P. Electric, Inc. (“KEP”) - On November 5, 2020, we acquired KEP, a Batavia, Ohio-based electrical contractor specializing in the design and installation of electrical systems for single-family housing and multi-family developments. The acquisition of KEP, which has operations in Ohio and Kentucky, advanced the expansion of our Residential service offerings into the Midwest. KEP is part of our Residential segment and continues to operate under the KEP name.
Total aggregate cash consideration for these acquisitions was $92,463 , of which $10,916 was paid into escrow pending discharge of the acquired companies' indebtedness under the Paycheck Protection Program ("PPP") established by the Coronavirus Aid, Relief, and Economic Security Act and implemented by the U.S. Small Business Administration. Loans made under the PPP are eligible to be forgiven if certain criteria are met. As of September 30, 2021, all PPP loans were forgiven and escrow payments have been distributed to the respective sellers.
68
In addition to the cash consideration, the purchase price also includes contingent consideration with respect to the acquisition of Bayonet of up to $4,500 due in December 2023. Amounts to be paid are contingent on earnings achieved over a three year period, and will accrue interest on the $4,500 at a rate of 3%, to be paid quarterly. This contingent liability was valued at $4,074 as of the date of the acquisition.
The Company accounted for the transactions under the acquisition method of accounting, which requires recording assets and liabilities at fair value (Level 3). The valuations derived from the estimated fair value assessments and assumptions used by management are preliminary pending finalization of certain tangible and intangible asset valuations and assessment of deferred taxes. While management believes the preliminary estimates and assumptions underlying the valuations are reasonable, different estimates and assumptions could result in different values being assigned to individual assets acquired and liabilities assumed. This may result
in further adjustments to the preliminary amounts recorded. The preliminary valuation of the assets acquired and liabilities assumed is as follows:
| Current assets | $ | ||||
| Property and equipment | |||||
| Intangible assets | |||||
| Goodwill | |||||
| Operating right of use assets | |||||
| Current liabilities | ( | ||||
| Operating long-term lease liabilities | ( | ||||
| Deferred tax liability | ( | ||||
| Noncontrolling interest | ( | ||||
| Net assets acquired | $ | ||||
With regard to goodwill, the balance is attributable to the workforce of the acquired business and other intangibles that do not qualify for separate recognition. In connection with these acquisitions, the preliminary estimate of acquired goodwill is $38,632 of which $20,741 is tax deductible.
The intangible assets acquired primarily consisted of Customer Relationships and Trade Names with a total weighted-average amortization period of 6.4 years.
These acquisitions contributed $179,628 in revenue and $6,508 in operating income during the year ended September 30, 2021.
Fiscal 2020
We completed two acquisitions in fiscal 2020 for total aggregate cash consideration of $28,952 . In February 2020, we acquired both Aerial Lighting & Electric, Inc. ("Aerial"), a Naugatuck, Connecticut-based electrical contractor specializing in the design and installation of electrical systems for multi-family developments, and Plant Power and Control Systems, L.L.C. ("PPCS"), a Birmingham, Alabama-based manufacturer and installer of custom engineered power distribution equipment.
These acquisitions contributed $21,836 in revenue and $812 in operating income during the year ended September 30, 2020.
Unaudited Pro Forma Information
The following unaudited supplemental pro forma results of operations for the year ended September 30, 2021 are calculated as if each acquisition occurred as of October 1 of the fiscal year prior to consummation.
| Unaudited | |||||||||||||||||
| Twelve Months Ended September 30, | |||||||||||||||||
| 2021 | 2020 | ||||||||||||||||
| Revenues | $ | $ | |||||||||||||||
| Net income attributable to IES Holdings, Inc. | $ | $ | |||||||||||||||
69
20. SUBSEQUENT EVENTS
On December 2, 2021, we entered into the Ninth Amendment of our Prior Credit Agreement with Wells Fargo. The Ninth Amendment, among other things, increases the maximum revolver amount from $100,000 to $125,000 , reduces our required minimum Liquidity from $20,000 to $12,500 , and extends the maturity date from September 30, 2024 to September 30, 2026. The Ninth Amendment also addresses the banking industry's transition away from the London Interbank Offered Rate ("LIBOR") as a benchmark interest rate by replacing LIBOR with the Secured Overnight Financing Rate ("SOFR") as the benchmark for establishing the interest rate charged on our borrowings.
Level | Thresholds | Interest Rate Margin | ||||||||||||
I | If Liquidity is less than 35% of the Maximum Revolver Amount at any time during the period | 2.00 percentage points | ||||||||||||
II | If Liquidity is greater than or equal to 35% of the Maximum Revolver Amount at all times during the period and less than 50% of the Maximum Revolver Amount at any time during the period | 1.75 percentage points | ||||||||||||
III | If Liquidity is greater than or equal to 50% of the Maximum Revolver Amount at all times during the period | 1.50 percentage points | ||||||||||||
70
Item 9. Changes in and Disagreements with Accountants on Accounting and Financial Disclosure
None.
Item 9A. Controls and Procedures
Changes in Internal Control Over Financial Reporting
There have not been any changes in the Company’s internal control over financial reporting (as such term is defined in Rules 13a-15 and 15d-15 under the Exchange Act) during the fiscal quarter ended September 30, 2021 that have materially affected, or are reasonably likely to materially affect, the Company’s internal control over financial reporting.
Disclosure Controls and Procedures
In accordance with Rules 13a-15 and 15d-15 under the Exchange Act, we carried out an evaluation, under the supervision and with the participation of management, including our Chief Executive Officer and our Chief Financial Officer, of the effectiveness of our disclosure controls and procedures as of the end of the period covered by this report. Based on this evaluation, our Chief Executive Officer and Chief Financial Officer concluded that our disclosure controls and procedures were effective as of September 30, 2021, to provide reasonable assurance that information required to be disclosed in our reports filed or submitted under the Exchange Act is recorded, processed, summarized and reported within the time periods specified in the SEC’s rules and forms. Our disclosure controls and procedures include controls and procedures designed to ensure that information required to be disclosed in reports filed or submitted under the Exchange Act is accumulated and communicated to our management, including our Chief Executive Officer and Chief Financial Officer, as appropriate, to allow timely decisions regarding required disclosure.
Management’s Report on Internal Control over Financial Reporting
Management, including the Company’s Chief Executive Officer and Chief Financial Officer, is responsible for establishing and maintaining adequate internal control over financial reporting for the Company. The Company’s internal control system was designed to provide reasonable assurance to the Company’s Management and Directors regarding the preparation and fair presentation of published financial statements. Because of its inherent limitations, internal control over financial reporting may not prevent or detect misstatements. Also, projections of any evaluation of effectiveness to future periods are subject to the risk that controls may become inadequate because of changes in conditions, or that the degree of compliance with the policies or procedures may deteriorate.
Management conducted an evaluation of the effectiveness of internal control over financial reporting based on the Internal Control — Integrated Framework issued by the Committee of Sponsoring Organizations of the Treadway Commission (COSO 2013 framework). Based on this assessment, our management determined that our disclosure controls and procedures were effective as of September 30, 2021.
In conducting management’s evaluation of the effectiveness of the Company’s internal controls over financial reporting, we have excluded Bayonet Plumbing, Heating & Air Conditioning, LLC, Edmonson Electric, LLC, K.E.P. Electric, Inc., and Wedlake Fabricating, Inc. because they were acquired during the year ended September 30, 2021. Excluding goodwill and intangible assets, these operations accounted for 11 percent of our total assets at September 30, 2021, and 12 percent of our consolidated revenues for the year then ended.
Ernst & Young LLP, an independent registered public accounting firm that has audited the Company’s financial statements as of and for the three-year period ended September 30, 2021, has issued a report on their audit of management’s internal control over financial reporting, which is included herein.
Item 9B. Other Information
None.
71
PART III
Item 10. Directors, Executive Officers and Corporate Governance
The information required to be included in Item 10 of Part III of this Annual Report on Form 10-K is incorporated by reference from the section entitled "Executive Officers of the Registrant" in Part I of this Annual Report on Form 10-K and the sections entitled “Security Ownership of Certain Beneficial Owners and Management,” “Report of the Audit Committee” and “Election of Directors” in the Company’s definitive Proxy Statement for its 2022 Annual Meeting of Stockholders (the “Proxy Statement”) to be filed with the SEC no later than January 28, 2022.
Item 11. Executive Compensation
The information required to be included in Item 11 of Part III of this Annual Report on Form 10-K is incorporated by reference from the section entitled “Executive Compensation” in the Proxy Statement.
Item 12. Security Ownership of Certain Beneficial Owners and Management and Related Stockholders Matters
Certain information required to be included in Item 12 of Part III of this Annual Report on Form 10-K is incorporated by reference from the section entitled “Security Ownership of Certain Beneficial Owners and Management” in the Proxy Statement.
Securities Authorized for Issuance Under Equity Plans
The following table provides information as of September 30, 2021 with respect to shares of our common stock that may be issued upon the exercise of options, warrants and rights granted to employees, consultants or members of the Board of Directors under the Company’s existing equity compensation plans. For additional information about our equity compensation plans, see Note 12, “Stockholders’ Equity” in the notes to our Consolidated Financial Statements set forth in Item 8. “Financial Statements and Supplementary Data” of this Annual Report on Form 10-K.
Equity Compensation Plan Information
| Plan Category | (a) Number of Securities to be Issued Upon Exercise of Outstanding Options, Warrants and Rights | (b) Weighted-Average Exercise Price of Outstanding Options, Warrants and Rights | (c) Number of Securities Remaining Available for Future Issuance Under Equity Compensation Plans (Excluding Securities Reflected in Column (a)) | |||||||||||||||||
| Equity compensation plans approved by security holders | 282,942 | $ | — | 817,452 (1) | ||||||||||||||||
| Equity compensation plans not approved by security holders | 16,000 | (2) | $ | 6.49 | — | |||||||||||||||
(1) Represents shares available for issuance under the Company's 2006 Equity Incentive Plan, as amended and restated effective February 9, 2016 (the "Amended Plan"). This plan provides for the granting or awarding of stock options, stock, restricted stock and other forms of equity to employees (including officers), consultants and directors of the Company. This includes 282,942 shares that may be issued pursuant to outstanding performance based phantom stock units ("PPSUs") based on achievement of performance metrics, where applicable, and otherwise assuming the target award is met.
(2) Represents shares issuable upon exercise of outstanding options granted under the Company’s 2006 Equity Incentive Plan (as amended and restated as of October 2007), which was in place prior to the Amended Plan. This includes 16,000 options with a weighted-average term of 3.46 years.
Item 13. Certain Relationships and Related Transactions, and Director Independence
The information required to be included in Item 13 of Part III of this Annual Report on Form 10-K is incorporated by reference from the section entitled “Certain Relationships and Related Person Transactions” in the Proxy Statement.
Item 14. Principal Accountant Fees and Services
72
The information required to be included in Item 14 of Part III of this Form 10-K is incorporated by reference from the section entitled “Audit Fees” in the Proxy Statement.
PART IV
Item 15. Exhibits, Financial Statement Schedules
(a) Financial Statements and Supplementary Data, Financial Statement Schedules and Exhibits
See Index to Financial Statements under Item 8. “Financial Statements and Supplementary Data” of this Form 10-K.
(b) Exhibits
Exhibit No. | Description | ||||
| 3.1 — | |||||
| 3.2 — | |||||
| 3.3 — | |||||
| 3.4 — | |||||
| 4.1 — | |||||
| 4.2 — | |||||
| 4.3 — | |||||
| 4.4 — | |||||
| 10.1 — | |||||
| 10.2 — | |||||
| 10.3 — | |||||
| 10.4 — | |||||
73
| 10.5 — | |||||
| 10.6 — | |||||
| 10.7 — | |||||
| 10.8 — | |||||
| 10.9 — | |||||
| 10.10 — | |||||
| 10.11 — | |||||
| 10.12 — | |||||
| 10.13 — | |||||
| 10.14 — | |||||
| 10.15 — | |||||
| 10.16 — | |||||
| 10.17 — | |||||
| 10.18 — | |||||
| 10.19 — | |||||
74
| 10.20 — | |||||
| *10.21 — | |||||
| *10.22 — | |||||
| *10.23 — | |||||
| *10.24 — | |||||
| *10.25 — | |||||
| *10.26 — | |||||
| *10.27 — | |||||
| *10.28 — | |||||
| *10.29 — | |||||
| *10.30 — | |||||
| *10.31 — | |||||
| *10.32 — | |||||
| *10.33 — | |||||
| *10.34 — | |||||
| *10.35 — | |||||
| *10.36 — | |||||
| *10.37 — | |||||
| *10.38 — | |||||
| *10.39 — | |||||
| *10.40 — | |||||
| 21.1 — | |||||
75
| 23.1 — | |||||
| 31.1 — | |||||
| 31.2 — | |||||
| 32.1 — | |||||
| 32.2 — | |||||
| 101.INS | Inline XBRL Instance Document - the instance document does not appear in the Interactive Data File because its XBRL tags are embedded within the Inline XBRL document (1) | ||||
| 101.SCH | Inline XBRL Schema Document (1) | ||||
| 101.LAB | Inline XBRL Label Linkbase Document (1) | ||||
| 101.PRE | Inline XBRL Presentation Linkbase Document (1) | ||||
| 101.DEF | Inline XBRL Definition Linkbase Document (1) | ||||
| 101.CAL | Inline XBRL Calculation Linkbase Document (1) | ||||
| 104 — | Cover Page Interactive Data File - the cover page interactive data file does not appear in the Interactive Data File because its XBRL tags are embedded within the Inline XBRL document | ||||
| * | Management contracts or compensatory plans or arrangements required to be filed herewith pursuant to Item 15(a)(3) of this Annual Report on Form 10-K. | ||||
| (1) | Filed herewith. | ||||
| (2) | Furnished herewith. | ||||
76
SIGNATURES
Pursuant to the requirements of Section 13 or 15(d) of the Securities Exchange Act of 1934, the Registrant has duly caused this report to be signed on its behalf by the undersigned, thereunto duly authorized, on December 3, 2021.
IES HOLDINGS, INC.
| By: | /s/ Jeffrey L. Gendell | |||||||
Jeffrey L. Gendell
Chief Executive Officer and Chairman of the Board
POWER OF ATTORNEY
KNOW ALL MEN BY THESE PRESENTS, that each of the undersigned officers and directors of IES HOLDINGS, INC. hereby constitutes and appoints Jeffrey L. Gendell and Tracy A. McLauchlin, and each of them individually, as his true and lawful attorneys-in-fact and agents, with full power of substitution, for him and on his behalf and in his name, place and stead, in any and all capacities, to sign, execute and file any or all amendments to this report, with any and all exhibits thereto, and all other documents required to be filed therewith, with the Securities and Exchange Commission or any regulatory authority, granting unto each such attorney-in-fact and agent, full power and authority to do and perform each and every act and thing requisite and necessary to be done in and about the premises in order to effectuate the same, as fully to all intents and purposes as he himself might or could do, if personally present, hereby ratifying and confirming all that said attorneys-in-fact and agents, or either of them, or their or his substitutes or substitute, may lawfully do or cause to be done by virtue hereof.
SIGNATURES
Pursuant to the requirements of the Securities Exchange Act of 1934, this report has been signed below by the following persons on behalf of the Registrant and in the capacities and on the dates indicated.
| Signature | Title | Date | |||||||||
| /s/ Jeffrey L. Gendell | Chief Executive Officer and Chairman of the Board | December 3, 2021 | |||||||||
| Jeffrey L. Gendell | (Principal Executive Officer) | ||||||||||
/s/ Tracy A. McLauchlin | Senior Vice President, Chief Financial Officer and Treasurer | December 3, 2021 | |||||||||
| Tracy A. McLauchlin | (Principal Financial Officer) | ||||||||||
| /s/ Alison M. Petersen | Vice President, Chief Accounting Officer | December 3, 2021 | |||||||||
| Alison M. Petersen | (Principal Accounting Officer) | ||||||||||
| /s/ Todd M. Cleveland | Director | December 3, 2021 | |||||||||
| Todd M. Cleveland | |||||||||||
/s/ Joseph L. Dowling III | Director | December 3, 2021 | |||||||||
| Joseph L. Dowling III | |||||||||||
/s/ David B. Gendell | Director | December 3, 2021 | |||||||||
| David B. Gendell | |||||||||||
/s/ Joe D. Koshkin | Director | December 3, 2021 | |||||||||
| Joe D. Koshkin | |||||||||||
/s/ Elizabeth D. Leykum | Director | December 3, 2021 | |||||||||
| Elizabeth D. Leykum | |||||||||||
77
Serious News for Serious Traders! Try StreetInsider.com Premium Free!
You May Also Be Interested In
- Netevia and BLUbeem by Brink's Partner to Enhance Financial Offerings for Retail and Hospitality Industries
- F3 Intersects Radioactivity Across Multiple Zones
- RESULT OF RIKSBANK CERTIFICATE SALE
Create E-mail Alert Related Categories
SEC FilingsSign up for StreetInsider Free!
Receive full access to all new and archived articles, unlimited portfolio tracking, e-mail alerts, custom newswires and RSS feeds - and more!
