

Form 10-K Howard Hughes Corp For: Dec 31
 Tweet
Tweet Share
ShareUNITED STATES SECURITIES AND EXCHANGE COMMISSION
Washington, D.C. 20549
FORM 10-K
(MARK ONE)
For the fiscal year ended December 31 , 2021
or
For the transition period from to
Commission File Number 001-34856

(Exact name of registrant as specified in its charter)
| (State or other jurisdiction of incorporation or organization) | (I.R.S. Employer Identification Number) | ||||
(Address of principal executive offices, including zip code)
Registrant’s telephone number, including area code (281) 719-6100
Securities registered pursuant to Section 12(b) of the Act:
| Title of each class: | Trading Symbol(s) | Name of each exchange on which registered: | |||||||||||||||
Indicate by check mark if the registrant is a well-known seasoned issuer, as defined in Rule 405 of the Securities Act. Yes ☒ No ☐
Indicate by check mark if the registrant is not required to file reports pursuant to Section 13 or Section 15(d) of the Act. Yes ☐ No ☒
Indicate by check mark whether the registrant (1) has filed all reports required to be filed by Section 13 or 15(d) of the Securities Exchange Act of 1934 during the preceding 12 months (or for such shorter period that the registrant was required to file such reports), and (2) has been subject to such filing requirements for the past 90 days. Yes ☒ No ☐
Indicate by check mark whether the registrant has submitted electronically every Interactive Data File required to be submitted pursuant to Rule 405 of Regulation S-T (§232.405 of this chapter) during the preceding 12 months (or for such shorter period that the registrant was required to submit such files). Yes ☒ No ☐
Indicate by check mark whether the registrant is a large accelerated filer, an accelerated filer, a non-accelerated filer, a smaller reporting company, or an emerging growth company. See the definitions of “large accelerated filer,” “accelerated filer,” “smaller reporting company,” and “emerging growth company” in Rule 12b-2 of the Exchange Act.
| ☒ | Accelerated filer | ☐ | Emerging growth company | ||||||||||||||||||||
| Non-accelerated filer | ☐ | Smaller reporting company | |||||||||||||||||||||
If an emerging growth company, indicate by check mark if the registrant has elected not to use the extended transition period for complying with any new or revised financial accounting standards provided pursuant to Section 13(a) of the Exchange Act. ☐
Indicate by check mark whether the registrant has filed a report on and attestation to its management’s assessment of the effectiveness of its internal control over financial reporting under Section 404(b) of the Sarbanes-Oxley Act (15 U.S.C. 7262(b)) by the registered public accounting firm that prepared or issued its audit report. ☒
Indicate by check mark whether the registrant is a shell company (as defined in Rule 12b-2 of the Act). Yes ☐ No ☒
As of June 30, 2021, the aggregate market value of the registrant’s common stock held by non-affiliates of the registrant was approximately $2.9 billion based on the closing sale price as reported on the New York Stock Exchange.
The number of shares of common stock, $0.01 par value, outstanding as of February 22, 2022 was 54,084,378 .
DOCUMENTS INCORPORATED BY REFERENCE
| TABLE OF CONTENTS | Page | |||||||
CAUTIONARY STATEMENT REGARDING FORWARD-LOOKING STATEMENTS
Throughout this Annual Report on Form 10-K (Annual Report), references to the “Company,” “HHC,” “we,” and “our” refer to The Howard Hughes Corporation and its consolidated subsidiaries, unless the context requires otherwise. This Annual report contains forward-looking statements within the meaning of Section 27A of the Securities Act of 1933 (Securities Act) and Section 21E of the Securities Exchange Act of 1934 (Exchange Act). All statements other than statements of historical fact included in this Annual Report are forward-looking statements. Forward-looking statements give our current expectations relating to our financial condition, results of operations, plans, objectives, future performance, or business. You can identify forward-looking statements by the fact that they do not relate strictly to current or historical facts. These statements may include words such as “anticipate,” “believe,” “estimate,” “expect,” “forecast,” “intend,” “likely,” “may,” “plan,” “project,” “realize,” “should,” “transform,” “would,” and other statements of similar expression. Forward-looking statements should not be relied upon. They give our expectations about the future and are not guarantees.
Currently, one of the most significant factors is the potential adverse effects of the current pandemic of the novel strain of coronavirus (COVID-19) on the financial condition, results of operations, cash flows and performance of our Company, our industry, and the global economy and financial markets. The extent to which COVID-19 will continue to impact us will depend on future developments, which remain uncertain and cannot be predicted with confidence, including the scope, severity and duration of the pandemic, the actions taken to contain or mitigate its impact, the speed of distribution and effectiveness of vaccines, the impact of ongoing and future mutations of the virus, and the short and long-term economic and consumer behavior, and the direct and indirect economic impact caused by the pandemic and related containment measures, among others. Moreover, you should interpret many of the risks identified in this Annual Report, as well as the risks set forth below, as being heightened as a result of the ongoing and numerous adverse impacts of COVID-19. Forward-looking statements include:
–the projected impact of the ongoing COVID-19 pandemic on our business, our tenants and the economy in general, including the resurgence of cases related to the spread of the Delta, Omicron or other potential variants, the increase of COVID-19 cases in regions where we operate, and numerous governmental restrictions and other orders instituted in response to the COVID-19 pandemic and as described above, and our ability to accurately assess and predict such impacts on the financial condition, results of operations, cash flows and performance of our Company
–the proposed sale of our non-core assets and accelerated growth in our core Master Planned Communities (MPC) assets
–expected performance of our stabilized, income-producing properties and the performance and stabilization timing of properties that we have recently placed into service or are under construction
–forecasts of our future economic performance
–expected capital required for our operations and development opportunities for our properties
–impact of technology on our operations and business
–expected performance of our segments
–expected commencement and completion for property developments and timing of sales or rentals of certain properties
–estimates of our future liquidity, development opportunities, development spending and management plans; and
–descriptions of assumptions underlying or relating to any of the foregoing
These statements involve known and unknown risks, uncertainties and other factors that may cause our actual results, performance and achievements to materially differ from any future results, performance and achievements expressed or implied by such forward-looking statements. Factors that could cause actual results to differ materially from those expressed or implied by the forward-looking statements include:
–the impact of COVID-19 on our businesses, our tenants and the economy, including as described above
–our inability to obtain operating and development capital, including our inability to obtain or refinance debt capital from lenders and the capital markets
–a prolonged recession in the national economy, including any adverse business or economic conditions in the homebuilding, condominium development, retail and office sectors
–our ability to successfully identify, acquire, develop and/or manage properties on terms that are favorable to us
–our ability to compete effectively, including the potential impact of heightened competition for tenants and potential decreases in occupancy at our properties
–general inflation, including core and wage inflation; commodity and energy price and currency volatility; as well as monetary, fiscal and policy interventions in anticipation of our reaction to such events, including increases in interest rates
–mismatch of supply and demand, including interruptions of supply lines
–our ability to successfully dispose of non-core assets on terms favorable to us
–the successful transition of our new executive officers
HHC 2021 FORM 10-K | 2
–extreme weather conditions or climate change, including natural disasters, that may cause property damage or interrupt business
–contamination of our property by hazardous or toxic substances
–terrorist activity, acts of violence, or breaches of our data security
–losses that are not insured or exceed the applicable insurance limits
–our ability to lease new or redeveloped space
–our ability to obtain the necessary governmental permits for the development of our properties and necessary regulatory approvals pursuant to an extensive entitlement process involving multiple and overlapping regulatory jurisdictions, which often require discretionary action by local governments
–increased construction costs exceeding our original estimates, delays or overruns, claims for construction defects, or other factors affecting our ability to develop, redevelop or construct our properties
–regulation of the portion of our business that is dedicated to the formation and sale of condominiums, including regulatory filings to state agencies, additional entitlement processes and requirements to transfer control to a condominium association’s board of directors in certain situations, as well as potential defaults by purchasers on their obligations to purchase condominiums
–fluctuations in regional and local economies, the residential housing and condominium markets, local real estate conditions, tenant rental rates and competition from competing retail properties and the internet
–inherent risks related to disruption of information technology networks and related systems, including cyber security attacks
–our ability to attract and retain key personnel
–our ability to collect rent and attract tenants
–our indebtedness, including our $750,000,000 5.375% Senior Notes due 2028, $650,000,000 4.125% Senior Notes due 2029, $650,000,000 4.375% Senior Notes due 2031, Term Loan and Revolver Loan which, in the case of the Term Loan and Revolver Loan, are secured by first priority security interests in real property owned by certain subsidiaries of the Company and all of which contain restrictions that may limit our ability to operate our business
–our directors’ involvement or interests in other businesses, including real estate activities and investments
–our inability to control certain of our properties due to the joint ownership of such property and our inability to successfully attract desirable strategic partners
–catastrophic events or geopolitical conditions, such as the ongoing COVID-19 pandemic and resurgence of different variants that may disrupt our business; and
–the other risks described in Item 1. Business, Item 1A. Risk Factors and Item 7. Management’s Discussion and Analysis of Financial Condition and Results of Operations of this Annual Report
Any factor could, by itself, or together with one or more other factors, adversely affect our business, results of operations, plans, objectives, future performance or financial condition. Other factors not described in this Annual Report also could cause results to differ from our expectations. Given these risks and uncertainties, you are cautioned not to place undue reliance on such forward-looking statements. These forward-looking statements present our estimates and assumptions only as of the date of this Annual Report. Except as may be required by law, we undertake no obligation to modify or revise any forward-looking statements to reflect events or circumstances occurring after the date of this Annual Report.
HHC 2021 FORM 10-K | 3
| PART I | ||
Item 1. Business
| OVERVIEW | ||
Our award-winning assets include one of the nation's largest portfolios of master planned communities (MPCs) spanning approximately 118,000 gross acres, as well as operating properties, strategic developments, and other unique assets across 9 states from New York to Hawai‘i. We create some of the most sought-after communities in the country by curating an environment tailored to meet the needs of our residents and tenants. Our unique business model allows us to drive outsized risk-adjusted returns while maintaining a sharp focus on sustainability to ensure our communities are equipped with the resources to last several decades.
We operate through four business segments: Operating Assets, MPCs, Strategic Developments and Seaport. We create a unique and continuous value-creation cycle through our operational and financial synergies associated with our three primary business segments of Operating Assets, MPCs and Strategic Developments. In our MPC segment, we plan, develop and manage small cities and large-scale, mixed-use communities, in markets with strong long-term growth fundamentals. This business focuses on the horizontal development of residential land. The improved acreage is then sold to homebuilders that build and sell homes to new residents. New homeowners create demand for commercial developments, such as retail, office, self-storage and hospitality offerings. We build these commercial properties through Strategic Developments at the appropriate time using the cash flow harvested from the sale of land to homebuilders, which helps mitigate development risk. Once the commercial developments are completed, the assets transition to Operating Assets, which increase recurring Net Operating Income (NOI), further funding our Strategic Developments. New office, retail and other commercial amenities make our MPC residential land more appealing to buyers and increase the velocity of land sales at premiums that typically exceed the broader market. This increased demand for residential land generates more cash flow from MPCs, thus continuing the value-creation cycle. Our fourth business segment, the Seaport, is one of the few multi-block districts largely under private management by a single owner in New York City. This historic waterfront area is being revitalized and enhanced into a mixed-use neighborhood featuring unique culinary and entertainment offerings.
Our assets are located across the United States with the vast majority of the assets in our Operating Assets segment located within our MPCs. This helps us achieve scale and, in most cases, critical mass, which leads to; pricing power in lease and vendor negotiations; increased ability to attract, hire and retain the best local leadership and leasing teams; flexibility to meet changing customer demands; and enhanced ability to identify and capitalize on emerging opportunities. Our MPCs, including our Trillium joint venture, span approximately 118,000 gross acres, with approximately 25,000 residential acres of land remaining to be developed and sold in high demand geographic areas. In addition to the residential land, our MPC segment contains approximately 13,000 acres designated for commercial development or sale to non-competing users such as hospitals. This land is held in our MPC segment until we identify demand for a new commercial development, at which point the land is transitioned into our Strategic Developments segment.
We were incorporated in Delaware in 2010. Through our predecessors, we have been in business for several decades. Financial information about each of our segments is presented in Note 18 - Segments in the Notes to Consolidated Financial Statements under Item 8 of this Form 10-K.
| Douglas Ranch Acquisition | ||
In October 2021, HHC announced the launch of Douglas Ranch, a new large-scale master planned community in the West Valley of the greater Phoenix, Arizona area. The Company closed on the all-cash purchase of approximately 33,810 acres for a purchase price of $541.0 million. The purchase price includes an option for the seller, JDM Partners, to re-acquire a 50% interest in the property for an additional $236.8 million, with $33.8 million of the original purchase price being credited to the seller upon exercise of the option for a total capital contribution of $270.6 million. If the option is not exercised by the seller, the $33.8 million will be returned to the Company. Simultaneous with the land acquisition, the Company closed on the acquisition of a 50% interest in Trillium Development Holding Company, LLC, for $59.0 million. This development holding company owns approximately 3,029 acres of land in the greater Phoenix, Arizona area. Trillium is Douglas Ranch’s first village to begin development with land sales expected to occur in the first half of 2022. In total, the Douglas Ranch MPC encompasses almost 37,000 fully-entitled, “shovel-ready” acres and is poised for growth with in-place entitlements for 100,000 residential homes and 55 million square feet of commercial development.
HHC 2021 FORM 10-K | 4
| Executive Transition | ||
Effective January 12, 2022, with the Company’s announcement, Carlos Olea was appointed to serve as the Company’s Chief Financial Officer (CFO). Mr. Olea succeeds Correne Loeffler, who assumed the Company's CFO role in 2021 after HHC's then-CFO, David O'Reilly, was appointed as Chief Executive Officer.
Mr. Olea has been with The Howard Hughes Corporation since 2017 and has served as the company's Chief Accounting Officer since 2019, overseeing the financial accounting strategy for the one of the nation's largest portfolios of MPCs during a time of outstanding growth. Prior to joining HHC, Mr. Olea served as Chief Accounting Officer at Carr Properties, a Washington, D.C.-based owner-operator and developer. Previously, he was a Senior Manager with the Advisory Services practice of Ernst and Young and a Director of Technical Accounting and Financial Reporting with AvalonBay Communities in Arlington, Virginia.
| Our Competitive Strengths | ||
We believe that we distinguish ourselves from other real estate companies through the following competitive strengths:
–Management Team with Track Record of Value Creation. We have completed the development of over 7.1 million square feet of office and retail operating properties, 3,807 multi-family units and 909 hospitality keys since 2011. Excluding land which we own, we have invested approximately $2.6 billion in these developments, which is projected to generate a 9.5% yield on cost, or $248.6 million per year of NOI upon stabilization. At today’s market cap rates, this implies value creation to our shareholders in excess of $1.5 billion. Our investment of approximately $690.4 million of cash equity in our development projects since inception, which is computed as total costs excluding land less the related construction debt, is projected to generate a 23.4% return on cash equity assuming a 4.5% cost of debt, which approximates our weighted-average cost. These investments and returns exclude condominium development as well as projects under construction such as the Seaport. We exclude condominium developments since they do not result in recurring NOI, and we exclude projects under development due to the wider range of NOI they are expected to generate upon stabilization. In Ward Village, we have either opened or have under construction 3,046 condominium units, which have approximately 95.3% units sold as of December 31, 2021.
–Unique, Diverse Portfolio. We own a portfolio with many diverse market leading assets located across nine states with a combination of steady cash flow and longer-term value creation opportunities.
–Significant Value Creation Opportunity. We own one of the preeminent development pipelines in the world, and with the acquisition of Douglas Ranch, we now have over 100 million square feet of vertical entitlements remaining across our portfolio. This represents approximately 14 times the 7.1 million square feet we have delivered in the last eleven years without having to acquire another development site or external asset, which we believe is a significant competitive advantage over other real estate development corporations.
–Flexible Balance Sheet. After the $600.0 million all-cash acquisition of Douglas Ranch and Trillium in the fourth quarter of 2021, we ended the year with $843.2 million of cash on hand. As of December 31, 2021, our total debt equaled approximately 47.9% of the book value of our total assets, which we believe is significantly less than our market value. Our net debt, which includes our share of debt of Real estate and other affiliates less cash and Special Improvement District (SID) and Municipal Utility District (MUD) receivables, equaled approximately 38.6% of our total enterprise value. Real estate and other affiliates refers to partnerships or joint ventures primarily for the development and operation of real estate assets. Our strong balance sheet provides substantial insulation against potential downturns and provides us with the flexibility to evaluate new real estate project opportunities.
–Self-Funded Business Plan. One of our key differentiators is our ability to self-fund significant portions of our new development without having to dispose of our recently completed developments. Our residential land sales, recurring NOI and profits on the sales of condominium units generate substantial amounts of free cash flow, which is used to fund the equity required to execute our many development opportunities. Furthermore, we are not required to pay dividends nor are we restricted from investing in any asset type, amenity or service, unlike many other real estate companies, which are limited in their activities because they have elected to be taxed as a real estate investment trust (REIT). We believe our structure currently provides us with significant financial and operating flexibility to maximize the value of our real estate portfolio.
HHC 2021 FORM 10-K | 5
| Competition | ||
The nature and extent of our competition depends on the type of property involved. With respect to our Operating Assets and Seaport segments, we primarily compete for retail and office tenants. We also compete for residential tenants in our Operating Assets segment. We believe the principal factors that retailers consider in making their leasing decisions include: (1) consumer demographics; (2) age, quality, design and location of properties; (3) neighboring real estate projects that have been developed or that we, or others, may develop in the future; (4) diversity of retailers and anchor tenants at shopping center locations; (5) management and operational expertise; and (6) rental rates. The principal factors influencing tenant leasing decisions for our office space include: (1) rental rates; (2) attractive views; (3) walkable retail; (4) commute time; (5) efficiency of space; and (6) demographics of available workforce. For residential tenants of our multi-family properties in our Operating Assets segment, we believe the principal factors that impact their decision of where to live are: (1) walkability/proximity to work; (2) amenities; and (3) the best value for their money.
With respect to our MPC segment, we compete with other landholders and residential and commercial property developers primarily in the development of properties within Las Vegas, Nevada; the greater Houston, Texas area; Phoenix, Arizona; and the Baltimore, Maryland/Washington, D.C. markets. Significant factors that we believe allow us to compete effectively in this business include:
–the size and scope of our MPCs
–strong reputation within the industry and years of experience serving our communities
–the recreational and cultural amenities available within our communities
–the commercial centers in the communities, including the properties that we own and/or operate or may develop
–our relationships with homebuilders
–our level of debt relative to total assets
–the proximity of our developments to major metropolitan areas
With respect to our Strategic Developments segment and certain developable assets in our Seaport segment, including the Tin Building and 250 Water Street, our direct competitors include other commercial property developers and other owners of commercial real estate that engage in similar businesses. With respect to our Strategic Developments segment, we also compete with residential condominium developers. With significant existing entitlements, we hold an advantage over many of our competitors in our markets in that we already own and control, or have significant influence over, substantial acreage for development. We also own the majority of square feet of each product type in many of our markets.
| Available Information | ||
Our website address is www.howardhughes.com. Our Annual Report on Form 10-K, Quarterly Reports on Form 10-Q, Current Reports on Form 8-K and other publicly filed documents, including all exhibits filed therewith, are available and may be accessed free of charge through the Investors section of our website under the SEC Filings subsection, as soon as reasonably practicable after those documents are filed with, or furnished to, the SEC at www.sec.gov. Also available through the Investors section of our website are reports filed by our directors and executive officers on Forms 3, 4 and 5, and amendments to those reports. Our website and included or linked information on the website are not incorporated into this Annual Report on Form 10-K. From time to time, we use our website as an additional means of disclosing public information to investors, the media and others interested in us.
| BUSINESS SEGMENTS | ||
The following further describes our four business segments and provides a general description of the assets comprising these segments. Refer to Item 2. Properties for additional details on individual properties, including assets by reportable segment, geographic location and predominant use at December 31, 2021. This section should be referred to when reading Item 7. Management’s Discussion and Analysis of Financial Condition and Results of Operations, which contains information about our financial results and operating performance for our business segments.
HHC 2021 FORM 10-K | 6
| Operating Assets | ||
We have developed many of the assets in our Operating Assets segment since the Company’s inception in 2010. As of December 31, 2021, we have 74 Operating Assets, including our investments in joint ventures and other assets, consisting of 15 retail, 33 office, 13 multi-family and 13 other operating assets and investments. Excluding our projects under construction, we own approximately 10.4 million square feet of retail and office space and 4,200 multi-family units.
We believe that the long-term value of our Operating Assets is driven by their concentration in our MPCs where we have a unique level of control and competitive advantage. We believe that these assets have the potential for future growth by increasing rental rates, absorbing remaining vacancy and changing the tenant mix in retail centers to improve gross sales revenue of our tenants, thereby increasing rents.
Revenue is primarily generated through rental services and is directly impacted by trends in rental rates and operating costs. Leases related to our office properties are generally triple net leases in The Woodlands, gross leases in Summerlin and modified gross leases in Columbia. Leases related to our retail properties are primarily triple net leases, which generally require tenants to pay their pro-rata share of property operating costs, such as real estate taxes, utilities and insurance, and the direct costs of their leased space. We also enter into certain leases which require tenants to pay a fixed rate per square foot reimbursement for common area costs that increase annually according to the terms of the lease.
We will also occasionally sell an operating asset when it does not complement our existing properties or no longer fits within our current strategy. In 2021, the Company completed the sale of The Woodlands Resort, The Westin at The Woodlands and Embassy Suites at Hughes Landing for $252.0 million. These hospitality properties, located in The Woodlands, contained a total of 909 rooms.
For certain assets, we believe there are opportunities to improve operating performance through redevelopment or repositioning. Redevelopment plans for these assets may include office, retail or residential space, shopping centers, movie theaters, parking complexes or open space. The redevelopment plans may require that we obtain permits, licenses, consents and/or waivers from various parties. These opportunities will require new capital investment and vary in complexity and scale. The redevelopment opportunities range from those that would have minimal disruption to the property to those requiring partial or full demolition of existing structures for new construction. Factors we evaluate in determining whether to redevelop or reposition an asset include the following: (1) existing and forecasted demographics surrounding the property; (2) competition related to existing and/or alternative uses; (3) existing entitlements of the property and our ability to change them; (4) compatibility of the physical site with proposed uses; and (5) environmental considerations, traffic patterns and access to the properties.
We generally transfer an operating asset that is being repositioned or redeveloped into our Strategic Developments segment when we close operations at a property and/or begin construction on the redevelopment project. Upon completion of construction or renovation of a development or redevelopment, the asset is fully or partially placed in service and transferred back into our Operating Assets segment.
| Master Planned Communities | ||
As of December 31, 2021, we own the MPCs of Summerlin in Las Vegas; The Woodlands, The Woodlands Hills and Bridgeland in the Houston region; Douglas Ranch in the Phoenix region; and Columbia in Maryland. Our MPC segment includes the development and sale of residential and commercial land, primarily in large-scale, long-term projects. These developments often require decades of investment and continued focus on the changing market dynamics surrounding these communities. We believe that the long-term value of our MPCs remains strong because of their competitive positioning in their respective markets, our in-depth experience in diverse land use planning and the fact that we have substantially completed the entitlement processes within the majority of our communities.
Our MPCs have won numerous awards for design excellence and for community contribution. Summerlin and Bridgeland were again ranked by Robert Charles Lesser & Co., LLC (RCLCO), capturing third and fifteenth highest selling master planned communities in the nation, respectively, for the year ended December 31, 2021.
HHC 2021 FORM 10-K | 7
We expect the competitive position, desirable locations and land development expertise to drive the long-term growth of our MPCs. As of December 31, 2021, our MPCs, including our Trillium joint venture, encompass approximately 118,000 gross acres of land and include approximately 38,000 remaining saleable acres of land. Residential sales, which are generated primarily from the sale of finished lots and undeveloped superpads to residential homebuilders and developers, include standard and custom parcels designated for detached and attached single family homes, and range from entry-level to luxury homes. Superpad sites are generally 20- to 25-acre parcels of unimproved land where we develop and construct the major utilities (water, sewer and storm drainage) and roads to the borders of the parcel and the homebuilder completes the on-site utilities, roads and finished lots. Revenue is also generated through price participation with homebuilders.
We also occasionally sell or lease land for commercial development when we deem its use will not compete with our existing properties or our development strategy. Commercial sales include land parcels designated for retail, office, hospitality, high density residential projects (e.g., condominiums and apartments), services and other for-profit activities, as well as those parcels designated for use by government, schools and other not-for-profit entities.
| Seaport | ||
The Seaport spans 461,000 square feet and several city blocks, including Pier 17, the Tin Building, the Historic District and the 250 Water Street parking lot. Our Seaport segment is part non-stabilized operating asset, part development project and part operating business. The Seaport businesses are comprised of the landlord operations, managed businesses and events and sponsorships categories. As we own, either entirely or in joint venture, many of the businesses, the NOI and stabilization of the Seaport is less predictable than our Operating Assets segment.
Throughout 2021, we have continued to execute on our long-term vision for the Seaport. Construction of the core and shell of the Tin Building is complete, with opening expected in the first half of 2022. We have also announced two new concepts at the Fulton Market Building in the space previously occupied by 10 Corso Como. In the summer of 2022, in a joint partnership with Endorphin Ventures, we expect to launch The Lawn Club, an immersive indoor and outdoor experience that includes an extensive indoor grass area, a stylish clubhouse bar and a wide variety of lawn games. We also expect to launch a new restaurant concept by Josh Eden and Wylie Dufresne at 1 Fulton Street in the summer of 2022. Total estimated aggregate project costs remaining to be spent and funded by us as of December 31, 2021, for the Seaport projects currently under construction are $69.6 million.
In December 2021, we obtained the final approval by the City of New York of our 250 Water Street development project, which includes the transformation of this underutilized full-block surface parking lot into a mixed-use development that would include affordable and market-rate apartments, community-oriented spaces and office space. Also in December 2021, an amendment to the Seaport ground lease was executed giving the Company extension options, at the discretion of the Company, for an additional 48 years from its current expiration in 2072 until 2120. We expect to begin comprehensive remediation of the site through the New York State Brownfield Cleanup program and break ground on the development in 2022. In February 2022, an additional lawsuit was filed challenging the land use approvals previously granted to the Company under the ULURP for the redevelopment and construction of 250 Water Street. The Company intends to vigorously contest the matter as it believes that these claims are without merit.
| Strategic Developments | ||
Our Strategic Developments segment consists of 19 development or redevelopment projects, including developments within our MPCs that will transition to Operating Assets upon completion and condominium towers at Ward Village. Many of these developments require extensive planning and expertise in large-scale and long-range development to maximize their highest and best uses. The strategic process is complex and unique to each asset and requires on-going assessment of the changing market dynamics prior to the commencement of construction. We must study each local market, determine the highest and best use of the land and necessary improvements to the area, obtain entitlements and permits, complete architectural design and construction drawings, secure tenant commitments and obtain and commit sources of capital.
We are in various stages of predevelopment or execution of our strategic plans for many of these assets based on market conditions. As of December 31, 2021, we had 8 properties under construction and not yet placed into service. Total estimated aggregate project costs remaining to be spent on our properties under construction as of December 31, 2021, were $916.4 million, of which $54.7 million remains to be funded by us and the balance will be funded with existing debt. We generally obtain construction financing to fund the majority of the costs associated with developing these assets.
HHC 2021 FORM 10-K | 8
| ENVIRONMENTAL, SOCIAL AND GOVERNANCE (ESG) | ||
Maintaining a sustainable approach to development is at the heart of what we do—it is our commitment to our stakeholders, to our communities, and to the world in which we live. This sense of responsibility has guided the growth of our master planned communities for many decades—long before the principles of environmental, social, and corporate governance fostered the global movement known as ESG. HHC’s legacy is our proven track record of long-term development that embodies our profound respect for conservation and inclusive communities.
Today we are at an exciting juncture with the opportunity to reevaluate our ESG targets, explore different measurements, and elevate our commitment to driving positive change and doing good. Our ESG program is overseen by our CEO, President and Board of Directors. Additional details on our approach are available in our latest ESG annual report, which can be found on the Company’s website at www.howardhughes.com/hhsustainability.
| Environmental Strategy and Performance | ||
Our master planned communities were founded on the large scale exploration of many of the smart growth principles that are being promoted today, and we have remained on a path of open space preservation, innovation, community connectivity, and integration with nature ever since. The critical component of our approach has always been to remain nimble and ready to innovate in the face of evolving urban landscapes.
In 2017, we set 10-year environmentally focused goals as the ESG movement developed. In 2020, we took the initiative to review our goals going forward. Reducing carbon emissions, energy and water use year-over-year is a comprehensive goal of our operational strategy. We achieve these reductions through systematic energy auditing, mechanical, lighting and other building upgrades, in an effort to optimize operations and engage tenants.
We report our progress against the goals annually in our ESG report and leverage industry leadership programs to benchmark environmental performance. We worked with DNV GL Business Assurance USA, Inc. to externally confirm our energy consumption, water consumption, greenhouse gas emissions and waste data. HHC’s developments pursue U.S. Green Building Council’s green building certification program; Leadership in Energy and Environmental Design (LEED) and eligible operational assets pursue U.S. Environmental Protection Agency (EPA) ENERGY STAR rating among other industry benchmarks that independently assess and recognize efficiencies and performance.
In 2021, HHC continued to expand its environmentally focused programs across business segments, including real-time data analysis, carbon emission reduction, climate risk management, passive design strategy, embodied carbon evaluation, renewable energy installations and achieving higher levels of green building and green community certifications through LEED. We partner with industry leading subject matter experts; Ramboll, Thorton Tomasetti, Studio Gang, SOM, InSite Intelligence, Verdani partners, and others to accelerate the positive impact across the lifecycle of our MPCs, strategic developments and operating assets.
HHC continued to make strides with ESG performance and transparency by participating in its fourth Global Real Estate Sustainability Benchmark (GRESB) Real Estate Assessment. HHC scored significantly above the global average, ranking in the upper third of the North America Diversified, Listed category for the GRESB Standing Investments Benchmark. Despite the rising competition within the benchmark, we earned a GRESB 4 Star Rating. Since 2018, HHC’s overall GRESB score has improved by 23%.
| Social Strategy and Impact | ||
Human Capital The Howard Hughes Corporation builds vibrant, diverse and culturally rich communities that will deliver an exceptional quality of life for generations to come. We accomplish this through the dedication of the talented people that make up our workforce who are committed to masterful planning and design and the mission of long-term sustainability. Our team members are empowered to help people discover new ways of experiencing life. Our master planned communities continue the work of the forward-thinking placemakers whose collective legacy of innovation, imagination, and excellence form the basis of our company - James Rouse, George Mitchell, Victoria Ward and Howard Hughes. As of December 31, 2021, we had approximately 530 employees supporting our core business, with an additional 116 employed at the Las Vegas Ballpark, including seasonal staff required to support ongoing ballpark events and merchandising operations.
HHC 2021 FORM 10-K | 9
We recognize that our people are the lifeblood of our Company. As such, we offer competitive wellness programs to support our employees and their families at all stages of life, including a robust health benefits plan, a 401k and match plan, a fully paid 12-week maternity leave and four weeks of child bonding leave for both the birth of a child or placement of a child with the employee for adoption or foster care. We are also proud to be a mother-friendly worksite, providing a supportive environment and the necessary facilities for nursing mothers. We encourage personal discovery for our team members and advocate for personal and professional growth through tuition reimbursement, student debt management resources and a personal growth fund for non-job-related training.
The continuous professional development of our employees is intrinsically linked to our Company’s ever-evolving design and development of inclusive, sustainable community living. The growth of our development pipeline creates great opportunities for all employees to benefit in career advancement and mobility. Through the growth of our employees comes the growth of our company, wherein lies the long-term success and evolution of our communities. The most recent launch of Douglas Ranch, our new 37,000-acre master planned community in Phoenix’s West Valley, allows us to leverage the team’s expertise while capitalizing on an incredibly refined and successfully proven business model.
Health, Safety and Well-Being We enforce the highest standards for building operations to protect the health, well-being and safety of our employees, tenants, residents and visitors. We are dedicated to improving quality of life by developing properties with healthy spaces to live, work, relax and socialize. We also believe that attracting and retaining the best talent means we must strive to provide an inclusive work environment in which employees feel valued and safe.
Throughout the COVID-19 pandemic, the health, safety and well-being of employees and their families has remained of paramount importance. The Company put in place policies and protocols based on the expertise and guidance from public health leaders, and has continued to regularly review and update policies and protocols to reflect the best, most current information available. Beginning in March of 2020, we instituted a remote workplace strategy for employees whose job duties were conducive to working from home. In April 2021, we implemented a voluntary return to office program, which allowed employees to return to our offices on a voluntary basis only. This voluntary program continued until November 1, 2021, at which time we began our mandatory return to office program, applying a hybrid work model. As part of both the voluntary and mandatory return to office programs, we implemented extensive safety measures to protect our employees, including enhanced sanitary procedures and tailored policies for vaccinated and unvaccinated employees. We continue to adjust to the fluidity of the pandemic, as recently as implementing more stringent testing protocols due to the highly transmissible Omicron variant.
Our employees’ safe working environment remains a focus in our occupational health and safety practices. Competency-based online safety training is provided to employees covering a broad range of hazards that may be encountered in the workplace. Our safety and loss control expert, supported by external expertise if needed, analyze the circumstances and consequences of an incident for corrective measures. Our recordable incident and lost time recordable incident rates (statistical numbers measuring the number of accidents per hours worked) directly reflects the emphasis placed on our commitment to these practices.
We are committed to providing affordable benefits for our employees. For 2022, we will focus on bringing more services to support our employees in their mental and physical well-being. The organization introduced a new hybrid work model to assist employees with juggling work, family and life-related issues. We are including in our medical services the opportunity to support families with the introduction of fertility services which is inclusive of adoption, donor, and surrogacy services. We are implementing a bike reimbursement program to help employees stay healthy and save the environment by biking to work. We are also partnering with a new health and wellness vendor to provide alternative methods for our employees to stay active and healthy during their fitness journey.
Our Commitment to Equal Employment Opportunity We believe it is the responsibility of each officer, manager and supervisor to ensure all employment activities are conducted with fairness. We are committed to recruiting, hiring, developing and promoting the best individuals based on job-related qualifications, and without regard to race, religion, color, creed, national origin, sex, age, disability, sexual orientation, veteran status, or any other reason prohibited by law. We do not tolerate differential treatment, and we believe that any practice toward employees or candidates that may get in the way of that duty hinders us all. We provide reasonable accommodations to qualified individuals with a disability, as required by law, under the Americans with Disabilities Act and other applicable statutes. Sexual or any other type of workplace harassment is not tolerated at HHC, and any employee who engages in discriminatory conduct or workplace harassment is subject to disciplinary action up to and including termination.
HHC 2021 FORM 10-K | 10
Diversity and Inclusion At The Howard Hughes Corporation, we value perspective. We believe in celebrating unique ideas and embracing different points of view. Diversity Equity and Inclusion (DEI) are essential to our success as a company and we strive to source, engage and retain diverse and talented people, partners, residents, and suppliers. We invest in our people through continuous learning opportunities and nurture the exchange of ideas. By maintaining an open dialogue and fostering new relationships, we can cultivate a culture of belonging. Because better people make better companies, and better companies build better communities. Through our people strategy, we strive for diversification and retention of talent that ultimately drives top performance, diverse thought and an inclusive culture. As of December 31, 2021, our workforce is 54% female and 33% ethnically diverse. Employees at a Vice President level or above are 34% female and 18% ethnically diverse.
Since 2020, to ensure that the company is actively fostering a diverse and inclusive environment, HHC, with significant interest from its employees, formed and appointed an all-volunteer employee DEI Advisory Council, DEI Review Board and a dedicated resource for DEI. Together, with the Culture + People team, HHC executes its DEI strategy through programs and policies such as the Summer Associate Program, Employee Resource Groups, Training + Development, Employee Growth Benefits, Strategic Talent Acquisition Partnerships and Annual DEI Goals.
Our Summer Associate Program has been an excellent source for attracting and identifying high-performing diverse talent. Summer Associates experience a competitive and rigorous rotational curriculum. This program is a culmination of the commitment and dedication of the HHC team and their investment in the future of the Company.
In January of 2022, HHC announced a partnership with Project Destined. Sharing a commitment to developing a more diverse and inclusive generation of new leaders within the real estate industry, the partnership launches the entry of Project Destined into the Greater Houston area for the first time as it continues to mentor and transform the industry with more equitable opportunities and standards. Project Destined partners with leading real estate firms and more than 70 universities around the country to enable and encourage a diverse group of underrepresented students to explore the industry through internships and the analysis of live local real estate deals. Student interns will be paired with mentors from HHC to participate in Project Destined-led training, mentor office hours and competitive team pitch presentations.
Philanthropy HHC is highly attuned to how we impact the lives of those within our communities, and we support over 350 causes of local charities through donations and volunteerism. In 2021, we donated over $3 million through our corporate social responsibility program, Howard Hughes Cares (HHCares). We offer all full-time employees 24 hours per year to volunteer, a 1:1 match on financial donations to the charity of their choice and time off to exercise voting rights, all of which reflects our commitment to sustaining the communities where we live and work.
Professional Development We empower employees to grow at every stage of their career. Full-time employees are eligible for up to $10,000 annually in reimbursement for professional growth, including continuing higher education and professional certifications, of which $1,000 is allocated to personal growth opportunities. In addition, conference and seminar attendance is encouraged throughout the Company, to promote networking, learning and firsthand industry experience. Throughout the years, our employees have participated in hundreds of conferences and engaged with industry-leading organizations, including the research and educational nonprofit Urban Land Institute (ULI). For those employees with student debt, we also provide a company-funded contribution plan to help reduce their repayment amount. At HHC, we love education, and we know it has its price. We want our employees to focus on and plan for their future, not be bogged down with student debt.
Ethics Compliance Training We believe that strong, well-established ethics are a key tenet of our culture. Training on our Code of Business Conduct and Ethics is required for all employees throughout their time with Howard Hughes. Our training guides employees through engaging in ethical business decisions, recognizing unethical behaviors and reporting when necessary. This training framework is our foundation from which all employees reinstate their understanding and acceptance of our organizational values on an annual basis.
HHC 2021 FORM 10-K | 11
| Governance and Risk Management | ||
In order to identify, monitor, and mitigate potential risks that could impact our organization and investors, The Howard Hughes Corporation has made governance risk and management a top Board priority. As part of our corporate governance framework, we have a formal Enterprise Risk Management (ERM) Program that is overseen by the Board’s Risk Committee and led by our Risk Management team. The Risk Committee helps to evaluate the effectiveness of the ERM Program and the performance of the Risk Management team. It also reviews and monitors risks that have been identified and are considered critical by management, such as capital, market, liquidity, legal, regulatory, operational, reputational and strategic risks. The Risk Committee reviews and approves periodic risk assessment results and reviews risk mitigation activities deemed material by management. The Risk Committee also reviews risk mitigation activities for emerging risks and oversees management’s approach to fostering a risk-intelligent culture.
HHC’s ESG program, is shaped and supported by the Board and encompasses a range of corporate governance policies and guidelines that include but are not limited to: Anti-Corruption Compliance Policy, Board Diversity Policy, Cybersecurity Policy, Code of Business Conduct and Ethics for Officers and Employees, Code of Business Conduct and Ethics for the Board of Directors, Corporate Governance Guidelines, and Insider Trading Policy.
Substantially all of our properties have been subject to third-party Phase I Environmental Site Assessments (ESAs), which are intended to evaluate the environmental condition of the surveyed and surrounding properties. This includes the 250 Water Street property in the Seaport, which we purchased in June 2018. The Phase I ESA identified historic fill, probable gasoline underground storage tanks, and historical factory and other industrial uses (including a gasoline service station and a thermometer factory) on the property and in the area. A limited Phase II Environmental Site Investigation (ESI) for 250 Water Street confirmed the presence of typical historic fill; an anomaly consistent with an underground petroleum storage tank; and an associated area of petroleum impacts; and mercury in soil at levels above New York State regulatory criteria. The property’s current use as a parking lot does not require remediation at this time. The property is in the New York State Brownfield Cleanup Program (BCP) with the Company as a Volunteer (an entity not responsible for the contamination and not responsible for cleaning up off-site contamination), and will be remediated, as necessary, under the BCP prior to or concurrent with future redevelopment activities. More recently and under the BCP, the 250 Water Street property has been fully investigated and the findings confirm those from the Phase I ESA and Phase II ESI.
As of December 31, 2021, neither the ESA or ESI for 250 Water Street, nor the completed ESAs of our other properties, have revealed any known environmental liability that we believe would have a material adverse effect on our overall business, financial position or results of operations. Nevertheless, it is possible that these assessments do not reveal all environmental liabilities or that the conditions have changed since the assessments were prepared (typically prior to the time the property was purchased or encumbered with debt). Moreover, no assurances can be given that future laws, ordinances or regulations will not impose any material environmental liability on us, or the current environmental condition of our properties will not be adversely affected by tenants and occupants of the properties, by the condition of properties in the vicinity of our properties or by third parties unrelated to us.
HHC 2021 FORM 10-K | 12
| REGULATORY MATTERS | ||
A portion of our business is dedicated to the development and sale of condominiums. Condominiums are generally regulated by an agency of the state in which they are located or where the condominiums are marketed to be sold. In connection with our development and offering of condominium units for sale, we must submit regulatory filings to various state agencies and engage in an entitlement process by which real property owned under one title is converted into individual units. Responses or comments on our condominium filings may delay our ability to sell condominiums in certain states and other jurisdictions in a timely manner, or at all. In addition, approval to develop real property sometimes requires political support and generally entails an extensive entitlement process involving multiple and overlapping regulatory jurisdictions and often requires discretionary action by local governments. Real estate projects must generally comply with local land development regulations and may need to comply with state and federal regulations. We incur substantial costs to comply with legal and regulatory requirements.
Various local, state and federal statutes, ordinances, rules and regulations concerning building, health and safety, site and building design, environment, zoning, sales and similar matters apply to and/or affect the real estate development industry. Our ability to obtain or renew permits or approvals and the continued effectiveness of permits already granted or approvals already obtained depends on factors beyond our control, such as changes in federal, state and local policies, rules and regulations and their interpretations and application.
There is a variety of legislation being enacted, or considered for enactment, at the federal, state and local level relating to energy and climate change. This legislation relates to items such as carbon dioxide emissions control and building codes that impose energy efficiency standards. New building code requirements that impose stricter energy efficiency standards could significantly increase our cost to construct buildings. As climate change concerns continue to grow, legislation and regulations of this nature are expected to continue and become more costly to comply with. We may be required to apply for additional approvals or modify our existing approvals because of changes in local circumstances or applicable law. Energy-related initiatives affect a wide variety of companies throughout the United States and the world and, because our operations are heavily dependent on significant amounts of raw materials, such as lumber, steel and concrete, they could have an indirect adverse impact on our operations and profitability to the extent the manufacturers and suppliers of our materials are burdened with expensive cap and trade and similar energy related taxes and regulations. Governmental regulation also affects sales activities, mortgage lending activities and other dealings with consumers. Further, government agencies routinely initiate audits, reviews or investigations of our business practices to ensure compliance with applicable laws and regulations, which can cause us to incur costs or create other disruptions in our business that can be significant. We may experience delays and increased expenses as a result of legal challenges to our proposed communities, whether brought by governmental authorities or private parties.
Under various federal, state and local laws and regulations, an owner of real estate is liable for the costs of remediation of certain hazardous substances, including petroleum and certain toxic substances (collectively hazardous substances) on such real estate. These laws often impose such liability without regard to whether the owner knew of, or was responsible for, the presence of such hazardous substances. The costs of remediation of such substances may be substantial, and the presence of such substances, or the failure to remediate such substances, may adversely affect the owner’s ability to sell such real estate or to obtain financing using such real estate as collateral. Other federal, state and local laws, ordinances and regulations require abatement or removal of asbestos-containing materials in the event of demolition or certain renovations or remodeling, the cost of which may be substantial for certain redevelopments, and also govern emissions of and exposure to asbestos fibers in the air. Federal and state laws also regulate the operation and removal of underground storage tanks. In connection with our ownership, operation and management of certain properties, we could be held liable for the costs of remedial action with respect to these regulated substances or tanks or related claims.
Additionally, changes to our procedures or additional procedures, implemented to comply with public health orders or best practice guidelines as a result of the ongoing COVID-19 pandemic, may increase our costs or reduce our productivity and thereby affect our business, financial condition or results of operations.
For further information see Governance and Risk Management above.
HHC 2021 FORM 10-K | 13
| RISK FACTORS | |||||
Item 1A. Risk Factors
The risks and uncertainties described below are those that we deem currently to be material, and do not represent all of the risks that we face. Additional risks and uncertainties not presently known to us or that we currently do not consider material may in the future become material and impair our business operations. If any of the following risks actually occur, our business could be materially harmed, and our financial condition and results of operations could be materially and adversely affected. Our business, prospects, financial condition or results of operations could be materially and adversely affected by the following:
| RISKS RELATED TO OUR INDUSTRY, MARKET AND CUSTOMERS | ||
Our performance and the market value of our securities are subject to risks associated with our investments in real estate assets and with trends in the real estate industry.
Our economic performance and the value of our real estate assets and, consequently the market value of the Company’s securities, are subject to the risk that our properties may not generate revenues sufficient to meet our operating expenses or other obligations. A deficiency of this nature would adversely impact our financial condition, results of operations, cash flows, the quoted trading price of our securities and our ability to satisfy our debt service obligations.
A downturn in the housing market or decline in general economic conditions could adversely affect our business, financial condition and operations.
We believe that new home sales are an important indicator of future demand for our superpad sites, lots and condominium units. Demand for new homes is sensitive to changes in economic conditions such as the level of employment, consumer confidence, consumer income, the availability of financing and interest rate levels. The prior economic downturn severely affected both the numbers of homes that could be sold in our MPCs and the prices for which homebuilders could sell them. We cannot predict when another economic downturn in the housing market will occur. If there were another economic downturn in the housing market or in general economic conditions, the resulting decline in demand for new homes and condominium units would likely have a material adverse effect on our business, financial condition and results of operations.
Our condominium sales are sensitive to interest rates and the ability of consumers to obtain mortgage financing.
The ability of the ultimate buyers of condominiums to finance their purchases is generally dependent on their personal savings and availability of third-party financing. Consequently, the demand for condominiums will be adversely affected by increases in interest rates, unavailability of mortgage financing, increasing housing costs and unemployment levels. Levels of income and savings, including retirement savings, available to condominium purchasers can be affected by declines in the capital markets. Any significant increase in the mortgage interest rates or decrease in available credit could reduce consumer demand for housing, and result in fewer condominium sales, which may have an adverse effect on our business, financial condition and results of operations.
Purchasers may default on their obligations to purchase condominiums.
We enter into contracts for the sale of condominium units that generally provide for the payment of a substantial portion of the sales price at closing when a condominium unit is ready to be delivered and occupied. A significant amount of time may pass between the execution of a contract for the purchase of a condominium unit and the closing thereof. The rate of defaults may increase from historical levels due to the personal finances of purchasers being negatively impacted as a result of COVID-19. Defaults by purchasers to pay any remaining portions of the sales prices for condominium units under contract may have an adverse effect on our business, financial condition and results of operations.
Downturn in tenants’ businesses may reduce our revenues and cash flows.
An office or retail tenant may experience a downturn in its business, which may weaken its financial condition and result in its failure to make timely rental payments or result in defaults under our leases. The rate of defaults may increase from historical levels due to tenants’ businesses being negatively impacted by the COVID-19 pandemic. In the event of default by a tenant, we may experience delays in enforcing our rights as landlord and may incur substantial costs in protecting our investment.
HHC 2021 FORM 10-K | 14
| RISK FACTORS | |||||
We may be negatively impacted by the consolidation or closing of anchor stores.
Many of our mixed-used properties are anchored by “big box” tenants. We could be adversely affected if these or other anchor stores were to consolidate, close or enter into bankruptcy. Given the current economic environment for certain retailers, there is a heightened risk an anchor store could close or enter into bankruptcy. Any losses resulting from the bankruptcy of any of our existing tenants could adversely impact our financial condition. Even if we own the anchor space, we may be unable to re-lease this area or to re-lease it on comparable terms. The loss of these revenues could adversely affect our results of operations and cash flows. Further, the temporary or permanent loss of any anchor would likely reduce customer traffic in the retail center, which could lead to decreased sales at other retail stores. Rents obtained from other tenants may be adversely impacted as a result of co-tenancy clauses in their leases. One or more of these factors could cause the retail center to fail to meet its debt service requirements. The consolidation of anchor stores may also negatively affect lease negotiations and current and future development projects.
We may be unable to renew leases or re-lease available space.
We cannot provide any assurance that existing leases will be renewed, available space will be re-leased or that our rental rates will be equal to or above the current rental rates. Delays in payments and the rate of defaults on existing leases has increased from historical levels due to tenants’ businesses being negatively impacted as a result of COVID-19. If the average rental rates for our properties decrease, existing tenants do not renew their leases, or available space is not re-leased, our financial condition, results of operations, cash flows, the quoted trading price of our securities and our ability to satisfy our debt service obligations at the affected properties could be adversely affected.
Significant competition could have an adverse effect on our business.
The nature and extent of the competition we face depends on the type of property. With respect to our MPCs, we compete with other landholders and residential and commercial property developers in the development of properties in the respective MPC regions. Numerous residential and commercial developers, some with greater financial and other resources, compete with us in seeking resources for development and prospective purchasers and tenants. Competition from other real estate developers may adversely affect our ability to attract purchasers and sell residential and commercial real estate, sell undeveloped rural land, attract and retain experienced real estate development personnel, or obtain construction materials and labor. These competitive conditions can make it difficult to sell land at desirable prices and can adversely affect our results of operations and financial condition.
There are numerous shopping facilities that compete with our operating retail properties in attracting retailers to lease space. In addition, retailers at these properties face continued competition from other retailers, including internet retailers, retailers at other regional shopping centers, outlet malls and other discount shopping centers, discount shopping clubs, and catalog companies. Competition of this type could adversely affect our results of operations and financial condition. In addition, we compete with other major real estate investors with significant capital for attractive investment and development opportunities. These competitors include REITs and private institutional investors.
| RISKS RELATED TO OUR ORGANIZATIONAL STRUCTURE AND STRATEGY | ||
Our performance may be negatively impacted by our management transitions, and we will continue to depend on the services and performance of our other senior management and key employees.
On September 17, 2020, Paul Layne retired as our Chief Executive Officer. David O’Reilly, our President and Chief Financial Officer, agreed to additionally serve as our interim Chief Executive Officer. Effective December 1, 2020, David O’Reilly was appointed Chief Executive Officer and L. Jay Cross was appointed President and Mr. O’Reilly agreed to continue as our interim Chief Financial Officer while a search was conducted for a permanent successor. Effective April 19, 2021, Ms. Correne Loeffler was appointed Chief Financial Officer. On January 10, 2022, Ms. Loeffler’s service as Chief Financial Officer and employment with the Company was terminated. Effective January 12, 2022, Carlos Olea was appointed Chief Financial Officer. Our future performance will depend, in part, on the successful transitions of Mr. O’Reilly as our Chief Executive Officer, Mr. Cross as our President and Mr. Olea as our new Chief Financial Officer. If we do not successfully manage these transitions, it could be viewed negatively by our customers, employees or investors and could have an adverse impact on our business. Our future performance also will continue to depend on the services and contributions of our other senior management and key employees to execute on our plans and to identify and pursue new opportunities.
HHC 2021 FORM 10-K | 15
| RISK FACTORS | |||||
The proposed sale of our non-core assets is subject to various risks and uncertainties and may not be completed on the terms or timeline currently contemplated, if at all.
On October 21, 2019, we announced our intention to sell our non-core assets with estimated net cash proceeds of approximately $600 million. Since the announcement, we have executed on the sale of thirteen non-core assets generating approximately $401 million of net proceeds after debt repayment; however, the COVID-19 pandemic has made additional non-core asset sales more challenging to execute, and there can be no assurance of the terms, timing or structure of any future transaction involving such assets, whether we will be able to identify buyers for the assets on favorable terms or at all, or whether any such transaction will take place at all. In addition, any such transaction is subject to risks and uncertainties, including unanticipated developments, regulatory approvals or clearances and uncertainty in the financial markets, that could delay or prevent the completion of any such transaction.
The proposed sales of our non-core assets may not achieve some or all of the anticipated benefits.
Executing the proposed sales of our non-core assets will continue to require us to incur costs and will require the time and attention of our senior management and key employees, which could distract them from operating our business, disrupt operations and result in the loss of business opportunities, each of which could adversely affect our business, financial condition and results of operations. We may also experience increased difficulty in attracting, retaining and motivating key employees during the pendency of the sale and following its completion, which could harm our business. Even if the proposed sale is completed, we may not realize some or all of the anticipated benefits from the sale, and the sale may in fact adversely affect our business.
The concentration of our properties in certain states may make our revenues and the value of our assets vulnerable to adverse changes in local economic conditions.
Many of the properties we own are located in the same or a limited number of geographic regions, including Texas, Hawai‘i, Nevada, New York and Maryland. In October 2021, we announced the launch of Douglas Ranch, a new large-scale master planned community in the West Valley of Phoenix, Arizona. Our current and future operations at the properties in these states are generally subject to significant fluctuations by various factors that are beyond our control such as the regional and local economy, which may be negatively impacted by material relocation by residents, industry slowdowns, plant closings, increased unemployment, lack of availability of consumer credit, levels of consumer debt, housing market conditions, adverse weather conditions, natural disasters, climate change and other factors, as well as the local real estate conditions, such as an oversupply of, or a reduction in demand for, retail space or retail goods and the availability and creditworthiness of current and prospective tenants.
In addition, some of our properties are subject to various other factors specific to those geographic areas. For example, tourism is a major component of both the local economies in Hawai‘i and Nevada. Ward Village, which is located in Honolulu, Hawai‘i, and Summerlin, which is located in Las Vegas, Nevada, may be impacted by the local and global tourism industry. These properties are susceptible to any factors that affect travel and tourism related to Hawai‘i and Las Vegas, including cost and availability of air services and the impact of any events that disrupt air travel to and from these regions. Moreover, these properties may be affected by risks such as acts of terrorism and natural disasters, including major fires, floods and earthquakes, as well as severe or inclement weather, which could also decrease tourism activity in Las Vegas or Hawai‘i.
Further, Summerlin is to some degree dependent on the gaming industry, which could be adversely affected by changes in consumer trends and preferences and other factors over which we have no control. The gaming industry is characterized by an increasingly high degree of competition among a large number of participants, including riverboat casinos, dockside casinos, land-based casinos, video lottery, sweepstakes and poker machines, many of which are located outside of Las Vegas. Furthermore, competition from internet lotteries, sweepstakes and other internet wagering gaming services, which allow their customers to wager on a wide variety of sporting events and play Las Vegas-style casino games from home or in non-casino settings, could negatively impact the population in the Las Vegas area. Expansion of internet gaming in other jurisdictions (both legal and illegal) could further compete with the gaming industry in Las Vegas, which could have a negative impact on the local Las Vegas economy and result in an adverse effect on Summerlin and Downtown Summerlin.
Markets and the local economy surrounding our properties in Columbia, Maryland are heavily influenced by government spending and activity. A reduction of government spending in this market generally could decrease the demand for housing and retail space in this geographic region.
HHC 2021 FORM 10-K | 16
| RISK FACTORS | |||||
The Woodlands, The Woodlands Hills and Bridgeland in the Houston, Texas region depend significantly on the energy sector. Our success depends to a large extent upon the business activity, population, income levels, employment trends and real estate activity in and around Houston, Texas. In the event that oil prices fall and remain depressed for a sustained period, demand may decrease for housing and commercial space in The Woodlands, Bridgeland and The Woodlands Hills.
Additionally, the success of Summerlin, our master planned community in Las Vegas, Nevada, and Douglas Ranch, our new master planned community in the Phoenix, Arizona region, may be negatively impacted by changes in temperature due to climate change, increased stress on water supplies caused by climate change and population growth and other factors over which we have no control.
Finally, we are subject to local governmental responses to the COVID-19 pandemic in each of these areas which may be stricter than federal mandates, and disproportionately affect our business given the aforementioned concentration of our properties.
If any or all of the factors discussed above were to occur and result in our inability to sell or lease our residential and commercial property in any of these geographic regions, it would likely have a material adverse effect on our business, financial condition and results of operations.
Our business model includes entering into joint venture arrangements with strategic partners, and our strategic partners may have different interests than us.
We currently have and intend to enter into joint venture partnerships. These joint venture partners may bring local market knowledge and relationships, development experience, industry expertise, financial resources, financing capabilities, brand recognition and credibility or other competitive advantages. In the future, we may not have sufficient resources, experience and/or skills to locate desirable partners. We also may not be able to attract partners who want to conduct business in the locations where our properties are located, and who have the assets, reputation or other characteristics that would optimize our development opportunities.
While we generally participate in making decisions for our jointly owned properties and assets, we might not always have the same objectives as the partner in relation to a particular asset, and we might not be able to formally resolve any issues that arise. In addition, actions by a partner may subject property owned by the joint venture to liabilities greater than those contemplated by the joint venture agreements, be contrary to our instructions or requests or result in adverse consequences. We cannot control the ultimate outcome of any decision made, which may be detrimental to our interests.
The bankruptcy or, to a lesser extent, financial distress of any of our joint venture partners could materially and adversely affect the relevant property or properties. If this occurred, we would be precluded from taking some actions affecting the estate of the other investor without prior court approval which would, in most cases, entail prior notice to other parties and a hearing. At a minimum, the requirement to obtain court approval may delay the actions we would or might want to take. If the relevant joint venture through which we have invested in a property has incurred recourse obligations, the discharge in bankruptcy of one of the other partners might result in our ultimate liability for a greater portion of those obligations than would otherwise be required.
Because real estate is illiquid, we may not be able to sell properties when in our best interest.
Real estate investments generally, and in particular large office and mixed-use properties like those that we develop and construct, often cannot be sold quickly. The capitalization rates at which properties may be sold could be higher than historic rates, thereby reducing our potential proceeds from sale. Consequently, we may not be able to alter our portfolio promptly in response to changes in economic or other conditions. All of these factors reduce our ability to respond to changes in the performance of our investments and could adversely affect our business, financial condition and results of operations.
Some of our properties are subject to potential natural or other disasters.
A number of our properties are located in areas which are subject to natural or other disasters, including hurricanes, floods, earthquakes and oil spills. We cannot predict the extent of damage that may result from such adverse weather events, which depend on a variety of factors beyond our control. Some of our properties, including Houston-area MPCs, Ward Village, the Seaport and the Outlet Collection at Riverwalk are located in coastal regions, and could be affected by increases in sea levels, the frequency or severity of hurricanes and tropical storms, or environmental disasters, whether such events are caused by global climate changes or other factors. Additionally, adverse weather events can cause widespread property damage and significantly depress the local economies in which the Company operates and have an adverse impact on the Company’s business, financial condition and operations.
HHC 2021 FORM 10-K | 17
| RISK FACTORS | |||||
| RISKS RELATED TO OUR BUSINESS OPERATIONS AND INFRASTRUCTURE | ||
Our MPC segment is highly dependent on homebuilders.
We are highly dependent on our relationships with homebuilders to purchase superpad sites and lots at our MPCs. Our business will be adversely affected if homebuilders do not view our MPCs as desirable locations for homebuilding operations or due to a change in demand, our inability to achieve certain pricing arrangements or upon an overall decline in general market conditions. Also, some homebuilders may be unwilling or unable to close on previously committed lot purchases due to our failure to meet certain conditions in our agreements or otherwise. As a result, we may sell fewer lots and, in certain instances suspend any of our MPC developments. This would result in lower land sales revenues, which could have an adverse effect on our financial position and results of operations.
The Seaport’s operational results are volatile, which could have an adverse effect on our financial position and results of operations.
The Seaport’s operational results are volatile. The increased volatility is largely the result of:
(i) seasonality; (ii) potential sponsorship revenue; (iii) potential event revenue; and (iv) business operating risks from various start-up businesses. We own, either wholly or through joint ventures, and in some instances operate, several start-up businesses in the Seaport. As a result, the revenues and expenses of these businesses directly impact the net operating income of the Seaport, which could have an adverse effect on our financial position and results of operations. This is in contrast to our other retail properties where we generally receive lease payments from unaffiliated tenants and are not necessarily impacted by the operating performance of their underlying businesses.
We are exposed to risks associated with the development, redevelopment or construction of our properties.
Our development, redevelopment and construction activities expose us to risks such as:
–inability to obtain construction financing for the development or redevelopment of properties
–increased construction costs for a project that exceeded our original estimates due to increases in materials, labor or other costs, which could make completion of the project less profitable because market rents or condominium prices may not increase sufficiently to compensate for the increased construction costs
–construction delays, which may increase project development costs
–claims for construction defects after a property has been developed
–poor performance or nonperformance by any of our joint venture partners or other third parties on whom we rely;
–health and safety incidents and site accidents
–easement restrictions which may impact our development costs and timing
–compliance with building codes and other local regulations
–the inability to secure tenants necessary to support commercial projects
If any of the aforementioned risks were to occur during the development, redevelopment or construction of our properties, it could have a substantial negative impact on the project’s success and result in a material adverse effect on our financial condition or results of operations.
Our development projects may subject us to certain liabilities.
We may hire and supervise third-party contractors to provide construction, engineering and various other services for wholly-owned development projects or development projects undertaken by real estate ventures in which we hold an equity interest. Certain of these contracts are structured such that we are the principal rather than the agent. As a result, we may assume liabilities in the course of the project and be subjected to, or become liable for, claims for construction defects, negligent performance of work or other similar actions by third parties we have engaged.
Adverse outcomes of disputes or litigation could negatively impact our business, results of operations and financial condition, particularly if we have not limited the extent of the damages to which we may be liable, or if our liabilities exceed the amounts of the insurance that we carry. Moreover, our tenants and condominium owners may seek to hold us accountable for the actions of contractors because of our role even if we have technically disclaimed liability as a legal matter, in which case we may determine it necessary to participate in a financial settlement for purposes of preserving the tenant or customer relationship or to protect our corporate brand. Acting as a principal may also mean that we pay a contractor before we have been reimbursed by our tenants or have received the entire purchase price of a condominium unit from the purchaser. This exposes us to additional risks of collection in the event of a bankruptcy, insolvency or a condominium purchaser default. The reverse can occur as well, where a contractor we have paid files for bankruptcy protection or commits fraud with the funds before completing a project which we have funded in part or in full.
HHC 2021 FORM 10-K | 18
| RISK FACTORS | |||||
For example, we are directly paying the costs to repair certain construction defects at the Waiea condominium tower in Ward Village and will seek to recoup these costs from the general contractor and other responsible parties. We have subsequently entered into a settlement agreement with the Waiea homeowners association pursuant to which we have agreed to pay for the repair. We believe the general contractor is ultimately responsible for the defects and expect to recover our repair costs from the general contractor, other responsible parties and insurance proceeds; however, we can provide no assurances that all or any portion of these costs will be recovered. The Company recorded total expenses of $99.2 million for the estimated repair costs related to this matter during 2020 and an additional $21.0 million during the year ended December 31, 2021.
Cybersecurity risks and incidents, such as a breach of the Company’s privacy or information security systems, or those of our vendors or other third parties, could compromise our information and expose us to liability, which would cause our business and reputation to suffer.
The protection of tenant, business partner, employee and company data is critically important to us. In the ordinary course of our business, we collect and store sensitive data, including intellectual property, our proprietary business information and that of our tenants and business partners and personally identifiable information of our employees on our networks. The collection and use of personally identifiable information is governed by federal and state laws and regulations. Privacy and information security laws continue to evolve and may be inconsistent from one jurisdiction to another. Compliance with all such laws and regulations may increase the Company’s operating costs and adversely impact the Company’s ability to market the Company’s properties and services.
Additionally, we rely on our information technology systems to be able to monitor and control our operations, adjust to changing market conditions and implement strategic initiatives. Any disruptions in these systems or the failure of these systems to operate as expected could adversely affect our ability to access and use certain applications and could, depending on the nature and magnitude of the problem, adversely affect our operating results by limiting our ability to effectively monitor and control our operations, adjust to changing market conditions and implement strategic initiatives.
The security measures that we and our vendors put in place cannot provide absolute security, and the information technology infrastructure we and our vendors use may be vulnerable to criminal cyber-attacks or data security incidents, including, ransom of data, such as, without limitation, tenant, business partner and/or employee information, due to employee error, malfeasance or other vulnerabilities. Any such incident could compromise our networks or our vendors’ networks (or the networks or systems of third parties that facilitate our business activities or our vendors’ business activities), and the information we or our vendors store could be accessed, misused, publicly disclosed, corrupted, lost or stolen, resulting in fraud, including wire fraud related to our assets, or other harm. Moreover, if a data security incident or breach affects our systems or our vendors’ systems, whether through a breach of our systems or a breach of the systems of third parties, or results in the unauthorized release of personally identifiable information, our reputation and brand could be materially damaged and we may be exposed to a risk of loss or litigation and possible liability, including, without limitation, loss related to the fact that agreements with our vendors, or our vendors’ financial condition, may not allow us to recover all costs related to a cyber-breach for which they alone are responsible for or which we are jointly responsible for, which could result in a material adverse effect on our business, results of operations and financial condition.
Privacy and information security risks have generally increased in recent years because of the proliferation of new technologies, such as ransomware, and the increased sophistication and activities of perpetrators of cyber-attacks. In light of the increased risks, we have dedicated substantial additional resources of expense, labor and time to strengthening the security of our computer systems. In the future, we may expend additional resources to continue to enhance our information security measures and/or to investigate and remediate any information security vulnerabilities. Despite these steps, there can be no assurance that we will not suffer a significant data security incident in the future, that unauthorized parties will not gain access to sensitive data stored on our systems or that any such incident will be discovered in a timely manner. Any failure in or breach of our information security systems, those of third party service providers or a breach of other third party systems that ultimately impacts our operational or information security systems as a result of cyber-attacks or information security breaches could result in a wide range of potentially serious harm to our business and results of operations. Further, the techniques used by criminals to obtain unauthorized access to sensitive data, such as phishing and other forms of human engineering, are increasing in sophistication and are often novel or change frequently; accordingly, we may be unable to anticipate these techniques or implement adequate preventative measures.
Some of our directors are involved in other businesses including real estate activities and public and/or private investments and, therefore, may have competing or conflicting interests with us.
Certain of our directors have and may in the future have interests in other real estate business activities and may have control or influence over these activities or may serve as investment advisors, directors or officers. These interests and activities, and any duties to third parties arising from such interests and activities, could divert the attention of such
HHC 2021 FORM 10-K | 19
| RISK FACTORS | |||||
directors from our operations. Additionally, certain of our directors are engaged in investment and other activities in which they may learn of real estate and other related opportunities in their non-director capacities. Our Code of Business Conduct and Ethics applicable to our directors expressly provides, as permitted by Section 122(17) of the Delaware General Corporation Law (the DGCL), that our non-employee directors are not obligated to limit their interests or activities in their non-director capacities or to notify us of any opportunities that may arise in connection therewith, even if the opportunities are complementary to, or in competition with, our businesses. Accordingly, we have no expectation that we will be able to learn of or participate in such opportunities. If any potential business opportunity is expressly presented to a director exclusively in his or her director capacity, the director will not be permitted to pursue the opportunity, directly or indirectly through a controlled affiliate in which the director has an ownership interest, without the approval of the independent members of our board of directors.
Pershing Square will have the ability to influence our policies and operations and its interests may not in all cases be aligned with other stockholders.
Pershing Square beneficially owns approximately 25.2% of our outstanding common stock as of December 31, 2021. Additionally, Mr. William Ackman, founder and chief executive officer of Pershing Square, is the chairman of our board of directors. Accordingly, Pershing Square will have the ability to influence our policies and operations, including the appointment of management, future issuances of our common stock or other securities, the payment of dividends, if any, on our common stock, the incurrence or modification of debt by us, amendments to our amended and restated certificate of incorporation and amended and restated bylaws and the entering into of extraordinary transactions, and its interests may not in all cases be aligned with other stockholders’ interests.
| FINANCIAL RISKS | ||
Our indebtedness could adversely affect our business, prospects, financial condition or results of operations and prevent us from fulfilling our obligations under our Senior Notes and Loan Agreements.
We have a significant amount of indebtedness. As of December 31, 2021, our total consolidated debt was approximately $4.6 billion (excluding an undrawn balance of $85.0 million under our revolving credit facility) of which $2.2 billion was recourse to the Company or one of its subsidiaries. In addition, we have $97.7 million of recourse guarantees associated with undrawn financing commitments as of December 31, 2021. As of December 31, 2021, our proportionate share of the debt of our non-consolidated joint ventures (Real estate and other affiliates) was $295.5 million based upon our economic ownership of which $100.6 million was recourse to The Company.
Subject to the limits contained in the indentures governing the $275 million Bridgeland Notes due 2026, the $750 million 5.375% senior notes due 2028, the $650 million 4.125% senior notes due 2029, and the $650 million 4.375% senior notes due 2031 (collectively, the Senior Notes), the limits contained in the agreements governing our Term Loan and Revolver (collectively, the Loan Agreements) that mature on September 18, 2023, and any limits under our other debt agreements, we may need to incur substantial additional indebtedness from time to time, including project indebtedness for developments by our subsidiaries. If we incur additional indebtedness, the risks related to our level of indebtedness could intensify. Specifically, an increased level of indebtedness could have important consequences, including:
–making it more difficult for us to satisfy our obligations with respect to our indebtedness, including the Senior Notes and Loan Agreements
–limiting our ability to obtain additional financing to fund future working capital, capital expenditures, debt service requirements, execution of our business strategy or finance other general corporate requirements
–requiring us to make non-strategic divestitures, particularly when the availability of financing in the capital markets is limited, which may adversely impact sales prices
–requiring a substantial portion of our cash flow to be allocated to debt service payments instead of other business purposes, thereby reducing the amount of cash flow available for working capital, capital expenditures, acquisitions, dividends and other general corporate purposes
–increasing our vulnerability to general adverse economic and industry conditions, including increases in interest rates, particularly given that certain indebtedness bears interest at variable rates
–limiting our ability to capitalize on business opportunities, reinvest in and develop properties and to react to competitive pressures and adverse changes in government regulations
–placing us at a disadvantage compared to other less leveraged competitors, if any
–limiting our ability, or increasing the costs, to refinance indebtedness
–resulting in an event of default if we fail to satisfy our obligations under our indebtedness, which default could result in all or part of our indebtedness becoming immediately due and payable and, in the case of our secured debt, could permit the lenders to foreclose on our assets securing such debt
HHC 2021 FORM 10-K | 20
| RISK FACTORS | |||||
The indentures governing our Senior Notes, the Loan Agreements and our other debt agreements contain restrictions that may limit our ability to operate our business.
The indentures governing our Senior Notes contain certain restrictions that may limit our ability to operate. In addition, the Loan Agreements contain representations and covenants customary for loan agreements of this type, including financial covenants related to maintenance of interest coverage ratios and loan-to-value ratios with respect to the certain mortgaged properties, taken as a whole. The Loan Agreements also contain customary events of default, certain of which are subject to cure periods. These restrictions limit our ability or the ability of certain of our subsidiaries to, among other things:
–incur indebtedness or issue equity
–create certain liens
–pay dividends on, redeem or repurchase capital stock or make other restricted payments
–make investments
–incur obligations that restrict the ability of our subsidiaries to make dividend or other payments to us
–consolidate, merge or transfer all, or substantially all, of our assets
–enter into or amend lease or other agreements or transactions without consent
–substitute collateral, if applicable, due to produce and geographic concentrations
–enter into transactions with our affiliates
–create or designate unrestricted subsidiaries
Additionally, certain of our debt agreements also contain various restrictive covenants, including minimum net worth requirements, maximum payout ratios on distributions, minimum debt yield ratios, minimum fixed charge coverage ratios, minimum interest coverage ratios and maximum leverage ratios. The restrictions under the indentures and/or other debt agreements could limit our ability to finance our future operations or capital needs, make acquisitions or pursue available business opportunities.
We may be required to take action to reduce our debt or act in a manner inconsistent with our business objectives and strategies to meet such ratios and satisfy the covenants in our debt agreements. Events beyond our control, such as changes in economic and business conditions or the volatility and uncertainty created by COVID-19, may affect our ability to do so. We may not be able to meet the ratios or satisfy the covenants in our debt agreements, and we cannot assure that our lenders will waive any failure to do so. A breach of any of the covenants in, or our inability to maintain the required financial ratios, under our debt agreements would likely result in a default under such debt agreements, which may accelerate the principal and interest payments of the debt and, if such debt is secured, result in the foreclosure on certain of our assets that secure such debt. A breach of any of the covenants in, or our inability to maintain the required financial ratios, under our debt agreements also would prevent us from borrowing additional money under such agreements that include revolving credit facilities. A default under any of our debt agreements could, in turn, result in defaults under other obligations and result in other creditors accelerating the payment of other obligations and foreclosing on assets securing such obligations, if any. Any such defaults could materially impair our financial condition and liquidity. In addition, if the lenders under any of our debt agreements or other obligations accelerate the maturity of those obligations, we cannot assure that we will have sufficient assets to satisfy our obligations under the notes or our other debt.
We may be unable to develop and expand our properties without sufficient capital or financing.
Our business objective includes the development and redevelopment of our properties, particularly those in our Strategic Developments segment, which we may be unable to do if we do not have, cannot obtain or cannot generate sufficient capital from MPC land sales or operations, debt capital from lenders or the capital markets, or government incentives, such as tax increment financing, to proceed with planned development, redevelopment or expansion activities. We may be unable to access or acquire financing due to the market volatility and uncertainty created by COVID-19. We may be unable to obtain an anchor store, mortgage lender and property partner approvals that are required for any such development, redevelopment or expansion. We may abandon redevelopment or expansion activities already underway that we are unable to complete due to the inability to secure additional capital to finance such activities. This may result in charge-offs of costs previously capitalized. In addition, if redevelopment, expansion or reinvestment projects are unsuccessful, the investment in such projects may not be recoverable, in full or in part, from future operations or sale resulting in impairment charges.
We may be adversely affected by changes in LIBOR reporting practices, the method in which LIBOR is determined or the use of alternative reference rates.
On March 5, 2021, the ICE Benchmark Administration Limited, the administrator of LIBOR and the United Kingdom Financial Conduct Authority (FCA), which regulates the process for establishing London Interbank Offered Rate (LIBOR), announced that all LIBOR settings will either cease to be published by any benchmark administrator, or no longer be representative immediately after December 31, 2021, for most LIBOR settings, and immediately after June 30, 2023, for
HHC 2021 FORM 10-K | 21
| RISK FACTORS | |||||
overnight, one-month, three-month, six-month and 12-month U.S. dollar LIBOR settings. Accordingly, the FCA has stated that is does not intend to persuade or compel banks to submit to LIBOR after such respective dates. As of January 1, 2022, publication of one-week and two-month U.S. dollar LIBOR has ceased, and regulated U.S. financial institutions are no longer permitted to enter into new contracts referencing any LIBOR settings. The Alternative Reference Rates Committee (ARRC), a committee convened by the Federal Reserve Board and the New York Federal Reserve Bank, has proposed replacing U.S. dollar LIBOR with a new index based on trading in overnight repurchase agreements, the Secured Overnight Financing Rate (SOFR). The ARRC has formally announced and recommended SOFR as an alternative reference rate to LIBOR. At this time, we are not able to accurately predict whether SOFR will become the most prevalent alternative reference rate in the market, or what impact the transition from LIBOR to alternative reference rates may have on our business, results of operations, and financial condition. Additionally, it is difficult to predict whether and to what extent banks will continue to provide submissions to the administrator of rate quotes for the U.S. dollar LIBOR settings that have not already been discontinued or, if they do, whether such rates will be representative of the underlying market or economic reality before they are scheduled to be discontinued on June 30, 2023, or whether any additional reforms to LIBOR may be enacted in the United Kingdom or elsewhere.
As of December 31, 2021, we had approximately $1.2 billion of mortgages, notes and loans payable indexed to LIBOR. During 2021, we entered into certain new borrowings indexed to SOFR. It is anticipated that SOFR will be the benchmark for new borrowings and that we will modify certain existing borrowings to replace LIBOR with SOFR. However, there can be no assurances on which benchmark rate(s) may replace LIBOR or how LIBOR will be determined for purposes of financial instruments that are currently referencing LIBOR when it ceases to exist, and the discontinuance of LIBOR may result in uncertainty or differences in the calculation of the applicable interest rate or payment amount depending on the terms of the governing instruments and may also increase operational and other risks to the Company and our industry. For example, if a published U.S. dollar LIBOR rate is unavailable, the interest rates on our mortgage notes, certain of which are indexed to LIBOR, will be determined using various alternative methods, any of which may result in interest obligations which are more than or do not otherwise correlate over time with the payments that would have been made on such debt if U.S. dollar LIBOR was available in its current form. Our financial instruments may require changes to documentation as well as enhancements and modifications to systems, controls, procedures and models, which could present operational and legal challenges for us and our customers, investors and counterparties. There can be no assurance that we will be able to modify all existing financial instruments before the discontinuation of LIBOR. If such financial instruments are not remediated to provide a method for transitioning from LIBOR to an alternative reference rate, the New York state LIBOR legislation and proposed federal legislation related to the LIBOR transition may provide statutory solutions to implement an alternative reference rate and provide legal protection against litigation.
The market transition away from LIBOR to an alternative reference rate is complex, and any of these proposals or consequences could have a material adverse effect on our financing costs, and as a result, our financial condition, operating results and cash flows. We continue to monitor developments in the LIBOR transition and the proposed federal legislation related to the LIBOR transition to facilitate an orderly transition away from the use of LIBOR.
We are subject to risks associated with hedging arrangements.
We enter into interest rate swap agreements and other interest rate hedging contracts, including caps and cash settled forward starting swaps, to mitigate or reduce our exposure to interest rate volatility or to satisfy lender requirements. These agreements expose us to additional risks, including a risk that counterparties of these hedging and swap agreements will not perform. There also could be significant costs and cash requirements involved to fulfill our obligations under a hedging agreement. In addition, our hedging activities may not have the desired beneficial impact on interest rate exposure and have a negative impact on our business, financial condition and results of operations.
We may not realize the value of our tax assets.
Certain provisions of the Internal Revenue Code could limit our ability to fully utilize certain tax assets if we were to experience a change in control. As of December 31, 2021, we have approximately $384.8 million of federal net operating loss carryforwards. If certain change in control events were to occur, the cash flow benefits we might otherwise have received could be decreased.
Inflation may adversely affect us by increasing costs beyond what we can recover through price increases.
The U.S. economy has experienced an increase in inflation recently. Inflation can adversely affect us by increasing costs of land, materials and labor. Although we believe that sources of supply for raw materials and components are generally adequate, it is difficult to predict what effects price increases may have in the future. In addition, significant inflation is often accompanied by higher interest rates, which have a negative impact on demand for homes in our MPCs and demand for our condominium projects, and our ability to refinance existing indebtedness on favorable terms, or at all, due to higher borrowing costs. In an inflationary environment, depending on the homebuilding industry and other economic
HHC 2021 FORM 10-K | 22
| RISK FACTORS | |||||
conditions, we may be precluded from raising land prices enough to keep up with the rate of inflation, which could significantly reduce our profit margins. In recent years we have been experiencing increases in the prices of labor and materials above the general inflation rate. Our inability to offset increasing costs due to inflation through price increases to customers could have a material adverse effect on our results of operations, financial conditions and cash flows.
Some potential losses are not insured.
We carry comprehensive liability, fire, flood, earthquake, terrorism, extended coverage and rental loss insurance on all of our properties. We believe the policy specifications and insured limits of these policies are adequate and appropriate. There are some types of losses, including lease and other contract claims, which generally are not insured. If an uninsured loss or a loss in excess of insured limits occurs, we could lose all or a portion of the capital invested in a property, as well as the anticipated future revenue from the property. If this happens, we might remain obligated for any mortgage debt or other financial obligations related to the property.
| REGULATORY, LEGAL AND ENVIRONMENTAL RISKS | ||
Our development, construction and sale of condominiums are subject to state regulations and may be subject to claims from the condominium owner’s association at each project.
A portion of our business is dedicated to the development and sale of condominiums. Condominiums are generally regulated by an agency of the state in which they are located or where the condominiums are marketed to be sold. In connection with our development and offering of condominium units for sale, we must submit regulatory filings to various state agencies and engage in an entitlement process by which real property owned under one title is converted into individual units. Responses or comments on our condominium filings may delay our ability to sell condominiums in certain states and other jurisdictions in a timely manner, or at all. Further, we will be required to transfer control of a condominium association’s board of directors once we trigger one of several statutory thresholds, with the most likely triggers being tied to the sale of not less than a majority of units to third-party owners. Transfer of control can result in claims with respect to deficiencies in operating funds and reserves, construction defects and other condominium-related matters by the condominium association and/or third-party condominium unit owners. Any material claims in these areas could negatively affect our reputation in condominium development and ultimately have a material adverse effect on our business, financial condition and results of operations.
Development of properties entails a lengthy, uncertain and costly entitlement process.
Approval to develop real property sometimes requires political support and generally entails an extensive entitlement process involving multiple and overlapping regulatory jurisdictions and often requires discretionary action by local governments. Real estate projects must generally comply with local land development regulations and may need to comply with state and federal regulations. We incur substantial costs to comply with legal and regulatory requirements. An increase in legal and regulatory requirements may cause us to incur substantial additional costs, or in some cases cause us to determine that the property is not feasible for development. In addition, our competitors and local residents may challenge our efforts to obtain entitlements and permits for the development of properties. The process to comply with these regulations is usually lengthy and costly, may not result in the approvals we seek and can be expected to materially affect our development activities.
Government regulations and legal challenges may delay the start or completion of the development of our communities, increase our expenses or limit our homebuilding or other activities.
Various local, state and federal statutes, ordinances, rules and regulations concerning building, health and safety, site and building design, environment, zoning, sales and similar matters apply to and/or affect the real estate development industry. In addition, our ability to obtain or renew permits or approvals and the continued effectiveness of permits already granted or approvals already obtained depends on factors beyond our control, such as changes in federal, state and local policies, rules and regulations and their interpretations and application.
Municipalities may restrict or place moratoriums on the availability of utilities, such as water and sewer taps. If municipalities in which we operate take such actions, it could have an adverse effect on our business by causing delays, increasing our costs or limiting our ability to operate in those municipalities. These measures may reduce our ability to open new MPCs and to build and sell other real estate development projects in the affected markets, including with respect to land we may already own, and create additional costs and administration requirements, which in turn may harm our future sales, margins and earnings.
HHC 2021 FORM 10-K | 23
| RISK FACTORS | |||||
Governmental regulation affects not only construction activities but also sales activities, mortgage lending activities and other dealings with consumers. Further, government agencies routinely initiate audits, reviews or investigations of our business practices to ensure compliance with applicable laws and regulations, which can cause us to incur costs or create other disruptions in our business that can be significant. Further, we may experience delays and increased expenses as a result of legal challenges to our proposed communities, whether brought by governmental authorities or private parties.
We may be subject to increased compliance costs to comply with new and contemplated government regulations relating to energy standards and climate change.
A variety of legislation being enacted, or considered for enactment, at the federal, state and local level relating to energy and climate change. This legislation relates to items such as carbon dioxide emissions control and building codes that impose energy efficiency standards. New building code requirements that impose stricter energy efficiency standards could significantly increase our cost to construct buildings. Such environmental laws may affect, for example, how we manage storm water runoff, wastewater discharges and dust; how we develop or operate on properties on or affecting resources such as wetlands, endangered species, cultural resources, or areas subject to preservation laws; and how we address contamination. As climate change concerns continue to grow, legislation and regulations of this nature are expected to continue and to make compliance more costly. In addition, it is possible that some form of expanded energy efficiency legislation may be passed by the U.S. Congress or federal agencies and certain state legislatures, which may, despite being phased in over time, significantly increase our costs of building MPCs and the sale price to our buyers and adversely affect our sales volumes. We may be required to apply for additional approvals or modify our existing approvals because of changes in local circumstances or applicable law.
Energy-related initiatives affect a wide variety of companies throughout the United States and the world and, because our operations are heavily dependent on significant amounts of raw materials, such as lumber, steel and concrete, they could have an indirect adverse impact on our operations and profitability to the extent the manufacturers and suppliers of our materials are burdened with expensive cap and trade and similar energy related taxes and regulations. Our noncompliance with environmental laws could result in fines and penalties, obligations to remediate, permit revocations and other sanctions.
We may be subject to potential costs to comply with environmental laws.
Future development opportunities may require additional capital and other expenditures to comply with laws and regulations relating to the protection of the environment. Under various federal, state or local laws, ordinances and regulations, a current or previous owner or operator of real estate may be required to investigate and clean up hazardous or toxic substances released at a property and may be held liable to a governmental entity or to third parties for property damage or personal injuries and for investigation and clean-up costs incurred by the parties in connection with the contamination. These laws often impose liability without regard to whether the owner or operator knew of, or was responsible for, the release of the hazardous or toxic substances. The presence of contamination or the failure to remediate contamination may adversely affect the owner’s ability to sell or lease real estate or to borrow using the real estate as collateral. Other federal, state and local laws, ordinances and regulations require abatement or removal of asbestos-containing materials in the event of demolition or certain renovations or remodeling, the cost of which may be substantial for certain redevelopments, and also govern emissions of and exposure to asbestos fibers in the air. Federal and state laws also regulate the operation and removal of underground storage tanks. In connection with our ownership, operation and management of certain properties, we could be held liable for the costs of remedial action with respect to these regulated substances or tanks or related claims.
We cannot predict with any certainty the magnitude of any expenditures relating to the environmental compliance or the long-range effect, if any, on our operations. Compliance with such laws has not had a material adverse effect on our operating results or competitive position in the past but could have such an effect on our operating results and competitive position in the future.
Compliance with the Americans with Disabilities Act may be a significant cost for us.
The Americans with Disabilities Act of 1990, as amended (ADA), requires that all public accommodations and commercial facilities, including office buildings, meet certain federal requirements related to access and use by disabled persons. Compliance with ADA requirements could involve the removal of structural barriers from certain disabled persons’ entrances which could adversely affect our financial condition and results of operations. Other federal, state and local laws may require modifications to or restrict further renovations of our properties with respect to such accesses. Noncompliance with the ADA or similar or related laws or regulations could result in the United States government imposing fines or private litigants being awarded damages against us. In addition, changes to existing requirements or enactments of new requirements could require significant expenditures. Such costs may adversely affect our business, financial and results of operations.
HHC 2021 FORM 10-K | 24
| RISK FACTORS | |||||
Climate change may adversely affect our business.
As a result of climate change, we may experience extreme weather and changes in precipitation and temperature, all of which may result in physical damage or a decrease in demand for our properties located in the areas affected by these conditions. Should the impact of climate change be material in nature or occur for lengthy periods of time, our financial condition or results of operations would be adversely affected. In addition, many state and local governments are adopting or considering adopting regulations requiring that property owners and developers include in their development or redevelopment plans resiliency measures to address climate-change related risks. We may be required to incur substantial costs if such regulations apply to any of our properties.
| GENERAL RISKS | ||
COVID-19 has disrupted our business and has had a material adverse effect on our business, financial performance and condition, operating results and cash flows.
COVID-19 has disrupted our business and has had a material adverse effect on our business, financial performance and condition, operating results and cash flows, and will continue to materially adversely impact and cause disruption to, our business, financial performance and condition, operating results and cash flows. Factors that would negatively impact our ability to successfully operate during and after COVID-19 or another pandemic include:
–our ability to continue to sell land to residential homebuilders and developers in our MPCs at attractive prices, which would lead to lower land sales revenue in our MPC segment, if such homebuilders continue to see a decline in new home sales to their consumers or if there is reduced availability of loans to support such homebuilders
–our ability to continue to collect rents, on a timely basis or at all, without reductions or other concessions, in multi-family and office properties
–our ability to collect rent from our retail tenants where most retail tenants have closed their businesses (including nearly all of our retail tenants in Summerlin, Ward Village and Riverwalk)
–reductions in demand for leased space and/or defaults under our leases, as a result of downturns in our tenants’ personal financial situations as well as commercial businesses, which include retail stores, restaurants and event attractions such as those in the Seaport, in part due to containment measures, such as travel restrictions, mandatory government closures, quarantines, “shelter in place” orders and social distancing, as well as the overall impact on the economy and our tenants’ industries (including the energy sector)
–fluctuations in regional and local economies, the residential housing and condominium markets, local real estate conditions, and tenant rental rates
–disruptions to supply chains continue and significant inflation has been seen in the market
–our ability to continue to make condominium sales in Hawai‘i and land sales in our MPCs, in light of the impact on the overall economy and consumers’ reluctance to make significant capital decisions in times of economic uncertainty, particularly if there is reduced availability of loans for such consumers
–our ability to attract people to the Seaport through socially distanced events and programs
–our and our tenants’ ability to continue or complete construction as planned for their operations, or delays in the supply of materials or labor necessary for construction
–the continued service and availability of personnel, including our executive officers and other leaders that are part of our management team and our ability to recruit, attract and retain skilled personnel to the extent our management or personnel are impacted in significant numbers or in other significant ways by the outbreak of pandemic or epidemic disease
–our ability to ensure business continuity in the event our continuity of operations plan is not effective or improperly implemented or deployed during a disruption
–a complete or partial closure of, or other operational issues at, one or more of our MPCs or our corporate headquarters resulting from government action or otherwise
–delays in, or our ability to complete, sales of our remaining non-core assets on the expected terms or timing
–difficulty accessing debt and equity capital on attractive terms, or at all, and a severe disruption and instability in the global financial markets or deteriorations in credit and financing conditions that may affect our access to capital necessary to fund business operations or address maturing liabilities
The extent to which the ongoing COVID-19 pandemic will continue to impact our operations will depend on future developments, which are highly uncertain, cannot be predicted with confidence, and are largely outside of our control, including the scope, severity and duration of the pandemic, the spread of the Delta, Omicron or other potential new variants, the actions taken to contain the pandemic or mitigate its impact, and the direct and indirect economic effects of the pandemic and containment measures, among others. At various times during the course of the pandemic,
HHC 2021 FORM 10-K | 25
| RISK FACTORS | |||||
governments, businesses and the public have taken unprecedented actions and imposed restrictions to contain the spread of COVID-19 and mitigate the effects of the pandemic. We cannot predict whether and to what extent restrictions will be reinstated, whether additional cities and states will implement similar restrictions or when restrictions currently in place will expire. In addition to governmental restrictions, we cannot predict when our customers will again feel comfortable with frequenting retail establishments or working from offices.
The effects of restrictions on our operations, including future restrictions and extended periods of remote work arrangements, could strain our business continuity plans, introduce operational risk, including but not limited to cybersecurity risks, and impair our ability to manage our business. The rapid development and fluidity of this situation precludes any prediction as to the full adverse impact of the COVID-19 pandemic. The COVID-19 pandemic presents material uncertainty and risk with respect to our financial condition, results of operations, cash flows and performance. Moreover, many risk factors set forth herein should be interpreted as heightened risks as a result of the impact of the COVID-19 pandemic.
Loss of key personnel could adversely affect our business and operations.
We depend on the efforts of key executive personnel. The loss of the services of any key executive personnel could adversely affect our business and operations. While we believe we have proper succession planning and are confident we could attract and train new personnel if necessary, this could impose additional costs and hinder our business strategy. Competition for qualified personnel in our industry is intense.
Possible terrorist activity or other acts of violence could adversely affect our financial condition and results of operations.
Future terrorist attacks in the United States or other acts of violence may result in declining economic activity, which could harm the demand for goods and services offered by tenants and the value of our properties and might adversely affect the value of an investment in our securities. Such a resulting decrease in retail demand could make it difficult to renew or re-lease properties at lease rates equal to or above historical rates. Terrorist activities or violence also could directly affect the value of our properties, including a high-profile property such as the Seaport, through damage, destruction or loss, and the availability of insurance for such acts, or of insurance generally, might be lower or cost more, which could increase our operating expenses and adversely affect our financial condition and results of operations. To the extent that tenants are affected by future attacks, their businesses similarly could be adversely affected, including their ability to continue to meet obligations under their existing leases. These acts might erode business and consumer confidence and spending and might result in increased volatility in national and international financial markets and economies. Any one of these events might decrease demand for real estate, decrease or delay the occupancy of new or redeveloped properties, and limit access to capital or increase the cost of capital.
Our stock price may continue to be volatile.
The trading price of our common stock is likely to continue to be volatile due to the stock market’s routine periods of large or extreme volatility. This volatility often has been unrelated or disproportionate to the operating performance of particular companies, including ours. Factors that affect our trading price include the following:
–results of operations that vary from the expectations of securities analysts and investors, including our ability to finance and achieve operational success at the Seaport project
–changes in expectations as to our future financial performance, including financial estimates and investment recommendations by securities analysts and investors
–announcements by us or our competitors of new significant real-estate developments, acquisitions, joint ventures, other strategic relationships or actions, or capital commitments, or responses to these events
–changes in general economic or market conditions, including increases in interest rates, or trends in our industry or markets
–future sales of our common stock or other securities
–the successful transition of our new senior executives and the services and contribution of our other senior management and key employees to execute on our Transformation Plan and to identify new opportunities
–guidance, if any, that we provide to the public, any changes in this guidance, or our failure to meet this guidance;
–the development and sustainability of an active trading market for our stock
–changes in accounting principles
–events or factors resulting from natural disasters
–other events or factors, including those resulting from war, acts of terrorism, or responses to these events
HHC 2021 FORM 10-K | 26
| RISK FACTORS | |||||
These broad market and industry fluctuations may adversely affect the market price of our common stock, regardless of our actual operating performance. In addition, price volatility may be greater if the public float and trading volume of our common stock is low. In the past, following periods of market volatility, stockholders have instituted securities class action litigation. If we were involved in securities litigation, it could have a substantial cost and divert resources and the attention of executive management from our business regardless of the outcome of such litigation.
Provisions in our certificate of incorporation, our by-laws, Delaware law, stockholder’s rights agreement and certain other agreements may prevent or delay an acquisition of us, which could decrease the trading price of our common stock.
Our certificate of incorporation and bylaws contain the following limitations:
–the inability of our stockholders to act by written consent
–restrictions on the ability of stockholders to call a special meeting without 15% or more of the voting power of the issued and outstanding shares entitled to vote generally in the election of our directors
–rules regarding how stockholders may present proposals or nominate directors for election at stockholder meetings
–the right of our board of directors to issue preferred stock without stockholder approval
–a requirement that, to the fullest extent permitted by law, certain proceedings against or involving us or our directors or officers be brought exclusively in the Court of Chancery in the State of Delaware
–that certain provisions may be amended only by the affirmative vote of at least 66 2/3% of the shares of common stock entitled to vote generally in the election of directors
In addition, we are a Delaware corporation, and Section 203 of the DGCL applies to us. In general, Section 203 prevents an interested stockholder from engaging in certain business combinations with us for three years following the date that person becomes an interested stockholder subject to certain exceptions. The statute generally defines interested stockholder as any person that is the owner of 15% or more of the outstanding voting stock or is our affiliate or associate and was the owner of 15% or more of outstanding voting stock at any time within the three-year period immediately before the date of determination.
We have granted a waiver of the applicability of the provisions of Section 203 of the DGCL to Pershing Square Capital Management, L.P., PS Management GP, LLC and William A. Ackman, chairman of our Board (together, Pershing Square) such that Pershing Square may increase its position in our common stock up to 40% of the outstanding shares without being subject to Section 203’s restrictions on business combinations. As such, Pershing Square, through its ability to accumulate more common stock than would otherwise be permitted under Section 203, has the ability to become a large holder that would be able to affect matters requiring approval by Company stockholders, including the election of directors and approval of mergers or other business combination transactions. The Board also amended the Company’s Corporate Governance Guidelines to reflect that it will grant to any stockholder a waiver of the applicability of Section 203 of the DGCL to the acquisition of up to 40% of the Company’s outstanding voting stock upon the request of such stockholder, subject to the Board’s fiduciary duties and applicable law.
These anti-takeover provisions could make it more difficult for a third party to acquire us, even if the third-party’s offer may be considered beneficial by many of our stockholders. As a result, our stockholders may be limited in their ability to obtain a premium for their shares. These provisions could limit the price that investors might be willing to pay in the future for shares of our common stock. There also may be dilution of our common stock from the exercise of outstanding warrants, which may materially adversely affect the market price and negatively impact a holder’s investment.
Item 1B. Unresolved Staff Comments
None.
HHC 2021 FORM 10-K | 27
Item 2. Properties
Our corporate headquarters are located in The Woodlands, Texas. We also maintain offices at certain of our properties nationwide, including Honolulu, Hawai‘i; New York, New York; Columbia, Maryland; Las Vegas, Nevada; and Phoenix, Arizona, which serve operations across all segments. We believe our present facilities are sufficient to support our operations.
| OPERATING ASSETS | ||
In our Operating Assets segment, we own a variety of asset types including retail, office, multi-family and other assets and investments. Our portfolio includes approximately 10.4 million square feet of retail and office properties, 4,200 wholly and partially owned multi-family units, and wholly and partially owned other properties and investments. In addition to several other locations, our assets in this segment are primarily located in and around Houston, Texas (The Woodlands and Bridgeland); Columbia, Maryland (Columbia); Las Vegas, Nevada (Summerlin); and Honolulu, Hawai‘i (Ward Village).
The following table summarizes certain metrics of our office assets within our Operating Assets segment as of December 31, 2021:
| Office Assets | Rentable Sq.Ft./Units | % Leased | Annualized Base Rent (thousands) (a) | Annualized Base Rent Per Square Foot (a) | Effective Annual Rent (thousands) (b) | Effective Annual Rent per Square Foot (b) | Year Built / Acquired / Last Renovated | |||||||||||||||||||||||||||||||
| The Woodlands | ||||||||||||||||||||||||||||||||||||||
| One Hughes Landing | 197,719 | 97% | $5,775 | $30.12 | $8,635 | $45.03 | 2013 | |||||||||||||||||||||||||||||||
| Two Hughes Landing | 197,714 | 68% | 4,072 | 30.36 | 6,167 | 45.97 | 2014 | |||||||||||||||||||||||||||||||
| Three Hughes Landing | 320,815 | 91% | 8,159 | 28.43 | 11,778 | 41.05 | 2016 | |||||||||||||||||||||||||||||||
| 1725 Hughes Landing Boulevard | 331,176 | 64% | 4,375 | 20.70 | 6,096 | 28.85 | 2015 | |||||||||||||||||||||||||||||||
| 1735 Hughes Landing Boulevard | 318,170 | 100% | 7,884 | 24.78 | 11,605 | 36.47 | 2015 | |||||||||||||||||||||||||||||||
| 2201 Lake Woodlands Drive | 24,119 | 100% | 446 | 18.50 | 759 | 31.46 | 2011 | |||||||||||||||||||||||||||||||
| Lakefront North | 258,058 | 96% | 4,275 | 22.37 | 7,101 | 37.16 | 2018 | |||||||||||||||||||||||||||||||
| 8770 New Trails | (c) | 180,000 | 100% | — | — | — | — | 2020 | ||||||||||||||||||||||||||||||
| 9303 New Trails | 97,967 | 79% | 1,626 | 21.01 | 2,485 | 32.12 | 2011 | |||||||||||||||||||||||||||||||
| 3831 Technology Forest Drive | 95,078 | 100% | 2,349 | 24.70 | 3,419 | 35.96 | 2014 | |||||||||||||||||||||||||||||||
| 3 Waterway Square | 232,021 | 91% | 5,645 | 27.90 | 8,020 | 39.63 | 2013 | |||||||||||||||||||||||||||||||
| 4 Waterway Square | 218,551 | 100% | 6,559 | 30.01 | 9,371 | 42.88 | 2011 | |||||||||||||||||||||||||||||||
| The Woodlands Towers at The Waterway | 1,401,610 | 76% | 29,951 | 29.64 | 45,148 | 44.68 | 2019 | |||||||||||||||||||||||||||||||
| 1400 Woodloch Forest | 95,667 | 57% | 1,469 | 31.61 | 1,518 | 32.68 | 2011 | |||||||||||||||||||||||||||||||
| 3,968,665 | ||||||||||||||||||||||||||||||||||||||
| Columbia | ||||||||||||||||||||||||||||||||||||||
| 10 - 70 Columbia Corporate Center | 898,746 | 84% | 20,556 | 29.21 | 20,918 | 29.73 | 2012 / 2014 | |||||||||||||||||||||||||||||||
| Columbia Office Properties | 63,831 | 64% | 894 | 27.13 | 931 | 28.23 | 2004 / 2007 | |||||||||||||||||||||||||||||||
| One Mall North | 97,092 | 93% | 2,813 | 30.99 | 2,967 | 32.69 | 2016 | |||||||||||||||||||||||||||||||
| One Merriweather | 206,632 | 100% | 7,754 | 37.53 | 7,767 | 37.59 | 2017 | |||||||||||||||||||||||||||||||
| Two Merriweather | 124,016 | 93% | 4,568 | 39.47 | 4,588 | 39.64 | 2017 | |||||||||||||||||||||||||||||||
| 6100 Merriweather | 319,470 | 66% | 6,946 | 33.57 | 7,169 | 34.64 | 2019 | |||||||||||||||||||||||||||||||
| 1,709,787 | ||||||||||||||||||||||||||||||||||||||
| Summerlin | ||||||||||||||||||||||||||||||||||||||
| Aristocrat | (c) | 181,534 | 100% | — | — | — | — | 2018 | ||||||||||||||||||||||||||||||
| One Summerlin | 206,279 | 96% | 7,591 | 38.31 | 7,766 | 39.19 | 2015 | |||||||||||||||||||||||||||||||
| Two Summerlin | 144,615 | 100% | 5,263 | 36.39 | 5,477 | 37.87 | 2018 | |||||||||||||||||||||||||||||||
| 532,428 | ||||||||||||||||||||||||||||||||||||||
| Other | ||||||||||||||||||||||||||||||||||||||
| 110 North Wacker | (d) | 1,491,651 | 79% | 24 | 28.27 | 29,891 | 34.87 | 2020 | ||||||||||||||||||||||||||||||
| Total | 7,702,531 | |||||||||||||||||||||||||||||||||||||
(a)Annualized Base Rent is calculated as the monthly Base Minimum Rent for the property for December 31, 2021, multiplied by 12. Annualized Base Rent Per Square Foot is the Annualized Base Rent for the property at December 31, 2021, divided by the average occupied square feet.
(b)Effective Annual Rent includes base minimum rent and common area maintenance recovery revenue. Effective Annual Rent Per Square Foot is the Effective Annual Rent divided by the average occupied square feet.
(c)8770 New Trails and Aristocrat are build-to-suit projects entirely leased by a single tenant. Therefore, the Annualized Base Rent and Effective Annual Rent details have been excluded for competitive reasons.
(d)Our economic ownership in 110 North Wacker, located in Chicago, Illinois, is 23%.
HHC 2021 FORM 10-K | 28
The following table summarizes certain metrics of the retail properties (does not include any retail square feet within our multi-family or office assets) within our Operating Assets segment as of December 31, 2021:
| Retail Properties | Rentable Sq.Ft./Units | % Leased | Annualized Base Rent (thousands) (a) | Annualized Base Rent Per Square Foot (a) | Year Built / Acquired / Last Renovated | |||||||||||||||
| The Woodlands | ||||||||||||||||||||
| Creekside Park West | 72,977 | 72% | $1,631 | $30.89 | 2019 | |||||||||||||||
| Creekside Village Green | 74,670 | 85% | 2,040 | 33.13 | 2015 | |||||||||||||||
| Hughes Landing Retail | 125,798 | 89% | 3,737 | 35.12 | 2015 | |||||||||||||||
| 1701 Lake Robbins | 12,376 | 100% | 522 | 42.16 | 2014 | |||||||||||||||
| Lake Woodlands Crossing Retail | 60,261 | 85% | 1,512 | 29.47 | 2018 | |||||||||||||||
| 20/25 Waterway Avenue | 50,062 | 98% | 1,813 | 37.06 | 2011 | |||||||||||||||
| Waterway Garage Retail | 21,513 | 100% | 450 | 26.45 | 2011 | |||||||||||||||
| 2000 Woodlands Parkway | 7,900 | 100% | 251 | 31.75 | 2016 | |||||||||||||||
| 425,557 | ||||||||||||||||||||
| Bridgeland | ||||||||||||||||||||
| Lakeland Village Center at Bridgeland | 67,947 | 82% | 1,403 | 33.57 | 2016 | |||||||||||||||
| Columbia | ||||||||||||||||||||
| Columbia Regional Building | 89,199 | 100% | 2,704 | 30.31 | 2014 | |||||||||||||||
| Merriweather District Area 3 Standalone Restaurant | (b) | 10,700 | 100% | — | — | 2020 | ||||||||||||||
| 99,899 | ||||||||||||||||||||
| Summerlin | ||||||||||||||||||||
| Downtown Summerlin | (c) | 800,548 | 98% | 23,153 | 30.38 | 2014 / 2015 | ||||||||||||||
| Ward Village | ||||||||||||||||||||
| Ward Village Retail - Pending Redevelopment | 550,122 | 83% | 12,210 | 26.60 | 2002 | |||||||||||||||
| Ward Village - New or Renovated | 451,854 | 95% | 18,092 | 42.05 | 2012 - 2021 | |||||||||||||||
| 1,001,976 | ||||||||||||||||||||
| Other | ||||||||||||||||||||
| Outlet Collection at Riverwalk | (d) | 264,080 | 88% | 5,435 | 24.38 | 2014 | ||||||||||||||
| Total | 2,660,007 | |||||||||||||||||||
(a)Annualized Base Rent is calculated as the monthly Base Minimum Rent for the property for December 31, 2021, multiplied by 12. Annualized Base Rent Per Square Foot is the Annualized Base Rent for the property at December 31, 2021, divided by the average occupied square feet.
(b)Merriweather District Area 3 Standalone Restaurant was transferred from Strategic Developments in the third quarter of 2020 but the tenant did not take occupancy until the fourth quarter of 2021. This project is entirely leased by a single tenant. Therefore, the Annualized Base Rent and Effective Annual Rent details have been excluded for competitive reasons.
(c)Excludes 381,767 square feet of anchors and 40,846 square feet of additional office space above our retail space.
(d)The entire property, located in New Orleans, Louisiana, is subject to a ground lease where we are the ground lessee.
HHC 2021 FORM 10-K | 29
The following tables summarize certain metrics of our multi-family Operating Assets as of December 31, 2021:
| Multi-family Assets | Economic Ownership % | # Units | Retail Sq. Ft. | % Units Leased | Average Monthly Rate | Average Monthly Rate Per Square Foot | Year Built / Acquired / Last Renovated | ||||||||||||||||
| The Woodlands | |||||||||||||||||||||||
| Creekside Park Apartments | 100% | 292 | — | 98% | $1,574 | $1.61 | 2018 | ||||||||||||||||
| Creekside Park The Grove | 100% | 360 | — | 78% | 1,606 | 1.63 | 2021 | ||||||||||||||||
| Millennium Six Pines Apartments | 100% | 314 | — | 99% | 2,016 | 2.10 | 2016 | ||||||||||||||||
| Millennium Waterway Apartments | 100% | 393 | — | 98% | 1,544 | 1.72 | 2012 | ||||||||||||||||
| One Lakes Edge | 100% | 390 | 22,971 | 100% | 2,164 | 2.19 | 2015 | ||||||||||||||||
| Two Lakes Edge | 100% | 386 | 11,448 | 100% | 2,315 | 2.32 | 2020 | ||||||||||||||||
| The Lane at Waterway | 100% | 163 | — | 99% | 2,109 | 1.92 | 2020 | ||||||||||||||||
| Bridgeland | |||||||||||||||||||||||
| Lakeside Row | 100% | 312 | — | 99% | 1,701 | 1.73 | 2019 | ||||||||||||||||
| Columbia | |||||||||||||||||||||||
| Juniper Apartments | 100% | 382 | 56,683 | 97% | 2,189 | 2.45 | 2020 | ||||||||||||||||
| The Metropolitan Downtown Columbia | 50% | 380 | 13,591 | 100% | 2,325 | 2.46 | 2015 | ||||||||||||||||
| m.flats/TEN.M | 50% | 437 | 28,026 | 98% | 2,374 | 2.67 | 2018 | ||||||||||||||||
| Summerlin | |||||||||||||||||||||||
| Constellation Apartments | 100% | 124 | — | 100% | 2,330 | 2.09 | 2017 | ||||||||||||||||
| Tanager Apartments | 100% | 267 | — | 99% | 1,961 | 2.01 | 2019 | ||||||||||||||||
| Total | 4,200 | 132,719 | |||||||||||||||||||||
The following tables summarize certain metrics of our other Operating Assets as of December 31, 2021:
| Other Assets | Economic Ownership % | Asset Type | Sq. Ft. / Acres / Units / Spaces | % Leased | Year Built / Acquired / Last Renovated | ||||||||||||
| The Woodlands | |||||||||||||||||
| Hughes Landing Daycare | 100% | Daycare | 10,000 sq.ft. | 100% | 2019 | ||||||||||||
| HHC 242 Self-Storage | 100% | Storage | 631 units | 95% | 2017 | ||||||||||||
| HHC 2978 Self-Storage | 100% | Storage | 729 units | 93% | 2017 | ||||||||||||
| Stewart Title of Montgomery County, TX | 50% | Title Company | N/A | N/A | — | ||||||||||||
| The Woodlands Ground Leases | 100% | Ground lease | N/A | N/A | Various | ||||||||||||
| Woodlands Sarofim #1 | 20% | Industrial | 129,790 sq. ft. | 66% | late 1980's | ||||||||||||
| The Woodlands Warehouse | 100% | Warehouse | 125,801 sq. ft. | 100% | 2019 | ||||||||||||
| Summerlin | |||||||||||||||||
| Hockey Ground Lease | 100% | Ground lease | N/A | N/A | 2017 | ||||||||||||
| Las Vegas Aviators | 100% | Minor League Baseball Team | N/A | N/A | 2017 | ||||||||||||
| Las Vegas Ballpark | 100% | Ballpark | N/A | N/A | 2019 | ||||||||||||
| Summerlin Hospital Medical Center | 5% | Hospital | N/A | N/A | 1997 | ||||||||||||
| Ward Village | |||||||||||||||||
| Kewalo Basin Harbor | Ground Lease | Marina | 55 acres | N/A | 2019 | ||||||||||||
| Other | |||||||||||||||||
| Parking Garages (a) | 100% | Garage | 6,748 spaces | N/A | Various | ||||||||||||
(a)Parking Garages consists of Woodloch Forest Garage, Waterway Square Garage, Hughes Landing Garages, Ward Village Shops Garage, Ae‘o Garage and Lakefront Parking Garages.
HHC 2021 FORM 10-K | 30
The following table summarizes our Operating Assets segment lease expirations:
| $ in thousands | ||||||||||||||||||||||||||
| Year | Number of Expiring Leases | Total Square Feet Expiring | Total Annualized Base Rent Expiring | % of Total Annual Gross Rent Expiring | ||||||||||||||||||||||
| 2022 | 201 | (a) | 579,429 | $ | 15,425 | 5.2 | % | |||||||||||||||||||
| 2023 | 107 | 364,944 | 15,645 | 5.3 | % | |||||||||||||||||||||
| 2024 | 126 | 571,515 | 24,208 | 8.1 | % | |||||||||||||||||||||
| 2025 | 177 | 993,238 | 45,684 | 15.4 | % | |||||||||||||||||||||
| 2026 | 90 | 414,125 | 18,892 | 6.3 | % | |||||||||||||||||||||
| 2027 | 72 | 769,413 | 33,593 | 11.3 | % | |||||||||||||||||||||
| 2028 | 47 | 350,809 | 16,007 | 5.4 | % | |||||||||||||||||||||
| 2029 | 43 | 411,207 | 16,775 | 5.6 | % | |||||||||||||||||||||
| 2030 | 38 | 463,488 | 19,460 | 6.5 | % | |||||||||||||||||||||
| 2031 | 27 | 240,787 | 10,925 | 3.7 | % | |||||||||||||||||||||
| 2032+ | 89 | 1,612,976 | 80,966 | 27.2 | % | |||||||||||||||||||||
| Total | 1,017 | 6,771,931 | $ | 297,580 | 100.0 | % | ||||||||||||||||||||
(a)Includes 18 specialty leases totaling 22,853 square feet which expire in less than 365 days.
HHC 2021 FORM 10-K | 31
| MASTER PLANNED COMMUNITIES | ||
Our MPCs are located in and around Houston, Texas; Las Vegas, Nevada; Phoenix, Arizona and Columbia, Maryland. The following table summarizes our MPCs as of December 31, 2021:
| Remaining | Projected | Average | Undiscounted/ | |||||||||||||||||||||||||||||||||||||||||
| Total | Remaining saleable | Average Price Per Acre | Saleable | Community | Cash | Uninflated Value | ||||||||||||||||||||||||||||||||||||||
| Gross | Approx. No. | Acres | (thousands) (b) | Residential | Sell-Out Date | Margin (d) | (millions) (e) | |||||||||||||||||||||||||||||||||||||
| Community | Location | Acres (a) | Residents | Residential | Commercial | Residential | Commercial | Lots (c) | Residential | Commercial | Residential | Residential | Commercial | |||||||||||||||||||||||||||||||
| Bridgeland | Cypress, TX | 11,506 | 17,500 | 2,483 | 1,346 | $494 | $629 | 12,117 | 2036 | 2045 | 87% | $1,065 | $847 | |||||||||||||||||||||||||||||||
| Columbia | Columbia, MD | 16,450 | 112,000 | — | 96 | N/A | 580 | — | N/A | 2024 | N/A | — | 56 | |||||||||||||||||||||||||||||||
| Douglas Ranch | Phoenix, AZ | 33,810 | — | 17,770 | 9,578 | 332 | 204 | 90,680 | 2081 | 2081 | 88% | 5,168 | 1,954 | |||||||||||||||||||||||||||||||
| Summerlin | Las Vegas, NV | 22,500 | 120,000 | 2,543 | 825 | 977 | 1,039 | 17,858 | 2039 | 2039 | 75% | 1,853 | 857 | |||||||||||||||||||||||||||||||
| The Woodlands | The Woodlands, TX | 28,545 | 120,000 | 32 | 749 | 1,983 | 961 | 121 | 2025 | 2034 | 97% | 61 | 720 | |||||||||||||||||||||||||||||||
| The Woodlands Hills | Conroe, TX | 2,055 | 1,600 | 1,212 | 175 | 315 | 515 | 3,841 | 2030 | 2030 | 86% | 329 | 90 | |||||||||||||||||||||||||||||||
| Total | 114,866 | 371,100 | 24,040 | 12,769 | 124,617 | $8,476 | $4,524 | |||||||||||||||||||||||||||||||||||||
| Trillium (f) | Phoenix, AZ | 3,029 | — | 1,230 | 337 | 305 | 173 | 5,209 | 2033 | 2026 | 61% | $229 | $58 | |||||||||||||||||||||||||||||||
(a)Encompasses all of the land located within the borders of the master planned community, including parcels already sold, saleable parcels and non-saleable areas such as roads, parks and recreation areas, conservation areas and parcels acquired during the year.
(b)Average Price Per Acre is the uninflated weighted-average land value per acre estimated in the Company’s 2022 land models.
(c)Remaining Saleable Residential Lots are estimates and include only lots that are intended for sale or joint venture. The mix of intended use on our remaining saleable and developable acres is primarily based on assumptions regarding entitlements and zoning of the remaining project and are likely to change over time as the master plan is refined.
(d)Average Cash Margin represents the total projected cash profit (total projected cash sales minus remaining projected cash development expenditures), divided by total projected cash sales. It is calculated based on future revenues and future projected non-reimbursable development costs, capitalized overhead, capitalized taxes and capitalized interest.
(e)Undiscounted / Uninflated Value represents Remaining Saleable Acres, multiplied by Average Price Per Acre, multiplied by Average Cash Margin.
(f)Data is presented at 100%, of which the Company owns a 50.0% interest in Trillium. See below for additional details.
| The Summit | ||
Within our Summerlin MPC, an exclusive luxury community named The Summit is being developed and managed through a joint venture with Discovery Land Company (Discovery), a leading developer of luxury communities and private clubs. The 555-acre community is expected to consist of approximately 270 homes including 32 condominiums, plus an 18-hole Tom Fazio designed golf course and other amenities for residents. See Item 7. Management’s Discussion and Analysis of Financial Condition and Results of Operations and Note 2 - Investments in Real Estate and Other Affiliates in the Notes to Consolidated Financial Statements under Item 8 of this Form 10-K for further details.
| Trillium | ||
Trillium is the first village to be developed in our recently acquired Douglas Ranch MPC. Trillium will be developed and managed through a 50% joint venture with Trillium Development Holding Company, LLC. The 3,029-acre village is located in the greater Phoenix, Arizona area and expected to consist of approximately 5,000 residential lots as well as a business park. Land sales are expected to commence at Trillium in the first half of 2022. See Item 7. Management’s Discussion and Analysis of Financial Condition and Results of Operations and Note 2 - Investments in Real Estate and Other Affiliates in the Notes to Consolidated Financial Statements under Item 8 of this Form 10-K for further details.
HHC 2021 FORM 10-K | 32
| Seaport | ||
The Seaport, located on the East River in Lower Manhattan, encompasses several city blocks (inclusive of Historic Area/Uplands, Pier 17, Tin Building and the 250 Water Street parking lot) and totals approximately 461,000 square feet of innovative culinary, entertainment and cultural experiences.
The following table summarizes certain metrics of the Seaport as of December 31, 2021:
| Landlord Operations (a) | Managed Businesses (b) | Events, Sponsorships & Catering Business (e) | |||||||||||||||||||||||||||||||||
| $ in thousands | Historic District & Pier 17 | Multi-Family (c) | Historic District & Pier 17 | Tin Building (d) | Total | ||||||||||||||||||||||||||||||
| Project Status | Unstabilized | Stabilized | Unstabilized | Under Construction | Unstabilized | ||||||||||||||||||||||||||||||
| Rentable Sq. Ft. / Units | |||||||||||||||||||||||||||||||||||
| Total Sq. Ft. / units | 333,803 | 13,000 | / | 22 | 52,370 | 53,783 | 21,077 | ||||||||||||||||||||||||||||
| Leased Sq. Ft. / units | (f) | 149,728 | — | / | 20 | 52,370 | 53,783 | 21,077 | |||||||||||||||||||||||||||
| % Leased or occupied | (f) | 45% | —% | / | 91% | 100% | 100% | 100% | |||||||||||||||||||||||||||
| Development | (g) | ||||||||||||||||||||||||||||||||||
| Development costs incurred | $ 557,783 | $ — | $ — | $ 161,593 | $ — | $ | 719,376 | ||||||||||||||||||||||||||||
| Estimated total costs (excl. land) | 594,368 | — | — | 194,613 | — | 788,981 | |||||||||||||||||||||||||||||
(a)Landlord operations represents physical real estate developed and owned by HHC and leased to third parties.
(b)Managed businesses represents retail and food and beverage businesses that HHC owns, either wholly or through joint ventures, and operates, including through license and management agreements.
(c)Multi-Family represents 85 South Street which includes base level retail in addition to residential units.
(d)Represents the marketplace by Jean-Georges. Construction on core and shell of the Tin Building is complete, with opening expected in the first half of 2022.
(e)Events, sponsorships & catering business includes private events, catering, sponsorships, concert series and other rooftop activities.
(f)The percent leased for Landlord operations - Historic District & Pier 17 includes agreements with terms of less than one year.
(g)Development costs incurred and Estimated total costs (excl. land) are shown net of insurance proceeds of approximately $64.7 million.
| STRATEGIC DEVELOPMENTS | ||
We continue to plan, develop and hold or seek development rights for unique properties primarily in Ward Village, The Woodlands, Bridgeland, Summerlin, Columbia and Douglas Ranch. We continue to execute our strategic plans for developing several of these assets with construction either actively underway or pending. Strategic Developments are transferred into our Operating Assets segment when the asset is placed in service and increase recurring cash flow.
The majority of our Total Estimated Costs of projects currently under construction in our Strategic Developments segment relate to our projects in Honolulu at Ward Village and in Las Vegas at Summerlin. Ward Village is a globally recognized urban master planned condominium community offering integration with local culture, access to parks and public amenities, unique retail experiences, exceptional residences and desirable workforce housing. Refer to the Seaport segment section for details of projects currently under construction in that segment.
HHC 2021 FORM 10-K | 33
The following table summarizes our Strategic Developments projects as of December 31, 2021:
| $ in thousands | Location | Size / GLA (a) | Size (Acres) | Total Estimated Cost | Construction Start | Estimated Completion | Estimated Stabilization Date | ||||||||||||||||
| Strategic Developments Under Construction | |||||||||||||||||||||||
| Columbia | |||||||||||||||||||||||
| Marlow | Columbia, MD | 472 units / 32,000 sq ft | 4 | $130,490 | Q1 2021 | Q1 2023 | 2026 | ||||||||||||||||
| Bridgeland | |||||||||||||||||||||||
| Starling at Bridgeland | Cypress, TX | 358 units | 15 | 60,572 | Q4 2020 | Q2 2022 | 2025 | ||||||||||||||||
| Summerlin | |||||||||||||||||||||||
| 1700 Pavilion | Las Vegas, NV | 267,000 sq ft | 3 | 121,515 | Q2 2021 | Q4 2022 | 2025 | ||||||||||||||||
| Tanager Echo | Las Vegas, NV | 294 units | 3 | 86,160 | Q2 2021 | Q1 2023 | 2026 | ||||||||||||||||
| The Woodlands | |||||||||||||||||||||||
| Memorial Hermann Health System Build-to-Suit | The Woodlands, TX | 20,000 sq ft | 4 | 6,032 | Q4 2021 | Q1 2023 | 2023 | ||||||||||||||||
| Ward Village | |||||||||||||||||||||||
| Under Construction | |||||||||||||||||||||||
| Kō'ula | Honolulu, HI | 565 units / 36,787 sq ft | 2 | 487,039 | Q3 2019 | Q3 2022 | N/A | ||||||||||||||||
| Victoria Place | Honolulu, HI | 349 units | 2 | 503,271 | Q1 2021 | 2024 | N/A | ||||||||||||||||
| Completed (b) | |||||||||||||||||||||||
| ‘A‘ali‘i | Honolulu, HI | 750 units / 11,570 sq ft | 2 | 394,908 | Q4 2018 | Open | N/A | ||||||||||||||||
| Waiea | Honolulu, HI | 177 units / 7,716 sq ft | 2 | 595,470 | Q2 2014 | Open | N/A | ||||||||||||||||
| Completed and Sold Out | |||||||||||||||||||||||
| Ae‘o | Honolulu, HI | 465 units / 70,800 sq ft | 3 | 430,737 | Q1 2016 | Open | N/A | ||||||||||||||||
| Anaha | Honolulu, HI | 317 units / 16,048 sq ft | 2 | 403,974 | Q4 2014 | Open | N/A | ||||||||||||||||
| Ke Kilohana | Honolulu, HI | 423 units / 28,386 sq ft | 1 | 217,483 | Q4 2016 | Open | N/A | ||||||||||||||||
| Future Strategic Developments Rights or Pending Construction | |||||||||||||||||||||||
| Columbia | |||||||||||||||||||||||
| Lakefront District (c) | Columbia, MD | 1,914,000 sq ft | |||||||||||||||||||||
| South Lake Medical Office Building (d) | Columbia, MD | 86,000 sq ft | 2 | ||||||||||||||||||||
| Bridgeland | |||||||||||||||||||||||
| Bridgeland Single-Family for Rent (d) | Cypress, TX | 263 units | 29 | ||||||||||||||||||||
| Summerlin | |||||||||||||||||||||||
| 80% Interest in Fashion Show Air Rights | Las Vegas, NV | — | — | ||||||||||||||||||||
| The Woodlands | |||||||||||||||||||||||
| Creekside Park Medical Plaza (e) | The Woodlands, TX | 33,000 sq ft | 3 | ||||||||||||||||||||
| Ward Village | |||||||||||||||||||||||
| The Park Ward Village (f) | Honolulu, HI | 545 units / 37,236 sq ft | — | ||||||||||||||||||||
| Other | |||||||||||||||||||||||
| West End Alexandria (g) | Alexandria, VA | — | 41 | ||||||||||||||||||||
| Maui Ranch Land | Maui, HI | — | 20 | ||||||||||||||||||||
| Commercial Land | |||||||||||||||||||||||
| The Woodlands | |||||||||||||||||||||||
| The Woodlands Commercial Land (h) | The Woodlands, TX | — | 13 | ||||||||||||||||||||
| Columbia | |||||||||||||||||||||||
| Merriweather District (h) | Columbia, MD | — | 15 | ||||||||||||||||||||
| Ward | |||||||||||||||||||||||
| Ward Commercial Land (h) | Honolulu, HI | — | 10 | ||||||||||||||||||||
(a)For condominium units, single-family and multi-family assets, square feet represents ground floor retail space whereas units represents residential units for sale or rent.
(b)There are 2 units remaining to be sold at Waiea and 78 units remaining to be sold at the newly completed ‘A‘ali‘i. The retail section of ‘A‘ali‘i is still under construction as of December 31, 2021, and is expected to be placed in service in early 2022.
(c)We are currently approved for approximately 2.0 million square feet of net new mixed-use development in the Lakefront District which will include office, retail and residual assets. The remaining 1.9 million excludes approximately 86,000 square feet allocated to the first office development, South Lake Medical Office Building.
(d)South Lake Medical Office Building, a future office development in Columbia, and Bridgeland Single-Family for Rent, our first single-family for rent community in Bridgeland, have received board approval and are expected to begin construction in the first quarter of 2022.
(e)Creekside Park Medical Plaza, a future medical office development, began construction in the first quarter of 2022.
(f)Acreage related to The Park Ward Village is still included in the Operating Asset segment as of December 31, 2021, and will be transferred to the Strategic segment in 2022.
(g)Represents acreage owned by a joint venture between the Company, Foulger-Pratt and Seritage. Refer to Note 2 - Investments in Real Estate and Other Affiliates in the Notes to Consolidated Financial Statements under Item 8 of this Form 10-K for further details.
(h)Represents land acquired or transferred to the Strategic Development segment in prior years for future development, excluding acreage related to assets that are now in service in our Operating Assets segment or related to completed or under construction condominium towers.
HHC 2021 FORM 10-K | 34
| OTHER INFORMATION | |||||
Item 3. Legal Proceedings
We, as part of our normal business activities, are a party to a number of legal proceedings. Management periodically assesses our liabilities and contingencies in connection with these matters based upon the latest information available. We disclose material pending legal proceedings pursuant to Securities and Exchange Commission rules and other pending matters as we may determine to be appropriate. As of December 31, 2021, management believes that any monetary liability or financial impact of claims or potential claims to which we might be subject after final adjudication of any legal procedures would not be material to our financial position or our results of operations. The cost of the Waiea settlement, however, could affect our cash flows for a limited period of time. See Note 10 - Commitments and Contingencies in the Notes to Consolidated Financial Statements under Item 8 of this Form 10-K for further discussion.
Item 4. Mine Safety Disclosure
Not applicable.
HHC 2021 FORM 10-K | 35
| OTHER INFORMATION | |||||
| PART II | ||
Item 5. Market for Registrant’s Common Equity, Related Stockholder Matters and Issuer Purchases of Equity Securities
| MARKET INFORMATION | ||
Our common stock is traded on the New York Stock Exchange (the NYSE) under the symbol HHC. No dividends have been declared or paid in 2021 or 2020. Any future determination related to our dividend policy will be made at the discretion of our board of directors and will depend on a number of factors, including future earnings, capital requirements, restrictions under debt agreements, financial condition and future prospects and other factors the board of directors may deem relevant.
| NUMBER OF HOLDERS OF RECORD | ||
As of February 22, 2022, there were 1,372 stockholders of record of our common stock.
| PERFORMANCE GRAPH | ||
The following performance graph compares the yearly dollar change in the cumulative total stockholder return on our common stock with the cumulative total returns of the NYSE Composite Index, MSCI US REIT Index and the S&P 500 Real Estate Index. The S&P 500 Real Estate Index replaces the Morningstar Real Estate Diversified Index in this analysis and going forward, as the latter data is no longer accessible. The latter index has been included with data through 2020. The graph tracks the performance of a $100 investment in our common stock and in each of the indexes during the last five fiscal years ended December 31, 2021. The graph was prepared based on the assumption that dividends have been reinvested subsequent to the initial investment. Stockholder returns over the indicated period are based on historical data and should not be considered indicative of future stockholder returns.
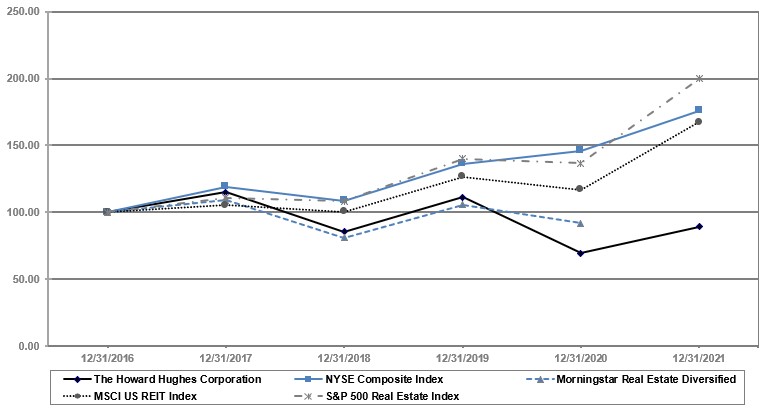
HHC 2021 FORM 10-K | 36
| OTHER INFORMATION | |||||
| PURCHASES OF EQUITY SECURITIES BY THE ISSUER | ||
The following sets forth information with respect to the equity compensation plans available to employees, directors and consultants of the Company at December 31, 2021:
| Plan Category | (a) Number of securities to be issued upon exercise of outstanding options, warrants and rights (1) | (b) Weighted-average exercise price of outstanding options, warrants and rights | (c) Number of securities remaining available for future issuance under equity compensation plans (excluding securities reflected in column (a)) | ||||||||||||||
| Equity compensation plans approved by security holders (2) | 2,323,847 | $ | 122.95 | 1,102,470 | |||||||||||||
| Equity compensation plans not approved by security holders | 50,125 | $ | 112.08 | — | |||||||||||||
| Total | 2,373,972 | $ | 122.72 | 1,102,470 | |||||||||||||
(1)The amounts shown in columns (a) and (b) of the above table do not include 405,966 outstanding Common Shares (all of which are restricted and subject to vesting requirements) that were granted under the Company’s 2020 Equity Incentive Plan and its predecessor, the Amended and Restated 2010 Incentive Plan (2010 Incentive Plan), as further described in Note 11 - Stock-Based Compensation Plans in the Notes to Consolidated Financial Statements under Item 8 of this Form 10-K.
(2)Reflects stock option grants under the Company’s 2020 Equity Incentive Plan and the 2010 Incentive Plan. Following adoption of the 2020 Equity Incentive Plan by our stockholders, grants are no longer made under the 2010 Incentive Plan. Column (a) also includes the warrants held by Messrs. O’Reilly, Weinreb, and Herlitz, as further described in Note 13 - Warrants in the Notes to Consolidated Financial Statements under Item 8 of this Form 10-K (which, in the case of Messrs. Weinreb and Herlitz, were approved by security holders).
In October 2021, the board of directors of The Howard Hughes Corporation, authorized a share repurchase program, pursuant to which the Company may, from time to time, purchase up to $250.0 million of its common stock through open market transactions. The date and time of such repurchases will depend upon market conditions and the program may be suspended or discontinued at any time. The new program replaces the Company’s prior share repurchase program adopted in October 2019, which authorized the repurchase of up to $100.0 million of its common stock. Under this program, the Company had repurchased 496,000 shares of its common stock with an aggregate value of $53.9 million. Under the new program, during the fourth quarter of 2021, the Company repurchased 1,023,284 shares of its common stock, par value $0.01 per share, for $96.6 million, or approximately $94.42 per share. During the first quarter of 2022, the Company repurchased an additional 1,579,646 shares of its common stock, for $153.4 million, or approximately $97.10 per share, thereby completing all authorized purchases under the plan. All purchases were funded with cash on hand.
The following sets forth information with respect to repurchases made by the Company of its shares of common stock during the fourth quarter of 2021:
| Period | Total number of shares purchased (a) | Average price paid per share | Total number of shares purchased as part of publicly announced plans or programs | Approximate dollar value of shares that may yet be purchased under the plans or programs | ||||||||||||||||
October 1-31, 2021 | 369 | $ | 93.29 | — | $ | 250,000,000 | ||||||||||||||
November 1-30, 2021 | 134,679 | $ | 89.25 | 134,679 | $ | 237,980,464 | ||||||||||||||
December 1-31, 2021 | 900,235 | $ | 95.26 | 888,605 | $ | 153,381,153 | ||||||||||||||
| Total | 1,035,283 | $ | 94.48 | 1,023,284 | ||||||||||||||||
(a)During the fourth quarter of 2021, 11,999 shares were repurchased related to stock received by the Company for the payment of withholding taxes due on employee share issuances under share-based compensation plans. For additional information, see Note 11 - Stock-Based Compensation Plans in the Notes to Consolidated Financial Statements under Item 8 of this Form 10-K.
Item 6. [Reserved]
HHC 2021 FORM 10-K | 37
| MANAGEMENT’S DISCUSSION AND ANALYSIS | |||||
Item 7. Management's Discussion and Analysis of Financial Condition and Results of Operations
The following discussion should be read in conjunction with our Consolidated Financial Statements and the related notes filed as a part of this Annual Report. This discussion contains forward-looking statements that involve risks, uncertainties, assumptions and other factors, including those described in Part I, Item 1A. Risk Factors and elsewhere in this Annual Report. These factors and others not currently known to us could cause our financial results in 2021 and subsequent fiscal years to differ materially from those expressed in, or implied by, those forward-looking statements. You are cautioned not to place undue reliance on this information which speaks only as of the date of this report. We are not obligated to update this information, whether as a result of new information, future events or otherwise, except as may be required by law.
All references to numbered Notes are to specific Notes to our Consolidated Financial Statements included in this Annual Report and which descriptions are incorporated into the applicable response by reference. Capitalized terms used, but not defined, in this Management’s Discussion and Analysis of Financial Condition and Results of Operations (MD&A) have the same meanings as in such Notes.
| Index | Page | ||||
HHC 2021 FORM 10-K | 38
MANAGEMENT’S DISCUSSION AND ANALYSIS OVERVIEW | |||||
| OVERVIEW | ||
Please refer to Item 1. Business for a general discussion of our business strategy, competitive strengths and a general description of the assets contained in our four business segments and Item 2. Properties for details regarding the asset type, size, location and key metrics about our various properties.
The following section highlights significant activities and financial results for the Company and its segments during 2021. Performance for each of our business segments is more fully described hereinafter (all items are pre-tax unless otherwise noted).
Douglas Ranch Acquisition In October 2021, HHC announced the launch of Douglas Ranch, a new large-scale master planned community in the West Valley of Phoenix, Arizona. The Company closed on the all-cash purchase of approximately 33,810 acres for a purchase price of $541.0 million. The purchase price includes an option for the seller, JDM Partners, to re-acquire a 50% interest in the property for an additional $236.8 million, with $33.8 million of the original purchase price being credited to the seller upon exercise of the option for a total capital contribution of $270.6 million. If the option is not exercised by the seller, the $33.8 million will be returned to the Company. Simultaneous with the land acquisition, the Company closed on the acquisition of a 50% interest in Trillium Development Holding Company, LLC, for $59.0 million. Trillium Development Holding Company, LLC owns approximately 3,029 acres of land in the greater Phoenix, Arizona area. Trillium is Douglas Ranch’s first village to begin development with land sales expected to occur in the first half of 2022. In total, the Douglas Ranch MPC encompasses almost 37,000 fully-entitled, “shovel-ready” acres and is poised for growth with in-place entitlements for 100,000 residential homes and 55 million square feet of commercial development.
COVID-19 Pandemic The outbreak of COVID-19 impacted global economic activity in early 2020 and caused significant volatility and negative pressure in financial markets. The impact of ongoing COVID-19 pandemic and resurgence of cases related to new variants, led to a wide variety of government-issued control measures, including states of emergency, required business and school closures, shelter-in-place orders and travel restrictions, resulted in a negative impact on our financial performance in 2020, particularly in our Operating Asset and Seaport segments. Many states began easing quarantine protocols near the end of the second quarter of 2020, which allowed most of our retail and hospitality properties to resume operations on a limited basis. The extent to which COVID-19 continues to impact us will depend on future developments, which are highly uncertain and cannot be predicted with confidence, including the actions taken to contain the pandemic or mitigate its impact, such as the speed and effectiveness of vaccine and treatment developments and their deployment, potential mutations of COVID-19, and the direct and indirect economic effects of the pandemic and containment measures.
While the impact of COVID-19 affected all of our business segments throughout 2020 and continued to impact the Company into 2021, we saw significant performance improvement during the second half of 2020 that has continued through 2021. Notably, during 2021, we achieved Operating Asset NOI of $218.7 million and MPC EBT of $316.6 million. This represents a $39.1 million increase in Operating Asset NOI and a $107.2 million increase in MPC EBT, as compared to 2020. In Ward Village, we closed on 670 condominium units, including 663 units at the newly completed ‘A‘ali‘i tower, and contracted to sell 144 condominium units at our under-construction towers, Kō'ula and Victoria Place. In July 2021, we began public sales at our eighth condominium project, The Park Ward Village, which was 84.2% presold as of December 31, 2021. We also completed the sale of Monarch City in Collin County, Texas, our three hospitality properties in The Woodlands, Texas and Century Park in Houston, Texas, for combined net proceeds after debt repayment of $195.6 million.
HHC 2021 FORM 10-K | 39
MANAGEMENT’S DISCUSSION AND ANALYSIS OVERVIEW | |||||
2021 Highlights | ||
Comparison of the year ended December 31, 2021, to the year ended December 31, 2020
Total Company
–Net income attributable to common stockholders increased to $56.1 million, or $1.03 per diluted share, for the year ended December 31, 2021, compared to a loss of $26.2 million, or $0.50 per diluted share, for the year ended December 31, 2020.
–We continue to maintain a strong liquidity position with $843.2 million of cash and cash equivalents and available capacity of $85 million on the revolver portion of our credit facilities as of December 31, 2021, with limited near-term debt maturities.
–During 2021, we completed the sale of Monarch City, our three hospitality properties in The Woodlands and Century Park for net proceeds after debt repayment of $195.6 million. Since the fourth quarter of 2019, we have completed the sales of 13 non-core assets generating approximately $401.0 million of net proceeds after debt repayment.
Operating Assets
–Operating Assets NOI totaled $218.7 million in 2021, a $39.1 million or 21.8% increase compared to $179.6 million in the prior year.
–Retail NOI increased $17.6 million, primarily due to improving rent collections of 82.4% due to continued recovery from the COVID-19 pandemic as well as the receipt of one-time payments related to COVID-19 rent deferrals received throughout the year.
–Multi-family NOI increased $14.1 million, primarily due to accelerated lease-up in our latest developments, including Two Lakes Edge at 99.7% leased, The Lane at Waterway at 99.4% leased and Juniper Apartments at 97.1% leased, which all opened in 2020 and are already stabilized.
–Other property NOI increased $11.0 million, primarily due to the return of the Las Vegas Aviators 2021 baseball season. Las Vegas Ballpark generated $6.0 million of NOI as the Las Vegas Aviators were able to host a full Minor League Baseball season compared to a $3.6 million loss in 2020 due to no Minor League Baseball season as a result of COVID-19.
–Office NOI decreased $4.5 million, primarily related to the planned expiration in June 2020 of a short-term lease for approximately 142,000 square feet at The Woodlands Towers at the Waterway which is being actively marketed.
–Hospitality NOI increased $2.0 million, prior to disposition of these properties in September 2021.
MPC
–MPC EBT totaled $316.6 million in 2021, a $107.2 million or 51.2% increase compared to $209.4 million in the prior year.
–The increase in EBT was primarily due to higher land sales revenues at Summerlin due to an increase in superpad and custom lot sales and higher Equity in earnings (losses) from real estate and other affiliates at The Summit due to an increase in the number of units sold in 2021 and the impact of increased amenity cost and higher unit completion cost in the prior-year period that did not repeat in 2021. These increases were partially offset by lower land sales revenues at The Woodlands due to the lack of available land as the community reaches completion.
Seaport
–Seaport EBT increased $41.6 million to a loss of $58.4 million, compared to a loss of $100.0 million in the prior year.
–The increase in EBT was primarily due to several items in 2020 that did not reoccur in 2021, including a loss on extinguishment of debt and interest expense due to the early repayment of the $250 million Seaport loan in August 2020, charges in the first quarter of 2020 related to write-offs of building improvements and retail inventory due to the permanent closure of 10 Corso Como Retail and Café and an impairment charge of $6.0 million for the Company’s equity investment in Mr. C Seaport in the second quarter of 2020. These increases were partially offset by an increase in operating expenses, net of an increase in segment revenues, as a result of increased activity in 2021 as business resumed after the onset of the COVID-19 pandemic.
–Seaport NOI decreased $1.1 million to a loss of $17.6 million, primarily due increased expenses related to the reopening of businesses following the COVID-19 pandemic as well as increased marketing costs, partially offset by the launch of new restaurant concepts and the reintroduction of the Seaport Summer Concert Series.
–Construction of the core and shell of the Tin Building is complete and the marketplace is expected to have its grand opening in the first half of 2022.
–In December 2021, we obtained final approval from the City of New York to transform the one-acre parking lot at 250 Water Street into a mixed-use development that will include multi-family rental units, office and retail space.
HHC 2021 FORM 10-K | 40
MANAGEMENT’S DISCUSSION AND ANALYSIS OVERVIEW | |||||
–Also in December 2021, we secured ground lease extension options at the Seaport for an additional 48 years from its current expiration in 2072 until 2120.
Strategic Developments
–Strategic Developments EBT totaled income of $83.8 million in 2021, a $94.0 million decrease compared to income of $177.8 million in the prior year.
–The decrease in EBT was primarily due to the deconsolidation of 110 North Wacker in the third quarter of 2020. As part of the deconsolidation, a gain of $267.5 million was recognized in Equity in earnings (losses) from real estate and other affiliates and an additional $15.4 million of previously eliminated 110 North Wacker development fees were recognized in Other land, rental and property revenues. This decrease was partially offset by an increase in net condominium sales of $121.4 million driven by timing of condominium closings.
–We completed construction at ‘A‘ali‘i and began welcoming residents in October 2021. As of December 31, 2021, we closed on 663 units, totaling $453.3 million in net revenue.
–We contracted to sell 144 condominium units during 2021 at our two under construction towers, Kō'ula and Victoria Place. Victoria Place, which began construction in February 2021, accounted for 78 of the units contracted during the quarter and was 99.1% presold as of December 31, 2021, with only 3 units remaining to be sold.
–The Park Ward Village, our eighth condominium project at Ward Village, began public sales in July 2021 and as of December 31, 2021, we have entered into contracts for 459 units, representing 84.2% of total units. The Park Ward Village is now Ward Village’s fastest-selling tower since inception, surpassing Victoria Place, which held the previous record.
–During 2021, we placed Creekside Park The Grove, a multi-family property in The Woodlands, in service upon substantial completion of construction. We began construction on the following assets in 2021: (i) Marlow, a multi-family property in Columbia; (ii) Victoria Place, our seventh condominium project in Ward Village; (iii) Tanager Echo, a multi-family property in Summerlin; (iv) 1700 Pavilion, an office property in Summerlin; and (v) Memorial Hermann Health System Build-to-Suit, an office property in The Woodlands. These under construction assets represent 1,124 multi-family units, 349 condominium units and 319,000 square feet of office and retail space.
Corporate
–Net expenses related to Corporate income, expenses and other items increased $43.3 million compared to the prior year period primarily due to a loss on extinguishment of debt related to the repurchase of the Company’s $1.0 billion 5.375% Senior Notes due 2025 during the first quarter of 2021, higher corporate interest expense, net primarily as a result of the issuance of $750 million 5.375% Senior Notes in August 2020, as well as the issuance of $650 million 4.125% Senior Notes and $650 million 4.375% Senior Notes in the first quarter of 2021, offset by the repurchase of the $1.0 billion 5.375% Senior Notes in the first quarter of 2021. These increases in net expenses were partially offset by a decrease in general and administrative expenses related to workforce reductions and other corporate initiatives, which are part of an overall plan to reduce recurring overhead costs, and a decrease in consulting expenses as a result of fewer IT projects taking place in 2021.
Capital and Financing Activities
–In 2021, we closed on $2.1 billion of permanent financings, replacing $2.1 billion of existing debt, and closed on $628 million of construction financings to support development spending at our latest projects actively under construction. These financings extended the term of our maturities and took advantage of a historically low rate environment. Refer to Note 7 - Mortgages, Notes and Loans Payable, Net in the Notes to Consolidated Financial Statements under Item 8 of this Form 10-K for additional information.
–In October 2021, the board of directors authorized a share repurchase program to purchase up to $250.0 million of its common stock. The Company repurchased $96.6 million as of December 31, 2021, and completed all authorized purchases under the plan in the first quarter of 2022.
HHC 2021 FORM 10-K | 41
MANAGEMENT’S DISCUSSION AND ANALYSIS OVERVIEW | |||||
| Overview of Business Segments | ||||||||||||||
Operating Assets
Office and Multi-family We have seen continued strength in the performance of our office and multi-family assets. For the year ended December 31, 2021, we collected 98.8% of our office portfolio billings and 98.2% of our multi-family portfolio billings.
Retail Beginning in April 2020, we experienced the temporary closure of all non-essential retail in Summerlin, Houston and Ward Village, and the complete closure of the Outlet Collection at Riverwalk. Several of our tenants were able to resume limited operations in May and June 2020, and the majority of our tenants had reopened by the end of the third quarter of 2020. As a result of these closures, collections of our retail portfolio billings reached a low of 49.7% during the three months ended June 30, 2020, but increased to 72.6% for the three months ended December 31, 2020. This trend continued throughout 2021 with collections increasing each quarter and reaching 88.8% for the three months ended December 31, 2021, and 82.4% for the year ended December 31, 2021. As a result of improved collections and continued recovery as business rebounds from the COVID-19 pandemic, Retail NOI increased to $57.6 million for the year ended December 31, 2021, a $17.6 million increase compared to the year ended December 31, 2020.
Hospitality At the onset of the pandemic in March 2020, we temporarily closed all three of our hospitality properties. The Woodlands Resort reopened in May 2020, the Embassy Suites reopened in June 2020 and The Westin at The Woodlands reopened in July 2020. As a result, occupancy levels rose throughout the second half of 2020 and into 2021 but remained lower than levels achieved prior to the pandemic. On September 16, 2021, the Company completed the sale of all three hospitality assets for $252.0 million, resulting in a gain on sale of $39.1 million. Refer to Note 3 - Acquisitions and Dispositions in the Notes to Consolidated Financial Statements under Item 8 of this Form 10-K for further details.
Las Vegas Aviators The Minor League Baseball season was canceled for 2020, which impacted the Las Vegas Aviators, our Triple-A professional baseball team. Following the 2021 restructuring of Minor League Baseball, the Las Vegas Aviators are participating in the Triple-A West Professional Development League. The team began the 2021 season in May at 50% capacity and were able to operate at 100% capacity through the third quarter of 2021. As a result, NOI has increased substantially from a loss of $3.6 million for the year ended December 31, 2020, to income of $6.0 million for the year ended December 31, 2021.
MPC New home sales in our MPC locations, a leading indicator of land sales, dropped considerably in April of 2020 as a result of stay-at-home orders related to the pandemic, but experienced large upticks in May through December of 2020. In response, we restarted horizontal development to maintain a sufficient supply of lots and superpads to keep up with the strong home sales. Home sales remained strong through 2021, with 2,761 new homes sold in our MPCs for the year ended December 31, 2021, compared to the 2,724 new homes sold in our MPCs for the year ended December 31, 2020. In addition, the total acres of residential land sold across all our MPCs increased 50% in the year ended December 31, 2021 to 565 acres, compared to 377 acres in the prior-year period.
In October 2021, the Company announced the acquisition of Douglas Ranch and Trillium, an almost 37,000-acre fully-entitled, “shovel-ready” MPC location in Phoenix’s West Valley for approximately $600 million. Douglas Ranch is poised for growth with in-place entitlements for 100,000 residential homes and 55 million square feet of commercial development. Land sales are expected to commence at Trillium, Douglas Ranch’s first village, in the first half of 2022. Trillium will be developed and managed through a joint venture.
HHC 2021 FORM 10-K | 42
MANAGEMENT’S DISCUSSION AND ANALYSIS OVERVIEW | |||||
Seaport In response to the pandemic, we completely closed the Seaport and halted construction on the Tin Building in March 2020. Social distancing restrictions also resulted in cancellation of our 2020 Seaport summer concert series. While restrictions remained in place throughout 2020 and into 2021, many of the businesses within the Seaport were able to resume operations, on a limited basis, in the third quarter of 2020. Most restrictions were lifted in June of 2021; however, many businesses at the Seaport continued to operate at reduced levels through the third quarter of 2021, primarily due to labor shortages. All venues were open and operating at close to full capacity during the fourth quarter of 2021. Construction on the Tin Building resumed in May 2020 and the core and shell of the building was completed as of December 31, 2021. The Tin Building is expected to open in the first half of 2022, with an expanded focus on in-person dining, retail shopping, mobile ordering and delivery. We are closely monitoring our revenues and for the year ended December 31, 2021, we have collected 98.0% of our $4.8 million of office portfolio billings and a nominal amount of our $4.2 million of retail portfolio billings as we have restructured many leases as a result of the impacts of the pandemic.
In April 2021, Momofuku reopened the Ssäm Bar in the space previously occupied by its former concept, Bar Wayō. Additionally, Andrew Carmellini’s Noho Hospitality opened Mister Dips in May 2021 and Carne Mare in June 2021.
In 2020, in place of the cancelled summer concert series, we launched a new concept at the Pier 17 rooftop called The Greens, which allowed guests to reserve socially distanced, mini-lawn spaces. These lawn spaces were converted to individual dining cabins in the winter months. In 2021, the Seaport welcomed live events back to the Rooftop at Pier 17. Our first major event, following a COVID-related 16-month hiatus, was ESPN’s broadcast of The ESPYS, which returned to New York for the first time in 22 years. In 2021, we also reintroduced The Greens on the Rooftop at Pier 17 with new and improved versions of both the summer mini-lawns and winter cabins. In anticipation of the return of concerts to Pier 17, the newly designed mini-lawns were fabricated as deployable units that could be easily removed for concerts and returned to the Rooftop on off days allowing for very limited downtime.
Following The ESPYS, live music returned to Pier 17 with the reintroduction of the Seaport Summer Concert Series. The 2021 summer concert series began in July 2021 and ran through mid-October 2021. During the 11-week concert season, Pier 17 hosted over 30 concerts, of which 20 were sold out. In total, approximately 74,000 guests attended the concert series, representing 90% of available ticket inventory.
In July 2021, we completed a brand overhaul for the Seaport including new identity, updated logo and complimenting ad campaign. The creative work was well received in the community and won DRIVENxDESIGN’s Silver Award for Graphic Design, Illustration and Type. Across the Seaport, we executed a series of dynamic activations in vacant and public spaces to drive additional traffic and awareness to the Seaport. Finally, our Seaport Arts platform launched with two marquee exhibits, both of which drew tremendous global attention to the Seaport and elevated our profile as a destination for dynamic exhibitions by world class photographers.
We have also announced the future opening of two new concepts at the Fulton Market Building in the space previously occupied by 10 Corso Como. In the summer of 2022, in a joint partnership with Endorphin Ventures, we expect to launch The Lawn Club, a new concept that will transform 20,000 square feet of the Fulton Market Building into an immersive indoor and outdoor experience that includes an extensive indoor grass area, a stylish clubhouse bar and a wide variety of lawn games. We also expect to launch a new restaurant concept by Josh Eden and Wylie Dufresne at 1 Fulton Street featuring an all-day menu with many specialty to-go items and an expansive outdoor café in the summer of 2022.
In October 2020, we announced our comprehensive proposal for the redevelopment of 250 Water Street, which includes the transformation of this underutilized full-block surface parking lot into a mixed-use development that would include affordable and market rate apartments, community-oriented spaces and office space. This project, which includes approximately 547,000 zoning square feet, presents a unique opportunity at the Seaport to redevelop this site into a vibrant mixed-use asset, provide long-term viability to the South Street Seaport Museum and deliver much-needed affordable housing and economic stimulus to the area. In May 2021, we received approval from the New York City Landmarks Preservation Commission (LPC) on our proposed design for the 250 Water Street and in September 2021, the New York State Supreme Court dismissed on procedural grounds a lawsuit challenging the LPC approval. We received final approvals in December 2021 through the New York City Uniform Land Use Review Procedure known as ULURP, which will allow the necessary transfer of development rights to the parking lot site. Also in December 2021, an amendment to the Seaport ground lease was executed giving the Company extension options, at the discretion of the Company, for an additional 48 years from its current expiration in 2072 until 2120. We expect to begin comprehensive remediation of the site through the New York State Brownfield Cleanup program and break ground on the development in 2022. In February 2022, an additional lawsuit was filed challenging the land use approvals previously granted to the Company under the ULURP for the redevelopment and construction of 250 Water Street. The Company intends to vigorously contest the matter as it believes that these claims are without merit.
HHC 2021 FORM 10-K | 43
MANAGEMENT’S DISCUSSION AND ANALYSIS OVERVIEW | |||||
Strategic Developments Given the challenges presented by the pandemic, we implemented new strategies to sell condominiums in Hawai‘i, which included 3D virtual tours of interactive floor plans, live chat capabilities with sales staff, and increased photographs on our websites.
In 2021, Ward Village achieved the highest sales volume in the community’s history. During the fourth quarter of 2021, we completed construction on ‘A‘ali‘i and closed on 663 units. As of December 31, 2021, our five completed towers are 96.2% sold and our two under-construction towers are 93.1% sold. We also launched public sales at The Park Ward Village, which was 84.2% presold at the end of 2021. The Park Ward Village is now Ward Village’s fastest-selling tower since inception, surpassing Victoria Place, which held the previous record.
We have not experienced any delays in our existing construction as a result of COVID-19, other than the brief delay of construction on the Tin Building discussed above. In December 2020, we began construction on Starling at Bridgeland, a luxury multi-family development in Bridgeland. During the first quarter of 2021, we began construction on Marlow, a multi-family development in Columbia, and Victoria Place, our seventh condominium project in Ward Village. During the second quarter of 2021 in Downtown Summerlin, we began construction on 1700 Pavilion, an office building and Tanager Echo, a luxury apartment complex. During the fourth quarter of 2021, we began construction on Memorial Hermann Health System Build-to-Suit, a medical office property in The Woodlands. Additionally, we began construction on a second medical office property in The Woodlands in January 2022, and expect to begin construction on a new medical office property in Columbia and our first single-family for rent property in Bridgeland in the first quarter of 2022.
HHC 2021 FORM 10-K | 44
MANAGEMENT’S DISCUSSION AND ANALYSIS OVERVIEW | |||||
| Earnings Before Taxes | ||
In addition to the required presentations using GAAP, we use certain non-GAAP performance measures, as we believe these measures improve the understanding of our operational results and make comparisons of operating results among peer companies more meaningful. Management continually evaluates the usefulness, relevance, limitations and calculation of our reported non-GAAP performance measures to determine how best to provide relevant information to the public, and thus such reported measures could change.
Because our four segments, Operating Assets, MPC, Seaport and Strategic Developments, are managed separately, we use different operating measures to assess operating results and allocate resources among them. The one common operating measure used to assess operating results for our business segments is EBT. EBT, as it relates to each business segment, represents the revenues less expenses of each segment, including interest income, interest expense, depreciation and amortization and equity in earnings of real estate and other affiliates. EBT excludes corporate expenses and other items that are not allocable to the segments. See discussion herein at Corporate income, expenses and other items for further details. We present EBT for each segment because we use this measure, among others, internally to assess the core operating performance of our assets.
EBT should not be considered an alternative to GAAP net income attributable to common stockholders or GAAP net income, as it has limitations as an analytical tool, and should not be considered in isolation, or as a substitute for analysis of our results as reported under GAAP. Some of the limitations of EBT are that it does not include the following in our calculations:
–cash expenditures, or future requirements for capital expenditures or contractual commitments
–corporate general and administrative expenses
–interest expense on our corporate debt
–income taxes that we may be required to pay
–any cash requirements for replacement of fully depreciated or amortized assets
–limitations on, or costs related to, the transfer of earnings from our real estate and other affiliates to us
Segment operating results are as follows:
| thousands | Operating Assets Segment (a) | MPC Segment | Seaport Segment | Strategic Developments Segment | Total | ||||||||||||||||||||||||
| Year ended December 31, 2021 | |||||||||||||||||||||||||||||
| Total revenues | $ | 442,698 | $ | 409,746 | $ | 55,008 | $ | 520,109 | $ | 1,427,561 | |||||||||||||||||||
| Total operating expenses | (209,020) | (193,851) | (77,198) | (436,698) | (916,767) | ||||||||||||||||||||||||
| Segment operating income (loss) | 233,678 | 215,895 | (22,190) | 83,411 | 510,794 | ||||||||||||||||||||||||
| Depreciation and amortization | (163,031) | (366) | (30,867) | (6,512) | (200,776) | ||||||||||||||||||||||||
| Interest income (expense), net | (75,391) | 42,683 | 357 | 3,701 | (28,650) | ||||||||||||||||||||||||
| Other income (loss), net | (10,746) | — | (3,730) | 2,536 | (11,940) | ||||||||||||||||||||||||
| Equity in earnings (losses) from real estate and other affiliates | (67,042) | 59,399 | (1,988) | (221) | (9,852) | ||||||||||||||||||||||||
| Gain (loss) on sale or disposal of real estate and other assets, net | 39,168 | — | — | 13,911 | 53,079 | ||||||||||||||||||||||||
| Gain (loss) on extinguishment of debt | (1,926) | (1,004) | — | — | (2,930) | ||||||||||||||||||||||||
| Provision for impairment | — | — | — | (13,068) | (13,068) | ||||||||||||||||||||||||
| Segment EBT | $ | (45,290) | $ | 316,607 | $ | (58,418) | $ | 83,758 | $ | 296,657 | |||||||||||||||||||
| Corporate income, expenses and other items | (247,733) | ||||||||||||||||||||||||||||
| Net income (loss) | 48,924 | ||||||||||||||||||||||||||||
| Net (income) loss attributable to noncontrolling interests | 7,176 | ||||||||||||||||||||||||||||
| Net income (loss) attributable to common stockholders | $ | 56,100 | |||||||||||||||||||||||||||
HHC 2021 FORM 10-K | 45
MANAGEMENT’S DISCUSSION AND ANALYSIS OVERVIEW | |||||
| thousands | Operating Assets Segment (a) | MPC Segment | Seaport Segment | Strategic Developments Segment | Total | ||||||||||||||||||||||||
| Year Ended December 31, 2020 | |||||||||||||||||||||||||||||
| Total revenues | $ | 372,057 | $ | 283,953 | $ | 23,814 | $ | 19,407 | $ | 699,231 | |||||||||||||||||||
| Total operating expenses | (185,480) | (128,597) | (46,112) | (135,160) | (495,349) | ||||||||||||||||||||||||
| Segment operating income (loss) | 186,577 | 155,356 | (22,298) | (115,753) | 203,882 | ||||||||||||||||||||||||
| Depreciation and amortization | (162,324) | (365) | (41,602) | (6,545) | (210,836) | ||||||||||||||||||||||||
| Interest income (expense), net | (91,411) | 36,587 | (12,512) | 6,312 | (61,024) | ||||||||||||||||||||||||
| Other income (loss), net | 540 | — | (2,616) | 2,165 | 89 | ||||||||||||||||||||||||
| Equity in earnings (losses) from real estate and other affiliates | (7,366) | 17,845 | (9,292) | 269,912 | 271,099 | ||||||||||||||||||||||||
| Gain (loss) on sale or disposal of real estate and other assets, net | 38,232 | — | — | 21,710 | 59,942 | ||||||||||||||||||||||||
| Gain (loss) on extinguishment of debt | (1,521) | — | (11,648) | — | (13,169) | ||||||||||||||||||||||||
| Provision for impairment | (48,738) | — | — | — | (48,738) | ||||||||||||||||||||||||
| Segment EBT | $ | (86,011) | $ | 209,423 | $ | (99,968) | $ | 177,801 | $ | 201,245 | |||||||||||||||||||
| Corporate income, expenses and other items | (204,418) | ||||||||||||||||||||||||||||
| Net income (loss) | (3,173) | ||||||||||||||||||||||||||||
| Net (income) loss attributable to noncontrolling interests | (22,981) | ||||||||||||||||||||||||||||
| Net income (loss) attributable to common stockholders | $ | (26,154) | |||||||||||||||||||||||||||
| Year Ended December 31, 2019 | |||||||||||||||||||||||||||||
| Total revenues | $ | 400,131 | $ | 386,781 | $ | 55,645 | $ | 457,948 | $ | 1,300,505 | |||||||||||||||||||
| Total operating expenses | (187,322) | (183,472) | (77,872) | (391,848) | (840,514) | ||||||||||||||||||||||||
| Segment operating income (loss) | 212,809 | 203,309 | (22,227) | 66,100 | 459,991 | ||||||||||||||||||||||||
| Depreciation and amortization | (115,499) | (424) | (26,381) | (5,473) | (147,777) | ||||||||||||||||||||||||
| Interest income (expense), net | (81,029) | 32,019 | (12,865) | 11,321 | (50,554) | ||||||||||||||||||||||||
| Other income (loss), net | 1,142 | 601 | (22) | 831 | 2,552 | ||||||||||||||||||||||||
| Equity in earnings (losses) from real estate and other affiliates | 3,672 | 28,336 | (2,592) | 1,213 | 30,629 | ||||||||||||||||||||||||
| Gain (loss) on sale or disposal of real estate and other assets, net | — | — | (6) | 27,119 | 27,113 | ||||||||||||||||||||||||
| Selling profit from sales-type leases | 13,537 | — | — | — | 13,537 | ||||||||||||||||||||||||
| Gain (loss) on extinguishment of debt | — | — | 4,851 | — | 4,851 | ||||||||||||||||||||||||
| Segment EBT | $ | 34,632 | $ | 263,841 | $ | (59,242) | $ | 101,111 | $ | 340,342 | |||||||||||||||||||
| Corporate income, expenses and other items | (266,047) | ||||||||||||||||||||||||||||
| Net income (loss) | 74,295 | ||||||||||||||||||||||||||||
| Net (income) loss attributable to noncontrolling interests | (339) | ||||||||||||||||||||||||||||
| Net income (loss) attributable to common stockholders | $ | 73,956 | |||||||||||||||||||||||||||
(a)Total revenues includes hospitality revenues of $35.6 million for the year ended December 31, 2021, $35.2 million for the year ended December 31, 2020, and $87.9 million for the year ended December 31, 2019. Total operating expenses includes hospitality operating costs of $30.5 million for the year ended December 31, 2021, $32.3 million for the year ended December 31, 2020, and $60.2 million for the year ended December 31, 2019. In September 2021, the Company completed the sale of its three hospitality properties.
HHC 2021 FORM 10-K | 46
MANAGEMENT’S DISCUSSION AND ANALYSIS RESULTS OF OPERATIONS | |||||
| RESULTS OF OPERATIONS | ||
Net income (loss) attributable to common stockholders increased $82.3 million for the year ended December 31, 2021, compared to the same period in 2020 and decreased $100.1 million for the year ended December 31, 2020, compared to the same period in 2019. See segment discussions for more detail on the changes described above.
| Operating Assets | ||
Segment EBT The following table presents segment EBT for Operating Assets for the years ended December 31:
| Operating Assets Segment EBT | 2021-2020 | 2020-2019 | |||||||||||||||||||||||||||
| thousands | 2021 | 2020 | 2019 | Change | Change | ||||||||||||||||||||||||
| Rental Revenue | $ | 360,830 | $ | 315,730 | $ | 269,392 | $ | 45,100 | $ | 46,338 | |||||||||||||||||||
| Other land, rental and property revenues | 81,868 | 56,327 | 130,739 | 25,541 | (74,412) | ||||||||||||||||||||||||
| Total revenues | 442,698 | 372,057 | 400,131 | 70,641 | (28,074) | ||||||||||||||||||||||||
| Operating costs | (158,994) | (133,877) | (155,137) | (25,117) | 21,260 | ||||||||||||||||||||||||
| Rental property real estate taxes | (50,661) | (45,739) | (32,563) | (4,922) | (13,176) | ||||||||||||||||||||||||
| (Provision for) recovery of doubtful accounts | 635 | (5,864) | 378 | 6,499 | (6,242) | ||||||||||||||||||||||||
| Total operating expenses | (209,020) | (185,480) | (187,322) | (23,540) | 1,842 | ||||||||||||||||||||||||
| Segment operating income (loss) | 233,678 | 186,577 | 212,809 | 47,101 | (26,232) | ||||||||||||||||||||||||
| Depreciation and amortization | (163,031) | (162,324) | (115,499) | (707) | (46,825) | ||||||||||||||||||||||||
| Interest income (expense), net | (75,391) | (91,411) | (81,029) | 16,020 | (10,382) | ||||||||||||||||||||||||
| Other income (loss), net | (10,746) | 540 | 1,142 | (11,286) | (602) | ||||||||||||||||||||||||
| Equity in earnings (losses) from real estate and other affiliates | (67,042) | (7,366) | 3,672 | (59,676) | (11,038) | ||||||||||||||||||||||||
| Gain (loss) on sale or disposal of real estate and other assets, net | 39,168 | 38,232 | — | 936 | 38,232 | ||||||||||||||||||||||||
| Selling profit from sales-type leases | — | — | 13,537 | — | (13,537) | ||||||||||||||||||||||||
| Gain (loss) on extinguishment of debt | (1,926) | (1,521) | — | (405) | (1,521) | ||||||||||||||||||||||||
| Provision for impairment | — | (48,738) | — | 48,738 | (48,738) | ||||||||||||||||||||||||
| Segment EBT | $ | (45,290) | $ | (86,011) | $ | 34,632 | $ | 40,721 | $ | (120,643) | |||||||||||||||||||
For the year ended December 31, 2021:
Operating Assets segment EBT increased $40.7 million compared to the prior year period primarily due to the following:
–increase in Rental revenue and a decrease in (Provision for) recovery of doubtful accounts primarily as a result of improved collections at our retail properties in 2021 due to continued recovery from the COVID-19 pandemic as well as the receipt of one-time payments related to COVID-19 rent deferrals received throughout the year
–increase in Rental revenue, net of related Operating costs, related to multi-family properties in The Woodlands and Columbia as well as office property in Columbia placed in service since the beginning of 2020
–increase in our Other land, rental and property revenues, net of related Operating Costs, primarily related to the return of the Las Vegas Aviators 2021 baseball season after cancellation in 2020 as a result of the COVID-19 pandemic
–gain on the sale of The Woodlands Resort, The Westin at The Woodlands and Embassy Suites at Hughes Landing in the third quarter of 2021
–decrease in interest expense due to the retirement or refinancing of various loans
–impairment on the Outlet Collection at Riverwalk in the first quarter of 2020 that did not reoccur in 2021
These increases to EBT were partially offset by the following:
–decrease in equity earnings related to 110 North Wacker, which was deconsolidated and recorded as an equity method investment upon completion of construction in the third quarter of 2020. Losses recognized in 2021 were primarily related to the disproportionate impact of interest expense, real estate taxes and depreciation expense during the lease-up period and an impairment on the Company’s equity investment recorded in the fourth quarter of 2021. Please refer to Note 2 - Investments in Real Estate and Other Affiliates and Note 4 - Impairment in the Notes to Consolidated Financial Statements under Item 8 of this Form 10-K for further details.
–gain on the sale of 100 Fellowship Drive in the first quarter of 2020
–increase in Operating expenses primarily due to the steady return of business operations across our portfolio after the onset of the COVID-19 pandemic in 2020
HHC 2021 FORM 10-K | 47
MANAGEMENT’S DISCUSSION AND ANALYSIS RESULTS OF OPERATIONS | |||||
–increase in Other income (loss), net primarily related to a loss on the settlement of the rate-lock agreement upon repayment of $280.3 million outstanding on our loans for 1201 Lake Robbins and The Woodlands Warehouse in February 2021
For the year ended December 31, 2020:
Operating Assets segment EBT decreased $120.6 million compared to the prior year period primarily due to the following:
–increase in the Provision for impairment of $48.7 million for Outlet Collection at Riverwalk, partially offset by an increase in Gain (loss) on sale or disposal of real estate related to the sale of 100 Fellowship Drive in the first quarter of 2020. Please refer to Note 3 - Acquisitions and Dispositions and Note 4 - Impairment in the Notes to Consolidated Financial Statements under Item 8 of this Form 10-K for further details.
–net decreases in our Other land, rental and property revenues and related Operating expenses primarily due to declines in occupancy at our hospitality properties and cancellation of the Las Vegas Aviators 2020 baseball season, all as a result of the COVID-19 pandemic
–net decreases in Rental revenue and related Operating expenses primarily due to rent deferrals and collection reserves related to our retail properties
–decrease in Selling profit from sales-type leases attributable to the commencement of a lease at our 100 Fellowship Drive property in the third quarter of 2019
–increase in Depreciation and amortization expense, Rental property real estate taxes, Interest expense, net, and Operating expenses, partially offset by Rental revenue related to office and multi-family assets recently acquired or placed in service, but still in the lease-up period
Net Operating Income We believe that NOI is a useful supplemental measure of the performance of our Operating Assets and Seaport segments because it provides a performance measure that, when compared year over year, reflects the revenues and expenses directly associated with owning and operating real estate properties and the impact on operations from trends in rental and occupancy rates and operating costs as variances between years in NOI typically result from changes in rental rates, occupancy, tenant mix and operating expenses. We define NOI as operating revenues (rental income, tenant recoveries and other revenue) less operating expenses (real estate taxes, repairs and maintenance, marketing and other property expenses). NOI excludes straight-line rents and amortization of tenant incentives, net; interest expense, net; ground rent amortization; demolition costs; other income (loss); amortization; depreciation; development-related marketing costs; gain on sale or disposal of real estate and other assets, net; provision for impairment and equity in earnings from real estate and other affiliates. We use NOI to evaluate our operating performance on a property-by-property basis because NOI allows us to evaluate the impact that property-specific factors such as lease structure, lease rates and tenant base have on our operating results, gross margins and investment returns.
Projected annual stabilized NOI is initially projected prior to the development of the asset based on market assumptions and is revised over the life of the asset as market conditions evolve. On a quarterly basis, each asset’s annualized NOI is compared to its projected stabilized NOI in conjunction with forecast data to determine if an adjustment is needed. Adjustments to an asset’s stabilized NOI are made when changes to the asset's long-term performance are thought to be more than likely and permanent.
Although we believe that NOI provides useful information to investors about the performance of our Operating Assets and Seaport segments, due to the exclusions noted above, NOI should only be used as an additional measure of the financial performance of such assets and not as an alternative to GAAP net income. A reconciliation of Operating Assets segment EBT to Operating Assets NOI is presented in the table below. Refer to the Seaport section for a reconciliation of Seaport segment EBT to Seaport NOI.
HHC 2021 FORM 10-K | 48
MANAGEMENT’S DISCUSSION AND ANALYSIS RESULTS OF OPERATIONS | |||||
| Operating Assets NOI | 2021-2020 | 2020-2019 | |||||||||||||||||||||||||||
| thousands | 2021 | 2020 | 2019 | Change | Change | ||||||||||||||||||||||||
| Total Operating Assets segment EBT | $ | (45,290) | $ | (86,011) | $ | 34,632 | $ | 40,721 | $ | (120,643) | |||||||||||||||||||
| Add back: | |||||||||||||||||||||||||||||
| Depreciation and amortization | 163,031 | 162,324 | 115,499 | 707 | 46,825 | ||||||||||||||||||||||||
| Interest (income) expense, net | 75,391 | 91,411 | 81,029 | (16,020) | 10,382 | ||||||||||||||||||||||||
| Equity in (earnings) losses from real estate and other affiliates | 67,042 | 7,366 | (3,672) | 59,676 | 11,038 | ||||||||||||||||||||||||
| (Gain) loss on sale or disposal of real estate and other assets, net | (39,168) | (38,232) | — | (936) | (38,232) | ||||||||||||||||||||||||
| (Gain) loss on extinguishment of debt | 1,926 | 1,521 | — | 405 | 1,521 | ||||||||||||||||||||||||
| Selling profit from sales-type leases | — | — | (13,537) | — | 13,537 | ||||||||||||||||||||||||
| Provision for impairment | — | 48,738 | — | (48,738) | 48,738 | ||||||||||||||||||||||||
| Impact of straight-line rent | (14,715) | (7,630) | (9,007) | (7,085) | 1,377 | ||||||||||||||||||||||||
| Other | 10,449 | 99 | 671 | 10,350 | (572) | ||||||||||||||||||||||||
| Operating Assets NOI | $ | 218,666 | $ | 179,586 | $ | 205,615 | $ | 39,080 | $ | (26,029) | |||||||||||||||||||
The below table presents Operating Assets NOI by property type:
| Operating Assets NOI by Property Type | 2021-2020 | 2020-2019 | |||||||||||||||||||||||||||
| thousands | 2021 | 2020 | 2019 | Change | Change | ||||||||||||||||||||||||
| Office | $ | 109,838 | $ | 114,303 | $ | 83,559 | $ | (4,465) | $ | 30,744 | |||||||||||||||||||
| Retail | 57,571 | 40,019 | 62,568 | 17,552 | (22,549) | ||||||||||||||||||||||||
| Multi-family | 32,895 | 18,798 | 18,062 | 14,097 | 736 | ||||||||||||||||||||||||
| Other | 13,492 | 2,528 | 10,274 | 10,964 | (7,746) | ||||||||||||||||||||||||
| Redevelopments and Dispositions | 4,870 | 3,938 | 31,152 | 932 | (27,214) | ||||||||||||||||||||||||
| Operating Assets NOI | $ | 218,666 | $ | 179,586 | $ | 205,615 | $ | 39,080 | $ | (26,029) | |||||||||||||||||||
For the year ended December 31, 2021:
Operating Assets NOI increased $39.1 million compared to the prior-year period primarily due to the following:
–increase at our retail properties as collections improve and business rebounds from the COVID-19 pandemic
–increase at our multi-family properties primarily related to the lease-up of Juniper Apartments, Two Lakes Edge and The Lane at Waterway which opened in 2020
–increase at our other properties primarily related to the return of the Las Vegas Aviators 2021 baseball season after cancellation in 2020 as a result of the COVID-19 pandemic
–partially offset by a decrease in revenue on our office properties primarily related to the planned expiration in June 2020 of a short-term lease for approximately 142,000 square feet at The Woodlands Towers at the Waterway, which is being actively marketed
For the year ended December 31, 2020:
Operating Assets NOI decreased $26.0 million compared to the prior-year period primarily due to the following:
–decreases at our hospitality and other properties primarily due to declines in occupancy at our hospitality properties and cancellation of the Las Vegas Aviators 2020 baseball season, all as a result of the COVID-19 pandemic
–decreases at our retail properties primarily due to rent deferrals and collection reserves
–decrease related to the third quarter 2019 commencement of a lease at our 100 Fellowship Drive property which was sold in the first quarter of 2020
–partially offset by an increase in revenue on our office properties recently acquired or placed in service
HHC 2021 FORM 10-K | 49
MANAGEMENT’S DISCUSSION AND ANALYSIS RESULTS OF OPERATIONS | |||||
The below table presents Operating Assets NOI by property type and property with redevelopments and dispositions presented separately:
| Operating Assets NOI by Property Type by Property | 2021-2020 | 2020-2019 | |||||||||||||||||||||||||||
| thousands | 2021 | 2020 | 2019 | Change | Change | ||||||||||||||||||||||||
| Office | |||||||||||||||||||||||||||||
| The Woodlands | |||||||||||||||||||||||||||||
| One Hughes Landing | $ | 5,526 | $ | 5,795 | $ | 6,968 | $ | (269) | $ | (1,173) | |||||||||||||||||||
| Two Hughes Landing | 3,739 | 4,128 | 5,573 | (389) | (1,445) | ||||||||||||||||||||||||
| Three Hughes Landing | 7,894 | 7,780 | 5,546 | 114 | 2,234 | ||||||||||||||||||||||||
| 1725 Hughes Landing Boulevard | 4,339 | 6,262 | 5,665 | (1,923) | 597 | ||||||||||||||||||||||||
| 1735 Hughes Landing Boulevard | 8,342 | 8,193 | 7,887 | 149 | 306 | ||||||||||||||||||||||||
| 2201 Lake Woodlands Drive | 459 | 450 | 455 | 9 | (5) | ||||||||||||||||||||||||
| Lakefront North | 4,245 | 3,754 | (161) | 491 | 3,915 | ||||||||||||||||||||||||
| 8770 New Trails | 3,295 | 341 | — | 2,954 | 341 | ||||||||||||||||||||||||
| 9303 New Trails | 1,474 | 1,325 | 941 | 149 | 384 | ||||||||||||||||||||||||
| 3831 Technology Forest Drive | 2,504 | 2,442 | 2,346 | 62 | 96 | ||||||||||||||||||||||||
| 3 Waterway Square | 5,963 | 5,711 | 6,466 | 252 | (755) | ||||||||||||||||||||||||
| 4 Waterway Square | 6,619 | 6,974 | 6,768 | (355) | 206 | ||||||||||||||||||||||||
The Woodlands Towers at The Waterway (a) | 17,927 | 26,901 | 189 | (8,974) | 26,712 | ||||||||||||||||||||||||
| 1400 Woodloch Forest | 437 | 599 | 1,369 | (162) | (770) | ||||||||||||||||||||||||
| Columbia | |||||||||||||||||||||||||||||
| 10-70 Columbia Corporate Center | 12,744 | 13,282 | 14,400 | (538) | (1,118) | ||||||||||||||||||||||||
| Columbia Office Properties | 238 | 420 | 1,104 | (182) | (684) | ||||||||||||||||||||||||
| One Mall North | 1,610 | 1,811 | 1,786 | (201) | 25 | ||||||||||||||||||||||||
| One Merriweather | 5,244 | 5,280 | 3,728 | (36) | 1,552 | ||||||||||||||||||||||||
| Two Merriweather | 2,204 | 1,803 | 967 | 401 | 836 | ||||||||||||||||||||||||
| 6100 Merriweather | 618 | (2,563) | (215) | 3,181 | (2,348) | ||||||||||||||||||||||||
| Summerlin | |||||||||||||||||||||||||||||
| Aristocrat | 4,334 | 4,280 | 4,133 | 54 | 147 | ||||||||||||||||||||||||
| One Summerlin | 6,349 | 6,243 | 5,702 | 106 | 541 | ||||||||||||||||||||||||
| Two Summerlin | 3,734 | 3,092 | 1,942 | 642 | 1,150 | ||||||||||||||||||||||||
| Total Office NOI | 109,838 | 114,303 | 83,559 | (4,465) | 30,744 | ||||||||||||||||||||||||
| Retail | |||||||||||||||||||||||||||||
| The Woodlands | |||||||||||||||||||||||||||||
| Creekside Park West | $ | 1,143 | $ | 441 | $ | 2 | $ | 702 | $ | 439 | |||||||||||||||||||
| Creekside Village Green | 1,689 | 1,886 | 2,051 | (197) | (165) | ||||||||||||||||||||||||
| Hughes Landing Retail | 3,388 | 3,635 | 4,329 | (247) | (694) | ||||||||||||||||||||||||
| 1701 Lake Robbins | 586 | 508 | 540 | 78 | (32) | ||||||||||||||||||||||||
| Lake Woodlands Crossing Retail | 1,437 | 1,449 | 1,297 | (12) | 152 | ||||||||||||||||||||||||
| One Lakes Edge Retail | 810 | 766 | 1,048 | 44 | (282) | ||||||||||||||||||||||||
| Two Lakes Edge Retail | 159 | 298 | — | (139) | 298 | ||||||||||||||||||||||||
| 20/25 Waterway Avenue | 1,826 | 1,317 | 1,573 | 509 | (256) | ||||||||||||||||||||||||
| Waterway Garage Retail | 378 | 372 | 573 | 6 | (201) | ||||||||||||||||||||||||
| 2000 Woodlands Parkway | 246 | 400 | 79 | (154) | 321 | ||||||||||||||||||||||||
| Bridgeland | |||||||||||||||||||||||||||||
| Lakeland Village Center at Bridgeland | 1,138 | 1,257 | 1,869 | (119) | (612) | ||||||||||||||||||||||||
| Columbia | |||||||||||||||||||||||||||||
| Columbia Regional Building | 2,226 | 2,272 | 2,198 | (46) | 74 | ||||||||||||||||||||||||
| Juniper Retail | (744) | (131) | — | (613) | (131) | ||||||||||||||||||||||||
| Merriweather District Area 3 Standalone Restaurant | (49) | (3) | — | (46) | (3) | ||||||||||||||||||||||||
| Summerlin | |||||||||||||||||||||||||||||
| Downtown Summerlin | 24,732 | 15,521 | 21,585 | 9,211 | (6,064) | ||||||||||||||||||||||||
| Ward Village | |||||||||||||||||||||||||||||
| Ward Village Retail | 16,608 | 9,385 | 19,387 | 7,223 | (10,002) | ||||||||||||||||||||||||
| Other | |||||||||||||||||||||||||||||
| Outlet Collection at Riverwalk | 1,998 | 646 | 6,037 | 1,352 | (5,391) | ||||||||||||||||||||||||
| Total Retail NOI | 57,571 | 40,019 | 62,568 | 17,552 | (22,549) | ||||||||||||||||||||||||
HHC 2021 FORM 10-K | 50
MANAGEMENT’S DISCUSSION AND ANALYSIS RESULTS OF OPERATIONS | |||||
| Operating Assets NOI by Property Type by Property | 2021-2020 | 2020-2019 | |||||||||||||||||||||||||||
| thousands | 2021 | 2020 | 2019 | Change | Change | ||||||||||||||||||||||||
| Multi-family | |||||||||||||||||||||||||||||
| The Woodlands | |||||||||||||||||||||||||||||
| Creekside Park Apartments | $ | 2,533 | $ | 2,403 | $ | 1,654 | $ | 130 | $ | 749 | |||||||||||||||||||
| Creekside Park The Grove | 504 | — | — | 504 | — | ||||||||||||||||||||||||
| Millennium Six Pines Apartments | 2,810 | 3,114 | 4,207 | (304) | (1,093) | ||||||||||||||||||||||||
| Millennium Waterway Apartments | 2,638 | 3,245 | 3,890 | (607) | (645) | ||||||||||||||||||||||||
| One Lakes Edge | 4,849 | 4,950 | 5,762 | (101) | (812) | ||||||||||||||||||||||||
| Two Lakes Edge | 4,131 | (488) | — | 4,619 | (488) | ||||||||||||||||||||||||
| The Lane at Waterway | 1,044 | (117) | — | 1,161 | (117) | ||||||||||||||||||||||||
| Bridgeland | |||||||||||||||||||||||||||||
Lakeside Row | 3,113 | 696 | (88) | 2,417 | 784 | ||||||||||||||||||||||||
| Columbia | |||||||||||||||||||||||||||||
Juniper Apartments | 4,474 | 307 | — | 4,167 | 307 | ||||||||||||||||||||||||
| Summerlin | |||||||||||||||||||||||||||||
| Constellation Apartments | 2,067 | 1,912 | 1,980 | 155 | (68) | ||||||||||||||||||||||||
Tanager Apartments | 4,732 | 2,776 | 657 | 1,956 | 2,119 | ||||||||||||||||||||||||
| Total Multi-family NOI | 32,895 | 18,798 | 18,062 | 14,097 | 736 | ||||||||||||||||||||||||
| Total Retail, Office and Multi-family NOI | 200,304 | 173,120 | 164,189 | 27,184 | 8,931 | ||||||||||||||||||||||||
| Other | |||||||||||||||||||||||||||||
| The Woodlands | |||||||||||||||||||||||||||||
| The Woodlands Ground Leases | $ | 4,185 | $ | 1,868 | $ | 1,778 | $ | 2,317 | $ | 90 | |||||||||||||||||||
| The Woodlands Warehouse | 1,365 | 1,052 | 6 | 313 | 1,046 | ||||||||||||||||||||||||
| Summerlin | |||||||||||||||||||||||||||||
| Las Vegas Ballpark (b) | 5,954 | (3,577) | 8,135 | 9,531 | (11,712) | ||||||||||||||||||||||||
| Ward Village | |||||||||||||||||||||||||||||
| Kewalo Basin Harbor | 1,658 | 1,080 | 612 | 578 | 468 | ||||||||||||||||||||||||
| Other | |||||||||||||||||||||||||||||
| Parking Garages (c) | (1,514) | (1,539) | (1,286) | 25 | (253) | ||||||||||||||||||||||||
| Other Properties | 1,844 | 3,644 | 1,029 | (1,800) | 2,615 | ||||||||||||||||||||||||
| Total Other NOI | 13,492 | 2,528 | 10,274 | 10,964 | (7,746) | ||||||||||||||||||||||||
| Operating Assets NOI excluding properties sold or in redevelopment | $ | 213,796 | $ | 175,648 | $ | 174,463 | $ | 38,148 | $ | 1,185 | |||||||||||||||||||
| Redevelopments | |||||||||||||||||||||||||||||
| Other | |||||||||||||||||||||||||||||
| 110 North Wacker (d) | $ | — | $ | — | $ | (5) | $ | — | $ | 5 | |||||||||||||||||||
| Total Operating Assets Redevelopments NOI | — | — | (5) | — | 5 | ||||||||||||||||||||||||
| Dispositions | |||||||||||||||||||||||||||||
| Other | |||||||||||||||||||||||||||||
| Hospitality Properties | $ | 4,970 | $ | 2,927 | $ | 28,843 | $ | 2,043 | $ | (25,916) | |||||||||||||||||||
| 100 Fellowship Drive | — | 1,011 | 2,214 | (1,011) | (1,203) | ||||||||||||||||||||||||
| Elk Grove | (100) | — | 100 | (100) | (100) | ||||||||||||||||||||||||
| Total Operating Assets Dispositions NOI | 4,870 | 3,938 | 31,157 | 932 | (27,219) | ||||||||||||||||||||||||
| Total Operating Assets NOI - Consolidated | $ | 218,666 | $ | 179,586 | $ | 205,615 | $ | 39,080 | $ | (26,029) | |||||||||||||||||||
(a)Includes 1201 Lake Robbins and 9950 Woodloch Forest.
(b)Includes the Las Vegas Aviators.
(c)Includes parking garages in The Woodlands, Columbia and Ward Village.
(d)During the third quarter of 2020, 110 North Wacker was completed and placed in service, resulting in the deconsolidation of 110 North Wacker and subsequent treatment as an equity method investment. The Company's share of NOI related to 110 North Wacker is calculated using our stated ownership of 23% and does not include the impact of the partnership distribution waterfall.
HHC 2021 FORM 10-K | 51
MANAGEMENT’S DISCUSSION AND ANALYSIS RESULTS OF OPERATIONS | |||||
| Master Planned Communities | ||
Segment EBT The following table presents segment EBT for MPC Assets for the years ended December 31:
| Consolidated MPC Segment EBT | |||||||||||||||||||||||||||||||||||||||||||||||||||||||||||||||||||||||||||||||||||||||||||||||
| Bridgeland | Columbia | Douglas Ranch | Summerlin | The Woodlands | The Woodlands Hills | Total MPC | Trillium (f) | ||||||||||||||||||||||||||||||||||||||||||||||||||||||||||||||||||||||||||||||||||||||||
| thousands except percentages | 2021 | 2020 | 2019 | 2021 | 2020 | 2019 | 2021 | 2020 | 2019 | 2021 | 2020 | 2019 | 2021 | 2020 | 2019 | 2021 | 2020 | 2019 | 2021 | 2020 | 2019 | 2021 | 2020 | 2019 | |||||||||||||||||||||||||||||||||||||||||||||||||||||||||||||||||||||||
| Land sales (a) | $ | 75,160 | $ | 76,040 | $ | 61,401 | $ | — | $ | — | $ | — | $ | — | $ | — | $ | — | $ | 238,168 | $ | 113,336 | $ | 214,793 | $ | 5,933 | $ | 26,290 | $ | 42,846 | $ | 26,956 | $ | 17,378 | $ | 11,106 | $ | 346,217 | $ | 233,044 | $ | 330,146 | $ | — | $ | — | $ | — | |||||||||||||||||||||||||||||||||||||||||||||||
| Builder price participation (b) | 2,856 | 1,841 | 920 | — | — | — | — | — | — | 40,171 | 34,687 | 34,355 | 715 | 362 | 290 | 1,396 | 182 | 116 | 45,138 | 37,072 | 35,681 | — | — | — | |||||||||||||||||||||||||||||||||||||||||||||||||||||||||||||||||||||||
| Other land revenues | 635 | 96 | 150 | — | — | — | — | — | — | 16,743 | 13,432 | 12,830 | 960 | 309 | 7,966 | 53 | — | 8 | 18,391 | 13,837 | 20,954 | — | — | — | |||||||||||||||||||||||||||||||||||||||||||||||||||||||||||||||||||||||
| Total revenues | 78,651 | 77,977 | 62,471 | — | — | — | — | — | — | 295,082 | 161,455 | 261,978 | 7,608 | 26,961 | 51,102 | 28,405 | 17,560 | 11,230 | 409,746 | 283,953 | 386,781 | — | — | — | |||||||||||||||||||||||||||||||||||||||||||||||||||||||||||||||||||||||
| Cost of sales - land | 20,235 | 24,790 | 22,781 | — | — | — | — | — | — | 120,579 | 55,100 | 93,590 | 2,034 | 15,011 | 20,600 | 10,782 | 6,604 | 4,881 | 153,630 | 101,505 | 141,852 | — | — | — | |||||||||||||||||||||||||||||||||||||||||||||||||||||||||||||||||||||||
| Land sales operations | 8,402 | 5,195 | 7,162 | 945 | 1,054 | 1,281 | 3 | — | — | 12,074 | 9,564 | 11,422 | 16,004 | 9,099 | 19,266 | 2,793 | 2,180 | 2,489 | 40,221 | 27,092 | 41,620 | 3 | — | — | |||||||||||||||||||||||||||||||||||||||||||||||||||||||||||||||||||||||
| Provision for doubtful accounts | — | — | — | — | — | — | — | — | — | — | — | — | — | — | — | — | — | — | — | — | — | — | — | — | |||||||||||||||||||||||||||||||||||||||||||||||||||||||||||||||||||||||
| Total operating expenses | 28,637 | 29,985 | 29,943 | 945 | 1,054 | 1,281 | 3 | — | — | 132,653 | 64,664 | 105,012 | 18,038 | 24,110 | 39,866 | 13,575 | 8,784 | 7,370 | 193,851 | 128,597 | 183,472 | 3 | — | — | |||||||||||||||||||||||||||||||||||||||||||||||||||||||||||||||||||||||
| Operating income | 50,014 | 47,992 | 32,528 | (945) | (1,054) | (1,281) | (3) | — | — | 162,429 | 96,791 | 156,966 | (10,430) | 2,851 | 11,236 | 14,830 | 8,776 | 3,860 | 215,895 | 155,356 | 203,309 | — | — | — | |||||||||||||||||||||||||||||||||||||||||||||||||||||||||||||||||||||||
| Depreciation and amortization | 140 | 133 | 133 | — | — | (20) | — | — | — | 105 | 97 | 176 | 114 | 135 | 135 | 7 | — | — | 366 | 365 | 424 | 3 | — | — | |||||||||||||||||||||||||||||||||||||||||||||||||||||||||||||||||||||||
| Other (income) loss | — | — | (223) | — | — | (311) | — | — | — | — | — | 5 | — | — | (72) | — | — | — | — | — | (601) | — | — | — | |||||||||||||||||||||||||||||||||||||||||||||||||||||||||||||||||||||||
| Interest (income) expense, net (c) | (17,879) | (16,578) | (15,639) | — | — | — | — | — | — | (23,943) | (21,838) | (20,736) | 721 | 2,913 | 5,497 | (1,582) | (1,084) | (1,141) | (42,683) | (36,587) | (32,019) | 10 | — | — | |||||||||||||||||||||||||||||||||||||||||||||||||||||||||||||||||||||||
| Equity in earnings from real estate and other affiliates (d) | — | — | — | — | — | — | 8 | — | — | (59,407) | (17,845) | (28,336) | — | — | — | — | — | — | (59,399) | (17,845) | (28,336) | — | — | — | |||||||||||||||||||||||||||||||||||||||||||||||||||||||||||||||||||||||
| Gain (loss) on extinguishment of debt | 566 | — | — | — | — | — | — | — | — | — | — | — | 438 | — | — | — | — | — | 1,004 | — | — | — | — | — | |||||||||||||||||||||||||||||||||||||||||||||||||||||||||||||||||||||||
| Segment EBT (e) | $ | 67,187 | $ | 64,437 | $ | 48,257 | $ | (945) | $ | (1,054) | $ | (950) | $ | (11) | $ | — | $ | — | $ | 245,674 | $ | 136,377 | $ | 205,857 | $ | (11,703) | $ | (197) | $ | 5,676 | $ | 16,405 | $ | 9,860 | $ | 5,001 | $ | 316,607 | $ | 209,423 | $ | 263,841 | $ | (16) | $ | — | $ | — | |||||||||||||||||||||||||||||||||||||||||||||||
| (GAAP Basis) Residential Gross Margin % | 73.1 | % | 67.4 | % | 62.9 | % | NM | NM | NM | NM | NM | NM | 49.4 | % | 51.4 | % | 56.4 | % | 46.3 | % | 42.9 | % | 51.9 | % | 60.0 | % | 62.2 | % | 56.1 | % | 55.4 | 56.5 | % | 57.0 | % | NM | NM | NM | |||||||||||||||||||||||||||||||||||||||||||||||||||||||||
| (GAAP Basis) Commercial Gross Margin % | 71.7 | % | 67.4 | % | 74.9 | % | NM | NM | NM | NM | NM | NM | 47.4 | % | NM | NM | 79.0 | % | NM | NM | NM | NM | NM | 63.0 | % | 67.4 | % | 74.9 | % | NM | NM | NM | |||||||||||||||||||||||||||||||||||||||||||||||||||||||||||||||
(a)Land sales include deferred revenue from land sales closed in a previous period which met criteria for recognition in the current period.
(b)Builder price participation revenue is based on an agreed-upon percentage of the sales price of homes closed relative to the base lot price which was paid by the homebuilders to us. This revenue fluctuates based upon the number and the prices of homes closed that qualify for builder price participation payments.
(c)Interest expense, net reflects the amount of interest that is capitalized at the project level. Negative interest expense amounts relate to interest capitalized relating to debt assigned to our Operating Assets segment and corporate debt.
(d)Equity in earnings (losses) from real estate and other affiliates for Douglas Ranch reflects our share of earnings in our Trillium joint venture and for Summerlin our share of earnings in The Summit joint venture.
(e)The negative MPC segment EBT in Columbia in 2021, 2020 and 2019 was due to real estate taxes and administrative expenses. The negative MPC segment EBT in Douglas Ranch in 2021 was due to administrative expenses at Trillium as development of the community begins. Land sales are expected to occur in the first half of 2022.
(f)This represents 100% of Trillium EBT. The Company owns 50% interest in Trillium. Refer to Note 2 - Investments in Real Estate and Other Affiliates in the Notes to Consolidated Financial Statements under Item 8 of this Form 10-K for a description of the joint venture and further discussion.
NM - Not Meaningful
HHC 2021 FORM 10-K | 52
MANAGEMENT’S DISCUSSION AND ANALYSIS RESULTS OF OPERATIONS | |||||
MPC revenues vary between periods based on economic conditions and several factors including location, availability of land for sale, development density and residential or commercial use. Gross margin for each MPC will vary from period to period based on the locations of the land sold and the related costs associated with developing the land sold. Reported results differ significantly from actual cash flows generated principally because cost of sales for GAAP purposes is derived from margins calculated using carrying values, projected future improvements and other capitalized project costs in relation to projected future land sale revenues. Carrying values generally represent acquisition and development costs reduced by any previous impairment charges. Development expenditures are capitalized and generally not reflected in the Statements of Operations in the current period. Accordingly, Cost of sales – land includes both actual and estimated future costs allocated based upon relative sales value to the lots or land parcels in each of the villages and neighborhoods in our MPCs.
For the year ended December 31, 2021:
MPC Segment EBT increased $107.2 million to $316.6 million for the year ended December 31, 2021, primarily due to the following results by MPC:
Bridgeland
–Residential land sales revenues remained consistent with 2020, with 158.1 residential acres sold compared to 169.1 acres in 2020. The average price per residential acre increased by $29,000 to $468,000 per acre.
–Commercial land sales increased $7.2 million compared to $2.2 million in commercial site sales, due to the sale of 41.5 acres more acres in 2021.
Summerlin
–Land sales revenues increased $124.8 million primarily due to higher superpad sales and custom lot sales. The increase in land sales revenues was partially offset by an increase in associated MPC cost of sales of $65.5 million.
–Summerlin’s residential land sales totaled 322.6 acres compared to 126.9 for the same period in 2020. The average price per acre for superpad sites for the year decreased by $82,000 to $656,000 per acre compared to the same period in 2020 due to the mix of lots sold.
–Revenues from custom lot sales increased due to an increase in average price for custom lots, which averaged approximately $43.88 per square foot in 2021 compared to $34.50 per square foot in 2020.
–Equity earnings at The Summit increased due to the closing of 46 units in 2021, compared to 29 units in 2020.
The Woodlands
–Land sales revenues decreased $20.4 million primarily due to a decrease in acres sold due to availability of land as the community reaches completion. The Woodlands sold 3.9 residential acres compared to 24.5 acres in 2020. The average price per residential acre decreased $455,000 to $618,000 per acre, primarily due to 2020 land sales occurring in a high-end, exclusive section of The Woodlands community that generated significantly higher value per acre in comparison.
The Woodlands Hills
–Land sales revenues increased $9.6 million due to an increase in acres sold and price per acre. The Woodlands Hills sold 80.1 residential acres compared to 56.1 acres in 2020. The average price per acre increased $27,000 to $337,000 per acre.
For the year ended December 31, 2020:
MPC Segment EBT decreased $54.4 million to $209.4 million for the year ended December 31, 2020, primarily due to the following results by MPC:
Bridgeland
–Residential land sales revenues increased $12.9 million primarily due to an increase in acres sold and price per acre. Bridgeland sold 169.1 residential acres compared to 150.3 acres in 2019. The average price per residential acre increased by $31,000 to $439,000 per acre.
–Commercial land sales increased $2.2 million from the sale of 16.6 acres compared to no commercial site sales in 2019.
HHC 2021 FORM 10-K | 53
MANAGEMENT’S DISCUSSION AND ANALYSIS RESULTS OF OPERATIONS | |||||
Summerlin
–Land sales revenues decreased $101.5 million primarily due to lower superpad sales and SID bond assumptions, partially offset by an increase in custom lot sales. The decrease in land sales revenues was partially offset by a decrease in associated MPC cost of sales of $38 million. The decrease in superpad sales in 2020 was primarily due to the acceleration of sales into 2019 as a result of increased demand from homebuilders and homebuyers.
–Revenues from custom lot sales increased due to an increase in quantity of lots sold despite a decrease in average price for custom lots, which averaged approximately $34.50 per square foot in 2020 compared to $39.00 per square foot in 2019.
–Summerlin’s residential land sales totaled 126.9 acres compared to 319.4 for the same period in 2019. The average price per acre for superpad sites for the year increased by $90,000 to $738,000 per acre compared to the same period in 2019 due to the mix of lots sold.
–Equity earnings at The Summit decreased due to an increase in projected amenity costs and the 2020 sales consisting of a greater mix of built units which have a lower margin than custom lot sales.
The Woodlands
–Land sales revenues decreased $16.6 million primarily due to a decrease in acres sold due to availability of land as the community reaches completion. The Woodlands sold 24.6 residential acres compared to 60.9 acres in 2019. The average price per residential acre increased $384,000 to $1.1 million per acre, primarily due to an increase in land sales in a high-end, exclusive section of The Woodlands community that generates significantly higher value per acre in comparison.
The Woodlands Hills
–Land sales revenues increased $6.3 million due to an increase in acres sold and price per acre. The Woodlands Hills sold 56.1 residential acres compared to 40.2 acres in 2020. The average price per acre increased $34,000 to $310,000 per acre.
MPC Equity Investments
The Summit
Land development began at The Summit, our joint venture with Discovery Land, in the second quarter of 2015, and the development continues to progress. The golf course and related amenities were completed and opened to the members of the golf club in October 2017. The Club Tower Suites broke ground in March of 2019, and are completed as 15 of the 16 Suites closed escrow in 2021. Construction of the clubhouse has commenced with an expected delivery in 2023. Lot closings began in the second quarter of 2016, and a total of 202 lots have closed for $821.6 million through December 31, 2021. For the year ended December 31, 2021, 46 residential units closed for $244.5 million, compared to 29 residential units closed for $155.7 million in 2020 and 20 residential units closed for $76.4 million in 2019 at The Summit, which offers a mix of custom lots, single family homes and clubhouse suites, sold by the joint venture. We recognized equity in earnings of $59.4 million in 2021, $17.8 million in 2020 and $28.3 million in 2019. We received cash distributions of $114.2 million in 2021, $6.0 million in 2020 and $16.1 million in 2019. Refer to Note 2 - Investments in Real Estate and Other Affiliates in the Notes to Consolidated Financial Statements under Item 8 of this Form 10-K for a description of the joint venture and further discussion.
Trillium
Land development is currently underway at Trillium, our joint venture with Trillium Development Holding Company, LLC. Land sales are expected to begin in the first half of 2022. Refer to Note 2 - Investments in Real Estate and Other Affiliates in the Notes to Consolidated Financial Statements under Item 8 of this Form 10-K for a description of the joint venture and further discussion.
HHC 2021 FORM 10-K | 54
MANAGEMENT’S DISCUSSION AND ANALYSIS RESULTS OF OPERATIONS | |||||
The following tables detail our residential and commercial land sales for the years ended December 31:
| Summary of Residential MPC Land Sales Closed | |||||||||||||||||||||||||||||||||||||||||||||||||||||||||||
| Land Sales | Acres Sold | Number of Lots/Units | Price Per Acre | Price Per Lot | |||||||||||||||||||||||||||||||||||||||||||||||||||||||
| thousands except percentages | 2021 | 2020 | 2019 | 2021 | 2020 | 2019 | 2021 | 2020 | 2019 | 2021 | 2020 | 2019 | 2021 | 2020 | 2019 | ||||||||||||||||||||||||||||||||||||||||||||
| Bridgeland | |||||||||||||||||||||||||||||||||||||||||||||||||||||||||||
| Single family | $ | 73,999 | $ | 74,180 | $ | 61,320 | 158.1 | 169.1 | 150.3 | 782 | 856 | 773 | $ | 468 | $ | 439 | $ | 408 | $ | 95 | $ | 87 | $ | 79 | |||||||||||||||||||||||||||||||||||
| Change | (181) | 12,860 | (11.0) | 18.8 | (74) | 83 | 29 | 31 | 8 | 8 | |||||||||||||||||||||||||||||||||||||||||||||||||
| % Change | (0.2) | % | 21.0 | % | (6.5) | % | 12.5 | % | (8.6) | % | 10.7 | % | 6.6 | % | 7.6 | % | 9.2 | % | 10.1 | % | |||||||||||||||||||||||||||||||||||||||
| Summerlin | |||||||||||||||||||||||||||||||||||||||||||||||||||||||||||
| Superpad sites | 203,855 | 89,461 | 204,647 | 310.9 | 121.2 | 315.9 | 1,286 | 593 | 1,862 | 656 | 738 | 648 | 159 | 151 | 110 | ||||||||||||||||||||||||||||||||||||||||||||
| Custom lots | 22,270 | 8,563 | 5,952 | 11.7 | 5.7 | 3.5 | 15 | 14 | 8 | 1,903 | 1,502 | 1,701 | 1,485 | 612 | 744 | ||||||||||||||||||||||||||||||||||||||||||||
| Total | 226,125 | 98,024 | 210,599 | 322.6 | 126.9 | 319.4 | 1,301 | 607 | 1,870 | 701 | 772 | 659 | 174 | 161 | 113 | ||||||||||||||||||||||||||||||||||||||||||||
| Change | 128,101 | (112,575) | 195.7 | (192.5) | 694 | (1,263) | (71) | 113 | 13 | 48 | |||||||||||||||||||||||||||||||||||||||||||||||||
| % Change | 130.7 | % | (53.5) | % | 154.2 | % | (60.3) | % | 114.3 | % | (67.5) | % | (9.2) | % | 17.1 | % | 8.1 | % | 42.5 | % | |||||||||||||||||||||||||||||||||||||||
| The Woodlands | |||||||||||||||||||||||||||||||||||||||||||||||||||||||||||
| Single family | 2,412 | 26,290 | 39,246 | 3.9 | 24.5 | 57.0 | 16 | 112 | 240 | 618 | 1,073 | 689 | 151 | 235 | 164 | ||||||||||||||||||||||||||||||||||||||||||||
| Superpad sites | — | — | 3,600 | — | — | 3.9 | — | — | 30 | — | — | 923 | — | — | 120 | ||||||||||||||||||||||||||||||||||||||||||||
| Total | 2,412 | 26,290 | 42,846 | 3.9 | 24.5 | 60.9 | 16 | 112 | 270 | 618 | 1,073 | 704 | 151 | 235 | 159 | ||||||||||||||||||||||||||||||||||||||||||||
| Change | (23,878) | (16,556) | (20.6) | (36.4) | (96) | (158) | (455) | 369 | (84) | 76 | |||||||||||||||||||||||||||||||||||||||||||||||||
| % Change | (90.8) | % | (38.6) | % | (84.1) | % | (59.8) | % | (85.7) | % | (58.5) | % | (42.4) | % | 52.4 | % | (35.7) | % | 47.8 | % | |||||||||||||||||||||||||||||||||||||||
| The Woodlands Hills | |||||||||||||||||||||||||||||||||||||||||||||||||||||||||||
| Single family | 26,956 | 17,378 | 11,107 | 80.1 | 56.1 | 40.2 | 402 | 280 | 171 | 337 | 310 | 276 | 67 | 62 | 65 | ||||||||||||||||||||||||||||||||||||||||||||
| Change | 9,578 | 6,271 | 24.0 | 15.9 | 122 | 109 | 27 | 34 | 5 | (3) | |||||||||||||||||||||||||||||||||||||||||||||||||
| % Change | 55.1 | % | 56.5 | % | 42.8 | % | 39.6 | % | 43.6 | % | 63.7 | % | 8.7 | % | 12.3 | % | 8.1 | % | (4.6) | % | |||||||||||||||||||||||||||||||||||||||
| Total residential land sales closed (a) | $ | 329,492 | $ | 215,872 | $ | 325,872 | 564.7 | 376.6 | 570.8 | 2,501 | 1,855 | 3,084 | |||||||||||||||||||||||||||||||||||||||||||||||
(a)Excludes revenues closed and deferred for recognition in a previous period that met criteria for recognition in the current period. Please see the Reconciliation of MPC Land Sales Closed to GAAP Land Sales Revenue table below which reconciles Total residential and commercial land sales closed to Land sales revenue for the years ended December 31, 2021, 2020 and 2019.
| Summary of Commercial MPC Land Sales Closed | |||||||||||||||||||||||||||||||||||||||||||||||||||||
| Land Sales | Acres Sold | Price Per Acre | |||||||||||||||||||||||||||||||||||||||||||||||||||
| thousands except percentages | 2021 | 2020 | 2019 | 2021 | 2020 | 2019 | 2021 | 2020 | 2019 | ||||||||||||||||||||||||||||||||||||||||||||
| Bridgeland | |||||||||||||||||||||||||||||||||||||||||||||||||||||
| Commercial | $ | — | $ | — | $ | — | — | — | — | $ | — | $ | — | $ | — | ||||||||||||||||||||||||||||||||||||||
| Institutional | 9,335 | 2,164 | — | 58.1 | 16.6 | — | 161 | 130 | — | ||||||||||||||||||||||||||||||||||||||||||||
| Total | 9,335 | 2,164 | — | 58.1 | 16.6 | — | 161 | 130 | — | ||||||||||||||||||||||||||||||||||||||||||||
| Change | 7,171 | 2,164 | 41.5 | 16.6 | 31 | 130 | |||||||||||||||||||||||||||||||||||||||||||||||
| % Change | 331.4 | % | — | % | 250 | % | — | % | 23.8 | % | — | % | |||||||||||||||||||||||||||||||||||||||||
| Summerlin | |||||||||||||||||||||||||||||||||||||||||||||||||||||
| Commercial | 4,250 | — | — | 6.3 | — | — | 675 | — | — | ||||||||||||||||||||||||||||||||||||||||||||
| Institutional | — | — | — | — | — | — | — | — | — | ||||||||||||||||||||||||||||||||||||||||||||
| Total | 4,250 | — | — | 6.3 | — | — | 675 | — | — | ||||||||||||||||||||||||||||||||||||||||||||
| Change | 4,250 | — | 6.3 | — | 675 | — | |||||||||||||||||||||||||||||||||||||||||||||||
| % Change | — | % | — | % | — | % | — | % | — | % | — | % | |||||||||||||||||||||||||||||||||||||||||
| The Woodlands | |||||||||||||||||||||||||||||||||||||||||||||||||||||
| Commercial | 2,694 | — | — | 1.6 | — | — | 1,684 | — | — | ||||||||||||||||||||||||||||||||||||||||||||
| Institutional | 827 | — | — | 1.5 | — | — | 551 | — | — | ||||||||||||||||||||||||||||||||||||||||||||
| Total | 3,521 | — | — | 3.1 | — | — | 1,136 | — | — | ||||||||||||||||||||||||||||||||||||||||||||
| Change | 3,521 | — | 3.1 | — | 1,136 | — | |||||||||||||||||||||||||||||||||||||||||||||||
| % Change | — | % | — | % | — | % | — | % | — | % | — | % | |||||||||||||||||||||||||||||||||||||||||
| Total commercial land sales closed (a) | $ | 17,106 | $ | 2,164 | $ | — | 67.5 | 16.6 | — | ||||||||||||||||||||||||||||||||||||||||||||
(a)Excludes revenues closed and deferred for recognition in a previous period that met criteria for recognition in the current period. Please see the Reconciliation of MPC Land Sales Closed to GAAP Land Sales Revenue table below which reconciles Total residential and commercial land sales closed to Land sales for the years ended December 31, 2021, 2020 and 2019.
Although our business does not involve the sale or resale of homes, we believe that net new home sales are an important indicator of future demand for our superpad sites and finished lots. Therefore, we use this statistic where relevant in our discussion of MPC operating results herein. Net new home sales reflect home sales made by homebuilders, less cancellations. Cancellations generally occur when a homebuyer signs a contract to purchase a home but later fails to qualify for a home mortgage or is unable to provide an adequate down payment to complete the home sale.
HHC 2021 FORM 10-K | 55
MANAGEMENT’S DISCUSSION AND ANALYSIS RESULTS OF OPERATIONS | |||||
| Net New Home Sales | Median Home Sales Price | ||||||||||||||||||||||||||||||||||
| thousands except percentages | 2021 | 2020 | 2019 | 2021 | 2020 | 2019 | |||||||||||||||||||||||||||||
| Bridgeland | 713 | 873 | 739 | $ 463 | $ 372 | $ 371 | |||||||||||||||||||||||||||||
| Change | (160) | 134 | 91 | 1 | |||||||||||||||||||||||||||||||
| % Change | (18.3)% | 18.1% | 24.5% | 0.3% | |||||||||||||||||||||||||||||||
| Summerlin | 1,578 | 1,397 | 1,292 | 628 | 565 | 578 | |||||||||||||||||||||||||||||
| Change | 181 | 105 | 63 | (13) | |||||||||||||||||||||||||||||||
| % Change | 13.0% | 8.1% | 11.2% | (2.2)% | |||||||||||||||||||||||||||||||
| The Woodlands | 144 | 236 | 319 | 750 | 614 | 525 | |||||||||||||||||||||||||||||
| Change | (92) | (83) | 136 | 89 | |||||||||||||||||||||||||||||||
| % Change | (39.0)% | (26.0)% | 22.1% | 17.0% | |||||||||||||||||||||||||||||||
| The Woodlands Hills | 326 | 218 | 121 | 368 | 316 | 297 | |||||||||||||||||||||||||||||
| Change | 108 | 97 | 52 | 19 | |||||||||||||||||||||||||||||||
| % Change | 49.5% | 80.2% | 16.5% | 6.4% | |||||||||||||||||||||||||||||||
Reconciliation of MPC Land Sales Closed to GAAP Land Sales Revenue The following table reconciles Total residential and commercial land sales closed in the years ended December 31, 2021, 2020 and 2019 to Land sales revenue for the respective periods. Total net recognized (deferred) revenue includes revenues recognized in the current period which are related to sales closed in prior periods, offset by revenues deferred on sales closed in the current period.
| thousands | 2021 | 2020 | 2019 | ||||||||||||||
| Total residential land sales closed in period | $ | 329,492 | $ | 215,872 | $ | 325,872 | |||||||||||
| Total commercial land sales closed in period | 17,106 | 2,164 | — | ||||||||||||||
| Net recognized (deferred) revenue: | |||||||||||||||||
| Bridgeland | (8,174) | (305) | 81 | ||||||||||||||
| Summerlin | (1,568) | 5,019 | (19,290) | ||||||||||||||
| Total net recognized (deferred) revenue | (9,742) | 4,714 | (19,209) | ||||||||||||||
| Special Improvement District revenue | 9,361 | 10,294 | 23,483 | ||||||||||||||
| Land sales | $ | 346,217 | $ | 233,044 | $ | 330,146 | |||||||||||
Population growth, coupled with low mortgage interest rates, have led to continued demand for new homes in the Summerlin and Houston markets. Summerlin was ranked the third highest selling master planned community in the nation and also recognized as the “Best Selling MPC in Las Vegas” by RCLCO for 2021. Bridgeland was ranked the fifteenth highest selling master planned community in the nation and also recognized as the second highest selling master planned community in Texas by RCLCO for 2021. We expect demand to continue as home sales in high quality suburban communities continue to grow in 2022.
MPC Net Contribution In addition to MPC segment EBT, MPC Net Contribution is a non-GAAP financial measure derived from EBT, adjusted for certain items as discussed below. Management uses this measure because it captures current period performance through the velocity of sales, as well as current period development expenditures based upon demand at our MPCs, which varies depending upon the stage of the MPCs development lifecycle, and the overall economic environment. MPC Net Contribution is defined as MPC segment EBT, plus MPC cost of sales, Depreciation and amortization, and net collections from SID bonds and MUD receivables, reduced by MPC development expenditures, land acquisitions and Equity in earnings from real estate and other affiliates, net of distributions. MPC Net Contribution is a non-GAAP operational metric and should not be used to measure operating performance of the MPC assets as a substitute for GAAP measures of such performance nor should it be used as a comparison metric with other comparable businesses. A reconciliation of segment EBT to MPC Net Contribution is presented below.
HHC 2021 FORM 10-K | 56
MANAGEMENT’S DISCUSSION AND ANALYSIS RESULTS OF OPERATIONS | |||||
The following table sets forth the MPC Net Contribution for the years ended December 31:
| 2021-2020 | 2020-2019 | ||||||||||||||||||||||||||||
| thousands | 2021 | 2020 | 2019 | Change | Change | ||||||||||||||||||||||||
| MPC segment EBT (a) | $ | 316,607 | $ | 209,423 | $ | 263,841 | $ | 107,184 | $ | (54,418) | |||||||||||||||||||
| Plus: | |||||||||||||||||||||||||||||
| Cost of sales - land | 153,630 | 101,505 | 141,852 | 52,125 | (40,347) | ||||||||||||||||||||||||
| Depreciation and amortization | 366 | 365 | 424 | 1 | (59) | ||||||||||||||||||||||||
| MUD and SID bonds collections, net (b) | 46,460 | 51,247 | 24,047 | (4,787) | 27,200 | ||||||||||||||||||||||||
| Distributions from real estate and other affiliates | 114,172 | 6,000 | 16,051 | 108,172 | (10,051) | ||||||||||||||||||||||||
| Less: | |||||||||||||||||||||||||||||
| MPC development expenditures | (322,255) | (229,065) | (238,951) | (93,190) | 9,886 | ||||||||||||||||||||||||
| MPC land acquisitions | (574,253) | — | (752) | (574,253) | 752 | ||||||||||||||||||||||||
| Equity in (earnings) losses from real estate and other affiliates | (59,399) | (17,845) | (28,336) | (41,554) | 10,491 | ||||||||||||||||||||||||
| MPC Net Contribution | $ | (324,672) | $ | 121,630 | $ | 178,176 | $ | (446,302) | $ | (56,546) | |||||||||||||||||||
(a)For a detailed breakdown of our MPC segment EBT, refer to Note 18 - Segments in the Notes to Consolidated Financial Statements under Item 8 of this Form 10-K.
(b)SID collections are shown net of SID transfers to buyers in the respective periods.
MPC Net contribution decreased for the year ended December 31, 2021, primarily due to MPC land acquisitions related to Douglas Ranch. Excluding the acquisition of Douglas Ranch, MPC Net Contribution increased primarily due to the land sales increase explained in the EBT section above, as well as Distributions from real estate and other affiliates, partially offset by lower MUD and SID bond collections, net and higher MPC development expenditures. MPC Net Contribution decreased for the year ended December 31, 2020, primarily due to the land sales changes explained in the EBT section above, partially offset by higher MUD and SID bonds collections, net and lower MPC development expenditures.
The following table sets forth MPC land inventory activity for 2020 and 2021:
| thousands | Bridgeland | Columbia | Douglas Ranch | Summerlin | The Woodlands | The Woodlands Hills | Total MPC | ||||||||||||||||||||||||||||||||||
| Balance December 31, 2019 | $ | 487,314 | $ | 16,643 | $ | — | $ | 845,440 | $ | 186,773 | $ | 119,504 | $ | 1,655,674 | |||||||||||||||||||||||||||
| Development expenditures (a) | 106,839 | — | — | 100,177 | 6,148 | 15,901 | 229,065 | ||||||||||||||||||||||||||||||||||
| MPC Cost of sales | (24,790) | — | — | (55,100) | (15,011) | (6,604) | (101,505) | ||||||||||||||||||||||||||||||||||
| MUD reimbursable costs (b) | (72,539) | — | — | — | (377) | (10,379) | (83,295) | ||||||||||||||||||||||||||||||||||
| Transfer to Strategic Developments | (1,511) | — | — | — | — | — | (1,511) | ||||||||||||||||||||||||||||||||||
| Other (c) | (8,446) | (18) | — | (1,563) | (192) | (690) | (10,909) | ||||||||||||||||||||||||||||||||||
| Balance December 31, 2020 | 486,867 | 16,625 | — | 888,954 | 177,341 | 117,732 | 1,687,519 | ||||||||||||||||||||||||||||||||||
| Acquisitions | — | — | 569,541 | — | 4,712 | — | 574,253 | ||||||||||||||||||||||||||||||||||
| Development expenditures (a) | 142,556 | — | — | 156,433 | 5,448 | 17,818 | 322,255 | ||||||||||||||||||||||||||||||||||
| MPC Cost of sales | (20,235) | — | — | (120,578) | (2,035) | (10,782) | (153,630) | ||||||||||||||||||||||||||||||||||
| MUD reimbursable costs (b) | (102,563) | — | — | — | (248) | (9,604) | (112,415) | ||||||||||||||||||||||||||||||||||
| Transfer to Strategic Developments | (1,617) | — | — | (1,700) | (892) | — | (4,209) | ||||||||||||||||||||||||||||||||||
| Investment in real estate and other affiliates | — | — | (59,000) | — | — | — | (59,000) | ||||||||||||||||||||||||||||||||||
| Other (c) | 15,145 | — | — | 8,615 | 3,092 | 1,143 | 27,995 | ||||||||||||||||||||||||||||||||||
| Balance December 31, 2021 | $ | 520,153 | $ | 16,625 | $ | 510,541 | $ | 931,724 | $ | 187,418 | $ | 116,307 | $ | 2,282,768 | |||||||||||||||||||||||||||
(a)Development expenditures are inclusive of capitalized interest and property taxes.
(b)MUD reimbursable costs represent land development expenditures transferred to MUD Receivables.
(c)Primarily consists of changes in development expenditures payable.
HHC 2021 FORM 10-K | 57
MANAGEMENT’S DISCUSSION AND ANALYSIS RESULTS OF OPERATIONS | |||||
| Seaport | ||
The Seaport is part non-stabilized operating asset, part development project and part operating business. As such, the Seaport has a greater range of possible outcomes than our other projects. The greater uncertainty is largely the result of: (i) seasonality; (ii) potential sponsorship revenue; (iii) potential event revenue; and (iv) business operating risks from various start-up businesses. We operate and own, either directly, through license agreements or in joint ventures, many of the tenants in the Seaport, including retail stores and restaurants such as The Fulton by Jean-Georges, Ssäm Bar (formerly Bar Wayō), Malibu Farm, two concepts by Andrew Carmellini, Mister Dips and Carne Mare, The Greens at Pier 17 and the marketplace operated by Jean-Georges. As a result, the revenues and expenses of these businesses, as well as the underlying market conditions affecting these types of businesses, will directly impact the NOI of the Seaport. This is in contrast to our other retail properties where we primarily receive lease payments and are not as directly impacted by the operating performance of the underlying businesses. This causes the financial results and eventual stabilized yield of the Seaport to be less predictable than our other operating real estate assets with traditional lease structures. Further, as we open new operating businesses, either owned entirely or in partnership with third parties, we expect to incur pre-opening expenses and operating losses until those businesses stabilize, which likely will not happen until the Seaport reaches its critical mass of offerings. As a result of impacts related to COVID-19, there were delays in construction on the Tin Building; however, construction on the core and shell was completed as of the December 31, 2021. The Tin Building is expected to open in the first half of 2022, with an expanded focus on experiences including in-person dining, retail shopping, mobile ordering and delivery. Given the factors and uncertainties listed above combined with the continued impacts related to COVID-19, we do not currently provide guidance on our expected NOI yield and stabilization date for the Seaport. As we move closer to opening a critical mass of offerings at the Seaport, we will re-establish goals for yield on costs and stabilization dates when the uncertainties and range of possible outcomes are clearer.
We primarily categorize the businesses in the Seaport segment into three groups: landlord operations, managed businesses, and events and sponsorships. Landlord operations represent physical real estate we have developed and own, and is inclusive of our office, retail and multi-family properties.
Managed businesses represent retail and food and beverage businesses that HHC owns, either wholly or through partnerships with third parties, and operates, including license and management agreements. Our managed businesses include, among others, The Fulton, Cobble & Co., Mister Dips, Carne Mare, Malibu Farm and Ssäm Bar (formerly Bar Wayō). The Fulton, Cobble & Co. and Malibu Farm are managed by Creative Culinary Management Company, LLC, a Jean-Georges company, and Mister Dips and Carne Mare are managed by Seaport F&B LLC , an Andrew Carmellini company. These third party management companies are responsible for employment and supervision of all employees providing services for the food and beverage operations and restaurant as well as day-to-day operations and accounting for food and beverage operations.
In the summer of 2022, we plan to expand our managed business portfolio with the launch of The Lawn Club, a new concept that will transform 20,000 square feet of the Fulton Market Building into an immersive indoor and outdoor experience that includes an extensive indoor grass area, a stylish clubhouse bar and a wide variety of lawn games. We also expect to launch a new restaurant concept by Josh Eden and Wylie Dufresne at 1 Fulton Street featuring an all-day menu with many specialty to-go items and an expansive outdoor café in the summer of 2022.
Our events and sponsorship businesses include our concert series, an outdoor socially distanced space rental and dining concept at the Pier 17 rooftop called The Greens, event catering, private events and sponsorships. Food and beverage operations associated with The Greens, concert concessions and catering are operated under management agreements with Creative culinary. The Greens concept replaced the cancelled 2020 summer concert series and the Winterland skating and bar and continued through the end of the first quarter of 2021. The Greens concept returned in May 2021 to complement the 2021 summer concert series, which began in July 2021 and ran through mid-October 2021. During the 11-week concert season, Pier 17 hosted over 30 concerts, of which 20 were sold out. In total, approximately 74,000 guests attended the concert series, representing 90% of available ticket inventory. The Greens winter dining cabins returned in November 2021.
HHC 2021 FORM 10-K | 58
MANAGEMENT’S DISCUSSION AND ANALYSIS RESULTS OF OPERATIONS | |||||
Segment EBT The following table presents segment EBT for the Seaport for the years ended December 31:
| 2021-2020 | 2020-2019 | ||||||||||||||||||||||||||||
| thousands | 2021 | 2020 | 2019 | Change | Change | ||||||||||||||||||||||||
| Rental Revenue | $ | 7,901 | $ | 6,894 | $ | 8,582 | $ | 1,007 | $ | (1,688) | |||||||||||||||||||
| Other land, rental and property revenues | 47,107 | 16,920 | 47,063 | 30,187 | (30,143) | ||||||||||||||||||||||||
| Total revenues | 55,008 | 23,814 | 55,645 | 31,194 | (31,831) | ||||||||||||||||||||||||
| Operating costs | (75,721) | (44,515) | (76,527) | (31,206) | 32,012 | ||||||||||||||||||||||||
| Rental property real estate taxes | (1,322) | (1,452) | (1,366) | 130 | (86) | ||||||||||||||||||||||||
| (Provision for) recovery of doubtful accounts | (155) | (145) | 21 | (10) | (166) | ||||||||||||||||||||||||
| Total operating expenses | (77,198) | (46,112) | (77,872) | (31,086) | 31,760 | ||||||||||||||||||||||||
| Segment operating income (loss) | (22,190) | (22,298) | (22,227) | 108 | (71) | ||||||||||||||||||||||||
| Depreciation and amortization | (30,867) | (41,602) | (26,381) | 10,735 | (15,221) | ||||||||||||||||||||||||
| Interest income (expense), net | 357 | (12,512) | (12,865) | 12,869 | 353 | ||||||||||||||||||||||||
| Other income (loss), net | (3,730) | (2,616) | (22) | (1,114) | (2,594) | ||||||||||||||||||||||||
| Equity in earnings (losses) from real estate and other affiliates | (1,988) | (9,292) | (2,592) | 7,304 | (6,700) | ||||||||||||||||||||||||
| Gain (loss) on sale or disposal of real estate and other assets, net | — | — | (6) | — | 6 | ||||||||||||||||||||||||
| Gain (loss) on extinguishment of debt | — | (11,648) | 4,851 | 11,648 | (16,499) | ||||||||||||||||||||||||
| Segment EBT | $ | (58,418) | $ | (99,968) | $ | (59,242) | $ | 41,550 | $ | (40,726) | |||||||||||||||||||
For the year ended December 31, 2021:
Seaport segment EBT loss decreased $41.6 million compared to the prior year period primarily due to the following:
–loss on extinguishment of debt and decrease in interest expense due to the early repayment of the $250 million Seaport loan in August 2020
–charges in the first quarter of 2020 related to write-offs of building improvements recorded within Depreciation and amortization and retail inventory recorded within Other income (loss), net due to the permanent closure of 10 Corso Como Retail and Café that did not reoccur in 2021
–$6.0 million impairment of the Company’s equity investment in Mr. C Seaport in the second quarter of 2020
–increase in segment revenues, offset by an increase in operating expenses, primarily as a result of increased activity in 2021 as business resumed after the onset of the COVID-19 pandemic
For the year ended December 31, 2020:
Seaport segment EBT loss increased $40.7 million compared to the prior year period primarily due to the following:
–write-offs of retail inventory totaling $3.1 million recorded within Other income (loss), net and building improvements and other assets totaling $14.1 million recorded within Depreciation and amortization due to permanent closure of 10 Corso Como Retail and Café during the first quarter of 2020
–$11.6 million loss on extinguishment of debt upon retirement of the $250 million Seaport loan in August 2020
–$6.0 million impairment of the Company’s equity investment in Mr. C Seaport. Refer to Note 4 - Impairment in the Notes to Consolidated Financial Statements under Item 8 of this Form 10-K for further details.
–decreases in segment revenues were offset by decreases in segment operating expenses primarily as a result of business closures and cancellations of events related to the COVID-19 pandemic
–partially offset by a $1.6 million increase in Other income (loss), net due to liquidation sales of 10 Corso Como Retail inventory
HHC 2021 FORM 10-K | 59
MANAGEMENT’S DISCUSSION AND ANALYSIS RESULTS OF OPERATIONS | |||||
Net Operating Income A reconciliation of Seaport segment EBT to Seaport NOI is presented below:
| Seaport NOI | 2021-2020 | 2020-2019 | |||||||||||||||||||||||||||
| thousands | 2021 | 2020 | 2019 | Change | Change | ||||||||||||||||||||||||
| Total Seaport segment EBT | $ | (58,418) | $ | (99,968) | $ | (59,242) | $ | 41,550 | $ | (40,726) | |||||||||||||||||||
| Add back: | |||||||||||||||||||||||||||||
| Depreciation and amortization | 30,867 | 41,602 | 26,381 | (10,735) | 15,221 | ||||||||||||||||||||||||
| Interest (income) expense, net | (357) | 12,512 | 12,865 | (12,869) | (353) | ||||||||||||||||||||||||
| Equity in (earnings) losses from real estate and other affiliates | 1,988 | 9,292 | 2,592 | (7,304) | 6,700 | ||||||||||||||||||||||||
| (Gain) loss on sale or disposal of real estate and other assets, net | — | — | 6 | — | (6) | ||||||||||||||||||||||||
| (Gain) loss on extinguishment of debt | — | 11,648 | (4,851) | (11,648) | 16,499 | ||||||||||||||||||||||||
| Impact of straight-line rent | 1,632 | 2,801 | 1,634 | (1,169) | 1,167 | ||||||||||||||||||||||||
| Other (income) loss, net (a) | 6,725 | 5,639 | 5,595 | 1,086 | 44 | ||||||||||||||||||||||||
| Seaport NOI | $ | (17,563) | $ | (16,474) | $ | (15,020) | $ | (1,089) | $ | (1,454) | |||||||||||||||||||
(a)Includes miscellaneous development-related items as well as the loss related to the write-off of inventory due to the permanent closure of 10 Corso Como Retail and Café in the first quarter of 2020, and income related to inventory liquidation sales in the third quarter of 2020.
Including managed businesses, events, sponsorships, catering and the Tin Building, the Seaport is approximately 60% leased. We may continue to incur operating expenses in excess of rental revenues while the remaining available space is in lease-up. We expect to incur operating losses for our Seaport operations until the economy recovers from the economic impact of the COVID-19 pandemic and the Seaport reaches its critical mass of offerings.
The below table presents Seaport NOI by category:
| Seaport NOI by Category | 2021-2020 | 2020-2019 | |||||||||||||||||||||||||||
| thousands | 2021 | 2020 | 2019 | Change | Change | ||||||||||||||||||||||||
| Landlord Operations - Historic District & Pier 17 | $ | (15,027) | $ | (8,526) | $ | (8,147) | $ | (6,501) | $ | (379) | |||||||||||||||||||
| Multi-family | (5) | 290 | 394 | (295) | (104) | ||||||||||||||||||||||||
| Hospitality | — | (12) | 41 | 12 | (53) | ||||||||||||||||||||||||
| Managed Businesses - Historic District & Pier 17 | (1,057) | (5,638) | (7,172) | 4,581 | 1,534 | ||||||||||||||||||||||||
| Events, Sponsorships & Catering Business | (1,474) | (2,588) | (136) | 1,114 | (2,452) | ||||||||||||||||||||||||
| Seaport NOI | $ | (17,563) | $ | (16,474) | $ | (15,020) | $ | (1,089) | $ | (1,454) | |||||||||||||||||||
Landlord Operations NOI decreased for the year ended December 31, 2021, compared to 2020, primarily due to increased operating expenses as business resumed after the onset of the COVID-19 pandemic, including new tenants and a full year of activations in event space, as well as increased marketing expenses related to a brand overhaul for the Seaport in 2021. As a portion of our leased space is occupied by tenant businesses we own and operate, revenue from these tenants is eliminated in consolidation and operating losses related to Landlord Operations are expected to continue until occupancy stabilizes.
Managed Business and Events, Sponsorships and Catering Business NOI increased for the year ended December 31, 2021, compared to 2020, primarily due to increased revenues, partially offset by increased operating expense related to the reopening of businesses following the COVID-19 pandemic; the launch of new restaurant concepts in 2021 including Mister Dips, Carne Mare and the reopening of the Ssäm Bar; as well as the reintroduction of the Seaport Summer Concert Series.
Seaport NOI decreased for the year ended December 31, 2020, compared to 2019, primarily as a result of business closures and cancellations of events related to the COVID-19 pandemic.
The following describes the status of our major construction projects at the Seaport as of December 31, 2021:
Tin Building In January 2017, we executed a ground lease amendment with the City of New York, incorporating the Tin Building into our leased premises and modifying other related provisions. The project includes construction of a turn-key, interior fit-out for the marketplace space, leased by a joint venture with Jean-Georges Vongerichten, which will feature a variety of fresh specialty foods, seafood, exceptional dining experiences and other products. We have completed the reconstruction of the platform pier where the Tin Building previously stood and restoration of the building is well under way. As a result of impacts related to COVID-19, there were delays in construction on the Tin Building, however construction of the core and shell was completed as of December 31, 2021, and it is expected to open in the first half of 2022, with an expanded focus on in-person dining, retail shopping, mobile ordering and delivery.
HHC 2021 FORM 10-K | 60
MANAGEMENT’S DISCUSSION AND ANALYSIS RESULTS OF OPERATIONS | |||||
250 Water Street We acquired 250 Water Street in the second quarter of 2018. This one-acre site, currently used as a parking lot, is at the entrance of the Seaport and encompasses a full city block bounded by Peck Slip, Pearl Street, Water Street and Beekman Street. In October 2020, we announced our comprehensive proposal for the redevelopment of 250 Water Street, which includes the transformation of this underutilized full-block surface parking lot into a mixed-use development that would include affordable and market rate apartments, community-oriented spaces and office space. This project, which includes approximately 547,000 zoning square feet, presents a unique opportunity at the Seaport to redevelop this site into a vibrant mixed-use asset, provide long-term viability to the South Street Seaport Museum and deliver much-needed affordable housing and economic stimulus to the area. In May 2021, we received approval from the New York City Landmarks Preservation Commission (LPC) on our proposed design for the 250 Water Street and in September 2021, the New York State Supreme Court dismissed on procedural grounds a lawsuit challenging the LPC approval. We received final approvals in December 2021 through the New York City Uniform Land Use Review Procedure known as ULURP, which will allow the necessary transfer of development rights to the parking lot site. Also in December 2021, an amendment to the Seaport ground lease was executed giving the Company extension options, at the discretion of the Company, for an additional 48 years from its current expiration in 2072 until 2120. We expect to begin comprehensive remediation of the site through the New York State Brownfield Cleanup program and break ground on the development in 2022. In February 2022, an additional lawsuit was filed challenging the land use approvals previously granted to the Company under the ULURP for the redevelopment and construction of 250 Water Street. The Company intends to vigorously contest the matter as it believes that these claims are without merit.
| Strategic Developments | ||
Our Strategic Developments assets generally require substantial future development to maximize their value. Other than our condominium properties, most of the properties and projects in this segment do not generate revenues. Our expenses relating to these assets are primarily related to costs associated with constructing the assets, selling condominiums, marketing costs associated with our Strategic Developments, carrying costs including, but not limited to, property taxes and insurance and other ongoing costs relating to maintaining the assets in their current condition. If we decide to redevelop or develop a Strategic Developments asset, we would expect that with the exception of the residential portion of our condominium projects, upon completion of development, the asset would likely be reclassified to Operating Assets when the asset is placed in service and NOI would become a meaningful measure of its operating performance. All development costs discussed herein are exclusive of land costs.
Segment EBT The following table presents segment EBT for Strategic Developments for the years ended December 31:
| Strategic Developments Segment EBT | 2021-2020 | 2020-2019 | |||||||||||||||||||||||||||
| thousands | 2021 | 2020 | 2019 | Change | Change | ||||||||||||||||||||||||
| Rental Revenue | $ | 319 | $ | 446 | $ | 832 | $ | (127) | $ | (386) | |||||||||||||||||||
| Condominium rights and unit sales | 514,597 | 1,143 | 448,940 | 513,454 | (447,797) | ||||||||||||||||||||||||
| Other land, rental and property revenues | 5,193 | 17,818 | 8,176 | (12,625) | 9,642 | ||||||||||||||||||||||||
| Total revenues | 520,109 | 19,407 | 457,948 | 500,702 | (438,541) | ||||||||||||||||||||||||
| Condominium rights and unit cost of sales | (414,199) | (108,229) | (369,759) | (305,970) | 261,530 | ||||||||||||||||||||||||
| Operating costs | (19,063) | (21,307) | (19,172) | 2,244 | (2,135) | ||||||||||||||||||||||||
| Real estate taxes | (3,415) | (5,624) | (2,932) | 2,209 | (2,692) | ||||||||||||||||||||||||
| (Provision for) recovery of doubtful accounts | (21) | — | 15 | (21) | (15) | ||||||||||||||||||||||||
| Total operating expenses | (436,698) | (135,160) | (391,848) | (301,538) | 256,688 | ||||||||||||||||||||||||
| Segment operating income (loss) | 83,411 | (115,753) | 66,100 | 199,164 | (181,853) | ||||||||||||||||||||||||
| Depreciation and amortization | (6,512) | (6,545) | (5,473) | 33 | (1,072) | ||||||||||||||||||||||||
| Interest income (expense), net | 3,701 | 6,312 | 11,321 | (2,611) | (5,009) | ||||||||||||||||||||||||
| Other income (loss), net | 2,536 | 2,165 | 831 | 371 | 1,334 | ||||||||||||||||||||||||
| Equity in earnings (losses) from real estate and other affiliates | (221) | 269,912 | 1,213 | (270,133) | 268,699 | ||||||||||||||||||||||||
| Gain (loss) on sale or disposal of real estate and other assets, net | 13,911 | 21,710 | 27,119 | (7,799) | (5,409) | ||||||||||||||||||||||||
| Provision for impairment | (13,068) | — | — | (13,068) | — | ||||||||||||||||||||||||
| Segment EBT | $ | 83,758 | $ | 177,801 | $ | 101,111 | $ | (94,043) | $ | 76,690 | |||||||||||||||||||
HHC 2021 FORM 10-K | 61
MANAGEMENT’S DISCUSSION AND ANALYSIS RESULTS OF OPERATIONS | |||||
For the year ended December 31, 2021:
Strategic segment EBT decreased $94.0 million compared to the prior year period primarily due to the following:
–decrease in Equity in earnings (losses) from real estate and other affiliates primarily due to a $267.5 million gain on deconsolidation of 110 North Wacker attributable to the initial fair value step-up of the retained equity method investment at the time of deconsolidation in the third quarter of 2020. Please refer to Note 2 - Investments in Real Estate and Other Affiliates in the Notes to Consolidated Financial Statements under Item 8 of this Form 10-K for further details.
–decrease in Other land, rental and property revenues primarily due to the recognition of $15.4 million of previously eliminated 110 North Wacker development fees upon deconsolidation in the third quarter of 2020
–increase in Provision of impairment of $13.1 million due to an impairment of Century Park in the second quarter of 2021. Century Park was subsequently sold in the fourth quarter of 2021. Refer to Note 3 - Acquisitions and Dispositions and Note 4 - Impairment in the Notes to Consolidated Financial Statements under Item 8 of this Form 10-K for additional information.
–decrease in Gain (loss) on sale or disposal of real estate and other assets, net of $7.8 million driven by 2021 activity that included a loss of $7.4 million related to the sale of Century Park and a gain of $21.3 million related to the sale of Monarch City, compared to 2020 activity that included a gain of $13.7 million related to the sale of Elk Grove and the receipt of an $8.0 million termination payment related to the 2019 sale of West Windsor.
These decreases in EBT were partially offset by the following:
–increase in net condominium sales (condominium unit sales net of condominium cost of sales) of $121.4 million driven by the timing of condominium closings. The Company closed on 670 units during the year ended December 31, 2021, including 663 units at ‘A‘ali‘i which completed construction during the fourth quarter of 2021, 5 units at Waiea and the final 2 units at Anaha, compared to zero condominium units closed during the year ended December 31, 2020, due to significantly lower available inventory as no new condominium towers were scheduled for completion in 2020.
–decrease in Condominium right and unit cost of sales primarily driven by charges related to our expected funding of costs to correct alleged construction defects as Waiea. An additional $21.0 million was charged during the year ended December 31, 2021, related to additional anticipated costs, compared to charges of $99.2 million during the year ended December 31, 2020. Refer to Note 10 - Commitments and Contingencies in the Notes to Consolidated Financial Statements under Item 8 of this Form 10-K for additional information.
For the year ended December 31, 2020:
Strategic District segment EBT increased $76.7 million compared to the prior year period primarily due to the following:
–increase in Equity in earnings (losses) from real estate and other affiliates of $267.5 million due to a gain on deconsolidation of 110 North Wacker attributable to the initial fair value step-up of the retained equity method investment at the time of deconsolidation in the third quarter of 2020.
–increase in Other land, rental and property revenues primarily due to the recognition of $15.4 million of previously eliminated 110 North Wacker development fees upon deconsolidation in the third quarter of 2020.
These increases were partially offset by the following:
–increase in Condominium rights and unit cost of sales primarily driven by a $99.2 million charge in the first quarter of 2020, related to our expected funding of costs to correct alleged construction defects at Waiea.
–decrease in net condominium sales of $78.4 million driven by the timing of condominium closings. The Company closed on 596 units in 2019, primarily at Ke Kilohana and Ae’o, with zero closings and no new condominium towers scheduled for completion in 2020.
–increase in Condominium rights and unit cost of sales of $7.6 million driven by a reduction in the estimated net sales price of certain condominium units, including the remaining penthouse inventory, to better align the expected price with recently contracted final sales prices
–decrease in Gain (loss) on sale or disposal of real estate and other assets, net of $5.4 million as a result of 2020 activity that included the sale of Elk Grove and the receipt of a termination payment related to the 2019 sale of West Windsor, compared to 2019 activity related to the sales of Cottonwood Mall, West Windsor and Bridges at Mint Hill.
HHC 2021 FORM 10-K | 62
MANAGEMENT’S DISCUSSION AND ANALYSIS RESULTS OF OPERATIONS | |||||
Strategic Developments Projects The following describes the status of our major construction projects and announced Strategic Developments projects as of December 31, 2021. For information on the construction financings on our projects, please refer to Note 7 - Mortgages, Notes and Loans Payable, Net in the Notes to Consolidated Financial Statements under Item 8 of this Form 10-K for additional information.
Downtown Columbia Redevelopment District
We continued to execute on our redevelopment strategy in the Downtown Columbia Redevelopment District during 2021. The Master Plan and zoning for Downtown Columbia, as amended in 2017, allows for a total of approximately 14,000,000 square feet for all of Downtown Columbia and has densities for the future development of up to 6,200 residential units, 4,300,000 square feet of commercial office space, 1,300,000 square feet of retail space and 640 hotel rooms. The majority of the properties will be developed on raw land, surface parking lots and other assets controlled by us. Based on the Development Rights and Responsibilities Agreement, signed in 2018 with the County, the existing Master Plan, zoning and project approval process cannot be amended for a period of 30 years. Additionally, pursuant to a 2010 development agreement, we have a preferred residential and office development covenant that provides us the right of first offer for new development densities of both residential and office space within the Columbia Mall Ring Road. This covenant expires in 2030.
We are currently focusing on the redevelopment of the Merriweather and Lakefront Districts. At the Merriweather District, we began construction on Marlow, a 472-unit multi-family property, in the first quarter of 2021. At the Lakefront District, we received final approvals in 2019 for approximately 2,000,000 square feet of net new mixed-use development which will include office, retail and residential assets. We expect to begin construction on South Lake Medical Office Building, an 86,000 square foot office property, in the first quarter of 2022. This future development district also includes four acres of land related to Ridgley Building, Sterret Place and American City Building, all of which have been demolished.
Marlow Marlow will be a 472-unit multi-family property comprised of studio, one, two and three-bedroom units and approximately 32,000 square feet of new street level retail space. Total development costs are expected to be approximately $130.5 million, which will be partially financed with a $82.6 million construction loan that closed in April 2021. We began construction in the first quarter of 2021 and anticipate project completion in the first quarter of 2023. We expect to reach projected annual stabilized NOI of $9.3 million by 2026.
Bridgeland
Starling at Bridgeland Starling at Bridgeland is the second phase of multi-family development in Bridgeland. The project will be 358-unit, luxury development, situated on approximately 15.2 acres and will be comprised of one, two and three-bedroom units. Total development costs are expected to be approximately $60.6 million which will be partially financed with a $42.7 million construction loan that closed in April 2021. We began construction in the fourth quarter of 2020 and anticipate project completion in the second quarter of 2022. We expect to reach projected annual stabilized NOI of $4.4 million by 2025.
Summerlin
1700 Pavilion 1700 Pavilion will be a 267,000 square foot office property. Total development costs are expected to be approximately $121.5 million which will be partially financed with a $75.0 million construction loan that closed in September 2021. We began construction in the second quarter of 2021 and anticipate project completion in the fourth quarter of 2022. We expect to reach projected annual stabilized NOI of $8.4 million by 2025.
Tanager Echo Tanager Echo will be a 294 unit multi-family property located in Downtown Summerlin, comprised of studio, one and two-bedroom units. Total development costs are expected to be approximately $86.2 million which will be partially financed with a $59.5 million construction loan that closed in September 2021. We began construction in the second quarter of 2021 and anticipate project completion in the first quarter of 2023. We expect to reach annual stabilized NOI of $5.9 million by 2026.
The Woodlands
Memorial Hermann Health System Build-to-Suit This will be a 20,000 square foot medical office property. Total development costs are expected to be approximately $6.0 million which will be partially financed by a construction loan expected to close in the first quarter of 2022. We began construction in the fourth quarter of 2021 and anticipate project completion in the first quarter of 2023. We expect to reach annual stabilized NOI of $0.6 million by 2023.
HHC 2021 FORM 10-K | 63
MANAGEMENT’S DISCUSSION AND ANALYSIS RESULTS OF OPERATIONS | |||||
Ward Village
We continue to transform Ward Village into a vibrant neighborhood offering unique retail experiences, dining and entertainment, along with exceptional residences and workforce housing set among open public spaces and pedestrian-friendly streets. We believe we have found the optimal mix of price point and product in the Honolulu market for condominium development as evidenced by the demand for our condominium projects discussed below. The ongoing and completed construction at our mixed-use condominium projects includes 171,307 square feet of retail to serve our new residents and the community at large. In addition, during the last half of 2017, we removed 226,466 square feet of dated retail space from service to prepare it for redevelopment. Many of the tenants occupying these locations were relocated within Ward Village. As we progress the buildout of the master plan, which ultimately contemplates a total of approximately 1,000,000 million square feet of commercial space at completion, we will periodically redevelop, reposition, or replace the existing retail spaces as part of new mixed-use projects.
In 2021, Ward Village achieved the highest sales volume in the community’s history. We broke ground at Victoria Place, launched sales at the Park Ward Village and completed construction and began welcoming residents at ‘A‘ali‘i.
Condominium revenue is recognized when construction of the condominium tower is complete and unit sales close, leading to variability in revenue recognized between periods. We closed on 670 condominium units during the year ended December 31, 2021, primarily as a result of the completion and opening of ‘A‘ali‘i , compared to zero condominium units for the year ended December 31, 2020, due to significantly lower available inventory in completed towers during 2020.
Sales contracts for condominium units are subject to a 30-day rescission period, and the buyers are typically required to make an initial deposit at signing and an additional deposit 30 days later at which point their total deposit becomes non-refundable. Buyers are typically then required to make a final deposit within approximately 90 days of our receipt of their second deposit. Certain buyers are required to deposit the remainder of the sales price on a predetermined pre-closing date, which is specified in the sales contracts for each condominium project. Contracted amounts disclosed below represent sales that are past the 30-day rescission period.
Completed Condominiums As of December 31, 2021, our five completed towers are 96.2% sold with only 2 units remaining to be sold at Waiea and 78 units remaining to be sold at ‘A‘ali‘i. Ae‘o, Ke Kilohana and Anaha are completely sold.
Under Construction Condominiums As of December 31, 2021, 93.1% of the units at our two under construction towers, Kō'ula and Victoria Place, are under contract. We launched public sales of our sixth condominium project, Kō'ula, in January 2019 and broke ground in July 2019. Kō'ula will be a 41-story, 565-unit, mixed-use condominium project located on Auahi Street that consists of studio, one, two and three-bedroom residences. We expect to complete construction of Kō'ula in the third quarter of 2022 and anticipate closing on the sale of the 505 units under contract as of December 31, 2021 at that time. We launched public sales of our seventh condominium project, Victoria Place, in December 2019 and broke ground in February 2021. Victoria Place will be a 40-story, 349-unit condominium project located between Auahi Street and Ala Moana Boulevard that consists of one, two and three-bedroom residences. As of December 31, 2021, Victoria Place is 99.1% presold, with only 3 units remaining to be sold.
Predevelopment Condominiums We launched public sales of our eighth condominium project in July 2021. The Park Ward Village will be a 41-story, 545-unit condominium project located at Ward Avenue and Auahi Street, adjacent to Victoria Ward Park. The project consists of studio, one, two and three-bedroom residences with units ranging from approximately 400 square feet to 1,500 square feet. As of December 31, 2021, we have entered into contracts for 459 of the 545 units, representing 84.2% of total units. This strong sales activity continued after year end, and as of February 24, 2022, we have entered into contracts for 480 units, representing 88.1% of total units. The Park Ward Village is now Ward Village’s fastest-selling tower since inception, surpassing Victoria Place which held the previous record.
In 2021, HHC announced plans for our ninth condominium project, Ulana Ward Village. This mixed-use residence will be adjacent to the new Ka Laʻi o Kukuluāeʻo public park and will consist of 696 studio, one-, two- and three-bedroom units. All units are designated as workforce housing units and are being offered to local residents who meet certain maximum income and net worth requirements. In March 2022, the Company will advance the lottery for local residents and expects to have the first contracted sales in the second quarter of 2022.
HHC 2021 FORM 10-K | 64
MANAGEMENT’S DISCUSSION AND ANALYSIS RESULTS OF OPERATIONS | |||||
The following provides further details for Ward Village as of December 31, 2021:
| Units Closed | Units Under Contract | Total Units | Total % of Units Closed or Under Contract | Total % of Residential Square Feet Closed or Under Contract | Completion Date | |||||||||||||||||||||||||||||||||
| Completed | ||||||||||||||||||||||||||||||||||||||
| Waiea | (a) | 175 | — | 177 | 98.9 | % | 99.0 | % | Q4 2016 | |||||||||||||||||||||||||||||
| Anaha | (a) | 317 | — | 317 | 100.0 | % | 100.0 | % | Q4 2017 | |||||||||||||||||||||||||||||
| Ae‘o | (b) | 465 | — | 465 | 100.0 | % | 100.0 | % | Q4 2018 | |||||||||||||||||||||||||||||
| Ke Kilohana | (a) | 423 | — | 423 | 100.0 | % | 100.0 | % | Q2 2019 | |||||||||||||||||||||||||||||
| ‘A‘ali‘i | (c) | 663 | 9 | 750 | 89.6 | % | 85.5 | % | Q4 2021 | |||||||||||||||||||||||||||||
| Under Construction | ||||||||||||||||||||||||||||||||||||||
| Kō'ula | (d) | — | 505 | 565 | 89.4 | % | 91.3 | % | Q3 2022 | |||||||||||||||||||||||||||||
| Victoria Place | — | 346 | 349 | 99.1 | % | 99.3 | % | 2024 | ||||||||||||||||||||||||||||||
| Predevelopment | ||||||||||||||||||||||||||||||||||||||
| The Park Ward Village | (e) | — | 459 | 545 | 84.2 | % | 85.3 | % | 2025 | |||||||||||||||||||||||||||||
(a)The retail portions of these projects are 100% leased and have been placed in service.
(b)The retail portion of the project, which is primarily comprised of the 57,000-square-foot flagship Whole Foods Market, is 100% leased and has been placed into service.
(c)There will be approximately 12,000 square feet of new street level retail space as part of this project. Landlord work is still ongoing as of December 31, 2021, and the retail space is expected to be placed in service in early 2022.
(d)There will be approximately 37,000 square feet of retail space as part of this project.
(e)There will be approximately 37,236 square feet of retail space as part of this project.
HHC 2021 FORM 10-K | 65
MANAGEMENT’S DISCUSSION AND ANALYSIS RESULTS OF OPERATIONS | |||||
Corporate Income, Expenses and Other Items | ||
The following table contains certain corporate related and other items not related to segment activities and that are not otherwise included within the segment analyses. Variances related to income and expenses included in NOI or EBT are explained within the previous segment discussions. Significant variances for consolidated items not included in NOI or EBT are described below for the years ended December 31.
| 2021-2020 | 2020-2019 | ||||||||||||||||||||||||||||
| thousands | 2021 | 2020 | 2019 | Change | Change | ||||||||||||||||||||||||
| Corporate income | $ | 340 | $ | 258 | $ | 34 | $ | 82 | $ | 224 | |||||||||||||||||||
| General and administrative | (81,990) | (109,402) | (162,506) | 27,412 | 53,104 | ||||||||||||||||||||||||
| Corporate interest expense, net | (101,279) | (68,865) | (45,023) | (32,414) | (23,842) | ||||||||||||||||||||||||
| Gain (loss) on extinguishment of debt | (35,084) | — | (210) | (35,084) | 210 | ||||||||||||||||||||||||
| Corporate other income (loss), net | 425 | 41 | 7,597 | 384 | (7,556) | ||||||||||||||||||||||||
| Corporate gain (loss) on sale or disposal of real estate and other assets, net | — | — | (4,751) | — | 4,751 | ||||||||||||||||||||||||
| Corporate depreciation and amortization | (4,324) | (6,631) | (8,021) | 2,307 | 1,390 | ||||||||||||||||||||||||
| Demolition costs | (355) | — | (855) | (355) | 855 | ||||||||||||||||||||||||
| Development-related marketing costs | (10,313) | (8,166) | (23,067) | (2,147) | 14,901 | ||||||||||||||||||||||||
| Income tax (expense) benefit | (15,153) | (11,653) | (29,245) | (3,500) | 17,592 | ||||||||||||||||||||||||
| Total Corporate income, expenses and other items | $ | (247,733) | $ | (204,418) | $ | (266,047) | $ | (43,315) | $ | 61,629 | |||||||||||||||||||
For the year ended December 31, 2021:
Corporate income, expenses and other items was unfavorably impacted compared to the prior year period by the following:
–increase in loss on extinguishment of debt of $35.1 million due to the repurchase of the Company’s $1.0 billion 5.375% Senior Notes due 2025
–increase in corporate interest expense, net primarily due to the issuance of $750 million 5.375% Senior Notes in August 2020, as well as the issuance of $650 million 4.125% Senior Notes and $650 million 4.375% Senior Notes in the first quarter of 2021, partially offset by the repurchase of the $1.0 billion 5.375% Senior Notes in the first quarter of 2021
–increase in income tax expense primarily due to an increase in income before income taxes, partially offset by the impact of the release of a valuation allowance on the Company’s capital loss carryover in 2021. Refer to Note 12 - Income Taxes for additional information.
Corporate income, expenses and other items was favorably impacted compared to the prior year period by the following:
–decrease in general and administrative expenses primarily related to workforce reductions and other corporate initiatives, that have been completed in accordance with a corporate restructuring initiative that began in 2019 as part of an overall plan to reduce recurring overhead costs, and a decrease in consulting expenses as a result of fewer IT projects taking place in 2021
For the year ended December 31, 2020:
Corporate income, expenses and other items was favorably impacted compared to the prior year period by the following:
–decrease in General and administrative expenses primarily related to the reduction of labor costs due to workforce reductions that have been completed in accordance with a corporate restructuring initiative that began in 2019 as part of an overall plan to reduce recurring overhead costs, and lower travel and entertainment costs, which are attributable to COVID-19 travel restrictions
–decrease in income tax expense primarily due to a decrease in income before income taxes
–decrease in Development-related marketing costs primarily related to a reduction in the number of projects under development
Corporate income, expenses and other items was unfavorably impacted compared to the prior year period by the following:
–increase in corporate interest expense, net primarily due to the $750 million issuance of senior notes in August 2020, as well as a decrease in interest income due to lower interest rates
–decrease in corporate other income (loss), net due to the receipt of Superstorm Sandy insurance proceeds in the second quarter of 2019, which did not recur in 2020
HHC 2021 FORM 10-K | 66
MANAGEMENT’S DISCUSSION AND ANALYSIS RESULTS OF OPERATIONS | |||||
Income Taxes
| thousands except percentages | 2021 | 2020 | 2019 | ||||||||||||||
| Income tax expense (benefit) | $ | 15,153 | $ | 11,653 | $ | 29,245 | |||||||||||
| Income (loss) before income taxes | $ | 64,077 | $ | 8,480 | $ | 103,540 | |||||||||||
| Effective tax rate | 23.6 | % | 137.4 | % | 28.2 | % | |||||||||||
The Company’s effective tax rate is typically impacted by non-deductible executive compensation and other permanent differences as well as state income taxes, which cause the Company’s effective tax rate to deviate from the federal statutory rate.
The Company’s effective tax rate for the year ended December 31, 2021, was 23.6% compared to 137.4% for the year ended December 31, 2020. The decrease was primarily due to the following:
–a release of a valuation allowance of $4.7 million on the Company’s capital loss carryover in 2021 that was established in 2020 related to a capital loss generated by the sale of the Company’s 50% equity method investment in Circle T Ranch and Power Center in 2020 (refer to Note 3 - Acquisitions and Dispositions in the Notes to Consolidated Financial Statements under Item 8 of this Form 10-K for additional details)
–a valuation allowance of $1.8 million on our charitable contribution carryover in 2020
–a tax expense of $1.7 million related to the recapture of federal and state historic preservation credits due to the sale of our interest in Mr. C Seaport in 2020 (refer to Note 3 - Acquisitions and Dispositions in the Notes to Consolidated Financial Statements under Item 8 of this Form 10-K for additional details)
–offset by a $4.8 million tax benefit related to the noncontrolling interest share of the gain on the deconsolidation of 110 North Wacker in 2020 (refer to Note 2 - Investments in Real Estate and Other Affiliates in the Notes to Consolidated Financial Statements under Item 8 of this Form 10-K for additional details)
The Company’s effective tax rate for the year ended December 31, 2020, was 137.4% compared to 28.2% for the year ended December 31, 2019. The increase was primarily due to the following:
–a valuation allowance of $4.7 million on a capital loss generated by the sale of the Company’s 50% equity method investment in Circle T Ranch and Power Center in 2020
–a valuation allowance of $1.8 million on our charitable contribution carryover in 2020
–a tax expense of $1.7 million related to the recapture of federal and state historic preservation credits due to the sale of our interest in Mr. C Seaport in 2020
–offset by a $4.8 million tax benefit related to the noncontrolling interest share of the gain on the deconsolidation of 110 North Wacker in 2020
For additional information on income taxes, see Note 12 - Income Taxes in the Notes to Consolidated Financial Statements under Item 8 of this Form 10-K.
Capitalized Internal Costs The following table presents our capitalized internal costs by segment for the years ended December 31:
| Capitalized Internal Costs | Capitalized Internal Costs Related to Compensation Costs | ||||||||||||||||||||||||||||||||||
| thousands | 2021 | 2020 | 2019 | 2021 | 2020 | 2019 | |||||||||||||||||||||||||||||
| Operating Assets segment | $ | 1,462 | $ | 37 | $ | 247 | $ | 1,204 | $ | 35 | $ | 221 | |||||||||||||||||||||||
| MPC segment | 9,694 | 7,658 | 9,440 | 7,462 | 6,936 | 7,078 | |||||||||||||||||||||||||||||
| Seaport segment | 7,755 | 3,470 | 2,794 | 5,549 | 3,258 | 2,494 | |||||||||||||||||||||||||||||
| Strategic Developments segment | 19,111 | 13,788 | 24,110 | 15,093 | 12,942 | 21,527 | |||||||||||||||||||||||||||||
| Total | $ | 38,022 | $ | 24,953 | $ | 36,591 | $ | 29,308 | $ | 23,171 | $ | 31,320 | |||||||||||||||||||||||
Capitalized internal costs (which include compensation costs) increased for the year ended December 31, 2021, compared to 2020, primarily related to the timing of construction projects in the Strategic Developments, MPC and Seaport segments, as more development projects were approved and staffing was reallocated to support the development activity. As projects continue to begin construction, internal costs will continue to be capitalized within these segments.
Capitalized internal costs (which include compensation costs) decreased for the year ended December 31, 2020, compared to 2019, primarily related to workforce reductions in the Strategic Developments segment. The capitalized internal costs for the Seaport segment increased due to tenant buildouts and escalated work on the Tin Building. In the MPC segment, capitalized internal costs decreased in 2020 due to fluctuations in the level of development activity at our newer MPCs.
HHC 2021 FORM 10-K | 67
MANAGEMENT’S DISCUSSION AND ANALYSIS LIQUIDITY AND CAPITAL RESOURCES | |||||
| LIQUIDITY AND CAPITAL RESOURCES | ||
Throughout the pandemic we have focused on measures to increase our liquidity. As a result, we have been able to maintain a strong balance sheet and ensure we maintain the financial flexibility and liquidity necessary to fund future growth. We continued to enhance our liquidity profile in 2021 through $2.1 billion of permanent financings, replacing $2.1 billion of existing debt, and closed on $628 million of construction financings to support development spending at our latest projects actively under construction. These financings extended the term of our maturities and took advantage of a historically low interest rate environment. Refer to Note 7 - Mortgages, Notes and Loans Payable, Net in the Notes to Consolidated Financial Statements under Item 8 of this Form 10-K for additional information. The strength of HHC’s balance sheet has allowed us to deploy significant amounts of capital in 2021 including our acquisition of Douglas Ranch, share buybacks, and the ability to continue unlocking value through the development of new projects across the portfolio.
During 2021, we continued to pursue the sale of our remaining non-core assets with the goal of generating an estimated $600.0 million of net proceeds after debt repayment. We closed on the sale of Monarch City during the second quarter of 2021 for net proceeds of $50.9 million, the sale of our hospitality properties in The Woodlands during the third quarter of 2021 for net proceeds after debt repayment of $119.7 million and the sale of Century Park during the fourth quarter of 2021 for net proceeds of $25.0 million. Since the fourth quarter of 2019, we have completed the sales of 13 non-core assets generating approximately $401.0 million of net proceeds after debt repayment.
In October 2021, the board of directors of The Howard Hughes Corporation, authorized a share repurchase program, pursuant to which the Company may, from time to time, purchase up to $250.0 million of its common stock through open market transactions. The date and time of such repurchases will depend upon market conditions and the program may be suspended or discontinued at any time. The new program replaces the Company’s prior share repurchase program adopted in October 2019. Under the new program, during the fourth quarter of 2021, the Company repurchased 1,023,284 shares of its common stock, par value $0.01 per share for $96.6 million, or approximately $94.42 per share. During the first quarter of 2022, the Company repurchased an additional 1,579,646 shares of its common stock, for $153.4 million, or approximately $97.10 per share, thereby completing all authorized purchases under the plan. All purchases were funded with cash on hand.
Cash Flows | ||
| Year Ended December 31, | |||||||||||||||||
| thousands | 2021 | 2020 | 2019 | ||||||||||||||
| Cash provided by (used in) operating activities | $ | (283,958) | $ | (72,870) | $ | 207,732 | |||||||||||
| Cash provided by (used in) investing activities | 101,458 | (428,546) | (1,232,897) | ||||||||||||||
| Cash provided by (used in) financing activities | 156,140 | 1,124,278 | 921,085 | ||||||||||||||
Operating Activities Each segment’s relative contribution to our cash flows from operating activities will likely vary significantly from year to year given the changing nature of our development focus. Other than our condominium properties, most of the properties and projects in our Strategic Developments segment do not generate revenues and the cash flows and earnings may vary. Operating cash continued to be utilized in 2021 to fund ongoing development expenditures in our Strategic Developments, Seaport and MPC segments, consistent with prior years.
The cash flows and earnings from the MPC business may fluctuate more than from our operating assets because the MPC business generates revenues from land sales rather than recurring contractual revenues from operating leases. MPC land sales are a substantial portion of our cash flows from operating activities and are partially offset by development costs associated with the land sales business and acquisitions of land that is intended to ultimately be developed and sold.
Net cash used in operating activities increased $211.1 million in 2021, compared to 2020, primarily due to an increase in MPC land acquisitions primarily related to Douglas Ranch and Trillium, an increase in Condominium development expenditures and an increase in MPC development expenditures. These increases in cash used were partially offset by an increase in cash provided from condominium rights and units sales as a result of closings at ‘A‘ali‘i and an increase in MPC land sales.
Net cash provided by operating activities decreased $280.6 million in 2020, compared to 2019, primarily due to a decrease in condominium rights and units sales due to timing of closings, which was partially offset by proceeds from the sale of lease receivable and condominium deposits received.
HHC 2021 FORM 10-K | 68
MANAGEMENT’S DISCUSSION AND ANALYSIS LIQUIDITY AND CAPITAL RESOURCES | |||||
Investing Activities For the year ended December 31, 2021, cash provided by investing activities of $101.5 million was primarily related to proceeds from sales of our hospitality properties in the Woodlands, Monarch City and Century Park of $322.5 million and distributions from real estate and affiliates of $92.1 million, primarily related to The Summit. These cash inflows were offset by property development expenditures primarily related to ongoing development at The Seaport, 1700 Pavilion, Marlow and Tanager Echo.
For the year ended December 31, 2020, cash used in investing activities of $428.5 million was primarily related to property development expenditures related to ongoing development activity at 110 North Wacker, the Seaport and 6100 Merriweather.
Financing Activities For the year ended December 31, 2021, net proceeds from new loan borrowings and refinancing activities exceeded principal payments on our debt by $282.5 million and were used to partially fund development activity at our development projects, to increase liquidity and for the acquisition of assets. Under the new share repurchase program, during the fourth quarter of 2021, the Company repurchased 1,023,284 shares of its common stock, par value $0.01 per share, for $96.6 million, or approximately $94.42 per share. Due to the timing of share repurchase payments, $15.5 million was recorded in Accounts payable and accrued expenses in the Consolidated Balance Sheet as of December 31, 2021. During the first quarter of 2022, the Company repurchased an additional 1,579,646 shares of its common stock, for $153.4 million, or approximately $97.10 per share, thereby completing all authorized purchases under the plan. All purchases were funded with cash on hand.
For the year ended December 31, 2020, net proceeds from new loan borrowings and refinancing activities exceeded principal payments on our debt by $536.0 million and were used to partially fund development activity at our development projects, to increase liquidity and for the acquisition of assets. Cash provided by financing activities also included $593.6 million proceeds from the issuance of common stock.
Short- and Long-Term Liquidity | ||
Short-Term Liquidity In the next twelve months, we expect our primary sources of cash to include cash flow from condominium closings, MPC land sales, cash generated from our Operating assets, first mortgage financings secured by our assets and deposits from condominium sales (which are restricted to funding construction of the related developments). The sale of our non-core assets may also provide additional cash proceeds to our operating or investing activities. We expect our primary uses of cash to include condominium pre-development and development costs, debt principal payments and debt service costs, MPC land development costs and other capital expenditures. We believe that our sources of cash, including existing cash on hand, will provide sufficient liquidity to meet our existing obligations and anticipated ordinary course operating expenses for at least the next 12 months.
Long-Term Liquidity The development and redevelopment opportunities in Strategic Developments, Seaport and Operating Assets are capital intensive and will require significant additional funding, if and when pursued. Any additional funding would be raised with a mix of construction, bridge and long-term financings, by entering into joint venture arrangements, through the sale of non-core assets at the appropriate time, and lastly future equity raises.
We cannot provide assurance that financing arrangements for our properties will be on favorable terms or occur at all, which could have a negative impact on our liquidity and capital resources. In addition, we typically must provide completion guarantees to lenders in connection with their providing financing for our projects. We also provided completion guarantees to the City of New York for the redevelopment of the Tin Building, as well as the Hawai‘i Community Development Authority for reserve condominium units at Ward Village.
HHC 2021 FORM 10-K | 69
MANAGEMENT’S DISCUSSION AND ANALYSIS LIQUIDITY AND CAPITAL RESOURCES | |||||
Summary of Remaining Development Costs The following table summarizes remaining development costs related to projects under construction and related debt held in Operating Assets, Seaport and Strategic Developments segments as of December 31, 2021. Total cost remaining to be paid net of debt and buyer deposits consists of $195.6 million related to substantially completed projects, $76.5 million related to projects with estimated completion dates within the next 12 months and $11.2 million related to projects with estimated completion dates in 2023 and 2024.
Projects that are substantially complete and which have been placed into service in the Operating Assets or Seaport segments are included in the following table if the project has more than $1.0 million of estimated costs remaining to be incurred. As of December 31, 2021, $117.6 million of the cost related to substantially completed projects primarily relates to warranty repairs at Waiea in Ward Village. However, we anticipate recovering a substantial amount of these costs in the future, which is not reflected in the table below. The remaining cost related to substantially completed projects primarily represents budgeted tenant allowances necessary to bring the asset to stabilized occupancy.
We expect to be able to meet our cash funding requirements with a combination of existing and anticipated construction loans, condominium buyer deposits, free cash flow from our Operating Assets and MPC segments, net proceeds from condominium sales and our existing cash balances.
| thousands | Estimated Remaining to be Spent | Remaining Buyer Deposits/Holdback to be Drawn | Debt to be Drawn (a) | Costs Remaining to be Paid, Net of Debt and Buyer Deposits/Holdbacks to be Drawn | |||||||||||||||||||
| Operating Assets | |||||||||||||||||||||||
| Columbia | $ | 42,181 | $ | — | $ | 36,394 | $ | 5,787 | |||||||||||||||
| The Woodlands | 18,542 | — | 12,534 | 6,008 | |||||||||||||||||||
| Total Operating Assets | 60,723 | — | 48,928 | 11,795 | |||||||||||||||||||
| Seaport Assets | |||||||||||||||||||||||
| Seaport | 69,605 | — | — | 69,605 | |||||||||||||||||||
| Total Seaport Assets | 69,605 | — | — | 69,605 | |||||||||||||||||||
| Strategic Developments | |||||||||||||||||||||||
| Columbia | 88,699 | — | 82,570 | 6,129 | |||||||||||||||||||
| The Woodlands | 5,561 | — | — | 5,561 | |||||||||||||||||||
| Bridgeland | 40,467 | — | 38,708 | 1,759 | |||||||||||||||||||
| Summerlin | 150,132 | — | 134,498 | 15,634 | |||||||||||||||||||
| Ward Village (b) | 778,823 | 113,998 | 491,991 | 172,834 | |||||||||||||||||||
| Total Strategic Developments | 1,063,682 | 113,998 | 747,767 | 201,917 | |||||||||||||||||||
| Total | $ | 1,194,010 | $ | 113,998 | $ | 796,695 | $ | 283,317 | |||||||||||||||
(a)With respect to our condominium projects, remaining debt to be drawn is reduced by deposits utilized for construction. Refer to Note 7 - Mortgages, Notes and Loans Payable, Net in the Notes to Consolidated Financial Statements under Item 8 of this Form 10-K for additional information on each loan.
(b)Estimated remaining to be spent includes amounts for Waiea warranty repairs. However, we anticipate recovering a substantial amount of these costs in the future, which is not reflected in this schedule.
HHC 2021 FORM 10-K | 70
MANAGEMENT’S DISCUSSION AND ANALYSIS LIQUIDITY AND CAPITAL RESOURCES | |||||
Contractual Cash Obligations and Commitments The following table aggregates our contractual cash obligations and commitments as of December 31, 2021:
| thousands | 2022 | 2023 | 2024 | 2025 | 2026 | Thereafter | Total | ||||||||||||||||
| Mortgages, notes and loans payable (a) | $ | 103,022 | $ | 547,744 | $ | 343,950 | $ | 172,275 | $ | 359,603 | $ | 3,112,822 | $ | 4,639,416 | |||||||||
| Interest Payments (b) | 197,420 | 198,142 | 174,225 | 163,549 | 153,838 | 470,626 | 1,357,800 | ||||||||||||||||
| Ground lease and other leasing commitments | 4,611 | 4,521 | 4,577 | 4,635 | 4,695 | 275,229 | 298,268 | ||||||||||||||||
| Total | $ | 305,053 | $ | 750,407 | $ | 522,752 | $ | 340,459 | $ | 518,136 | $ | 3,858,677 | $ | 6,295,484 | |||||||||
(a)Based on final maturity, inclusive of extension options. In January 2022, the Company closed on a $49.8 million financing of One Merriweather with maturity in February 2032 and used proceeds to pay a portion of the Senior Secured Credit Facility. In January 2022, the Company closed on a $25.6 million financing of Two Merriweather with maturity in February 2032. In February 2022, the Company closed on a $40.8 million financing of Two Summerlin with an initial maturity of February 2027 and 2 one-year extension options. In February 2022, the Company paid $28.4 million on the Senior Secured Credit Facility which matures in September 2023.
(b)Interest is based on the borrowings that are presently outstanding and current floating interest rates.
We lease land or buildings at certain properties from third parties. Rental payments are expensed as incurred and have been, to the extent applicable, straight-lined over the term of the lease. Contractual rental expense, including participation rent, was $7.2 million for the year ended December 31, 2021, $7.2 million for the year ended December 31, 2020, and $8.5 million for the year ended December 31, 2019. The amortization of above- and below-market ground leases and straight-line rents included in the contractual rent amount were not significant.
Debt Total outstanding debt was $4.6 billion as of December 31, 2021. Certain mortgages may require paydowns in order to exercise contractual extension terms. Please refer to Note 7 - Mortgages, Notes and Loans Payable, Net in our Consolidated Financial Statements for a table showing our debt maturity dates.
Debt Compliance Due to the COVID-19 pandemic, the Company experienced a decline in operating results for certain retail and hospitality properties resulting in the Company not meeting its required debt service coverage ratio for the $615.0 million Term Loan portion of the Senior Secured Credit Facility as of December 31, 2020. As a result, the excess net cash flow after debt service from the underlying properties became restricted. While the restricted cash could not be used for general corporate purposes, it could be used to fund operations of the underlying assets and did not have a material impact on the Company’s liquidity. As a result of payments on the Term Loan, the Company met the debt service coverage ratio as of September 30, 2021, and December 31, 2021. As two consecutive quarters of compliance were required to release the restricted cash requirement, $43.0 million of restricted cash as of December 31, 2021, qualifies for release.
As of December 31, 2021, the Company did not meet the debt service coverage ratio for the Two Hughes Landing loan. As a result, the excess net cash flow after debt service from the underlying property became restricted and cannot be used for general corporate purposes, but can continue to be used to fund operations of the underlying asset. This restriction does not have a material impact on the Company’s liquidity.
As of December 31, 2021, apart from the Two Hughes Landing loan described above, the Company was in compliance with all financial covenants included in the agreements governing its indebtedness.
Net Debt The following table summarizes our net debt on a segment basis as of December 31, 2021. Net debt is defined as Mortgages, notes and loans payable, net, including our ownership share of debt of our Real estate and other affiliates, reduced by liquidity sources to satisfy such obligations such as our ownership share of Cash and cash equivalents and SID, MUD and TIF receivables. Although net debt is a non-GAAP financial measure, we believe that such information is useful to our investors and other users of our financial statements as net debt and its components are important indicators of our overall liquidity, capital structure and financial position. However, it should not be used as an alternative to our debt calculated in accordance with GAAP.
HHC 2021 FORM 10-K | 71
MANAGEMENT’S DISCUSSION AND ANALYSIS LIQUIDITY AND CAPITAL RESOURCES | |||||
| thousands | Operating Assets | Master Planned Communities | Seaport | Strategic Developments | Segment Totals | Non- Segment Amounts | December 31, 2021 | ||||||||||||||||
| Mortgages, notes and loans payable | $ | 1,931,339 | $ | 339,512 | $ | 99,579 | $ | 198,500 | $ | 2,568,930 | $ | 2,022,227 | $ | 4,591,157 | |||||||||
| Mortgages, notes and loans payable of real estate and other affiliates | 286,243 | 9,270 | — | — | 295,513 | — | 295,513 | ||||||||||||||||
| Less: | |||||||||||||||||||||||
| Cash and cash equivalents | (71,094) | (114,241) | (8,202) | (5,668) | (199,205) | (644,007) | (843,212) | ||||||||||||||||
| Cash and cash equivalents of real estate and other affiliates | (5,655) | (45,307) | (133) | (14,914) | (66,009) | — | (66,009) | ||||||||||||||||
| Special Improvement District receivables | — | (86,165) | — | — | (86,165) | — | (86,165) | ||||||||||||||||
| Municipal Utility District receivables, net | — | (387,199) | — | — | (387,199) | — | (387,199) | ||||||||||||||||
| TIF receivable | — | — | — | (855) | (855) | — | (855) | ||||||||||||||||
| Net Debt | $ | 2,140,833 | $ | (284,130) | $ | 91,244 | $ | 177,063 | $ | 2,125,010 | $ | 1,378,220 | $ | 3,503,230 | |||||||||
Real Estate and Other Affiliates We have interests in certain property owning non-consolidated ventures which, as of December 31, 2021, have mortgage financing totaling $671.5 million, with our proportionate share of this debt totaling $295.5 million. All of this indebtedness is without recourse to the Company, with the exception of $100.6 million related to 110 North Wacker. The following table summarizes our share of affiliate debt and cash as of December 31, 2021:
| thousands | Company’s Share of Affiliate Debt | Company’s Share of Affiliate Cash | |||||||||
| Operating Assets | |||||||||||
| 110 North Wacker | $ | 195,858 | $ | 2,244 | |||||||
| The Metropolitan Downtown Columbia | 40,200 | 1,535 | |||||||||
| Stewart Title of Montgomery County, TX | — | 818 | |||||||||
| Woodlands Sarofim #1 | 980 | 329 | |||||||||
| m.flats/TEN.M | 49,205 | 729 | |||||||||
| Master Planned Communities | |||||||||||
| The Summit | 3,748 | 45,307 | |||||||||
| Trillium | 5,522 | — | |||||||||
| Seaport | |||||||||||
| Ssäm Bar (formerly Bar Wayō) | — | 133 | |||||||||
| Strategic Developments | |||||||||||
| HHMK Development | — | 10 | |||||||||
| KR Holdings | — | 136 | |||||||||
| West End Alexandria | — | 14,768 | |||||||||
| Total | $ | 295,513 | $ | 66,009 | |||||||
HHC 2021 FORM 10-K | 72
MANAGEMENT’S DISCUSSION AND ANALYSIS LIQUIDITY AND CAPITAL RESOURCES | |||||
| CRITICAL ACCOUNTING POLICIES | ||
The preparation of financial statements in accordance with GAAP requires management to make informed judgments, assumptions and estimates that affect the reported amounts of assets, liabilities, revenues, and expenses. We base our estimates on historical experience and on various other assumptions that we believe to be reasonable under the circumstances. Changes in facts and circumstances or additional information may result in revised estimates, and actual results may differ from these estimates.
We believe that of our significant accounting policies, which are described in Note 1 - Summary of Significant Accounting Policies in the Notes to Consolidated Financial Statements under Item 8 of this Form 10-K, the accounting policies below involve a greater degree of judgment and complexity. Accordingly, we believe these are the most critical to understand and evaluate fully our financial condition and results of operations.
| Impairments | ||
Methodology We review our long-lived assets for potential impairment indicators whenever events or changes in circumstances indicate that the carrying amount may not be recoverable. Although the carrying amount may exceed the estimated fair value of certain properties, a real estate asset is only considered to be impaired when its carrying amount is not expected to be recovered through estimated future undiscounted cash flows. To the extent an impairment provision is necessary, the excess of the carrying amount of the asset over its estimated fair value is expensed to operations and the carrying amount of the asset is reduced. The adjusted carrying amount, which represents the new cost basis of the asset, is depreciated over the remaining useful life of the asset or, for MPCs, is expensed as a cost of sales when land is sold.
Judgments and uncertainties An impairment loss is recognized if the carrying amount of an asset is not recoverable and exceeds its fair value. The cash flow estimates used both for determining recoverability and estimating fair value are inherently judgmental and reflect current and projected trends in rental, occupancy, pricing, development costs, sales pace and capitalization rates, selling costs, and estimated holding periods for the applicable assets. As such, the evaluation of anticipated cash flows is highly subjective and is based in part on assumptions that could differ materially from actual results in future periods. Unfavorable changes in any of the primary assumptions could result in a reduction of anticipated future cash flows and could indicate property impairment. Uncertainties related to the primary assumptions could affect the timing of an impairment. While we believe our assumptions are reasonable, changes in these assumptions may have a material impact on our financial results.
| Master Planned Communities Cost of Sales | ||
Methodology When residential or commercial land is sold, the cost of sales includes actual costs incurred and estimates of future development costs benefiting the property sold. When land is sold, costs are allocated to each sold superpad or lot based upon the relative sales value. For purposes of allocating development costs, estimates of future revenues and development costs are re-evaluated throughout the year, with adjustments being allocated prospectively to the remaining parcels available for sale. For certain parcels of land, including acquired parcels that the Company does not intend to develop or for which development was complete at the date of acquisition, the specific identification method is used to determine the cost of sales.
Judgments and uncertainties MPC cost of sales estimates are highly judgmental as they are sensitive to cost escalation, sales price escalation and pace of absorption, which are subject to judgment and affected by expectations about future market or economic conditions. Changes in the assumptions used to estimate future development costs could result in a significant impact on the amounts recorded as cost of sales.
| RECENTLY ISSUED ACCOUNTING PRONOUNCEMENTS AND DEVELOPMENTS | ||
Please refer to Note 1 - Summary of Significant Accounting Policies in the Notes to Consolidated Financial Statements under Item 8 of this Form 10-K for additional information about new accounting pronouncements.
HHC 2021 FORM 10-K | 73
MARKET RISK QUANTITATIVE AND QUALITATIVE DISCLOSURES | |||||
Item 7A. Quantitative and Qualitative Disclosures about Market Risk
We are subject to interest rate risk with respect to our variable-rate financings in that increases in interest rates will increase our payments under these variable rates. With respect to fixed-rate financings, increases in interest rates could make it more difficult to refinance such debt when due. We manage a portion of our variable interest rate exposure by using interest rate swaps and caps. As of December 31, 2021, of our $1.5 billion of variable-rate debt outstanding, $650.5 million is swapped to a fixed rate. We may enter into interest rate cap contracts to mitigate our exposure to rising interest rates. We have a $75.0 million cap contract at a 5.00% interest rate related to our properties in The Woodlands. We have cap contracts totaling $368.2 million with a LIBOR strike rate of 2.00% on our construction loan on Victoria Place, which has an outstanding balance of $49.0 million as of December 31, 2021. We have a $59.5 million cap contract with a LIBOR strike rate of 2.50% on our construction loan on Tanager Echo, which has an immaterial amount drawn as of December 31, 2021. We have a $75.0 million cap contract with a LIBOR strike rate of 2.50% on our construction loan for 1700 Pavilion, which has an immaterial amount drawn as of December 31, 2021. As the properties are placed into service and become stabilized, we typically refinance the variable-rate debt with long-term fixed-rate debt.
As of December 31, 2021, annual interest costs would increase approximately $8.6 million for every 1.00% increase in floating interest rates. Generally, a significant portion of our interest expense is capitalized due to the level of assets we currently have under development; therefore, the current impact of a change in our interest rate on our Consolidated Statements of Operations and Consolidated Statements of Comprehensive Income (Loss) would be less than the total change, but we would incur higher cash payments and the development costs of our assets would be higher, resulting in greater depreciation or cost of sales in later years. For additional information concerning our debt and management’s estimation process to arrive at a fair value of our debt as required by GAAP, please refer to the Liquidity and Capital Resources section of Item 7. Management's Discussion and Analysis of Financial Condition and Results of Operations, Note 7 - Mortgages, Notes and Loans Payable, Net and Note 9 - Derivative Instruments and Hedging Activities in the Notes to Consolidated Financial Statements under Item 8 of this Form 10-K.
The following table summarizes principal cash flows on our debt obligations and related weighted-average interest rates by expected maturity dates as of December 31, 2021:
| Contractual Maturity Date | |||||||||||||||||||||||||||||||||||||||||
| thousands | 2022 | 2023 | 2024 | 2025 | 2026 | Thereafter | Total | ||||||||||||||||||||||||||||||||||
| Mortgages, notes and loans payable (a) | $ | 103,022 | $ | 547,744 | $ | 343,950 | $ | 172,275 | $ | 359,603 | $ | 3,112,822 | $ | 4,639,416 | |||||||||||||||||||||||||||
| Weighted-average interest rate | 4.27 | % | 4.47 | % | 4.54 | % | 4.58 | % | 4.64 | % | 4.48 | % | |||||||||||||||||||||||||||||
(a)Based on final maturity, inclusive of extension options. In January 2022, the Company closed on a $49.8 million financing of One Merriweather with maturity in February 2032 and used proceeds to pay a portion of the Senior Secured Credit Facility. In January 2022, the Company closed on a $25.6 million financing of Two Merriweather with maturity in February 2032. In February 2022, the Company closed on a $40.8 million financing of Two Summerlin with an initial maturity of February 2027 and 2 one-year extension options. In February 2022, the Company paid $28.4 million on the Senior Secured Credit Facility which matures in September 2023.
HHC 2021 FORM 10-K | 74
FINANCIAL STATEMENTS INDEX | |||||
Item 8. Financial Statements and Supplementary Data
| Index to Consolidated Financial Statements and Financial Statement Schedule | Page | ||||
| Consolidated Financial Statements | |||||
Report of Independent Registered Public Accounting Firm (PCAOB ID : | |||||
HHC 2021 FORM 10-K | 75
| FINANCIAL STATEMENTS | |||||
Report of Independent Registered Public Accounting Firm
To the Stockholders and the Board of Directors of
The Howard Hughes Corporation
Opinion on the Financial Statements
We have audited the accompanying consolidated balance sheets of The Howard Hughes Corporation (the Company) as of December 31, 2021 and 2020, the related consolidated statements of operations, comprehensive income (loss), equity and cash flows for each of the three years in the period ended December 31, 2021, and the related notes and financial statement schedule listed in the Index at Item 15(a) (collectively referred to as the “consolidated financial statements”). In our opinion, the consolidated financial statements present fairly, in all material respects, the financial position of the Company at December 31, 2021 and 2020, and the results of its operations and its cash flows for each of the three years in the period ended December 31, 2021, in conformity with U.S. generally accepted accounting principles.
We also have audited, in accordance with the standards of the Public Company Accounting Oversight Board (United States) (PCAOB), the Company’s internal control over financial reporting as of December 31, 2021, based on criteria established in Internal Control-Integrated Framework issued by the Committee of Sponsoring Organizations of the Treadway Commission (2013 framework) and our report dated February 28, 2022 expressed an unqualified opinion thereon.
Basis for Opinion
These financial statements are the responsibility of the Company's management. Our responsibility is to express an opinion on the Company’s financial statements based on our audits. We are a public accounting firm registered with the PCAOB and are required to be independent with respect to the Company in accordance with the U.S. federal securities laws and the applicable rules and regulations of the Securities and Exchange Commission and the PCAOB.
We conducted our audits in accordance with the standards of the PCAOB. Those standards require that we plan and perform the audit to obtain reasonable assurance about whether the financial statements are free of material misstatement, whether due to error or fraud. Our audits included performing procedures to assess the risks of material misstatement of the financial statements, whether due to error or fraud, and performing procedures that respond to those risks. Such procedures included examining, on a test basis, evidence regarding the amounts and disclosures in the financial statements. Our audits also included evaluating the accounting principles used and significant estimates made by management, as well as evaluating the overall presentation of the financial statements. We believe that our audits provide a reasonable basis for our opinion.
Critical Audit Matter
The critical audit matter communicated below is a matter arising from the current period audit of the financial statements that was communicated or required to be communicated to the audit committee and that: (1) relates to accounts or disclosures that are material to the financial statements and (2) involved our especially challenging, subjective or complex judgments. The communication of the critical audit matter does not alter in any way our opinion on the consolidated financial statements, taken as a whole, and we are not, by communicating the critical audit matter below, providing a separate opinion on the critical audit matter or on the accounts or disclosures to which it relates.
HHC 2021 FORM 10-K | 76
| FINANCIAL STATEMENTS | |||||
| Master Planned Communities (MPC) Cost of Sales Estimates | ||||||||
| Description of the Matter | As discussed in Note 1 of the consolidated financial statements, when developed residential or commercial land is sold, the cost of sales includes actual costs incurred and estimates of future development costs, based on relative sales value, that benefit the property sold. For purposes of allocating development costs, estimates of future revenues and development costs are re-evaluated throughout the year, with adjustments being allocated prospectively to the remaining parcels available for sale. MPC cost of sales estimates are highly judgmental as they are sensitive to cost escalation, sales price escalation and lot absorption, which are subject to judgment and affected by expectations about future market or economic conditions. | |||||||
| How We Addressed the Matter in Our Audit | We obtained an understanding of and evaluated the design and operating effectiveness of the Company’s internal controls over the estimation process that affect MPC cost of sales. This included controls over management’s monitoring and review of key assumptions, including the Company’s procedures to validate the completeness and accuracy of data used to determine estimates. Our testing of the Company’s MPC cost of sales estimates included, among other procedures, evaluating management’s methodology of estimating future costs and revenues, testing the significant assumptions related to cost escalation, sales price escalation and lot absorption, evaluating the underlying data used by management and performing site visits for certain MPC developments to compare the overall status of the developments to what is reflected within the development cost models. We involved internal specialists to assist in comparing a sample of estimated future costs, lot absorption rates, and sales price escalation to market data, assessing contrary information and obtaining supporting evidence used to derive the estimates. We also assessed the historical accuracy of management’s estimates and performed sensitivity analyses of significant assumptions to evaluate the changes in the cost of sale estimates that resulted from changes in the assumptions. | |||||||
/s/ Ernst & Young LLP
We have served as the Company’s auditor since 2013.
February 28, 2022
HHC 2021 FORM 10-K | 77
| FINANCIAL STATEMENTS | |||||
THE HOWARD HUGHES CORPORATION
CONSOLIDATED BALANCE SHEETS
| December 31, | |||||||||||
| thousands except par values and share amounts | 2021 | 2020 | |||||||||
| ASSETS | |||||||||||
| Investment in real estate: | |||||||||||
| Master Planned Communities assets | $ | $ | |||||||||
| Buildings and equipment | |||||||||||
| Less: accumulated depreciation | ( | ( | |||||||||
| Land | |||||||||||
| Developments | |||||||||||
| Net property and equipment | |||||||||||
| Investment in real estate and other affiliates | |||||||||||
| Net investment in real estate | |||||||||||
| Net investment in lease receivable | |||||||||||
| Cash and cash equivalents | |||||||||||
| Restricted cash | |||||||||||
| Accounts receivable, net | |||||||||||
| Municipal Utility District receivables, net | |||||||||||
| Notes receivable, net | |||||||||||
| Deferred expenses, net | |||||||||||
| Operating lease right-of-use assets, net | |||||||||||
| Prepaid expenses and other assets, net | |||||||||||
| Total assets | $ | $ | |||||||||
| LIABILITIES | |||||||||||
| Mortgages, notes and loans payable, net | $ | $ | |||||||||
| Operating lease obligations | |||||||||||
| Deferred tax liabilities | |||||||||||
| Accounts payable and accrued expenses | |||||||||||
| Total liabilities | |||||||||||
| Commitments and Contingencies (see Note 10) | |||||||||||
| Redeemable noncontrolling interest | |||||||||||
| EQUITY | |||||||||||
Preferred stock: $ | |||||||||||
Common stock: $ | |||||||||||
| Additional paid-in capital | |||||||||||
| Accumulated deficit | ( | ( | |||||||||
| Accumulated other comprehensive loss | ( | ( | |||||||||
Treasury stock, at cost, | ( | ( | |||||||||
| Total stockholders' equity | |||||||||||
| Noncontrolling interests | |||||||||||
| Total equity | |||||||||||
| Total liabilities and equity | $ | $ | |||||||||
See Notes to Consolidated Financial Statements.
HHC 2021 FORM 10-K | 78
| FINANCIAL STATEMENTS | |||||
THE HOWARD HUGHES CORPORATION
CONSOLIDATED STATEMENTS OF OPERATIONS
| Year Ended December 31, | |||||||||||||||||
| thousands except per share amounts | 2021 | 2020 | 2019 | ||||||||||||||
| REVENUES | |||||||||||||||||
| Rental revenue | $ | $ | $ | ||||||||||||||
| Master Planned Communities land sales | |||||||||||||||||
| Condominium rights and unit sales | |||||||||||||||||
| Other land, rental and property revenues | |||||||||||||||||
| Builder price participation | |||||||||||||||||
| Total revenues | |||||||||||||||||
| EXPENSES | |||||||||||||||||
| Operating costs | |||||||||||||||||
| Master Planned Communities cost of sales | |||||||||||||||||
| Condominium rights and unit cost of sales | |||||||||||||||||
| Rental property real estate taxes | |||||||||||||||||
| Provision for (recovery of) doubtful accounts | ( | ( | |||||||||||||||
| Demolition costs | |||||||||||||||||
| Development-related marketing costs | |||||||||||||||||
| General and administrative | |||||||||||||||||
| Depreciation and amortization | |||||||||||||||||
| Total expenses | |||||||||||||||||
| OTHER | |||||||||||||||||
| Provision for impairment | ( | ( | |||||||||||||||
| Gain (loss) on sale or disposal of real estate and other assets, net | |||||||||||||||||
| Other income (loss), net | ( | ||||||||||||||||
| Total other | |||||||||||||||||
| Operating income (loss) | ( | ||||||||||||||||
| Selling profit from sales-type leases | |||||||||||||||||
| Interest income | |||||||||||||||||
| Interest expense | ( | ( | ( | ||||||||||||||
| Gain (loss) on extinguishment of debt | ( | ( | |||||||||||||||
| Equity in earnings (losses) from real estate and other affiliates | ( | ||||||||||||||||
| Income (loss) before income taxes | |||||||||||||||||
| Income tax expense (benefit) | |||||||||||||||||
| Net income (loss) | ( | ||||||||||||||||
| Net (income) loss attributable to noncontrolling interests | ( | ( | |||||||||||||||
| Net income (loss) attributable to common stockholders | $ | $ | ( | $ | |||||||||||||
| Basic income (loss) per share | $ | $ | ( | $ | |||||||||||||
| Diluted income (loss) per share | $ | $ | ( | $ | |||||||||||||
See Notes to Consolidated Financial Statements.
HHC 2021 FORM 10-K | 79
| FINANCIAL STATEMENTS | |||||
THE HOWARD HUGHES CORPORATION
CONSOLIDATED STATEMENTS OF COMPREHENSIVE INCOME (LOSS)
| Year Ended December 31, | |||||||||||||||||
| thousands | 2021 | 2020 | 2019 | ||||||||||||||
| Net income (loss) | $ | $ | ( | $ | |||||||||||||
| Other comprehensive income (loss) | |||||||||||||||||
| Interest rate swaps (a) | ( | ( | |||||||||||||||
| Capitalized swap interest (expense) income (b) | ( | ||||||||||||||||
| Pension adjustment (b) | ( | ||||||||||||||||
| Deconsolidation of 110 North Wacker (c) | |||||||||||||||||
| Share of investee's other comprehensive income (d) | |||||||||||||||||
| Other comprehensive income (loss) | ( | ( | |||||||||||||||
| Comprehensive income (loss) | ( | ||||||||||||||||
| Comprehensive (income) loss attributable to noncontrolling interests | ( | ( | |||||||||||||||
| Comprehensive income (loss) attributable to common stockholders | $ | $ | ( | $ | |||||||||||||
(a)Amounts are shown net of deferred tax expense of $5.1 million for the year ended December 31, 2021, deferred tax benefit of $5.3 million for the year ended December 31, 2020, and deferred tax benefit of $6.2 million for the year ended December 31, 2019.
(b)The deferred tax impact was not meaningful for the years ended December 31, 2021, 2020 and 2019.
(c)The amount for 2020 represents the derecognition of Other comprehensive income (loss) related to interest rate collars on the 110 North Wacker debt, shown net of deferred tax expense of $1.0 million.
(d)Amounts are shown net of deferred tax expense of $1.6 million for the year ended December 31, 2021, and $0.3 million for the year ended December 31, 2020.
See Notes to Consolidated Financial Statements.
HHC 2021 FORM 10-K | 80
| FINANCIAL STATEMENTS | |||||
THE HOWARD HUGHES CORPORATION
CONSOLIDATED STATEMENTS OF EQUITY
| Accumulated | ||||||||||||||||||||||||||||||||
| Additional | Other | Total | ||||||||||||||||||||||||||||||
| thousands except shares | Common Stock | Paid-In | Accumulated | Comprehensive | Treasury Stock | Stockholders' | Noncontrolling | Total | ||||||||||||||||||||||||
| Shares | Amount | Capital | Deficit | (Loss) | Shares | Amount | Equity | Interests (a) | Equity | |||||||||||||||||||||||
| Balance, January 1, 2019 | $ | $ | $ | ( | $ | ( | ( | $ | ( | $ | $ | $ | ||||||||||||||||||||
| Net income | — | — | — | — | — | — | ||||||||||||||||||||||||||
Interest rate swaps,net of tax expense (benefit) of $( | — | — | — | — | ( | — | — | ( | — | ( | ||||||||||||||||||||||
Pension adjustment,net of tax expense (benefit) of $( | — | — | — | — | — | — | — | |||||||||||||||||||||||||
Capitalized swap interest, net of tax expense (benefit) of $ | — | — | — | — | ( | — | — | ( | — | ( | ||||||||||||||||||||||
| Deconsolidation of equity investments | — | — | — | — | — | — | — | — | ( | ( | ||||||||||||||||||||||
| Deconsolidation of Associations of Unit Owners | — | — | — | — | — | — | — | — | ( | ( | ||||||||||||||||||||||
| Repurchase of common shares | — | — | — | — | — | ( | ( | ( | — | ( | ||||||||||||||||||||||
| Contributions to joint ventures | — | — | — | — | — | — | — | — | ||||||||||||||||||||||||
| Stock plan activity | — | — | ( | ( | — | |||||||||||||||||||||||||||
| Balance, December 31, 2019 | $ | $ | $ | ( | $ | ( | ( | $ | ( | $ | $ | $ | ||||||||||||||||||||
Net income(loss), excluding income of $ | — | — | — | ( | — | — | — | ( | ( | |||||||||||||||||||||||
Interest rate swaps,net of tax expense (benefit) of $( | — | — | — | — | ( | — | — | ( | — | ( | ||||||||||||||||||||||
Pension adjustment, net of tax expense (benefit) of $ | — | — | — | — | ( | — | — | ( | — | ( | ||||||||||||||||||||||
| Reclassification of redeemable noncontrolling interest to temporary equity | — | — | — | — | — | — | — | — | ( | ( | ||||||||||||||||||||||
Share of investee's other comprehensive income, net of tax expense (benefit) of $ | — | — | — | — | — | — | — | |||||||||||||||||||||||||
Derecognition of 110 North Wacker,net of tax expense (benefit)of $ | — | — | — | — | — | ( | ( | |||||||||||||||||||||||||
| — | — | — | ( | — | — | — | ( | — | ( | |||||||||||||||||||||||
| Issuance of common shares | — | — | — | — | — | |||||||||||||||||||||||||||
| Stock plan activity | — | — | ( | ( | — | |||||||||||||||||||||||||||
| Balance, December 31, 2020 | $ | $ | $ | ( | $ | ( | ( | $ | ( | $ | $ | $ | ||||||||||||||||||||
Net income(loss), excluding a loss of $ | — | — | — | — | — | — | ||||||||||||||||||||||||||
Interest rate swaps,net of tax expense (benefit) of $ | — | — | — | — | — | — | — | |||||||||||||||||||||||||
Pension adjustment,net of tax expense (benefit) of $ | — | — | — | — | — | — | ||||||||||||||||||||||||||
Share of investee's other comprehensive income, net of tax expense (benefit) of $ | — | — | — | — | — | — | — | |||||||||||||||||||||||||
| Issuance of common shares | — | — | ( | — | — | — | — | ( | — | ( | ||||||||||||||||||||||
| Repurchase of common shares | — | — | — | — | — | ( | ( | ( | ( | |||||||||||||||||||||||
| Stock plan activity | — | — | ( | ( | — | |||||||||||||||||||||||||||
| Balance, December 31, 2021 | $ | $ | $ | ( | $ | ( | ( | $ | ( | $ | $ | $ | ||||||||||||||||||||
(a)Excludes redeemable noncontrolling interest, which is reflected in temporary equity. See Note 2 - Investments in Real Estate and Other Affiliates.
(b)Related to deconsolidation of 110 North Wacker. Refer to Note 2 - Investments in Real Estate and Other Affiliates for additional information.
(c)Related to the adoption of ASU 2016-13, Financial Instruments-Credit Losses (Topic 326) and all its related amendments as of January 1, 2020.
See Notes to Consolidated Financial Statements.
HHC 2021 FORM 10-K | 81
| FINANCIAL STATEMENTS | |||||
THE HOWARD HUGHES CORPORATION
CONSOLIDATED STATEMENTS OF CASH FLOWS
| Year Ended December 31, | |||||||||||||||||
| thousands | 2021 | 2020 | 2019 | ||||||||||||||
| CASH FLOWS FROM OPERATING ACTIVITIES | |||||||||||||||||
| Net income (loss) | $ | $ | ( | $ | |||||||||||||
| Adjustments to reconcile net income (loss) to cash provided by (used in) operating activities: | |||||||||||||||||
| Depreciation | |||||||||||||||||
| Amortization | |||||||||||||||||
| Amortization of deferred financing costs | |||||||||||||||||
| Amortization of intangibles other than in-place leases | |||||||||||||||||
| Straight-line rent amortization | ( | ( | ( | ||||||||||||||
| Deferred income taxes | |||||||||||||||||
| Restricted stock and stock option amortization | |||||||||||||||||
| Net gain on sale of properties | ( | ( | ( | ||||||||||||||
| Net gain on sale of equity method investments | ( | ||||||||||||||||
| Net gain on sale of lease receivable | ( | ||||||||||||||||
| Proceeds from the sale of lease receivable | |||||||||||||||||
| Selling profit from sales-type leases | ( | ||||||||||||||||
| (Gain) loss on extinguishment of debt | ( | ||||||||||||||||
| Impairment charges | |||||||||||||||||
| Equity in (earnings) losses from real estate and other affiliates, net of distributions | ( | ( | |||||||||||||||
| Provision for doubtful accounts | ( | ||||||||||||||||
| Master Planned Community land acquisitions | ( | ( | |||||||||||||||
| Master Planned Community development expenditures | ( | ( | ( | ||||||||||||||
| Master Planned Community cost of sales | |||||||||||||||||
| Condominium development expenditures | ( | ( | ( | ||||||||||||||
| Condominium rights and units cost of sales | |||||||||||||||||
| Net Changes: | |||||||||||||||||
| Accounts and notes receivable | |||||||||||||||||
| Prepaid expenses and other assets | ( | ( | |||||||||||||||
| Condominium deposits received | ( | ||||||||||||||||
| Deferred expenses | ( | ( | ( | ||||||||||||||
| Accounts payable and accrued expenses | ( | ||||||||||||||||
| Cash provided by (used in) operating activities | ( | ( | |||||||||||||||
| CASH FLOWS FROM INVESTING ACTIVITIES | |||||||||||||||||
| Property and equipment expenditures | ( | ( | ( | ||||||||||||||
| Operating property improvements | ( | ( | ( | ||||||||||||||
| Property development and redevelopment | ( | ( | ( | ||||||||||||||
| Acquisition of assets | ( | ||||||||||||||||
| Proceeds from sales of properties | |||||||||||||||||
| Reimbursements under tax increment financings | |||||||||||||||||
| Distributions from real estate and other affiliates | |||||||||||||||||
| Investments in real estate and other affiliates, net | ( | ( | ( | ||||||||||||||
| Cash provided by (used in) investing activities | ( | ( | |||||||||||||||
HHC 2021 FORM 10-K | 82
| FINANCIAL STATEMENTS | |||||
| Year Ended December 31, | |||||||||||||||||
| thousands | 2021 | 2020 | 2019 | ||||||||||||||
| CASH FLOWS FROM FINANCING ACTIVITIES | |||||||||||||||||
| Proceeds from mortgages, notes and loans payable | |||||||||||||||||
| Principal payments on mortgages, notes and loans payable | ( | ( | ( | ||||||||||||||
| Proceeds from issuance of common stock | |||||||||||||||||
| Repurchases of common shares | ( | ( | |||||||||||||||
| Debt extinguishment costs | ( | ||||||||||||||||
| Special Improvement District bond funds released from (held in) escrow | |||||||||||||||||
| Deferred financing costs and bond issuance costs, net | ( | ( | ( | ||||||||||||||
| Taxes paid on stock options exercised and restricted stock vested | ( | ( | ( | ||||||||||||||
| Stock options exercised | |||||||||||||||||
| Issuance of noncontrolling interests | |||||||||||||||||
| Cash provided by (used in) financing activities | |||||||||||||||||
| Net change in cash, cash equivalents and restricted cash | ( | ( | |||||||||||||||
| Cash, cash equivalents and restricted cash at beginning of period | |||||||||||||||||
| Cash, cash equivalents and restricted cash at end of period | $ | $ | $ | ||||||||||||||
| SUPPLEMENTAL DISCLOSURE OF CASH FLOW INFORMATION | |||||||||||||||||
| Interest paid | $ | $ | $ | ||||||||||||||
| Interest capitalized | |||||||||||||||||
| Income taxes paid (refunded), net | ( | ( | |||||||||||||||
| NON-CASH TRANSACTIONS | |||||||||||||||||
| Initial recognition of ASC 842 operating leases ROU asset | |||||||||||||||||
| Initial recognition of ASC 842 operating lease obligation | |||||||||||||||||
| Accrued property improvements, developments and redevelopments | ( | ||||||||||||||||
| Special Improvement District bond transfers associated with land sales | |||||||||||||||||
| Special Improvement District bonds held in third-party escrow | |||||||||||||||||
| Accrued interest on construction loan borrowing | |||||||||||||||||
| Capitalized stock compensation | |||||||||||||||||
| Accrued repurchase of common shares | |||||||||||||||||
See Notes to Consolidated Financial Statements.
HHC 2021 FORM 10-K | 83
FINANCIAL STATEMENTS FOOTNOTES | |||||
| 1. Summary of Significant Accounting Policies | ||
General The Howard Hughes Corporation is a Delaware corporation that was formed on July 1, 2010. Together with its subsidiaries (herein, HHC or the Company), HHC develops Master Planned Communities (MPC) and residential condominiums, transforms a multi-block district largely under private management in New York City into a lifestyle destination (Seaport), invests in other strategic real estate opportunities in the form of entitled and unentitled land and other development rights (Strategic Developments) and owns, manages and operates real estate assets currently generating revenues (Operating Assets), which may be redeveloped or repositioned from time to time.
Certain amounts in the 2020 Consolidated Balance Sheet have been reclassified to conform to the current presentation. Specifically, the Company reclassified straight-line rent from Prepaid expenses and other assets, net to Accounts Receivable, net.
COVID-19 Pandemic The 2020 outbreak of the novel strain of the coronavirus (COVID-19) resulted in a global slowdown of economic activity including worldwide travel restrictions, prohibitions of non-essential work activities, and the disruption and shutdown of businesses, all of which resulted in significant uncertainty in global financial markets and a material adverse impact on the Company’s financial performance in fiscal 2020, particularly in the Operating Asset and Seaport segments. Many states began easing quarantine protocols near the end of the second quarter of 2020, which allowed most of the Company’s retail and hospitality properties to resume operations on a limited basis. While COVID-19 has adversely impacted all business segments during 2020 and 2021, the Company’s performance notably improved during the second half of 2020. This improvement has continued through 2021.
The extent to which COVID-19 continues to impact the Company will depend on future developments, which are highly uncertain and cannot be predicted with confidence, including the actions taken to contain the pandemic or mitigate its impact, such as the speed and effectiveness of vaccine and treatment developments and their deployment, potential mutations of COVID-19, and the direct and indirect economic effects of the pandemic and containment measures.
HHC 2021 FORM 10-K | 84
FINANCIAL STATEMENTS FOOTNOTES | |||||
Investment in Real Estate
Master Planned Community Assets, Buildings and Equipment and Land Real estate assets are stated at cost less any provisions for impairments. Expenditures for significant improvements to the Company’s assets are capitalized. Tenant improvements relating to the Company’s operating assets are capitalized and depreciated over the shorter of their economic lives or the lease term. Maintenance and repair costs are charged to expense when incurred.
The Company periodically reviews the estimated useful lives of properties. Depreciation or amortization expense is computed using the straight‑line method based upon the following estimated useful lives:
| Asset Type | Years | Balance Sheet Location | |||||||||
| Buildings and improvements | Buildings and Equipment | ||||||||||
| Equipment and fixtures | Buildings and Equipment | ||||||||||
| Computer hardware and software, and vehicles | Buildings and Equipment | ||||||||||
| Tenant improvements | Lesser of lease term or useful life | Buildings and Equipment | |||||||||
| Leasing costs | Related lease term | Prepaid expenses and other assets, net | |||||||||
From time to time, the Company may reassess the development strategies for certain buildings and improvements which results in changes to the Company’s estimate of their remaining useful lives. The Company did not recognize additional depreciation expense of significance for the years ended December 31, 2021, 2020 and 2019.
Developments Development costs, which primarily include direct costs related to placing the asset in service associated with specific development properties, are capitalized as part of the property being developed. Construction and improvement costs incurred in connection with the development of new properties or the redevelopment of existing properties are capitalized before they are placed into service. Costs include planning, engineering, design, direct material, labor and subcontract costs. Real estate taxes, utilities, direct legal and professional fees related to the sale of a specific unit, interest, insurance costs and certain employee costs incurred during construction periods are also capitalized. Capitalization commences when the development activities begin and ceases when a project is completed, put on hold or at the date that the Company decides to not move forward with a project. Capitalized costs related to a project where HHC has determined not to move forward are expensed if they are not deemed recoverable. Capitalized interest costs are based on qualified expenditures and interest rates in place during the construction period. Demolition costs associated with redevelopments are expensed as incurred unless the demolition was included in the Company’s development plans and imminent as of the acquisition date of an asset. Once the assets are placed into service, they are depreciated in accordance with HHC’s policy. In the event that management no longer has the ability or intent to complete a development, the costs previously capitalized are evaluated for impairment.
Developments consist of the following categories as of December 31:
| thousands | 2021 | 2020 | |||||||||
| Land and improvements | $ | $ | |||||||||
| Development costs | |||||||||||
| Total Developments | $ | $ | |||||||||
HHC 2021 FORM 10-K | 85
FINANCIAL STATEMENTS FOOTNOTES | |||||
The Company also performs a qualitative assessment of each VIE to determine if HHC is the primary beneficiary. Under ASC 810, a company concludes that it is the primary beneficiary and consolidates the VIE if the company has both (a) the power to direct the economically significant activities of the entity and (b) the obligation to absorb losses of, or the right to receive benefits from, the entity that could potentially be significant to the VIE. The Company considers the contractual agreements that define the ownership structure, distribution of profits and losses, risks, responsibilities, indebtedness, voting rights and board representation of the respective parties in determining if the company is the primary beneficiary. As required by ASC 810, management’s assessment of whether the Company is the primary beneficiary of a VIE is continuously performed.
The Company accounts for VIEs for which it is not considered to be the primary beneficiary but has significant influence using the equity method, and investments in VIEs where HHC does not have significant influence on the joint venture’s operating and financial policies using the cost method. The Company accounts for investments in joint ventures where it owns a noncontrolling interest using the equity method. For investments in joint ventures where the Company has virtually no influence on the joint venture’s operating and financial policies, the Company has elected the measurement alternative to carry the securities at cost less impairment, if any, plus or minus changes resulting from observable price changes in orderly transactions for the identical or similar investment of the issuer. Equity securities not accounted for under the equity method are required to be reported at fair value with unrealized gains and losses reported in the Consolidated Statements of Comprehensive Income (Loss) as Net unrealized gains (losses) on instruments measured at fair value through earnings, unless the securities do not have readily determinable fair values.
Acquisitions of Properties The Company accounts for the acquisition of real estate properties in accordance with ASC 805 Business Combinations (ASC 805). This methodology requires that assets acquired and liabilities assumed be recorded at their fair values on the date of acquisition for business combinations and at relative fair values for asset acquisitions.
Costs directly related to asset acquisitions are considered additions to the purchase price and increase the cost basis recorded for the Investment in Real Estate. Acquisition costs related to the acquisition of a business are expensed as incurred.
The fair value of tangible assets of an acquired property (which includes land, buildings and improvements) is determined by valuing the property as if it were vacant, and the as-if-vacant value is then allocated to land, buildings and improvements based on management’s determination of the fair value of these assets. The as-if-vacant values are derived from several sources which incorporate significant unobservable inputs that are classified as Level 3 inputs in the fair value hierarchy and primarily include a discounted cash flow analysis using discount and capitalization rates based on recent comparable market transactions, where available.
The fair value of acquired intangible assets consisting of in-place, above-market and below-market leases is recorded based on a variety of considerations, some of which incorporate significant unobservable inputs that are classified as Level 3 inputs in the fair value hierarchy. In-place lease considerations include, but are not necessarily limited to: (1) the value associated with avoiding the cost of originating the acquired in-place leases (i.e., the market cost to execute a lease, including leasing commissions and tenant improvements); (2) the value associated with lost revenue related to tenant reimbursable operating costs incurred during the assumed lease-up period (i.e., real estate taxes, insurance and certain other operating expenses); and (3) the value associated with lost rental revenue from existing leases during the assumed lease-up period. Above-market and below-market leases are valued at the present value, using a discount rate that reflects the risks associated with the leases acquired, of the difference between (1) the contractual amounts to be paid pursuant to the in-place lease; and (2) management’s estimate of current market lease rates, measured over the remaining non-cancelable lease term, including any below-market renewal option periods.
HHC 2021 FORM 10-K | 86
FINANCIAL STATEMENTS FOOTNOTES | |||||
Impairment HHC reviews its long-lived assets (including those held by its Real estate and other affiliates) for potential impairment indicators whenever events or changes in circumstances indicate that the carrying amount may not be recoverable. An impairment loss is recognized if the carrying amount of an asset is not recoverable and exceeds its fair value. The evaluation of anticipated cash flows is highly subjective and is based in part on assumptions regarding future economic conditions, such as occupancy, rental rates, capital requirements and sales values that could differ materially from actual results in future periods. If impairment indicators exist and it is expected that undiscounted cash flows generated by the asset are less than its carrying amount, less costs to sell in the case of assets classified as held for sale, an impairment provision is recorded to write-down the carrying amount of the asset to its fair value.
Impairment indicators for HHC’s assets or projects within MPCs are assessed separately and include, but are not limited to, significant decreases in sales pace or average selling prices, significant increases in expected land development and construction costs or cancellation rates, and projected losses on expected future sales. MPC assets have extended life cycles that may last 20 to 40 years, or longer, and have few long‑term contractual cash flows. Further, MPC assets generally have minimal to no residual values because of their liquidating characteristics. MPC development periods often occur through several economic cycles. Subjective factors such as the expected timing of property development and sales, optimal development density and sales strategy impact the timing and amount of expected future cash flows and fair value.
Impairment indicators for Operating Assets are assessed for each property and include, but are not limited to, significant decreases in net operating income, significant decreases in occupancy, ongoing low occupancy and significant net operating losses.
Impairment indicators for Seaport include, but are not limited to, significant changes in projected completion dates, operating revenues or cash flows, development costs, ongoing low occupancy, and market factors.
Impairment indicators for assets in the Strategic Developments are assessed by project and include, but are not limited to, significant changes in projected completion dates, revenues or cash flows, development costs, market factors, significant decreases in comparable property sale prices and feasibility.
The cash flow estimates used both for determining recoverability and estimating fair value are inherently judgmental and reflect current and projected trends in rental, occupancy, pricing, development costs, sales pace and capitalization rates, and estimated holding periods for the applicable assets. Although the estimated fair value of certain assets may be exceeded by the carrying amount, a real estate asset is only considered to be impaired when its carrying amount is not expected to be recovered through estimated future undiscounted cash flows. To the extent an impairment provision is necessary, the excess of the carrying amount of the asset over its estimated fair value is expensed to operations. In addition, the impairment provision is allocated proportionately to adjust the carrying amount of the asset. The adjusted carrying amount, which represents the new cost basis of the asset, is depreciated over the remaining useful life of the asset or, for MPCs, is expensed as a cost of sales when land is sold. Assets that have been impaired will in the future have lower depreciation and cost of sale expenses. The impairment will have no impact on cash flow.
With respect to HHC’s Investment in real estate and other affiliates, a series of operating losses of an underlying asset or other factors may indicate that a decrease in value has occurred which is other‑than‑temporary. The investment in each real estate and other affiliate is evaluated periodically and as deemed necessary for recoverability and valuation declines that are other‑than‑temporary. If the decrease in value of an investment in a real estate and other affiliate is deemed to be other‑than‑temporary, HHC’s investment is reduced to its estimated fair value. In addition to the property‑specific impairment analysis that are performed on the underlying assets of the investment, the Company also considers the ownership, distribution preferences, limitations and rights to sell and repurchase its ownership interests.
HHC 2021 FORM 10-K | 87
FINANCIAL STATEMENTS FOOTNOTES | |||||
The following table represents the components of Accounts Receivable, net of amounts considered uncollectible, in the accompanying Consolidated Balance Sheets as of December 31:
| thousands | 2021 | 2020 | |||||||||
| Straight-line rent receivables | $ | $ | |||||||||
| Tenant receivables | |||||||||||
| Other receivables | |||||||||||
| Accounts receivable, net (a) | $ | $ | |||||||||
The following table summarizes the impacts of the ASC 842 and ASC 450 reserves in the accompanying Consolidated Statements of Operations for the years ended December 31:
| thousands | Income Statement Location | 2021 | 2020 | 2019 | ||||||||||||||||
| ASC 842 reserve | Rental revenue | $ | ( | $ | $ | |||||||||||||||
| ASC 450 reserve | Provision for (recovery of) doubtful accounts | ( | ( | |||||||||||||||||
| Total impact | $ | ( | $ | $ | ||||||||||||||||
Notes Receivable, net Notes receivable, net includes non-derivative financial assets with fixed or determinable payments that are not quoted in an active market. Subsequent to initial recognition, they are recorded at amortized cost less any provision for impairment as required under ASC 326 - Financial Instruments - Credit Losses. Refer to discussion below for information related to the adoption of ASC 326 in 2020.
Municipal Utility District Receivables, net In Houston, Texas, certain development costs are reimbursable through the creation of a Municipal Utility District (MUD), also known as Water Control and Improvement Districts, which are separate political subdivisions authorized by Article 16, Section 59 of the Texas Constitution and governed by the Texas Commission on Environmental Quality (TCEQ). MUDs are formed to provide municipal water, wastewater, drainage services, recreational facilities and roads to those areas where they are currently unavailable through the regular city services. Typically, the developer advances funds for the creation of the facilities, which must be designed, bid and constructed in accordance with the City of Houston’s and TCEQ requirements.
HHC 2021 FORM 10-K | 88
FINANCIAL STATEMENTS FOOTNOTES | |||||
SID receivables are amounts due from SID bonds related to the Company’s Summerlin MPC. Proceeds from SID bonds are held in escrow by a third-party and are used to reimburse the Company for a portion of the development costs incurred in Summerlin. SID receivables are $86.2 million as of December 31, 2021, and $54.8 million as of December 31, 2020.
Tax increment financing (TIF) receivables are amounts which the Company has submitted for reimbursement from Howard County, Maryland, in conjunction with development costs expended on key roads and infrastructure work within the Merriweather District of Columbia specified per the terms of the county’s TIF legislation and Special Obligation Bonds issued in October 2017. TIF receivables are $0.9 million as of December 31, 2021, and $0.9 million as of December 31, 2020.
Income Taxes The Company utilizes the asset and liability method of accounting for income taxes. Under this method, deferred tax assets and liabilities are determined based on the difference between the financial statement carrying amounts and tax bases of assets and liabilities using enacted tax rates in effect for years in which the temporary differences are expected to reverse. Deferred income taxes also reflect the impact of operating loss and tax credit carryforwards.
The Company periodically assesses the realizability of its deferred tax assets. If the Company concludes that it is more likely than not that some of the deferred tax assets will not be realized, the tax asset is reduced by a valuation allowance. The Company considers many factors when assessing the likelihood of future realization of deferred tax assets, including expectations of future taxable income, carryforward periods available to the Company for tax reporting purposes, various income tax strategies and other relevant factors. In addition, interest and penalties related to uncertain tax positions, if necessary, are recognized in income tax expense.
HHC 2021 FORM 10-K | 89
FINANCIAL STATEMENTS FOOTNOTES | |||||
Revenue Recognition and Related Matters
Condominium Rights and Unit Sales Revenue from the sale of an individual unit in a condominium project is recognized at a point in time (i.e., the closing) when HHC satisfies the single performance obligation to construct a condominium project and transfer control of a completed unit to a buyer. The transaction price, which is the amount of consideration the Company receives upon delivery of the completed condominium unit to the buyer, is allocated to this single obligation and is received at closing less any amounts previously paid on deposit.
The Company receives cash payments in the form of escrowed condominium deposits from customers who have contracted to purchase a condominium unit based on billing schedules established in HHC’s condominium purchase agreement contracts. The amounts are recorded in Restricted cash until released from escrow in accordance with the escrow agreement and on approval of HHC’s lender to fund construction costs of a project. A corresponding condominium contract deposit liability is established at the date of receipt, representing a portion of HHC’s unsatisfied performance obligation at each reporting date.
These deposits, along with the balance of the contract value, are recognized at closing upon satisfaction of HHC’s performance obligation and transfer of title to the buyer. Real estate project costs directly associated with a condominium project, which are HHC’s costs to fulfill contracts with condominium buyers, are capitalized while all other costs are expensed as incurred. Total estimated project costs include direct costs such as the carrying value of the land, site planning, architectural, construction and financing costs, as well as indirect cost allocations. The allocations include costs which clearly relate to the specific project, including certain infrastructure and amenity costs which benefit the project as well as others, and are based upon the relative sales value of the units. Costs incurred to sell condominium units are evaluated for capitalization in accordance with ASC 340-40, and incremental costs of obtaining and fulfilling a contract are capitalized only if the costs relate directly to a specifically identified contract, enhance resources to satisfy performance obligations in the future and are expected to be recovered.
Master Planned Community Land Sales Revenues from land sales are recognized at a point in time when the land sale closing process is complete. The transaction price generally has both fixed and variable components, with the fixed price stipulated in the contract and representative of a single performance obligation. See Builder Price Participation (BPP) below for a discussion of the variable component. The fixed transaction price, which is the amount of consideration received in full upon transfer of the land title to the buyer, is allocated to this single obligation and is received at closing of the land sale less any amounts previously paid on deposit.
The Company receives cash payments in the form of land purchase deposits from homebuilders or other commercial buyers who have contracted to purchase land within the Company’s MPCs, and HHC holds any escrowed deposits in Restricted cash or Cash and cash equivalents based on the terms of the contract. In situations where the Company has completed the closing of a developed land parcel or superpad and consideration is paid in full, but a portion of HHC’s performance obligation relating to the enhancement of the land is still unsatisfied, revenue related to HHC’s obligation is recognized over time. The Company recognizes only the portion of the improved land sale where the improvements are fully satisfied based on a cost input method. The aggregate amount of the transaction price allocated to the unsatisfied obligation is recorded as deferred land sales and is presented in Accounts payable and accrued expenses. The Company measures the completion of HHC’s unsatisfied obligation based on the costs remaining relative to the total cost at the date of closing.
HHC 2021 FORM 10-K | 90
FINANCIAL STATEMENTS FOOTNOTES | |||||
When residential or commercial land is sold, the cost of sales includes actual costs incurred and estimates of future development costs benefiting the property sold. In accordance with ASC 970-360-30-1, when land is sold, costs are allocated to each sold superpad or lot based upon the relative sales value. For purposes of allocating development costs, estimates of future revenues and development costs are re-evaluated throughout the year, with adjustments being allocated prospectively to the remaining parcels available for sale. For certain parcels of land, including acquired parcels that the Company does not intend to develop or for which development was complete at the date of acquisition, the specific identification method is used to determine the cost of sales.
Builder Price Participation BPP is the variable component of the transaction price for certain Master Planned Communities Land Sales. BPP is earned when a developer that acquired land from HHC develops and sells a home to an end user at a price higher than a predetermined breakpoint. The excess over the breakpoint is shared between HHC and the developer at the time of closing on the sale of the home based on a percentage previously agreed upon. The Company concluded that as of December 31, 2021, BPP was constrained, as discussed below, and accordingly, the Company did not recognize an estimate of variable consideration. The Company’s conclusion is based on the following factors:
–BPP is highly susceptible to factors outside HHC’s influence such as unemployment and interest rates
–the time between the sale of land to a homebuilder and closing on a completed home can take up to three years
–there is significant variability in home pricing from period to period
The Company evaluates contracts with homebuilders with respect to BPP at each reporting period to determine whether a change in facts and circumstances has eliminated the constraint and will record an estimate of BPP revenue, if applicable.
For Condominium Rights and Unit Sales, Master Planned Community Land Sales and Builder Price Participation the Company elected the practical expedient to not adjust promised amount of consideration for the effects of a significant financing component when the period between transfer of the promised asset and payment is expected to be one year or less.
Rental Revenues Revenue associated with the Company’s operating assets includes minimum rent, percentage rent in lieu of fixed minimum rent, tenant recoveries and overage rent.
Minimum rent revenues are recognized on a straight‑line basis over the terms of the related leases when collectability is reasonably assured and the tenant has taken possession of, or controls, the physical use of the leased asset. Percentage rent in lieu of fixed minimum rent is recognized as sales are reported from tenants. Minimum rent revenues reported on the Consolidated Statements of Operations also include amortization related to above and below‑market tenant leases on acquired properties.
Recoveries from tenants are stipulated in the leases, are generally computed based upon a formula related to real estate taxes, insurance and other real estate operating expenses, and are generally recognized as revenues in the period the related costs are incurred.
Overage rent is recognized on an accrual basis once tenant sales exceed contractual thresholds contained in the lease and is calculated by multiplying the tenant sales in excess of the minimum amount by a percentage defined in the lease.
If the lease provides for tenant improvements, the Company determines whether the tenant improvements are owned by the tenant or by HHC. When HHC is the owner of the tenant improvements, rental revenue begins when the improvements are substantially complete. When the tenant is the owner of the tenant improvements, any tenant allowance funded by the Company is treated as a lease incentive and amortized as an adjustment to rental revenue over the lease term.
Other Land, Rental and Property Revenues - Over Time and Point in Time Other land revenues recognized over time include ground maintenance revenue, homeowner association management fee revenue and revenue from providing exclusive cable and internet services at the Company’s MPCs for the benefit of the tenants and owners of the communities. These revenues are recognized over time, as time elapses. The amount of consideration and the duration are fixed, as stipulated in the related agreements, and represent a single performance obligation.
Other land revenues also include transfer fees on the secondary sales of homes in MPCs, forfeitures of earnest money deposits by buyers of HHC’s condominium units and other miscellaneous items. These items are recognized at a point in time when the real estate closing process is complete or HHC has a legal right to the respective fee or deposit.
HHC 2021 FORM 10-K | 91
FINANCIAL STATEMENTS FOOTNOTES | |||||
Other rental and property revenues related to contracts with customers is generally comprised of baseball related ticket sales, retail operations, food sales, advertising and sponsorships. Season ticket sales are recognized over time as games take place. Single tickets and total net sales from retail operations are recognized at a point in time, at the time of sale when payment is received and the customer takes possession of the merchandise. In all cases, the transaction prices are fixed, stipulated in the ticket, contract or product, and representative in each case of a single performance obligation. Events-related service revenue is recorded at the time the customer receives the benefit of the service.
Hospitality revenues were recognized at a point in time in accordance with the pattern of each related service. Lodging was recognized on daily increments, while retail services such as food and beverage were recognized at the point of sale. The transaction price was fixed, clearly stipulated and representative of a single performance obligation in all cases. The duration of all contracts with customers of HHC’s hospitality lodging and related services were generally short. In September 2021, the Company completed the sale of its three hospitality properties.
Baseball-related and other sponsorships generally cover a season or contractual period of time, and the related revenue is generally recognized on a straight-line basis over time, as time elapses, unless a specific performance obligation exists within the sponsorship contract where point-in-time delivery occurs and recognition at a specific performance or delivery date is more appropriate. Advertising and sponsorship agreements that allow third parties to display their advertising and products at HHC’s venues for a certain amount of time relate to a single performance obligation, consideration terms for these services are fixed in each respective agreement, and HHC generally recognizes the related revenue on a straight-line basis over time, as time elapses.
Financial Instruments - Credit Losses The Company is exposed to credit losses through the sale of goods and services to the Company’s customers. Receivables held by the Company primarily relate to short-term trade receivables and financing receivables, which include MUD receivables, SID bonds, TIF receivables, net investments in lease receivables, and notes receivable. The Company assesses its exposure to credit loss based on historical collection experience and future expectations by portfolio segment. Historical collection experience is evaluated on a quarterly basis by the Company.
The amortized cost basis of financing receivables, consisting primarily of MUD and SID receivables, totaled $484.7 million as of December 31, 2021, and $374.2 million as of December 31, 2020. The MUD receivable balance includes accrued interest of $18.2 million at December 31, 2021 and $15.7 million at December 31, 2020. The allowance for credit losses for financing receivables was not material as of December 31, 2021 and 2020, and there was no material activity related to the allowance for credit losses for the year ended December 31, 2021.
Financing receivables are considered to be past due once they are 30 days contractually past due under the terms of the agreement. The Company currently does not have significant financing receivables that are past due or on nonaccrual status. There have been no significant write-offs or recoveries of amounts previously written-off during the current period for financing receivables.
HHC 2021 FORM 10-K | 92
FINANCIAL STATEMENTS FOOTNOTES | |||||
Recently Issued Accounting Standards The following is a summary of recently issued and other notable accounting pronouncements which relate to the Company’s business.
ASU 2020-04, Reference Rate Reform The amendments in this Update provide optional expedients and exceptions for applying GAAP to contracts, hedging relationships, and other transactions affected by reference rate reform when certain criteria are met. The amendments in this Update apply only to contracts, hedging relationships, and other transactions that reference LIBOR or another reference rate expected to be discontinued because of reference rate reform. The expedients and exceptions provided by the amendments do not apply to contract modifications made and hedging relationships entered into or evaluated after December 31, 2022, except for hedging relationships existing as of December 31, 2022, for which an entity has applied certain optional expedients, that are retained through the end of the hedging relationship. The amendments in this Update are effective as of March 12, 2020, through December 31, 2022. The guidance in ASU 2020-04 is optional and may be elected over time as reference rate reform activities occur. During the first quarter of 2020, the Company has elected to apply the hedge accounting expedients related to probability and the assessments of effectiveness for future LIBOR-indexed cash flows to assume that the index upon which future hedge transactions will be based matches the index on the corresponding derivatives. Application of these expedients preserves the presentation of derivatives consistent with past presentation. The Company continues to evaluate the impact of the guidance and may apply other elections as applicable as additional changes in the market occur. An entity may elect to apply the amendments for contract modifications by Topic or Industry Subtopic as of any date from the beginning of an interim period that includes or is subsequent to March 12, 2020, or prospectively from a date within an interim period that includes or is subsequent to March 12, 2020, up to the date that the financial statements are available to be issued.
HHC 2021 FORM 10-K | 93
FINANCIAL STATEMENTS FOOTNOTES | |||||
2. Investments in Real Estate and Other Affiliates | ||
As of December 31, 2021, the Company does not consolidate the investments below as it does not have the power to direct the activities that most significantly impact the economic performance of the ventures and does not have a controlling interest in these investments. As a result, the Company reports its interests in accordance with the equity method. As of December 31, 2021, these ventures had mortgage financing totaling $671.5 million, with the Company’s proportionate share of this debt totaling $295.5 million. All of this indebtedness is without recourse to the Company, with the exception of $100.6 million related to 110 North Wacker.
Investments in real estate and other affiliates are reported as follows:
| Economic/Legal Ownership | Carrying Value | Share of Earnings/Dividends | |||||||||||||||||||||||||||||||||||||||
| December 31, | December 31 | December 31, | December 31 | Year Ended Year Ended December 31, | |||||||||||||||||||||||||||||||||||||
| thousands except percentages | 2021 | 2020 | 2021 | 2020 | 2021 | 2020 | 2019 | ||||||||||||||||||||||||||||||||||
| Equity Method Investments | |||||||||||||||||||||||||||||||||||||||||
| Operating Assets | |||||||||||||||||||||||||||||||||||||||||
| 110 North Wacker (a)(b) | see below | see below | $ | $ | $ | ( | $ | ( | $ | ||||||||||||||||||||||||||||||||
| The Metropolitan Downtown Columbia (c) | % | % | |||||||||||||||||||||||||||||||||||||||
| Stewart Title of Montgomery County, TX | % | % | |||||||||||||||||||||||||||||||||||||||
| Woodlands Sarofim #1 | % | % | |||||||||||||||||||||||||||||||||||||||
| m.flats/TEN.M (d) | % | % | ( | ||||||||||||||||||||||||||||||||||||||
| Master Planned Communities | |||||||||||||||||||||||||||||||||||||||||
| The Summit (e) | see below | see below | |||||||||||||||||||||||||||||||||||||||
| Trillium (e) | % | % | ( | ||||||||||||||||||||||||||||||||||||||
| Seaport | |||||||||||||||||||||||||||||||||||||||||
| Mr. C Seaport (f) | % | % | ( | ( | |||||||||||||||||||||||||||||||||||||
| The Lawn Club (e) | see below | see below | |||||||||||||||||||||||||||||||||||||||
| Ssäm Bar (Momofuku) (e) | see below | see below | ( | ( | ( | ||||||||||||||||||||||||||||||||||||
| Strategic Developments | |||||||||||||||||||||||||||||||||||||||||
| Circle T Ranch and Power Center (g) | % | % | |||||||||||||||||||||||||||||||||||||||
| HHMK Development | % | % | |||||||||||||||||||||||||||||||||||||||
| KR Holdings | % | % | ( | ( | |||||||||||||||||||||||||||||||||||||
| West End Alexandria (e) | see below | see below | |||||||||||||||||||||||||||||||||||||||
| 110 North Wacker (a) | see below | see below | |||||||||||||||||||||||||||||||||||||||
| ( | |||||||||||||||||||||||||||||||||||||||||
| Other equity investments (h) | |||||||||||||||||||||||||||||||||||||||||
| Investments in real estate and other affiliates | $ | $ | $ | ( | $ | $ | |||||||||||||||||||||||||||||||||||
(a)During the third quarter of 2020, 110 North Wacker was completed and placed in service. This triggered a reconsideration event that resulted in the deconsolidation of 110 North Wacker and the recognition of the retained equity method investment at fair market value. The $267.5 million gain on deconsolidation was recorded in the Strategic Developments segment and the equity method investment was transferred from the Strategic Development segment to the Operating Asset segment. Refer to the discussion below for additional details.
(b)During the fourth quarter of 2021, the Company recognized a $17.7 million impairment related to its investment in 110 North Wacker. See Note 4 - Impairment for additional information.
(c)The Metropolitan Downtown Columbia was in a deficit position of $11.3 million at December 31, 2021, and $5.0 million at December 31, 2020, due to distributions from operating cash flows in excess of basis. These deficit balances are presented in Accounts payable and accrued expenses at December 31, 2021 and 2020. The increase in the deficit balance is primarily due to a $5.0 million distribution in the third quarter of 2021.
(d)M.flats/TEN.M was in a deficit position of $6.0 million at December 31, 2021, due to distributions from operating cash flows in excess of basis. The deficit balance is presented in Accounts payable and accrued expenses at December 31, 2021.
(e)Refer to the discussion below for details on the ownership structure.
(f)During the third quarter of 2020, the Company completed the sale of its 35 % equity investment in Mr. C Seaport.
(g)During the fourth quarter of 2020, the Company completed the sale of its 50 % equity investment in Circle T Ranch and Power Center.
(h)Other equity investments represent equity investments not accounted for under the equity method. The Company elected the measurement alternative as these investments do not have readily determinable fair values. See Note 1 - Summary of Significant Accounting Policies for additional information. There were no impairments, or upward or downward adjustments to the carrying amounts of these securities either during current year 2021, or cumulatively.
HHC 2021 FORM 10-K | 94
FINANCIAL STATEMENTS FOOTNOTES | |||||
Significant activity for Investments in real estate and other affiliates and the related accounting considerations are described below.
110 North Wacker The Company formed a partnership with a local developer (the Partnership) during the second quarter of 2017. During the second quarter of 2018, the Partnership executed an agreement with USAA related to 110 North Wacker (collectively, the local developer and USAA are the Partners) to construct and operate the building at 110 North Wacker (the Venture).
The Partnership was determined to be a VIE, and as the Company has the power to direct the activities of the Partnership that most significantly impact its economic performance, the Company is considered the primary beneficiary and consolidates the Partnership. Additionally, the noncontrolling interest holder has the right to require the Company to purchase its interest in the Partnership if the Venture has not been sold or refinanced (with distributions made to the local developer and Company sufficient to repay all capital contributions), at the later of (1) the third anniversary of the issuance of the certificate of occupancy for the project or (2) the fifth anniversary of the effective date of the Partnership's LLC agreement. Therefore, the local developer’s redeemable noncontrolling interest in the Partnership is presented as temporary equity on the Consolidated Balance Sheets. As of December 31, 2021, the time restriction has not been met, and the Company believes it is not probable that the put will be redeemed. As such, the redeemable noncontrolling interest is measured at the initial carrying value plus net income (loss) attributable to the noncontrolling interest and is not adjusted to fair value.
The following table presents changes in Redeemable noncontrolling interest:
| thousands | Redeemable Noncontrolling Interest | |||||||
Balance as of December 31, 2019 | $ | |||||||
| Reclassification of redeemable noncontrolling interest to temporary equity | ||||||||
| Net income (loss) attributable to noncontrolling interest | ||||||||
| Share of investee's other comprehensive income | ||||||||
Balance as of December 31, 2020 | $ | |||||||
| Net income (loss) attributable to noncontrolling interest | ( | |||||||
| Share of investee's other comprehensive income | ||||||||
Balance as of December 31, 2021 | $ | |||||||
Upon execution of the Venture in the second quarter of 2018, the Company contributed land with a carrying value of $33.6 million and an agreed upon fair value of $85.0 million, the local developer contributed $5.0 million in cash and USAA contributed $64.0 million in cash. USAA was required to fund up to $105.6 million in addition to its initial contribution. HHC and the local developer also had additional cash funding requirements and contributed $9.8 million and $1.1 million, respectively, during 2018. The Company and its Partners entered into a construction loan agreement further described in Note 7 - Mortgages, Notes and Loans Payable, Net. Any further cash funding requirements by the Partnership were eliminated when the construction loan increased on May 23, 2019. Concurrently with the increase in the construction loan, USAA agreed to fund an additional $8.8 million, for a total commitment of $178.4 million. No changes were made to the rights of either the Company or the Partners under the construction loan agreement.
The Company concluded that the Venture was within the scope of the VIE model, and that it was the primary beneficiary of the Venture during the development phase of the project because it had the power to direct activities that most significantly impact the Venture’s economic performance, however, upon the building’s completion, the Company expected to recognize the investment under the equity method. As the primary beneficiary of the VIE during the development phase, the Company has consolidated 110 North Wacker and its underlying entities since the second quarter of 2018. During the third quarter of 2020, 110 North Wacker was completed and placed in service, triggering a reconsideration event. Upon development completion, the Company concluded it is no longer the primary beneficiary and as such, should no longer consolidate the Venture. As there have been no changes to the structure and control of the Partnership with the local developer, the Company will continue to consolidate the Partnership.
HHC 2021 FORM 10-K | 95
FINANCIAL STATEMENTS FOOTNOTES | |||||
As of September 30, 2020, the Company derecognized all assets, liabilities and noncontrolling interest related to the Venture that were previously consolidated and recognized an equity method investment of $273.6 million based on the fair value of its interest in 110 North Wacker. The Company recognized a gain of $267.5 million attributable to the initial fair value step-up at the time of deconsolidation, which is included in Equity in earnings (losses) from real estate and other affiliates on the Consolidated Statements of Operations and reported in the Strategic Developments segment for the year ended December 31, 2020. The Company utilized a third-party appraiser to measure the fair value of 110 North Wacker on an as-is basis at September 30, 2020, using the discounted cash flow approach and sales comparison approach, based on current market assumptions. Also as a result of the deconsolidation, the Company recognized an additional $15.4 million attributable to the recognition of previously eliminated development management fees, which is included in Other land, rental and property revenues on the Consolidated Statements of Operations and reported in the Strategic Developments segment for the year ended December 31, 2020. The remaining equity method investment was transferred from the Strategic Development segment to the Operating Asset segment as of September 30, 2020.
Given the nature of the Venture’s capital structure and the provisions for the liquidation of assets, the Company’s share of the Venture’s income-producing activities is recognized based on the Hypothetical Liquidation at Book Value (HLBV) method. Under this method, the Company recognizes income or loss in Equity in earnings from real estate and other affiliates based on the change in its underlying share of the Venture’s net assets on a hypothetical liquidation basis as of the reporting date. After USAA receives a 9.0 % preferred return on its capital contribution, the Partnership is entitled to cash distributions from the Venture until it receives a 9.0 % return on its capital account, calculated as the initial land contribution of $85.0 million and cash contribution of $5.0 million, plus subsequent cash contributions and less subsequent cash distributions. Subsequently, USAA is entitled to cash distributions equal to 11.11 % of the amount distributed to the Partnership that resulted in a 9.0 % return. Thereafter, the Partnership and USAA are entitled to distributions pari passu to their profit ownership interests of 90 % and 10 %, respectively.
The Lawn Club On January 19, 2021, the Company formed HHC Lawn Games, LLC with The Lawn Club NYC, LLC (Endorphin Ventures), to construct and operate an immersive indoor and outdoor restaurant that includes an extensive area of indoor grass, a stylish clubhouse bar and a wide variety of lawn games. This concept is expected to open in the summer of 2022. Under the terms of the agreement, the Company will fund 80 % of the cost to construct the restaurant, and Endorphin Ventures will contribute the remaining 20 %. The Company also entered into a lease agreement with HHC Lawn Games, LLC (Lease Agreement) to lease 20,000 square feet of the Fulton Market Building for this venture. The Company will report its ownership interest in accordance with the equity method.
Available cash will be distributed 80 % to the Company and 20 % to Endorphin Ventures until each member’s unreturned capital account has been reduced to zero. Distributions will then be allocated 60 % to the Company and 40 % to Endorphin Ventures until the amounts paid to the Company under the Lease Agreement and the aggregate amounts distributed to the Company equal $100 per square foot of the property on an annual basis. Any remaining cash will be distributed equally between both members. Given the nature of The Lawn Club’s capital structure and the provisions for the liquidation of assets, the Company’s share of The Lawn Club’s income-producing activities will be recognized based on the HLBV method.
Ssäm Bar (formerly Bar Wayō) During the first quarter of 2016, the Company formed Pier 17 Restaurant C101, LLC (Bar Wayō) with MomoPier, LLC (Momofuku), an affiliate of the Momofuku restaurant group, to construct and operate a restaurant and bar at Pier 17 in the Seaport. Under the terms of the agreement, the Company will fund 89.75 % of the costs to construct the restaurant, and Momofuku will contribute the remaining 10.25 %. In 2021, Bar Wayō was rebranded as the Ssäm Bar.
As of December 31, 2021 and 2020, Ssäm Bar is classified as a VIE because the equity holders, as a group, lack the characteristics of a controlling financial interest. The carrying value of Ssäm Bar as of December 31, 2021, is $5.9 million and is classified as Investments in real estate and other affiliates in the Consolidated Balance Sheets. The Company’s maximum exposure to loss as a result of these investments is limited to the aggregate carrying value of the investments as the Company has not provided any guarantees or otherwise made firm commitments to fund amounts on behalf of this VIE.
After each member receives a 10 % preferred return on its capital contributions, available cash will be allocated 75 % to the Company and 25 % to Momofuku, until each member’s unreturned capital account has been reduced to zero. Any remaining cash will be distributed 50 % to each of the members. Given the nature of the Ssäm Bar’s capital structure and the provisions for the liquidation of assets, the Company’s share of the Ssäm Bar’s income-producing activities is recognized based on the HLBV method.
HHC 2021 FORM 10-K | 96
FINANCIAL STATEMENTS FOOTNOTES | |||||
The Summit During the first quarter of 2015, the Company formed DLV/HHPI Summerlin, LLC (The Summit) with Discovery Land Company (Discovery). The Company contributed land with a carrying value of $13.4 million and transferred SID bonds related to such land with a carrying value of $1.3 million to The Summit at the agreed upon capital contribution value of $125.4 million, or $226,000 per acre and has no further capital obligations. Discovery is required to fund up to a maximum of $30.0 million of cash as their capital contribution, of which $3.8 million has been contributed. The gains on the contributed land are recognized in Equity in earnings from real estate and other affiliates as The Summit sells lots.
As of December 31, 2021, the Company has received cash distributions equal to its capital contribution of $125.4 million and a 5.0 % preferred return on such capital contribution, and Discovery has received cash distributions equal to two times its equity contribution. Any further cash distributions and income producing activities will be recognized according to equity ownership with HHC receiving 50 % and Discovery receiving 50 %. As of December 31, 2021, HHC has received $179.1 million in total distributions and Discovery has received $27.0 million in total distributions.
Trillium In the fourth quarter of 2021, simultaneous with the Douglas Ranch land acquisition, the Company entered into a Limited Liability Company Agreement (LLC Agreement) with JDM Partners and El Dorado Holdings to form Trillium Development Holding Company, LLC (Trillium) for the purpose of developing the first village within the new Douglas Ranch MPC in Phoenix’s West Valley. Refer to Note 3 - Acquisitions and Dispositions for additional details on the Douglas Ranch acquisition.
Within the 3,029 -acre Trillium development located in the greater Phoenix, Arizona area (Trillium Property), JDM Partners owned approximately 2,579 acres and El Dorado Holdings owned approximately 450 acres. Simultaneously with the LLC Agreement, all parties executed the Contribution and Purchase Agreement under which the Company acquired a 50 % interest in the land owned by JDM Partners and a 50 % interest in the land owned by El Dorado Holdings for $59.0 million, and immediately contributed its ownership interest in the property to Trillium in exchange for a 50 % equity interest. At the same time, JDM Partners contributed its remaining 50 % interest in the land and El Dorado Holdings contributed its remaining 50 % interest in the land to Trillium in exchange for the remaining equity interest. Subsequent to these contributions, member equity interest in Trillium was 50 % for the Company, 42.5 % for JDM Partners and 7.5 % for El Dorado Holdings. The Company will report its ownership interest in accordance with the equity method. Under the terms of the agreement, all future capital contributions, cash distributions and the recognition of income producing activities will be pro rata based on economic ownership interest. The first Trillium land sales are expected to occur in the first half of 2022.
West End Alexandria In the fourth quarter of 2021, the Company entered into an Asset Contribution Agreement with Foulger-Pratt Development, LLC (Foulger-Pratt) and Seritage SRC Finance (Seritage). Prior to this agreement, Foulger-Pratt owned 100 % interest in Landmark Land Holdings, LLC (West End Alexandria). Pursuant to this agreement, the Company conveyed its 33 -acre Landmark Mall property with an agreed upon fair value of $56.0 million and Seritage conveyed an additional 19 acres of land with an agreed upon fair value of $30 million to West End Alexandria in exchange for equity interest. Additionally, Foulger-Pratt agreed to contribute $10 million to West End Alexandria. Subsequent to these conveyances and contributions, each member received an equity interest proportionate to the agreed upon values, defined as 58.33 % for the Company, 31.25 % for Seritage, and 10.42 % for Foulger-Pratt.
Also in the fourth quarter of 2021, West End Alexandria executed a Purchase and Sale Agreement with the City of Alexandria to sell approximately 11 acres to the City of Alexandria for $54.0 million. The City will lease this land to Inova Health Care Services for construction of a new hospital.
Development plans for the remaining 41 acre property includes approximately four million square feet of residential, retail, commercial, and entertainment offerings integrated into a cohesive neighborhood with a central plaza, a network of parks and public transportation. Demolition is set to begin in Spring 2022, with completion of the first buildings expected in 2025.
Each member is entitled to a 10 % return on their respective capital contributions, which is allocated pro rata in accordance with their respective percentage interest. Next, 20 % to Foulger-Pratt, and 80 % to all members in accordance with their respective percentage interests, until each member has received an internal rate of return of 15 % on its capital contributions. After which 100 % will be allocated to Foulger-Pratt equal to any unreturned contributions made by Foulger-Pratt to cover controllable cost overruns. Lastly, 30 % to Foulger-Pratt, and 70 % to all members pro rata in accordance with their respective percentage interests. Given the nature of the venture’s capital structure and the provisions for the liquidation of assets, the Company’s share of income-producing activities is recognized based on the HLBV method.
HHC 2021 FORM 10-K | 97
FINANCIAL STATEMENTS FOOTNOTES | |||||
Summarized Financial Information The following tables include relevant summarized financial statement information for all equity method investments:
| thousands | The Summit (a)(b)(c) | 110 North Wacker (d) | Other Investments (e) | |||||||||||||||||||||||
| Balance Sheet | ||||||||||||||||||||||||||
| December 31, 2021 | ||||||||||||||||||||||||||
| Total Assets | $ | $ | $ | |||||||||||||||||||||||
| Total Liabilities | ||||||||||||||||||||||||||
| Total Equity | ||||||||||||||||||||||||||
| December 31, 2020 | ||||||||||||||||||||||||||
| Total Assets | $ | $ | $ | |||||||||||||||||||||||
| Total Liabilities | ||||||||||||||||||||||||||
| Total Equity | ||||||||||||||||||||||||||
| Income Statement | ||||||||||||||||||||||||||
| Year ended December 31, 2021 | ||||||||||||||||||||||||||
| Revenues | $ | $ | $ | |||||||||||||||||||||||
| Gross Margin | n/a | n/a | ||||||||||||||||||||||||
| Operating Income | n/a | |||||||||||||||||||||||||
| Net income (loss) | ( | |||||||||||||||||||||||||
| Year Ended December 31, 2020 | ||||||||||||||||||||||||||
| Revenues | $ | $ | $ | |||||||||||||||||||||||
| Gross Margin | n/a | n/a | ||||||||||||||||||||||||
| Operating Income | n/a | ( | ||||||||||||||||||||||||
| Net income (loss) | ( | |||||||||||||||||||||||||
| Year Ended December 31, 2019 | ||||||||||||||||||||||||||
| Revenues | $ | $ | $ | |||||||||||||||||||||||
| Gross Margin | n/a | n/a | ||||||||||||||||||||||||
| Operating Income | n/a | |||||||||||||||||||||||||
| Net income (loss) | ||||||||||||||||||||||||||
(a)The Summit adopted ASU 2014-09, Revenues from Contracts with Customers (Topic 606) effective in the fourth quarter of 2019 using the modified retrospective transition method. Therefore, for 2019, revenues allocated to each of The Summit’s performance obligations is recognized over time based on an input measure of progress. Prior period amounts have not been adjusted and are recognized on a percentage of completion basis. The Summit’s adoption of ASU 2014-09 did not have a material impact on the Company’s consolidated financial statements.
(b)The decrease in Total Equity for The Summit is primarily the result of distributions made in the second quarter of 2021.
(c)The increase in Revenues for The Summit is due to an increase in units closed, with 46 units closed during the year ended December 31, 2021, compared to 29 units closed for the year ended December 31, 2020.
(d)The income statement amounts for 110 North Wacker only include activity for the three months ended December 31, 2020, to correspond with the period it was accounted for under the equity method. Losses for 2021 and 2020 are the result of the asset still being in the lease-up period.
HHC 2021 FORM 10-K | 98
FINANCIAL STATEMENTS FOOTNOTES | |||||
3. Acquisitions and Dispositions | ||
Acquisitions In October 2021, HHC announced the launch of Douglas Ranch, a new large-scale master planned community in the West Valley of Phoenix, Arizona. The Company closed on the all-cash purchase of approximately 33,810 acres for a purchase price of $541.0 million. The purchase price includes an option for the seller, JDM Partners, to re-acquire a 50 % interest in the property for an additional $236.8 million, with $33.8 million of the original purchase price being credited to the seller upon exercise of the option for a total capital contribution of $270.6 million. If the option is not exercised by the seller within six months , the $33.8 million will be returned to the Company. Simultaneous with the land acquisition, the Company closed on the acquisition of a 50 % interest in Trillium Development Holding Company, LLC, for $59.0 million. Trillium Development Holding Company, LLC owns approximately 3,029 acres of land in the greater Phoenix, Arizona area. In total, the Douglas Ranch MPC encompasses almost 37,000 fully-entitled, “shovel-ready” acres and is poised for growth with in-place entitlements for 100,000 residential homes and 55 million square feet of commercial development.
There were no acquisitions during 2020.
Dispositions On December 22, 2021, the Company completed the sale of Century Park, a 63 -acre, 1,302,597 square foot campus with 17 office buildings in the West Houston Energy Corridor for $25.0 million. The carrying value of the property was approximately $32.0 million. Loss on sale of $7.4 million is calculated as the difference between the sale price and the asset’s carrying value, less related transaction costs of approximately $0.4 million. The loss on sale is included in Gain (loss) on sale or disposal of real estate and other assets, net in the Statements of Operations for the year ended December 31, 2021. This asset was previously impaired during the second quarter of 2021. Refer to Note 4 - Impairment for additional information.
On September 16, 2021, the Company completed the sale of The Woodlands Resort, The Westin at The Woodlands and Embassy Suites at Hughes Landing for $252.0 million. These hospitality properties, located in The Woodlands, contained a total of 909 rooms. The carrying value of the properties was approximately $210.0 million at the time of sale. Gain on sale of $39.1 million is calculated as the difference between the sale price and the asset’s carrying value, less related transaction costs of approximately $2.9 million. The gain on sale is included in Gain (loss) on sale or disposal of real estate and other assets, net in the Statements of Operations for the year ended December 31,2021. Additionally, as part of the sale, the Company repaid $132.3 million of debt directly associated with the properties sold. Income (loss) before taxes for these properties consisted of losses of $6.4 million for the year ended December 31, 2021, and $12.5 million for the year ended December 31, 2020.
On May 7, 2021, the Company completed the sale of Monarch City, a property comprised of approximately 229 acres of undeveloped land in Collin County, Texas, for $51.4 million. The carrying value of the property was approximately $28.7 million at the time of sale. Gain on sale of $21.3 million is calculated as the difference between the sale price and the asset’s carrying value, less related transaction costs of approximately $1.5 million. The gain on sale is included in Gain (loss) on sale or disposal of real estate and other assets, net in the Statements of Operations for the year ended December 31, 2021.
On December 18, 2020, the Company completed the sale to its joint venture partner of its 50 % equity method investment in Circle T Ranch and Power Center, a joint venture with Westlake Retail Associates for $13.0 million. The carrying value of the asset at the time of sale was approximately $11.9 million and the Company recognized a gain on sale of $1.1 million which is included in Equity in earnings (losses) from real estate and other affiliates on the Consolidated Statements of Operations.
On November 20, 2020, the Company completed the sale of its Elk Grove asset, a 64 -acre land parcel in the City of Elk Grove, California, for $24.6 million. The carrying value of the asset at the time of sale was approximately $10.8 million and the Company recognized a gain on sale of $13.7 million which is included in Gain (loss) on sale or disposal of real estate and other assets, net on the Consolidated Statements of Operations.
On July 16, 2020, the Company completed the sale to its joint venture partner of its 35 % equity investment in Mr. C Seaport, a 66 -room boutique hotel located at 33 Peck Slip, New York, in close proximity to the Seaport, for $0.8 million. The carrying value at the time of sale approximated the sales price. Refer to Note 2 - Investments in Real Estate and Other Affiliates and Note 4 - Impairment for additional information.
HHC 2021 FORM 10-K | 99
FINANCIAL STATEMENTS FOOTNOTES | |||||
On June 29, 2020, the Company entered into an agreement terminating a participation right contained in the contract for the sale of West Windsor that occurred in October 2019, as discussed below. As consideration, the Company received an $8.0 million termination payment in 2020, which is included in Gain (loss) on sale or disposal of real estate and other assets, net on the Consolidated Statements of Operations for the year ended December 31, 2021.
On March 13, 2020, the Company closed on the sale of its property at 100 Fellowship Drive, a 13.5 -acre land parcel and 203,257 -square-foot build-to-suit medical building with approximately 550 surface parking spaces in The Woodlands, Texas, for a total sales price of $115.0 million. The sale of 100 Fellowship Drive resulted in an additional gain of $38.3 million in the first quarter of 2020, which is included in Gain (loss) on sale or disposal of real estate and other assets, net on the Consolidated Statements of Operations. This gain was in addition to $13.5 million of Selling profit from the sales-type lease recognized on the Consolidated Statements of Operations as of December 31, 2019. The Company had previously entered into a lease agreement related to this property in November of 2019, and at lease commencement, the Company derecognized $63.7 million from Developments and recorded an initial net investment in lease receivable of $75.9 million on the Consolidated Balance Sheets.
The carrying value of the net investment in lease receivable related to 100 Fellowship Drive was approximately $76.1 million at the time of sale. Gain on sale is calculated as the difference between the purchase price of $115.0 million, and the asset’s carrying value, less related transaction costs of approximately $0.2 million. Contemporaneous with the sale, the Company credited to the buyer approximately $0.6 million for operating account funds and the buyer’s assumption of the related liabilities. After the sale, the Company had no continuing involvement in this lease. After repayment of debt associated with the property, the sale generated approximately $64.2 million in net proceeds, which are presented as cash inflows from operating activities in the Consolidated Statements of Cash Flows for the year ended December 31, 2021.
On December 20, 2019, the Company sold its 90.5 % share in Bridges at Mint Hill, a joint venture to develop a shopping center southeast of Charlotte, North Carolina, for $9.5 million. Prior to the sale, the Company accounted for its investment in Bridges at Mint Hill, which was in the Strategic Developments segment, as a consolidated joint venture. The carrying value of assets acquired by the purchaser and deconsolidated from the Company’s financial statements total $22.0 million; liabilities assumed and deconsolidated were not meaningful; and noncontrolling interest deconsolidated from the Company’s financial statements totaled $3.8 million. The Company recognized a pre-tax loss of $8.8 million which is included in Gain (loss) on sale or disposal of real estate and other assets, net on the Consolidated Statements of Operations.
On October 29, 2019, the Company closed on the sale of West Windsor, a 658 -acre parcel of land located in West Windsor, New Jersey, for $40.0 million. The carrying value of assets acquired by the purchaser total $27.5 million; no liabilities were assumed. As a result of the sale, the Company recorded a $12.0 million pre-tax gain which is included in Gain (loss) on sale or disposal of real estate and other assets, net on the Consolidated Statements of Operations.
On September 16, 2019, the Company closed on the sale of Cottonwood Mall, a 196,975 square foot building and 54 -acre land parcel in Holladay, Utah. The Company sold the asset for a total sales price of $46.0 million, resulting in a pre-tax gain of $24.1 million which is included in Gain (loss) on sale or disposal of real estate and other assets, net on the Consolidated Statements of Operations. The carrying value of assets acquired by the purchaser total $21.5 million; no liabilities were assumed. As consideration, the Company received a $10.0 million down payment from the purchaser and recorded a $36.0 million note receivable for the remainder at time of sale. The receivable was subsequently collected during the year ended December 31, 2020.
4. Impairment | ||
The Company reviews its long-lived assets for potential impairment indicators whenever events or changes in circumstances indicate that the carrying amount may not be recoverable. Impairment or disposal of long‑lived assets in accordance with ASC 360 requires that if impairment indicators exist and expected undiscounted cash flows generated by the asset over an anticipated holding period are less than its carrying amount, an impairment provision should be recorded to write down the carrying amount of the asset to its fair value. The impairment analysis does not consider the timing of future cash flows and whether the asset is expected to earn an above- or below-market rate of return.
HHC 2021 FORM 10-K | 100
FINANCIAL STATEMENTS FOOTNOTES | |||||
During the second quarter of 2021, the Company recorded a $13.1 million impairment charge for Century Park, which is included in Provision for impairment on the Consolidated Statements of Operations. The Century Park asset includes both building and land components. The impairment relates to the building component, while the land component was not impaired. Century Park is a 63 -acre, 1.3 million square foot campus with 17 office buildings in the West Houston Energy Corridor, a non-core asset acquired as part of the acquisition of The Woodlands Towers at The Waterway. The Company recognized an impairment due to decreases in estimated future cash flows and as a result of the impact of a shorter than anticipated holding term. The Company used weighted market and income valuation techniques to estimate the fair value of Century Park. Market valuation was based on recent sales of similar commercial properties in and around Houston, Texas. For the income approach, the Company utilized a capitalization rate of 8.75 %, and probability weighted scenarios assuming lease-up periods ranging from 24 months to 48 months, and management’s estimate of future lease income and carry costs. In December 2021, the Company completed the sale of Century Park. See Note 3 - Acquisitions and Dispositions for additional details regarding the sale.
During the first quarter of 2020, the Company recorded a $48.7 million impairment charge for Outlet Collection at Riverwalk, a 273,270 -square-foot urban upscale outlet center located along the Mississippi River in downtown New Orleans, LA. The Company recognized the impairment due to decreases in estimated future cash flows as a result of the impact of a shorter than anticipated holding term due to management’s plans to divest the non-core operating asset, decreased demand and reduced interest in brick and mortar retail due to the impact of COVID-19, as well as an increase in the capitalization rate used to evaluate future cash flows due to the impact of COVID-19. The $46.8 million net carrying value of Outlet Collection at Riverwalk, after the impairment, represents the estimated fair market value at March 31, 2020, at the time of the impairment assessment. The Company used a discounted cash flow analysis using a capitalization rate of 10 % to determine fair value. There can be no assurance that the Company will ultimately recover the fair value amounts of Outlet Collection at Riverwalk through sales of these assets. Refer to Note 8 - Fair Value for additional information.
Each Investment in real estate and other affiliates discussed in Note 2 - Investments in Real Estate and Other Affiliates is evaluated periodically for recoverability and valuation declines that are other-than-temporary. If the decrease in value of an investment in a real estate and other affiliate is deemed to be other-than-temporary, the investment in such Real estate and other affiliates is reduced to its estimated fair value. In 2021, the Company recorded a $17.7 million impairment of its equity investment in 110 North Wacker, a 1,491,651 square foot office building located in Chicago. The Company recognized the impairment due to a change in the anticipated holding period as the Company entered into a plan to sell its interest in 110 North Wacker. In 2020, the Company recorded a $6.0 million impairment of its equity investment in Mr. C Seaport, a 66 -room boutique hotel located at 33 Peck Slip in close proximity to the Seaport. The Company recognized the impairment due to a change in the anticipated holding period as the Company entered into a plan to sell its 35 % equity investment in Mr. C Seaport to its venture partners for $0.8 million. In July 2020, the Company completed the sale of its interest in Mr. C Seaport. See Note 3 - Acquisitions and Dispositions for additional details regarding the sale. The impairment loss is presented in Equity in earnings (losses) from real estate and other affiliates.
The Company periodically evaluates strategic alternatives with respect to each property and may revise the strategy from time to time, including the intent to hold the asset on a long-term basis or the timing of potential asset dispositions. For example, the Company may decide to sell property that is held for use, and the sale price may be less than the carrying amount. As a result, changes in strategy could result in impairment charges in future periods.
In addition to the impairments discussed above, the Company reduced the estimated net sales price of certain condominium units, including the remaining penthouse inventory, to better align the expected price with recent final sales prices, resulting in a loss of $2.3 million for the year ended December 31, 2021, and a loss of $7.6 million for the year ended December 31, 2020, included in Condominium rights and unit cost of sales.
The following table summarizes the pre-tax impacts of the items mentioned above to the Consolidated Statements of Operations for the years ended December 31:
| thousands | Statements of Operations Line Item | 2021 | 2020 | |||||||||||
| Operating assets: | ||||||||||||||
| Outlet Collection at Riverwalk | Provision for impairment | $ | $ | |||||||||||
| Century Park | Provision for impairment | |||||||||||||
| Equity Investments: | ||||||||||||||
| 110 North Wacker | Equity in earnings (losses) from real estate and other affiliates | |||||||||||||
| Mr. C Seaport | Equity in earnings (losses) from real estate and other affiliates | |||||||||||||
| Other Assets: | ||||||||||||||
| Condominium Inventory | Condominium rights and unit sales | |||||||||||||
HHC 2021 FORM 10-K | 101
FINANCIAL STATEMENTS FOOTNOTES | |||||
5. Other Assets and Liabilities | ||
Prepaid Expenses and Other Assets The following table summarizes the significant components of Prepaid expenses and other assets as of December 31:
| thousands | 2021 | 2020 | Change | ||||||||||||||
| Special Improvement District receivable (a) | $ | $ | $ | ||||||||||||||
| Condominium inventory (b) | |||||||||||||||||
| Security, escrow and other deposits (c) | ( | ||||||||||||||||
| In-place leases (d) | ( | ||||||||||||||||
| Intangibles | ( | ||||||||||||||||
| Prepaid expenses | |||||||||||||||||
| Other | ( | ||||||||||||||||
| Tenant incentives and other receivables | ( | ||||||||||||||||
| Food and beverage and lifestyle inventory | ( | ||||||||||||||||
| TIF receivable | ( | ||||||||||||||||
| Prepaid expenses and other assets, net | $ | $ | $ | ||||||||||||||
(a)The increase in Special Improvement District receivable is primarily attributable to a third quarter 2021 SID Bond issuance in Summerlin. Proceeds from SID bonds are held in escrow by a third party and are used to reimburse the Company for a portion of the development costs.
(b)The increase in Condominium inventory is attributable to the addition of inventory units at the newly completed ‘A‘ali‘i, partially offset by closing on inventory units at Waiea and Anaha.
(c)The decrease in Security, escrow and other deposits is primarily attributable to a $29.5 million settlement of the rate-lock agreement associated with the loans for 1201 Lake Robbins and The Woodlands Warehouse upon repayment in February 2021, partially offset by a $27.5 million deposit related to the loan for Bridgeland entered into in September 2021.
(d)The decrease in In-place leases is primarily attributable to routine amortization.
Accounts Payable and Accrued Expenses The following table summarizes the significant components of Accounts payable and accrued expenses as of December 31:
| thousands | 2021 | 2020 | Change | ||||||||||||||
| Condominium deposit liabilities (a) | $ | $ | $ | ||||||||||||||
| Construction payables (b) | |||||||||||||||||
| Accounts payable and accrued expenses (c) | |||||||||||||||||
| Deferred income | |||||||||||||||||
| Accrued interest (d) | |||||||||||||||||
| Tenant and other deposits | |||||||||||||||||
| Accrued payroll and other employee liabilities | |||||||||||||||||
| Accrued real estate taxes (e) | ( | ||||||||||||||||
| Interest rate swap liabilities (f) | ( | ||||||||||||||||
| Other | |||||||||||||||||
| Accounts payable and accrued expenses | $ | $ | $ | ||||||||||||||
(a)The increase in Condominium deposit liabilities is primarily due to the increase in contracted condominium unit sales at The Park Ward Village, Victoria Place and Kō'ula, partially offset by a decrease in deposits at ‘A‘ali‘i as customers close on the sale of completed units.
(b)The increase in Construction payables is attributable to an increase of $120.6 million primarily related to increased construction spend at Ward Village, the Summerlin, Bridgeland and Columbia MPC developments and the Tin Building, as well as a $21.0 million charge for additional remediation costs at Waiea. These increases were partially offset by decreases of $89.9 million related to a reduction of construction spend for projects placed in service in 2020 and 2021 or approaching completion, as well as costs incurred and paid for Waiea remediation activities during 2021.
(c)The increase in Accounts Payable and accrued expenses is primarily attributable to repurchases of common stock executed in December 2021.
(d)The increase in Accrued interest is primarily due to new loan agreements entered into in 2021, partially offset by the repayment of certain loans in 2021. See Note 7 - Mortgages, Notes and Loans Payable, Net for additional detail.
(e)The decrease in Accrued real estate taxes is primarily related to annual tax payments being made at year-end 2021.
(f)The decrease in Interest rate swap liabilities is due to an increase of the one-month London Interbank Offered Rate (LIBOR) forward curve for the periods presented.
HHC 2021 FORM 10-K | 102
FINANCIAL STATEMENTS FOOTNOTES | |||||
6. Intangibles | ||
The following table summarizes the Company’s intangible assets and liabilities:
| As of December 31, 2021 | As of December 31, 2020 | ||||||||||||||||||||||||||||||||||
| Gross Asset (Liability) | Accumulated (Amortization)/ Accretion | Net Carrying Amount | Gross Asset (Liability) | Accumulated (Amortization)/ Accretion | Net Carrying Amount | ||||||||||||||||||||||||||||||
| thousands | |||||||||||||||||||||||||||||||||||
| Intangible Assets: | |||||||||||||||||||||||||||||||||||
| Other intangibles (a) | $ | $ | ( | $ | $ | $ | ( | $ | |||||||||||||||||||||||||||
| Goodwill | — | — | |||||||||||||||||||||||||||||||||
| Indefinite lived intangibles (a) | — | — | |||||||||||||||||||||||||||||||||
| Tenant leases: | |||||||||||||||||||||||||||||||||||
| In-place value | ( | ( | |||||||||||||||||||||||||||||||||
| Above-market | ( | ( | |||||||||||||||||||||||||||||||||
| Below-market | ( | ( | ( | ( | |||||||||||||||||||||||||||||||
| Total indefinite lived intangibles | $ | $ | |||||||||||||||||||||||||||||||||
| Total amortizing intangibles | $ | $ | |||||||||||||||||||||||||||||||||
(a)Following the 2021 restructuring of Minor League Baseball, the intangible asset associated with the Company’s Las Vegas Aviators Triple-A professional baseball team was treated as an amortizing intangible and no longer accounted for as an indefinite lived intangible.
The tenant in-place, above-market and below-market lease intangible assets resulted from real estate acquisitions. The in‑place value and above-market value of tenant leases are included in Prepaid expenses and other assets, net and are amortized over periods that approximate the related lease terms. The below‑market tenant leases are included in Accounts payable and accrued expenses and are amortized over the remaining non‑cancelable terms of the respective leases. See Note 5 - Other Assets and Liabilities for additional information regarding Prepaid expenses and other assets, net and Accounts payable and accrued expenses.
Net amortization and accretion expense for these intangible assets and liabilities was $7.5 million in 2021, $5.8 million in 2020 and $2.1 million in 2019.
Future net amortization and accretion expense is estimated for each of the five succeeding years as shown below:
| thousands | 2022 | 2023 | 2024 | 2025 | 2026 | ||||||||||||||||||||||||
| Net amortization and accretion expense | $ | $ | $ | $ | $ | ||||||||||||||||||||||||
HHC 2021 FORM 10-K | 103
FINANCIAL STATEMENTS FOOTNOTES | |||||
7. Mortgages, Notes and Loans Payable, Net | ||
Mortgages, Notes and Loans Payable Mortgages, notes and loans payable, net are summarized as follows:
| December 31, | ||||||||||||||
| thousands | 2021 | 2020 | ||||||||||||
| Fixed-rate debt | ||||||||||||||
Unsecured | $ | $ | ||||||||||||
Unsecured | ||||||||||||||
Unsecured | ||||||||||||||
Unsecured | ||||||||||||||
| Secured mortgages, notes and loans payable | ||||||||||||||
| Special Improvement District bonds | ||||||||||||||
| Variable-rate debt (a) | ||||||||||||||
| Secured Bridgeland Notes due 2026 | ||||||||||||||
| Mortgages, notes and loans payable (a) | ||||||||||||||
| Unamortized bond issuance costs | ( | |||||||||||||
| Unamortized deferred financing costs (b) | ( | ( | ||||||||||||
| Total mortgages, notes and loans payable, net | $ | $ | ||||||||||||
(a)The Company has entered into derivative instruments to manage a portion of the variable interest rate exposure. See Note 9 - Derivative Instruments and Hedging Activities for additional information.
(b)Deferred financing fees are amortized to interest expense over the terms of the respective financing agreements using the effective interest method (or other methods which approximate the effective interest method).
Credit Facilities In 2018, the Company entered into a $700.0 million loan agreement, which provided for a $615.0 million term loan (the Term Loan) and an $85.0 million revolver loan (the Revolver Loan and together with the Term Loan, the Senior Secured Credit Facility or the Loans), which is included in Variable-rate debt above. Concurrent with the sale of The Westin at The Woodlands and Embassy Suites at Hughes Landing in September 2021, $181.8 million was repaid on the Term Loan, of which $69.8 million was directly associated with the properties sold. Refer to Note 3 - Acquisitions and Dispositions for additional information. As of December 31, 2021, the Company had $316.7 million of outstanding borrowings on the Term Loan. The Company has a one -time right to request an increase of $50.0 million in the aggregate amount of the Revolver Loan commitment. As of December 31, 2021, the Company had no outstanding borrowings under the Revolver Loan. The Loans are secured by a first priority security interest in certain of the Company’s properties.
In 2019, the Company closed on a $250.0 million credit facility secured by land and certain other collateral in The Woodlands and Bridgeland MPCs. The loan provided for a $100.0 million term loan and a $150.0 million revolver loan. In September 2021, the Company repaid the $100.0 million term loan and the $50.0 million outstanding borrowings under the revolver portion of the loan. As a result, the Company no longer has access to the $150.0 million revolver loan. These borrowings were replaced by a $275.0 million loan for Bridgeland. See the table below for additional detail.
Special Improvement District Bonds The Summerlin MPC uses SID bonds to finance certain common infrastructure improvements. These bonds are issued by the municipalities and are secured by the assessments on the land. The majority of proceeds from each bond issued is held in a construction escrow and disbursed to the Company as infrastructure projects are completed, inspected by the municipalities and approved for reimbursement. Accordingly, the SID bonds have been classified as debt, and the Summerlin MPC pays the debt service on the bonds semi‑annually. As Summerlin sells land, the buyers assume a proportionate share of the bond obligation at closing, and the residential sales contracts provide for the reimbursement of the principal amounts that the Company previously paid with respect to such proportionate share of the bond. For the year ended December 31, 2021, $45.4 million in SID bonds were issued and obligations of $8.8 million were assumed by buyers.
Debt Compliance Due to the COVID-19 pandemic, the Company experienced a decline in operating results for certain retail and hospitality properties resulting in the Company not meeting its required debt service coverage ratio for the $615.0 million Term Loan portion of the Senior Secured Credit Facility as of December 31, 2020. As a result, the excess net cash flow after debt service from the underlying properties became restricted. While the restricted cash could not be used for general corporate purposes, it could be used to fund operations of the underlying assets and did not have a material impact on the Company’s liquidity. As a result of payments on the Term Loan, the Company met the debt service coverage ratio as of September 30, 2021, and December 31, 2021. As two consecutive quarters of compliance were required to release the restricted cash requirement, $43.0 million of restricted cash as of December 31, 2021, qualifies for release.
HHC 2021 FORM 10-K | 104
FINANCIAL STATEMENTS FOOTNOTES | |||||
As of December 31, 2021, the Company did not meet the debt service coverage ratio for the Two Hughes Landing loan. As a result, the excess net cash flow after debt service from the underlying property became restricted and cannot be used for general corporate purposes, but can continue to be used to fund operations of the underlying asset. This restriction does not have a material impact on the Company’s liquidity.
As of December 31, 2021, apart from the Two Hughes Landing loan described above, the Company was in compliance with all financial covenants included in the agreements governing its indebtedness.
Financing Activity The Company’s borrowing activity is summarized as follows:
| thousands | Initial / Extended Maturity (a) | Interest Rate | Carrying Value | |||||||||||
| Balance at December 31, 2020 | $ | |||||||||||||
| Issuances: | ||||||||||||||
| Senior Notes due 2029 | February 2029 | (c) | ||||||||||||
| Senior Notes due 2031 | February 2031 | (c) | ||||||||||||
| Bridgeland Notes due 2026 | September 2026 | (b),(d) | ||||||||||||
| Special Improvement District bonds | April 2051 | |||||||||||||
| Borrowings: | ||||||||||||||
| Victoria Place | September 2024 / September 2026 | (b),(e) | ||||||||||||
| 1725 Hughes Landing | January 2027 / January 2030 | (b),(f) | ||||||||||||
| 1735 Hughes Landing | January 2027 / January 2030 | (b),(f) | ||||||||||||
| Tanager Apartments | May 2031 | (g) | ||||||||||||
| Lakeside Row | September 2031 | (i) | ||||||||||||
| 1201 Lake Robbins | October 2031 | (j) | ||||||||||||
| Three Hughes Landing | December 2031 | (k) | ||||||||||||
| The Woodlands Warehouse | January 2032 | |||||||||||||
| Draws on existing mortgages, notes and loans payable | ||||||||||||||
| Repayments: | ||||||||||||||
| 1201 Lake Robbins | June 2021 | (b),(l) | ( | |||||||||||
| The Woodlands Warehouse | June 2021 | (b),(l) | ( | |||||||||||
| Tanager Apartments | October 2021 / October 2024 | (b),(g) | ( | |||||||||||
| ‘A‘ali‘i | June 2022 / June 2023 | (b),(h) | ( | |||||||||||
| Lakeside Row | July 2022 / July 2023 | (b),(i) | ( | |||||||||||
| Senior Secured Credit Facility | September 2023 | (f),(m) | ( | |||||||||||
| The Woodlands Resort | December 2021 / December 2023 | (b),(m) | ( | |||||||||||
| The Woodlands Master Credit Facility | October 2022 / October 2024 | (b),(d) | ( | |||||||||||
| Bridgeland Credit Facility | October 2022 / October 2024 | (b),(d) | ( | |||||||||||
| Repayments on existing mortgages, notes and loans payable | ( | |||||||||||||
| Redemptions | ||||||||||||||
| Senior Notes due 2025 | March 2025 | (l) | ( | |||||||||||
| Other: | ||||||||||||||
| Special Improvement District bond assumptions | April 2049 | ( | ||||||||||||
| Deferred financing costs, net | ( | |||||||||||||
| Balance at December 31, 2021 | $ | |||||||||||||
(a)Maturity dates presented represent initial maturity dates and the extended or final maturity dates as contractually stated. HHC has the option to exercise extension periods at the initial maturity date, subject to certain terms which may include minimum debt service coverage, minimum occupancy levels or condominium sales levels, as applicable and other performance criteria. In certain cases, due to property performance not meeting covenants, HHC may have to pay down a portion of the loan to obtain the extension.
(b)The interest rate presented is based on the one-month LIBOR of 0.10 % or Secured Overnight Financing Rate (SOFR) of 0.05 %, as applicable, at December 31, 2021. Interest rates associated with loans which have been paid off reflect the interest rate at December 31, 2020.
HHC 2021 FORM 10-K | 105
FINANCIAL STATEMENTS FOOTNOTES | |||||
(c)In February 2021, the Company issued $650 million in 4.125 % Senior Notes due 2029 and $650 million in 4.375 % Senior Notes due 2031. Interest is paid semi-annually in February and August of each year, beginning in August 2021. These notes will be unsecured senior obligations of the Company and are guaranteed by certain subsidiaries of the Company.
(d)In September 2021, the Company closed on a $275.0 million financing secured by MUD receivables and land in Bridgeland, retiring an existing $250.0 million credit facility secured by MUD receivables, land and certain other collateral in both The Woodlands and Bridgeland MPCs. The loan required a $27.5 million fully refundable deposit and has a net effective interest rate of SOFR plus 2.30 %, subject to a SOFR floor of 0.10 %, with maturity in September 2026.
(e)In March 2021, the Company closed on a $368.2 million construction loan for the development of Victoria Place in Ward Village. The loan bears interest at LIBOR, with a floor of 0.25 %, plus 5.00 %, with an initial maturity of September 2024 and two one-year extension options. Concurrent with the funding of the loan, the Company entered into interest rate cap agreements with a total notional amount of $368.2 million and a LIBOR strike rate of 2.00 %.
(f)In December 2021, the Company closed on a $127.0 million non-recourse financing of 1725/1735 Hughes Landing with $7 million withheld for future costs. The loan bears interest at LIBOR plus 3.95 %, subject to a floor of 0.15 %, with an initial maturity of January 2027 and three -year extension options. Proceeds from this financing were used to pay a portion of the Senior Secured Credit Facility.
(g)In April 2021, the Company closed on a $58.5 million loan to replace the existing construction loan for Tanager Apartments in Downtown Summerlin.
(h)In November 2021, the Company paid off the $249.7 million outstanding loan balance relating to ‘A‘ali‘i using proceeds from condo sales.
(i)In July 2021, the Company closed on a $35.5 million loan to replace the existing construction loan for Lakeside Row in Bridgeland.
(j)In October 2021, the Company closed on a $250.0 million non-recourse, interest-only loan for 1201 Lake Robbins.
(k)In November 2021, the Company closed on a $70.0 million non-recourse financing for Three Hughes Landing. This 10 -year, fixed-rate financing bears interest at 3.55 %. The financing is interest-only for the first four years , with 30 -year amortization thereafter.
(l)The Company used the net proceeds from the February 2021 issuance of Senior Notes due 2029 and 2031, as well as available cash on hand, as follows: (1) repurchased its $1.0 billion 5.375% Senior Notes due 2025; resulting in a $35.1 million loss on extinguishment of debt and (2) repaid $280.3 million outstanding under its loans for 1201 Lake Robbins and The Woodlands Warehouse maturing June 2021, resulting in a $10.0 million loss on the settlement of the rate-lock agreement associated with these loans.
(m)Concurrent with the sale of the Company’s Hospitality properties in September 2021, the entire $62.5 million loan on The Woodlands Resort was repaid and $69.8 million of debt associated with The Westin at The Woodlands and Embassy Suites at Hughes Landing was repaid on the Senior Secured Credit Facility. See Note 3 - Acquisitions and Dispositions for additional detail.
Additional Financing Activity in 2021 In April 2021, the Company closed on an $82.6 million construction loan for the development of Marlow, a multi-family development in Columbia. The loan bears interest at LIBOR plus 2.95 % with an initial maturity of April 2025 and a one-year extension option, with no amounts drawn as of December 31, 2021.
In April 2021, the Company closed on a $42.7 million construction loan for the development of Starling at Bridgeland. The loan bears interest at LIBOR plus 2.75 %, subject to an overall interest rate floor of 3.75 %, and an initial maturity date of April 2026, and a one-year extension option, with $4.0 million drawn as of December 31, 2021.
In June 2021, the Company closed on an extension of the $35.5 million loan for 8770 New Trails, extending the final maturity date to January 2032.
In September 2021, the Company closed on a $59.5 million construction loan for the development of Tanager Echo, a multi-family development in Summerlin. The loan bears interest at LIBOR, with a floor of 0.10 %, plus 2.90 % with an initial maturity of September 2025 and two one-year extension options and an immaterial amount drawn as of December 31, 2021. In October 2021, the Company entered into an interest rate cap agreement with a notional amount equal to the loan amount and a LIBOR strike rate of 2.50 %.
In September 2021, the Company closed on a $75.0 million construction loan for the development of 1700 Pavilion, an office development in Summerlin. The loan bears interest at LIBOR, with a floor of 0.10 %, plus 3.80 % with an initial maturity of September 2025 and two one-year extension options and an immaterial amount drawn as of December 31, 2021. In October 2021, the Company entered into an interest rate cap agreement with a notional amount equal to the loan amount and a LIBOR strike rate of 2.50 %.
In October 2021, the Company closed on an extension of the $27.2 million loan for Outlet Collection at Riverwalk, extending the initial maturity date to October 2022 with a one-year extension option and modifying the interest rate to SOFR plus 3.00 % with a total floor of 3.50 %.
HHC 2021 FORM 10-K | 106
FINANCIAL STATEMENTS FOOTNOTES | |||||
Financing Activity in 2022 In January 2022, the Company closed on a $49.8 million non-recourse, interest-only financing of One Merriweather. The loan bears interest at 3.525 % with maturity in February 2032. Proceeds from this financing were used to pay a portion of the Senior Secured Credit Facility.
In January 2022, the Company closed on a $25.6 million non-recourse, interest-only financing of Two Merriweather which was previously unencumbered. The loan bears interest at 3.825 % with maturity in February 2032.
In February 2022, the Company closed on a $40.8 million non-recourse financing of Two Summerlin which was previously unencumbered. The loan bears interest at SOFR plus 1.75 % with an initial maturity of February 2027 and two one-year extension options. Concurrent with the funding of the loan, the Company entered into an interest rate swap agreement with a notional amount equal to the loan and an interest rate of 3.425 %.
In February 2022, the Company paid $28.4 million on the Senior Secured Credit Facility with cash on hand.
Mortgages, Notes, and Loans Payable Balances by Property The following table presents the Company’s mortgages, notes and loans payable by property, presented within each segment in order of extended maturity date:
| Carrying Value December 31, | |||||||||||||||||
| thousands | Initial / Extended Maturity (a) | Interest Rate | 2021 | 2020 | |||||||||||||
| Operating Assets | |||||||||||||||||
| 20/25 Waterway Avenue | May 2022 | % | |||||||||||||||
| Millennium Waterway Apartments | June 2022 | % | |||||||||||||||
| Lake Woodlands Crossing Retail | January 2023 | % | (b),(c) | ||||||||||||||
| Senior Secured Credit Facility | September 2023 | % | (b),(c) | ||||||||||||||
| Two Lakes Edge | October 2022 / October 2023 | % | (b) | ||||||||||||||
| Outlet Collection at Riverwalk | October 2022 / October 2023 | % | (b) | ||||||||||||||
| The Woodlands Resort | December 2021 / December 2023 | % | (b) | ||||||||||||||
| 9303 New Trails | December 2023 | % | |||||||||||||||
| 4 Waterway Square | December 2023 | % | |||||||||||||||
| Creekside Park West | March 2023 / March 2024 | % | (b),(c) | ||||||||||||||
| The Lane at Waterway | August 2023 / August 2024 | % | (b) | ||||||||||||||
| 6100 Merriweather | September 2022 / September 2024 | % | (b) | ||||||||||||||
| Juniper Apartments | September 2022 / September 2024 | % | (b) | ||||||||||||||
| Creekside Park The Grove | January 2024 / January 2025 | % | (b),(c) | ||||||||||||||
| 9950 Woodloch Forest | March 2025 | % | (b) | ||||||||||||||
| Ae‘o Retail | October 2025 | % | (b) | ||||||||||||||
| Ke Kilohana Retail | October 2025 | % | (b) | ||||||||||||||
| 3831 Technology Forest Drive | March 2026 | % | |||||||||||||||
| Kewalo Basin Harbor | September 2027 | % | (b) | ||||||||||||||
| Millennium Six Pines Apartments | August 2028 | % | |||||||||||||||
| 3 Waterway Square | August 2028 | % | |||||||||||||||
| One Lakes Edge | March 2029 | % | |||||||||||||||
| Aristocrat | September 2029 | % | |||||||||||||||
| Creekside Park Apartments | October 2029 | % | |||||||||||||||
| 1725 Hughes Landing Boulevard | January 2027 / January 2030 | % | (b) | ||||||||||||||
| 1735 Hughes Landing Boulevard | January 2027 / January 2030 | % | (b) | ||||||||||||||
| One Hughes Landing | December 2029 | % | |||||||||||||||
| Two Hughes Landing | December 2030 | % | |||||||||||||||
| Other SID Bonds | December 2030 | % | (d) | ||||||||||||||
| Tanager Apartments | May 2031 | % | |||||||||||||||
| Lakeside Row | September 2031 | % | |||||||||||||||
| 1201 Lake Robbins | October 2031 | % | |||||||||||||||
| Three Hughes Landing | December 2031 | % | |||||||||||||||
| The Woodlands Warehouse | January 2032 | % | |||||||||||||||
| 8770 New Trails | January 2032 | % | (e) | ||||||||||||||
| Constellation Apartments | January 2033 | % | |||||||||||||||
HHC 2021 FORM 10-K | 107
FINANCIAL STATEMENTS FOOTNOTES | |||||
| Carrying Value December 31, | |||||||||||||||||
| thousands | Initial / Extended Maturity (a) | Interest Rate | 2021 | 2020 | |||||||||||||
| Hughes Landing Retail | December 2036 | % | |||||||||||||||
| Columbia Regional Building | February 2037 | % | |||||||||||||||
| Las Vegas Ballpark | December 2039 | % | |||||||||||||||
| Operating Assets Total | |||||||||||||||||
| Master Planned Communities | |||||||||||||||||
| The Woodlands Master Credit Facility | October 2022 / October 2024 | % | (b) | ||||||||||||||
| Bridgeland Credit Facility | October 2022 / October 2024 | % | (b) | ||||||||||||||
| Bridgeland Notes due 2026 | September 2026 | % | (b) | ||||||||||||||
| Summerlin South SID Bonds | June 2025 - April 2051 | (f) | |||||||||||||||
| Master Planned Communities Total | |||||||||||||||||
| Seaport | |||||||||||||||||
| 250 Water Street | November 2022 / November 2023 | % | (b),(c) | ||||||||||||||
| Seaport Total | |||||||||||||||||
| Strategic Developments | |||||||||||||||||
| ‘A‘ali‘i | June 2022 / June 2023 | % | (b) | ||||||||||||||
| Kō‘ula | March 2023 / March 2024 | % | (b),(c) | ||||||||||||||
| Victoria Place | September 2024 / September 2026 | % | (b),(g) | ||||||||||||||
| Starling at Bridgeland | April 2026 / April 2027 | % | (b) | ||||||||||||||
| Tanager Echo | September 2025 / September 2027 | % | (b),(h) | ||||||||||||||
| 1700 Pavillion | September 2025 / September 2027 | % | (b),(i) | ||||||||||||||
| Strategic Developments Total | |||||||||||||||||
| Senior Notes due 2025 | March 2025 | % | |||||||||||||||
| Senior Notes due 2028 | August 2028 | % | |||||||||||||||
| Senior Notes due 2029 | February 2029 | % | |||||||||||||||
| Senior Notes due 2031 | February 2031 | % | |||||||||||||||
| Unamortized bond issuance costs | ( | ||||||||||||||||
| Unamortized deferred financing costs | ( | ( | |||||||||||||||
| Total mortgages, notes and loans payable,net | $ | $ | |||||||||||||||
(a)Maturity dates presented represent initial maturity dates and the extended or final maturity dates as contractually stated. HHC has the option to exercise extension periods at the initial maturity date, subject to certain terms which may include minimum debt service coverage, minimum occupancy levels or condominium sales levels, as applicable, and other performance criteria. In certain cases, due to property performance not meeting covenants, HHC may have to pay down a portion of the loan to obtain the extension.
(b)The interest rate presented is based on the one-month LIBOR of 0.10 % or SOFR of 0.05 %, as applicable, at December 31, 2021. Interest rates associated with loans which have been paid off reflect the interest rate at December 31, 2020.
(c)$615 million of outstanding debt has been swapped to a fixed rate equal to 4.61 %.
(d)Includes SID bonds related to Downtown Summerlin, Hockey Ground Lease, Las Vegas Ballpark, Tanager Apartments, Two Summerlin, Tanager Echo and 1700 Pavillion.
(e)Concurrent with the closing of the $35.5 million construction loan for 8770 New Trails in 2019, the Company entered into an interest rate swap. The Loan bears interest at one-month LIBOR plus 2.45 % but it is currently swapped to a fixed rate equal to 4.89 %.
(f)Includes SID bonds with various maturity dates ranging from June 2025 to April 2051 and interest rates ranging from 4.00 % to 6.05 %.
(g)In the first quarter of 2021, the Company closed on a $368.2 million construction loan for the development of Victoria Place in Ward Village, which bears interest at LIBOR, with a floor of 0.25 %, plus 5.00 %. Concurrently, the Company entered into interest rate cap agreements with a total notional amount of $368.2 million and a LIBOR strike rate of 2.00 %.
(h)In the third quarter of 2021, the Company closed on a $59.5 million construction loan for the development of Tanager Echo, which bears interest at LIBOR, with a floor of 0.10 %, plus 2.90 %. The Company entered into an interest rate cap agreement with a LIBOR strike rate of 2.50 %.
HHC 2021 FORM 10-K | 108
FINANCIAL STATEMENTS FOOTNOTES | |||||
The weighted-average interest rate on the Company’s mortgages, notes and loans payable, excluding interest rate hedges, was 4.17 % as of December 31, 2021, and 4.34 % as of December 31, 2020.
HHC’s mortgages, notes and loans payable are secured by the properties listed in the table above and are non-recourse except for the following:
| thousands | Recourse % | Amount | |||||||||
| Recourse to HHC | |||||||||||
| Senior Notes due 2028 | % | $ | |||||||||
| Senior Notes due 2029 | % | ||||||||||
| Senior Notes due 2031 | % | ||||||||||
| Kō‘ula | % | ||||||||||
| 250 Water Street | % | ||||||||||
| Juniper Apartments | % | ||||||||||
| 6100 Merriweather | % | ||||||||||
| Outlet Collection at Riverwalk | % | ||||||||||
| Total recourse to HHC | |||||||||||
Recourse to The Woodlands Land Development Company (TWLDC) (a) | |||||||||||
| Two Lake's Edge | % | ||||||||||
| 9950 Woodloch Forest | % | ||||||||||
| Creekside Park The Grove | % | ||||||||||
| The Lane at Waterway | % | ||||||||||
| Lake Woodlands Crossing Retail | % | ||||||||||
| Creekside Park West | % | ||||||||||
| Total recourse to TWLDC | |||||||||||
| Total | $ | ||||||||||
(a)This debt is partially recourse to The Woodlands Land Development Company which is a wholly owned subsidiary of HHC.
Certain of the Company’s loans contain provisions which grant the lender a security interest in the operating cash flow of the property that represents the collateral for the loan. Certain mortgage notes may be prepaid subject to a prepayment penalty equal to a yield maintenance premium, defeasance, or a percentage of the loan balance. As of December 31, 2021, land, buildings and equipment and developments with a net book value basis of $4.2 billion have been pledged as collateral for HHC’s mortgages, notes and loans payable.
Scheduled Maturities The following table summarizes the contractual obligations relating to the Company’s mortgages, notes and loans payable as of December 31, 2021, based on extended maturity dates:
| thousands | Mortgages, notes and loans payable principal payments | |||||||
| 2022 | $ | |||||||
| 2023 | ||||||||
| 2024 | ||||||||
| 2025 | ||||||||
| 2026 | ||||||||
| Thereafter | ||||||||
| Total principal payments | ||||||||
| Unamortized deferred financing and bond issuance costs | ( | |||||||
| Total mortgages, notes and loans payable | $ | |||||||
HHC 2021 FORM 10-K | 109
FINANCIAL STATEMENTS FOOTNOTES | |||||
8. Fair Value | ||
ASC 820, Fair Value Measurement, emphasizes that fair value is a market-based measurement that should be determined using assumptions market participants would use in pricing an asset or liability. The standard establishes a hierarchal disclosure framework which prioritizes and ranks the level of market price observability used in measuring assets or liabilities at fair value. Market price observability is impacted by a number of factors, including the type of investment and the characteristics specific to the asset or liability. Assets or liabilities with readily available active quoted prices, or for which fair value can be measured from actively quoted prices, generally will have a higher degree of market price observability and a lesser degree of judgment used in measuring fair value.
The following table presents the fair value measurement hierarchy levels required under ASC 820 for the Company’s liabilities that are measured at fair value on a recurring basis:
| December 31, 2021 | December 31, 2020 | ||||||||||||||||||||||||||||||||||||||||||||||
| Fair Value Measurements Using | Fair Value Measurements Using | ||||||||||||||||||||||||||||||||||||||||||||||
| thousands | Total | Quoted Prices in Active Markets for Identical Assets (Level 1) | Significant Other Observable Inputs (Level 2) | Significant Unobservable Inputs (Level 3) | Total | Quoted Prices in Active Markets for Identical Assets (Level 1) | Significant Other Observable Inputs (Level 2) | Significant Unobservable Inputs (Level 3) | |||||||||||||||||||||||||||||||||||||||
| Assets: | |||||||||||||||||||||||||||||||||||||||||||||||
| Interest rate derivative assets | $ | $ | $ | $ | $ | $ | $ | $ | |||||||||||||||||||||||||||||||||||||||
| Liabilities: | |||||||||||||||||||||||||||||||||||||||||||||||
| Interest rate derivative liabilities | $ | $ | $ | $ | $ | $ | $ | $ | |||||||||||||||||||||||||||||||||||||||
The fair values of interest rate derivatives are determined using the market standard methodology of netting the discounted future fixed cash payments and the discounted expected variable cash receipts. The variable cash receipts are based on an expectation of future interest rates derived from observable market interest rate curves.
The estimated fair values of the Company’s financial instruments that are not measured at fair value on a recurring basis are as follows:
| December 31, 2021 | December 31, 2020 | ||||||||||||||||||||||||||||
| thousands | Fair Value Hierarchy | Carrying Amount | Estimated Fair Value | Carrying Amount | Estimated Fair Value | ||||||||||||||||||||||||
| Assets: | |||||||||||||||||||||||||||||
| Cash and Restricted cash | Level 1 | $ | $ | $ | $ | ||||||||||||||||||||||||
| Accounts receivable, net (a) | Level 3 | ||||||||||||||||||||||||||||
| Notes receivable, net (b) | Level 3 | ||||||||||||||||||||||||||||
| Liabilities: | |||||||||||||||||||||||||||||
| Fixed-rate debt (c) | Level 2 | ||||||||||||||||||||||||||||
| Variable-rate debt (c) | Level 2 | ||||||||||||||||||||||||||||
(a)Accounts receivable, net is shown net of an allowance of $16.5 million at December 31, 2021, and $33.0 million at December 31, 2020. Refer to Note 1 - Summary of Significant Accounting Policies for additional information on the allowance.
(b)Notes receivable, net is shown net of an allowance of $0.2 million at December 31, 2021, and $0.2 million at December 31, 2020. Refer to Note 1 - Summary of Significant Accounting Policies for additional information on the allowance.
(c)Excludes related unamortized financing costs.
The carrying amounts of Cash and Restricted cash, Accounts receivable, net and Notes receivable, net approximate fair value because of the short‑term maturity of these instruments.
HHC 2021 FORM 10-K | 110
FINANCIAL STATEMENTS FOOTNOTES | |||||
The fair value of the Company’s Senior Notes, included in fixed-rate debt in the table above, is based upon the trade price closest to the end of the period presented. The fair value of other fixed-rate debt in the table above was estimated based on a discounted future cash payment model, which includes risk premiums and risk-free rates derived from the current LIBOR or U.S. Treasury obligation interest rates. Refer to Note 7 - Mortgages, Notes and Loans Payable, Net for additional information. The discount rates reflect the Company’s judgment as to what the approximate current lending rates for loans or groups of loans with similar maturities and credit quality would be if credit markets were operating efficiently and assuming that the debt is outstanding through maturity.
The carrying amounts for the Company’s variable-rate debt approximate fair value given that the interest rates are variable and adjust with current market rates for instruments with similar risks and maturities.
The below table includes a non-financial asset that was measured at fair value on a non-recurring basis resulting in the properties being impaired:
| Fair Value Measurements Using | ||||||||||||||||||||||||||
| thousands | Segment | Total Fair Value Measurement | Quoted Prices in Active Markets for Identical Assets (Level 1) | Significant Other Observable Inputs (Level 2) | Significant Unobservable Inputs (Level 3) | |||||||||||||||||||||
| 2021 | ||||||||||||||||||||||||||
| Century Park (a) | Strategic Developments | $ | $ | $ | $ | |||||||||||||||||||||
| 2020 | ||||||||||||||||||||||||||
| Outlet Collection at Riverwalk (b) | Operating Assets | |||||||||||||||||||||||||
(a)The fair value was measured using weighted income and market valuation techniques as of the impairment date in the second quarter of 2021. Refer to Note 4 - Impairment for additional information.
(b)The fair value was measured as of the impairment date in 2020 based on a discounted cash flow analysis using a capitalization rate of 10.0 % and is shown net of transaction costs. Refer to Note 4 - Impairment for additional information.
9. Derivative Instruments and Hedging Activities | ||
The Company is exposed to interest rate risk related to its variable interest rate debt, and it manages this risk by utilizing interest rate derivatives. The Company uses interest rate swaps, collars and caps to add stability to interest costs by reducing the Company’s exposure to interest rate movements. Interest rate swaps designated as cash flow hedges involve the receipt of variable amounts from a counterparty in exchange for the Company’s fixed‑rate payments over the life of the agreements without exchange of the underlying notional amount. Interest rate caps designated as cash flow hedges involve the receipt of variable amounts from a counterparty if interest rates rise above the strike rate on the contract in exchange for an up‑front premium. The Company’s interest rate cap is not currently designated as a hedge, and therefore, any gain or loss is recognized in current-period earnings. These derivatives are recorded on a gross basis at fair value on the balance sheet.
Assessments of hedge effectiveness are performed quarterly using regression analysis. The change in the fair value of derivatives designated and qualifying as cash flow hedges is recorded in Accumulated Other Comprehensive Income (AOCI) and is subsequently reclassified into earnings in the period that the hedged forecasted transaction affects earnings within the same income statement line item being hedged. Derivatives accounted for as cash flow hedges are classified in the same category in the Consolidated Statements of Cash Flows as the items being hedged. Gains and losses from derivative financial instruments are reported in Cash provided by (used in) operating activities within the Consolidated Statements of Cash Flows.
The Company is exposed to credit risk in the event of non-performance by its derivative counterparties. The Company evaluates counterparty credit risk through monitoring the creditworthiness of counterparties, which includes review of debt ratings and financial performance. To mitigate its credit risk, the Company enters into agreements with counterparties that are considered credit-worthy, such as large financial institutions with favorable credit ratings. There were no events of default as of December 31, 2021 and 2020.
HHC 2021 FORM 10-K | 111
FINANCIAL STATEMENTS FOOTNOTES | |||||
If the derivative contracts are terminated prior to their maturity, the amounts previously recorded in AOCI are recognized into earnings over the period that the hedged transaction impacts earnings. If the hedging relationship is discontinued because it is probable that the forecasted transaction will not occur in accordance with the original strategy, any related amounts previously recorded in AOCI are recognized in earnings immediately. During the years ended December 31, 2021 and 2020, there were no 2.4 million reduction in Interest expense related to the amortization of terminated swaps. The Company has deferred the effective portion of the fair value change of an interest rate swap agreement in Accumulated other comprehensive loss on the accompanying Consolidated Balance Sheet for the year ended December 31, 2021, and will recognize the impact as a component of Interest expense over the next six years , which is what remains of the original forecasted period. During the years ended December 31, 2021 and 2020, the Company did no
Amounts reported in AOCI related to derivatives will be reclassified to Interest expense as interest payments are made on the Company’s variable‑rate debt. Over the next 12 months, HHC estimates that an additional $15.2 million of net loss will be reclassified to Interest expense including amounts related to the amortization of terminated swaps.
The following table summarizes certain terms of the Company’s derivative contracts:
| Fixed | Fair Value Asset (Liability) | |||||||||||||||||||||||||||||||
| Notional | Interest | Effective | Maturity | December 31, | December 31, | |||||||||||||||||||||||||||
| thousands | Balance Sheet Location | Amount | Rate (a) | Date | Date | 2021 | 2020 | |||||||||||||||||||||||||
| Derivative instruments not designated as hedging instruments: (b) | ||||||||||||||||||||||||||||||||
| Interest rate cap | (c) | Prepaid expenses and other assets, net | 3/12/2021 | 9/15/2023 | $ | $ | ||||||||||||||||||||||||||
| Interest rate cap | (c) | Prepaid expenses and other assets, net | 3/12/2021 | 9/15/2023 | ||||||||||||||||||||||||||||
| Interest rate cap | Prepaid expenses and other assets, net | 8/31/2020 | 10/17/2022 | |||||||||||||||||||||||||||||
| Interest rate cap | (d) | Prepaid expenses and other assets, net | 10/12/2021 | 9/29/2025 | ||||||||||||||||||||||||||||
| Interest rate cap | (e) | Prepaid expenses and other assets, net | 10/12/2021 | 9/29/2025 | ||||||||||||||||||||||||||||
| Total fair value derivative assets | $ | $ | ||||||||||||||||||||||||||||||
| Derivative instruments designated as hedging instruments: | ||||||||||||||||||||||||||||||||
| Interest rate swap | (f) | Accounts payable and accrued expenses | 9/21/2018 | 9/18/2023 | $ | ( | $ | ( | ||||||||||||||||||||||||
| Interest rate swap | (g) | Accounts payable and accrued expenses | 11/1/2019 | 1/1/2032 | ( | ( | ||||||||||||||||||||||||||
| Total fair value derivative liabilities | ( | ( | ||||||||||||||||||||||||||||||
| Total fair value derivatives, net | $ | ( | $ | ( | ||||||||||||||||||||||||||||
(a)These rates represent the strike rate on HHC’s interest swaps and caps.
(b)Interest expense included in the Consolidated Statements of Operations for the year ended December 31, 2021 and 2020, related to these contracts was not material.
(c)Concurrent with the closing of the $368.2 million construction loan for Victoria Place in 2021, the Company entered into two new LIBOR interest rate caps.
(d)Concurrent with the closing of the $75.0 million construction loan for 1700 Pavilion in 2021, the Company entered into this interest rate cap.
(e)Concurrent with the closing of the $59.5 million construction loan for Tanager Echo in 2021, the Company entered into this interest rate cap.
(f)Concurrent with the funding of the $615.0 million Term Loan in September 2018, the Company entered into this interest rate swap which is designated as a cash flow hedge. In conjunction with the sale of The Westin at The Woodlands and Embassy Suites at Hughes Landing in September 2021, $181.8 million was repaid on the Term Loan. This swap covers the outstanding balance on the Term Loan in addition to other LIBOR-based debt held by the Company.
The tables below present the effect of the Company’s derivative financial instruments on the Consolidated Statements of Operations for the years ended December 31:
| Derivatives in Cash Flow Hedging Relationships | Amount of Gain (Loss) Recognized in AOCI on Derivatives | ||||||||||||||||
| thousands | 2021 | 2020 | 2019 | ||||||||||||||
| Interest rate derivatives | $ | $ | ( | $ | ( | ||||||||||||
| Location of Gain (Loss) Reclassified from AOCI into Operations | Amount of Gain (Loss) Reclassified from AOCI into Operations | ||||||||||||||||
| thousands | 2021 | 2020 | 2019 | ||||||||||||||
| Interest expense | $ | ( | $ | ( | $ | ||||||||||||
HHC 2021 FORM 10-K | 112
FINANCIAL STATEMENTS FOOTNOTES | |||||
| Interest Expense Presented in Results of Operations | Total Interest Expense Presented in the Results of Operations in which the Effects of Cash Flow Hedges are Recorded | ||||||||||||||||
| thousands | 2021 | 2020 | 2019 | ||||||||||||||
| Interest expense | $ | $ | $ | ||||||||||||||
Credit-risk-related Contingent Features The Company has agreements with certain derivative counterparties that contain a provision where if the Company defaults on any of its indebtedness, including default where repayment of the indebtedness has not been accelerated by the lender, then the Company could also be declared in default on its derivative obligations. The Company also has agreements with certain derivative counterparties that contain a provision where the Company could be declared in default on its derivative obligations if repayment of the underlying indebtedness is accelerated by the lender due to the Company’s default on the indebtedness.
The fair value of derivatives in a net liability position, which includes accrued interest but excludes any adjustment for nonperformance risk, related to these agreements was $28.5 million as of December 31, 2021, and $54.6 million as of December 31, 2020. If the Company had breached any of these provisions at December 31, 2021, it could have been required to settle its obligations under the agreements at their termination value of $28.5 million.
10. Commitments and Contingencies | ||
In the normal course of business, from time to time, the Company is involved in legal proceedings relating to the ownership and operations of its properties. In management’s opinion, the liabilities, if any, that may ultimately result from normal course of business legal actions or The Woodlands legal proceeding discussed below, are not expected to have a material effect on the Company’s consolidated financial position, results of operations or liquidity.
Litigation On June 14, 2018, the Company was served with a petition involving approximately 500 individuals or entities who claim that their properties, located in the Timarron Park neighborhood of The Woodlands, were damaged by flood waters that resulted from the unprecedented rainfall that occurred throughout Harris County and surrounding areas during Hurricane Harvey in August 2017. The complaint was filed in State Court in Harris County of the State of Texas. In general, the plaintiffs allege negligence in the development of Timarron Park and violations of Texas’ Deceptive Trade Practices Act and name as defendants The Howard Hughes Corporation, The Woodlands Land Development Company and two unaffiliated parties involved in the planning and engineering of Timarron Park. The plaintiffs are seeking restitution for damages to their property and diminution of their property values. The Company intends to vigorously defend the matter as it believes that these claims are without merit and that it has substantial legal and factual defenses to the claims and allegations contained in the complaint. Based upon the present status of this matter, the Company does not believe it is probable that a loss will be incurred. Accordingly, the Company has not recorded a charge as a result of this action.
The Company entered into a settlement agreement with the Waiea homeowners association related to certain construction defects at the condominium tower. Pursuant to the settlement agreement, the Company will pay for the repair of the defects. The Company believes that the general contractor is ultimately responsible for the defects and expects to recover all the repair costs from the general contractor, other responsible parties and insurance proceeds; however, the Company can provide no assurances that all or any portion of the costs will be recovered. The Company recorded total expenses of $99.2 million for the estimated repair costs related to this matter during 2020. An additional $21.0 million was charged during the year ended December 31, 2021, related to additional anticipated costs. These amounts were included in Condominium rights and unit cost of sales in the accompanying Consolidated Statements of Operations. As of December 31, 2021, a total of $96.6 million remains in Construction payables for the estimated repair costs related to this matter, which is included in Accounts payable and accrued expenses in the accompanying Consolidated Balance Sheet.
Environmental Matters The Company purchased its 250 Water Street property in the Seaport in June 2018. The site is currently used as a parking lot while the Company continues to move forward with redevelopment planning. The Company engaged a third-party specialist to perform a Phase I Environmental Site Assessment (ESA), and the ESA identified, among other findings, the existence of mercury in the soil at levels above New York State regulatory criteria. The site is in the State Brownfield Cleanup Program and will be remediated under this program. The normal operations of the parking lot do not require the property to be remediated, and the Company had not started any redevelopment activities as of December 31, 2021. As a result, the potential remediation had no financial impact for the year ended December 31, 2021.
Letters of Credit and Surety Bonds As of December 31, 2021, the Company had outstanding letters of credit totaling $5.1 million and surety bonds totaling $331.0 million. As of December 31, 2020, the Company had outstanding letters of credit totaling $5.2 million and surety bonds totaling $272.4 million. These letters of credit and bonds were issued primarily in connection with insurance requirements, special real estate assessments and construction obligations.
HHC 2021 FORM 10-K | 113
FINANCIAL STATEMENTS FOOTNOTES | |||||
Operating Leases The Company leases land or buildings at certain properties from third parties, which are recorded in Operating lease right-of-use assets, net and Operating lease obligations on the Consolidated Balance Sheets. See Note 17 - Leases for further discussion. Contractual rental expense, including participation rent, was $7.2 million for the year ended December 31, 2021, $7.2 million for the year ended December 31, 2020, and $8.5 million for the year ended December 31, 2019. The amortization of above and below‑market ground leases and straight‑line rents included in the contractual rent amount was not significant.
Guarantee Agreements The Company has entered into guarantee agreements as part of certain development projects. In conjunction with the execution of the ground lease for the Seaport, the Company executed a completion guarantee for the redevelopment of Pier 17 and the Tin Building. The Company satisfied its completion guarantee for Pier 17 in the second quarter of 2019. The completion guaranty for the Tin Building is for the core and shell construction, which is now complete. The Company is working with the New York City Economic Development Corporation to receive the completion certificate necessary to relinquish the guarantee.
The Company’s wholly owned subsidiaries agreed to complete defined public improvements and to indemnify Howard County, Maryland, for certain matters as part of the Downtown Columbia Redevelopment District TIF bonds. The Company’s guarantee of the performance of its subsidiaries under the funding agreement for up to a maximum of $1.0 million expired on October 31, 2020. Furthermore, to the extent that increases in taxes do not cover debt service payments on the TIF bonds, the Company’s wholly owned subsidiary is obligated to pay special taxes. Management has concluded that as of December 31, 2021, any obligations to pay special taxes are not probable.
As part of the Company’s development permits with the Hawai‘i Community Development Authority for the condominium towers at Ward Village, the Company entered into a guarantee whereby it is required to reserve 20 % of the residential units for local residents who meet certain maximum income and net worth requirements. This guarantee, which is triggered once the necessary permits are granted and construction commences, was satisfied for the Company’s three condominium towers, Waiea, Anaha and Ae‘o, with the opening of Ke Kilohana, which is a workforce tower fully earmarked to fulfill this obligation. The reserved units for ‘A‘ali‘i tower are included in the tower. Units for Kō'ula and Victoria Place, the two towers under construction, will be satisfied with the construction of Ulana Ward Village, which is a second workforce tower fully earmarked to fulfill the remaining obligation. As a result of this guarantee, the Company expects reserved housing towers will be delivered on a break-even basis.
The Company evaluates the likelihood of future performance under these guarantees and did not record an obligation as of December 31, 2021, and December 31, 2020.
11. Stock-Based Compensation Plans | ||
On May 14, 2020, the Company’s shareholders approved The Howard Hughes Corporation 2020 Equity Incentive Plan (the 2020 Equity Plan). Pursuant to the 2020 Equity Plan, 1,350,000 shares of the Company’s common stock were reserved for issuance. The 2020 Equity Plan provides for grants of options, stock appreciation rights, restricted stock, restricted stock units and other stock-based awards (collectively, the Awards). Employees, directors and consultants of the Company are eligible for Awards. The 2020 Equity Incentive Plan is administered by the Compensation Committee of the Board of Directors.
Prior to the adoption of the 2020 Equity Plan, equity awards were issued under The Howard Hughes Corporation Amended and Restated 2010 Equity Incentive Plan (the 2010 Equity Plan). The adoption of the 2020 Equity Plan did not impact the administration of Awards issued under the 2010 Equity Plan but following adoption of the 2020 Equity Plan, equity awards will no longer be granted under the 2010 Equity Plan.
As of December 31, 2021, there were a maximum of 1,102,470 shares available for future grant under the Company’s 2020 Equity Plan.
HHC 2021 FORM 10-K | 114
FINANCIAL STATEMENTS FOOTNOTES | |||||
The following summarizes stock-based compensation expense, net of amounts capitalized to development projects, for the years ended December 31:
| thousands | 2021 | 2020 | 2019 | ||||||||||||||
| Stock Options (a)(b) | $ | $ | ( | $ | |||||||||||||
| Restricted Stock (c)(d) | |||||||||||||||||
| Pre-tax stock-based compensation expense | $ | $ | $ | ||||||||||||||
| Income tax benefit | $ | $ | $ | ||||||||||||||
(a)Amounts shown are net of $0.1 million capitalized to development projects in 2021, $0.2 million capitalized to development projects in 2020 and $0.4 million capitalized to development projects in 2019.
(b)The credit position for the year ended December 31, 2020, was due to significant forfeitures which exceeded the expense.
(c)Amounts shown are net of $2.2 million capitalized to development projects in 2021, $0.9 million capitalized to development projects in 2020 and $1.0 million capitalized to development projects in 2019.
Stock Options The following table summarizes stock option activity:
| Stock Options | Weighted-average Exercise Price | Weighted-average Remaining Contractual Term (years) | Aggregate Intrinsic Value | ||||||||||||||
Stock options outstanding at December 31, 2020 | $ | ||||||||||||||||
| Granted | $ | ||||||||||||||||
| Exercised (a) | ( | ||||||||||||||||
| Forfeited | ( | ||||||||||||||||
| Expired | ( | ||||||||||||||||
Stock options outstanding at December 31, 2021 | $ | $ | |||||||||||||||
Stock options vested and expected to vest at December 31, 2021 | $ | $ | |||||||||||||||
Stock options exercisable at December 31, 2021 | $ | $ | |||||||||||||||
(a)The total intrinsic value of stock options exercised was $2.6 million during 2021, $2.4 million during 2020, and $2.4 million during 2019, based on the difference between the market price at the exercise date and the exercise price.
Cash received from stock option exercises was $4.1 million in 2021, $4.6 million in 2020, and $3.5 million in 2019 and the tax benefit from these exercises was $0.6 million in 2021, $0.5 million in 2020, and $0.5 million in 2019.
The fair value of stock option awards is determined using the Black-Scholes option-pricing model with the following assumptions:
–Expected life—Based on the average of the time to vesting and full term of an option
–Risk-free interest rates—Based on the U.S. Treasury rate over the expected life of an option
–Expected volatility—Based on the average of implied and historical volatilities as of each of the grant dates
The fair value on the grant date and the significant assumptions used in the Black‑Scholes option‑pricing model are as follows:
| 2021 | 2020 | 2019 | |||||||||||||||
| Weighted-average grant date fair value | $ | $ | $ | ||||||||||||||
| Assumptions | |||||||||||||||||
| Expected life of options (in years) | |||||||||||||||||
| Risk-free interest rate | % | % | % | ||||||||||||||
| Expected volatility | % | % | % | ||||||||||||||
| Expected annual dividend per share | |||||||||||||||||
Generally, options granted vest over requisite service periods, expire ten years after the grant date and generally do not become exercisable until their restrictions on exercise lapse after the five-year anniversary of the grant date.
The balance of unamortized stock option expense as of December 31, 2021, is $1.7 million, which is expected to be recognized over a weighted‑average period of 3.1 years.
HHC 2021 FORM 10-K | 115
FINANCIAL STATEMENTS FOOTNOTES | |||||
Restricted Stock Restricted stock awards issued under the 2020 Equity Plan provide that shares awarded may not be sold or otherwise transferred until restrictions have lapsed as established by the Committee. In addition to the granting of restricted stock to certain members of management, the Company awards restricted stock to non‑employee directors as part of their annual retainer. The management awards generally vest over a range of to five years , and the restriction on the non‑employee director shares generally lapses on the date of the Company’s following annual meeting of shareholders, or June 1st of the year following the award year, whichever is earlier, in each case generally subject to continued service.
The following table summarizes restricted stock activity:
| Restricted Stock | Weighted-average Grant Date Fair Value | ||||||||||
| Restricted stock outstanding at December 31, 2020 | $ | ||||||||||
| Granted | |||||||||||
| Vested | ( | ||||||||||
| Forfeited | ( | ||||||||||
| Restricted stock outstanding at December 31, 2021 | $ | ||||||||||
The grant date fair value of restricted stock is based on the closing sales price of common stock on the grant date. For restricted stock awards that vest based on shareholder returns, the grant date fair values are calculated using a Monte-Carlo approach which simulates the Company’s stock price on the corresponding vesting dates and are reflected at the target level of performance in the table above.
The weighted-average grant-date fair value per share of restricted stock granted was $71.48 during 2020 and $98.78 during 2019. The fair value of restricted stock that vested was $6.9 million during 2021, $5.6 million during 2020, and $14.9 million during 2019, based on the market price at the vesting date.
The balance of unamortized restricted stock expense as of December 31, 2021, was $16.2 million, which is expected to be recognized over a weighted‑average period of 3.0 years.
12. Income Taxes | ||
Deferred income taxes are accounted for using the asset and liability method. Deferred tax assets and liabilities are recognized for the expected future tax consequences of events that have been included in the financial statements or tax returns. Under this method, deferred tax assets and liabilities are determined based on the differences between the financial reporting and tax basis of assets and liabilities using enacted tax rates currently in effect. Deferred income taxes also reflect the impact of operating loss and tax credit carryforwards.
The following summarizes income tax expense (benefit) for the years ended December 31:
| thousands | 2021 | 2020 | 2019 | ||||||||||||||
| Current | $ | $ | $ | ||||||||||||||
| Deferred | |||||||||||||||||
| Total | $ | $ | $ | ||||||||||||||
HHC 2021 FORM 10-K | 116
FINANCIAL STATEMENTS FOOTNOTES | |||||
Reconciliation of the Income tax expense (benefit) if computed at the U.S. federal statutory income tax rate to the Company’s reported Income tax expense (benefit) for the years ended December 31 is as follows:
| thousands except percentages | 2021 | 2020 | 2019 | ||||||||||||||
| Income (loss) before income taxes | $ | $ | $ | ||||||||||||||
| U.S. federal statutory tax rate | % | % | % | ||||||||||||||
| Tax computed at the U.S. federal statutory rate | $ | $ | $ | ||||||||||||||
| Increase (decrease) in valuation allowance, net | |||||||||||||||||
| State income taxes, net of federal income tax expense (benefit) | ( | ( | |||||||||||||||
| Tax expense (benefit) from other change in rates, prior period adjustments and other permanent differences | ( | ( | |||||||||||||||
| Tax expense on compensation disallowance | |||||||||||||||||
| Net (income) loss attributable to noncontrolling interests (a) | ( | ||||||||||||||||
| Tax expense (benefit) on tax credits | ( | ||||||||||||||||
| Income tax expense (benefit) | $ | $ | $ | ||||||||||||||
| Effective tax rate | % | % | % | ||||||||||||||
As of December 31, 2021, the amounts and expiration dates of operating loss, capital loss and charitable contribution carryforwards for tax purposes are as follows:
| thousands | Amount | Expiration Date | |||||||||
| Net operating loss carryforwards - Federal | $ | n/a | |||||||||
| Net operating loss carryforwards - State (a) | 2022-2041 | ||||||||||
| Net operating loss carryforwards - State (a) | n/a | ||||||||||
| Capital loss carryforwards - Federal | 2025 | ||||||||||
| Charitable contribution carryforwards - Federal | 2025 | ||||||||||
(a)A valuation allowance has been recorded against the deferred tax benefit related to a majority of the state net operating loss carryforwards.
The following summarizes tax effects of temporary differences and carryforwards included in the net deferred tax liabilities as of December 31:
| thousands | 2021 | 2020 | |||||||||
| Deferred tax assets: | |||||||||||
| Operating and Strategic Developments properties, primarily differences in basis of assets and liabilities | $ | $ | |||||||||
| Operating loss and tax carryforwards | |||||||||||
| Total deferred tax assets | |||||||||||
| Valuation allowance | ( | ( | |||||||||
| Total net deferred tax assets | $ | $ | |||||||||
| Deferred tax liabilities: | |||||||||||
| Property associated with MPCs, primarily differences in the tax basis of land assets and treatment of interest and other costs | $ | ( | $ | ( | |||||||
| Operating and Strategic Developments properties, primarily differences in basis of assets and liabilities | ( | ( | |||||||||
| Deferred income | ( | ( | |||||||||
| Total deferred tax liabilities | ( | ( | |||||||||
| Total net deferred tax liabilities | $ | ( | $ | ( | |||||||
HHC 2021 FORM 10-K | 117
FINANCIAL STATEMENTS FOOTNOTES | |||||
The deferred tax liability associated with the Company’s MPCs is largely attributable to the difference between the basis and value determined as of the date of the acquisition by its predecessors adjusted for sales that have occurred since that time. The recognition of these deferred tax liabilities is dependent upon the timing and sales price of future land sales and the method of accounting used for income tax purposes. The deferred tax liability related to deferred income represents the difference between the income tax method of accounting and the financial statement method of accounting for prior sales of land in the Company’s MPCs.
Generally, the Company is currently open to audit under the statute of limitations by the Internal Revenue Service as well as state taxing authorities for the years ended December 31, 2018 through 2021. In the Company’s opinion, it has made adequate tax provisions for years subject to examination. However, the final determination of tax examinations and any related litigation could be different from what was reported on the returns.
The Company applies the generally accepted accounting principle related to accounting for uncertainty in income taxes, which prescribes a recognition threshold that a tax position is required to meet before recognition in the financial statements and provides guidance on derecognition, measurement, classification, interest and penalties, accounting in interim periods, disclosure and transition issues.
The Company recognizes and reports interest and penalties related to unrecognized tax benefits, if applicable, within the provision for income tax expense. The Company had no no
13. Warrants | ||
On October 7, 2016, the Company entered into a warrant agreement with David R. O’Reilly, (O’Reilly Warrant) prior to his appointment to his previous position of Chief Financial Officer. Upon exercise of his warrant, Mr. O’Reilly may acquire 50,125 shares of common stock at an exercise price of $112.08 per share. The O’Reilly Warrant was issued at fair value in exchange for a $1.0 million payment in cash from Mr. O’Reilly. The O’Reilly Warrant becomes exercisable on April 6, 2022, subject to earlier exercise upon certain change in control, separation and termination provisions, and will expire on October 2, 2022.
On June 16, 2017, and October 4, 2017, the Company entered into warrant agreements with its Chief Executive Officer, David R. Weinreb, (Weinreb Warrant) and President, Grant Herlitz, (Herlitz Warrant) to acquire 1,965,409 shares and 87,951 shares of common stock for the purchase price of $50.0 million and $2.0 million, respectively. The Weinreb Warrant would have become exercisable on June 15, 2022, at an exercise price of $124.64 per share, and the Herlitz Warrant would have become exercisable on October 3, 2022, at an exercise price of $117.01 per share, subject in each case to earlier exercise upon certain change in control, separation and termination provisions. The Weinreb Warrant expires June 15, 2023, and the Herlitz Warrant expires October 3, 2023. The purchase prices paid by the respective executives for the O’Reilly Warrant, the Weinreb Warrant and the Herlitz Warrant, which qualify as equity instruments, are included within Additional paid-in capital in the Consolidated Balance Sheets at December 31, 2021 and 2020.
HHC 2021 FORM 10-K | 118
FINANCIAL STATEMENTS FOOTNOTES | |||||
14. Accumulated Other Comprehensive Income | ||
The following tables summarize changes in AOCI by component, all of which are presented net of tax:
| thousands | |||||
| Balance as of December 31, 2018 | $ | ( | |||
| Other comprehensive income (loss) before reclassifications | ( | ||||
| (Gain) loss reclassified from accumulated other comprehensive loss to net income | ( | ||||
| Pension adjustment | |||||
| Net current-period other comprehensive income (loss) | ( | ||||
| Balance as of December 31, 2019 | ( | ||||
| Other comprehensive income (loss) before reclassifications | ( | ||||
| (Gain) loss reclassified from accumulated other comprehensive loss to net income | |||||
| Pension adjustment | ( | ||||
| Share of investee's other comprehensive income | |||||
| Deconsolidation of 110 North Wacker | |||||
| Net current-period other comprehensive income (loss) | ( | ||||
| Balance as of December 31, 2020 | ( | ||||
| Other comprehensive income (loss) before reclassifications | |||||
| (Gain) loss reclassified from accumulated other comprehensive loss to net income | |||||
| Pension adjustment | |||||
| Share of investee's other comprehensive income | |||||
| Net current-period other comprehensive income (loss) | |||||
| Balance as of December 31, 2021 | $ | ( | |||
The following table summarizes the amounts reclassified out of AOCI:
Accumulated Other Comprehensive Income (Loss) Components thousands | Amounts reclassified from Accumulated Other Comprehensive Income (Loss) | |||||||||||||
| For the Year Ended | Affected line items in the Statements of Operations | |||||||||||||
| 2021 | 2020 | |||||||||||||
| (Gains) losses on cash flow hedges | $ | $ | Interest expense | |||||||||||
| Income taxes on (gains) losses on cash flow hedges | ( | ( | Income tax expense (benefit) | |||||||||||
| Total reclassifications of (income) loss for the period | $ | $ | ||||||||||||
HHC 2021 FORM 10-K | 119
FINANCIAL STATEMENTS FOOTNOTES | |||||
15. Earnings Per Share | ||
Basic earnings (loss) per share (EPS) is computed by dividing net income (loss) available to common stockholders by the weighted‑average number of common shares outstanding. Diluted EPS is computed after adjusting the numerator and denominator of the basic EPS computation for the effects of all potentially dilutive common shares. The dilutive effect of options and non-vested stock issued under stock‑based compensation plans is computed using the treasury stock method. The dilutive effect of the warrants is computed using the if-converted method.
Information related to the Company’s EPS calculations is summarized for the years ended December 31 as follows:
| thousands except per share amounts | 2021 | 2020 | 2019 | ||||||||||||||
| Net income (loss) | |||||||||||||||||
| Net income (loss) | $ | $ | ( | $ | |||||||||||||
| Net (income) loss attributable to noncontrolling interests | ( | ( | |||||||||||||||
| Net income (loss) attributable to common stockholders | $ | $ | ( | $ | |||||||||||||
| Shares | |||||||||||||||||
| Weighted-average common shares outstanding - basic | |||||||||||||||||
| Restricted stock and stock options | |||||||||||||||||
| Warrants | |||||||||||||||||
| Weighted-average common shares outstanding - diluted | |||||||||||||||||
| Net income (loss) per common share | |||||||||||||||||
| Basic income (loss) per share | $ | $ | ( | $ | |||||||||||||
| Diluted income (loss) per share | $ | $ | ( | $ | |||||||||||||
The diluted EPS computation excludes 255,987 shares of stock options as of December 31, 2021, 372,736 shares as of December 31, 2020, and 488,108 shares as of December 31, 2019, because their effect is anti-dilutive. The diluted EPS computation also excludes 299,506 shares of restricted stock as of December 31, 2021, 409,110 shares as of December 31, 2020, and 291,485 shares as of December 31, 2019, because their effect is anti-dilutive.
Common Stock Offering On March 27, 2020, the Company offered 2,000,000 shares of common stock to the public at $50.00 per share and granted the underwriters an option to purchase up to an additional 300,000 shares of common stock at the same price. The underwriters exercised most of their option and purchased an additional 270,900 shares. Concurrently, the Company entered into a share purchase agreement with a related party, Pershing Square Capital Management, L.P., acting as investment advisor to funds that it manages, to issue and sell 10,000,000 shares of common stock in a private placement at $50.00 per share. The total issuance of 12,270,900 shares closed on March 31, 2020, and the Company received $593.6 million in net proceeds. The Company used the net proceeds for general corporate purposes including strengthening the Company’s balance sheet and enhancing liquidity.
Common Stock Repurchase In October 2021, the board of directors of The Howard Hughes Corporation, authorized a share repurchase program, pursuant to which the Company may, from time to time, purchase up to $250.0 million of its common stock through open market transactions. The date and time of such repurchases will depend upon market conditions. All repurchases will be made in compliance with, and at such times as permitted by, federal securities laws and may be suspended or discontinued at any time. The new program replaces the Company’s prior share repurchase program adopted in October 2019, which authorized the repurchase of up to $100.0 million of its common stock. Under the 2019 program, the Company had repurchased 496,000 shares of its common stock with an aggregate value of $53.9 million. Under the new program, during the fourth quarter of 2021, the Company repurchased 1,023,284 shares of its common stock, par value $0.01 per share, for $96.6 million, or approximately $94.42 per share. During the first quarter of 2022, the Company repurchased an additional 1,579,646 shares of its common stock, for $153.4 million, or approximately $97.10 per share, thereby completing all authorized purchases under the plan. All purchases were funded with cash on hand.
HHC 2021 FORM 10-K | 120
FINANCIAL STATEMENTS FOOTNOTES | |||||
16. Revenues | ||
The core principle of ASC 606, Revenues from Contracts with Customers, is that revenues from contracts with customers (excluding lease-related revenues) are recognized when control of the promised goods or services is transferred to the Company’s customers in an amount that reflects the consideration the Company expects to be entitled to in exchange for those goods or services. Under ASC 606, revenue and cost of sales for condominium units sold are not recognized until the construction is complete, the sale closes and the title to the property has transferred to the buyer (point in time). Additionally, certain real estate selling costs, such as the costs related to the Company’s condominium model units, are either expensed immediately or capitalized as property and equipment and depreciated over their estimated useful life.
The following presents the Company’s revenues disaggregated by revenue source for the years ended December 31:
| thousands | 2021 | 2020 | 2019 | ||||||||||||||
| Revenues from contracts with customers | |||||||||||||||||
| Recognized at a point in time | |||||||||||||||||
| Condominium rights and unit sales | $ | $ | $ | ||||||||||||||
| Master Planned Communities land sales | |||||||||||||||||
| Builder price participation | |||||||||||||||||
| Total | |||||||||||||||||
| Recognized at a point in time or over time | |||||||||||||||||
| Other land, rental and property revenues | |||||||||||||||||
| Rental and lease-related revenues | |||||||||||||||||
| Rental revenue | |||||||||||||||||
| Total revenues | $ | $ | $ | ||||||||||||||
| Revenues by segment | |||||||||||||||||
| Operating Assets revenues | $ | $ | $ | ||||||||||||||
| Master Planned Communities revenues | |||||||||||||||||
| Seaport revenues | |||||||||||||||||
| Strategic Developments revenues | |||||||||||||||||
| Corporate revenues | |||||||||||||||||
| Total revenues | $ | $ | $ | ||||||||||||||
Contract Assets and Liabilities Contract assets are the Company’s right to consideration in exchange for goods or services that have been transferred to a customer, excluding any amounts presented as a receivable. Contract liabilities are the Company’s obligation to transfer goods or services to a customer for which the Company has received consideration.
There were no contract assets for the periods presented. The contract liabilities primarily relate to escrowed condominium deposits, MPC land sales deposits and deferred MPC land sales related to unsatisfied land improvements. The beginning and ending balances of contract liabilities and significant activity during the periods presented are as follows:
| thousands | Contract Liabilities | ||||
Balance as of December 31, 2019 | $ | ||||
| Consideration earned during the period | ( | ||||
| Consideration received during the period | |||||
Balance as of December 31, 2020 | |||||
| Consideration earned during the period | ( | ||||
| Consideration received during the period | |||||
Balance as of December 31, 2021 | $ | ||||
HHC 2021 FORM 10-K | 121
FINANCIAL STATEMENTS FOOTNOTES | |||||
Remaining Unsatisfied Performance Obligations The Company’s remaining unsatisfied performance obligations represent a measure of the total dollar value of work to be performed on contracts executed and in progress. These performance obligations primarily relate to the completion of condominium construction and transfer of control to a buyer, as well as the completion of contracted MPC land sales and related land improvements. These obligations are associated with contracts that generally are noncancelable by the customer after 30 days; however, purchasers of condominium units have the right to cancel the contract should the Company elect not to construct the condominium unit within a certain period of time or materially change the design of the condominium unit. The aggregate amount of the transaction price allocated to the Company’s remaining unsatisfied performance obligations as of December 31, 2021, is $2.2 billion. The Company expects to recognize this amount as revenue over the following periods:
| thousands | Less than 1 year | 1-2 years | 3 years and thereafter | |||||||||||||||||
| Total remaining unsatisfied performance obligations | $ | $ | $ | |||||||||||||||||
17. Leases | ||
Lessee Arrangements The Company determines whether an arrangement is a lease at inception. Operating leases are included in Operating lease right-of-use assets, net and Operating lease obligations on the Consolidated Balance Sheets. Right-of-use assets represent the Company’s right to use an underlying asset for the lease term and lease liabilities represent the Company’s obligation to make lease payments arising from the lease. Operating lease right-of-use assets and liabilities are recognized at commencement date based on the present value of future minimum lease payments over the lease term. As most of the Company’s leases do not provide an implicit rate, the Company uses an estimate of the incremental borrowing rate based on the information available at the lease commencement date in determining the present value of future lease payments. The Operating lease right-of-use asset also includes any lease payments made, less any lease incentives and initial direct costs incurred. The Company does not have any finance leases as of December 31, 2021.
The Company’s lessee agreements consist of operating leases primarily for ground leases and other real estate. The majority of the Company’s leases have remaining lease terms of approximately 25 52 years, excluding extension options. Most leases include one or more options to renew, with renewal terms that can extend the lease term from to 48 years, and some of which may include options to terminate the leases within one year . The Company considers its strategic plan and the life of associated agreements in determining when options to extend or terminate lease terms are reasonably certain of being exercised. Leases with an initial term of 12 months or less are not recorded on the balance sheet; the Company recognizes lease expense for these leases on a straight-line basis over the lease term. Certain of the Company’s lease agreements include variable lease payments based on a percentage of income generated through subleases, changes in price indices and market rates, and other costs arising from operating, maintenance, and taxes. The Company’s lease agreements do not contain residual value guarantees or restrictive covenants. The Company leases certain buildings and office space constructed on its ground leases to third parties.
The Company’s leased assets and liabilities are as follows:
| thousands | 2021 | 2020 | |||||||||
| Assets | |||||||||||
| Operating lease right-of-use assets, net | $ | $ | |||||||||
| Liabilities | |||||||||||
| Operating lease obligations | $ | $ | |||||||||
The components of lease expense for the years ended December 31 are as follows:
| thousands | 2021 | 2020 | |||||||||
| Operating lease cost | $ | $ | |||||||||
| Variable lease costs | |||||||||||
| Net lease cost | $ | $ | |||||||||
HHC 2021 FORM 10-K | 122
FINANCIAL STATEMENTS FOOTNOTES | |||||
Future minimum lease payments as of December 31, 2021, are as follows:
| thousands | Operating Leases | ||||
| 2022 | $ | ||||
| 2023 | |||||
| 2024 | |||||
| 2025 | |||||
| 2026 | |||||
| Thereafter | |||||
| Total lease payments | |||||
| Less: imputed interest | ( | ||||
| Present value of lease liabilities | $ | ||||
Other information related to the Company’s lessee agreements is as follows:
| Supplemental Consolidated Statements of Cash Flows Information | Year ended December 31, | ||||||||||
| thousands | 2021 | 2020 | |||||||||
| Cash paid for amounts included in the measurement of lease liabilities: | |||||||||||
| Operating cash flows on operating leases | $ | $ | |||||||||
| Other Information | 2021 | 2020 | |||||||||
| Weighted-average remaining lease term (years) | |||||||||||
| Operating leases | |||||||||||
| Weighted-average discount rate | |||||||||||
| Operating leases | % | % | |||||||||
Lessor Arrangements The Company receives rental income from the leasing of retail, office, multi-family and other space under operating leases, as well as certain variable tenant recoveries. Such operating leases are with a variety of tenants and have a remaining average term of approximately four years . Lease terms generally vary among tenants and may include early termination options, extension options and fixed rental rate increases or rental rate increases based on an index. The minimum rentals based on operating leases of the consolidated properties held as of December 31, 2021, are as follows:
| Year ended December 31, | |||||||||||
| thousands | 2021 | 2020 | |||||||||
| Total Minimum Rent Payments | $ | $ | |||||||||
Total future minimum rents associated with operating leases are as follows:
| thousands | Total Minimum Rent | ||||
| 2022 | $ | ||||
| 2023 | |||||
| 2024 | |||||
| 2025 | |||||
| 2026 | |||||
| Thereafter | |||||
| Total | $ | ||||
Minimum rent revenues are recognized on a straight‑line basis over the terms of the related leases when collectability is reasonably assured and the tenant has taken possession of, or controls, the physical use of the leased asset. Percentage rent in lieu of fixed minimum rent is recognized as sales are reported from tenants. Minimum rent revenues reported on the Consolidated Statements of Operations also include amortization related to above and below‑market tenant leases on acquired properties.
HHC 2021 FORM 10-K | 123
FINANCIAL STATEMENTS FOOTNOTES | |||||
In response to the COVID-19 pandemic, the Company granted rent deferrals to certain tenants. Under the accounting elections provided by the FASB in response to the COVID-19 pandemic, the Company has elected to not assess whether COVID-19 related deferrals are lease modifications and will account for the deferrals as if contemplated in the original lease. Rent deferrals are treated as variable lease payments resulting in a decrease in straight-line rent revenue during the deferral period and additional revenue upon payment in subsequent periods. COVID-19 related rent deferrals, net of subsequent collections was $1.0 million as of December 31, 2021, and $4.8 million as of December 31, 2020.
In 2020, the Company sold 100 Fellowship Drive, the Company’s only material sales-type lease.
18. Segments | ||
The Company has four business segments that offer different products and services. HHC’s four segments are managed separately because each requires different operating strategies or management expertise and are reflective of management’s operating philosophies and methods. As further discussed in Item 7. Management’s Discussion and Analysis of Financial Condition and Results of Operations, one common operating measure used to assess operating results for the Company’s business segments is earnings before taxes (EBT). The Company’s segments or assets within such segments could change in the future as development of certain properties commences or other operational or management changes occur. All operations are within the United States. The Company’s reportable segments are as follows:
–Operating Assets – consists of developed or acquired retail, office and multi-family properties along with other real estate investments. These properties are currently generating revenues and may be redeveloped, repositioned or sold to improve segment performance or to recycle capital. This segment also included hospitality properties prior to the sale of The Woodlands Resort, The Westin at The Woodlands and Embassy Suites at Hughes Landing in the third quarter of 2021. Refer to Note 3 - Acquisitions and Dispositions for additional information.
–MPC – consists of the development and sale of land in large‑scale, long‑term community development projects in and around Las Vegas, Nevada; Houston, Texas; Phoenix, Arizona; and Columbia, Maryland.
–Seaport – consists of approximately 461,000 square feet of restaurant, retail and entertainment properties situated in three primary locations in New York, New York: Pier 17, Historic Area/Uplands and Tin Building as well as the 250 Water Street parking lot. While the Tin Building is still under development and will comprise about 53,783 square feet when completed, the two operating locations consist of third-party tenants, tenants either directly or jointly owned and operated by the Company and businesses owned and operated by the Company under licensing agreements.
–Strategic Developments – consists of residential condominium and commercial property projects currently under development and all other properties held for development which have no substantial operations.
Segment operating results are as follows:
| thousands | Operating Assets Segment (a) | MPC Segment | Seaport Segment | Strategic Developments Segment | Total | ||||||||||||||||||
| Year ended December 31, 2021 | |||||||||||||||||||||||
| Total revenues | $ | $ | $ | $ | $ | ||||||||||||||||||
| Total operating expenses | ( | ( | ( | ( | ( | ||||||||||||||||||
| Segment operating income (loss) | ( | ||||||||||||||||||||||
| Depreciation and amortization | ( | ( | ( | ( | ( | ||||||||||||||||||
| Interest income (expense), net | ( | ( | |||||||||||||||||||||
| Other income (loss), net | ( | ( | ( | ||||||||||||||||||||
| Equity in earnings (losses) from real estate and other affiliates | ( | ( | ( | ( | |||||||||||||||||||
| Gain (loss) on sale or disposal of real estate and other assets, net | |||||||||||||||||||||||
| Gain (loss) on extinguishment of debt | ( | ( | ( | ||||||||||||||||||||
| Provision for impairment | ( | ( | |||||||||||||||||||||
| Segment EBT | $ | ( | $ | $ | ( | $ | $ | ||||||||||||||||
| Corporate income, expenses and other items | ( | ||||||||||||||||||||||
| Net income (loss) | |||||||||||||||||||||||
| Net (income) loss attributable to noncontrolling interests | |||||||||||||||||||||||
| Net income (loss) attributable to common stockholders | $ | ||||||||||||||||||||||
HHC 2021 FORM 10-K | 124
FINANCIAL STATEMENTS FOOTNOTES | |||||
| thousands | Operating Assets Segment (a) | MPC Segment | Seaport Segment | Strategic Developments Segment | Total | ||||||||||||||||||
| Year Ended December 31, 2020 | |||||||||||||||||||||||
| Total revenues | $ | $ | $ | $ | $ | ||||||||||||||||||
| Total operating expenses | ( | ( | ( | ( | ( | ||||||||||||||||||
| Segment operating income (loss) | ( | ( | |||||||||||||||||||||
| Depreciation and amortization | ( | ( | ( | ( | ( | ||||||||||||||||||
| Interest income (expense), net | ( | ( | ( | ||||||||||||||||||||
| Other income (loss), net | ( | ||||||||||||||||||||||
| Equity in earnings (losses) from real estate and other affiliates | ( | ( | |||||||||||||||||||||
| Gain (loss) on sale or disposal of real estate and other assets, net | |||||||||||||||||||||||
| Gain (loss) on extinguishment of debt | ( | ( | ( | ||||||||||||||||||||
| Provision for impairment | ( | ( | |||||||||||||||||||||
| Segment EBT | $ | ( | $ | $ | ( | $ | $ | ||||||||||||||||
| Corporate income, expenses and other items | ( | ||||||||||||||||||||||
| Net income (loss) | ( | ||||||||||||||||||||||
| Net (income) loss attributable to noncontrolling interests | ( | ||||||||||||||||||||||
| Net income (loss) attributable to common stockholders | $ | ( | |||||||||||||||||||||
| Year Ended December 31, 2019 | |||||||||||||||||||||||
| Total revenues | $ | $ | $ | $ | $ | ||||||||||||||||||
| Total operating expenses | ( | ( | ( | ( | ( | ||||||||||||||||||
| Segment operating income (loss) | ( | ||||||||||||||||||||||
| Depreciation and amortization | ( | ( | ( | ( | ( | ||||||||||||||||||
| Interest income (expense), net | ( | ( | ( | ||||||||||||||||||||
| Other income (loss), net | ( | ||||||||||||||||||||||
| Equity in earnings (losses) from real estate and other affiliates | ( | ||||||||||||||||||||||
| Gain (loss) on sale or disposal of real estate and other assets, net | ( | ||||||||||||||||||||||
| Selling profit from sales-type leases | |||||||||||||||||||||||
| Gain (loss) on extinguishment of debt | |||||||||||||||||||||||
| Segment EBT | $ | $ | $ | ( | $ | $ | |||||||||||||||||
| Corporate income, expenses and other items | ( | ||||||||||||||||||||||
| Net income (loss) | |||||||||||||||||||||||
| Net (income) loss attributable to noncontrolling interests | ( | ||||||||||||||||||||||
| Net income (loss) attributable to common stockholders | $ | ||||||||||||||||||||||
The following represents assets by segment and the reconciliation of total segment assets to the total assets in the Consolidated Balance Sheets as of December 31:
| thousands | 2021 | 2020 | |||||||||
| Operating Assets | $ | $ | |||||||||
| Master Planned Communities | |||||||||||
| Seaport | |||||||||||
| Strategic Developments | |||||||||||
| Total segment assets | |||||||||||
| Corporate | |||||||||||
| Total assets | $ | $ | |||||||||
HHC 2021 FORM 10-K | 125
| FINANCIAL STATEMENT SCHEDULE | |||||
SCHEDULE III – REAL ESTATE AND ACCUMULATED DEPRECIATION
DECEMBER 31, 2021
| Initial Cost (b) | Costs Capitalized Subsequent to Acquisition (c) | Gross Amounts at Which Carried at Close of Period (d) | |||||||||||||||||||||||||||||||||||||||||||||
Name of Center thousands | Location | Center Type | Encumbrances (a) | Land | Buildings and Improvements | Land (e) | Buildings and Improvements (e)(f) | Land | Buildings and Improvements (f) | Total | Accumulated Depreciation (g) | Date of Construction | Date Acquired / Completed | ||||||||||||||||||||||||||||||||||
| Bridgeland | |||||||||||||||||||||||||||||||||||||||||||||||
| Bridgeland | Cypress, TX | MPC | $ | $ | $ | $ | $ | $ | $ | $ | $ | ( | 2004 | ||||||||||||||||||||||||||||||||||
| Bridgeland Predevelopment | Cypress, TX | Development | |||||||||||||||||||||||||||||||||||||||||||||
| Lakeland Village Center at Bridgeland (h) | Cypress, TX | Retail | ( | 2015 | 2016 | ||||||||||||||||||||||||||||||||||||||||||
| Lakeside Row | Cypress, TX | Multi-family | ( | 2018 | 2019 | ||||||||||||||||||||||||||||||||||||||||||
| Starling at Bridgeland | Cypress, TX | Development | 2021 | ||||||||||||||||||||||||||||||||||||||||||||
| Columbia | |||||||||||||||||||||||||||||||||||||||||||||||
| Columbia | Columbia, MD | MPC | ( | 2004 | |||||||||||||||||||||||||||||||||||||||||||
| Columbia Predevelopment | Columbia, MD | Development | |||||||||||||||||||||||||||||||||||||||||||||
| 10 - 70 Columbia Corporate Center (h) | Columbia, MD | Office | ( | 2012/2014 | |||||||||||||||||||||||||||||||||||||||||||
| Columbia Office Properties | Columbia, MD | Office | ( | ( | 2004 / 2007 | ||||||||||||||||||||||||||||||||||||||||||
| Columbia Regional Building | Columbia, MD | Retail | ( | 2013 | 2014 | ||||||||||||||||||||||||||||||||||||||||||
| Juniper Apartments | Columbia, MD | Multi-family | ( | 2018 | 2020 | ||||||||||||||||||||||||||||||||||||||||||
| Lakefront District (i) | Columbia, MD | Development | ( | ( | Various | ||||||||||||||||||||||||||||||||||||||||||
| Marlow | Columbia, MD | Development | 2021 | ||||||||||||||||||||||||||||||||||||||||||||
| Merriweather District | Columbia, MD | Development | 2015 | ||||||||||||||||||||||||||||||||||||||||||||
| Merriweather District Area 3 Standalone Restaurant | Columbia, MD | Retail | ( | 2019 | 2020 | ||||||||||||||||||||||||||||||||||||||||||
| One Mall North (h) | Columbia, MD | Office | ( | 2016 | |||||||||||||||||||||||||||||||||||||||||||
| One Merriweather (h) | Columbia, MD | Office | ( | 2015 | 2017 | ||||||||||||||||||||||||||||||||||||||||||
| Two Merriweather | Columbia, MD | Office | ( | 2016 | 2017 | ||||||||||||||||||||||||||||||||||||||||||
| 6100 Merriweather | Columbia, MD | Office | ( | 2018 | 2019 | ||||||||||||||||||||||||||||||||||||||||||
| Douglas Ranch | |||||||||||||||||||||||||||||||||||||||||||||||
| Douglas Ranch | Phoenix, AZ | MPC | 2021 | ||||||||||||||||||||||||||||||||||||||||||||
| Seaport | |||||||||||||||||||||||||||||||||||||||||||||||
| 85 South Street | New York, NY | Multi-family | ( | 2014 | |||||||||||||||||||||||||||||||||||||||||||
| Seaport Predevelopment | New York, NY | Development | 2013 | ||||||||||||||||||||||||||||||||||||||||||||
| Tin Building | New York, NY | Development | 2017 | ||||||||||||||||||||||||||||||||||||||||||||
| Pier 17 | New York, NY | Retail | ( | 2013 | 2018 | ||||||||||||||||||||||||||||||||||||||||||
| Historic District Area / Uplands | New York, NY | Retail | ( | 2013 | 2016 | ||||||||||||||||||||||||||||||||||||||||||
| 250 Water Street | New York, NY | Development | 2018 | ||||||||||||||||||||||||||||||||||||||||||||
| Summerlin | |||||||||||||||||||||||||||||||||||||||||||||||
| 1700 Pavilion (j) | Las Vegas, NV | Development | 2021 | ||||||||||||||||||||||||||||||||||||||||||||
| Aristocrat (j) | Las Vegas, NV | Office | ( | 2017 | 2018 | ||||||||||||||||||||||||||||||||||||||||||
| Constellation Apartments | Las Vegas, NV | Multi-family | ( | 2017 | |||||||||||||||||||||||||||||||||||||||||||
| Downtown Summerlin (j)(k) | Las Vegas, NV | Retail/Office | ( | 2013 | 2014 / 2015 | ||||||||||||||||||||||||||||||||||||||||||
| Hockey Ground Lease (j) | Las Vegas, NV | Other | ( | 2017 | |||||||||||||||||||||||||||||||||||||||||||
| Las Vegas Ballpark (j)(l) | Las Vegas, NV | Other | ( | 2018 | 2019 | ||||||||||||||||||||||||||||||||||||||||||
| Two Summerlin (j) | Las Vegas, NV | Office | ( | 2017 | 2018 | ||||||||||||||||||||||||||||||||||||||||||
| Summerlin | Las Vegas, NV | MPC | ( | ( | 2004 | ||||||||||||||||||||||||||||||||||||||||||
| Summerlin Predevelopment | Las Vegas, NV | Development | |||||||||||||||||||||||||||||||||||||||||||||
HHC 2021 FORM 10-K | 126
| FINANCIAL STATEMENT SCHEDULE | |||||
| Initial Cost (b) | Costs Capitalized Subsequent to Acquisition (c) | Gross Amounts at Which Carried at Close of Period (d) | |||||||||||||||||||||||||||||||||||||||||||||
Name of Center thousands | Location | Center Type | Encumbrances (a) | Land | Buildings and Improvements | Land (e) | Buildings and Improvements (e)(f) | Land | Buildings and Improvements (f) | Total | Accumulated Depreciation (g) | Date of Construction | Date Acquired / Completed | ||||||||||||||||||||||||||||||||||
| Tanager Apartments (j) | Las Vegas, NV | Multi-family | ( | ( | ( | 2017 | 2019 | ||||||||||||||||||||||||||||||||||||||||
| Tanager Echo (j) | Las Vegas, NV | Development | 2021 | ||||||||||||||||||||||||||||||||||||||||||||
| The Woodlands | |||||||||||||||||||||||||||||||||||||||||||||||
| Creekside Park Apartments | The Woodlands, TX | Multi-family | ( | 2017 | 2018 | ||||||||||||||||||||||||||||||||||||||||||
| Creekside Park Medical Plaza | The Woodlands, TX | Development | |||||||||||||||||||||||||||||||||||||||||||||
| Creekside Park The Grove | The Woodlands, TX | Multi-family | ( | 2019 | 2021 | ||||||||||||||||||||||||||||||||||||||||||
| Creekside Park West | The Woodlands, TX | Retail | ( | 2018 | 2019 | ||||||||||||||||||||||||||||||||||||||||||
| Creekside Village Green (h) | The Woodlands, TX | Retail | ( | ( | ( | 2013 | 2015 | ||||||||||||||||||||||||||||||||||||||||
| HHC 242 Self-Storage | The Woodlands, TX | Other | ( | 2015 | 2017 | ||||||||||||||||||||||||||||||||||||||||||
| HHC 2978 Self-Storage | The Woodlands, TX | Other | ( | 2016 | 2017 | ||||||||||||||||||||||||||||||||||||||||||
| One Hughes Landing | The Woodlands, TX | Office | ( | 2012 | 2013 | ||||||||||||||||||||||||||||||||||||||||||
| Two Hughes Landing | The Woodlands, TX | Office | ( | ( | 2013 | 2014 | |||||||||||||||||||||||||||||||||||||||||
| Three Hughes Landing | The Woodlands, TX | Office | ( | 2014 | 2016 | ||||||||||||||||||||||||||||||||||||||||||
| 1725 Hughes Landing Boulevard | The Woodlands, TX | Office | ( | 2013 | 2015 | ||||||||||||||||||||||||||||||||||||||||||
| 1735 Hughes Landing Boulevard | The Woodlands, TX | Office | ( | ( | 2013 | 2015 | |||||||||||||||||||||||||||||||||||||||||
| Hughes Landing Daycare | The Woodlands, TX | Other | 2018 | 2019 | |||||||||||||||||||||||||||||||||||||||||||
| Hughes Landing Retail | The Woodlands, TX | Retail | ( | 2013 | 2015 | ||||||||||||||||||||||||||||||||||||||||||
| 1701 Lake Robbins (h) | The Woodlands, TX | Retail | ( | 2014 | |||||||||||||||||||||||||||||||||||||||||||
| Lake Woodlands Crossing Retail | The Woodlands, TX | Retail | ( | 2017 | 2018 | ||||||||||||||||||||||||||||||||||||||||||
| 2201 Lake Woodlands Drive | The Woodlands, TX | Office | ( | 2011 | |||||||||||||||||||||||||||||||||||||||||||
| Lakefront North | The Woodlands, TX | Office | ( | 2018 | |||||||||||||||||||||||||||||||||||||||||||
| Memorial Hermann Health System Build-to-Suit | The Woodlands, TX | Development | 2021 | ||||||||||||||||||||||||||||||||||||||||||||
| One Lakes Edge | The Woodlands, TX | Multi-family | ( | 2013 | 2015 | ||||||||||||||||||||||||||||||||||||||||||
| Two Lakes Edge | The Woodlands, TX | Multi-family | ( | 2018 | 2020 | ||||||||||||||||||||||||||||||||||||||||||
| Millennium Six Pines Apartments | The Woodlands, TX | Multi-family | ( | 2016 | |||||||||||||||||||||||||||||||||||||||||||
| Millennium Waterway Apartments | The Woodlands, TX | Multi-family | ( | 2012 | |||||||||||||||||||||||||||||||||||||||||||
| The Lane at Waterway | The Woodlands, TX | Multi-family | ( | 2019 | 2020 | ||||||||||||||||||||||||||||||||||||||||||
| 8770 New Trails | The Woodlands, TX | Office | ( | 2019 | 2020 | ||||||||||||||||||||||||||||||||||||||||||
| 9303 New Trails | The Woodlands, TX | Office | ( | 2011 | |||||||||||||||||||||||||||||||||||||||||||
| 3831 Technology Forest Drive | The Woodlands, TX | Office | ( | 2014 | 2014 | ||||||||||||||||||||||||||||||||||||||||||
| 20/25 Waterway Avenue | The Woodlands, TX | Retail | ( | ( | 2011 | ||||||||||||||||||||||||||||||||||||||||||
| Waterway Garage Retail | The Woodlands, TX | Retail | ( | 2011 | |||||||||||||||||||||||||||||||||||||||||||
| 3 Waterway Square | The Woodlands, TX | Office | ( | 2012 | 2013 | ||||||||||||||||||||||||||||||||||||||||||
| 4 Waterway Square | The Woodlands, TX | Office | ( | 2011 | |||||||||||||||||||||||||||||||||||||||||||
| The Woodlands | The Woodlands, TX | MPC | ( | ( | ( | 2011 | |||||||||||||||||||||||||||||||||||||||||
| The Woodlands Predevelopment | The Woodlands, TX | Development | ( | ||||||||||||||||||||||||||||||||||||||||||||
| The Woodlands Ground Leases | The Woodlands, TX | Other | Various | ||||||||||||||||||||||||||||||||||||||||||||
| The Woodlands Parking Garages | The Woodlands, TX | Other | ( | 2011 / 2013 | |||||||||||||||||||||||||||||||||||||||||||
| 2000 Woodlands Parkway | The Woodlands, TX | Retail | ( | 2016 | |||||||||||||||||||||||||||||||||||||||||||
| The Woodlands Towers at the Waterway | The Woodlands, TX | Office | ( | 2019 | |||||||||||||||||||||||||||||||||||||||||||
| The Woodlands Warehouse | The Woodlands, TX | Other | ( | 2019 | |||||||||||||||||||||||||||||||||||||||||||
| 1400 Woodloch Forest | The Woodlands, TX | Office | ( | 2011 | |||||||||||||||||||||||||||||||||||||||||||
HHC 2021 FORM 10-K | 127
| FINANCIAL STATEMENT SCHEDULE | |||||
| Initial Cost (b) | Costs Capitalized Subsequent to Acquisition (c) | Gross Amounts at Which Carried at Close of Period (d) | |||||||||||||||||||||||||||||||||||||||||||||
Name of Center thousands | Location | Center Type | Encumbrances (a) | Land | Buildings and Improvements | Land (e) | Buildings and Improvements (e)(f) | Land | Buildings and Improvements (f) | Total | Accumulated Depreciation (g) | Date of Construction | Date Acquired / Completed | ||||||||||||||||||||||||||||||||||
| The Woodlands Hills | |||||||||||||||||||||||||||||||||||||||||||||||
| The Woodlands Hills | Conroe, TX | MPC | ( | 2014 | |||||||||||||||||||||||||||||||||||||||||||
| Ward Village | |||||||||||||||||||||||||||||||||||||||||||||||
| ‘A‘ali‘i | Honolulu, HI | Condominium | ( | 2018 | 2021 | ||||||||||||||||||||||||||||||||||||||||||
| Ae‘o | Honolulu, HI | Condominium | ( | ( | ( | 2016 | 2018 | ||||||||||||||||||||||||||||||||||||||||
| Anaha | Honolulu, HI | Condominium | ( | ( | ( | 2014 | 2017 | ||||||||||||||||||||||||||||||||||||||||
| Ke Kilohana | Honolulu, HI | Condominium | ( | ( | ( | 2016 | 2019 | ||||||||||||||||||||||||||||||||||||||||
| Kewalo Basin Harbor | Honolulu, HI | Other | ( | 2017 | 2019 | ||||||||||||||||||||||||||||||||||||||||||
| Kō'ula | Honolulu, HI | Development | ( | 2019 | |||||||||||||||||||||||||||||||||||||||||||
| Victoria Place | Honolulu, HI | Development | ( | 2021 | |||||||||||||||||||||||||||||||||||||||||||
| Waiea | Honolulu, HI | Condominium | ( | ( | 2014 | 2017 | |||||||||||||||||||||||||||||||||||||||||
| Ward Predevelopment | Honolulu, HI | Development | ( | 2013 | |||||||||||||||||||||||||||||||||||||||||||
| Ward Village Retail (h) | Honolulu, HI | Retail | ( | ( | Various | ||||||||||||||||||||||||||||||||||||||||||
| Other | |||||||||||||||||||||||||||||||||||||||||||||||
| Outlet Collection at Riverwalk | New Orleans, LA | Retail | ( | ( | 2013 | 2014 | |||||||||||||||||||||||||||||||||||||||||
| Total excluding Corporate, Deferred financing costs and Unamortized bond issuance costs | ( | ||||||||||||||||||||||||||||||||||||||||||||||
| Corporate | Various | ( | ( | ||||||||||||||||||||||||||||||||||||||||||||
| Unamortized bond issuance costs | N/A | — | — | — | — | — | — | — | — | ||||||||||||||||||||||||||||||||||||||
| Deferred financing costs | N/A | ( | — | — | — | — | — | — | — | — | |||||||||||||||||||||||||||||||||||||
| Total | $ | $ | $ | $ | $ | $ | $ | $ | $ | ( | |||||||||||||||||||||||||||||||||||||
(a)See description of Encumbrances in Note 7 - Mortgages, Notes and Loans Payable, Net in the Notes to Consolidated Financial Statements under Item 8 of this Form 10-K.
(b)Initial cost for projects undergoing development or redevelopment is cost at end of first complete calendar year subsequent to opening.
(c)For retail and other properties, costs capitalized subsequent to acquisitions is net of cost of disposals or other property write‑downs. For MPCs, costs capitalized subsequent to acquisitions are net of the cost of land sales.
(d)The aggregate cost of land, building and improvements for federal income tax purposes is approximately $6.5 billion.
(e)Reductions in Land reflect transfers to Buildings and Improvements for projects which the Company is internally developing.
(f)Includes all amounts related to Developments.
(g)Depreciation is computed based upon the useful lives in Note 1 - Summary of Significant Accounting Policies in the Notes to Consolidated Financial Statements under Item 8 of this Form 10-K.
(h)Property is collateral for the Senior Secured Credit Facility. See Note 7 - Mortgages, Notes and Loans Payable, Net in the Notes to Consolidated Financial Statements under Item 8 of this Form 10-K for additional information. The Ward Village Retail line includes $29.9 million related to Ae’o Retail and $9.1 million related to Ke Kilohana retail that are not collateral for the Senior Secured Credit Facility.
(i)Lakefront District includes American City Building acquired in 2016, Ridgley Building acquired in 2017 and Sterrett Place acquired in 2018, all of which have been demolished and now represent future development rights.
(j)Encumbrances balance either represents or is inclusive of SIDs. See Note 7 - Mortgages, Notes and Loans Payable, Net in the Notes to Consolidated Financial Statements under Item 8 of this Form 10-K for additional information.
(k)Downtown Summerlin includes the One Summerlin office property, which was placed in service in 2015.
(l)Includes the Las Vegas Aviators.
HHC 2021 FORM 10-K | 128
| FINANCIAL STATEMENT SCHEDULE | |||||
| Reconciliation of Real Estate | ||||||||||||||||||||
| thousands | 2021 | 2020 | 2019 | |||||||||||||||||
| Balance as of January 1, | $ | $ | $ | |||||||||||||||||
| Change in land | ||||||||||||||||||||
| Additions | ||||||||||||||||||||
| Impairments | ( | ( | ||||||||||||||||||
| Dispositions and write-offs and land and condominium costs of sales | ( | ( | ( | |||||||||||||||||
| Balance as of December 31, | $ | $ | $ | |||||||||||||||||
| Reconciliation of Accumulated Depreciation | ||||||||||||||||||||
| thousands | 2021 | 2020 | 2019 | |||||||||||||||||
| Balance as of January 1, | $ | $ | $ | |||||||||||||||||
| Depreciation Expense | ||||||||||||||||||||
| Dispositions and write-offs | ( | ( | ( | |||||||||||||||||
| Balance as of December 31, | $ | $ | $ | |||||||||||||||||
HHC 2021 FORM 10-K | 129
Item 9. Changes in and Disagreements with Accountants on Accounting and Financial Disclosure
None.
Item 9A. Controls and Procedures
| DISCLOSURE CONTROLS AND PROCEDURES | ||
We maintain disclosure controls and procedures (as defined in Rule 13a-15(e) under the Exchange Act) that are designed to provide reasonable assurance that information required to be disclosed in our reports to the SEC is recorded, processed, summarized and reported within the time periods specified in the SEC’s rules and forms, and that such information is accumulated and communicated to our management, including our principal executive officer and our principal financial and accounting officer, as appropriate, to allow timely decisions regarding required disclosure.
As required by SEC rules, we carried out an evaluation, under the supervision and with the participation of our management, including our principal executive officer and our principal financial and accounting officer, of the effectiveness of the design and operation of our disclosure controls and procedures as of December 31, 2021, the end of the period covered by this report. Based on the foregoing, our principal executive officer and principal financial and accounting officer concluded that our disclosure controls and procedures were effective as of December 31, 2021.
| INTERNAL CONTROLS OVER FINANCIAL REPORTING | ||
There were no other changes to our internal control over financial reporting that occurred during the period covered by this report that have materially affected, or are reasonably likely to materially affect, our internal control over financial reporting.
| MANAGEMENT’S REPORT ON INTERNAL CONTROL OVER FINANCIAL REPORTING | ||
Management is responsible for establishing and maintaining a system of internal control over financial reporting designed to provide reasonable assurance that transactions are executed in accordance with management authorization and that such transactions are properly recorded and reported in the financial statements, and that records are maintained so as to permit preparation of the financial statements in accordance with U.S. generally accepted accounting principles. Because of its inherent limitations, internal control over financial reporting may not prevent or detect misstatements. Management has assessed the effectiveness of the Company’s internal control over financial reporting utilizing the criteria set forth by the Committee of Sponsoring Organizations of the Treadway Commission in Internal Control – Integrated Framework (2013 Framework). Management concluded, based on its assessment, that The Howard Hughes Corporation’s internal control over financial reporting was effective as of December 31, 2021. Ernst & Young LLP, an independent registered public accounting firm, has audited the Company’s internal control over financial reporting as of December 31, 2021, as stated in their report which is included in this Annual Report on Form 10-K.
HHC 2021 FORM 10-K | 130
| REPORT OF INDEPENDENT REGISTERED PUBLIC ACCOUNTING FIRM | ||
To the Stockholders and the Board of Directors of
The Howard Hughes Corporation
Opinion on Internal Control Over Financial Reporting
We have audited The Howard Hughes Corporation’s internal control over financial reporting as of December 31, 2021, based on criteria established in Internal Control-Integrated Framework issued by the Committee of Sponsoring Organizations of the Treadway Commission (2013 framework) (the COSO criteria). In our opinion, The Howard Hughes Corporation (the Company) maintained, in all material respects, effective internal control over financial reporting as of December 31, 2021, based on the COSO criteria.
We also have audited, in accordance with the standards of the Public Company Accounting Oversight Board (United States) (PCAOB), the 2021 consolidated financial statements of the Company and our report dated February 28, 2022 expressed an unqualified opinion thereon.
Basis for Opinion
The Company’s management is responsible for maintaining effective internal control over financial reporting and for its assessment of the effectiveness of internal control over financial reporting included in the accompanying Management’s Report on Internal Control over Financial Reporting. Our responsibility is to express an opinion on the Company’s internal control over financial reporting based on our audit. We are a public accounting firm registered with the PCAOB and are required to be independent with respect to the Company in accordance with the U.S. federal securities laws and the applicable rules and regulations of the Securities and Exchange Commission and the PCAOB.
We conducted our audit in accordance with the standards of the PCAOB. Those standards require that we plan and perform the audit to obtain reasonable assurance about whether effective internal control over financial reporting was maintained in all material respects.
Our audit included obtaining an understanding of internal control over financial reporting, assessing the risk that a material weakness exists, testing and evaluating the design and operating effectiveness of internal control based on the assessed risk, and performing such other procedures as we considered necessary in the circumstances. We believe that our audit provides a reasonable basis for our opinion.
Definition and Limitations of Internal Control Over Financial Reporting
A company’s internal control over financial reporting is a process designed to provide reasonable assurance regarding the reliability of financial reporting and the preparation of financial statements for external purposes in accordance with generally accepted accounting principles. A company’s internal control over financial reporting includes those policies and procedures that (1) pertain to the maintenance of records that, in reasonable detail, accurately and fairly reflect the transactions and dispositions of the assets of the company; (2) provide reasonable assurance that transactions are recorded as necessary to permit preparation of financial statements in accordance with generally accepted accounting principles, and that receipts and expenditures of the company are being made only in accordance with authorizations of management and directors of the company; and (3) provide reasonable assurance regarding prevention or timely detection of unauthorized acquisition, use, or disposition of the company’s assets that could have a material effect on the financial statements.
Because of its inherent limitations, internal control over financial reporting may not prevent or detect misstatements. Also, projections of any evaluation of effectiveness to future periods are subject to the risk that controls may become inadequate because of changes in conditions, or that the degree of compliance with the policies or procedures may deteriorate.
/s/ Ernst & Young LLP
Houston, Texas
February 28, 2022
Item 9B. Other Information
None.
HHC 2021 FORM 10-K | 131
| PART III | ||
Item 10. Directors, Executive Officers and Corporate Governance
The information required by Item 10 is incorporated by reference to the relevant information included in our proxy statement for our 2022 Annual Meeting of Stockholders.
Item 11. Executive Compensation
The information required by Item 11 is incorporated by reference to the relevant information included in our proxy statement for our 2022 Annual Meeting of Stockholders.
Item 12. Security Ownership of Certain Beneficial Owners and Management and Related Stockholder Matters
The information required by Item 12 is incorporated by reference to the relevant information included in our proxy statement for our 2022 Annual Meeting of Stockholders.
Item 13. Certain Relationships and Related Transactions, and Director Independence
The information required by Item 13 is incorporated by reference to the relevant information included in our proxy statement for our 2022 Annual Meeting of Stockholders.
Item 14. Principal Accountant Fees and Services
The information required by Item 14 is incorporated by reference to the relevant information included in our proxy statement for our 2022 Annual Meeting of Stockholders.
HHC 2021 FORM 10-K | 132
| PART IV | ||
Item 15. Exhibits, Financial Statement Schedule
(a)Financial Statements and Financial Statement Schedule.
The Consolidated Financial Statements and Schedule listed in the Index to this Form 10-K on page 75 are filed as part of this Annual Report. No additional financial statement schedules are presented as the required information is not applicable, not present in amounts sufficient to require submission of the schedule or because the information required is enclosed in the Consolidated Financial Statements and notes thereto.
(b)Exhibits.
| Exhibit No. | Description of Exhibit | ||||
| 3.1 | |||||
| 3.2 | |||||
| 3.3 | |||||
| 3.4 | |||||
| 4.1 | |||||
| 4.1.1 | |||||
| 4.1.2 | |||||
| 4.1.3 | |||||
| 4.2 | |||||
| 4.2.1 | |||||
| 4.3 | |||||
| 4.4 | |||||
HHC 2021 FORM 10-K | 133
| 4.5 | |||||
| 4.6 | |||||
| 4.7 | |||||
| 4.8 | |||||
| 4.9* | Form of Deposit Agreement | ||||
| 4.10* | Form of Warrant Agreement | ||||
| 4.11* | Form of Purchase Contract Agreement | ||||
| 4.12* | Form of Unit Agreement | ||||
| 4.13+ | |||||
| 10.1 | |||||
| 10.2 | |||||
| 10.3** | |||||
| 10.4** | |||||
| 10.5** | |||||
| 10.6** | |||||
| 10.7** | |||||
| 10.8** | |||||
| 10.9** | |||||
| 10.10** | |||||
| 10.11** | |||||
HHC 2021 FORM 10-K | 134
| 10.12** | |||||
| 10.13** | |||||
| 10.14** | |||||
| 10.15** | |||||
| 10.16** | |||||
| 10.17** | |||||
| 10.18** | |||||
| 10.19 | |||||
| 10.20 | |||||
| 10.21 | |||||
| 10.22** | |||||
| 10.23** | |||||
| 10.24** | |||||
| 10.25** | |||||
| 10.26** | |||||
| 10.27** | |||||
HHC 2021 FORM 10-K | 135
| 10.28** | |||||
| 10.29** | |||||
| 10.30** | |||||
| 10.31** | |||||
| 10.32** | |||||
| 10.33** | |||||
| 10.34 | |||||
| 10.35** | |||||
| 10.36** | |||||
| 10.37** | |||||
| 10.38** | |||||
| 10.39** | |||||
| 10.40** | |||||
| 10.41** | |||||
| 10.42** | |||||
| 10.43** | |||||
| 10.44** | |||||
| 10.45** | |||||
| 10.46** | |||||
HHC 2021 FORM 10-K | 136
| 10.47** | |||||
| 10.48** | |||||
| 10.49** | |||||
| 10.50** | |||||
| 10.51** | |||||
| 21.1+ | |||||
| 23.1+ | |||||
| 24.1+ | |||||
| 31.1+ | |||||
| 31.2+ | |||||
| 32.1+ | |||||
| 101.INS | Inline XBRL Instance Document -- the instance document does not appear in the Interactive Data File because its XBRL tags are embedded within the Inline XBRL document | ||||
| 101.SCH+ | Inline XBRL Taxonomy Extension Schema Document | ||||
| 101.CAL+ | Inline XBRL Taxonomy Extension Calculation Linkbase Document | ||||
| 101.LAB+ | Inline XBRL Taxonomy Extension Label Linkbase Document | ||||
| 101.PRE+ | Inline XBRL Taxonomy Extension Presentation Linkbase Document | ||||
| 101.DEF+ | Inline XBRL Taxonomy Extension Definition Linkbase Document | ||||
| 104 | Cover Page Interactive Data File (formatted as Inline XBRL and contained in Exhibit 101) | ||||
* To be filed by amendment to the Form S-3 filed on March 27, 2020 or by a Current Report on Form 8-K.
** Management contract, compensatory plan or arrangement
+ Filed herewith
Attached as Exhibit 101 to this report are the following documents formatted in iXBRL (Inline Extensible Business Reporting Language): (i) the Consolidated Statements of Operations for the years ended December 31, 2021, 2020 and 2019, (ii) Consolidated Statements of Comprehensive Income (Loss) for the years ended December 31, 2021, 2020 and 2019, (iii) the Consolidated Balance Sheets as of December 31, 2021 and 2020, (iv) Consolidated Statements of Equity for the years ended December 31, 2021, 2020 and 2019, (v) the Consolidated Statements of Cash Flows for the years ended December 31, 2021, 2020 and 2019, and (vi) the Notes to Consolidated Financial Statements.
Item 16. Form 10-K Summary
Not applicable.
HHC 2021 FORM 10-K | 137
| SIGNATURES | ||
Pursuant to the requirements of Section 13 or 15(d) of the Securities Exchange Act of 1934, the registrant has duly caused this report to be signed on its behalf by the undersigned, thereunto duly authorized.
THE HOWARD HUGHES CORPORATION
| /s/ Carlos Olea | ||||||||
| Carlos Olea | ||||||||
| Chief Financial Officer | February 28, 2022 | |||||||
Pursuant to the requirements of the Securities Exchange Act of 1934, this report has been signed below by the following persons on behalf of the registrant and in the capacities and on the dates indicated.
| Signature | Title | Date | ||||||||||||
| * | Chairman of the Board and Director | February 28, 2022 | ||||||||||||
| William Ackman | ||||||||||||||
| /s/ David R. O’Reilly | Chief Executive Officer | February 28, 2022 | ||||||||||||
| David R. O’Reilly | (Principal Executive Officer) | |||||||||||||
| /s/ Carlos Olea | Chief Financial Officer | February 28, 2022 | ||||||||||||
| Carlos Olea | (Principal Financial and Accounting Officer) | |||||||||||||
| * | Director | February 28, 2022 | ||||||||||||
| Adam Flatto | ||||||||||||||
| * | Director | February 28, 2022 | ||||||||||||
| Jeffrey Furber | ||||||||||||||
| * | Director | February 28, 2022 | ||||||||||||
| Beth Kaplan | ||||||||||||||
| * | Director | February 28, 2022 | ||||||||||||
| Allen Model | ||||||||||||||
| * | Director | February 28, 2022 | ||||||||||||
| R. Scot Sellers | ||||||||||||||
| * | Director | February 28, 2022 | ||||||||||||
| Steven Shepsman | ||||||||||||||
| * | Director | February 28, 2022 | ||||||||||||
| Mary Ann Tighe | ||||||||||||||
| * | Director | February 28, 2022 | ||||||||||||
| Anthony Williams | ||||||||||||||
| */s/ David R. O’Reilly | ||||||||||||||
| David R. O’Reilly | ||||||||||||||
| Attorney-in-fact | ||||||||||||||
HHC 2021 FORM 10-K | 138
Serious News for Serious Traders! Try StreetInsider.com Premium Free!
You May Also Be Interested In
- CTS Corporation Announces Date for First Quarter 2024 Earnings Release and Conference Call
- Black Hills Corp. Confirms Details for its Annual Meeting of Shareholders
- EIN and the DriveH2 Movement Shine Brightly at This Year’s ‘Sonic Desert’ Party at Coachella
Create E-mail Alert Related Categories
SEC FilingsSign up for StreetInsider Free!
Receive full access to all new and archived articles, unlimited portfolio tracking, e-mail alerts, custom newswires and RSS feeds - and more!
