

Form 10-K HP INC For: Oct 31
 Tweet
Tweet Share
ShareUNITED STATES
SECURITIES AND EXCHANGE COMMISSION
Washington, D.C. 20549
FORM 10-K
| (Mark One) | ||||||||
| ANNUAL REPORT PURSUANT TO SECTION 13 OR 15(d) OF THE SECURITIES EXCHANGE ACT OF 1934 | ||||||||
| For the fiscal year ended | ||||||||
| Or | ||||||||
| TRANSITION REPORT PURSUANT TO SECTION 13 OR 15(d) OF THE SECURITIES EXCHANGE ACT OF 1934 | ||||||||
| For the transition period from to | ||||||||
| Commission file number | ||||||||
(Exact name of registrant as specified in its charter)
(State or other jurisdiction of incorporation or organization) | (I.R.S. employer identification no.) | ||||||||||
(Zip code) | |||||||||||
| (Address of principal executive offices) | |||||||||||
(650 ) 857-1501
(Registrant’s telephone number, including area code)
____________________
Securities registered pursuant to Section 12(b) of the Securities Exchange Act of 1934:
| Title of each class | Trading Symbol(s) | Name of each exchange on which registered | ||||||
| | ||||||||
Securities registered pursuant to Section 12(g) of the Act:
None
Indicate by check mark if the registrant is a well-known seasoned issuer as defined in Rule 405 of the Securities Act. Yes ☐ No ☒
Indicate by check mark if the registrant is not required to file reports pursuant to Section 13 or Section 15(d) of the Act. Yes ☐ No ☒
Indicate by check mark whether the registrant (1) has filed all reports required to be filed by Section 13 or 15(d) of the Securities Exchange Act of 1934 (the “Exchange Act”) during the preceding 12 months (or for such shorter period that the registrant was required to file such reports), and (2) has been subject to such filing requirements for the past 90 days. Yes ☒ No ☐
Indicate by check mark whether the registrant has submitted electronically every Interactive Data File required to be submitted pursuant to Rule 405 of Regulation S-T (232.405 of this chapter) during the preceding 12 months (or for such shorter period that the registrant was required to submit such files). Yes ☒ No ☐
Indicate by check mark whether the registrant is a large accelerated filer, an accelerated filer, a non-accelerated filer, a smaller reporting company, or an emerging growth company. See the definitions of “large accelerated filer,” “accelerated filer,” “smaller reporting company” and “emerging growth company” in Rule 12b-2 of the Exchange Act
☒ | Accelerated filer | ☐ | Non-accelerated filer | ☐ | Smaller reporting company | Emerging growth company | |||||||||||||||||||||||
If an emerging growth company, indicate by check mark if the registrant has elected not to use the extended transition period for complying with any new or revised financial accounting standards provided pursuant to Section 13(a) of the Exchange Act. ☐
Indicate by check mark whether the registrant has filed a report on and attestation to its management’s assessment of the effectiveness of its internal control over financial reporting under Section 404(b) of the Sarbanes-Oxley Act (15 U.S.C. 7262(b)) by the registered public accounting firm that prepared or issued its audit report. ☒
Indicate by check mark whether the registrant is a shell company (as defined in Rule 12b-2 of the Exchange Act). Yes ☐ No ☒
The aggregate market value of the registrant’s common stock held by non-affiliates was $40,931,733,492 based on the last sale price of common stock on April 30, 2021.
The number of shares of HP Inc. common stock outstanding as of November 30, 2021 was 1,082,722,559 shares.
| DOCUMENTS INCORPORATED BY REFERENCE | ||||||||
| DOCUMENT DESCRIPTION | 10-K PART | |||||||
| Portions of the Registrant’s definitive proxy statement related to its 2022 Annual Meeting of Stockholders to be filed pursuant to Regulation 14A within 120 days after Registrant’s fiscal year end of October 31, 2021 are incorporated by reference into Part III of this Report. | III | |||||||
1
HP INC. AND SUBSIDIARIES
Form 10-K
For the Fiscal Year ended October 31, 2021
Table of Contents
| Page | ||||||||
| PART I | ||||||||
| Item 1. | ||||||||
| Item 1A. | ||||||||
| Item 1B. | ||||||||
| Item 2. | ||||||||
| Item 3. | ||||||||
| Item 4. | ||||||||
| PART II | ||||||||
| Item 5. | ||||||||
| Item 6. | ||||||||
| Item 7. | ||||||||
| Item 7A. | ||||||||
| Item 8. | ||||||||
| Item 9. | ||||||||
| Item 9A. | ||||||||
| Item 9B. | ||||||||
| PART III | ||||||||
| Item 10. | ||||||||
| Item 11. | ||||||||
| Item 12. | ||||||||
| Item 13. | ||||||||
| Item 14. | ||||||||
| PART IV | ||||||||
| Item 15. | ||||||||
| Item 16. | ||||||||
In this report on Form 10-K, for all periods presented, “we”, “us”, “our”, the “company”, the “Company”, “HP” and “HP Inc.” refer to HP Inc. (formerly Hewlett-Packard Company) and its consolidated subsidiaries.
2
Forward-Looking Statements
This Annual Report on Form 10-K, including “Business” in Item 1 and “Management’s Discussion and Analysis of Financial Condition and Results of Operations” in Item 7, contains forward-looking statements based on current expectations and assumptions that involve risks and uncertainties. If the risks or uncertainties ever materialize or the assumptions prove incorrect, the results of HP Inc. and its consolidated subsidiaries (“HP”) may differ materially from those expressed or implied by such forward-looking statements and assumptions. All statements other than statements of historical fact are statements that could be deemed forward-looking statements, including, but not limited to, any statements regarding the potential impact of the COVID-19 pandemic and the actions by governments, businesses and individuals in response to the situation; projections of net revenue, margins, expenses, effective tax rates, net earnings, net earnings per share, cash flows, benefit plan funding, deferred taxes, share repurchases, foreign currency exchange rates or other financial items; any projections of the amount, timing or impact of cost savings or restructuring and other charges, planned structural cost reductions and productivity initiatives; any statements of the plans, strategies and objectives of management for future operations, including, but not limited to, our business model and transformation, our sustainability goals, our go-to-market strategy, the execution of restructuring plans and any resulting cost savings, net revenue or profitability improvements or other financial impacts; any statements concerning the expected development, demand, performance, market share or competitive performance relating to products or services; any statements concerning potential supply constraints, component shortages, manufacturing disruptions or logistics challenges; any statements regarding current or future macroeconomic trends or events and the impact of those trends and events on HP and its financial performance; any statements regarding pending investigations, claims, disputes or other litigation matters; any statements of expectation or belief, including with respect to the timing and expected benefits of acquisitions and other business combination and investment transactions; and any statements of assumptions underlying any of the foregoing. Forward-looking statements can also generally be identified by words such as “future,” “anticipates,” “believes,” “estimates,” “expects,” “intends,” “plans,” “predicts,” “projects,” “will,” “would,” “could,” “can,” “may,” and similar terms. Risks, uncertainties and assumptions include factors relating to the effects of the COVID-19 pandemic and the actions by governments, businesses and individuals in response to the situation, the effects of which may give rise to or amplify the risks associated with many of these factors listed here; the need to manage (and reliance on) third-party suppliers, including with respect to component shortages, and the need to manage HP’s global, multi-tier distribution network, limit potential misuse of pricing programs by HP’s channel partners, adapt to new or changing marketplaces and effectively deliver HP’s services; HP’s ability to execute on its strategic plan, including the previously announced initiatives, business model changes and transformation; execution of planned structural cost reductions and productivity initiatives; HP’s ability to complete any contemplated share repurchases, other capital return programs or other strategic transactions; the competitive pressures faced by HP’s businesses; risks associated with executing HP’s strategy and business model changes and transformation; successfully innovating, developing and executing HP’s go-to-market strategy, including online, omnichannel and contractual sales, in an evolving distribution, reseller and customer landscape; the development and transition of new products and services and the enhancement of existing products and services to meet evolving customer needs and respond to emerging technological trends; successfully competing and maintaining the value proposition of HP’s products, including supplies; challenges to HP’s ability to accurately forecast inventories, demand and pricing, which may be due to HP’s multi-tiered channel, sales of HP’s products to unauthorized resellers or unauthorized resale of HP’s products or our uneven sales cycle; integration and other risks associated with business combination and investment transactions; the results of the restructuring plans, including estimates and assumptions related to the cost (including any possible disruption of HP’s business) and the anticipated benefits of the restructuring plans; the protection of HP’s intellectual property assets, including intellectual property licensed from third parties; the hiring and retention of key employees; the impact of macroeconomic and geopolitical trends and events, including the effects of inflation; risks associated with HP’s international operations; the execution and performance of contracts by HP and its suppliers, customers, clients and partners, including logistical challenges with respect to such execution and performance; changes in estimates and assumptions HP makes in connection with the preparation of its financial statements; disruptions in operations from system security risks, data protection breaches, cyberattacks, extreme weather conditions or other effects of climate change, medical epidemics or pandemics such as the COVID-19 pandemic, and other natural or manmade disasters or catastrophic events; the impact of changes to federal, state, local and foreign laws and regulations, including environmental regulations and tax laws; potential impacts, liabilities and costs from pending or potential investigations, claims and disputes; and other risks that are described herein, including but not limited to the items discussed in “Risk Factors” in Item 1A of Part I of this report and that are otherwise described or updated from time to time in HP’s other filings with the Securities and Exchange Commission (the “SEC”). The forward-looking statements in this report are made as of the date of this filing and HP assumes no obligation and does not intend to update these forward-looking statements.
Forward-looking and other statements in this report may also address our corporate responsibility progress, plans, and goals (including environmental matters), and the inclusion of such statements is not an indication that these contents are necessarily material to investors or required to be disclosed in HP’s filings with the SEC. In addition, historical, current, and forward-looking sustainability-related statements may be based on standards for measuring progress that are still developing, internal controls and processes that continue to evolve, and assumptions that are subject to change in the future.
3
PART I
ITEM 1. Business.
Business Overview
We are a leading global provider of personal computing and other access devices, imaging and printing products, and related technologies, solutions and services. We sell to individual consumers, small- and medium-sized businesses (“SMBs”) and large enterprises, including customers in the government, health and education sectors.
As part of the separation of Hewlett Packard Enterprise Company (“Hewlett Packard Enterprise”), Hewlett-Packard Company’s former enterprise technology infrastructure, software, services and financing businesses (the “Separation”), on November 1, 2015, HP and Hewlett Packard Enterprise entered into a separation and distribution agreement and various other agreements that provide a framework for the relationships between the parties following the Separation.
HP Products and Services; Segment Information
We have three reportable segments: Personal Systems, Printing and Corporate Investments. The Personal Systems segment offers commercial and consumer desktop and notebook personal computers (“PCs”), workstations, thin clients, commercial mobility devices, retail point-of-sale (“POS”) systems, displays and peripherals, software, support and services. The Printing segment provides consumer and commercial printer hardware, supplies, services and solutions. Corporate Investments includes HP Labs and certain business incubation and investment projects.
Personal Systems
Personal Systems offers commercial and consumer desktop and notebook PCs, workstations, thin clients, commercial mobility devices, retail POS systems, displays and peripherals, software, support and services. We group commercial notebooks, commercial desktops, commercial services, commercial mobility devices, commercial detachables and convertibles, workstations, retail POS systems and thin clients into commercial PCs and consumer notebooks, consumer desktops, consumer services and consumer detachables into consumer PCs when describing performance in these markets. Both commercial and consumer PCs maintain multi-operating system, multi-architecture strategies using Microsoft Windows and Google Chrome operating systems, and predominantly use processors from Intel Corporation (“Intel”) and Advanced Micro Devices, Inc. (“AMD”).
Commercial PCs are optimized for use by enterprise, public sector which includes education, and SMB customers, with a focus on robust design, security, serviceability, connectivity, reliability and manageability in the customer’s environment and working remotely. Commercial PCs include the HP ProBook and HP EliteBook lines of notebooks, convertibles, and detachables, the HP Pro and HP Elite lines of business desktops and all-in-ones, retail POS systems, HP Thin Clients, HP Pro Tablet PCs and the HP notebook, desktop and Chromebook systems. Commercial PCs also include workstations that are designed and optimized for high-performance and demanding application environments including Z desktop workstations, Z all-in-ones and Z mobile workstations. Additionally, we offer a range of services and solutions to enterprise, public sector which includes education and SMB customers to help them manage the lifecycle of their PC and mobility installed base.
Consumer PCs are optimized for consumer usage, focusing on gaming, learning and working remotely, consuming multi-media for entertainment, managing personal life activities, staying connected, sharing information, getting things done for work including creating content, and staying informed and secure. These systems include HP Spectre, HP Envy, HP Pavilion, HP Chromebook, HP Stream, Omen by HP lines of notebooks, desktops and hybrids, HP Envy, HP Pavilion desktops and all-in-one lines.
Personal Systems groups its global business capabilities into the following business units when reporting business performance:
•Notebooks consists of consumer notebooks, commercial notebooks, mobile workstations, peripherals, and commercial mobility devices;
• Desktops includes consumer desktops, commercial desktops, thin clients, displays, peripherals, and retail POS systems;
• Workstations consists of desktop workstations, displays and peripherals; and
• Other consists of consumer and commercial services as well as other Personal Systems capabilities.
Printing
Printing provides consumer and commercial printer hardware, supplies, services and solutions. Printing is also focused on Graphics and 3D imaging solutions in the commercial and industrial markets. Our global business capabilities within Printing are described below:
Office Printing Solutions delivers HP’s office printers, supplies, services, and solutions to SMBs and large enterprises. It also includes Original Equipment Manufacturer (“OEM”) hardware and solutions, and some Samsung-branded supplies.
Home Printing Solutions delivers innovative printing products, supplies, services and solutions for the home, home business and micro business customers utilizing both HP’s Ink and Laser technologies. It also includes some Samsung-branded supplies.
4
Graphics Solutions delivers large-format, commercial and industrial solutions and supplies to print service providers and packaging converters through a wide portfolio of printers and presses (HP DesignJet, HP Latex, HP Indigo and HP PageWide Web Presses).
3D Printing and Digital Manufacturing offers a portfolio of additive manufacturing solutions and supplies to help customers succeed in their additive and digital manufacturing journey. HP offers complete solutions in collaboration with an ecosystem of partners.
Printing groups its global business capabilities into the following business units when reporting business performance:
•Commercial consists of office printing solutions, graphics solutions and 3D printing and digital manufacturing, excluding supplies;
•Consumer consists of home printing solutions, excluding supplies; and
•Supplies comprises a set of highly innovative consumable products, ranging from ink and laser cartridges to media, graphics supplies and 3D printing and digital manufacturing supplies, for recurring use in consumer and commercial hardware.
Corporate Investments
Corporate Investments includes HP Labs and certain business incubation and investment projects.
Sales, Marketing and Distribution
We manage our business and report our financial results based on the business segments described above. Our customers are organized by consumer and commercial groups, and purchases of HP products, solutions and services may be fulfilled directly by HP or indirectly through a variety of partners, utilizing their own physical or internet stores or an omnichannel combination of the two, including:
•retailers that sell our products to the public focusing on consumers and small- and medium-sized businesses;
•resellers that sell our products and services, frequently with their own value-added products or services, to targeted customer groups;
•distribution partners that supply our products and solutions to resellers; and
•system integrators and other business intermediaries that provide various levels of services, including systems integration work and as-a-service solutions, and typically partner with us on client solutions that require our products and services.
The mix of our business conducted by direct sales or channel sales differs by business and geographic market. We believe that customer buying patterns and different geographic market conditions require us to tailor our sales, marketing and distribution efforts to the geographic market and sub-geographic specificities for each of our businesses. We are focused on driving the depth and breadth of our market coverage while identifying efficiencies and productivity gains in both our direct and indirect routes to market. Our businesses collaborate to accomplish strategic and process alignment where appropriate. For example, we typically assign an account manager to manage relationships across our business with large enterprise customers. The account manager is supported by a team of specialists with product and services expertise and drives both direct and indirect sales to their assigned customers. For other customers and for consumers, we typically manage both direct online sales as well as channel relationships with retailers mainly targeting consumers and SMBs and commercial resellers mainly targeting SMBs and mid-market accounts.
Manufacturing and Materials
We utilize a significant number of outsourced manufacturers (“OMs”) around the world to manufacture HP-designed products. The use of OMs is intended to generate cost efficiencies and reduce time to market for HP-designed products. We use multiple OMs to maintain flexibility in our supply chain and manufacturing processes. In some circumstances, third-party suppliers produce products that we purchase and resell under the HP brand. Additionally, we manufacture finished products from components and sub-assemblies that we acquire from a wide range of vendors.
We utilize two primary methods of fulfilling demand for products: building products to order and configuring products to order. We build products to order to maximize manufacturing and logistics efficiencies by producing high volumes of basic product configurations. Alternatively, configuring products to order enables units to match a customer’s hardware and software customization requirements. Our inventory management and distribution practices in both building products to order and configuring products to order seek to minimize inventory holding periods by taking delivery of the inventory and manufacturing shortly before the sale or distribution of products to our customers.
We purchase materials, supplies and product sub-assemblies from a substantial number of vendors. For most of our products, we have existing or readily available alternate sources of supply. However, we have relied on sole sources for some laser printer engines, LaserJet supplies, certain customized parts and parts for products with short life cycles (although some of these sources have operations in multiple locations, mitigating the effect of a disruption). For instance, we source the majority of our A4 and a portion of A3 portfolio laser printer engines and laser toner cartridges from Canon. Any decision by either party not to renew our agreement with Canon or to limit or reduce the scope of the agreement could adversely affect our net
5
revenue from LaserJet products; however, we have a long-standing business relationship with Canon and anticipate renewal of this agreement.
We are dependent upon Intel and AMD as suppliers of x86 processors and Microsoft and Google for various software products. We believe that disruptions with these suppliers would have industry-wide ramifications, and therefore would not disproportionately disadvantage us relative to our competitors. See “Risk Factors—We are heavily dependent on third-party suppliers and supply chain issues have adversely affected, and could continue to adversely affect, our financial results” in Item 1A, which is incorporated herein by reference.
Like other participants in the information technology (“IT”) industry, we ordinarily acquire materials and components through a combination of blanket and scheduled purchase orders to support our demand requirements for periods averaging 90 to 120 days. From time to time, we may experience significant price volatility or supply constraints for certain components that are not available from multiple sources. We also may acquire component inventory in anticipation of supply constraints or enter into longer-term pricing commitments with vendors to improve the priority, price and availability of supplies. See “Risk Factors—We are heavily dependent on third-party suppliers and supply chain issues have adversely affected, and could continue to adversely affect, our financial results” in Item 1A, which is incorporated herein by reference.
Sustainability also plays an important role in the manufacturing and sourcing of materials and components for our products. We strive to make our products in an ethical and sustainable manner. We have committed to building an efficient, resilient and sustainable supplier network, and we collaborate with our suppliers to improve their labor practices and working conditions, and to reduce the environmental impact of their operations. These actions, together with our broader sustainability program, help us in our effort to meet customer sustainability requirements and comply with regulations, such as supplier labor practices and conflict minerals disclosures. For more information on our sustainability goals, programs, and performance, we refer you to our annual sustainability report, available on our website (which is not incorporated by reference herein).
International
Our products and services are available worldwide. We believe this geographic diversity allows us to meet both consumer and enterprise customers’ demand on a worldwide basis and draws on business and technical expertise from a worldwide workforce. This provides stability to our operations, provides revenue streams that may offset geographic economic trends and offers us an opportunity to access new markets for maturing products. We believe that our broad geographic presence as well as our focus on diversity and inclusion, gives us a solid base on which to build future growth.
Research and Development
Innovation across products, services, business models and processes is a key element of our culture and success. Our development efforts are focused on designing and developing products, services and solutions that anticipate customers’ changing needs and desires, and emerging technological trends. Our efforts also are focused on identifying the areas where we believe we can make a unique contribution and the areas where partnering with other leading technology companies will leverage our cost structure and maximize our customers’ experiences.
HP Labs, together with the various research and development groups within our business segments, is responsible for our research and development efforts. HP Labs is part of our Corporate Investments segment.
We anticipate that we will continue to have significant research and development expenditures in the future to support the design and development of innovative, high-quality products and services to maintain and enhance our competitive position.
For a discussion of risks attendant to our research and development activities, see “Risk Factors—If we cannot successfully execute our strategy and continue to develop, manufacture and market innovative products, services and solutions, our business and financial performance may suffer” in Item 1A, which is incorporated herein by reference.
Patents
Our general policy has been to seek patent protection for those inventions likely to be incorporated into our products and services or where obtaining such proprietary rights will improve our competitive position. At October 31, 2021, our worldwide patent portfolio included over 28,000 patents.
Patents generally have a term of twenty years from the date they are filed. As our patent portfolio has been built over time, the remaining terms of the individual patents across our patent portfolio vary. We believe that our patents and patent applications are important for maintaining the competitive differentiation of our products and services, enhancing our freedom of action to sell our products and services in markets in which we choose to participate, and maximizing our return on research and development investments. No single patent is essential to HP as a whole or to any of HP’s business segments.
In addition to developing our patent portfolio, we license intellectual property (“IP”) from third parties as we deem appropriate. We have also granted and continue to grant to others licenses, and other rights, under our patents when we consider these arrangements to be in our interest. These license arrangements include a number of cross-licenses with third parties.
For a discussion of risks attendant to IP rights, see “Risk Factors—Our financial performance may suffer if we cannot develop, obtain, license or enforce the intellectual property rights on which our businesses depend”, “Risk Factors—Our products and services depend in part on IP and technology licensed from third parties” and “Risk Factors—Third-party claims
6
of IP infringement are commonplace in our industry and may limit or disrupt our ability to sell our products and services” in Item 1A, which is incorporated herein by reference.
Seasonality
General economic conditions have an impact on our business and financial results. From time to time, the markets in which we sell our products and services experience weak economic conditions that may negatively affect sales. We experience some seasonal trends in the sale of our products and services. For example, European sales are often weaker in the summer months and consumer sales are often stronger in the fourth calendar quarter. Demand during the spring and early summer months also may be adversely impacted by market anticipation of seasonal trends. Historical seasonal patterns may not continue in the future and have been impacted by increasing supply constraints, shifts in customer behavior and the evolving impacts of the COVID-19 pandemic. See “Risk Factors—Our uneven sales cycle makes planning and inventory management difficult and future financial results less predictable,” in Item 1A, which is incorporated herein by reference.
Competition
We encounter strong competition in all areas of our business activity. We compete on the basis of technology, innovation, performance, price, quality, reliability, brand, reputation, distribution, range of products and services, ease of use of our products, account relationships, customer training, service, support and solutions including subscription-based offerings and financing, security, availability of application software, and our sustainability performance.
The markets for each of our key business segments are characterized by strong competition among major corporations with long-established positions and a large number of new and rapidly growing firms. Most product life cycles are short, and to remain competitive we must develop new products and services, periodically enhance our existing products and services and compete effectively on the basis of the factors listed above. In addition, we compete with many of our current and potential partners, including OEMs that design, manufacture and often market their products under their own brand names. Our successful management of these competitive partner relationships will be critical to our future success. Moreover, we anticipate that we will have to continue to adjust prices on many of our products and services to stay competitive.
We have a broad technology portfolio spanning personal computing and other access devices, imaging and printing-related products and services. We are the leader or among the leaders in each of our key business segments.
The competitive environment in which each key segment operates is described below:
Personal Systems. The markets in which Personal Systems operates are highly competitive and are characterized by price competition and introduction of new products and solutions. Our primary competitors are Lenovo Group Limited, Dell Inc., Huawei Technologies Co., Ltd., Acer Inc., ASUSTeK Computer Inc., Apple Inc., Toshiba Corporation, Microsoft Corporation, and Samsung Electronics Co., Ltd. In particular geographies, we also experience competition from local companies and from generically-branded or “white box” manufacturers. Our competitive advantages include our broad product portfolio, our innovation, and research and development capabilities including security features, our innovative design work, our brand and procurement leverage, our ability to cross-sell our portfolio of offerings, our extensive service and support offerings and the accessibility of our products through a broad-based distribution strategy from retail and commercial channels to direct sales.
Printing. The markets for printer hardware and associated supplies are highly competitive. Printing’s key customer segments each face competitive market pressures in pricing and the introduction of new products. Our primary competitors include Canon Inc., Lexmark International, Inc., Xerox Corporation Ltd., Seiko Epson Corporation, The Ricoh Company Ltd. and Brother Industries, Ltd. In addition, independent suppliers offer non-original supplies (including imitation, refill and remanufactured alternatives), which are often available for lower prices but which can also offer lower print quality and reliability compared to HP original inkjet and toner supplies. These and other competing products are often sold alongside our products through online or omnichannel resellers or distributors, or such resellers and distributors may highlight the availability of lower cost non-original supplies. Our competitive advantages include our comprehensive high-quality solutions for the home, office and publishing environments, our innovation, and research and development capabilities including security features, sustainability, our brand, and the accessibility of our products through a broad-based distribution strategy from retail and commercial channels to direct sales.
For a discussion of risks attendant to these competitive factors, see “Risk Factors—We operate in an intensely competitive industry and competitive pressures could harm our business and financial performance,” in Item 1A, which is incorporated herein by reference.
Sustainability
At HP, we believe how we do things is just as important as what we do, and so efforts to make a sustainable impact on people, the planet and our communities are integrated into HP’s business strategy and operations.
Through our Sustainable Impact agenda, HP is tackling some key issues: Climate Action, Human Rights, and Digital Equity. Our ambition is to become the world’s most sustainable and just technology company by 2030, and our strategy is designed to propel us forward. It stays true to HP’s values, supports the United Nations Sustainable Development Goals, and prioritizes efforts where our technology, talent, and ecosystem can have the greatest impact.
7
Climate Action: Drive toward a net zero carbon, fully regenerative economy while engineering the industry’s most sustainable portfolio of products and solutions. Among our goals:
•Achieve net zero greenhouse gas (“GHG”) emissions across HP’s value chain (scope 1, 2 and 3) by 2040, with a 50% reduction in absolute value chain GHG emissions by 2030 compared to 2019;
•Reach 75% circularity for products and packaging by 2030;
•Maintain zero deforestation for HP paper and paper-based packaging and counteract deforestation for non-HP paper used in our products and print services;
Human Rights: Create a powerful culture of diversity, equity, and inclusion. Advance human rights, social justice, and racial and gender equality across our ecosystem, raising the bar for all. Among our goals:
•Achieve 50/50 gender equality in HP leadership by 2030;
•Achieve greater than 30% technical women and women in engineering roles by 2030;
•Meet or exceed labor market representation for racial and ethnic minorities in the U.S. by 2030;
•Reach one million workers through worker empowerment programs by 2030;
Digital Equity: Lead in activating and innovating holistic solutions that break down the digital divide that prevents many from accessing the education, jobs, and healthcare needed to thrive. Drive digital inclusion to transform lives and communities. Among our goals:
•Accelerate digital equity for 150 million people by 2030;
•Enable better learning outcomes for 100 million people by 2025, since the beginning of 2015;
•Enroll 1 million HP LIFE (Learning Initiative for Entrepreneurs) users between 2016 and 2025;
For more information on our Sustainable Impact strategy, programs, and a complete list of goals and performance, we refer you to our annual Sustainable Impact Report, available on our website (which is not incorporated by reference herein).
Environment
Our operations are subject to regulation under various federal, state, local and foreign laws concerning the environment, including laws addressing the discharge of pollutants into the air and water, the management and disposal of hazardous substances and wastes, and the cleanup of contaminated sites. We could incur substantial costs, including cleanup costs, fines and civil or criminal sanctions, and third-party damage or personal injury claims, if we were to violate or become liable under environmental laws.
Many of our products are subject to various federal, state, local and foreign laws governing chemical substances in products and their safe use, including laws regulating the manufacture and distribution of chemical substances and laws restricting the presence of certain substances in electronics products. Most of our products also are subject to requirements applicable to their energy consumption. In addition, we face increasing complexity in our product design and procurement operations as we adjust to new and future requirements relating to the chemical and materials composition of our products, and their safe use.
We proactively evaluate and at times replace materials in our products and supply chain, taking into account, among other things, published lists of substances of concern, new and upcoming legal requirements, customer preferences and scientific analysis that indicates a potential impact to human health or the environment.
We are also subject to legislation in an increasing number of jurisdictions that makes producers of electrical goods, including computers and printers, financially responsible for specified collection, recycling, treatment and disposal of past and future covered products (sometimes referred to as “product take-back legislation”). We are also subject to standards set by public and private entities related to sustainability issues such as energy consumption, carbon emissions, reusing or recycling. We intend for our products to be easily reused and recycled, and we provide many of our customers with reuse and recycling programs.
In the event our products become non-compliant with these laws or standards, our products could be restricted from entering certain jurisdictions or from being procured by certain governments or private companies, and we could face other sanctions, including fines.
Our operations, supply chain and our products are expected to become increasingly subject to federal, state, local and foreign laws, regulations and international treaties relating to climate change, such as climate disclosure, carbon pricing or product energy efficiency requirements, requiring us to comply or potentially face market access limitations or other sanctions including fines. We strive to continually improve the energy and carbon efficiency of our operations, supply chain and product portfolio and deliver more cost-effective and lower carbon technology solutions to our customers. We believe that technology will be fundamental to finding solutions to achieve compliance with and manage those requirements, and we are collaborating with industry, business groups and governments to find and promote ways that HP technology can be used to address climate change and to facilitate compliance with related laws, regulations and treaties.
8
We are committed to complying with all environmental laws applicable to our operations, products and services and to reducing our environmental impact across all aspects of our business. This commitment is reflected and outlined in our sustainability policy, our comprehensive environmental, health and safety policy, strict environmental management of our operations and worldwide environmental programs and services.
A liability for environmental remediation and other environmental costs is accrued when we consider it probable that a liability has been incurred and the amount of loss can be reasonably estimated. Environmental costs and accruals are presently not material to our operations, cash flows or financial position. Although there is no assurance that existing or future environmental laws applicable to our operations or products will not have a material adverse effect on our operations, cash flows or financial condition, we do not currently anticipate material capital expenditures for environmental control facilities.
For a discussion of risks attendant to these environmental factors, see “Risk Factors—Our business is subject to various federal, state, local and foreign laws and regulations that could result in costs or other sanctions that adversely affect our business and results of operations and cash flows” in Item 1A, which is incorporated herein by reference. In addition, for a discussion of our environmental contingencies see Note 14, “Litigation and Contingencies” to the Consolidated Financial Statements in Item 8, which is also incorporated herein by reference.
Human Capital
Approximately 51,000 employees worldwide power HP’s innovation, contributing unique perspectives and a growth mindset to create breakthrough technologies and transformative solutions. We are committed to fostering a diverse, equitable, and inclusive workplace that attracts, retains, and advances exceptional talent. Through ongoing employee development, comprehensive compensation and benefits, and a focus on health, safety, and employee wellbeing, we strive to support our employees in all aspects of their lives so they can do their best work—while learning, growing, and feeling engaged.
Diversity, Equity, and Inclusion (DEI)
Innovation at HP comes from the diverse perspectives, backgrounds, knowledge, and unique experiences of our employees. We strive to create an inclusive workplace where people bring their authentic selves to work and can reach their full potential.
Our commitment to DEI starts at the top with a highly knowledgeable, skilled and diverse board of directors. We are among the top technology companies for women in executive positions. Women represent 32.5% of HP’s full-time executive positions globally. We are committed to improving representation of women at HP overall, with an intentional focus on leadership and technical roles globally.
In fiscal year 2021, 44.8% of our U.S. hires were ethnically diverse. We continue to work on removing barriers for underrepresented employees by creating equitable programs, training and development opportunities to grow and promote our employees.
To ensure leadership embeds a strong focus on DEI, each executive leader has individual performance goals under the Management by Objectives (“MBOs”) program tied to DEI. The board has ongoing oversight of these programs.
Pay Equity
We believe people should be paid equitably for what they do and how they do it, regardless of their gender, race, or other personal characteristics. To deliver on that commitment, we benchmark and set pay ranges based on relevant market data and consider factors such as an employee’s role and experience, and their performance. We also regularly review our compensation practices, both in terms of our overall workforce and individual employees, to make sure our pay is fair and equitable.
For the past five years, HP has reviewed employees’ compensation with the support of independent third-party experts to ensure consistent pay practices.
HP expanded its annual pay equity assessment in fiscal year 2021 - evaluating the nine countries with our largest employee populations, representing 72% of our global workforce. The independent analysis determined there were no systemic issues. Any areas of potential concern, considering what we would expect employees to be paid when evaluating their skills, qualifications, and experience were reviewed and addressed as part of our off-cycle compensation process.
Employee Engagement
We regularly collect feedback from employees to better understand and improve their experiences and identify opportunities to continually strengthen our culture. In fiscal year 2021, 95% of employees participated in our annual employee engagement survey. Employee engagement globally remained stable as compared to fiscal year 2020. Ethics and integrity as well as employees feeling that HP values diversity were both highly rated, at 96% and 94%, respectively. Our Inclusion Index reported 87% of employees experience an inclusive work environment at HP.
Talent and Learning
HP employees have access to a wide range of development opportunities, including virtual, social, and self-directed learning, as well as mentoring and coaching. We offer a variety of collaborative learning experiences, connection to a network
9
of subject matter experts, and a social learning platform that enables employees to integrate development into their daily routines.
In fiscal year 2021, 99% of employees participated in learning and development activities, and we estimate that employees (on average) spent more than 30 hours participating in development activities through the year. The 2021 annual employee survey revealed that 84% of employees felt HP actively supported their learning and development.
Through fiscal year 2021 we accelerated our transition toward more holistic approaches of employee development, with additional trainings supporting employee wellbeing and remote working. More than 25,000 employees participated in new virtual business, professional, digital, and career development live trainings.
In addition to the above, we have key focus areas on leadership development and digital skills. Our priority leadership development programs included our new Hire EQ development program to improve our diversity hiring practices, and the Senior Leader Meeting Connect program to develop global business leadership insights and learn from external best practices. In fiscal year 2021, we continued our focus on the HP digital literacy campaign (Speak Digital) targeted to all employees to increase knowledge of digital technologies and emerging trends in customer experience and innovation.
Health, Safety, and Wellness
The physical health, financial wellbeing, life balance and mental health of our employees are vital to HP’s success. Our environmental, health, and safety leadership team uses our global injury and illness reporting system to assess worldwide and regional trends as a part of quarterly reviews. Our manufacturing facilities continue to represent our most significant health and safety risks, due to higher potential exposure to chemicals and machinery related hazards. Reducing and effectively managing risks at these facilities remains a focus, and injury rates continue to be low.
We also sponsor a global wellness program designed to enhance physical, financial, and mental wellbeing for all our employees around the world. Throughout the year, we encourage healthy behaviors through regular communications, educational sessions, voluntary progress tracking, wellness challenges, and other incentives.
Throughout the COVID-19 pandemic, a top priority of HP’s has been the health, safety, and wellbeing of employees and their families. Our cross-functional COVID-19 program management office meets regularly to review the latest data from HP business and site leaders, identify and address emerging risks, and formulate HP’s response to actions taken by governments and public policy organizations. We've put in place global policies and protocols based on guidance from healthcare experts and public health leaders, and regularly review and update them to reflect the best, most current information available.
Hybrid Work Strategy
We are embracing hybrid ways of working across HP and introduced new flexible working guidelines in July 2021. Hybrid Work at HP balances more workplace flexibility with structured time together to collaborate and connect in person at our HP sites. Our goal is to provide the ability to work seamlessly across a diverse ecosystem of workplaces, enabled by enhanced tools and technology designed to optimize productivity and collaboration.
In summary, we aim to cultivate a healthy, supportive and inclusive environment that enables employees to do their best work, while developing themselves and reaching their full potential.
Information about our Executive Officers
The following are our current executive officers:
Harvey Anderson; age 58; Chief Legal Officer
Mr. Anderson has served as Chief Legal Officer since February 2021. Previously, he served as General Counsel from November 2019 to January 2021. Mr. Anderson joined HP in 2017 as deputy general counsel for the Personal Systems and 3D Printing business units. Prior to joining HP, he served as chief legal officer at AVG Technologies, a leading provider of software security solutions, from 2014 to 2019. He has also held senior legal roles at Mozilla Corporation, Seven Networks, and Netscape/AOL.
Alex Cho; age 49; President, Personal Systems
Mr. Cho has served as President, Personal Systems since June 2018. From 2014 to 2018, Mr. Cho served as Global Head and General Manager of Commercial Personal Systems. Prior to that role, Mr. Cho served as the Vice President and General Manager of the LaserJet Supplies team from 2010 to 2014.
Enrique Lores; age 56; President and Chief Executive Officer
Mr. Lores has served as President and Chief Executive Officer since November 2019. Throughout his over 30-year tenure with the company, Mr. Lores held leadership positions across the organization, most recently serving as President, Printing, Solutions and Services from November 2015 to November 2019, and prior to that role, leading the Separation Management Office for HP Inc. Previously, Mr. Lores was the Senior Vice President and General Manager for Business Personal Systems. Before his Business Personal Systems role, Mr. Lores was Senior Vice President of Customer Support and Services.
Kristen Ludgate; age 58; Chief People Officer
Ms. Ludgate has served as Chief People Officer since July 2021. Previously, Ms. Ludgate served as Executive Vice President and Chief Human Resources Officer at 3M, a global technology company, from June 2018 until July 2021. Ms.
10
Ludgate held a wide range of leadership positions during her 17 years with 3M, leading global teams in human resources, legal, compliance, and communications.
Marie Myers; age 53; Chief Financial Officer
Ms. Myers has served as Chief Financial Officer since February 2021, previously serving as acting Chief Financial Officer from October 2020 to February 2021. She served as Chief Transformation Officer from June 2020 to May 2021 and as Chief Digital Officer from March 2020 to June 2020. Prior to rejoining HP, she was the Chief Financial Officer of UiPath, a robotic process automation company, from December 2018 to December 2019. Prior to UiPath, Ms. Myers served as Global Controller from December 2015 to December 2018 and finance lead during the separation of Hewlett-Packard Company into HP and Hewlett Packard Enterprise Company from October 2014 to August 2015, in addition to other finance-related roles at Hewlett-Packard Company.
Christoph Schell; age 50; Chief Commercial Officer
Mr. Schell has served as Chief Commercial Officer since November 2019. From November 2018 to October 2019, he served as the President of 3D Printing & Digital Manufacturing. Before that, he served as President of the Americas region from November 2015 to November 2018 and managed the Americas region for the HP Print and Personal Systems business from August 2014 to November 2015. Prior to rejoining HP in August 2014, Mr. Schell served as Executive Vice President of the Lighting business in Growth Markets at Philips. Prior to Philips, Mr. Schell held various roles at HP and Procter & Gamble.
Tuan Tran; age 54; President of Imaging, Printing and Solutions
Mr. Tran served as President of Imaging, Printing and Solutions since November 2019. Previously, he served as Global Head & General Manager of the Office Printing Solutions business from 2016 to November 2019, and Global Head & General Manager of the LaserJet and Enterprise Solutions business from 2014 to 2016.
Barb Barton Weiszhaar; age 58; Acting Global Controller
Ms. Weiszhaar has served as Acting Global Controller since June 2021. Previously, she served as the Chief of Staff for the Chief Financial Officer and Operations Lead, a position she had held since April 2020. Prior to April 2020, she served as HP's Chief Tax Officer from November 2015 to March 2020 and in other leadership roles, including Chief Operations Officer for Tax, prior to the November 2015 separation of Hewlett-Packard Company into HP and Hewlett Packard Enterprise Company. Ms. Weiszhaar joined Hewlett-Packard Company following its acquisition of EDS in 2008; at EDS she served as Tax Director.
Available Information
Our Annual Report on Form 10-K, Quarterly Reports on Form 10-Q, Current Reports on Form 8-K and amendments to reports filed or furnished pursuant to Sections 13(a) and 15(d) of the Securities Exchange Act of 1934, as amended, are available free of charge on our website at http://investor.hp.com, as soon as reasonably practicable after HP electronically files such reports with, or furnishes those reports to, the Securities and Exchange Commission. HP’s Corporate Governance Guidelines, Board of Directors’ committee charters (including the charters of the Audit Committee, Finance, Investment and Technology Committee, HR and Compensation Committee, and Nominating, Governance and Social Responsibility Committee) and code of ethics entitled “Integrity at HP” (none of which are incorporated by reference herein) are also available at that same location on our website. If the Board grants any waivers from Integrity at HP to any of our directors or executive officers, or if we amend Integrity at HP, we will, if required, disclose these matters via updates to our website at http://investor.hp.com on a timely basis. We encourage investors to visit our website from time to time, as information is updated and new information is posted. The content of our website is not incorporated by reference into this Annual Report on Form 10-K or in any other report or document we file with the SEC, and any references to our website are intended to be inactive textual references only.
Stockholders may request free copies of these documents from:
HP Inc.
Attention: Investor Relations
1501 Page Mill Road,
Palo Alto, CA 94304
http://investor.hp.com/resources/information-request/default.aspx
Additional Information
Microsoft® and Windows® are either registered trademarks or trademarks of Microsoft Corporation in the United States and/or other countries. Intel® is a trademark of Intel Corporation or its subsidiaries in the United States and/or other countries. AMD is a trademark of Advanced Micro Devices, Inc. Google™ and Google Chrome™ are trademarks of Google LLC. All other trademarks are the property of their respective owners.
11
ITEM 1A. Risk Factors.
The following discussion of risk factors contains forward-looking statements. These risk factors may be important for understanding any statement in this Form 10-K or elsewhere. The following information should be read in conjunction with Part II, Item 7, “Management’s Discussion and Analysis of Financial Condition and Results of Operations” and the Consolidated Financial Statements and related notes in Part II, Item 8, “Financial Statements and Supplementary Data” of this Form 10-K.
Because of the following factors, as well as other variables affecting our results of operations, past financial performance may not be a reliable indicator of future performance, and historical trends should not be used to anticipate results or trends in future periods.
STRATEGIC AND OPERATIONAL RISKS
Our business, results of operations and financial condition have been, and could continue to be, affected by the COVID-19 pandemic.
The COVID-19 pandemic and the actions taken by governments, businesses and individuals in response to the pandemic have resulted in, and are expected to continue to result in, a curtailment of business activities (including changes in demand for a broad variety of goods and services), weakened economic conditions, disruptions in supply, manufacturing and logistics, economic uncertainty and volatility in the financial markets, both in the United States and abroad.
The COVID-19 pandemic, including its resurgence in key markets, has impacted, and could adversely impact, our operations and financial performance. COVID-19 related restrictions impacted the demand for certain products and services as a result of temporary closures of offices and businesses, the shift to a hybrid work environment, and as people moved to spend more time at home, which negatively impacted sales for commercial products in both Personal Systems and Print. For as long as remote working and learning practices remain prevalent, whether due to restrictions implemented by governmental authorities or businesses allowing employees to continue to work remotely or adopting new workplace models, we expect decreased sales of products for in-office consumption in some markets and channels compared to pre-pandemic levels. While this decrease in demand for certain products has been partially offset by increased sales of other products for in-home consumption compared to pre-pandemic levels, we are unable to predict for how long or to what extent this elevated level of sales of products for in-home consumption will continue. Additionally, as the market continues to shift to hybrid, our financial performance will depend in part on our ability to remain competitive in products designed for hybrid consumption.
Moreover, our channel partners have experienced, and may continue to experience, disruptions in their operations due to restrictions implemented in response to COVID-19, which has caused, and may continue to cause, reduced, or cancelled orders and/or collection risks. This has further adversely impacted our results of operations and we expect it may continue to have a negative impact on our results of operations.
Additionally, as the COVID-19 pandemic continues and new variants of the virus emerge, we are seeing a resurgence of the pandemic in certain key markets. We have experienced temporary factory closures and other disruptions in supply, manufacturing and logistics as a result of COVID-19, and we may continue to experience such disruptions. For example, our manufacturing sites, including those in Asia, as well as those of our suppliers and outsourcing partners, were adversely impacted as a result of quarantines, facility closures, and travel and logistics challenges. These disruptions have resulted and may continue to result in supply shortages and delays impacting sales worldwide for both Personal Systems and Print, as well as incremental costs. We may experience further disruptions in the future, and any prolonged disruptions to our manufacturing operations, supply chain and/or distribution channels could have a material adverse effect on our business, results of operations, cash flows and financial condition.
We are also facing increased operational challenges as we take measures to support and protect employee health and safety, including limiting employee travel, limiting access to facilities and offices, implementing remote work and flexible work policies and implementing a vaccine policy for employees. In particular, our remote work arrangements pose challenges for our employees and our IT systems and extended periods of remote work arrangements could strain our business continuity plans, introduce operational risk, including cybersecurity and IT systems management risks, and impair our ability to manage our business. In addition, complying with various customer or government vaccine, masking or testing requirements, could result in increased competition for skilled talent, and could adversely impact our ability to deliver services to our customers, which could in turn adversely impact our results of operations or financial performance.
The effects of COVID-19 may also limit the resources afforded to or delay the implementation of our strategic initiatives and make it more difficult to develop, manufacture and market innovative products and services. If our strategic initiatives are delayed or otherwise modified, such initiatives may not achieve some or all of the expected benefits, which could have a material adverse effect on our competitive position, business, financial condition, results of operations and cash flows.
The ultimate impact of COVID-19 on our operations and financial performance depends on many factors that are not within our control, including: the duration, scope and severity of the pandemic, including the impact of variants and resurgences; the development, availability and public acceptance of effective treatments or vaccines; governmental, business
12
and individuals’ actions that have been and continue to be taken in response to the pandemic; general economic uncertainty in global markets and financial market volatility; global economic conditions and levels of economic growth; and the pace of recovery when the COVID-19 pandemic subsides.
Further, COVID-19, and the volatile regional and global economic conditions stemming from the pandemic, could precipitate or aggravate the other risk factors that we identify in this report, any of which could materially adversely impact our business. We also face an increased risk of litigation and governmental and regulatory scrutiny as a result of the effects of COVID-19 on economic and market conditions. COVID-19 may also affect our business and financial results in ways that are not presently known to us or that we do not currently consider as significant risks to our operations.
We are heavily dependent on third-party suppliers and supply chain issues have adversely affected, and could continue to adversely affect, our financial results.
We are operating in a supply-constrained environment and are facing, and may continue to face, component shortages, logistics challenges and manufacturing disruptions that impact our revenues and profitability. We are heavily dependent on third-party suppliers and their ability to deliver sufficient quantities of key components, products and services at reasonable prices and in time for us to meet schedules for the delivery of our products and services. In addition, our operations depend on our ability to anticipate and our suppliers’ ability to fulfill, our needs for sufficient quantities of key components, products and services (including sourcing matched sets). Given the wide variety of products and services we offer, the large and diverse distribution of our suppliers and contract manufacturers, and the long lead times required to manufacture, assemble and deliver certain components and products, problems have and could continue to arise in production, planning and inventory management, and regulatory compliance that could seriously harm our business. Third-party suppliers may have limited financial resources to withstand challenging business conditions, particularly as a result of increased interest rates or emerging market volatility, and our business could be negatively impacted if key suppliers are forced to cease or limit their operations. Due to the international nature of our third-party supplier network, our financial results may also be negatively impacted by increased trade barriers, increased tariffs and localization requirements, which could increase the cost or availability of certain components, products and services that we may not be able to offset. We also have experienced, and may experience in the future, gross margin declines in certain businesses, reflecting the effect of items such as competitive pricing pressures and increases in component and manufacturing costs resulting from higher labor and material costs borne by our manufacturers and suppliers that we are unable to pass on to our customers. In addition, our business may be disrupted if we are unable to obtain equipment, parts or components from our suppliers—and our suppliers from their suppliers—due to the insolvency of key suppliers or the inability of key suppliers to obtain credit, or if any of our distributors lack sufficient financial resources to withstand economic weakness. In addition, our ongoing efforts to optimize the efficiency of our supply chain could cause supply disruptions and be more expensive, time-consuming and resource-intensive than expected. Furthermore, certain of our suppliers and Outsourced Manufacturers (“OMs”) may decide to discontinue business with us or limit the allocation of products to us, which could result in our inability to fill our supply needs, jeopardizing our ability to fulfill our contractual obligations, which could in turn, result in a decrease in sales and profitability, contract penalties or terminations, and damage to customer relationships. Other supplier problems that we could face include component shortages, excess supply, risks related to the terms of our contracts with suppliers, risks associated with contingent workers, risks related to supply chain working conditions, human rights and materials sourcing, and risks related to our relationships with single-source suppliers, each of which is described below.
•Component shortages. We have and may continue to experience a shortage of, or a delay in receiving, certain components as a result of strong demand, capacity constraints, supplier financial weaknesses, the inability of suppliers to borrow funds, disputes with suppliers (some of whom are also our customers), disruptions in the operations of component suppliers, other problems experienced by suppliers or problems we face during the transition to new suppliers. For example, we have experienced disruptions in our manufacturing and supply chain during the COVID-19 pandemic, which have resulted in temporary supply shortages that have negatively affected our ability to fulfill demand for Personal Systems and Printing products worldwide and resulted in increases in prices for certain components, and we expect such challenges to continue during 2022. For example, there is currently a market shortage of integrated circuits and panels and other component supply which has affected, and could continue to affect, lead times, the cost of that supply, and our ability to meet customer demand for our products if we cannot secure sufficient supply in a timely manner or on terms that are acceptable. Additionally, our Personal Systems business relies heavily upon OMs to manufacture our products and we are therefore dependent upon the continuing operations of those OMs to manufacture our products to fulfill demand. We represent a substantial portion of the business for certain OMs, and any changes to the nature or volume of our business transactions with a particular OM could adversely affect the operations and financial condition of the OM and lead to shortages or delays in receiving component products from that OM. If shortages or delays in component products persist, the price of certain components may increase further, we may be exposed to quality issues, or the components may not be available at all. We may not be able to secure enough components at reasonable prices or of acceptable quality to build products or provide services in a timely manner in the quantities needed or according to our specifications. Accordingly, our business, cash flows, results of operations and financial condition could suffer if we lose time-sensitive sales, incur additional freight costs or are
13
unable to pass on price increases to our customers due to such component shortages or delays. If we cannot adequately address a component supply issue, we may have to re-engineer some product or service offerings, which could result in further costs and delays.
•Excess supply. In order to secure components for our products or services, we have and may continue to make advance payments to suppliers or enter into non-cancelable commitments with vendors. In addition, we have and may continue to strategically purchase components in advance of demand to take advantage of favorable pricing or to address concerns about future availability. If we fail to anticipate customer demand properly, a temporary oversupply could result in excess or obsolete components, which could adversely affect our business and financial performance.
•Contractual terms. As a result of binding long-term price or purchase commitments with vendors, we may be obligated to purchase components or services at prices that are higher than those available in the current market and may be limited in our ability to respond to changing market conditions. If we commit to purchasing components or services for prices in excess of the then-current market price, we may be at a disadvantage to competitors who have access to components or services at lower prices, our gross margin could suffer, and we could incur additional charges relating to inventory obsolescence. In addition, many of our competitors obtain products or components from the same OMs and suppliers that we utilize. Our competitors may obtain better pricing, more favorable contractual terms and conditions, or more favorable allocations of products and components during periods of limited supply, and our ability to engage in relationships with certain OMs and suppliers could be limited. The practice employed by our Personal Systems business of purchasing product components and transferring those components to OMs may create large supplier receivables with the OMs that, depending on the financial condition of the OMs, may create collectability risks. In addition, in order to secure components, we may accept contractual terms and conditions that are less favorable to us. Any of these developments could adversely affect our future cash flows, results of operations and financial condition.
•Contingent workers. We also rely on third-party suppliers for the provision of contingent workers, and our failure to effectively manage this workforce could adversely affect our results of operations. Our ability to manage the costs associated with engaging a contingent workforce may be impacted by evolving local labor rights laws.
•Working conditions, human rights and materials sourcing. Our brand perception, customer loyalty and legal compliance could be adversely impacted by a supplier’s improper practices or failure to comply with our requirements for environmentally, socially or legally responsible practices and sourcing, including those in our Supplier Code of Conduct, General Specification for the Environment or other related provisions in our procurement contracts. These provisions include supplier audits, reporting of smelters, human rights due diligence, wood fiber certification and GHG emissions, water and waste data.
•Single-source suppliers. We obtain a significant number of components from a single source due to technology, availability, price, quality or other considerations. For example, we rely on Canon for certain laser printer engines and laser toner cartridges. We also rely on both Intel and AMD to provide us with a sufficient supply of processors for the majority of our PCs and workstations. Some of those processors may be customized for our products. New products that we introduce may utilize custom components obtained initially from only one source until we have determined whether there is a need for additional suppliers. Replacing a single-source supplier could delay production of some products as replacement suppliers may be subject to capacity constraints or other output limitations. For some components, alternative sources may not exist or may be unable to produce the quantities of those components necessary to satisfy our production requirements. In certain circumstances, we purchase components from single-source suppliers under short-term agreements that contain favorable pricing and other terms, but that may be unilaterally modified or terminated by the supplier with limited notice and with little or no penalty. The performance of single-source suppliers under those agreements (and the renewal or extension of those agreements upon similar terms) may affect the quality, quantity and price of our components. The loss of, deterioration of our relationship with, or limits in allocation by, a single-source supplier, or any unilateral modification to the contractual terms under which we are supplied components by a single-source supplier could adversely affect our business and financial performance.
If we cannot successfully execute our strategy and continue to develop, manufacture and market innovative products, services and solutions, our business and financial performance may suffer.
Our strategy is to strengthen our core businesses, innovate and develop new products, services and solutions, expand into adjacencies, and grow organically and inorganically. To execute our strategy, we must, among other things, optimize our cost structure, make long-term investments, develop or acquire and appropriately protect intellectual property, commit significant research and development and other resources, evolve our go-to-market strategy and Printing business model to meet changing market dynamics, forces and demand as well as innovate, develop and execute on evolutionary strategies in a rapidly changing and increasingly hybrid environment, seize on disruptive opportunities and effectively respond to secular trends and shifts in customer preferences. As the market continues to shift to hybrid, our financial performance will depend in part on our ability to remain competitive in offerings geared towards hybrid consumption. Any failure to successfully execute our strategy, including any failure to invest sufficiently (or prioritize research and development) in strategic growth areas, accurately predict technological or business trends and control costs of research and development, could adversely affect adoption of our products, services and solutions and our business, results of operations, cash flows and financial condition.
14
Moreover, the process of developing new high-technology products, services and solutions and enhancing existing products, services and solutions is complex, costly and uncertain, and any failure by us to anticipate or respond to customers’ changing needs (or the timing of those needs) and emerging technological trends accurately could affect our market share, cash flows, results of operations and financial condition. In addition, our ability to successfully offer our products, services and solutions in this rapidly evolving market requires an effective planning, forecasting, and management process to enable us to effectively calibrate and adjust our business and business models in response to fluctuating market opportunities and conditions. We could also be adversely affected if we have not appropriately prioritized and balanced our initiatives or if we are unable to effectively manage change throughout our organization. For example, we may adjust production levels in response to demand fluctuations and in order to improve the alignment of our resources to business conditions.
Our industry is subject to rapid and substantial innovation and technological change. Even if we successfully develop new products and technologies, future products and technologies, including those created by our competitors, may eventually supplant ours if we are unable to keep pace with technological advances and end-user requirements and preferences and timely enhancement of our existing products and technologies or develop new ones. As a result, we could fail to maintain market leadership in certain of our products, such as commercial PCs and notebooks, and any of our products and technologies may be rendered uneconomical or obsolete.
After we develop a product, we must be able to quickly manufacture appropriate volumes while also managing costs and preserving or improving margins. To accomplish this, we must accurately forecast volumes, mixes of products and configurations that meet customer requirements, and we may not succeed in doing so within a given product’s lifecycle or at all. Any delay in the development, production or marketing of a new product, service or solution could result in us not being among the first to market, which could further harm our competitive position. Moreover, new products and services may not be profitable, and even if they are profitable, the operating margins may not be as high as the historical or anticipated margins.
We operate in an intensely competitive industry and competitive pressures could harm our business and financial performance.
We encounter aggressive competition from competitors in all areas of our business, and our competitors have targeted and are expected to continue targeting our key market segments. In addition, we are expanding into new disruptive and competitive businesses, such as services. We compete on the basis of our technology, innovation, performance, price, quality, reliability, brand, reputation, distribution, range of products and services, ease of use, account relationships, customer training, service and support, security, availability of application software and internet infrastructure offerings, and our sustainability performance. If our products, services, support and cost structure do not enable us to compete successfully, our results of operations, cash flows and business prospects could be affected.
We have a large portfolio of products and must allocate our financial, personnel and other resources across all of our products while competing with companies that have smaller portfolios or specialize in one or more of our product lines. As a result, we may invest less in certain areas of our business than our competitors, and our competitors may have greater financial, technical and marketing resources available for their products and services compared to the resources allocated to our competing products and services or greater economies of scale, which could in turn result in our inability to maintain market leadership in certain of our products, such as commercial PCs and notebooks.
Our alliance partners in certain areas may be or may become our competitors in others. In addition, these partners also may acquire or form alliances with our competitors, which could reduce their business with us. If we are unable to effectively manage these complicated relationships with alliance partners, our business and financial results could be adversely affected.
We have faced and may continue to face aggressive price competition and may have to lower the prices of many of our products and services to stay competitive, while at the same time trying to maintain or improve our revenue and gross margin. In addition, competitors who have a greater presence in some of the lower-cost markets in which we compete, or who can obtain better pricing, more favorable contractual terms and conditions, and/or more favorable allocations of products and components during periods of limited supply, may be able to offer lower prices than we are able to offer. Our cash flows, results of operations and financial condition may be adversely affected by these and other industry-wide pricing pressures.
Industry consolidation may also affect competition by creating larger, more homogeneous and potentially stronger competitors in the markets in which we operate. Additionally, our competitors may affect our business by entering into exclusive arrangements with our existing or potential customers or suppliers.
Because our business model is based on providing innovative and high-quality products and services, we may spend a proportionately greater percentage of our revenues on research and development than some of our competitors. If we cannot proportionately decrease our cost structure (apart from research and development expenses) on a timely basis in response to competitive price pressures, our gross margin and profitability could be adversely affected. In addition, if our pricing and other facets of our offerings are not sufficiently competitive, or if there is negative reception to our product decisions, we may lose market share in certain areas, which could adversely affect our financial performance and business prospects.
Even if we are able to maintain or increase market share for a particular product, the financial performance of that product could decline because the product is in a maturing industry or market segment or contains technology that is becoming
15
obsolete. Financial performance could also decline due to increased competition from other types of products, services or solutions. For example, non-original supplies (including imitation, refill or remanufactured alternatives), which are often available at lower prices, compete with our Printing Supplies business and we may not be able to prevent the use of imitation print supplies with our printers using technological protection measures.
Customers are increasingly using online and omnichannel retailers, resellers and distributors to purchase our products. These retailers, resellers and distributors often sell our products alongside competing products, including non-original supplies, or they may highlight the availability of lower cost non-original supplies. We expect this competition will continue, and it may negatively impact our financial performance, particularly if large commercial customers purchase competing products instead of HP products.
If we cannot continue to produce high-quality and secure products and services, our reputation, business and financial performance may suffer.
In the course of conducting our business, we must address quality and security issues associated with our products and services, including potential defects in our engineering, design and manufacturing processes, unsatisfactory performance under service contracts, and unsatisfactory performance or malicious acts by third-party contractors or subcontractors. Our business is also exposed to the risk of defects in third-party components included in our products, including security vulnerabilities. In order to address quality and security issues, we work extensively with our customers and suppliers and engage in product testing to determine the causes of problems and to develop and implement effective solutions. However, the products and services that we offer are complex, and our regular testing and quality control efforts may not be completely effective in controlling or detecting all quality and security issues or errors, particularly with respect to undiscovered defects or security vulnerabilities in components manufactured by third parties.
If we are unable to determine the cause or find an effective solution to address quality or security issues with our products, we may delay shipment to customers, which would delay revenue recognition and receipt of customer payments and could adversely affect our net revenue, cash flows and profitability. We have and may again in the future write off some or all of the value of non-performing inventory. In addition, after products are delivered, quality and security issues may require us to repair or replace such products. Addressing these issues can be expensive and may result in additional warranty, repair, replacement and other costs, adversely affecting our financial performance. In the event of security vulnerabilities or other issues with third-party components, we may have to rely on third parties to provide mitigation such as firmware updates. Furthermore, these mitigation techniques may be ineffective or may result in adverse performance, system instability and data loss or corruption, and are not always available on a timely or cost effective basis, or at all. If new or existing customers have difficulty operating our products or are dissatisfied with our services, our results of operations and cash flows could be adversely affected, and we have faced and could potentially continue to face legal claims if we fail to meet our customers’ expectations. In addition, quality and security issues, including those resulting from defects or security vulnerabilities in third-party components, can impair our relationships with new or existing customers and adversely affect our brand and reputation, which could, in turn, adversely affect our cash flows, results of operations and financial condition.
Our operating results have historically varied and may not be indicative of future results.
Our net revenue, gross margin, profit and cash flow generation vary among our portfolio of products and services, customer groups and geographic markets and therefore will likely continue to vary in future periods. Overall gross margins and profitability in any given period are dependent on the product, service, customer and geographic mix reflected in that period’s net revenue, which in turn depends on the overall demand for our products and services. Delays or reductions in spending by our customers or potential customers could have a material adverse effect on demand for our products and services, which could result in a significant decline in net revenue. In addition, net revenue declines in some of our businesses may affect net revenue in our other businesses, as we may lose cross-selling opportunities. Competition, lawsuits, investigations, increases in component and manufacturing costs that we are unable to pass on to our customers, increased tariffs, component supply disruptions and other risks affecting our businesses may also have a significant impact on our overall gross margin, profitability and cash flow. In addition, newer geographic markets can be relatively less profitable due to our investments associated with entering those markets and local pricing pressures, as well as difficulty establishing and maintaining the operating infrastructure necessary to support the high growth rate associated with some of those markets. Market trends, industry shifts, competitive pressures, commoditization of products, increased component or shipping costs, increased tariffs, regulatory impacts and other factors may result in reductions in revenue or pressure on gross margins in a given period, which may lead to adjustments to our operations. For example, our supplies business has experienced declining revenues due to declines in installed base and usage. Our efforts to address the challenges facing our business could increase the level of variability in our financial results because the rate at which we are able to realize the benefits from those efforts may vary from period to period. These factors could also make it difficult to accurately forecast revenues and operating results and could negatively affect our ability to provide accurate forecasts to suppliers and manufacturers, manage our relationships and other expenses and to make decisions about future investments.
16
If we fail to manage the distribution of our products and services properly, our business and financial performance could suffer.
We use a variety of distribution methods to sell our products and services around the world, including third-party resellers and distributors and both direct and indirect sales to enterprise accounts and consumers. Successfully managing our global, multi-tier distribution network including the interaction of our direct sales and indirect channel sales efforts to reach potential customer segments for our products and services is a complex process. Moreover, since each distribution method has distinct risks and gross margins, any failure to implement the most advantageous balance in the delivery model for our products and services could adversely affect our net revenue and gross margins, and therefore, our profitability and cash flows.
Our financial results could be materially adversely affected due to distribution channel conflicts or if the financial conditions of our channel partners were to weaken. Our results of operations may be adversely affected by any conflicts that might arise between our various distribution channels, the loss or deterioration of any alliance or distribution arrangement or reduced assortments of our products, if we are not able to limit the potential misuse of pricing programs by our channel partners or we fail to optimize the use of our pricing programs. Moreover, some of our distributors may have insufficient financial resources and may not be able to withstand changes in business conditions, including economic weakness, industry consolidation and market trends. They may also have difficulty selling our products under new business models. Many of our significant distributors operate on narrow margins and have been negatively affected by business pressures in the past. Trade receivables that are not covered by collateral or credit insurance are outstanding with our distribution and retail channel partners. Net revenue from indirect sales could suffer, and we could experience disruptions in distribution, if our distributors’ financial conditions, abilities to borrow funds or operations weaken or if our distributors cannot successfully compete in the online or omnichannel marketplace.
Our inventory management is complex, as we continue to sell a significant mix of products through distributors. We must manage both owned and channel inventory effectively, particularly with respect to sales to distributors, which involves forecasting demand and pricing challenges (and factoring in supply chain challenges and order cancellations resulting from any pricing increases). Our forecasts may not accurately predict demand, and distributors may increase orders during periods of product shortages, cancel orders if their inventory is too high or delay orders in anticipation of new products. Distributors also may adjust their orders in response to the supply of our products and the products of our competitors and seasonal fluctuations in end-user demand. Our reliance upon indirect distribution methods, including a multi-tiered channel, may reduce our visibility into inventories, demand and pricing trends and issues, and may therefore make forecasting and managing multi-tiered channel inventory more difficult.
If we were to expand direct distribution initiatives, channel and indirect distributors could consider such initiatives in conflict with their business interests and reduce their investment in the distribution and sale of our products, or cease all sales of our products. Sales of our products by channel partners to unauthorized resellers or unauthorized resale of our products has and could continue to make our forecasting and channel inventory management more difficult and impact pricing in the market. For example, in the past we have had channel partners sell products outside of their agreed territory, and misrepresent sales to unauthorized resellers as sales to end-users, frustrating our efforts to estimate channel inventory or maintain consistent pricing, and negatively impacting gross margins. Moreover, our use of indirect distribution channels may limit our willingness or ability to adjust prices quickly and otherwise to respond to pricing changes by competitors. In addition, factors in different markets may cause differential discounting between the geographies where our products are sold, which makes it difficult to achieve global consistency in pricing and creates the opportunity for grey marketing.
In addition, we depend on our global channel partners to comply with applicable legal and regulatory requirements. To the extent they fail to do so, such failure could have a material adverse effect on our business, operating results, cash flows and financial condition.
Our uneven sales cycle makes planning and inventory management difficult and future financial results less predictable.
Our quarterly sales often have reflected a pattern in which a disproportionate percentage of each quarter’s total sales occurs towards the end of the quarter. This uneven sales pattern makes predicting net revenue, earnings, cash flow from operations and working capital for each financial period difficult, increases the risk of unanticipated variations in our quarterly results and financial condition, and places pressure on our inventory management and logistics systems. If predicted demand is substantially greater than orders, there may be excess inventory. Alternatively, if orders substantially exceed predicted demand, we may not be able to fulfill all of the orders received in each quarter and such orders may be canceled by the customer. Depending on when they occur in a quarter, developments such as a systems failure, component pricing movements, component shortages, supply disruptions or logistics challenges could adversely impact our inventory levels, our results of operations and cash flows in a manner that is disproportionate to the number of days in the quarter affected.
We experience seasonal trends in the sale of our products that may produce variations in our quarterly results and financial condition. For example, sales to governments (particularly, sales to the U.S. government) are often stronger in the third calendar quarter, and many customers whose fiscal year is the calendar year spend their remaining capital budget authorizations in the fourth calendar quarter. Consumer sales are often higher in the fourth calendar quarter due in part to seasonal holiday demand, and typically it has been our strongest quarter by revenues. European sales are often weaker during
17
the summer months. Demand during the spring and early summer may also be adversely impacted by market anticipation of seasonal trends. However, historical seasonal patterns may not continue in the future and such patterns have been and may continue to be impacted by increasing supply constraints, shifts in customer behavior and the evolving impacts of the COVID-19 pandemic. Moreover, to the extent that we introduce new products in anticipation of seasonal demand trends, our discounting of existing products may adversely affect our gross margins. Many of the factors that create and affect seasonal trends are beyond our control.
We may not be able to execute acquisitions, divestitures and other significant transactions successfully.
As part of our business strategy, we may acquire companies or businesses, divest businesses or assets, enter into strategic alliances and joint ventures, and make investments to further our business. Risks associated with these transactions include the following, any of which could adversely affect our revenue, gross margin, profitability, cash flows and financial condition:
•We may not fully realize the anticipated benefits of any particular transaction, in the timeframe we expected or at all, such transaction may be less profitable than anticipated or unprofitable, we may not identify all factors to estimate accurately our costs, timing or other matters, and realizing the benefits of a particular transaction may depend upon competition, market trends, additional costs or investments and the actions of advisors, suppliers or other third parties.
•Certain transactions have resulted, and in the future may result, in significant costs and expenses, including those related to compensation and benefit costs, goodwill and impairment charges, charges from the elimination of duplicative facilities and contracts, inventory adjustments, assumed litigation and other liabilities, advisory fees, and required payments to executive officers and key employees under retention plans.
•Our due diligence process may fail to identify significant issues with the acquired company’s product quality, financial disclosures, accounting practices or internal controls, including as a result of being dependent on the veracity and completeness of statements and disclosures made or actions taken by third parties.
•In order to finance a transaction, we may issue common stock (potentially creating dilution) or borrow additional debt.
•These transactions could adversely impact our effective tax rate.
•These transactions may lead to litigation.
•If we fail to identify, successfully complete and integrate transactions that further our strategic objectives, we may be required to expend resources to develop products, services and technology internally, which may put us at a competitive disadvantage
If there are future decreases in our stock price or significant changes in the business climate or results of operations of our reporting units, we may incur additional charges, which may include impairment charges.
As part of our business strategy, we regularly evaluate the potential disposition of assets and businesses that may no longer help us meet our objectives. When we decide to sell assets or a business, we may have difficulty finding buyers or alternative exit strategies on acceptable terms in a timely manner, which could delay the achievement of our strategic objectives. We may also dispose of a business at a price or on terms that are less desirable than we had anticipated. In addition, we may experience fewer synergies than expected, and the impact of the divestiture on our revenue growth may be larger than projected. After reaching an agreement for the acquisition or disposition of a business, we are subject to satisfaction of pre-closing conditions as well as necessary regulatory and governmental approvals on acceptable terms, which, if not satisfied or obtained, may prevent us from completing the transaction. Such regulatory and governmental approvals may be required in jurisdictions around the world, and any delays in the timing of such approvals could materially delay or prevent the transaction.
Integrating acquisitions may be difficult and time-consuming. Any failure by us to integrate acquired companies, products or services into our overall business in a timely manner could harm our financial results, business and prospects.
To pursue our strategy successfully, we have to identify candidates for and successfully complete business combination and investment transactions, some of which may be large or complex, and manage post-closing issues such as the integration of acquired businesses, products, services or employees. Integrations involve significant challenges and are often time-consuming and expensive and, without proper planning and implementation, could significantly disrupt our business and the acquired business. These challenges include successfully combining product and service offerings; entering or expanding into markets; retaining key employees; integrating employees, facilities, technology, products, processes, operations (including supply and manufacturing operations), sales and distribution channels, business models and business systems; and retaining customers and distributors.
We may not achieve some or all of the expected benefits of our restructuring plan and our restructuring may adversely affect our business.
We have undertaken and may undertake in the future restructuring plans in order to realign our cost structure due to the changing nature of our business and to achieve operating efficiencies that we expect to reduce costs. For example, we began implementing the 2020 restructuring plan in the fourth quarter of fiscal 2019 and expect to complete the restructuring by the end of fiscal 2022. Implementation of any restructuring plan may be costly and disruptive to our business, and we may not be
18
able to obtain the estimated workforce reductions within the projected timing or at all, or obtain the cost savings and operational improvements that were initially anticipated. We currently plan to invest a portion of the savings from our 2020 restructuring plan across our businesses, including investing to build our digital capabilities. If we are unable to obtain the anticipated cost savings, our ability to make those investments, realize operational improvements and execute our strategy may be negatively impacted. Additionally, as a result of restructuring initiatives, we may experience a loss of continuity, loss of accumulated knowledge and/or inefficiency, loss of key employees and/or other retention issues during transitional periods. Restructuring can require a significant amount of time and focus, which may divert attention from operating and growing our business. If we fail to achieve some or all of the expected benefits of restructuring, it could have a material adverse effect on our competitive position, business, financial condition, results of operations and cash flows. For more information about our 2020 restructuring plan, see Note 3 to our Consolidated Financial Statements in Item 8.
Our financial performance may suffer if we cannot develop, obtain, license or enforce the intellectual property rights on which our businesses depend.
We rely upon patent, copyright, trademark, trade secret and other intellectual property (“IP”) laws in the United States, similar laws in other countries, and agreements with our employees, customers, suppliers and other parties, to establish and maintain IP rights in the products and services we sell, provide or otherwise use in our operations. However, our IP rights could be challenged, invalidated, infringed or circumvented, or such IP rights may not be sufficient to permit us to take advantage of current market trends or to otherwise provide competitive advantages, either of which could result in costly product redesign efforts, discontinuance of certain product offerings or other harm to our competitive position. For example, the enforcement of our IP rights for InkJet printer supplies against infringers may be successfully challenged or our IP rights may be successfully circumvented. In addition, we may choose to not apply for patent protection or may fail to apply for patent protection in a timely fashion. Further, the laws of certain countries do not protect proprietary rights to the same extent as the laws of the United States. Therefore, in certain jurisdictions we may be unable to protect our proprietary technology adequately against unauthorized third-party copying or use, which could adversely affect our ability to sell products or services and our competitive position.
In connection with the Separation, Hewlett-Packard Company allocated to each of Hewlett Packard Enterprise and HP the IP assets relevant to their respective businesses. The terms of the Separation also include cross-licenses and other arrangements to provide for certain ongoing use of IP in the existing operations of both businesses. As a result of the allocation of IP as part of the Separation, we no longer own IP allocated to Hewlett Packard Enterprise and our resulting IP ownership position could adversely affect our position and options relating to patent and trademark enforcement, patent licensing and cross-licensing, our ability to sell our products or services, our competitive position in the industry and our ability to enter new product markets.
Our products and services depend in part on IP and technology licensed from third parties.
Certain of our businesses and products rely on key technologies developed or licensed by third parties. We may not be able to obtain or continue to obtain licenses and technologies from these third parties at all or on reasonable terms, or such third parties may demand cross-licenses to our IP. Third-party components may become obsolete, defective or incompatible with future versions of our products, our relationship with the third party may deteriorate, or our agreements may expire or be terminated. We may face legal or business disputes with licensors that may threaten or lead to the disruption of inbound licensing relationships. In order to remain in compliance with the terms of our licenses, we must monitor and manage our use of third-party components, including both proprietary and open source license terms that may require the licensing or public disclosure of our IP without compensation or on undesirable terms. Additionally, some of these licenses may not be available to us in the future on terms that are acceptable or that allow our product offerings to remain competitive. Our inability to obtain licenses or rights on favorable terms could have a material effect on our business, including our financial condition, cash flows and results of operations. In addition, it is possible that as a consequence of a merger or acquisition, third parties may obtain licenses to some of our IP rights or our business may be subject to certain restrictions that were not in place prior to such transaction. Because the availability and cost of licenses from third parties depends upon the willingness of third parties to deal with us on the terms we request, there is a risk that third parties who license to our competitors will either refuse to license to us or refuse to license to us on terms equally favorable to those granted to our competitors. Consequently, we may lose a competitive advantage with respect to these IP rights or we may be required to enter into costly arrangements in order to terminate or limit these rights. Finally, we may rely on third parties to enforce certain IP rights.
Third-party claims of IP infringement are commonplace in our industry and may limit or disrupt our ability to sell our products and services.
Third parties have in the past claimed, and may in the future claim, that we or customers indemnified by us are infringing upon their IP rights. For example, patent assertion entities may purchase IP assets for the purpose of asserting claims of infringement and attempting to extract settlements and we have seen trends towards assertions of patents originally assigned to operating companies with significant R&D investments and patents asserted against standards-based technology. If we cannot or do not license allegedly infringed IP at all or on reasonable terms, or if we are required to substitute technology from another source, our operations could be adversely affected. Even if we believe that IP claims are without merit, they can be
19
time-consuming and costly to defend against and may divert management’s attention and resources away from our business. Claims of IP infringement also might require us to redesign affected products, enter into costly settlements or license agreements, pay damage awards, or face a temporary or permanent injunction prohibiting us from importing, marketing or selling certain products. Even if we have an agreement to indemnify us against such costs, the indemnifying party may be unable or unwilling to fulfill its contractual obligations to us. Additionally, claims of IP infringement may adversely impact our brand and reputation and imperil new and existing customer relationships.
Our results of operations and cash flows have been and could continue to be affected by the imposition, accrual and payment of copyright levies or similar fees. In certain countries (primarily in Europe), proceedings are ongoing or have been concluded in which groups representing copyright owners seek to impose upon and collect from us levies upon IT equipment (such as PCs and printers) alleged to be copying devices under applicable laws. Other groups have also sought to modify existing levy schemes to increase the amount of the levies that can be collected from us. Some European countries are expected to implement legislation to introduce or extend existing levy schemes to digital devices. The total amount of the copyright levies will depend on the types of products determined to be subject to the levy, the number of units of those products sold during the period covered by the levy, and the per unit fee for each type of product, all of which are affected by several factors, including the outcome of ongoing litigation involving us and other industry participants and possible action by legislative bodies, and could be substantial. Consequently, the ultimate impact of these copyright levies or similar fees, and our ability to recover such amounts through increased prices, remains uncertain.
System security risks, data protection breaches, cyberattacks, system outages and systems integration issues could disrupt our internal operations or services provided to customers, and could reduce our revenue, increase our expenses, damage our reputation and adversely affect our cash flows and stock price.
We are exposed to attacks from individuals and organizations, including malicious computer programmers and hackers, state-sponsored organizations, nation-states or other bad actors, seeking to penetrate our network security and misappropriate or compromise our confidential information or that of third parties, create system disruptions or cause shutdowns. Such attacks may involve the deployment of viruses, worms, ransomware and other malicious software programs that attack our products or otherwise exploit security vulnerabilities, or attempt to fraudulently induce our employees, customers, or others to disclose passwords, other sensitive information or provide access to our systems or data. In addition, sophisticated hardware and operating system software and applications that we produce or procure from third parties may contain defects or vulnerabilities in design or manufacture, including “bugs” that could unexpectedly interfere with the operation of the product. Breaches of our facilities, network, or data security could disrupt the security of our systems and business applications, impair our ability to provide services to our customers and protect the privacy of their data, result in product development delays, compromise confidential or technical business information, harm our reputation or competitive position, result in theft or misuse of our IP or other assets, require us to allocate more resources to improve technologies, or otherwise adversely affect our business. Additionally, the costs to combat cyber or other security threats can be significant, and our efforts to address these problems may not be successful and could result in interruptions, delays, cessation of service and loss of existing or potential customers that may impede our sales, manufacturing, distribution or other critical functions. Media or other reports of perceived security vulnerabilities in our network security, regardless of their immediacy or accuracy, could adversely impact our brand and reputation and materially affect our business. While we have developed and implemented security measures and internal controls designed to protect against cyber and other security threats, such measures cannot provide absolute security and may not be successful in preventing future security breaches. Moreover, these threats are constantly evolving, thereby making it more difficult to successfully defend against them or to implement adequate preventative measures. We may not have the current capability to detect certain vulnerabilities, which may allow those vulnerabilities to persist in our systems over long periods of time. In the past, we have experienced data security incidents resulting from unauthorized access to or use of our systems or those of third parties, which to date, have not had a material impact on our operations; however, there is no assurance that such impact will not be material in the future. As a result of the COVID-19 pandemic, remote work and remote access to our systems has increased significantly, which also increases our cybersecurity attack surface. We have also seen an increase in cyberattack volume, frequency, and sophistication driven by the global enablement of remote workforces. Our products and services are potentially vulnerable to additional known or unknown threats.
Because we process proprietary information and sensitive or confidential data relating to our business and our customers, breaches of our security measures or accidental loss, inadvertent disclosure or unapproved dissemination of such data can expose us, our customers, or the individuals affected to a risk of loss, alteration or misuse of such information. A breach could also damage our brand and reputation or otherwise harm our business, and could result in government enforcement actions, litigation and potential liability for us. For example, the European Union’s General Data Protection Regulation (“GDPR”) imposes a data protection compliance regime with severe penalties and China has recently adopted new privacy and security laws. In the United States, California has adopted, and several other states are now considering adopting, laws and regulations imposing varying obligations regarding the handling of personal data, which could result in increased compliance costs. Additionally, we could lose existing or potential customers or incur significant expenses in connection with our customers’ system failures or any actual or perceived security vulnerabilities in our products and services. In addition, the cost and operational consequences of implementing new data protection measures could be significant.
20
Portions of our IT infrastructure, including those provided by third parties, may experience interruptions, outages, delays or cessations of service or may produce errors in connection with systems integrations, migration work or other causes, which could result in business disruptions and the process of remediating them could be more expensive, time-consuming, disruptive and resource intensive than planned. Such disruptions could adversely impact our ability to fulfill orders and respond to customer requests and interrupt other processes. Delayed sales, lower margins or lost customers resulting from these disruptions could reduce our revenue, increase our expenses, damage our reputation and adversely affect our cash flows and stock price.
Our business and financial performance could suffer if we do not manage the risks associated with our services businesses properly.
The risks that accompany our services businesses differ from those of our other businesses. For example, the success of our services business (such as our managed print services, digital services and other workforce solutions in both Printing and Personal Systems) depends to a significant degree on attracting, retaining, and maintaining or increasing the level of revenues from our customers. Our standard services agreements are generally renewable at a customer’s option and/or subject to cancellation rights, with or without penalties for early termination. We may not be able to retain or renew services contracts with our customers, or our customers may reduce the scope of the services they contract for. Factors that may influence contract termination, non-renewal or reduction include business downturns, dissatisfaction with our services or products, our retirement or lack of support for our services, our customers selecting alternative technologies, the cost of our services as compared to our competitors, general market conditions, or other reasons. We may not be able to replace the revenue and earnings from lost customers or reductions in services. While our services agreements may include penalties for early termination, these penalties may not fully cover our investments in these businesses. Our customers could also delay or terminate implementations or use of our services or choose not to invest in additional services from us in the future. In addition, the pricing and other terms of certain services agreements require us to make estimates and assumptions at the time we enter into these contracts that could differ from actual results. Any increased or unexpected costs or unanticipated delays in connection with the performance of these contracts, which may increase as services become more customized, could make these agreements less profitable or unprofitable, which could have an adverse effect on the product margin of our services business. As a result, we may not generate the revenues, profits or cash flows we may have anticipated from our services business within the expected timelines, if at all.
In order to be successful, we must attract, retain, train, motivate, develop and transition key employees, and failure to do so could seriously harm us.
In order to be successful, we must attract, hire, retain, train, motivate, develop, and deploy qualified executives, engineers, technical staff and other key employees. Identifying, developing internally or hiring externally, training and retaining qualified executives, engineers and qualified sales representatives are critical to our future, and competition for experienced employees in the technology industry can be intense. In order to attract and retain executives and key employees, we must provide competitive compensation, including cash- and equity-based compensation. Our equity-based incentive awards may contain conditions relating to our stock price performance and our long-term financial performance that make the future value of those awards uncertain. If we reduce, modify or eliminate our equity programs or fail to grant equity competitively or equitably or if the anticipated value of equity-based incentive awards do not materialize or equity-based compensation otherwise ceases to be viewed as a valuable benefit, we may have difficulty attracting and retaining top talent. There may also be a risk that we will be unable to achieve our diversity, equity and inclusion objectives, which could adversely impact our workplace culture and our ability to hire and retain talent, as well damage our reputation with stockholders, customers and other stakeholders. Additionally, changes in immigration policies may impair our ability to recruit and hire technical and professional talent globally. A failure to successfully hire or retain top talent could have a significant impact on our business continuity and operations. Further, changes in our management team may be disruptive to our business, and any failure to successfully transition and assimilate key new hires or promoted employees could adversely affect our business and results of operations. Moreover, as social and economic conditions evolve due to the COVID-19 pandemic, current and prospective employees may seek new or different opportunities based on factors such as benefits, mobility and flexibility that are different from what we offer, making it difficult to attract and retain talent.
Some anti-takeover provisions contained in our certificate of incorporation and bylaws, as well as provisions of Delaware law, could impair a takeover attempt.
Certain provisions in our certificate of incorporation and bylaws and the Delaware General Corporation Law may discourage, delay or prevent changes of control of HP judged as undesirable by our Board of Directors. These provisions include: authorizing blank check preferred stock, which we could issue with voting, liquidation, dividend and other rights superior to our common stock; limiting the liability of, and providing indemnification to, our directors and officers; specifying that our stockholders may take action only at a duly called annual or special meeting of stockholders and otherwise in accordance with our bylaws and limiting the ability of our stockholders to call special meetings; requiring advance notice of proposals by our stockholders for business to be conducted at stockholder meetings and for nominations of candidates for
21
election to our Board of Directors; and controlling the procedures for our Board of Directors and stockholder meetings, and election, appointment and removal of our directors.
These provisions could deter or delay hostile takeovers, proxy contests and changes in control or our management or limit the opportunity for our stockholders to receive a premium for their shares of our stock.
MACROECONOMIC, INDUSTRY AND FINANCIAL RISKS
Global, regional and local economic weakness and uncertainty could adversely affect our business and financial performance.
Our business and financial performance depend on worldwide economic conditions and the demand for technology products and services in the markets in which we compete. Ongoing economic weakness, uncertainty in markets throughout the world and other adverse economic conditions, including inflation, have resulted, and may result in the future, in decreased net revenue, gross margin, earnings, growth rates or cash flows and in increased expenses and difficulty in managing inventory levels and accurately forecasting revenue, gross margin, cash flows and expenses. Ongoing U.S. federal government spending limits may continue to reduce demand for our products and services from organizations that receive funding from the U.S. government, and could negatively affect macroeconomic conditions in the United States, which could further reduce demand for our products and services. Political developments impacting international trade, trade disputes and increased tariffs, particularly between the United States and China, may negatively impact markets and cause weaker macroeconomic conditions or drive political or national sentiment, weakening demand for our products and services.
Prolonged or more severe economic weakness and uncertainty could also cause our expenses to vary materially from our expectations. Any financial turmoil affecting the banking system and financial markets or any significant financial services institution failures could negatively impact our treasury operations, as the financial condition of such parties may deteriorate rapidly and without notice. Poor financial performance of asset markets combined with lower interest rates and the adverse effects of fluctuating currency exchange rates could lead to higher pension and post-retirement benefit expenses. Interest and other expenses could vary materially from expectations depending on changes in interest rates, borrowing costs, currency exchange rates, costs of hedging activities and the fair value of derivative instruments. There is uncertainty regarding the timing of the discontinuation, modification or reform of LIBOR and other interest rate benchmarks and the implementation of alternative reference rates, including the secured overnight financing rate or SOFR. Any such discontinuation, modification or reform could result in an increase in our interest expense or make our interest expense more volatile. Economic downturns also may lead to future restructuring actions and associated expenses.
Due to the international nature of our business, political or economic changes, uncertainty or other factors could harm our business and financial performance.
Approximately 65% of our net revenue for fiscal year 2021 came from outside the United States. In addition, a portion of our business activity is being conducted in emerging markets. Our future business and financial performance could suffer due to a variety of international factors, including:
•ongoing instability or changes in a country’s or region’s economic, regulatory or political conditions, including inflation, recession, interest rate fluctuations, changes or uncertainty in fiscal or monetary policy, actual or anticipated military or political conflicts, health emergencies or pandemics (such as the COVID-19 pandemic) or Brexit and its impact;
•longer collection cycles and financial instability among customers;
•the imposition by governments of additional taxes, tariffs or other restrictions on foreign trade or changes in restrictions on trade between the United States and other countries, including China;
•trade and other policies, laws and regulations affecting production, shipping, pricing and marketing of products, including policies adopted by the United States or other countries that may champion or otherwise favor domestic companies and technologies over foreign competitors or other country localization requirements;
•political or nationalist sentiment impacting global trade, including the willingness of non-U.S. consumers to purchase goods or services from U.S. corporations;
•managing a geographically dispersed workforce and local labor conditions and regulations, including labor issues faced by specific suppliers and Original Equipment Manufacturers (“OEMs”), or changes to immigration and labor law which may adversely impact our access to technical and professional talent;
•changes or uncertainty in the international, national or local regulatory and legal environments, including tax laws and antitrust laws;
•differing technology standards, customer requirements or levels of protection of intellectual property;
•import, export or other business licensing requirements or requirements relating to making foreign direct investments, which could increase our cost of doing business in certain jurisdictions, prevent us from shipping products to particular
22
countries or markets, affect our ability to obtain favorable terms for components, increase our operating costs or lead to penalties or restrictions;
•stringent privacy and data protection policies, such as the GDPR;
•compliance with the U.S. Foreign Corrupt Practices Act, U.S. export control and trade sanction laws, and similar anti-corruption and international trade laws, and adverse consequences, such as fines or other penalties, for any failure to comply; and
•fluctuations in freight costs, limitations on shipping and receiving capacity, and other disruptions in the transportation and shipping infrastructure at important geographic points for our products and shipments.
The factors described above also could disrupt our product and component manufacturing and key suppliers located outside of the United States and our supply chain. For example, we rely on manufacturers in Taiwan for the production of notebook computers and other suppliers in Asia for product assembly and manufacture.
We are exposed to fluctuations in foreign currency exchange rates, which could adversely impact our results.
Currencies other than the U.S. dollar, including the euro, the British pound, Chinese yuan (renminbi) and the Japanese yen, can have an impact on our results as expressed in U.S. dollars. Global economic events, including trade disputes, economic sanctions and emerging market volatility, and the resulting uncertainty, may cause currencies to fluctuate, which may contribute to variations in sales of our products and services in impacted jurisdictions. Because a majority of our revenues are generated outside the United States, fluctuations in foreign currency exchange rates could adversely affect our net revenue growth in future periods. In addition, currency variations can adversely affect margins on sales of our products in countries outside of the United States and products that include components obtained from suppliers located outside of the United States. From time to time, we may use forward contracts and/or options designated as cash flow hedges to protect against foreign currency exchange rate risks. Our hedging strategies may be ineffective or may not offset any or more than a portion of the adverse financial impact resulting from currency variations. Losses associated with hedging activities also may impact our revenue, financial condition, cash flows and, to a lesser extent, our cost of sales.
Business disruptions could seriously harm our future revenue, cash flows and financial condition and increase our costs and expenses.
Our worldwide operations could be disrupted by earthquakes, telecommunications failures, manufacturing equipment failures, cybersecurity incidents, power or water shortages, natural disasters, fires, extreme weather conditions (whether as a result of climate change or otherwise) such as those described in “Climate change may have a long-term impact on our business” below, medical epidemics or pandemics (such as COVID-19) and other natural or man-made disasters or catastrophic events, for which we are predominantly self-insured. Terrorist acts, conflicts or wars, for which we are predominantly uninsured, may also disrupt our worldwide operations. The occurrence of any of these business disruptions could result in significant losses, seriously harm our revenue, profitability, cash flows and financial condition, adversely affect our competitive position, increase our costs and expenses, require substantial expenditures and recovery time in order to fully resume operations, make it difficult or impossible to provide services or deliver products to our customers or to receive components from our suppliers, create delays and inefficiencies in our supply chain and/or result in the need to impose employee travel restrictions. Our corporate headquarters and a portion of our research and development activities are located in California, and other critical business operations and some of our suppliers are located in California and Asia, near major earthquake faults known for seismic activity. The manufacture of product components, the final assembly of our products and other critical operations are concentrated in certain geographic locations that may be vulnerable to such natural disasters. We also rely on major logistics hubs primarily in Asia to manufacture and distribute our products, and primarily in the southwestern United States to import products into North and South America. Our operations and those of our significant suppliers and distributors could be adversely affected if manufacturing, logistics, or other operations in these locations are disrupted for any reason, such as those described above or other economic, business, labor, environmental, public health, regulatory or political reasons. The ultimate impact on us, our significant suppliers, our distributors and our general infrastructure, which may be located near areas more vulnerable to the occurrence of the aforementioned business disruptions and which is consolidated in certain geographical areas, is unknown and remains uncertain. Even if our operations are unaffected or recover quickly, if our customers cannot timely resume their own operations due to a catastrophic event, they may reduce or cancel their orders, or these events could otherwise result in a decrease in demand for our products, which may adversely affect our financial performance.
Climate change may have a long-term impact on our business.
There are inherent climate-related risks wherever our business is conducted. Changes in market dynamics, stakeholder expectations, local, national and international climate change policies, and the frequency and intensity of extreme weather events on critical infrastructure in the United States and abroad, all have the potential to disrupt our business and operations. Such events could result in a significant increase in our costs and expenses and harm our future revenue, cash flows and financial performance. Global climate change is resulting, and may continue to result, in certain natural disasters and adverse weather, such as drought, wildfires, storms, sea-level rise, and flooding, occurring more frequently or with greater intensity, which could cause business disruptions and impact employees’ abilities to commute or to work from home effectively. For example, the increasing intensity of droughts, wildfires or extreme weather conditions at our office locations increase the
23
probability of planned power outages. Government failure to address climate change in line with the Paris Agreement could result in greater exposure to economic and other risks from climate change and impact our ability to achieve our climate goals. In addition, failure or perception of failure to achieve our goals (including as a result of governmental inaction) with respect to reducing our impact on the environment or perception of a failure to act responsibly with respect to the environment or to effectively respond to regulatory requirements concerning climate change could lead to adverse publicity, resulting in an adverse effect on our business or damage to our reputation.
Failure to maintain our credit ratings could adversely affect our liquidity, capital position, borrowing costs and access to capital markets.
Our credit risk is evaluated by the major independent rating agencies. Past downgrades of Hewlett-Packard Company’s ratings increased the cost of borrowing under our credit facilities and reduced market capacity for our commercial paper. Future downgrades could have the same effect, and could also require the posting of additional collateral under some of our derivative contracts. We cannot be assured that we will be able to maintain our current credit ratings, and any additional actual or anticipated changes or downgrades in our credit ratings, including any announcement that our ratings are under further review for a downgrade, may impact us in a similar manner and may have a negative impact on our liquidity, capital position and access to capital markets.
Our debt obligations could adversely affect our business and financial condition.
In addition to our current total debt, we may also incur additional indebtedness in the future. Our debt level and related debt service obligations could have the effect, among other things, of reducing our flexibility to respond to changing business and economic conditions, and reducing funds available for working capital, capital expenditures, dividend repayments, acquisitions, and other general corporate purposes. Our indebtedness increases our vulnerability to general adverse economic and industry conditions. We may also be required to raise additional financing for working capital, capital expenditures, debt service obligations, debt refinancing, future acquisitions or for other general corporate purposes, which will depend on, among other factors, our financial position and performance, as well as prevailing market conditions and other factors beyond our control, and could be adversely impacted by our debt level. Consequently, we may not be able to obtain additional financing or refinancing on terms acceptable to us, or at all, which could adversely impact our ability to service our outstanding indebtedness or to repay our outstanding indebtedness as it becomes due and could adversely impact our business and financial condition.
We cannot guarantee that our share repurchase program will be fully consummated or that it will enhance long-term stockholder value.
We have adopted a share repurchase program under which we are authorized to repurchase our common stock. The repurchase program does not have an expiration date and we are not obligated to repurchase a specified number or dollar value of shares under our share repurchase program. Our repurchase program may be suspended or terminated at any time. Even if our share repurchase program is fully implemented, it may not enhance long-term stockholder value. Also, the amount, timing, and execution of our share repurchase program may fluctuate based on our priorities for the use of cash for other purposes and because of changes in cash flows, tax laws, and the market price of our common stock.
We make estimates and assumptions in connection with the preparation of our Consolidated Financial Statements, and any changes to those estimates and assumptions could adversely affect our results of operations.
In connection with the preparation of our Consolidated Financial Statements, we use certain estimates and assumptions based on historical experience and other factors. Our most critical accounting estimates are described in the section entitled “Management’s Discussion and Analysis of Financial Condition and Results of Operations” in Item 7 of this report. For example, we make significant estimates and assumptions when accounting for revenue recognition, taxes on earnings and restructuring and other charges. In addition, as discussed in Note 14 to the Consolidated Financial Statements, we make certain estimates, including decisions related to provisions for legal proceedings and other contingencies. We also estimate sales and marketing program incentives based on a number of factors including historical experience, expected customer behavior and market conditions. These estimates and assumptions are subject to significant uncertainties, some of which are beyond our control. Should any of these estimates and assumptions change or prove to have been incorrect, it could adversely affect our results of operations and financial condition.
LEGAL AND REGULATORY RISKS
Our business is subject to various federal, state, local and foreign laws and regulations that could result in costs or other sanctions that adversely affect our business and results of operations and cash flows.
We are subject to various federal, state, local and foreign laws and regulations. There can be no assurance that such laws and regulations will not be changed in ways that will require us to modify our business models and objectives or affect our returns on investments by restricting existing activities and products, subjecting them to escalating costs or increased restrictions or prohibiting them outright. In particular, we face increasing complexity in our product design and procurement operations as we adjust to new and future requirements relating to the chemical and materials composition of our products, their safe use, the energy consumption associated with those products, climate change laws and regulations, and product repairability, reuse and take-back legislation. In addition, there are existing and proposed legislation related to environmental
24
and social responsibility for our operations, supply chain partners, and our products and services. Noncompliance with these laws and regulations could result in substantial costs or other penalties, which may include restrictions on our products entering certain jurisdictions. We could also face significant compliance and operational burdens and incur significant costs in our efforts to comply with or rectify non-compliance with these laws or regulations, such as privacy regulations. In addition, these laws or regulations could result in loss of market access or limit offerings in those markets. Such burdens or costs may result in an adverse effect on our financial condition and results of operations. Our potential exposure includes fines and civil or criminal sanctions, third-party property damage, personal injury claims and clean-up costs. Further, liability under some environmental laws relating to contaminated sites can be imposed retroactively, on a joint and several basis, and without any finding of noncompliance or fault. The amount and timing of costs to comply with environmental laws are difficult to predict. Moreover, we are expected to become increasingly subject to laws, regulations and international treaties relating to climate change, such as carbon pricing or product energy efficiency requirements. As these new laws, regulations, treaties and similar initiatives and programs are adopted and implemented, we will be required to comply or potentially face market access limitations or other sanctions, including fines.
We are subject to risks associated with litigation and regulatory proceedings.
We face legal claims or regulatory matters involving stockholder, consumer, competition, commercial, IP, employment, and other issues on a global basis. There is an increasingly active litigation and regulatory environment, including but not limited to employment and patent-monetization claims in the United States and litigation and regulatory matters focused on consumer protection, privacy, and competition regulation globally. As described in Note 14, “Litigation and Contingencies” to the Consolidated Financial Statements in Item 8, we are engaged in a number of litigation and regulatory matters that may have a material adverse impact on our business, financial condition, cash flows or results of operations, if decided adversely to or settled by us. Litigation and regulatory proceedings are inherently uncertain, and adverse rulings have occurred and may occur, including awards of monetary damages, imposition of fines, issuance of injunctions or cease-and-desist orders directing us to cease engaging in certain business practices, cease manufacturing or selling certain products, requiring the compulsory licensing of patents, or requiring other remedies. An unfavorable outcome may result in a material adverse impact on our business, financial condition, cash flows or results of operations. In addition, regardless of the outcome, litigation and regulatory proceedings can be costly, time-consuming, disruptive to our operations, and distracting to management.
Failure to comply with our customer and partner contracts or government contracting regulations could adversely affect our business and financial performance.
Our contracts with our customers may include unique and specialized performance requirements. In particular, our contracts with federal, state, provincial and local governmental customers are subject to procurement regulations, contract provisions and other specific requirements relating to their formation, administration and performance. Any failure by us to comply with the specific provisions in our customer contracts or any violation of government contracting regulations could result in the imposition of civil and criminal penalties, which may include termination of contracts, forfeiture of profits, suspension of payments and, in the case of our government contracts, fines and suspension from future government contracting. Such failures could also cause reputational damage to our business and affect our ability to compete for new contracts. Additionally, some of our agreements with governmental customers may be subject to periodic funding approval. Funding reductions or delays could adversely impact public sector demand for our products and services. If our customer contracts are terminated, if we are suspended or disbarred from government work, or if our ability to compete for new contracts is adversely affected, our financial performance could suffer. Our partner contracts also contain terms relating to new partner business models and tools creation that could raise issues for which laws or regulations are currently changing or emerging. This could affect us in ways that are not currently fully known or measurable.
Changes in our tax provisions, adverse tax audits, the adoption of new tax legislation, or exposure to additional tax liabilities could have a material impact on our financial performance.
We are subject to income and other taxes in the United States and approximately 60 other countries, and we are subject to routine corporate income tax audits in many of these jurisdictions. We believe that the positions taken on our tax returns are fully supported, but tax authorities may challenge these positions, and our positions may not be fully sustained on examination by the relevant tax authorities. We regularly assess the likely outcomes of these audits in order to determine the appropriateness of our tax provision, and, we believe we have provided adequate reserves for all tax deficiencies or reductions in tax benefits that could reasonably result from an audit. Our accrual for uncertain tax positions is attributable primarily to uncertainties concerning the tax treatment of our domestic operations, including the allocation of income among different jurisdictions, intercompany transactions, pension and related interest. We adjust our uncertain tax positions to reflect the impact of negotiations, settlements, rulings, advice of legal counsel, and other information and events pertaining to a particular audit. Determining the appropriate provision for potential deficiencies or reductions in in tax benefits that could reasonably result from an audit requires management judgments and estimates, and income tax audits are inherently unpredictable. We may not accurately predict the outcomes of these audits, and the amounts ultimately paid upon resolution of audits could be materially different from the amounts previously included in our income tax provision and, therefore, could have a material impact on our income tax provision, net income and cash flows.
25
Our effective tax rate in the future could be adversely affected by changes to our operating structure, changes in the mix of earnings in countries with differing statutory tax rates, changes in the valuation of deferred tax assets and liabilities, or changes in tax laws or in their interpretation or enforcement. In addition, changes in tax law and regulation in the U.S. or elsewhere could significantly impact our tax rate, the carrying value of deferred tax assets, or our deferred tax liabilities. For example, the U.S. Congress has advanced a variety of tax legislation proposals, and while the final form of any legislation is uncertain, the current proposals, if enacted, could have a material effect on the Company’s effective tax rate. Our effective tax rate could also be materially affected by the Organization for Economic Co-operation and Development’s, the European Commission’s and other certain major jurisdictions’ heightened interest in and taxation of large multi-national companies.
RISKS RELATED TO THE SEPARATION
We or Hewlett Packard Enterprise may fail to perform under the transaction agreements executed as part of the Separation.
In connection with the Separation, we and Hewlett Packard Enterprise entered a separation and distribution agreement and various other agreements. The separation and distribution agreement provides for cross-indemnities between HP and Hewlett Packard Enterprise for liabilities allocated to the respective party pursuant to the terms of such agreement. If Hewlett Packard Enterprise or its successor entities (including spun off businesses to which obligations have been transferred) are unable to satisfy their obligations under these agreements, we could incur operational difficulties or losses that could have a material adverse effect on our business, financial condition, cash flows and results of operations.
26
ITEM 1B. Unresolved Staff Comments.
None.
ITEM 2. Properties.
As of October 31, 2021, we owned or leased approximately 18.0 million square feet of space worldwide, a summary of which is provided below.
| Fiscal year ended October 31, 2021 | |||||||||||||||||
| Owned | Leased | Total | |||||||||||||||
| (square feet in millions) | |||||||||||||||||
| Administration and support | 2.0 | 6.3 | 8.3 | ||||||||||||||
| (Percentage) | 24 | % | 76 | % | 100 | % | |||||||||||
| Core data centers, manufacturing plants, research and development facilities and warehouse operations | 2.3 | 5.8 | 8.1 | ||||||||||||||
| (Percentage) | 28 | % | 72 | % | 100 | % | |||||||||||
Total(1) | 4.3 | 12.1 | 16.4 | ||||||||||||||
| (Percentage) | 26 | % | 74 | % | 100 | % | |||||||||||
(1)Excludes 1.6 million square feet of vacated space, of which 1.3 million square feet is leased to third parties.
We believe that our existing properties are in good condition and are suitable for the conduct of our business. Each of our segments Personal Systems, Printing and Corporate Investments uses each of the properties at least in part, and we retain the flexibility to use each of the properties in whole or in part for each of the segments.
Principal Executive Offices
Our principal executive offices, including our global headquarters, which we lease, are located at 1501 Page Mill Road, Palo Alto, California, United States.
Headquarters of Geographic Operations
The locations of our geographic headquarters are as follows:
| Americas | Europe, Middle East, Africa | Asia Pacific | ||||||||||||
| Palo Alto, United States | Geneva, Switzerland | Singapore | ||||||||||||
Product Development and Manufacturing
The locations of our major product development, manufacturing, data centers and HP Labs facilities are as follows:
Americas United States—Corvallis, San Diego, Boise, Vancouver, Spring, Fort Collins, Fountain Valley, Aguadilla, Puerto Rico | Europe, Middle East, Africa Israel—Kiryat-Gat, Rehovot, Netanya Spain—Barcelona | |||||||
Asia Pacific China—Weihai, Chongqing, Shanghai India—Bangalore Malaysia—Penang Singapore—Singapore South Korea—Suwon Taiwan—Taipei | Technology office (HP Labs) United Kingdom—Bristol United States—Palo Alto United States—Corvallis | |||||||
ITEM 3. Legal Proceedings.
Information with respect to this item may be found in Note 14, “Litigation and Contingencies” to the Consolidated Financial Statements in Item 8, which is incorporated herein by reference.
27
ITEM 4. Mine Safety Disclosures.
Not applicable.
28
PART II
ITEM 5. Market for Registrant’s Common Equity, Related Stockholder Matters and Issuer Purchases of Equity Securities.
Our common stock is traded on the New York Stock Exchange under the symbol HPQ.
For information about dividends, see “Consolidated Statements of Stockholders’ Deficit” to the Consolidated Financial Statements in Item 8, which is incorporated herein by reference.
As of November 30, 2021, there were approximately 53,907 stockholders of record.
Recent Sales of Unregistered Securities
There were no unregistered sales of equity securities in fiscal year 2021.
Issuer Purchases of Equity Securities
| Total Number of Shares Purchased | Average Price Paid per Share | Total Number of Shares Purchased as Part of Publicly Announced Plans or Programs | Approximate Dollar Value of Shares that May Yet Be Purchased under the Plans or Programs | |||||||||||||||||
| In thousands, except per share amounts | ||||||||||||||||||||
| Period | ||||||||||||||||||||
| August 2021 | 17,388 | $ | 29.08 | 17,388 | $ | 7,680,048 | ||||||||||||||
| September 2021 | 25,960 | $ | 28.68 | 25,960 | $ | 6,935,480 | ||||||||||||||
| October 2021 | 17,667 | $ | 28.47 | 17,667 | $ | 6,432,546 | ||||||||||||||
| Total | 61,015 | 61,015 | ||||||||||||||||||
The Company’s share repurchase program, which does not have a specific expiration date, authorizes repurchases in the open market or in private transactions. On February 22, 2020, HP’s Board of Directors increased HP’s remaining share repurchase authorization to $15.0 billion in total. HP intends to repurchase shares opportunistically as part of a robust share repurchase program. HP intends to continue repurchase of shares at an elevated level of at least $4.0 billion in fiscal year 2022. All share repurchases settled in the fourth quarter of fiscal year 2021 were open market transactions. As of October 31, 2021, HP had approximately $6.4 billion remaining under the share repurchase authorizations.
Stock Performance Graph and Cumulative Total Return
The graph below shows the cumulative total stockholder return assuming the investment of $100 at the market close on October 31, 2016 (and the reinvestment of dividends thereafter) in each of HP common stock, the S&P 500 Index, and the S&P
29
Information Technology Index. The comparisons in the graph below are based on historical data and are not indicative of, or intended to forecast, future performance of our common stock.
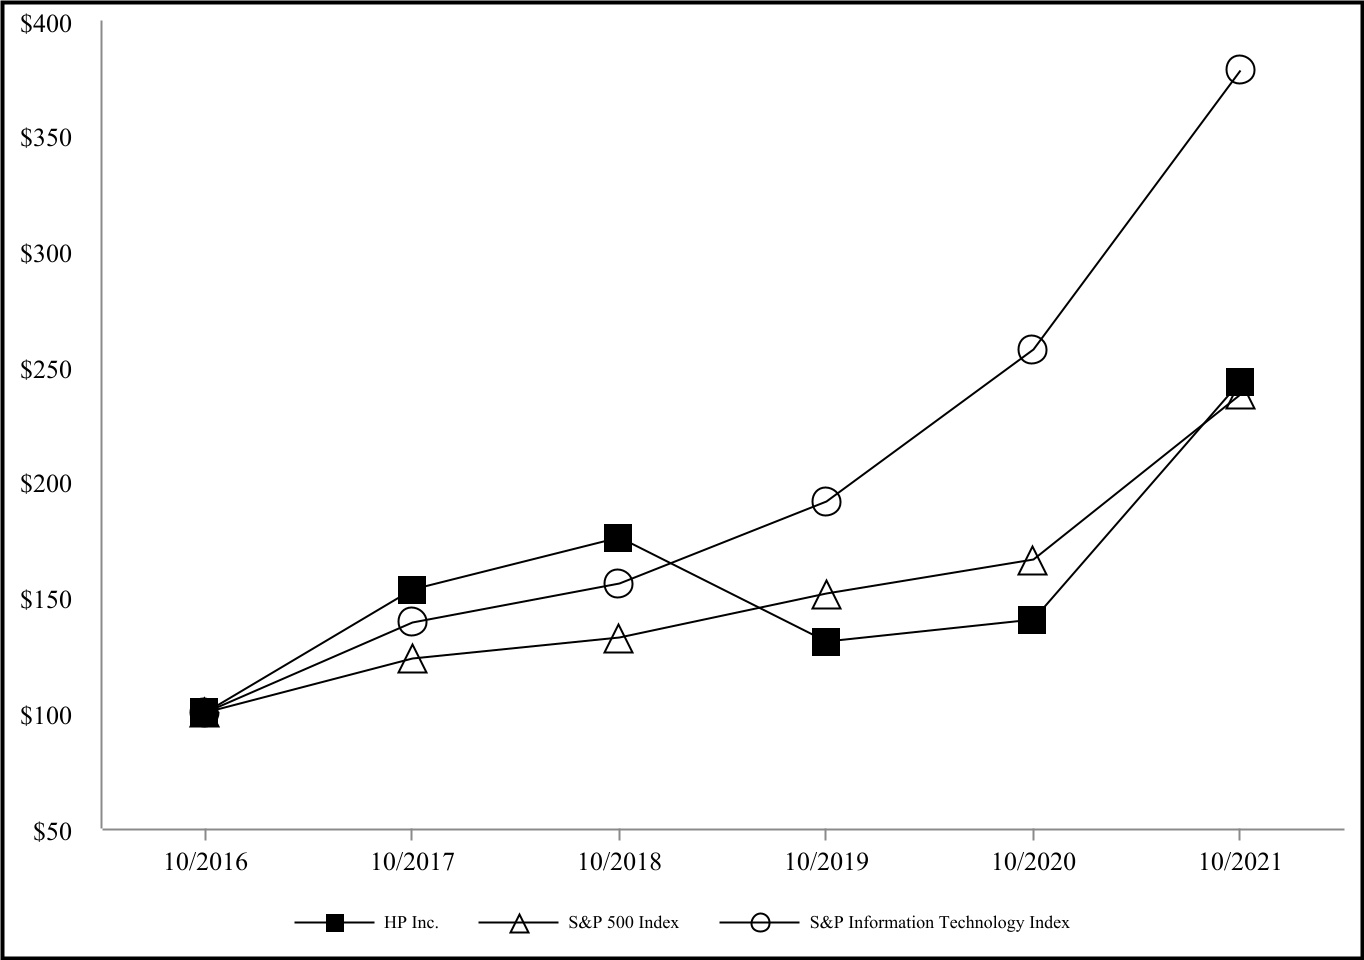
| 10/16 | 10/17 | 10/18 | 10/19 | 10/20 | 10/21 | |||||||||||||||||||||||||||||||||
| HP Inc. | $ | 100.00 | $ | 153.29 | $ | 175.88 | $ | 130.66 | $ | 140.13 | $ | 243.29 | ||||||||||||||||||||||||||
| S&P 500 Index | $ | 100.00 | $ | 123.62 | $ | 132.69 | $ | 151.69 | $ | 166.40 | $ | 237.77 | ||||||||||||||||||||||||||
| S&P Information Technology Index | $ | 100.00 | $ | 138.96 | $ | 156.05 | $ | 191.30 | $ | 257.25 | $ | 377.96 | ||||||||||||||||||||||||||
30
ITEM 6. [Reserved].
Data responsive to Item 6 have not been presented in accordance with amendments to Item 301 of Regulation S-K.
31
HP INC. AND SUBSIDIARIES
Management’s Discussion and Analysis of
Financial Condition and Results of Operations
ITEM 7. Management’s Discussion and Analysis of Financial Condition and Results of Operations.
This Management’s Discussion and Analysis of Financial Condition and Results of Operations (“MD&A”) is organized as follows:
•Overview. A discussion of our business and other highlights affecting the company to provide context for the remainder of this MD&A.
•Critical Accounting Policies and Estimates. A discussion of accounting policies and estimates that we believe are important to understanding the assumptions and judgments incorporated in our reported financial results.
•Results of Operations. This section discusses the results of operations for the fiscal year ended October 31, 2021 compared to the fiscal year ended October 31, 2020. A discussion of the results of operations is followed by a more detailed discussion of the results of operations by segment. For a discussion of the fiscal year ended October 31, 2020 compared to the fiscal year ended October 31, 2019, please refer to Part II, Item 7, "Management’s Discussion and Analysis of Financial Condition and Results of Operations" in our Annual Report on Form 10-K for the fiscal year ended October 31, 2020.
•Liquidity and Capital Resources. An analysis of changes in our cash flows and a discussion of our liquidity and financial condition.
•Contractual and Other Obligations. An overview of contractual obligations, retirement and post-retirement benefit plan contributions, cost-saving plans, uncertain tax positions and off-balance sheet arrangements.
The discussion of financial condition and results of our operations that follows provides information that will assist the reader in understanding our Consolidated Financial Statements, the changes in certain key items in those financial statements from year to year, and the primary factors that accounted for those changes, as well as how certain accounting principles, policies and estimates affect our Consolidated Financial Statements. This discussion should be read in conjunction with our Consolidated Financial Statements and the related notes that appear elsewhere in this document.
32
HP INC. AND SUBSIDIARIES
Management’s Discussion and Analysis of
Financial Condition and Results of Operations (Continued)
OVERVIEW
We are a leading global provider of personal computing and other access devices, imaging and printing products, and related technologies, solutions, and services. We sell to individual consumers, SMBs and large enterprises, including customers in the government, health, and education sectors. We have three reportable segments: Personal Systems, Printing and Corporate Investments. The Personal Systems segment offers commercial and consumer desktop and notebook PCs, workstations, thin clients, commercial mobility devices, retail POS systems, displays and peripherals, software, support, and services. The Printing segment provides consumer and commercial printer hardware, supplies, solutions and services. Corporate Investments include HP Labs and certain business incubation and investment projects.
•In Personal Systems, our strategic focus is on profitable growth through innovation and market segmentation. This focus is with respect to enhanced innovation in multi-operating systems, multi-architecture, geography, customer segments and other key attributes. Additionally, we are investing in endpoint services and solutions. We are focused on services, including Device as a Service, as the market begins to shift to contractual solutions, and accelerating in attractive adjacencies such as peripherals. We are driving innovation to enable productivity and collaboration with the PC becoming essential for hybrid work, learn and play. We believe that we are well positioned due to our competitive product lineup along with our recent acquisitions in peripherals and remote-computing solutions.
•In Printing, our strategic focus is on offering contractual solutions to serve consumers, SMBs and large enterprises through our Instant Ink Services, HP+ and Managed Print Services solutions, providing digital printing solutions for graphics segments and applications including commercial publishing, labels, packaging and textiles as well as expanding our footprint in 3D printing across digital manufacturing and strategic applications.
We continue to experience challenges that are representative of trends and uncertainties that may affect our business and results of operations. One set of challenges relates to dynamic market trends that may adversely impact our product mix. A second set of challenges relates to changes in the competitive landscape. Our primary competitors are exerting competitive pressure in targeted areas and are entering new markets, our emerging competitors are introducing new technologies and business models, and our alliance partners in some businesses are increasingly becoming our competitors in others. A third set of challenges relates to business model changes and our go-to-market execution in an evolving distribution and reseller landscape, with increasing online and omnichannel presence. Additional challenges we face at the segment level are set forth below.
•In Personal Systems, we face challenges with industry component availability which we expect to continue to negatively impact our ability to meet demand at least in the short-term, and a competitive environment.
•In Printing, we face challenges from a competitive environment, including non-original supplies (which includes imitation, refill, or remanufactured alternatives), and we face component constraints and other supply chain disruptions particularly in printer hardware which we expect to continue to negatively impact our ability to meet demand at least in the short-term. We also obtain many Printing components from single source due to technology, availability, price, quality or other considerations. For instance, we source the majority of our A4 and a portion of our A3 portfolio of laser printer engines and laser toner cartridges from Canon. Any decision by either party to not renew our agreement with Canon or to limit or reduce the scope of the agreement could adversely affect our net revenue from LaserJet products; however, we have a long-standing business relationship with Canon and anticipate renewal of this agreement.
In fiscal year 2022, we expect to see continued demand for both Personal Systems and Printing. We also anticipate that component shortages, manufacturing disruptions and logistics challenges will continue to impact our revenues and margins.
Our business and financial performance also depend significantly on worldwide economic conditions. Accordingly, we face global macroeconomic challenges, particularly in light of the effects of the COVID-19 pandemic as discussed below, tariff-driven headwinds, uncertainty in the markets, volatility in exchange rates and evolving dynamics in the global trade environment. The full impact of these and other global macroeconomic challenges on our business cannot be known at this time.
To address these challenges, we continue to pursue innovation with a view towards developing new products and services aligned with generating market demand and meeting the needs of our customers and partners. In addition, we continue to work on improving our operations and adapting our business models, with a particular focus on enhancing our end-to-end processes, analytics and efficiencies. We also continue to work on optimizing our sales coverage models, aligning our sales incentives with our strategic goals, improving channel execution and inventory, production and backlog management, strengthening our capabilities in our areas of strategic focus, strengthening our pricing discipline, and developing and capitalizing on market opportunities.
In October 2019, we announced cost-reduction and operational efficiency initiatives intended to simplify the way we work, move closer to our customers and facilitate specific investment in our business. These were further updated in February 2020. These efforts included transforming our operating model to integrate our sales force into a single commercial organization and reducing structural costs across the Company through our restructuring plan approved in September 2019 (the
33
HP INC. AND SUBSIDIARIES
Management’s Discussion and Analysis of
Financial Condition and Results of Operations
“Fiscal 2020 Plan”). We have invested and expect to invest some of the savings from these efforts across our businesses, including investing to build our digital capabilities. Over time, we expect these investments will make us more efficient and allow us to advance our positions in Personal Systems and Printing, while also disrupting new industries where we see attractive medium to long-term growth opportunities. However, the rate at which we are able to invest in our business and the returns that we are able to achieve from these investments will be affected by many factors, including the efforts to address the execution, industry and macroeconomic challenges facing our business as discussed above. As a result, we may experience delays in the anticipated timing of activities related to these efforts, and the anticipated benefits of these efforts may not materialize.
In the second year of our program, we continued to look at new cost savings opportunities and remained ahead of our $1.2 billion gross run rate structural cost reduction plan. In the third quarter of fiscal year 2021, we completed the initial deployment of our SAP S/4 HANA system, one of the largest ERP implementations. Also, as part of our end-to-end business planning and forecasting efforts, we went live with our new cloud-based platform which we believe will improve our forecasting agility as part of our digital transformation. Further, our hybrid work strategy has enabled us to accelerate our location strategy while providing a more flexible workspace. Going forward we are enabling HP’s hybrid work strategy by modernizing our sites to be critical hubs for collaboration and innovation. This will also deliver savings in our real estate portfolio. For more information on our Fiscal 2020 Plan, see Note 3, “Restructuring and Other Charges”, to the Consolidated Financial Statements in Item 8 of Part II of this report, which is incorporated herein by reference.
We typically experience higher net revenues in our fourth quarter compared to other quarters in our fiscal year due in part to seasonal holiday demand. Historical seasonal patterns may not continue in the future and have been impacted by increasing supply constraints, shifts in customer behavior and the evolving impacts of the COVID-19 pandemic.
Our COVID-19 Response
We continue to closely monitor the COVID-19 pandemic, including its resurgence in key markets. We will continue promoting the health, safety, and well-being of workers and their loved ones. In response to the COVID-19 pandemic, we have established a cross-functional COVID-19 program management office that reviews the latest data from our business and site leaders and identifies and addresses emerging risks and issues, and we have put in place global policies and protocols based on guidance from healthcare experts and public health leaders, which we continue to review and update. We balance our company-wide approach by assessing risk and adjusting our response at the site level, taking into consideration each country's or area's COVID-19 case trends and related measures. We have commenced a phased approach to returning our employees onsite, which included modifications to certain of our facilities as we adapt to a hybrid work environment.
The business impact of the COVID-19 pandemic has created new and different demand dynamics in the market. Our Personal Systems business benefited from the remote working and learning environment, including growth in gaming. We saw continued strong demand in Consumer PCs and mix shifts from low end to premium products in Commercial PCs in the second half of fiscal year 2021.We had seen a strong Chromebook demand in first half of the year. In Printing, Consumer print demand remained strong, and Commercial print is expected to continue its gradual improvement as more offices reopen. Also, favorable pricing including historically low promotions and incentives have contributed positively towards average selling prices (“ASPs”) and gross margin in both Personal Systems and Printing. We estimate sales and marketing program incentives based on a number of factors like historical experience, expected customer behavior and market conditions. These estimates have been and may continue to be impacted by lower-than-expected incentives due to increased supply constraints, shifts in customer behavior and the evolving impact of the COVID-19 pandemic. Demand fulfillment has been and is expected to continue to be impacted by industry wide commodity and component constraints primarily integrated circuits and panels, manufacturing disruptions in Asia and logistics challenges globally, at least in short-term.
As the COVID-19 pandemic continues and new variants of the virus emerge, we are seeing a resurgence of the pandemic in key markets. We have and may experience future disruptions in supply, manufacturing and logistics, including in Asia, and with our suppliers and outsourcing partners. The full extent of the impact of the COVID-19 pandemic on our business, results of operations, cash flows and financial position will depend on many factors that are not within our control, including, but not limited to: the severity, duration and scope of the pandemic, including the impact of coronavirus mutations and resurgences; the effectiveness of actions taken to contain or mitigate the pandemic and prevent or limit any reoccurrence; the development, availability and public acceptance of effective treatments or vaccines; governmental, business and individuals’ actions that have been and continue to be taken in response to the pandemic; general economic uncertainty in key global markets and financial market volatility; global economic conditions and levels of economic growth; and the pace of recovery when the COVID-19 pandemic subsides.
Unsolicited Exchange Offer in Fiscal Year 2020
On March 2, 2020, Xerox Holdings Corporation (“Xerox”) commenced an unsolicited exchange offer for all outstanding shares of HP’s common stock (the “Offer”). Xerox had also previously nominated candidates for election to HP’s Board of
34
HP INC. AND SUBSIDIARIES
Management’s Discussion and Analysis of
Financial Condition and Results of Operations
Directors at HP’s 2020 annual meeting of stockholders. On March 31, 2020, Xerox announced that the Offer had been terminated and subsequently withdrew its slate of director nominees. In order to respond to Xerox’s actions, HP incurred certain costs during the fiscal year ended October 31, 2020.
Oracle Corporation (“Oracle”) Litigation proceeds
On October 12, 2021, Oracle paid approximately $4.65 billion, to satisfy the judgment with interest, related to the litigation in connection with Oracle’s discontinuation of software support for former Hewlett-Packard Company’s Itanium-based line of mission-critical servers. The net proceeds from the judgement are being shared equally between HP and Hewlett Packard Enterprise pursuant to the terms of the separation and distribution agreement. For more information, see Note 14, “Litigation and Contingencies” to the Consolidated Financial Statements in Item 8 of Part II of this report, which is incorporated herein by reference.
For a further discussion of trends, uncertainties and other factors that could impact our operating results, see the section entitled “Risk Factors” in Item 1A of Part I in this Annual Report on Form 10-K.
CRITICAL ACCOUNTING POLICIES AND ESTIMATES
General
The Consolidated Financial Statements of HP are prepared in accordance with United States (“U.S.”) generally accepted accounting principles (“GAAP”), which require management to make estimates, judgments and assumptions that affect the reported amounts of assets, liabilities, net revenue and expenses, and the disclosure of contingent liabilities. As of October 31, 2021, the impact of COVID-19 on our business continued to unfold. As a result, many of our estimates and assumptions required increased judgment and may carry a higher degree of variability and volatility. As events continue to evolve and additional information becomes available, our estimates may change in future periods. Management bases its estimates on historical experience and on various other assumptions that it believes to be reasonable under the circumstances, the results of which form the basis for making judgments about the carrying amount of assets and liabilities that are not readily apparent from other sources. Management has discussed the development, selection and disclosure of these estimates with the Audit Committee of HP’s Board of Directors. Management believes that the accounting estimates employed and the resulting amounts are reasonable; however, actual results may differ from these estimates. Making estimates and judgments about future events is inherently unpredictable and is subject to significant uncertainties, some of which are beyond our control. Should any of these estimates and assumptions change or prove to have been incorrect, it could have a material impact on our results of operations, financial position and cash flows.
A summary of significant accounting policies is included in Note 1, “Overview and Summary of Significant Accounting Policies” to the Consolidated Financial Statements in Item 8, which is incorporated herein by reference. An accounting policy is deemed to be critical if it requires an accounting estimate to be made based on assumptions about matters that are highly uncertain at the time the estimate is made, if different estimates reasonably could have been used, or if changes in the estimate that are reasonably possible could materially impact the financial statements. Management believes the following critical accounting policies reflect the significant estimates and assumptions used in the preparation of the Consolidated Financial Statements.
Revenue Recognition
We recognize revenue depicting the transfer of promised goods or services to customers in an amount that reflects the consideration to which we are expected to be entitled in exchange for those goods or services. We evaluate customers’ ability to pay based on various factors like historical payment experience, financial metrics and customer credit scores.
We enter into contracts to sell our products and services, and while many of our sales contracts contain standard terms and conditions, there are contracts which contain non-standard terms and conditions. Further, many of our arrangements include multiple performance obligations. As a result, significant contract interpretation may be required to determine the appropriate accounting, including the identification of performance obligations that are distinct, the allocation of the transaction price among performance obligations in the arrangement and the timing of transfer of control of promised goods or services for each of those performance obligations.
We evaluate each performance obligation in an arrangement to determine whether it represents a distinct good or services. A performance obligation constitutes distinct goods or services when the customer can benefit from the goods or services either on its own or together with other resources that are readily available to the customer and the performance obligation is distinct within the context of the contract.
Transaction price is the amount of consideration to which we expect to be entitled in exchange for transferring goods or services to the customer. If the transaction price includes a variable amount, we estimate the amount using either the expected value or most likely amount method. We reduce the transaction price at the time of revenue recognition for customer and
35
HP INC. AND SUBSIDIARIES
Management’s Discussion and Analysis of
Financial Condition and Results of Operations
distributor programs and incentive offerings, rebates, promotions, other volume-based incentives and expected returns. We use estimates to determine the expected variable consideration for such programs based on historical experience, expected consumer behavior and market conditions.
When a sales arrangement contains multiple performance obligations, such as hardware and/or services, we allocate revenue to each performance obligation in proportion to their selling price. The selling price for each performance obligation is based on its Standalone Selling Price (“SSP”). We establish SSP using the price charged for a performance obligation when sold separately (“observable price”) and, in some instances, using the price established by management having the relevant authority. When observable price is not available, we establish SSP based on management’s judgment considering internal factors such as margin objectives, pricing practices and controls, customer segment pricing strategies and the product life-cycle. Consideration is also given to market conditions such as competitor pricing strategies and technology industry life cycles. We may modify or develop new go-to-market practices in the future, which may result in changes in selling prices, impacting standalone selling price determination applying the aforementioned management judgments and estimates. This may change the pattern and timing of revenue recognition for identical arrangements executed in future periods but will not change the total revenue recognized for any given arrangement. In most arrangements with multiple performance obligations, the transaction price is allocated to each performance obligation at the inception of the arrangement based on their relative selling price.
Revenue is recognized when, or as, a performance obligation is satisfied by transferring control of a promised good or service to a customer. We generally invoice the customer upon delivery of the goods or services and the payments are due as per contract terms. For fixed-price support or maintenance and other service contracts that are in the nature of stand-ready obligations, payments are generally received in advance from customers and revenue is recognized on a straight-line basis over the duration of the contract. In instances when revenue is derived from sales of third-party vendor products or services, we record revenue on a gross basis when we are a principal in the transaction and on a net basis when we are acting as an agent between the customer and the vendor. We consider several factors to determine whether we are acting as a principal or an agent, most notably whether we are the primary obligor to the customer, have established our own pricing and have inventory and credit risks.
Warranty
We accrue the estimated cost of product warranties at the time we recognize revenue. We evaluate our warranty obligations on a product group basis. Our standard product warranty terms generally include post-sales support and repairs or replacement of a product at no additional charge for a specified period. While we engage in extensive product quality programs and processes, including actively monitoring and evaluating the quality of our component suppliers, we base our estimated warranty obligation on contractual warranty terms, repair costs, product call rates, average cost per call, current period product shipments and ongoing product failure rates, as well as specific product class failure outside of our baseline experience. Warranty terms generally range from 90 days to three years for parts, labor and onsite services, depending upon the product. If actual product failure rates or repair costs differ from estimates, revisions to the estimated warranty obligation may be required.
Retirement and Post-Retirement Benefits
Our pension and other post-retirement benefit costs and obligations depend on various assumptions. Our major assumptions relate primarily to discount rates, mortality rates, expected increases in compensation levels and the expected long-term return on plan assets. The discount rate assumption is based on current investment yields of high-quality fixed-income securities with maturities similar to the expected benefits payment period. Mortality rates help predict the expected life of plan participants and are based on a historical demographic study of the plan. The expected increase in the compensation levels assumption reflects our long-term actual experience and future expectations. The expected long-term return on plan assets is determined based on asset allocations, historical portfolio results, historical asset correlations and management’s expected returns for each asset class. We evaluate our expected return assumptions annually including reviewing current capital market assumptions to assess the reasonableness of the expected long-term return on plan assets. In any fiscal year, significant differences may arise between the actual return and the expected long-term return on plan assets. Historically, differences between the actual return and expected long-term return on plan assets have resulted from changes in target or actual asset allocation, short-term performance relative to expected long-term performance, and to a lesser extent, differences between target and actual investment allocations, the timing of benefit payments compared to expectations, and the use of derivatives intended to effect asset allocation changes or hedge certain investment or liability exposures. For the recognition of net periodic benefit (credit) cost, the calculation of the expected long-term return on plan assets uses the fair value of plan assets as of the beginning of the fiscal year unless updated as a result of interim re-measurement.
Our major assumptions vary by plan, and the weighted-average rates used are set forth in Note 4, “Retirement and Post-Retirement Benefit Plans” to the Consolidated Financial Statements in Item 8, which is incorporated herein by reference. The following table provides the impact a change of 25 basis points in each of the weighted-average assumptions of the discount
36
HP INC. AND SUBSIDIARIES
Management’s Discussion and Analysis of
Financial Condition and Results of Operations
rate, expected increase in compensation levels and expected long-term return on plan assets would have had on our net periodic benefit (credit) cost for fiscal year 2021:
| Change in Net Periodic Benefit Cost in millions | |||||
| Assumptions: | |||||
| Discount rate | $ | 7 | |||
| Expected increase in compensation levels | $ | 2 | |||
| Expected long-term return on plan assets | $ | 30 | |||
Taxes on Earnings
As a result of certain employment actions and capital investments we have undertaken, income from manufacturing activities in certain jurisdictions is subject to reduced tax rates and, in some cases, is wholly exempt from taxes for fiscal years through 2029.
Material changes in our estimates of cash, working capital and long-term investment requirements in the various jurisdictions in which we do business could impact how future earnings are repatriated to the United States, and our related future effective tax rate.
We calculate our current and deferred tax provisions based on estimates and assumptions that could differ from the final positions reflected in our income tax returns. We adjust our current and deferred tax provisions based on income tax returns which are generally filed in the third or fourth quarters of the subsequent fiscal year.
We recognize deferred tax assets and liabilities for the expected tax consequences of temporary differences between the tax bases of assets and liabilities and their reported amounts using enacted tax rates in effect for the year in which we expect the differences to reverse.
We record a valuation allowance to reduce deferred tax assets to the amount that we are more likely than not to realize. In determining the need for a valuation allowance, we consider future market growth, forecasted earnings, future taxable income, the mix of earnings in the jurisdictions in which we operate and prudent and feasible tax planning strategies. In the event we were to determine that it is more likely than not that we will be unable to realize all or part of our deferred tax assets in the future, we would increase the valuation allowance and recognize a corresponding charge to earnings or other comprehensive income in the period in which we make such a determination. Likewise, if we later determine that we are more likely than not to realize the deferred tax assets, we would reverse the applicable portion of the previously recognized valuation allowance. In order for us to realize our deferred tax assets, we must be able to generate sufficient taxable income in the jurisdictions in which the deferred tax assets are located.
We are subject to income taxes in the United States and approximately 60 other countries, and we are subject to routine corporate income tax audits in many of these jurisdictions. We believe that positions taken on our tax returns are fully supported, but tax authorities may challenge these positions, and our positions may not be fully sustained on examination by the relevant tax authorities. Accordingly, our income tax provision includes amounts intended to satisfy assessments that may result from these challenges. Our accrual for uncertain tax positions is attributable primarily to uncertainties concerning the tax treatment of our domestic operations, including the allocation of income among different jurisdictions, intercompany transactions, pension and related interest. We adjust our uncertain tax positions to reflect the impact of negotiations, settlements, rulings, advice of legal counsel, and other information and events pertaining to a particular audit. Determining the appropriate provision for potential deficiencies or reductions in tax benefits that could reasonably result from an audit requires management judgments and estimates, and income tax audits are inherently unpredictable. We may not accurately predict the outcomes of these audits, and the amounts ultimately paid on resolution of an audit could be materially different from the amounts previously included in our income tax provision and, therefore, could have a material impact on our provision for taxes, net earnings and cash flows. For a further discussion on taxes on earnings, refer to Note 6, “Taxes on Earnings” to the Consolidated Financial Statements in Item 8, which is incorporated herein by reference.
Inventory
We state our inventory at the lower of cost or market on a first-in, first-out basis. We make adjustments to reduce the cost of inventory to its net realizable value at the product group level for estimated excess or obsolescence considering judgments related to future demand and market conditions, along with the impact of COVID-19. Factors influencing these adjustments include changes in demand, technological changes, product life cycle and development plans, component cost trends, product pricing, physical deterioration and quality issues.
37
HP INC. AND SUBSIDIARIES
Management’s Discussion and Analysis of
Financial Condition and Results of Operations
Business Combinations
We allocate the fair value of purchase consideration to the assets acquired, liabilities assumed, and non-controlling interests in the acquiree generally based on their fair values at the acquisition date. The excess of the fair value of purchase consideration over the fair value of these assets acquired, liabilities assumed and non-controlling interests in the acquiree is recorded as goodwill and may involve engaging independent third parties to perform an appraisal. When determining the fair values of assets acquired, liabilities assumed, and non-controlling interests in the acquiree, management makes significant estimates and assumptions, especially with respect to intangible assets.
Critical estimates in valuing intangible assets include, but are not limited to, expected future cash flows, which includes consideration of future growth rates and margins, attrition rates, future changes in technology and brand awareness, loyalty and position, and discount rates. Fair value estimates are based on the assumptions management believes a market participant would use in pricing the asset or liability. Amounts recorded in a business combination may change during the measurement period, which is a period not to exceed one year from the date of acquisition, as additional information about conditions existing at the acquisition date becomes available.
Goodwill
We review goodwill for impairment annually during our fourth quarter and whenever events or changes in circumstances indicate the carrying amount of goodwill may not be recoverable. A qualitative assessment is first performed to determine if the fair value of a reporting unit is more likely than not to be less than its carrying amount. Judgment in the assessment of qualitative factors of impairment may include changes in business climate, market conditions, or other events impacting the reporting unit. If we determine an impairment is more likely than not based on our qualitative assessment, a quantitative assessment of impairment is performed.
Performing a quantitative goodwill impairment test includes the determination of the fair value of a reporting unit and involves significant estimates and assumptions. These estimates and assumptions include, among others, revenue growth rates and operating margins used to calculate projected future cash flows, risk-adjusted discount rates, future economic and market conditions, and the determination of appropriate market comparables. If we determine the carrying amount exceeds fair value, goodwill is impaired and the excess is recognized as an impairment loss.
Loss Contingencies
We are involved in various lawsuits, claims, investigations and proceedings including those consisting of intellectual property (“IP”), commercial, securities, employment, employee benefits and environmental matters that arise in the ordinary course of business. We record a liability when we believe that it is both probable that a liability has been incurred and the amount of loss can be reasonably estimated. Significant judgment is required to determine both the probability of having incurred a liability and the estimated amount of the liability. We review these matters at least quarterly and adjust these liabilities to reflect the impact of negotiations, settlements, rulings, advice of legal counsel and other updated information and events, pertaining to a particular case. Pursuant to the separation and distribution agreement, we share responsibility with Hewlett Packard Enterprise for certain matters, as discussed in Note 14, “Litigation and Contingencies” to the Consolidated Financial Statements in Item 8, which is incorporated herein by reference, and Hewlett Packard Enterprise has agreed to indemnify us in whole or in part with respect to certain matters. Based on our experience, we believe that any damage amounts claimed in the specific litigation and contingencies matters further discussed in Note 14, “Litigation and Contingencies”, are not a meaningful indicator of HP’s potential liability. Litigation is inherently unpredictable. However, we believe we have valid defenses with respect to legal matters pending against us. Nevertheless, cash flows or results of operations could be materially affected in any particular period by the resolution of one or more of these contingencies. We believe we have recorded adequate provisions for any such matters and, as of October 31, 2021, it was not reasonably possible that a material loss had been incurred in excess of the amounts recognized in our financial statements.
RECENT ACCOUNTING PRONOUNCEMENTS
For a summary of recent accounting pronouncements applicable to our consolidated financial statements see Note 1, “Overview and Summary of Significant Accounting Policies” to the Consolidated Financial Statements in Item 8, which is incorporated herein by reference.
RESULTS OF OPERATIONS
Revenue from our international operations has historically represented, and we expect will continue to represent, a majority of our overall net revenue. As a result, our net revenue growth has been impacted, and we expect it will continue to be impacted, by fluctuations in foreign currency exchange rates. In order to provide a framework for assessing performance excluding the impact of foreign currency fluctuations, we supplement the year-over-year percentage change in net revenue with the year-over-year percentage change in net revenue on a constant currency basis, which excludes the effect of foreign currency
38
HP INC. AND SUBSIDIARIES
Management’s Discussion and Analysis of
Financial Condition and Results of Operations
exchange fluctuations calculated by translating current period revenues using monthly exchange rates from the comparative period and excluding any hedging impact recognized in the current period, and does not adjust for any repricing or demand impacts from changes in foreign currency exchange rates. This information is provided so that net revenue can be viewed with and without the effect of fluctuations in foreign currency exchange rates, which is consistent with how management evaluates our net revenue results and trends, as management does not believe that the excluded items are reflective of ongoing operating results. The constant currency measures are provided in addition to, and not as a substitute for, the year-over-year percentage change in net revenue on a GAAP basis. Other companies may calculate and define similarly labeled items differently, which may limit the usefulness of this measure for comparative purposes.
Results of operations in dollars and as a percentage of net revenue were as follows:
| For the fiscal years ended October 31 | |||||||||||||||||||||||||||||||||||
| 2021 | 2020 | 2019 | |||||||||||||||||||||||||||||||||
| Dollars | % of Net Revenue | Dollars | % of Net Revenue | Dollars | % of Net Revenue | ||||||||||||||||||||||||||||||
| Dollars in millions | |||||||||||||||||||||||||||||||||||
| Net revenue | $ | 63,487 | 100.0 | % | $ | 56,639 | 100.0 | % | $ | 58,756 | 100.0 | % | |||||||||||||||||||||||
| Cost of revenue | 50,070 | 78.9 | % | 46,202 | 81.6 | % | 47,586 | 81.0 | % | ||||||||||||||||||||||||||
| Gross profit | 13,417 | 21.1 | % | 10,437 | 18.4 | % | 11,170 | 19.0 | % | ||||||||||||||||||||||||||
| Research and development | 1,907 | 3.0 | % | 1,478 | 2.6 | % | 1,499 | 2.6 | % | ||||||||||||||||||||||||||
| Selling, general and administrative | 5,741 | 9.0 | % | 4,906 | 8.6 | % | 5,368 | 9.1 | % | ||||||||||||||||||||||||||
| Restructuring and other charges | 245 | 0.4 | % | 462 | 0.9 | % | 275 | 0.4 | % | ||||||||||||||||||||||||||
| Acquisition-related charges | 68 | 0.1 | % | 16 | — | % | 35 | 0.1 | % | ||||||||||||||||||||||||||
| Amortization of intangible assets | 154 | 0.2 | % | 113 | 0.2 | % | 116 | 0.2 | % | ||||||||||||||||||||||||||
| Earnings from operations | 5,302 | 8.4 | % | 3,462 | 6.1 | % | 3,877 | 6.6 | % | ||||||||||||||||||||||||||
| Interest and other, net | 2,209 | 3.4 | % | (231) | (0.4) | % | (1,354) | (2.3) | % | ||||||||||||||||||||||||||
| Earnings before taxes | 7,511 | 11.8 | % | 3,231 | 5.7 | % | 2,523 | 4.3 | % | ||||||||||||||||||||||||||
| (Provision for) benefit from taxes | (1,008) | (1.6) | % | (387) | (0.7) | % | 629 | 1.1 | % | ||||||||||||||||||||||||||
| Net earnings | $ | 6,503 | 10.2 | % | $ | 2,844 | 5.0 | % | $ | 3,152 | 5.4 | % | |||||||||||||||||||||||
Net Revenue
In fiscal year 2021, total net revenue increased 12.1% (increased 10.2% on a constant currency basis) as compared to the prior-year period. Net revenue from the United States increased 11.0% to $22.4 billion, and outside of the United States increased 12.7% to $41.1 billion. The increase in net revenue was primarily driven by growth in Notebooks, Supplies, Consumer and Commercial Printing, and favorable foreign currency impacts, partially offset by decline in Desktops. The increase in net revenue is due to strong demand and higher ASPs driven by work from home and remote learning.
A detailed discussion of the factors contributing to the changes in segment net revenue is included under “Segment Information” below.
Gross Margin
For fiscal year 2021, gross margin increased by 2.7 percentage points, primarily driven by favorable pricing including lower promotions and favorable foreign currency impacts, partially offset by higher costs including commodity costs. A detailed discussion of the factors contributing to the changes in segment gross margins is included under “Segment Information” below.
Operating Expenses
Research and Development (“R&D”)
R&D expense increased 29.0% in fiscal year 2021, primarily due to continuing investments in innovation and key growth initiatives and higher variable compensation.
Selling, General and Administrative (“SG&A”)
SG&A expense increased 17.0% in fiscal year 2021, primarily driven by go-to-market initiatives and higher variable compensation.
39
HP INC. AND SUBSIDIARIES
Management’s Discussion and Analysis of
Financial Condition and Results of Operations
Restructuring and other Charges
Restructuring and other charges relate primarily to the Fiscal 2020 Plan. For more information, see Note 3, “Restructuring and Other Charges”, to the Consolidated Financial Statements in Item 8 of Part II of this report, which is incorporated herein by reference.
Acquisition-related Charges
Acquisition-related charges relate primarily to third-party professional and legal fees, and integration-related costs, as well as fair value adjustments of certain acquired assets such as inventory. Acquisition-related charges increased by $52 million in the fiscal year 2021, primarily due to recent acquisitions.
Amortization of Intangible Assets
Amortization of intangible assets relates primarily to intangible assets resulting from acquisitions. Amortization of Intangible assets increased by $41 million in the fiscal year 2021, primarily due to recent acquisitions.
Interest and Other, Net
Interest and other, net for the fiscal year 2021 was net gain as compared to a net expense in the fiscal year 2020, primarily due to gain from one-time Oracle litigation proceeds of $2.3 billion, impact from defined benefit plan settlements, partially offset by lower Net Periodic Post-retirement Benefit Credit. For more information, see Note 7, “Supplementary Financial Information”, to the Consolidated Financial Statements in Item 8 of Part II of this report, which is incorporated herein by reference.
Provision for taxes
Our effective tax rate was 13.4% in fiscal year 2021. In fiscal year 2021, our effective tax rate differed from the U.S. federal statutory rate of 21% primarily due to changes in valuation allowances and favorable tax rates associated with certain earnings in lower-tax jurisdictions throughout the world. The jurisdictions with favorable tax rates that had the most significant impact on our effective tax rate in the periods presented were Puerto Rico, Singapore, and Malaysia.
For a reconciliation of our effective tax rate to the U.S. federal statutory rate of 21% in fiscal year 2021, and further explanation of our provision for income taxes, see Note 6, “Taxes on Earnings” to the Consolidated Financial Statements in Item 8, which is incorporated herein by reference.
In fiscal year 2021, we recorded $9 million of net income tax charges related to discrete items in the provision for taxes. This amount included income tax charges of $533 million related to the Oracle litigation proceeds, $15 million of uncertain tax position charges, and $9 million of other net tax charges. These charges were partially offset by income tax benefits of $393 million related to changes in valuation allowances, $89 million of tax effects related to internal reorganization, $50 million related to restructuring charges, and $16 million related to the filing of tax returns in various jurisdictions.
Segment Information
A description of the products and services for each segment can be found in Note 2, “Segment Information,” to the Consolidated Financial Statements in Item 8, which is incorporated herein by reference. Future changes to this organizational structure may result in changes to the segments disclosed.
Personal Systems
| For the fiscal years ended October 31 | |||||||||||||||||
| 2021 | 2020 | 2019 | |||||||||||||||
| Dollars in millions | |||||||||||||||||
| Net revenue | $ | 43,359 | $ | 38,997 | $ | 38,694 | |||||||||||
| Earnings from operations | $ | 3,101 | $ | 2,312 | $ | 1,898 | |||||||||||
| Earnings from operations as a % of net revenue | 7.2% | 5.9 | % | 4.9% | |||||||||||||
40
HP INC. AND SUBSIDIARIES
Management’s Discussion and Analysis of
Financial Condition and Results of Operations
The components of net revenue and the weighted net revenue change by business unit were as follows:
| For the fiscal years ended October 31 | |||||||||||||||||||||||||||||
| Net Revenue | Weighted Net Revenue Change Percentage Points(1) | ||||||||||||||||||||||||||||
| 2021 | 2020 | 2019 | 2021 | 2020 | |||||||||||||||||||||||||
| In millions | |||||||||||||||||||||||||||||
| Notebooks | $ | 30,522 | $ | 25,766 | $ | 22,928 | 12.2 | 7.3 | |||||||||||||||||||||
| Desktops | 9,381 | 9,806 | 12,046 | (1.1) | (5.8) | ||||||||||||||||||||||||
| Workstations | 1,669 | 1,816 | 2,389 | (0.4) | (1.5) | ||||||||||||||||||||||||
| Other | 1,787 | 1,609 | 1,331 | 0.5 | 0.8 | ||||||||||||||||||||||||
| Total Personal Systems | $ | 43,359 | $ | 38,997 | $ | 38,694 | 11.2 | 0.8 | |||||||||||||||||||||
(1) Weighted Net Revenue Change Percentage Points measures contribution of each business unit towards overall segment revenue growth. It is calculated by dividing the change in revenue of each business unit from the prior-year period by total segment revenue for the prior-year period.
Fiscal Year 2021 compared with Fiscal Year 2020
Personal Systems net revenue increased 11.2% (increased 8.8% on a constant currency basis) in fiscal year 2021 as compared to the prior-year period. The net revenue increase was primarily due to growth in Notebooks and favorable foreign currency impacts, partially offset by decline in Desktops. The net revenue increase was driven by 9.8% increase in unit volume and 1.3% increase in ASPs. The increase in unit volume was primarily due to growth in Notebooks resulting from strong demand driven by work from home, remote learning and gaming, partially offset by decline in Desktops. Also, industry-wide supply chain constraints limited unit growth during the fiscal year 2021. The increase in ASPs was primarily due to favorable pricing including lower promotions and favorable foreign currency impacts, partially offset by mix shifts.
Consumer PCs revenue increased 19.9% driven by unit growth in Notebooks and Desktops and higher ASPs. Commercial revenue increased 6.4% primarily driven by unit growth in Notebooks, partially offset by lower ASPs driven by higher Chromebook mix and unit declines in Desktops.
Consequently, net revenue increased 18.5% in Notebooks and decreased 4.3% in Desktops and 8.1% in Workstations.
Personal Systems earnings from operations as a percentage of net revenue increased by 1.3 percentage points. The increase was primarily due to an increase in gross margin, partially offset by an increase in operating expenses as a percentage of revenue. The increase in gross margin was primarily due to favorable pricing including lower promotions and favorable foreign currency impacts, partially offset by higher commodity and logistics costs. Operating expenses as a percentage of revenue increased by 0.7 percentage points primarily due to R&D investments in innovation, go-to-market initiatives and higher variable compensation.
Printing
| For the fiscal years ended October 31 | |||||||||||||||||
| 2021 | 2020 | 2019 | |||||||||||||||
| Dollars in millions | |||||||||||||||||
| Net revenue | $ | 20,128 | $ | 17,641 | $ | 20,066 | |||||||||||
| Earnings from operations | $ | 3,636 | $ | 2,495 | $ | 3,202 | |||||||||||
| Earnings from operations as a % of net revenue | 18.1% | 14.1% | 16.0% | ||||||||||||||
41
HP INC. AND SUBSIDIARIES
Management’s Discussion and Analysis of
Financial Condition and Results of Operations
The components of the net revenue and weighted net revenue change by business unit were as follows:
| For the fiscal years ended October 31 | |||||||||||||||||||||||||||||
| Net Revenue | Weighted Net Revenue Change Percentage Points(1) | ||||||||||||||||||||||||||||
| 2021 | 2020 | 2019 | 2021 | 2020 | |||||||||||||||||||||||||
| In millions | |||||||||||||||||||||||||||||
| Supplies | $ | 12,632 | $ | 11,586 | $ | 12,921 | 5.9 | (6.7) | |||||||||||||||||||||
| Commercial | 4,209 | 3,539 | 4,612 | 3.8 | (5.3) | ||||||||||||||||||||||||
| Consumer | 3,287 | 2,516 | 2,533 | 4.4 | (0.1) | ||||||||||||||||||||||||
| Total Printing | $ | 20,128 | $ | 17,641 | $ | 20,066 | 14.1 | (12.1) | |||||||||||||||||||||
(1) Weighted Net Revenue Change Percentage Points measures the contribution of each business unit towards overall segment revenue growth. It is calculated by dividing the change in revenue of each business unit from the prior period by total segment revenue for the prior-year period.
Fiscal Year 2021 compared with Fiscal Year 2020
Printing net revenue increased 14.1% (increased 13.2% on a constant currency basis) for fiscal year 2021 as compared to the prior-year period. The growth in net revenue was primarily driven by a growth in Supplies, Consumer and Commercial. Net revenue for Supplies increased 9.0% as compared to the prior-year period, primarily driven by favorable pricing including lower promotions and improvement in enterprise and SMB demand. Printer ASPs increased 26.2% and printer unit volume increased 3.0% as compared to the prior-year period. Printer ASPs increased primarily due to favorable pricing including lower promotions. The increase in printer unit volume was driven by both Consumer and Commercial. While there has been unit growth compared to prior-year period, we continue to experience supply chain constraints, including component shortages, which limited growth during fiscal year 2021.
Net revenue for Commercial increased 18.9% as compared to the prior-year period, due to a 7.6% increase in printer unit volume and a 20.4% increase in ASPs. The printer unit volume increased due to improved demand as compared to prior-year period which was impacted by COVID-19. The increase in ASPs was primarily driven by favorable pricing and mix shifts.
Net revenue for Consumer increased 30.6% as compared to the prior-year period, due to a 27.4% increase in ASPs and a 2.4% increase in printer unit volume. The increase in ASPs was primarily driven by favorable pricing. The printer unit volume increased due to strong demand from remote working and learning.
Printing earnings from operations as a percentage of net revenue increased by 4.0 percentage points for the fiscal year 2021 as compared to the prior-year period, primarily due to increase in gross margin driven by favorable pricing including lower promotions, partially offset by mix shifts. Operating expenses as a percentage of revenue remained flat.
Corporate Investments
The loss from operations in Corporate Investments for the fiscal year 2021 was primarily due to expenses associated with our incubation projects and investments in digital enablement.
LIQUIDITY AND CAPITAL RESOURCES
We use cash generated by operations as our primary source of liquidity. While the impacts from the COVID-19 pandemic were originally expected to be temporary, however, with the emergence of new variants, there remains uncertainty around the extent and duration of the pandemic and how our liquidity and working capital needs may be impacted in the future periods as a result. We believe that current cash, cash flow from operating activities, new borrowings, available commercial paper authorization and the credit facilities will be sufficient to meet HP’s operating cash requirements, planned capital expenditures, interest and principal payments on all borrowings, pension and post-retirement funding requirements, authorized share repurchases and annual dividend payments for the foreseeable future. Additionally, if suitable acquisition opportunities arise, the Company may obtain all or a portion of the required financing through additional borrowings. While our access to capital markets may be constrained and our cost of borrowing may increase under certain business, market and economic conditions, our access to a variety of funding sources to meet our liquidity needs is designed to facilitate continued access to capital resources under all such conditions. Our liquidity is subject to various risks including the risks identified in the section entitled “Risk Factors” in Item 1A and market risks identified in the section entitled “Quantitative and Qualitative Disclosures about Market Risk” in Item 7A, which are incorporated herein by reference.
During the fiscal year 2021, HP completed four acquisitions with a combined purchase price of $854 million, net of cash acquired, of which $400 million was recorded as goodwill and $385 million as intangible assets related to these acquisitions. For more information, see Note 18, “Acquisitions”, to the Consolidated Financial Statements in Item 8 of Part II of this report, which is incorporated herein by reference.
42
HP INC. AND SUBSIDIARIES
Management’s Discussion and Analysis of
Financial Condition and Results of Operations
Our cash and cash equivalents balances are held in numerous locations throughout the world. We utilize a variety of planning and financing strategies in an effort to ensure that our worldwide cash is available when and where it is needed. Amounts held outside of the United States are generally utilized to support non-U.S. liquidity needs and may from time to time be distributed to the United States. The Tax Cuts and Jobs Act (“TCJA”) made significant changes to the U.S. tax law, including a one-time transition tax on accumulated foreign earnings. The payments associated with this one-time transition tax will be paid over eight years and began in fiscal year 2019. We expect a significant portion of the cash and cash equivalents held by our foreign subsidiaries will no longer be subject to U.S. income tax upon a subsequent repatriation to the United States as a result of the transition tax on accumulated foreign earnings. However, a portion of this cash may still be subject to foreign income tax or withholding tax upon repatriation. As we evaluate the future cash needs of our operations, we may revise the amount of foreign earnings considered to be permanently reinvested in our foreign subsidiaries and how to utilize such funds, including reducing our gross debt level, or other uses.
Liquidity
Our cash and cash equivalents, marketable debt securities and total debt were as follows:
| As of October 31 | |||||||||||||||||
| 2021 | 2020 | 2019 | |||||||||||||||
| In billions | |||||||||||||||||
| Cash and cash equivalents | $ | 4.3 | $ | 4.9 | $ | 4.5 | |||||||||||
Marketable debt securities(1) | $ | — | $ | 0.3 | $ | — | |||||||||||
| Total debt | $ | 7.5 | $ | 6.2 | $ | 5.1 | |||||||||||
(1)Includes highly liquid U.S. treasury notes, U.S. agency securities, non-U.S. government bonds, corporate debt securities, money market and other funds. We classify these investments within Other current assets in Consolidated Balance Sheets, including those with maturity dates beyond one year, based on their highly liquid nature and availability for use in current operations.
Our key cash flow metrics were as follows:
| For the fiscal years ended October 31 | |||||||||||||||||
| 2021 | 2020 | 2019 | |||||||||||||||
| In millions | |||||||||||||||||
| Net cash provided by operating activities | $ | 6,409 | $ | 4,316 | $ | 4,654 | |||||||||||
| Net cash used in investing activities | (1,012) | (1,016) | (438) | ||||||||||||||
| Net cash used in financing activities | (5,962) | (2,973) | (4,845) | ||||||||||||||
| Net (decrease) increase in cash and cash equivalents | $ | (565) | $ | 327 | $ | (629) | |||||||||||
Operating Activities
Net cash provided by operating activities increased by $2.1 billion for fiscal year 2021 as compared to fiscal year 2020, primarily due to higher earnings from operation including net gain from the one-time Oracle litigation proceeds of $1.8 billion, partially offset by higher cash utilized in working capital activities as a result of changes in demand dynamics and supply chain constraints due to COVID-19.
Key Working Capital Metrics
Management utilizes current cash conversion cycle information to manage our working capital level. The table below presents the cash conversion cycle:
| As of October 31 | |||||||||||||||||
| 2021 | 2020 | 2019 | |||||||||||||||
| Days of sales outstanding in accounts receivable (“DSO”) | 30 | 32 | 35 | ||||||||||||||
| Days of supply in inventory (“DOS”) | 53 | 43 | 41 | ||||||||||||||
| Days of purchases outstanding in accounts payable (“DPO”) | (108) | (105) | (107) | ||||||||||||||
| Cash conversion cycle | (25) | (30) | (31) | ||||||||||||||
The cash conversion cycle is the sum of days of DSO and DOS less DPO. Items which may cause the cash conversion cycle in a particular period to differ from a long-term sustainable rate include, but are not limited to, changes in business mix, changes in payment terms, extent of receivables factoring, macro-economic factors, seasonal trends and the timing of revenue recognition and inventory purchases within the period.
43
HP INC. AND SUBSIDIARIES
Management’s Discussion and Analysis of
Financial Condition and Results of Operations
DSO measures the average number of days our receivables are outstanding. DSO is calculated by dividing ending accounts receivable, net of allowance for credit losses, by a 90-day average of net revenue. The decrease in DSO as compared to prior-year period, was due to strong collections and favorable revenue linearity.
DOS measures the average number of days from procurement to sale of our product. DOS is calculated by dividing ending inventory by a 90-day average of cost of goods sold. The increase in DOS as compared to prior-year period, was primarily due to higher strategic buys to better assure supply of commodities in Personal Systems and recovering Printing inventory from the impacts of COVID-19.
DPO measures the average number of days our accounts payable balances are outstanding. DPO is calculated by dividing ending accounts payable by a 90-day average of cost of goods sold. The decrease in DPO compared to prior-year period, was primarily due to higher commodity costs, partially offset by working capital management activities.
Investing Activities
Net cash used in investing activities remained flat for fiscal year 2021 as compared to fiscal year 2020, primarily due to decrease in investments of $0.6 billion and collateral related to derivative instruments of $0.3 billion, partially offset by higher net payments for acquisitions of $0.9 billion.
Financing Activities
Net cash used in financing activities increased by $3.0 billion in fiscal year 2021 compared to fiscal year 2020, primarily due to higher share repurchases of $3.1 billion and lower proceeds from debt issuance of $1.0 billion, partially offset by lower payment of debt of $0.6 billion and higher proceeds from commercial paper of $0.4 billion.
Share Repurchases and Dividends
In fiscal year 2021, HP returned $7.2 billion to the shareholders in the form of share repurchases of $6.3 billion and cash dividends of $0.9 billion. As of October 31, 2021, HP had approximately $6.4 billion remaining under the share repurchase authorizations approved by HP’s Board of Directors. HP intends to continue to repurchase shares at an elevated level of at least $4.0 billion in fiscal year 2022.
For more information on our share repurchases, see Note 12, “Stockholders’ Deficit”, to the Consolidated Financial Statements in Item 8, which is incorporated herein by reference.
Capital Resources
Debt Levels
| As of October 31 | |||||||||||||||||
| 2021 | 2020 | 2019 | |||||||||||||||
| Dollars in millions | |||||||||||||||||
| Short-term debt | $ | 1,106 | $ | 674 | $ | 357 | |||||||||||
| Long-term debt | $ | 6,386 | $ | 5,543 | $ | 4,780 | |||||||||||
| Weighted-average interest rate | 3.1 | % | 3.9 | % | 4.6 | % | |||||||||||
We maintain debt levels that we establish through consideration of a number of factors, including cash flow expectations, cash requirements for operations, investment plans (including acquisitions), share repurchase activities, our cost of capital and targeted leverage ratio.
Short-term debt increased by $0.4 billion and long-term debt increased by $0.8 billion for fiscal year 2021 as compared to fiscal year 2020. The net increase in total debt was primarily due to issuance of unsecured senior debt in June 2021 amounting to $2.0 billion and commercial paper of $0.4 billion issued in September 2021, which was, partially offset by payment of $1.0 billion in July 2021, towards redemption of existing notes maturing in September and December 2021.
Our weighted-average interest rate reflects the effective interest rate on our borrowings prevailing during the period and reflects the effect of interest rate swaps. For more information on our interest rate swaps, see Note 10, “Financial Instruments” in the Consolidated Financial Statements and notes thereto in Item 8, “Financial Statements and Supplementary Data”, which is incorporated herein by reference.
On May 26, 2021, we entered into a new $5.0 billion 5-year sustainability-linked senior unsecured committed revolving credit facility (the ‘New Revolving Facility”) which will be available until May 26, 2026. Commitment fees, interest rates and other terms of borrowing under the New Revolving Facility vary based on HP’s external credit ratings and certain sustainability metrics.
As of October 31, 2021, we continue to maintain the New Revolving Facility. Funds borrowed under the New Revolving Facility may be used for general corporate purposes.
44
HP INC. AND SUBSIDIARIES
Management’s Discussion and Analysis of
Financial Condition and Results of Operations
On June 16, 2021, we issued $2.0 billion in aggregate principal amount of senior notes across various maturities. We used approximately $1.0 billion of the proceeds from such issuance to fund the redemption of existing notes maturing in September and December 2021. For more information on the new notes and the redemption of existing notes, see Note 11, “Borrowings”, to the Consolidated Financial Statements in Item 8 of Part II of this report, which is incorporated herein by reference.
Available Borrowing Resources
As of October 31, 2021, we had available borrowing resources of $579 million from uncommitted lines of credit in addition to the New Revolving Facility.
The amendment to our 2019 Shelf Registration Statement to convert to a non-automatic shelf registration statement was declared effective by the SEC on February 25, 2021 and enables us to offer for sale, from time to time, in one or more offerings, $5.0 billion, in the aggregate, of debt securities, common stock, preferred stock, depository shares and warrants.
For more information on our borrowings, see Note 11, “Borrowings”, to the Consolidated Financial Statements in Item 8, which is incorporated herein by reference.
Credit Ratings
Our credit risk is evaluated by major independent rating agencies based upon publicly available information as well as information they obtain during our ongoing discussions. While we currently do not have any rating downgrade triggers that would accelerate the maturity of a material amount of our debt, a downgrade from our current credit rating may increase the cost of borrowing under our credit facility, reduce market capacity for our commercial paper, require the posting of additional collateral under some of our derivative contracts and may have a negative impact on our liquidity and capital position, depending on the extent of such downgrade. We can access alternative sources of funding, including drawdowns under our credit facility, if necessary, to offset potential reductions in the market capacity for our commercial paper.
45
HP INC. AND SUBSIDIARIES
Management’s Discussion and Analysis of
Financial Condition and Results of Operations (Continued)
CONTRACTUAL AND OTHER OBLIGATIONS
Our contractual and other obligations as of October 31, 2021, were as follows:
| Payments Due by Period | |||||||||||||||||
| Total | Short-term | Long-term | |||||||||||||||
| In millions | |||||||||||||||||
Principal payments on debt(1) | $ | 7,550 | $ | 1,099 | $ | 6,451 | |||||||||||
Interest payments on debt(2) | 2,335 | 239 | 2,096 | ||||||||||||||
Purchase obligations(3) | 6,940 | 2,642 | 4,298 | ||||||||||||||
| Operating lease obligations | 1,381 | 382 | 999 | ||||||||||||||
| Finance lease obligations | 24 | 10 | 14 | ||||||||||||||
Total(4)(5)(6) | $ | 18,230 | $ | 4,372 | $ | 13,858 | |||||||||||
(1)Amounts represent the principal cash payments relating to our short-term and long-term debt and do not include any fair value adjustments, discounts or premiums.
(2)Amounts represent the expected interest payments relating to our short-term and long-term debt. We have outstanding interest rate swap agreements accounted for as fair value hedges that have the economic effect of changing fixed interest rates associated with some of our U.S. Dollar Global Notes to variable interest rates. The impact of our outstanding interest rate swaps at October 31, 2021 was factored into the calculation of the future interest payments on debt.
(3)Purchase obligations include agreements to purchase goods or services that are enforceable and legally binding on us and that specify all significant terms, including fixed or minimum quantities to be purchased; fixed, minimum or variable price provisions; and the approximate timing of the transaction. These purchase obligations are related principally to inventory and other items. Purchase obligations exclude agreements that are cancelable without penalty. Purchase obligations also exclude open purchase orders that are routine arrangements entered into in the ordinary course of business as they are difficult to quantify in a meaningful way. Even though open purchase orders are considered enforceable and legally binding, the terms generally allow us the option to cancel, reschedule, and adjust terms based on our business needs prior to the delivery of goods or performance of services.
(4)Retirement and Post-Retirement Benefit Plan Contributions. In fiscal year 2022, we expect to contribute approximately $44 million to non-U.S. pension plans, $36 million to cover benefit payments to U.S. non-qualified plan participants and $4 million to cover benefit claims for our post-retirement benefit plans. Our policy is to fund our pension plans so that we meet at least the minimum contribution required by local government, funding and taxing authorities. Expected contributions and payments to our pension and post-retirement benefit plans are excluded from the contractual obligations table because they do not represent contractual cash outflows as they are dependent on numerous factors which may result in a wide range of outcomes. For more information on our retirement and post-retirement benefit plans, see Note 4, “Retirement and Post-Retirement Benefit Plans”, to the Consolidated Financial Statements in Item 8, which is incorporated herein by reference.
(5)Cost Savings Plans. As a result of our approved restructuring plans, we expect to make future cash payments of approximately $0.3 billion. We expect to make future cash payments of $0.2 billion in fiscal year 2022 with remaining cash payments through fiscal year 2023. These payments have been excluded from the contractual obligations table because they do not represent contractual cash outflows and there is uncertainty as to the timing of these payments. For more information on our restructuring activities that are part of our cost improvements, see Note 3, “Restructuring and Other Charges”, to the Consolidated Financial Statements in Item 8, which is incorporated herein by reference.
(6)Uncertain Tax Positions. As of October 31, 2021, we had approximately $584 million of recorded liabilities and related interest and penalties pertaining to uncertain tax positions. We are unable to make a reasonable estimate as to when cash settlement with the tax authorities might occur due to the uncertainties related to these tax matters. Payments of these obligations would result from settlements with taxing authorities. For more information on our uncertain tax positions, see Note 6, “Taxes on Earnings”, to the Consolidated Financial Statements in Item 8, which is incorporated herein by reference.
46
HP INC. AND SUBSIDIARIES
Management’s Discussion and Analysis of
Financial Condition and Results of Operations
Off-balance sheet arrangements
As part of our ongoing business, we have not participated in transactions that generate material relationships with unconsolidated entities or financial partnerships, such as entities often referred to as structured finance or special purpose entities, which would have been established for the purpose of facilitating off-balance sheet arrangements or other contractually narrow or limited purposes.
We have third-party short-term financing arrangements intended to facilitate the working capital requirements of certain customers. For more information on our third-party short-term financing arrangements, see Note 7 “Supplementary Financial Information” to the Consolidated Financial Statements in Item 8, which is incorporated herein by reference.
47
ITEM 7A. Quantitative and Qualitative Disclosures About Market Risk.
In the normal course of business, we are exposed to foreign currency exchange rate and interest rate risks that could impact our financial position and results of operations. Our risk management strategy with respect to these market risks may include the use of derivative instruments. We use derivative contracts only to manage existing underlying exposures. Accordingly, we do not use derivative contracts for speculative purposes. Our risks, risk management strategy and a sensitivity analysis estimating the effects of changes in fair value for each of these exposures are outlined below.
Actual gains and losses in the future may differ materially from the sensitivity analyses based on changes in the timing and amount of foreign currency exchange rate and interest rate movements and our actual exposures and derivatives in place at the time of the change, as well as the effectiveness of the derivative to hedge the related exposure.
Foreign currency exchange rate risk
We are exposed to foreign currency exchange rate risk inherent in our sales commitments, anticipated sales, anticipated purchases and assets and liabilities denominated in currencies other than the U.S. dollar. We transact business in over 40 currencies worldwide, of which the most significant foreign currencies to our operations for fiscal year 2021 were the Euro, Chinese yuan renminbi, the Japanese yen and the British pound. For most currencies, we are a net receiver of the foreign currency and therefore benefit from a weaker U.S. dollar and are adversely affected by a stronger U.S. dollar relative to the foreign currency. Even where we are a net receiver of the foreign currency, a weaker U.S. dollar may adversely affect certain expense figures, if taken alone.
We use a combination of forward contracts and at times, options designated as cash flow hedges to protect against the foreign currency exchange rate risks inherent in our forecasted net revenue and, to a lesser extent in cost of sales. In addition, when debt is denominated in a foreign currency, we may use swaps to exchange the foreign currency principal and interest obligations for U.S. dollar-denominated amounts to manage the exposure to changes in foreign currency exchange rates. We also use other derivatives not designated as hedging instruments consisting primarily of forward contracts to hedge foreign currency balance sheet exposures. Alternatively, we may choose not to hedge the risk associated with our foreign currency exposures, primarily if such exposure acts as a natural hedge for offsetting amounts denominated in the same currency or if the currency is too difficult or too expensive to hedge.
We have performed sensitivity analyses as of October 31, 2021 and 2020, using a modeling technique that measures the change in the fair values arising from a hypothetical 10% adverse movement in the levels of foreign currency exchange rates relative to the U.S. dollar, with all other variables held constant. The analyses cover all of our foreign currency derivative contracts offset by underlying exposures. The foreign currency exchange rates we used in performing the sensitivity analysis were based on market rates in effect at October 31, 2021 and 2020. The sensitivity analyses indicated that a hypothetical 10% adverse movement in foreign currency exchange rates would result in a foreign exchange loss of $168 million and $77 million at October 31, 2021 and October 31, 2020, respectively.
Interest rate risk
We also are exposed to interest rate risk related to debt we have issued and our investment portfolio.
We issue long-term debt in either U.S. dollars or foreign currencies based on market conditions at the time of financing. We may use interest rate and/or currency swaps to modify the market risk exposures in connection with the debt to achieve a floating interest expense. The swap transactions generally involve the exchange of fixed for floating interest payments. However, we may choose not to swap fixed for floating interest payments or may terminate a previously executed swap if we believe a larger proportion of fixed-rate debt would be beneficial.
In order to hedge the fair value of certain fixed-rate investments, we may enter into interest rate swaps that convert fixed interest returns into variable interest returns. We may use cash flow hedges to hedge the variability in interest income received on certain variable-rate investments. We may also enter into interest rate swaps that convert variable rate interest returns into fixed-rate interest returns.
We have performed sensitivity analyses as of October 31, 2021 and 2020, using a modeling technique that measures the change in the fair values arising from a hypothetical 10% adverse movement in the levels of interest rates across the entire yield curve, with all other variables held constant. The analyses cover our debt, investments and interest rate swaps. The analyses use actual or approximate maturities for the debt, investments and interest rate swaps. The discount rates used were based on the market interest rates in effect at October 31, 2021 and 2020. The sensitivity analyses indicated that a hypothetical 10% adverse movement in interest rates would have resulted in a loss in the fair values of our debt and investments, net of interest rate swaps, of $73 million at October 31, 2021 and $36 million at October 31, 2020.
48
ITEM 8. Financial Statements and Supplementary Data.
Table of Contents
| Page | |||||
49
Report of Independent Registered Public Accounting Firm
To the Stockholders and the Board of Directors of HP Inc.
Opinion on the Financial Statements
We have audited the accompanying consolidated balance sheets of HP Inc. and subsidiaries (the Company) as of October 31, 2021 and 2020, the related consolidated statements of earnings, comprehensive income, stockholders' deficit and cash flows for each of the three years in the period ended October 31, 2021, and the related notes (collectively referred to as the “consolidated financial statements”). In our opinion, the consolidated financial statements present fairly, in all material respects, the financial position of the Company at October 31, 2021 and 2020, and the results of its operations and its cash flows for each of the three years in the period ended October 31, 2021, in conformity with U.S. generally accepted accounting principles.
We also have audited, in accordance with the standards of the Public Company Accounting Oversight Board (United States) (PCAOB), the Company’s internal control over financial reporting as of October 31, 2021, based on criteria established in Internal Control-Integrated Framework issued by the Committee of Sponsoring Organizations of the Treadway Commission (2013 framework) and our report dated December 9, 2021 expressed an unqualified opinion thereon.
Basis for Opinion
These financial statements are the responsibility of the Company's management. Our responsibility is to express an opinion on the Company’s financial statements based on our audits. We are a public accounting firm registered with the PCAOB and are required to be independent with respect to the Company in accordance with the U.S. federal securities laws and the applicable rules and regulations of the Securities and Exchange Commission and the PCAOB.
We conducted our audits in accordance with the standards of the PCAOB. Those standards require that we plan and perform the audit to obtain reasonable assurance about whether the financial statements are free of material misstatement, whether due to error or fraud. Our audits included performing procedures to assess the risks of material misstatement of the financial statements, whether due to error or fraud, and performing procedures that respond to those risks. Such procedures included examining, on a test basis, evidence regarding the amounts and disclosures in the financial statements. Our audits also included evaluating the accounting principles used and significant estimates made by management, as well as evaluating the overall presentation of the financial statements. We believe that our audits provide a reasonable basis for our opinion.
Critical Audit Matters
The critical audit matters communicated below are matters arising from the current period audit of the financial statements that were communicated or required to be communicated to the audit committee and that: (1) relate to accounts or disclosures that are material to the financial statements and (2) involved our especially challenging, subjective or complex judgments. The communication of critical audit matters does not alter in any way our opinion on the consolidated financial statements, taken as a whole, and we are not, by communicating the critical audit matters below, providing separate opinions on the critical audit matters or on the accounts or disclosures to which they relate.
50
| Income Taxes | |||||
Description of the Matter | As described in Notes 1 and 6 of the consolidated financial statements, the Company is subject to income taxes in the United States and several other countries and is subject to routine corporate income tax audits in many of those jurisdictions. Uncertainty in the Company’s tax positions may arise as tax laws are subject to interpretation and the Company’s positions are subject to examination by taxing authorities, which may result in assessments of additional amounts owed. Determining the income tax provision for these potential assessments and recording the related effects requires significant management judgment in estimating whether a tax position’s technical merits are more-likely-than-not to be sustained and measuring the amount of tax benefit that qualifies for recognition. Additionally, the Company records a valuation allowance to reduce deferred tax assets to the amount which are more likely than not to be realized. In determining the need for a valuation allowance, the Company considers certain subjective factors such as future market growth, forecasted earnings, future taxable income, mix of earnings in the jurisdictions in which they operate and prudent and feasible tax planning strategies. Our assessment of management’s analyses of the reserve for uncertain tax positions and the realizability of its deferred tax assets are significant to our audit because the amounts are material to the financial statements and the assessment process involves significant judgment. For example, management’s assumptions that may be affected by future market and economic conditions or interpretations of tax laws and legal rulings are challenging to audit. | ||||
| How We Addressed the Matter in Our Audit | We tested controls over management’s processes relating to the recording of unrecognized tax benefits, including controls over the Company’s process to assess the technical merits of its uncertain tax positions, and the realizability of deferred tax assets, including the development of the above described assumptions and judgments. Our audit procedures included an evaluation of the Company’s key assumptions and judgments and testing the completeness and accuracy of the underlying data used to determine the amount of unrecognized tax benefits recognized. For example, we evaluated the measurement of the amounts recorded taking into consideration the applicable tax laws and the Company’s positions examined by taxing authorities. We also evaluated the key assumptions and judgments used by management in determining the need for a valuation allowance and testing the completeness and accuracy of the underlying data used in the Company’s process. For example, we compared the projections of future taxable income with the actual results of prior periods as well as management’s consideration of current industry and economic trends. In each of these areas, we involved our tax professionals to assess the technical merits of the Company’s tax positions. This included assessing the Company’s correspondence with the relevant tax authorities and evaluating income tax opinions or other third-party advice obtained by the Company. | ||||
| Revenue Recognition | |||||
51
| Description of the Matter | As described in Note 1 of the consolidated financial statements, the Company enters into certain contracts to sell their products and services that contain non-standard terms and conditions and multiple performance obligations. For such contracts, significant interpretation may be required to determine the appropriate accounting, including the allocation of the transaction price among performance obligations in the arrangement and the timing of the transfer of control of promised goods or services for each of those performance obligations. In addition, the Company reduces revenue for customer and distributor programs and incentive offerings including rebates, promotions, other volume-based incentives and expected returns. The Company uses significant estimates to determine the expected variable consideration for such programs based on factors like historical experience, forecasted sales, expected customer behavior and market conditions. Our assessment of management’s evaluation of the appropriate accounting for revenue contracts and the determination of the variable consideration for sales incentives are significant to our audit because the amounts are material to the financial statements and the assessment process involves significant judgment. | ||||
| How We Addressed the Matter in Our Audit | We tested relevant controls over the identified risks related to the Company’s accounting for revenue recognition, including the controls to evaluate the appropriate accounting treatment for contracts containing non-standard terms and conditions and multiple performance obligations and the controls related to the estimation process to record the variable consideration related to certain sales incentives. Our audit procedures included, among others, inspection of contracts entered into during the period, evaluation of management’s judgments related to the interpretation of certain contract provisions including the identification of performance obligations, the method of allocating the transaction price to the performance obligations in the arrangement, and the assessment of the appropriateness of the amount of revenue recognized. We also evaluated the Company’s key assumptions and judgments and tested the completeness and accuracy of the underlying data used to determine the variable consideration for sales incentives. This included analyzing data related to the historical experience of sales incentive payments as well as understanding the current market dynamics that can affect the estimate of variable consideration to assess the Company’s judgments and estimates. | ||||
/s/ ERNST & YOUNG LLP
We have served as the Company’s auditor since 2000.
San Jose, California
December 9, 2021
52
Report of Independent Registered Public Accounting Firm
To the Stockholders and the Board of Directors of HP Inc.
Opinion on Internal Control over Financial Reporting
We have audited HP Inc. and subsidiaries’ internal control over financial reporting as of October 31, 2021, based on criteria established in Internal Control—Integrated Framework issued by the Committee of Sponsoring Organizations of the Treadway Commission (2013 framework) (the COSO criteria). In our opinion, HP Inc. and subsidiaries (the Company) maintained, in all material respects, effective internal control over financial reporting as of October 31, 2021, based on the COSO criteria.
We also have audited, in accordance with the standards of the Public Company Accounting Oversight Board (United States) (PCAOB), the consolidated balance sheets of HP Inc. and subsidiaries as of October 31, 2021 and 2020, the related consolidated statements of earnings, comprehensive income, stockholders' deficit and cash flows for each of the three years in the period ended October 31, 2021, and the related notes and our report dated December 9, 2021 expressed an unqualified opinion thereon.
Basis for Opinion
The Company’s management is responsible for maintaining effective internal control over financial reporting and for its assessment of the effectiveness of internal control over financial reporting included in the accompanying Management’s Report on Internal Control over Financial Reporting. Our responsibility is to express an opinion on the Company’s internal control over financial reporting based on our audit. We are a public accounting firm registered with the PCAOB and are required to be independent with respect to the Company in accordance with the U.S. federal securities laws and the applicable rules and regulations of the Securities and Exchange Commission and the PCAOB.
We conducted our audit in accordance with the standards of the PCAOB. Those standards require that we plan and perform the audit to obtain reasonable assurance about whether effective internal control over financial reporting was maintained in all material respects.
Our audit included obtaining an understanding of internal control over financial reporting, assessing the risk that a material weakness exists, testing and evaluating the design and operating effectiveness of internal control based on the assessed risk, and performing such other procedures as we considered necessary in the circumstances. We believe that our audit provides a reasonable basis for our opinion.
Definition and Limitations of Internal Control Over Financial Reporting
A company’s internal control over financial reporting is a process designed to provide reasonable assurance regarding the reliability of financial reporting and the preparation of financial statements for external purposes in accordance with generally accepted accounting principles. A company’s internal control over financial reporting includes those policies and procedures that (1) pertain to the maintenance of records that, in reasonable detail, accurately and fairly reflect the transactions and dispositions of the assets of the company; (2) provide reasonable assurance that transactions are recorded as necessary to permit preparation of financial statements in accordance with generally accepted accounting principles, and that receipts and expenditures of the company are being made only in accordance with authorizations of management and directors of the company; and (3) provide reasonable assurance regarding prevention or timely detection of unauthorized acquisition, use, or disposition of the company’s assets that could have a material effect on the financial statements.
Because of its inherent limitations, internal control over financial reporting may not prevent or detect misstatements. Also, projections of any evaluation of effectiveness to future periods are subject to the risk that controls may become inadequate because of changes in conditions, or that the degree of compliance with the policies or procedures may deteriorate.
/s/ ERNST & YOUNG LLP
San Jose, California
December 9, 2021
53
Management’s Report on Internal Control Over Financial Reporting
HP’s management is responsible for establishing and maintaining adequate internal control over financial reporting. HP’s internal control over financial reporting is a process designed to provide reasonable assurance regarding the reliability of financial reporting and the preparation of financial statements for external purposes in accordance with U.S. generally accepted accounting principles. HP’s internal control over financial reporting includes those policies and procedures that (i) pertain to the maintenance of records that, in reasonable detail, accurately and fairly reflect the transactions and dispositions of the assets of HP; (ii) provide reasonable assurance that transactions are recorded as necessary to permit preparation of financial statements in accordance with generally accepted accounting principles, and that receipts and expenditures of HP are being made only in accordance with authorizations of management and directors of HP; and (iii) provide reasonable assurance regarding prevention or timely detection of unauthorized acquisition, use, or disposition of HP’s assets that could have a material effect on the financial statements.
Because of its inherent limitations, internal control over financial reporting may not prevent or detect misstatements. Also, projections of any evaluation of effectiveness to future periods are subject to the risk that controls may become inadequate because of changes in conditions, or that the degree of compliance with the policies or procedures may deteriorate.
HP’s management assessed the effectiveness of HP’s internal control over financial reporting as of October 31, 2021, utilizing the criteria set forth by the Committee of Sponsoring Organizations of the Treadway Commission (COSO) in Internal Control—Integrated Framework (2013 framework). Based on the assessment by HP’s management, we determined that HP’s internal control over financial reporting was effective as of October 31, 2021. The effectiveness of HP’s internal control over financial reporting as of October 31, 2021 has been audited by Ernst & Young LLP, HP’s independent registered public accounting firm, as stated in their report which appears on page 53 of this Annual Report on Form 10-K.
| /s/ ENRIQUE LORES | /s/ MARIE MYERS | |||||||
Enrique Lores President and Chief Executive Officer December 9, 2021 | Marie Myers Chief Financial Officer December 9, 2021 | |||||||
54
HP INC. AND SUBSIDIARIES
Consolidated Statements of Earnings
| For the fiscal years ended October 31 | |||||||||||||||||
| 2021 | 2020 | 2019 | |||||||||||||||
| In millions, except per share amounts | |||||||||||||||||
| Net revenue | $ | $ | $ | ||||||||||||||
| Costs and expenses: | |||||||||||||||||
| Cost of revenue | |||||||||||||||||
| Research and development | |||||||||||||||||
| Selling, general and administrative | |||||||||||||||||
| Restructuring and other charges | |||||||||||||||||
| Acquisition-related charges | |||||||||||||||||
| Amortization of intangible assets | |||||||||||||||||
| Total costs and expenses | |||||||||||||||||
| Earnings from operations | |||||||||||||||||
| Interest and other, net | ( | ( | |||||||||||||||
| Earnings before taxes | |||||||||||||||||
| (Provision for) benefit from taxes | ( | ( | |||||||||||||||
| Net earnings | $ | $ | $ | ||||||||||||||
| Net earnings per share: | |||||||||||||||||
| Basic | $ | $ | $ | ||||||||||||||
| Diluted | $ | $ | $ | ||||||||||||||
| Weighted-average shares used to compute net earnings per share: | |||||||||||||||||
| Basic | |||||||||||||||||
| Diluted | |||||||||||||||||
The accompanying notes are an integral part of these Consolidated Financial Statements.
55
HP INC. AND SUBSIDIARIES
Consolidated Statements of Comprehensive Income
| For the fiscal years ended October 31 | |||||||||||||||||
| 2021 | 2020 | 2019 | |||||||||||||||
| In millions | |||||||||||||||||
| Net earnings | $ | $ | $ | ||||||||||||||
| Other comprehensive income (loss) before taxes: | |||||||||||||||||
| Change in unrealized components of available-for-sale debt securities: | |||||||||||||||||
| Unrealized gains arising during the period | |||||||||||||||||
| Losses reclassified into earnings | |||||||||||||||||
| Change in unrealized components of cash flow hedges: | |||||||||||||||||
| Unrealized (losses) gains arising during the period | ( | ( | |||||||||||||||
| Losses (gains) reclassified into earnings | ( | ( | |||||||||||||||
| ( | ( | ||||||||||||||||
| Change in unrealized components of defined benefit plans: | |||||||||||||||||
| Gains (losses) arising during the period | ( | ( | |||||||||||||||
| Amortization of actuarial loss and prior service benefit | |||||||||||||||||
| Curtailments, settlements and other | ( | ||||||||||||||||
| ( | |||||||||||||||||
| Change in cumulative translation adjustment | ( | ||||||||||||||||
| Other comprehensive income (loss) before taxes | ( | ( | |||||||||||||||
| (Provision for) benefit from taxes | ( | ( | |||||||||||||||
| Other comprehensive income (loss), net of taxes | ( | ( | |||||||||||||||
| Comprehensive income | $ | $ | $ | ||||||||||||||
The accompanying notes are an integral part of these Consolidated Financial Statements.
56
HP INC. AND SUBSIDIARIES
Consolidated Balance Sheets
| As of October 31 | |||||||||||
| 2021 | 2020 | ||||||||||
| In millions, except par value | |||||||||||
| ASSETS | |||||||||||
| Current assets: | |||||||||||
| Cash and cash equivalents | $ | $ | |||||||||
Accounts receivable, net of allowance for credit losses of $ | |||||||||||
| Inventory | |||||||||||
| Other current assets | |||||||||||
| Total current assets | |||||||||||
| Property, plant and equipment, net | |||||||||||
| Goodwill | |||||||||||
| Other non-current assets | |||||||||||
| Total assets | $ | $ | |||||||||
| LIABILITIES AND STOCKHOLDERS’ DEFICIT | |||||||||||
| Current liabilities: | |||||||||||
| Notes payable and short-term borrowings | $ | $ | |||||||||
| Accounts payable | |||||||||||
| Other current liabilities | |||||||||||
| Total current liabilities | |||||||||||
| Long-term debt | |||||||||||
| Other non-current liabilities | |||||||||||
| Commitments and contingencies | |||||||||||
| Stockholders’ deficit: | 0 | ||||||||||
Preferred stock, $ | |||||||||||
Common stock, $ | |||||||||||
| Additional paid-in capital | |||||||||||
| Accumulated deficit | ( | ( | |||||||||
| Accumulated other comprehensive loss | ( | ( | |||||||||
| Total stockholders’ deficit | ( | ( | |||||||||
| Total liabilities and stockholders’ deficit | $ | $ | |||||||||
The accompanying notes are an integral part of these Consolidated Financial Statements.
57
HP INC. AND SUBSIDIARIES
Consolidated Statements of Cash Flows
| For the fiscal years ended October 31 | |||||||||||||||||
| 2021 | 2020 | 2019 | |||||||||||||||
| In millions | |||||||||||||||||
| Cash flows from operating activities: | |||||||||||||||||
| Net earnings | $ | $ | $ | ||||||||||||||
| Adjustments to reconcile net earnings to net cash provided by operating activities: | |||||||||||||||||
| Depreciation and amortization | |||||||||||||||||
| Stock-based compensation expense | |||||||||||||||||
| Restructuring and other charges | |||||||||||||||||
| Deferred taxes on earnings | ( | ||||||||||||||||
| Defined benefit plan settlement (gains) charges | ( | ||||||||||||||||
| Other, net | |||||||||||||||||
| Changes in operating assets and liabilities, net of acquisitions: | |||||||||||||||||
| Accounts receivable | ( | ( | |||||||||||||||
| Inventory | ( | ( | ( | ||||||||||||||
| Accounts payable | ( | ( | |||||||||||||||
| Net investment in leases | ( | ( | |||||||||||||||
| Taxes on earnings | ( | ( | |||||||||||||||
| Restructuring and other | ( | ( | ( | ||||||||||||||
| Other assets and liabilities | ( | ( | |||||||||||||||
| Net cash provided by operating activities | |||||||||||||||||
| Cash flows from investing activities: | |||||||||||||||||
| Investment in property, plant and equipment | ( | ( | ( | ||||||||||||||
| Proceeds from sale of property, plant and equipment | |||||||||||||||||
| Purchases of available-for-sale securities and other investments | ( | ( | ( | ||||||||||||||
| Maturities and sales of available-for-sale securities and other investments | |||||||||||||||||
| Collateral posted for derivative instruments | ( | ||||||||||||||||
| Payments made in connection with business acquisitions, net of cash acquired | ( | ( | |||||||||||||||
| Net cash used in investing activities | ( | ( | ( | ||||||||||||||
| Cash flows from financing activities: | |||||||||||||||||
Proceeds from (Payments of) short-term borrowings with original maturities less than 90 days, net | ( | ||||||||||||||||
| Proceeds from short-term borrowings with original maturities greater than 90 days | |||||||||||||||||
| Proceeds from debt, net of issuance costs | |||||||||||||||||
| Payment of debt | ( | ( | ( | ||||||||||||||
| Stock-based award activities and others | ( | ( | ( | ||||||||||||||
| Repurchase of common stock | ( | ( | ( | ||||||||||||||
| Cash dividends paid | ( | ( | ( | ||||||||||||||
| Net cash used in financing activities | ( | ( | ( | ||||||||||||||
| (Decrease) increase in cash and cash equivalents | ( | ( | |||||||||||||||
| Cash and cash equivalents at beginning of period | |||||||||||||||||
| Cash and cash equivalents at end of period | $ | $ | $ | ||||||||||||||
| Supplemental cash flow disclosures: | |||||||||||||||||
| Income taxes paid, net of refunds | $ | $ | $ | ||||||||||||||
| Interest expense paid | $ | $ | $ | ||||||||||||||
| Supplemental schedule of non-cash activities: | |||||||||||||||||
| Purchase of assets under finance leases | $ | $ | $ | ||||||||||||||
The accompanying notes are an integral part of these Consolidated Financial Statements.
58
HP INC. AND SUBSIDIARIES
Consolidated Statements of Stockholders’ Deficit
| Common Stock | Additional Paid-in Capital | Accumulated Other Comprehensive Loss | Total Stockholders’ Deficit | ||||||||||||||||||||||||||||||||
| Number of Shares | Par Value | Accumulated Deficit | |||||||||||||||||||||||||||||||||
| In millions, except number of shares in thousands | |||||||||||||||||||||||||||||||||||
Balance October 31, 2018 | $ | $ | $ | ( | $ | ( | $ | ( | |||||||||||||||||||||||||||
| Net earnings | |||||||||||||||||||||||||||||||||||
| Other comprehensive loss, net of taxes | ( | ( | |||||||||||||||||||||||||||||||||
| Comprehensive income | |||||||||||||||||||||||||||||||||||
| Issuance of common stock in connection with employee stock plans and other | ( | ( | |||||||||||||||||||||||||||||||||
| Repurchases of common stock | ( | ( | ( | ( | ( | ||||||||||||||||||||||||||||||
Cash dividends ($ | ( | ( | |||||||||||||||||||||||||||||||||
| Stock-based compensation expense | |||||||||||||||||||||||||||||||||||
| Adjustment for adoption of accounting standards | ( | ( | |||||||||||||||||||||||||||||||||
Balance October 31, 2019 | $ | $ | $ | ( | $ | ( | $ | ( | |||||||||||||||||||||||||||
| Net earnings | |||||||||||||||||||||||||||||||||||
| Other comprehensive loss, net of taxes | ( | ( | |||||||||||||||||||||||||||||||||
| Comprehensive income | |||||||||||||||||||||||||||||||||||
| Issuance of common stock in connection with employee stock plans and other | ( | ( | |||||||||||||||||||||||||||||||||
| Repurchases of common stock | ( | ( | ( | ( | ( | ||||||||||||||||||||||||||||||
Cash dividends ($ | ( | ( | |||||||||||||||||||||||||||||||||
| Stock-based compensation expense | |||||||||||||||||||||||||||||||||||
| Adjustment for adoption of accounting standards | |||||||||||||||||||||||||||||||||||
Balance October 31, 2020 | $ | $ | $ | ( | $ | ( | $ | ( | |||||||||||||||||||||||||||
| Net earnings | |||||||||||||||||||||||||||||||||||
| Other comprehensive income, net of taxes | |||||||||||||||||||||||||||||||||||
| Comprehensive income | |||||||||||||||||||||||||||||||||||
| Issuance of common stock in connection with employee stock plans and other | ( | ( | |||||||||||||||||||||||||||||||||
| Repurchases of common stock | ( | ( | ( | ( | ( | ||||||||||||||||||||||||||||||
Cash dividends ($ | ( | ( | |||||||||||||||||||||||||||||||||
| Stock-based compensation expense | |||||||||||||||||||||||||||||||||||
Balance October 31, 2021 | $ | $ | $ | ( | $ | ( | $ | ( | |||||||||||||||||||||||||||
The accompanying notes are an integral part of these Consolidated Financial Statements.
59
Note 1: Summary of Significant Accounting Policies
Basis of Presentation
The accompanying Consolidated Financial Statements of HP and its wholly-owned subsidiaries are prepared in conformity with U.S. GAAP.
Principles of Consolidation
The Consolidated Financial Statements include the accounts of HP and its subsidiaries and affiliates in which HP has a controlling financial interest or is the primary beneficiary. All intercompany balances and transactions have been eliminated.
Reclassifications
HP has reclassified certain prior-year amounts to conform to the current-year presentation.
Use of Estimates
The preparation of financial statements in accordance with U.S. GAAP requires management to make estimates and assumptions that affect the amounts reported in HP’s Consolidated Financial Statements and accompanying notes. Actual results may differ materially from those estimates. As of October 31, 2021, the extent to which the COVID-19 pandemic will impact our business going forward depends on numerous dynamic factors which we cannot reliably predict. As a result, many of our estimates and assumptions required increased judgment and may carry a higher degree of variability and volatility. As the events continue to evolve with respect to the pandemic, our estimates may materially change in future periods.
Foreign Currency Translation
HP predominantly uses the U.S. dollar as its functional currency. Assets and liabilities denominated in non-U.S. dollars are remeasured into U.S. dollars at current exchange rates for monetary assets and liabilities and at historical exchange rates for non-monetary assets and liabilities. Net revenue, costs and expenses denominated in non-U.S. dollars are recorded in U.S. dollars at monthly average exchange rates prevailing during the period. HP includes gains or losses from foreign currency remeasurement in Interest and other, net in the Consolidated Statements of Earnings. Certain foreign subsidiaries designate the local currency as their functional currency, and HP records the translation of their assets and liabilities into U.S. dollars at the balance sheet dates as translation adjustments and includes them as a component of Accumulated other comprehensive loss.
Separation Transaction
On November 1, 2015, Hewlett-Packard Company completed the separation of Hewlett Packard Enterprise Company (“Hewlett Packard Enterprise”), Hewlett-Packard Company’s former enterprise technology infrastructure, software, services and financing businesses (the “Separation”). In connection with the Separation, HP and Hewlett Packard Enterprise entered into a separation and distribution agreement and various other agreements which remain enforceable and provide a framework for the continuing relationships between the parties. For more information on the impacts of these agreements, see Note 14, “Litigation and Contingencies”.
Oracle litigation proceeds
On October 12, 2021, Oracle paid approximately $4.65 billion, to satisfy the judgement with interest, related to the litigation in connection with Oracle’s discontinuation of software support for former Hewlett-Packard Company’s Itanium-based line of mission-critical servers. The net proceeds from the judgement are being shared equally between HP and Hewlett Packard Enterprise pursuant to the terms of the separation and distribution agreement. For the fiscal year 2021, HP has recorded a gain of $2.3 billion in Interest and other, net and corresponding tax impact of $0.5 billion in Provision for taxes on the Consolidated Statements of Earnings as HP believes that the likelihood of the reduction or reversal of the judgement is remote. For more information, see Note 14, “Litigation and Contingencies”.
Recently Adopted Accounting Pronouncements
In June 2016, the FASB issued guidance, which requires credit losses on financial assets measured at amortized cost basis to be presented at the net amount expected to be collected, not based on incurred losses. Furthermore, credit losses on available-for-sale debt securities should be recorded through an allowance for credit losses limited to the amount by which fair value is below amortized cost. HP adopted the new credit loss standard as of November 1, 2020 using a modified retrospective approach. The cumulative effect upon adoption was not material to the Consolidated Financial Statements.
Revenue Recognition
General
60
HP INC. AND SUBSIDIARIES
Notes to Consolidated Financial Statements (Continued)
Note 1: Summary of Significant Accounting Policies (Continued)
HP recognizes revenues at a point in time or over time depicting the transfer of promised goods or services to customers in an amount that reflects the consideration to which HP expects to be entitled in exchange for those goods or services. HP follows the five-step model for revenue recognition as summarized below:
1. Identify the contract with a customer - A contract with customer exists when (i) it is approved and signed by all parties,
(ii) each party’s rights and obligations can be identified, (iii) payment terms are defined, (iv) it has commercial substance and (v) the customer has the ability and intent to pay. HP evaluates customers’ ability to pay based on various factors like historical payment experience, financial metrics and customer credit scores. While the majority of our sales contracts contain standard terms and conditions, there are certain contracts with non-standard terms and conditions.
2. Identify the performance obligations in the contract - HP evaluates each performance obligation in an arrangement to
determine whether it is distinct, such as hardware and/or service. A performance obligation constitutes distinct goods or services when the customer can benefit from such goods or services either on its own or together with other resources that are readily available to the customer and the performance obligation is distinct within the context of the contract.
3. Determine the transaction price - Transaction price is the amount of consideration to which HP expects to be entitled in
exchange for transferring goods or services to the customer. If the transaction price includes a variable amount, HP estimates the amount it expects to be entitled to using either the expected value or the most likely amount method.
HP reduces the transaction price at the time of revenue recognition for customer and distributor programs and incentive
offerings, rebates, promotions, other volume-based incentives and expected returns. HP uses estimates to determine the expected variable consideration for such programs based on factors like historical experience, expected consumer behavior and market conditions.
HP has elected the practical expedient of not accounting for significant financing components if the period between
revenue recognition and when the customer pays for the product or service is one year or less.
4. Allocate the transaction price to performance obligations in the contract - When a sales arrangement contains multiple
performance obligations, such as hardware and/or services, HP allocates revenue to each performance obligation in proportion to their selling price. The selling price for each performance obligation is based on its Standalone Selling Price (“SSP”). HP establishes SSP using the price charged for a performance obligation when sold separately (“observable price”) and, in some instances, using the price established by management having the relevant authority. When observable price is not available, HP establishes SSP based on management judgment considering internal factors such as margin objectives, pricing practices and controls, customer segment pricing strategies and the product life cycle. Consideration is also given to market conditions such as competitor pricing strategies and technology industry life cycles.
5. Recognize revenue when (or as) the performance obligation is satisfied - Revenue is recognized when, or as, a
performance obligation is satisfied by transferring control of a promised good or service to a customer. HP generally invoices the customer upon delivery of the goods or services and the payments are due as per contract terms. For fixed price support or maintenance contracts that are in the nature of stand-ready obligations, payments are generally received in advance from customers and revenue is recognized on a straight-line basis over the duration of the contract.
HP reports revenue net of any taxes collected from customers and remitted to government authorities, and the collected taxes are recorded as other current liabilities until remitted to the relevant government authority. HP includes costs related to shipping and handling in Cost of revenue.
HP records revenue on a gross basis when HP is a principal in the transaction and on a net basis when HP is acting as an agent between the customer and the vendor. HP considers several factors to determine whether it is acting as a principal or an agent, most notably whether HP is the primary obligor to the customer, has established its own pricing and has inventory and credit risks.
Hardware
HP transfers control of the products to the customer at the time the product is delivered to the customer and recognizes revenue accordingly, unless customer acceptance is uncertain or significant obligations to the customer remain unfulfilled. HP records revenue from the sale of equipment under sales-type leases as revenue at the commencement of the lease.
Services
HP recognizes revenue from fixed-price support, maintenance and other service contracts over time depicting the pattern of service delivery and recognizes the costs associated with these contracts as incurred.
Contract Assets and Liabilities
Contract assets are rights to consideration in exchange for goods or services that HP has transferred to a customer when such right is conditional on something other than the passage of time. Such contract assets are not material to HP’s Consolidated Financial Statements.
61
HP INC. AND SUBSIDIARIES
Notes to Consolidated Financial Statements (Continued)
Note 1: Summary of Significant Accounting Policies (Continued)
Contract liabilities are recorded as deferred revenues when amounts invoiced to customers are more than the revenues recognized or when payments are received in advance for fixed-price support or maintenance contracts. The short-term and long-term deferred revenues are reported within the other current liabilities and other non-current liabilities respectively.
Cost to obtain a contract and fulfillment cost
Incremental direct costs of obtaining a contract primarily consist of sales commissions. HP has elected the practical expedient to expense as incurred the costs to obtain a contract with a benefit period equal to or less than one year. For contracts with a period of benefit greater than one year, HP capitalizes incremental costs of obtaining a contract with a customer and amortizes these costs over their expected period of benefit provided such costs are recoverable.
Fulfillment costs consist of set-up and transition costs related to other service contracts. These costs generate or enhance resources of HP that will be used in satisfying the performance obligation in the future and are capitalized and amortized over the expected period of the benefit, provided such costs are recoverable.
See Note 7, “Supplementary Financial Information” for details on net revenue by region, cost to obtain a contract and fulfillment cost, contract liabilities and value of remaining performance obligations.
Leases
At the inception of a contract, HP assesses whether the contract is, or contains, a lease. The assessment is based on (1) whether the contract involves the use of a distinct identified asset, (2) whether HP obtains the right to substantially all the economic benefit from the use of the asset throughout the period, and (3) whether HP has the right to direct the use of the asset.
All significant lease arrangements are recognized at lease commencement. Leases with a lease term of 12 months or less at inception are not recorded on the Consolidated Balance Sheets and are expensed on a straight-line basis over the lease term in the Consolidated Statement of Earnings. HP determines the lease term by assuming the exercise of renewal options that are reasonably certain. As most of the leases do not provide an implicit interest rate, HP uses the unsecured borrowing rate and risk-adjusts that rate to approximate a collateralized rate at the commencement date to determine the present value of future payments that are reasonably certain.
Retirement and Post-Retirement Plans
HP has various defined benefit, other contributory and non-contributory retirement and post-retirement plans. HP generally amortizes unrecognized actuarial gains and losses on a straight-line basis over the average remaining estimated service life of participants. In limited cases, HP amortizes actuarial gains and losses using the corridor approach. See Note 4, “Retirement and Post-Retirement Benefit Plans” for a full description of these plans and the accounting and funding policies.
62
HP INC. AND SUBSIDIARIES
Notes to Consolidated Financial Statements (Continued)
Note 1: Summary of Significant Accounting Policies (Continued)
HP recognizes deferred tax assets and liabilities for the expected tax consequences of temporary differences between the tax bases of assets and liabilities and their reported amounts using enacted tax rates in effect for the year the differences are expected to reverse. HP records a valuation allowance to reduce the deferred tax assets to the amount that is more likely than not to be realized.
HP records accruals for uncertain tax positions when HP believes that it is not more likely than not that the tax position will be sustained on examination by the taxing authorities based on the technical merits of the position. HP makes adjustments to these accruals when facts and circumstances change, such as the closing of a tax audit or the refinement of an estimate. The provision for income taxes includes the effects of adjustments for uncertain tax positions, as well as any related interest and penalties.
Accounts Receivable
HP records allowance for credit losses for the current expected credit losses inherent in the asset over its expected life. The allowance for credit losses is maintained based on the relevant information about past events, including historical experience, current conditions, and reasonable and supportable forecasts that affect the collectability of the reported amount.
HP records a specific reserve for individual accounts when HP becomes aware of specific customer circumstances, such as in the case of a bankruptcy filing or deterioration in the customer’s operating results or financial position. If there are additional changes in circumstances related to the specific customer, HP further adjusts estimates of the recoverability of receivables. HP assesses collectability by pooling receivables where similar risk characteristics exist.
HP maintains an allowance for credit losses for all other customers based on a variety of factors, including the use of third-party credit risk models that generate quantitative measures of default probabilities based on market factors, financial condition of customers, length of time receivables are past due, trends in the weighted-average risk rating for the portfolio, macroeconomic conditions, information derived from competitive benchmarking, significant one-time events, and historical experience. The past due or delinquency status of a receivable is based on the contractual payment terms of the receivable.
HP has third-party short-term financing arrangements intended to facilitate the working capital requirements of certain customers. These financing arrangements, which in certain cases provide for partial recourse, result in the transfer of HP’s trade receivables to a third-party. HP reflects amounts transferred to, but not yet collected from the third-party in Accounts receivable in the Consolidated Balance Sheets. For arrangements involving an element of recourse, the fair value of the recourse obligation is measured using market data from similar transactions and reported as a current liability in the Consolidated Balance Sheets.
Concentrations of Risk
Financial instruments that potentially subject HP to significant concentrations of credit risk consist principally of cash and cash equivalents, investments, receivables from trade customers and contract manufacturers and derivatives.
HP maintains cash and cash equivalents, investments, derivatives and certain other financial instruments with various financial institutions. These financial institutions are located in many different geographic regions, and HP’s policy is designed to limit exposure from any particular institution. As part of its risk management processes, HP performs periodic evaluations of the relative credit standing of these financial institutions. HP has not sustained material credit losses from instruments held at these financial institutions. HP utilizes derivative contracts to protect against the effects of foreign currency, interest rate and, on certain investment exposures. Such contracts involve the risk of non-performance by the counterparty, which could result in a material loss. The likelihood of which HP deems to be remote.
HP sells a significant portion of its products through third-party distributors and resellers and, as a result, maintains individually significant receivable balances with these parties. If the financial condition or operations of these distributors’ and resellers’ aggregated business deteriorates substantially, HP’s operating results could be adversely affected. The ten largest distributor and reseller receivable balances, which were concentrated primarily in North America and Europe, collectively represented approximately 43 % and 47 % of gross accounts receivable as of October 31, 2021 and 2020, respectively. No single customer accounts for more than 10% of gross accounts receivable as of October 31, 2021 or 2020. Credit risk with respect to other accounts receivable is generally diversified due to HP’s large customer base and their dispersion across many different industries and geographic markets. HP performs ongoing credit evaluations of the financial condition of its third-party distributors, resellers and other customers and may require collateral, such as letters of credit and bank guarantees, in certain circumstances.
HP utilizes outsourced manufacturers around the world to manufacture HP-designed products. HP may purchase product components from suppliers and sell those components to its outsourced manufacturers thereby creating receivable balances from the outsourced manufacturers. The three largest outsourced manufacturer receivable balances collectively represented 85 % and 89 % of HP’s supplier receivables of $1.4 billion and $1.2 billion as of October 31, 2021 and 2020, respectively. HP includes the supplier receivables in Other current assets in the Consolidated Balance Sheets on a gross basis. HP’s credit risk
63
HP INC. AND SUBSIDIARIES
Notes to Consolidated Financial Statements (Continued)
Note 1: Summary of Significant Accounting Policies (Continued)
associated with these receivables is mitigated wholly or in part, by the amount HP owes to these outsourced manufacturers, as HP generally has the legal right to offset its payables to the outsourced manufacturers against these receivables. HP does not reflect the sale of these components in net revenue and does not recognize any profit on these component sales until the related products are sold by HP, at which time any profit is recognized as a reduction to cost of revenue.
HP obtains a significant number of components from single source suppliers due to technology, availability, price, quality or other considerations. The loss of a single source supplier, the deterioration of HP’s relationship with a single source supplier, or any unilateral modification to the contractual terms under which HP is supplied components by a single source supplier could adversely affect HP’s net revenue, cash flows and gross margins.
Upon completion of the Separation on November 1, 2015, HP recorded net income tax indemnification receivables from Hewlett Packard Enterprise for certain income tax liabilities that HP is jointly and severally liable for, but for which it is indemnified by Hewlett Packard Enterprise under the tax matters agreement (“TMA”). The TMA was terminated during the fourth quarter of fiscal year 2019.
Inventory
HP values inventory at the lower of cost or market. Cost is computed using standard cost which approximates actual cost on a first-in, first-out basis. Adjustments, if required, to reduce the cost of inventory to market (net realizable value) are made for estimated excess, obsolete or impaired balances after considering judgments related to future demand and market conditions, along with the impact of COVID-19.
Property, Plant and Equipment, Net
HP reflects property, plant and equipment at cost less accumulated depreciation. HP capitalizes additions and improvements and expenses maintenance and repairs as incurred. Depreciation expense is recognized on a straight-line basis over the estimated useful lives of the assets. Estimated useful lives are to 40 years for buildings and improvements and to 15 years for machinery and equipment. HP depreciates leasehold improvements over the life of the lease or the asset, whichever is shorter. HP depreciates equipment held for lease over the initial term of the lease to the equipment’s estimated residual value. On retirement or disposition, the asset cost and related accumulated depreciation are removed from the Consolidated Balance Sheets with any gain or loss recognized in the Consolidated Statements of Earnings.
Internal Use Software and Cloud Computing Arrangements
HP capitalizes external costs and directly attributable internal costs to acquire or create internal use software which are incurred subsequent to the completion of the preliminary project stage. These costs relate to activities such as software design, configuration, coding, testing, and installation. Costs related to post-implementation activities such as training and maintenance are expensed as incurred. Once the software is substantially complete and ready for its intended use, capitalized development costs are amortized straight-line over the estimated useful life of the software, generally not to exceed five years .
HP also enters into certain cloud-based software hosting arrangements that are accounted for as service contracts. For internal-use software obtained through a hosting arrangement that is in the nature of a service contract, HP incurs certain implementation costs such as integrating, configuring, and software customization, which are consistent with costs incurred during the application development stage for on-premise software. HP applies the same guidance to determine costs that are eligible for capitalization. For these arrangements, HP amortizes the capitalized development costs straight-line over the fixed, non-cancellable term of the associated hosting arrangement plus any reasonably certain renewal periods. HP also applies the same impairment model to both internal-use software and capitalized implementation costs in a software hosting arrangement that is in the nature of a service contract.
Business Combinations
HP includes the results of operations of the acquired business in HP’s consolidated results prospectively from the acquisition date. HP allocates the purchase consideration to the assets acquired, liabilities assumed, and non-controlling interests in the acquired entity generally based on their fair values at the acquisition date. The excess of the fair value of purchase consideration over the fair value of these assets acquired, liabilities assumed and non-controlling interests in the acquired entity is recorded as goodwill. The primary items that generate goodwill include the value of the synergies between the acquired company and HP, and the value of the acquired assembled workforce, neither of which qualify for recognition as an intangible asset. Acquisition-related charges are recognized separately from the business combination and are expensed as incurred. These charges primarily include, direct third-party professional and legal fees, and integration-related costs.
Goodwill
HP reviews goodwill for impairment annually during its fourth quarter and whenever events or changes in circumstances indicate the carrying amount of goodwill may not be recoverable. HP can elect to perform a qualitative assessment to test a
64
HP INC. AND SUBSIDIARIES
Notes to Consolidated Financial Statements (Continued)
Note 1: Summary of Significant Accounting Policies (Continued)
reporting unit’s goodwill for impairment or HP can directly perform the quantitative impairment test. Based on the qualitative assessment, if HP determines that the fair value of a reporting unit is more likely than not (i.e., a likelihood of more than 50 percent) to be less than its carrying amount, a quantitative impairment test will be performed.
In the quantitative impairment test, HP compares the fair value of each reporting unit to its carrying amount with the fair values derived most significantly from the income approach, and to a lesser extent, the market approach. Under the income approach, HP estimates the fair value of a reporting unit based on the present value of estimated future cash flows. HP bases cash flow projections on management’s estimates of revenue growth rates and operating margins, taking into consideration industry and market conditions. HP bases the discount rate on the weighted-average cost of capital adjusted for the relevant risk associated with business-specific characteristics and the uncertainty related to the reporting unit’s ability to execute on the projected cash flows. Under the market approach, HP estimates fair value based on market multiples of revenue and earnings derived from comparable publicly-traded companies with similar operating and investment characteristics as the reporting unit. HP weights the fair value derived from the market approach depending on the level of comparability of these publicly-traded companies to the reporting unit. When market comparables are not meaningful or not available, HP estimates the fair value of a reporting unit using only the income approach.
In order to assess the reasonableness of the estimated fair value of HP’s reporting units, HP compares the aggregate reporting unit fair value to HP’s market capitalization on an overall basis and calculates an implied control premium (the excess of the sum of the reporting units’ fair value over HP’s market capitalization on an overall basis). HP evaluates the control premium by comparing it to observable control premiums from recent comparable transactions. If the implied control premium is determined to not be reasonable in light of these recent transactions, HP re-evaluates its reporting unit fair values, which may result in an adjustment to the discount rate and/or other assumptions. This re-evaluation could result in a change to the estimated fair value for certain or all reporting units.
If the fair value of a reporting unit exceeds the carrying amount of the net assets assigned to that reporting unit, goodwill is not impaired. If the fair value of the reporting unit is less than its carrying amount, goodwill is impaired and the excess of the reporting unit’s carrying value over the fair value is recognized as an impairment loss.
Debt and Marketable Equity Securities Investments
HP determines the appropriate classification of its investments at the time of purchase and re-evaluates the classifications at each balance sheet date. Debt and marketable equity securities are generally considered available-for-sale. All highly liquid investments with maturities of three months or less at the date of purchase are classified as cash equivalents. Marketable debt securities with maturities of twelve months or less are classified as short-term investments and marketable debt securities with maturities greater than twelve months are classified based on their availability for use in current operations. Marketable equity securities, including mutual funds, are classified as either short or long-term based on the nature of each security and its availability for use in current operations.
Available-for-sale debt securities are reported at fair value with unrealized gains and losses, net of applicable taxes, in Accumulated other comprehensive loss. Unrealized gains and losses on equity securities, credit losses and impairments on available-for-sale debt securities are recorded in Consolidated Statements of Earnings. Realized gains and losses on available-for-sale securities are calculated at the individual security level and included in Interest and other, net in the Consolidated Statements of Earnings.
HP monitors its investment portfolio for potential impairment and credit losses on a quarterly basis. If HP intends to sell a debt security or it is more likely than not that HP will be required to sell the security before recovery, then a decline in fair value below cost is recorded as an impairment charge in Interest and other, net and a new cost basis in the investment is established.
In other cases, if the carrying amount of an investment in debt securities exceeds its fair value and the decline in value is determined to be due to credit related reasons, HP records a credit loss allowance, limited by the amount that fair value is less than the amortized cost basis. HP recognizes the corresponding charge in Interest and other, net and the remaining unrealized loss, if any, in Accumulated other comprehensive loss in the Consolidated Balance Sheets. Factors that HP considers while determining the credit loss allowance includes, but is not limited to, severity and the reason for the decline in value, interest rate changes and counterparty long-term ratings.
Derivatives
HP uses derivative instruments, primarily forward contracts, interest rate swaps, total return swaps, treasury rate locks, forward starting swaps and, at times, option contracts to hedge certain foreign currency, interest rate and, return on certain investment exposures. HP also may use other derivative instruments not designated as hedges, such as forwards used to hedge foreign currency balance sheet exposures. HP does not use derivative instruments for speculative purposes. See Note 10, “Financial Instruments” for a full description of HP’s derivative instrument activities and related accounting policies.
65
HP INC. AND SUBSIDIARIES
Notes to Consolidated Financial Statements (Continued)
Note 1: Summary of Significant Accounting Policies (Continued)
Loss Contingencies
HP is involved in various lawsuits, claims, investigations and proceedings that arise in the ordinary course of business. HP records a liability for contingencies when it believes it is both probable that a liability has been incurred and the amount of the loss can be reasonably estimated. See Note 14, “Litigation and Contingencies” for a full description of HP’s loss contingencies and related accounting policies.
66
Note 2: Segment Information
HP is a leading global provider of personal computing and other access devices, imaging and printing products, and related technologies, solutions and services. HP sells to individual consumers, small- and medium-sized businesses (“SMBs”) and large enterprises, including customers in the government, health and education sectors. HP goes to market through its extensive channel network and direct sales.
HP’s operations are organized into three reportable segments: Personal Systems, Printing and Corporate Investments. HP’s organizational structure is based on many factors that the chief operating decision maker (“CODM”) uses to evaluate, view and run the business operations, which include, but are not limited to, customer base and homogeneity of products and technology. The segments are based on this organizational structure and information reviewed by HP’s CODM to evaluate segment results. The CODM uses several metrics to evaluate the performance of the overall business, including earnings from operations, and uses these results to allocate resources to each of the segments.
A summary description of each segment is as follows:
Personal Systems offers commercial and consumer desktop and notebook personal computers (“PCs”), workstations, thin clients, commercial mobility devices, retail point-of-sale (“POS”) systems, displays and peripherals, software, support and services. HP groups commercial notebooks, commercial desktops, commercial services, commercial mobility devices, commercial detachables and convertibles, workstations, retail POS systems and thin clients into commercial PCs and consumer notebooks, consumer desktops, consumer services and consumer detachables into consumer PCs when describing performance in these markets. Described below are HP’s global business capabilities within Personal Systems:
•Commercial PCs are optimized for use by enterprise, public sector which includes education, and SMB customers, with a focus on robust designs, security, serviceability, connectivity, reliability and manageability in the customer’s environment. Additionally, HP offers a range of services and solutions to enterprise, public sector which includes education, and SMB customers to help them manage the lifecycle of their PC and mobility installed base.
•Consumer PCs are optimized for consumer usage, focusing on gaming, learning and working remotely, consuming multi-media for entertainment, managing personal life activities, staying connected, sharing information, getting things done for work including creating content, and staying informed and secure.
Personal Systems groups its global business capabilities into the following business units when reporting business performance:
•Notebooks consists of consumer notebooks, commercial notebooks, mobile workstations, peripherals, and commercial mobility devices;
• Desktops includes consumer desktops, commercial desktops, thin clients, displays, peripherals, and retail POS systems;
• Workstations consists of desktop workstations, displays, and peripherals; and
• Other consists of consumer and commercial services as well as other Personal Systems capabilities.
Printing provides consumer and commercial printer hardware, supplies, services and solutions. Printing is also focused on imaging solutions in the commercial and industrial markets. Described below are HP’s global business capabilities within Printing.
•Office Printing Solutions delivers HP’s office printers, supplies, services and solutions to SMBs and large enterprises. It also includes OEM hardware and solutions, and some Samsung-branded supplies.
•Home Printing Solutions delivers innovative printing products, supplies, services and solutions for the home, home business and micro business customers utilizing both HP’s Ink and Laser technologies. It also includes some Samsung-branded supplies.
•Graphics Solutions delivers large-format, commercial and industrial solutions and supplies to print service providers and packaging converters through a wide portfolio of printers and presses (HP DesignJet, HP Latex, HP Indigo and HP PageWide Web Presses).
•3D Printing & Digital Manufacturing offers a portfolio of additive manufacturing solutions and supplies to help customers succeed in their additive and digital manufacturing journey. HP offers complete solutions in collaboration with an ecosystem of partners.
67
HP INC. AND SUBSIDIARIES
Notes to Consolidated Financial Statements (Continued)
Note 2: Segment Information (Continued)
Printing groups its global business capabilities into the following business units when reporting business performance:
•Commercial consists of office printing solutions, graphics solutions and 3D printing & digital manufacturing, excluding supplies;
•Consumer consists of home printing solutions, excluding supplies; and
•Supplies comprises a set of highly innovative consumable products, ranging from ink and laser cartridges to media, graphics supplies and 3D printing & digital manufacturing supplies, for recurring use in consumer and commercial hardware.
Corporate Investments includes HP Labs and certain business incubation and investment projects.
68
HP INC. AND SUBSIDIARIES
Notes to Consolidated Financial Statements (Continued)
Note 2: Segment Information (Continued)
Segment Operating Results from Operations and the reconciliation to HP consolidated results were as follows:
| For the fiscal years ended October 31 | |||||||||||||||||
| 2021 | 2020 | 2019 | |||||||||||||||
| In millions | |||||||||||||||||
| Net revenue: | |||||||||||||||||
| Notebooks | $ | $ | $ | ||||||||||||||
| Desktops | |||||||||||||||||
| Workstations | |||||||||||||||||
| Other | |||||||||||||||||
| Personal Systems | |||||||||||||||||
| Supplies | |||||||||||||||||
| Commercial | |||||||||||||||||
| Consumer | |||||||||||||||||
| Printing | |||||||||||||||||
| Corporate Investments | |||||||||||||||||
| Total segment net revenue | |||||||||||||||||
| Other | ( | ( | ( | ||||||||||||||
| Total net revenue | $ | $ | $ | ||||||||||||||
| Earnings before taxes: | |||||||||||||||||
| Personal Systems | $ | $ | $ | ||||||||||||||
| Printing | |||||||||||||||||
| Corporate Investments | ( | ( | ( | ||||||||||||||
| Total segment earnings from operations | $ | $ | $ | ||||||||||||||
| Corporate and unallocated costs and other | ( | ( | ( | ||||||||||||||
| Stock-based compensation expense | ( | ( | ( | ||||||||||||||
| Restructuring and other charges | ( | ( | ( | ||||||||||||||
| Acquisition-related charges | ( | ( | ( | ||||||||||||||
| Amortization of intangible assets | ( | ( | ( | ||||||||||||||
| Interest and other, net | ( | ( | |||||||||||||||
| Total earnings before taxes | $ | $ | $ | ||||||||||||||
Segment Assets
HP allocates assets to its business segments based on the segments primarily benefiting from the assets. Total assets by segment and the reconciliation of segment assets to HP consolidated assets were as follows:
| As of October 31 | |||||||||||
| 2021 | 2020 | ||||||||||
| In millions | |||||||||||
| Personal Systems | $ | $ | |||||||||
| Printing | |||||||||||
| Corporate Investments | |||||||||||
| Corporate and unallocated assets | |||||||||||
| Total assets | $ | $ | |||||||||
69
HP INC. AND SUBSIDIARIES
Notes to Consolidated Financial Statements (Continued)
Note 2: Segment Information (Continued)
Major Customers
No single customer represented 10% or more of HP’s net revenue in any fiscal year presented.
Geographic Information
Net revenue by country is based upon the sales location that predominately represents the customer location. For each of the fiscal years of 2021, 2020 and 2019, other than the United States, no country represented more than 10% of HP net revenue.
Net revenue by country was as follows:
| For the fiscal years ended October 31 | |||||||||||||||||
| 2021 | 2020 | 2019 | |||||||||||||||
| In millions | |||||||||||||||||
| United States | $ | $ | $ | ||||||||||||||
| Other countries | |||||||||||||||||
| Total net revenue | $ | $ | $ | ||||||||||||||
Net property, plant and equipment by country in which HP operates was as follows:
| As of October 31 | |||||||||||
| 2021 | 2020 | ||||||||||
| In millions | |||||||||||
| United States | $ | $ | |||||||||
| Singapore | |||||||||||
| South Korea | |||||||||||
| Other countries | |||||||||||
| Total property, plant and equipment, net | $ | $ | |||||||||
No single country other than those represented above exceeds 10% or more of HP’s total net property, plant and equipment in any fiscal year presented.
70
Note 3: Restructuring and Other Charges
Summary of Restructuring Plans
HP’s restructuring activities in fiscal years 2021, 2020 and 2019 summarized by plan were as follows:
| Fiscal 2020 Plan | Other prior year plans(1) | Total | |||||||||||||||||||||
| Severance and EER | Non-labor | ||||||||||||||||||||||
| In millions | |||||||||||||||||||||||
| Accrued balance as of October 31, 2018 | $ | $ | $ | $ | |||||||||||||||||||
| Charges | |||||||||||||||||||||||
| Cash payments | ( | ( | |||||||||||||||||||||
| Non-cash and other adjustments | ( | ( | ( | ||||||||||||||||||||
| Accrued balance as of October 31, 2019 | |||||||||||||||||||||||
| Charges | |||||||||||||||||||||||
| Cash payments | ( | ( | ( | ( | |||||||||||||||||||
| Non-cash and other adjustments | ( | (2) | ( | ( | |||||||||||||||||||
| Accrued balance as of October 31, 2020 | |||||||||||||||||||||||
| Charges | |||||||||||||||||||||||
| Cash payments | ( | ( | ( | ( | |||||||||||||||||||
| Non-cash and other adjustments | ( | ( | ( | ||||||||||||||||||||
| Accrued balance as of October 31, 2021 | $ | $ | $ | $ | |||||||||||||||||||
| Total costs incurred to date as of October 31, 2021 | $ | $ | $ | $ | |||||||||||||||||||
| Reflected in Consolidated Balance Sheets: | |||||||||||||||||||||||
| Other current liabilities | $ | $ | $ | $ | |||||||||||||||||||
(1) Includes prior-year plans which are substantially complete. HP does not expect any further material activity associated
with these plans.
(2) Includes reclassification of liability related to the Enhanced Early Retirement (“EER”) plan of $44 million for certain healthcare and medical savings account benefits to pension and post retirement plans. See Note 4 “Retirement and Post-Retirement Benefit Plans” for further information.
Fiscal 2020 Plan
On September 30, 2019, HP’s Board of Directors approved the Fiscal 2020 Plan intended to optimize and simplify its operating model and cost structure that HP expects will be implemented through fiscal 2022. HP expects to reduce global headcount by approximately 7,000 to 9,000 employees through a combination of employee exits and voluntary EER. HP estimates that it will incur pre-tax charges of approximately $1.0 billion relating to labor and non-labor actions. HP expects to incur approximately $0.8 billion primarily in labor costs related to workforce reductions and the remaining costs will relate to non-labor actions and other charges.
Other charges
Other charges include non-recurring costs, including those as a result of information technology rationalization efforts and proxy contest activities, and are distinct from ongoing operational costs. These costs primarily relate to third-party legal, professional services and other non-recurring costs. HP incurred $22 million, $105 million and $28 million of other charges in fiscal year 2021, 2020 and 2019, respectively.
71
Note 4: Retirement and Post-Retirement Benefit Plans
Defined Benefit Plans
HP sponsors a number of defined benefit pension plans worldwide. The most significant defined benefit plan, the HP Inc. Pension Plan (“Pension Plan”) is a frozen plan in the United States.
HP reduces the benefit payable to certain U.S. employees under the Pension Plan for service before 1993, if any, by any amounts due to the employee under HP’s frozen defined contribution Deferred Profit-Sharing Plan (“DPSP”). At October 31, 2021 and 2020, the fair value of plan assets of the DPSP was $482 million and $463 million, respectively. The DPSP obligations are equal to the plan assets and are recognized as an offset to the Pension Plan when HP calculates its defined benefit pension cost and obligations.
In August 2021, HP entered into an agreement with The Prudential Insurance Company of America (“Prudential”) to purchase an irrevocable group annuity contract and transfer approximately $5.2 billion of the Pension Plan obligations. Under the agreement, Prudential assumed responsibility for pension benefits and annuity administration for approximately 41,000 retirees and beneficiaries, with no changes to the amount or timing of monthly retirement benefit payments. This transaction closed in the fourth quarter of fiscal year 2021 and was funded by the assets of the Pension Plan. HP recorded a settlement gain of approximately $39 million in Interest and other, net on the Consolidated Statements of Earnings, with no cash flow impact.
Post-Retirement Benefit Plans
HP sponsors retiree health and welfare benefit plans, of which the most significant are in the United States. Under the HP Inc. Retiree Welfare Benefits Plan, certain pre-2003 retirees and grandfathered participants with continuous service to HP since 2002 are eligible to receive partially subsidized medical coverage based on years of service at retirement. HP’s share of the premium cost is capped for all subsidized medical coverage provided under the HP Inc. Retiree Welfare Benefits Plan. HP currently leverages the employer group waiver plan process to provide HP Inc. Retiree Welfare Benefits Plan post-65 prescription drug coverage under Medicare Part D, thereby giving HP access to federal subsidies to help pay for retiree benefits.
Certain employees not grandfathered for partially subsidized medical coverage under the above programs, and employees hired after 2002 but before August 2008, are eligible for credits under the HP Inc. Retiree Welfare Benefits Plan. Credits offered after September 2008 are provided in the form of matching credits on employee contributions made to a voluntary employee beneficiary association upon attaining age 45 or as part of early retirement programs. On retirement, former employees may use these credits for the reimbursement of certain eligible medical expenses, including premiums required for coverage.
Defined Contribution Plans
HP offers various defined contribution plans for U.S. and non-U.S. employees. Total defined contribution expense was $112 million in fiscal year 2021, $108 million in fiscal year 2020 and $107 million in fiscal year 2019.
U.S. employees are automatically enrolled in the HP Inc. 401(k) Plan when they meet eligibility requirements, unless they decline participation. The employer matching contributions in the HP Inc. 401(k) Plan is 100 % of the first 4 % of eligible compensation contributed by employees, and the employer match is vested after three years of employee service. Generally, an employee must be employed by HP Inc. on the last day of the calendar year to receive a match.
72
HP INC. AND SUBSIDIARIES
Notes to Consolidated Financial Statements (Continued)
Note 4: Retirement and Post-Retirement Benefit Plans (Continued)
Pension and Post-Retirement Benefit Expense
The components of HP’s pension and post-retirement benefit (credit) cost recognized in the Consolidated Statements of Earnings were as follows:
| For the fiscal years ended October 31 | |||||||||||||||||||||||||||||||||||||||||||||||||||||
| 2021 | 2020 | 2019 | 2021 | 2020 | 2019 | 2021 | 2020 | 2019 | |||||||||||||||||||||||||||||||||||||||||||||
| U.S. Defined Benefit Plans | Non-U.S. Defined Benefit Plans | Post-Retirement Benefit Plans | |||||||||||||||||||||||||||||||||||||||||||||||||||
| In millions | |||||||||||||||||||||||||||||||||||||||||||||||||||||
| Service cost | $ | $ | $ | $ | $ | $ | $ | $ | $ | ||||||||||||||||||||||||||||||||||||||||||||
| Interest cost | |||||||||||||||||||||||||||||||||||||||||||||||||||||
| Expected return on plan assets | ( | ( | ( | ( | ( | ( | ( | ( | ( | ||||||||||||||||||||||||||||||||||||||||||||
| Amortization and deferrals: | |||||||||||||||||||||||||||||||||||||||||||||||||||||
| Actuarial loss (gain) | ( | ( | ( | ||||||||||||||||||||||||||||||||||||||||||||||||||
| Prior service cost (credit) | ( | ( | ( | ( | ( | ||||||||||||||||||||||||||||||||||||||||||||||||
| Net periodic benefit (credit) cost | ( | ( | ( | ( | ( | ( | |||||||||||||||||||||||||||||||||||||||||||||||
| Curtailment gain | ( | ||||||||||||||||||||||||||||||||||||||||||||||||||||
| Settlement (gain) loss | ( | ||||||||||||||||||||||||||||||||||||||||||||||||||||
| Special termination benefit cost | |||||||||||||||||||||||||||||||||||||||||||||||||||||
| Total periodic benefit (credit) cost | $ | ( | $ | ( | $ | ( | $ | $ | $ | $ | ( | $ | $ | ( | |||||||||||||||||||||||||||||||||||||||
The components of net periodic benefit (credit) cost other than the service cost component are included in Interest and other, net in our Consolidated Statements of Earnings.
The weighted-average assumptions used to calculate the total periodic benefit (credit) cost were as follows:
| For the fiscal years ended October 31 | |||||||||||||||||||||||||||||||||||||||||||||||||||||
| 2021 | 2020 | 2019 | 2021 | 2020 | 2019 | 2021 | 2020 | 2019 | |||||||||||||||||||||||||||||||||||||||||||||
| U.S. Defined Benefit Plans | Non-U.S. Defined Benefit Plans | Post-Retirement Benefit Plans | |||||||||||||||||||||||||||||||||||||||||||||||||||
| Discount rate | % | % | % | % | % | % | % | % | % | ||||||||||||||||||||||||||||||||||||||||||||
| Expected increase in compensation levels | % | % | % | % | % | % | % | % | % | ||||||||||||||||||||||||||||||||||||||||||||
| Expected long-term return on plan assets | % | % | % | % | % | % | % | % | % | ||||||||||||||||||||||||||||||||||||||||||||
Guaranteed interest crediting rate | % | % | % | % | % | % | % | % | % | ||||||||||||||||||||||||||||||||||||||||||||
73
HP INC. AND SUBSIDIARIES
Notes to Consolidated Financial Statements (Continued)
Note 4: Retirement and Post-Retirement Benefit Plans (Continued)
Funded Status
The funded status of the defined benefit and post-retirement benefit plans was as follows:
| As of October 31 | |||||||||||||||||||||||||||||||||||
| 2021 | 2020 | 2021 | 2020 | 2021 | 2020 | ||||||||||||||||||||||||||||||
| U.S. Defined Benefit Plans | Non-U.S. Defined Benefit Plans | Post-Retirement Benefit Plans | |||||||||||||||||||||||||||||||||
| In millions | |||||||||||||||||||||||||||||||||||
| Change in fair value of plan assets: | |||||||||||||||||||||||||||||||||||
| Fair value of assets — beginning of year | $ | $ | $ | $ | $ | $ | |||||||||||||||||||||||||||||
| Actual return on plan assets | |||||||||||||||||||||||||||||||||||
| Employer contributions | |||||||||||||||||||||||||||||||||||
| Participant contributions | |||||||||||||||||||||||||||||||||||
| Benefits paid | ( | ( | ( | ( | ( | ( | |||||||||||||||||||||||||||||
| Settlement | ( | ( | ( | ( | |||||||||||||||||||||||||||||||
| Currency impact | ( | ||||||||||||||||||||||||||||||||||
| Fair value of assets — end of year | $ | $ | $ | $ | $ | $ | |||||||||||||||||||||||||||||
| Change in benefits obligation | |||||||||||||||||||||||||||||||||||
| Projected benefit obligation — beginning of year | $ | $ | $ | $ | $ | $ | |||||||||||||||||||||||||||||
| Acquisition of plan | |||||||||||||||||||||||||||||||||||
| Service cost | |||||||||||||||||||||||||||||||||||
| Interest cost | |||||||||||||||||||||||||||||||||||
| Participant contributions | |||||||||||||||||||||||||||||||||||
| Actuarial (gain) loss | ( | ( | ( | ( | |||||||||||||||||||||||||||||||
| Benefits paid | ( | ( | ( | ( | ( | ( | |||||||||||||||||||||||||||||
| Plan amendments | ( | ||||||||||||||||||||||||||||||||||
| Curtailment | ( | ||||||||||||||||||||||||||||||||||
| Settlement | ( | ( | ( | ( | |||||||||||||||||||||||||||||||
| Special termination benefit cost | |||||||||||||||||||||||||||||||||||
| Currency impact | ( | ||||||||||||||||||||||||||||||||||
| Projected benefit obligation — end of year | $ | $ | $ | $ | $ | $ | |||||||||||||||||||||||||||||
| Funded status at end of year | $ | $ | ( | $ | ( | $ | ( | $ | $ | ||||||||||||||||||||||||||
| Accumulated benefit obligation | $ | $ | $ | $ | |||||||||||||||||||||||||||||||
The cumulative net actuarial losses for our defined pension plans and retiree welfare plans decreased year over year. The decrease in losses is primarily due to the higher than expected returns on assets, increases in discount rates, partially offset by
74
HP INC. AND SUBSIDIARIES
Notes to Consolidated Financial Statements (Continued)
Note 4: Retirement and Post-Retirement Benefit Plans (Continued)
increases in the cost of living assumptions and the recognition of gains as a result of the U.S. settlement. This has also resulted in improvement in the funded status of HP’s defined benefit and post-retirement benefit plans.
The weighted-average assumptions used to calculate the projected benefit obligations for the fiscal years ended October 31, 2021 and 2020 were as follows:
| For the fiscal years ended October 31 | |||||||||||||||||||||||||||||||||||
| 2021 | 2020 | 2021 | 2020 | 2021 | 2020 | ||||||||||||||||||||||||||||||
| U.S. Defined Benefit Plans | Non-U.S. Defined Benefit Plans | Post-Retirement Benefit Plans | |||||||||||||||||||||||||||||||||
| Discount rate | % | % | % | % | % | % | |||||||||||||||||||||||||||||
| Expected increase in compensation levels | % | % | % | % | % | % | |||||||||||||||||||||||||||||
| Guaranteed interest crediting rate | % | % | % | % | % | % | |||||||||||||||||||||||||||||
The net amounts of non-current assets and current and non-current liabilities for HP’s defined benefit and post-retirement benefit plans recognized on HP’s Consolidated Balance Sheet were as follows:
| As of October 31 | |||||||||||||||||||||||||||||||||||
| 2021 | 2020 | 2021 | 2020 | 2021 | 2020 | ||||||||||||||||||||||||||||||
| U.S. Defined Benefit Plans | Non-U.S. Defined Benefit Plans | Post-Retirement Benefit Plans | |||||||||||||||||||||||||||||||||
| In millions | |||||||||||||||||||||||||||||||||||
| Other non-current assets | $ | $ | $ | $ | $ | $ | |||||||||||||||||||||||||||||
| Other current liabilities | ( | ( | ( | ( | ( | ( | |||||||||||||||||||||||||||||
| Other non-current liabilities | ( | ( | ( | ( | ( | ( | |||||||||||||||||||||||||||||
| Funded status at end of year | $ | $ | ( | $ | ( | $ | ( | $ | $ | ||||||||||||||||||||||||||
The following table summarizes the pre-tax net actuarial loss (gain) and prior service cost (credit) recognized in Accumulated other comprehensive loss for the defined benefit and post-retirement benefit plans.
| As of October 31, 2021 | |||||||||||||||||
| U.S. Defined Benefit Plans | Non-U.S. Defined Benefit Plans | Post-Retirement Benefit Plans | |||||||||||||||
| In millions | |||||||||||||||||
| Net actuarial loss (gain) | $ | $ | $ | ( | |||||||||||||
| Prior service cost (credit) | ( | ||||||||||||||||
| Total recognized in Accumulated other comprehensive loss | $ | $ | $ | ( | |||||||||||||
Defined benefit plans with projected benefit obligations exceeding the fair value of plan assets were as follows:
| As of October 31 | |||||||||||||||||||||||
| 2021 | 2020 | 2021 | 2020 | ||||||||||||||||||||
| U.S. Defined Benefit Plans | Non-U.S. Defined Benefit Plans | ||||||||||||||||||||||
| In millions | |||||||||||||||||||||||
| Aggregate fair value of plan assets | $ | $ | $ | $ | |||||||||||||||||||
| Aggregate projected benefit obligation | $ | $ | $ | $ | |||||||||||||||||||
75
HP INC. AND SUBSIDIARIES
Notes to Consolidated Financial Statements (Continued)
Note 4: Retirement and Post-Retirement Benefit Plans (Continued)
Defined benefit plans with accumulated benefit obligations exceeding the fair value of plan assets were as follows:
| As of October 31 | |||||||||||||||||||||||
| 2021 | 2020 | 2021 | 2020 | ||||||||||||||||||||
| U.S. Defined Benefit Plans | Non-U.S. Defined Benefit Plans | ||||||||||||||||||||||
| In millions | |||||||||||||||||||||||
| Aggregate fair value of plan assets | $ | $ | $ | $ | |||||||||||||||||||
| Aggregate accumulated benefit obligation | $ | $ | $ | $ | |||||||||||||||||||
Fair Value of Plan Assets
The table below sets forth the fair value of plan assets by asset category within the fair value hierarchy as of October 31, 2021. Refer to Note 9, “Fair Value” for details on fair value hierarchy. Certain investments that are measured at fair value using the Net Asset Value (“NAV”) per share as a practical expedient have not been categorized in the fair value hierarchy. The fair value amounts presented in this table provide a reconciliation of the fair value hierarchy to the total value of plan assets.
| As of October 31, 2021 | |||||||||||||||||||||||||||||||||||||||||||||||||||||||||||||||||||||||
| U.S. Defined Benefit Plans | Non-U.S. Defined Benefit Plans | Post-Retirement Benefit Plans | |||||||||||||||||||||||||||||||||||||||||||||||||||||||||||||||||||||
| Level 1 | Level 2 | Level 3 | Total | Level 1 | Level 2 | Level 3 | Total | Level 1 | Level 2 | Level 3 | Total | ||||||||||||||||||||||||||||||||||||||||||||||||||||||||||||
| In millions | |||||||||||||||||||||||||||||||||||||||||||||||||||||||||||||||||||||||
| Asset Category: | |||||||||||||||||||||||||||||||||||||||||||||||||||||||||||||||||||||||
Equity securities(1) | $ | $ | $ | $ | $ | $ | $ | $ | $ | $ | $ | ||||||||||||||||||||||||||||||||||||||||||||||||||||||||||||
Debt securities(2) | |||||||||||||||||||||||||||||||||||||||||||||||||||||||||||||||||||||||
Corporate | |||||||||||||||||||||||||||||||||||||||||||||||||||||||||||||||||||||||
Government | |||||||||||||||||||||||||||||||||||||||||||||||||||||||||||||||||||||||
| Real Estate Funds | |||||||||||||||||||||||||||||||||||||||||||||||||||||||||||||||||||||||
| Insurance Contracts | |||||||||||||||||||||||||||||||||||||||||||||||||||||||||||||||||||||||
Common Collective Trusts and 103-12 Investment Entities(3) | |||||||||||||||||||||||||||||||||||||||||||||||||||||||||||||||||||||||
Investment Funds(4) | |||||||||||||||||||||||||||||||||||||||||||||||||||||||||||||||||||||||
Cash and Cash Equivalents(5) | |||||||||||||||||||||||||||||||||||||||||||||||||||||||||||||||||||||||
Other(6) | ( | ( | ( | ( | ( | ||||||||||||||||||||||||||||||||||||||||||||||||||||||||||||||||||
| Net plan assets subject to leveling | $ | ( | $ | $ | $ | $ | $ | $ | $ | $ | $ | $ | $ | ||||||||||||||||||||||||||||||||||||||||||||||||||||||||||
Investments using NAV as a Practical Expedient(7) | |||||||||||||||||||||||||||||||||||||||||||||||||||||||||||||||||||||||
| Investments at Fair Value | $ | $ | $ | ||||||||||||||||||||||||||||||||||||||||||||||||||||||||||||||||||||
76
HP INC. AND SUBSIDIARIES
Notes to Consolidated Financial Statements (Continued)
Note 4: Retirement and Post-Retirement Benefit Plans (Continued)
The table below sets forth the fair value of plan assets by asset category within the fair value hierarchy as of October 31, 2020.
| As of October 31, 2020 | |||||||||||||||||||||||||||||||||||||||||||||||||||||||||||||||||||||||
| U.S. Defined Benefit Plans | Non-U.S. Defined Benefit Plans | Post-Retirement Benefit Plans | |||||||||||||||||||||||||||||||||||||||||||||||||||||||||||||||||||||
| Level 1 | Level 2 | Level 3 | Total | Level 1 | Level 2 | Level 3 | Total | Level 1 | Level 2 | Level 3 | Total | ||||||||||||||||||||||||||||||||||||||||||||||||||||||||||||
| In millions | |||||||||||||||||||||||||||||||||||||||||||||||||||||||||||||||||||||||
| Asset Category: | |||||||||||||||||||||||||||||||||||||||||||||||||||||||||||||||||||||||
Equity securities(1) | $ | $ | $ | $ | $ | $ | $ | $ | $ | $ | $ | $ | |||||||||||||||||||||||||||||||||||||||||||||||||||||||||||
Debt securities(2) | |||||||||||||||||||||||||||||||||||||||||||||||||||||||||||||||||||||||
Corporate | |||||||||||||||||||||||||||||||||||||||||||||||||||||||||||||||||||||||
Government | |||||||||||||||||||||||||||||||||||||||||||||||||||||||||||||||||||||||
| Real Estate Funds | |||||||||||||||||||||||||||||||||||||||||||||||||||||||||||||||||||||||
| Insurance Contracts | |||||||||||||||||||||||||||||||||||||||||||||||||||||||||||||||||||||||
Common Collective Trusts and 103-12 Investment Entities(3) | |||||||||||||||||||||||||||||||||||||||||||||||||||||||||||||||||||||||
Investment Funds(4) | |||||||||||||||||||||||||||||||||||||||||||||||||||||||||||||||||||||||
Cash and Cash Equivalents(5) | |||||||||||||||||||||||||||||||||||||||||||||||||||||||||||||||||||||||
Other(6) | ( | ( | ( | ( | ( | ||||||||||||||||||||||||||||||||||||||||||||||||||||||||||||||||||
| Net plan assets subject to leveling | $ | $ | $ | $ | $ | $ | $ | $ | $ | $ | $ | $ | |||||||||||||||||||||||||||||||||||||||||||||||||||||||||||
Investments using NAV as a Practical Expedient(7) | |||||||||||||||||||||||||||||||||||||||||||||||||||||||||||||||||||||||
| Investments at Fair Value | $ | $ | $ | ||||||||||||||||||||||||||||||||||||||||||||||||||||||||||||||||||||
(1)Investments in publicly traded equity securities are valued using the closing price on the measurement date as reported on the stock exchange on which the individual securities are traded.
(2)The fair value of corporate, government and asset-backed debt securities is based on observable inputs of comparable market transactions. Also included in this category is debt issued by national, state and local governments and agencies.
(3)Department of Labor 103-12 IE (Investment Entity) designation is for plan assets held by two or more unrelated employee benefit plans which includes limited partnerships and venture capital partnerships. Certain common collective trusts and interests in 103-12 entities are valued using NAV as a practical expedient.
(4)Includes publicly traded funds of investment companies that are registered with the SEC, funds that are not publicly traded and a non-U.S. fund-of-fund arrangement.
(5)Includes cash and cash equivalents such as short-term marketable securities. Cash and cash equivalents include money market funds, which are valued based on NAV. Other assets were classified in the fair value hierarchy based on the lowest level input (e.g., quoted prices and observable inputs) that is significant to the fair value measure in its entirety.
(6)Includes primarily reverse repurchase agreements, unsettled transactions, and derivative instruments.
(7)These investments include alternative investments, which primarily consist of private equities and hedge funds. The valuation of alternative investments, such as limited partnerships and joint ventures, may require significant management judgment. For alternative investments, valuation is based on NAV as reported by the asset manager or investment company and adjusted for cash flows, if necessary. In making such an assessment, a variety of factors are reviewed by management, including but not limited to the timeliness of NAV as reported by the asset manager and changes in general economic and market conditions subsequent to the last NAV reported by the asset manager.
•Private equities include limited partnerships such as equity, buyout, venture capital, real estate and other similar funds that invest in the United States and internationally where foreign currencies are hedged.
•Hedge funds include limited partnerships that invest both long and short primarily in common stocks and credit, relative value, event-driven equity, distressed debt and macro strategies. Management of the hedge funds has the ability to shift investments from value to growth strategies, from small to large capitalization stocks and bonds, and from a net long position to a net short position.
These investments also include Common Collective Trusts and 103-12 Investment Entities as defined in note (3) above and Investment Funds as defined in note (4) above.
77
HP INC. AND SUBSIDIARIES
Notes to Consolidated Financial Statements (Continued)
Note 4: Retirement and Post-Retirement Benefit Plans (Continued)
Plan Asset Allocations
Refer to the fair value hierarchy table above for actual assets allocations across the benefit plans. The weighted-average target asset allocations across the benefit plans represented in the fair value tables above were as follows:
| 2021 Target Allocation | ||||||||||||||||||||
| Asset Category | U.S. Defined Benefit Plans | Non-U.S. Defined Benefit Plans | Post-Retirement Benefit Plans | |||||||||||||||||
| Equity-related investments | % | % | % | |||||||||||||||||
| Debt securities | % | % | % | |||||||||||||||||
| Real estate | % | % | % | |||||||||||||||||
| Cash and cash equivalents | % | % | % | |||||||||||||||||
| Other | % | % | % | |||||||||||||||||
| Total | % | % | % | |||||||||||||||||
Investment Policy
HP’s investment strategy is to seek a competitive rate of return relative to an appropriate level of risk depending on the funded status of each plan and the timing of expected benefit payments. The majority of the plans’ investment managers employ active investment management strategies with the goal of outperforming the broad markets in which they invest. Risk management practices include diversification across asset classes and investment styles and periodic rebalancing toward asset allocation targets. A number of the plans’ investment managers are authorized to utilize derivatives for investment or liability exposures, and HP may utilize derivatives to affect asset allocation changes or to hedge certain investment or liability exposures.
The target asset allocation selected for each U.S. plan (pension and post-retirement) reflects a risk/return profile HP believes is appropriate relative to each plan’s liability structure and return goals. HP conducts periodic asset-liability studies for U.S. plans to model various potential asset allocations in comparison to each plan’s forecasted liabilities and liquidity needs and to develop a policy glide path which adjusts the asset allocation with funded status. Due to the strong funded status for the U.S. Pension Plan, consistent with our policy, steps have been taken to de-risk the portfolio by reallocation of assets to liability hedging fixed-income investments. HP also invests a portion of the U.S. defined benefit plan assets in private market securities such as private equity funds to provide diversification and a higher expected return on assets.
Outside the United States, asset allocation decisions are typically made by an independent board of trustees for the specific plan. As in the United States, investment objectives are designed to generate returns that will enable the plan to meet its future obligations. In some countries, local regulations may restrict asset allocations, typically leading to a higher percentage of investment in fixed-income securities than would otherwise be deployed. HP reviews the investment strategy and where appropriate, can offer some assistance in the selection of investment managers, with final decisions on asset allocation and investment managers made by the board of trustees for the specific plan.
Basis for Expected Long-Term Rate of Return on Plan Assets
The expected long-term rate of return on plan assets reflects the expected returns for each major asset class in which the plan invests and the weight of each asset class in the target mix. Expected asset returns reflect the current yield on government bonds, risk premiums for each asset class and expected real returns which considers each country’s specific inflation outlook. Because HP’s investment policy is to employ primarily active investment managers who seek to outperform the broader market, the expected returns are adjusted to reflect the expected additional returns net of fees.
Retirement Incentive Program
As part of the Fiscal 2020 Plan, HP announced the voluntary EER program for its U.S. employees in October 2019. Voluntary participation in the EER program was limited to those employees who were at least 50 years old with 20 or more years of service at HP. Employees accepted into the EER program left HP on dates ranging from December 31, 2019 to September 30, 2020. The EER benefit was a cash lump sum payment which was calculated based on years of service at HP at the time of the retirement and ranging from 13 to 52 weeks of pay.
All employees participating in the EER program were offered the opportunity to continue health care coverage at the active employee contribution rates for up to 36 months following retirement. In addition, HP provided up to $12,000 in employer credits under the Retirement Medical Savings Account (“RMSA”) program. In relation to the continued health care
78
HP INC. AND SUBSIDIARIES
Notes to Consolidated Financial Statements (Continued)
Note 4: Retirement and Post-Retirement Benefit Plans (Continued)
coverage and employer credits under the RMSA program, HP recognized special termination benefit costs of $44 million as restructuring and other charges for the twelve months ended October 31, 2020.
Lump Sum Program
HP offered a lump sum program during the third quarter of fiscal year 2020. Certain terminated vested participants in the HP Inc. Pension Plan (“Pension Plan”) could elect to take a one-time voluntary lump sum payment equal to the present value of future benefits. Approximately 12,000 participants elected the lump sum option. Payments of $2.2 billion were made from plan assets to the participants in the fourth quarter of fiscal year 2020. A non-cash settlement expense of $214 million arising from the accelerated recognition of previously deferred actuarial losses was recorded in the fourth quarter of fiscal year 2020.
Future Contributions and Funding Policy
In fiscal year 2022, HP expects to contribute approximately $44 million to its non-U.S. pension plans, $36 million to cover benefit payments to U.S. non-qualified plan participants and $4 million to cover benefit claims for HP’s post-retirement benefit plans. HP’s policy is to fund its pension plans so that it makes at least the minimum contribution required by local government, funding and taxing authorities.
Estimated Future Benefits Payments
As of October 31, 2021, HP estimates that the future benefits payments for the retirement and post-retirement plans are as follows:
| Fiscal year | U.S. Defined Benefit Plans | Non-U.S. Defined Benefit Plans | Post-Retirement Benefit Plans | |||||||||||||||||
| In millions | ||||||||||||||||||||
| 2022 | $ | $ | $ | |||||||||||||||||
| 2023 | ||||||||||||||||||||
| 2024 | ||||||||||||||||||||
| 2025 | ||||||||||||||||||||
| 2026 | ||||||||||||||||||||
| Next five fiscal years to October 31, 2031 | ||||||||||||||||||||
79
Note 5: Stock-Based Compensation
HP’s stock-based compensation plans include incentive compensation plans and an employee stock purchase plan.
Stock-Based Compensation Expense and Related Income Tax Benefits for Operations
Stock-based compensation expense and the resulting tax benefits for operations were as follows:
| For the fiscal years ended October 31 | |||||||||||||||||
| 2021 | 2020 | 2019 | |||||||||||||||
| In millions | |||||||||||||||||
| Stock-based compensation expense | $ | $ | $ | ||||||||||||||
| Income tax benefit | ( | ( | ( | ||||||||||||||
| Stock-based compensation expense, net of tax | $ | $ | $ | ||||||||||||||
Cash received from option exercises under the HP Inc 2004 Stock Incentive Plan, as amended and restated, and ESPP purchases under the HP Inc. 2011 Employee Stock Purchase Plan (the “2011 ESPP”) and HP Inc. 2021 Employee Stock Purchase Plan (the “2021 ESPP”) was $55 million in fiscal year 2021, $56 million in fiscal year 2020 and $59 million in fiscal year 2019. The benefit realized for the tax deduction from option exercises in fiscal years 2021, 2020 and 2019 was $3 million, $2 million and $3 million, respectively.
Stock-Based Incentive Compensation Plans
HP’s stock-based incentive compensation plan includes equity plan adopted in 2004, as amended and restated (“principal equity plan”). Stock-based awards granted under the equity plan includes restricted stock awards, stock options and performance-based awards. Employees meeting certain employment qualifications are eligible to receive stock-based awards. The aggregate number of shares of HP’s stock authorized for issuance under the principal equity plan is 593.1 million.
Restricted stock awards are non-vested stock awards that may include grants of restricted stock or restricted stock units. Restricted stock awards and cash-settled awards are generally subject to forfeiture if employment terminates prior to the lapse of the restrictions. Such awards generally vest to three years from the date of grant. During the vesting period, ownership of the restricted stock cannot be transferred. Restricted stock has the same dividend and voting rights as common stock and is considered to be issued and outstanding upon grant. The dividends paid on restricted stock are non-forfeitable. Restricted stock units do not have the voting rights of common stock, and the shares underlying restricted stock units are not considered issued and outstanding upon grant. However, shares underlying restricted stock units are included in the calculation of diluted net EPS. Restricted stock units have forfeitable dividend equivalent rights equal to the dividend paid on common stock. HP expenses the fair value of restricted stock awards ratably over the period during which the restrictions lapse. The majority of restricted stock units issued by HP contain only service vesting conditions. HP also grants performance-adjusted restricted stock units which vest only on the satisfaction of both service and the achievement of certain performance goals including market conditions prior to the expiration of the awards.
Stock options granted under the principal equity plan are generally non-qualified stock options, but the principal equity plan permits some options granted to qualify as incentive stock options under the U.S. Internal Revenue Code. Stock options generally vest over to four years from the date of grant. The exercise price of a stock option is equal to the closing price of HP’s stock on the option grant date. The majority of stock options issued by HP contain only service vesting conditions. HP grants performance-contingent stock options that vest only on the satisfaction of both service and market conditions prior to the expiration of the awards.
RSU and stock option grants provide for accelerated vesting in certain circumstances as defined in the plans and related grant agreements, including termination in connection with a change in control.
Restricted Stock Units
80
HP INC. AND SUBSIDIARIES
Notes to Consolidated Financial Statements (Continued)
Note 5: Stock-Based Compensation (Continued)
| For the fiscal years ended October 31 | |||||||||||||||||
| 2021 | 2020 | 2019 | |||||||||||||||
Expected volatility(1) | % | % | % | ||||||||||||||
Risk-free interest rate(2) | % | % | % | ||||||||||||||
Expected performance period in years(3) | |||||||||||||||||
(1)The expected volatility was estimated using the historical volatility derived from HP’s common stock.
(2)The risk-free interest rate was estimated based on the yield on U.S. Treasury zero-coupon issues.
(3)The expected performance period was estimated based on the length of the remaining performance period from the grant date.
A summary of restricted stock units activity is as follows:
| As of October 31 | |||||||||||||||||||||||||||||||||||
| 2021 | 2020 | 2019 | |||||||||||||||||||||||||||||||||
| Shares | Weighted- Average Grant Date Fair Value Per Share | Shares | Weighted- Average Grant Date Fair Value Per Share | Shares | Weighted- Average Grant Date Fair Value Per Share | ||||||||||||||||||||||||||||||
| In thousands | In thousands | In thousands | |||||||||||||||||||||||||||||||||
| Outstanding at beginning of year | $ | $ | $ | ||||||||||||||||||||||||||||||||
| Granted | $ | $ | $ | ||||||||||||||||||||||||||||||||
| Vested | ( | $ | ( | $ | ( | $ | |||||||||||||||||||||||||||||
| Forfeited | ( | $ | ( | $ | ( | $ | |||||||||||||||||||||||||||||
| Outstanding at end of year | $ | $ | $ | ||||||||||||||||||||||||||||||||
The total grant date fair value of restricted stock units vested in fiscal years 2021, 2020 and 2019 was $278 million, $297 million and $273 million, respectively. As of October 31, 2021, total unrecognized pre-tax stock-based compensation expense related to non-vested restricted stock units was $297 million, which is expected to be recognized over the remaining weighted-average vesting period of 1.4 years.
Stock Options
HP utilizes the Black-Scholes-Merton option pricing formula to estimate the fair value of stock options subject to service-based vesting conditions. HP estimates the fair value of stock options subject to performance-contingent vesting conditions using a combination of a Monte Carlo simulation model and a lattice model as these awards contain market conditions. The weighted-average fair value and the assumptions used to measure fair value were as follows:
| For the fiscal years ended October 31 | |||||||||||||||||
| 2021 | 2020 | 2019 | |||||||||||||||
Weighted-average fair value(1) | $ | $ | $ | ||||||||||||||
Expected volatility(2) | % | % | % | ||||||||||||||
Risk-free interest rate(3) | % | % | % | ||||||||||||||
Expected dividend yield(4) | % | % | % | ||||||||||||||
Expected term in years(5) | |||||||||||||||||
(1)The weighted-average fair value was based on stock options granted during the period.
(2)Expected volatility was estimated based on a blended volatility (50 % historical volatility and 50 % implied volatility from traded options on HP’s common stock).
(3)The risk-free interest rate was estimated based on the yield on U.S. Treasury zero-coupon issues.
(4)The expected dividend yield represents a constant dividend yield applied for the duration of the expected term of the award.
81
HP INC. AND SUBSIDIARIES
Notes to Consolidated Financial Statements (Continued)
Note 5: Stock-Based Compensation (Continued)
A summary of stock options activity is as follows:
| As of October 31 | |||||||||||||||||||||||||||||||||||||||||||||||||||||||||||||||||||||||
| 2021 | 2020 | 2019 | |||||||||||||||||||||||||||||||||||||||||||||||||||||||||||||||||||||
| Shares | Weighted- Average Exercise Price | Weighted- Average Remaining Contractual Term | Aggregate Intrinsic Value | Shares | Weighted- Average Exercise Price | Weighted- Average Remaining Contractual Term | Aggregate Intrinsic Value | Shares | Weighted- Average Exercise Price | Weighted- Average Remaining Contractual Term | Aggregate Intrinsic Value | ||||||||||||||||||||||||||||||||||||||||||||||||||||||||||||
| In thousands | In years | In millions | In thousands | In years | In millions | In thousands | In years | In millions | |||||||||||||||||||||||||||||||||||||||||||||||||||||||||||||||
| Outstanding at beginning of year | $ | $ | $ | ||||||||||||||||||||||||||||||||||||||||||||||||||||||||||||||||||||
| Granted | $ | $ | $ | ||||||||||||||||||||||||||||||||||||||||||||||||||||||||||||||||||||
| Exercised | ( | $ | ( | $ | ( | $ | |||||||||||||||||||||||||||||||||||||||||||||||||||||||||||||||||
| Forfeited/cancelled/expired | ( | $ | ( | $ | ( | $ | |||||||||||||||||||||||||||||||||||||||||||||||||||||||||||||||||
| Outstanding at end of year | $ | $ | $ | $ | $ | $ | |||||||||||||||||||||||||||||||||||||||||||||||||||||||||||||||||
| Vested and expected to vest | $ | $ | $ | $ | $ | $ | |||||||||||||||||||||||||||||||||||||||||||||||||||||||||||||||||
| Exercisable | $ | $ | $ | $ | $ | $ | |||||||||||||||||||||||||||||||||||||||||||||||||||||||||||||||||
The aggregate intrinsic value in the table above represents the total pre-tax intrinsic value that option holders would have realized had all option holders exercised their options on the last trading day of fiscal years 2021, 2020 and 2019. The aggregate intrinsic value is the difference between HP’s closing stock price on the last trading day of the fiscal year and the exercise price, multiplied by the number of in-the-money options. The total intrinsic value of options exercised in fiscal years 2021, 2020 and 2019 was $18 million, $12 million and $20 million, respectively. The total grant date fair value of options vested in fiscal years 2021, 2020 and 2019 was $3 million, $3 million and $9 million, respectively.
As of October 31, 2021, total unrecognized pre-tax stock-based compensation expense related to stock options was $10 million, which is expected to be recognized over a weighted-average vesting period of 1.4 years.
Employee Stock Purchase Plan
HP sponsors the 2021 ESPP, pursuant to which eligible employees may contribute up to 10 % of base compensation, subject to certain income limits, to purchase shares of HP’s common stock.
Pursuant to the terms of the 2021 ESPP, employees purchase stock under the 2021 ESPP at a price equal to 95 % of HP’s closing stock price on the purchase date. No stock-based compensation expense was recorded in connection with those purchases because the criteria of a non-compensatory plan were met. The aggregate number of shares of HP’s stock authorized for issuance under the 2021 ESPP was 50 million. The 2021 ESPP came into effect on May 1, 2021 upon expiry of the 2011 ESPP. The 2021 ESPP terms are similar to the previous ESPP.
Shares Reserved
Shares available for future grant and shares reserved for future issuance under the stock-based incentive compensation plans and the 2021 ESPP were as follows:
| As of October 31 | |||||||||||||||||
| 2021 | 2020 | 2019 | |||||||||||||||
| In thousands | |||||||||||||||||
Shares available for future grant(1) | |||||||||||||||||
Shares reserved for future issuance(1) | |||||||||||||||||
(1) For years 2020 and 2019, shares authorized under the 2011 ESPP were included in the shares available for future grant and shares reserved for future issuance.
82
Note 6: Taxes on Earnings
Provision for Taxes
The domestic and foreign components of earnings before taxes were as follows:
| For the fiscal years ended October 31 | |||||||||||||||||
| 2021 | 2020 | 2019 | |||||||||||||||
| In millions | |||||||||||||||||
| U.S. | $ | $ | $ | ( | |||||||||||||
| Non-U.S. | |||||||||||||||||
| $ | $ | $ | |||||||||||||||
The provision for (benefit from) taxes on earnings was as follows:
| For the fiscal years ended October 31 | |||||||||||||||||
| 2021 | 2020 | 2019 | |||||||||||||||
| In millions | |||||||||||||||||
| U.S. federal taxes: | |||||||||||||||||
| Current | $ | $ | ( | $ | ( | ||||||||||||
| Deferred | ( | ( | |||||||||||||||
| Non-U.S. taxes: | |||||||||||||||||
| Current | |||||||||||||||||
| Deferred | ( | ( | |||||||||||||||
| State taxes: | |||||||||||||||||
| Current | ( | ||||||||||||||||
| Deferred | ( | ( | |||||||||||||||
| $ | $ | $ | ( | ||||||||||||||
The differences between the U.S. federal statutory income tax rate and HP’s effective tax rate were as follows:
| For the fiscal years ended October 31 | |||||||||||||||||
| 2021 | 2020 | 2019 | |||||||||||||||
| U.S. federal statutory income tax rate from continuing operations | % | % | % | ||||||||||||||
| State income taxes, net of federal tax benefit | % | % | % | ||||||||||||||
| Impact of foreign earnings including GILTI and FDII, net | ( | % | ( | % | ( | % | |||||||||||
U.S. Tax Reform enactment | % | % | ( | % | |||||||||||||
| Research and development (“R&D”) credit | ( | % | ( | % | ( | % | |||||||||||
| Valuation allowances | ( | % | % | ( | % | ||||||||||||
| Uncertain tax positions and audit settlements | % | ( | % | ( | % | ||||||||||||
| Indemnification related items | % | % | % | ||||||||||||||
| Impact of internal reorganization | ( | % | % | % | |||||||||||||
| Other, net | ( | % | ( | % | ( | % | |||||||||||
| % | % | ( | % | ||||||||||||||
The jurisdictions with favorable tax rates that have the most significant effective tax rate impact in the periods presented include Puerto Rico, Singapore, and Malaysia. HP has elected to treat GILTI inclusions as period costs.
In fiscal year 2021, HP recorded $9 million of net income tax charges related to discrete items in the provision for taxes. This amount included income tax charges of $533 million related to the Oracle litigation proceeds, $15 million of uncertain tax
83
HP INC. AND SUBSIDIARIES
Notes to Consolidated Financial Statements (Continued)
Note 6: Taxes on Earnings (Continued)
position charges, and $9 million of other net tax charges. These charges were partially offset by income tax benefits of $393 million related to changes in valuation allowances, $89 million of tax effects related to internal reorganization, $50 million related to restructuring charges, and $16 million related to the filing of tax returns in various jurisdictions. In fiscal year 2021, excess tax benefits associated with stock options, restricted stock units and performance-adjusted restricted stock units were immaterial.
In fiscal year 2020, HP recorded $244 million of net income tax benefits related to discrete items in the provision for taxes. This amount included tax benefits related to audit settlements of $124 million in various jurisdictions and $82 million related to restructuring benefits. Additionally, HP recorded benefits of $20 million related to proxy contest costs and $17 million of other net tax benefits. In fiscal year 2020, excess tax benefits associated with stock options, restricted stock units and performance-adjusted restricted stock units were immaterial.
In fiscal year 2019, HP recorded $1.3 billion of net income tax benefits related to discrete items in the provision for taxes. This amount included tax benefits related to audit settlements of $1.0 billion, $75 million due to ability to utilize tax attributes, $57 million of restructuring benefits and net valuation allowance releases of $94 million. HP also recorded benefits of $78 million related to U.S. tax reform as a result of new guidance issued by the U.S. Internal Revenue Service (“IRS”). These benefits were partially offset by uncertain tax position charges of $51 million. In fiscal year 2019, in addition to the discrete items mentioned above, HP recorded excess tax benefits of $20 million associated with stock options, restricted stock units and performance-adjusted restricted stock units.
As a result of certain employment actions and capital investments HP has undertaken, income from manufacturing and services in certain countries is subject to reduced tax rates, and in some cases is wholly exempt from taxes, through 2029. The gross income tax benefits attributable to these actions and investments were estimated to be $385 million ($0.32 diluted net EPS) in fiscal year 2021, $344 million ($0.24 diluted net EPS) in fiscal year 2020 and $386 million ($0.25 diluted net EPS) in fiscal year 2019.
Uncertain Tax Positions
A reconciliation of unrecognized tax benefits is as follows:
| For the fiscal years ended October 31 | |||||||||||||||||
| 2021 | 2020 | 2019 | |||||||||||||||
| In millions | |||||||||||||||||
| Balance at beginning of year | $ | $ | $ | ||||||||||||||
| Increases: | |||||||||||||||||
| For current year’s tax positions | |||||||||||||||||
| For prior years’ tax positions | |||||||||||||||||
| Decreases: | |||||||||||||||||
| For prior years’ tax positions | ( | ( | ( | ||||||||||||||
| Statute of limitations expirations | ( | ( | ( | ||||||||||||||
| Settlements with taxing authorities | ( | ( | ( | ||||||||||||||
| Balance at end of year | $ | $ | $ | ||||||||||||||
As of October 31, 2021, the amount of gross unrecognized tax benefits was $820 million, of which up to $660 million would affect HP’s effective tax rate if realized. As of October 31, 2020, the amount of unrecognized tax benefits was $820 million of which up to $657 million would affect HP’s effective tax rate if realized. The amount of unrecognized tax benefit changed by a net immaterial amount. HP recognizes interest income from favorable settlements and interest expense and penalties accrued on unrecognized tax benefits in the provision for taxes in the Consolidated Statements of Earnings. As of October 31, 2021, 2020 and 2019, HP had accrued $70 million, $34 million and $56 million, respectively, for interest and penalties.
HP engages in continuous discussions and negotiations with taxing authorities regarding tax matters in various jurisdictions. HP expects complete resolution of certain tax years with various tax authorities within the next 12 months. HP believes it is reasonably possible that its existing gross unrecognized tax benefits may be reduced by up to $72 million within the next 12 months, affecting HP’s effective tax rate if realized.
84
HP INC. AND SUBSIDIARIES
Notes to Consolidated Financial Statements (Continued)
Note 6: Taxes on Earnings (Continued)
HP is subject to income tax in the United States and approximately 60 other countries and is subject to routine corporate income tax audits in many of these jurisdictions. In addition, HP is subject to numerous ongoing audits by federal, state and foreign tax authorities. The IRS is conducting an audit of HP’s 2018 and 2019 income tax returns.
With respect to major state and foreign tax jurisdictions, HP is no longer subject to tax authority examinations for years prior to 2002. No material tax deficiencies have been assessed in major state or foreign tax jurisdictions related to ongoing audits as of October 31, 2021.
HP believes it has provided adequate reserves for all tax deficiencies or reductions in tax benefits that could result from federal, state and foreign tax audits. HP regularly assesses the likely outcomes of these audits in order to determine the appropriateness of HP’s tax provision. HP adjusts its uncertain tax positions to reflect the impact of negotiations, settlements, rulings, advice of legal counsel, and other information and events pertaining to a particular audit. However, income tax audits are inherently unpredictable and there can be no assurance that HP will accurately predict the outcome of these audits. The amounts ultimately paid on resolution of an audit could be materially different from the amounts previously included in the Provision for taxes and therefore the resolution of one or more of these uncertainties in any particular period could have a material impact on net income or cash flows.
HP has not provided for U.S. federal income and foreign withholding taxes on $5.7 billion of undistributed earnings from non-U.S. operations as of October 31, 2021 because HP intends to reinvest such earnings indefinitely outside of the United States. Determination of the amount of unrecognized deferred tax liability related to these earnings is not practicable. The TCJA taxed HP’s historic earnings and profits of its non-U.S. subsidiaries. HP will remit these taxed reinvested earnings for which deferred U.S. federal and withholding taxes have been provided where excess cash has accumulated and HP determines that it is advantageous for business operations, tax or cash management reasons.
85
HP INC. AND SUBSIDIARIES
Notes to Consolidated Financial Statements (Continued)
Note 6: Taxes on Earnings (Continued)
Deferred Income Taxes
The significant components of deferred tax assets and deferred tax liabilities were as follows:
| As of October 31 | |||||||||||
| 2021 | 2020 | ||||||||||
| In millions | |||||||||||
| Deferred tax assets: | |||||||||||
| Loss and credit carryforwards | $ | $ | |||||||||
| Intercompany transactions—excluding inventory | |||||||||||
| Fixed assets | |||||||||||
| Warranty | |||||||||||
| Employee and retiree benefits | |||||||||||
| Deferred revenue | |||||||||||
| Capitalized research and development | |||||||||||
| Intangible assets | |||||||||||
| Operating lease liabilities | |||||||||||
| Investment in partnership | |||||||||||
| Other | |||||||||||
| Gross deferred tax assets | |||||||||||
| Valuation allowances | ( | ( | |||||||||
| Total deferred tax assets | |||||||||||
| Deferred tax liabilities: | |||||||||||
| Unremitted earnings of foreign subsidiaries | ( | ( | |||||||||
| Right-of-use assets from operating leases | ( | ( | |||||||||
| Other | ( | ( | |||||||||
| Total deferred tax liabilities | ( | ( | |||||||||
| Net deferred tax assets | $ | $ | |||||||||
Deferred tax assets and liabilities included in the Consolidated Balance Sheets as follows:
| As of October 31 | |||||||||||
| 2021 | 2020 | ||||||||||
| In millions | |||||||||||
| Deferred tax assets | $ | $ | |||||||||
| Deferred tax liabilities | ( | ( | |||||||||
| Total | $ | $ | |||||||||
| Gross NOLs | Deferred Taxes on NOLs | Valuation allowance | Initial Year of Expiration | |||||||||||||||||
| In millions | ||||||||||||||||||||
| Federal | $ | $ | $ | ( | 2023 | |||||||||||||||
| State | ( | 2022 | ||||||||||||||||||
| Foreign | ( | 2033 | ||||||||||||||||||
| Balance at end of year | $ | $ | $ | ( | ||||||||||||||||
86
HP INC. AND SUBSIDIARIES
Notes to Consolidated Financial Statements (Continued)
Note 6: Taxes on Earnings (Continued)
As of October 31, 2021, HP had recorded deferred tax assets for various tax credit carryforwards as follows:
| Carryforward | Valuation Allowance | Initial Year of Expiration | |||||||||||||||
| In millions | |||||||||||||||||
| Tax credits in state and foreign jurisdictions | $ | $ | ( | 2022 | |||||||||||||
| Balance at end of year | $ | $ | ( | ||||||||||||||
Deferred Tax Asset Valuation Allowance
The deferred tax asset valuation allowance and changes were as follows:
| For the fiscal years ended October 31 | |||||||||||||||||
| 2021 | 2020 | 2019 | |||||||||||||||
| In millions | |||||||||||||||||
| Balance at beginning of year | $ | $ | $ | ||||||||||||||
| Income tax (benefit) expense | ( | ( | |||||||||||||||
| Other comprehensive loss (income), currency translation and charges to other accounts | ( | ( | |||||||||||||||
| Balance at end of year | $ | $ | $ | ||||||||||||||
Gross deferred tax assets as of October 31, 2021, 2020, and 2019 were reduced by valuation allowances of $7.7 billion,$8.0 billion and $7.9 billion, respectively. In fiscal year 2021, the deferred tax asset valuation allowance decreased by $227 million primarily due to the expected utilization of foreign net operating losses and U.S. deferred tax assets that are anticipated to be realized at a lower effective rate than the federal statutory tax rate. In fiscal year 2020, the deferred tax asset valuation allowance increased by $46 million primarily associated with foreign net operating losses and U.S. deferred tax assets that are anticipated to be realized at a lower effective rate than the federal statutory tax rate due to certain future U.S. international tax reform implications. In fiscal year 2019, the deferred tax asset valuation allowance increased by $24 million primarily associated with the recognition of the income tax consequences of intra-entity transfers other than inventory. This increase was partially offset by the impact of tax rate changes in foreign jurisdictions and state valuation allowance releases. See Note 1, “Summary of Significant Accounting Policies” for detailed information.
87
Note 7: Supplementary Financial Information
Accounts Receivable
The allowance for credit losses related to accounts receivable and changes were as follows:
| For the fiscal years ended October 31 | |||||||||||||||||
| 2021 | 2020 | 2019 | |||||||||||||||
| In millions | |||||||||||||||||
| Balance at beginning of period | $ | $ | $ | ||||||||||||||
| Current-period allowance for credit losses | |||||||||||||||||
| Deductions, net of recoveries | ( | ( | ( | ||||||||||||||
| Balance at end of period | $ | $ | $ | ||||||||||||||
HP has third-party arrangements, consisting of revolving short-term financing, which provide liquidity to certain partners to facilitate their working capital requirements. These financing arrangements, which in certain circumstances may contain partial recourse, result in a transfer of HP’s receivables and risk to the third-party. As these transfers qualify as true sales under the applicable accounting guidance, the receivables are de-recognized from the Consolidated Balance Sheets upon transfer, and HP receives a payment for the receivables from the third-party within a mutually agreed upon time period. For arrangements involving an element of recourse, the recourse obligation is measured using market data from the similar transactions and reported as a current liability on the Consolidated Balance Sheets. The recourse obligations as of October 31, 2021 and 2020 were not material. The costs associated with the sales of trade receivables for fiscal year 2021, 2020 and 2019 were not material.
The following is a summary of the activity under these arrangements:
| For the fiscal years ended October 31 | |||||||||||||||||
| 2021 | 2020 | 2019 | |||||||||||||||
| In millions | |||||||||||||||||
Balance at beginning of year (1) | $ | $ | $ | ||||||||||||||
| Trade receivables sold | |||||||||||||||||
| Cash receipts | ( | ( | ( | ||||||||||||||
| Foreign currency and other | ( | ||||||||||||||||
Balance at end of year (1) | $ | $ | $ | ||||||||||||||
(1) Amounts outstanding from third parties reported in Accounts Receivable in the Consolidated Balance Sheets.
Inventory
| As of October 31 | |||||||||||
| 2021 | 2020 | ||||||||||
| In millions | |||||||||||
| Finished goods | $ | $ | |||||||||
| Purchased parts and fabricated assemblies | |||||||||||
| $ | $ | ||||||||||
88
HP INC. AND SUBSIDIARIES
Notes to Consolidated Financial Statements (Continued)
Note 7: Supplementary Financial Information (Continued)
Other Current Assets
| As of October 31 | |||||||||||
| 2021 | 2020 | ||||||||||
| In millions | |||||||||||
| Supplier and other receivables | $ | $ | |||||||||
| Prepaid and other current assets | |||||||||||
| Value-added taxes receivable | |||||||||||
| Available-for-sale investments | |||||||||||
| $ | $ | ||||||||||
Property, Plant and Equipment, Net
| As of October 31 | |||||||||||
| 2021 | 2020 | ||||||||||
| In millions | |||||||||||
| Land, buildings and leasehold improvements | $ | $ | |||||||||
| Machinery and equipment, including equipment held for lease | |||||||||||
| Accumulated depreciation | ( | ( | |||||||||
| $ | $ | ||||||||||
Depreciation expense was $627 million, $673 million and $623 million in fiscal years 2021, 2020 and 2019, respectively.
Other Non-Current Assets
| As of October 31 | |||||||||||
| 2021 | 2020 | ||||||||||
| In millions | |||||||||||
Deferred tax assets(1) | $ | $ | |||||||||
Right-of-use assets from operating leases(2) | |||||||||||
Intangible assets(3) | |||||||||||
Prepaid pension asset(4) | |||||||||||
| Deposits and prepaid | |||||||||||
| Other | |||||||||||
| $ | $ | ||||||||||
(1)See Note 6, “Taxes on Earnings” for detailed information.
(2)See Note 17, “Leases” for detailed information.
(3)See Note 8, “Goodwill and Intangible Assets” for detailed information.
(4)See Note 4, “Retirement and Post-Retirement Benefit Plans” for detailed information.
89
HP INC. AND SUBSIDIARIES
Notes to Consolidated Financial Statements (Continued)
Note 7: Supplementary Financial Information (Continued)
Other Current Liabilities
| As of October 31 | |||||||||||
| 2021 | 2020 | ||||||||||
| In millions | |||||||||||
| Sales and marketing programs | $ | $ | |||||||||
| Employee compensation and benefit | |||||||||||
| Deferred revenue | |||||||||||
| Other accrued taxes | |||||||||||
| Warranty | |||||||||||
Operating lease liabilities(1) | |||||||||||
| Tax liability | |||||||||||
| Other | |||||||||||
| $ | $ | ||||||||||
(1)See Note 17, “Leases” for detailed information.
Other Non-Current Liabilities
| As of October 31 | |||||||||||
| 2021 | 2020 | ||||||||||
| In millions | |||||||||||
| Deferred revenue | $ | $ | |||||||||
Pension, post-retirement, and post-employment liabilities(1) | |||||||||||
Operating lease liabilities(2) | |||||||||||
| Tax liability | |||||||||||
Deferred tax liability(3) | |||||||||||
| Other | |||||||||||
| $ | $ | ||||||||||
(1)See Note 4, “Retirement and Post-Retirement Benefit Plans” for detailed information.
(2)See Note 17, “Leases” for detailed information.
(3)See Note 6, “Taxes on Earnings” for detailed information.
Interest and other, net
| For the fiscal years ended October 31 | |||||||||||||||||
| 2021 | 2020 | 2019 | |||||||||||||||
| In millions | |||||||||||||||||
Oracle litigation proceeds(1) | $ | $ | $ | ||||||||||||||
| Non-operating retirement-related credits | |||||||||||||||||
| Interest expense on borrowings | ( | ( | ( | ||||||||||||||
| Defined benefit plan settlement gains (charges) | ( | ||||||||||||||||
| Loss on extinguishment of debt | ( | ( | |||||||||||||||
Tax indemnifications(2) | ( | ||||||||||||||||
| Other, net | ( | ( | |||||||||||||||
| $ | $ | ( | $ | ( | |||||||||||||
90
HP INC. AND SUBSIDIARIES
Notes to Consolidated Financial Statements (Continued)
Note 7: Supplementary Financial Information (Continued)
(1)See Note 1, “Summary of Significant Accounting Policies” and Note 14, “Litigation and Contingencies” for detailed information.
(2)Fiscal year ended October 31, 2019, includes an adjustment of $764 million, of indemnification receivables, primarily related to resolution of various income tax audits settlements and an adjustment of $417 million pursuant to the termination of the TMA with Hewlett Packard Enterprise.
Net Revenue by Region
| For the fiscal years ended October 31 | |||||||||||||||||
| 2021 | 2020 | 2019 | |||||||||||||||
| In millions | |||||||||||||||||
| Americas | $ | $ | $ | ||||||||||||||
| Europe, Middle East and Africa | |||||||||||||||||
| Asia-Pacific and Japan | |||||||||||||||||
| Total net revenue | $ | $ | $ | ||||||||||||||
Value of Remaining Performance Obligations
As of October 31, 2021, the estimated value of transaction price allocated to remaining performance obligations was $3.7 billion. HP expects to recognize approximately $1.7 billion of the unearned amount in next 12 months and $2.0 billion thereafter.
HP has elected the practical expedients and accordingly does not disclose the aggregate amount of the transaction price allocated to remaining performance obligations if:
•the contract has an original expected duration of one year or less; or
•the revenue from the performance obligation is recognized over time on an as-invoiced basis when the amount corresponds directly with the value to the customer; or
•the portion of the transaction price that is variable in nature is allocated entirely to a wholly unsatisfied performance obligation.
The remaining performance obligations are subject to change and may be affected by various factors, such as termination of contracts, contract modifications and adjustment for currency.
Costs of Obtaining Contracts and Fulfillment Cost
As of October 31, 2021, deferred contract fulfillment and acquisition costs balances were $65 million and $36 million, respectively, included in Other Current Assets and Other Non-Current Assets in the Consolidated Balance Sheets. During the fiscal year ended October 31, 2021, the Company amortized $79 million of these costs.
As of October 31, 2020, deferred contract fulfillment and acquisition costs balances were $65 million and $34 million, respectively, included in Other Current Assets and Other Non-Current Assets in the Consolidated Balance Sheets. During the fiscal year ended October 31, 2020, the Company amortized $98 million of these costs.
Contract Liabilities
As of October 31, 2021 and 2020, HP’s contract liabilities balances were $2.3 billion and $2.2 billion, respectively, included in Other Current Liabilities and Other Non-Current Liabilities in the Consolidated Balance Sheets.
The increase in the contract liabilities balance for the fiscal year 2021 was primarily driven by sales of fixed-price support and maintenance services, partially offset by $1.1 billion of revenue recognized that were included in the opening contract liabilities balance as of October 31, 2020.
As of October 31, 2020 and 2019, HP’s contract liabilities balances were $2.2 billion and $2.1 billion, respectively, included in Other Current Liabilities and Other Non-Current Liabilities in the Consolidated Balance Sheets.
The increase in the contract liabilities balance for the fiscal year 2020 was primarily driven by sales of fixed-price support and maintenance services, partially offset by $1.1 billion of revenue recognized that were included in the opening contract liabilities balance as of October 31, 2019.
91
Note 8: Goodwill and Intangible Assets
Goodwill allocated to HP’s reportable segments and changes in the carrying amount of goodwill were as follows:
| Personal Systems | Printing | Corporate Investments | Total | ||||||||||||||||||||
| In millions | |||||||||||||||||||||||
Balance at October 31, 2019(1) | $ | $ | $ | $ | |||||||||||||||||||
| Acquisitions/adjustments | |||||||||||||||||||||||
| Foreign currency translation | |||||||||||||||||||||||
Balance at October 31, 2020(1) | |||||||||||||||||||||||
| Acquisitions/adjustments | |||||||||||||||||||||||
| Foreign currency translation | |||||||||||||||||||||||
Balance at October 31, 2021(1) | $ | $ | $ | $ | |||||||||||||||||||
(1)Goodwill is net of accumulated impairment losses of $0.8
Goodwill is tested for impairment at the reporting unit level. As of October 31, 2021, our reporting units are consistent with the reportable segments identified in Note 2, “Segment Information”. There were no
Intangible Assets
HP’s acquired intangible assets were composed of:
| As of October 31, 2021 | As of October 31, 2020 | |||||||||||||||||||||||||||||||||||||
| Gross | Accumulated Amortization | Net | Gross | Accumulated Amortization | Net | |||||||||||||||||||||||||||||||||
| In millions | ||||||||||||||||||||||||||||||||||||||
| Customer contracts, customer lists and distribution agreements | $ | $ | $ | $ | $ | $ | ||||||||||||||||||||||||||||||||
| Technology and patents | ||||||||||||||||||||||||||||||||||||||
| Trade name and trademarks | ||||||||||||||||||||||||||||||||||||||
| Total intangible assets | $ | $ | $ | $ | $ | $ | ||||||||||||||||||||||||||||||||
For the fiscal year 2021, the increase in gross intangible assets was primarily due to intangible assets resulting from acquisitions. The intangibles acquired during the year were based on preliminary fair value estimates.
The weighted-average useful lives of intangible assets acquired during the period are as follows:
Weighted-Average Useful Life (in years) | |||||
| Customer contracts and customer lists | |||||
| Technology and patents | |||||
| Trade name and trademarks | |||||
HP INC. AND SUBSIDIARIES
Notes to Consolidated Financial Statements (Continued)
Note 8: Goodwill and Intangible Assets (Continued)
As of October 31, 2021, estimated future amortization expense related to intangible assets was as follows:
| Fiscal year | In millions | ||||
| 2022 | $ | ||||
| 2023 | |||||
| 2024 | |||||
| 2025 | |||||
| 2026 | |||||
| Thereafter | |||||
| Total | $ | ||||
Note 9: Fair Value
Fair value is defined as the price that would be received to sell an asset or paid to transfer a liability (an exit price) in an orderly transaction between market participants at the measurement date.
Fair Value Hierarchy
HP uses valuation techniques that are based upon observable and unobservable inputs. Observable inputs are developed using market data such as publicly available information and reflect the assumptions market participants would use, while unobservable inputs are developed using the best information available about the assumptions market participants would use. Assets and liabilities are classified in the fair value hierarchy based on the lowest level input that is significant to the fair value measurement:
Level 1—Quoted prices (unadjusted) in active markets for identical assets or liabilities.
Level 2—Quoted prices for similar assets or liabilities in active markets, quoted prices for identical or similar assets or liabilities in markets that are not active, inputs other than quoted prices that are observable for the asset or liability and market-corroborated inputs.
Level 3—Unobservable inputs for the asset or liability.
The fair value hierarchy gives the highest priority to observable inputs and lowest priority to unobservable inputs.
93
HP INC. AND SUBSIDIARIES
Notes to Consolidated Financial Statements (Continued)
Note 9: Fair Value (Continued)
The following table presents HP’s assets and liabilities that are measured at fair value on a recurring basis:
| As of October 31, 2021 | As of October 31, 2020 | ||||||||||||||||||||||||||||||||||||||||||||||
| Fair Value Measured Using | Fair Value Measured Using | ||||||||||||||||||||||||||||||||||||||||||||||
| Level 1 | Level 2 | Level 3 | Total | Level 1 | Level 2 | Level 3 | Total | ||||||||||||||||||||||||||||||||||||||||
| In millions | |||||||||||||||||||||||||||||||||||||||||||||||
| Assets: | |||||||||||||||||||||||||||||||||||||||||||||||
| Cash Equivalents | |||||||||||||||||||||||||||||||||||||||||||||||
| Corporate debt | $ | $ | $ | $ | $ | $ | $ | $ | |||||||||||||||||||||||||||||||||||||||
| Financial institution instruments | |||||||||||||||||||||||||||||||||||||||||||||||
Government debt(1) | |||||||||||||||||||||||||||||||||||||||||||||||
| Available-for-Sale Investments | |||||||||||||||||||||||||||||||||||||||||||||||
| Corporate debt | |||||||||||||||||||||||||||||||||||||||||||||||
| Financial institution instruments | |||||||||||||||||||||||||||||||||||||||||||||||
Government debt(1) | |||||||||||||||||||||||||||||||||||||||||||||||
| Marketable equity securities and mutual funds | |||||||||||||||||||||||||||||||||||||||||||||||
| Derivative Instruments | |||||||||||||||||||||||||||||||||||||||||||||||
| Interest rate contracts | |||||||||||||||||||||||||||||||||||||||||||||||
| Foreign currency contracts | |||||||||||||||||||||||||||||||||||||||||||||||
| Other derivatives | |||||||||||||||||||||||||||||||||||||||||||||||
| Total assets | $ | $ | $ | $ | $ | $ | $ | $ | |||||||||||||||||||||||||||||||||||||||
| Liabilities: | |||||||||||||||||||||||||||||||||||||||||||||||
| Derivative Instruments | |||||||||||||||||||||||||||||||||||||||||||||||
| Interest rate contracts | $ | $ | $ | $ | $ | $ | $ | $ | |||||||||||||||||||||||||||||||||||||||
| Foreign currency contracts | |||||||||||||||||||||||||||||||||||||||||||||||
| Other derivatives | |||||||||||||||||||||||||||||||||||||||||||||||
| Total liabilities | $ | $ | $ | $ | $ | $ | $ | $ | |||||||||||||||||||||||||||||||||||||||
(1) Government debt includes instruments such as U.S. treasury notes, U.S. agency securities and non-U.S. government bonds. Money market funds invested in government debt and traded in active markets are included in Level 1.
Valuation Techniques
Cash Equivalents and Investments: HP holds time deposits, money market funds, mutual funds, other debt securities primarily consisting of corporate and foreign government notes and bonds, and common stock and equivalents. HP values cash equivalents and equity investments using quoted market prices, alternative pricing sources, including net asset value, or models utilizing market observable inputs. The fair value of debt investments is based on quoted market prices or model-driven valuations using inputs primarily derived from or corroborated by observable market data, and, in certain instances, valuation models that utilize assumptions which cannot be corroborated with observable market data.
Derivative Instruments: HP uses industry standard valuation models to measure fair value. Where applicable, these models project future cash flows and discount the future amounts to present value using market-based observable inputs, including interest rate curves, HP and counterparty credit risk, foreign exchange rates, and forward and spot prices for currencies and interest rates. See Note 10, “Financial Instruments” for a further discussion of HP’s use of derivative instruments.
Other Fair Value Disclosures
Short- and Long-Term Debt: HP estimates the fair value of its debt primarily using an expected present value technique, which is based on observable market inputs using interest rates currently available to companies of similar credit standing for similar terms and remaining maturities and considering its own credit risk. The portion of HP’s debt that is hedged is reflected in the Consolidated Balance Sheets as an amount equal to the debt’s carrying amount and a fair value adjustment representing
94
HP INC. AND SUBSIDIARIES
Notes to Consolidated Financial Statements (Continued)
Note 9: Fair Value (Continued)
changes in the fair value of the hedged debt obligations arising from movements in benchmark interest rates. The fair value of HP’s short- and long-term debt was $8.0 billion as compared to its carrying amount of $7.5 billion at October 31, 2021. The fair value of HP’s short- and long-term debt was $6.7 billion as compared to its carrying value of $6.2 billion at October 31, 2020. If measured at fair value in the Consolidated Balance Sheets, short- and long-term debt would be classified in Level 2 of the fair value hierarchy.
Other Financial Instruments: For the balance of HP’s financial instruments, primarily accounts receivable, accounts payable and financial liabilities included in Other current liabilities on the Consolidated Balance Sheets, the carrying amounts approximate fair value due to their short maturities. If measured at fair value in the Consolidated Balance Sheets, these other financial instruments would be classified as Level 2 or Level 3 of the fair value hierarchy.
Non-Marketable Equity Investments and Non-Financial Assets: HP’s non-marketable equity investments are measured at cost less impairment, adjusted for observable price changes. HP’s non-financial assets, such as intangible assets, goodwill and property, plant and equipment, are recorded at fair value in the period an impairment charge is recognized. If measured at fair value in the Consolidated Balance Sheets these would generally be classified within Level 3 of the fair value hierarchy.
95
Note 10: Financial Instruments
Cash Equivalents and Available-for-Sale Investments
| As of October 31, 2021 | As of October 31, 2020 | ||||||||||||||||||||||||||||||||||||||||||||||
| Cost | Gross Unrealized Gain | Gross Unrealized Loss | Fair Value | Cost | Gross Unrealized Gain | Gross Unrealized Loss | Fair Value | ||||||||||||||||||||||||||||||||||||||||
| In millions | |||||||||||||||||||||||||||||||||||||||||||||||
| Cash Equivalents: | |||||||||||||||||||||||||||||||||||||||||||||||
| Corporate debt | $ | $ | — | $ | — | $ | $ | $ | — | $ | — | $ | |||||||||||||||||||||||||||||||||||
| Financial institution instruments | — | — | — | — | |||||||||||||||||||||||||||||||||||||||||||
| Government debt | — | — | — | — | |||||||||||||||||||||||||||||||||||||||||||
| Total cash equivalents | — | — | — | — | |||||||||||||||||||||||||||||||||||||||||||
| Available-for-Sale Investments: | |||||||||||||||||||||||||||||||||||||||||||||||
Corporate debt(1) | |||||||||||||||||||||||||||||||||||||||||||||||
Financial institution instruments(1) | |||||||||||||||||||||||||||||||||||||||||||||||
Government debt(1) | |||||||||||||||||||||||||||||||||||||||||||||||
| Marketable equity securities and mutual funds | |||||||||||||||||||||||||||||||||||||||||||||||
| Total available-for-sale investments | |||||||||||||||||||||||||||||||||||||||||||||||
| Total cash equivalents and available-for-sale investments | $ | $ | $ | $ | $ | $ | $ | $ | |||||||||||||||||||||||||||||||||||||||
(1)HP classifies its marketable debt securities as available-for-sale investments within Other current assets on the Consolidated Balance Sheets, including those with maturity dates beyond one year, based on their highly liquid nature and availability for use in current operations.
All highly liquid investments with original maturities of three months or less at the date of acquisition are considered cash equivalents. As of October 31, 2021 and 2020, the carrying amount of cash equivalents approximated fair value due to the short period of time to maturity. Interest income related to cash, cash equivalents and debt securities was approximately $31 million in fiscal year 2021, $40 million in fiscal year 2020, and $80 million in fiscal year 2019. The estimated fair value of the available-for-sale investments may not be representative of values that will be realized in the future.
Contractual maturities of investments in available-for-sale debt securities were as follows:
| As of October 31, 2021 | |||||||||||
| Amortized Cost | Fair Value | ||||||||||
| In millions | |||||||||||
| Due in one year | $ | $ | |||||||||
Non-marketable equity securities in privately held companies are included in Other non-current assets in the Consolidated Balance Sheets. These amounted to $59 million and $44 million as of October 31, 2021 and 2020, respectively.
HP determines credit losses on cash equivalents and available-for-sale debt securities at the individual security level. All instruments are considered investment grade. No credit-related or noncredit-related impairment losses were recorded in the fiscal year 2021.
96
HP INC. AND SUBSIDIARIES
Notes to Consolidated Financial Statements (Continued)
Note 10: Financial Instruments (Continued)
Derivative Instruments
HP uses derivatives to offset business exposure to foreign currency and interest rate risk on expected future cash flows and on certain existing assets and liabilities. As part of its risk management strategy, HP uses derivative instruments, primarily forward contracts, interest rate swaps, total return swaps, treasury rate locks, forward starting swaps and, at times, option contracts to hedge certain foreign currency, interest rate and, return on certain investment exposures. HP may designate its derivative contracts as fair value hedges or cash flow hedges and classifies the cash flows with the activities that correspond to the underlying hedged items. Additionally, for derivatives not designated as hedging instruments, HP categorizes those economic hedges as other derivatives. HP recognizes all derivative instruments at fair value in the Consolidated Balance Sheets.
As a result of its use of derivative instruments, HP is exposed to the risk that its counterparties will fail to meet their contractual obligations. Master netting agreements mitigate credit exposure to counterparties by permitting HP to net amounts due from HP to counterparty against amounts due to HP from the same counterparty under certain conditions. To further limit credit risk, HP has collateral security agreements that allow HP’s custodian to hold collateral from, or require HP to post collateral to, counterparties when aggregate derivative fair values exceed contractually established thresholds which are generally based on the credit ratings of HP and its counterparties. If HP’s or the counterparty’s credit rating falls below a specified credit rating, either party has the right to request full collateralization of the derivatives’ net liability position. The fair value of derivatives with credit contingent features in a net liability position was $64 million and $90 million as of October 31, 2021 and 2020, respectively, all of which were fully collateralized within business days.
Under HP’s derivative contracts, the counterparty can terminate all outstanding trades following a covered change of control event affecting HP that results in the surviving entity being rated below a specified credit rating. This credit contingent provision did not affect HP’s financial position or cash flows as of October 31, 2021 and 2020.
Fair Value Hedges
HP enters into fair value hedges, such as interest rate swaps, to reduce the exposure of its debt portfolio to changes in fair value resulting from changes in benchmark interest rates on HP’s future interest payments.
For derivative instruments that are designated and qualify as fair value hedges, HP recognizes the change in fair value of the derivative instrument, as well as the offsetting change in the fair value of the hedged item, in Interest and other, net in the Consolidated Statements of Earnings in the period of change.
During the fiscal year 2021, HP entered into interest rate swaps with a notional amount of $375 million that were designated as fair value hedges, to convert a portion of its fixed-rate debt to floating. HP terminated interest rate swaps with a notional amount of $500 million that were de-designated as fair value hedges, including $250 million notional amount related to certain fixed-rate debt securities that were extinguished, resulting in an immaterial loss.
Cash Flow Hedges
HP uses forward contracts, treasury rate locks, forward starting swaps and, at times, option contracts designated as cash flow hedges to protect against the foreign currency exchange and interest rate risks inherent in its forecasted net revenue, cost of revenue, operating expenses and debt issuance. HP’s foreign currency cash flow hedges mature predominantly within twelve months ; however, hedges related to long-term procurement arrangements extend several years.
For derivative instruments that are designated and qualify as cash flow hedges, HP initially records changes in fair value of the derivative instrument in Accumulated other comprehensive loss as a separate component of Stockholders’ deficit in the Consolidated Balance Sheets and subsequently reclassifies these amounts into earnings in the period during which the hedged transaction is recognized in earnings. HP reports the changes in the fair value of the derivative instrument in the same financial statement line item as changes in the fair value of the hedged item.
During the fiscal year 2021, HP entered into a series of forward starting swap agreements with notional amounts totaling $2.25 billion to hedge the exposure to variability in future cash flows resulting from changes in interest rate related to anticipated issuance of long-term debt. These agreements were designated as cash flow hedges. In June 2021, a series of these forward starting swaps totaling $750 million notional amount were settled upon the issuance of the senior notes resulting in an immaterial loss recognized in Accumulated other comprehensive loss. The loss will be reclassified to Interest and other, net over the life of the related debt.
Other Derivatives
Other derivatives not designated as hedging instruments consist primarily of forward contracts used to hedge foreign currency-denominated balance sheet exposures. HP also uses total return swaps to hedge its executive deferred compensation plan liability.
97
HP INC. AND SUBSIDIARIES
Notes to Consolidated Financial Statements (Continued)
Note 10: Financial Instruments (Continued)
For derivative instruments not designated as hedging instruments, HP recognizes changes in fair value of the derivative instrument, as well as the offsetting change in the fair value of the hedged item, in Interest and other, net in the Consolidated Statements of Earnings in the period of change.
Hedge Effectiveness
For interest rate swaps designated as fair value hedges, HP measures hedge effectiveness by offsetting the change in fair value of the hedged item with the change in fair value of the derivative. For foreign currency options, forward contracts and forward starting swaps designated as cash flow hedges, HP measures hedge effectiveness by comparing the cumulative change in fair value of the hedge contract with the cumulative change in fair value of the hedged item, both of which are based on forward rates.
During the fiscal 2021 and 2020, no portion of the hedging instruments’ gain or loss was excluded from the assessment of effectiveness for fair value and cash flow hedges.
Fair Value of Derivative Instruments in the Consolidated Balance Sheets
The gross notional and fair value of derivative instruments in the Consolidated Balance Sheets were as follows:
| As of October 31, 2021 | As of October 31, 2020 | ||||||||||||||||||||||||||||||||||||||||||||||||||||||||||
| Outstanding Gross Notional | Other Current Assets | Other Non-Current Assets | Other Current Liabilities | Other Non-Current Liabilities | Outstanding Gross Notional | Other Current Assets | Other Non-Current Assets | Other Current Liabilities | Other Non-Current Liabilities | ||||||||||||||||||||||||||||||||||||||||||||||||||
| In millions | |||||||||||||||||||||||||||||||||||||||||||||||||||||||||||
| Derivatives designated as hedging instruments | |||||||||||||||||||||||||||||||||||||||||||||||||||||||||||
| Fair value hedges: | |||||||||||||||||||||||||||||||||||||||||||||||||||||||||||
| Interest rate contracts | $ | $ | $ | $ | $ | $ | $ | $ | $ | $ | |||||||||||||||||||||||||||||||||||||||||||||||||
| Cash flow hedges: | |||||||||||||||||||||||||||||||||||||||||||||||||||||||||||
| Foreign currency contracts | |||||||||||||||||||||||||||||||||||||||||||||||||||||||||||
| Interest rate contracts | |||||||||||||||||||||||||||||||||||||||||||||||||||||||||||
| Total derivatives designated as hedging instruments | |||||||||||||||||||||||||||||||||||||||||||||||||||||||||||
| Derivatives not designated as hedging instruments | |||||||||||||||||||||||||||||||||||||||||||||||||||||||||||
| Foreign currency contracts | |||||||||||||||||||||||||||||||||||||||||||||||||||||||||||
| Other derivatives | |||||||||||||||||||||||||||||||||||||||||||||||||||||||||||
| Total derivatives not designated as hedging instruments | |||||||||||||||||||||||||||||||||||||||||||||||||||||||||||
| Total derivatives | $ | $ | $ | $ | $ | $ | $ | $ | $ | $ | |||||||||||||||||||||||||||||||||||||||||||||||||
Offsetting of Derivative Instruments
HP recognizes all derivative instruments on a gross basis in the Consolidated Balance Sheets. HP does not offset the fair value of its derivative instruments against the fair value of cash collateral posted under its collateral security agreements. As of
98
HP INC. AND SUBSIDIARIES
Notes to Consolidated Financial Statements (Continued)
Note 10: Financial Instruments (Continued)
October 31, 2021 and 2020, information related to the potential effect of HP’s master netting agreements and collateral security agreements was as follows:
| In the Consolidated Balance Sheets | |||||||||||||||||||||||||||||||||||||||||
| (i) | (ii) | (iii) = (i)–(ii) | (iv) | (v) | (vi) = (iii)–(iv)–(v) | ||||||||||||||||||||||||||||||||||||
| Gross Amount Recognized | Gross Amount Offset | Net Amount Presented | Gross Amounts Not Offset | ||||||||||||||||||||||||||||||||||||||
| Derivatives | Financial Collateral | Net Amount | |||||||||||||||||||||||||||||||||||||||
| In millions | |||||||||||||||||||||||||||||||||||||||||
| As of October 31, 2021 | |||||||||||||||||||||||||||||||||||||||||
| Derivative assets | $ | $ | $ | $ | $ | (1) | $ | ||||||||||||||||||||||||||||||||||
| Derivative liabilities | $ | $ | $ | $ | $ | (2) | $ | ||||||||||||||||||||||||||||||||||
| As of October 31, 2020 | |||||||||||||||||||||||||||||||||||||||||
| Derivative assets | $ | $ | $ | $ | $ | (1) | $ | ||||||||||||||||||||||||||||||||||
| Derivative liabilities | $ | $ | $ | $ | $ | (2) | $ | ( | |||||||||||||||||||||||||||||||||
(1)Represents the cash collateral posted by counterparties as of the respective reporting date for HP’s asset position, net of derivative amounts that could be offset, as of, generally, business days prior to the respective reporting date.
(2)Represents the collateral posted by HP including any re-use of counterparty cash collateral as of the respective reporting date for HP’s liability position, net of derivative amounts that could be offset, as of, generally, business days prior to the respective reporting date.
Effect of Derivative Instruments in the Consolidated Statements of Earnings
The pre-tax effect of derivative instruments and related hedged items in a fair value hedging relationship were as follows:
| Derivative Instrument | Hedged Item | Location | For the fiscal years ended October 31 | Total amounts of income/(expense) line items in the statement of financial performance in which the effects of fair value hedges are recorded | Gain/(loss) recognized in earnings on derivative instruments | Gain/(loss) recognized in earnings on hedged item | ||||||||||||||||||||||||||||||||
| In millions | ||||||||||||||||||||||||||||||||||||||
| Interest rate contracts | Fixed-rate debt | Interest and other, net | 2021 | $ | $ | ( | $ | |||||||||||||||||||||||||||||||
| 2020 | $ | ( | $ | $ | ( | |||||||||||||||||||||||||||||||||
| 2019 | $ | ( | $ | $ | ( | |||||||||||||||||||||||||||||||||
The pre-tax effect of derivative instruments in cash flow hedging relationships included in Accumulated other comprehensive loss was as follows:
| For the fiscal years ended October 31 | |||||||||||||||||
| 2021 | 2020 | 2019 | |||||||||||||||
| In millions | |||||||||||||||||
| Gain/(loss) recognized in Accumulated other comprehensive loss on derivatives: | |||||||||||||||||
| Foreign currency contracts | $ | ( | $ | ( | $ | ||||||||||||
| Interest rate contracts | $ | ( | $ | ( | $ | ||||||||||||
99
HP INC. AND SUBSIDIARIES
Notes to Consolidated Financial Statements (Continued)
Note 10: Financial Instruments (Continued)
The pre-tax effect of derivative instruments in cash flow hedging relationships included in earnings were as follows:
| Total amounts of income/ (expense) line items in the statement of financial performance in which the effects of cash flow hedges are recorded | Gain/ (loss) reclassified from Accumulated other comprehensive loss into earnings | ||||||||||||||||||||||||||||||||||
| For the fiscal years ended October 31 | For the fiscal years ended October 31 | ||||||||||||||||||||||||||||||||||
| 2021 | 2020 | 2019 | 2021 | 2020 | 2019 | ||||||||||||||||||||||||||||||
| In millions | In millions | ||||||||||||||||||||||||||||||||||
| Net revenue | $ | $ | $ | $ | ( | $ | $ | ||||||||||||||||||||||||||||
| Cost of revenue | ( | ( | ( | ( | ( | ( | |||||||||||||||||||||||||||||
| Operating expenses | ( | ( | ( | ( | |||||||||||||||||||||||||||||||
| Interest and other, net | ( | ( | |||||||||||||||||||||||||||||||||
| Total | $ | $ | $ | $ | ( | $ | $ | ||||||||||||||||||||||||||||
As of October 31, 2021, HP expects to reclassify an estimated Accumulated other comprehensive gain of approximately $10 million, net of taxes, to earnings within the next twelve months associated with cash flow hedges along with the earnings effects of the related forecasted transactions. The amounts ultimately reclassified into earnings could be different from the amounts previously included in Accumulated other comprehensive loss based on the change of market rate, and therefore could have different impact on earnings.
The pre-tax effect of derivative instruments not designated as hedging instruments recognized in Interest and other, net in the Consolidated Statements of Earnings for fiscal years 2021, 2020 and 2019 was as follows:
| Gain/(loss) recognized in earnings on derivative instrument | |||||||||||||||||||||||
| Location | 2021 | 2020 | 2019 | ||||||||||||||||||||
| In millions | |||||||||||||||||||||||
| Foreign currency contracts | Interest and other, net | $ | ( | $ | $ | ( | |||||||||||||||||
| Other derivatives | Interest and other, net | ( | |||||||||||||||||||||
| Total | $ | ( | $ | $ | ( | ||||||||||||||||||
100
Note 11: Borrowings
Notes Payable and Short-Term Borrowings
| As of October 31 | |||||||||||||||||||||||
| 2021 | 2020 | ||||||||||||||||||||||
| Amount Outstanding | Weighted-Average Interest Rate | Amount Outstanding | Weighted-Average Interest Rate | ||||||||||||||||||||
| In millions | |||||||||||||||||||||||
| Commercial paper | $ | % | $ | % | |||||||||||||||||||
| Current portion of long-term debt | % | % | |||||||||||||||||||||
| Notes payable to banks, lines of credit and other | % | % | |||||||||||||||||||||
| $ | $ | ||||||||||||||||||||||
Long-Term Debt
| As of October 31 | |||||||||||
| 2021 | 2020 | ||||||||||
| In millions | |||||||||||
U.S. Dollar Global Notes(1) | |||||||||||
| 2009 Shelf Registration Statement: | |||||||||||
$ | |||||||||||
$ | |||||||||||
$ | |||||||||||
$ | |||||||||||
| 2019 Shelf Registration Statement: | |||||||||||
$ | |||||||||||
$ | |||||||||||
$ | |||||||||||
| Private Placement: | |||||||||||
$ | |||||||||||
$ | |||||||||||
Other borrowings at | |||||||||||
| Fair value adjustment related to hedged debt | ( | ||||||||||
| Unamortized debt issuance cost | ( | ( | |||||||||
| Current portion of long-term debt | ( | ( | |||||||||
| Total long-term debt | $ | $ | |||||||||
(1)HP may redeem some or all of the fixed-rate U.S. Dollar Global Notes at any time in accordance with the terms thereof. The U.S. Dollar Global Notes are senior unsecured debt.
In June 2021, HP completed its offering of $2.0 billion aggregate principal amount of senior unsecured notes, consisting of $1.0 billion of 1.450 % notes due June 2026 (the “2026 Notes”), and $1.0 billion of 2.650 % notes due June 2031 (the “2031 Notes”). HP incurred issuance costs of $17 million. HP will pay interest semi-annually on the notes on June 17 and December 17, beginning December 17, 2021. In June 2021, HP terminated a series of forward starting swap agreements with notional amounts totaling $750 million that were executed to mitigate the treasury rate volatility associated with this debt issuance. The net proceeds from the 2026 Notes were used for general corporate purposes, including redemption of existing notes maturing in 2021, as described below. HP intends to allocate an amount equal to the net proceeds of the 2031 Notes to finance or refinance, in whole or in part, environmentally and socially responsible eligible projects in the following eight areas: renewable energy; green buildings; energy efficiency; clean transportation; pollution prevention and control; eco-efficient and/or circular economy products, production technologies and processes; environmentally sustainable management of living natural resources and land use; and socioeconomic advancement and empowerment.
101
HP INC. AND SUBSIDIARIES
Notes to Consolidated Financial Statements (Continued)
Note 11: Borrowings (Continued)
As disclosed in Note 10, “Financial Instruments”, HP uses interest rate swaps to mitigate some of the exposure of its debt portfolio to changes in fair value resulting from changes in benchmark interest rates. Interest rates shown in the table of long-term debt have not been adjusted to reflect the impact of any interest rate swaps.
As of October 31, 2021, aggregate future maturities of debt at face value (excluding unamortized debt issuance cost of $51 million, discounts on debt issuance of $14 million, and fair value adjustment related to hedged debt of $16 million), including other borrowings were as follows:
| Fiscal year | In millions | ||||
| 2022 | $ | ||||
| 2023 | |||||
| 2024 | |||||
| 2025 | |||||
| 2026 | |||||
| Thereafter | |||||
| Total | $ | ||||
Extinguishment of Debt
In July 2021, HP redeemed the remaining aggregate principal amounts of $0.4 billion in outstanding U.S. Dollar 4.375 % Global Notes due September 15, 2021 and $0.6 billion in outstanding U.S. Dollar 4.650 % Global Notes due December 9, 2021. This extinguishment of debt resulted in a net loss of $16 million, which was recorded as Interest and other, net on the Consolidated Statements of Earnings.
As part of the above transactions, HP terminated and settled interest rate swaps with a notional amount of $250 million that were de-designated as fair value hedges.
Commercial Paper
As of October 31, 2021, HP maintained two commercial paper programs. HP’s U.S. program provides for the issuance of U.S. dollar-denominated commercial paper up to a maximum aggregate principal amount of $6.0 billion. HP’s euro commercial paper program provides for the issuance of commercial paper outside of the United States denominated in U.S. dollars, euros or British pounds up to a maximum aggregate principal amount of $6.0 billion or the equivalent in those alternative currencies. The combined aggregate principal amount of commercial paper outstanding under those programs at any one time cannot exceed the $6.0 billion authorized by HP’s Board of Directors.
Credit Facilities
As of October 31, 2021, HP maintained a $5.0 billion sustainability-linked senior unsecured committed revolving credit facility (the “New Revolving Facility”), which HP entered into on May 26, 2021. Commitments under the New Revolving Facility will be available until May 26, 2026. As of October 31, 2020, HP had maintained a $4.0 billion senior unsecured committed revolving credit facility and a $1.0 billion 364 -day revolving credit facility to support the issuance of commercial paper or for general corporate purposes. Commitments under the $4.0 billion and $1.0 billion revolving credit facilities were terminated concurrently with the execution of the New Revolving Facility.
Commitment fees, interest rates and other terms of borrowing under the New Revolving Facility vary based on HP’s external credit ratings and certain sustainability metrics. Funds borrowed under the New Revolving Facility may be used for general corporate purposes.
As of October 31, 2021, HP was in compliance with the covenants in the New Revolving Facility.
Available Borrowing Resources
As of October 31, 2021, HP had available borrowing resources of $579 million from uncommitted lines of credit in addition to the New Revolving Facility.
102
Note 12: Stockholders’ Deficit
Share Repurchase Program
HP’s share repurchase program authorizes both open market and private repurchase transactions. In fiscal year 2021, HP executed share repurchases of 224 million shares and settled total shares for $6.3 billion. In fiscal year 2020, HP executed share repurchases of 168 million shares and settled total shares for $3.1 billion. In fiscal year 2019, HP executed share repurchases of 118 million shares and settled total shares for $2.4 billion. Share repurchases executed during fiscal years 2021, 2020, and 2019 included 1.6 million shares, 2.3 million shares, and 0.9 million shares settled in November 2021, 2020, and 2019, respectively.
The shares repurchased in fiscal years 2021, 2020 and 2019 were all open market repurchase transactions. On February 22, 2020, HP’s Board of Directors increased HP’s share repurchase authorization to $15.0 billion in total. As of October 31, 2021, HP had approximately $6.4 billion remaining under the share repurchase authorizations approved by HP’s Board of Directors.
Taxes related to Other Comprehensive Income (Loss)
| For the fiscal years ended October 31 | |||||||||||||||||
| 2021 | 2020 | 2019 | |||||||||||||||
| In millions | |||||||||||||||||
| Tax effect on change in unrealized components of available-for-sale debt securities: | |||||||||||||||||
| Tax provision on unrealized gains arising during the period | $ | ( | $ | $ | |||||||||||||
| Tax effect on change in unrealized components of cash flow hedges: | |||||||||||||||||
| Tax (provision) benefit on unrealized gains (losses) arising during the period | ( | ( | |||||||||||||||
| Tax (benefit) provision on losses (gains) reclassified into earnings | ( | ||||||||||||||||
| ( | |||||||||||||||||
| Tax effect on change in unrealized components of defined benefit plans: | |||||||||||||||||
| Tax (provision) benefit on gains (losses) arising during the period | ( | ||||||||||||||||
| Tax benefit on amortization of actuarial loss and prior service benefit | ( | ( | ( | ||||||||||||||
| Tax benefit (provision) on curtailments, settlements and other | ( | ( | |||||||||||||||
| ( | ( | ( | |||||||||||||||
| Tax effect on change in cumulative translation adjustment | ( | ||||||||||||||||
| Tax (provision) benefit on other comprehensive income (loss) | $ | ( | $ | $ | ( | ||||||||||||
103
HP INC. AND SUBSIDIARIES
Notes to Consolidated Financial Statements (Continued)
Note 12: Stockholders’ Deficit (Continued)
Changes and reclassifications related to Other Comprehensive Income (Loss), net of taxes
| For the year ended October 31 | |||||||||||||||||
| 2021 | 2020 | 2019 | |||||||||||||||
| In millions | |||||||||||||||||
| Other comprehensive income (loss), net of taxes: | |||||||||||||||||
| Change in unrealized components of available-for-sale debt securities: | |||||||||||||||||
| Unrealized gains arising during the period | $ | $ | $ | ||||||||||||||
| Losses reclassified into earnings | |||||||||||||||||
| Change in unrealized components of cash flow hedges: | |||||||||||||||||
| Unrealized (losses) gains arising during the period | ( | ( | |||||||||||||||
| Losses (gains) reclassified into earnings | ( | ( | |||||||||||||||
| ( | ( | ||||||||||||||||
| Change in unrealized components of defined benefit plans: | |||||||||||||||||
| Gains (losses) arising during the period | ( | ( | |||||||||||||||
Amortization of actuarial loss and prior service benefit(1) | |||||||||||||||||
| Curtailments, settlements and other | ( | ( | |||||||||||||||
| ( | |||||||||||||||||
| Change in cumulative translation adjustment | ( | ||||||||||||||||
| Other comprehensive income (loss), net of taxes | $ | $ | ( | $ | ( | ||||||||||||
(1)These components are included in the computation of net pension and post-retirement benefit (credit) charges in Note 4,
“Retirement and Post-Retirement Benefit Plans”.
The components of Accumulated other comprehensive loss, net of taxes as of October 31, 2021 and changes during fiscal year 2021 were as follows:
| Net unrealized gains on available-for-sale securities | Net unrealized gains (losses) on cash flow hedges | Unrealized components of defined benefit plans | Change in cumulative translation adjustment | Accumulated other comprehensive loss | |||||||||||||||||||||||||
| In millions | |||||||||||||||||||||||||||||
| Balance at beginning of period | $ | $ | ( | $ | ( | $ | $ | ( | |||||||||||||||||||||
| Other comprehensive gains (losses) before reclassifications | ( | ||||||||||||||||||||||||||||
| Reclassifications of losses into earnings | |||||||||||||||||||||||||||||
| Reclassifications of curtailments, settlements and other into earnings | — | — | ( | — | ( | ||||||||||||||||||||||||
| Balance at end of period | $ | $ | $ | ( | $ | $ | ( | ||||||||||||||||||||||
104
Note 13: Earnings Per Share
A reconciliation of the number of shares used for basic and diluted net EPS calculations is as follows:
| For the fiscal years ended October 31 | |||||||||||||||||
| 2021 | 2020 | 2019 | |||||||||||||||
| In millions, except per share amounts | |||||||||||||||||
| Numerator: | |||||||||||||||||
| Net earnings | $ | $ | $ | ||||||||||||||
| Denominator: | |||||||||||||||||
| Weighted-average shares used to compute basic net EPS | |||||||||||||||||
| Dilutive effect of employee stock plans | |||||||||||||||||
| Weighted-average shares used to compute diluted net EPS | |||||||||||||||||
| Net earnings per share: | |||||||||||||||||
| Basic | $ | $ | $ | ||||||||||||||
| Diluted | $ | $ | $ | ||||||||||||||
Anti-dilutive weighted-average stock-based compensation awards(1) | |||||||||||||||||
(1)HP excludes from the calculation of diluted net EPS stock options and restricted stock units where the assumed proceeds exceed the average market price, because their effect would be anti-dilutive. The assumed proceeds of a stock option include the sum of its exercise price, and average unrecognized compensation cost. The assumed proceeds of a restricted stock unit represent unrecognized compensation cost.
105
Note 14: Litigation and Contingencies
HP is involved in lawsuits, claims, investigations and proceedings, including those identified below, consisting of IP, commercial, securities, employment, employee benefits and environmental matters that arise in the ordinary course of business. HP accrues a liability when management believes that it is both probable that a liability has been incurred and the amount of loss can be reasonably estimated. HP believes it has recorded adequate provisions for any such matters and, as of October 31, 2021, it was not reasonably possible that a material loss had been incurred in excess of the amounts recognized in HP’s financial statements. HP reviews these matters at least quarterly and adjusts its accruals to reflect the impact of negotiations, settlements, rulings, advice of legal counsel, and other information and events pertaining to a particular case. Pursuant to the separation and distribution agreement, HP shares responsibility with Hewlett Packard Enterprise for certain matters, as indicated below, and Hewlett Packard Enterprise has agreed to indemnify HP in whole or in part with respect to certain matters. Based on its experience, HP believes that any damage amounts claimed in the specific matters discussed below are not a meaningful indicator of HP’s potential liability. Litigation is inherently unpredictable. However, HP believes it has valid defenses with respect to legal matters pending against it. Nevertheless, cash flows or results of operations could be materially affected in any particular period by the resolution of one or more of these contingencies.
Litigation, Proceedings and Investigations
Copyright Levies. Proceedings are ongoing or have been concluded involving HP in certain European countries, challenging the imposition or the modification of levies regimes upon IT equipment (such as PCs or printers) or the restrictions to exonerate the application of private copying levies on devices purchased by business users. The levies are generally based upon the number of products sold and the per-product amounts of the levies, which vary. Some European countries are expected to implement legislation to introduce or extend existing levy schemes to digital devices. HP, other companies and various industry associations have opposed the extension of levies to the digital environment and certain requirements for business sales exemptions, and have advocated alternative models of compensation to rights holders.
Based on industry opposition to the extension of levies to digital products, HP’s assessments of the merits of various proceedings and HP’s estimates of the number of units impacted and the amounts of the levies, HP has accrued amounts that it believes are adequate to address the ongoing disputes.
Hewlett-Packard Company v. Oracle Corporation. On June 15, 2011, HP filed suit against Oracle Corporation (“Oracle”) in California Superior Court in Santa Clara County in connection with Oracle’s March 2011 announcement that it was discontinuing software support for HP’s Itanium-based line of mission-critical servers. HP asserted, among other things, that Oracle’s actions breached the contract that was signed by the parties as part of the settlement of the litigation relating to Oracle’s hiring of Mark Hurd. In the first phase of the bifurcated trial, the court ruled that the contract at issue required Oracle to continue to offer its software products on HP’s Itanium-based servers for as long as HP decided to sell such servers. In the second phase, the jury returned a verdict in favor of HP, awarding HP approximately $3.0 billion in damages, which included approximately $1.7 billion for past lost profits and $1.3 billion for future lost profits. The court entered judgment for HP for this amount with interest accruing until the judgment is paid. Oracle appealed the trial court’s judgment and HP filed a cross-appeal challenging the trial court’s denial of prejudgment interest. The Court of Appeals affirmed both the trial court’s judgment and its denial of prejudgment interest to HP. Oracle filed a petition with the California Supreme Court for review, which was denied on September 29, 2021. On October 12, 2021, Oracle paid approximately $4.65 billion to satisfy the judgment with interest. During the fourth quarter of fiscal 2021, HP recorded approximately $2.3 billion as a gain (Interest and other, net) in relation to the damages awarded, representing HP’s interest in the amount recovered, which is being shared equally between HP and Hewlett Packard Enterprise, less $47.4 million reimbursed to Hewlett Packard Enterprise for certain costs incurred in the prosecution of the action prior to the Separation. Oracle has until December 28, 2021 to file a petition for certiorari asking the United States Supreme Court for review. Review by the United States Supreme Court is discretionary, and HP believes the likelihood the award of damages will be reduced or reversed is remote.
Forsyth, et al. v. HP Inc. and Hewlett Packard Enterprise. This is a purported class and collective action filed on August 18, 2016 in the United States District Court, Northern District of California, against HP and Hewlett Packard Enterprise (“HPE”) alleging the defendants violated federal and state law by terminating older workers and replacing them with younger workers. In their most recent complaint, plaintiffs seek to represent (1) a putative nationwide federal Age Discrimination in Employment Act (ADEA) collective comprised of all former HP Inc. employees 40 years of age and older who had their employment terminated under a WFR plan in or after 2014 or 2015, depending on state law; and (2) a putative Rule 23 class under California law comprised of all former HP Inc. employees 40 years of age and older who had their employment terminated in California under a WFR plan in or after 2012. Excluded from the putative collective and class are employees who (a) signed a Waiver and General Release Agreement at termination, or (b) signed an Agreement to Arbitrate Claims. Similar
106
HP INC. AND SUBSIDIARIES
Notes to Consolidated Financial Statements (Continued)
Note 14: Litigation and Contingencies (Continued)
claims are pending against HPE. Because the court granted plaintiffs’ motion for preliminary certification of the putative nationwide ADEA collectives, a third-party administrator has notified eligible former employees of their right to opt into the ADEA collective. Former employees must opt in by February 15, 2022. Plaintiffs seek monetary damages, punitive damages, and other relief.
India Directorate of Revenue Intelligence Proceedings. On April 30 and May 10, 2010, the India Directorate of Revenue Intelligence (the “DRI”) issued show cause notices to Hewlett-Packard India Sales Private Limited (“HP India”), a subsidiary of HP, seven HP India employees and one former HP India employee alleging that HP India underpaid customs duties while importing products and spare parts into India and seeking to recover an aggregate of approximately $370 million, plus penalties and interest. Prior to the issuance of the notices, HP India deposited approximately $16 million with the DRI and agreed to post a provisional bond in exchange for the DRI’s agreement to not seize HP India products and spare parts or interrupt business by HP India.
On April 11, 2012, the Bangalore Commissioner of Customs issued an order on the products-related notice affirming certain duties and penalties against HP India and the named individuals of approximately $386 million, of which HP India had already deposited $9 million. On December 11, 2012, HP India voluntarily deposited an additional $10 million in connection with the products-related notice. The differential duty demand is subject to interest. On April 20, 2012, the Commissioner issued an order on the parts-related notice affirming certain duties and penalties against HP India and certain of the named individuals of approximately $17 million, of which HP India had already deposited $7 million. After the order, HP India deposited an additional $3 million in connection with the parts-related notice so as to avoid certain penalties.
HP India filed appeals of the Commissioner’s orders before the Customs, Excise and Service Tax Appellate Tribunal (the “Customs Tribunal”) along with applications for waiver of the pre-deposit of remaining demand amounts as a condition for hearing the appeals. The Customs Department has also filed cross-appeals before the Customs Tribunal. On January 24, 2013, the Customs Tribunal ordered HP India to deposit an additional $24 million against the products order, which HP India deposited in March 2013. On February 7, 2014, the Customs Tribunal granted HP India’s application for extension of the stay of deposit until disposal of the appeals. On October 27, 2014, the Customs Tribunal commenced hearings on the cross-appeals of the Commissioner’s orders and rejected HP India’s request to remand the matter to the Commissioner on procedural grounds. The Customs Tribunal cancelled hearings to reconvene in 2015, 2016, and January 2019. On January 20, 2021, the Customs Tribunal held a virtual hearing during which the judge allowed HP’s application for a physical hearing on the merits as soon as practicable, which will be scheduled when physical hearings resume at court. Pursuant to the separation and distribution agreement, Hewlett Packard Enterprise has agreed to indemnify HP in part, based on the extent to which any liability arises from the products and spare parts of Hewlett Packard Enterprise’s businesses.
Philips Patent Litigation. In September 2020, Koninklijke Philips N.V. and Philips North America LLC (collectively, “Philips”) filed a complaint against HP for patent infringement in federal court for the District of Delaware and filed a companion complaint with the U.S. International Trade Commission (“ITC”) pursuant to Section 337 of the Tariff Act against HP and 8 other sets of respondents. Both complaints allege that certain digital video-capable devices and components thereof infringe four of Philips patents. In October 2020, the ITC instituted an investigation, and Philips later withdrew two of the four patents. On October 21, 2021, the ITC rendered an initial determination that there is no violation of Section 337. The ITC is expected to render a final decision by February 22, 2022. In the ITC proceeding, Philips seeks an order enjoining respondents from importing, or selling after importation, the accused products. In the district court case, Philips seeks unspecified damages and an injunction against HP, and the case has been stayed pending resolution of the ITC proceeding.
Caltech Patent Litigation. On November 11, 2020, the California Institute of Technology (“Caltech”) filed a complaint against HP for patent infringement in the federal court for the Western District of Texas. On March 19, 2021, Caltech filed an amendment to this same complaint. The complaint as amended alleges infringement of five of Caltech’s patents, U.S. Patent Nos. 7,116,710; 7,421,032; 7,716,552; 7,916,781; and 8,284,833. The accused products are HP commercial and consumer PCs as well as wireless printers that comply with the IEEE 802.11n, 802.11ac, and/or 802.11ax standards. Caltech seeks unspecified damages and other relief. The court has stayed the case pending the decision by the U.S. Court of Appeals for the Federal Circuit in The California Inst. of Tech. v. Broadcom Ltd et al., Case No. 2020-2222.
In re HP Inc. Securities Litigation (Electrical Workers Pension Fund, Local 103, I.B.E.W. v. HP Inc., et al.). On February 19, 2020, Electrical Workers Pension Fund, Local 103, I.B.E.W. filed a putative class action complaint against HP, Dion Weisler, Catherine Lesjak, and Steven Fieler in U.S. District Court in the Northern District of California. The court appointed the State of Rhode Island, Office of the General Treasurer, on behalf of the Employees’ Retirement System of Rhode Island and Iron Workers Local 580 Joint Funds as Lead Plaintiffs. Lead Plaintiffs filed an amended complaint, which
107
HP INC. AND SUBSIDIARIES
Notes to Consolidated Financial Statements (Continued)
Note 14: Litigation and Contingencies (Continued)
additionally named as defendants Enrique Lores and Christoph Schell. HP and the named officers filed a motion to dismiss the complaint for failure to state a claim upon which relief can be granted. The court granted HP’s motion to dismiss and granted plaintiffs leave to amend the complaint. Plaintiffs’ second amended complaint, which no longer names Christoph Schell as a defendant, alleges, among other things, that from February 23, 2017 to October 3, 2019, HP and the named officers violated Sections 10(b) and 20(a) of the Exchange Act by making false or misleading statements about HP’s printing supplies business. It further alleges that Dion Weisler and Enrique Lores violated Sections 10(b) and 20A of the Exchange Act by allegedly selling shares of HP common stock during this period while in possession of material, non-public adverse information about HP’s printing supplies business. Plaintiffs seek compensatory damages and other relief. HP and the named officers filed a motion to dismiss the second amended complaint for failure to state a claim upon which relief can be granted. On September 15, 2021, the court granted HP’s motion. Plaintiffs are appealing the decision.
York County on behalf of the County of York Retirement Fund v. HP Inc., et al., and related proceedings. On November 5, 2020, York County, on behalf of the County of York Retirement Fund, filed a putative class action complaint against HP, Dion Weisler, and Catherine Lesjak in federal court in the Northern District of California. The court appointed Maryland Electrical Industry Pension Fund as Lead Plaintiff. Lead Plaintiff filed a consolidated complaint, which additionally names as defendants Enrique Lores and Richard Bailey. The complaint alleges, among other things, that from November 5, 2015 to June 21, 2016, HP and the named current and former officers violated Sections 10(b) and 20(a) of the Exchange Act by concealing material information and making false statements about HP’s printing supplies business. Plaintiff seeks compensatory damages and other relief. HP and the named officers filed a motion to dismiss the complaint for failure to state a claim upon which relief can be granted. That motion is fully briefed. On May 17, 2021, stockholder Scott Franklin filed a derivative complaint against certain current and former officers and directors in federal court in the District of Delaware. Plaintiff purports to bring the action on behalf of HP, which he has named as a nominal defendant, and it makes substantially the same factual allegations as in the York County securities complaint, bringing claims for breach of fiduciary duty and violations of securities laws. The derivative plaintiff seeks compensatory damages, governance reforms, and other relief. By court order following stipulations by the parties, the case was transferred to the Northern District of California, and the case was stayed pending a ruling on the motion to dismiss in York County.
Legal Proceedings re Authentication of Supplies. Civil litigation or government investigations involving supplies authentication protocols used in certain HP printers are pending, have concluded, or may be filed or opened in multiple geographies, including but not limited to the United States, Italy, Israel, and the Netherlands. The supplies authentication protocols are often referred to as Dynamic Security. The core allegations in these proceedings claim misleading or inadequate consumer notifications and permissions pertaining to the use of Dynamic Security, the impact of firmware updates, or the potential inability of cartridges with clone chips or circuitry to work in HP printers with Dynamic Security.
123Inkt Foundation litigation (Netherlands). On November 23, 2016, a foundation known as Stichting 123Inkt-Huismerk Klanten (the “Foundation”) filed a complaint in district court in Amsterdam against HP Nederland B.V. and HP Inc. arising out of the use of Dynamic Security in certain OfficeJet printers. Digital Revolution B.V. (trading as 123Inkt) established the Foundation to pursue the interests of approximately 960 of its customers who transferred their claims to it. The complaint alleges that HP’s use of Dynamic Security was unlawful, asserts a variety of claims, and seeks injunctive relief to prohibit use of Dynamic Security, damages, and attorneys’ fees. In December 2019, the Amsterdam Court of Appeal rejected the Foundation’s argument that Dynamic Security is unlawful but ruled that error messages displayed on HP printers in September 2016 without providing prior warning regarding Dynamic Security were misleading. Both parties appealed to the Supreme Court of the Netherlands. In July 2021, the Attorney General issued a non-binding opinion concluding that both parties’ appeals should be rejected. The Supreme Court has scheduled its final decision to be delivered on January 7, 2022.
Gensin v. HP Inc. (Israel). HP is named in a consolidated, consumer class action pending in the District Court in Jerusalem relating to HP’s use of Dynamic Security in certain OfficeJet printers, which was initially filed on October 25,2017. Plaintiff asserts consumer protection, tort and other statutory claims primarily on the basis that no information on Dynamic Security was available in Hebrew, and plaintiff seeks class relief, injunctive relief, damages, and attorneys’ fees. HP has reached an agreement to settle this case, which has been submitted to the Court for approval. The Court has scheduled a hearing for January 13, 2022 to address any issues that may arise with the settlement.
Parziale v. HP Inc. (United States). In August 2019, HP was named in this purported nationwide consumer class action in federal court in the Northern District of California arising out of the use of Dynamic Security in certain OfficeJet printers. Plaintiff’s Second Amended Complaint alleged claims under Florida Consumer Protection statutes, the federal Computer Fraud and Abuse Act, and for trespass to chattels. Plaintiff sought class relief, injunctive relief, damages, including punitive damages, and attorneys’ fees. On September 29, 2020, the court granted HP’s motion to dismiss, dismissing the case in
108
HP INC. AND SUBSIDIARIES
Notes to Consolidated Financial Statements (Continued)
Note 14: Litigation and Contingencies (Continued)
full with prejudice. The plaintiff appealed, and the parties subsequently reached a settlement. On August 2, 2021, the plaintiff dismissed the appeal with prejudice.
Consumer Protection Investigation (Italy). In December 2020, the Italian Competition Authority (Autorità Garante della Concorrenza e del Mercato) (“AGCM”) notified HP of its decision that HP engaged in unfair commercial practices with respect to its disclosures to consumers about Dynamic Security and alleged use of certain warranty and data collection practices regarding the use of third-party cartridges in HP printers. The AGCM decision (i) ordered HP to end the allegedly unfair commercial practices; (ii) fined HP €5 10 million); (iii) required HP to file a compliance report within 60 days; (iv) ordered HP to publicly publish a corrective statement within 120 days; and (v) ordered HP to amend the packaging of its printers within 120 days. On December 21, 2020, HP paid the imposed fines. On February 5, 2021, HP filed an appeal. On April 6, 2021, HP filed its compliance report, which it subsequently supplemented, and, on June 23, 2021 the AGCM accepted the compliance plan as sufficient. HP’s appeal is pending in front of the Regional Administrative Court of Lazio.
Digital Revolution B.V. v. HP Nederland B.V., et al. (Netherlands). On March 30, 2020, Digital Revolution B.V. (trading as 123Inkt) served a complaint filed in Amsterdam District Court. The complaint generally alleges that HP’s use of Dynamic Security in certain HP printers constituted a violation of competition law and unfair and misleading commercial practices and advertising. The complaint asserts a variety of claims and seeks injunctive relief, including prohibition of Dynamic Security and disclosure of cartridge authentication protocols, damages, and attorneys’ fees. On September 9, 2020, HP filed its defense and a counterclaim for unfair commercial practices and misleading and unlawful comparative advertising. The Court held an oral hearing on September 13, 2021. The Court’s decision has not yet issued and is subject to appeal.
Mobile Emergency Housing Corp., et al. v. HP, Inc. (United States). In December 2020, HP was named in a putative nationwide consumer class action pending in federal court in California arising out of the use of Dynamic Security firmware updates in certain LaserJet printers. The complaint alleges a variety of claims, including state consumer protection and unfair business claims and state and federal computer access and data collection claims. Plaintiffs seek compensatory damages, restitution, injunctive relief against alleged unfair business practices, and other relief. The case is in its early stages and discovery has commenced.
Autonomy-Related Legal Matters
Investigations. As a result of the findings of an internal investigation, HP provided information to government authorities, including the U.S. Department of Justice (“DOJ”) related to accounting improprieties, disclosure failures and misrepresentations at Autonomy that occurred before and in connection with HP’s 2011 acquisition of Autonomy. In November 2016, a federal grand jury indicted Sushovan Hussain, former CFO of Autonomy on charges of conspiracy to commit wire fraud, securities fraud, and multiple counts of wire fraud. The indictment alleged that Mr. Hussain engaged in a scheme to defraud purchasers and sellers of securities of Autonomy and HP about Autonomy’s true financial performance and condition. On April 30, 2018, a jury found Mr. Hussain guilty of all charges against him, and that judgment was affirmed on appeal in August 2020. In November 2018, a federal grand jury indicted Michael Lynch, former CEO of Autonomy, and Stephen Chamberlain, former VP of Finance of Autonomy. The indictment charged Dr. Lynch and Mr. Chamberlain with conspiracy to commit wire fraud and multiple counts of wire fraud. HP is continuing to cooperate with the ongoing enforcement actions.
Autonomy Corporation Limited v. Michael Lynch and Sushovan Hussain. On April 17, 2015, four former HP subsidiaries that became subsidiaries of Hewlett Packard Enterprise at the time of the Separation (Autonomy Corporation Limited, Hewlett Packard Vision BV, Autonomy Systems, Limited, and Autonomy, Inc.) initiated civil proceedings in the U.K. High Court of Justice against two members of Autonomy’s former management, Michael Lynch and Sushovan Hussain. The Particulars of Claim seek damages in excess of $5 billion from Messrs. Lynch and Hussain for breach of their fiduciary duties by causing Autonomy group companies to engage in improper transactions and accounting practices. On October 1, 2015, Messrs. Lynch and Hussain filed their defenses. Mr. Lynch also filed a counterclaim against Autonomy Corporation Limited seeking $160 million in damages, among other things, for alleged misstatements regarding Lynch. The Hewlett Packard Enterprise subsidiary claimants filed their replies to the defenses and the asserted counter-claim on March 11, 2016. Trial began on March 25, 2019 and was completed in January 2020. The parties are awaiting a ruling from the Court.
Environmental
HP is party to, or otherwise involved in, proceedings brought by U.S. or state environmental agencies under the Comprehensive Environmental Response, Compensation and Liability Act (“CERCLA”), known as “Superfund,” or state laws similar to CERCLA, and may become a party to, or otherwise involved in, proceedings brought by private parties for
109
HP INC. AND SUBSIDIARIES
Notes to Consolidated Financial Statements (Continued)
Note 14: Litigation and Contingencies (Continued)
Note 15: Guarantees, Indemnifications and Warranties
Guarantees
In the ordinary course of business, HP may issue performance guarantees to certain of its clients, customers and other parties pursuant to which HP has guaranteed the performance obligations of third parties. Some of those guarantees may be backed by standby letters of credit or surety bonds. In general, HP would be obligated to perform over the term of the guarantee in the event a specified triggering event occurs as defined by the guarantee. HP believes the likelihood of having to perform under a material guarantee is remote.
Cross-Indemnifications with Hewlett Packard Enterprise
The separation and distribution agreement provides for cross-indemnities between HP and Hewlett Packard Enterprise for liabilities allocated to the respective party pursuant to the terms of such agreement. For information on cross-indemnifications with Hewlett Packard Enterprise for litigation matters, see Note 14, “Litigation and Contingencies”.
Indemnifications
In the ordinary course of business, HP enters into contractual arrangements under which HP may agree to indemnify a third party to such arrangement from any losses incurred relating to the services they perform on behalf of HP or for losses arising from certain events as defined within the particular contract, which may include, for example, litigation or claims relating to past performance. HP also provides indemnifications to certain vendors and customers against claims of intellectual property infringement made by third parties arising from the vendors’ and customers’ use of HP’s software products and services and certain other matters. Some indemnifications may not be subject to maximum loss clauses. Historically, payments made related to these indemnifications have been immaterial.
HP records tax indemnification receivables from various third parties for certain tax liabilities that HP is jointly and severally liable for, but for which it is indemnified by those same third parties under existing legal agreements. HP records a tax indemnification payable to various third parties under these agreements when management believes that it is both probable that a liability has been incurred and the amount can be reasonably estimated. The actual amount that the third parties pay or may be obligated to pay HP could vary depending on the outcome of certain unresolved tax matters, which may not be resolved for several years.
Warranties
HP accrues the estimated cost of product warranties at the time it recognizes revenue. HP engages in extensive product quality programs and processes, including actively monitoring and evaluating the quality of its component suppliers; however, contractual warranty terms, repair costs, product call rates, average cost per call, current period product shipments and ongoing product failure rates, as well as specific product class failures outside of HP’s baseline experience, affect the estimated warranty obligation.
HP’s aggregate product warranty liabilities and changes were as follows:
| For the fiscal years ended October 31 | |||||||||||
| 2021 | 2020 | ||||||||||
| In millions | |||||||||||
| Balance at beginning of year | $ | $ | |||||||||
| Accruals for warranties issued | |||||||||||
| Adjustments related to pre-existing warranties (including changes in estimates) | |||||||||||
| Settlements made (in cash or in kind) | ( | ( | |||||||||
| Balance at end of year | $ | $ | |||||||||
110
Note 16: Commitments
Unconditional Purchase Obligations
As of October 31, 2021, HP had unconditional purchase obligations of $6.9 billion. These unconditional purchase obligations include agreements to purchase goods or services that are enforceable and legally binding on HP and that specify all significant terms, including fixed or minimum quantities to be purchased, fixed, minimum or variable price provisions and the approximate timing of the transaction. These unconditional purchase obligations are primarily related to inventory and service support. Unconditional purchase obligations exclude agreements that are cancellable without penalty.
As of October 31, 2021, unconditional purchase obligations were as follows:
| Fiscal year | In millions | |||||||
| 2022 | $ | |||||||
| 2023 | ||||||||
| 2024 | ||||||||
| 2025 | ||||||||
| 2026 | ||||||||
| Thereafter | ||||||||
| Total | $ | |||||||
111
Note 17: Leases
HP determines, at lease inception, whether or not an arrangement contains a lease. A significant portion of the operating lease portfolio includes real estate leases. Additionally, HP has identified embedded operating leases within certain outsourced supply chain contracts. Leasing arrangements typically range in terms from 1 to 12 years with varying renewal and termination options. Substantially all of HP’s leases are considered operating leases. Finance leases, short-term leases and sub-lease income were not material as of October 31, 2021 and 2020 or for the fiscal years ended October 31, 2021 and 2020, respectively.
Lease terms include options to extend or terminate the lease when it is reasonably certain that HP will exercise such options. HP generally considers the economic life of the ROU assets to be comparable to the useful life of similar owned assets. HP’s leases generally do not provide a residual guarantee.
Operating leases are included in , and . Finance leases are included in Property, plant and equipment, net, Notes payable and short-term borrowings and Long-term debt in the Consolidated Balance Sheets.
As most of the leases do not provide an implicit interest rate, HP uses the incremental borrowing rate based on the information available at the commencement date of a lease in determining the present value of lease payments. The incremental borrowing rate is determined based on the rate of interest that HP would have to pay to borrow an amount equal to the lease payments on a collateralized basis over a similar term. HP uses the unsecured borrowing rate and risk-adjusts that rate to approximate a collateralized rate.
HP has elected the practical expedient to combine lease and non-lease components as a single lease element for its real estate leases and certain outsourced supply chain contracts in calculating the ROU assets and lease liabilities. Where HP chooses not to combine the lease and non-lease components, HP allocates contract consideration to the lease and non-lease components based on relative standalone prices.
HP reviews the impairment of the ROU assets consistent with the approach applied for other long-lived assets.
The components of lease expense are as follows:
| For the fiscal years ended October 31 | |||||||||||
| 2021 | 2020 | ||||||||||
| In millions | |||||||||||
| Operating lease cost | $ | $ | |||||||||
| Variable cost | |||||||||||
| Total lease expense | $ | $ | |||||||||
All lease expenses, including variable lease costs, are primarily included in Cost of revenue and Selling, general and administrative expenses in the Consolidated Statements of Earnings based on the use of the facilities.
Variable lease expense relates primarily to leased real estate utilized for office space and outsourced warehousing. These costs primarily include adjustments for inflation, payments dependent on a rate or index or usage of asset and common area maintenance charges. These costs are not included in the lease liability and are recognized in the period in which they are incurred.
The following table presents supplemental information relating to the cash flows arising from lease transactions. Cash payments made from variable lease costs and short-term leases are not included in the measurement of operating lease liabilities, and, as such, are excluded from the amounts below:
| For the fiscal years ended October 31 | |||||||||||
| 2021 | 2020 | ||||||||||
| In millions | |||||||||||
| Cash paid for amount included in the measurement of lease liabilities | $ | $ | |||||||||
Right-of-use assets obtained in exchange of lease liabilities(1) | $ | $ | |||||||||
(1) Includes the impact of new leases as well as remeasurements and modifications to existing leases.
112
HP INC. AND SUBSIDIARIES
Notes to Consolidated Financial Statements (Continued)
Note 17: Leases (Continued)
Weighted-average information associated with the measurement of our remaining operating lease liabilities is as follows:
| As of October 31 | |||||||||||
| 2021 | 2020 | ||||||||||
| Weighted-average remaining lease term in years | |||||||||||
| Weighted-average discount rate | % | % | |||||||||
The following maturity analysis presents expected undiscounted cash outflows for operating leases on an annual basis for the next five years:
| Fiscal year | In millions | |||||||
| 2022 | $ | |||||||
| 2023 | ||||||||
| 2024 | ||||||||
| 2025 | ||||||||
| 2026 | ||||||||
| Thereafter | ||||||||
| Total lease payments | ||||||||
| Less: Imputed interest | ||||||||
| Total lease liabilities | $ | |||||||
There were no material operating leases that HP had entered into and that were yet to commence as of October 31, 2021.
113
Note 18: Acquisitions
Acquisitions in fiscal 2021
In fiscal 2021, HP completed four acquisitions. The estimated fair value of the assets acquired and liabilities assumed at the acquisition date for all four acquisitions, as set forth in the table below, reflects various preliminary fair value estimates and analyses, including preliminary work performed by third-party valuation specialists, which are subject to change within the measurement period as valuations are finalized. The fair values of certain tangible assets and liabilities acquired, the valuation of intangible assets acquired, certain legal matters, income and non income-based taxes, and residual goodwill are not yet finalized and subject to change. HP expects to continue to obtain information to assist in the calculation of the fair value of the net assets acquired at the acquisition date during the measurement period.
Pro forma results of operations for these acquisitions have not been presented because they are not material to HP’s consolidated results of operations, either individually or in the aggregate. Goodwill, which represents the excess of the purchase price over the net tangible and intangible assets acquired, is not deductible for tax purposes.
The following table presents the aggregate estimated fair values of the assets acquired and liabilities assumed, including those items that are still preliminary allocations, for all of HP's acquisitions in fiscal 2021:
| In millions | |||||
| Goodwill | $ | ||||
| Amortizable intangible assets | |||||
| Net assets acquired | |||||
| Total fair value of consideration | $ | ||||
Acquisition of HyperX, the gaming division of Kingston Technology Company
HP’s largest acquisition in fiscal 2021 was its acquisition of HyperX, the gaming division of Kingston Technology Company which was completed in June 2021 with a total fair value purchase consideration of $412 million. The acquisition supports HP’s strategy to drive growth in gaming and peripherals within the Personal Systems segment. In connection with this acquisition, HP recorded approximately $112 million of goodwill and $197 million of amortizable purchased intangible assets.
114
ITEM 9. Changes in and Disagreements with Accountants on Accounting and Financial Disclosure.
None.
ITEM 9A. Controls and Procedures.
Under the supervision and with the participation of our management, including our principal executive officer and principal financial officer, we conducted an evaluation of the effectiveness of the design and operation of our disclosure controls and procedures, as defined in Rules 13a-15(e) and 15d-15(e) under the Exchange Act as of the end of the period covered by this report (the “Evaluation Date”). Based on this evaluation, our principal executive officer and principal financial officer concluded as of the Evaluation Date that our disclosure controls and procedures were effective such that the information required to be disclosed by us in our SEC reports (i) is recorded, processed, summarized and reported within the time periods specified in SEC rules and forms, and (ii) is accumulated and communicated to HP’s management, including our principal executive officer and principal financial officer, as appropriate to allow timely decisions regarding required disclosure.
Under the supervision and with the participation of our management, including our principal executive officer and principal financial officer, we conducted an evaluation of any changes in our internal control over financial reporting (as such term is defined in Rules 13a-15(f) and 15d-15(f) under the Exchange Act) that occurred during our most recently completed fiscal quarter. Based on that evaluation, our principal executive officer and principal financial officer concluded that there has not been any change in our internal control over financial reporting during the fourth quarter of fiscal year 2021 that has materially affected, or is reasonably likely to materially affect, our internal control over financial reporting.
See Management’s Report on Internal Control over Financial Reporting and the Report of Independent Registered Public Accounting Firm on our internal control over financial reporting in Item 8, which are incorporated herein by reference.
ITEM 9B. Other Information.
None.
ITEM 9C. Disclosure Regarding Foreign Jurisdictions that Prevent Inspections.
Not Applicable.
115
PART III
ITEM 10. Directors, Executive Officers and Corporate Governance.
The names of the executive officers of HP and their ages, titles and biographies as of the date hereof are incorporated by reference from Part I, Item 1, above.
The following information is included in HP’s Proxy Statement related to its 2022 Annual Meeting of Stockholders to be filed within 120 days after HP’s fiscal year end of October 31, 2021 (the “Proxy Statement”) and is incorporated herein by reference:
•Information regarding directors of HP who are standing for reelection and any persons nominated to become directors of HP is set forth under “Corporate Governance and Board of Directors—Management Proposal No. 1 Election of Directors.”
•Information regarding HP’s Audit Committee and designated “audit committee financial experts” is set forth under “Corporate Governance and Board of Directors—Management Proposal No. 1 Election of Directors—How We Are Organized—Audit Committee.”
•Information on HP’s code of business conduct and ethics for directors, officers and employees, also known as “Integrity at HP”, is set forth under “Corporate Governance and Board of Directors—Management Proposal No. 1 Election of Directors—How We Govern and Are Governed—Code of Conduct” and information on HP’s Corporate Governance Guidelines is set forth under “—How We Are Selected—Director Nominees and Director Nominees’ Experience and Qualifications” and “—How We Govern and Are Governed—Director Independence.”
ITEM 11. Executive Compensation.
The following information is included in the Proxy Statement and is incorporated herein by reference:
•Information regarding HP’s compensation of its named executive officers is set forth under “Executive Compensation.”
•Information regarding HP’s compensation of its directors is set forth under “Corporate Governance and Board of Directors—Management Proposal No. 1 Election of Directors—How We Are Compensated—Director Compensation and Stock Ownership Guidelines.”
•The report of HP’s HR and Compensation Committee is set forth under “Executive Compensation—Management Proposal No. 3 Advisory Vote to Approve Executive Compensation—HR and Compensation Committee Report on Executive Compensation.”
ITEM 12. Security Ownership of Certain Beneficial Owners and Management and Related Stockholder Matters.
The following information is included in the Proxy Statement and is incorporated herein by reference:
•Information regarding security ownership of certain beneficial owners, directors and executive officers is set forth under “Ownership of Our Stock—Common Stock Ownership of Certain Beneficial Owners and Management.”
•Information regarding HP’s equity compensation plans, including both stockholder approved plans and non-stockholder approved plans, is set forth in the section entitled “Equity Compensation Plan Information.”
ITEM 13. Certain Relationships and Related Transactions, and Director Independence.
The following information is included in the Proxy Statement and is incorporated herein by reference:
•Information regarding transactions with related persons is set forth under “Corporate Governance and Board of Directors—Management Proposal No. 1 Election of Directors—Related-Person Transactions Policies and Procedures—Fiscal 2021 Related-Person Transactions.”
•Information regarding director independence is set forth under “Corporate Governance and Board of Directors—Management Proposal No. 1 Election of Directors—How We Govern and Are Governed—Director Independence.”
116
ITEM 14. Principal Accounting Fees and Services.
Information regarding principal accounting fees and services is set forth under “Audit Matters—Management Proposal No. 2 Ratification of Independent Registered Public Accounting Firm—Principal Accounting Fees and Services” in the Proxy Statement, which information is incorporated herein by reference.
117
PART IV
ITEM 15. Exhibits and Financial Statement Schedules.
(a)The following documents are filed as part of this report:
1.All Financial Statements:
The following financial statements are filed as part of this report under Item 8—“Financial Statements and Supplementary Data.”
2.Financial Statement Schedules:
All schedules are omitted as the required information is not applicable or the information is presented in the Consolidated Financial Statements and notes thereto in Item 8 above.
3.Exhibits:
118
EXHIBIT INDEX
| Exhibit Number | Incorporated by Reference | |||||||||||||||||||||||||||||||
| Exhibit Description | Form | File No. | Exhibit(s) | Filing Date | ||||||||||||||||||||||||||||
| 2(a) | 8-K | 001-04423 | 2.1 | November 5, 2015 | ||||||||||||||||||||||||||||
| 2(b) | 8-K | 001-04423 | 2.2 | November 5, 2015 | ||||||||||||||||||||||||||||
| 2(c) | 8-K | 001-04423 | 2.4 | November 5, 2015 | ||||||||||||||||||||||||||||
| 3(a) | 10-Q | 001-04423 | 3(a) | June 12, 1998 | ||||||||||||||||||||||||||||
| 3(b) | 10-Q | 001-04423 | 3(b) | March 16, 2001 | ||||||||||||||||||||||||||||
119
| Exhibit Number | Incorporated by Reference | |||||||||||||||||||||||||||||||
| Exhibit Description | Form | File No. | Exhibit(s) | Filing Date | ||||||||||||||||||||||||||||
| 3(c) | 8-K | 001-04423 | 3.2 | October 22, 2015 | ||||||||||||||||||||||||||||
| 3(d) | 8-K | 001-04423 | 3.1 | April 7, 2016 | ||||||||||||||||||||||||||||
| 3(e) | 8-K | 001-04423 | 3.1 | February 13, 2019 | ||||||||||||||||||||||||||||
| 3(f) | 8-K | 001-04423 | 3.1 | February 20, 2020 | ||||||||||||||||||||||||||||
| 4(a) | S-3 | 333-21516 | 4.1 | December 15, 2016 | ||||||||||||||||||||||||||||
| 4(b) | S-3 | 333-21516 | 4.2 | December 15, 2016 | ||||||||||||||||||||||||||||
| 4(c) | Form of Registrant’s 4.375% Global Note due September 15, 2021 and 6.000% Global Note due September 15, 2041 and form of related Officers’ Certificate. | 8-K | 001-04423 | September 19, 2011 | ||||||||||||||||||||||||||||
| 4(d) | Form of Registrant’s 4.650% Global Note due December 9, 2021 and related Officers’ Certificate. | 8-K | 001-04423 | December 12, 2011 | ||||||||||||||||||||||||||||
| 4(e) | Form of Registrant’s 4.050% Global Note due September 15, 2022 and related Officers’ Certificate. | 8-K | 001-04423 | March 12, 2012 | ||||||||||||||||||||||||||||
| 4(f) | 8-A/A | 001-04423 | 4.1 | June 23, 2006 | ||||||||||||||||||||||||||||
| 4(g) | 10-Q | 001-04423 | 4(j) | June 5, 2018 | ||||||||||||||||||||||||||||
| 4(h) | 10-K | 001-04423 | 4(j) | December 12, 2019 | ||||||||||||||||||||||||||||
| 4(i) | 8-K | 001-04423 | 4.1 | June 17, 2020 | ||||||||||||||||||||||||||||
| 4(j) | Form of 2.200% notes due 2025 and related Officers’ Certificate. | 8-K | 001-04423 | June 17, 2020 | ||||||||||||||||||||||||||||
| 4(k) | Form of 3.000% notes due 2027 and related Officers’ Certificate. | 8-K | 001-04423 | June 17, 2020 | ||||||||||||||||||||||||||||
| 4(l) | Form of 3.400% notes due 2030 and related Officers’ Certificate. | 8-K | 001-04423 | June 17, 2020 | ||||||||||||||||||||||||||||
| 4(m) | 8-K | 001-04423 | 4.2 | June 21, 2021 | ||||||||||||||||||||||||||||
| 4(n) | 8-K | 001-04423 | 4.3 | June 21, 2021 | ||||||||||||||||||||||||||||
120
| Exhibit Number | Incorporated by Reference | |||||||||||||||||||||||||||||||
| Exhibit Description | Form | File No. | Exhibit(s) | Filing Date | ||||||||||||||||||||||||||||
| 10(a) | S-8 | 333-114253 | 4.1 | April 7, 2004 | ||||||||||||||||||||||||||||
| 10(b) | 8-K | 001-04423 | 10.2 | September 21, 2006 | ||||||||||||||||||||||||||||
| 10(c) | 8-K | 001-04423 | 99.3 | November 23, 2005 | ||||||||||||||||||||||||||||
| 10(d) | 8-K | 001-04423 | 10.2 | January 24, 2008 | ||||||||||||||||||||||||||||
| 10(e) | 10-Q | 001-04423 | 10(o)(o) | March 10, 2008 | ||||||||||||||||||||||||||||
| 10(f) | 10-Q | 001-04423 | 10(p)(p) | March 10, 2008 | ||||||||||||||||||||||||||||
| 10(g) | 10-Q | 001-04423 | 10(u)(u) | June 6, 2008 | ||||||||||||||||||||||||||||
| 10(h) | 10-Q | 001-04423 | 10(b)(b)(b) | March 10, 2009 | ||||||||||||||||||||||||||||
| 10(i) | 10-K | 001-04423 | 10(i)(i)(i) | December 15, 2010 | ||||||||||||||||||||||||||||
| 10(j) | 10-K | 001-04423 | 10(j)(j)(j) | December 15, 2010 | ||||||||||||||||||||||||||||
| 10(k) | 10-K | 001-04423 | 10(k)(k)(k) | December 15, 2010 | ||||||||||||||||||||||||||||
| 10(1) | 8-K | 001-04423 | 10.2 | March 21, 2013 | ||||||||||||||||||||||||||||
| 10(m) | 10-Q | 001-04423 | 10(v)(v) | March 11, 2014 | ||||||||||||||||||||||||||||
| 10(n) | 10-Q | 001-04423 | 10(w)(w) | March 11, 2014 | ||||||||||||||||||||||||||||
| 10(o) | 10-Q | 001-04423 | 10(x)(x) | March 11, 2014 | ||||||||||||||||||||||||||||
| 10(p) | 10-Q | 001-04423 | 10(a)(a)(a) | March 11, 2014 | ||||||||||||||||||||||||||||
| 10(q) | 10-Q | 001-04423 | 10(b)(b)(b) | March 11, 2014 | ||||||||||||||||||||||||||||
| 10(r) | 10-Q | 001-04423 | 10(e)(e)(e) | March 11, 2015 | ||||||||||||||||||||||||||||
| 10(s) | 10-Q | 001-04423 | 10(f)(f)(f) | March 11, 2015 | ||||||||||||||||||||||||||||
| 10(t) | 10-Q | 001-04423 | 10(i)(i)(i) | March 11, 2015 | ||||||||||||||||||||||||||||
| 10(u) | 10-K | 001-04423 | 10(e)(e)(e) | December 16, 2015 | ||||||||||||||||||||||||||||
| 10(v) | 10-K | 001-04423 | 10(f)(f)(f) | December 16, 2015 | ||||||||||||||||||||||||||||
| 10(w) | 10-K | 001-04423 | 10(g)(g)(g) | December 16, 2015 | ||||||||||||||||||||||||||||
121
| Exhibit Number | Incorporated by Reference | |||||||||||||||||||||||||||||||
| Exhibit Description | Form | File No. | Exhibit(s) | Filing Date | ||||||||||||||||||||||||||||
| 10(x) | 10-K/A | 001-04423 | 10(n)(n) | December 15, 2017 | ||||||||||||||||||||||||||||
| 10(y) | 10-Q | 001-04423 | 10(p)(p) | March 5, 2020 | ||||||||||||||||||||||||||||
| 10(z) | 10-Q | 001-04423 | 10(p)(p) | March 3, 2016 | ||||||||||||||||||||||||||||
| 10(a)(a) | 10-Q | 001-04423 | 10(w)(w) | March 2, 2017 | ||||||||||||||||||||||||||||
| 10(b)(b) | 10-Q | 001-04423 | 10(x)(x) | March 2, 2017 | ||||||||||||||||||||||||||||
| 10(c)(c) | 10-Q | 001-04423 | 10(y)(y) | March 2, 2017 | ||||||||||||||||||||||||||||
| 10(d)(d) | 10-Q | 001-04423 | 10(b)(b)(b) | March 1, 2018 | ||||||||||||||||||||||||||||
| 10(e)(e) | 10-Q | 001-04423 | 10(c)(c)(c) | March 1, 2018 | ||||||||||||||||||||||||||||
| 10(f)(f) | 10-Q | 001-04423 | 10(e)(e)(e) | March 1, 2018 | ||||||||||||||||||||||||||||
| 10(g)(g) | 10-Q | 001-04423 | 10(f)(f)(f) | March 1, 2018 | ||||||||||||||||||||||||||||
| 10(h)(h) | 10-K | 001-04423 | 10(g)(g)(g) | December 13, 2018 | ||||||||||||||||||||||||||||
| 10(i)(i) | 10-K | 001-04423 | 10(h)(h)(h) | December 13, 2018 | ||||||||||||||||||||||||||||
| 10(j)(j) | 10-Q | 001-04423 | 10(j)(j)(j) | March 5, 2019 | ||||||||||||||||||||||||||||
| 10(k)(k) | 10-Q | 001-04423 | 10(k)(k)(k) | March 5, 2019 | ||||||||||||||||||||||||||||
| 10(l)(l) | 10-Q | 001-04423 | 10(l)(l)(l) | August 29, 2019 | ||||||||||||||||||||||||||||
| 10(m)(m) | 10-K | 001-04423 | 10(m)(m)(m) | December 12, 2019 | ||||||||||||||||||||||||||||
| 10(n)(n) | 10-K | 001-04423 | 10(n)(n)(n) | December 12, 2019 | ||||||||||||||||||||||||||||
122
| Exhibit Number | Incorporated by Reference | |||||||||||||||||||||||||||||||
| Exhibit Description | Form | File No. | Exhibit(s) | Filing Date | ||||||||||||||||||||||||||||
| 10(o)(o) | 10-Q | 001-04423 | 10(m)(m)(m) | March 5, 2020 | ||||||||||||||||||||||||||||
| 10(p)(p) | 10-Q | 001-04423 | 10(n)(n)(n) | March 5, 2020 | ||||||||||||||||||||||||||||
| 10(q)(q) | 10-Q | 001-04423 | 10(o)(o)(o) | March 5, 2020 | ||||||||||||||||||||||||||||
| 10(r)(r) | 10-Q | 001-04423 | 10(p)(p)(p) | March 5, 2020 | ||||||||||||||||||||||||||||
| 10(s)(s) | 10-Q | 001-04423 | 10(q)(q)(q) | March 5, 2020 | ||||||||||||||||||||||||||||
| 10(t)(t) | 10-Q | 001-04423 | 10(r)(r)(r) | June 5, 2020 | ||||||||||||||||||||||||||||
| 10(u)(u) | 10-Q | 001-04423 | 10(s)(s)(s) | June 5, 2020 | ||||||||||||||||||||||||||||
| 10(v)(v) | 10-Q | 001-04423 | 10(t)(t)(t) | June 5, 2020 | ||||||||||||||||||||||||||||
| 10(w)(w) | 10-K | 001-04423 | 10(x)(x)(x) | December 10, 2020 | ||||||||||||||||||||||||||||
| 10(x)(x) | 10-K | 001-04423 | 10(y)(y)(y) | December 10, 2020 | ||||||||||||||||||||||||||||
| 10(y)(y) | 10-Q | 001-04423 | 10(x)(x)(x) | March 5, 2021 | ||||||||||||||||||||||||||||
| 10(z)(z) | 10-Q | 001-04423 | 10(y)(y)(y) | March 5, 2021 | ||||||||||||||||||||||||||||
| 10(a)(a)(a) | 10-Q | 001-04423 | 10(z)(z)(z) | March 5, 2021 | ||||||||||||||||||||||||||||
| 10(b)(b)(b) | 10-Q | 001-04423 | 10(a)(a)(a)(a) | March 5, 2021 | ||||||||||||||||||||||||||||
| 10(c)(c)(c) | 10-Q | 001-04423 | 10(b)(b)(b)(b) | March 5, 2021 | ||||||||||||||||||||||||||||
| 10(d)(d)(d) | 10-Q | 001-04423 | 10(c)(c)(c)(c) | March 5, 2021 | ||||||||||||||||||||||||||||
| 10(e)(e)(e) | 10-Q | 001-04423 | 10(d)(d)(d)(d) | March 5, 2021 | ||||||||||||||||||||||||||||
| 10(f)(f)(f) | 10-Q | 001-04423 | 10(e)(e)(e)(e) | March 5, 2021 | ||||||||||||||||||||||||||||
123
| Exhibit Number | Incorporated by Reference | |||||||||||||||||||||||||||||||
| Exhibit Description | Form | File No. | Exhibit(s) | Filing Date | ||||||||||||||||||||||||||||
| 10(g)(g)(g) | 10-Q | 001-04423 | 10(f)(f)(f)(f) | March 5, 2021 | ||||||||||||||||||||||||||||
| 10(h)(h)(h) | 10-Q | 001-04423 | 10(g)(g)(g)(g) | March 5, 2021 | ||||||||||||||||||||||||||||
| 10(i)(i)(i) | 8-K | 001-04423 | 10.1 | June 1, 2021 | ||||||||||||||||||||||||||||
| 10(j)(j)(j) | 10-Q | 001-04423 | 10(j)(j)(j) | September 3, 2021 | ||||||||||||||||||||||||||||
| 21 | ||||||||||||||||||||||||||||||||
| 23 | ||||||||||||||||||||||||||||||||
| 24 | Power of Attorney (included on the signature page). | |||||||||||||||||||||||||||||||
| 31.1 | ||||||||||||||||||||||||||||||||
| 31.2 | ||||||||||||||||||||||||||||||||
| 32 | ||||||||||||||||||||||||||||||||
| 101.INS | XBRL Instance Document - the instance document does not appear in the Interactive Data File because its XBRL tags are embedded within the Inline XBRL document.† | |||||||||||||||||||||||||||||||
| 101.SCH | Inline XBRL Taxonomy Extension Schema Document.† | |||||||||||||||||||||||||||||||
| 101.CAL | Inline XBRL Taxonomy Extension Calculation Linkbase Document.† | |||||||||||||||||||||||||||||||
| 101.DEF | Inline XBRL Taxonomy Extension Definition Linkbase Document.† | |||||||||||||||||||||||||||||||
| 101.LAB | Inline XBRL Taxonomy Extension Label Linkbase Document.† | |||||||||||||||||||||||||||||||
| 101.PRE | Inline XBRL Taxonomy Extension Presentation Linkbase Document.† | |||||||||||||||||||||||||||||||
| 104 | The cover page from the Company’s Annual Report on Form 10-K for the fiscal year ended October 31, 2021, formatted in Inline XBRL (included within the Exhibit 101 attachments).† | |||||||||||||||||||||||||||||||
* Indicates management contract or compensatory plan, contract or arrangement.
** Certain schedules and exhibits to this agreement have been omitted pursuant to Item 601(a)(5) of Registration S-K. A copy of any omitted schedule and/or exhibit will be furnished supplementally to the SEC upon request.
† Filed herewith.
†† Furnished herewith.
124
The registrant agrees to furnish to the Commission supplementally upon request a copy of (1) any instrument with respect to long-term debt not filed herewith as to which the total amount of securities authorized thereunder does not exceed 10% of the total assets of the registrant and its subsidiaries on a consolidated basis and (2) any omitted schedules to any material agreements set forth above.
125
ITEM 16. Form 10-K Summary
None.
126
SIGNATURES
Pursuant to the requirements of Section 13 or 15(d) of the Securities Exchange Act of 1934, the registrant has duly caused this report to be signed on its behalf by the undersigned, thereunto duly authorized.
| Date: December 9, 2021 | HP INC. | |||||||
| By: | /s/ MARIE MYERS | |||||||
Marie Myers Chief Financial Officer | ||||||||
127
POWER OF ATTORNEY
KNOW ALL PERSONS BY THESE PRESENTS, that each person whose signature appears below constitutes and appoints Marie Myers, Harvey Anderson and Rick Hansen, or any of them, his or her attorneys-in-fact, for such person in any and all capacities, to sign any amendments to this report and to file the same, with exhibits thereto, and other documents in connection therewith, with the Securities and Exchange Commission, hereby ratifying and confirming all that either of said attorneys-in-fact, or substitute or substitutes, may do or cause to be done by virtue hereof.
Pursuant to the requirements of the Securities Exchange Act of 1934, this report has been signed below by the following persons on behalf of the registrant and in the capacities and on the dates indicated.
| Signature | Title(s) | Date | ||||||||||||
| /s/ ENRIQUE LORES | President and Chief Executive Officer and Director (Principal Executive Officer) | December 9, 2021 | ||||||||||||
| Enrique Lores | ||||||||||||||
| /s/ MARIE MYERS | Chief Financial Officer (Principal Financial Officer) | December 9, 2021 | ||||||||||||
| Marie Myers | ||||||||||||||
| /s/ BARB BARTON WEISZHAAR | Acting Global Controller (Principal Accounting Officer) | December 9, 2021 | ||||||||||||
| Barb Barton Weiszhaar | ||||||||||||||
| /s/ AIDA ALVAREZ | Director | December 9, 2021 | ||||||||||||
| Aida Alvarez | ||||||||||||||
| /s/ SHUMEET BANERJI | Director | December 9, 2021 | ||||||||||||
| Shumeet Banerji | ||||||||||||||
| /s/ ROBERT R. BENNETT | Director | December 9, 2021 | ||||||||||||
| Robert R. Bennett | ||||||||||||||
| /s/ CHARLES V. BERGH | Director | December 9, 2021 | ||||||||||||
| Charles V. Bergh | ||||||||||||||
| /s/ BRUCE BROUSSARD | Director | December 9, 2021 | ||||||||||||
| Bruce Broussard | ||||||||||||||
| /s/ STACY BROWN-PHILPOT | Director | December 9, 2021 | ||||||||||||
| Stacy Brown-Philpot | ||||||||||||||
| /s/ STEPHANIE BURNS | Director | December 9, 2021 | ||||||||||||
| Stephanie Burns | ||||||||||||||
| /s/ MARY ANNE CITRINO | Director | December 9, 2021 | ||||||||||||
| Mary Anne Citrino | ||||||||||||||
| /s/ RICHARD L. CLEMMER | Director | December 9, 2021 | ||||||||||||
| Richard L. Clemmer | ||||||||||||||
| /s/ JUDITH MISCIK | Director | December 9, 2021 | ||||||||||||
| Judith Miscik | ||||||||||||||
| /s/ KIM K.W. RUCKER | Director | December 9, 2021 | ||||||||||||
| Kim K.W. Rucker | ||||||||||||||
| /s/ SUBRA SURESH | Director | December 9, 2021 | ||||||||||||
| Subra Suresh | ||||||||||||||
128
Serious News for Serious Traders! Try StreetInsider.com Premium Free!
You May Also Be Interested In
- HP Inc. (HPQ) Amends Bylaws to Decrease Board to 12 Seats
- First Generation of Advance Silicon-Based Anode Material Continues Delivering Strong Performance
- Capitol Federal Financial, Inc.® Announces Quarterly Dividend
Create E-mail Alert Related Categories
SEC FilingsSign up for StreetInsider Free!
Receive full access to all new and archived articles, unlimited portfolio tracking, e-mail alerts, custom newswires and RSS feeds - and more!
