

Form 10-K EAST WEST BANCORP INC For: Dec 31
 Tweet
Tweet Share
ShareUNITED STATES
SECURITIES AND EXCHANGE COMMISSION
Washington, D.C. 20549
FORM 10-K
THE SECURITIES EXCHANGE ACT OF 1934
For the fiscal year ended December 31 , 2021
OR
THE SECURITIES EXCHANGE ACT OF 1934
For the transition period from to
Commission file number 000-24939
(Exact name of registrant as specified in its charter)
(State or other jurisdiction of incorporation or organization)
(I.R.S. Employer Identification No.)
(Address of principal executive offices) (Zip Code)
(626 ) 768-6000
(Registrant’s telephone number, including area code)
Securities registered pursuant to Section 12(b) of the Act:
| Title of each class | Trading Symbol(s) | Name of each exchange on which registered | |||||||||||||||
Securities registered pursuant to Section 12(g) of the Act: None
Indicate by check mark if the registrant is a well-known seasoned issuer, as defined in Rule 405 of the Securities Act. Yes ☒ No ☐
Indicate by check mark if the registrant is not required to file reports pursuant to Section 13 or Section 15(d) of the Act. Yes ☐ No ☒
Indicate by check mark whether the registrant (1) has filed all reports required to be filed by Section 13 or 15(d) of the Securities Exchange Act of 1934 during the preceding 12 months (or for such shorter period that the registrant was required to file such reports), and (2) has been subject to such filing requirements for the past 90 days. Yes ☒ No ☐
Indicate by check mark whether the registrant has submitted electronically every Interactive Data File required to be submitted pursuant to Rule 405 of Regulation S-T (§ 232.405 of this chapter) during the preceding 12 months (or for such shorter period that the registrant was required to submit such files). Yes ☒ No ☐
Indicate by check mark whether the registrant is a large accelerated filer, an accelerated filer, a non-accelerated filer, a smaller reporting company, or an emerging growth company. See the definitions of “large accelerated filer,” “accelerated filer,” “smaller reporting company,” and “emerging growth company” in Rule 12b-2 of the Exchange Act.
| ☒ | Accelerated filer | ☐ | Smaller reporting company | ||||||||||||||
| Non-accelerated filer | ☐ | Emerging growth company | |||||||||||||||
If an emerging growth company, indicate by check mark if the registrant has elected not to use the extended transition period for complying with any new or revised financial accounting standards provided pursuant to Section 13(a) of the Exchange Act. ☐
Indicate by check mark whether the registrant has filed a report on and attestation to its management’s assessment of the effectiveness of its internal control over financial reporting under Section 404(b) of the Sarbanes-Oxley Act (15 U.S.C. 7262(b)) by the registered public accounting firm that prepared or issued its audit report. ☒
Indicate by check mark whether the registrant is a shell company (as defined in Rule 12b-2 of the Exchange Act). Yes ☐ No ☒
The aggregate market value of the registrant’s common stock held by non-affiliates was approximately $10,090,038,515 (based on the June 30, 2021 closing price of Common Stock of $71.69 per share). As of January 31, 2022, 141,908,514 shares of East West Bancorp, Inc. Common Stock were outstanding.
DOCUMENT INCORPORATED BY REFERENCE
EAST WEST BANCORP, INC.
2021 ANNUAL REPORT ON FORM 10-K
TABLE OF CONTENTS
| Page | |||||||||||
2
PART I
Forward-Looking Statements
This Annual Report on Form 10-K (“this Form 10-K”) contains forward-looking statements that are intended to be covered by the safe harbor provision for such statements provided by the Private Securities Litigation Reform Act of 1995. In addition, the Company may make forward-looking statements in other documents that it files with, or furnishes to, the United States (“U.S.”) Securities and Exchange Commission (“SEC”) and management may make forward-looking statements to analysts, investors, media members and others. Forward-looking statements are those that do not relate to historical facts, and are based on current expectations, estimates, and projections about the Company’s industry, management’s beliefs, and certain assumptions made by management, many of which, by their nature, are inherently uncertain and beyond the Company’s control. These statements relate to the Company’s financial condition, results of operations, plans, objectives, future performance and/or business. They usually can be identified by the use of forward-looking language, such as “anticipates,” “assumes,” “believes,” “can,” “continues,” “could,” “estimates,” “expects,” “forecasts,” “goal,” “intends to,” “likely,” “may,” “might,” “objective,” “plans,” “potential,” “projects,” “target,” “trend,” “remains,” “should,” “will,” “would,” or similar expressions, and the negative thereof. You should not place undue reliance on these statements, as they are subject to risks and uncertainties, including, but not limited to, those described in this Form 10-K. When considering these forward-looking statements, you should keep in mind these risks and uncertainties, as well as any cautionary statements the Company may make. Moreover, you should treat these statements as speaking only as of the date they are made and based only on information then actually known to the Company.
There are a number of important factors that could cause future results to differ materially from historical performance and these forward-looking statements. Factors that might cause such differences include, but are not limited to:
•changes in the global economy, including an economic slowdown or market disruption, level of inflation, interest rate environment, housing prices, employment levels, rate of growth and general business conditions;
•the impact of any future federal government shutdown and uncertainty regarding the federal government’s debt limit;
•changes in local, regional and global business, economic and political conditions, and geopolitical events;
•the economic, financial, reputational and other impacts of the ongoing COVID-19 global pandemic, including variants thereof, and any other pandemic, epidemic or health-related crisis, as well as a deterioration of asset quality and an increase in credit losses due to the COVID-19 global pandemic;
•changes in laws or the regulatory environment, including regulatory reform initiatives and policies of the U.S. Department of Treasury, the Board of Governors of the Federal Reserve System (the “Federal Reserve”), the Federal Deposit Insurance Corporation (“FDIC”), the SEC, the Consumer Financial Protection Bureau (“CFPB”) and the California Department of Financial Protection and Innovation (“DFPI”) - Division of Financial Institutions;
•the changes and effects thereof in trade, monetary and fiscal policies and laws, including the ongoing trade, economic and political disputes between the U.S. and the People’s Republic of China and the monetary policies of the Federal Reserve;
•changes in the commercial and consumer real estate markets;
•changes in consumer or commercial spending, and savings and borrowing habits, patterns and behaviors;
•fluctuations in the Company’s stock price;
•impact from potential changes to income tax laws and regulations, federal spending and economic stimulus programs;
•the Company’s ability to compete effectively against financial institutions in its banking markets and other entities, including as a result of emerging technologies;
•the soundness of other financial institutions;
•success and timing of the Company’s business strategies;
•the Company’s ability to retain key officers and employees;
•impact on the Company’s funding costs, net interest income and net interest margin from changes in key variable market interest rates, competition, regulatory requirements and the Company’s product mix;
•changes in the Company’s costs of operation, compliance and expansion;
•the Company’s ability to adopt and successfully integrate new technologies into its business in a strategic manner;
•impact of the benchmark interest rate reform in the U.S. including the transition away from U.S. dollar (“USD”) London Interbank Offered Rate (“LIBOR”) to alternative reference rates;
3
•impact of communications or technology disruption, failure in, or breach of, the Company’s operational or security systems or infrastructure, or those of third party vendors with which the Company does business, including as a result of cyber-attacks; and other similar matters which could result in, among other things, confidential and/or proprietary information being disclosed or misused and materially impact the Company’s ability to provide services to its clients;
•adequacy of the Company’s risk management framework, disclosure controls and procedures and internal control over financial reporting;
•future credit quality and performance, including the Company’s expectations regarding future credit losses and allowance levels;
•impact of adverse changes to the Company’s credit ratings from major credit rating agencies;
•impact of adverse judgments or settlements in litigation;
•impact on the Company’s operations due to political developments, disease pandemics, wars, civil unrest, terrorism or other hostilities that may disrupt or increase volatility in securities or otherwise affect business and economic conditions;
•heightened regulatory and governmental oversight and scrutiny of the Company’s business practices, including dealings with consumers;
•impact of reputational risk from negative publicity, fines, penalties and other negative consequences from regulatory violations, legal actions, and the Company’s interactions with business partners, counterparties, service providers and other third parties;
•impact of regulatory enforcement actions;
•changes in accounting standards as may be required by the Financial Accounting Standards Board (“FASB”) or other regulatory agencies and their impact on critical accounting policies and assumptions;
•the Company’s capital requirements and its ability to generate capital internally or raise capital on favorable terms;
•impact on the Company’s liquidity due to changes in the Company’s ability to receive dividends from its subsidiaries;
•any future strategic acquisitions or divestitures;
•changes in the equity and debt securities markets;
•fluctuations in foreign currency exchange rates;
•impact of increased focus on social, environmental and sustainability matters, which may affect the Company’s operations as well as those of its customers and the economy more broadly;
•significant turbulence or disruption in the capital or financial markets, which could result in, among other things, a reduction in the availability of funding or increases in funding costs, declines in asset values and/or recognition of allowance for credit losses on securities held in the Company’s available-for-sale (“AFS”) debt securities portfolio; and
•impact of climate change, natural or man-made disasters or calamities, such as wildfires, droughts and earthquakes, all of which are particularly common in California, or other events that may directly or indirectly result in a negative impact on the Company’s financial performance.
For a more detailed discussion of some of the factors that might cause such differences, see Item 1A. Risk Factors presented elsewhere in this report. The Company does not undertake, and specifically disclaims, any obligation to update or revise any forward-looking statements to reflect the occurrence of events or circumstances after the date of such statements except as required by law.
4
ITEM 1. BUSINESS
Organization
East West Bancorp, Inc. (referred to herein on an unconsolidated basis as “East West” and on a consolidated basis as the “Company,” “we” or “EWBC”) is a bank holding company incorporated in Delaware on August 26, 1998 and is registered under the Bank Holding Company Act of 1956, as amended (“BHC Act”). The Company commenced business on December 30, 1998 when, pursuant to a reorganization, it acquired all of the voting stock of East West Bank (“East West Bank” or the “Bank”), which became its principal asset. East West’s principal business is to serve as a holding company for the Bank and other banking or banking-related subsidiaries that East West may establish or acquire. The Company operates in more than 120 locations in the U.S. and China. In the U.S., the Bank’s corporate headquarters and main administrative offices are located in California; its branches and offices are located in California, Texas, New York, Washington, Georgia, Massachusetts, Nevada and Illinois. The Bank has a banking subsidiary based in China - East West Bank (China) Limited.
As of December 31, 2021, the Company had $60.87 billion in total assets, $41.15 billion in total net loans, $53.35 billion in total deposits, and $5.84 billion in total stockholders’ equity.
Strategy
We are committed to enhancing long-term stockholder value by growing loans, deposits and revenue, improving profitability, and investing for the future while managing risks, expenses and capital. Our business model is built on customer loyalty and engagement, understanding our customers’ financial goals, and meeting our customers’ financial needs through our diverse products and services. The Bank’s strategy focuses on seeking out and deepening client relationships that meet our risk/return parameters. This guides our decision-making across every aspect of our operations: the products we develop, the expertise we cultivate, and the infrastructure we build to help our customers conduct their businesses. We expect our relationship-focused business model to continue to generate organic growth from existing customers and to expand our targeted customer bases. We constantly invest in technology to improve the customer user experience, strengthen critical business infrastructure, and streamline core processes, while properly managing operating expenses. Our risk management activities are focused on ensuring that the Bank identifies and manages risks to sustain safety and soundness while maximizing profitability.
Uniquely among U.S.-based regional banks, East West has a commercial business operating license in China, allowing the bank to open branches, make loans and collect deposits in the country. The Bank continues to develop its international banking presence with its network of overseas branches and representative offices that includes four full-service branches in China, located in Hong Kong, Shanghai, Shantou and Shenzhen. The Bank also has five offices in China, located in Beijing, Chongqing, Guangzhou and Xiamen. In addition to facilitating traditional letters of credit and trade financing to businesses, these representative offices allow the Bank to assist existing clients and to develop new business relationships. Through its branches and offices, the Bank focuses on growing its cross-border client base between the U.S. and China, helps U.S.-based businesses expand in China, and helps companies based in China pursue business opportunities in the U.S.
The Bank believes that its customers benefit from the Bank’s understanding of the China market through its physical presence, corporate and organizational ties in China, as well as the Bank’s international banking products and services. The Bank believes that this approach, combined with its senior management’s and Board of Directors’ extensive ties to Asian business opportunities and Asian American communities, provides the Bank with a competitive advantage. The Bank utilizes its presence in China to identify and build corporate relationships, which the Bank may leverage to create business opportunities in California and other U.S. markets.
5
Banking Services
As of December 31, 2021, the Bank was the fourth largest independent commercial bank headquartered in California based on total assets. The Bank is the largest bank in the U.S. focused on the financial service needs of individuals and businesses that operate both in the U.S. and China/Asia. The Bank also has a strong focus on the Asian American community. Through its network of over 120 banking locations in the U.S. and China, the Bank provides a wide range of personal and commercial banking services to businesses and individuals. The Bank provides services to its customers in English and in over ten other languages. In addition to offering traditional deposit products that include personal and business checking and savings accounts, money market, and time deposits, the Bank also offers foreign exchange, treasury management, and wealth management services. The Bank’s lending activities include commercial and residential real estate lending, construction finance, working capital lines of credit, trade finance, letters of credit, commercial business lending, affordable housing lending, asset-based lending, asset-backed finance, project finance, equipment financing and loan syndications. The Bank also provides financing services to clients in need of a financial bridge to facilitate their business transactions between the U.S. and China. Additionally, to support the business needs of its customers, the Bank offers various derivative contracts such as interest rate, energy commodity and foreign exchange contracts.
The integration of digital channels and brick and mortar channels has been an area of investment for the Bank, for both commercial and consumer banking platforms. Our strategic priorities include the use of technology to innovate and expand commercial payments and treasury management products and services. We have developed mobile and online banking platforms, which we are continually enhancing to enrich our customer user experience and we offer a full suite of banking services tailored to our customers’ unique needs. The omnichannel banking service approach increases efficiency and deepens customer relationships.
Operating Segments
The Bank’s three operating segments, (1) Consumer and Business Banking, (2) Commercial Banking and (3) Other, are based on the Bank’s core strategy. The Consumer and Business Banking segment primarily provides financial products and services to consumer and commercial customers through the Company’s domestic branch network. The Commercial Banking segment primarily generates commercial loans and deposits. The remaining centralized functions, including the corporate treasury activities of the Company and eliminations of inter-segment amounts, are aggregated and included in the Other segment. For complete discussion and disclosure, see Item 7. Management’s Discussion and Analysis of Financial Condition and Results of Operations (“MD&A”) — Results of Operation — Operating Segment Results and Note 17 — Business Segments to the Consolidated Financial Statements in this Form 10-K.
Competition
The Bank operates in a highly competitive environment. The Company faces intense competition from domestic and foreign lending institutions, numerous other financial services providers and other entities, including as a result of emerging technologies. Competition is based on a number of factors including, among others, customer service and convenience, quality and range of products and services offered, reputation, interest rates on loans and deposits, and lending limits. Competition also varies based on the types of customers and locations served. The Company is a leader of banking market share among the Asian American community, and maintains a differentiated presence within selected markets by providing cross-border expertise to customers in a number of industry specializations between the U.S. and China.
While the Company believes it is well positioned within a highly competitive industry, the industry could become even more competitive as a result of legislative, regulatory, economic, and technological changes, as well as continuing consolidation.
Human Capital
As a company that delivers relationship-driven financial solutions to a diverse customer base, we believe that the strength of our workforce is one of the most significant contributors to our success. Our key human capital objectives are to attract, develop and retain quality talent, who reflect our values and enable us to serve our customers. To achieve these objectives, our human resource programs have been designed based on our core values and the attributes we seek to foster, which include absolute integrity, customer orientation, creativity, respect, teamwork, expertise, and selflessness. We use these core values to better service our customers and prepare our employees for leadership positions and to advance their careers. We are committed to promoting diversity in employment and advancement.
6
As of December 31, 2021, we had approximately 3,100 full-time equivalent employees, of which nearly 200 were located in China and Hong Kong. None of our employees are subject to a collective bargaining agreement. The Company’s compensation and employee benefits expense was $433.7 million and $404.1 million, or 54% and 56% of total noninterest expense in 2021 and 2020, respectively.
Diversity and Inclusion
East West Bank was founded in 1973 in Chinatown, Los Angeles, California as a savings & loan association for immigrants who were underserved by mainstream banks. As of December 31, 2021, the Bank had grown to be the largest FDIC-insured, minority-operated depository institution headquartered in the United States, serving communities with diverse ethnicities and socio-economic backgrounds in eight states across the nation. Our operations are concentrated in areas that include larger numbers of immigrants and minorities. We proudly offer home loans and other products and services that support low-to-moderate income, minority and immigrant communities. We also provide community development loans, and partner with a diverse list of nonprofit and community-based organizations to promote wealth generation and entrepreneurship in underserved communities. Our focus on basic, fair-priced products and alternative credit criteria supports the underbanked, which is part of our founding mission. In addition, given our diverse customer base and the diversity of the communities that we serve, our retail bankers are able to assist customers in English and in over ten other languages.
Promoting diversity and inclusion in our workforce and executive leadership is critical to our continued growth and success. Our commitment to diversity is reflected in the composition of our employees. As of December 31, 2021, 74% of the Company’s employees were Asian or Asian-American, 15% were other minorities and 11% were Caucasian. Approximately 62% of our employees were women. At the managerial level, 74% of our managers were Asian or Asian-American, 12% were other minorities and 57% of our managers were women.
To put our diversity in context, minorities made up only 32% of the FDIC-regulated institutions’ workforce, and 12% of their managers, according to the most recently available FDIC survey data from 2019. For us, 89% of the Bank’s workforce and 86% of its managers were minorities. The composition of our Board of Directors further exemplifies our commitment to diversity. Of our eight directors as of December 31, 2021, six were minorities, representing four ethnic groups, and three were women.
Talent Acquisition, Development and Promotion
An experienced and well qualified work force is essential to delivering high quality and reliable banking services to our customers and to managing the Company in a safe and sound manner. We endeavor to attract, develop, and retain diverse, motivated talent as part of our ongoing commitment to building a stronger workforce to serve our customers and communities. Our compensation and benefits program provides both short-term and long-term awards, incentivizing performance, and aligning employee and stockholder interests. Employee compensation packages include a competitive base salary and, subject to Company and individual performance, may include an annual incentive bonus. In addition, employees at certain levels are eligible to receive equity awards tied to the value of the Company’s stock. We sponsor a 401(k) plan for U.S. employees and provide a Company matching contribution, and maintain other defined contribution retirement plans for countries outside of the U.S. As of December 31, 2021, approximately 2,700 or 94% of employees participated in our 401(k) plan. We are committed to fair and equitable compensation programs, and regularly assess the current business environment and labor markets to review our compensation and benefits programs for pay equity.
To foster a strong sense of ownership and to align the interests of our employees with our stockholders, restricted stock units are awarded to eligible employees under our stock incentive programs. We award stock grants under our “Spirit of Ownership” program to all of our employees, regardless of job title or part-time/full-time status. The program allows each employee to share directly in the success they help create. The fact that our employees are also owners is a source of pride for us.
The focus on leadership development and promoting from within is a critical part of our succession planning for key roles throughout the organization and fostering organizational stability. We also recognize the importance of employee development and career growth in achieving personal fulfillment for our employees, which is the key for fostering retention and one of the Company’s strategic objectives. We provide a variety of resources to help all employees grow in their current roles and build new skills for future advancement, such as tuition reimbursement. We provide training in many areas and encourage continuing education for all employees. Our corporate culture is a distinguishing factor in our work and collaboration every day, which has been incorporated into the fabric of what we do in all of our routines through our interactions and activities with customers, other external stakeholders, and internal teams and associates.
7
Health, Safety and Wellness
We are committed to supporting our employees’ well-being by offering flexible and competitive benefits. Comprehensive health insurance coverage (medical, dental and vision) is offered to employees working at least 30 hours or more each week. We offer paid time off, life insurance, disability insurance, parental leave, wellness and benefits programs designed to assist employees in maintaining a healthy work-life balance. We apply a consistent approach towards employee policies, opportunities, benefits, and protections to all employees regardless of their locations, except if there are contradictions between individual state laws. As an example of our consistent approach, we applied the state of California’s work-from-home reimbursement policy nationwide during the COVID-19 pandemic, even in states without similar requirements.
In addition, we are committed to making positive and lasting impacts in our communities through our business activities and our volunteer and charitable efforts. We are a vital part of the communities in which we live and work, and we encourage our employees to engage with our local communities by leading or participating in events to foster community development, as COVID-19 safety protocols permit. Based on the guidance from health authorities regarding the COVID-19 pandemic, we provided resources and implemented measures to limit the risk of exposure to our employees, and our communities. We also partnered with local community health centers to offer COVID-19 and flu vaccines for employees.
Information about our Executive Officers
The following table presents the Company’s executive officers’ names, ages, positions and offices, and business experience during the last five years as of February 28, 2022. There is no family relationship between any of the Company’s executive officers or directors. Each executive officer is appointed by the Board of Directors of the Company.
| Name | Age | Positions and Offices, and Business Experience | ||||||||||||
| Dominic Ng | 63 | Chairman and Chief Executive Officer of the Company and the Bank since 1992. | ||||||||||||
| Douglas P. Krause | 65 | Vice Chairman and Chief Corporate Officer of the Company and the Bank since 2020; 2018 - 2020: Executive Vice President, General Counsel and Corporate Secretary; 2010 - 2018: Executive Vice President, Chief Risk Officer and General Counsel. | ||||||||||||
| Irene H. Oh | 44 | Executive Vice President and Chief Financial Officer of the Company and the Bank since 2010. | ||||||||||||
| Parker Shi | 52 | Executive Vice President and Chief Operating Officer of the Company and the Bank since December 2021; June 2021 - November 2021: Executive Vice President & Chief Strategy, Growth and Technology Officer; March 2021 - June 2021: Consultant of the Bank; 2020: Senior Advisor at PharmScript; 2018 - 2019: Senior Managing Director at Accenture; 2013 - 2018: Senior Partner at McKinsey & Company. | ||||||||||||
| Nick Huang | 57 | Executive Vice President and Head of Commercial Banking of the Company and the Bank since November 2021; 2018 - 2020: Chief Executive Officer of Institutional and International Banking at CTBC Bank; 2017 - 2018: Deputy Chief Executive Officer of Institutional and International Banking at CTBC Bank. | ||||||||||||
| Gary Teo | 49 | Senior Vice President and Head of Human Resources of the Company and the Bank since 2015. | ||||||||||||
| Lisa L. Kim | 57 | Executive Vice President, General Counsel and Corporate Secretary since 2020; 2014 - 2020: Executive Vice President, General Counsel and Secretary at Cathay General Bancorp and Cathay Bank | ||||||||||||
Supervision and Regulation
Overview
East West and the Bank are subject to extensive and comprehensive regulations under U.S. federal and state laws. Regulation and supervision by the federal and state banking agencies are intended primarily for the protection of depositors, the Deposit Insurance Fund (“DIF”) administered by the FDIC, consumers, and the banking system as a whole, and not for the protection of our investors. As a bank holding company, East West is subject to primary regulation, supervision, and examination by the Federal Reserve under the BHC Act. The Bank is regulated, supervised, and examined by the Federal Reserve, the DFPI, and, with respect to consumer laws, the CFPB. As insurer of the Bank’s deposits, the FDIC has back-up examination authority of the Bank as well. In addition, the Bank is regulated by certain foreign regulatory agencies in international jurisdictions where we conduct business, including China and Hong Kong. East West also has a wholly-owned nonbank subsidiary, East West Markets, LLC ("East West Markets"), which is an SEC-registered broker-dealer and a member of the Financial Industry Regulatory Authority, Inc. ("FINRA"). East West Markets is subject to regulatory requirements from a number of regulatory bodies, including the SEC, FINRA, and state securities regulators.
8
The Company is also subject to the disclosure and regulatory requirements under the Securities Act of 1933, as amended, and Section 21E of the Exchange Act, as amended, both as administered by the SEC. Our common stock is listed on the Nasdaq Global Select Market under the trading symbol “EWBC” and subject to Nasdaq rules for listed companies.
Described below are material elements of selected laws and regulations applicable to East West and the Bank. The descriptions are not intended to be complete and are qualified in their entirety by reference to the full text of the statutes and regulations described. A change in applicable statutes, regulations or regulatory policies may have a material effect on the Company’s business.
East West
As a bank holding company and pursuant to its election of financial holding company status, East West is subject to regulation, supervision, and examination by the Federal Reserve under the BHC Act. The BHC Act provides a federal framework for the regulation and supervision of all bank holding companies and their nonbank subsidiaries. The BHC Act and other federal statutes grant the Federal Reserve authority to, among other things:
•require periodic reports and such additional information as the Federal Reserve may require in its discretion;
•require bank holding companies to maintain certain levels of capital and, under the Dodd-Frank Wall Street Reform and Consumer Protection Act (the “Dodd-Frank Act”), limit the ability of bank holding companies to pay dividends or bonuses unless their capital levels exceed the capital conservation buffer (see the section captioned “Regulatory Capital Requirements” included elsewhere under this item);
•require bank holding companies to serve as a source of financial and managerial strength to subsidiary banks and commit resources, as necessary, to support each subsidiary bank, including at times when bank holding companies may not be inclined to do so, and the failure to do so generally may be considered by the Federal Reserve to be an unsafe and unsound banking practice or a violation of Federal Reserve regulations or both;
•restrict dividends and other distributions from subsidiary banks to their parent bank holding companies;
•require bank holding companies to terminate an activity or terminate control of or liquidate or divest certain nonbank subsidiaries, affiliates or investments if the Federal Reserve believes that the activity or the control of the nonbank subsidiary or affiliate constitutes a serious risk to the financial safety, soundness or stability of the bank holding company, or if the activity, ownership, or control is inconsistent with the purposes of the BHC Act;
•regulate provisions of certain bank holding company debt, including by imposing interest ceilings and reserve requirements on such debt and requiring a bank holding company to obtain prior approval to purchase or redeem its securities in certain situations;
•approve in advance senior executive officer or director changes and prohibit (under certain circumstances) golden parachute payments to officers and employees, including change in control agreements and new employment agreements, that are contingent upon termination; and
•approve in advance the acquisitions of and mergers with bank holding companies, banks and other financial companies, and consider certain competitive, management, financial, financial stability and other factors in granting these approvals. DFPI approval may also be required for certain acquisitions and mergers involving a California state-chartered bank such as the Bank.
East West’s election to be a financial holding company as permitted under the Gramm-Leach-Bliley Act of 1999 (“GLBA”) generally allows East West to engage in any activity that the Federal Reserve has determined to be financial in nature or incidental or complementary to activities that are financial in nature, or acquire and retain the shares of a company engaged in any such activity, without prior Federal Reserve approval. Activities that are considered to be financial in nature include securities underwriting and dealing, insurance agency and underwriting, merchant banking activities and activities that the Federal Reserve, in consultation with the U.S. Secretary of the Treasury, determines to be financial in nature or incidental to such financial activity. To maintain financial holding company status and continue to be able to engage in new activities or investments that are financial in nature, a financial holding company and all of its depository institution subsidiaries must be “well capitalized” and “well managed”, and the financial holding company’s depository institution subsidiaries must have Community Reinvestment Act (“CRA”) ratings of at least “Satisfactory.” A depository institution subsidiary is considered “well capitalized” if it satisfies the requirements for this status discussed in the sections captioned “Regulatory Capital Requirements” and “Prompt Corrective Action,” included elsewhere under this item. A depository institution subsidiary is considered “well managed” if it received a composite rating and a management rating of at least “Satisfactory” in its most recent examination. See the section captioned “Community Reinvestment Act” included elsewhere under this item. As of December 31, 2021, East West is a financial holding company and has financial subsidiaries, as discussed in Item 1. Business — Organization.
9
The Bank and its Subsidiaries
East West Bank is a California state-chartered bank and a member of the Federal Reserve System, and its deposits are insured by the FDIC. The Bank’s operations in the U.S. are primarily regulated and supervised by the Federal Reserve and the DFPI, and its activities outside the U.S. are regulated and supervised by both its U.S. regulators and the applicable regulatory authority in the host country in which each overseas office is located. Specific federal and state laws and regulations that are applicable to banks, monitor among other things, their regulatory capital levels, the scope of their business, their investments, their reserves against deposits, the timing of the availability of deposited funds, and the nature and amount of collateral for certain loans. Bank regulatory agencies also have extensive discretion to impose various restrictions on management or operations and to issue policies and guidance in connection with their supervisory and enforcement activities and examination policies. California law permits state-chartered commercial banks to engage in any activity permissible for national banks, unless such activity is expressly prohibited by state law. The Bank may also form subsidiaries to engage in many activities commonly conducted by national banks in operating subsidiaries. Further, pursuant to the GLBA, the Bank may conduct certain “financial” activities in a subsidiary to the same extent permitted for a national bank, provided the Bank is “well capitalized” and “well managed” and has a CRA rating of at least “Satisfactory.”
Regulation of Foreign Subsidiaries and Branches
The Bank’s foreign-based subsidiary, East West Bank (China) Limited, is subject to applicable foreign laws and regulations, such as those implemented by the China Banking and Insurance Regulatory Commission. East West Bank’s Hong Kong branch is subject to applicable foreign laws and regulations, such as those implemented by the Hong Kong Monetary Authority and the Securities and Futures Commission of Hong Kong.
Regulatory Capital Requirements
The federal banking agencies have imposed risk-based capital adequacy requirements intended to ensure that banking organizations maintain capital that is commensurate with the degree of risk associated with their operations. In July 2013, the federal banking agencies adopted final rules (the “Basel III Capital Rules”) establishing a comprehensive capital framework for U.S. banking organizations that became effective for the Company and the Bank beginning January 1, 2015. The Basel III Capital Rules define the components of regulatory capital, include a required ratio of Common Equity Tier 1 (“CET1”) capital to risk-weighted assets and restrict the type of instruments that may be recognized in Tier 1 and 2 capital (including by phasing out trust preferred securities from Tier 1 capital for bank holding companies). The Basel III Capital Rules also prescribe a standardized approach for risk weighting assets and include a number of risk weighting categories that affect the denominator in banking institutions’ regulatory capital ratios.
Under the Basel III Capital Rules, to be considered adequately capitalized, standardized approach banking organizations, such as the Company and the Bank are required to maintain minimum capital ratios of at least 4.5% CET1 capital to risk-weighted assets, 6.0% Tier 1 capital to risk-weighted assets, 8.0% total risk-based capital (i.e. Tier 1 plus Tier 2 capital) to risk-weighted assets and a 4.0% Tier 1 leverage ratio of Tier 1 capital to average total consolidated assets. The Basel III Capital Rules also include a “capital conservation buffer” of 2.5% that fully phased in on January 1, 2019, on top of each of the minimum risk-based capital ratios. Banking institutions with a risk-based capital ratio that meets or exceeds the minimum requirement but does not meet the capital conservation buffer will face constraints on dividends, equity repurchases and discretionary bonus payments based on the amount of the shortfall. To avoid these constraints, a banking organization must meet or exceed the following risk-based capital ratios (after any distribution): (i) CET1 capital to risk-weighted assets of 7.0%, (ii) Tier 1 capital to risk-weighted assets of 8.5%, and (iii) total risk-based capital to risk-weighted assets of 10.5%.
As of December 31, 2021, the Company’s and the Bank’s capital ratios exceeded the minimum capital adequacy requirements of the federal banking agencies, including the capital conservation buffer, and the Company and the Bank were classified as “well capitalized.” For additional discussion and disclosure see Item 7. MD&A — Regulatory Capital and Ratios and Note 16 — Regulatory Requirements and Matters to the Consolidated Financial Statements in this Form 10-K.
The Bank is also subject to additional capital requirements under the Prompt Corrective Action (“PCA”) regulations that implement Section 38 of the Federal Deposit Insurance Act (“FDIA”), as discussed below under the Prompt Corrective Action section.
10
Regulatory Capital-Related Developments
From time to time, the regulatory agencies propose changes and amendments to, and issue interpretations of, risk-based capital requirements and related reporting instructions. Such proposals and interpretations could, if implemented in the future, affect our regulatory capital requirements and reported capital ratios.
In April 2020, in recognition of the Coronavirus Aid, Relief, and Economic Security Act (“CARES Act”) requirements and to facilitate the use of the Paycheck Protection Program Liquidity Facility (“PPPLF”), the federal banking agencies issued an interim final rule that allows banking organizations to exclude from risk-based and leverage capital requirements any eligible assets sold or pledged to the Federal Reserve on a non-recourse basis through the PPPLF. The interim final rule states that the Paycheck Protection Program (“PPP”) loans originated by a banking organization under the PPP will be risk-weighted at zero percent for regulatory capital purposes and PPP loans pledged as collateral to PPPLF may be excluded from the denominator of the Tier 1 leverage ratio. In addition, the CARES Act, the federal banking agencies’ “Interagency Statement on Loan Modifications and Reporting for Financial Institutions Working with Customers Affected by the Coronavirus (Revised)” (the “Interagency Statement”) issued on March 22, 2020 and April 7, 2020, and the Consolidated Appropriations Act, 2021 (the “CAA”), enacted on December 27, 2020, provided options for financial institutions to elect to temporarily suspend troubled debt restructurings (“TDR”) accounting under Accounting Standards Codification (“ASC”) Subtopic 310-40. For additional information, see Note 1 — Summary of Significant Accounting Policies, Troubled Debt Restructurings, to the Consolidated Financial Statements in this Form 10-K. The election to apply the TDR relief under this regulatory guidance provided banking organizations such as the Bank a capital benefit by increasing their regulatory capital ratios as the loan modifications related to the COVID-19 pandemic are not adjusted to a higher risk weighting normally associated with a TDR classification.
In December 2018, the federal banking agencies approved a final rule to address changes to credit loss accounting, including with respect to banking organizations’ implementation of the Accounting Standards Update (“ASU”) 2016-13 Financial Instruments — Credit Losses (Topic 326) Measurement of Credit Losses on Financial Instruments, which introduced the current expected credit losses (“CECL”) methodology. The final rule among other things provided banking organizations with the option to phase in over a three-year period the day-one adverse effects on regulatory capital upon the adoption of ASU 2016-13. On March 31, 2020, the federal banking agencies issued an interim final rule that provided banking organizations that adopted CECL during 2020, the option to delay for two years the estimated impact of CECL on regulatory capital, followed by a three-year transition period to phase out the aggregate amount of the capital benefit provided during the initial two-year delay (i.e., a five-year transition, in total). The Company adopted the five-year transition in 2020. As a result, the effects of CECL on the Company’s and the Bank’s regulatory capital were delayed through the year 2021, after which the effects are being phased-in over a three-year period from January 1, 2022 through December 31, 2024.
Prompt Corrective Action
The FDIA, as amended, requires federal banking agencies to take PCA with respect to insured depository institutions that do not meet minimum capital requirements. The FDIA includes the following five capital tiers: “well capitalized,” “adequately capitalized,” “undercapitalized,” “significantly undercapitalized” and “critically undercapitalized.” A depository institution’s capital tier will depend upon how its capital levels compare with various relevant capital measures and certain other factors, as established by regulations. The capital tiers in the PCA framework do not apply directly to bank holding companies (such as the Company). Under the federal banking agencies’ regulations implementing the PCA provisions of the FDIA, an insured depository institution (such as the Bank) generally is classified in the following categories based on the capital measures indicated:
| PCA Category | Risk-Based Capital Ratios | |||||||||||||||||||||||||
| Total Capital | Tier 1 Capital | CET1 Capital | Tier 1 Leverage | |||||||||||||||||||||||
Well capitalized (1) | ≥ 10% | ≥ 8% | ≥ 6.5% | ≥ 5% | ||||||||||||||||||||||
| Adequately capitalized | ≥ 8% | ≥ 6% | ≥ 4.5% | ≥ 4% | ||||||||||||||||||||||
| Undercapitalized | < 8% | < 6% | < 4.5% | < 4% | ||||||||||||||||||||||
| Significantly undercapitalized | < 6% | < 4% | < 3.0% | < 3% | ||||||||||||||||||||||
| Critically undercapitalized | Tangible Equity/Total Assets ≤ 2% | |||||||||||||||||||||||||
(1)Additionally, to be classified as well capitalized, an insured depository institution may not be subject to any written agreement, order, capital directive, or PCA directive issued by its primary federal regulator to meet and maintain a specific capital level for any capital measure.
11
An institution may be downgraded to, or deemed to be in, a capital category that is lower than indicated by its capital ratios, if it is determined to be in an unsafe or unsound condition or if it receives an unsatisfactory examination rating with respect to certain matters. A bank’s capital category is determined solely for the purpose of applying PCA regulations and the capital category may not constitute an accurate representation of the bank’s overall financial condition or prospects for other purposes.
The FDIA generally prohibits a depository institution from making any capital distributions (including payment of any dividend) or paying any management fee to its parent holding company, if the depository institution would thereafter be “undercapitalized.” Undercapitalized institutions are subject to growth limitations and are required to submit capital restoration plans. If a depository institution fails to submit an acceptable plan, it is treated as if it is “significantly undercapitalized.” Significantly undercapitalized depository institutions may be subject to a number of requirements and restrictions, including orders to sell sufficient voting stock to become “adequately capitalized,” requirements to reduce total assets, cessation of receipt of deposits from correspondent banks and/or restrictions on interest rates paid on deposits. “Critically undercapitalized” institutions are subject to the appointment of a receiver or conservator. The FDIA also generally permits only “well capitalized” insured depository institutions to accept brokered deposits, although an “adequately capitalized” institution may apply to the FDIC for a waiver of this restriction.
Economic Growth, Regulatory Relief, and Consumer Protection Act and Stress Testing
In May 2018, the enactment of the Economic Growth, Regulatory Relief, and Consumer Protection Act (“EGRRCPA”) amended certain provisions in the Dodd-Frank Act and other statutes administered by the Federal Reserve and other federal banking agencies. Among other things, the EGRRCPA provided regulatory relief, including from risk committee requirements, for bank holding companies with total consolidated assets between $10 billion and $50 billion. We were among the bank holding companies in this range until we exceeded $50 billion in total consolidated assets as of September 30, 2020.
The EGRRCPA lifted the asset size threshold and provided relief for banks and bank holding companies with total consolidated assets between $50 billion and $100 billion with respect to many of the Dodd-Frank Act’s enhanced prudential standards, except for the risk committee requirements. The EGRRCPA also raised the asset size threshold for required company-run stress testing at banks and bank holding companies from $10 billion to $250 billion. Additionally, based on authority provided in the EGRRCPA, the Federal Reserve raised the asset size threshold for required supervisory stress testing at bank holding companies from $50 billion to $100 billion. We are among the bank holding companies in this range. Although the Company and the Bank are not required to conduct company-run or supervisory stress tests, we continue to conduct annual capital and quarterly liquidity stress tests.
Consumer Financial Protection Bureau Supervision
The Dodd-Frank Act established the CFPB, which has the authority to implement, examine and enforce compliance with federal consumer financial laws that apply to banking institutions with total consolidated assets exceeding $10 billion (such as the Bank) and their affiliates. The CFPB may focus its supervisory, examination, and enforcement efforts on, among other things:
•risks to consumers and compliance with federal consumer financial laws when evaluating the policies and practices of a financial institution;
•unfair, deceptive, or abusive acts or practices, which the Dodd-Frank Act empowers the CFPB to prevent through rulemaking, enforcement and examination;
•rulemaking to implement various federal consumer statutes such as the Home Mortgage Disclosure Act, Truth in Lending Act, Real Estate Settlement Procedures Act, Electronic Fund Transfer Act, Equal Credit Opportunity Act and Fair Credit Billing Act; and
•the markets in which firms operate and risks to consumers posed by activities in those markets.
The statutes and regulations that the CFPB enforces mandate certain disclosure and other requirements, and regulate the manner in which financial institutions must deal with consumers when taking deposits, making loans, collecting payments on loans, and providing other services. Failure to comply with these laws can subject the Bank to various penalties, including, but not limited to, enforcement actions, injunctions, fines or criminal penalties, punitive damages or restitution to consumers, and the loss of certain contractual rights. The Company and the Bank are also subject to federal and state laws prohibiting unfair or fraudulent business practices, untrue or misleading advertising and unfair competition.
12
Federal Home Loan Bank and the Federal Reserve’s Reserve Requirements
The Bank is a member of the Federal Home Loan Bank (“FHLB”) of San Francisco. As a FHLB member, the Bank is required to own a certain amount of capital stock in the FHLB. The Bank may also access the FHLB for both short-term and long-term secured credit.
The Federal Reserve requires all depository institutions to maintain reserves at specified levels against their transaction accounts either in the form of vault cash or an interest-bearing account at the Federal Reserve Bank, or a pass-through account as defined by the Federal Reserve. Effective March 26, 2020, the Federal Reserve reduced reserve requirement ratios to zero percent, eliminating the reserve requirement for all depository institutions, an action that provides liquidity in the banking system to support lending to households and businesses. The Bank is a member bank and stockholder of the Federal Reserve Bank of San Francisco (“FRBSF”).
Dividends and Other Transfers of Funds
The principal source of liquidity of East West is dividends received from the Bank. The Bank is subject to various statutory and regulatory restrictions on its ability to pay dividends. In addition, the banking agencies may prohibit or limit the Bank from paying dividends, depending upon the Bank’s financial condition, if such payment is deemed to constitute an unsafe or unsound practice. Furthermore, under the federal PCA regime, the Federal Reserve or FDIC may prohibit a bank holding company from paying any dividends if the holding company’s bank subsidiary is classified as “significantly undercapitalized” or, in some circumstances, “undercapitalized.” It is the Federal Reserve’s policy that a bank holding company should generally pay dividends on common stock only if the company’s net income available to common stockholders over the past four quarters, net of distributions, would be sufficient to fully fund the dividends, and if the prospective rate of earnings retention appears consistent with the company’s capital needs, asset quality and overall financial condition. It is also the Federal Reserve’s policy that a bank holding company should not maintain dividend levels that undermine the company’s ability to be a financial source of strength to its banking subsidiaries. The Federal Reserve requires bank holding companies to continuously review their dividend policy in light of their organizations’ financial condition and compliance with regulatory capital requirements, and has discouraged payment ratios that are at maximum allowable levels, unless both asset quality and capital are strong.
Transactions with Affiliates and Insiders
Pursuant to Sections 23A and 23B of the Federal Reserve Act, as implemented by the Federal Reserve’s Regulation W, banks are subject to restrictions that strictly limit their ability to engage in transactions with their affiliates, including their parent bank holding companies. Regulation W limits the types, terms and amounts of these transactions and generally requires the transactions to be on an arm’s-length basis. In general, Regulation W requires that “covered transactions,” which include a bank’s extension of credit to or purchase of assets from an affiliate, be limited to 10% of the bank’s capital and surplus with respect to any one affiliate, and 20% of the bank’s capital and surplus with respect to the aggregate of all covered transactions with all affiliates. In addition, a bank generally may not extend credit to an affiliate unless the extension of credit is secured by specified amounts of collateral. The Dodd-Frank Act expanded the coverage and scope of the limitations on affiliate transactions, including by treating derivative transactions resulting in a bank’s credit exposure to an affiliate as covered transactions. In addition, the Volcker Rule under the Dodd-Frank Act establishes certain prohibitions, restrictions and requirements (known as “Super 23A” and “Super 23B”) on transactions between a covered fund and a banking entity that serves as an investment manager, investment adviser, organizer and offeror, or sponsor with respect to that covered fund, regardless of whether the banking entity has an ownership interest in the fund.
Federal law also limits a bank’s authority to extend credit to its directors, executive officers and principal stockholders, as well as to entities controlled by such persons (collectively, “insiders”). Among other things, extensions of credit to insiders are required to be made on terms that are substantially the same as, and follow credit underwriting procedures that are not less stringent than, those prevailing for comparable transactions with unaffiliated persons. The terms of such extensions of credit may not involve more than the normal risk of repayment or present other unfavorable features and may not exceed certain limitations on the amount of credit extended to such persons, individually and in the aggregate, which limits are based, in part, on the amount of the bank’s capital.
13
Community Reinvestment Act
Under the CRA, an insured depository institution has a continuing and affirmative obligation to help serve the credit needs of its communities, including low- and moderate-income borrowers and neighborhoods. The Federal Reserve periodically evaluates a state member bank’s performance under applicable performance criteria and assign a rating of “outstanding,” “satisfactory,” “needs to improve” or “substantial noncompliance.” The Federal Reserve takes this performance into account when reviewing applications by banks and their parent companies to expand branches, relocate, add subsidiaries and affiliates, expand into new financial activities and merge with or acquire other financial institutions. Unsatisfactory CRA performance may result in the denial of such applications. Based on the most recent CRA examination as of March 8, 2021, the Bank was rated “outstanding”. On September 21, 2020, the Federal Reserve issued an Advance Notice of Proposed Rulemaking that invited the public to comment on ways to modernize CRA regulations to strengthen, clarify, and tailor the regulations to reflect the current banking landscape and better meet the core purposes of the CRA. On July 20, 2021, the federal banking agencies issued an interagency statement indicating a joint agency commitment to work together to strengthen and modernize regulations implementing the CRA. The impact on the Company from any changes in CRA regulations will depend on how they are implemented and applied.
FDIC Deposit Insurance Assessments
The FDIC insures the Bank’s customer deposits through the DIF up to $250,000 for each depositor, per FDIC-insured bank, for each account ownership category. The DIF is funded mainly through quarterly insurance assessments on insured banks based on their assessment base. The Dodd-Frank Act revised the FDIC’s fund management authority by establishing a minimum Designated Reserve Ratio of 1.35 percent of total estimated insured deposits and redefining the assessment base to be calculated as average consolidated total assets minus average tangible equity. The Bank’s DIF quarterly assessment is calculated by multiplying its assessment base by the applicable assessment rate. The assessment rate is calculated based on an institution’s risk profile, including capital adequacy, asset quality, management, earnings, liquidity and sensitivity to market risk ratings, certain financial measures to assess an institution’s ability to withstand asset related stress and funding related stress, and a measure of loss severity that estimates the relative magnitude of potential losses to the FDIC in the event of the Bank’s failure.
Following the outbreak of the COVID-19 pandemic, extraordinary growth in insured deposits caused the DIF reserve ratio to fall below the statutory minimum of 1.35 percent. This growth was primarily due to U.S. monetary policy action, direct government assistance to consumers and businesses, and an overall reduction in spending. The FDIC adopted a restoration plan on September 15, 2020 to restore the DIF reserve ratio to at least 1.35 percent by September 30, 2028. Under the restoration plan, the FDIC will continue to closely monitor the factors that affect the DIF reserve ratio and will provide progress reports and, as necessary, modifications to the plan at least semiannually. According to the Restoration Plan Semiannual Update issued on December 14, 2021, the DIF reserve ratio was at 1.27 percent as of September 30, 2021. The FDIC expects the surge of insured deposits resulting from the pandemic to eventually recede and insured deposit growth rates to normalize in the medium to long-term.
In June 2020, the FDIC published a final rule that mitigates the deposit insurance assessment effects of participating in the PPP, PPPLF and the Money Market Mutual Fund Liquidity Facility (“MMLF”). Under the rule, the FDIC provided adjustments to the risk based premium formula and certain of its risk ratios, and an offset to an insured institution’s total assessment amount due for the increase to its assessment base attributable to participation in the PPP and MMLF. Absent such a change to the assessment rules, an insured depository institution could have become subject to increased deposit insurance assessments based on its participation in the PPP, PPPLF or MMLF. The application date of the final rule was April 1, 2020, which applied the changes to deposit insurance assessments starting in the second quarter of 2020.
The FDIC may terminate a depository institution’s deposit insurance upon a finding that the institution’s financial condition is unsafe or unsound, that the institution has engaged in unsafe or unsound practices, or that the institution has violated any applicable rule, regulation, condition, or order imposed by the FDIC.
14
Bank Secrecy Act and Anti-Money Laundering
The Bank Secrecy Act (“BSA”), USA PATRIOT Act of 2001 (“PATRIOT Act”), and other federal laws and regulations impose obligations on U.S. financial institutions to implement and maintain appropriate policies, procedures and controls, which are reasonably designed to prevent, detect and report instances of money laundering, the financing of terrorism and to comply with recordkeeping and reporting requirements. Regulatory agencies require that the Bank have an effective governance structure for the program that includes effective oversight by our Board of Directors and management. We regularly evaluate and continue to enhance our systems and procedures to comply with the PATRIOT Act and other anti-money laundering (“AML”) initiatives. Failure of a financial institution to maintain and implement adequate BSA/AML programs, or to comply with all of the relevant laws or regulations, could have serious legal, financial and reputational consequences for the institution. The Bank regularly evaluates and continues to enhance its systems and procedures to ensure compliance with BSA/AML laws and regulations.
The Anti-Money Laundering Act of 2020 (“AML Act”) was enacted in January 2021 as part of the National Defense Authorization Act for Fiscal Year 2020 and includes the most substantial changes to U.S. AML law since the PATRIOT Act. Among other changes, the AML Act imposes new beneficial ownership reporting requirements for certain entities doing business in the U.S.; requires the U.S. Treasury’s Financial Crimes Enforcement Network (FinCEN) to establish government-wide priorities for AML and countering the financing of terrorism (“CFT”); increases AML whistleblower awards and expands whistleblower protections; modernizes the statutory definition of “financial institution” to include “value that substitutes for currency”; enhances penalties for BSA and AML violations; streamlines and modernizes BSA and AML requirements; and improves coordination and cooperation among international, federal, state, and tribal AML law enforcement agencies. The federal banking agencies are expected to revise the BSA regulations to incorporate the AML/CFT priorities.
Office of Foreign Assets Control Regulation
The U.S. Department of the Treasury’s Office of Foreign Assets Control (“OFAC”) is responsible for helping to ensure that U.S. financial institutions do not engage in transactions with certain prohibited parties, as defined by various executive orders and acts of Congress. Federal banking regulators also examine banks for compliance with regulations administered by the OFAC for economic sanctions against designated foreign countries, designated nationals, and others. OFAC publishes lists of persons and organizations suspected of aiding, harboring or engaging in terrorist acts, known as Specially Designated Nationals and Blocked Persons. Generally, if a bank identifies a transaction, account, or wire transfer relating to a person or entity on an OFAC list, it must freeze the account or block the transaction, file a suspicious activity report and notify the appropriate authorities. Failure to comply with these sanctions could have serious legal, strategic, and reputational consequences, and result in civil money penalties on the Company and the Bank.
Privacy and Cybersecurity
Federal statutes and regulations require banking organizations to take certain actions to protect nonpublic consumer financial information. The Bank has prepared a privacy policy that it must disclose to consumers annually. In some cases, the Bank must obtain a consumer’s consent before sharing information with an unaffiliated third party, and the Bank must allow a consumer to opt out of the Bank’s sharing of information with its affiliates for marketing and certain other purposes. Additional conditions affect the Bank’s information exchanges with credit reporting agencies. The Bank's privacy practices and the effectiveness of its systems to protect consumer privacy are subjects covered in the Federal Reserve’s periodic compliance examinations.
The Federal Reserve pays close attention to the cybersecurity practices of state member banks and their holding companies and affiliates. The interagency council of the federal banking agencies, the Federal Financial Institutions Examination Council (“FFIEC”), has issued a number of policy statements and other guidance for banks in light of the growing risk posed by cybersecurity threats. The FFIEC has recently focused on such matters as compromised customer credentials, cyber resilience and business continuity planning. Examinations by the banking agencies now include review of an institution’s information technology and its ability to thwart or mitigate cyber-attacks. The federal banking agencies issued a final rule in November 2021 that requires banking organizations to notify their primary federal regulator of significant computer security incidents within 36 hours of determining that such an incident has occurred. The compliance date of this rule is May 1, 2022. We are implementing policies and procedures to ensure compliance with this rule should such an incident occur in the future.
15
Consumer data privacy and data protection are also the subject of state laws. For example, the Bank is subject to the California Consumer Privacy Act (“CCPA”). This statute grants consumers several rights, including the right to request disclosure of information collected about them and whether that information has been sold or shared with others, the right to request deletion of personal information (subject to certain exceptions), and the right to opt out of the sale of their personal information. However, a consumer does not have these rights with respect to information that is collected, processed, sold, or disclosed pursuant to the GLBA or the California Financial Information Privacy Act. The California Attorney General has adopted regulations to implement the CCPA.
The Standing Committee of China’s National People’s Congress passed the Personal Information Protection Law (“PIPL”), effective November 1, 2021. The PIPL establishes guiding principles on protection of a Chinese citizen’s personal information and applies to entities operating in China, foreign organizations, and individuals processing personal information outside China. Failure to comply with the PIPL requirements can result in monetary penalties, entities or individuals placed on government’s banned list, or potential termination of future business activities in China, and potentially impact our Hong Kong and China operations.
Future Legislation, Regulation and Supervision Activities
New statutes, regulations and policies that contain wide-ranging proposals for altering the structures, regulations and competitive relationships of financial institutions and public companies operating in the U.S. are regularly adopted. Such changes to applicable statutes, regulations, and policies may change the Company’s operating environment in substantial and unpredictable ways, increase the Company’s cost of conducting business, impede the efficiency of internal business processes, subject the Company to increased supervision activities and disclosure and reporting requirements, and restrict or expand the activities in which the Company may engage. Accordingly, such changes may have a significant influence on our operations and activities, financial condition, results of operations, growth plans or future prospects, and the overall growth and distribution of loans, investments and deposits. We cannot predict whether or in what form any statute, regulation or policy will be proposed or adopted or the extent to which our businesses may be affected by any new statute, regulation or policy.
Available Information
The Company’s website is www.eastwestbank.com. The Company’s Annual Reports on Form 10-K, Quarterly Reports on Form 10-Q, Proxy Statements, Current Reports on Form 8-K, amendments to those reports filed or furnished pursuant to Section 13(a) or 15(d) of the Securities Exchange Act of 1934, as amended (the “Exchange Act”), and other filings with the SEC are available at http://investor.eastwestbank.com under the heading “SEC Filings”, as soon as reasonably practicable after the Company electronically files such material with, or furnishes it to, the SEC. These reports are also available on the SEC’s website at www.sec.gov. In addition, the Company’s Code of Conduct, Corporate Governance Guidelines, charters of the Audit Committee, Compensation Committee, Executive Committee, Risk Oversight Committee and Nominating/Corporate Governance Committee, and other corporate governance materials are available on the Investor Relations section of the Company’s website. The information contained on the Company’s website as referenced in this report is not part of this report.
Stockholders may also request a copy of any of the above-referenced reports and corporate governance documents by writing to: Investor Relations, East West Bancorp, Inc., 135 N. Los Robles Avenue, 7th Floor, Pasadena, California 91101; by calling (626) 768-6000; or by sending an e-mail to [email protected].
ITEM 1A. RISK FACTORS
We are exposed to a variety of risks, some of which are inherent to the financial services industry and others of which are more specific to our businesses. Our enterprise risk management (“ERM”) program incorporates risk management throughout the organization in identifying, managing, monitoring, and reporting risks. Our ERM program identifies the Company’s major risk categories as: capital risk; market risk; liquidity risk; credit risk; operational risk; compliance risk; legal risk; strategic risk; and reputational risk. ERM is comprised of our senior management and chaired by our Chief Risk Officer.
The discussion below addresses material factors, of which we are currently aware, that could have a material and adverse effect on our businesses, results of operations, and financial condition. These risk factors and other forward-looking statements that relate to future events, expectations, trends and operating periods involve certain factors that are subject to change, and important risks and uncertainties that could cause actual results to differ materially. These risks and uncertainties should not be considered a complete discussion of all the risks and uncertainties that we might face. Although the risks are organized by headings and each risk is discussed separately, many are interrelated.
16
Risks Related to the COVID-19 Pandemic
The effects of the COVID-19 pandemic have impacted, and may continue to impact, the Company’s businesses, financial condition, liquidity, capital and results of operations, and the extent and duration of these impacts depend on future developments, which remain uncertain and cannot be predicted.
The COVID-19 pandemic and governmental responses to the pandemic have had and will likely continue to have an impact on global economic conditions, including disruption and volatility in the financial markets, disruption of global supply chains, temporary closures or failures of businesses, increased unemployment, and the imposition of social distancing and restrictions on movement in the U.S. and other countries.
East West Bank is considered an essential business in the eight states where we have branches or office locations. As part of our continued response to the recent developments of the COVID-19 pandemic, the Company has implemented office reopening and return to office plans. With various safety protocols implemented throughout our facilities, we have continued to provide financial services to our customers and support to our communities throughout the pandemic. The worldwide distribution of vaccines has made significant progress in containing the virus. However, the emergence of new variants, as well as insufficient adoption and long-term effectiveness of vaccines, may negatively affect our ability to resume full normal operations and provide services to our customers.
The prolongation of the COVID-19 pandemic and emergence of new variants could continue to cause disruption in global supply chains, labor market shortages, and increase in employment costs, which in turn adversely affect the ability of the Company’s borrowers to satisfy their obligations. If our customers experience credit deterioration, including an inability to pay loans as they come due or a decrease in the value of collateral and/or higher than usual draws on outstanding lines of credit, our level of charge-offs and provision for credit losses could increase. Further, failures to contain the COVID-19 pandemic and the emergence of variants may decrease our borrowers’ confidence with respect to purchasing real estate or homes and adversely affect the demand for the Company’s loans and other products and services, the valuation of our loans, securities, derivatives portfolios, goodwill and intangibles, the carrying value of our deferred tax assets, our capital levels and liquidity, and our results of operations.
Market declines or volatility due to the COVID-19 pandemic could have material impacts on the value of securities, derivatives and other financial instruments which the Company owns. The Company executes transactions with various counterparties in the financial industry, including broker-dealers, commercial banks, and investment banks. Any defaults by such financial services institutions, or uncertainty in the financial services industry in general, could lead to market-wide liquidity problems and may expose the Company to credit risk in the event of default of its counterparties or clients and further increase the possibility of downgrades in the Company’s credit ratings. Additionally, changes in the government’s monetary policy addressing the COVID-19 pandemic could potentially have an adverse effect on our results of operations and financial condition.
The extent to which the COVID-19 pandemic continues to impact our businesses, results of operations, and financial condition is uncertain and will depend on numerous evolving factors that are outside our control and cannot be accurately predicted, including the scope, severity, and duration of the pandemic, the governmental, business, and individual actions in response to the pandemic, or the impact of those actions on global economic activities and economic conditions when the COVID-19 pandemic subsides.
The impact of the U.S. federal government actions to mitigate the effects of the COVID-19 pandemic, and our participation in those efforts, may materially and adversely affect our businesses, results of operations and financial condition.
The U.S. federal government has taken significant actions to address the economic and financial effects of the COVID-19 pandemic. The Federal Reserve sharply reduced interest rates and instituted quantitative easing measures, as well as domestic and global capital market support programs; however, to help curtail rising inflation, the Federal Reserve is expected to increase interest rates and reduce quantitative easing measures. In addition, Congress, various federal agencies and state governments have taken measures to address the economic and social consequences of the pandemic, including the enactment of the CARES Act, which, among other things, established various initiatives to protect individuals, businesses and local economies in an effort to lessen the impact of the COVID-19 pandemic on consumers and businesses. These initiatives included the PPP, the Main Street Lending Program (“MSLP”), relief with respect to TDRs, mortgage forbearance, and extended unemployment benefits.
17
During 2021 and 2020, the Company supported its customers by offering Small Business Administration (“SBA”) loans under the PPP. The Bank was also a participating lender in the MSLP, which was established by the Federal Reserve to support lending to small- and medium-sized businesses and nonprofit organizations that were in sound financial condition before the onset of the COVID-19 pandemic. The Company’s participation in these programs could subject us to increased governmental and regulatory scrutiny, negative publicity or increased exposure to litigation, which could increase our operational, legal and compliance costs and damage our reputation. Moreover, if the federal stimulus measures are not effective in mitigating the effect of the COVID-19 pandemic, credit issues for our loan customers may be severe and adversely affect our businesses, results of operations, and financial condition more substantially over a longer period.
In response to the COVID-19 pandemic, U.S. federal banking regulatory agencies have encouraged lenders to extend additional loans, and the federal government has enacted legislation supporting various sectors, including small businesses. However, the full impact on our business activities as a result of government and regulatory policies, programs and guidelines, as well as regulators’ reactions to such activities, remains uncertain.
Risks Related to Geopolitical Uncertainties
Unfavorable general economic, political or industry conditions, either domestically or internationally, may adversely affect our businesses, results of operations, and financial condition.
Our businesses and results of operations are affected by the financial markets and general economic conditions globally, particularly in the U.S. and China, including factors such as the level and volatility of short-term and long-term interest rates, inflation, deflation, home prices, collateral asset prices, unemployment and under-employment levels, bankruptcies, household income, consumer behavior, fluctuations in both debt and equity capital markets and currencies, liquidity of the global financial markets, the availability and cost of capital and credit, investor sentiment and confidence in the financial markets, and sustainability of economic growth in the U.S. and China. The deterioration of any of these conditions could adversely affect our consumer and commercial businesses, securities and derivatives portfolios, the level of charge-offs and provision for credit losses, the carrying value of deferred tax assets, capital levels, liquidity, and results of operations. In addition, because the Company’s operations and the collateral securing its real estate lending portfolio are primarily concentrated in Northern and Southern California, the Company may be particularly susceptible to adverse economic conditions in the state of California. Any unfavorable changes in economic and market conditions in California and other regions where we operate could lead to the following outcomes:
•greater than expected losses in the Company’s credit exposure due to unforeseen economic conditions, which may, in turn, adversely impact the Company’s results of operations and financial condition;
•failure of the Company’s commercial and residential borrowers to make timely repayments of their loans, or a decrease in the value of real estate collateral securing the payment of such loans, which could result in credit losses, delinquencies, foreclosures and customer bankruptcies, and in turn have a material adverse effect on the Company’s results of operations and financial condition;
•a decrease in deposit balances, and the demand for loans and other products and services;
•future disruptions in the capital markets or other events, including actions by rating agencies and deteriorating investor expectations, which may result in an inability to borrow on favorable terms or at all from other financial institutions;
•an adverse effect on the value of the AFS debt securities portfolio as a result of debt defaults; and
•a loss of confidence in the financial services industry, our market sector and the equity markets by investors, placing pressure on the Company’s stock price.
Changes in the economic and political relations between the U.S. and China, including trade policies and the imposition of tariffs and retaliatory tariffs, may adversely impact the Company’s businesses, results of operations and financial condition.
Economic trade and political tensions, including tariffs and other punitive trade policies and disputes, between the U.S. and China pose a risk to the businesses of the Company and its customers. The imposition of tariffs, retaliatory tariffs or other trade restrictions on products and materials that the Company’s customers import or export could cause the prices of their products to increase, possibly reduce demand and hence may negatively impact the Company’s customers’ margins and their ability to service debt. The Company may also experience a decrease in the demand for loans and other financial products or experience a deterioration in the credit quality of the loans extended to the customer in industry sectors that are most sensitive to the tariffs.
18
We face risks associated with international operations.
A substantial number of our customers have economic and cultural ties to Asia. The Bank’s international presence includes four full-service branches and four representative offices in China. Our presence in China carries certain risks, including risks arising from the uncertainty regarding our ability to generate revenues from foreign operations, risks associated with leveraging and conducting business on an international basis, including among others, legal, regulatory and tax requirements and restrictions, cross-border trade restrictions or tariffs, uncertainties regarding liability, trade barriers, difficulties in staffing and managing foreign operations, political and economic risks, and financial risks including currency and payment risks. Further, volatility in the Shanghai and Hong Kong stock exchanges and/or a potential fall in real estate prices in China, among other things, may negatively impact asset values and the profitability and liquidity of the Company’s customers operating in this region. These risks could adversely affect the success of our international operations and could have a material adverse effect on our overall business, results of operations and financial condition. In addition, we face risks that our employees and affiliates may fail to comply with applicable laws and regulations governing our international operations, including the U.S. Foreign Corrupt Practices Act, anti-corruption laws, and other U.S. and foreign laws and regulations. Failure to comply with such laws and regulations could, among other things, result in enforcement actions and fines against us, as well as limitations on our conduct, any of which could have a material adverse effect on our businesses, results of operations and financial condition.
Natural disasters and geopolitical events beyond the Company’s control, as well as the impacts of climate change, could adversely affect the Company.
Natural disasters such as wildfires, earthquakes, extreme weather conditions, hurricanes, floods, widespread health emergencies or pandemics and other acts of nature and geopolitical events involving political unrest, terrorism or military conflicts could adversely affect the Company’s business operations and those of the Company’s customers and cause substantial damage and loss to real and personal property. For example, California, in which the Company’s operations and the collateral securing its real estate lending portfolio are concentrated, contains active earthquake zones and has been, and continues to be, subject to numerous devastating wildfires. Natural disasters may be more frequent or severe due to the effects of climate change, which may include altered distribution and intensity of rainfall, prolonged droughts or flooding, increased frequency of wildfires, rising sea levels, and a rising heat index. Additionally, our business and operations have been affected by the ongoing COVID-19 pandemic and could be adversely affected by the effects of epidemics or pandemics or other adverse public health developments. Temporary closures of our branches and offices or a reduction of consumer spending could adversely impact our operating results and the performance of loans to impacted borrowers in the U.S or China. These natural disasters and geopolitical events could impair borrowers’ ability to service their loans, decrease the level and duration of deposits by customers, erode the value of loan collateral, and result in an increase in the amount of nonperforming assets, net charge-offs, and provision for credit losses.
Risks arising from climate change, including physical risks and transition risks, could have a material adverse impact on our business and results of operations.
Climate change could present financial risks to us through changes in the physical climate that affect our operations directly or that impact our customers or collateral. Climate change also could present financial risks to us as a result of transition risks, such as societal and/or technological responses to climate change, which could include changes in climate policy or in the regulation of financial institutions with respect to risks posed by climate change. These climate-related physical risks and transition risks could have a financial impact on us both directly on our business and operations and as a result of material adverse impacts to our customers, including declines in asset values, reduced availability of insurance, significant interruptions to business operations, and negative consequences to business models and the need to make changes in response to those consequences. The risks of regulatory changes and compliance requirements related to climate change may impose operational burdens and increased compliance costs, capital requirements, or the risk of litigation, which could adversely affect the Company’s businesses, results of operations and financial condition.
19
Risks Related to Financial Matters
A significant portion of the Company’s loan portfolio is secured by real estate and thus the Company has a higher degree of risk from a downturn in real estate markets.
Because many of the Company’s loans are secured by real estate, a decline in the real estate markets could impact the Company’s business and financial condition. Real estate values and real estate markets are generally affected by changes in general economic conditions, fluctuations in interest rates and the availability of loans to potential purchasers, changes in tax laws and other governmental statutes, regulations and policies, and natural disasters, such as wildfires and earthquakes, which are particularly prevalent in California, where a significant portion of the Company’s real estate collateral is located. If real estate values decline, the value of real estate collateral securing the Company’s loans could be significantly reduced. The Company’s ability to recover on defaulted loans by foreclosing and selling the real estate collateral would be further diminished, and the Company would be more likely to suffer losses on defaulted loans. Furthermore, commercial real estate (“CRE”) and multifamily residential loans typically involve large balances to single borrowers or groups of related borrowers. Since payments on these loans are often dependent on the successful operation or management of the properties, as well as the business and financial condition of the borrowers, repayment of such loans may be subject to adverse conditions in the real estate market, adverse economic conditions, or changes in applicable government regulations. Borrowers’ inability to repay such loans may have an adverse effect on the Company’s businesses, results of operations and financial condition.
The Company’s businesses are subject to interest rate risk and variations in interest rates may have a material adverse effect on the Company’s financial performance.
Our financial results depend substantially on net interest income, which is the difference between the interest income we earn on interest-earning assets and the interest expense we pay on interest-bearing liabilities. Interest-earning assets primarily include loans extended, securities held in our investment portfolio and excess cash held to manage short-term liquidity. We fund our assets using deposits and borrowings. While we offer interest-bearing deposit products, a portion of our deposit balances are from noninterest-bearing products. Overall, the interest rates we receive on our interest-earning assets and pay on our interest-bearing liabilities could be affected by a variety of factors, including market interest rate changes in response to inflation, competition, regulatory requirements and a change in our product mix. Changes in key variable market interest rates such as the Federal Funds, National Prime or Treasury rates generally impact our interest rate spread. Because of the differences in maturities and repricing characteristics of the Company’s interest-earning assets and interest-bearing liabilities, changes in interest rates do not produce equivalent changes in interest income earned on interest-earning assets and interest expense paid on interest-bearing liabilities. Rising interest rates may cause our funding costs to increase at a faster pace than the yield we earn from our assets, ultimately causing our net interest margin to decrease. Higher interest rates may also result in lower mortgage production and increased charge-offs in certain segments of the loan portfolio, such as CRE and home equity. In contrast, declining interest rates would increase the Bank’s lending capacity, decrease funding cost, increase prepayments of loans and mortgage related securities, as borrowers refinance to reduce borrowing costs. Accordingly, changes in levels of interest rates could materially and adversely affect our net interest income, net interest margin, cost of deposits, loan origination volume, average loan portfolio balance, asset quality, liquidity and overall profitability.
Reforms to and uncertainty regarding LIBOR may adversely affect our business.
The United Kingdom’s Financial Conduct Authority, which regulates LIBOR, announced that after specified dates, LIBOR settings will cease to be provided by any administrator. As of December 31, 2021, the one-week and two-month tenors of USD LIBOR ceased to be published. The overnight, one-, three-, six- and 12-month USD LIBOR tenors will continue to be calculated using panel bank submissions for the purpose of legacy contracts and will permanently cease on June 30, 2023. Banking regulators have increased regulatory scrutiny and intensified supervisory focus of financial institutions’ LIBOR transition plans, preparations and readiness, including the use of credit-sensitive rates.
The U.S. federal banking agencies issued guidance to strongly encourage banking organizations to cease using USD LIBOR as a reference rate in new contracts by December 31, 2021. In connection with this, the Company ceased extending new LIBOR loans during the fourth quarter of 2021 and began offering new variable rate loans based on alternative reference rates.
20
The LIBOR transition is anticipated to continue through June 30, 2023. The Company created a cross-functional team to manage the communication of the Company’s transition plans with both internal and external stakeholders. The cross-functional team also helps ensures that the Company appropriately updates its business processes, analytical tools, information systems and contract language to minimize disruption during and after the LIBOR transition. Since the volume of our products that are indexed to LIBOR is significant, the transition, if not sufficiently planned for and managed by our cross-functional teams, could impact the financial performance of previously recorded transactions, requiring different hedging strategies, result in our hedges being ineffective or impact the availability of cost of floating rate funding, affect our liquidity and capital planning and management or other adverse financial consequences. Although the implementation of the Secured Overnight Financing Rate (“SOFR”) index is intended to have minimal economic effect on the parties to a LIBOR-based contract, the transition from LIBOR to a new benchmark rate could result in significant increased systems, compliance, operational and legal costs, increased scrutiny from regulators, reputational harm or other adverse consequences. Inconsistent approaches to a transition from LIBOR to an alternative rate among different market participants and for different financial products may cause market disruption and operational problems, which could adversely affect us. This may include exposure to increased basis risk, increased possibility of disagreements with counterparties and the resulting costs in connection with remediating these problems. This transition may also result in our customers challenging the determination of their interest payments, entering into fewer transactions or postponing their financing needs, or disputing the interpretation of implementation of contract “fallback” provisions and other transition related changes, which could reduce the Company’s revenue and adversely impact our business. In addition, the transition from LIBOR to another benchmark rate or rates could have adverse impacts on floating-rate obligations such as loans, deposits, derivatives, and other financial instruments that currently use LIBOR as a benchmark rate and, ultimately, adversely affect the Company’s results of operations and financial condition. For additional information on the discontinuation of LIBOR, refer to Item 7. MD&A — Other Matters.
The monetary policies of the federal government and its agencies could have a material adverse effect on our earnings.
The Federal Reserve Board regulates the supply of money and credit in the U.S. Its policies determine in large part the cost of funds for lending and investing and affect the return earned on those loans and investments, both of which in turn affect our net interest margin. They can also materially decrease the value of financial assets we hold. Federal Reserve policies may also adversely affect borrowers, potentially increasing the risk that they may fail to repay their loans, or could adversely create asset bubbles which result from prolonged periods of accommodative policy. This, in turn, may result in volatile markets and rapidly declining collateral values. Changes in Federal Reserve policies are beyond our control. Consequently, the impact of these changes on our businesses and results of operations is difficult to predict.
The Company is subject to fluctuations in foreign currency exchange rates.
The Company’s foreign currency translation exposure relates primarily to its China subsidiary that has its functional currency denominated in Chinese Renminbi (“RMB”). In addition, as the Company continues to expand its businesses in China and Hong Kong, certain transactions are conducted in currencies other than the USD. Although the Company has entered into derivative instruments to offset the impact of the foreign exchange fluctuations, given the volatility of exchange rates, there is no assurance that the Company will be able to effectively manage foreign currency translation risk. Fluctuations in foreign currency exchange rates could have a material unfavorable impact on the Company’s net income, therefore adversely affecting the Company’s businesses, results of operations, and financial condition.
Risks Related to Our Capital Resources and Liquidity
As a regulated entity, we are subject to capital requirements, and a failure to meet these standards could adversely affect our financial condition.
The Company and the Bank are subject to certain capital and liquidity rules, including the Basel III Capital Rules, which establish the minimum capital adequacy requirements and may require us to increase our regulatory capital or liquidity targets, increase regulatory capital ratios, or change how we calculate regulatory capital. We may be required to increase our capital levels, even in the absence of actual adverse economic conditions or forecasts, and enhance capital planning based on hypothetical future adverse economic scenarios. As of December 31, 2021, we met the requirements of the Basel III Capital Rules, including the capital conservation buffer. Compliance with these capital requirements may limit capital-intensive operations and increase operational costs, and we may be limited or prohibited from distributing dividends or repurchasing our stock. This could adversely affect our ability to expand or maintain present business levels, which may adversely affect our businesses, results of operations and financial condition. Additional information on the regulatory capital requirements applicable to the Company and the Bank is set forth in Item 1. Business — Supervision and Regulation — Regulatory Capital Requirements in this Form 10-K.
21
The Company’s dependence on dividends from the Bank could affect the Company’s liquidity and ability to pay dividends.
East West is dependent on the Bank for dividends, distributions and other payments. Our principal source of cash flows, including cash flows to pay dividends to our stockholders and principal and interest on our outstanding debt, is dividends received from the Bank. The ability of the Bank to pay dividends to the Company is limited by federal and California law. Subject to the Bank meeting or exceeding regulatory capital requirements, regulatory approval is required under federal law if the total of all dividends declared by the Bank in any calendar year would exceed the sum of the Bank’s net income for that year and its retained earnings for the preceding two years. Federal law also prohibits the Bank from paying dividends that would be greater than its undivided profits, unless the Bank has received prior approval of the Federal Reserve and of at least two-thirds of the stockholders of each class of stock. California law imposes its own limitations on capital distributions by California-charted banks that could require the Bank to obtain the approval of the DFPI prior to making a distribution to the Company. In addition, Federal Reserve guidance sets forth the supervisory expectation that bank holding companies will inform and consult with the Federal Reserve in advance of issuing a dividend that exceeds earnings for the quarter and should not pay dividends in a rolling four quarter period in an amount that exceeds net income, net of distributions, for the period. Further description of regulatory requirements applicable to dividends by us and the Bank is set forth in Item 1. Business — Supervision and Regulation — Dividends and Other Transfers of Funds in this Form 10-K.
The Company is subject to liquidity risk, which could negatively affect the Company’s funding levels.
Market conditions or other events could negatively affect the level of or cost of funding, which in turn could affect the Company’s ongoing ability to accommodate liability maturities and deposit withdrawals, meet contractual obligations, or fund asset growth and new business initiatives at a reasonable cost, in a timely manner and without adverse consequences. Although the Company has implemented strategies to maintain sufficient and diverse sources of funding to accommodate planned, as well as unanticipated changes in assets, liabilities, and off-balance sheet commitments under various economic conditions, a substantial, unexpected or prolonged change in the level or cost of liquidity could have a material adverse effect on the Company’s businesses, results of operations, and financial condition. If the cost effectiveness or the availability of supply in the credit markets is reduced for a prolonged period of time, the Company’s funding needs may require the Company to access funding and manage liquidity by other means. These alternatives may include generating client deposits, securitizing or selling loans, and further managing loan growth and investment opportunities. These alternative means of funding may not be available under stressed market conditions or realized in a timely fashion.
Any downgrades in our credit ratings could have a material adverse effect on our liquidity, cost of funding, cash flows, results of operations and financial condition.
Credit rating agencies evaluate us regularly, and their ratings are based on a number of factors, including our financial strength, capital adequacy, liquidity, asset quality and ability to generate earnings. Some of these factors are not entirely within our control, including conditions affecting the financial services industry as a whole. Severe downgrades in credit ratings could impact our business and reduce the Company’s profitability in different ways, including a reduction in the Company’s access to capital markets, triggering additional collateral or funding obligations which could negatively affect our liquidity. In addition, our counterparties, as well as our clients, rely on our financial strength and stability and evaluate the risks of doing business with us, on a regular basis. If we experience a decline in our credit ratings, this could result in a decrease in the number of counterparties and clients who may be willing to transact with us. Our borrowing costs may also be affected by various external factors, including market volatility and concerns or perceptions about the financial services industry. There can be no assurance that we can maintain our credit ratings nor that they will not be changed in the future.
22
Risks Related to Credit Matters
The Company’s allowance for credit losses level may not be adequate to cover actual losses.
In accordance with the U.S. Generally Accepted Accounting Principles (“GAAP”), we maintain an allowance for loan losses to provide for loan defaults and nonperformance, and an allowance for unfunded credit commitments which, when combined, are referred to as the allowance for credit losses. Our allowance for loan losses is based on our evaluation of risks associated with our loans held-for-investment portfolio, including historical loss experience, current borrower characteristics, current economic conditions, reasonable and supportable forecasts of future economic conditions, delinquencies, performing status, the size and composition of the loan portfolio, and concentrations within the portfolio. The allowance estimation process requires subjective and complex judgments, including analysis of economic conditions and how these economic conditions might impair the ability of our borrowers to repay their loans. Current economic conditions in the U.S. and in the international markets could further deteriorate, which could result in, among other things, greater than expected deterioration in credit quality of our loan portfolio or in the value of collateral securing these loans. Our allowance for credit losses may not be adequate to absorb actual credit losses, and future provisions for credit losses could materially and adversely affect our operating results. The amount of future losses is influenced by changes in economic, operating and other conditions, including changes in interest rates that may be beyond our control, and these losses may exceed current estimates.
We adopted new guidance for estimating credit losses on loans receivable, AFS and held-to-maturity debt securities, and unfunded loan commitments effective January 1, 2020. The CECL model significantly changed how entities recognized impairment of many financial assets by requiring immediate recognition of estimated credit losses that occur over the life of the financial asset. This requires reserves over the life of the loan rather than the loss emergence period as required under previous guidance. The CECL guidance requires the implementation of new modeling to quantify this estimate by using principles of not only relevant historical experience and current conditions, but also reasonable and supportable forecasts of future events and circumstances, thus incorporating a broad range of estimates and assumptions in developing credit loss estimates, which could result in significant changes to both the timing and amount of credit loss expense and allowance. The Company has elected the CECL phase-in option provided by regulatory capital rule, which delays the impact of CECL on regulatory capital for two years, followed by a three-year transition period. As a result, the effect of CECL on the Company’s and the Bank’s regulatory capital was delayed through the year 2021, after which the effects are being phased-in over a three-year period from January 1, 2022 through December 31, 2024. Adoption of, and efforts to implement this guidance has caused and may in the future cause our allowance for credit losses to change, which could have a material adverse effect on our businesses, and financial condition.
Additionally, in order to maximize the collection of loan balances, we sometimes modify loan terms when there is a reasonable chance that an appropriate modification would allow the borrower to continue servicing the debt. If such modifications ultimately are less effective at mitigating loan losses than we expect, we may incur losses in excess of the specific amount of allowance for loan losses associated with a modified loan, which would result in additional provision for loan losses. In addition, we establish a reserve for losses associated with our unfunded credit commitments. The level of the allowance for unfunded credit commitments is determined by following a methodology similar to that used to establish our allowance for loan losses in our loans held-for-investment portfolio. There can be no assurance that our allowance for unfunded credit commitments will be adequate to provide for the actual losses associated with our unfunded credit commitments. An increase in the allowance for unfunded credit commitments in any period may result in a charge to earnings and could have a material adverse effect on our businesses, results of operations, and financial condition.
We may be subject to increased credit risk and higher credit losses to the extent that our loans are concentrated by loan type, industry segment, borrower type, or location of the borrower or collateral.
Our credit risk and credit losses can increase if our loans are concentrated in borrowers affected by the same or similar economic conditions in the markets in which we operate or elsewhere, which could result in materially higher credit losses. For example, the Bank has a concentration of real estate loans in California. Potential deterioration in the California commercial or residential real estate markets could result in additional loan charge-offs and provision for loan losses, which could have a material adverse effect on the Company’s business, results of operations and financial condition. If any industry or market sector were to experience economic difficulties, loan collectability from customers operating in those industries or sectors may deteriorate, which could have a material adverse impact on our businesses, results of operations and financial condition.
23
Risks Related to Our Operations
A failure in or breach of our operational or security systems or infrastructure, or those of third party vendors, could disrupt our businesses, and adversely impact our results of operations, financial condition, cash flows, and liquidity, as well as damage our reputation.
The potential for operational risk exposure exists throughout our organization and among our interactions with third parties. Our operational and security systems, infrastructure, including our computer systems, network infrastructure, data management and internal processes, as well as those of third party vendors, are integral to our performance. In addition, our ongoing operations rely on our employees and third parties, who may, as a result of human error, malfeasance, or failure or breach of third-party systems or infrastructure, expose us to operational risk. We have taken measures to implement backup systems and safeguards to support our operations, but our ability to conduct business may be adversely affected by any significant disruptions to us or to the third parties with whom we interact. In addition, our ability to implement backup systems and other safeguards with respect to third-party systems is more limited than with respect to our own systems. Our financial, accounting, data processing, backup or other operating or security systems and infrastructure may fail to operate properly or may become disabled or damaged as a result of a number of factors including events that are wholly or partially beyond our control which could adversely affect our ability to process transactions or provide certain services. These factors include, and are not limited to electrical, telecommunications or other major physical infrastructure outages, disease pandemics, natural disasters such as wildfires, earthquakes, tornadoes, hurricanes and floods, and events arising from local or larger scale political or social matters, including terrorist acts. Furthermore, we frequently update these systems to support our operations and growth, requiring significant costs and creating risks associated with implementing new systems and integrating them with existing ones. Operational risk exposures could adversely impact our results of operations, financial condition, cash flows, and liquidity, and may result in loss of confidence, significant litigation exposure and harm to our reputation.
A cyber-attack, information or security breach, or a technology failure of our systems or of a third party’s systems could adversely affect our ability to conduct business, manage our exposure to risk or expand our businesses. This could also result in the misuse of confidential or proprietary information, increase our costs to maintain and update our operational and security systems and infrastructure, and adversely impact our results of operations, financial condition, cash flows and liquidity, as well as cause reputational harm.
Our business is highly dependent on the security and efficacy of our infrastructure, computer and data management systems, as well as those of third parties with which we interact. Cyber security risks, including ransomware and malware attacks, for financial institutions have significantly increased in recent years in part because of the proliferation of new technologies, the use of the internet and telecommunication technologies to conduct financial transactions, the significant increased use of remote workstations by employees, especially during the COVID-19 pandemic, and the increased sophistication and activities of organized crime, hackers, terrorists, nation-states and other threat actors. Our businesses rely on the secure processing, transmission, storage and retrieval of confidential, proprietary and other information in our computer email and data management systems and networks, including those of our third party vendors. Although we employ a combination of preventative and detective controls to safeguard against cyber-attacks and have not experienced any known cyber-attacks resulting in material system failures or breaches to date, we can provide no assurance that all of our security measures will be effective, especially since the industry has seen an increase in ransomware attacks, data breaches, social engineering, and internet scams that have placed the Bank, employees, our customers and third party vendors at heightened risk levels. Failure to mitigate breaches of security, or to comply with frequent imposition of increasingly demanding new and changing industry standards and regulatory requirements, could result in violation of applicable privacy laws, reputational damage, regulatory fines, litigation exposure, increased security compliance costs, adversely affect our ability to offer and grow the online services, and could have an adverse effect on the Company’s businesses, results of operations and financial condition.
24
Failure to keep pace with technological change could adversely affect the Company’s businesses. The Company may face risks associated with the utilization of information technology systems to support our operations effectively.
The financial services industry is continuously undergoing rapid technological change with frequent introductions of new technology-driven products and services, including financial technology and non-banking entities. The effective use of technology increases efficiency and enables financial institutions to better serve customers and to reduce costs. Our future success depends, in part, upon our ability to address the needs of our customers by using technology to provide products and services that will satisfy customer demands, as well as to create additional efficiencies in the Company’s operations. Many of the Company’s competitors have substantially greater resources to invest in technological improvements. The Company may not be able to effectively implement new technology-driven products and services or be successful in marketing these products and services to its customers. Failure to successfully keep pace with technological change affecting the financial services industry could have a material adverse impact on our businesses and, in turn, our results of operations and financial condition. In addition, if we do not implement systems effectively or if our outsourcing business partners do not perform their functions properly, there could be an adverse effect on us. There can be no assurance that we will be able to effectively maintain or improve our systems and processes, or utilize outsourced talent, to meet our business needs successfully. Any such failure could adversely affect our businesses, results of operations, financial condition and reputation.
The actions and soundness of other financial institutions could affect the Company.
Financial services institutions are interrelated as a result of trading, clearing, counterparty or other relationships. The Company executes transactions with various counterparties in the financial industry, including broker-dealers, commercial banks and investment banks. Defaults by financial services institutions and uncertainty in the financial services industry in general could lead to market-wide liquidity problems and may expose the Company to credit risk. Further, the Company’s credit risk may increase when the underlying collateral held cannot be realized or is liquidated at prices not sufficient to recover the full amount of the loan or derivative exposure due to the Company. Any such losses could materially and adversely affect the Company’s businesses, results of operations and financial condition.
The Company’s controls and procedures could fail or be circumvented.
Management regularly reviews and updates the Company’s internal controls, reporting controls and procedures, and corporate governance policies and procedures. Any system of controls, however well designed and operated, is based in part on certain assumptions and can provide only reasonable, but not absolute, assurances of the effectiveness of these systems and controls, and that the objectives of these controls have been met. Any failure or circumvention of the Company’s controls and procedures, and any failure to comply with regulations or supervisory expectations related to controls and procedures could adversely affect the Company’s businesses, results of operations and financial condition.
The Company is dependent on key personnel and the loss of one or more of those key personnel may materially and adversely affect the Company’s prospects.
Competition for qualified personnel in the banking industry is intense and there is a limited number of qualified persons with knowledge of, and experience in, the regional banking industry, especially in the West Coast market, and the international banking operations, in particular, China and Pan Asia region. The process of recruiting personnel with the combination of skills and attributes required to carry out the Company’s strategies is often lengthy. The Company’s success depends, to a significant degree, upon its ability to attract and retain qualified management, loan origination, finance, administrative, marketing and technical personnel, as well as upon the continued contributions of its management and personnel. In particular, the Company’s success has been and continues to be highly dependent upon the abilities of certain key executives. Accordingly, we believe that our future success is dependent upon the development and, when needed, implementation of adequate succession plans. Although both the Board of Directors and management monitor our succession planning for our senior management team, unexpected departures of key personnel or disruptions in future leadership transitions could negatively impact our business and prospects.
25
We face strong competition in the financial services industry and we could lose business or suffer margin declines as a result.
The Company operates in a highly competitive environment. Our competitors include but are not limited to commercial banks, savings and loan associations, finance companies, brokerage firms, insurance companies, credit unions, mortgage banks, nonbank financial institutions and other regional, national, and global financial institutions. Some of our major competitors include multinational financial service companies whose greater resources may afford them a marketplace advantage by enabling them to maintain numerous locations and mount extensive promotional and advertising campaigns. Areas of competition include interest rates on loans and deposits, customer services, and range of price and quality of products and services, including new technology-driven products and services. Ongoing or increased competition may put pressure on the pricing for the Company’s products and services or may cause the Company to lose market share, particularly with respect to traditional banking products such as loans and deposits. Failure to attract and retain banking customers may adversely impact the Company’s loan and deposit growth and in turn, its revenues.
The Company has engaged in and may continue to engage in further expansion through acquisitions, which could cause disruption to the Company’s businesses and may dilute existing stockholders’ interests.
There are risks associated with expanding through acquisitions. These risks include, among others, incorrectly assessing the asset quality of a bank acquired in a particular transaction, incurring greater than anticipated costs in integrating acquired businesses, failing to retain customers or employees, and the inability to profitably deploy assets acquired in the transaction. Additional country or region-specific risks are associated with transactions outside the U.S., including in China. To the extent the Company issues capital stock in connection with additional transactions, these transactions and related stock issuances may have a dilutive effect on earnings per share and share ownership.
Risks Related to Regulatory, Compliance and Legal Matters
Changes in regulation may require the Company to change its business practices, increase costs, limit the Company’s ability to make investments and generate revenue, or otherwise adversely affect business operations and/or competitiveness.
The Company is subject to extensive regulation under federal and state laws, as well as supervision and examination by the DFPI, FDIC, Federal Reserve, SEC, CFPB, and other government agencies and self-regulatory organizations. We are also subject to enforcement oversight by the U.S. Department of Justice and state attorneys general. Our overseas operations in China are subject to extensive regulation under Chinese laws as well as supervision and examination by Chinese financial regulators. Moreover, regulation of the financial services industry continues to undergo major changes. On July 9, 2021, President Biden issued an Executive Order on Promoting Competition in the American Economy (the “Executive Order”), which encourages the federal banking agencies to review current merger oversight practices and directs the CFPB to commence or continue rulemaking to facilitate the portability of consumer financial transaction data. The Executive Order could result in increased competition in the financial services and technology sectors that may adversely impact our business. In addition, we face certain legal, reputational and financial risks as a result of serving customers in new or evolving industries that are subject to changing, and at times conflicting, laws, such as digital currency or cannabis related businesses. Changes to statutes, regulations or regulatory policies, including changes in interpretation or implementation of statutes, regulations or policies could affect the manner in which the Company conducts business. Such changes could also subject us to additional costs and may limit the types of financial services and products we offer, and the investments we make.
Given that banks operate in an extensively regulated environment under federal and state law, good standing with our regulators is of fundamental importance to the continuation and growth of our businesses. In the performance of their supervisory and enforcement duties, the U.S. federal and state regulators, and non-U.S. regulators, have significant discretion and power to initiate enforcement actions for violations of laws and regulations, and unsafe and unsound practices. Further, regulators and bank supervisors continue to exercise qualitative supervision of our industry and specific business operations and related matters. Violations of laws and regulations or deemed deficiencies in risk management or other qualitative practices also may be incorporated into the Company’s bank supervisory ratings. A downgrade in these ratings, or other enforcement actions or supervisory criticisms, could limit the Company’s ability to pursue acquisitions or conduct other expansionary activities and require new or additional regulatory approvals before engaging in certain other business activities, as well as result in civil monetary penalties, other sanctions, and damage to our reputation, all of which could adversely affect our business, financial condition, results of operations and future prospects.
26
Failure to comply with laws, regulations or policies could result in civil or criminal sanctions by U.S. federal and state, and non-U.S. agencies, the loss of FDIC insurance, the revocation of our banking charter, civil or criminal monetary penalties and/or reputational damage, which could have a material adverse impact on the Company’s businesses, results of operations and financial condition. We continue to adjust our businesses and operations, capital, policies, procedures and controls to comply with these laws and regulations, final rulemaking, and interpretations from the regulatory authorities. See Item 1. Business — Supervision and Regulation in this Form 10-K for more information about the regulations to which we are subject.
Complying with the Bank Secrecy Act and other anti-money laundering and sanctions statutes and regulations can increase our compliance costs and risks.
The BSA, the PATRIOT Act, and other laws and regulations require us and other financial institutions to institute and maintain an effective AML program and file suspicious activity reports and currency transaction reports when appropriate. We may provide banking services to customers considered to be higher risk customers, which subjects us to greater enforcement risk under the BSA, and required us to ensure our third-party vendors adhere to the BSA and related regulations. The Financial Crimes Enforcement Network may impose significant civil monetary penalties for violations of those requirements and has been engaging in coordinated enforcement efforts with the federal and state banking regulators, as well as the U.S. Department of Justice, Drug Enforcement Administration, and the Internal Revenue Service (“IRS”).
We are also required to comply with the U.S. economic and trade sanctions administered by the OFAC regarding, among other things, the prohibition of transacting business with, and the need to freeze assets of, certain persons and organizations identified as a threat to the national security, foreign policy or economy of the U.S. A violation of any AML or OFAC-related law or regulation could subject us to significant civil and criminal penalties as well as regulatory enforcement actions, which may include restrictions on our ability to pay dividends and the necessity to obtain regulatory approvals to proceed with certain aspects of our business plan, including any acquisition plans. Any of these violations could have a material adverse effect on our businesses, results of operations, financial condition, reputation and future prospects.
We are subject to significant financial and reputational risk arising from lawsuits and other legal proceedings.
We face significant risk from lawsuits and claims brought by consumers, borrowers and counterparties. These actions include claims for monetary damages, penalties and fines, as well as demands for injunctive relief. If these lawsuits or claims, whether founded or unfounded, are not resolved in a favorable manner to us, they could lead to significant financial obligations for the Company, as well as restrictions or changes to how we conduct our businesses. Although we establish accruals for legal matters when and as required by U.S. GAAP and certain expenses and liabilities in connection with such matters may or may not be covered by insurance, the amount of loss ultimately incurred in relation to those matters may be substantially higher than the amounts accrued and/or insured. Substantial legal liability could adversely affect our businesses, results of operations, and financial condition. In addition, we may suffer significant reputational harm as a result of lawsuits and claims, adversely impacting our ability to attract and retain customers and investors. Moreover, it may be difficult to predict the outcome of certain legal proceedings, which may present additional uncertainty to our business prospects.
Risks Related to Accounting and Tax Matters
Changes in accounting standards or changes in how the accounting standards are interpreted or applied could materially impact the Company’s financial statements.
The preparation of the Company’s financial statements is based on accounting standards established by the FASB and the SEC. From time to time, these accounting standards may change and such changes may have a material impact on the Company’s financial statements. In addition, the FASB, SEC, banking regulators and the Company’s independent registered public accounting firm may amend or reverse their previous interpretations or positions on how various standards should be applied. These changes may be difficult to predict and could impact how we prepare and report the Company’s financial statements. In some cases, the Company could be required to adopt a new or revised standard retroactively, potentially resulting in restatements to a prior period’s financial statements.
27
The Company’s Consolidated Financial Statements are based in part on assumptions and estimates which, if incorrect, could cause unexpected losses in the future.
Pursuant to U.S. GAAP, we are required to use certain assumptions and estimates in preparing our financial statements, including in determining credit loss reserves, reserves related to litigation, and the fair value of certain assets and liabilities, among other items. Our assumptions and estimates may be inaccurate or subjective, particularly in times of market stress or under unforeseen circumstances. Inaccurate assumptions or inadequate design of our forecasting models could result in incorrect or misleading information, and in turn could lead to inappropriate business decisions, such as an inadequate reserve for credit losses, and adversely impact our businesses, results of operations and financial condition. The Company’s significant accounting policies and use of estimates are fundamental to understanding its results of operations and financial condition. Some accounting policies, by their nature, are inherently subject to estimation techniques, valuation assumptions and other subjective assessments. In addition, some significant accounting policies require significant judgments in applying complex accounting principles to individual transaction and determining the most appropriate treatment. The Company has procedures and processes in place to facilitate making these judgments. For a description of these policies, refer to Note 1 — Summary of Significant Accounting Policies to the Consolidated Financial Statements of this Form 10-K, and Item 7. MD&A – Critical Accounting Estimates in this Form 10-K.
Changes to fiscal policies and tax legislation may adversely affect our business.
From time to time, the U.S. government may introduce new fiscal policies and tax laws or make substantial changes to existing tax legislation. These changes could have a material impact on the Company’s businesses, results of operations and financial condition. The Company’s positions or its actions taken prior to such changes, may be compromised by such changes. In addition, the Company’s actions taken in response to, or in reliance upon, such changes in the tax laws may impact our tax position in a manner that may result in an adverse financial condition. The Company also provides for current and deferred taxes in our financial statements, based on our results of operations and financial condition. We may take tax return filing positions for which the final determination of tax is uncertain, and our income tax expense could be increased if a federal, state, or local authority were to assess additional taxes that have not been provided for in our Consolidated Financial Statements. There can be no assurance that we will achieve our anticipated effective tax rate. The U.S. government could further introduce new tax legislation or amend current tax laws that would adversely affect the Company. In addition, the President’s proposed budget, negotiations with Congress over the details of the budget, and the terms of the approved budget could create uncertainty about the U.S. economy, ultimately having an adverse effect on our business, results of operations, and financial condition.
The Company’s investments in certain tax-advantaged projects may not generate anticipated returns and may have an adverse impact on the Company’s results of operations.
The Company invests in certain tax-advantaged investments that support qualified affordable housing projects, community development and renewable energy resources. The Company’s investments in these projects are designed to generate a return primarily through the realization of federal and state income tax credits, and other tax benefits, over specified time periods, but such returns are not guaranteed. The Company remains subject to the risk that previously recorded tax credits, which remain subject to recapture by taxing authorities based on compliance features required to be met at the project level, may fail to meet certain government compliance requirements and may not be able to be realized. The Company’s ability to realize tax credits and other tax benefits depends on many factors outside the Company’s control, including changes in the applicable tax code and the ability of the projects to be completed. Failure to realize anticipated tax credits and other tax benefits may have a negative impact on the Company’s business, results of operations, and financial condition.
General Risk Factors
Anti-takeover provisions could negatively impact the Company’s stockholders.
Provisions of Delaware and California law and of the Company’s certificate of incorporation, as amended, and bylaws, as amended and restated, could make it more difficult for a third party to acquire control of the Company or could have the effect of discouraging a third party from attempting to acquire control of the Company. For example, the Company’s certificate of incorporation, as amended, requires the approval of the holders of at least two-thirds of the outstanding shares of voting stock to approve certain business combinations. The Company is also subject to Section 203 of the Delaware General Corporation Law, which would make it more difficult for another party to acquire the Company without the approval of the Board of Directors. Additionally, the Company’s certificate of incorporation, as amended, authorizes the Board of Directors to issue preferred stock which could be issued as a defensive measure in response to a takeover proposal.
28
Further, prior approval of the Federal Reserve and the DFPI is required for any person to acquire control of the Company, and control for these purposes may be presumed to exist when a person owns 10% or more of our outstanding common stock. Federal Reserve approval is also required for a bank holding company to acquire more than 5% of our outstanding common stock. These and other provisions could make it more difficult for a third party to acquire the Company, even if an acquisition might be in the best interest of the stockholders.
Managing reputational risk is important to attracting and maintaining customers, investors and employees.
Threats to the Company’s reputation can come from many sources, including unethical practices, employee misconduct, failure to deliver minimum standards of service or quality, compliance deficiencies, and questionable or fraudulent activities of the Company’s customers. The Company has policies and procedures, including the Company’s Code of Conduct, in place to govern the personal conduct, action and work relationship of our employees with customers, fellow employees, competitors, governmental officials, and suppliers under both official and unofficial situations, in which employees may reasonably be perceived by others as acting as representatives of the Company. In addition, employees who fail to comply with the Code of Conduct may be subject to disciplinary action, termination of employment, and/or prosecution. However, these policies and procedures may not be fully effective. Negative publicity regarding the Company’s businesses, employees or customers, with or without merit, may result in the loss of customers, investors and employees, costly litigation, a decline in revenues and increased governmental scrutiny.
The price of the Company’s common stock may be volatile or may decline.
The price of the Company’s common stock may fluctuate in response to various factors, some of which are outside the Company’s control. These factors include the risk factors discussed herein, as well as:
•actual or anticipated quarterly fluctuations in the Company’s results of operations and financial condition;
•changes in revenue or earnings estimates or publication of research reports and recommendations by financial analysts and rating agencies;
•speculation in the press or investment community;
•strategic actions by the Company or its competitors, such as acquisitions or restructurings;
•actions by institutional stockholders;
•addition or departure of key personnel;
•fluctuations in the stock price and operating results of the Company’s competitors;
•general market conditions and, in particular, market conditions in the financial services industry;
•proposed or adopted regulatory changes or developments;
•cyclical fluctuations;
•trading volume of the Company’s common stock; and
•anticipated or pending investigations, proceedings or litigation that involve or affect the Company.
Industry factors, general economic and political conditions and events, such as cyber or terrorist attacks, economic downturn or recessions, interest rate changes, credit default trends, currency fluctuations, changes to trade policies or public health issues could also cause our stock price to decline regardless of our operating results. A significant decline in the Company’s stock price could result in substantial losses for stockholders.
Impairment of goodwill could result in a charge against earnings and thus a reduction in stockholders’ equity.
The Company tests goodwill for impairment on an annual basis, or more frequently, if necessary. A significant decline in our expected future cash flows, a material change in interest rates, a significant adverse change in the business climate, slower growth rates, or a significant or sustained decline in the price of the Company’s common stock may necessitate taking charges in the future related to the impairment of goodwill. If the Company determines that a future write-down of goodwill is necessary, the amount of such impairment charge could be significant and could adversely affect earnings as well as capital.
ITEM 1B. UNRESOLVED STAFF COMMENTS
None.
29
ITEM 2. PROPERTIES
East West’s corporate headquarters is located at 135 North Los Robles Avenue, Pasadena, California, an eight-story office building that it owns. The Company operates in over 120 locations in the U.S. and China. In the U.S., the Bank’s corporate headquarters and main administrative offices are located in California, and its branches and offices are located in California, Texas, New York, Washington, Georgia, Massachusetts, Nevada and Illinois. In China, East West’s presence includes full service branches in Hong Kong, Shanghai, Shantou and Shenzhen, and offices in Beijing, Chongqing, Guangzhou, and Xiamen.
As of December 31, 2021, the Bank owns approximately 159,000 square feet of property at 19 U.S. locations and leases approximately 785,000 square feet in the remaining U.S. locations. Expiration dates for these leases range from 2022 to 2036, exclusive of renewal options. The Bank leases all of its branches and offices in China, totaling approximately 58,000 square feet. Expiration dates for these leases range from 2022 to 2026. All properties occupied by the Bank are used across all business segments and for corporate purposes.
On an ongoing basis, the Company evaluates its current and projected space needs and, from time to time, it may determine that certain premises or facilities are no longer necessary for its operations. The Company believes that, if necessary, it could secure alternative properties on similar terms without adversely affecting its operations.
ITEM 3. LEGAL PROCEEDINGS
See Note 12 — Commitments and Contingencies — Litigation to the Consolidated Financial Statements in this Form 10-K, which is incorporated herein by reference.
ITEM 4. MINE SAFETY DISCLOSURES
Not applicable.
30
PART II
ITEM 5. MARKET FOR REGISTRANT’S COMMON EQUITY, RELATED STOCKHOLDER MATTERS AND ISSUER PURCHASES OF EQUITY SECURITIES
Market Information, Holders of Common Stock and Dividends
The Company’s common stock is traded on the Nasdaq Global Select Market under the symbol “EWBC.” As of January 31, 2022, the Company had 725 stockholders of record holding 141,908,514 shares of the Company’s common stock, not including beneficial owners whose shares are held in record names of brokers or other nominees.
Holders of the Company’s common stock are entitled to receive cash dividends when declared by the Company’s Board of Directors out of legally available funds. The Board of Directors presently intends to continue the policy of paying quarterly cash dividends, however, there can be no assurance as to future dividends because they are dependent on the Company’s future earnings, capital requirements and financial condition.
Securities Authorized for Issuance under Equity Compensation Plans
For information regarding securities authorized for issuance under the Company’s equity compensation plans, see Note 13 — Stock Compensation Plans to the Consolidated Financial Statements and Item 12. Security Ownership of Certain Beneficial Owners and Management and Related Stockholder Matters presented elsewhere in this Form 10-K, which are incorporated herein by reference.
Five-Year Stock Performance
The following graph and table compare the Company’s cumulative total return on its common stock with the cumulative total return of the Standard & Poor’s (“S&P”) 500 Index and the Keefe, Bruyette and Woods Nasdaq Regional Banking Index (“KRX”) over the five-year period through December 31, 2021. The S&P 500 Index is utilized as a benchmark against performance and is a commonly referenced U.S. equity benchmark consisting of leading companies from different economic sectors. The KRX is used to compare EWBC with other banks of a relatively similar size. This index seeks to reflect the performance of publicly traded U.S. companies that do business as regional banks or thrifts, and is composed of 50 companies. The graph and table below assume that on December 31, 2016, $100 was invested in EWBC’s common stock, the S&P 500 Index and the KRX, and that all dividends were reinvested. Historical stock price performance shown on the graph is not necessarily indicative of future price performance. The information set forth under the heading “Five-Year Stock Performance” shall not be deemed to be “soliciting material” or to be “filed” with the SEC or subject to the liabilities of Section 18 of the Exchange Act, except to the extent that the Company specifically requests that such information to be treated as soliciting material or specifically to be incorporated by reference into a filing under the Securities Act or the Exchange Act.
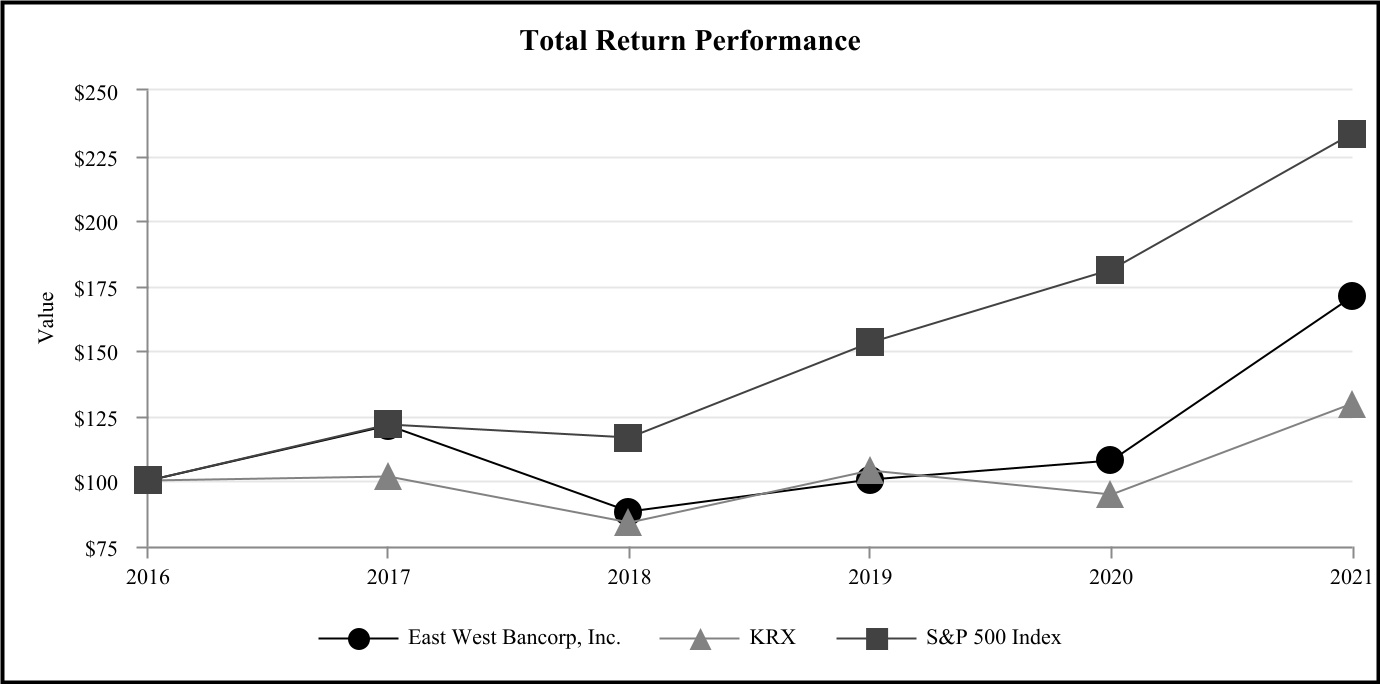
31
| December 31, | ||||||||||||||||||||||||||||||||||||||
| Index | 2016 | 2017 | 2018 | 2019 | 2020 | 2021 | ||||||||||||||||||||||||||||||||
| East West Bancorp, Inc. | $100.00 | $121.40 | $88.10 | $100.70 | $108.00 | $170.70 | ||||||||||||||||||||||||||||||||
| KRX | $100.00 | $101.80 | $83.90 | $103.90 | $94.90 | $129.70 | ||||||||||||||||||||||||||||||||
| S&P 500 Index | $100.00 | $121.80 | $116.50 | $153.20 | $181.30 | $233.40 | ||||||||||||||||||||||||||||||||
Repurchases of Equity Securities by the Issuer and Affiliated Purchasers
During the first quarter of 2020, the Company’s Board of Directors authorized the repurchase of up to $500.0 million of the Company’s common stock. The share repurchase authorization has no expiration date. 4,471,682 shares were repurchased at an average price of $32.64 per share and a total cost of $146.0 million during the first quarter of 2020. The Company did not repurchase any shares under the authorization during the remainder of 2020 and during 2021. The Company’s total remaining available share repurchase authorization as of both December 31, 2021 and 2020 was $354.0 million.
ITEM 6. [RESERVED]
32
EAST WEST BANCORP, INC.
ITEM 7. MANAGEMENT’S DISCUSSION AND ANALYSIS OF FINANCIAL
CONDITION AND RESULTS OF OPERATIONS
TABLE OF CONTENTS
| Page | |||||||||||
33
Overview
The following discussion provides information about the results of operations, financial condition, liquidity and capital resources of the Company, and its subsidiaries, including its subsidiary bank, East West Bank and its subsidiaries. This information is intended to facilitate the understanding and assessment of significant changes and trends related to the Company’s results of operations and financial condition. This discussion and analysis should be read in conjunction with the Consolidated Financial Statements and the accompanying notes presented elsewhere in this Form 10-K.
The Bank is an independent commercial bank headquartered in California that has a focus on the financial service needs of the Asian-American community. Through over 120 locations in the U.S. and China, the Company provides a full range of consumer and commercial products and services through the following business segments: Consumer and Business Banking and Commercial Banking, with the remaining operations recorded in Other. The Company’s principal activity is lending to and accepting deposits from businesses and individuals. The primary source of revenue is net interest income, which is principally derived from the difference between interest earned on loans and debt securities and interest paid on deposits and other funding sources. As of December 31, 2021, the Company had $60.87 billion in assets and approximately 3,100 full-time equivalent employees.
Coronavirus Disease 2019 Global Pandemic
The Coronavirus Disease 2019 (“COVID-19”) pandemic has created a historic public health crisis and caused unprecedented disruptions to global economies. Although the COVID-19 pandemic continues to present public health challenges, including the emergence of new variants, great progress has been made and continues to be made in containing the virus through vaccination efforts. While these responses have largely mitigated the impact from the COVID-19 pandemic and propelled the U.S. economy to recovery, a resurgence of the pandemic, the adoption and long-term effectiveness of the vaccines, and other factors including the continuing impact on global supply chains may slow down such progress. As a result, we are unable to quantify all the specific impacts, and the extent to which the COVID-19 pandemic may negatively affect our business, financial condition, results of operations, regulatory capital, and liquidity ratios. Throughout the COVID-19 pandemic, the Company has been focused on serving our customers and communities and maintaining the well-being of our employees. The Company has been, and may continue to be, impacted by the pandemic.
On March 11, 2021, President Biden signed the American Rescue Plan Act of 2021 to provide additional relief for individuals and businesses affected by the COVID-19 pandemic, including additional funding for the PPP. The PPP Extension Act of 2021, enacted on March 30, 2021, extended the PPP through May 31, 2021. The Company was a participating lender in the PPP in 2020 and 2021. As of December 31, 2021, the Company had approximately 1,800 PPP loans outstanding with balances totaling $534.2 million, which were recorded in the commercial and industrial (“C&I”) loan portfolio. During 2021, the Company submitted and received SBA approval for the forgiveness of approximately 9,500 PPP loans, totaling $1.93 billion.
The Company also participated in the Board of Governors of the Federal Reserve’s MSLP and funded $233.6 million in MSLP loans as of December 31, 2020. The Company did not fund any MSLP loans in 2021. As part of the MSLP, the related Main Street special purpose vehicle purchased 95% participations in the loans originated. The portion retained by the Company totaled $10.2 million and $9.5 million as of December 31, 2021 and 2020, respectively. The MSLP was terminated on January 8, 2021.
In response to the COVID-19 pandemic, the Company implemented protocols and processes to execute its business resumption plans to protect its employees and support its customers. As state and local governments have relaxed restrictions on temporary business closures, we have started phasing in the return of our corporate associates to the office. As we resume normal operations, our highest priority continues to be the health and safety of our associates and our customers. We have prepared our facilities with employee safety protocols, including badge or key fob access for fully vaccinated associates, personal protection equipment, visual safety reminders related to social distancing and mask requirements, and sanitizing products. The Company continues to monitor the external environment and make changes to its safety protocols as appropriate.
Further discussion of the potential impacts on our business due to the COVID-19 pandemic is provided under Part I, Item 1A. — Risk Factors in this Form 10-K.
34
Our MD&A reviews the financial condition and results of operations of the Company for 2021 and 2020. Some tables include additional periods to comply with disclosure requirements or to illustrate trends in greater depth. When reading the discussion in the MD&A, readers should also refer to the Consolidated Financial Statements and related notes in this Form 10-K. The page locations of specific sections that we refer to are presented in the table of contents. To review our financial condition and results of operations for 2020 and a comparison between 2020 and 2019 results, see Item 7. MD&A of our 2020 Form 10-K filed with the SEC on February 26, 2021.
Financial Review
| ($ and shares in thousands, except per share, and ratio data) | 2021 | 2020 | ||||||||||||
| Summary of operations: | ||||||||||||||
Net interest income before (reversal of) provision for credit losses (1) | $ | 1,531,571 | $ | 1,377,193 | ||||||||||
| Noninterest income | 285,895 | 235,547 | ||||||||||||
| Total revenue | 1,817,466 | 1,612,740 | ||||||||||||
| (Reversal of) provision for credit losses | (35,000) | 210,653 | ||||||||||||
Noninterest expense (2) | 796,089 | 716,322 | ||||||||||||
| Income before income taxes | 1,056,377 | 685,765 | ||||||||||||
| Income tax expense | 183,396 | 117,968 | ||||||||||||
Net income (1)(2) | $ | 872,981 | $ | 567,797 | ||||||||||
| Per common share: | ||||||||||||||
| Basic earnings | $ | 6.16 | $ | 3.99 | ||||||||||
| Diluted earnings | $ | 6.10 | $ | 3.97 | ||||||||||
| Dividends declared | $ | 1.32 | $ | 1.10 | ||||||||||
| Book value | $ | 41.13 | $ | 37.22 | ||||||||||
Non-GAAP tangible common equity per share (3) | $ | 37.79 | $ | 33.85 | ||||||||||
| Weighted-average number of shares outstanding: | ||||||||||||||
| Basic | 141,826 | 142,336 | ||||||||||||
| Diluted | 143,140 | 142,991 | ||||||||||||
| Common shares outstanding at period-end | 141,908 | 141,565 | ||||||||||||
| Performance metrics: | ||||||||||||||
| Return on average assets (“ROA”) | 1.47 | % | 1.16 | % | ||||||||||
| Return on average equity (“ROE”) | 15.70 | % | 11.17 | % | ||||||||||
Return on average non-GAAP tangible equity (3) | 17.24 | % | 12.42 | % | ||||||||||
| Common dividend payout ratio | 21.73 | % | 27.97 | % | ||||||||||
| Net interest margin | 2.72 | % | 2.98 | % | ||||||||||
Efficiency ratio (4) | 43.80 | % | 44.42 | % | ||||||||||
Non-GAAP efficiency ratio (3) | 36.91 | % | 39.30 | % | ||||||||||
| At year end: | ||||||||||||||
| Total assets | $ | 60,870,701 | $ | 52,156,913 | ||||||||||
Total loans (5) | $ | 41,694,416 | $ | 38,392,743 | ||||||||||
| Total deposits | $ | 53,350,532 | $ | 44,862,752 | ||||||||||
(1)Includes $55.2 million and $43.3 million of interest income related to PPP loans in 2021 and 2020, respectively.
(2)2020 includes $10.7 million of recovery related to DC Solar and affiliates (“DC Solar”) tax credit investments, of which $1.1 million was recorded as an impairment recovery. 2020 also includes $8.7 million in extinguishment costs related to assets sold under repurchase agreements (“repurchase agreements”).
(3)For a discussion of non-GAAP tangible common equity per share, return on average non-GAAP tangible equity, and non-GAAP efficiency ratio, refer to Item 7. MD&A — Reconciliation of GAAP to Non-GAAP Financial Measures in this Form 10-K.
(4)The efficiency ratio is noninterest expense divided by total revenue.
(5)Includes $534.2 million and $1.57 billion of PPP loans as of December 31, 2021 and 2020, respectively.
35
The Company’s 2021 net income was $873.0 million, an increase of $305.2 million, or 54%, from 2020 net income of $567.8 million. The increase was driven by higher net interest income and noninterest income, and the reversal of provision for credit losses, partially offset by higher noninterest expense and income tax expense.
Noteworthy items about the Company’s performance for 2021 included:
•Profitability in 2021 expanded substantially, reflecting robust net interest income and fee income growth, efficient expense management, and materially improved asset quality. 2021 ROA was 1.47%, an increase of 31 bps, from 1.16% for 2020. 2021 ROE was 15.70%, an increase of 453 bps, from 11.17% for 2020. 2021 non-GAAP return on average tangible equity was 17.24%, compared with 12.42% for 2020. For additional details, see the reconciliation of non-GAAP measures presented under Item 7. MD&A — Reconciliation of GAAP to Non-GAAP Financial Measures in this Form 10-K.
•The Company’s 2021 net interest income of $1.53 billion grew by $154.4 million, or 11.2%, from 2020 net interest income of $1.38 billion.
•The efficiency ratio was 43.80% and 44.42% for 2021 and 2020, respectively. The non-GAAP efficiency ratio was 36.91% in 2021, an improvement of 239 bps from 39.30% in 2020. The non-GAAP efficiency ratio is adjusted for the amortization of tax credit and other investments, the amortization of core deposit intangibles, and repurchase agreements’ extinguishment cost. For additional details, see the reconciliations of non-GAAP measures presented under Item 7. MD&A — Reconciliation of GAAP to Non-GAAP Financial Measures in this Form 10-K.
•The Company recorded a reversal of provision for credit losses of $35.0 million in 2021, primarily due to an improved macroeconomic outlook, compared with a provision for credit losses of $210.7 million in 2020.
•Total assets reached $60.87 billion, growing by $8.71 billion or 17% year-over-year, primarily reflecting growth in loans and AFS debt securities.
•Total loans reached a record $41.69 billion as of December 31, 2021, growing by $3.30 billion or 9% year-over-year. Loan growth was well-diversified across the Company’s major loan portfolios, including residential mortgage, CRE and C&I.
•Total deposits reached $53.35 billion as of December 31, 2021, growing by $8.49 billion or 19% year-over-year. The growth was primarily driven by noninterest-bearing demand deposits and money market accounts, partially offset by a decrease in time deposits.
•Asset quality metrics improved substantially. Criticized loans totaled $833.1 million as of December 31, 2021, decreasing by $384.4 million or 32% from $1.22 billion as of December 31, 2020. The criticized loans ratio was 2.00% of loans held-for-investment as of December 31, 2021, an improvement of 117 bps from 3.17% as of December 31, 2020. Nonperforming assets were $103.5 million, or 0.17% of total assets, as of December 31, 2021, a decrease of $131.4 million or 56%, from $234.9 million, or 0.45% of total assets, as of December 31, 2020.
Results of Operations
Net Interest Income
The Company’s primary source of revenue is net interest income, which is the interest income earned on interest-earning assets less interest expense paid on interest-bearing liabilities. Net interest margin is the ratio of net interest income to average interest-earning assets. Net interest income and net interest margin are impacted by several factors, including changes in average balances and the composition of interest-earning assets and funding sources, market interest rate fluctuations and the slope of the yield curve, repricing characteristics and maturity of interest-earning assets and interest-bearing liabilities, the volume of noninterest-bearing sources of funds and asset quality.
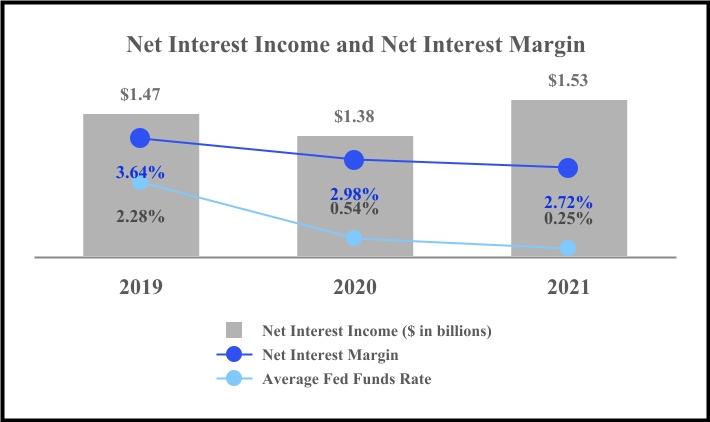
36
2021 net interest income before provision for credit losses was $1.53 billion, an increase of $154.4 million or 11%, compared with $1.38 billion in 2020. The year-over year growth in net interest income was primarily driven by a decrease in interest expense, reflecting a lower cost of funds, and an increase in interest income from AFS debt securities due to average balance growth, partially offset by a decrease in interest income from loans, reflecting lower loan yields. Net interest margin for 2021 was 2.72%, a decrease of 26 basis points (“bps”) from 2.98% in 2020. The year-over year net interest margin compression primarily reflected lower yields on earning assets, a change in the interest-earning assets mix in favor of more lower-yielding assets, partially offset by lower cost of funds.

Average interest-earning assets were $56.26 billion in 2021, an increase of $10.02 billion or 22% from $46.24 billion in 2020. The increase in average interest-earning assets was due to growth in the average balances of AFS debt securities, loans, interest-bearing cash and deposits with banks, and resale agreements. The growth in AFS debt securities, loans, and resale agreements reflected the Company’s deployment of excess cash.
The yield on average interest-earning assets for 2021 was 2.88%, a decrease of 57 bps from 3.45% in 2020. The year-over-year yield compression reflected lower yields on interest-earning assets in response to the low interest rate environment.
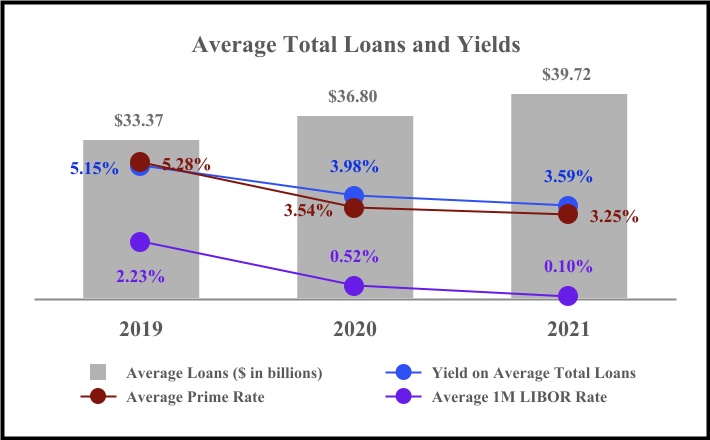
37
The average loan yield for 2021 was 3.59%, a decrease of 39 bps from 3.98% in 2020. Excluding the impact of PPP loans, the adjusted average loan yield was 3.57%, a decrease of 43 bps from 4.00% in 2020. For additional details, see the reconciliations of non-GAAP measures presented under Item 7. MD&A — Reconciliation of GAAP to Non-GAAP Financial Measures in this Form 10-K. Approximately 66% and 65% of loans held-for-investment were variable-rate or hybrid loans in their adjustable rate period as of December 31, 2021 and 2020, respectively.
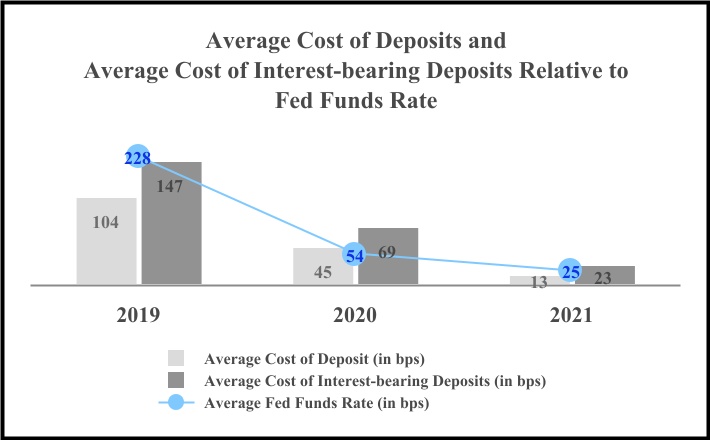
Deposits are an important source of funds and impact both net interest income and net interest margin. The average cost of deposits was 0.13% in 2021, a 32 bps decrease from 0.45% in 2020. The year-over-year decrease reflected a lower interest rate environment in 2021, the year-over-year run-off of higher-cost time deposits, and a higher proportion of noninterest-bearing demand deposits in the deposit mix. Noninterest-bearing demand deposits comprised 41% of average total deposits in 2021, compared with 34% in 2020. Time deposits comprised 16% of average total deposits in 2021, compared with 23% in 2020. The average cost of interest-bearing deposits decreased 46 bps to 0.23% in 2021, from 0.69% in 2020.
The average cost of funds in 2021 was 0.17%, a decrease of 34 bps from 0.51% in 2020. The decrease in the average cost of funds reflected the lower cost of deposits, as well as decreases in the cost of other funding sources due to changes in the interest rate environment. Other sources of funding primarily consist of FHLB advances, repurchase agreements, long-term debt and short-term borrowings.
The Company utilizes various tools to manage interest rate risk. Refer to the Interest Rate Risk Management section of Item 7. MD&A — Risk Management — Market Risk Management for details.
38
The following table presents the interest spread, net interest margin, average balances, interest income and expense, and the average yield/rate by asset and liability component in 2021, 2020 and 2019:
| ($ in thousands) | Year Ended December 31, | |||||||||||||||||||||||||||||||||||||||||||||||||||||||
| 2021 | 2020 | 2019 | ||||||||||||||||||||||||||||||||||||||||||||||||||||||
| Average Balance | Interest | Average Yield/ Rate | Average Balance | Interest | Average Yield/ Rate | Average Balance | Interest | Average Yield/ Rate | ||||||||||||||||||||||||||||||||||||||||||||||||
| ASSETS | ||||||||||||||||||||||||||||||||||||||||||||||||||||||||
| Interest-earning assets: | ||||||||||||||||||||||||||||||||||||||||||||||||||||||||
Interest-bearing cash and deposits with banks | $ | 6,071,896 | $ | 15,531 | 0.26 | % | $ | 4,236,430 | $ | 25,175 | 0.59 | % | $ | 3,050,954 | $ | 66,518 | 2.18 | % | ||||||||||||||||||||||||||||||||||||||
Assets purchased under resale agreements (“resale agreements”) (1) | 2,107,157 | 32,239 | 1.53 | % | 1,101,434 | 21,389 | 1.94 | % | 969,384 | 28,061 | 2.89 | % | ||||||||||||||||||||||||||||||||||||||||||||
AFS debt securities (2)(3) | 8,281,234 | 143,983 | 1.74 | % | 4,023,668 | 82,553 | 2.05 | % | 2,850,476 | 67,838 | 2.38 | % | ||||||||||||||||||||||||||||||||||||||||||||
Loans (4)(5) | 39,716,697 | 1,424,900 | 3.59 | % | 36,799,017 | 1,464,382 | 3.98 | % | 33,373,136 | 1,717,415 | 5.15 | % | ||||||||||||||||||||||||||||||||||||||||||||
Restricted equity securities | 79,404 | 2,081 | 2.62 | % | 79,160 | 1,543 | 1.95 | % | 76,854 | 2,468 | 3.21 | % | ||||||||||||||||||||||||||||||||||||||||||||
Total interest-earning assets | $ | 56,256,388 | $ | 1,618,734 | 2.88 | % | $ | 46,239,709 | $ | 1,595,042 | 3.45 | % | $ | 40,320,804 | $ | 1,882,300 | 4.67 | % | ||||||||||||||||||||||||||||||||||||||
| Noninterest-earning assets: | ||||||||||||||||||||||||||||||||||||||||||||||||||||||||
| Cash and due from banks | 615,255 | 528,406 | 471,060 | |||||||||||||||||||||||||||||||||||||||||||||||||||||
| Allowance for loan losses | (592,211) | (577,560) | (330,125) | |||||||||||||||||||||||||||||||||||||||||||||||||||||
| Other assets | 2,971,659 | 2,747,238 | 2,023,146 | |||||||||||||||||||||||||||||||||||||||||||||||||||||
| Total assets | $ | 59,251,091 | $ | 48,937,793 | $ | 42,484,885 | ||||||||||||||||||||||||||||||||||||||||||||||||||
| LIABILITIES AND STOCKHOLDERS’ EQUITY | ||||||||||||||||||||||||||||||||||||||||||||||||||||||||
| Interest-bearing liabilities: | ||||||||||||||||||||||||||||||||||||||||||||||||||||||||
| Checking deposits | $ | 6,543,817 | $ | 13,023 | 0.20 | % | $ | 5,357,934 | $ | 24,213 | 0.45 | % | $ | 5,244,867 | $ | 58,168 | 1.11 | % | ||||||||||||||||||||||||||||||||||||||
| Money market deposits | 12,428,025 | 15,041 | 0.12 | % | 9,881,284 | 42,720 | 0.43 | % | 8,220,236 | 111,081 | 1.35 | % | ||||||||||||||||||||||||||||||||||||||||||||
| Saving deposits | 2,746,933 | 7,496 | 0.27 | % | 2,234,913 | 6,398 | 0.29 | % | 2,118,060 | 9,626 | 0.45 | % | ||||||||||||||||||||||||||||||||||||||||||||
| Time deposits | 8,493,511 | 33,599 | 0.40 | % | 9,465,608 | 111,411 | 1.18 | % | 9,961,289 | 196,927 | 1.98 | % | ||||||||||||||||||||||||||||||||||||||||||||
| Short-term borrowings | 1,584 | 42 | 2.65 | % | 108,398 | 1,504 | 1.39 | % | 44,881 | 1,763 | 3.93 | % | ||||||||||||||||||||||||||||||||||||||||||||
| FHLB advances | 404,789 | 6,881 | 1.70 | % | 664,370 | 13,792 | 2.08 | % | 592,257 | 16,697 | 2.82 | % | ||||||||||||||||||||||||||||||||||||||||||||
Repurchase agreements (1) | 306,845 | 7,999 | 2.61 | % | 350,849 | 11,766 | 3.35 | % | 74,926 | 13,582 | 18.13 | % | ||||||||||||||||||||||||||||||||||||||||||||
Long-term debt and finance lease liabilities | 151,955 | 3,082 | 2.03 | % | 734,921 | (6) | 6,045 | 0.82 | % | 152,445 | 6,643 | 4.36 | % | |||||||||||||||||||||||||||||||||||||||||||
Total interest-bearing liabilities | $ | 31,077,459 | $ | 87,163 | 0.28 | % | $ | 28,798,277 | $ | 217,849 | 0.76 | % | $ | 26,408,961 | $ | 414,487 | 1.57 | % | ||||||||||||||||||||||||||||||||||||||
Noninterest-bearing liabilities and stockholders’ equity: | ||||||||||||||||||||||||||||||||||||||||||||||||||||||||
| Demand deposits | 21,271,410 | 13,823,152 | 10,502,618 | |||||||||||||||||||||||||||||||||||||||||||||||||||||
Accrued expenses and other liabilities | 1,343,010 | 1,234,178 | 812,461 | |||||||||||||||||||||||||||||||||||||||||||||||||||||
| Stockholders’ equity | 5,559,212 | 5,082,186 | 4,760,845 | |||||||||||||||||||||||||||||||||||||||||||||||||||||
Total liabilities and stockholders’ equity | $ | 59,251,091 | $ | 48,937,793 | $ | 42,484,885 | ||||||||||||||||||||||||||||||||||||||||||||||||||
| Interest rate spread | 2.60 | % | 2.69 | % | 3.10 | % | ||||||||||||||||||||||||||||||||||||||||||||||||||
Net interest income and net interest margin | $ | 1,531,571 | 2.72 | % | $ | 1,377,193 | 2.98 | % | $ | 1,467,813 | 3.64 | % | ||||||||||||||||||||||||||||||||||||||||||||
(1)Average balances of resale and repurchase agreements for the years ended December 31, 2020 and 2019 have been reported net, pursuant to ASC 210-20-45-11, Balance Sheet Offsetting: Repurchase and Reverse Repurchase Agreements. The weighted-average yields of gross resale agreements were 1.94% and 2.66% for 2020 and 2019, respectively. The weighted-average interest rates of gross repurchase agreements were 3.25% and 4.74% for 2020 and 2019, respectively.
(2)Yields on tax-exempt securities are not presented on a tax-equivalent basis.
(3)Includes the amortization of premiums on debt securities of $92.8 million, $33.9 million and $10.9 million for 2021, 2020 and 2019, respectively.
(4)Average balances include nonperforming loans and loans held-for-sale.
(5)Loans include the accretion of net deferred loan fees, unearned fees and amortization of premiums, which totaled $61.7 million, $52.4 million and $36.8 million for 2021, 2020 and 2019, respectively.
(6)Primarily includes average balances of PPPLF, which was repaid in full during the fourth quarter of 2020.
39
The following table summarizes the extent to which changes in (1) interest rates; and (2) volume of average interest-earning assets and average interest-bearing liabilities affected the Company’s net interest income for the periods presented. The total change for each category of interest-earning assets and interest-bearing liabilities is segmented into changes attributable to variations in volume and yield/rate. Changes that are not solely due to either volume or yield/rate are allocated proportionally based on the absolute value of the change related to average volume and average rate.
| ($ in thousands) | Year Ended December 31, | |||||||||||||||||||||||||||||||||||||
| 2021 vs. 2020 | 2020 vs. 2019 | |||||||||||||||||||||||||||||||||||||
| Total Change | Changes Due to | Total Change | Changes Due to | |||||||||||||||||||||||||||||||||||
| Volume | Yield/Rate | Volume | Yield/Rate | |||||||||||||||||||||||||||||||||||
| Interest-earning assets: | ||||||||||||||||||||||||||||||||||||||
| Interest-bearing cash and deposits with banks | $ | (9,644) | $ | 8,223 | $ | (17,867) | $ | (41,343) | $ | 19,300 | $ | (60,643) | ||||||||||||||||||||||||||
| Resale agreements | 10,850 | 16,168 | (5,318) | (6,672) | 3,454 | (10,126) | ||||||||||||||||||||||||||||||||
| AFS debt securities | 61,430 | 75,704 | (14,274) | 14,715 | 25,037 | (10,322) | ||||||||||||||||||||||||||||||||
| Loans | (39,482) | 111,007 | (150,489) | (253,033) | 163,842 | (416,875) | ||||||||||||||||||||||||||||||||
| Restricted equity securities | 538 | 5 | 533 | (925) | 72 | (997) | ||||||||||||||||||||||||||||||||
| Total interest and dividend income | $ | 23,692 | $ | 211,107 | $ | (187,415) | $ | (287,258) | $ | 211,705 | $ | (498,963) | ||||||||||||||||||||||||||
| Interest-bearing liabilities: | ||||||||||||||||||||||||||||||||||||||
| Checking deposits | $ | (11,190) | $ | 4,509 | $ | (15,699) | $ | (33,955) | $ | 1,228 | $ | (35,183) | ||||||||||||||||||||||||||
| Money market deposits | (27,679) | 8,921 | (36,600) | (68,361) | 18,949 | (87,310) | ||||||||||||||||||||||||||||||||
| Saving deposits | 1,098 | 1,409 | (311) | (3,228) | 506 | (3,734) | ||||||||||||||||||||||||||||||||
| Time deposits | (77,812) | (10,424) | (67,388) | (85,516) | (9,365) | (76,151) | ||||||||||||||||||||||||||||||||
| Short-term borrowings | (1,462) | (2,184) | 722 | (259) | 1,387 | (1,646) | ||||||||||||||||||||||||||||||||
| FHLB advances | (6,911) | (4,722) | (2,189) | (2,905) | 1,864 | (4,769) | ||||||||||||||||||||||||||||||||
| Repurchase agreements | (3,767) | (1,357) | (2,410) | (1,816) | 16,640 | (18,456) | ||||||||||||||||||||||||||||||||
| Long-term debt and finance lease liabilities | (2,963) | (7,263) | 4,300 | (598) | 8,397 | (8,995) | ||||||||||||||||||||||||||||||||
| Total interest expense | $ | (130,686) | $ | (11,111) | $ | (119,575) | $ | (196,638) | $ | 39,606 | $ | (236,244) | ||||||||||||||||||||||||||
| Change in net interest income | $ | 154,378 | $ | 222,218 | $ | (67,840) | $ | (90,620) | $ | 172,099 | $ | (262,719) | ||||||||||||||||||||||||||
Noninterest Income
The following table presents the components of noninterest income for the periods indicated:
| ($ in thousands) | Year Ended December 31, | |||||||||||||||||||||||||
| 2021 | 2020 | Change from 2020 % | 2019 | |||||||||||||||||||||||
| Lending fees | $ | 77,704 | $ | 74,842 | 4 | % | $ | 63,670 | ||||||||||||||||||
| Deposit account fees | 71,261 | 48,148 | 48 | % | 38,648 | |||||||||||||||||||||
| Interest rate contracts and other derivative income | 22,913 | 31,685 | (28) | % | 39,865 | |||||||||||||||||||||
| Foreign exchange income | 48,977 | 22,370 | 119 | % | 26,398 | |||||||||||||||||||||
| Wealth management fees | 25,751 | 17,494 | 47 | % | 16,547 | |||||||||||||||||||||
| Net gains on sales of loans | 8,909 | 4,501 | 98 | % | 4,035 | |||||||||||||||||||||
| Gains on sales of AFS debt securities | 1,568 | 12,299 | (87) | % | 3,930 | |||||||||||||||||||||
| Other investment income | 16,852 | 10,641 | 58 | % | 18,117 | |||||||||||||||||||||
| Other income | 11,960 | 13,567 | (12) | % | 11,035 | |||||||||||||||||||||
| Total noninterest income | $ | 285,895 | $ | 235,547 | 21 | % | $ | 222,245 | ||||||||||||||||||
Noninterest income comprised 16% and 15% of total revenue in 2021 and 2020, respectively. 2021 noninterest income was $285.9 million, an increase of $50.4 million or 21%, compared with $235.5 million in 2020. This increase was primarily due to increases in foreign exchange income, deposit account fees, wealth management fees, and other investment income, partially offset by decreases in gains on sales of AFS debt securities, and interest rate contracts and other derivative income.
40
Deposit account fees were $71.3 million in 2021, an increase of $23.2 million or 48%, compared with $48.1 million in 2020. This increase primarily reflected higher treasury management and deposit-related fees resulting from commercial deposit growth.
Interest rate contracts and other derivative income was $22.9 million in 2021, a decrease of $8.8 million or 28%, compared with $31.7 million in 2020. This decrease was primarily due to a lower volume of customer-driven transactions, partially offset by favorable credit valuation adjustments.
Foreign exchange income was $49.0 million in 2021, an increase of $26.6 million or 119%, compared with $22.4 million in 2020. This increase primarily reflected new customer acquisitions and growth in customer-driven transactions.
Wealth management fees were $25.8 million in 2021, an increase of $8.3 million or 47%, compared with $17.5 million in 2020. This increase primarily reflected growth in customer transactions.
Gains on sales of AFS debt securities were $1.6 million in 2021, a decrease of $10.7 million or 87%, compared with $12.3 million in 2020. This decrease reflected a lower volume of AFS debt securities sold.
Other investment income was $16.9 million in 2021, an increase of $6.3 million or 58%, compared with $10.6 million in 2020. This increase primarily reflected higher earnings from equity method investments, partially offset by lower distributions from affordable housing partnership investments.
Noninterest Expense
The following table presents the components of noninterest expense for the periods indicated:
| ($ in thousands) | Year Ended December 31, | |||||||||||||||||||||||||
| 2021 | 2020 | Change from 2020 % | 2019 | |||||||||||||||||||||||
| Compensation and employee benefits | $ | 433,728 | $ | 404,071 | 7 | % | $ | 401,700 | ||||||||||||||||||
| Occupancy and equipment expense | 62,996 | 66,489 | (5) | % | 69,730 | |||||||||||||||||||||
| Deposit insurance premiums and regulatory assessments | 17,563 | 15,128 | 16 | % | 12,928 | |||||||||||||||||||||
| Deposit account expense | 16,152 | 13,530 | 19 | % | 14,175 | |||||||||||||||||||||
| Data processing | 16,263 | 16,603 | (2) | % | 13,533 | |||||||||||||||||||||
| Computer software expense | 30,600 | 29,033 | 5 | % | 26,471 | |||||||||||||||||||||
| Consulting expense | 6,517 | 5,391 | 21 | % | 9,846 | |||||||||||||||||||||
| Legal expense | 8,015 | 7,766 | 3 | % | 8,441 | |||||||||||||||||||||
| Other operating expense | 81,798 | 79,489 | 3 | % | 92,249 | |||||||||||||||||||||
| Amortization of tax credit and other investments | 122,457 | 70,082 | 75 | % | 98,383 | |||||||||||||||||||||
| Repurchase agreements’ extinguishment cost | — | 8,740 | (100) | % | — | |||||||||||||||||||||
| Total noninterest expense | $ | 796,089 | $ | 716,322 | 11 | % | $ | 747,456 | ||||||||||||||||||
2021 noninterest expense was $796.1 million, an increase of $79.8 million or 11%, compared with $716.3 million in 2020. This increase primarily reflected higher amortization of tax credit and other investments, and compensation and employee benefits.
Compensation and employee benefits were $433.7 million in 2021, an increase of $29.6 million or 7%, compared with $404.1 million in 2020. This increase primarily reflected higher bonuses.
Amortization of tax credit and other investments was $122.5 million in 2021, an increase of $52.4 million or 75%, compared with $70.1 million in 2020. This increase was primarily due to a higher number of new tax credit investments in 2021 and the timing of tax credit recognition in each period, based on when tax credit projects were put into service.
During the second quarter of 2020, the Company prepaid $150.0 million of repurchase agreements and incurred a debt extinguishment cost of $8.7 million. No such expense was incurred in 2021.
41
Income Taxes
| ($ in thousands) | Year Ended December 31, | |||||||||||||||||||
| 2021 | 2020 | 2019 | ||||||||||||||||||
| Income before income taxes | $ | 1,056,377 | $ | 685,765 | $ | 843,917 | ||||||||||||||
| Income tax expense | $ | 183,396 | $ | 117,968 | $ | 169,882 | ||||||||||||||
| Effective tax rate | 17.4 | % | 17.2 | % | 20.1 | % | ||||||||||||||
Income tax expense was $183.4 million for the year ended December 31, 2021, an increase of $65.4 million, compared with income tax expense of $118.0 million for the year ended December 31, 2020. The year-over-year increase in income tax expense was predominantly driven by higher level of income before income taxes. 2021 effective tax rate was 17.4%, compared with 2020 effective tax rate of 17.2%.
Operating Segment Results
The Company organizes its operations into three reportable operating segments: (1) Consumer and Business Banking; (2) Commercial Banking; and (3) Other. These segments are defined by the type of customers served and the related products and services provided. The segments reflect how financial information is currently evaluated by management. For an additional description of the Company’s internal management reporting process, including the segment cost allocation methodology, see Note 17 — Business Segments to the Consolidated Financial Statements in this Form 10-K.
Segment net interest income represents the difference between actual interest earned on assets and interest incurred on liabilities of the segment, adjusted for funding charges or credits through the Company’s internal funds transfer pricing (“FTP”) process.
The following table presents the results by operating segment for the periods indicated:
| ($ in thousands) | Year Ended December 31, | |||||||||||||||||||||||||||||||||||||||||||||||||||||||
| Consumer and Business Banking | Commercial Banking | Other | ||||||||||||||||||||||||||||||||||||||||||||||||||||||
| 2021 | 2020 | 2019 | 2021 | 2020 | 2019 | 2021 | 2020 | 2019 | ||||||||||||||||||||||||||||||||||||||||||||||||
Total revenue (1) | $ | 791,226 | $ | 594,944 | $ | 753,789 | $ | 929,970 | $ | 848,623 | $ | 786,718 | $ | 96,270 | $ | 169,173 | $ | 149,551 | ||||||||||||||||||||||||||||||||||||||
| (Reversal of) provision for credit losses | (4,998) | 3,885 | 14,178 | (30,002) | 206,768 | 84,507 | — | — | — | |||||||||||||||||||||||||||||||||||||||||||||||
| Noninterest expense | 364,635 | 331,750 | 343,001 | 271,408 | 266,923 | 263,064 | 160,046 | 117,649 | 141,391 | |||||||||||||||||||||||||||||||||||||||||||||||
Segment income (loss) before income taxes (1) | 431,589 | 259,309 | 396,610 | 688,564 | 374,932 | 439,147 | (63,776) | 51,524 | 8,160 | |||||||||||||||||||||||||||||||||||||||||||||||
Segment net income (1) | $ | 308,630 | $ | 185,782 | $ | 283,674 | $ | 492,271 | $ | 268,476 | $ | 314,321 | $ | 72,080 | $ | 113,539 | $ | 76,040 | ||||||||||||||||||||||||||||||||||||||
(1)During the fourth quarter of 2021, the Company enhanced its segment allocation methodology related to the fair values of interest rate and commodity derivative contracts, which are included in noninterest income. These fair values that were previously allocated to the “Commercial Banking” segment, have been reclassified between “Consumer and Business Banking” and “Commercial Banking.” Prior years’ balances have been reclassified to conform to the 2021 presentation.
Consumer and Business Banking
The Consumer and Business Banking segment primarily provides financial products and services to consumer and commercial customers through the Company’s domestic branch network and digital banking platform. This segment offers consumer and commercial deposits, mortgage and home equity loans, and other products and services. It also originates commercial loans for small- and medium-sized enterprises. Other products and services provided by this segment include wealth management, treasury management, interest rate risk hedging, and foreign exchange services.
42
The following table presents additional financial information for the Consumer and Business Banking segment for the periods indicated:
| ($ in thousands) | Year Ended December 31, | |||||||||||||||||||||||||||||||
| Change from 2020 | ||||||||||||||||||||||||||||||||
| 2021 | 2020 | $ | % | 2019 | ||||||||||||||||||||||||||||
| Net interest income before (reversal of) provision for credit losses | $ | 697,101 | $ | 530,829 | $ | 166,272 | 31 | % | $ | 696,551 | ||||||||||||||||||||||
Noninterest income (1) | 94,125 | 64,115 | 30,010 | 47 | % | 57,238 | ||||||||||||||||||||||||||
Total revenue (1) | 791,226 | 594,944 | 196,282 | 33 | % | 753,789 | ||||||||||||||||||||||||||
| (Reversal of) provision for credit losses | (4,998) | 3,885 | (8,883) | (229) | % | 14,178 | ||||||||||||||||||||||||||
| Noninterest expense | 364,635 | 331,750 | 32,885 | 10 | % | 343,001 | ||||||||||||||||||||||||||
Segment income before income taxes (1) | 431,589 | 259,309 | 172,280 | 66 | % | 396,610 | ||||||||||||||||||||||||||
| Income tax expense | 122,959 | 73,527 | 49,432 | 67 | % | 112,936 | ||||||||||||||||||||||||||
Segment net income (1) | $ | 308,630 | $ | 185,782 | $ | 122,848 | 66 | % | $ | 283,674 | ||||||||||||||||||||||
| Average loans | $ | 13,922,693 | $ | 12,056,987 | $ | 1,865,706 | 15 | % | $ | 10,647,814 | ||||||||||||||||||||||
| Average deposits | $ | 31,679,856 | $ | 27,201,737 | $ | 4,478,119 | 16 | % | $ | 25,124,827 | ||||||||||||||||||||||
(1)During the fourth quarter of 2021, the Company enhanced its segment allocation methodology related to the fair values of interest rate and commodity derivative contracts, which are included in noninterest income. These fair values that were previously allocated to the “Commercial Banking” segment, have been reclassified between “Consumer and Business Banking” and “Commercial Banking.” Prior years’ balances have been reclassified to conform to the 2021 presentation.
Consumer and Business Banking segment net income increased $122.8 million or 66% year-over-year to $308.6 million in 2021, due to revenue growth and a lower provision for credit losses, partially offset by higher income tax expense and noninterest expense. Net interest income before (reversal of) provision for credit losses increased $166.3 million, or 31%, to $697.1 million, driven by higher interest income, primarily due to growth in residential mortgage loans, and lower interest expense, primarily due to lower interest rates and growth in noninterest-bearing demand deposits. Noninterest income increased $30.0 million, or 47%, to $94.1 million, primarily driven by higher deposit account fees, foreign exchange income and wealth management fees, reflecting growth in customer-driven transactions. Noninterest expense increased $32.9 million, or 10%, to $364.6 million, primarily due to higher allocated corporate overhead expense, and compensation and employee benefits.
Commercial Banking
The Commercial Banking segment primarily offers commercial loan and deposit products. Commercial loan products include commercial real estate lending, construction finance, working capital lines of credit, trade finance, letters of credit, commercial business lending, affordable housing lending, asset-based lending, asset-backed finance, project finance and equipment financing. Commercial deposit products and other financial services include treasury management, foreign exchange services, and interest rate and commodity risk hedging.
43
The following table presents additional financial information for the Commercial Banking segment for the periods indicated:
| ($ in thousands) | Year Ended December 31, | |||||||||||||||||||||||||||||||
| Change from 2020 | ||||||||||||||||||||||||||||||||
| 2021 | 2020 | $ | % | 2019 | ||||||||||||||||||||||||||||
| Net interest income before (reversal of) provision for credit losses | $ | 766,202 | $ | 706,286 | $ | 59,916 | 8 | % | $ | 651,413 | ||||||||||||||||||||||
Noninterest income (1) | 163,768 | 142,337 | 21,431 | 15 | % | 135,305 | ||||||||||||||||||||||||||
Total revenue (1) | 929,970 | 848,623 | 81,347 | 10 | % | 786,718 | ||||||||||||||||||||||||||
| (Reversal of) provision for credit losses | (30,002) | 206,768 | (236,770) | (115) | % | 84,507 | ||||||||||||||||||||||||||
| Noninterest expense | 271,408 | 266,923 | 4,485 | 2 | % | 263,064 | ||||||||||||||||||||||||||
Segment income before income taxes (1) | 688,564 | 374,932 | 313,632 | 84 | % | 439,147 | ||||||||||||||||||||||||||
| Income tax expense | 196,293 | 106,456 | 89,837 | 84 | % | 124,826 | ||||||||||||||||||||||||||
Segment net income (1) | $ | 492,271 | $ | 268,476 | $ | 223,795 | 83 | % | $ | 314,321 | ||||||||||||||||||||||
| Average loans | $ | 25,794,004 | $ | 24,742,030 | $ | 1,051,974 | 4 | % | $ | 22,725,322 | ||||||||||||||||||||||
| Average deposits | $ | 17,122,743 | $ | 10,811,020 | $ | 6,311,723 | 58 | % | $ | 8,591,285 | ||||||||||||||||||||||
(1)During the fourth quarter of 2021, the Company enhanced its segment allocation methodology related to the fair values of interest rate and commodity derivative contracts, which are included in noninterest income. These fair values that were previously allocated to the “Commercial Banking” segment, have been reclassified between “Consumer and Business Banking” and “Commercial Banking.” Prior years’ balances have been reclassified to conform to the 2021 presentation.
Commercial Banking segment net income increased $223.8 million or 83% year-over-year to $492.3 million in 2021, reflecting a lower provision for credit losses and higher revenue, partially offset by increased income tax expense and noninterest expense. Net interest income before (reversal of) provision for credit losses increased $59.9 million, or 8%, to $766.2 million, driven by lower interest expense, primarily due to lower interest rates and growth in noninterest-bearing demand deposits. Noninterest income increased $21.4 million, or 15%, to $163.8 million, primarily driven by higher foreign exchange income, deposit account fees and net gains on sales of loans, partially offset by lower interest rate contracts and other derivative income.
Other
Centralized functions, including the corporate treasury activities of the Company and eliminations of inter-segment amounts, have been aggregated and included in the Other segment, which provides broad administrative support to the two core segments, namely the Consumer and Business Banking and the Commercial Banking segments.
The following table presents additional financial information for the Other segment for the periods indicated:
| ($ in thousands) | Year Ended December 31, | |||||||||||||||||||||||||||||||
| Change from 2020 | ||||||||||||||||||||||||||||||||
| 2021 | 2020 | $ | % | 2019 | ||||||||||||||||||||||||||||
| Net interest income before provision for credit losses | $ | 68,268 | $ | 140,078 | $ | (71,810) | (51) | % | $ | 119,849 | ||||||||||||||||||||||
| Noninterest income | 28,002 | 29,095 | (1,093) | (4) | % | 29,702 | ||||||||||||||||||||||||||
| Total revenue | 96,270 | 169,173 | (72,903) | (43) | % | 149,551 | ||||||||||||||||||||||||||
| Noninterest expense | 160,046 | 117,649 | 42,397 | 36 | % | 141,391 | ||||||||||||||||||||||||||
| Segment (loss) income before income taxes | (63,776) | 51,524 | (115,300) | (224) | % | 8,160 | ||||||||||||||||||||||||||
| Income tax benefit | (135,856) | (62,015) | (73,841) | 119 | % | (67,880) | ||||||||||||||||||||||||||
| Segment net income | $ | 72,080 | $ | 113,539 | $ | (41,459) | (37) | % | $ | 76,040 | ||||||||||||||||||||||
| Average deposits | $ | 2,681,097 | $ | 2,750,134 | $ | (69,037) | (3) | % | $ | 2,330,958 | ||||||||||||||||||||||
Other segment net income decreased $41.4 million or 37% year-over-year to $72.1 million in 2021, primarily driven by lower revenue and higher noninterest expense, partially offset by an increased income tax benefit. Net interest income before provision for credit losses decreased $71.8 million, or 51%, to $68.3 million. The decrease was primarily driven by lower FTP spread income absorbed by the Other segment, partially offset by an increase in interest income from investments due to a higher volume of AFS debt securities, and lower interest expense from borrowings. Noninterest expense increased $42.4 million, or 36%, to $160.0 million, primarily due to higher amortization of tax credits and other investments.
44
Balance Sheet Analysis
Debt Securities
The Company maintains a portfolio of high quality and liquid debt securities with a moderate duration profile. It closely manages the overall portfolio interest rate and liquidity risks. The Company’s debt securities provide:
•interest income for earnings and yield enhancement;
•availability for funding needs arising during the normal course of business;
•the ability to execute interest rate risk management strategies in response to changes in economic or market conditions; and
•collateral to support pledging agreements as required and/or to enhance the Company’s borrowing capacity.
Available-for-Sale Debt Securities
Debt securities classified as AFS are carried at their fair value with the corresponding changes in fair value recorded in Accumulated other comprehensive income (loss), net of tax, as a component of Stockholders’ equity on the Consolidated Balance Sheet.
The following table presents the distribution of the Company’s AFS debt securities portfolio by fair value and percentage of fair value as of December 31, 2021 and 2020, and by credit rating as of December 31, 2021:
| ($ in thousands) | December 31, | Ratings (1) | ||||||||||||||||||||||||||||||||||||||||||||||||
| 2021 | 2020 | As of December 31, 2021 | ||||||||||||||||||||||||||||||||||||||||||||||||
| Fair Value | % of Total | Fair Value | % of Total | AAA/AA | A | BBB | No Rating | |||||||||||||||||||||||||||||||||||||||||||
| AFS debt securities: | ||||||||||||||||||||||||||||||||||||||||||||||||||
| U.S. Treasury securities | $ | 1,032,681 | 10 | % | $ | 50,761 | 1 | % | 100 | % | — | % | — | % | — | % | ||||||||||||||||||||||||||||||||||
| U.S. government agency and U.S. government-sponsored enterprise debt securities | 1,301,971 | 13 | % | 814,319 | 15 | % | 100 | % | — | % | — | % | — | % | ||||||||||||||||||||||||||||||||||||
| U.S. government agency and U.S. government-sponsored enterprise mortgage-backed securities | 4,157,263 | 42 | % | 2,814,664 | 51 | % | 100 | % | — | % | — | % | — | % | ||||||||||||||||||||||||||||||||||||
| Municipal securities | 523,158 | 5 | % | 396,073 | 7 | % | 95 | % | 3 | % | — | % | 2 | % | ||||||||||||||||||||||||||||||||||||
| Non-agency mortgage-backed securities | 1,378,374 | 14 | % | 529,617 | 10 | % | 87 | % | — | % | — | % | 13 | % | ||||||||||||||||||||||||||||||||||||
| Corporate debt securities | 649,665 | 6 | % | 405,968 | 7 | % | — | % | 22 | % | 78 | % | — | % | ||||||||||||||||||||||||||||||||||||
| Foreign government bonds | 257,733 | 3 | % | 182,531 | 3 | % | 45 | % | 55 | % | — | % | — | % | ||||||||||||||||||||||||||||||||||||
| Asset-backed securities | 74,558 | 1 | % | 63,231 | 1 | % | 100 | % | — | % | — | % | — | % | ||||||||||||||||||||||||||||||||||||
| CLOs | 589,950 | 6 | % | 287,494 | 5 | % | 96 | % | 4 | % | — | % | — | % | ||||||||||||||||||||||||||||||||||||
| Total AFS debt securities | $ | 9,965,353 | 100 | % | $ | 5,544,658 | 100 | % | 90 | % | 3 | % | 5 | % | 2 | % | ||||||||||||||||||||||||||||||||||
(1)Primarily based upon the credit ratings issued by S&P, Moody’s Investors Service (“Moody’s”) or Fitch Ratings (“Fitch”), applying the lowest rating, if split rated. Rating percentages are allocated based on fair value.
The fair value of AFS debt securities totaled $9.97 billion as of December 31, 2021, an increase of $4.42 billion or 80% from $5.54 billion as of December 31, 2020. The largest net change came from U.S. government agency and U.S. government-sponsored enterprise mortgage-backed securities, which increased $1.34 billion, followed by U.S. Treasury securities, which increased $981.9 million, and non-agency mortgage-backed securities, which increased $848.8 million. These changes were mainly driven by purchases during 2021 to deploy cash from deposit growth and to enhance the return of the overall AFS debt securities portfolio.
The Company’s AFS debt securities portfolio had an effective duration, defined as the sensitivity of the value of the portfolio to interest rate changes, of 5.0 as of December 31, 2021. This increased from 4.2 as of December 31, 2020, primarily due to an increase in the target duration of securities purchased to achieve enhancement in portfolio yield, and portfolio duration extension because of the steepening of the yield curve. As of December 31, 2021, 90% of the carrying value of the Company’s debt securities portfolio was rated “AA-” or “Aa3” or higher by nationally recognized credit rating agencies, compared with 88% as of December 31, 2020. Credit ratings of BBB- or higher by S&P and Fitch, or Baa3 or higher by Moody’s, are considered investment grade.
45
The Company’s AFS debt securities are carried at fair value with non-credit related unrealized gains and losses, net of tax, reported in Other comprehensive income (loss) on the Consolidated Statement of Comprehensive Income. Pre-tax net unrealized losses on AFS debt securities were $121.8 million as of December 31, 2021, compared with pre-tax net unrealized gains on AFS debt securities of $74.1 million as of December 31, 2020. This change was primarily due to interest rate movement. As of December 31, 2021, the Company had no intention to sell securities with unrealized losses and believed it is more-likely-than-not that it would not be required to sell such securities before recovery of their amortized costs.
Of the securities with gross unrealized losses, substantially all were rated investment grade as of both December 31, 2021 and 2020. The Company believes that the gross unrealized losses were due to non-credit related factors and were primarily attributable to interest rate movement and widened spreads for certain securities. The Company believes that the credit support levels of the AFS debt securities are strong and, based on current assessments and macroeconomic forecasts, expects that full contractual cash flows will be received, even if near term credit performance is negatively impacted.
The Company assesses individual securities for credit losses for each reporting period. If a credit loss is identified, the Company records an impairment through the allowance for credit losses with a corresponding Provision for credit losses on the Consolidated Statement of Income. There were no credit losses recognized in earnings for both 2021 and 2020. For additional information of the Company’s accounting policies, valuation and composition, see Note 1 — Summary of Significant Accounting Policies, Note 2 — Fair Value Measurement and Fair Value of Financial Instruments, and Note 4 — Securities to the Consolidated Financial Statements in this Form 10-K.
The following table presents the amortized cost and weighted-average yields by contractual maturity distribution, excluding periodic principal payments, of the Company’s AFS debt securities as of December 31, 2021. Actual maturities of certain securities can differ from contractual maturities as the borrowers have the right to prepay obligations with or without prepayment penalties. In addition, factors such as prepayments and interest rates may affect the yields on the carrying values of these securities.
| ($ in thousands) | Within one year | After one year through five years | After five years through ten years | After ten years | Total | |||||||||||||||||||||||||||||||||||||||||||||||||||||||||
| Amortized Cost | Yield(1) | Amortized Cost | Yield(1) | Amortized Cost | Yield (1) | Amortized Cost | Yield (1) | Amortized Cost | Yield (1) | |||||||||||||||||||||||||||||||||||||||||||||||||||||
| AFS debt securities: | ||||||||||||||||||||||||||||||||||||||||||||||||||||||||||||||
| U.S. Treasury securities | $ | — | — | % | $ | 334,716 | 1.03 | % | $ | 714,522 | 0.98 | % | $ | — | — | % | $ | 1,049,238 | 0.99 | % | ||||||||||||||||||||||||||||||||||||||||||
| U.S. government agency and U.S. government-sponsored enterprise debt securities | 1,190,108 | 1.72 | % | 60,604 | 2.20 | % | 32,370 | 1.70 | % | 50,902 | 2.40 | % | 1,333,984 | 1.77 | % | |||||||||||||||||||||||||||||||||||||||||||||||
| U.S. government agency and U.S. government-sponsored enterprise mortgage-backed securities: | 6,296 | 2.33 | % | 18,267 | 2.77 | % | 293,792 | 2.18 | % | 3,892,477 | 1.67 | % | 4,210,832 | 1.71 | % | |||||||||||||||||||||||||||||||||||||||||||||||
Municipal securities (2) | 9,376 | 2.30 | % | 34,402 | 2.54 | % | 236,449 | 2.21 | % | 239,154 | 2.04 | % | 519,381 | 2.16 | % | |||||||||||||||||||||||||||||||||||||||||||||||
| Non-agency mortgage-backed securities | 11,929 | 2.91 | % | 177,392 | 3.12 | % | 49,584 | 1.17 | % | 1,149,952 | 1.96 | % | 1,388,857 | 2.09 | % | |||||||||||||||||||||||||||||||||||||||||||||||
| Corporate debt securities | 180,013 | 1.80 | % | 441,003 | 3.24 | % | 36,500 | 2.61 | % | — | — | % | 657,516 | 2.81 | % | |||||||||||||||||||||||||||||||||||||||||||||||
| Foreign government bonds | 84,994 | 1.30 | % | 125,453 | 2.41 | % | 50,000 | 0.42 | % | — | — | % | 260,447 | 1.67 | % | |||||||||||||||||||||||||||||||||||||||||||||||
| Asset-backed securities: | — | — | % | — | — | % | — | — | % | 74,674 | 0.85 | % | 74,674 | 0.85 | % | |||||||||||||||||||||||||||||||||||||||||||||||
| CLOs | — | — | % | — | — | % | — | — | % | 592,250 | 1.27 | % | 592,250 | 1.27 | % | |||||||||||||||||||||||||||||||||||||||||||||||
| Total AFS debt securities | $ | 1,482,716 | 1.72 | % | $ | 1,191,837 | 2.43 | % | $ | 1,413,217 | 1.48 | % | $ | 5,999,409 | 1.70 | % | $ | 10,087,179 | 1.76 | % | ||||||||||||||||||||||||||||||||||||||||||
(1)Weighted-average yields are computed based on amortized cost balances.
(2)Yields on tax-exempt securities are not presented on a tax-equivalent basis.
46
Loan Portfolio
The Company offers a broad range of financial products designed to meet the credit needs of its borrowers. The Company’s loan portfolio segments include commercial loans, which consist of C&I, CRE, multifamily residential, and construction and land loans; and consumer loans, which consist of single-family residential, home equity lines of credit (“HELOCs”) and other consumer loans. Total net loans were $41.15 billion as of December 31, 2021, an increase of $3.38 billion or 9% from $37.77 billion as of December 31, 2020. This was primarily driven by well-diversified growth throughout our major loan categories including $1.45 billion or 15% in residential mortgage loans, $1.37 billion or 9% in total CRE loans, and $518.9 million or 4% in C&I loans. Excluding PPP loans, total net loans grew $4.41 billion or 12%, and C&I loans grew $1.55 billion or 13% year-over-year. The composition of the loan portfolio as of December 31, 2021 was similar to the composition as of December 31, 2020.
The following table presents the composition of the Company’s total loan portfolio by loan type as of December 31, 2021 and 2020:
| ($ in thousands) | December 31, | |||||||||||||||||||||||||
| 2021 | 2020 | |||||||||||||||||||||||||
| Amount | % | Amount | % | |||||||||||||||||||||||
| Commercial: | ||||||||||||||||||||||||||
C&I (1) | $ | 14,150,608 | 34 | % | $ | 13,631,726 | 36 | % | ||||||||||||||||||
| CRE: | ||||||||||||||||||||||||||
| CRE | 12,155,047 | 29 | % | 11,174,611 | 29 | % | ||||||||||||||||||||
| Multifamily residential | 3,675,605 | 9 | % | 3,033,998 | 8 | % | ||||||||||||||||||||
| Construction and land | 346,486 | 1 | % | 599,692 | 2 | % | ||||||||||||||||||||
| Total CRE | 16,177,138 | 39 | % | 14,808,301 | 39 | % | ||||||||||||||||||||
| Total commercial | 30,327,746 | 73 | % | 28,440,027 | 75 | % | ||||||||||||||||||||
| Consumer: | ||||||||||||||||||||||||||
| Residential mortgage: | ||||||||||||||||||||||||||
| Single-family residential | 9,093,702 | 22 | % | 8,185,953 | 21 | % | ||||||||||||||||||||
| HELOCs | 2,144,821 | 5 | % | 1,601,716 | 4 | % | ||||||||||||||||||||
| Total residential mortgage | 11,238,523 | 27 | % | 9,787,669 | 25 | % | ||||||||||||||||||||
| Other consumer | 127,512 | 0 | % | 163,259 | 0 | % | ||||||||||||||||||||
| Total consumer | 11,366,035 | 27 | % | 9,950,928 | 25 | % | ||||||||||||||||||||
Total loans held-for-investment (2) | 41,693,781 | 100 | % | 38,390,955 | 100 | % | ||||||||||||||||||||
| Allowance for loan losses | (541,579) | (619,983) | ||||||||||||||||||||||||
Loans held-for-sale (3) | 635 | 1,788 | ||||||||||||||||||||||||
| Total loans, net | $ | 41,152,837 | $ | 37,772,760 | ||||||||||||||||||||||
(1)Includes $534.2 million and $1.57 billion of PPP loans as of December 31, 2021 and 2020, respectively.
(2)Includes net deferred loan fees, unearned fees, unamortized premiums and unaccreted discounts of $(50.7) million and $(58.8) million as of December 31, 2021, and 2020, respectively. Net origination fees related to PPP loans were $(5.7) million and $(12.7) million as of December 31, 2021 and 2020, respectively.
(3)Consists of single-family residential loans as of both December 31, 2021 and 2020.
Actions to Support Customers during the COVID-19 Pandemic
In response to the COVID-19 pandemic, the Company assisted customers by offering SBA PPP loans in 2020 and 2021 to help struggling businesses in our communities pay their employees and sustain their businesses. The SBA stopped accepting new loan applications on May 31, 2021. For more information on PPP loans, refer to Item 7. MD&A — Overview — Coronavirus Disease 2019 Global Pandemic and Note 1 — Summary of Significant Accounting Policies — Significant Accounting Policies — Paycheck Protection Program to the Consolidated Financial Statements in this Form 10-K. The Company was also a participating lender in the MSLP, which was established by the Federal Reserve to support lending to small- and medium-sized businesses and nonprofit organizations.
In addition, the Company has provided payment relief through various loan modification programs. For a summary of the loans that the Company has modified in response to the COVID-19 pandemic, refer to Item 7. MD&A — Risk Management — Credit Risk Management — Loan Modifications Due to the COVID-19 Pandemic in this Form 10-K.
47
Commercial
The commercial loan portfolio made up 73% and 75% of total loans as of December 31, 2021 and 2020, respectively. The Company actively monitors this commercial lending portfolio for elevated levels of credit risk and reviews credit exposures for sensitivity to changing economic conditions.
Commercial — Commercial and Industrial Loans. Total C&I loan commitments (loans outstanding plus unfunded credit commitments, excluding issued letters of credit) were $20.29 billion as of December 31, 2021, an increase of $1.60 billion or 9% from $18.69 billion as of December 31, 2020. Total C&I loans were $14.15 billion as of December 31, 2021, an increase of $518.9 million or 4% from $13.63 billion as of December 31, 2020. Total C&I loans made up 34% and 36% of total loans held-for-investment as of December 31, 2021 and 2020, respectively. The C&I loan portfolio includes loans and financing for businesses in a wide spectrum of industries, comprised of working capital lines of credit, trade finance, letters of credit, affordable housing lending, asset-based lending, asset-backed finance, project finance and equipment financing. The C&I loan portfolio also includes PPP loans. Additionally, the Company has a portfolio of broadly syndicated C&I loans, which represent revolving or term loan facilities that are marketed and sold primarily to institutional investors, totaling $939.4 million and $892.1 million as of December 31, 2021 and 2020, respectively. The majority of the C&I loans had variable interest rates as of both December 31, 2021, and 2020.
The C&I portfolio is well-diversified by industry. The Company monitors concentrations within the C&I loan portfolio by customer exposure and industry classification, setting diversification targets and exposure limits by industry or loan product. The following charts illustrate the industry mix within the Company’s C&I loan portfolio as of December 31, 2021, and 2020:
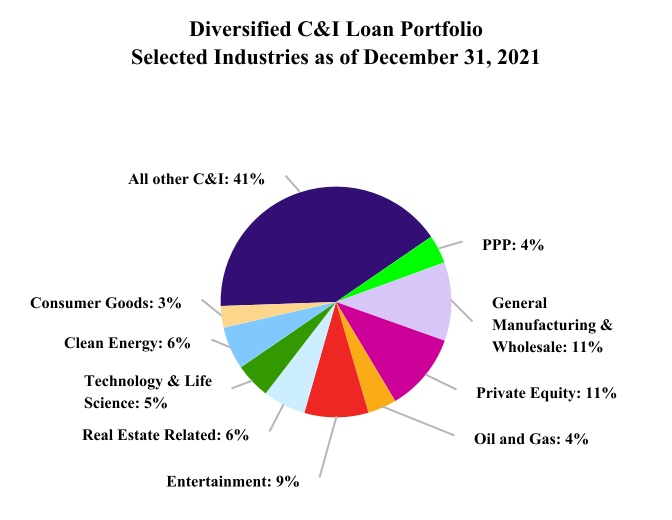
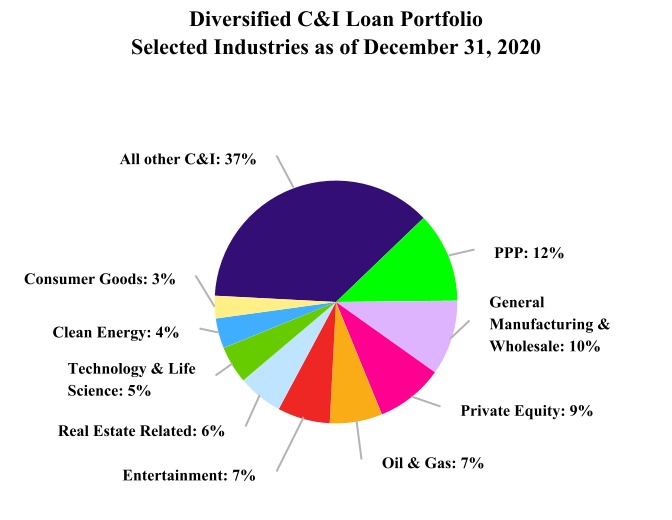
Commercial — Commercial Real Estate Loans. Total CRE loans outstanding were $16.18 billion or 39% of total loans held-for-investment as of December 31, 2021, which grew by $1.37 billion or 9% from $14.81 billion or 39% of total loans held-for-investment as of December 31, 2020. The total CRE portfolio consists of CRE, multifamily residential, and construction and land loans. CRE consists of customers with diversified property types listed in the table below. The year-over-year growth in total CRE loans was driven by growth in CRE and multifamily residential loans, partially offset by declines in construction and land loans.
48
The Company’s total CRE loan portfolio is diversified by property type with an average CRE loan size of $2.5 million and $2.4 million as of December 31, 2021 and 2020, respectively. The following table summarizes the Company’s total CRE loans by property type as of December 31, 2021 and 2020:
| ($ in thousands) | December 31, 2021 | December 31, 2020 | ||||||||||||||||||||||||
| Amount | % | Amount | % | |||||||||||||||||||||||
| Property types: | ||||||||||||||||||||||||||
Retail (1) | $ | 3,685,900 | 23 | % | $ | 3,466,141 | 23 | % | ||||||||||||||||||
| Multifamily | 3,675,605 | 23 | % | 3,033,998 | 20 | % | ||||||||||||||||||||
Office (1) | 2,804,006 | 17 | % | 2,747,082 | 19 | % | ||||||||||||||||||||
Industrial (1) | 2,807,325 | 18 | % | 2,407,594 | 16 | % | ||||||||||||||||||||
Hospitality (1) | 1,993,995 | 12 | % | 1,888,797 | 13 | % | ||||||||||||||||||||
| Construction and land | 346,486 | 2 | % | 599,692 | 4 | % | ||||||||||||||||||||
Other (1) | 863,821 | 5 | % | 664,997 | 5 | % | ||||||||||||||||||||
| Total CRE loans | $ | 16,177,138 | 100 | % | $ | 14,808,301 | 100 | % | ||||||||||||||||||
(1)Included in CRE loans.
The weighted-average loan-to-value (“LTV”) ratio of the total CRE loan portfolio was 51% as of both December 31, 2021 and 2020. The low weighted-average LTV ratio was consistent by CRE loan property type. Approximately 89% of total CRE loans had an LTV ratio of 65% or lower as of both December 31, 2021, and 2020. The consistency of the Company’s low LTV underwriting standards has historically resulted in lower credit losses for CRE and multifamily residential loans.
The following tables provide a summary of the Company’s CRE, multifamily residential, and construction and land loans by geography as of December 31, 2021 and 2020. The distribution of the total CRE loan portfolio reflects the Company’s geographical footprint, which is primarily concentrated in California:
| ($ in thousands) | December 31, 2021 | |||||||||||||||||||||||||||||||||||||||||||||||||
| CRE | % | Multifamily Residential | % | Construction and Land | % | Total | % | |||||||||||||||||||||||||||||||||||||||||||
| Geographic markets: | ||||||||||||||||||||||||||||||||||||||||||||||||||
| Southern California | $ | 6,406,609 | $ | 2,030,938 | $ | 138,953 | $ | 8,576,500 | ||||||||||||||||||||||||||||||||||||||||||
| Northern California | 2,622,398 | 748,631 | 109,483 | 3,480,512 | ||||||||||||||||||||||||||||||||||||||||||||||
| California | 9,029,007 | 75 | % | 2,779,569 | 77 | % | 248,436 | 70 | % | 12,057,012 | 75 | % | ||||||||||||||||||||||||||||||||||||||
| Texas | 1,005,455 | 8 | % | 308,652 | 8 | % | 1,896 | 1 | % | 1,316,003 | 8 | % | ||||||||||||||||||||||||||||||||||||||
| New York | 630,442 | 5 | % | 157,099 | 4 | % | 78,368 | 23 | % | 865,909 | 5 | % | ||||||||||||||||||||||||||||||||||||||
| Washington | 408,913 | 3 | % | 116,047 | 3 | % | 9,865 | 3 | % | 534,825 | 3 | % | ||||||||||||||||||||||||||||||||||||||
| Nevada | 128,395 | 1 | % | 115,163 | 3 | % | 5,775 | 2 | % | 249,333 | 2 | % | ||||||||||||||||||||||||||||||||||||||
| Arizona | 122,164 | 1 | % | 49,836 | 1 | % | — | — | % | 172,000 | 1 | % | ||||||||||||||||||||||||||||||||||||||
| Other markets | 830,671 | 7 | % | 149,239 | 4 | % | 2,146 | 1 | % | 982,056 | 6 | % | ||||||||||||||||||||||||||||||||||||||
| Total loans | $ | 12,155,047 | 100 | % | $ | 3,675,605 | 100 | % | $ | 346,486 | 100 | % | $ | 16,177,138 | 100 | % | ||||||||||||||||||||||||||||||||||
49
| ($ in thousands) | December 31, 2020 | |||||||||||||||||||||||||||||||||||||||||||||||||
| CRE | % | Multifamily Residential | % | Construction and Land | % | Total | % | |||||||||||||||||||||||||||||||||||||||||||
| Geographic markets: | ||||||||||||||||||||||||||||||||||||||||||||||||||
| Southern California | $ | 5,884,691 | $ | 1,867,646 | $ | 249,282 | $ | 8,001,619 | ||||||||||||||||||||||||||||||||||||||||||
| Northern California | 2,476,510 | 674,813 | 197,195 | 3,348,518 | ||||||||||||||||||||||||||||||||||||||||||||||
| California | 8,361,201 | 75 | % | 2,542,459 | 84 | % | 446,477 | 74 | % | 11,350,137 | 77 | % | ||||||||||||||||||||||||||||||||||||||
| Texas | 864,639 | 8 | % | 116,367 | 4 | % | 2,581 | 0 | % | 983,587 | 7 | % | ||||||||||||||||||||||||||||||||||||||
| New York | 696,712 | 6 | % | 137,114 | 4 | % | 93,806 | 16 | % | 927,632 | 6 | % | ||||||||||||||||||||||||||||||||||||||
| Washington | 341,374 | 3 | % | 91,824 | 3 | % | 22,724 | 4 | % | 455,922 | 3 | % | ||||||||||||||||||||||||||||||||||||||
| Nevada | 88,959 | 1 | % | 86,644 | 3 | % | 22,384 | 4 | % | 197,987 | 1 | % | ||||||||||||||||||||||||||||||||||||||
| Arizona | 147,187 | 1 | % | 12,406 | 0 | % | — | — | % | 159,593 | 1 | % | ||||||||||||||||||||||||||||||||||||||
| Other markets | 674,539 | 6 | % | 47,184 | 2 | % | 11,720 | 2 | % | 733,443 | 5 | % | ||||||||||||||||||||||||||||||||||||||
| Total loans | $ | 11,174,611 | 100 | % | $ | 3,033,998 | 100 | % | $ | 599,692 | 100 | % | $ | 14,808,301 | 100 | % | ||||||||||||||||||||||||||||||||||
Because 75% and 77% of total CRE loans were concentrated in California as of December 31, 2021 and 2020, respectively, changes in California’s economy and real estate values could have a significant impact on the collectability of these loans and the required level of allowance for credit losses. For additional information related to the higher degree of risk from a downturn in real estate markets in California, see Item 1A. Risk Factors — Risks Related to Geopolitical Uncertainties in this Form 10-K.
Commercial — Commercial Real Estate Loans. The Company focuses on providing financing to experienced real estate investors and developers who have moderate levels of leverage, many of whom are long-time customers of the Bank. CRE loans totaled $12.16 billion as of December 31, 2021, compared with $11.17 billion as of December 31, 2020, and accounted for 29% of total loans held-for-investment as of both dates. Interest rates on CRE loans may be fixed, variable or hybrid. As of both December 31, 2021 and 2020, the majority of CRE loans were variable rate loans. Loans are underwritten with conservative standards for cash flows, debt service coverage and LTV.
Owner-occupied properties comprised 20% of the CRE loans as of both December 31, 2021 and 2020. The remainder were non-owner-occupied properties, where 50% or more of the debt service for the loan is typically provided by rental income from an unaffiliated third party.
Commercial — Multifamily Residential Loans. The multifamily residential loan portfolio is largely comprised of loans secured by residential properties with five or more units. Multifamily residential loans totaled $3.68 billion or 9% of total loans held-for-investment as of December 31, 2021, compared with $3.03 billion or 8% of total loans held-for-investment as of December 31, 2020. The Company offers a variety of first lien mortgages, including fixed- and variable-rate loans, as well as hybrid loans with interest rates that adjust annually after an initial fixed rate period of three to ten years.
Commercial — Construction and Land Loans. Construction and land loans provide financing for a portfolio of projects diversified by real estate property type. These loans totaled $346.5 million or 1% of total loans held-for-investment as of December 31, 2021, compared with $599.7 million or 2% of total loans held-for-investment as of December 31, 2020. Construction loan exposure was made up of $297.9 million in loans outstanding, plus $361.2 million in unfunded commitments, as of December 31, 2021, compared with $554.7 million in loans outstanding, plus $288.2 million in unfunded commitments as of December 31, 2020. Land loans totaled $48.6 million as of December 31, 2021, compared with $45.0 million as of December 31, 2020.
50
Consumer
The following tables summarize the Company’s single-family residential and HELOCs loan portfolios by geography as of December 31, 2021 and 2020:
| ($ in thousands) | December 31, 2021 | |||||||||||||||||||||||||||||||||||||
| Single- Family Residential | % | HELOCs | % | Total Residential Mortgage | % | |||||||||||||||||||||||||||||||||
| Geographic markets: | ||||||||||||||||||||||||||||||||||||||
| Southern California | $ | 3,520,010 | $ | 971,731 | $ | 4,491,741 | ||||||||||||||||||||||||||||||||
| Northern California | 1,024,564 | 506,310 | 1,530,874 | |||||||||||||||||||||||||||||||||||
| California | 4,544,574 | 49 | % | 1,478,041 | 68 | % | 6,022,615 | 54 | % | |||||||||||||||||||||||||||||
| New York | 3,102,129 | 34 | % | 292,540 | 14 | % | 3,394,669 | 30 | % | |||||||||||||||||||||||||||||
| Washington | 526,721 | 6 | % | 230,294 | 11 | % | 757,015 | 7 | % | |||||||||||||||||||||||||||||
| Massachusetts | 258,372 | 3 | % | 75,815 | 4 | % | 334,187 | 3 | % | |||||||||||||||||||||||||||||
| Georgia | 279,328 | 3 | % | 25,208 | 1 | % | 304,536 | 3 | % | |||||||||||||||||||||||||||||
| Texas | 230,402 | 3 | % | — | — | % | 230,402 | 2 | % | |||||||||||||||||||||||||||||
| Other markets | 152,176 | 2 | % | 42,923 | 2 | % | 195,099 | 1 | % | |||||||||||||||||||||||||||||
| Total | $ | 9,093,702 | 100 | % | $ | 2,144,821 | 100 | % | $ | 11,238,523 | 100 | % | ||||||||||||||||||||||||||
| Lien priority: | ||||||||||||||||||||||||||||||||||||||
| First mortgage | $ | 9,093,702 | 100 | % | $ | 1,872,440 | 87 | % | $ | 10,966,142 | 98 | % | ||||||||||||||||||||||||||
| Junior lien mortgage | — | — | % | 272,381 | 13 | % | 272,381 | 2 | % | |||||||||||||||||||||||||||||
| Total | $ | 9,093,702 | 100 | % | $ | 2,144,821 | 100 | % | $ | 11,238,523 | 100 | % | ||||||||||||||||||||||||||
| ($ in thousands) | December 31, 2020 | |||||||||||||||||||||||||||||||||||||
| Single- Family Residential | % | HELOCs | % | Total Residential Mortgage | % | |||||||||||||||||||||||||||||||||
| Geographic markets: | ||||||||||||||||||||||||||||||||||||||
| Southern California | $ | 3,462,067 | $ | 728,733 | $ | 4,190,800 | ||||||||||||||||||||||||||||||||
| Northern California | 1,059,832 | 354,014 | 1,413,846 | |||||||||||||||||||||||||||||||||||
| California | 4,521,899 | 55 | % | 1,082,747 | 68 | % | 5,604,646 | 57 | % | |||||||||||||||||||||||||||||
| New York | 2,277,722 | 28 | % | 244,425 | 15 | % | 2,522,147 | 26 | % | |||||||||||||||||||||||||||||
| Washington | 597,231 | 7 | % | 180,765 | 11 | % | 777,996 | 8 | % | |||||||||||||||||||||||||||||
| Massachusetts | 259,368 | 3 | % | 44,633 | 3 | % | 304,001 | 3 | % | |||||||||||||||||||||||||||||
| Georgia | 180,447 | 2 | % | 16,147 | 1 | % | 196,594 | 2 | % | |||||||||||||||||||||||||||||
| Texas | 209,737 | 3 | % | — | — | % | 209,737 | 2 | % | |||||||||||||||||||||||||||||
| Other markets | 139,549 | 2 | % | 32,999 | 2 | % | 172,548 | 2 | % | |||||||||||||||||||||||||||||
| Total | $ | 8,185,953 | 100 | % | $ | 1,601,716 | 100 | % | $ | 9,787,669 | 100 | % | ||||||||||||||||||||||||||
| Lien priority: | ||||||||||||||||||||||||||||||||||||||
| First mortgage | $ | 8,185,953 | 100 | % | $ | 1,372,270 | 86 | % | $ | 9,558,223 | 98 | % | ||||||||||||||||||||||||||
| Junior lien mortgage | — | — | % | 229,446 | 14 | % | 229,446 | 2 | % | |||||||||||||||||||||||||||||
| Total | $ | 8,185,953 | 100 | % | $ | 1,601,716 | 100 | % | $ | 9,787,669 | 100 | % | ||||||||||||||||||||||||||
51
Consumer — Single-Family Residential Loans. Single-family residential loans totaled $9.09 billion or 22% of total loans held-for-investment as of December 31, 2021, compared with $8.19 billion or 21% of total loans held-for-investment as of December 31, 2020. Year-over-year, single-family residential loans increased $907.7 million or 11%, primarily driven by growth in New York. The Company was in a first lien position for all of its single-family residential loans as of both December 31, 2021 and 2020. Many of these loans are reduced documentation loans, for which a substantial down payment is required, resulting in a low LTV ratio at origination, typically 65% or less. These loans have historically experienced low delinquency and loss rates. The Company offers a variety of single-family residential first lien mortgage loan programs, including fixed- and variable-rate loans, as well as hybrid loans with interest rates that adjust on a regular basis, typically each year, after an initial fixed rate period.
Consumer — Home Equity Lines of Credit. Total HELOC commitments were $2.49 billion as of December 31, 2021, which grew by $739.8 million or 42% from $1.75 billion as of December 31, 2020. Unfunded HELOC commitments are unconditionally cancellable. HELOCs outstanding totaled $2.14 billion or 5% of total loans held-for-investment as of December 31, 2021, compared with $1.60 billion or 4% of total loans held-for-investment as of December 31, 2020. Year-over-year, HELOCs increased $543.1 million or 34%, primarily driven by growth in California. The Company was in a first lien position for 87% and 86% of its HELOCs as of December 31, 2021 and 2020, respectively. Many of these loans are reduced documentation loans, for which a substantial down payment is required, resulting in a low LTV ratio at origination, typically 60% or less. These loans have historically experienced low delinquency and loss rates. Substantially all of the Company’s HELOCs were variable-rate loans as of both December 31, 2021 and 2020.
All originated commercial and consumer loans are subject to the Company’s underwriting guidelines and loan origination standards. Management believes that the Company’s underwriting criteria and procedures adequately consider the unique risks associated with these products. The Company conducts a variety of quality control procedures and periodic audits, including the review of lending and legal requirements, to ensure that the Company is compliant with these requirements.
The following table presents the contractual loan maturities by loan category and the contractual distribution of loans to changes in interest rates as of December 31, 2021:
| ($ in thousands) | Due within one year | Due after one year through five years | Due after five years through fifteen years | Due after fifteen years | Total | |||||||||||||||||||||||||||
| Commercial: | ||||||||||||||||||||||||||||||||
| C&I | $ | 5,276,061 | $ | 7,647,496 | $ | 1,076,886 | $ | 150,165 | $ | 14,150,608 | ||||||||||||||||||||||
| CRE: | ||||||||||||||||||||||||||||||||
| CRE | 930,731 | 5,425,388 | 5,666,738 | 132,190 | 12,155,047 | |||||||||||||||||||||||||||
| Multifamily residential | 170,420 | 781,492 | 1,049,359 | 1,674,334 | 3,675,605 | |||||||||||||||||||||||||||
| Construction and land | 160,343 | 105,903 | 79,882 | 358 | 346,486 | |||||||||||||||||||||||||||
| Total CRE | 1,261,494 | 6,312,783 | 6,795,979 | 1,806,882 | 16,177,138 | |||||||||||||||||||||||||||
| Total commercial | 6,537,555 | 13,960,279 | 7,872,865 | 1,957,047 | 30,327,746 | |||||||||||||||||||||||||||
| Consumer: | ||||||||||||||||||||||||||||||||
| Residential mortgage: | ||||||||||||||||||||||||||||||||
| Single-family residential | 400 | 16,812 | 1,521,198 | 7,555,292 | 9,093,702 | |||||||||||||||||||||||||||
| HELOCs | — | 624 | 198,108 | 1,946,089 | 2,144,821 | |||||||||||||||||||||||||||
| Total residential mortgage | 400 | 17,436 | 1,719,306 | 9,501,381 | 11,238,523 | |||||||||||||||||||||||||||
| Other consumer | 73,109 | 47,247 | 7,156 | — | 127,512 | |||||||||||||||||||||||||||
| Total consumer | 73,509 | 64,683 | 1,726,462 | 9,501,381 | 11,366,035 | |||||||||||||||||||||||||||
| Total loans held-for-investment | $ | 6,611,064 | $ | 14,024,962 | $ | 9,599,327 | $ | 11,458,428 | $ | 41,693,781 | ||||||||||||||||||||||
| Distribution of loans to changes in interest rates: | ||||||||||||||||||||||||||||||||
| Variable-rate loans | $ | 5,179,036 | $ | 11,930,932 | $ | 5,773,056 | $ | 4,497,380 | $ | 27,380,404 | ||||||||||||||||||||||
| Fixed-rate loans | 1,432,028 | 1,935,014 | 2,419,275 | 2,258,233 | 8,044,550 | |||||||||||||||||||||||||||
| Hybrid adjustable-rate loans | — | 159,016 | 1,406,996 | 4,702,815 | 6,268,827 | |||||||||||||||||||||||||||
| Total loans held-for-investment | $ | 6,611,064 | $ | 14,024,962 | $ | 9,599,327 | $ | 11,458,428 | $ | 41,693,781 | ||||||||||||||||||||||
52
Loans Held-for-Sale
As of December 31, 2021 and 2020, loans held-for-sale totaled $635 thousand and $1.8 million, respectively, and consisted of single-family residential loans. At the time of commitment to originate or purchase a loan, a loan is determined to be held-for-investment if it is the Company’s intent to hold the loan to maturity or for the foreseeable future, subject to periodic reviews under the Company’s evaluation processes, including liquidity and credit risk management. If the Company subsequently changes its intent to hold certain loans, those loans are transferred from held-for-investment to held-for-sale at the lower of cost or fair value.
Sales of Originated Loans and Purchased Loans
All loans originated by the Company are underwritten pursuant to the Company’s policies and procedures. Although the Company’s primary focus is on directly originated loans, in certain circumstances, the Company also purchases loans and participates in loans with other banks. In the normal course of doing business, the Company also participates out interests in directly originated commercial loans to other financial institutions or sells loans.
The following tables provide information on loan sales during the years ended December 31, 2021, 2020 and 2019. Refer to Note 6 — Loans Receivable and Allowance for Credit Losses to the Consolidated Financial Statements in this Form 10-K for additional information on loan purchases and transfers.
| ($ in thousands) | Year Ended December 31, 2021 | |||||||||||||||||||||||||||||||||||||
| Commercial | Consumer | Total | ||||||||||||||||||||||||||||||||||||
| CRE | Residential Mortgage | |||||||||||||||||||||||||||||||||||||
| C&I | CRE | Multifamily Residential | Construction and Land | Single-Family Residential | ||||||||||||||||||||||||||||||||||
| Loans sold: | ||||||||||||||||||||||||||||||||||||||
| Originated loans: | ||||||||||||||||||||||||||||||||||||||
| Amount | $ | 294,258 | $ | 78,834 | $ | — | $ | 21,557 | $ | 18,458 | $ | 413,107 | ||||||||||||||||||||||||||
| Net gains | $ | 581 | $ | 7,767 | $ | — | $ | — | $ | 348 | $ | 8,696 | ||||||||||||||||||||||||||
| Purchased loans: | ||||||||||||||||||||||||||||||||||||||
| Amount | $ | 208,436 | $ | — | $ | — | $ | — | $ | — | $ | 208,436 | ||||||||||||||||||||||||||
| Net gains | $ | 213 | $ | — | $ | — | $ | — | $ | — | $ | 213 | ||||||||||||||||||||||||||
| ($ in thousands) | Year Ended December 31, 2020 | |||||||||||||||||||||||||||||||||||||
| Commercial | Consumer | Total | ||||||||||||||||||||||||||||||||||||
| CRE | Residential Mortgage | |||||||||||||||||||||||||||||||||||||
| C&I | CRE | Multifamily Residential | Construction and Land | Single-Family Residential | ||||||||||||||||||||||||||||||||||
| Loans sold: | ||||||||||||||||||||||||||||||||||||||
| Originated loans: | ||||||||||||||||||||||||||||||||||||||
| Amount | $ | 291,740 | $ | 26,994 | $ | 1,398 | $ | — | $ | 80,309 | $ | 400,441 | ||||||||||||||||||||||||||
| Net gains | $ | 565 | $ | 2,940 | $ | — | $ | — | $ | 996 | $ | 4,501 | ||||||||||||||||||||||||||
| Purchased loans: | ||||||||||||||||||||||||||||||||||||||
Amount (1) | $ | 11,780 | $ | — | $ | — | $ | — | $ | — | $ | 11,780 | ||||||||||||||||||||||||||
53
| ($ in thousands) | Year Ended December 31, 2019 | |||||||||||||||||||||||||||||||||||||
| Commercial | Consumer | Total | ||||||||||||||||||||||||||||||||||||
| CRE | Residential Mortgage | |||||||||||||||||||||||||||||||||||||
| C&I | CRE | Multifamily Residential | Construction and Land | Single-Family Residential | ||||||||||||||||||||||||||||||||||
| Loans sold: | ||||||||||||||||||||||||||||||||||||||
| Originated loans: | ||||||||||||||||||||||||||||||||||||||
| Amount | $ | 179,280 | $ | 39,062 | $ | — | $ | 1,573 | $ | 10,410 | $ | 230,325 | ||||||||||||||||||||||||||
| Net gains | $ | 875 | $ | 3,045 | $ | — | $ | — | $ | 115 | $ | 4,035 | ||||||||||||||||||||||||||
| Purchased loans: | ||||||||||||||||||||||||||||||||||||||
Amount (1) | $ | 66,511 | $ | — | $ | — | $ | — | $ | — | $ | 66,511 | ||||||||||||||||||||||||||
(1)Net gains on sales of purchased loans were insignificant or none.
Foreign Outstandings
The Company’s overseas offices, which include the branch in Hong Kong and the subsidiary bank in China, are subject to the general risks inherent in conducting business in foreign countries, such as regulatory, economic and political uncertainties. As such, the Company’s international operation risk exposure is largely concentrated in China and Hong Kong. In addition, the Company’s financial assets held in the Hong Kong branch and the subsidiary bank in China may be affected by fluctuations in currency exchange rates or other factors. The following table presents the major financial assets held in the Company’s overseas offices as of December 31, 2021 and 2020:
| ($ in thousands) | December 31, | |||||||||||||||||||||||||
| 2021 | 2020 | |||||||||||||||||||||||||
| Amount | % of Total Consolidated Assets | Amount | % of Total Consolidated Assets | |||||||||||||||||||||||
| Hong Kong branch: | ||||||||||||||||||||||||||
| Cash and cash equivalents | $ | 831,283 | 1 | % | $ | 647,883 | 1 | % | ||||||||||||||||||
AFS debt securities (1) | $ | 242,926 | 0 | % | $ | 66,170 | 0 | % | ||||||||||||||||||
Loans held-for-investment (2) | $ | 849,573 | 1 | % | $ | 704,415 | 1 | % | ||||||||||||||||||
| Total assets | $ | 1,933,164 | 3 | % | $ | 1,426,479 | 3 | % | ||||||||||||||||||
| Subsidiary bank in China: | ||||||||||||||||||||||||||
| Cash and cash equivalents | $ | 543,134 | 1 | % | $ | 611,088 | 1 | % | ||||||||||||||||||
| Interest-bearing deposits with banks | $ | 51,243 | 0 | % | $ | 74,079 | 0 | % | ||||||||||||||||||
AFS debt securities (3) | $ | 141,404 | 0 | % | $ | 152,219 | 0 | % | ||||||||||||||||||
Loans held-for-investment (2) | $ | 984,591 | 2 | % | $ | 796,153 | 2 | % | ||||||||||||||||||
| Total assets | $ | 1,709,640 | 3 | % | $ | 1,634,896 | 3 | % | ||||||||||||||||||
(1)Primarily comprised of U.S. Treasury securities and foreign government bonds as of both December 31, 2021 and 2020.
(2)Primarily comprised of C&I loans as of both December 31, 2021 and 2020.
(3)Comprised of foreign government bonds as of both December 31, 2021 and 2020.
The following table presents the total revenue generated by the Company’s overseas offices in 2021, 2020 and 2019:
| ($ in thousands) | Year Ended December 31, | |||||||||||||||||||||||||||||||||||||
| 2021 | 2020 | 2019 | ||||||||||||||||||||||||||||||||||||
| Amount | % of Total Consolidated Revenue | Amount | % of Total Consolidated Revenue | Amount | % of Total Consolidated Revenue | |||||||||||||||||||||||||||||||||
| Hong Kong Branch: | ||||||||||||||||||||||||||||||||||||||
| Total revenue | $ | 25,221 | 1 | % | $ | 22,947 | 1 | % | $ | 33,791 | 2 | % | ||||||||||||||||||||||||||
| Subsidiary Bank in China: | ||||||||||||||||||||||||||||||||||||||
| Total revenue | $ | 27,252 | 1 | % | $ | 20,178 | 1 | % | $ | 32,071 | 2 | % | ||||||||||||||||||||||||||
54
Capital
The Company maintains a strong capital base to support its anticipated asset growth, operating needs, and credit risks, and to ensure that the Company and the Bank are in compliance with all regulatory capital guidelines. The Company engages in regular capital planning processes on at least an annual basis to optimize the use of available capital and to appropriately plan for future capital needs, allocating capital to existing and future business activities. Furthermore, the Company conducts capital stress tests as part of its capital planning process. The stress tests enable the Company to assess the impact of adverse changes in the economy and interest rates on its capital base.
In March 2020, the Company’s Board of Directors authorized the repurchase of up to $500.0 million of the Company’s common stock. This $500.0 million repurchase authorization was inclusive of the Company’s $100.0 million stock repurchase authorization previously outstanding. The Company determines the timing and amount of stock repurchases, based on its assessment of various factors, including prevailing market conditions, alternate uses of capital, liquidity and the economic environment. During the first quarter of 2020, the Company repurchased 4,471,682 shares at an average price of $32.64 per share and a total cost of $146.0 million. The Company did not repurchase any shares during the remainder of 2020 and during 2021. As of December 31, 2021, the total remaining available capital authorized for repurchase was $354.0 million.
The Company’s stockholders’ equity was $5.84 billion as of December 31, 2021, an increase of $568.0 million or 11% from $5.27 billion as of December 31, 2020. The increase in the Company’s stockholders’ equity was primarily due to 2021 net income of $873.0 million, partially offset by cash dividends declared of $189.7 million and an increase in other comprehensive loss of $134.7 million. For other factors that contributed to the changes in stockholders’ equity, refer to Item 8. Financial Statements and Supplementary Data — Consolidated Statement of Changes in Stockholders’ Equity in this Form 10-K.
Book value was $41.13 per common share as of December 31, 2021, an increase of 11% from $37.22 per common share as of December 31, 2020. Non-GAAP tangible common equity per share was $37.79 as of December 31, 2021, compared with $33.85 as of December 31, 2020. For additional details, see the reconciliation of non-GAAP measures presented under Item 7. MD&A — Reconciliation of GAAP to Non-GAAP Financial Measures in this Form 10-K. The Company paid cash dividends of $1.32 per common share in 2021, compared with $1.10 per common share in 2020. In January 2022, the Company’s Board of Directors declared first quarter 2022 cash dividends of $0.40 per common share, which represents a 21% increase or seven cents per common share, from the previous quarterly cash dividend of $0.33 per common share. The dividend was paid on February 22, 2022, to stockholders of record as of February 7, 2022.
55
Deposits and Other Sources of Funding
Deposits are the Company’s primary source of funding, the cost of which has a significant impact on the Company’s net interest income and net interest margin. Additional funding is provided by short- and long-term borrowings, and long-term debt. See Item 7. MD&A — Risk Management — Liquidity Risk Management — Liquidity in this Form 10-K for a discussion of the Company’s liquidity management. The following table summarizes the Company’s sources of funds as of December 31, 2021 and 2020:
| December 31, 2021 | December 31, 2020 | Change | ||||||||||||||||||||||||||||||||||||
| Amount | % | Amount | % | $ | % | |||||||||||||||||||||||||||||||||
| Deposits: | ||||||||||||||||||||||||||||||||||||||
| Noninterest-bearing demand | $ | 22,845,464 | 43 | % | $ | 16,298,301 | 36 | % | $ | 6,547,163 | 40 | % | ||||||||||||||||||||||||||
| Interest-bearing checking | 6,524,721 | 12 | % | 6,142,193 | 14 | % | 382,528 | 6 | % | |||||||||||||||||||||||||||||
| Money market | 13,130,300 | 25 | % | 10,740,667 | 24 | % | 2,389,633 | 22 | % | |||||||||||||||||||||||||||||
| Savings | 2,888,065 | 5 | % | 2,681,242 | 6 | % | 206,823 | 8 | % | |||||||||||||||||||||||||||||
| Time deposits | 7,961,982 | 15 | % | 9,000,349 | 20 | % | (1,038,367) | (12) | % | |||||||||||||||||||||||||||||
| Total deposits | $ | 53,350,532 | 100 | % | $ | 44,862,752 | 100 | % | $ | 8,487,780 | 19 | % | ||||||||||||||||||||||||||
| Other Funds: | ||||||||||||||||||||||||||||||||||||||
| Short-term borrowings | $ | — | $ | 21,009 | $ | (21,009) | (100) | % | ||||||||||||||||||||||||||||||
| FHLB advances | 249,331 | 652,612 | (403,281) | (62) | % | |||||||||||||||||||||||||||||||||
| Repurchase agreements | 300,000 | 300,000 | — | — | % | |||||||||||||||||||||||||||||||||
| Long-term debt | 147,658 | 147,376 | 282 | 0 | % | |||||||||||||||||||||||||||||||||
| Total other funds | $ | 696,989 | $ | 1,120,997 | $ | (424,008) | (38) | % | ||||||||||||||||||||||||||||||
| Total sources of funds | $ | 54,047,521 | $ | 45,983,749 | $ | 8,063,772 | 18 | % | ||||||||||||||||||||||||||||||
Deposits
The Company offers a wide variety of deposit products to consumer and commercial customers. The Company’s deposit strategy is to grow and retain relationship-based deposits, which provide a stable and low-cost source of funding and liquidity to the Company.
Total deposits reached $53.35 billion as of December 31, 2021, an increase of $8.49 billion or 19% from $44.86 billion as of December 31, 2020. Deposit growth was well-diversified across our commercial sectors and branch network, including cross-border clients, partially offset by a reduction in higher-cost time deposits. The strongest growth was in noninterest-bearing demand deposits, which increased by $6.55 billion or 40% year-over-year. Noninterest-bearing demand deposits reached $22.85 billion or 43% of total deposits as of December 31, 2021, up from $16.30 billion or 36% of total deposits as of December 31, 2020. Additional information regarding the impact of deposits on net interest income, with a comparison of average deposit balances and rates, is provided in Item 7 — MD&A — Results of Operations — Net Interest Income in this Form 10-K.
Customer deposits of $50.54 billion, $1.37 billion and $1.44 billion were held in the Company’s domestic offices, the subsidiary bank in China and the branch in Hong Kong, respectively. Of the $50.54 billion of deposits held in the domestic offices as of December 31, 2021, $10.28 billion or 20% were from depositors domiciled in non-U.S. countries and territories.
Customer deposit accounts in the domestic offices are insured by the FDIC for up to $250,000. The deposits in the Company’s subsidiary bank in China and the branch in Hong Kong are insured by each country’s federal authority for up to RMB 500,000 and HKD 500,000, respectively. The following table presents total uninsured deposits by location as of December 31, 2021 and 2020:
| ($ in thousands) | Domestic | China | Hong Kong | Total | ||||||||||||||||||||||
| Uninsured deposits as of 12/31/2021 | $ | 33,768,332 | $ | 1,334,116 | $ | 1,365,753 | $ | 36,468,201 | ||||||||||||||||||
| Uninsured deposits as of 12/31/2020 | $ | 27,750,039 | $ | 1,261,539 | $ | 792,815 | $ | 29,804,393 | ||||||||||||||||||
56
Uninsured time deposits totaled $4.96 billion as of December 31, 2021. The following table presents the maturity distribution for uninsured customer time deposits by location as of December 31, 2021:
| ($ in thousands) | Domestic | China | Hong Kong | Total | ||||||||||||||||||||||
| Three months or less | $ | 2,436,383 | $ | 123,639 | $ | 243,941 | $ | 2,803,963 | ||||||||||||||||||
| Over three months through six months | 540,143 | 107,987 | 60,936 | 709,066 | ||||||||||||||||||||||
| Over six months through 12 months | 935,075 | 232,061 | 7,821 | 1,174,957 | ||||||||||||||||||||||
| Over 12 months | 49,932 | 219,821 | — | 269,753 | ||||||||||||||||||||||
| Total | $ | 3,961,533 | $ | 683,508 | $ | 312,698 | $ | 4,957,739 | ||||||||||||||||||
Other Sources of Funding
Short-term borrowings generally consist of borrowings entered into by the Company’s subsidiary bank in China. As of December 31, 2021, there were no short-term borrowings outstanding, compared with $21.0 million as of December 31, 2020.
FHLB advances were $249.3 million as of December 31, 2021, a decrease of $403.3 million or 62% from $652.6 million as of December 31, 2020. The decrease was due to $405.0 million of fixed rate FHLB advances that matured during 2021 and were not renewed. As of December 31, 2021, FHLB advances had floating interest rates ranging from 0.53% to 0.59% with $74.8 million maturing in two months and $174.5 million maturing in 10 months.
Gross repurchase agreements totaled $300.0 million as of each of December 31, 2021 and 2020. As of December 31, 2021, gross repurchase agreements had interest rates ranging from 2.39% to 2.42%. Repurchase agreements of $200.0 million have an original maturity of 10.0 years and mature in 1.6 years, whereas repurchase agreements of $100.0 million have an original maturity of 8.5 years and mature in 1.7 years.
Repurchase agreements are accounted for as collateralized financing transactions and recorded as liabilities based on the values at which the assets are sold. As of December 31, 2021, the collateral for the repurchase agreements was comprised of U.S. government agency and U.S. government-sponsored enterprise mortgage-backed securities, and U.S. Treasury securities. To ensure the market value of the underlying collateral remains sufficient, the Company monitors the fair value of collateral pledged relative to the principal amounts borrowed under the repurchase agreements. The Company manages liquidity risks related to the repurchase agreements by sourcing funds from a diverse group of counterparties, and entering into repurchase agreements with longer durations, when appropriate. For additional details, see Note 3 — Assets Purchased under Resale Agreements and Sold under Repurchase Agreements to the Consolidated Financial Statements in this Form 10-K.
The Company uses long-term debt to provide funding to acquire interest-earning assets, and to enhance liquidity and regulatory capital adequacy. Long-term debt totaled $147.7 million and $147.4 million as of December 31, 2021 and 2020, respectively. Long-term debt consists of junior subordinated debt, which qualifies as Tier 2 capital for regulatory capital purposes. The junior subordinated debt was issued in connection with the Company’s various pooled trust preferred securities offerings, as well as with common stock issued by the six wholly-owned subsidiaries of the Company in conjunction with these offerings. The junior subordinated debt had a weighted-average interest rate of 1.74% and 2.26% during 2021 and 2020, respectively, with remaining maturities ranging between 12.9 years and 15.7 years as of December 31, 2021. In October 2020, the Company paid off $1.43 billion in borrowings from the PPPLF, which was included in long-term debt.
Regulatory Capital and Ratios
The federal banking agencies have risk-based capital adequacy guidelines intended to ensure that banking organizations maintain capital that is commensurate with the degree of risk associated with a banking organization’s operations. The Company and the Bank are subject to regulatory capital adequacy requirements. The Company and the Bank are also required to comply with the Basel III Capital Rules adopted by the federal banking agencies as standardized approach institutions. See Item 1. Business — Supervision and Regulation — Regulatory Capital Requirements in this Form 10-K for additional details.
57
The Company adopted ASU 2016-13 on January 1, 2020, which requires the measurement of the allowance for credit losses to be based on management’s best estimate of lifetime expected credit losses inherent in the Company’s relevant financial assets. The Company also elected the phase-in option provided by a final rule that delays the estimated impact of CECL on regulatory capital for two years and phases the impact over three years. As a result, the effects of CECL on the Company’s and the Bank’s regulatory capital were delayed through the year 2021, after which the effects are being phased-in over a three-year period from January 1, 2022 through December 31, 2024. In April 2020, in recognition of CARES Act requirements, and to facilitate the use of the PPPLF, the U.S banking agencies issued an interim final rule that banking organizations may exclude from leverage and risk-based capital requirements any eligible assets sold or pledged to the Federal Reserve on a non-recourse basis as part of the PPPLF. In addition, under the CARES Act, loans originated by a banking organization under the PPP (whether or not sold or pledged in the PPPLF) are risk-weighted at zero percent for regulatory capital purposes. Accordingly, the December 31, 2021, capital ratios exclude the impact of the increased allowance for loan losses due to CECL, and PPP loans are risk-weighted at zero percent. The Company paid off all of the PPPLF borrowings in 2020. .
The following table presents the Company’s and the Bank’s capital ratios as of December 31, 2021 and 2020 under the Basel III Capital Rules, and those required by regulatory agencies for capital adequacy and well-capitalized classification purposes:
| Basel III Capital Rules | ||||||||||||||||||||||||||||||||||||||||||||
| December 31, 2021 | December 31, 2020 | Minimum Regulatory Requirements | Fully Phased-in Minimum Regulatory Requirements (2) | Well- Capitalized Requirements | ||||||||||||||||||||||||||||||||||||||||
| Company | East West Bank | Company | East West Bank | |||||||||||||||||||||||||||||||||||||||||
| Risk-based capital ratios: | ||||||||||||||||||||||||||||||||||||||||||||
| CET 1 capital | 12.8 | % | 12.3 | % | 12.7 | % | 12.1 | % | 4.5 | % | 7.0 | % | 6.5 | % | ||||||||||||||||||||||||||||||
Tier 1 capital (1) | 12.8 | % | 12.3 | % | 12.7 | % | 12.1 | % | 6.0 | % | 8.5 | % | 8.0 | % | ||||||||||||||||||||||||||||||
| Total capital | 14.1 | % | 13.2 | % | 14.3 | % | 13.4 | % | 8.0 | % | 10.5 | % | 10.0 | % | ||||||||||||||||||||||||||||||
Tier 1 leverage (1) | 9.0 | % | 8.6 | % | 9.4 | % | 9.0 | % | 4.0 | % | 4.0 | % | 5.0 | % | ||||||||||||||||||||||||||||||
(1)The Tier 1 leverage well-capitalized requirement applies only to the Bank since there is no Tier 1 leverage ratio component in the definition of a well-capitalized bank holding company. In addition, the minimum Tier 1 risk-based capital ratio requirement for the Company to be considered well-capitalized is 6%.
(2)As of January 1, 2019, the 2.5% capital conservation buffer above the minimum capital ratios was required in order to avoid limitations on distributions, including dividend payments and certain discretionary bonus payments to executive officers.
The Company is committed to maintaining strong capital levels to assure the Company’s investors, customers and regulators that the Company and the Bank are financially sound. As of both December 31, 2021 and 2020, the Company and the Bank continued to exceed all “well-capitalized” capital requirements and the required minimum capital requirements under the Basel III Capital Rules. Total risk-weighted assets were $43.59 billion as of December 31, 2021, an increase of $5.18 billion or 13% from $38.41 billion as of December 31, 2020. The increase in the risk-weighted assets was primarily due to loan growth and increase in AFS debt securities.
Other Matters
LIBOR Transition
As of December 31, 2021, the one-week and two-month USD LIBOR tenors ceased to be published. The overnight, one-, three-, six- and 12-month USD LIBOR tenors will continue to be calculated using panel bank submissions for the purpose of legacy contracts and will permanently cease on June 30, 2023. The transition away from USD LIBOR in loan agreements that use the Alternative Reference Rate Committee’s (“ARRC”) recommended fallback language will be triggered on that date. Federal banking agencies have encouraged banks to ensure existing contracts have robust fallback language that includes a clearly defined reference rate.
The ARRC selected the SOFR as its recommended alternative to LIBOR, although the adoption of SOFR remains voluntary. The ARRC also formally recommended the CME Group’s forward-looking Term SOFR Reference Rates. The ARRC supports the use of the CME’s Term SOFR Reference Rates for business loan activity and continues to recommend using forms of overnight and averages of SOFR where possible.
58
A majority of the Company’s LIBOR-based loans, derivatives, debt securities, resale agreements, junior subordinated debt and repurchase agreements are indexed to LIBOR tenors that will cease to be published after June 30, 2023. The volume of the Company’s LIBOR-based products that mature after June 30, 2023 is significant and, if not sufficiently planned for, the discontinuation of LIBOR could result in financial, operational, legal, reputational or compliance risks to the Company.
The on-going transition from LIBOR is anticipated to continue through June 30, 2023. The Company has a cross-functional team in place to manage and execute an enterprise-wide LIBOR transition plan. The plan identifies, assesses, monitors and mitigates risk associated with the discontinuance of LIBOR. The cross-functional team also provides appropriate communication and educational information to impacted customers and other key internal and external stakeholders. The Company has invested in updates to business and legal processes, models, analytical tools, and information and operational systems to facilitate the transition of legacy LIBOR products and offer products under alternative rates. During the fourth quarter of 2021, the Company ceased extending new LIBOR loans as a primary offering in anticipation of the December 31, 2021 deadline for no new LIBOR contracts, and began offering new variable rate loans based on alternative reference rates, including SOFR and the Bloomberg Short-Term Bank Yield Index.
The Company will continue to monitor potential risks and impacts associated with the transition. For additional information related to the potential impact surrounding the transition from LIBOR on the Company’s business, see Item 1A. Risk Factors in this Form 10-K.
Risk Management
Overview
In conducting its businesses, the Company is exposed to a variety of risks, some of which are inherent to the financial services industry and others of which are more specific to the Company’s businesses. The Company operates under a Board-approved ERM framework, which outlines the company-wide approach to risk management and oversight, and describes the structures and practices employed to manage the current and emerging risks inherent to the Company. The Company’s ERM program incorporates risk management throughout the organization in identifying, managing, monitoring and reporting risks. It identifies the Company’s major risk categories as credit risk, liquidity risk, capital risk, market risk, operational risk, compliance and regulatory risks, legal risks, strategic risks and reputational risks.
The Risk Oversight Committee of the Board of Directors monitors the ERM program through stated risk categories and provides oversight of the Company’s risk appetite and control environment. The Risk Oversight Committee provides focused oversight of the Company’s identified enterprise risk categories on behalf of the full Board of Directors. Under the direction of the Risk Oversight Committee, management committees apply targeted strategies to reduce the risks to which the Company’s operations are exposed.
The Company’s ERM program is executed along the three lines of defense model, which provides for a consistent and standardized risk management control environment across the enterprise. The first line of defense is comprised of production, operational, and support units. The second line of defense is comprised of various risk management and control functions charged with monitoring and managing specific major risk categories and/or risk subcategories. The third line of defense is comprised of the Internal Audit function and Independent Asset Review. Internal Audit provides assurance and evaluates the effectiveness of risk management, control and governance processes as established by the Company. Internal Audit has organizational independence and objectivity, reporting directly to the Board’s Audit Committee. Further discussion and analysis of each major risk area are included in the following sub-sections of Risk Management.
Credit Risk Management
Credit risk is the risk that a borrower or counterparty will fail to perform according to the terms and conditions of a loan or investment and expose the Company to loss. Credit risk exists with many of the Company’s assets and exposures such as loans and certain derivatives. The majority of the Company’s credit risk is associated with lending activities.
59
The Risk Oversight Committee has primary oversight responsibility of identified enterprise risk categories including credit risk. The Risk Oversight Committee monitors management’s assessment of asset quality, credit risk trends, credit quality administration, underwriting standards, and portfolio credit risk management strategies and processes, such as diversification and concentration limits, all of which enable management to control credit risk. At the management level, the Credit Risk Management Committee has primary oversight responsibility for credit risk. The Senior Credit Supervision function manages credit policy and provides the resources to manage the line of business transactional credit risk, assuring that all exposure is risk-rated according to the requirements of the credit risk rating policy. The Senior Credit Supervision function evaluates and reports the overall credit risk exposure to senior management and the Risk Oversight Committee. The Independent Asset Review function supports a strong credit risk management culture by providing independent and objective assessment of underwriting and documentation quality, reporting directly to the Board’s Risk Oversight Committee. A key focus of our credit risk management is adherence to a well-controlled underwriting process.
The Company assesses the overall credit quality performance of the loans held-for-investment portfolio through an integrated analysis of specific performance ratios. This approach forms the basis of the discussion in the sections immediately following: Nonperforming Assets, TDRs and Allowance for Credit Losses.
Credit Quality
The Company utilizes a credit risk rating system to assist in monitoring credit quality. Loans are evaluated using the Company’s internal credit risk rating of 1 through 10. Loans risk rated 1 through 5 are assigned an internal risk rating of “Pass.” Loans assigned with a credit risk rating of 6 have potential weaknesses that warrant closer attention by management and are assigned an internal risk rating of “Special mention.” Loans assigned a credit risk rating of 7 or 8 have well-defined weaknesses that may jeopardize the full and timely repayment of the loan; these are assigned an internal risk rating of “Substandard.” Loans assigned a credit risk rating of 9 have insufficient sources of repayment and a high probability of loss; these are assigned an internal risk rating of “Doubtful.” Loans assigned a credit risk rating of 10 are uncollectible and of such little value that they are no longer considered bankable assets; these are assigned an internal risk rating of “Loss.” Exposures categorized as criticized consist of “Special mention,” “Substandard,” “Doubtful” and “Loss” categories. Exposures categorized as classified consist of “Substandard,” “Doubtful,” and “Loss” categories. For more information on credit quality indicators, refer to Note 6 — Loans Receivable and Allowance for Credit Losses to the Consolidated Financial Statements in this Form 10-K.
The following table presents the Company’s criticized loans as of December 31, 2021 and 2020:
| ($ in thousands) | Change | |||||||||||||||||||||||||
| December 31, 2021 | December 31, 2020 | $ | % | |||||||||||||||||||||||
| Criticized loans | ||||||||||||||||||||||||||
| Special mention loans | $ | 384,694 | $ | 564,555 | $ | (179,861) | (32) | % | ||||||||||||||||||
| Classified loans | 448,362 | 652,880 | (204,518) | (31) | % | |||||||||||||||||||||
| Total criticized loans | $ | 833,056 | $ | 1,217,435 | $ | (384,379) | (32) | % | ||||||||||||||||||
| Special mention loans to loans held-for-investment | 0.92 | % | 1.47 | % | ||||||||||||||||||||||
| Classified loans to loans held-for-investment | 1.08 | % | 1.70 | % | ||||||||||||||||||||||
| Criticized loans to loans held-for-investment | 2.00 | % | 3.17 | % | ||||||||||||||||||||||
Nonperforming Assets
Nonperforming assets are comprised of nonaccrual loans, other real estate owned (“OREO”), and other nonperforming assets. Other nonperforming assets and OREO are repossessed assets and properties, respectively, acquired through foreclosure, or through full or partial satisfaction of loans held-for-investment. Loans are generally placed on nonaccrual status when they become 90 days past due or when the full collection of principal or interest becomes uncertain regardless of the length of past due status. Collectability is generally assessed based on economic and business conditions, the borrower’s financial condition and the adequacy of collateral, if any. For additional details regarding the Company’s nonaccrual loan policy, see Note 1 — Summary of Significant Accounting Policies — Loans Held-for-Investment to the Consolidated Financial Statements in this Form 10-K.
60
The following table presents information regarding nonperforming assets as of December 31, 2021 and 2020:
| ($ in thousands) | Change | |||||||||||||||||||||||||
| December 31, 2021 | December 31, 2020 | $ | % | |||||||||||||||||||||||
| Commercial: | ||||||||||||||||||||||||||
| C&I | $ | 59,023 | $ | 133,939 | $ | (74,916) | (56) | % | ||||||||||||||||||
| CRE: | ||||||||||||||||||||||||||
| CRE | 9,498 | 46,546 | (37,048) | (80) | % | |||||||||||||||||||||
| Multifamily residential | 444 | 3,668 | (3,224) | (88) | % | |||||||||||||||||||||
| Total CRE | 9,942 | 50,214 | (40,272) | (80) | % | |||||||||||||||||||||
| Consumer: | ||||||||||||||||||||||||||
| Residential mortgage: | ||||||||||||||||||||||||||
| Single-family residential | 15,720 | 16,814 | (1,094) | (7) | % | |||||||||||||||||||||
| HELOCs | 8,444 | 11,696 | (3,252) | (28) | % | |||||||||||||||||||||
| Total residential mortgage | 24,164 | 28,510 | (4,346) | (15) | % | |||||||||||||||||||||
| Other consumer | 52 | 2,491 | (2,439) | (98) | % | |||||||||||||||||||||
| Total nonaccrual loans | 93,181 | 215,154 | (121,973) | (57) | % | |||||||||||||||||||||
| OREO, net | 363 | 15,824 | (15,461) | (98) | % | |||||||||||||||||||||
| Other nonperforming assets | 9,938 | 3,890 | 6,048 | 155 | % | |||||||||||||||||||||
| Total nonperforming assets | $ | 103,482 | $ | 234,868 | $ | (131,386) | (56) | % | ||||||||||||||||||
| Nonperforming assets to total assets | 0.17 | % | 0.45 | % | ||||||||||||||||||||||
| Nonaccrual loans to loans held-for-investment | 0.22 | % | 0.56 | % | ||||||||||||||||||||||
| Allowance for loan losses to nonaccrual loans | 581.21 | % | 288.16 | % | ||||||||||||||||||||||
| TDRs included in nonaccrual loans | $ | 30,383 | $ | 71,924 | ||||||||||||||||||||||
Nonaccrual loans were $93.2 million as of December 31, 2021, a decrease of $122.0 million or 57% from $215.2 million as of December 31, 2020. This decrease was predominantly due to the resolutions of C&I oil and gas exposures and CRE loans.
As of December 31, 2021, $54.2 million or 58% of nonaccrual loans were less than 90 days delinquent. In comparison, $106.4 million or 49% of nonaccrual loans were less than 90 days delinquent as of December 31, 2020.
OREO was $363 thousand as of December 31, 2021, a decrease of $15.5 million from $15.8 million as of December 31, 2020. The decrease was primarily due to the sale of two CRE properties totaling $40.7 million. During 2021, the Company took possession of one CRE property totaling $28.8 million.
Other nonperforming assets totaled $9.9 million and $3.9 million as of December 31, 2021 and 2020, respectively, a net increase of $6.0 million or 155%, due to transfers of nonaccrual C&I oil and gas loans to foreclosed assets, partially offset by the sales and write-downs of oil and gas foreclosed assets.
61
The following table presents accruing loans past due by loan portfolio segments as of December 31, 2021 and 2020:
| ($ in thousands) | Total Accruing Past Due Loans (1) | Change | Percentage of Total Loans Outstanding | |||||||||||||||||||||||||||||||||||
| December 31, | December 31, | |||||||||||||||||||||||||||||||||||||
| 2021 | 2020 | $ | % | 2021 | 2020 | |||||||||||||||||||||||||||||||||
Commercial: | ||||||||||||||||||||||||||||||||||||||
| C&I | $ | 11,069 | $ | 9,717 | $ | 1,352 | 14 | % | 0.08 | % | 0.07 | % | ||||||||||||||||||||||||||
| CRE: | ||||||||||||||||||||||||||||||||||||||
| CRE | 3,722 | 375 | 3,347 | 893 | % | 0.03 | % | 0.00 | % | |||||||||||||||||||||||||||||
Multifamily residential | 5,342 | 1,818 | 3,524 | 194 | % | 0.15 | % | 0.06 | % | |||||||||||||||||||||||||||||
Construction and land | — | 19,900 | (19,900) | 100 | % | 0.00 | % | 3.32 | % | |||||||||||||||||||||||||||||
Total CRE | 9,064 | 22,093 | (13,029) | (59) | % | 0.06 | % | 0.15 | % | |||||||||||||||||||||||||||||
Total commercial | 20,133 | 31,810 | (11,677) | (37) | % | 0.07 | % | 0.11 | % | |||||||||||||||||||||||||||||
| Consumer: | ||||||||||||||||||||||||||||||||||||||
Residential mortgage: | ||||||||||||||||||||||||||||||||||||||
Single-family residential | 18,760 | 12,494 | 6,266 | 50 | % | 0.21 | % | 0.15 | % | |||||||||||||||||||||||||||||
| HELOCs | 5,854 | 6,052 | (198) | (3) | % | 0.27 | % | 0.38 | % | |||||||||||||||||||||||||||||
Total residential mortgage | 24,614 | 18,546 | 6,068 | 33 | % | 0.22 | % | 0.19 | % | |||||||||||||||||||||||||||||
| Other consumer | 108 | 234 | (126) | (54) | % | 0.08 | % | 0.14 | % | |||||||||||||||||||||||||||||
Total consumer | 24,722 | 18,780 | 5,942 | 32 | % | 0.22 | % | 0.19 | % | |||||||||||||||||||||||||||||
Total | $ | 44,855 | $ | 50,590 | $ | (5,735) | (11) | % | 0.11 | % | 0.13 | % | ||||||||||||||||||||||||||
(1)There were no accruing loans past due 90 days or more as of both December 31, 2021 and 2020.
Troubled Debt Restructurings
TDRs are loans for which contractual terms have been modified by the Company for economic or legal reasons related to a borrower’s financial difficulties, and for which a concession to the borrower was granted that the Company would not otherwise consider. The Company’s loan modifications are handled on a case-by-case basis and are negotiated to achieve mutually agreeable terms that maximize loan collectability and meet the borrower’s financial needs. The following table presents the performing and nonperforming TDRs by loan portfolio segments as of December 31, 2021 and 2020. The allowance for loan losses for TDRs was $4.8 million as of December 31, 2021, and $10.3 million as of December 31, 2020.
| ($ in thousands) | December 31, | |||||||||||||||||||||||||||||||||||||
| 2021 | 2020 | |||||||||||||||||||||||||||||||||||||
| Performing TDRs | Nonperforming TDRs | Total | Performing TDRs | Nonperforming TDRs | Total | |||||||||||||||||||||||||||||||||
| Commercial: | ||||||||||||||||||||||||||||||||||||||
| C&I | $ | 77,256 | $ | 28,239 | $ | 105,495 | $ | 85,767 | $ | 68,451 | $ | 154,218 | ||||||||||||||||||||||||||
| CRE: | ||||||||||||||||||||||||||||||||||||||
| CRE | 23,379 | — | 23,379 | 24,851 | — | 24,851 | ||||||||||||||||||||||||||||||||
| Multifamily residential | 4,042 | 197 | 4,239 | 3,310 | 1,448 | 4,758 | ||||||||||||||||||||||||||||||||
| Construction and land | — | — | — | 19,900 | — | 19,900 | ||||||||||||||||||||||||||||||||
| Total CRE | 27,421 | 197 | 27,618 | 48,061 | 1,448 | 49,509 | ||||||||||||||||||||||||||||||||
| Consumer: | ||||||||||||||||||||||||||||||||||||||
| Residential mortgage: | ||||||||||||||||||||||||||||||||||||||
| Single-family residential | 6,585 | 1,102 | 7,687 | 6,748 | 1,169 | 7,917 | ||||||||||||||||||||||||||||||||
| HELOCs | 2,553 | 845 | 3,398 | 2,631 | 856 | 3,487 | ||||||||||||||||||||||||||||||||
| Total residential mortgage | 9,138 | 1,947 | 11,085 | 9,379 | 2,025 | 11,404 | ||||||||||||||||||||||||||||||||
| Total TDRs | $ | 113,815 | $ | 30,383 | $ | 144,198 | $ | 143,207 | $ | 71,924 | $ | 215,131 | ||||||||||||||||||||||||||
Performing TDRs were $113.8 million as of December 31, 2021, a decrease of $29.4 million or 21% from $143.2 million as of December 31, 2020. This decrease reflected payoffs and paydowns of performing C&I and construction TDR loans, partially offset by the transfers of C&I TDRs from nonperforming to performing status. Over 94% and 85% of the performing TDRs were current as of December 31, 2021 and 2020, respectively.
62
Nonperforming TDRs were $30.4 million as of December 31, 2021, a decrease of $41.5 million or 58% from $71.9 million as of December 31, 2020. This decrease primarily reflected transfers of certain C&I TDRs from nonperforming to performing status, and payoffs and charge-offs of C&I TDRs. The decrease was partially offset by newly designated nonperforming C&I TDR loans.
Existing TDRs that were subsequently modified in response to the COVID-19 pandemic continue to be classified as TDRs. As of December 31, 2021, there were two TDRs totaling $145 thousand that were provided subsequent modifications related to the COVID-19 pandemic.
Loan Modifications Due to the COVID-19 Pandemic
Since late March 2020, under various forbearance programs, the Company has granted a range of commercial and consumer loan accommodations, predominantly in the form of payment deferrals, to provide relief to borrowers experiencing financial hardship due to the COVID-19 pandemic. Section 4013 of the CARES Act, as amended by the CAA, permits a financial institution to elect to temporarily suspend TDR accounting under ASC Subtopic 310-40 in certain circumstances. To be eligible under Section 4013 of the CARES Act, a loan modification must be (1) related to the COVID-19 pandemic; (2) executed on a loan that was not more than 30 days past due as of December 31, 2019; and (3) executed between March 1, 2020, and the earlier of (a) 60 days after the date of termination of the federal National Emergency or (b) January 1, 2022. The federal banking regulators, in consultation with the FASB, issued the Interagency Statement on April 7, 2020, confirming that, for loans not subject to Section 4013 of the CARES Act, short-term modifications (i.e. six months or less) made on a good faith basis in response to the COVID-19 pandemic to borrowers who were current as of the implementation date of a loan modification, or modifications granted under government mandated modification programs, are not considered as TDRs under ASC Subtopic 310-40. See additional information in Note 1 — Summary of Significant Accounting Policies — Troubled Debt Restructurings in this Form 10-K.
The delinquency aging of loans modified related to the COVID-19 pandemic is frozen at the time of the modification. As a result, the recognition of delinquent loans, nonaccrual status, and loan net charge-offs may be delayed for certain borrowers who are enrolled in these loan modification programs, which would have otherwise moved into past due or nonaccrual status. Interest income continues to be recognized over the accommodation periods.
The following table provides a summary of the COVID-19 pandemic-related loan modifications that remained under their modified terms as of December 31, 2021. The amounts represent loan modifications that meet the criteria under Section 4013 of the CARES Act, as amended by the CAA, or the Interagency Statement and therefore are not considered as TDRs. These amounts exclude loan modifications related to the COVID-19 pandemic made on existing TDRs. A loan is counted once in the table regardless of the number of accommodations received.
| ($ in thousands) | December 31, 2021 | December 31, 2020 | ||||||||||||||||||||||||||||||||||||
| Number of Loans | Outstanding Balance | % of Balance of Respective Loan Portfolio | Number of Loans | Outstanding Balance | % of Balance of Respective Loan Portfolio | |||||||||||||||||||||||||||||||||
| Payment deferral and forbearance | ||||||||||||||||||||||||||||||||||||||
| Commercial: | ||||||||||||||||||||||||||||||||||||||
| C&I | 2 | $ | 1,584 | 0% | 16 | $ | 54,215 | 0% | ||||||||||||||||||||||||||||||
| CRE: | ||||||||||||||||||||||||||||||||||||||
| CRE | 19 | 270,100 | 2% | 63 | 597,972 | 5% | ||||||||||||||||||||||||||||||||
| Multifamily residential | 4 | 40,994 | 1% | 4 | 17,111 | 1% | ||||||||||||||||||||||||||||||||
| Construction and land | — | — | —% | 3 | 66,629 | 11% | ||||||||||||||||||||||||||||||||
| Total CRE | 23 | 311,094 | 2% | 70 | 681,712 | 5% | ||||||||||||||||||||||||||||||||
| Total commercial | 25 | 312,678 | 1% | 86 | 735,927 | 3% | ||||||||||||||||||||||||||||||||
| Consumer: | ||||||||||||||||||||||||||||||||||||||
| Residential mortgage: | ||||||||||||||||||||||||||||||||||||||
| Single-family residential | 76 | 40,146 | 0% | 498 | 207,797 | 3% | ||||||||||||||||||||||||||||||||
| HELOCs | 21 | 10,233 | 0% | 102 | 39,469 | 2% | ||||||||||||||||||||||||||||||||
| Total residential mortgage | 97 | 50,379 | 0% | 600 | 247,266 | 3% | ||||||||||||||||||||||||||||||||
| Total consumer | 97 | 50,379 | 0% | 600 | 247,266 | 2% | ||||||||||||||||||||||||||||||||
| Total | 122 | $ | 363,057 | 1% | 686 | $ | 983,193 | 3% | ||||||||||||||||||||||||||||||
63
The above table excludes loan modifications related to the COVID-19 pandemic that did not meet the criteria provided under Section 4013 of the CARES Act, as amended by the CAA, or the Interagency Statement, and that were evaluated and deemed to not be classified as TDRs. The determination to not consider a modification a TDR was made on the premise that the amount of the delayed restructured payments was insignificant relative to the unpaid principal or the collateral value of the loan, resulting in an insignificant shortfall in the contractual amount due from the borrower, or an insignificant delay in the timing of the restructured payment period relative to the payment frequency under the loan’s original contractual maturity or expected duration.
The COVID-19 pandemic-related loan modifications primarily consisted of payment deferrals 12 months or less in duration, in the form of either principal payment deferrals, where the borrower was still paying interest, or full principal and interest payment deferrals. Other forbearance programs consisted of interest rate concessions. The deferred payments for commercial loans are either repaid at contractual maturity, or spread over the remaining contractual term of the loan. The deferred payments for consumer loans are repaid under defined payment plans between six to 72 months after the deferral period ends, or the loan term is extended beyond the contractual maturity by the number of payments deferred.
As of December 31, 2021, the Company had $363.1 million of loans under payment deferral and forbearance programs, a decrease of $620.1 million or 63% from $983.2 million as of December 31, 2020. The loans on deferral as of both December 31, 2021 and 2020, predominantly consisted of CRE and residential mortgage loans. The year-to-date decrease in loans on deferral reflected the lifting of the COVID-19 pandemic-related business shutdowns and restrictions on travel and restaurant dining. The CRE COVID-19-related loan deferrals that were making at least partial payments increased from 73% as of December 31, 2020, to 100% as of December 31, 2021. Modifications are considered to have exited active accommodation after the borrower exited the modification program or after the modification period expired. The loans with exited or expired COVID-19 pandemic modifications were predominantly current as of December 31, 2021. The Company monitors the delinquency status of loans exiting relief programs on an ongoing basis. The impacts of the COVID-19 pandemic loan modifications were considered in determination of the allowance for credit losses.
Allowance for Credit Losses
ASU 2016-13, Credit Losses (Topic 326): Measurement of Credit Losses on Financial Instruments requires the measurement of the allowance for credit losses to be based on management’s best estimate of lifetime expected credit losses inherent in the Company’s relevant financial assets. The allowance for credit losses estimate uses various models and estimation techniques based on historical loss experience, current borrower characteristics, current conditions, reasonable and supportable forecasts, and other relevant factors.
In addition to the allowance for loan losses, the Company maintains an allowance for unfunded credit commitments. The Company has three general areas for which it provides the allowance for unfunded credit commitments: 1) recourse obligations for loans sold, 2) letters of credit, and 3) unfunded lending commitments. The Company’s methodology for determining the allowance calculation for unfunded lending commitments uses the lifetime loss rates of the on-balance sheet commitment. Recourse obligations for loans sold and letters of credit use the weighted loss rates for the applicable segment of the individual credit.
In the case of loans and securities, allowance for credit losses are contra-asset valuation accounts that are deducted from the amortized cost basis of these assets to present the net amount expected to be collected. In the case of unfunded credit commitments, the allowance for credit losses is a liability account that is reported as a component of Accrued expenses and other liabilities in our Consolidated Balance Sheet.
The Company is committed to maintaining the allowance for credit losses at a level that is commensurate with the estimated inherent losses in the loan portfolio, including unfunded credit facilities. While the Company believes that the allowance for credit losses as of December 31, 2021 was appropriate to absorb losses inherent in the loan portfolio and in unfunded credit commitments based on the information available, future allowance levels may increase or decrease based on a variety of factors, including but not limited to, accounting standard and regulatory changes, loan growth, portfolio performance and general economic conditions. This evaluation is inherently subjective as it requires numerous estimates and judgements. For a description of the policies, methodologies and judgments used to determine the allowance for credit losses, see Item 7. MD&A — Critical Accounting Estimates, Note 1 — Summary of Significant Accounting Policies and Note 6 — Loans Receivable and Allowance for Credit Losses to the Consolidated Financial Statements in this Form 10-K.
64
The following table presents an allocation of the allowance for loan losses by loan portfolio segments as of the periods indicated:
| ($ in thousands) | December 31, | |||||||||||||||||||||||||
| 2021 | 2020 | |||||||||||||||||||||||||
| Allowance Allocation | % of Loan Type to Total Loans | Allowance Allocation | % of Loan Type to Total Loans | |||||||||||||||||||||||
| Allowance for loan losses | ||||||||||||||||||||||||||
| Commercial: | ||||||||||||||||||||||||||
| C&I | $ | 338,252 | 34 | % | $ | 398,040 | 36 | % | ||||||||||||||||||
| CRE: | ||||||||||||||||||||||||||
| CRE | 150,940 | 29 | % | 163,791 | 29 | % | ||||||||||||||||||||
| Multifamily residential | 14,400 | 9 | % | 27,573 | 8 | % | ||||||||||||||||||||
| Construction and land | 15,468 | 1 | % | 10,239 | 2 | % | ||||||||||||||||||||
| Total CRE | 180,808 | 39 | % | 201,603 | 39 | % | ||||||||||||||||||||
| Total Commercial | 519,060 | 73 | % | 599,643 | 75 | % | ||||||||||||||||||||
| Consumer: | ||||||||||||||||||||||||||
| Residential mortgage: | ||||||||||||||||||||||||||
| Single-family residential | 17,160 | 22 | % | 15,520 | 21 | % | ||||||||||||||||||||
| HELOCs | 3,435 | 5 | % | 2,690 | 4 | % | ||||||||||||||||||||
| Total residential mortgage | 20,595 | 27 | % | 18,210 | 25 | % | ||||||||||||||||||||
| Other consumer | 1,924 | 0 | % | 2,130 | 0 | % | ||||||||||||||||||||
| Total Consumer | 22,519 | 27 | % | 20,340 | 25 | % | ||||||||||||||||||||
| Total allowance for loan losses | $ | 541,579 | 100 | % | $ | 619,983 | 100 | % | ||||||||||||||||||
| Allowance for unfunded credit commitments | $ | 27,514 | $ | 33,577 | ||||||||||||||||||||||
| Total allowance for credit losses | $ | 569,093 | $ | 653,560 | ||||||||||||||||||||||
| Loans held-for-investment | $ | 41,693,781 | $ | 38,390,955 | ||||||||||||||||||||||
| Allowance for loan losses to loans held-for-investment | 1.30 | % | 1.61 | % | ||||||||||||||||||||||
The allowance for loan losses was $541.6 million as of December 31, 2021, a decrease of $78.4 million from $620.0 million as of December 31, 2020, primarily driven by a reduction in the allowance against the C&I loan portfolio. The change in the allowance reflects an improvement over the year in the macroeconomic forecast, partially offset by loan growth.
The Company considers multiple economic scenarios to develop the estimate of the allowance for loan losses. The scenarios may consist of a base forecast representing management’s view of the most likely outcome, and downside or upside scenarios reflecting possible worsening or improving economic conditions. The base forecast assumed that the worst of the pandemic had passed in 2021 and that COVID-19 variants would be seasonal and less disruptive in the future, with the economic outlook continuing to improve. Macroeconomic assumptions underlying the base forecast include: (1) annual Gross Domestic Product (“GDP”) growth of 4.4% for 2022; (2) a return to a 3.5% unemployment rate by the end of 2022; and (3) rising interest rates. The downside scenario assumed a pullback in the expected economic recovery due to rising concerns about COVID-19 variants, with no growth in GDP and a rise in unemployment throughout 2022. The upside scenario assumed a more optimistic view of the economic recovery, including higher GDP growth through 2022 and a faster return to full employment by mid-2022.
As of December 31, 2021 and 2020, PPP loans outstanding were $534.2 million and $1.57 billion, respectively. Because these loans are fully guaranteed by the SBA, there was no allowance for loan losses established for these loans as of December 31, 2021 and 2020.
65
The following table presents net charge-offs and the net charge-offs to average loans ratios based on the loan categories as of the periods indicated:
| ($ in thousands) | December 31 | |||||||||||||||||||||||||||||||||||||
| 2021 | 2020 | |||||||||||||||||||||||||||||||||||||
| Net Charge-Offs (Recoveries) | Average Loans Held-for-Investment | % of Net Charge-Offs (Recoveries) to Average Loans Held-for-Investment | Net Charge-Offs (Recoveries) | Average Loans Held-for-Investment | % of Net Charge-Offs (Recoveries) to Average Loans Held-for-Investment | |||||||||||||||||||||||||||||||||
| Commercial: | ||||||||||||||||||||||||||||||||||||||
| C&I | $ | 20,584 | $ | 13,656,720 | 0.15 | % | $ | 60,797 | $ | 13,074,883 | 0.46 | % | ||||||||||||||||||||||||||
| CRE: | ||||||||||||||||||||||||||||||||||||||
| CRE | 27,133 | 11,663,144 | 0.23 | % | 4,751 | 10,828,037 | 0.04 | % | ||||||||||||||||||||||||||||||
| Multifamily residential | (1,903) | 3,213,582 | (0.06 | %) | (1,980) | 3,009,365 | (0.07) | % | ||||||||||||||||||||||||||||||
| Construction and land | 2,347 | 445,333 | 0.53 | % | (80) | 597,118 | (0.01) | % | ||||||||||||||||||||||||||||||
| Total CRE | 27,577 | 15,322,059 | 0.18 | % | 2,691 | 14,434,520 | 0.02 | % | ||||||||||||||||||||||||||||||
| Total commercial | 48,161 | 28,978,779 | 0.17 | % | 63,488 | 27,509,403 | 0.23 | % | ||||||||||||||||||||||||||||||
| Consumer: | ||||||||||||||||||||||||||||||||||||||
| Residential mortgage: | ||||||||||||||||||||||||||||||||||||||
| Single-family residential | 325 | 8,742,565 | 0.00 | % | (585) | 7,611,678 | (0.01) | % | ||||||||||||||||||||||||||||||
| HELOCs | — | 1,859,073 | 0.00 | % | 172 | 1,480,516 | 0.01 | % | ||||||||||||||||||||||||||||||
| Total residential mortgage | 325 | 10,601,638 | 0.00 | % | (413) | 9,092,194 | 0.00 | % | ||||||||||||||||||||||||||||||
| Other consumer | 1,492 | 136,280 | 1.09 | % | 90 | 195,392 | 0.05 | % | ||||||||||||||||||||||||||||||
| Total consumer | 1,817 | 10,737,918 | 0.02 | % | (323) | 9,287,586 | 0.00 | % | ||||||||||||||||||||||||||||||
| Total | $ | 49,978 | $ | 39,716,697 | 0.13 | % | $ | 63,165 | $ | 36,796,989 | 0.17 | % | ||||||||||||||||||||||||||
2021 net charge-offs were $50.0 million or 0.13% of average loans-held-for-investment, compared with $63.2 million or 0.17% of average loan held-for-investment in 2020. The year-over-year decrease in net charge-offs was primarily due to a decrease in C&I charge-offs, partially offset by an increase in CRE charge-offs. The decrease in C&I charge-offs was primarily driven by fewer oil and gas loan charge-offs, while the increase in CRE charge-offs was primarily driven by one CRE relationship. The recognition of certain loan charge-offs could be delayed due to payment deferral activities instituted in response to the COVID-19 pandemic.
The allowance for unfunded credit commitments was $27.5 million as of December 31, 2021, compared with $33.6 million as of December 31, 2020.
Liquidity Risk Management
Liquidity
Liquidity is a financial institution’s capacity to meet its deposit and other counterparties’ obligations as they come due, compensate for balance sheet fluctuations, and provide funds for growth. The objective of liquidity management is to manage the potential mismatch of asset and liability cash flows at a reasonable cost. Maintaining an adequate level of liquidity depends on the institution’s ability to efficiently meet both expected and unexpected cash, and collateral needs without adversely affecting daily operations or the financial condition of the institution. To achieve this objective, the Company analyzes its liquidity risk, maintains readily available liquid assets and utilizes diverse funding sources including its stable core deposit base.
66
The Board of Directors’ Risk Oversight Committee has primary oversight responsibility over the Company’s liquidity risk. At the management level, the Company’s Asset/Liability Committee (“ALCO”) establishes the liquidity guidelines that govern the day-to-day active management of the Company’s liquidity position by requiring sufficient asset-based liquidity to cover potential funding requirements and avoid over-dependence on volatile, less reliable funding markets. These guidelines are established and monitored for both the Bank and East West, the parent company, on a stand-alone basis to ensure that the Company is a source of financial strength for its subsidiaries. The ALCO regularly monitors the liquidity status at the Company level, Bank level, and at foreign subsidiaries and branches, and related management processes, providing regular reports to the Board of Directors. The Company believes its liquidity management practices have been effective under both normal operating and stressed market conditions, including the financial stress caused by the COVID-19 pandemic.
Liquidity Risk — Liquidity Sources. The Company’s primary source of funding is from deposits, which are relatively stable and low-cost. Total deposits amounted to $53.35 billion as of December 31, 2021, compared with $44.86 billion as of December 31, 2020. The Company’s loan-to-deposit ratio was 78% as of December 31, 2021, compared with 86% as of December 31, 2020.
In addition to deposits, the Company has access to various sources of wholesale financing, including borrowing capacity with the FHLB and FRBSF, unsecured federal funds lines of credit with various correspondent banks, and several master repurchase agreements with major brokerage companies to sustain an adequate liquid asset portfolio, meet daily cash demands and allow management flexibility to execute its business strategy. Economic conditions and the stability of capital markets impact the Company’s access to and the cost of wholesale financing. The Company’s access to capital markets is also affected by the ratings received from various credit rating agencies. As of December 31, 2021, the Company had a total borrowing capacity of $25.27 billion. The Company had available borrowing capacity under secured borrowing lines of $11.93 billion with the FHLB and $4.05 billion with the FRBSF. Unencumbered loans and/or securities were pledged to the FHLB and the FRBSF discount window as collateral. The Company has established operational procedures to enable borrowing against these assets, including regular monitoring of the total pool of loans and securities eligible as collateral. Eligibility of collateral is defined in guidelines from the FHLB and FRBSF and is subject to change at their discretion. The Bank’s unsecured federal funds lines of credit with correspondent banks, subject to availability, totaled $1.03 billion as of December 31, 2021. Estimated borrowing capacity from unpledged AFS debt securities totaled $8.26 billion as of December 31, 2021. See Item 7. — MD&A — Balance Sheet Analysis — Deposits and Other Sources of Funding in this Form 10-K for further detail related to the Company’s funding sources.
The Company maintains a certain level of liquid assets in the form of cash and cash equivalents, interest-bearing deposits with banks, short-term resale agreements, and unencumbered high-quality and liquid AFS debt securities. The following table presents the Company’s liquid assets as of December 31, 2021 and 2020:
| ($ in thousands) | December 31, 2021 | December 31, 2020 | ||||||||||||||||||||||||||||||||||||
| Encumbered | Unencumbered | Total | Encumbered | Unencumbered | Total | |||||||||||||||||||||||||||||||||
| Cash and cash equivalents | $ | — | $ | 3,912,935 | $ | 3,912,935 | $ | — | $ | 4,017,971 | $ | 4,017,971 | ||||||||||||||||||||||||||
| Interest-bearing deposits with banks | — | 736,492 | 736,492 | — | 809,728 | 809,728 | ||||||||||||||||||||||||||||||||
| Resale agreements due to mature in one year | — | 1,818,503 | 1,818,503 | — | 900,000 | 900,000 | ||||||||||||||||||||||||||||||||
| U.S. Treasury, and U.S. government agency and U.S. government-sponsored enterprise debt securities | 384,895 | 1,949,757 | 2,334,652 | 91,637 | 773,443 | 865,080 | ||||||||||||||||||||||||||||||||
| U.S. government agency and U.S. government-sponsored enterprise mortgage-backed securities | 418,761 | 3,738,502 | 4,157,263 | 494,132 | 2,320,532 | 2,814,664 | ||||||||||||||||||||||||||||||||
| Foreign government bonds | — | 257,733 | 257,733 | — | 182,531 | 182,531 | ||||||||||||||||||||||||||||||||
| Municipal securities | — | 523,158 | 523,158 | 1,033 | 395,040 | 396,073 | ||||||||||||||||||||||||||||||||
| Non-agency mortgage-backed securities, asset-backed securities and CLOs | 240 | 2,042,642 | 2,042,882 | 434 | 879,908 | 880,342 | ||||||||||||||||||||||||||||||||
| Corporate debt securities | — | 649,665 | 649,665 | 1,249 | 404,719 | 405,968 | ||||||||||||||||||||||||||||||||
| Total | $ | 803,896 | $ | 15,629,387 | $ | 16,433,283 | $ | 588,485 | $ | 10,683,872 | $ | 11,272,357 | ||||||||||||||||||||||||||
Unencumbered liquid assets totaled $15.63 billion as of December 31, 2021, compared with $10.68 billion as of December 31, 2020. AFS debt securities consist of high quality and liquid securities with relatively short durations to minimize overall interest rate and liquidity risks. The Company believes these AFS debt securities are sources of liquidity that will permit it to quickly obtain financing, regardless of market conditions, through sale or pledging.
67
Management believes that the Company’s excess cash, borrowing capacity and access to sufficient sources of capital are adequate to meet its short-term and long-term liquidity needs in the foreseeable future. In addition, the Company may use debt and equity issuances when costs are deemed attractive, should longer term needs arise.
Liquidity Risk — Cash Requirements. In the ordinary course of the Company’s business, the Company enters into contractual obligations that require future cash payments, including funding for customer deposit withdrawals, repayments for short-term and long-term borrowings, leases obligations and other cash commitments. The Company also has off-balance sheet arrangements which represent transactions that are not recorded on the Consolidated Balance Sheet. The Company’s off-balance sheet arrangements include (i) commitments to extend credit, such as loan commitments, commercial letters of credit for foreign and domestic trade, standby letters of credit (“SBLCs”), and financial guarantees, to meet financing needs of its customers, (ii) future interest obligations related to customer deposits and the Company’s borrowings, and (iii) transactions with unconsolidated entities that provide financing, liquidity, market risk or credit risk support to the Company, or engages in leasing, hedging or research and development services with the Company. Since many of these commitments are expected to expire without being drawn upon, the total commitment amounts do not necessarily represent future funding requirements. Information about the Company’s loan commitments, commercial letters of credit and SBLCs is provided in Note 12 — Commitments and Contingencies to the Consolidated Financial Statements in this Form10-K.
The following table shows the Company’s material cash requirements from significant and determinable contractual obligations as of December 31, 2021. The Company’s liquidity sources have been, and are expected to be, sufficient to meet such cash requirements.
| ($ in thousands) | Payment Due by Period | |||||||||||||||||||
| Up to One Year | Greater than One Year | Total | ||||||||||||||||||
| On-balance sheet obligations: | ||||||||||||||||||||
| FHLB advances | $ | 249,331 | $ | — | $ | 249,331 | ||||||||||||||
| Gross repurchase agreements | — | 300,000 | 300,000 | |||||||||||||||||
| Affordable housing partnership and other tax credit investment commitments | 174,475 | 135,141 | 309,616 | |||||||||||||||||
Long-term debt (1) | — | 147,658 | 147,658 | |||||||||||||||||
| Lease Liabilities | 4,458 | 105,414 | 109,872 | |||||||||||||||||
| Projected cash payments for employee benefit plans | 1,277 | 21,244 | 22,521 | |||||||||||||||||
| Total on-balance sheet obligations | $ | 429,541 | $ | 709,457 | $ | 1,138,998 | ||||||||||||||
(1)Represents junior subordinated debt, which is subject to call options where early redemption requires appropriate notice. For further discussion see Note 10 — Federal Home Loan Bank Advances and Long-Term Debt in this Form 10-K.
The Consolidated Statement of Cash Flows summarizes the Company’s sources and uses of cash by type of activities in 2021, 2020, and 2019. Excess cash generated by operating and investing activities may be used to repay outstanding debt or invest in liquid assets.
Liquidity Risk — Liquidity for East West. In addition to bank level liquidity management, the Company manages liquidity at the parent company level for various operating needs including payment of dividends, repurchases of common stock, principal and interest payments on its borrowings, acquisitions and additional investments in its subsidiaries. East West’s primary source of liquidity is from cash dividends distributed by its subsidiary, East West Bank. The Bank is subject to various statutory and regulatory restrictions on its ability to pay dividends as discussed in Item 1. Business — Supervision and Regulation — Dividends and Other Transfers of Funds in this Form 10-K. As of December 31, 2021, East West held $345.0 million in cash and cash equivalents, after receiving $200.0 million in dividends from the Bank. In comparison, as of December 31, 2020, East West held $439.1 million in cash and cash equivalents, after receiving $511.0 million in dividends from the Bank. The dividends from the Bank to East West have historically been sufficient to meet the projected cash obligations of the parent company for the coming year.
Liquidity Risk — Liquidity Stress Testing. Liquidity stress testing is performed at the Company and Bank level, as well as at the foreign subsidiary and foreign branch levels. Stress tests and scenario analyses are intended to quantify the potential impact of a liquidity event on the financial and liquidity position of the entity. Scenario analyses include assumptions about significant changes in key funding sources, market triggers, potential uses of funding and economic conditions in certain countries. In addition, Company specific events are incorporated into the stress testing. Liquidity stress tests are conducted to ascertain potential mismatches between liquidity sources and uses over a variety of time horizons, both immediate and longer term, and over a variety of stressed conditions. Given the range of potential stresses, the Company maintains contingency funding plans on a consolidated basis and for individual entities.
68
As of December 31, 2021, the Company was not aware of any material commitments for capital expenditures in the foreseeable future and believes it has adequate liquidity resources to conduct operations and meet other needs in the ordinary course of business. Given the uncertainty of economic conditions related to the COVID-19 pandemic, the Company will continue to actively evaluate the nature and extent of impact on its business and financial position. For more information of how the COVID-19 pandemic may impact our liquidity, see Item 1A. Risk Factors — Risks Related to the COVID-19 Pandemic in this Form 10-K.
Market Risk Management
Market risk is the risk that the Company’s financial condition may change resulting from adverse movements in market rates or prices including interest rates, foreign exchange rates, interest rate contracts, investment securities prices, credit spreads and related risk resulting from mismatches in rate sensitive assets and liabilities. In the event of market stress, the risk could have a material impact on our results of operations and financial condition.
The Board’s Risk Oversight Committee has primary oversight responsibility over market risk management. At the management level, the ALCO establishes and monitors compliance with the policies and risk limits pertaining to market risk management activities. Corporate Treasury supports the ALCO in measuring, monitoring and managing interest rate risk as well as all other market risks.
Interest Rate Risk Management
Interest rate risk results primarily from the Company’s traditional banking activities of gathering deposits and extending loans, which are the primary areas of market risk for the Company. Economic and financial conditions, movements in interest rates, and consumer preferences impact the level of noninterest-bearing funding sources at the Company, as well as affect the difference between the interest the Company earns on interest-earning assets and pays on interest-bearing liabilities. In addition, changes in interest rates can influence the rate of principal prepayments on loans and the speed of deposit withdrawals. Due to the pricing term mismatches and the embedded options inherent in certain products, changes in market interest rates not only affect expected near-term earnings, but also the economic value of these interest-earning assets and interest-bearing liabilities. Other market risks include foreign currency exchange risk and equity price risk. These risks are not considered significant to the Company, and no separate quantitative information concerning these risks is presented herein.
With oversight by the Company’s Board of Directors, the ALCO coordinates the overall management of the Company’s interest rate risk. The ALCO meets regularly and is responsible for reviewing the Company’s open market positions and establishing policies to monitor and limit exposure to market risk. Management of interest rate risk is carried out primarily through strategies involving the Company’s debt securities portfolio, loan portfolio, available funding channels and capital market activities. In addition, the Company’s policies permit the use of derivative instruments to assist in managing interest rate risk.
The interest rate risk exposure is measured and monitored through various risk management tools, which include a simulation model that performs interest rate sensitivity analyses under multiple interest rate scenarios. The model incorporates the Company’s cash instruments, loans, debt securities, resale agreements, deposits, borrowings and repurchase agreements, as well as financial instruments from the Company’s foreign operations. The Company uses both a static balance sheet and a forward growth balance sheet to perform these analyses. The simulated interest rate scenarios include a non-parallel shift in the yield curve (“rate shock”) and a gradual non-parallel shift in the yield curve (“rate ramp”) over a static balance sheet. In addition, the Company also performs simulations using alternative interest rate scenarios, including various permutations of the yield curve flattening, steepening or inverting. Results of these various simulations are used to formulate and gauge strategies to achieve a desired risk profile within the Company’s capital and liquidity guidelines.
The net interest income simulation model is based on the actual maturity and repricing characteristics of the Company’s interest-rate sensitive assets, liabilities and related derivative contracts. It also incorporates various assumptions, which management believes to be reasonable but may have a significant impact on results. These assumptions include, but are not limited to, the timing and magnitude of changes in interest rates, the yield curve evolution and shape, the correlation between various interest rate indices, financial instrument future repricing characteristics and spread relative to benchmark rates, and the effect of interest rate floors and caps. The modeled results are highly sensitive to deposit decay and deposit beta assumptions, which are derived from a regression analysis of the Company’s historical deposit data. The Company used full betas with each incremental rate increase in the rate ramp scenarios, and did not assume lags in repricing. Deposit beta commonly refers to the correlation of the changes in interest rates paid on deposits to changes in benchmark interest rates. The model is also sensitive to the loan and investment prepayment assumptions that are based on an independent model and the Company’s historical prepayment data, which consider anticipated prepayments under different interest rate environments.
69
Simulation results are highly dependent on input assumptions. To the extent actual behavior is different from the assumptions in the models, there could be a material change in interest rate sensitivity. The assumptions applied in the model are documented and supported for reasonableness, and periodically back-tested to assess their effectiveness. The Company makes appropriate calibrations to the model as needed, continually refining the model, methodology and results. Changes to key model assumptions are reviewed by the ALCO. Scenario results do not reflect strategies that management could employ to limit the impact of changing interest rate expectations.
To help address the impact of the COVID-19 pandemic on the economy and financial markets, the Federal Reserve reduced the benchmark federal funds rate to a target range of 0.00% to 0.25%. Throughout 2021, it elected to follow this approach as pandemic-related risks to the economy were likely to persist for the foreseeable future. At its January 2022 meeting, the Federal Reserve maintained the target interest rate at a range of 0.00% to 0.25% but reiterated its commitment to a shift away from pandemic-era economic stimulus toward containing inflation and signaled that the Federal Reserve was on track to raise interest rates in 2022 and 2023.
Twelve-Month Net Interest Income Simulation
Net interest income simulation modeling looks at interest rate risk through earnings. It projects the changes in interest rate sensitive asset and liability cash flows, expressed in terms of net interest income, over a specified time horizon for defined interest rates scenarios. Net interest income simulations generate insight into the impact of changes in market rates on earnings and guide risk management decisions. The Company assesses interest rate risk by comparing net interest income using different interest rate scenarios.
The following table presents the Company’s net interest income sensitivity related to an instantaneous and sustained non-parallel shift in market interest rates of 100 and 200 bps in an upward direction as of December 31, 2021 and 2020:
| Change in Interest Rates (in bps) | Net Interest Income Volatility (1) | |||||||||||||
| December 31, | ||||||||||||||
| 2021 | 2020 | |||||||||||||
| +200 | 19.5 | % | 12.6 | % | ||||||||||
| +100 | 9.4 | % | 5.6 | % | ||||||||||
| -100 | NM | NM | ||||||||||||
| -200 | NM | NM | ||||||||||||
NM — Not meaningful.
(1)The percentage change represents net interest income over 12 months in a stable interest rate environment versus net interest income in the various rate scenarios.
While an instantaneous and sustained non-parallel shift in market interest rates was used in the simulation model described in the preceding paragraphs, the Company believes that any shift in interest rates would likely be more gradual and would therefore have a more modest impact, and non-parallel gradual rate shift scenarios may give a more meaningful estimate of the Company’s underlying interest rate risk. The rate ramp table below shows the net income volatility under a gradual non-parallel shift of the yield curve upward, in even quarterly increments over the first 12 months, followed by rates held constant thereafter:
| Change in Interest Rates (in bps) | Net Interest Income Volatility (1) | |||||||||||||
| December 31, | ||||||||||||||
| 2021 | 2020 | |||||||||||||
| +200 Rate Ramp | 9.2 | % | 4.9 | % | ||||||||||
| +100 Rate Ramp | 4.1 | % | 2.2 | % | ||||||||||
| -100 Rate Ramp | NM | NM | ||||||||||||
| -200 Rate Ramp | NM | NM | ||||||||||||
NM — Not meaningful.
(1)The percentage change represents net interest income under a gradual non-parallel shift in even quarterly increments over 12 months.
70
As of December 31, 2021, the Company’s net interest income profile reflects an asset sensitive position. Net interest income is expected to increase if interest rates rise. The Company is naturally asset sensitive due to the large share of variable rate loans in its loan portfolio, which are primarily linked to Prime and LIBOR indices. The Company’s interest income is sensitive to changes in short-term interest rates. The Company’s deposit portfolio is primarily comprised of non-maturity deposits, which are not directly tied to short-term interest rate indices, but are, nevertheless, sensitive to changes in short-term interest rates.
As of December 31, 2021, the Company’s estimated twelve-month net interest income sensitivity was higher under both non-parallel rate shift and ramp increases, as compared with the sensitivity as of December 31, 2020. The increased rate sensitivity in the Company’s net interest income was primarily due to an increase in noninterest-bearing deposits and updated deposit assumptions.
Economic Value of Equity at Risk
Economic value of equity (“EVE”) is a cash flow calculation that takes the present value of all asset cash flows and subtracts the present value of all liability cash flows. This calculation is used for asset/liability management and measures changes in the economic value of the bank. The fair market values of a bank's assets and liabilities are directly linked to interest rates. The economic value approach provides a comparatively broader scope than the net income volatility approach since it captures all anticipated cash flows.
EVE simulation reflects the effect of interest rate shifts on the value of the Company and is used to assess the degree of interest rate risk exposure. In contrast to the earnings perspective, the economic perspective identifies risks arising from repricing or maturity gaps over the life of the balance sheet. Changes in economic value indicate anticipated changes in the value of the bank’s future cash flows. Thus, the economic perspective can provide a leading indicator of the bank’s future earnings and capital values. The economic value method also reflects sensitivity across the full maturity spectrum of the bank’s assets and liabilities.
The following table presents the Company’s EVE sensitivity related to an instantaneous and sustained non-parallel shift in market interest rates of 100 and 200 bps in an upward direction as of December 31, 2021 and 2020:
| Change in Interest Rates (in bps) | EVE Volatility (1) | |||||||||||||
| December 31, | ||||||||||||||
| 2021 | 2020 | |||||||||||||
| +200 | 7.1 | % | 9.6 | % | ||||||||||
| +100 | 3.5 | % | 4.8 | % | ||||||||||
| -100 | NM | NM | ||||||||||||
| -200 | NM | NM | ||||||||||||
NM — Not meaningful.
(1)The percentage change represents net portfolio value of the Company in a stable interest rate environment versus net portfolio value in the various rate scenarios.
The Company’s EVE sensitivity for the upward interest rate scenarios decreased as of December 31, 2021, compared with the results as of December 31, 2020. The changes in EVE sensitivity during this period were primarily due to changes in the level and shape of the yield curve, as well as changes in the balance sheet mix.
The Company’s EVE profile as of December 31, 2021, reflects an asset sensitive EVE position under the higher interest rate scenarios. Given the uncertainty of the magnitude, timing and direction of future interest rate movements, and the shape of the yield curve, actual results may vary from those predicted by the Company’s model.
71
Derivatives
It is the Company’s policy not to speculate on the future direction of interest rates, foreign currency exchange rates and commodity prices. However, the Company will periodically enter into derivative transactions in order to reduce its exposure to market risks, primarily interest rate risk and foreign currency risk. The Company believes that these derivative transactions, when properly structured and managed, may provide a hedge against inherent risk in certain assets and liabilities and against risk in specific transactions. Hedging transactions may be implemented using a variety of derivative instruments such as swaps, forwards and options. Prior to entering into any hedging activities, the Company analyzes the costs and benefits of the hedge in comparison to alternative strategies. In addition, the Company enters into derivative transactions in order to assist customers with their risk management objectives, such as managing exposure to fluctuations in interest rates, foreign currencies and commodity prices. To economically hedge against the derivative contracts entered into with the Company’s customers, the Company enters into mirrored derivative contracts with third-party financial institutions. The exposures from derivative transactions are collateralized by cash and/or eligible securities based on limits as set forth in the respective agreements entered between the Company and counterparty financial institutions.
The Company is subject to credit risk associated with the counterparties to the derivative contracts. This counterparty credit risk is a multi-dimensional form of risk, affected by both the exposure and credit quality of the counterparty, both of which are sensitive to market-induced changes. The Company’s Credit Risk Management Committee provides oversight of credit risks and the Company has guidelines in place to manage counterparty concentration, tenor limits and collateral. The Company manages the credit risk of its derivative positions by diversifying its positions among various counterparties, by entering into legally enforceable master netting arrangements, and by requiring collateral arrangements, where possible. The Company may also transfer counterparty credit risk-related to interest rate swaps to institutional third parties through the use of credit risk participation agreements. Certain derivative contracts are required to be centrally cleared through clearinghouses to further mitigate counterparty credit risk. The Company incorporates credit value adjustments and other market standard methodologies to appropriately reflect its own nonperformance risk and the respective counterparty’s nonperformance risk in the fair value measurements of its derivatives.
The following table summarizes certain information about derivative financial instruments utilized by the Company in its management of interest rate risk and foreign currency risk as of December 31, 2021 and 2020:
| December 31, | ||||||||||||||||||||||||||
| ($ in thousands) | 2021 | 2020 | ||||||||||||||||||||||||
| Interest Rate Contracts | Foreign Exchange Contracts | Interest Rate Contracts | Foreign Exchange Contracts | |||||||||||||||||||||||
| Derivatives designated as hedging instruments: | Cash Flow Hedges | Net Investment Hedges | Cash Flow Hedges | Net Investment Hedges | ||||||||||||||||||||||
| Notional amounts: | $ | 275,000 | $ | 86,531 | $ | 275,000 | $ | 84,269 | ||||||||||||||||||
| Fair value: | ||||||||||||||||||||||||||
| Recognized as an asset | — | — | — | — | ||||||||||||||||||||||
| Recognized as a liability | 57 | 225 | 1,864 | 235 | ||||||||||||||||||||||
| Net fair value | $ | (57) | $ | (225) | $ | (1,864) | $ | (235) | ||||||||||||||||||
| Weighted average interest rates: | ||||||||||||||||||||||||||
| Pay fixed (receive floating) | 0.351% (3-month USD-LIBOR) | NM | 0.483% (3-month USD-LIBOR) | NM | ||||||||||||||||||||||
Weighted average remaining term to maturity (in months): | 13.9 | 2.7 | 25.8 | 2.6 | ||||||||||||||||||||||
| Derivatives not designated as hedging instruments: | Interest Rate Contracts | Foreign Exchange Contracts | Interest Rate Contracts | Foreign Exchange Contracts | ||||||||||||||||||||||
| Notional amounts: | $ | 17,575,420 | $ | 1,874,681 | $ | 18,155,678 | $ | 3,108,488 | ||||||||||||||||||
| Fair value: | ||||||||||||||||||||||||||
| Recognized as an asset | 240,222 | 21,033 | 489,132 | 30,300 | ||||||||||||||||||||||
| Recognized as a liability | 179,905 | 15,276 | 315,834 | 22,524 | ||||||||||||||||||||||
| Net fair value | $ | 60,317 | $ | 5,757 | $ | 173,298 | $ | 7,776 | ||||||||||||||||||
NM — Not meaningful.
72
Derivatives Designated as Hedging Instruments — Interest rate and foreign exchange derivative contracts are utilized in the Company’s asset and liability management activities and serve as an efficient tool to manage the Company’s interest rate risk and foreign exchange risk. We use derivatives to hedge the risk of variable cash flows that the Company is exposed to from its variable interest rate borrowings, including repurchase agreements and FHLB advances. The Company also uses derivatives to hedge the risk of changes in the USD equivalent value of a designated monetary amount of the Company’s investment in East West Bank (China) Limited. For both cash flow and net investment hedges, the change in the fair value of the hedging instruments is recognized in AOCI, net of tax, on the Consolidated Balance Sheet.
The fluctuation in foreign currency translation of the hedged exposure is expected to be offset by changes in the fair value of the forward contracts. As of December 31, 2021, the outstanding foreign currency forward contracts effectively hedged approximately 50% of the net RMB exposure from East West Bank (China) Limited.
Changes to the composition of the Company’s derivatives designated as hedging instruments during 2021 reflect actions taken for interest rate risk and foreign exchange rate risk management. The Company repositions its derivatives portfolio based on the current assessment of economic and financial conditions, including the interest rate and foreign currency environments, balance sheet composition and trends, and the relative mix of its cash and derivative positions.
Derivatives Not Designated as Hedging Instruments — The Company enters into interest rate, foreign exchange and energy commodity contracts to support the business needs of its customers. When derivative transactions are executed with its customers, the derivative contracts are offset by paired trades with third-party financial institutions. The Company may enter into derivative contracts that are either exchange-traded, centrally cleared through a clearinghouse or over-the counter.
The Company offers various interest rate derivative contracts to its customers. For the interest rate contracts entered into with its customers, the Company managed its interest rate risk by entering into offsetting interest rate contracts with third-party financial institutions and central clearing organizations. Certain derivative contracts entered into with central clearing organizations are settled-to-market daily to the extent the central clearing organizations’ rulebooks legally characterize the variation margin as settlement. Derivative contracts allow borrowers to lock in attractive intermediate and long-term fixed rate financing while not increasing the interest rate risk to the Company. These transactions are not linked to any specific Company assets or liabilities on the Consolidated Balance Sheet, or to forecasted transactions in a hedging relationship, and are therefore classified as economic hedges. The contracts are marked-to-market at each reporting period. The changes in fair values of the derivative contracts traded with third-party financial institutions are expected to be largely comparable to the changes in fair values of the derivative transactions executed with customers throughout the terms of these contracts, except for the credit valuation adjustment component. The Company records credit valuation adjustments on the derivatives to properly reflect the variances of credit worthiness between the Company and the counterparties, considering the effects of enforceable master netting agreements and collateral arrangements.
The Company enters into foreign exchange contracts with its customers, consisting of forward, spot, swap and option contracts to accommodate the business needs of its customers. For the foreign exchange contracts entered into with its customers, the Company managed its foreign exchange and credit exposures by entering into offsetting foreign exchange contracts with third-party financial institutions and/or entering into bilateral collateral and master netting agreements with customer counterparties. The changes in the fair values entered with third-party financial institutions are expected to be largely comparable to the changes in fair values of the foreign exchange transactions executed with the customers throughout the terms of these contracts. As of December 31, 2021, the Company anticipates performance by all counterparties and has not experienced nonperformance by any of its counterparties, and therefore did not incur any related losses. The Company also utilizes foreign exchange contracts that are not designated as hedging instruments to mitigate the economic effect of fluctuations in certain foreign currency on-balance sheet assets and liabilities, primarily foreign currency denominated deposits offered to its customers. The Company’s policies permit taking proprietary currency positions within approved limits, in compliance with exemptions to proprietary trading restrictions provided under Section 619 of the Dodd-Frank Act, or the Volcker Rule. The Company does not speculate in the foreign exchange markets, and actively manages its foreign exchange exposures within prescribed risk limits and defined controls.
The Company enters into energy commodity contracts with its customers to allow them to hedge against the risk of energy commodity price fluctuations. To economically hedge against the risk of commodity price fluctuations in the products offered to its customers, the Company enters into offsetting commodity contracts with third-party financial institutions and central clearing organizations. Certain derivative contracts entered into with central clearing organizations are settled to market daily, to the extent the central clearing organizations’ rulebooks legally characterize the variation margin as settlement. The changes in fair values of the energy commodity contracts traded with third-party financial institutions are expected to be largely comparable to the changes in fair values of the energy commodity transactions executed with customers throughout the terms of these contracts.
73
Additional information on the Company’s derivatives is presented in Note 1 — Summary of Significant Accounting Policies — Significant Accounting Policies — Derivatives, Note 2 — Fair Value Measurement and Fair Value of Financial Instruments, and Note 5 — Derivatives to the Consolidated Financial Statements in this Form 10-K.
Critical Accounting Estimates
The Company’s significant accounting policies are described in Note 1 — Summary of Significant Accounting Policies to the Consolidated Financial Statements in this Form 10-K. Certain of these policies include critical accounting estimates, which are subject to valuation assumptions, subjective or complex judgments about matters that are inherently uncertain, and it is likely that materially different amounts could be reported under different assumptions and conditions. The Company has procedures and processes in place to facilitate making these judgments. The following is a brief description of the Company’s critical accounting estimates involving significant judgments.
Allowance for Loan Losses and Unfunded Credit Commitments
ASU 2016-13, Financial Instruments - Credit Losses (Topic 326): Measurement of Credit Losses on Financial Instruments requires the measurement of the allowance for credit losses to be based on management’s best estimate of lifetime expected credit losses inherent in the Company’s relevant financial assets. The Company’s allowance for credit losses, which includes both the allowance for loan losses and the allowance for unfunded credit commitments, is calculated with the objective of maintaining a reserve sufficient to absorb losses inherent in our credit portfolio. Management’s ongoing determination of the appropriateness of the allowance involves significant judgements including, but not limited to, the development and weighting of macroeconomic forecasts, incorporation of historical loss experience, assessment of key credit risk characteristics, assignment of risk ratings, valuation of collateral, and the determination of remaining expected life. The allowance for credit losses considers the unique risk characteristics of the loan portfolio segments. The commercial loan portfolio is comprised of C&I, CRE, multifamily residential, and construction and land loans; and the consumer loan portfolio is comprised of single-family residential, HELOCs, and other consumer loans.
When similar risk characteristics exist, the Company measures the expected loan losses on a collective pool basis. Lifetime loss rate models have been adopted for the portfolios, which use historical loss rates and forecast economic variables to calculate the expected credit losses for each loan pool. Models consisting of quantitative and qualitative components are designed for each pool to develop the expected credit loss estimate. Quantitative methods consider factors such as historical loss experience, the current credit quality of the portfolio, as well as an economic outlook over the life of the loan. Our allowance for credit losses is sensitive to the macroeconomic forecast assumptions. The Company incorporates forward-looking information using macroeconomic scenarios applied over the forecasted life of the loans. These macroeconomic scenarios, which are applied over a reasonable and supportable forecast period, consist of the base forecast representing management’s view of the most likely outcome reflected in the financial statements, along with two additional scenarios considered in calculating the allowance for loan loss estimate. The additional scenarios include downside and upside scenarios reflecting possible worsening or improving economic conditions. The scenarios are based on quantitative components, such as macroeconomic variables that are most relevant to the Company’s modeled credit losses, and qualitative components not already considered in the quantitative components, such as the environment factors including the uncertainties in the loan portfolio resulted from the estimated impact from the pandemic on credit losses, as well as the regulatory environment.
Under the base forecast, the U.S. unemployment rate is expected to fall from below 4.0% at the start of 2022 to 3.5% by the end of 2022 and remain in this range thereafter. The U.S. real GDP is expected to grow by 4.4% for 2022 and taper down to below 3.0% by mid-2023. The downside scenario assumed a slower recovery to full employment and forecasted an increase in the U.S. unemployment rate throughout 2022, averaging 4.1% higher than the base scenario with a peak difference of 5.5% in the first quarter of 2023. A flat growth is assumed for real GDP in 2022, followed by a slower recovery thereafter. The upside scenario assumed a more optimistic view for the economic recovery, including higher annual GDP growth at 6.3% for 2022 and a faster return to full employment by mid-2022.
The following sensitivity analysis does not represent management’s view of expected credit losses as of December 31, 2021 but is provided as hypothetical scenarios to assess the sensitivity of allowance for credit losses considering the impact of alternative macroeconomic forecasts. If the Company applied a 100% weighting to the downside scenario rather than a weighting of multiple scenarios, and excluded the effects of the qualitative components to the allowance for credit losses, the difference between the weighted qualitative modeled loss estimates and downside scenario as of December 31, 2021 are as follows:
•An increase of approximately $166 million in the allowance for credit losses for the commercial loan portfolio and its lending-related commitments.
74
•An increase of approximately $5 million in the allowance for credit losses for the consumer loan portfolio and its lending-related commitments.
The above sensitivity analysis is not intended to reflect the expected future changes in the allowance for credit losses. Additionally, qualitative factors such as the stress from the COVID-19 pandemic and the pace of the economic recovery, were excluded from the macroeconomic variables in the above sensitivity analysis, but were considered in estimating the allowance for credit losses as of December 31, 2021. While the effect of the current economic environment and the duration of the COVID-19 pandemic continues to be uncertain, the Company believes that its estimates for the allowance for credit losses are supported and reasonable.
When loans do not share risk characteristics, the Company evaluates the expected credit losses on an individual basis if, based on current information and events, it is probable that the Company will be unable to collect all amounts due according to the original contractual terms of the loan agreement. The following three different asset valuation measurement methods are available: (1) the present value of expected future cash flows, (2) the fair value of collateral less costs to sell, and (3) the loan’s observable market price. The allowance for loan losses for collateral-dependent loans is determined based on the fair value of the collateral less costs to sell. For loans that are not collateral-dependent, the Company applies the present value of expected future cash flows valuation or the market value of the loan.
The allowance for unfunded credit commitments includes reserves provided for unfunded loan commitments, letters of credit, SBLCs and recourse obligations for loans sold. For all off-balance sheet instruments and commitments, the unfunded credit exposure is calculated using utilization assumptions based on the Company's historical utilization experience in related portfolio segments. Loss rates are applied to the calculated exposure balances to estimate the allowance for unfunded credit commitments. Other elements such as credit risk factors for loans outstanding, terms and expiration dates of the unfunded credit facilities, and other pertinent information are considered to determine the adequacy of the allowance.
For additional information on allowance for credit losses, see Note 1 — Summary of Significant Accounting Policies and Note 6 — Loans Receivable and Allowance for Credit Losses to the Consolidated Financial Statements in this Form 10-K.
Fair Value Estimates
A portion of the Company’s financial instruments are carried at fair value on the Consolidated Balance Sheet, with changes in fair value recorded either through earnings or other comprehensive income (loss). Financial instruments measured on a recurring basis include AFS debt securities, certain equity securities and derivatives.
In determining the fair value of financial instruments, the Company uses market prices of the same or similar instruments whenever such prices are available. The Company does not use prices involving distressed sellers in determining fair value. Changes in the market conditions such as reduced liquidity in the capital markets or changes in secondary market activities, may increase variability or reduce the availability of market prices used to determine fair value. If observable market prices are unavailable or impracticable to obtain, then fair value is estimated using modeling techniques such as discounted cash flows analysis. These modeling techniques incorporate management’s assessments regarding assumptions that market participants would use in pricing the asset or the liability, including the risks inherent in a particular valuation technique and the risk of nonperformance. The use of methodologies or assumptions different than those used by the Company could result in different estimates of fair value of financial instruments.
Significant judgment is also required to determine the fair value hierarchy for certain financial instruments. When fair values are based on valuation techniques that require inputs that are both unobservable and significant to the overall fair value measurement, the financial assets and liabilities are classified as Level 3 of the fair value hierarchy established under ASC 820-10, Fair Value Measurement. Total recurring Level 3 assets were $215 thousand and $273 thousand as of December 31, 2021 and 2020, respectively, and there were no recurring Level 3 liabilities as of December 31, 2021 and 2020.
Assets measured on a nonrecurring basis, include certain individually evaluated loans held-for-investment, loans held-for-sale, investments in qualified affordable housing partnerships, tax credit and other investments, OREO and other nonperforming assets. Total non-recurring Level 3 assets were $127.0 million and $208.8 million as of December 31, 2021 and 2020, respectively.
For a complete discussion on the Company’s fair value hierarchy of financial instruments, fair value measurement techniques and assumptions, and the impact on the Consolidated Financial Statements, see Note 2 — Fair Value Measurement and Fair Value of Financial Instruments to the Consolidated Financial Statements in this Form 10-K.
75
Goodwill Impairment
The Company assesses goodwill for impairment annually, or more frequently if events or circumstances change that indicate a potential impairment at the reporting unit level. The Company has the option to perform a qualitative assessment of goodwill to determine whether it is likely or not the fair value is less than its carrying amount or elect to bypass the qualitative test and proceed directly to a quantitative test. Factors considered in qualitative assessments may include but are not limited to macroeconomic conditions, industry and market considerations, financial performance of the respective operating segment and other specific reporting unit considerations. If the qualitative analysis indicates that it is more likely than not that a reporting unit’s fair value is less than its carrying fair value, the Company is required to perform a quantitative assessment to determine if there is goodwill impairment. A quantitative valuation involves determining the fair value of each reporting unit and comparing the fair value to its corresponding carrying value. In order to determine the fair value of the reporting units, a combined income approach and market approach is used.
Significant judgments are applied and assumptions are made when estimating the fair value of the reporting units. Estimates of fair value are dependent upon various factors including estimates of the profitability of the Company’s reporting units, long term growth rates and the estimated market cost of equity, such as the discount rate and price multiples of comparable companies. Imprecision in estimating these factors can affect the estimated fair value of the reporting units. Certain events or circumstances could have a negative effect on the estimated fair value of the reporting units, including declines in business performance, increases in credit losses, as well as deterioration in economic or market conditions and adverse regulatory or legislative changes, which could result in a material impairment charge to earnings in a future period. As of December 31, 2021, there is no goodwill impairment booked as a result of the evaluation. For additional information on goodwill, see in Note 1 — Summary of Significant Accounting Policies and Note 8 — Goodwill and Other Intangible Assets to the Consolidated Financial Statements in this Form 10-K. For information on how reporting units were determined and the methodology and assumptions used to determine reporting unit fair values, see Note 17 — Business Segments in this Form 10-K.
Income Taxes
The Company is subject to income tax laws of the various tax jurisdictions in which it conducts business, including the U.S., its states and the municipalities, and the tax jurisdictions in Hong Kong and China. The Company estimates income tax expense based on amounts expected to be owed to these various tax jurisdictions. The estimated income tax expense or benefit is reported on the Consolidated Statement of Income.
Accrued taxes represent the net estimated amount due to or due from various tax jurisdictions in the current year and are reported in Accrued expenses and other liabilities or Other assets on the Consolidated Balance Sheets. In estimating accrued taxes, the Company assesses the appropriate tax treatment of transactions and filing positions after considering statutes, regulations, judicial precedent, and other pertinent information. The income tax laws are complex and subject to different interpretations by the Company and the relevant government taxing authorities. Significant judgment is required in determining the tax accruals and in evaluating the tax positions, including evaluating uncertain tax positions. Changes in the estimate of accrued taxes occur periodically due to changes in tax rates, tax credits, interpretations of tax laws, the status of examinations by the tax authorities, and newly enacted statutory, judicial, and regulatory guidance that could impact the relative merits and risks of tax positions. These changes, when occur, impact tax expense and can materially affect our operating results and financial condition. The Company reviews its tax positions on a quarterly basis and makes adjustments to accrued taxes as new information becomes available.
Deferred tax assets represent amounts available to reduce income taxes payable in future years. Such assets arise due to temporary differences between the financial accounting basis and the income tax basis of assets and liabilities, as well as from net operating losses and tax credit carryforwards. The Company regularly evaluates the realizability of deferred tax assets. The available evidence used in connection with the evaluations includes taxable income, potential tax-planning strategies, and projected future reversals of deferred tax items. A valuation allowance is established for deferred tax assets if, based on the weight of available evidence, it is more-likely-than-not that some portion or all of the deferred tax assets will not be realized.
76
The Company reports a liability for unrecognized tax benefits resulting from uncertain tax positions taken, or expected to be taken, in an income tax return. Uncertain tax positions that meet the more-likely-than-not recognition threshold are measured to determine the amount of benefit to recognize. An uncertain tax position is measured at the largest amount of benefit that management believes has a greater than 50% likelihood of realization upon settlement. Tax benefits not meeting our realization criteria represent unrecognized tax benefits. The Company establishes a liability for potential taxes, interest and penalties related to uncertain tax positions based on facts and circumstances, including the interpretation of existing law, new judicial or regulatory guidance, and the status of tax audits. The Company believes that adequate provisions have been recorded for all income tax uncertainties consistent with ASC 740, Income Taxes as of December 31, 2021. See Note 11 — Income Taxes to the Consolidated Financial Statements in this Form 10-K for additional information on income taxes.
Recently Issued Accounting Standards
For detailed discussion and disclosure on new accounting pronouncements adopted and recent accounting standards, see Note 1 — Summary of Significant Accounting Policies to the Consolidated Financial Statements in this Form 10-K.
Reconciliation of GAAP to Non-GAAP Financial Measures
To supplement the Company’s Consolidated Financial Statements presented in accordance with U.S. GAAP, the Company uses certain non-GAAP measures of financial performance. Non-GAAP financial measures are not prepared in accordance with, or as an alternative to U.S. GAAP. Generally, a non-GAAP financial measure is a numerical measure of a company’s performance that either excludes or includes amounts that are not normally excluded or included in the most directly comparable measure calculated and presented in accordance with U.S. GAAP. A non-GAAP financial measure may also be a financial metric that is not required by U.S. GAAP or other applicable requirements. The Company believes these non-GAAP financial measures, when taken together with the corresponding U.S. GAAP financial measures, provide meaningful supplemental information regarding its performance, and allow comparability to prior periods. These non-GAAP financial measures may be different from non-GAAP financial measures used by other companies, limiting their usefulness for comparison purposes.
During 2020, the Company recorded $10.7 million in recoveries, of which $1.1 million was recorded as an impairment recovery, and $5.1 million in uncertain tax position related to DC Solar. In addition, the Company prepaid $150.0 million of repurchase agreements and incurred a debt extinguishment cost of $8.7 million in 2020. During 2019, the Company recorded a $7.0 million impairment charge, reversed $30.1 million of certain previously claimed tax credits and subsequently recovered $1.6 million related to DC Solar.
77
The following tables present the reconciliation of U.S. GAAP to non-GAAP financial measures of 2021, 2020 and 2019:
| ($ and shares in thousands, except per share data) | Year Ended December 31, | ||||||||||||||||||||||
| 2021 | 2020 | 2019 | |||||||||||||||||||||
| Net income | (a) | $ | 872,981 | $ | 567,797 | $ | 674,035 | ||||||||||||||||
| Adjustments related to DC Solar | |||||||||||||||||||||||
Add: Impairment charge (1) | — | — | 6,978 | ||||||||||||||||||||
Less: Recoveries (1) | — | (10,739) | (1,583) | ||||||||||||||||||||
Tax effect of adjustments (2) | — | 3,047 | (1,595) | ||||||||||||||||||||
| Add: Reversal of certain previously claimed tax credits | — | — | 30,104 | ||||||||||||||||||||
Add: Uncertain tax position recorded in income tax expense | — | 5,127 | — | ||||||||||||||||||||
| Non-GAAP net income | (b) | $ | 872,981 | $ | 565,232 | $ | 707,939 | ||||||||||||||||
Diluted weighted-average number of shares outstanding | 143,140 | 142,991 | 146,179 | ||||||||||||||||||||
| Diluted EPS | $ | 6.10 | $ | 3.97 | $ | 4.61 | |||||||||||||||||
| Adjustments related to DC Solar | |||||||||||||||||||||||
| Impairment charge, net of tax | — | — | 0.03 | ||||||||||||||||||||
| Recoveries, net of tax | — | (0.06) | (0.01) | ||||||||||||||||||||
| Reversal of certain previously claimed tax credits | — | — | 0.21 | ||||||||||||||||||||
| Uncertain tax position recorded in income tax expense | — | 0.04 | — | ||||||||||||||||||||
| Non-GAAP diluted EPS | $ | 6.10 | $ | 3.95 | $ | 4.84 | |||||||||||||||||
| Average total assets | (c) | $ | 59,251,091 | $ | 48,937,793 | $ | 42,484,885 | ||||||||||||||||
| Average stockholders’ equity | (d) | $ | 5,559,212 | $ | 5,082,186 | $ | 4,760,845 | ||||||||||||||||
| ROA | (a)/(c) | 1.47 | % | 1.16 | % | 1.59 | % | ||||||||||||||||
| Non-GAAP ROA | (b)/(c) | 1.47 | % | 1.16 | % | 1.67 | % | ||||||||||||||||
| ROE | (a)/(d) | 15.70 | % | 11.17 | % | 14.16 | % | ||||||||||||||||
| Non-GAAP ROE | (b)/(d) | 15.70 | % | 11.12 | % | 14.87 | % | ||||||||||||||||
(1)Included in Amortization of tax credit and other investments on the Consolidated Statement of Income.
(2)Applied statutory tax rates of 28.77% for 2021, 28.37% for 2020 and 29.56% for 2019.
| ($ in thousands) | Year Ended December 31, | ||||||||||||||||||||||||||||
| 2021 | 2020 | 2019 | |||||||||||||||||||||||||||
Net interest income before provision for credit losses | (a) | $ | 1,531,571 | $ | 1,377,193 | $ | 1,467,813 | ||||||||||||||||||||||
| Total noninterest income | 285,895 | 235,547 | 222,245 | (1) | |||||||||||||||||||||||||
Total revenue | (b) | $ | 1,817,466 | $ | 1,612,740 | $ | 1,690,058 | ||||||||||||||||||||||
| Total noninterest expense | (c) | $ | 796,089 | $ | 716,322 | $ | 747,456 | (1) | |||||||||||||||||||||
| Less: Amortization of tax credit and other investments | (122,457) | (70,082) | (98,383) | (1) | |||||||||||||||||||||||||
| Amortization of core deposit intangibles | (2,749) | (3,634) | (4,518) | ||||||||||||||||||||||||||
| Repurchase agreements’ extinguishment cost | — | (8,740) | — | ||||||||||||||||||||||||||
| Non-GAAP noninterest expense | (d) | $ | 670,883 | $ | 633,866 | $ | 644,555 | ||||||||||||||||||||||
| Efficiency ratio | (c)/(b) | 43.80 | % | 44.42 | % | 44.23 | % | ||||||||||||||||||||||
| Non-GAAP efficiency ratio | (d)/(b) | 36.91 | % | 39.30 | % | 38.14 | % | ||||||||||||||||||||||
(1)In the fourth quarter of 2020, the Company reclassified certain income/losses from equity-method investments from Amortization of tax credit and other investments to Other investment income, with no effect on net income. Prior-period amounts have been revised to conform with the current presentation.
78
| ($ and shares in thousands, except per share data) | December 31, | |||||||||||||||||||||||||
| 2021 | 2020 | 2019 | ||||||||||||||||||||||||
| Stockholders’ equity | (a) | $ | 5,837,218 | $ | 5,269,175 | $ | 5,017,617 | |||||||||||||||||||
| Less: Goodwill | (465,697) | (465,697) | (465,697) | |||||||||||||||||||||||
Other intangible assets (1) | (9,334) | (11,899) | (16,079) | |||||||||||||||||||||||
| Non-GAAP tangible common equity | (b) | $ | 5,362,187 | $ | 4,791,579 | $ | 4,535,841 | |||||||||||||||||||
| Total assets | (c) | $ | 60,870,701 | $ | 52,156,913 | $ | 44,196,096 | |||||||||||||||||||
| Less: Goodwill | (465,697) | (465,697) | (465,697) | |||||||||||||||||||||||
Other intangible assets (1) | (9,334) | (11,899) | (16,079) | |||||||||||||||||||||||
| Non-GAAP tangible assets | (d) | $ | 60,395,670 | $ | 51,679,317 | $ | 43,714,320 | |||||||||||||||||||
| Total stockholders’ equity to total assets | (a)/(c) | 9.59 | % | 10.10 | % | 11.35 | % | |||||||||||||||||||
Non-GAAP tangible common equity to tangible assets | (b)/(d) | 8.88 | % | 9.27 | % | 10.38 | % | |||||||||||||||||||
| Number of common shares, at period-end | (e) | 141,908 | 141,565 | 145,625 | ||||||||||||||||||||||
| Non-GAAP tangible common equity per share | (b)/(e) | $ | 37.79 | $ | 33.85 | $ | 31.15 | |||||||||||||||||||
(1)Includes core deposit intangibles and mortgage servicing assets.
| ($ in thousands) | Year Ended December 31, | ||||||||||||||||||||||
| 2021 | 2020 | 2019 | |||||||||||||||||||||
| Net income | $ | 872,981 | $ | 567,797 | $ | 674,035 | |||||||||||||||||
| Add: Amortization of core deposit intangibles | 2,749 | 3,634 | 4,518 | ||||||||||||||||||||
| Amortization of mortgage servicing assets | 1,679 | 1,920 | 2,738 | ||||||||||||||||||||
Tax effect of adjustments (1) | (1,274) | (1,575) | (2,145) | ||||||||||||||||||||
| Non-GAAP tangible net income | (a) | $ | 876,135 | $ | 571,776 | $ | 679,146 | ||||||||||||||||
| Average stockholders’ equity | $ | 5,559,212 | $ | 5,082,186 | $ | 4,760,845 | |||||||||||||||||
| Less: Average goodwill | (465,697) | (465,697) | (465,663) | ||||||||||||||||||||
Average other intangible asset (2) | (10,535) | (13,769) | (19,340) | ||||||||||||||||||||
| Non-GAAP average tangible equity | (b) | $ | 5,082,980 | $ | 4,602,720 | $ | 4,275,842 | ||||||||||||||||
| Non-GAAP return on average tangible equity | (a)/(b) | 17.24 | % | 12.42 | % | 15.88 | % | ||||||||||||||||
(1)Applied statutory rate of 28.77% for 2021, 28.37% for 2020, and 29.56% for 2019.
(2)Includes core deposit intangibles and mortgage servicing assets.
| Yield on Average Loans ($ in thousands) | Year Ended December 31, | ||||||||||||||||||||||
| 2021 | 2020 | 2019 | |||||||||||||||||||||
| Interest income on loans | (a) | $ | 1,424,900 | $ | 1,464,382 | $ | 1,717,415 | ||||||||||||||||
| Less: Interest income on PPP loans | (55,198) | (43,271) | — | ||||||||||||||||||||
| Adjusted interest income on loans | (b) | 1,369,702 | 1,421,111 | 1,717,415 | |||||||||||||||||||
| Average loans | (c) | $ | 39,716,697 | $ | 36,799,017 | $ | 33,373,136 | ||||||||||||||||
| Less: Average PPP loans | (1,393,302) | (1,236,246) | — | ||||||||||||||||||||
| Adjusted average loans | (d) | $ | 38,323,395 | $ | 35,562,771 | $ | 33,373,136 | ||||||||||||||||
Average loan yield (1) | (a)/(c) | 3.59 | % | 3.98 | % | 5.15 | % | ||||||||||||||||
Adjusted average loan yield (1) | (b)/(d) | 3.57 | % | 4.00 | % | 5.15 | % | ||||||||||||||||
79
ITEM 7A. QUANTITATIVE AND QUALITATIVE DISCLOSURES ABOUT MARKET RISK
For quantitative and qualitative disclosures regarding market risk in the Company’s portfolio, see Item 7. MD&A — Risk Management — Market Risk Management and Note 5 — Derivatives to the Consolidated Financial Statements in this Form 10-K.
80
EAST WEST BANCORP, INC.
ITEM 8. FINANCIAL STATEMENTS AND SUPPLEMENTARY DATA
TABLE OF CONTENTS
| Page | |||||||||||
81
REPORT OF INDEPENDENT REGISTERED PUBLIC ACCOUNTING FIRM
To the Stockholders and Board of Directors
East West Bancorp, Inc.:
Opinion on the Consolidated Financial Statements
We have audited the accompanying consolidated balance sheet of East West Bancorp, Inc. and subsidiaries (the Company) as of December 31, 2021 and 2020, the related consolidated statements of income, comprehensive income, changes in stockholders’ equity, and cash flows for each of the years in the three‑year period ended December 31, 2021, and the related notes (collectively, the consolidated financial statements). In our opinion, the consolidated financial statements present fairly, in all material respects, the financial position of the Company as of December 31, 2021 and 2020, and the results of its operations and its cash flows for each of the years in the three‑year period ended December 31, 2021, in conformity with U.S. generally accepted accounting principles.
We also have audited, in accordance with the standards of the Public Company Accounting Oversight Board (United States) (PCAOB), the Company’s internal control over financial reporting as of December 31, 2021, based on criteria established in Internal Control — Integrated Framework (2013) issued by the Committee of Sponsoring Organizations of the Treadway Commission, and our report dated February 28, 2022 expressed an unqualified opinion on the effectiveness of the Company’s internal control over financial reporting.
Change in Accounting Principle
As discussed in Note 1 to the consolidated financial statements, the Company has changed its method of accounting for the recognition and measurement of credit losses as of January 1, 2020 due to the adoption of ASU 2016-13, Financial Instruments — Credit Losses (Topic 326): Measurement of Credit Losses on Financial Instruments.
Basis for Opinion
These consolidated financial statements are the responsibility of the Company’s management. Our responsibility is to express an opinion on these consolidated financial statements based on our audits. We are a public accounting firm registered with the PCAOB and are required to be independent with respect to the Company in accordance with the U.S. federal securities laws and the applicable rules and regulations of the Securities and Exchange Commission and the PCAOB.
We conducted our audits in accordance with the standards of the PCAOB. Those standards require that we plan and perform the audit to obtain reasonable assurance about whether the consolidated financial statements are free of material misstatement, whether due to error or fraud. Our audits included performing procedures to assess the risks of material misstatement of the consolidated financial statements, whether due to error or fraud, and performing procedures that respond to those risks. Such procedures included examining, on a test basis, evidence regarding the amounts and disclosures in the consolidated financial statements. Our audits also included evaluating the accounting principles used and significant estimates made by management, as well as evaluating the overall presentation of the consolidated financial statements. We believe that our audits provide a reasonable basis for our opinion.
Critical Audit Matter
The critical audit matter communicated below is a matter arising from the current period audit of the consolidated financial statements that was communicated or required to be communicated to the audit committee and that: (1) relates to accounts or disclosures that are material to the consolidated financial statements and (2) involved our especially challenging, subjective, or complex judgments. The communication of a critical audit matter does not alter in any way our opinion on the consolidated financial statements, taken as a whole, and we are not, by communicating the critical audit matter below, providing a separate opinion on the critical audit matter or on the accounts or disclosures to which it relates.
82
Allowance for loan losses for loans evaluated on a collective pool basis
As discussed in Notes 1 and 6 to the consolidated financial statements, the Company adopted ASU No. 2016-13, Financial Instruments — Credit Losses (ASC Topic 326) as of January 1, 2020. As of December 31, 2021, the allowance for loan losses (ALL) was $542 million, which includes the ALL for commercial loans evaluated on a collective pool basis (the commercial collective ALL). The ALL is the portion of the loan’s amortized cost basis that the Company does not expect to collect due to anticipated credit losses over the loan’s contractual life, adjusted for estimated prepayments. The Company measured the expected credit losses on a collective pool basis when similar risk characteristics existed. The December 31, 2021 commercial collective ALL included quantitative and qualitative components (together, the collective ALL). The Company developed and documented the collective ALL methodology at the portfolio segment level. The collective ALL methodology used various models and estimation techniques based on the Company’s historical loss experience, current borrower characteristics, which included internal risk ratings, current conditions, and reasonable and supportable macroeconomic forecasts. The commercial loan portfolio is comprised of commercial and industrial (C&I) and commercial real estate (CRE), which also included multifamily residential, and construction and land loans. The Company’s C&I lifetime loss rate model estimated credit losses by estimating a loss rate expected over the life of a loan which is applied to the amortized cost basis, excluding accrued interest receivables, to determine expected credit losses. The Company’s CRE projected probability of defaults (PDs) and loss given defaults (LGDs) are applied to the estimated exposure at default, considering the term and payment structure of the loan, to generate estimates of expected loss. The Company incorporated forward-looking information using macroeconomic scenarios, which included variables that are considered key drivers of increases and decreases in credit losses. A probability-weighted multiple scenario forecast over a reasonable and supportable forecast period is incorporated into both the quantitative models. The Company’s C&I lifetime loss rate model reverts to the historical average loss rate, expressed through the loan-level lifetime loss rate, after the reasonable and supportable forecast period. The Company’s CRE model considers the contractual life of the loans and the forecast of future economic conditions return to long-run historical economic trends within the reasonable and supportable period. In order to estimate the life of a loan under both quantitative models, the contractual term of the loan is adjusted for estimated prepayments based on historical prepayment experience. The Company also considered qualitative factors in determining the commercial collective ALL, if these factors have not already been captured by the quantitative model.
We identified the assessment of the December 31, 2021 commercial collective ALL as a critical audit matter. A high degree of audit effort, including specialized skills and knowledge, and subjective and complex auditor judgment was involved in the assessment due to significant measurement uncertainty. Specifically, the assessment encompassed the evaluation of the collective ALL methodology, including an evaluation of the conceptual soundness and performance of the methods and models used to estimate (1) the quantitative component and its significant data elements and assumptions, which included portfolio segments, historic loss experience, reasonable and supportable forecast period, internal risk ratings, probability-weighted macroeconomic forecast scenarios, contractual term of the loan adjusted for estimated prepayments, and (2) the qualitative component. In addition, auditor judgment was required to evaluate the sufficiency of audit evidence obtained.
The following are the primary procedures we performed to address this critical audit matter. We evaluated the design and tested the operating effectiveness of certain internal controls related to the Company’s measurement of the collective ALL estimates, including controls over the:
•development of the collective ALL methodology
•continued use and appropriateness of changes made to the quantitative models
•performance monitoring of the quantitative models for the December 31, 2021 commercial collective ALL
•identification and determination of the significant data elements and assumptions used in the quantitative models
•development of the qualitative component
•analysis of the collective ALL results, trends, and ratios.
We evaluated the Company’s process to develop the collective ALL estimates by testing the models, significant data elements and assumptions that the Company used, and considered the relevance and reliability of such models, data, factors, and assumptions. We performed ratio and trend analysis over key ratios and peer comparison information relevant to the collective ALL. In addition, we involved credit risk professionals with specialized skills and knowledge, who assisted in:
83
•evaluating the Company’s collective ALL methodology for compliance with U.S. generally accepted accounting principles
•evaluating judgments made by the Company relative to the assessment, conceptual soundness and performance testing of the quantitative models, which are based on historical loss experience by comparing them to relevant Company-specific metrics and trends and the applicable industry and regulatory practices
•evaluating the judgments made by the Company in selecting the macroeconomic forecast scenarios, including the reasonable and supportable period and the related probability-weighted macroeconomic forecast scenarios
•determining whether the loan portfolio is pooled based on loans with similar risk characteristics by comparing to the Company’s business environment and relevant industry practices
•evaluating risk ratings for a selection of collectively evaluated loans
•evaluating the conceptual soundness of the framework used to develop the qualitative factors and the effect of those factors on the collective ALL compared with relevant credit risk factors and consistency with credit trends and identified limitations of the underlying quantitative models.
We also assessed the sufficiency of the audit evidence obtained related to the collective ALL estimates by evaluating the:
•cumulative results of audit procedures
•qualitative aspects of the Company’s accounting practices
•potential bias in accounting estimates.
/s/ KPMG LLP
We have served as the Company’s auditor since 2009.
Los Angeles, California
February 28, 2022
84
EAST WEST BANCORP, INC. AND SUBSIDIARIES
CONSOLIDATED BALANCE SHEET
($ in thousands, except shares)
| December 31, | ||||||||||||||
| 2021 | 2020 | |||||||||||||
| ASSETS | ||||||||||||||
| Cash and due from banks | $ | $ | ||||||||||||
| Interest-bearing cash with banks | ||||||||||||||
| Cash and cash equivalents | ||||||||||||||
| Interest-bearing deposits with banks | ||||||||||||||
| Assets purchased under resale agreements (“resale agreements”) | ||||||||||||||
| Securities: | ||||||||||||||
Available-for-sale (“AFS”) debt securities, at fair value (amortized cost of $ | ||||||||||||||
| Restricted equity securities, at cost | ||||||||||||||
| Loans held-for-sale | ||||||||||||||
Loans held-for-investment (net of allowance for loan losses of $ | ||||||||||||||
| Investments in qualified affordable housing partnerships, net | ||||||||||||||
| Investments in tax credit and other investments, net | ||||||||||||||
Premises and equipment (net of accumulated depreciation of $ | ||||||||||||||
| Goodwill | ||||||||||||||
| Operating lease right-of-use assets | ||||||||||||||
| Other assets | ||||||||||||||
| TOTAL | $ | $ | ||||||||||||
| LIABILITIES | ||||||||||||||
| Deposits: | ||||||||||||||
| Noninterest-bearing | $ | $ | ||||||||||||
| Interest-bearing | ||||||||||||||
| Total deposits | ||||||||||||||
| Short-term borrowings | ||||||||||||||
| Federal Home Loan Bank (“FHLB”) advances | ||||||||||||||
| Assets sold under repurchase agreements (“repurchase agreements”) | ||||||||||||||
| Long-term debt and finance lease liabilities | ||||||||||||||
| Operating lease liabilities | ||||||||||||||
| Accrued expenses and other liabilities | ||||||||||||||
| Total liabilities | ||||||||||||||
| COMMITMENTS AND CONTINGENCIES (Note 12) | ||||||||||||||
| STOCKHOLDERS’ EQUITY | ||||||||||||||
Common stock, $ | ||||||||||||||
| Additional paid-in capital | ||||||||||||||
| Retained earnings | ||||||||||||||
Treasury stock, at cost | ( | ( | ||||||||||||
| Accumulated other comprehensive (loss) income (“AOCI”), net of tax | ( | |||||||||||||
| Total stockholders’ equity | ||||||||||||||
| TOTAL | $ | $ | ||||||||||||
See accompanying Notes to Consolidated Financial Statements.
85
EAST WEST BANCORP, INC. AND SUBSIDIARIES
CONSOLIDATED STATEMENT OF INCOME
($ and shares in thousands, except per share data)
| Year Ended December 31, | ||||||||||||||||||||
| 2021 | 2020 | 2019 | ||||||||||||||||||
| INTEREST AND DIVIDEND INCOME | ||||||||||||||||||||
| Loans receivable, including fees | $ | $ | $ | |||||||||||||||||
AFS debt securities | ||||||||||||||||||||
| Resale agreements | ||||||||||||||||||||
| Restricted equity securities | ||||||||||||||||||||
| Interest-bearing cash and deposits with banks | ||||||||||||||||||||
| Total interest and dividend income | ||||||||||||||||||||
| INTEREST EXPENSE | ||||||||||||||||||||
| Deposits | ||||||||||||||||||||
| Short-term borrowings | ||||||||||||||||||||
| FHLB advances | ||||||||||||||||||||
| Repurchase agreements | ||||||||||||||||||||
| Long-term debt and finance lease liabilities | ||||||||||||||||||||
| Total interest expense | ||||||||||||||||||||
| Net interest income before (reversal of) provision for credit losses | ||||||||||||||||||||
| (Reversal of) provision for credit losses | ( | |||||||||||||||||||
| Net interest income after (reversal of) provision for credit losses | ||||||||||||||||||||
| NONINTEREST INCOME | ||||||||||||||||||||
| Lending fees | ||||||||||||||||||||
| Deposit account fees | ||||||||||||||||||||
| Interest rate contracts and other derivative income | ||||||||||||||||||||
| Foreign exchange income | ||||||||||||||||||||
| Wealth management fees | ||||||||||||||||||||
| Net gains on sales of loans | ||||||||||||||||||||
| Net gains on sales of AFS debt securities | ||||||||||||||||||||
Other investment income | ||||||||||||||||||||
| Other income | ||||||||||||||||||||
| Total noninterest income | ||||||||||||||||||||
| NONINTEREST EXPENSE | ||||||||||||||||||||
| Compensation and employee benefits | ||||||||||||||||||||
| Occupancy and equipment expense | ||||||||||||||||||||
| Deposit insurance premiums and regulatory assessments | ||||||||||||||||||||
| Deposit account expense | ||||||||||||||||||||
| Data processing | ||||||||||||||||||||
| Computer software expense | ||||||||||||||||||||
| Consulting expense | ||||||||||||||||||||
| Legal expense | ||||||||||||||||||||
| Other operating expense | ||||||||||||||||||||
| Amortization of tax credit and other investments | ||||||||||||||||||||
| Repurchase agreements’ extinguishment cost | ||||||||||||||||||||
| Total noninterest expense | ||||||||||||||||||||
| INCOME BEFORE INCOME TAXES | ||||||||||||||||||||
| INCOME TAX EXPENSE | ||||||||||||||||||||
| NET INCOME | $ | $ | $ | |||||||||||||||||
| EARNINGS PER SHARE (“EPS”) | ||||||||||||||||||||
| BASIC | $ | $ | $ | |||||||||||||||||
| DILUTED | $ | $ | $ | |||||||||||||||||
| WEIGHTED-AVERAGE NUMBER OF SHARES OUTSTANDING | ||||||||||||||||||||
| BASIC | ||||||||||||||||||||
| DILUTED | ||||||||||||||||||||
See accompanying Notes to Consolidated Financial Statements.
86
EAST WEST BANCORP, INC. AND SUBSIDIARIES
CONSOLIDATED STATEMENT OF COMPREHENSIVE INCOME
($ in thousands)
| Year Ended December 31, | ||||||||||||||||||||
| 2021 | 2020 | 2019 | ||||||||||||||||||
| Net income | $ | $ | $ | |||||||||||||||||
| Other comprehensive income, net of tax: | ||||||||||||||||||||
| Net changes in unrealized (losses) gains on AFS debt securities | ( | |||||||||||||||||||
Net changes in unrealized gains (losses) on cash flow hedges | ( | |||||||||||||||||||
| Foreign currency translation adjustments | ( | |||||||||||||||||||
| Other comprehensive (loss) income | ( | |||||||||||||||||||
| COMPREHENSIVE INCOME | $ | $ | $ | |||||||||||||||||
See accompanying Notes to Consolidated Financial Statements.
87
EAST WEST BANCORP, INC. AND SUBSIDIARIES
CONSOLIDATED STATEMENT OF CHANGES IN STOCKHOLDERS’ EQUITY
($ in thousands, except shares and per share data)
| Common Stock and Additional Paid-in Capital | Retained Earnings | Treasury Stock | AOCI, Net of Tax | Total Stockholders’ Equity | ||||||||||||||||||||||||||||||||||
| Shares | Amount | |||||||||||||||||||||||||||||||||||||
| BALANCE, DECEMBER 31, 2018 | $ | $ | $ | ( | $ | ( | $ | |||||||||||||||||||||||||||||||
| — | — | — | — | |||||||||||||||||||||||||||||||||||
| Net income | — | — | — | — | ||||||||||||||||||||||||||||||||||
| Other comprehensive income | — | — | — | — | ||||||||||||||||||||||||||||||||||
| Warrants exercised | — | — | ||||||||||||||||||||||||||||||||||||
| Issuance of common stock pursuant to various stock compensation plans and agreements | — | — | — | |||||||||||||||||||||||||||||||||||
| Repurchase of common stock pursuant to various stock compensation plans and agreements | ( | — | — | ( | — | ( | ||||||||||||||||||||||||||||||||
Cash dividends on common stock ($ | — | — | ( | — | — | ( | ||||||||||||||||||||||||||||||||
| BALANCE, DECEMBER 31, 2019 | $ | $ | $ | ( | $ | ( | $ | |||||||||||||||||||||||||||||||
| — | — | ( | — | — | ( | |||||||||||||||||||||||||||||||||
| Net income | — | — | — | — | ||||||||||||||||||||||||||||||||||
| Other comprehensive income | — | — | — | — | ||||||||||||||||||||||||||||||||||
| Issuance of common stock pursuant to various stock compensation plans and agreements | — | — | — | |||||||||||||||||||||||||||||||||||
| Repurchase of common stock pursuant to various stock compensation plans and agreements | ( | — | — | ( | — | ( | ||||||||||||||||||||||||||||||||
| Repurchase of common stock pursuant to the Stock Repurchase Program | ( | — | — | ( | — | ( | ||||||||||||||||||||||||||||||||
Cash dividends on common stock ($ | — | — | ( | — | — | ( | ||||||||||||||||||||||||||||||||
| BALANCE, DECEMBER 31, 2020 | $ | $ | $ | ( | $ | $ | ||||||||||||||||||||||||||||||||
| Net income | — | — | — | — | ||||||||||||||||||||||||||||||||||
| Other comprehensive loss | — | — | — | — | ( | ( | ||||||||||||||||||||||||||||||||
| Issuance of common stock pursuant to various stock compensation plans and agreements | — | — | — | |||||||||||||||||||||||||||||||||||
| Repurchase of common stock pursuant to various stock compensation plans and agreements | ( | — | — | ( | — | ( | ||||||||||||||||||||||||||||||||
Cash dividends on common stock ($ | — | — | ( | — | — | ( | ||||||||||||||||||||||||||||||||
| BALANCE, DECEMBER 31, 2021 | $ | $ | $ | ( | $ | ( | $ | |||||||||||||||||||||||||||||||
(1)Represents the impact of the adoption of Accounting Standards Update (“ASU”) 2016-02, Leases (Topic 842) and subsequent related ASUs on January 1, 2019.
(2)Represents the impact of the adoption of ASU 2016-13, Financial Instruments — Credit Losses (Topic 326) on January 1, 2020. Refer to Note 1 — Summary of Significant Accounting Policies to the Consolidated Financial Statements in this Annual Report on Form 10-K (“this Form 10-K”) for additional information.
See accompanying Notes to Consolidated Financial Statements.
88
EAST WEST BANCORP, INC. AND SUBSIDIARIES
CONSOLIDATED STATEMENT OF CASH FLOWS
($ in thousands)
| Year Ended December 31, | ||||||||||||||||||||
| 2021 | 2020 | 2019 | ||||||||||||||||||
| CASH FLOWS FROM OPERATING ACTIVITIES | ||||||||||||||||||||
| Net income | $ | $ | $ | |||||||||||||||||
| Adjustments to reconcile net income to net cash provided by operating activities: | ||||||||||||||||||||
| (Reversal of) provision for credit losses | ( | |||||||||||||||||||
| Depreciation and amortization | ||||||||||||||||||||
| Accretion of discount and amortization of premiums, net | ( | ( | ||||||||||||||||||
| Stock compensation costs | ||||||||||||||||||||
| Deferred income tax benefit | ( | ( | ||||||||||||||||||
| Net gains on sales of loans | ( | ( | ( | |||||||||||||||||
| Gains on sales of AFS debt securities | ( | ( | ( | |||||||||||||||||
| Net gains on sales of other real estate owned ("OREO") and other foreclosed assets | ( | ( | ( | |||||||||||||||||
| Impairment on OREO and other foreclosed assets | ||||||||||||||||||||
| Loans held-for-sale: | ||||||||||||||||||||
| Originations and purchases | ( | ( | ( | |||||||||||||||||
| Proceeds from sales and paydowns/payoffs of loans originally classified as held-for-sale | ||||||||||||||||||||
| Proceeds from distributions received from equity method investees | ||||||||||||||||||||
| Net change in accrued interest receivable and other assets | ( | ( | ||||||||||||||||||
| Net change in accrued expenses and other liabilities | ( | |||||||||||||||||||
| Other net operating activities | ( | |||||||||||||||||||
| Total adjustments | ||||||||||||||||||||
| Net cash provided by operating activities | ||||||||||||||||||||
| CASH FLOWS FROM INVESTING ACTIVITIES | ||||||||||||||||||||
| Net (increase) decrease in: | ||||||||||||||||||||
| Investments in qualified affordable housing partnerships, tax credit and other investments | ( | ( | ( | |||||||||||||||||
| Interest-bearing deposits with banks | ( | |||||||||||||||||||
| Resale agreements: | ||||||||||||||||||||
| Proceeds from paydowns and maturities | ||||||||||||||||||||
| Purchases | ( | ( | ( | |||||||||||||||||
| AFS debt securities: | ||||||||||||||||||||
| Proceeds from sales | ||||||||||||||||||||
| Proceeds from repayments, maturities and redemptions | ||||||||||||||||||||
| Purchases | ( | ( | ( | |||||||||||||||||
| Loans held-for-investment: | ||||||||||||||||||||
| Proceeds from sales of loans originally classified as held-for-investment | ||||||||||||||||||||
| Purchases | ( | ( | ( | |||||||||||||||||
| Other changes in loans held-for-investment, net | ( | ( | ( | |||||||||||||||||
| Premises and equipment: | ||||||||||||||||||||
| Proceeds from sales | ||||||||||||||||||||
| Purchases | ( | ( | ( | |||||||||||||||||
| Proceeds from sales of OREO and other foreclosed assets | ||||||||||||||||||||
| Purchase of bank-owned life insurance | ( | |||||||||||||||||||
| Distributions received from equity method investees | ||||||||||||||||||||
| Other net investing activities | ( | ( | ||||||||||||||||||
| Net cash used in investing activities | ( | ( | ( | |||||||||||||||||
See accompanying Notes to Consolidated Financial Statements.
89
EAST WEST BANCORP, INC. AND SUBSIDIARIES
CONSOLIDATED STATEMENT OF CASH FLOWS
($ in thousands)
(Continued)
| Year Ended December 31, | ||||||||||||||||||||
| 2021 | 2020 | 2019 | ||||||||||||||||||
| CASH FLOWS FROM FINANCING ACTIVITIES | ||||||||||||||||||||
| Net increase in deposits | ||||||||||||||||||||
| Net decrease in short-term borrowings | ( | ( | ( | |||||||||||||||||
| FHLB advances: | ||||||||||||||||||||
| Proceeds | ||||||||||||||||||||
| Repayments | ( | ( | ( | |||||||||||||||||
| Repurchase agreements: | ||||||||||||||||||||
| Proceeds | ||||||||||||||||||||
| Repayment | ( | |||||||||||||||||||
| Extinguishment cost | ( | |||||||||||||||||||
| Long-term debt and lease liabilities: | ||||||||||||||||||||
| Proceeds from long-term debt | ||||||||||||||||||||
| Repayments of long-term debt and lease liabilities | ( | ( | ( | |||||||||||||||||
| Common stock: | ||||||||||||||||||||
| Proceeds from issuance pursuant to various stock compensation plans and agreements | ||||||||||||||||||||
| Stock tendered for payment of withholding taxes | ( | ( | ( | |||||||||||||||||
| Repurchase of common stock pursuant to the Stock Repurchase Program | ( | |||||||||||||||||||
| Cash dividends paid | ( | ( | ( | |||||||||||||||||
| Net cash provided by financing activities | ||||||||||||||||||||
| Effect of exchange rate changes on cash and cash equivalents | ( | |||||||||||||||||||
| NET (DECREASE) INCREASE IN CASH AND CASH EQUIVALENTS | ( | |||||||||||||||||||
| CASH AND CASH EQUIVALENTS, BEGINNING OF YEAR | ||||||||||||||||||||
| CASH AND CASH EQUIVALENTS, END OF YEAR | $ | $ | $ | |||||||||||||||||
| SUPPLEMENTAL CASH FLOW INFORMATION: | ||||||||||||||||||||
| Cash paid during the year for: | ||||||||||||||||||||
| Interest | $ | $ | $ | |||||||||||||||||
| Income taxes, net | $ | $ | $ | |||||||||||||||||
| Noncash investing and financing activities: | ||||||||||||||||||||
| Loans transferred from held-for-investment to held-for-sale | $ | $ | $ | |||||||||||||||||
| Loans transferred to OREO | $ | $ | $ | |||||||||||||||||
See accompanying Notes to Consolidated Financial Statements.
90
EAST WEST BANCORP, INC. AND SUBSIDIARIES
NOTES TO CONSOLIDATED FINANCIAL STATEMENTS
Note 1 — Summary of Significant Accounting Policies
Organization
East West Bancorp, Inc. (referred to herein on an unconsolidated basis as “East West” and on a consolidated basis as the “Company”) is a registered bank holding company that offers a full range of banking services to individuals and businesses through its subsidiary bank, East West Bank and its subsidiaries (“East West Bank” or the “Bank”). The Bank is the Company’s principal asset. As of December 31, 2021, the Company operates in more than 120 locations in the United States (“U.S.”) and China. In the U.S., the Bank’s corporate headquarters and main administrative offices are located in California, and its branches and offices are located in California, Texas, New York, Massachusetts, Georgia, Washington, Nevada and Illinois. In China, East West’s presence includes full-service branches in Hong Kong, Shanghai, Shantou and Shenzhen, and representative offices in Beijing, Chongqing, Guangzhou and Xiamen. The Bank has a banking subsidiary based in China — East West Bank (China) Limited.
In 2019, the Company acquired East West Markets, LLC, a registered broker-dealer, and established East West Investment Management LLC, an investment adviser. Both East West Markets, LLC and East West Investment Management LLC are wholly-owned subsidiaries of East West.
Significant Accounting Policies
91
Debt securities are purchased for liquidity and investment purposes, as part of asset-liability management and other strategic activities. Debt securities for which the Company does not have the positive intention and ability to hold to maturity are classified as AFS. AFS debt securities are reported at fair value with unrealized gains and losses, net of applicable income taxes, and are included in AOCI, net of the allowance for credit losses. Interest income, including amortization of any premium or discount, is included in net income. We recognize realized gains and losses on the sale of AFS debt securities in earnings, using the specific identification method. For allowance for credit losses on AFS debt securities, refer to the Allowance for Credit Losses on Available-for-Sale Debt Securities section of this note for details.
Marketable equity securities that have readily determinable fair values are recorded at fair value with unrealized gains and losses, due to changes in fair value, reflected in earnings. Marketable equity securities include mutual fund investments, which are included in Investments in tax credit and other investments, net on the Consolidated Balance Sheet.
Non-marketable equity securities that do not have readily determinable fair values are accounted for under one of the following accounting methods:
•Equity Method — When we have the ability to exert significant influence over the investee.
•Cost Method — The cost method is applied to investments such as FRBSF and FHLB stock. These investments are held at their cost minus impairment. If impaired, the carrying value is written down to the fair value of the security.
•Measurement Alternative — This method is applied to all remaining non-marketable equity securities. These securities are carried at cost adjusted for impairment, if any, plus or minus observable price changes in orderly transactions of an identical or similar security of the same issuer.
Non-marketable equity securities include tax credit investments that are included in Investments in tax credit and other investments, net, and Other assets on the Consolidated Balance Sheet.
Our impairment review for equity method, cost method and measurement alternative securities typically includes an analysis of the facts and circumstances of each security, the intent or requirement to sell the security, the expectations of cash flows, capital needs and the viability of its business model. For equity method and cost method investments, we reduce the asset’s carrying value when we consider declines in value to be other-than-temporary impairment (“OTTI”). For securities accounted for under the measurement alternative, we reduce the asset value when the fair value is less than the carrying value, without the consideration of recovery.
92
Troubled Debt Restructurings — A loan is generally classified as a troubled debt restructuring (“TDR”) when the Company, for economic or legal reasons related to the borrower’s financial difficulties, grants a concession to the borrower that the Company would not otherwise consider. The concessions may be granted in various forms, including a below-market change in the stated interest rate, a reduction in the loan balance or accrued interest, an extension of the maturity date with a stated interest rate lower than the current market rate or note splits referred to as A/B note restructurings. Loans with contractual terms that have been modified as a TDR and are current at the time of restructuring may remain on accrual status if there is demonstrated performance prior to the restructuring and payment in full under the restructured terms is expected. Otherwise, these loans are placed on nonaccrual status and are reported as nonperforming, until the borrower demonstrates a sustained period of performance, generally six months, and the ability to repay the loan according to the contractual terms. If accruing TDRs cease to perform in accordance with their modified contractual terms, they are placed on nonaccrual status and reported as nonperforming TDRs. TDRs are included in the quarterly allowance for credit losses valuation process. Refer to Allowance for Loan Losses below for a complete discussion.
The Company has implemented various loan modification programs to provide its borrowers relief from the economic impacts of the COVID-19 pandemic. As provided under Section 4013 of the CARES Act, as amended by the Consolidated Appropriations Act, 2021 (“CAA”), the Company has elected not to apply TDR classification to any COVID-19 pandemic- related loan modifications that were executed after March 1, 2020 and earlier of (A) 60 days after the national emergency termination date concerning the COVID-19 pandemic outbreak or (B) January 1, 2022 to borrowers who were current as of December 31, 2019. For loans that were modified in response to the COVID-19 pandemic that do not meet the CARES Act criteria (e.g., current payment status as of December 31, 2019), the Company has applied the guidance included in the “Interagency Statement on Loan Modifications and Reporting for Financial Institutions Working with Customer Affected by the Coronavirus (Revised)” (the “Interagency Statement”) issued by the federal banking regulators on April 7, 2020. The Interagency Statement states that short-term loan modifications (i.e. six months or less) are not TDRs if they were made on a good faith basis in response to the COVID-19 pandemic to borrowers who were current as of the implementation date of a loan modification program. The aging on the delinquency of the loans modified under the CARES Act, as amended by the CAA, and the Interagency Statement is frozen at the time of the modification. Interest income continues to be recognized over the accommodation period.
93
Allowance for Loan Losses — The Company adopted ASU 2016-13, Financial Instruments — Credit Losses (Topic 326): Measurement of Credit Losses on Financial Instruments on January 1, 2020, which introduced a new current expected credit losses (“CECL”) model. The allowance for loan losses is established as management’s estimate of expected credit losses inherent in the Company’s lending activities; it is increased by the provision for credit losses and decreased by net charge-offs. The allowance for loan losses is evaluated quarterly by management based on regular reviews of the collectability of the Company’s loans, and more often if deemed necessary. The Company develops and documents the allowance for loan losses methodology at the portfolio segment level. The commercial loan portfolio is comprised of C&I, CRE, multifamily residential, and construction and land loans; and the consumer loan portfolio is comprised of single-family residential, HELOCs, and other consumer loans.
The allowance for loan losses represents the portion of a loan’s amortized cost basis that the Company does not expect to collect due to anticipated credit losses over the loan’s contractual life, adjusted for prepayments. The Company measures the expected loan losses on a collective pool basis when similar risk characteristics exist. Models consisting of quantitative and qualitative components are designed for each pool to develop the expected credit loss estimates. Reasonable and supportable forecast periods vary by loan portfolio. The Company has adopted lifetime loss rate models for the portfolios, which use historical loss rates and forecast economic variables to calculate the expected credit losses for each loan pool.
When loans do not share similar risk characteristics, the Company evaluates the loan for expected credit losses on an individual basis. Individually assessed loans include nonaccrual and TDR loans. The Company evaluates loans for expected credit losses on an individual basis if, based on current information and events, it is probable that the Company will be unable to collect all amounts due according to the original contractual terms of the loan agreement. The following three different asset valuation measurement methods are available: (1) the present value of expected future cash flows, (2) the fair value of collateral less costs to sell, and (3) the loan's observable market price. The allowance for loan losses for collateral-dependent loans is determined based on the fair value of the collateral less costs to sell. For loans that are not collateral-dependent, the Company applies the present value of expected future cash flows valuation or the market value of the loan. When the loan is deemed uncollectible, it is the Company’s policy to charge off the uncollectible amount against the allowance for credit losses.
The amortized cost of loans held-for-investment excludes accrued interest, which is included in Other assets on the Consolidated Balance Sheet. The Company has made an accounting policy election to not recognize an allowance for credit losses for accrued interest receivables as the Company reverses accrued interest if a loan is on nonaccrual status.
The allowance for loan losses is reported separately on the Consolidated Balance Sheet and the Provision for credit losses is reported on the Consolidated Statement of Income.
Allowance for Unfunded Credit Commitments — The allowance for unfunded credit commitments includes reserves provided for unfunded loan commitments, letters of credit, standby letters of credit (“SBLCs”) and recourse obligations for loans sold. The Company estimates the allowance for unfunded credit commitments over the contractual period in which the entity is exposed to credit risk via a present contractual obligation to extend credit. Within the period of credit exposure, the estimate of credit losses will consider both the likelihood that funding will occur, and an estimate of the expected credit losses on the commitments that are expected to fund over their estimated lives.
The allowance for unfunded credit commitments is maintained at a level believed by management to be sufficient to absorb estimated expected credit losses related to unfunded credit facilities. The determination of the adequacy of the allowance is based on periodic evaluations of the unfunded credit facilities. For all off-balance sheet instruments and commitments, the unfunded credit exposure is calculated using assumptions based on the Company's historical utilization experience in related portfolio segments. Loss rates are applied to the calculated exposure balances to estimate the allowance for unfunded credit commitments. Other elements such as credit risk factors for loans outstanding, terms and expiration dates of the unfunded credit facilities, and other pertinent information are considered to determine the adequacy of the allowance.
The allowance for unfunded credit commitments is included in the Accrued expenses and other liabilities on the Consolidated Balance Sheet. Changes to the allowance for unfunded credit commitments are included in Provision for credit losses on the Consolidated Income Statements.
94
Allowance for Credit Losses on Available-for-Sale Debt Securities — For each reporting period, every AFS debt security that is in an unrealized loss position is individually analyzed as part of the Company’s ongoing assessments to determine whether a fair value below the amortized cost basis has resulted from a credit loss or other factors. The initial indicator of impairment is a decline in fair value below the amortized cost of the AFS debt security, excluding accrued interest. The Company first considers whether there is a plan to sell the AFS debt security or it is more-likely-than-not that it will be required to sell the debt security before recovery of the amortized cost. In determining whether an impairment is due to credit related factors, the Company considers the severity of the decline in fair value, nature of the security, the underlying collateral, the financial condition of the issuer, changes in the AFS debt security’s ratings and other qualitative factors. For AFS debt securities that are guaranteed or issued by the U.S. government, or government-sponsored enterprises of high credit quality, the Company applies a zero credit loss assumption.
When the Company does not intend to sell the impaired AFS debt security and it is more-likely-than-not that the Company will not be required to sell the impaired debt security prior to recovery of its amortized cost basis, the credit component of the unrealized loss of the impaired AFS debt security is recognized as an allowance for credit losses, with a corresponding Provision for credit losses on the Consolidated Statement of Income and the non-credit component is recognized in Other comprehensive income (loss) on the Consolidated Statement of Comprehensive Income, net of applicable taxes. At each reporting period, the Company increases or decreases the allowance for credit losses as appropriate, while limiting reversals of the allowance for credit losses to the extent of the amounts previously recorded. If the Company intends to sell the impaired debt security or it is more-likely-than-not that the Company will be required to sell the impaired debt security prior to recovering its amortized cost basis, the entire impairment amount is recognized as an adjustment to the debt security’s amortized cost basis, with a corresponding Provision for credit losses on the Consolidated Statement of Income.
The amortized cost of the Company’s AFS debt securities excludes accrued interest, which is included in Other assets on the Consolidated Balance Sheet. The Company has made an accounting policy election to not recognize an allowance for credit losses for accrued interest receivables on AFS debt securities as the Company reverses any accrued interest if a debt security is impaired. As each AFS debt security has a unique security structure, where the accrual status is clearly determined when certain criteria listed in the terms are met, the Company assesses the default status of each security as defined by the debt security’s specific security structure.
Other-Than-Temporary Impairment Assessment on AFS Debt Securities Prior to the Adoption of the CECL Guidance, Applicable for the Year Ended December 31, 2019 — For each reporting period, debt securities classified as either AFS or held-to-maturity debt securities that were in an unrealized loss position were analyzed as part of the Company’s ongoing OTTI assessment. The initial indicator of OTTI was a decline in fair value below the amortized cost of the debt security. In determining whether OTTI had occurred, the Company considered the severity and duration of the decline in fair value, the length of time expected for recovery, the financial condition of the issuer, changes in the debt securities’ ratings and other qualitative factors, as well as whether the Company either planned to sell the debt security or it was more-likely-than-not that it would be required to sell the debt security before recovery of the amortized cost. When the Company did not intend to sell the impaired debt security and it was more-likely-than-not that the Company would not be required to sell the impaired debt security prior to recovery of its amortized cost basis, the credit component of an OTTI of the impaired debt security was recognized as OTTI loss on the Consolidated Statement of Income and the non-credit component was recognized in other comprehensive income. This applied for both AFS and held-to-maturity debt securities. If the Company intended to sell the impaired debt security or it was more-likely-than-not that the Company would be required to sell the impaired debt security prior to recovery of its amortized cost basis, the full amount of the impairment loss (equal to the difference between the debt security’s amortized cost basis and its fair value at the balance sheet date) was recognized as OTTI loss on the Consolidated Statement of Income. Following the recognition of OTTI, the debt security’s new amortized cost basis was the previous basis minus the OTTI amount recognized in earnings.
Allowance for Collateral-Dependent Financial Assets — A financial asset is considered collateral-dependent if repayment is expected to be provided substantially through the operation or sale of the collateral. The allowance for credit losses is measured on an individual basis for collateral-dependent financial assets and determined by comparing the fair value of the collateral, minus the cost to sell, to the amortized cost basis of the related financial asset at the reporting date. Other than loans, collateral-dependent financial assets could also include resale agreements. In arrangements which the borrower must continually adjust the collateral securing the asset to reflect changes in the collateral’s fair value (e.g., resale agreements), the Company estimates the expected credit losses on the basis of the unsecured portion of the amortized cost as of the balance sheet date. If the fair value of the collateral is equal to or greater than the amortized cost of the resale agreement, the expected losses would be zero. If the fair value of the collateral is less than the amortized cost of the asset, the expected losses are limited to the difference between the fair value of the collateral and the amortized cost basis of the resale agreement.
95
Allowance for Purchased Credit Deteriorated Assets — ASU 2016-13 replaces the concept of purchased credit impaired (“PCI”) accounting under ASC 310-30 Receivables — Loans and Debt Securities Acquired with Deteriorated Credit Quality with the concept of purchased financial assets with credit deterioration. The Company adopted ASU 2016-13 using the prospective transition approach for Purchased Credit Deteriorated (“PCD”) assets that were previously classified as PCI assets. PCD financial assets are defined as acquired individual financial assets (or groups with similar risk characteristics) that as of the date of acquisition, have experienced a more-than-insignificant deterioration in credit quality since origination. For PCD debt securities and PCD loans, the company records the allowance for credit losses by grossing up the initial amortized cost, which includes the purchase price and the allowance for credit losses. The expected credit losses of PCD debt securities are measured at the individual security level. The expected credit losses for PCD loans are measured based on the loan’s unpaid principal balance. Beginning January 1, 2020, for any asset designated as a PCD asset at the time of acquisition, the Company estimates and records an allowance for credit losses, which is added to the purchase price to establish the initial amortized cost basis of the financial asset. Hence, there is no income statement impact from the acquisition. Subsequent changes in the allowance for credit losses on PCD assets will be recognized in Provision for credit losses on the Consolidated Statement of Income. The non-credit discount or premium will be accreted to interest income based on the effective interest rate on the PCD assets determined after the gross-up for the allowance for credit losses.
Allowance for Credit Losses Prior to the Adoption of the CECL Guidance, Applicable for the Year Ended December 31, 2019 — Prior to CECL adoption, the allowance of credit losses represented the Company’s estimate of probable credit losses inherent in the lending activities, and consisted of general and specific reserves. Impaired loans were subject to specific reserves. Non-impaired loans were evaluated as part of the general reserve. General reserves were calculated by utilizing both quantitative and qualitative factors. There were different qualitative risks for the loans in each portfolio segment. Predominant risk characteristics of the CRE, multifamily, single-family residential, and HELOC loans considered the collateral and geographic locations of the properties collateralizing the loans. Predominant risk characteristics of the C&I loans included cash flows, debt service and collateral of the borrowers and guarantors, as well as the economic and market conditions.
Impaired Loans Prior to the Adoption of the CECL Guidance, Applicable for the Years Ended December 31, 2019 — Impaired loans were identified and evaluated for impairment on an individual basis. A loan was considered impaired when, based on current information and events, it was probable that the Company would not be able to collect all scheduled payments of principal or interest due in accordance with the original contractual terms of the loan agreement. Factors considered by management in determining and measuring loan impairment included payment status, collateral value, and the probability of collecting scheduled principal and interest payments when due. Impaired loans were measured based on the present value of expected future cash flows discounted at a designated discount rate or, as appropriate, at the loan’s observable market price or the fair value of the collateral, if the loan was collateral dependent, less cost to sell.
Purchased Credit-Impaired Loans Prior to the Adoption of the CECL Guidance, Applicable for the Year Ended December 31, 2019 — Acquired loans were recorded at fair value as of acquisition date in accordance with ASC 805, Business Combinations. A purchased loan was deemed to be credit impaired when there was evidence of credit deterioration since its origination and it was probable at the acquisition date that the Company would be unable to collect all contractually required payments and was accounted for under ASC 310-30, Receivables — Loans and Debt Securities Acquired with Deteriorated Credit Quality. Under ASC 310-30, loans were recorded at fair value at acquisition date, factoring in credit losses expected to be incurred over the life of the loan. Accordingly, an allowance for loan losses was not carried over or recorded as of the acquisition date.
96
Investments in Qualified Affordable Housing Partnerships, Tax Credit and Other Investments, Net — The Company records the investments in qualified affordable housing partnerships, net, using the proportional amortization method. Under the proportional amortization method, the Company amortizes the initial cost of the investment in proportion to the tax credits and other tax benefits received, and recognizes the amortization in Income tax expense on the Consolidated Statement of Income.
The Company records investments in tax credit and other investments, net, using either the equity method, cost method of accounting or the measurement alternative method of accounting. The tax credits are recognized on the Consolidated Financial Statements to the extent they are utilized on the Company’s income tax returns in the year the credit arises under the flow-through method of accounting. The investments are reviewed for impairment on an annual basis or on an interim basis, if an event occurs that would trigger potential impairment.
Premises and Equipment, Net — The Company’s premises and equipment are stated at cost less accumulated depreciation and amortization. Depreciation and amortization are computed based on the straight-line method over the estimated useful lives of the various classes of assets. The ranges of estimated useful lives for the principal classes of assets are as follows:
| Premises and Equipment | Useful Lives | |||||||
| Buildings | ||||||||
| Furniture, fixtures and equipment, and building improvements | ||||||||
| Leasehold improvements | Term of lease or useful life, whichever is shorter | |||||||
The Company reviews its long-lived assets for impairment annually, or when events or changes in circumstances indicate that the carrying amounts of these assets may not be recoverable. An asset is considered impaired when the fair value, which is the expected undiscounted cash flows over the remaining useful life, is less than the net book value. The excess of the net book value over its fair value is charged as impairment loss to noninterest expense.
Goodwill and Other Intangible Assets — Goodwill represents the excess of the purchase price over the fair value of net assets acquired in an acquisition. Goodwill is tested for impairment on an annual basis as of December 31, or more frequently as events occur or circumstances change that indicate a potential impairment at the reporting unit level. The Company assesses goodwill for impairment at each operating segment level. The Company organizes its operations into three reporting segments: (1) Consumer and Business Banking; (2) Commercial Banking; and (3) Other. For information on how the reporting units are identified and the components are aggregated, see Note 17 — Business Segments to the Consolidated Financial Statements in this Form 10-K. The Company has the option to perform a qualitative assessment of goodwill or elect to bypass the qualitative test and proceed directly to a quantitative test. If the Company performs a qualitative assessment of goodwill to test for impairment and concludes it is more likely than not that a reporting unit’s fair value is greater than its carrying value, quantitative tests are not required. If the qualitative analysis indicates that it is more likely than not that a reporting unit’s fair value is less than its carrying value, the Company is required to perform a quantitative assessment to determine if there is goodwill impairment. Factors considered in the qualitative assessments include but are not limited to macroeconomic conditions, industry and market considerations, financial performance of the respective operating segment and other reporting unit specific considerations. The Company uses a combined income and market approach in its quantitative valuation methodologies. A quantitative valuation involves determining the fair value of each reporting unit and comparing the fair value to its corresponding carrying value. Goodwill impairment loss is recorded as a charge to noninterest expense and an adjustment to the carrying value of goodwill. Subsequent reversals of goodwill impairment are not allowed.
Other intangible assets are mainly comprised of core deposit intangibles and are included in Other assets on the Consolidated Balance Sheet. Core deposit intangibles represent the intangible value of depositor relationships resulting from deposits assumed in various acquisitions. Core deposit intangibles are amortized over the projected useful lives of the deposits, which is between to 15 years. The impairment test is performed annually, or more frequently as events occur or changes in circumstances indicate that the intangible asset’s carrying values may not be recoverable. Impairment on core deposit intangibles is recognized by writing down the asset as a charge to noninterest expense to the extent that the carrying value exceeds the estimated fair value.
97
Derivatives — As part of its asset and liability management strategy, the Company uses derivative financial instruments to mitigate exposure to interest rate and foreign currency risks, and to assist customers with their risk management objectives. Derivatives utilized by the Company include primarily swaps, forwards and option contracts. Derivative instruments are included in Other assets or Accrued expenses and other liabilities on the Consolidated Balance Sheet at fair value. The related cash flows are recognized on the Cash flows from operating activities section on the Consolidated Statement of Cash Flows. The Company uses its accounting hedges based on the exposure being hedged as either fair value hedges, cash flow hedges or hedges of the net investments in certain foreign operations. For fair value hedges of interest rate risk, changes in fair value of derivatives are reported within Interest expense on the Consolidated Statement of Income. Changes in fair value of derivatives designated as hedges of the net investments in foreign operations are recorded as a component of AOCI. For cash flow hedges of floating-rate interest payments, the change in the fair value of hedges is recognized in AOCI on the Consolidated Balance Sheet and reclassified to earnings in the same period when the hedged cash flows impact earnings. Reclassified gains and losses of cash flow hedges are recorded in the same line item as the hedged interest payment within Interest expense on the Consolidated Statements of Income.
All derivatives designated as fair value hedges and hedges of the net investments in certain foreign operations are linked to specific hedged items or to groups of specific assets and liabilities on the Consolidated Balance Sheet. Cash flow hedges are linked to the forecasted transactions related to a recognized asset or liability. To qualify as an accounting hedge under the hedge accounting rules (versus an economic hedge where hedge accounting is not sought), a derivative must be highly effective in offsetting the risk designated as being hedged. The Company formally documents its hedging relationships at inception, including the identification of the hedging instruments and the hedged items, as well as its risk management objectives and strategies for undertaking the hedge transaction at the time the derivative contract is executed. Subsequent to inception, on a quarterly basis, the Company assesses whether the derivatives used in hedging transactions are highly effective in offsetting changes in the fair value of the hedged items or the cash flows of attributable hedged risks. Retrospective effectiveness is also assessed, as well as the continued expectation that the hedge will remain effective prospectively.
The Company discontinues hedge accounting prospectively when (i) a derivative is no longer highly effective in offsetting changes in fair value; (ii) a derivative expires, or is sold, terminated or exercised, or (iii) the Company determines that designation of a derivative as a hedge is no longer appropriate. If a fair value hedge is discontinued, the derivative will continue to be recorded on the Consolidated Balance Sheet at fair value with changes in fair value recognized on the Consolidated Statement of Income. When the hedged net investment is either sold or substantially liquidated, changes in the fair value of the derivatives are reclassified out of AOCI into Foreign exchange income on the Consolidated Statement of Income. If a cash flow hedge is discontinued, the derivative net gain or loss will remain in AOCI and reclassified into earnings in the periods in which the hedged forecasted cash flow affects earnings.
The Company also offers various interest rate, foreign currency, and energy commodity derivative products to customers. These transactions are not linked to specific assets or liabilities on the Consolidated Balance Sheet or to forecasted transactions in a hedging relationship and, therefore, do not qualify for hedge accounting. These contracts are recorded at fair value with changes in fair value recorded in Interest rate contracts and other derivative income and Foreign exchange income on the Consolidated Statement of Income.
As part of the Company’s loan origination process, from time to time, the Company obtains equity warrants to purchase preferred and/or common stock of public or private companies it provides loans to. These equity warrants are accounted for as derivatives and recorded at fair value included in Other assets on the Consolidated Balance Sheet with changes in fair value recorded on the Consolidated Statement of Income.
The Company is exposed to counterparty credit risk, which is the risk that counterparties to the derivative contracts do not perform as expected. Valuation of derivative assets and liabilities reflect the value of the instrument inclusive of the nonperformance risk. The Company uses master netting arrangements to mitigate counterparty credit risk in derivative transactions. To the extent the derivatives are subject to master netting arrangements, the Company takes into account the impact of master netting arrangements that allow the Company to settle all derivative contracts executed with the same counterparty on a net basis, and to offset the net derivative position with the related cash and securities collateral. The Company elected to offset derivative transactions with the same counterparty on the Consolidated Balance Sheet when a derivative transaction has a legally enforceable master netting arrangement and when it is eligible for netting under ASC 210-20-45-1, Balance Sheet Offsetting: Netting Derivative Positions on Balance Sheet. Derivative balances and related cash collateral are presented net on the Consolidated Balance Sheet. In addition, the Company applied the Settlement to Market treatment for the cash collateralizing our interest rate and commodity contracts with certain centrally cleared counterparties. As a result, derivative balances with these counterparties are considered settled by the collateral.
98
Stock-Based Compensation — The Company issues stock-based awards to eligible employees, officers and directors, and accounts for the related costs in accordance with the provisions of ASC 505, Equity and ASC 718, Compensation — Stock Compensation. Stock-based compensation cost is measured at the grant date based on the fair value of the awards and expensed over the employee’s requisite service period.
The Company grants restricted stock units (“RSUs”), which include service conditions for vesting. Additionally, some of the Company’s RSUs contain performance goals and market conditions that are required to be met in order for the awards to vest. RSUs cliff vest after three years of continued employment from the date of the grant. RSUs are authorized to settle predominantly in shares of the Company’s common stock. Compensation cost for those awards is based on the quoted market price of the Company’s common stock at the grant date. Certain RSUs will be settled in cash, which subjects these RSUs to variable accounting whereby the compensation cost is adjusted to fair value based on changes in the Company’s stock price up to the settlement date. Compensation cost is amortized on a straight-line basis over the requisite service period for the entire award, which is generally the maximum vesting period of the award. Excess tax benefits and deficiencies on share-based payment awards are recognized within Income tax expense on the Consolidated Statement of Income.
For time-based RSUs, the grant-date fair value is measured at the fair value of the Company’s common stock as if the RSUs are vested and issued on the date of grant. For performance-based RSUs, the grant-date fair value considers both performance and market conditions. As stock-based compensation expense is estimated based on awards ultimately expected to vest, it is reduced by the expense related to awards expected to be forfeited. Forfeitures are estimated at the time of grant and are updated quarterly. If the estimated forfeitures are revised, a cumulative effect of changes in estimated forfeitures for the current and prior periods is recognized in compensation expense in the period of change. For performance-based RSUs, the compensation expense fluctuates based on the estimated outcome of meeting the performance conditions. The Company evaluates the probable outcome of the performance conditions quarterly and makes cumulative adjustments for current and prior periods in compensation expense in the period of change. Market conditions subsequent to the grant date have no impact on the amount of compensation expense the Company will recognize over the life of the award. Refer to Note 13 — Stock Compensation Plans on the Consolidated Financial Statements in this Form 10-K for additional information.
99
Revenue from Contracts with Customers — The Company recognizes two primary types of revenue on its Consolidated Statement of Income: Net interest income and Noninterest income. The Company’s revenue from contracts with customers consists of service charges and fees related to deposit accounts, card income and wealth management fees. These revenue streams as described below comprised 35 %, 29 % and 26 % of total noninterest income for the years ended December 31, 2021, 2020 and 2019, respectively.
•Deposit Service Charges and Related Fee Income — The Company offers a range of deposit products to individuals and businesses, which includes savings, money market, checking and time deposit accounts. The deposit account services include ongoing account maintenance, as well as certain optional services such as various in-branch services, automated teller machine/debit card usage, wire transfer services or check orders. In addition, treasury management and business account analysis services are offered to commercial deposit customers. The monthly account fees may vary with the amount of average monthly deposit balances maintained, or the Company may charge a fixed monthly account maintenance fee if certain average balances are not maintained. In addition, each time a deposit customer selects an optional service, the Company may earn transaction fees, generally recognized by the Company at the point when the transaction occurs. For business analysis accounts, commercial deposit customers receive an earnings credit based on their account balance, which can be used to offset the cost of banking and treasury management services. Business analysis accounts that are assessed fees in excess of earnings credits received are typically charged at the end of each month, after all transactions are known and the credits are calculated. Deposit service charge and related fee income are recognized in all operating segments.
•Card Income — Card income consists of merchant referral fees and interchange income. For merchant referral fees, the Company provides marketing and referral services to acquiring banks for merchant card processing services and earns variable referral fees based on transaction activities. The Company satisfies its performance obligation over time as the Company identifies, solicits, and refers business customers who are provided such services. The Company receives monthly fees net of consideration it pays to the acquiring bank performing the merchant card processing services. The Company recognizes revenue on a monthly basis when the uncertainty associated with the variable referral fees is resolved after the Company receives monthly statements from the acquiring bank. For interchange income, the Company, as a card issuer, has a stand ready performance obligation to authorize, clear, and settle card transactions. The Company earns or pays interchange fees, which are percentage-based on each transaction, and based on rates published by the corresponding payment network for transactions processed using their network. The Company measures its progress toward the satisfaction of its performance obligation over time as services are rendered, and the Company provides continuous access to this service and settles transactions as its customer or the payment network requires. Interchange income is presented net of direct costs paid to the customer and entities in their distribution chain, which are transaction-based expenses such as rewards program expenses and certain network costs. Revenue is recognized when the net profit is determined by the payment networks at the end of each day. Card income is recognized in consumer and business banking, and commercial banking segments.
•Wealth Management Fees — The Company provides investment planning services for customers including wealth management services, asset allocation strategies, portfolio analysis and monitoring, investment strategies and risk management strategies. The fees the Company earns are variable and are generally received monthly. The Company recognizes revenue for the services performed at quarter-end based on actual transaction details received from the broker-dealer the Company engages. Wealth management fees is recognized in consumer and business banking, and commercial banking segments.
100
Income Taxes — The Company files consolidated federal income tax returns, foreign tax returns, and various combined and separate company state tax returns. The calculation of the Company’s income tax provision and related tax accruals requires the use of estimates and judgments. Income tax expense consists of two components: current and deferred. Current tax expense represents taxes to be paid or refunded for the current period and includes income tax expense related to our uncertain tax positions. Income tax liabilities (receivables) represent the estimated amounts due to (due from) the various taxing jurisdictions where the Company has established a tax presence and are reported in Accrued expenses and other liabilities or Other assets on the Consolidated Balance Sheets. Deferred tax expense results from changes in deferred tax assets and liabilities between period, and is determined using the balance sheet method. Under the balance sheet method, the net deferred tax asset or liability is based on the tax effects of the differences between the book and tax basis of assets and liabilities. Deferred tax assets are also recognized for tax attributes such as net operating loss carryforwards and tax credit carryforwards. Management regularly reviews the Company’s tax positions and deferred tax balances. Factors considered in this analysis include the Company’s ability to generate future taxable income, implement tax-planning strategies (as defined in ASC 740, Income Taxes) and utilize taxable income from prior carryback years (if such carryback is permitted under the applicable tax law), as well as future reversals of existing taxable temporary differences. To the extent a deferred tax asset is no longer expected more-likely-than-not to be realized, a valuation allowance is established. Deferred tax assets net of deferred tax liabilities are included in Other assets on the Consolidated Balance Sheet. See Note 11 — Income Taxes to the Consolidated Financial Statements in this Form 10-K for a discussion of management’s assessment of evidence considered by the Company in establishing a valuation allowance.
The Company reports a liability for unrecognized tax benefits resulting from uncertain tax positions taken, or expected to be taken, in an income tax return. Uncertain tax positions that meet the more-likely-than-not recognition threshold are measured to determine the amount of benefit to recognize. An uncertain tax position is measured at the largest amount of benefit that management believes has a greater than 50% likelihood of realization upon settlement. Tax benefits not meeting our realization criteria represent unrecognized tax benefits. The Company establishes a liability for potential taxes, interest and penalties related to uncertain tax positions based on facts and circumstances, including the interpretation of existing law, new judicial or regulatory guidance, and the status of tax audits.
101
New Accounting Pronouncements Adopted in 2021
| Standard | Required Date of Adoption | Description | Effect on Financial Statements | ||||||||
| Standards Adopted in 2021 | |||||||||||
ASU 2019-12, Income Taxes (Topic 740): Simplifying the Accounting for Income Taxes | January 1, 2021 Early adoption is permitted on January 1, 2020. | This ASU simplifies the accounting for income taxes by removing certain exceptions to the existing guidance. This includes removing exceptions to: 1) the incremental approach for intraperiod tax allocation, 2) the requirement to recognize a deferred tax liability for equity method investments when a foreign subsidiary becomes an equity method investment, 3) the ability not to recognize a deferred tax liability when a foreign equity method investment becomes a subsidiary, and 4) the general methodology for calculating income taxes in an interim period when a year-to-date loss exceeds the anticipated loss for the year. In addition, this ASU simplifies the accounting for income taxes related to franchise taxes, the tax basis of goodwill and the method for recognizing an enacted change in tax laws. This ASU also specifies that an entity is not required to allocate the consolidated amount of tax expense to a legal entity that is not subject to tax in its separate financial statements. This ASU also makes improvements in the accounting for income taxes related to employee stock ownership plans and equity method investments in qualified affordable housing projects. This guidance should be applied on either a retrospective, modified retrospective or prospective basis depending on the amendments. | The Company adopted this guidance on January 1, 2021 using the transition guidance prescribed by this ASU. At the time of adoption, this guidance did not have a material impact on the Company’s Consolidated Financial Statements. | ||||||||
ASU 2020-01, Clarifying the Interactions between Investments —Equity Securities (Topic 321), Investments —Equity Method and Joint Ventures (Topic 323), and Derivatives and Hedging (Topic 815) | Effective for fiscal years beginning after December 15, 2020. | ASU 2020-01 clarifies that when applying the measurement alternative in Topic 321, the existing investment must be remeasured at fair value as of the date that the observable transaction occurred. This guidance also clarifies that companies are not required to assess whether the underlying securities in certain forward contracts and purchased options would be accounted for under the equity method or fair value option when determining the method of accounting for those contracts. This guidance should be applied on a prospective basis. | The Company adopted this standard on January 1, 2021. The adoption of this guidance did not have a material impact on the Company’s Consolidated Financial Statements. | ||||||||
ASU 2020-04, Reference Rate Reform (Topic 848): Facilitation of the Effects of Reference Rate Reform on Financial Reporting and subsequent related ASU 2021-01, Reference Rate Reform (Topic 848): Scope | Effective for all entities from the dates of issuance through December 31, 2022. | In March 2020, the FASB issued an ASU related to contracts or hedging relationships that reference London Interbank Offered Rate (“LIBOR”) or other reference rates that are expected to be discontinued due to reference rate reform. This ASU provides temporary optional expedients and exceptions regarding the accounting requirements related to the modification of certain contracts, hedging relationships and other transactions that are affected by the reference rate reform. The guidance permits the Company to make a one-time election to sell and/or transfer qualifying held-to-maturity securities, and not to apply modification accounting or remeasure lease payments in lease contracts if the changes to the contract are related to the discontinuation of the reference rate. If certain criteria are met, the amendments also allow exceptions to the de-designation criteria of the hedging relationships and the assessment of hedge effectiveness during the transition period. This one-time election may be made at any time after March 12, 2020, but no later than December 31, 2022. In January 2021, the FASB issued ASU 2021-01, which expanded the scope of Topic 848 to include all affected derivatives and clarified certain optional expedients and exceptions regarding the hedge accounting for derivative contracts affected by the discounting transition. The amendments of this guidance could be elected retrospectively or prospectively to new modifications made on or after the date of issuance of this ASU, January 7, 2021. | The Company adopted ASU 2020-04 and ASU 2021-01 on a prospective basis on January 1, 2021. At the time of adoption, the guidance did not have a material impact on the Company’s Consolidated Financial Statements. The Company will continue to track the exposure as of each reporting period and to assess the impact as the reference rate transition occurs through the cessation of LIBOR. | ||||||||
102
| Standard | Required Date of Adoption | Description | Effect on Financial Statements | ||||||||
| Standards Adopted in 2021 | |||||||||||
ASU 2020-08, Codification Improvements to Subtopic 310-20, Receivables — Nonrefundable Fees and Other Costs | January 1, 2021 Early adoption is not permitted. | The amendments in this ASU updates ASU 2017-08, Receivables — Nonrefundable Fees and Other Costs (Subtopic 310-20): Premium Amortization on Purchased Callable Debt Securities, by clarifying that an entity should reevaluate whether a callable debt security is within the scope of paragraph 310-20-35-33 for each reporting period. If the security contained additional future call dates, an entity should consider whether the amortized cost basis exceeded the amount repayable by the issuer at the next call date. If so, the excess should be amortized to the next call date. This ASU also clarifies if there is no remaining premium or if there are no further call dates, the entity shall reset the effective yield using the payment terms of the debt security. The amendments of this guidance should be applied on a prospective basis as of the beginning of the period of adoption for existing or newly purchased callable debt securities. | The Company adopted this guidance on a prospective basis on January 1, 2021. The adoption of this guidance did not have an impact on the Company’s Consolidated Financial Statements. | ||||||||
ASU 2021-06, Presentation of Financial Statements (Topic 205), Financial Services— Depository and Lending (Topic 942), and Financial Services —Investment Companies (Topic 946): Amendments to SEC Paragraphs Pursuant to SEC Final Rule Releases No. 33-10786, Amendments to Financial Disclosures about Acquired and Disposed Businesses, and NO. 33-10835, Update of Statistical Disclosures for Bank and Savings and Loan Registrants | Effective for all entities from the dates of issuance on August 9, 2021. | ASU 2021-06 was issued to amend U.S. Securities and Exchange Commission (‘SEC”) paragraphs in the Accounting Standards Codification to reflect the issuance of SEC Release No. 33-10786, Amendments to Financial Disclosures about Acquired and Disposed Businesses, and No. 33-10835, Update of Statistical Disclosures for Bank and Savings and Loan Registrants. | The Company adopted these disclosure requirements upon issuance of the ASU 2021-06 | ||||||||
Note 2 — Fair Value Measurement and Fair Value of Financial Instruments
Fair Value Determination
Fair value is defined as the price that would be received to sell an asset or the price that would be paid to transfer a liability in an orderly transaction between market participants at the measurement date. In determining the fair value of financial instruments, the Company uses various methods including market and income approaches. Based on these approaches, the Company utilizes certain assumptions that market participants would use in pricing an asset or a liability. These inputs can be readily observable, market corroborated or generally unobservable. The Company utilizes valuation techniques that maximize the use of observable inputs and minimize the use of unobservable inputs. The fair value hierarchy described below is based on the quality and reliability of the information used to determine fair value. The fair value hierarchy gives the highest priority to quoted prices available in active markets and the lowest priority to prices derived from data lacking transparency. The fair value of the Company’s assets and liabilities is classified and disclosed in one of the following three categories:
•Level 1 — Valuation is based on quoted prices for identical instruments traded in active markets.
103
•Level 2 — Valuation is based on quoted prices for similar instruments traded in active markets; quoted prices for identical or similar instruments traded in markets that are not active; and model-derived valuations whose inputs are observable and can be corroborated by market data.
•Level 3 — Valuation is based on significant unobservable inputs for determining the fair value of assets or liabilities. These significant unobservable inputs reflect assumptions that market participants may use in pricing the assets or liabilities.
The classification of assets and liabilities within the hierarchy is based on whether inputs to the valuation methodology used are observable or unobservable, and the significance of those inputs in the fair value measurement. The Company’s assets and liabilities are classified in their entirety based on the lowest level of input that is significant to their fair value measurements.
Assets and Liabilities Measured at Fair Value on a Recurring Basis
The following section describes the valuation methodologies used by the Company to measure financial assets and liabilities on a recurring basis, as well as the general classification of these instruments within the fair value hierarchy.
Available-for-Sale Debt Securities — The fair value of AFS debt securities is generally determined by independent external pricing service providers who have experience in valuing these securities or by taking the average quoted market prices obtained from independent external brokers. The valuations provided by the third-party pricing service providers are based on observable market inputs, which include benchmark yields, reported trades, issuer spreads, benchmark securities, bids, offers, prepayment expectation and reference data obtained from market research publications. Inputs used by the third-party pricing service providers in valuing collateralized mortgage obligations and other securitization structures also include new issue data, monthly payment information, whole loan collateral performance, tranche evaluation and “To Be Announced” prices. In valuing securities issued by state and political subdivisions, inputs used by third-party pricing service providers also include material event notices.
On a monthly basis, the Company validates the valuations provided by third-party pricing service providers to ensure that the fair value determination is consistent with the applicable accounting guidance and the financial instruments are properly classified in the fair value hierarchy. To perform this validation, the Company compares fair values provided by the third-party pricing service providers to prices from other available independent sources for the same securities. When significant variances in prices are identified, the Company further compares inputs used by different sources to ascertain the reliability of these sources. On a quarterly basis, the Company reviews the documentation received from the third-party pricing service providers regarding the valuation inputs and methodology used for each category of securities.
When available, the Company uses quoted market prices to determine the fair value of AFS debt securities that are classified as Level 1. Level 1 AFS debt securities consist of U.S. Treasury securities. When pricing is unavailable from third-party pricing service providers for certain securities, the Company requests market quotes from various independent external brokers and utilizes the average quoted market prices. In addition, the Company obtains market quotes from other official published sources. As these valuations are based on observable inputs in the current marketplace, they are classified as Level 2. The Company periodically communicates with the independent external brokers to validate their pricing methodology. Information such as pricing sources, pricing assumptions, data inputs, and valuation techniques are reviewed periodically.
Equity Securities — Equity securities consisted of mutual funds as of both December 31, 2021 and 2020. The Company invested in these mutual funds for Community Reinvestment Act (“CRA”) purposes. The Company uses net asset value (“NAV”) information to determine the fair value of these equity securities. When NAV is available periodically and the equity securities can be put back to the transfer agents at the publicly available NAV, the fair value of the equity securities is classified as Level 1. When NAV is available periodically but the equity securities may not be readily marketable at its periodic NAV in the secondary market, the fair value of these equity securities is classified as Level 2.
104
Interest Rate Contracts — The Company enters into interest rate swap and option contracts that are not designated as hedging instruments with its borrowers to lock in attractive intermediate and long-term interest rates, resulting in the customer obtaining a synthetic fixed-rate loan. To economically hedge against the interest rate risks in the products offered to its customers, the Company enters into mirrored offsetting interest rate contracts with third-party financial institutions. The Company also enters into interest rate swap contracts with institutional counterparties to hedge against certain variable interest rate borrowings. These interest rate swap contracts with institutional counterparties were designated as cash flow hedges. The fair value of the interest rate swaps is determined using the market standard methodology of netting the discounted future fixed cash payments (or receipts) and the discounted expected variable cash receipts (or payments). The fair value of the interest rate options, which consist of floors and caps, is determined using the market standard methodology of discounting the future expected cash receipts that would occur if variable interest rates fall below (rise above) the strike rate of the floors (caps). In addition, to comply with the provisions of ASC 820, Fair Value Measurement, the Company incorporates credit valuation adjustments to appropriately reflect both its own nonperformance risk and the respective counterparty’s nonperformance risk in the fair value measurements of its derivatives. The credit valuation adjustments associated with the Company’s derivatives utilize model-derived credit spreads, which are Level 3 inputs. Considering the observable nature of all other significant inputs utilized, the Company classifies these derivative instruments as Level 2.
Foreign Exchange Contracts — The Company enters into foreign exchange contracts to accommodate the business needs of its customers. For a majority of the foreign exchange contracts with its customers, the Company entered into offsetting foreign exchange contracts with third-party financial institutions to manage its exposure. The Company also utilizes foreign exchange contracts that are not designated as hedging instruments to mitigate the economic effect of fluctuations in certain foreign currency on-balance sheet assets and liabilities, primarily foreign currency denominated deposits offered to its customers. The fair value of foreign exchange contracts is determined at each reporting period based on changes in the foreign exchange rates. These are over-the-counter contracts where quoted market prices are not readily available. Valuation is measured using conventional valuation methodologies with observable market data. Due to the short-term nature of the majority of these contracts, the counterparties’ credit risks are considered nominal and result in no adjustments to the valuation of the foreign exchange contracts. Due to the observable nature of the inputs used in deriving the fair value of these contracts, the valuation of foreign exchange contracts are classified as Level 2. As of December 31, 2021 and 2020, the Bank held foreign currency non-deliverable forward contracts to hedge its net investment in its China subsidiary, East West Bank (China) Limited, a non-USD functional currency subsidiary in China. These foreign currency non-deliverable forward contracts were designated as net investment hedges. The fair value of foreign currency non-deliverable forward contracts is determined by comparing the contracted foreign exchange rate to the current market foreign exchange rate. Key inputs of the current market exchange rate include spot rates and forward rates of the contractual currencies. Foreign exchange forward curves are used to determine which forward rate pertains to a specific maturity. Due to the observable nature of the inputs used in deriving the estimated fair value, these instruments are classified as Level 2.
Credit Contracts — The Company may periodically enter into credit risk participation agreements (“RPAs”) to manage the credit exposure on interest rate contracts associated with the syndicated loans. The Company may enter into protection sold or protection purchased RPAs with institutional counterparties. The fair value of RPAs is calculated by determining the total expected asset or liability exposure of the derivatives to the borrowers and applying the borrowers’ credit spread to that exposure. Total expected exposure incorporates both the current and potential future exposure of the derivatives, derived from using observable inputs, such as yield curves and volatilities. Since the majority of the inputs used to value the RPAs are observable, RPAs are classified as Level 2.
Equity Contracts — As part of the loan origination process, the Company periodically obtains warrants to purchase preferred and/or common stock of technology and life sciences companies to which it provides loans. As of December 31, 2021 and 2020, the warrants included on the Consolidated Financial Statements were from both public and private companies. The Company values these warrants based on the Black-Scholes option pricing model. For warrants from public companies, the model uses the underlying stock price, stated strike price, warrant expiration date, risk-free interest rate based on a duration-matched U.S. Treasury rate and market-observable company-specific option volatility as inputs to value the warrants. Due to the observable nature of the inputs used in deriving the estimated fair value, warrants from public companies are classified as Level 2. For warrants from private companies, the model uses inputs such as the offering price observed in the most recent round of funding, stated strike price, warrant expiration date, risk-free interest rate based on duration-matched U.S. Treasury rate and option volatility. The Company applies proxy volatilities based on the industry sectors of the private companies. The model values are then adjusted for a general lack of liquidity due to the private nature of the underlying companies. Since both option volatility and liquidity discount assumptions are subject to management’s judgment, measurement uncertainty is inherent in the valuation of private companies’ warrants. Due to the unobservable nature of the option volatility and liquidity discount assumptions used in deriving the estimated fair value, warrants from private companies are classified as Level 3. On a quarterly basis, the changes in the fair value of warrants from private companies are reviewed for reasonableness, and a measurement of uncertainty analysis on the option volatility and liquidity discount assumptions is performed.
105
106
The following tables present financial assets and liabilities that are measured at fair value on a recurring basis as of December 31, 2021 and 2020:
| ($ in thousands) | Assets and Liabilities Measured at Fair Value on a Recurring Basis as of December 31, 2021 | |||||||||||||||||||||||||
| Quoted Prices in Active Markets for Identical Assets (Level 1) | Significant Other Observable Inputs (Level 2) | Significant Unobservable Inputs (Level 3) | Total Fair Value | |||||||||||||||||||||||
| AFS debt securities: | ||||||||||||||||||||||||||
| U.S. Treasury securities | $ | $ | $ | $ | ||||||||||||||||||||||
U.S. government agency and U.S. government sponsored enterprise debt securities | ||||||||||||||||||||||||||
U.S. government agency and U.S. government sponsored enterprise mortgage-backed securities: | ||||||||||||||||||||||||||
| Commercial mortgage-backed securities | ||||||||||||||||||||||||||
| Residential mortgage-backed securities | ||||||||||||||||||||||||||
| Municipal securities | ||||||||||||||||||||||||||
| Non-agency mortgage-backed securities: | ||||||||||||||||||||||||||
| Commercial mortgage-backed securities | ||||||||||||||||||||||||||
| Residential mortgage-backed securities | ||||||||||||||||||||||||||
| Corporate debt securities | ||||||||||||||||||||||||||
| Foreign government bonds | ||||||||||||||||||||||||||
| Asset-backed securities | ||||||||||||||||||||||||||
| Collateralized loan obligations (“CLOs”) | ||||||||||||||||||||||||||
| Total AFS debt securities | $ | $ | $ | $ | ||||||||||||||||||||||
| Investments in tax credit and other investments: | ||||||||||||||||||||||||||
| Equity securities | $ | $ | $ | $ | ||||||||||||||||||||||
Total investments in tax credit and other investments | $ | $ | $ | $ | ||||||||||||||||||||||
| Derivative assets: | ||||||||||||||||||||||||||
| Interest rate contracts | $ | $ | $ | $ | ||||||||||||||||||||||
| Foreign exchange contracts | ||||||||||||||||||||||||||
| Credit contracts | ||||||||||||||||||||||||||
| Equity contracts | ||||||||||||||||||||||||||
| Commodity contracts | ||||||||||||||||||||||||||
| Gross derivative assets | $ | $ | $ | $ | ||||||||||||||||||||||
Netting adjustments (1) | $ | $ | ( | $ | $ | ( | ||||||||||||||||||||
| Net derivative assets | $ | $ | $ | $ | ||||||||||||||||||||||
| Derivative liabilities: | ||||||||||||||||||||||||||
| Interest rate contracts | $ | $ | $ | $ | ||||||||||||||||||||||
| Foreign exchange contracts | ||||||||||||||||||||||||||
| Credit contracts | ||||||||||||||||||||||||||
| Commodity contracts | ||||||||||||||||||||||||||
| Gross derivative liabilities | $ | $ | $ | $ | ||||||||||||||||||||||
Netting adjustments (1) | $ | $ | ( | $ | $ | ( | ||||||||||||||||||||
| Net derivative liabilities | $ | $ | $ | $ | ||||||||||||||||||||||
107
| ($ in thousands) | Assets and Liabilities Measured at Fair Value on a Recurring Basis as of December 31, 2020 | |||||||||||||||||||||||||
| Quoted Prices in Active Markets for Identical Assets (Level 1) | Significant Other Observable Inputs (Level 2) | Significant Unobservable Inputs (Level 3) | Total Fair Value | |||||||||||||||||||||||
| AFS debt securities: | ||||||||||||||||||||||||||
| U.S. Treasury securities | $ | $ | $ | $ | ||||||||||||||||||||||
U.S. government agency and U.S. government sponsored enterprise debt securities | ||||||||||||||||||||||||||
U.S. government agency and U.S. government sponsored enterprise mortgage-backed securities: | ||||||||||||||||||||||||||
| Commercial mortgage-backed securities | ||||||||||||||||||||||||||
| Residential mortgage-backed securities | ||||||||||||||||||||||||||
| Municipal securities | ||||||||||||||||||||||||||
| Non-agency mortgage-backed securities: | ||||||||||||||||||||||||||
| Commercial mortgage-backed securities | ||||||||||||||||||||||||||
| Residential mortgage-backed securities | ||||||||||||||||||||||||||
| Corporate debt securities | ||||||||||||||||||||||||||
| Foreign government bonds | ||||||||||||||||||||||||||
| Asset-backed securities | ||||||||||||||||||||||||||
| CLOs | ||||||||||||||||||||||||||
| Total AFS debt securities | $ | $ | $ | $ | ||||||||||||||||||||||
| Investments in tax credit and other investments: | ||||||||||||||||||||||||||
| Equity securities | $ | $ | $ | $ | ||||||||||||||||||||||
Total investments in tax credit and other investments | $ | $ | $ | $ | ||||||||||||||||||||||
| Derivative assets: | ||||||||||||||||||||||||||
| Interest rate contracts | $ | $ | $ | $ | ||||||||||||||||||||||
| Foreign exchange contracts | ||||||||||||||||||||||||||
| Credit contracts | ||||||||||||||||||||||||||
| Equity contracts | ||||||||||||||||||||||||||
| Commodity contracts | ||||||||||||||||||||||||||
| Gross derivative assets | $ | $ | $ | $ | ||||||||||||||||||||||
Netting adjustments (1) | $ | $ | ( | $ | $ | ( | ||||||||||||||||||||
| Net derivative assets | $ | $ | $ | $ | ||||||||||||||||||||||
| Derivative liabilities: | ||||||||||||||||||||||||||
| Interest rate contracts | $ | $ | $ | $ | ||||||||||||||||||||||
| Foreign exchange contracts | ||||||||||||||||||||||||||
| Credit contracts | ||||||||||||||||||||||||||
| Commodity contracts | ||||||||||||||||||||||||||
| Gross derivative liabilities | $ | $ | $ | $ | ||||||||||||||||||||||
Netting adjustments (1) | $ | $ | ( | $ | $ | ( | ||||||||||||||||||||
| Net derivative liabilities | $ | $ | $ | $ | ||||||||||||||||||||||
(1)Represents balance sheet netting of derivative assets and liabilities and related cash collateral under master netting agreements or similar agreements. See Note 5 — Derivatives to the Consolidated Financial Statements in this Form 10-K for additional information.
108
For the years ended December 31, 2021, 2020 and 2019, Level 3 fair value measurements that were measured on a recurring basis consisted of warrants issued by private companies. The following table provides a reconciliation of the beginning and ending balances of these equity contracts for the years ended December 31, 2021, 2020 and 2019:
| ($ in thousands) | Year Ended December 31, | |||||||||||||||||||
| 2021 | 2020 | 2019 | ||||||||||||||||||
| Equity Contracts | ||||||||||||||||||||
| Beginning balance | $ | $ | $ | |||||||||||||||||
Total gains included in earnings (1) | ||||||||||||||||||||
| Issuances | ||||||||||||||||||||
| Settlements | ( | ( | ||||||||||||||||||
Transfers out of Level 3 (2) | ( | ( | ||||||||||||||||||
| Ending balance | $ | $ | $ | |||||||||||||||||
(1)Include both realized and unrealized gain (losses) recorded in Lending fees on the Consolidated Statement of Income. The unrealized (losses) gains were $(44 ) thousand, $8.2 million, and $(292 ) thousand for the years ended December 31, 2021, 2020 and 2019, respectively.
The following table presents quantitative information about the significant unobservable inputs used in the valuation of Level 3 fair value measurements as of December 31, 2021 and 2020. The significant unobservable inputs presented in the table below are those that the Company considers significant to the fair value of the Level 3 assets. The Company considers unobservable inputs to be significant if, by their exclusion, the fair value of the Level 3 assets would be impacted by a predetermined percentage change.
| ($ in thousands) | Fair Value Measurements (Level 3) | Valuation Technique | Unobservable Inputs | Range of Inputs | Weighted- Average of Inputs (1) | |||||||||||||||||||||||||||
| December 31, 2021 | ||||||||||||||||||||||||||||||||
| Derivative assets: | ||||||||||||||||||||||||||||||||
| Equity contracts | $ | Black-Scholes option pricing model | Equity volatility | |||||||||||||||||||||||||||||
| Liquidity discount | ||||||||||||||||||||||||||||||||
| December 31, 2020 | ||||||||||||||||||||||||||||||||
| Derivative assets: | ||||||||||||||||||||||||||||||||
| Equity contracts | $ | Black-Scholes option pricing model | Equity volatility | |||||||||||||||||||||||||||||
| Liquidity discount | ||||||||||||||||||||||||||||||||
(1)Weighted-average of inputs is calculated based on the fair value of equity contracts as of December 31, 2021 and 2020.
Assets and Liabilities Measured at Fair Value on a Nonrecurring Basis
Assets measured at fair value on a nonrecurring basis include certain individually evaluated loans held-for-investment, investments in qualified affordable housing partnerships, tax credit and other investments, OREO, loans held-for-sale, and other nonperforming assets. Nonrecurring fair value adjustments result from impairment on certain individually evaluated loans held-for-investment and investments in qualified affordable housing partnerships, tax credit and other investments, from write-downs of OREO and other nonperforming assets, or from the application of lower of cost or fair value on loans held-for-sale.
Individually Evaluated Loans Held-for-Investment — Individually evaluated loans held-for-investment are classified as Level 3 assets. The following two methods are used to derive the fair value of individually evaluated loans held-for-investment:
•Discounted cash flow valuation techniques that consist of developing an expected stream of cash flows over the life of the loans, and then calculating the present value of the loans by discounting the expected cash flows at a designated discount rate.
109
•When the repayment of an individually evaluated loan is dependent on the sale of the collateral, the fair value of the loan is determined based on the fair value of the underlying collateral, which may take the form of real estate, inventory, equipment, contracts or guarantees. The fair value of the underlying collateral is generally based on third-party appraisals, or an internal valuation if a third-party appraisal is not required by regulations, or unavailable. An internal valuation utilizes one or more valuation techniques such as the income, market and/or cost approaches.
Investments in Qualified Affordable Housing Partnerships, Tax Credit and Other Investments — The Company conducts due diligence on its investments in qualified affordable housing partnerships, tax credit and other investments prior to the initial investment date and through the placed-in-service date. After these investments are either acquired or placed into service, the Company continues its periodic monitoring process to ensure book values are realizable and that there is no significant tax credit recapture risk. This monitoring process includes the quarterly review of the financial statements, the annual review of tax returns of the investment entity, the annual review of the financial statements of the guarantor (if any) and a comparison of the actual performance of the investment against the financial projections prepared at the time when the investment was made. The Company assesses its tax credit and other investments for possible OTTI on an annual basis or when events or circumstances suggest that the carrying amount of the investments may not be realizable. These circumstances can include, but are not limited to the following factors:
•expected future cash flows that are less than the carrying amount of the investment;
•changes in the economic, market or technological environment that could adversely affect the investee’s operations; and
•other factors that raise doubt about the investee’s ability to continue as a going concern, such as negative cash flows from operations and the continuing prospects of the underlying operations of the investment.
All available evidence is considered in assessing whether a decline in value is other-than-temporary. Generally, none of the aforementioned factors are individually conclusive and the relative importance placed on individual facts may vary depending on the situation. In accordance with ASC 323-10-35-32, an impairment charge would only be recognized in earnings for a decline in value that is determined to be other-than-temporary.
Other Real Estate Owned — The Company’s OREO represents properties acquired through foreclosure, or through full or partial satisfaction of loans held-for-investment. These OREO properties are recorded at estimated fair value less the costs to sell at the time of foreclosure and at the lower of cost or estimated fair value less the costs to sell subsequent to acquisition. On a monthly basis, the current fair market value of each OREO property is reviewed to ensure that the current carrying value is appropriate. OREO properties are classified as Level 3.
Other Nonperforming Assets — Other nonperforming assets are recorded at fair value upon transfers from loans to foreclosed assets. Subsequently, foreclosed assets are recorded at the lower of carrying value or fair value. Fair value is based on independent market prices, appraised values of the collateral or management’s estimates of the foreclosed asset. The Company records an impairment when the foreclosed asset’s fair value declines below its carrying value. Fair value measurements of other nonperforming assets are classified within one of the three levels in a valuation hierarchy based upon the observability of inputs to the valuation as of the measurement date.
110
The following tables present the carrying amounts of assets that were still held and had fair value adjustments measured on a nonrecurring basis as of December 31, 2021 and 2020:
| ($ in thousands) | Assets Measured at Fair Value on a Nonrecurring Basis as of December 31, 2021 | |||||||||||||||||||||||||
| Quoted Prices in Active Markets for Identical Assets (Level 1) | Significant Other Observable Inputs (Level 2) | Significant Unobservable Inputs (Level 3) | Fair Value Measurements | |||||||||||||||||||||||
| Loans held-for-investment: | ||||||||||||||||||||||||||
| Commercial: | ||||||||||||||||||||||||||
| C&I | $ | $ | $ | $ | ||||||||||||||||||||||
| CRE: | ||||||||||||||||||||||||||
| CRE | ||||||||||||||||||||||||||
| Total commercial | ||||||||||||||||||||||||||
| Consumer: | ||||||||||||||||||||||||||
| Residential mortgage: | ||||||||||||||||||||||||||
| HELOCs | ||||||||||||||||||||||||||
| Total consumer | ||||||||||||||||||||||||||
| Total loans held-for-investment | $ | $ | $ | $ | ||||||||||||||||||||||
| Other nonperforming assets | $ | $ | $ | $ | ||||||||||||||||||||||
| ($ in thousands) | Assets Measured at Fair Value on a Nonrecurring Basis as of December 31, 2020 | |||||||||||||||||||||||||
| Quoted Prices in Active Markets for Identical Assets (Level 1) | Significant Other Observable Inputs (Level 2) | Significant Unobservable Inputs (Level 3) | Fair Value Measurements | |||||||||||||||||||||||
| Loans held-for-investment: | ||||||||||||||||||||||||||
| Commercial: | ||||||||||||||||||||||||||
| C&I | $ | $ | $ | $ | ||||||||||||||||||||||
| CRE: | ||||||||||||||||||||||||||
| CRE | ||||||||||||||||||||||||||
| Total commercial | ||||||||||||||||||||||||||
| Consumer: | ||||||||||||||||||||||||||
| Residential mortgage: | ||||||||||||||||||||||||||
| HELOCs | ||||||||||||||||||||||||||
| Other consumer | ||||||||||||||||||||||||||
| Total consumer | ||||||||||||||||||||||||||
| Total loans held-for-investment | $ | $ | $ | $ | ||||||||||||||||||||||
| Investments in tax credit and other investments, net | $ | $ | $ | $ | ||||||||||||||||||||||
OREO (1) | $ | $ | $ | $ | ||||||||||||||||||||||
(1)Amounts are included in Other assets on the Consolidated Balance Sheet and represent the carrying value of OREO properties that were written down subsequent to their initial classification as OREO.
111
The following table presents the increase (decrease) in the fair value of certain assets held at the end of the respective reporting periods, for which a nonrecurring fair value adjustment was recognized for the years ended December 31, 2021, 2020 and 2019:
| ($ in thousands) | Year Ended December 31, | |||||||||||||||||||
| 2021 | 2020 | 2019 | ||||||||||||||||||
Loans held-for-investment (1): | ||||||||||||||||||||
| Commercial: | ||||||||||||||||||||
| C&I | $ | ( | $ | ( | $ | ( | ||||||||||||||
| CRE: | ||||||||||||||||||||
| CRE | ( | ( | ||||||||||||||||||
| Total commercial | ( | ( | ( | |||||||||||||||||
| Consumer: | ||||||||||||||||||||
| Residential mortgage: | ||||||||||||||||||||
| HELOCs | ( | ( | ( | |||||||||||||||||
| Other consumer | ||||||||||||||||||||
| Total consumer | $ | ( | $ | $ | ( | |||||||||||||||
| Total loans held-for-investment | $ | ( | $ | ( | $ | ( | ||||||||||||||
| Investments in tax credit and other investments, net | $ | $ | ( | $ | ( | |||||||||||||||
| OREO | $ | $ | ( | $ | ( | |||||||||||||||
| Other nonperforming assets | $ | ( | $ | $ | ( | |||||||||||||||
(1)Excludes loans fully charged off.
The following table presents the quantitative information about the significant unobservable inputs used in the valuation of Level 3 fair value measurements that are measured on a nonrecurring basis as of December 31, 2021 and 2020:
| ($ in thousands) | Fair Value Measurements (Level 3) | Valuation Techniques | Unobservable Inputs | Range of Inputs | Weighted- Average of Inputs (1) | |||||||||||||||||||||||||||
| December 31, 2021 | ||||||||||||||||||||||||||||||||
| Loans held-for-investment | $ | Discounted cash flows | Discount | |||||||||||||||||||||||||||||
| $ | Fair value of collateral | Discount | ||||||||||||||||||||||||||||||
| $ | Fair value of property | Selling cost | ||||||||||||||||||||||||||||||
| December 31, 2020 | ||||||||||||||||||||||||||||||||
| Loans held-for-investment | $ | Discounted cash flows | Discount | |||||||||||||||||||||||||||||
| $ | Fair value of collateral | Discount | ||||||||||||||||||||||||||||||
| $ | Fair value of collateral | Contract value | NM | NM | ||||||||||||||||||||||||||||
| $ | Fair value of property | Selling cost | ||||||||||||||||||||||||||||||
| Investments in tax credit and other investments, net | $ | Individual analysis of each investment | Expected future tax benefits and distributions | NM | NM | |||||||||||||||||||||||||||
| OREO | $ | Fair value of property | Selling cost | |||||||||||||||||||||||||||||
NM — Not meaningful.
(1)Weighted-average of inputs is based on the relative fair value of the respective assets as of December 31, 2021 and 2020.
112
Disclosures about the Fair Value of Financial Instruments
The following tables present the fair value estimates for financial instruments as of December 31, 2021 and 2020, excluding financial instruments recorded at fair value on a recurring basis as they are included in the tables presented elsewhere in this Note. The carrying amounts in the following tables are recorded on the Consolidated Balance Sheet under the indicated captions, except for accrued interest receivable and mortgage servicing rights which are included in Other assets, and accrued interest payable which is included in Accrued expenses and other liabilities. These financial assets and liabilities are measured at amortized cost basis on the Company’s Consolidated Balance Sheet.
| ($ in thousands) | December 31, 2021 | |||||||||||||||||||||||||||||||
| Carrying Amount | Level 1 | Level 2 | Level 3 | Estimated Fair Value | ||||||||||||||||||||||||||||
| Financial assets: | ||||||||||||||||||||||||||||||||
| Cash and cash equivalents | $ | $ | $ | $ | $ | |||||||||||||||||||||||||||
| Interest-bearing deposits with banks | $ | $ | $ | $ | $ | |||||||||||||||||||||||||||
| Resale agreements | $ | $ | $ | $ | $ | |||||||||||||||||||||||||||
| Restricted equity securities, at cost | $ | $ | $ | $ | $ | |||||||||||||||||||||||||||
| Loans held-for-sale | $ | $ | $ | $ | $ | |||||||||||||||||||||||||||
| Loans held-for-investment, net | $ | $ | $ | $ | $ | |||||||||||||||||||||||||||
| Mortgage servicing rights | $ | $ | $ | $ | $ | |||||||||||||||||||||||||||
| Accrued interest receivable | $ | $ | $ | $ | $ | |||||||||||||||||||||||||||
| Financial liabilities: | ||||||||||||||||||||||||||||||||
Demand, checking, savings and money market deposits | $ | $ | $ | $ | $ | |||||||||||||||||||||||||||
| Time deposits | $ | $ | $ | $ | $ | |||||||||||||||||||||||||||
| FHLB advances | $ | $ | $ | $ | $ | |||||||||||||||||||||||||||
| Repurchase agreements | $ | $ | $ | $ | $ | |||||||||||||||||||||||||||
| Long-term debt | $ | $ | $ | $ | $ | |||||||||||||||||||||||||||
| Accrued interest payable | $ | $ | $ | $ | $ | |||||||||||||||||||||||||||
| ($ in thousands) | December 31, 2020 | |||||||||||||||||||||||||||||||
| Carrying Amount | Level 1 | Level 2 | Level 3 | Estimated Fair Value | ||||||||||||||||||||||||||||
| Financial assets: | ||||||||||||||||||||||||||||||||
| Cash and cash equivalents | $ | $ | $ | $ | $ | |||||||||||||||||||||||||||
| Interest-bearing deposits with banks | $ | $ | $ | $ | $ | |||||||||||||||||||||||||||
| Resale agreements | $ | $ | $ | $ | $ | |||||||||||||||||||||||||||
| Restricted equity securities, at cost | $ | $ | $ | $ | $ | |||||||||||||||||||||||||||
| Loans held-for-sale | $ | $ | $ | $ | $ | |||||||||||||||||||||||||||
| Loans held-for-investment, net | $ | $ | $ | $ | $ | |||||||||||||||||||||||||||
| Mortgage servicing rights | $ | $ | $ | $ | $ | |||||||||||||||||||||||||||
| Accrued interest receivable | $ | $ | $ | $ | $ | |||||||||||||||||||||||||||
| Financial liabilities: | ||||||||||||||||||||||||||||||||
Demand, checking, savings and money market deposits | $ | $ | $ | $ | $ | |||||||||||||||||||||||||||
| Time deposits | $ | $ | $ | $ | $ | |||||||||||||||||||||||||||
| Short-term borrowings | $ | $ | $ | $ | $ | |||||||||||||||||||||||||||
| FHLB advances | $ | $ | $ | $ | $ | |||||||||||||||||||||||||||
| Repurchase agreements | $ | $ | $ | $ | $ | |||||||||||||||||||||||||||
| Long-term debt | $ | $ | $ | $ | $ | |||||||||||||||||||||||||||
| Accrued interest payable | $ | $ | $ | $ | $ | |||||||||||||||||||||||||||
113
Note 3 — Assets Purchased under Resale Agreements and Sold under Repurchase Agreements
Assets Purchased under Resale Agreements
In resale agreements, the Company is exposed to credit risk for both counterparties and the underlying collateral. The company manages credit exposure from certain transactions by entering into master netting agreements and collateral arrangements with the counterparties. The relevant agreements allow for the efficient closeout of the transaction, liquidation and set-off of collateral against the net amount owed by the counterparty following a default. It is also the Company’s policy to take possession, where possible, of the assets underlying resale agreements. As a result of the Company’s credit risk mitigation practices with respect to resale agreements as described above, the Company did not hold any reserves for credit impairment related to these agreements as of December 31, 2021 and 2020.
Securities Purchased under Resale Agreements — Total securities purchased under resale agreements were $1.33 billion and $1.16 billion as of December 31, 2021 and 2020, respectively. The weighted-average yields were 1.53 %, 1.94 % and 2.66 % for the years ended December 31, 2021, 2020 and 2019, respectively.
Loans Purchased under Resale Agreements — The Company participated in resale agreements collateralized with loans starting in the fourth quarter of 2020. As of December 31, 2021 and 2020, total loans purchased under resale agreements were $1.02 billion and $300.0 million, respectively. The weighted-average yields were 1.53 % and 2.27 % for the years ended December 31, 2021 and 2020, respectively.
Assets Sold under Repurchase Agreements — As of December 31, 2021, securities sold under the repurchase agreements consisted of U.S. government agency and U.S. government-sponsored enterprise mortgage-backed securities, and U.S. Treasury securities. Gross repurchase agreements were $300.0 million as of both December 31, 2021 and 2020, respectively. The weighted-average interest rates were 2.61 %, 3.25 % and 4.74 % for the years ended December 31, 2021, 2020 and 2019, respectively. There were no 8.7 million of charges related to the extinguishment of $150.0 million of repurchase agreements. As of December 31, 2021, all repurchase agreements will mature in 2023.
Balance Sheet Offsetting
114
The following tables present the resale and repurchase agreements included on the Consolidated Balance Sheet as of December 31, 2021 and 2020:
| ($ in thousands) | December 31, 2021 | |||||||||||||||||||||||||||||||
| Assets | Gross Amounts of Recognized Assets | Gross Amounts Offset on the Consolidated Balance Sheet | Net Amounts of Assets Presented on the Consolidated Balance Sheet | Gross Amounts Not Offset on the Consolidated Balance Sheet | Net Amount | |||||||||||||||||||||||||||
| Collateral Received | ||||||||||||||||||||||||||||||||
| Resale agreements | $ | $ | $ | $ | ( | (1) | $ | |||||||||||||||||||||||||
| Liabilities | Gross Amounts of Recognized Liabilities | Gross Amounts Offset on the Consolidated Balance Sheet | Net Amounts of Liabilities Presented on the Consolidated Balance Sheet | Gross Amounts Not Offset on the Consolidated Balance Sheet | Net Amount | |||||||||||||||||||||||||||
| Collateral Pledged | ||||||||||||||||||||||||||||||||
| Repurchase agreements | $ | $ | $ | $ | ( | (2) | $ | |||||||||||||||||||||||||
| ($ in thousands) | December 31, 2020 | |||||||||||||||||||||||||||||||
| Assets | Gross Amounts of Recognized Assets | Gross Amounts Offset on the Consolidated Balance Sheet | Net Amounts of Assets Presented on the Consolidated Balance Sheet | Gross Amounts Not Offset on the Consolidated Balance Sheet | Net Amount | |||||||||||||||||||||||||||
| Collateral Received | ||||||||||||||||||||||||||||||||
| Resale agreements | $ | $ | $ | $ | ( | (1) | $ | |||||||||||||||||||||||||
| Liabilities | Gross Amounts of Recognized Liabilities | Gross Amounts Offset on the Consolidated Balance Sheet | Net Amounts of Liabilities Presented on the Consolidated Balance Sheet | Gross Amounts Not Offset on the Consolidated Balance Sheet | Net Amount | |||||||||||||||||||||||||||
| Collateral Pledged | ||||||||||||||||||||||||||||||||
| Repurchase agreements | $ | $ | $ | $ | ( | (2) | $ | |||||||||||||||||||||||||
(1)Represents the fair value of assets the Company has received under resale agreements, limited for table presentation purposes to the amount of the recognized asset due from each counterparty. The application of collateral cannot reduce the net position below zero. Therefore, excess collateral, if any, is not reflected above. There was no netting of repurchase agreements against resale agreements for the year ended December 31, 2021.
(2)Represents the fair value of assets the Company has pledged under repurchase agreements, limited for table presentation purposes to the amount of the recognized liability due to each counterparty. The application of collateral cannot reduce the net position below zero. Therefore, excess collateral, if any, is not reflected above. There was no netting of repurchase agreements against resale agreements for the year ended December 31, 2021.
In addition to the amounts included in the tables above, the Company also has balance sheet netting related to derivatives. Refer to Note 5 — Derivatives to the Consolidated Financial Statements in this Form 10-K for additional information.
115
Note 4 — Securities
The following tables present the amortized cost, gross unrealized gains and losses, and fair value by major categories of AFS debt securities as of December 31, 2021 and 2020:
| ($ in thousands) | December 31, 2021 | |||||||||||||||||||||||||
| Amortized Cost | Gross Unrealized Gains | Gross Unrealized Losses | Fair Value | |||||||||||||||||||||||
| AFS debt securities: | ||||||||||||||||||||||||||
| U.S. Treasury securities | $ | $ | $ | ( | $ | |||||||||||||||||||||
| U.S. government agency and U.S. government-sponsored enterprise debt securities | ( | |||||||||||||||||||||||||
| U.S. government agency and U.S. government-sponsored enterprise mortgage-backed securities: | ||||||||||||||||||||||||||
| Commercial mortgage-backed securities | ( | |||||||||||||||||||||||||
| Residential mortgage-backed securities | ( | |||||||||||||||||||||||||
| Municipal securities | ( | |||||||||||||||||||||||||
| Non-agency mortgage-backed securities: | ||||||||||||||||||||||||||
| Commercial mortgage-backed securities | ( | |||||||||||||||||||||||||
| Residential mortgage-backed securities | ( | |||||||||||||||||||||||||
| Corporate debt securities | ( | |||||||||||||||||||||||||
| Foreign government bonds | ( | |||||||||||||||||||||||||
| Asset-backed securities | ( | |||||||||||||||||||||||||
| CLOs | ( | |||||||||||||||||||||||||
| Total AFS debt securities | $ | $ | $ | ( | $ | |||||||||||||||||||||
| ($ in thousands) | December 31, 2020 | |||||||||||||||||||||||||
| Amortized Cost | Gross Unrealized Gains | Gross Unrealized Losses | Fair Value | |||||||||||||||||||||||
| AFS debt securities: | ||||||||||||||||||||||||||
| U.S. Treasury securities | $ | $ | $ | $ | ||||||||||||||||||||||
| U.S. government agency and U.S. government-sponsored enterprise debt securities | ( | |||||||||||||||||||||||||
| U.S. government agency and U.S. government-sponsored enterprise mortgage-backed securities: | ||||||||||||||||||||||||||
| Commercial mortgage-backed securities | ( | |||||||||||||||||||||||||
| Residential mortgage-backed securities | ( | |||||||||||||||||||||||||
| Municipal securities | ( | |||||||||||||||||||||||||
| Non-agency mortgage-backed securities: | ||||||||||||||||||||||||||
| Commercial mortgage-backed securities | ( | |||||||||||||||||||||||||
| Residential mortgage-backed securities | ( | |||||||||||||||||||||||||
| Corporate debt securities | ( | |||||||||||||||||||||||||
| Foreign government bonds | ( | |||||||||||||||||||||||||
| Asset-backed securities | ( | |||||||||||||||||||||||||
| CLOs | ( | |||||||||||||||||||||||||
| Total AFS debt securities | $ | $ | $ | ( | $ | |||||||||||||||||||||
The amortized cost of AFS debt securities excludes accrued interest receivables, which are a component of Other assets on the Consolidated Balance Sheet. The accrued interest receivables for AFS debt securities were $33.1 million and $22.3 million as of December 31, 2021 and 2020, respectively. For the Company’s accounting policy related to AFS debt securities’ accrued interest receivable, see Note 1 — Summary of Significant Accounting Policies — Allowance for Credit Losses on Available-for-Sale Debt Securities to the Consolidated Financial Statements in this Form 10-K.
116
Unrealized Losses
The following tables present the fair value and the associated gross unrealized losses of the Company’s AFS debt securities, aggregated by investment category and the length of time that the securities have been in a continuous unrealized loss position, as of December 31, 2021 and 2020:
| ($ in thousands) | December 31, 2021 | |||||||||||||||||||||||||||||||||||||
| Less Than 12 Months | 12 Months or More | Total | ||||||||||||||||||||||||||||||||||||
| Fair Value | Gross Unrealized Losses | Fair Value | Gross Unrealized Losses | Fair Value | Gross Unrealized Losses | |||||||||||||||||||||||||||||||||
| AFS debt securities: | ||||||||||||||||||||||||||||||||||||||
| U.S. Treasury securities | $ | $ | ( | $ | $ | ( | $ | $ | ( | |||||||||||||||||||||||||||||
| U.S. government agency and U.S. government-sponsored enterprise debt securities | ( | ( | ( | |||||||||||||||||||||||||||||||||||
| U.S. government agency and U.S. government-sponsored enterprise mortgage-backed securities: | ||||||||||||||||||||||||||||||||||||||
| Commercial mortgage-backed securities | ( | ( | ( | |||||||||||||||||||||||||||||||||||
| Residential mortgage-backed securities | ( | ( | ( | |||||||||||||||||||||||||||||||||||
| Municipal securities | ( | ( | ( | |||||||||||||||||||||||||||||||||||
| Non-agency mortgage-backed securities: | ||||||||||||||||||||||||||||||||||||||
| Commercial mortgage-backed securities | ( | ( | ( | |||||||||||||||||||||||||||||||||||
| Residential mortgage-backed securities | ( | ( | ( | |||||||||||||||||||||||||||||||||||
| Corporate debt securities | ( | ( | ( | |||||||||||||||||||||||||||||||||||
| Foreign government bonds | ( | ( | ( | |||||||||||||||||||||||||||||||||||
| Asset-backed securities | ( | ( | ||||||||||||||||||||||||||||||||||||
| CLOs | ( | ( | ( | |||||||||||||||||||||||||||||||||||
| Total AFS debt securities | $ | $ | ( | $ | $ | ( | $ | $ | ( | |||||||||||||||||||||||||||||
| ($ in thousands) | December 31, 2020 | |||||||||||||||||||||||||||||||||||||
| Less Than 12 Months | 12 Months or More | Total | ||||||||||||||||||||||||||||||||||||
| Fair Value | Gross Unrealized Losses | Fair Value | Gross Unrealized Losses | Fair Value | Gross Unrealized Losses | |||||||||||||||||||||||||||||||||
| AFS debt securities: | ||||||||||||||||||||||||||||||||||||||
| U.S. Treasury securities | $ | $ | ( | $ | $ | $ | $ | ( | ||||||||||||||||||||||||||||||
| U.S. government agency and U.S. government-sponsored enterprise mortgage-backed securities: | ||||||||||||||||||||||||||||||||||||||
| Commercial mortgage-backed securities | ( | ( | ( | |||||||||||||||||||||||||||||||||||
| Residential mortgage-backed securities | ( | ( | ||||||||||||||||||||||||||||||||||||
| Municipal securities | ( | ( | ||||||||||||||||||||||||||||||||||||
| Non-agency mortgage-backed securities: | ||||||||||||||||||||||||||||||||||||||
| Commercial mortgage-backed securities | ( | ( | ||||||||||||||||||||||||||||||||||||
| Residential mortgage-backed securities | ( | ( | ||||||||||||||||||||||||||||||||||||
| Corporate debt securities | ( | ( | ( | |||||||||||||||||||||||||||||||||||
| Foreign government bonds | ( | ( | ||||||||||||||||||||||||||||||||||||
| Asset-backed securities | ( | ( | ||||||||||||||||||||||||||||||||||||
| CLOs | ( | ( | ||||||||||||||||||||||||||||||||||||
| Total AFS debt securities | $ | $ | ( | $ | $ | ( | $ | $ | ( | |||||||||||||||||||||||||||||
117
As of December 31, 2021, the Company had 431 AFS debt securities in a gross unrealized loss position with no 180 U.S. government agency and U.S. government-sponsored enterprise mortgage-backed securities, 50 U.S. government agency and U.S. government-sponsored agency debt securities, 21 U.S. Treasury securities, and 30 corporate debt securities. In comparison, as of December 31, 2020, the Company had 104 AFS debt securities in a gross unrealized loss position with no credit impairment, consisting primarily of three CLOs, 46 U.S. government agency and U.S. government-sponsored enterprise mortgage-backed securities, and 17 corporate debt securities.
Allowance for Credit Losses
Each reporting period, the Company assesses each AFS debt security that is in an unrealized loss position to determine whether the decline in fair value below the amortized cost basis resulted from a credit loss or other factors. For a discussion of the factors and criteria the Company uses in analyzing securities for impairment related to credit losses, see Note 1 — Summary of Significant Accounting Policies — Significant Accounting Policies — Allowance for Credit Losses on Available-for-Sale Debt Securities to the Consolidated Financial Statements in this Form 10-K.
The gross unrealized losses presented in the above tables were primarily attributable to interest rate movement. Securities that were in unrealized loss positions as of December 31, 2021 were mainly comprised of the following:
•U.S. government agency and U.S. government-sponsored enterprise mortgage-backed securities — The market value decline as of December 31, 2021, was primarily due to interest rate movement. Since these securities (issued by Ginnie Mae, Freddie Mac, and Fannie Mae) are guaranteed or sponsored by agencies of the U.S. government, and the credit profiles are strong (rated Aaa, AA+ and AAA by Moody’s Investors Service (“Moody’s”), Standard & Poor's (“S&P”), and Fitch Ratings (“Fitch”), respectively), the Company expects to receive all contractual cash flows on time.
•U.S. government agency and U.S. government-sponsored agency debt securities — The market value decline as of December 31, 2021, was primarily due to interest rate movement. These securities are guaranteed or issued by entities sponsored by the U.S. government and the credit profiles are strong. The Company expects to receive all contractual cash flows on time. These securities consisted of the debt securities issued by:
•Federal Farm Credit Bank, Fannie Mae, Freddie Mac, and U.S. International Development Finance Corporation (rated Aaa, AA+ and AAA by Moody’s, S&P and Fitch, respectively).
•FHLB (rated Aaa and AA+ by Moody’s and S&P, respectively).
•U.S. Treasury securities — The market value decline as of December 31, 2021, was primarily due to interest rate movement. These securities are backed by the full faith of the U.S. government and are rated Aaa, AA+, and AAA by Moody’s, S&P, and Fitch, respectively. The Company expects to receive all contractual cash flows on time.
•Corporate debt securities — The market value decline as of December 31, 2021, was primarily due to interest rate movement and spread widening. Since the credit profiles of these securities are strong (rated BBB- or higher by Moody’s, S&P, Fitch, and Kroll Bond Rating Agency), and the contractual payments from these securities have been and are expected to be received on time, the Company believes that the risk of credit losses on these securities is low.
Overall, the Company believes that the credit support levels of the AFS debt securities are strong and, based on current assessments and macroeconomic forecasts, expects that full contractual cash flows will be received even if near-term credit performance could possibly be impacted by the COVID-19 pandemic, including new and more contagious variants.
As of December 31, 2021, the Company had the intent to hold the AFS debt securities with unrealized losses through the anticipated recovery period and it was more-likely-than-not that the Company will not have to sell these securities before recovery of their amortized cost. The issuers of these securities have not, to the Company’s knowledge, established any cause for default on these securities. As a result, the Company expects to recover the entire amortized cost basis of these securities. Accordingly, there was no no no OTTI credit loss recognized.
118
Realized Gains and Losses
The following table presents gross realized gains and tax expense related to the sales of AFS debt securities for the years ended December 31, 2021, 2020 and 2019:
| ($ in thousands) | Year Ended December 31, | |||||||||||||||||||
| 2021 | 2020 | 2019 | ||||||||||||||||||
| Gross realized gains | $ | $ | $ | |||||||||||||||||
| Related tax expense | $ | $ | $ | |||||||||||||||||
Contractual Maturities of Available-for-Sale Debt Securities
The following table presents the contractual maturities of AFS debt securities as of December 31, 2021. Expected maturities will differ from contractual maturities on certain securities as the issuers and borrowers of the underlying collateral may have the right to call or prepay obligations with or without prepayment penalties.
| ($ in thousands) | Amortized Cost | Fair Value | ||||||||||||
| Due within one year | $ | $ | ||||||||||||
| Due after one year through five years | ||||||||||||||
| Due after five years through ten years | ||||||||||||||
| Due after ten years | ||||||||||||||
| Total AFS debt securities | $ | $ | ||||||||||||
As of December 31, 2021 and 2020, AFS debt securities with fair value of $803.9 million and $588.5 million, respectively, were pledged to secure public deposits, repurchase agreements and for other purposes required or permitted by law.
Restricted Equity Securities
The following table presents the restricted equity securities on the Consolidated Balance Sheet as of December 31, 2021 and 2020:
| ($ in thousands) | December 31, | |||||||||||||
| 2021 | 2020 | |||||||||||||
FRBSF stock | $ | $ | ||||||||||||
| FHLB stock | ||||||||||||||
| Total restricted equity securities | $ | $ | ||||||||||||
Note 5 — Derivatives
119
The following table presents the notional amounts and gross fair values of the Company’s derivatives, as well as the balance sheet netting adjustments on an aggregate basis as of December 31, 2021 and 2020. The derivative assets and liabilities are presented on a gross basis prior to the application of bilateral collateral and master netting agreements, but after the variation margin payments with central clearing organizations have been applied as settlement, as applicable. Total derivative assets and liabilities are adjusted to take into consideration the effects of legally enforceable master netting agreements and cash collateral received or paid as of December 31, 2021 and 2020. The resulting net derivative asset and liability fair values are included in Other assets and Accrued expenses and other liabilities, respectively, on the Consolidated Balance Sheet.
| ($ in thousands) | December 31, 2021 | December 31, 2020 | ||||||||||||||||||||||||||||||||||||
| Notional Amount | Fair Value | Notional Amount | Fair Value | |||||||||||||||||||||||||||||||||||
| Derivative Assets | Derivative Liabilities | Derivative Assets | Derivative Liabilities | |||||||||||||||||||||||||||||||||||
| Derivatives designated as hedging instruments: | ||||||||||||||||||||||||||||||||||||||
| Cash flow hedges: | ||||||||||||||||||||||||||||||||||||||
Interest rate contracts | $ | $ | $ | $ | $ | $ | ||||||||||||||||||||||||||||||||
Net investment hedges: | ||||||||||||||||||||||||||||||||||||||
Foreign exchange contracts | ||||||||||||||||||||||||||||||||||||||
Total derivatives designated as hedging instruments | $ | $ | $ | $ | $ | $ | ||||||||||||||||||||||||||||||||
| Derivatives not designated as hedging instruments: | ||||||||||||||||||||||||||||||||||||||
Interest rate contracts | $ | $ | $ | $ | $ | $ | ||||||||||||||||||||||||||||||||
| Foreign exchange contracts | ||||||||||||||||||||||||||||||||||||||
| Credit contracts | ||||||||||||||||||||||||||||||||||||||
Equity contracts | (1) | (1) | ||||||||||||||||||||||||||||||||||||
Commodity contracts | (2) | (2) | ||||||||||||||||||||||||||||||||||||
Total derivatives not designated as hedging instruments | $ | $ | $ | $ | $ | $ | ||||||||||||||||||||||||||||||||
| Gross derivative assets/liabilities | $ | $ | $ | $ | ||||||||||||||||||||||||||||||||||
Less: Master netting agreements | ( | ( | ( | ( | ||||||||||||||||||||||||||||||||||
Less: Cash collateral received/paid | ( | ( | ( | ( | ||||||||||||||||||||||||||||||||||
Net derivative assets/liabilities | $ | $ | $ | $ | ||||||||||||||||||||||||||||||||||
(1)The Company held equity contracts in one public company and 12 private companies as of December 31, 2021. In comparison, the Company held equity contracts in two public companies and 17 private companies as of December 31, 2020.
(2)The notional amount of the Company’s commodity contracts entered with its customers totaled 7,519 thousand barrels of crude oil and 83,274 thousand units of natural gas, measured in million British thermal units (“MMBTUs”) as of December 31, 2021. In comparison, the notional amount of the Company’s commodity contracts entered with its customers totaled 6,321 thousand barrels of crude oil and 109,635 thousand MMBTUs of natural gas as of December 31, 2020. The Company simultaneously entered into the offsetting commodity contracts with mirrored terms with third-party financial institutions.
Derivatives Designated as Hedging Instruments
Fair Value Hedges — The Company entered into interest rate swaps designated as fair value hedges to hedge changes in the fair value of certain certificates of deposit due to changes in the benchmark interest rate. The interest rate swaps involved the exchange of variable-rate payments over the life of the agreements without exchanging the underlying notional amounts. During 2020, both the hedging interest rate swaps and hedged certificates of deposit were called. As of both December 31, 2021 and 2020, there were no
The following table presents the net gains (losses) recognized on the Consolidated Statement of Income related to the derivatives designated as fair value hedges for the years ended December 31, 2021, 2020 and 2019:
| ($ in thousands) | Year Ended December 31, | |||||||||||||||||||
| 2021 | 2020 | 2019 | ||||||||||||||||||
| Gains (losses) recorded in interest expense: | ||||||||||||||||||||
| Recognized on interest rate swaps | $ | $ | $ | |||||||||||||||||
| Recognized on certificates of deposit | $ | $ | ( | $ | ( | |||||||||||||||
120
Cash Flow Hedges — The Company entered into interest rate swaps that were designated and qualified as cash flow hedges during 2020 to hedge the variability in interest payments on certain floating-rate borrowings. For cash flow hedges, the entire change in the fair value of the hedging instruments is recognized in AOCI and reclassified to earnings in the same period when the hedged cash flows impact earnings. Reclassified gains and losses on interest rate swaps are recorded in the same line item as the interest payments of the hedged long-term borrowings within Interest expense in the Consolidated Statements of Income. Considering the interest rates, yield curve and notional amounts as of December 31, 2021, the Company expects to reclassify an estimated $28 thousand of after-tax net gains on derivative instruments designated as cash flow hedges from AOCI into earnings during the next 12 months.
The following table presents the pre-tax changes in AOCI from cash flow hedges for the years ended December 31, 2021, 2020 and 2019. The after-tax impact of cash flow hedges on AOCI is shown in Note 15 — Accumulated Other Comprehensive Income (Loss) to the Consolidated Financial Statements in this Form-10-K.
| ($ in thousands) | Year Ended December 31, | |||||||||||||||||||
| 2021 | 2020 | 2019 | ||||||||||||||||||
Gains (losses) recognized in AOCI | $ | $ | ( | $ | ||||||||||||||||
(Losses) gains reclassified from AOCI to interest expense | $ | ( | $ | $ | ||||||||||||||||
Net Investment Hedges — ASC 830-20, Foreign Currency Matters — Foreign Currency Transactions and ASC 815, Derivatives and Hedging, allow hedging of the foreign currency risk of a net investment in a foreign operation. The Company enters into foreign currency forward contracts to hedge a portion of the Bank’s investment in East West Bank (China) Limited, a non-USD functional currency subsidiary in China. The hedging instruments designated as net investment hedges involve hedging the risk of changes in the USD equivalent value of a designated monetary amount of the Bank’s net investment in East West Bank (China) Limited, against the risk of adverse changes in the foreign currency exchange rate of the RMB. The Company may de-designate the net investment hedges when the Company expects the hedge will cease to be highly effective.
The following table presents the after-tax losses recognized in AOCI on net investment hedges for the years ended December 31, 2021, 2020 and 2019:
| ($ in thousands) | Year Ended December 31, | |||||||||||||||||||
| 2021 | 2020 | 2019 | ||||||||||||||||||
| Losses recognized in AOCI | $ | ( | $ | ( | $ | ( | ||||||||||||||
Derivatives Not Designated as Hedging Instruments
Interest Rate Contracts — The Company enters into interest rate contracts, which include interest rate swaps and options with its customers to allow the customers to hedge against the risk of rising interest rates on their variable rate loans. To economically hedge against the interest rate risks in the products offered to its customers, the Company enters into mirrored offsetting interest rate contracts with third-party financial institutions, including central clearing organizations.
The following tables present the notional amounts and the gross fair values of interest rate derivative contracts outstanding as of December 31, 2021 and 2020:
| ($ in thousands) | December 31, 2021 | |||||||||||||||||||||||||||||||||||||||||||
| Customer Counterparty | ($ in thousands) | Financial Counterparty | ||||||||||||||||||||||||||||||||||||||||||
| Notional Amount | Fair Value | Notional Amount | Fair Value | |||||||||||||||||||||||||||||||||||||||||
| Assets | Liabilities | Assets | Liabilities | |||||||||||||||||||||||||||||||||||||||||
Written options | $ | $ | $ | Purchased options | $ | $ | $ | |||||||||||||||||||||||||||||||||||||
Sold collars and corridors | Collars and corridors | |||||||||||||||||||||||||||||||||||||||||||
| Swaps | Swaps | |||||||||||||||||||||||||||||||||||||||||||
Total | $ | $ | $ | Total | $ | $ | $ | |||||||||||||||||||||||||||||||||||||
121
| ($ in thousands) | December 31, 2020 | |||||||||||||||||||||||||||||||||||||||||||
| Customer Counterparty | ($ in thousands) | Financial Counterparty | ||||||||||||||||||||||||||||||||||||||||||
| Notional Amount | Fair Value | Notional Amount | Fair Value | |||||||||||||||||||||||||||||||||||||||||
| Assets | Liabilities | Assets | Liabilities | |||||||||||||||||||||||||||||||||||||||||
Written options | $ | $ | $ | Purchased options | $ | $ | $ | |||||||||||||||||||||||||||||||||||||
Sold collars and corridors | Collars and corridors | |||||||||||||||||||||||||||||||||||||||||||
| Swaps | Swaps | |||||||||||||||||||||||||||||||||||||||||||
Total | $ | $ | $ | Total | $ | $ | $ | |||||||||||||||||||||||||||||||||||||
Included in the total notional amount of $8.80 billion of interest rate contracts entered into with financial counterparties as of December 31, 2021, was a notional amount of $2.79 billion of interest rate swaps that cleared through the London Clearing House (“LCH”). Applying variation margin payments as settlement to LCH cleared derivative transactions resulted in a reduction in derivative asset fair values of $18.1 million and liability fair values of $79.9 million as of December 31, 2021. In comparison, included in the total notional amount of $9.09 billion of interest rate contracts entered into with financial counterparties as of December 31, 2020, was a notional amount of $2.98 billion of interest rate swaps that cleared through LCH. Applying variation margin payments as settlement to LCH cleared derivative transactions resulted in a reduction in derivative asset fair values of $1.3 million and liability fair values of $187.4 million as of December 31, 2020.
Foreign Exchange Contracts — The Company enters into foreign exchange contracts with its customers, consisting of forwards, spot, swap and option contracts to accommodate the business needs of its customers. The Company enters into offsetting foreign exchange contracts with third-party financial institutions to manage its foreign exchange exposure with its customers, and entered into bilateral collateral and master netting agreements with certain customer counterparties to manage its credit exposure. The Company also utilizes foreign exchange contracts, which are not designated as hedging instruments to mitigate the economic effect of currency fluctuations on certain foreign currency-denominated on-balance sheet assets and liabilities, primarily for foreign currency-denominated deposits offered to its customers. A majority of the foreign exchange contracts had original maturities of one year
The following tables present the notional amounts and the gross fair values of foreign exchange derivative contracts outstanding as of December 31, 2021 and 2020:
| ($ in thousands) | December 31, 2021 | |||||||||||||||||||||||||||||||||||||||||||
| Customer Counterparty | ($ in thousands) | Financial Counterparty | ||||||||||||||||||||||||||||||||||||||||||
| Notional Amount | Fair Value | Notional Amount | Fair Value | |||||||||||||||||||||||||||||||||||||||||
| Assets | Liabilities | Assets | Liabilities | |||||||||||||||||||||||||||||||||||||||||
| Forwards and spot | $ | $ | $ | Forwards and spot | $ | $ | $ | |||||||||||||||||||||||||||||||||||||
| Swaps | Swaps | |||||||||||||||||||||||||||||||||||||||||||
| Written options | Purchased options | |||||||||||||||||||||||||||||||||||||||||||
| Total | $ | $ | $ | Total | $ | $ | $ | |||||||||||||||||||||||||||||||||||||
| ($ in thousands) | December 31, 2020 | |||||||||||||||||||||||||||||||||||||||||||
| Customer Counterparty | ($ in thousands) | Financial Counterparty | ||||||||||||||||||||||||||||||||||||||||||
| Notional Amount | Fair Value | Notional Amount | Fair Value | |||||||||||||||||||||||||||||||||||||||||
| Assets | Liabilities | Assets | Liabilities | |||||||||||||||||||||||||||||||||||||||||
| Forwards and spot | $ | $ | $ | Forwards and spot | $ | $ | $ | |||||||||||||||||||||||||||||||||||||
| Swaps | Swaps | |||||||||||||||||||||||||||||||||||||||||||
| Written options | Purchased options | |||||||||||||||||||||||||||||||||||||||||||
| Total | $ | $ | $ | Total | $ | $ | $ | |||||||||||||||||||||||||||||||||||||
122
Credit Contracts — The Company may periodically enter into credit RPAs with institutional counterparties to manage the credit exposure of the interest rate contracts associated with the syndicated loans. The Company may enter into protection sold or protection purchased RPAs. The purchaser of credit protection that enters into an interest rate contract with the borrower, may in turn enter into an RPA with a seller of protection, under which the seller of protection receives a fee to accept a portion of the credit risk. A seller of credit protection is required to make payments to the buyer if a borrower defaults on the related interest rate contract. Credit risk on RPAs is managed by monitoring the credit worthiness of the borrowers and institutional counterparties, which is part of the normal credit review and monitoring process. The majority of the reference entities of the protection sold RPAs were investment grade as of December 31, 2021, while all were investment grade as of December 31, 2020. Assuming the underlying borrowers referenced in the interest rate contracts defaulted as of December 31, 2021 and 2020, the maximum exposure of protection sold RPAs would be $3.2 million and $6.0 million for 2021 and 2020, respectively. As of December 31, 2021 and 2020, the weighted-average remaining maturities of the outstanding protection sold RPAs were 3.2 years and 3.5 years, respectively.
The notional amount of the RPAs reflects the Company’s pro-rata share of the derivative instrument. The following table presents the notional amounts and the gross fair values of RPAs sold and purchased outstanding as of December 31, 2021 and 2020:
| ($ in thousands) | December 31, 2021 | December 31, 2020 | ||||||||||||||||||||||||||||||||||||
| Notional Amount | Fair Value | Notional Amount | Fair Value | |||||||||||||||||||||||||||||||||||
| Assets | Liabilities | Assets | Liabilities | |||||||||||||||||||||||||||||||||||
| RPAs - protection sold | $ | $ | $ | $ | $ | $ | ||||||||||||||||||||||||||||||||
| RPAs - protection purchased | ||||||||||||||||||||||||||||||||||||||
| Total RPAs | $ | $ | $ | $ | $ | $ | ||||||||||||||||||||||||||||||||
Equity Contracts — From time to time, as part of the Company’s loan origination process, the Company obtains warrants to purchase preferred and/or common stock of technology and life sciences companies to which it provides loans. Warrants grant the Company the right to buy a certain class of the underlying company’s equity at a certain price before expiration. The Company held warrants in one public company and 12 private companies as of December 31, 2021, and held warrants in two public companies and 17 private companies as of December 31, 2020. The total fair value of the warrants held was $220 thousand and $858 thousand as of December 31, 2021 and 2020, respectively.
Commodity Contracts — The Company enters into energy commodity contracts in the form of swaps and options with its commercial loan customers to allow them to hedge against the risk of energy commodity price fluctuation. To economically hedge against the risk of commodity price fluctuation in the products offered to its customers, the Company enters into offsetting commodity contracts with third-party financial institutions to manage the exposure.
The following tables present the notional amounts and fair values of the commodity derivative positions outstanding as of December 31, 2021 and 2020.
| ($ and units in thousands) | December 31, 2021 | |||||||||||||||||||||||||||||||||||||||||||||||||||||||
| Customer Counterparty | ($ and units in thousands) | Financial Counterparty | ||||||||||||||||||||||||||||||||||||||||||||||||||||||
| Notional Unit | Fair Value | Notional Unit | Fair Value | |||||||||||||||||||||||||||||||||||||||||||||||||||||
| Assets | Liabilities | Assets | Liabilities | |||||||||||||||||||||||||||||||||||||||||||||||||||||
| Crude oil: | Crude oil: | |||||||||||||||||||||||||||||||||||||||||||||||||||||||
| Written options | Barrels | $ | $ | Purchased options | Barrels | $ | $ | |||||||||||||||||||||||||||||||||||||||||||||||||
Collars | Barrels | Collars | Barrels | |||||||||||||||||||||||||||||||||||||||||||||||||||||
Swaps | Barrels | Swaps | Barrels | |||||||||||||||||||||||||||||||||||||||||||||||||||||
Total | $ | $ | Total | $ | $ | |||||||||||||||||||||||||||||||||||||||||||||||||||
Natural gas: | Natural gas: | |||||||||||||||||||||||||||||||||||||||||||||||||||||||
Collars | MMBTUs | $ | $ | Collars | MMBTUs | $ | $ | |||||||||||||||||||||||||||||||||||||||||||||||||
Swaps | MMBTUs | Swaps | MMBTUs | |||||||||||||||||||||||||||||||||||||||||||||||||||||
Total | $ | $ | Total | $ | $ | |||||||||||||||||||||||||||||||||||||||||||||||||||
| Total | $ | $ | Total | $ | $ | |||||||||||||||||||||||||||||||||||||||||||||||||||
123
| ($ and units in thousands) | December 31, 2020 | |||||||||||||||||||||||||||||||||||||||||||||||||||||||
| Customer Counterparty | ($ and units in thousands) | Financial Counterparty | ||||||||||||||||||||||||||||||||||||||||||||||||||||||
| Notional Unit | Fair Value | Notional Unit | Fair Value | |||||||||||||||||||||||||||||||||||||||||||||||||||||
| Assets | Liabilities | Assets | Liabilities | |||||||||||||||||||||||||||||||||||||||||||||||||||||
| Crude oil: | Crude oil: | |||||||||||||||||||||||||||||||||||||||||||||||||||||||
Collars | Barrels | $ | $ | Collars | Barrels | $ | $ | |||||||||||||||||||||||||||||||||||||||||||||||||
Swaps | Barrels | Swaps | Barrels | |||||||||||||||||||||||||||||||||||||||||||||||||||||
Total | $ | $ | Total | $ | $ | |||||||||||||||||||||||||||||||||||||||||||||||||||
Natural gas: | Natural gas: | |||||||||||||||||||||||||||||||||||||||||||||||||||||||
| Written options | MMBTUs | $ | $ | Purchased options | MMBTUs | $ | $ | |||||||||||||||||||||||||||||||||||||||||||||||||
Collars | MMBTUs | Collars | MMBTUs | |||||||||||||||||||||||||||||||||||||||||||||||||||||
Swaps | MMBTUs | Swaps | MMBTUs | |||||||||||||||||||||||||||||||||||||||||||||||||||||
Total | $ | $ | Total | $ | $ | |||||||||||||||||||||||||||||||||||||||||||||||||||
| Total | $ | $ | Total | $ | $ | |||||||||||||||||||||||||||||||||||||||||||||||||||
As of December 31, 2021, the notional amounts that cleared through the Chicago Mercantile Exchange (“CME”), totaled 1,036 thousand barrels of crude oil and 11,490 thousand MMBTUs of natural gas. Applying the variation margin payments as settlement to CME-cleared derivative transactions resulted in reductions to the gross derivative asset fair value of $2.2 million and to the liability fair value of $25.8 million as of December 31, 2021. In comparison, the notional amounts that cleared through CME totaled 1,275 thousand barrels of crude oil and 29,733 thousand MMBTUs of natural gas as of December 31, 2020. Applying the variation margin payments as settlement to CME-cleared derivative transactions resulted in a reduction to the gross derivative asset fair value of $7.9 million and to the liability fair value of $3.7 million, respectively, as of December 31, 2020.
The following table presents the net gains (losses) recognized on the Company’s Consolidated Statement of Income related to derivatives not designated as hedging instruments for the years ended December 31, 2021, 2020 and 2019:
| ($ in thousands) | Classification on Consolidated Statement of Income | Year Ended December 31, | ||||||||||||||||||||||||
| 2021 | 2020 | 2019 | ||||||||||||||||||||||||
Derivatives not designated as hedging instruments: | ||||||||||||||||||||||||||
| Interest rate contracts | Interest rate contracts and other derivative income | $ | $ | ( | $ | ( | ||||||||||||||||||||
| Foreign exchange contracts | Foreign exchange income | |||||||||||||||||||||||||
| Credit contracts | Interest rate contracts and other derivative income | ( | ||||||||||||||||||||||||
| Equity contracts | Lending fees | |||||||||||||||||||||||||
| Commodity contracts | Interest rate contracts and other derivative income | ( | ( | ( | ||||||||||||||||||||||
| Net gains | $ | $ | $ | |||||||||||||||||||||||
Credit-Risk-Related Contingent Features — Certain of the Company’s over-the-counter derivative contracts contain early termination provisions that may require the Company to settle any outstanding balances upon the occurrence of a specified credit-risk-related event. Such event primarily relates to a downgrade in the credit rating of East West Bank to below investment grade. As of December 31, 2021, the aggregate fair value amounts of all derivative instruments with credit risk-related contingent features that were in a net liability position totaled $66.8 million, in which $66.6 million of collateral was posted to cover these positions. As of December 31, 2020, the aggregate fair value amounts of all derivative instruments with credit risk-related contingent features that were in a net liability position totaled $107.4 million, in which $106.8 million of collateral was posted to cover these positions. In the event that the credit rating of East West Bank had been downgraded to below investment grade, minimal additional collateral would have been required to be posted as of December 31, 2021 and 2020.
124
Offsetting of Derivatives
The following tables present the gross derivative fair values, the balance sheet netting adjustments and the resulting net fair values recorded on the consolidated balance sheet, as well as the cash and noncash collateral associated with master netting arrangements. The gross amounts of derivative assets and liabilities are presented after the application of variation margin payments as settlements with central counterparties, where applicable. The collateral amounts in the following tables are limited to the outstanding balances of the related asset or liability, after the application of netting; therefore instances of overcollateralization are not shown:
| ($ in thousands) | As of December 31, 2021 | |||||||||||||||||||||||||||||||||||||
Gross Amounts Recognized (1) | Gross Amounts Offset on the Consolidated Balance Sheet | Net Amounts Presented on the Consolidated Balance Sheet | Gross Amounts Not Offset on the Consolidated Balance Sheet | Net Amount | ||||||||||||||||||||||||||||||||||
| Master Netting Arrangements | Cash Collateral Received (3) | Security Collateral Received (5) | ||||||||||||||||||||||||||||||||||||
| Derivative assets | $ | $ | ( | $ | ( | $ | $ | $ | ||||||||||||||||||||||||||||||
Gross Amounts Recognized (2) | Gross Amounts Offset on the Consolidated Balance Sheet | Net Amounts Presented on the Consolidated Balance Sheet | Gross Amounts Not Offset on the Consolidated Balance Sheet | Net Amount | ||||||||||||||||||||||||||||||||||
| Master Netting Arrangements | Cash Collateral Pledged (4) | Security Collateral Pledged (5) | ||||||||||||||||||||||||||||||||||||
| Derivative liabilities | $ | $ | ( | $ | ( | $ | $ | ( | $ | |||||||||||||||||||||||||||||
| ($ in thousands) | As of December 31, 2020 | |||||||||||||||||||||||||||||||||||||
Gross Amounts Recognized (1) | Gross Amounts Offset on the Consolidated Balance Sheet | Net Amounts Presented on the Consolidated Balance Sheet | Gross Amounts Not Offset on the Consolidated Balance Sheet | Net Amount | ||||||||||||||||||||||||||||||||||
| Master Netting Arrangements | Cash Collateral Received (3) | Security Collateral Received (5) | ||||||||||||||||||||||||||||||||||||
| Derivative assets | $ | $ | ( | $ | ( | $ | $ | ( | $ | |||||||||||||||||||||||||||||
Gross Amounts Recognized (2) | Gross Amounts Offset on the Consolidated Balance Sheet | Net Amounts Presented on the Consolidated Balance Sheet | Gross Amounts Not Offset on the Consolidated Balance Sheet | Net Amount | ||||||||||||||||||||||||||||||||||
| Master Netting Arrangements | Cash Collateral Pledged (4) | Security Collateral Pledged (5) | ||||||||||||||||||||||||||||||||||||
| Derivative liabilities | $ | $ | ( | $ | ( | $ | $ | ( | $ | |||||||||||||||||||||||||||||
(1)Included $587 thousand and $1.1 million of gross fair value assets with counterparties that were not subject to enforceable master netting arrangements or similar agreements as of December 31, 2021 and 2020, respectively.
(2)Included $666 thousand and $220 thousand of gross fair value liabilities with counterparties that were not subject to enforceable master netting arrangements or similar agreements as of December 31, 2021 and 2020, respectively.
(3)Gross cash collateral received under master netting arrangements or similar agreements were $47.0 million and $15.8 million as of December 31, 2021 and 2020, respectively. Of the gross cash collateral received, $42.3 million and $8.4 million were used to offset against derivative assets as of December 31, 2021 and 2020, respectively.
(4)Gross cash collateral pledged under master netting arrangements or similar agreements were $176.5 million and $91.6 million as of December 31, 2021 and 2020, respectively. Of the gross cash collateral pledged, $174.0 million and $91.6 million were used to offset against derivative liabilities as of December 31, 2021 and 2020, respectively.
(5)Represents the fair value of security collateral received and pledged limited to derivative assets and liabilities that are subject to enforceable master netting arrangements or similar agreements. U.S. GAAP does not permit the netting of noncash collateral on the consolidated balance sheet but requires disclosure of such amounts.
125
Note 6 — Loans Receivable and Allowance for Credit Losses
The following table presents the composition of the Company’s loans held-for-investment outstanding as of December 31, 2021 and 2020:
| ($ in thousands) | December 31, 2021 | December 31, 2020 | ||||||||||||
| Commercial: | ||||||||||||||
C&I (1) | $ | $ | ||||||||||||
| CRE: | ||||||||||||||
| CRE | ||||||||||||||
| Multifamily residential | ||||||||||||||
| Construction and land | ||||||||||||||
| Total CRE | ||||||||||||||
| Total commercial | ||||||||||||||
| Consumer: | ||||||||||||||
| Residential mortgage: | ||||||||||||||
| Single-family residential | ||||||||||||||
| HELOCs | ||||||||||||||
| Total residential mortgage | ||||||||||||||
| Other consumer | ||||||||||||||
| Total consumer | ||||||||||||||
Total loans held-for-investment (2) | $ | $ | ||||||||||||
| Allowance for loan losses | ( | ( | ||||||||||||
Loans held-for-investment, net (2) | $ | $ | ||||||||||||
(1)Includes PPP loans of $534.2 million and $1.57 billion as of December 31, 2021 and 2020, respectively.
(2)Includes net deferred loan fees, unearned fees, unamortized premiums and unaccreted discounts of $(50.7 ) million and $(58.8 ) million as of December 31, 2021 and 2020, respectively. Net origination fees related to PPP loans were $(5.7 ) million and $(12.7 ) million as of December 31, 2021 and 2020, respectively.
Loans held-for-investment accrued interest receivable was $107.4 million and $107.5 million as of December 31, 2021 and 2020, respectively, and is included in Other assets on the Consolidated Balance Sheet. For the Company’s accounting policy on accrued interest receivable related to loans held-for-investment, see Note 1 — Summary of Significant Accounting Policies — Loans Held-for-Investment to the Consolidated Financial Statements in this Form 10-K.
The Company’s FRBSF and FHLB borrowings are primarily secured by loans held-for-investment. Loans held-for-investment totaling $27.67 billion and $23.26 billion, respectively, were pledged to secure borrowings and provide additional borrowing capacity as of December 31, 2021 and 2020.
Credit Quality Indicators
All loans are subject to the Company’s credit review and monitoring process. For the commercial loan portfolio, loans are risk rated based on an analysis of the borrower’s current payment performance or delinquency, repayment sources, financial and liquidity factors, including industry and geographic considerations. For a majority of the consumer loan portfolio, payment performance or delinquency is the driving indicator for the risk ratings.
The Company utilizes internal credit risk ratings to assign each individual loan a risk rating of 1 through 10:
•Pass — loans risk rated 1 through 5 are assigned an internal risk rating category of “Pass.” Loans risk rated 1 are typically loans fully secured by cash. Pass loans have sufficient sources of repayment to repay the loan in full, in accordance with all terms and conditions.
•Special mention — loans assigned a risk rating of 6 have potential weaknesses that warrant closer attention by management; these are assigned an internal risk rating category of “Special Mention.”
126
•Substandard — loans assigned a risk rating of 7 or 8 have well-defined weaknesses that may jeopardize the full and timely repayment of the loan; these are assigned an internal risk rating category of “Substandard.”
•Doubtful — loans assigned a risk rating of 9 have insufficient sources of repayment and a high probability of loss; these are assigned an internal risk rating category of “Doubtful.”
•Loss — loans assigned a risk rating of 10 are uncollectible and of such little value that they are no longer considered bankable assets; these are assigned an internal risk rating category of “Loss.”
Loan exposures categorized as criticized consist of special mention, substandard, doubtful and loss categories. The Company reviews the internal risk ratings of its loan portfolio on a regular basis, and adjusts the ratings based on changes in the borrowers’ financial status and the collectability of the loans.
127
The following tables summarize the Company’s loans held-for-investment by loan portfolio segments, internal risk ratings and vintage year as of December 31, 2021 and 2020. The vintage year is the year of origination, renewal or major modification.
| ($ in thousands) | December 31, 2021 | |||||||||||||||||||||||||||||||||||||||||||||||||||||||
| Term Loans | Revolving Loans Amortized Cost Basis | Revolving Loans Converted to Term Loans Amortized Cost Basis | Total | |||||||||||||||||||||||||||||||||||||||||||||||||||||
| Amortized Cost Basis by Origination Year | ||||||||||||||||||||||||||||||||||||||||||||||||||||||||
| 2021 | 2020 | 2019 | 2018 | 2017 | Prior | |||||||||||||||||||||||||||||||||||||||||||||||||||
| Commercial: | ||||||||||||||||||||||||||||||||||||||||||||||||||||||||
| C&I: | ||||||||||||||||||||||||||||||||||||||||||||||||||||||||
| Pass | $ | $ | $ | $ | $ | $ | $ | $ | $ | |||||||||||||||||||||||||||||||||||||||||||||||
| Criticized (accrual) | ||||||||||||||||||||||||||||||||||||||||||||||||||||||||
| Criticized (nonaccrual) | ||||||||||||||||||||||||||||||||||||||||||||||||||||||||
| Total C&I | ||||||||||||||||||||||||||||||||||||||||||||||||||||||||
| CRE: | ||||||||||||||||||||||||||||||||||||||||||||||||||||||||
| Pass | ||||||||||||||||||||||||||||||||||||||||||||||||||||||||
| Criticized (accrual) | ||||||||||||||||||||||||||||||||||||||||||||||||||||||||
| Criticized (nonaccrual) | ||||||||||||||||||||||||||||||||||||||||||||||||||||||||
| Subtotal CRE | ||||||||||||||||||||||||||||||||||||||||||||||||||||||||
| Multifamily residential: | ||||||||||||||||||||||||||||||||||||||||||||||||||||||||
| Pass | ||||||||||||||||||||||||||||||||||||||||||||||||||||||||
| Criticized (accrual) | ||||||||||||||||||||||||||||||||||||||||||||||||||||||||
| Criticized (nonaccrual) | ||||||||||||||||||||||||||||||||||||||||||||||||||||||||
| Subtotal multifamily residential | ||||||||||||||||||||||||||||||||||||||||||||||||||||||||
| Construction and land: | ||||||||||||||||||||||||||||||||||||||||||||||||||||||||
| Pass | ||||||||||||||||||||||||||||||||||||||||||||||||||||||||
| Criticized (accrual) | ||||||||||||||||||||||||||||||||||||||||||||||||||||||||
| Criticized (nonaccrual) | ||||||||||||||||||||||||||||||||||||||||||||||||||||||||
| Subtotal construction and land | ||||||||||||||||||||||||||||||||||||||||||||||||||||||||
| Total CRE | ||||||||||||||||||||||||||||||||||||||||||||||||||||||||
| Total commercial | ||||||||||||||||||||||||||||||||||||||||||||||||||||||||
| Consumer: | ||||||||||||||||||||||||||||||||||||||||||||||||||||||||
| Single-family residential: | ||||||||||||||||||||||||||||||||||||||||||||||||||||||||
Pass (1) | ||||||||||||||||||||||||||||||||||||||||||||||||||||||||
| Criticized (accrual) | ||||||||||||||||||||||||||||||||||||||||||||||||||||||||
Criticized (Nonaccrual) (1) | ||||||||||||||||||||||||||||||||||||||||||||||||||||||||
| Subtotal single-family residential mortgage | ||||||||||||||||||||||||||||||||||||||||||||||||||||||||
| HELOCs: | ||||||||||||||||||||||||||||||||||||||||||||||||||||||||
| Pass | ||||||||||||||||||||||||||||||||||||||||||||||||||||||||
| Criticized (accrual) | ||||||||||||||||||||||||||||||||||||||||||||||||||||||||
| Criticized (nonaccrual) | ||||||||||||||||||||||||||||||||||||||||||||||||||||||||
| Subtotal HELOCs | ||||||||||||||||||||||||||||||||||||||||||||||||||||||||
| Total residential mortgage | ||||||||||||||||||||||||||||||||||||||||||||||||||||||||
| Other consumer: | ||||||||||||||||||||||||||||||||||||||||||||||||||||||||
| Pass | ||||||||||||||||||||||||||||||||||||||||||||||||||||||||
| Criticized (accrual) | ||||||||||||||||||||||||||||||||||||||||||||||||||||||||
| Criticized (nonaccrual) | ||||||||||||||||||||||||||||||||||||||||||||||||||||||||
| Subtotal other consumer | ||||||||||||||||||||||||||||||||||||||||||||||||||||||||
| Total consumer | ||||||||||||||||||||||||||||||||||||||||||||||||||||||||
| Total | $ | $ | $ | $ | $ | $ | $ | $ | $ | |||||||||||||||||||||||||||||||||||||||||||||||
128
| ($ in thousands) | December 31, 2020 | |||||||||||||||||||||||||||||||||||||||||||||||||||||||
| Term Loans | Revolving Loans Amortized Cost Basis | Revolving Loans Converted to Term Loans Amortized Cost Basis | Total | |||||||||||||||||||||||||||||||||||||||||||||||||||||
| Amortized Cost Basis by Origination Year | ||||||||||||||||||||||||||||||||||||||||||||||||||||||||
| 2020 | 2019 | 2018 | 2017 | 2016 | Prior | |||||||||||||||||||||||||||||||||||||||||||||||||||
| Commercial: | ||||||||||||||||||||||||||||||||||||||||||||||||||||||||
| C&I: | ||||||||||||||||||||||||||||||||||||||||||||||||||||||||
| Pass | $ | $ | $ | $ | $ | $ | $ | $ | $ | |||||||||||||||||||||||||||||||||||||||||||||||
| Criticized (accrual) | ||||||||||||||||||||||||||||||||||||||||||||||||||||||||
| Criticized (nonaccrual) | ||||||||||||||||||||||||||||||||||||||||||||||||||||||||
| Total C&I | ||||||||||||||||||||||||||||||||||||||||||||||||||||||||
| CRE: | ||||||||||||||||||||||||||||||||||||||||||||||||||||||||
| Pass | ||||||||||||||||||||||||||||||||||||||||||||||||||||||||
| Criticized (accrual) | ||||||||||||||||||||||||||||||||||||||||||||||||||||||||
| Criticized (nonaccrual) | ||||||||||||||||||||||||||||||||||||||||||||||||||||||||
| Subtotal CRE | ||||||||||||||||||||||||||||||||||||||||||||||||||||||||
| Multifamily residential: | ||||||||||||||||||||||||||||||||||||||||||||||||||||||||
| Pass | ||||||||||||||||||||||||||||||||||||||||||||||||||||||||
| Criticized (accrual) | ||||||||||||||||||||||||||||||||||||||||||||||||||||||||
| Criticized (nonaccrual) | ||||||||||||||||||||||||||||||||||||||||||||||||||||||||
| Subtotal multifamily residential | ||||||||||||||||||||||||||||||||||||||||||||||||||||||||
| Construction and land: | ||||||||||||||||||||||||||||||||||||||||||||||||||||||||
| Pass | ||||||||||||||||||||||||||||||||||||||||||||||||||||||||
| Criticized (accrual) | ||||||||||||||||||||||||||||||||||||||||||||||||||||||||
| Criticized (nonaccrual) | ||||||||||||||||||||||||||||||||||||||||||||||||||||||||
| Subtotal construction and land | ||||||||||||||||||||||||||||||||||||||||||||||||||||||||
| Total CRE | ||||||||||||||||||||||||||||||||||||||||||||||||||||||||
| Total commercial | ||||||||||||||||||||||||||||||||||||||||||||||||||||||||
| Consumer: | ||||||||||||||||||||||||||||||||||||||||||||||||||||||||
| Single-family residential: | ||||||||||||||||||||||||||||||||||||||||||||||||||||||||
Pass (1) | ||||||||||||||||||||||||||||||||||||||||||||||||||||||||
| Criticized (accrual) | ||||||||||||||||||||||||||||||||||||||||||||||||||||||||
Criticized (nonaccrual) (1) | ||||||||||||||||||||||||||||||||||||||||||||||||||||||||
| Subtotal single-family residential mortgage | ||||||||||||||||||||||||||||||||||||||||||||||||||||||||
| HELOCs: | ||||||||||||||||||||||||||||||||||||||||||||||||||||||||
| Pass | ||||||||||||||||||||||||||||||||||||||||||||||||||||||||
| Criticized (accrual) | ||||||||||||||||||||||||||||||||||||||||||||||||||||||||
| Criticized (nonaccrual) | ||||||||||||||||||||||||||||||||||||||||||||||||||||||||
| Subtotal HELOCs | ||||||||||||||||||||||||||||||||||||||||||||||||||||||||
| Total residential mortgage | ||||||||||||||||||||||||||||||||||||||||||||||||||||||||
| Other consumer: | ||||||||||||||||||||||||||||||||||||||||||||||||||||||||
| Pass | ||||||||||||||||||||||||||||||||||||||||||||||||||||||||
| Criticized (accrual) | ||||||||||||||||||||||||||||||||||||||||||||||||||||||||
| Criticized (nonaccrual) | ||||||||||||||||||||||||||||||||||||||||||||||||||||||||
| Subtotal other consumer | ||||||||||||||||||||||||||||||||||||||||||||||||||||||||
| Total consumer | ||||||||||||||||||||||||||||||||||||||||||||||||||||||||
| Total | $ | $ | $ | $ | $ | $ | $ | $ | $ | |||||||||||||||||||||||||||||||||||||||||||||||
(1)As of December 31, 2021 and 2020, $1.6 million and $747 thousand, respectively, of nonaccrual loans whose payments are guaranteed by the Federal Housing Administration were classified with a “Pass” rating.
129
Revolving loans that are converted to term loans presented in the table above are excluded from the term loans by vintage year columns. During the years ended December 31, 2021 and 2020, HELOCs totaling $54.1 million and $145.0 million, respectively, were converted to term loans. During the year ended December 31, 2021, one C&I revolving loan totaling $78 thousand and three CRE revolving loans totaling $6.4 million were converted to term loans. In comparison, four C&I revolving loans totaling $23.9 million were converted to term loans during the year ended December 31, 2020.
Nonaccrual and Past Due Loans
Loans that are 90 or more days past due are generally placed on nonaccrual status, unless the loan is well-collateralized and in the process of collection. Loans that are less than 90 days past due but have identified deficiencies, such as when the full collection of principal or interest becomes uncertain, are also placed on nonaccrual status. Payment deferral activities instituted in response to the COVID-19 pandemic could delay the recognition of delinquencies for customers who otherwise would have moved into nonaccrual status. The following tables present the aging analysis of total loans held-for-investment as of December 31, 2021 and 2020:
| ($ in thousands) | December 31, 2021 | |||||||||||||||||||||||||||||||||||||
| Current Accruing Loans | Accruing Loans 30-59 Days Past Due | Accruing Loans 60-89 Days Past Due | Total Accruing Past Due Loans | Total Nonaccrual Loans | Total Loans | |||||||||||||||||||||||||||||||||
| Commercial: | ||||||||||||||||||||||||||||||||||||||
| C&I | $ | $ | $ | $ | $ | $ | ||||||||||||||||||||||||||||||||
| CRE: | ||||||||||||||||||||||||||||||||||||||
| CRE | ||||||||||||||||||||||||||||||||||||||
| Multifamily residential | ||||||||||||||||||||||||||||||||||||||
| Construction and land | ||||||||||||||||||||||||||||||||||||||
| Total CRE | ||||||||||||||||||||||||||||||||||||||
| Total commercial | ||||||||||||||||||||||||||||||||||||||
| Consumer: | ||||||||||||||||||||||||||||||||||||||
| Residential mortgage: | ||||||||||||||||||||||||||||||||||||||
| Single-family residential | ||||||||||||||||||||||||||||||||||||||
| HELOCs | ||||||||||||||||||||||||||||||||||||||
| Total residential mortgage | ||||||||||||||||||||||||||||||||||||||
| Other consumer | ||||||||||||||||||||||||||||||||||||||
| Total consumer | ||||||||||||||||||||||||||||||||||||||
| Total | $ | $ | $ | $ | $ | $ | ||||||||||||||||||||||||||||||||
130
| ($ in thousands) | December 31, 2020 | |||||||||||||||||||||||||||||||||||||
Current Accruing Loans (1) | Accruing Loans 30-59 Days Past Due | Accruing Loans 60-89 Days Past Due | Total Accruing Past Due Loans | Total Nonaccrual Loans | Total Loans | |||||||||||||||||||||||||||||||||
| Commercial: | ||||||||||||||||||||||||||||||||||||||
| C&I | $ | $ | $ | $ | $ | $ | ||||||||||||||||||||||||||||||||
| CRE: | ||||||||||||||||||||||||||||||||||||||
| CRE | ||||||||||||||||||||||||||||||||||||||
| Multifamily residential | ||||||||||||||||||||||||||||||||||||||
| Construction and land | ||||||||||||||||||||||||||||||||||||||
| Total CRE | ||||||||||||||||||||||||||||||||||||||
| Total commercial | ||||||||||||||||||||||||||||||||||||||
| Consumer: | ||||||||||||||||||||||||||||||||||||||
| Residential mortgage: | ||||||||||||||||||||||||||||||||||||||
| Single-family residential | ||||||||||||||||||||||||||||||||||||||
| HELOCs | ||||||||||||||||||||||||||||||||||||||
Total residential mortgage | ||||||||||||||||||||||||||||||||||||||
| Other consumer | ||||||||||||||||||||||||||||||||||||||
| Total consumer | ||||||||||||||||||||||||||||||||||||||
| Total | $ | $ | $ | $ | $ | $ | ||||||||||||||||||||||||||||||||
(1)As of both December 31, 2021 and 2020, loans in payment deferral programs offered in response to the COVID-19 pandemic that are performing according to their modified terms are generally not considered delinquent, and are included in the “Current Accruing Loans” column.
The following table presents amortized cost of loans on nonaccrual status for which there was no related allowance for loan losses as of both December 31, 2021 and 2020. Nonaccrual loans may not have an allowance for credit losses if there is no loss expectation since the loan balances are well secured by the collateral value.
| ($ in thousands) | December 31, 2021 | December 31, 2020 | ||||||||||||
| Commercial: | ||||||||||||||
| C&I | $ | $ | ||||||||||||
| CRE: | ||||||||||||||
| CRE | ||||||||||||||
| Multifamily residential | ||||||||||||||
| Total CRE | ||||||||||||||
| Total commercial | ||||||||||||||
| Consumer: | ||||||||||||||
| Residential mortgage: | ||||||||||||||
| Single-family residential | ||||||||||||||
| HELOCs | ||||||||||||||
| Total residential mortgage | ||||||||||||||
| Other consumer | ||||||||||||||
| Total consumer | ||||||||||||||
| Total nonaccrual loans with no related allowance for loan losses | $ | $ | ||||||||||||
Foreclosed Assets
The Company acquires assets from borrowers through loan restructurings, workouts, and foreclosures. Assets acquired may include real properties (e.g., residential real estate, land, and buildings) and commercial and personal properties. The Company recognizes foreclosed assets upon receiving assets in satisfaction of a loan (e.g., taking legal title or physical possession).
131
Foreclosed assets, consisting of OREO and other nonperforming assets, are included in Other assets on the Consolidated Balance Sheet. The Company had $10.3 million in foreclosed assets as of December 31, 2021, compared with $19.7 million as of December 31, 2020. The Company commences the foreclosure process on consumer mortgage loans after a borrower becomes more than 120 days delinquent in accordance with the Consumer Financial Protection Bureau guidelines. The carrying values of consumer real estate loans that were in the process of active or suspended foreclosure were $7.3 million and $4.1 million as of December 31, 2021 and 2020, respectively.
In response to the COVID-19 pandemic, the Company has suspended certain mortgage foreclosure activities in connection with its actions to support its customers throughout 2021 and 2020. In addition, certain other foreclosures are awaiting for the end of government-mandated foreclosure moratoriums in certain states.
Troubled Debt Restructurings
TDRs are individually evaluated, and the type of restructuring is selected based on the loan type and the circumstances of the borrower’s financial difficulties. A TDR is a modification of the terms of a loan when the Company, for economic or legal reasons related to the borrower’s financial difficulties, grants a concession to the borrower that it would not have otherwise considered. Beginning in March 2020, the Company has implemented various commercial and consumer loan modification programs to provide its borrowers relief from the economic impacts of the COVID-19 pandemic. These COVID-related modifications are generally not classified as TDRs due to the relief under the CARES Act and the Interagency Statement, and therefore are not included in the discussion below. Assistance provided in response to the COVID-19 pandemic could delay the recognition of delinquencies, nonaccrual status, and net charge-offs for those borrowers who would have otherwise moved into past due or nonaccrual status. See Note 1 — Summary of Significant Accounting Policies — Troubled Debt Restructurings to the Consolidated Financial Statements in this Form 10-K for additional information related to TDR.
The following tables present the additions to TDRs for the years ended December 31, 2021, 2020 and 2019:
| ($ in thousands) | Loans Modified as TDRs During the Year Ended December 31, 2021 | |||||||||||||||||||||||||
| Number of Loans | Pre-Modification Outstanding Recorded Investment | Post-Modification Outstanding Recorded Investment (1) | Financial Impact (2) | |||||||||||||||||||||||
| Commercial: | ||||||||||||||||||||||||||
| C&I | $ | $ | $ | |||||||||||||||||||||||
| CRE: | ||||||||||||||||||||||||||
| Multifamily residential | ||||||||||||||||||||||||||
| Total CRE | ||||||||||||||||||||||||||
| Total commercial | ||||||||||||||||||||||||||
| Total | $ | $ | $ | |||||||||||||||||||||||
| ($ in thousands) | Loans Modified as TDRs During the Year Ended December 31, 2020 | |||||||||||||||||||||||||
| Number of Loans | Pre-Modification Outstanding Recorded Investment | Post-Modification Outstanding Recorded Investment (1) | Financial Impact (2) | |||||||||||||||||||||||
| Commercial: | ||||||||||||||||||||||||||
| C&I | $ | $ | $ | |||||||||||||||||||||||
| CRE: | ||||||||||||||||||||||||||
| CRE | ||||||||||||||||||||||||||
| Multifamily residential | ||||||||||||||||||||||||||
| Total CRE | ||||||||||||||||||||||||||
| Total commercial | ||||||||||||||||||||||||||
| Total | $ | $ | $ | |||||||||||||||||||||||
132
| ($ in thousands) | Loans Modified as TDRs During the Year Ended December 31, 2019 | |||||||||||||||||||||||||
| Number of Loans | Pre-Modification Outstanding Recorded Investment | Post-Modification Outstanding Recorded Investment (1) | Financial Impact (2) | |||||||||||||||||||||||
| Commercial: | ||||||||||||||||||||||||||
| C&I | $ | $ | $ | |||||||||||||||||||||||
| CRE: | ||||||||||||||||||||||||||
| Construction and land | ||||||||||||||||||||||||||
| Total CRE | ||||||||||||||||||||||||||
| Total commercial | ||||||||||||||||||||||||||
| Consumer: | ||||||||||||||||||||||||||
| Residential mortgage: | ||||||||||||||||||||||||||
| Single-family residential | ||||||||||||||||||||||||||
| HELOCs | ||||||||||||||||||||||||||
| Total residential mortgage | ||||||||||||||||||||||||||
| Total consumer | ||||||||||||||||||||||||||
| Total | $ | $ | $ | |||||||||||||||||||||||
(1)Includes subsequent payments after modification and reflects the balance as of December 31, 2021, 2020 and 2019.
(2)Includes charge-offs and specific reserves recorded since the modification date.
The following tables present the TDR post-modifications outstanding balances for the years ended December 31, 2021, 2020 and 2019 by modification type:
| ($ in thousands) | Modification Type During the Year Ended December 31, 2021 | |||||||||||||||||||||||||||||||||||||
Principal (1) | Principal and Interest (2) | Interest Rate Reduction | Interest Deferments | Other (3) | Total | |||||||||||||||||||||||||||||||||
| Commercial: | ||||||||||||||||||||||||||||||||||||||
| C&I | $ | $ | $ | $ | $ | $ | ||||||||||||||||||||||||||||||||
| CRE: | ||||||||||||||||||||||||||||||||||||||
| CRE | ||||||||||||||||||||||||||||||||||||||
| Multifamily residential | ||||||||||||||||||||||||||||||||||||||
| Total CRE | ||||||||||||||||||||||||||||||||||||||
| Total commercial | ||||||||||||||||||||||||||||||||||||||
| Total | $ | $ | $ | $ | $ | $ | ||||||||||||||||||||||||||||||||
| ($ in thousands) | Modification Type During the Year Ended December 31, 2020 | |||||||||||||||||||||||||||||||||||||
Principal (1) | Principal and Interest (2) | Interest Rate Reduction | Interest Deferments | Other (3) | Total | |||||||||||||||||||||||||||||||||
| Commercial: | ||||||||||||||||||||||||||||||||||||||
| C&I | $ | $ | $ | $ | $ | $ | ||||||||||||||||||||||||||||||||
| CRE: | ||||||||||||||||||||||||||||||||||||||
| CRE | ||||||||||||||||||||||||||||||||||||||
| Multifamily residential | ||||||||||||||||||||||||||||||||||||||
| Total CRE | ||||||||||||||||||||||||||||||||||||||
| Total commercial | ||||||||||||||||||||||||||||||||||||||
| Total | $ | $ | $ | $ | $ | $ | ||||||||||||||||||||||||||||||||
133
| ($ in thousands) | Modification Type During the Year Ended December 31, 2019 | |||||||||||||||||||||||||||||||||||||
Principal (1) | Principal and Interest (2) | Interest Rate Reduction | Interest Deferments | Other (3) | Total | |||||||||||||||||||||||||||||||||
| Commercial: | ||||||||||||||||||||||||||||||||||||||
| C&I | $ | $ | $ | $ | $ | $ | ||||||||||||||||||||||||||||||||
| CRE: | ||||||||||||||||||||||||||||||||||||||
| Construction and land | ||||||||||||||||||||||||||||||||||||||
| Total CRE | ||||||||||||||||||||||||||||||||||||||
| Total commercial | ||||||||||||||||||||||||||||||||||||||
| Consumer: | ||||||||||||||||||||||||||||||||||||||
| Residential mortgage: | ||||||||||||||||||||||||||||||||||||||
| Single-family residential | ||||||||||||||||||||||||||||||||||||||
| HELOCs | ||||||||||||||||||||||||||||||||||||||
| Total residential mortgage | ||||||||||||||||||||||||||||||||||||||
| Total consumer | ||||||||||||||||||||||||||||||||||||||
| Total | $ | $ | $ | $ | $ | $ | ||||||||||||||||||||||||||||||||
(1)Includes forbearance payments, term extensions and principal deferments that modify the terms of the loan from principal and interest payments to interest payments only.
(2)Includes principal and interest deferments or reductions.
(3)Includes primarily funding to secure additional collateral and provides liquidity to collateral-dependent C&I loans.
After a loan is modified as a TDR, the Company continues to monitor its performance under its most recent restructured terms. A TDR may become delinquent and result in payment default (generally 90 days past due) subsequent to restructuring. The following table presents the information on loans that entered into payment default during the years ended December 31, 2021, 2020 and 2019 that were modified as TDRs during the 12 months preceding payment default:
| ($ in thousands) | Loans Modified as TDRs that Subsequently Defaulted During the Year Ended December 31, | |||||||||||||||||||||||||||||||||||||
| 2021 | 2020 | 2019 | ||||||||||||||||||||||||||||||||||||
| Number of Loans | Recorded Investment | Number of Loans | Recorded Investment | Number of Loans | Recorded Investment | |||||||||||||||||||||||||||||||||
| Commercial: | ||||||||||||||||||||||||||||||||||||||
| C&I | $ | $ | $ | |||||||||||||||||||||||||||||||||||
| Total commercial | ||||||||||||||||||||||||||||||||||||||
| Total | $ | $ | $ | |||||||||||||||||||||||||||||||||||
As of December 31, 2021 and 2020, the remaining commitments to lend additional funds to borrowers whose terms of their outstanding owed balances were modified as TDRs were $5.0 million and $3.0 million, respectively.
Allowance for Credit Losses
The Company has an allowance framework under ASU 2016-13 for all financial assets measured at amortized cost and certain off-balance sheet credit exposures. The Company’s allowance for credit losses, which includes both the allowance for loan losses and the allowance for unfunded credit commitments, is calculated with the objective of maintaining a reserve sufficient to absorb losses inherent in our credit portfolios. The measurement of the allowance for credit losses is based on management’s best estimate of lifetime expected credit losses, and periodic evaluation of the loan portfolio, lending-related commitments and other relevant factors.
The allowance for credit losses is deducted from the amortized cost basis of a financial asset or a group of financial assets so that the balance sheet reflects the net amount the Company expects to collect. Amortized cost is the principal balance outstanding, net of purchase premiums and discounts, deferred fees and costs, and escrow advances. Subsequent changes in expected credit losses are recognized in net income as a provision for, or a reversal of, credit loss expense.
134
The allowance for credit losses estimation involves procedures to consider the unique risk characteristics of the portfolio segments. The majority of the Company’s credit exposures share risk characteristics with other similar exposures and are collectively evaluated. The collectively evaluated loans cover performing risk-rated loans and unfunded credit commitments. If an exposure does not share risk characteristics with other exposures, the Company generally estimates expected credit losses on an individual basis. These individually assessed loans include TDR and nonaccrual loans.
Allowance for Collectively Evaluated Loans
The allowance for collectively evaluated loans consists of a quantitative component that assesses the different risk factors considered in our models and a qualitative component that considers risk factors external to the models. Each of these components are described below.
•Quantitative Component — The Company applies quantitative methods to estimate loan losses by considering a variety of factors such as historical loss experience, the current credit quality of the portfolio, and an economic outlook over the life of the loan. The Company incorporates forward-looking information using macroeconomic scenarios which include variables that are considered key drivers of increases and decreases in credit losses. The Company utilizes a probability-weighted, multiple-scenario forecast approach. These scenarios may consist of a base forecast representing management's view of the most likely outcome, combined with downside or upside scenarios reflecting possible worsening or improving economic conditions. The quantitative models incorporate a probability-weighted calculation of these macroeconomic scenarios over a reasonable and supportable forecast period. If the life of the loans extends beyond the reasonable and supportable forecast period, the Company will consider historical experience or long-run macroeconomic trends over the remaining lives of the loans to estimate the allowance for loan losses.
For the year ended December 31, 2021, the reasonable and supportable forecast period, key credit risk characteristics and macroeconomic variables to estimate the expected credit losses of the C&I segment were modified due to model enhancement. There were no changes to the overall model methodology. For the year ended December 31, 2020, there were no changes to the reasonable and supportable forecast period, and reversion to historical loss experience method.
The following table provides key credit risk characteristics and macroeconomic variables that the Company uses to estimate the expected credit losses by portfolio segment:
| Portfolio Segment | Risk Characteristics | Macroeconomic Variables | ||||||||||||
| C&I | Age (1), size and spread at origination, and risk rating | Volatility Index (“VIX”) and BBB yield to 10-year U.S. Treasury spread (“BBB Spread”) (1) | ||||||||||||
| CRE, Multifamily residential, and Construction and land | Delinquency status, maturity date, collateral value, property type, and geographic location | Unemployment rate, Gross Domestic Product (“GDP”), and U.S. Treasury rates | ||||||||||||
| Single-family residential and HELOCs | FICO score, delinquency status, maturity date, collateral value, and geographic location | Unemployment rate, GDP, and home price index | ||||||||||||
| Other consumer | Historical loss experience | Immaterial (2) | ||||||||||||
(1)Due to model enhancements, the risk characteristic related to “time-to-maturity” was changed to “age”; while macroeconomic variables related to “unemployment rate and two- and ten-year U.S. Treasury spread” were changed to “VIX and BBB Spread” during the year ended December 31, 2021.
(2)Macroeconomic variables are included in the qualitative estimate.
Allowance for Loan Losses for the Commercial Loan Portfolio
The Company’s C&I lifetime loss rate model estimates credit losses by estimating a loss rate expected over the life of a loan. This loss rate is applied to the amortized cost basis, excluding accrued interest receivable, to determine expected credit losses. The lifetime loss rate model’s reasonable and supportable period spans 11 quarters, thereafter immediately reverting to the historical average loss rate, expressed through the loan-level lifetime loss rate.
For CRE, multifamily residential, and construction and land loans, projected probability of defaults (“PDs”) and loss given defaults (“LGDs”) are applied to the estimated exposure at default, considering the term and payment structure of the loan, to generate estimates of expected loss at the loan level. The forecast of future economic conditions returns to long-run historical economic trends within the reasonable and supportable period.
135
In order to estimate the life of a loan under both models, the contractual term of the loan is adjusted for estimated prepayments based on historical prepayment experience.
Allowance for Loan Losses for the Consumer Loan Portfolio
For single-family residential and HELOC loans, projected PDs and LGDs are applied to the estimated exposure at default, considering the term and payment structure of the loan, to generate estimates of expected loss at the loan level. The forecast of future economic conditions returns to long-run historical economic trends after the reasonable and supportable period. In order to estimate the life of a loan for the single-family residential and HELOC portfolios, the contractual term of the loan is adjusted for estimated prepayments based on historical prepayment experience. For other consumer loans, the Company uses a loss rate approach.
•Qualitative Component — The Company also considers the following qualitative factors in the determination of the collectively evaluated allowance, if these factors have not already been captured by the quantitative model. Such qualitative factors may include, but are not limited to:
–Loan growth trends;
–The volume and severity of past due financial assets, and the volume and severity of adversely classified financial assets;
–The Company’s lending policies and procedures, including changes in lending strategies, underwriting standards, collection, write-off and recovery practices;
–Knowledge of a borrower’s operations;
–The quality of the Company’s credit review system;
–The experience, ability and depth of the Company’s management, lending associates and other relevant associates;
–The effect of other external factors such as the regulatory and legal environments and changes in technology;
–Actual and expected changes in international, national, regional, and local economic and business conditions in which the Company operates; and
–Risk factors in certain industry sectors not captured by the quantitative models.
The magnitude of the impact of these factors on the Company’s qualitative assessment of the allowance for credit losses changes from period to period according to changes made by management in its assessment of these factors. The extent to which these factors change may be dependent on whether they are already reflected in quantitative loss estimates during the current period and the extent to which changes in these factors diverge from period to period.
While the Company’s allowance methodologies strive to reflect all relevant credit risk factors, there continues to be uncertainty associated with, but not limited to, potential imprecision in the estimation process due to the inherent time lag of obtaining information and normal variations between expected and actual outcomes. The Company may hold additional qualitative reserves that are designed to provide coverage for losses attributable to such risk.
Allowance for Individually Evaluated Loans
When a loan no longer shares similar risk characteristics with other loans, such as in the case of certain nonaccrual or TDR loans, the Company estimates the allowance for loan losses on an individual loan basis. The allowance for loan losses for individually evaluated loans is measured as the difference between the recorded value of the loans and their fair value. For loans evaluated individually, the Company uses one of three different asset valuation measurement methods: (1) the fair value of collateral less costs to sell; (2) the present value of expected future cash flows; or (3) the loan's observable market price. If an individually evaluated loan is determined to be collateral dependent, the Company applies the fair value of the collateral less costs to sell method. If an individually evaluated loan is determined not to be collateral dependent, the Company uses the present value of future cash flows or the observable market value of the loan.
136
The following tables summarize the activity in the allowance for loan losses by portfolio segments for the years ended December 31, 2021, 2020 and 2019:
| ($ in thousands) | Year Ended December 31, 2021 | |||||||||||||||||||||||||||||||||||||||||||||||||
| Commercial | Consumer | Total | ||||||||||||||||||||||||||||||||||||||||||||||||
| C&I | CRE | Residential Mortgage | Other Consumer | |||||||||||||||||||||||||||||||||||||||||||||||
| CRE | Multifamily Residential | Construction and Land | Single- Family Residential | HELOCs | ||||||||||||||||||||||||||||||||||||||||||||||
| Allowance for loan losses, beginning of period | $ | $ | $ | $ | $ | $ | $ | $ | ||||||||||||||||||||||||||||||||||||||||||
| (Reversal of ) provision for credit losses on loans | (a) | ( | ( | ( | ||||||||||||||||||||||||||||||||||||||||||||||
| Gross charge-offs | ( | ( | ( | ( | ( | ( | ( | ( | ||||||||||||||||||||||||||||||||||||||||||
| Gross recoveries | ||||||||||||||||||||||||||||||||||||||||||||||||||
| Total net (charge-offs) recoveries | ( | ( | ( | ( | ( | ( | ||||||||||||||||||||||||||||||||||||||||||||
| Foreign currency translation adjustment | ||||||||||||||||||||||||||||||||||||||||||||||||||
| Allowance for loan losses, end of period | $ | $ | $ | $ | $ | $ | $ | $ | ||||||||||||||||||||||||||||||||||||||||||
| ($ in thousands) | Year Ended December 31, 2020 | |||||||||||||||||||||||||||||||||||||||||||||||||
| Commercial | Consumer | Total | ||||||||||||||||||||||||||||||||||||||||||||||||
| C&I | CRE | Residential Mortgage | Other Consumer | |||||||||||||||||||||||||||||||||||||||||||||||
| CRE | Multifamily Residential | Construction and Land | Single- Family Residential | HELOCs | ||||||||||||||||||||||||||||||||||||||||||||||
Allowance for loan losses, beginning of period | $ | $ | $ | $ | $ | $ | $ | $ | ||||||||||||||||||||||||||||||||||||||||||
| ( | ( | ( | ( | |||||||||||||||||||||||||||||||||||||||||||||||
Provision for (reversal of) credit losses on loans | (a) | ( | ( | ( | ||||||||||||||||||||||||||||||||||||||||||||||
Gross charge-offs | ( | ( | ( | ( | ( | |||||||||||||||||||||||||||||||||||||||||||||
Gross recoveries | ||||||||||||||||||||||||||||||||||||||||||||||||||
Total net (charge-offs) recoveries | ( | ( | ( | ( | ( | |||||||||||||||||||||||||||||||||||||||||||||
| Foreign currency translation adjustment | ||||||||||||||||||||||||||||||||||||||||||||||||||
| Allowance for loan losses, end of period | $ | $ | $ | $ | $ | $ | $ | $ | ||||||||||||||||||||||||||||||||||||||||||
137
| ($ in thousands) | Year Ended December 31, 2019 | |||||||||||||||||||||||||||||||||||||||||||||||||
| Commercial | Consumer | Total | ||||||||||||||||||||||||||||||||||||||||||||||||
| C&I | CRE | Residential Mortgage | Other Consumer | |||||||||||||||||||||||||||||||||||||||||||||||
| CRE | Multifamily Residential | Construction and Land | Single- Family Residential | HELOCs | ||||||||||||||||||||||||||||||||||||||||||||||
| Allowance for loan losses, beginning of period | $ | $ | $ | $ | $ | $ | $ | $ | ||||||||||||||||||||||||||||||||||||||||||
| Provision for (reversal of) credit losses on loans | (a) | ( | ( | ( | ( | ( | ||||||||||||||||||||||||||||||||||||||||||||
| Gross charge-offs | ( | ( | ( | ( | ( | |||||||||||||||||||||||||||||||||||||||||||||
| Gross recoveries | ||||||||||||||||||||||||||||||||||||||||||||||||||
| Total net (charge-offs) recoveries | ( | ( | ( | |||||||||||||||||||||||||||||||||||||||||||||||
| Foreign currency translation adjustment | ( | ( | ||||||||||||||||||||||||||||||||||||||||||||||||
| Allowance for loan losses, end of period | $ | $ | $ | $ | $ | $ | $ | $ | ||||||||||||||||||||||||||||||||||||||||||
The following table summarizes the activities in the allowance for unfunded credit commitments for the years ended December 31, 2021, 2020 and 2019:
| ($ in thousands) | Year Ended December 31, | |||||||||||||||||||
| 2021 | 2020 | 2019 | ||||||||||||||||||
| Unfunded credit facilities | ||||||||||||||||||||
| Allowance for unfunded credit commitments, beginning of period | $ | $ | $ | |||||||||||||||||
| Impact of ASU 2016-13 adoption | — | — | ||||||||||||||||||
| (Reversal of) provision for credit losses on unfunded credit commitments | (b) | ( | ( | |||||||||||||||||
| Allowance for unfunded credit commitments, end of period | ||||||||||||||||||||
| (Reversal of) provision for credit losses | (a) + (b) | $ | ( | $ | $ | |||||||||||||||
The allowance for credit losses as of December 31, 2021, was $569.1 million, a decrease of $84.5 million or 13 % compared with $653.6 million as of December 31, 2020. The change in the allowance for credit losses was comprised of a net decrease of $78.4 million in the allowance for loan losses and a decrease of $6.1 million in the allowance for unfunded credit commitments. An improved macroeconomic outlook resulted in an overall decrease in the required allowance for credit losses as of December 31, 2021, leading to a $35.0 million reversal of credit losses for the year ended December 31, 2021.
The allowance for unfunded credit commitments is maintained at a level that management believes to be sufficient to absorb estimated expected credit losses related to unfunded credit facilities. See Note 12 — Commitments and Contingencies to the Consolidated Financial Statements in this Form 10-K for additional information related to unfunded credit reserves.
Loans Held-for-Sale
As of December 31, 2021 and 2020, loans held-for-sale of $635 thousand and $1.8 million consisted of single-family residential loans. Refer to Note 1 — Summary of Significant Accounting Policies — Significant Accounting Policies — Loans Held-for-Sale to the Consolidated Financial Statements in this Form 10-K for additional details related to the Company’s loans held-for-sale.
138
Loan Transfers, Sales and Purchases
The Company purchases and sells loans in the secondary market in the ordinary course of business. Purchased loans may be transferred from held-for-investment to held-for-sale, and write-downs to allowance for loan losses are recorded, when appropriate. The following tables provide information on the carrying value of loans transferred, loans sold and purchased for the held-for-investment portfolio, during the years ended December 31, 2021, 2020 and 2019:
| ($ in thousands) | Year Ended December 31, 2021 | |||||||||||||||||||||||||||||||||||||
| Commercial | Consumer | Total | ||||||||||||||||||||||||||||||||||||
| CRE | Residential Mortgage | |||||||||||||||||||||||||||||||||||||
| C&I | CRE | Multifamily Residential | Construction and Land | Single-Family Residential | ||||||||||||||||||||||||||||||||||
Loans transferred from held-for-investment to held-for-sale (1) | $ | $ | $ | $ | $ | $ | ||||||||||||||||||||||||||||||||
Sales (2)(3)(4) | $ | $ | $ | $ | $ | $ | ||||||||||||||||||||||||||||||||
Purchases (5) | $ | $ | $ | $ | $ | $ | ||||||||||||||||||||||||||||||||
| ($ in thousands) | Year Ended December 31, 2020 | |||||||||||||||||||||||||||||||||||||
| Commercial | Consumer | Total | ||||||||||||||||||||||||||||||||||||
| CRE | Residential Mortgage | |||||||||||||||||||||||||||||||||||||
| C&I | CRE | Multifamily Residential | Construction and Land | Single-Family Residential | ||||||||||||||||||||||||||||||||||
Loans transferred from held-for-investment to held-for-sale (1) | $ | $ | $ | $ | $ | $ | ||||||||||||||||||||||||||||||||
Sales (2)(3)(4) | $ | $ | $ | $ | $ | $ | ||||||||||||||||||||||||||||||||
Purchases (5) | $ | $ | $ | $ | $ | $ | ||||||||||||||||||||||||||||||||
| ($ in thousands) | Year Ended December 31, 2019 | |||||||||||||||||||||||||||||||||||||
| Commercial | Consumer | Total | ||||||||||||||||||||||||||||||||||||
| CRE | Residential Mortgage | |||||||||||||||||||||||||||||||||||||
| C&I | CRE | Multifamily Residential | Construction and Land | Single-Family Residential | ||||||||||||||||||||||||||||||||||
Loans transferred from held-for-investment to held-for-sale (1) | $ | $ | $ | $ | $ | $ | ||||||||||||||||||||||||||||||||
Sales (2)(3)(4) | $ | $ | $ | $ | $ | $ | ||||||||||||||||||||||||||||||||
Purchases (5) | $ | $ | $ | $ | $ | $ | ||||||||||||||||||||||||||||||||
(1)Includes write-downs of $12.2 million, $2.8 million and $789 thousand to the allowance for loan losses related to loans transferred from held-for-investment to held-for-sale for the years ended December 31, 2021, 2020 and 2019, respectively.
(2)Includes originated loans sold of $413.1 million, $400.4 million and $230.3 million for the years ended December 31, 2021, 2020 and 2019, respectively. Originated loans sold consist primarily of C&I for all periods.
(3)Includes $208.4 million, $11.8 million and $66.5 million of purchased loans sold in the secondary market for the years ended December 31, 2021, 2020 and 2019, respectively.
(4)Net gains on sales of loans were $8.9 million, $4.5 million and $4.0 million for the years ended December 31, 2021, 2020 and 2019, respectively.
(5)C&I loan purchases consisted primarily of syndicated C&I term loans.
139
Note 7 — Investments in Qualified Affordable Housing Partnerships, Tax Credit and Other Investments, Net and Variable Interest Entities
The CRA encourages banks to meet the credit needs of their communities, particularly including low- and moderate-income individuals and neighborhoods. The Company invests in certain affordable housing projects in the form of ownership interests in limited partnerships or limited liability companies that qualify for CRA and tax credits. These entities are formed to develop and operate apartment complexes designed as high-quality affordable housing for lower income tenants throughout the U.S. To fully utilize the available tax credits, each of these entities must meet the regulatory affordable housing requirements for a minimum 15-year compliance period. In addition to affordable housing projects, the Company also invests in New Market Tax Credit projects that qualify for CRA credits, as well as projects that qualify for renewable energy and historic tax credits. New Market Tax Credit investments provide capital through Community Development Entities to promote community development and economic growth. Investments in renewable energy tax credits help to promote the development of renewable energy sources, and the investments in historic tax credits promote the rehabilitation of historic buildings and economic revitalization of the surrounding areas.
Investments in Qualified Affordable Housing Partnerships, Net
The following table presents the Company’s investments in qualified affordable housing partnerships, net, and related unfunded commitments as of December 31, 2021 and 2020:
| ($ in thousands) | December 31, | |||||||||||||
| 2021 | 2020 | |||||||||||||
| Investments in qualified affordable housing partnerships, net | $ | $ | ||||||||||||
| Accrued expenses and other liabilities — Unfunded commitments | $ | $ | ||||||||||||
The following table presents additional information related to the Company’s investments in qualified affordable housing partnerships, net, for the years ended December 31, 2021, 2020 and 2019:
| ($ in thousands) | Year Ended December 31, | |||||||||||||||||||
| 2021 | 2020 | 2019 | ||||||||||||||||||
| Tax credits and other tax benefits recognized | $ | $ | $ | |||||||||||||||||
| Amortization expense included in income tax expense | $ | $ | $ | |||||||||||||||||
Investments in Tax Credit and Other Investments, Net
The following table presents the Company’s investments in tax credit and other investments, net, and related unfunded commitments as of December 31, 2021 and 2020:
| ($ in thousands) | December 31, | |||||||||||||
| 2021 | 2020 | |||||||||||||
| Investments in tax credit and other investments, net | $ | $ | ||||||||||||
| Accrued expenses and other liabilities — Unfunded commitments | $ | $ | ||||||||||||
140
The following table presents additional information related to the Company’s investments in tax credit and other investments, net, for the years ended December 31, 2021, 2020 and 2019:
| ($ in thousands) | Year Ended December 31, | |||||||||||||||||||
| 2021 | 2020 | 2019 | ||||||||||||||||||
| Amortization of tax credit and other investments | $ | $ | $ | |||||||||||||||||
The Company held equity securities that are mutual funds with readily determinable fair values of $26.6 million and $31.3 million, as of December 31, 2021 and 2020, respectively. The Company invested in these mutual funds for CRA purposes. These equity securities were measured at fair value with changes in fair value recorded in net income. The Company recorded unrealized losses on these equity securities of $746 thousand for the year ended December 31, 2021, compared with unrealized gains of $732 thousand for the year ended December 31, 2020. Equity securities with readily determinable fair value were included in Investments in tax credit and other investments, net on the Consolidated Balance Sheet.
The Company held equity securities without readily determinable fair values totaling $33.1 million and $23.7 million as of December 31, 2021 and 2020, respectively, which were measured using the measurement alternative at cost less impairment and adjusted for observable price changes. For the year ended December 31, 2021, the Company recorded no OTTI charges, compared with $360 thousand OTTI charges recorded for the year ended December 31, 2020 related to these securities. Equity securities without readily determinable fair values were included in Investments in tax credit and other investments, net and Other Assets on the Consolidated Balance Sheet.
As of December 31, 2021, the Company’s unfunded commitments related to investments in qualified affordable housing partnerships, tax credit and other investments are estimated to be funded as follows:
| ($ in thousands) | Amount | |||||||
| 2022 | $ | |||||||
| 2023 | ||||||||
| 2024 | ||||||||
| 2025 | ||||||||
| 2026 | ||||||||
| Thereafter | ||||||||
| Total | $ | |||||||
Tax credit and other investments are evaluated for possible OTTI on an annual basis or when events or changes in circumstances suggest that the carrying amount of the tax credit investments may not be realizable. OTTI charges and impairment recoveries are recorded within Amortization of tax credit and other investments on the Consolidated Statement of Income. Refer to Note 2 — Fair Value Measurement and Fair Value of Financial Instruments to the Consolidated Financial Statements in this Form 10-K for a discussion on the Company’s impairment evaluation and monitoring process of tax credit investments. During the year ended December 31, 2021, there were no OTTI charges and $1.3 million OTTI recoveries were recorded related to the Company’s investments in tax credits and other investments, net. Comparatively, there were $4.8 million in OTTI charges, offset by OTTI recoveries of $1.5 million, during the year ended December 31, 2020; and $14.6 million in OTTI charges, offset by $1.6 million in recoveries recorded during the year ended December 31, 2019.
Variable Interest Entities
The Company invests in unconsolidated limited partnerships and similar entities that construct, own and operate affordable housing, historic rehabilitation, wind and solar projects, of which the majority of such investments are VIEs. As a limited partner in these partnerships, these investments are designed to generate a return primarily through the realization of federal tax credits and tax benefits. An unrelated third party is typically the general partner or managing member who has control over the significant activities of such investments. While the Company’s interest in some of the investments may exceed 50% of the outstanding equity interests, the Company does not consolidate these structures due to the general partner or managing member’s ability to manage the entity, which is indicative of power over them. The Company’s expected maximum exposure to loss in connection with these partnerships consist of the unamortized investment balance and any tax credits claimed that may be subject to recapture.
141
Note 8 — Goodwill and Other Intangible Assets
Goodwill
Total goodwill was $465.7
Core Deposit Intangibles
The following table presents the gross carrying amount and accumulated amortization of core deposits intangible assets as of December 31, 2021 and 2020:
| ($ in thousands) | December 31, | |||||||||||||
| 2021 | 2020 | |||||||||||||
Gross balance (1) | $ | $ | ||||||||||||
Accumulated amortization (1) | ( | ( | ||||||||||||
Net carrying balance (1) | $ | $ | ||||||||||||
(1) Excludes fully amortized core deposit intangible assets.
There were no
Amortization Expense
The Company amortizes the core deposit intangibles based on the projected useful lives of the related deposits. The amortization expense related to the core deposit intangible assets was $2.7 million, $3.6 million and $4.5 million for the years ended December 31, 2021, 2020 and 2019, respectively.
The following table presents the estimated future amortization expense of core deposit intangibles as of December 31, 2021:
| ($ in thousands) | Amount | |||||||
| 2022 | $ | |||||||
| 2023 | ||||||||
| 2024 | ||||||||
| 2025 | ||||||||
| Total | $ | |||||||
142
Note 9 — Deposits
The following table presents the composition of the Company’s deposits as of December 31, 2021 and 2020:
| ($ in thousands) | December 31, | |||||||||||||
| 2021 | 2020 | |||||||||||||
| Deposits: | ||||||||||||||
| Noninterest-bearing demand | $ | $ | ||||||||||||
| Interest-bearing checking | ||||||||||||||
| Money market | ||||||||||||||
| Savings | ||||||||||||||
Time deposits (1): | ||||||||||||||
| Domestic office | ||||||||||||||
| Foreign office | ||||||||||||||
| Total deposits | $ | $ | ||||||||||||
(1)The aggregate amount of time deposits that met or exceeded the deposit insurance limit was $5.95 billion and $6.62 billion as of December 31, 2021 and 2020, respectively.
The following table presents the scheduled maturities of time deposits for the five years succeeding December 31, 2021 and thereafter:
| ($ in thousands) | Amount | |||||||
| 2022 | $ | |||||||
| 2023 | ||||||||
| 2024 | ||||||||
| 2025 | ||||||||
| 2026 | ||||||||
| Thereafter | ||||||||
| Total | $ | |||||||
Note 10 — Federal Home Loan Bank Advances and Long-Term Debt
The following table presents the balance of the Company’s junior subordinated debt and FHLB advances as of December 31, 2021 and 2020, and the related contractual rates and maturity dates as of December 31, 2021:
| ($ in thousands) | Interest Rate | Maturity Dates | December 31, | |||||||||||||||||||||||
| 2021 | 2020 | |||||||||||||||||||||||||
| Amount | Amount | |||||||||||||||||||||||||
| Parent Company | ||||||||||||||||||||||||||
Junior subordinated debt (1 ) — floating (2) | 2034 — 2037 | $ | $ | |||||||||||||||||||||||
| Bank | ||||||||||||||||||||||||||
FHLB advances (3): | ||||||||||||||||||||||||||
| Fixed | 2021 | |||||||||||||||||||||||||
Floating (2) | 2022 | |||||||||||||||||||||||||
| Total FHLB advances | $ | $ | ||||||||||||||||||||||||
(1)The weighted-average contractual interest rates for junior subordinated debt were 1.74 % and 2.26 % as of December 31, 2021 and 2020, respectively.
(2)Floating interest rates reset monthly or quarterly based on LIBOR.
143
FHLB Advances
The Bank’s available borrowing capacity from FHLB advances totaled $11.93 billion and $6.33 billion as of December 31, 2021 and 2020, respectively. The Bank’s available borrowing capacity from the FHLB is derived from its portfolio of loans that are pledged to the FHLB reduced by its outstanding FHLB advances. As of December 31, 2021 and 2020, all advances were secured by real estate loans.
Long-Term Debt — Junior Subordinated Debt
As of December 31, 2021, East West has six statutory business trusts for the purpose of issuing junior subordinated debt to third party investors. The junior subordinated debt was issued in connection with the East West’s various pooled trust preferred securities offerings. The Trusts issued variable rate capital securities, representing undivided preferred beneficial interests in the assets of the Trusts, to third party investors. East West is the owner of all the beneficial interests represented by the common securities of the Trusts. The junior subordinated debt is recorded as a component of long-term debt and includes the value of the common stock issued by six of East West’s wholly owned subsidiaries in conjunction with these transactions. The common stock is recorded in Other assets on the Consolidated Balance Sheet for the amount issued in connection with these junior subordinated debt issuances. The proceeds from these issuances represent liabilities of East West to the Trusts and are reported as a component of Long-term debt on the Consolidated Balance Sheet. Interest payments on these securities are made quarterly and are deductible for tax purposes.
The following table presents the outstanding junior subordinated debt issued by each trust as of December 31, 2021, and 2020:
| Issuer | Stated Maturity (1) | Stated Interest Rate | Current Rate | December 31, 2021 | December 31, 2020 | |||||||||||||||||||||||||||||||||||||||
| Aggregate Principal Amount of Trust Securities | Aggregate Principal Amount of the Junior Subordinated Debts | Aggregate Principal Amount of Trust Securities | Aggregate Principal Amount of the Junior Subordinated Debts | |||||||||||||||||||||||||||||||||||||||||
| ($ in thousands) | ||||||||||||||||||||||||||||||||||||||||||||
| East West Capital Trust V | November 2034 | 3-month LIBOR + | $ | $ | $ | $ | ||||||||||||||||||||||||||||||||||||||
| East West Capital Trust VI | September 2035 | 3-month LIBOR + | ||||||||||||||||||||||||||||||||||||||||||
| East West Capital Trust VII | June 2036 | 3-month LIBOR + | ||||||||||||||||||||||||||||||||||||||||||
| East West Capital Trust VIII | June 2037 | 3-month LIBOR + | ||||||||||||||||||||||||||||||||||||||||||
| East West Capital Trust IX | September 2037 | 3-month LIBOR + | ||||||||||||||||||||||||||||||||||||||||||
| MCBI Statutory Trust I | December 2035 | 3-month LIBOR + | ||||||||||||||||||||||||||||||||||||||||||
| Total | $ | $ | $ | $ | ||||||||||||||||||||||||||||||||||||||||
(1)All the above debt instruments mature in more than five years after December 31, 2021 and are subject to call options where early redemption requires appropriate notice.
144
Note 11 — Income Taxes
The following table presents the components of income tax expense (benefit) for the years ended December 31, 2021, 2020 and 2019:
| ($ in thousands) | Year Ended December 31, | |||||||||||||||||||
| 2021 | 2020 | 2019 | ||||||||||||||||||
| Current income tax expense (benefit): | ||||||||||||||||||||
| Federal | $ | $ | $ | |||||||||||||||||
| State | ||||||||||||||||||||
| Foreign | ( | ( | ||||||||||||||||||
| Total current income tax expense | ||||||||||||||||||||
| Deferred income tax expense (benefit): | ||||||||||||||||||||
| Federal | ( | ( | ||||||||||||||||||
| State | ( | ( | ||||||||||||||||||
| Foreign | ( | ( | ||||||||||||||||||
| Total deferred income tax expense (benefit) | ( | ( | ||||||||||||||||||
| Income tax expense | $ | $ | $ | |||||||||||||||||
The following table presents the reconciliation of the federal statutory rate to the Company’s effective tax rate for the years ended December 31, 2021, 2020 and 2019:
| Year Ended December 31, | ||||||||||||||||||||
| 2021 | 2020 | 2019 | ||||||||||||||||||
| Statutory U.S. federal tax rate | % | % | % | |||||||||||||||||
| U.S. state income taxes, net of U.S. federal income tax effect | ||||||||||||||||||||
Tax credits and benefits, net of related expenses | ( | ( | ( | |||||||||||||||||
| Other, net | ( | |||||||||||||||||||
| Effective tax rate | % | % | % | |||||||||||||||||
145
The following table summarizes the tax effects of temporary differences that give rise to a significant portion of deferred tax assets and liabilities as of December 31, 2021 and 2020:
| ($ in thousands) | December 31, | |||||||||||||
| 2021 | 2020 | |||||||||||||
| Deferred tax assets: | ||||||||||||||
Allowance for loan losses | $ | $ | ||||||||||||
| Investments in qualified affordable housing partnerships, tax credit and other investments, net | ||||||||||||||
| Deferred compensation | ||||||||||||||
| Interest income on nonaccrual loans | ||||||||||||||
| State taxes | ||||||||||||||
| Unrealized losses on securities | ||||||||||||||
| Tax credit carryforwards | ||||||||||||||
| Premises and equipment | ||||||||||||||
| Lease liabilities | ||||||||||||||
| Other | ||||||||||||||
| Total deferred tax assets | $ | $ | ||||||||||||
| Deferred tax liabilities: | ||||||||||||||
| Equipment lease financing | $ | $ | ||||||||||||
Investments in qualified affordable housing partnerships, tax credit and other investments, net | ||||||||||||||
| Core deposit intangibles | ||||||||||||||
| FHLB stock dividends | ||||||||||||||
| Mortgage servicing assets | ||||||||||||||
| Acquired debts | ||||||||||||||
| Prepaid expenses | ||||||||||||||
| Premises and equipment | ||||||||||||||
| Unrealized gains on securities | ||||||||||||||
| Operating lease right-of-use assets | ||||||||||||||
| Other | ||||||||||||||
| Total deferred tax liabilities | $ | $ | ||||||||||||
| Net deferred tax assets | $ | $ | ||||||||||||
The tax benefits of deductible temporary differences and tax carryforwards are recorded as an asset to the extent that management assesses the utilization of such temporary differences and carryforwards to be more-likely-than-not. A valuation allowance is used, as needed, to reduce the deferred tax assets to the amount that is more-likely-than-not to be realized. Evidence the Company considers includes the Company’s ability to generate future taxable income, implement tax-planning strategies (as defined in ASC 740, Income Taxes), and utilize taxable income from prior carryback years (if such carryback is permitted under the applicable tax law), as well as future reversals of existing taxable temporary differences. The Company expects to have sufficient taxable income in future years to fully realize its deferred tax assets. The Company also performed an overall assessment by weighing all positive evidence against all negative evidence and concluded that it is more-likely-than-not that all of the benefits of the deferred tax assets will be realized, with the exception of the deferred tax assets related to certain state net operating losses carryforwards. No
The following table presents a reconciliation of the beginning and ending amounts of unrecognized tax benefits for the years ended December 31, 2021, 2020 and 2019:
| ($ in thousands) | Year Ended December 31, | |||||||||||||||||||
| 2021 | 2020 | 2019 | ||||||||||||||||||
| Beginning balance | $ | $ | $ | |||||||||||||||||
| Additions for tax positions related to prior years | ||||||||||||||||||||
| Deductions for tax positions related to prior years | ( | |||||||||||||||||||
| Ending balance | $ | $ | $ | |||||||||||||||||
146
The Company believes that adequate provisions have been recorded for all income tax uncertainties consistent with the standards of ASC 740-10. The Company recognizes interest and penalties, as applicable, related to the underpayment of income taxes as a component of Income tax expense on the Consolidated Statement of Income. The Company recorded a charge of $921 thousand of interest for the year ended December 31, 2021. In comparison, a charge of $564 thousand of interest and a reversal of $6.3 million of interest and penalties were recorded for the years ended December 31, 2020 and 2019, respectively. Total accrued interest included in Accrued expenses and other liabilities on the Consolidated Balance Sheet was $921 thousand and $564 thousand as of December 31, 2021 and 2020, respectively.
Beginning with its 2012 tax year, the Company has executed a Memorandum of Understanding (“MOU”) with the Internal Revenue Service (“IRS”) to voluntarily participate in the IRS Compliance Assurance Process (“CAP”). Under the CAP, the IRS audits the tax position of the Company to identify and resolve any tax issues that may arise throughout the tax year. The objective of the CAP is to resolve issues in a timely and contemporaneous manner and eliminate the need for a lengthy post-filing examination. The Company has executed a MOU with the IRS for the 2019 tax year. For federal tax purposes, the IRS had completed the 2017 and earlier tax years’ corporate income tax return examination. For the 2020 and 2021 tax years, the Company was accepted by the IRS as a CAP Bridge Year. The Company is also currently being audited by the states of Missouri, California, and New York, as well as by the city of New York. The Company does not believe that the outcome of unresolved issues or claims in any tax jurisdiction is likely to be material to the Company’s financial position, cash flows or results of operations. The Company believes that adequate provisions have been recorded for all income tax uncertainties consistent with ASC 740, Income Taxes as of December 31, 2021.
Note 12 — Commitments and Contingencies
Commitments to Extend Credit — In the normal course of doing business, the Company provides customers loan commitments on predetermined terms. These outstanding commitments to extend credit are not reflected in the accompanying Consolidated Financial Statements. While the Company does not anticipate losses as a result of these transactions, commitments to extend credit are included in determining the appropriate level of the allowance for unfunded credit commitments, and outstanding commercial letters of credit and SBLCs.
The following table presents the Company’s credit-related commitments as of December 31, 2021 and 2020:
| ($ in thousands) | December 31, | |||||||||||||||||||||||||||||||||||||
| 2021 | 2020 | |||||||||||||||||||||||||||||||||||||
| Expire in One Year or Less | Expire After One Year Through Three Years | Expire After Three Years Through Five Years | Expire After Five Years | Total | Total | |||||||||||||||||||||||||||||||||
| Loan commitments | $ | $ | $ | $ | $ | $ | ||||||||||||||||||||||||||||||||
| Commercial letters of credit and SBLCs | ||||||||||||||||||||||||||||||||||||||
| Total | $ | $ | $ | $ | $ | $ | ||||||||||||||||||||||||||||||||
Loan commitments are agreements to lend to customers provided there are no violations of any conditions established in the agreement. Commitments generally have fixed expiration dates or other termination clauses and may require maintenance of compensatory balances. Since many of the commitments are expected to expire without being drawn upon, the total commitment amounts do not necessarily represent future funding requirements.
Commercial letters of credit are issued to facilitate domestic and foreign trade transactions, while SBLCs are generally contingent upon the failure of the customers to perform according to the terms of the underlying contract with the third party. As a result, the total contractual amounts do not necessarily represent future funding requirements. The Company’s historical experience is that SBLCs typically expire without being funded. Additionally, in many cases, the Company holds collateral in various forms against these SBLCs. As part of its risk management activities, the Company monitors the creditworthiness of customers in conjunction with its SBLC exposure. Customers are obligated to reimburse the Company for any payment made on the customers’ behalf. If the customers fail to pay, the Company would, as applicable, liquidate the collateral and/or offset accounts. As of December 31, 2021, total letters of credit of $2.22 billion consisted of SBLCs of $2.14 billion and commercial letters of credit of $78.9 million. In comparison, total letters of credit of $2.24 billion consisted of SBLCs of $2.12 billion and commercial letters of credit of $124.9 million as of December 31, 2020. As of both December 31, 2021 and 2020, substantially all SBLCs were rated as “Pass” by the Bank’s internal credit risk rating system.
147
The Company applies the same credit underwriting criteria to extend loans, commitments and conditional obligations to customers. Each customer’s creditworthiness is evaluated on a case-by-case basis. Collateral and financial guarantees may be obtained based on management’s assessment of a customer’s credit. Collateral may include cash, accounts receivable, inventory, property, plant and equipment, and commercial property.
Estimated exposure to loss from these commitments is included in the allowance for unfunded credit commitments, and amounted to $27.5 million and $33.5 million as of December 31, 2021 and 2020, respectively.
Guarantees — From time to time, the Company sells or securitizes single-family and multifamily residential loans with recourse in the ordinary course of business. The Company is obligated to repurchase up to the recourse component of the loans if the loans default. The following table presents the carrying amounts of loans sold or securitized with recourse and the maximum potential future payments as of December 31, 2021 and 2020:
| ($ in thousands) | Maximum Potential Future Payments | Carrying Value | ||||||||||||||||||||||||||||||||||||||||||||||||
| December 31, | December 31, | |||||||||||||||||||||||||||||||||||||||||||||||||
| 2021 | 2020 | 2021 | 2020 | |||||||||||||||||||||||||||||||||||||||||||||||
| Expire in One Year or Less | Expire After One Year Through Three Years | Expire After Three Years Through Five Years | Expire After Five Years | Total | Total | Total | Total | |||||||||||||||||||||||||||||||||||||||||||
| Single-family residential loans sold or securitized with recourse | $ | $ | $ | $ | $ | $ | $ | $ | ||||||||||||||||||||||||||||||||||||||||||
| Multifamily residential loans sold or securitized with recourse | ||||||||||||||||||||||||||||||||||||||||||||||||||
| Total | $ | $ | $ | $ | $ | $ | $ | $ | ||||||||||||||||||||||||||||||||||||||||||
The Company’s recourse reserve related to these guarantees is included in the allowance for unfunded credit commitments and totaled $29 thousand and $88 thousand as of December 31, 2021 and 2020, respectively. The allowance for unfunded credit commitments is included in Accrued expenses and other liabilities on the Consolidated Balance Sheet. The Company continues to experience minimal losses from the single-family and multifamily residential loan portfolios sold or securitized with recourse.
Note 13 — Stock Compensation Plans
148
The following table presents a summary of the total share-based compensation expense and the related net tax benefits (deficiencies) associated with the Company’s various employee share-based compensation plans for the years ended December 31, 2021, 2020 and 2019:
| ($ in thousands) | Year Ended December 31, | |||||||||||||||||||
| 2021 | 2020 | 2019 | ||||||||||||||||||
| Stock compensation costs | $ | $ | $ | |||||||||||||||||
| Related net tax benefits (deficiencies) for stock compensation plans | $ | $ | ( | $ | ||||||||||||||||
Restricted Stock Units — RSUs are granted under the Company’s long-term incentive plan at no cost to the recipient. RSUs generally cliff vest after three years of continued employment from the date of the grant, and are authorized to settle predominantly in shares of the Company’s common stock. Certain RSUs are settled in cash. Dividends are accrued during the vesting period and are paid at the time of vesting. While a portion of RSUs are time-based vesting awards, others vest subject to the attainment of specified performance goals, referred to as “performance-based RSUs.” Performance-based RSUs are granted annually upon approval by the Company’s Compensation Committee based on the performance in the year prior to the grant date of the award. The number of awards that vests can range from zero to a maximum of 200 % of the granted number of awards based on the Company’s achievement of specified performance criteria over a performance period of three years .
The following table presents a summary of the activities for the Company’s time- and performance-based RSUs that will be settled in shares for the year ended December 31, 2021. The number of outstanding performance-based RSUs provided below assumes that performance will be met at the 100% target level.
| Time-Based RSUs | Performance-Based RSUs | |||||||||||||||||||||||||
| Shares | Weighted- Average Grant Date Fair Value | Shares | Weighted- Average Grant Date Fair Value | |||||||||||||||||||||||
Outstanding, January 1, 2021 | $ | $ | ||||||||||||||||||||||||
| Granted | ||||||||||||||||||||||||||
| Vested | ( | ( | ||||||||||||||||||||||||
| Forfeited | ( | |||||||||||||||||||||||||
Outstanding, December 31, 2021 | $ | $ | ||||||||||||||||||||||||
The following table presents a summary of the activities for the Company’s time-based RSUs that will be settled in cash for the year ended December 31, 2021:
| Shares | ||||||||
Outstanding, January 1, 2021 | ||||||||
| Granted | ||||||||
| Vested | ||||||||
| Forfeited | ( | |||||||
Outstanding, December 31, 2021 | ||||||||
149
The weighted-average grant date fair value of the time-based awards granted during the years ended December 31, 2021, 2020, and 2019 was $71.88 , $40.61 , and $52.46 , respectively. The weighted-average grant date fair value of the performance-based awards granted during the years ended December 31, 2021, 2020 and 2019 was $77.67 , $39.79 and $54.64 , respectively. The total fair value of time-based awards that vested during the years ended December 31, 2021, 2020 and 2019 was $22.7 million, $11.5 million and $20.7 million, respectively. The total fair value of performance-based awards that vested during the years ended December 31, 2021, 2020, and 2019 was $15.4 million, $8.9 million and $14.5 million, respectively.
As of December 31, 2021, there were $24.4 million of unrecognized compensation costs related to unvested time-based RSUs expected to be recognized over a weighted-average period of 1.83 years, and $13.6 million of unrecognized compensation costs related to unvested performance-based RSUs expected to be recognized over a weighted-average period of 1.77 years.
Employee Stock Purchase Plan — The 1998 Employee Stock Purchase Plan (the “Purchase Plan”) provides eligible employees of the Company the right to purchase shares of its common stock at a discount. Employees could purchase shares at 90 % of the fair market price subject to an annual purchase limitation of $22,500 per employee. As of December 31, 2021, the Purchase Plan qualifies as a non-compensatory plan under Section 423 of the Internal Revenue Code and, accordingly, no compensation expense has been recognized. 2,000,000 shares of the Company’s common stock were authorized for sale under the Purchase Plan. During the years ended December 31, 2021 and 2020, 37,725 shares totaling $2.6 million and 89,425 shares totaling $2.3 million, respectively, were sold to employees under the Purchase Plan. As of December 31, 2021, there were 266,775 shares available under the Purchase Plan.
Note 14 — Stockholders’ Equity and Earnings Per Share
The following table presents the basic and diluted EPS calculations for the years ended December 31, 2021, 2020 and 2019. For more information on the calculation of EPS, see Note 1 — Summary of Significant Accounting Policies — Significant Accounting Policies — Earnings Per Share to the Consolidated Financial Statements in this Form 10-K.
| ($ and shares in thousands, except per share data) | Year Ended December 31, | |||||||||||||||||||
| 2021 | 2020 | 2019 | ||||||||||||||||||
| Basic: | ||||||||||||||||||||
| Net income available to common stockholders | $ | $ | $ | |||||||||||||||||
| Basic weighted-average number of shares outstanding | ||||||||||||||||||||
| Basic EPS | $ | $ | $ | |||||||||||||||||
| Diluted: | ||||||||||||||||||||
| Net income available to common stockholders | $ | $ | $ | |||||||||||||||||
| Basic weighted-average number of shares outstanding | ||||||||||||||||||||
Diluted potential common shares (1) | ||||||||||||||||||||
Diluted weighted-average number of shares outstanding (1) | ||||||||||||||||||||
| Diluted EPS | $ | $ | $ | |||||||||||||||||
(1)Includes dilutive shares from RSUs for the years ended December 31, 2021, 2020 and 2019.
Shares are excluded from the computation of EPS when their inclusion has an anti-dilutive effect on EPS. For the years ended December 31, 2021, 2020 and 2019, 6 thousand, 134 thousand and 15 thousand weighted-average shares of anti-dilutive RSUs, respectively, were excluded from the diluted EPS computation.
Stock Repurchase Program — In 2020, the Company’s Board of Directors authorized a stock repurchase program to buy back up to $500.0 million of the Company’s common stock, and the Company repurchased 4,471,682 shares at an average price of $32.64 per share, for a total cost of $146.0 million. The Company did not repurchase any shares during the remainder of 2020 and during 2021.
150
Note 15 — Accumulated Other Comprehensive Income (Loss)
The following table presents the changes in the components of AOCI balances for the years ended December 31, 2021, 2020 and 2019:
| ($ in thousands) | AFS Debt Securities | Cash Flow Hedges | Foreign Currency Translation Adjustments (1) | Total | ||||||||||||||||||||||
| Balance, December 31, 2018 | $ | ( | $ | $ | ( | $ | ( | |||||||||||||||||||
| Net unrealized gains (losses) arising during the period | ( | |||||||||||||||||||||||||
Amounts reclassified from AOCI | ( | ( | ||||||||||||||||||||||||
Changes, net of tax | ( | |||||||||||||||||||||||||
| Balance, December 31, 2019 | $ | ( | $ | $ | ( | $ | ( | |||||||||||||||||||
| Net unrealized gains (losses) arising during the period | ( | |||||||||||||||||||||||||
Amounts reclassified from AOCI | ( | ( | ( | |||||||||||||||||||||||
Changes, net of tax | ( | |||||||||||||||||||||||||
| Balance, December 31, 2020 | $ | $ | ( | $ | ( | $ | ||||||||||||||||||||
| Net unrealized (losses) gains arising during the period | ( | ( | ||||||||||||||||||||||||
Amounts reclassified from AOCI | ( | ( | ||||||||||||||||||||||||
Changes, net of tax | ( | ( | ||||||||||||||||||||||||
| Balance, December 31, 2021 | $ | ( | $ | $ | ( | $ | ( | |||||||||||||||||||
(1)Represents foreign currency translation adjustments related to the Company’s net investment in non-U.S. operations, including related hedges. The functional currency and reporting currency of the Company’s foreign subsidiary was RMB and USD, respectively.
The following table presents the components of other comprehensive income (loss), reclassifications to net income and the related tax effects for the years ended December 31, 2021, 2020 and 2019:
| ($ in thousands) | Year Ended December 31, | |||||||||||||||||||||||||||||||||||||||||||||||||||||||
| 2021 | 2020 | 2019 | ||||||||||||||||||||||||||||||||||||||||||||||||||||||
| Before - Tax | Tax Effect | Net-of- Tax | Before - Tax | Tax Effect | Net-of- Tax | Before - Tax | Tax Effect | Net-of- Tax | ||||||||||||||||||||||||||||||||||||||||||||||||
| AFS debt securities: | ||||||||||||||||||||||||||||||||||||||||||||||||||||||||
| Net unrealized (losses) gains arising during the period | $ | ( | $ | $ | ( | $ | $ | ( | $ | $ | $ | ( | $ | |||||||||||||||||||||||||||||||||||||||||||
Net realized (gains) reclassified into net income (1) | ( | ( | ( | ( | ( | ( | ||||||||||||||||||||||||||||||||||||||||||||||||||
Net change | ( | ( | ( | ( | ||||||||||||||||||||||||||||||||||||||||||||||||||||
| Cash flow hedges | ||||||||||||||||||||||||||||||||||||||||||||||||||||||||
Net unrealized gains (losses) arising during the period | ( | ( | ( | |||||||||||||||||||||||||||||||||||||||||||||||||||||
Net realized losses (gains) reclassified into net income (2) | ( | ( | ( | |||||||||||||||||||||||||||||||||||||||||||||||||||||
Net change | ( | ( | ( | |||||||||||||||||||||||||||||||||||||||||||||||||||||
Foreign currency translation adjustments, net of hedges: | ||||||||||||||||||||||||||||||||||||||||||||||||||||||||
Net unrealized gains (losses) arising during the period (3) | ( | ( | ||||||||||||||||||||||||||||||||||||||||||||||||||||||
Net change | ( | ( | ||||||||||||||||||||||||||||||||||||||||||||||||||||||
| Other comprehensive (loss) income | $ | ( | $ | $ | ( | $ | $ | ( | $ | $ | $ | ( | $ | |||||||||||||||||||||||||||||||||||||||||||
(1)Pre-tax amounts were reported in Net gains on sales of AFS debt securities on the Consolidated Statement of Income for the years ended December 31, 2021, 2020 and 2019.
(2)Pre-tax amounts were reported in Interest expense on the Consolidated Statement of Income for the years ended December 31, 2021 and 2020.
(3)The tax effects on foreign currency translation adjustments, net of hedges represent the cumulative net deferred tax liabilities on net investment hedges since its inception.
151
Note 16 — Regulatory Requirements and Matters
Capital Adequacy — The Company and the Bank are subject to regulatory capital adequacy requirements administered by the federal banking agencies. The Bank is a member bank of the Federal Reserve System and is primarily regulated by the Federal Reserve and the California Department of Financial Protection and Innovation. The Company and the Bank are required to comply with the Basel III Capital Rules adopted by the federal banking agencies as standardized approaches institutions. The Basel III Capital Rules require that banking organizations maintain a minimum Common Equity Tier 1 (“CET1”) capital ratio of at least 4.5 %, a Tier 1 capital ratio of at least 6.0 %, a total capital ratio of at least 8.0 %, and a Tier 1 leverage ratio of a least 4.0 % to be considered adequately capitalized. Failure to meet the minimum capital requirements can result in certain mandatory actions and possibly additional discretionary actions by the regulators that, if undertaken, could have a direct material effect on the Company’s Consolidated Financial Statements. The Company and the Bank are also subject to maintain a capital conservation buffer of 2.5 % above the minimum risk-based capital ratios under the Basel III Capital Rules. Banking institutions with a ratio of CET1 to risk-weighted assets above the minimum but below the capital conservation buffer will face constraints on dividends, equity repurchases and compensation based on the amount of the shortfall.
The FDIC Improvement Act of 1991 requires that the federal regulatory agencies adopt regulations defining capital categories for banks: well capitalized, adequately capitalized, undercapitalized, significantly undercapitalized and critically undercapitalized. Consistent with the Basel III Capital Rules, the capital categories were augmented by including the CET1 capital measure, and revised risk-based capital measures to reflect the rule changes to the minimum risk-based capital ratios.
Effective January 1, 2020, the Company adopted the ASU 2016-13 Financial Instruments — Credit Losses (Topic 326) Measurement of Credit Losses on Financial instrument that introduced the CECL methodology. In March 2020, the federal banking agencies issued the Interim Final Rule that provided banking organizations that adopted the CECL with the phase-in option to delay the estimated impact of CECL on regulatory capital. The Bank and the Company have elected the CECL phase-in option in 2020. As a result, the Bank and the Company delayed the impact of CECL on regulatory capital through the year 2021, after which the effects are being phased in over a three-year period from January 1, 2022 through December 31, 2024.
152
As of December 31, 2021 and 2020, the Company and the Bank were both categorized as well capitalized based on applicable U.S. regulatory capital ratio requirements in accordance with Basel III standardized approaches, as set forth in the table below. The Company believes that no changes in conditions or events have occurred since December 31, 2021, which would result in changes that would cause the Company or the Bank to fall below the well capitalized level. The following table presents the regulatory capital information of the Company and the Bank as of December 31, 2021 and 2020:
| ($ in thousands) | Basel III | |||||||||||||||||||||||||||||||||||||||||||
| December 31, 2021 | December 31, 2020 | Minimum Capital Ratios | Fully Phased-in Minimum Capital Ratios (3) | Well- Capitalized Requirement | ||||||||||||||||||||||||||||||||||||||||
| Actual | Actual | |||||||||||||||||||||||||||||||||||||||||||
| Amount | Ratio | Amount | Ratio | Ratio | Ratio | Ratio | ||||||||||||||||||||||||||||||||||||||
Total capital (to risk-weighted assets) | ||||||||||||||||||||||||||||||||||||||||||||
| Company | $ | % | $ | % | % | % | % | |||||||||||||||||||||||||||||||||||||
| East West Bank | $ | % | $ | % | % | % | % | |||||||||||||||||||||||||||||||||||||
Tier 1 capital (to risk-weighted assets) | ||||||||||||||||||||||||||||||||||||||||||||
| Company | $ | % | $ | % | % | % | % | |||||||||||||||||||||||||||||||||||||
| East West Bank | $ | % | $ | % | % | % | % | |||||||||||||||||||||||||||||||||||||
CET1 capital (to risk-weighted assets) | ||||||||||||||||||||||||||||||||||||||||||||
| Company | $ | % | $ | % | % | % | % | |||||||||||||||||||||||||||||||||||||
| East West Bank | $ | % | $ | % | % | % | % | |||||||||||||||||||||||||||||||||||||
Tier 1 leverage capital (to adjusted average assets) | ||||||||||||||||||||||||||||||||||||||||||||
Company (1) | $ | % | $ | % | % | % | N/A | |||||||||||||||||||||||||||||||||||||
| East West Bank | $ | % | $ | % | % | % | % | |||||||||||||||||||||||||||||||||||||
Risk-weighted assets | ||||||||||||||||||||||||||||||||||||||||||||
| Company | $ | N/A | $ | N/A | N/A | N/A | N/A | |||||||||||||||||||||||||||||||||||||
| East West Bank | $ | N/A | $ | N/A | N/A | N/A | N/A | |||||||||||||||||||||||||||||||||||||
Adjusted quarterly average total assets (2) | ||||||||||||||||||||||||||||||||||||||||||||
| Company | $ | N/A | $ | N/A | N/A | N/A | N/A | |||||||||||||||||||||||||||||||||||||
| East West Bank | $ | N/A | $ | N/A | N/A | N/A | N/A | |||||||||||||||||||||||||||||||||||||
(1)The Tier 1 leverage capital well-capitalized requirement applies only to the Bank since there is no Tier 1 leverage ratio component in the definition of a well-capitalized bank holding company.
(2)Reflects adjusted quarterly average total assets for the years ended December 31, 2021 and 2020.
(3)Includes a 2.5 % capital conservation buffer requirement above the minimum risk-based capital ratios.
N/A — Not applicable.
Reserve Requirement — The Bank is required to maintain a percentage of its deposits as reserves at the Federal Reserve. In an effort to provide monetary stimulus to counteract the economic disruption caused by the COVID-19 pandemic, the Federal Reserve reduced reserve requirement ratio to zero percent. The daily average reserve requirements were zero
Note 17 — Business Segments
The Company organizes its operations into three reportable operating segments: (1) Consumer and Business Banking; (2) Commercial Banking; and (3) Other. These segments are defined by the type of customers served, and the related products and services provided. The segments reflect how financial information is currently evaluated by management. Operating segment results are based on the Company’s internal management reporting process, which reflects assignments and allocations of certain balance sheet and income statement items. The information presented is not indicative of how the segments would perform if they operated as independent entities due to the interrelationships among the segments.
The Consumer and Business Banking segment primarily provides financial products and services to consumer and commercial customers through the Company’s domestic branch network and digital banking platform. This segment offers consumer and commercial deposits, mortgage and home equity loans, and other products and services. It also originates commercial loans for small- and medium-sized enterprises through the Company’s branch network. Other products and services provided by this segment include wealth management, treasury management, interest rate risk hedging and foreign exchange services.
153
The Commercial Banking segment primarily generates commercial loans and deposits. Commercial loan products include commercial real estate lending, construction finance, working capital lines of credit, trade finance, letters of credit, commercial business lending, affordable housing lending, asset-based lending, asset-backed finance, project finance and equipment financing. Commercial deposit products and other financial services include treasury management, foreign exchange services, and interest rate and commodity risk hedging.
The remaining centralized functions, including the corporate treasury activities of the Company and eliminations of inter-segment amounts, have been aggregated and included in the Other segment, which provides broad administrative support to the two core segments, namely the Consumer and Business Banking and the Commercial Banking segments.
The Company utilizes an internal reporting process to measure the performance of the three operating segments within the Company. The internal reporting process derives operating segment results by utilizing allocation methodologies for revenues and expenses. Net interest income of each segment represents the difference between actual interest earned on assets and interest incurred on liabilities of the segment, adjusted for funding charges or credits through the Company’s internal funds transfer pricing (“FTP”) process. Noninterest income and noninterest expense directly attributable to a business segment are assigned to that segment. Indirect costs, including technology-related costs and corporate overhead, are allocated based on a segment’s estimated usage using factors including but not limited to, full-time equivalent employees, net interest income, and loan and deposit volume. Charge-offs are booked to the segment directly associated with the loans charged off, and the provision for credit losses is booked to segments based on related loans for which allowances are evaluated. The Company’s internal reporting process utilizes a full-allocation methodology. Under this methodology, corporate and indirect expenses incurred by the Other segment are allocated to the Consumer and Business Banking and the Commercial Banking segments, except certain corporate treasury-related expenses and insignificant unallocated expenses.
The corporate treasury function within the Other segment is responsible for the Company’s liquidity and interest rate management. The Company’s internal FTP process is also managed by the corporate treasury function within the Other segment. The process is formulated with the goal of encouraging loan and deposit growth that is consistent with the Company’s overall profitability objectives, as well as providing a reasonable and consistent basis for the measurement of its business segments’ net interest margins and profitability. The FTP process charges a cost to fund loans (“FTP charges for loans”) and allocates credits for funds provided from deposits (“FTP credits for deposits”) using internal FTP rates. FTP charges for loans are determined based on a matched cost of funds, which is tied to the pricing and term characteristics of the loans. FTP credits for deposits are based on matched funding credit rates, which are tied to the implied or stated maturity of the deposits. FTP credits for deposits reflect the long-term value generated by the deposits. The FTP process transfers the corporate interest rate risk exposure to the treasury function within the Other segment, where such exposures are centrally managed. The Company’s internal FTP assumptions and methodologies are reviewed at least annually to ensure that the process is reflective of current market conditions.
The following tables present the results of operations and other key financial measures for the individual operating segments as of and for the years ended December 31, 2021, 2020 and 2019:
| ($ in thousands) | Consumer and Business Banking | Commercial Banking | Other | Total | ||||||||||||||||||||||
| Year Ended December 31, 2021 | ||||||||||||||||||||||||||
| Net interest income before reversal of provision for credit losses | $ | $ | $ | $ | ||||||||||||||||||||||
| Reversal of provision for credit losses | ( | ( | ( | |||||||||||||||||||||||
Noninterest income (1) | ||||||||||||||||||||||||||
| Noninterest expense | ||||||||||||||||||||||||||
Segment income (loss) before income taxes (1) | ( | |||||||||||||||||||||||||
Segment net income (1) | $ | $ | $ | $ | ||||||||||||||||||||||
| As of December 31, 2021 | ||||||||||||||||||||||||||
| Segment assets | $ | $ | $ | $ | ||||||||||||||||||||||
154
| ($ in thousands) | Consumer and Business Banking | Commercial Banking | Other | Total | ||||||||||||||||||||||
| Year Ended December 31, 2020 | ||||||||||||||||||||||||||
Net interest income before provision for credit losses | $ | $ | $ | $ | ||||||||||||||||||||||
| Provision for credit losses | ||||||||||||||||||||||||||
Noninterest income (1) | ||||||||||||||||||||||||||
| Noninterest expense | ||||||||||||||||||||||||||
Segment income before income taxes (1) | ||||||||||||||||||||||||||
Segment net income (1) | $ | $ | $ | $ | ||||||||||||||||||||||
| As of December 31, 2020 | ||||||||||||||||||||||||||
| Segment assets | $ | $ | $ | $ | ||||||||||||||||||||||
| ($ in thousands) | Consumer and Business Banking | Commercial Banking | Other | Total | ||||||||||||||||||||||
| Year Ended December 31, 2019 | ||||||||||||||||||||||||||
Net interest income before provision for credit losses | $ | $ | $ | $ | ||||||||||||||||||||||
| Provision for credit losses | ||||||||||||||||||||||||||
Noninterest income (1) | ||||||||||||||||||||||||||
| Noninterest expense | ||||||||||||||||||||||||||
Segment income before income taxes (1) | ||||||||||||||||||||||||||
Segment net income (1) | $ | $ | $ | $ | ||||||||||||||||||||||
| As of December 31, 2019 | ||||||||||||||||||||||||||
| Segment assets | $ | $ | $ | $ | ||||||||||||||||||||||
(1)During the fourth quarter of 2021, the Company enhanced its segment allocation methodology related to the fair values of interest rate and commodity derivative contracts, which are included in noninterest income. These fair values that were previously allocated to the “Commercial Banking” segment, have been reclassified between “Consumer and Business Banking” and “Commercial Banking.” Prior years’ balances have been reclassified to conform to the 2021 presentation.
Note 18 — Parent Company Condensed Financial Statements
155
The following tables present the Parent Company-only condensed financial statements:
CONDENSED BALANCE SHEET
| ($ in thousands, except shares) | December 31, | |||||||||||||
| 2021 | 2020 | |||||||||||||
| ASSETS | ||||||||||||||
| Cash and cash equivalents due from subsidiary bank | $ | $ | ||||||||||||
| Investments in subsidiaries: | ||||||||||||||
| Bank | ||||||||||||||
| Nonbank | ||||||||||||||
| Investments in tax credit investments, net | ||||||||||||||
| Other assets | ||||||||||||||
| TOTAL | $ | $ | ||||||||||||
| LIABILITIES | ||||||||||||||
| Long-term debt | $ | $ | ||||||||||||
| Accrued income tax payable | ||||||||||||||
| Other liabilities | ||||||||||||||
| Total liabilities | ||||||||||||||
| STOCKHOLDERS’ EQUITY | ||||||||||||||
Common stock, $ | ||||||||||||||
| Additional paid-in capital | ||||||||||||||
| Retained earnings | ||||||||||||||
Treasury stock, at cost | ( | ( | ||||||||||||
| AOCI, net of tax | ( | |||||||||||||
| Total stockholders’ equity | ||||||||||||||
| TOTAL | $ | $ | ||||||||||||
CONDENSED STATEMENT OF INCOME
| ($ in thousands) | Year Ended December 31, | |||||||||||||||||||
| 2021 | 2020 | 2019 | ||||||||||||||||||
| Dividends from subsidiaries: | ||||||||||||||||||||
| Bank | $ | $ | $ | |||||||||||||||||
| Nonbank | ||||||||||||||||||||
| Other income | ||||||||||||||||||||
| Total income | ||||||||||||||||||||
| Interest expense on long-term debt | ||||||||||||||||||||
| Compensation and employee benefits | ||||||||||||||||||||
| Amortization of tax credit and other investments | ||||||||||||||||||||
| Other expense | ||||||||||||||||||||
| Total expense | ||||||||||||||||||||
| Income before income tax benefit and equity in undistributed income of subsidiaries | ||||||||||||||||||||
| Income tax benefit | ||||||||||||||||||||
| Undistributed earnings of subsidiaries, primarily bank | ||||||||||||||||||||
| Net income | $ | $ | $ | |||||||||||||||||
156
CONDENSED STATEMENT OF CASH FLOWS
| ($ in thousands) | Year Ended December 31, | |||||||||||||||||||
| 2021 | 2020 | 2019 | ||||||||||||||||||
| CASH FLOWS FROM OPERATING ACTIVITIES | ||||||||||||||||||||
| Net income | $ | $ | $ | |||||||||||||||||
| Adjustments to reconcile net income to net cash provided by operating activities: | ||||||||||||||||||||
| Undistributed earnings of subsidiaries, principally bank | ( | ( | ( | |||||||||||||||||
| Amortization expense | ||||||||||||||||||||
| Deferred income tax expense (benefit) | ( | |||||||||||||||||||
| Net change in other assets | ( | |||||||||||||||||||
| Net change in other liabilities | ( | ( | ||||||||||||||||||
| Net cash provided by operating activities | ||||||||||||||||||||
| CASH FLOWS FROM INVESTING ACTIVITIES | ||||||||||||||||||||
| Net increase in investments in tax credit investments | ( | ( | ( | |||||||||||||||||
| Distributions received from equity method investees | ||||||||||||||||||||
| Net increase in investments in and advances to nonbank subsidiaries | ( | ( | ( | |||||||||||||||||
| Other investing activities | ( | |||||||||||||||||||
| Net cash (used in) provided by investing activities | ( | ( | ||||||||||||||||||
| CASH FLOWS FROM FINANCING ACTIVITIES | ||||||||||||||||||||
| Common stock: | ||||||||||||||||||||
Proceeds from issuance pursuant to various stock compensation plans and agreements | ||||||||||||||||||||
| Stock tendered for payment of withholding taxes | ( | ( | ( | |||||||||||||||||
| Repurchased of common stock pursuant to the Stock Repurchase Program | ( | |||||||||||||||||||
| Cash dividends paid | ( | ( | ( | |||||||||||||||||
| Net cash used in financing activities | ( | ( | ( | |||||||||||||||||
| Net (decrease) increase in cash and cash equivalents | ( | |||||||||||||||||||
| Cash and cash equivalents, beginning of year | ||||||||||||||||||||
| Cash and cash equivalents, end of year | $ | $ | $ | |||||||||||||||||
Note 19 — Subsequent Events
157
ITEM 9. CHANGES IN AND DISAGREEMENTS WITH ACCOUNTANTS ON ACCOUNTING AND FINANCIAL DISCLOSURE
None.
ITEM 9A. CONTROLS AND PROCEDURES
Disclosure Controls and Procedures
As of December 31, 2021, pursuant to Rule 13a-15(b) of the Securities Exchange Act of 1934, as amended (the “Exchange Act”), the Company conducted an evaluation, under the supervision and with the participation of the Company’s management, including the Chief Executive Officer and Chief Financial Officer, of the effectiveness of the Company’s disclosure controls and procedures (as defined in Rule 13a-15(e) of the Exchange Act). Based upon that evaluation, the Company’s Chief Executive Officer and Chief Financial Officer concluded that the Company’s disclosure controls and procedures were effective as of December 31, 2021.
The Company’s disclosure controls and procedures are designed to ensure that information required to be disclosed by the Company in the reports that the Company files or submits under the Exchange Act is recorded, processed, summarized, and reported within the time periods specified in the rules and forms of the SEC. The Company’s disclosure controls and procedures include, without limitation, controls and procedures designed to ensure that information required to be disclosed by the Company in the reports that the Company files under the Exchange Act is accumulated and communicated to the Company’s management, including the Chief Executive Officer and Chief Financial Officer, as appropriate, to allow timely decisions regarding required disclosure.
Management’s Annual Report on Internal Control over Financial Reporting
The Company’s management is responsible for establishing and maintaining adequate internal control over financial reporting (as defined in Rule 13a-15(f) of the Exchange Act). The Company’s internal control over financial reporting is designed to provide reasonable assurance regarding the reliability of financial reporting and the preparation of the Company’s financial statements for external purposes in accordance with U.S. GAAP.
Because of its inherent limitations, internal control over financial reporting may not prevent or detect misstatements. In addition, projections of any evaluation of effectiveness to future periods are subject to the risk that controls may become inadequate because of changes in conditions or that the degree of compliance with policies or procedures may deteriorate.
Management evaluated the effectiveness of the Company’s internal control over financial reporting as of December 31, 2021 using the criteria set forth in Internal Control — Integrated Framework 2013 issued by the Committee of Sponsoring Organization of the Treadway Commission. Based on this evaluation, management concluded that the Company’s internal control over financial reporting was effective as of December 31, 2021.
Changes in Internal Control over Financial Reporting
There were no changes in the Company’s internal control over financial reporting during the quarter ended December 31, 2021, that have materially affected or are reasonably likely to materially affect the Company’s internal control over financial reporting.
Report of Independent Registered Public Accounting Firm
KPMG LLP, the independent registered public accounting firm that audited the Company’s Consolidated Financial Statements, issued an audit report on the effectiveness of internal control over financial reporting as of December 31, 2021. The audit report is presented on the following page.
158
REPORT OF INDEPENDENT REGISTERED PUBLIC ACCOUNTING FIRM
To the Stockholders and Board of Directors
East West Bancorp, Inc.:
Opinion on Internal Control Over Financial Reporting
We have audited East West Bancorp, Inc. and subsidiaries’ (the Company) internal control over financial reporting as of December 31, 2021, based on criteria established in Internal Control — Integrated Framework (2013) issued by the Committee
of Sponsoring Organizations of the Treadway Commission. In our opinion, the Company maintained, in all material respects, effective internal control over financial reporting as of December 31, 2021, based on criteria established in Internal Control — Integrated Framework (2013) issued by the Committee of Sponsoring Organizations of the Treadway Commission.
We also have audited, in accordance with the standards of the Public Company Accounting Oversight Board (United States) (PCAOB), the consolidated balance sheets of the Company as of December 31, 2021 and 2020, the related consolidated statements of income, comprehensive income, changes in stockholders’ equity, and cash flows for each of the years in the three-year period ended December 31, 2021, and the related notes (collectively, the consolidated financial statements), and our report dated February 28, 2022 expressed an unqualified opinion on those consolidated financial statements.
Basis for Opinion
The Company’s management is responsible for maintaining effective internal control over financial reporting and for its assessment of the effectiveness of internal control over financial reporting, included in the accompanying Management’s Annual Report on Internal Control over Financial Reporting. Our responsibility is to express an opinion on the Company’s internal control over financial reporting based on our audit. We are a public accounting firm registered with the PCAOB and are required to be independent with respect to the Company in accordance with the U.S. federal securities laws and the applicable rules and regulations of the Securities and Exchange Commission and the PCAOB.
We conducted our audit in accordance with the standards of the PCAOB. Those standards require that we plan and perform the audit to obtain reasonable assurance about whether effective internal control over financial reporting was maintained in all material respects. Our audit of internal control over financial reporting included obtaining an understanding of internal control over financial reporting, assessing the risk that a material weakness exists, and testing and evaluating the design and operating effectiveness of internal control based on the assessed risk. Our audit also included performing such other procedures as we considered necessary in the circumstances. We believe that our audit provides a reasonable basis for our opinion.
Definition and Limitations of Internal Control Over Financial Reporting
A company’s internal control over financial reporting is a process designed to provide reasonable assurance regarding the reliability of financial reporting and the preparation of financial statements for external purposes in accordance with generally accepted accounting principles. A company’s internal control over financial reporting includes those policies and procedures that (1) pertain to the maintenance of records that, in reasonable detail, accurately and fairly reflect the transactions and dispositions of the assets of the company; (2) provide reasonable assurance that transactions are recorded as necessary to permit preparation of financial statements in accordance with generally accepted accounting principles, and that receipts and expenditures of the company are being made only in accordance with authorizations of management and directors of the company; and (3) provide reasonable assurance regarding prevention or timely detection of unauthorized acquisition, use, or disposition of the company’s assets that could have a material effect on the financial statements.
Because of its inherent limitations, internal control over financial reporting may not prevent or detect misstatements. Also, projections of any evaluation of effectiveness to future periods are subject to the risk that controls may become inadequate because of changes in conditions, or that the degree of compliance with the policies or procedures may deteriorate.
/s/ KPMG LLP
Los Angeles, California
February 28, 2022
159
ITEM 9B. OTHER INFORMATION
None.
ITEM 9C. DISCLOSURE REGARDING FOREIGN JURISDICTIONS THAT PREVENT INSPECTIONS
Not applicable.
PART III
ITEM 10. DIRECTORS, EXECUTIVE OFFICERS AND CORPORATE GOVERNANCE
The names of the Company’s executive officers and biographical information for each, is set forth in Item 1. Business — Information about our Executive Officers in this Form 10-K.
The other information required by this item will be set forth in the following sections of the Company’s definitive proxy statement for its 2022 Annual Meeting of Stockholders (the “2022 Proxy Statement”), which will be filed with the SEC pursuant to Regulation 14A within 120 days of the Company’s fiscal year ended December 31, 2021 and this information is incorporated herein by reference:
•Summary Information about Director Nominees
•Board of Directors and Nominees
•Director Nominee Qualifications and Experience
•Director Independence, Financial Experts and Risk Management Experience
•Board Leadership Structure
•Board Meetings and Committees
The Company has adopted a Code of Conduct that applies to its principal executive officer, principal financial and accounting officer, controller, and persons performing similar functions. The Code of Conduct is posted on the Company’s website at www.eastwestbank.com/govdocs. Any amendments to, or waivers from, the Company’s Code of Conduct will be disclosed on the Company’s website at http://investor.eastwestbank.com.
ITEM 11. EXECUTIVE COMPENSATION
Information regarding the Company’s executive compensation will be set forth in the following sections of the 2022 Proxy Statement and this information is incorporated herein by reference:
•Director Compensation
•Compensation Discussion and Analysis
ITEM 12. SECURITY OWNERSHIP OF CERTAIN BENEFICIAL OWNERS AND MANAGEMENT AND RELATED STOCKHOLDER MATTERS
Information concerning security ownership of certain beneficial owners and management not otherwise included herein will be set forth in the 2022 Proxy Statement under the heading “Stock Ownership of Principal Stockholders, Directors and Management” and this information is incorporated herein by reference.
160
Securities Authorized for Issuance under Equity Compensation Plans
The following table sets forth the total number of shares available for issuance under the Company’s employee equity compensation plans as of December 31, 2021:
| Plan Category | Number of Securities to be Issued upon Exercise of Outstanding Options | Weighted-Average Exercise Price of Outstanding Options | Number of Securities Remaining Available for Future Issuance under Equity Compensation Plans | ||||||||||||||||||||
Equity compensation plans approved by security holders | — | $ | — | 5,420,089 | (1) | ||||||||||||||||||
Equity compensation plans not approved by security holders | — | — | — | ||||||||||||||||||||
| Total | — | $ | — | 5,420,089 | |||||||||||||||||||
(1)Represents future shares available under the stockholder-approved 2021 Stock Incentive Plan effective March 4, 2021.
ITEM 13. CERTAIN RELATIONSHIPS AND RELATED TRANSACTIONS AND DIRECTOR INDEPENDENCE
Information regarding certain relationships and related transactions will be set forth in the following sections of the 2022 Proxy Statement and this information is incorporated herein by reference:
•Director Independence, Financial Experts and Risk Management Experience
•Certain Relationships and Related Transactions
ITEM 14. PRINCIPAL ACCOUNTANT FEES AND SERVICES
Our independent registered public accounting firm is KPMG LLP , Los Angeles, CA , PCAOB ID: 185 .
Information regarding principal accountant fees and services will be set forth in the 2022 Proxy Statement under the heading “Ratification of Auditors” and this information is incorporated herein by reference.
161
PART IV
ITEM 15. EXHIBITS AND FINANCIAL STATEMENT SCHEDULES
(1)Financial Statements
The following financial statements of East West Bancorp, Inc. and its subsidiaries, and the auditor’s report thereon are filed as part of this report under Item 8. Financial Statements and Supplementary Data:
| Page | |||||
(2)Financial Statement Schedules
All financial statement schedules for East West Bancorp, Inc. and its subsidiaries have been included in this Form 10-K in the Consolidated Financial Statements or the related notes thereto, or they are either inapplicable or not required.
(3)Exhibits
A list of exhibits to this Form 10-K is set forth below.
| Exhibit No. | Exhibit Description | |||||||
| 3.1 | ||||||||
| 3.1.1 | ||||||||
| 3.1.2 | ||||||||
| 3.1.3 | ||||||||
| 3.1.4 | ||||||||
| 3.2 | ||||||||
| 4.1 | ||||||||
| 4.2 | ||||||||
| 4.3 | ||||||||
| 10.1.1 | ||||||||
| 10.1.2 | ||||||||
162
| 10.1.3 | ||||||||
| 10.1.4 | ||||||||
| 10.1.5 | ||||||||
| 10.1.6 | ||||||||
| 10.1.7 | ||||||||
| 10.2.1 | ||||||||
| 10.2.2 | ||||||||
| 10.2.3 | ||||||||
| 10.2.4 | ||||||||
| 10.2.5 | ||||||||
| 10.2.6 | ||||||||
| 10.2.7 | ||||||||
| 10.3 | ||||||||
| 10.4.1 | ||||||||
| 10.4.2 | ||||||||
| 10.4.3 | ||||||||
| 10.4.4 | ||||||||
| 10.5 | ||||||||
| 10.6.1 | ||||||||
| 10.6.2 | ||||||||
| 10.6.3 | ||||||||
163
| 10.7.1 | ||||||||
| 10.7.2 | ||||||||
| 10.7.3 | ||||||||
| 10.7.4 | ||||||||
| 10.7.5 | ||||||||
| 10.7.6 | ||||||||
| 10.7.7 | ||||||||
| 10.7.8 | ||||||||
| 10.8 | ||||||||
| 10.9 | ||||||||
| 21.1 | ||||||||
| 23.1 | ||||||||
| 24 | ||||||||
| 31.1 | ||||||||
| 31.2 | ||||||||
| 32.1 | ||||||||
| 32.2 | ||||||||
| 101.INS | The instance document does not appear in the interactive data file because its XBRL tags are embedded within the inline XBRL document. | |||||||
| 101.SCH | XBRL Taxonomy Extension Schema Document. Filed herewith. | |||||||
| 101.CAL | XBRL Taxonomy Extension Calculation Linkbase Document. Filed herewith. | |||||||
| 101.DEF | XBRL Taxonomy Extension Definition Linkbase Document. Filed herewith. | |||||||
| 101.LAB | XBRL Taxonomy Extension Label Linkbase Document. Filed herewith. | |||||||
| 101.PRE | XBRL Taxonomy Extension Presentation Linkbase Document. Filed herewith. | |||||||
| 104 | Cover Page Interactive Data (formatted as Inline XBRL and contained in Exhibit 101 filed herewith). Filed herewith. | |||||||
| * Denotes management contract or compensatory plan or arrangement. | ||||||||
ITEM 16. FORM 10-K SUMMARY
Not applicable.
164
GLOSSARY OF ACRONYMS
| AFS | Available-for-sale | HELOC | Home equity line of credit | ||||||||
| ALCO | Asset/Liability Committee | IRS | Internal Revenue Service | ||||||||
| AML | Anti-money laundering | KRX | Keefe, Bruyette and Woods Nasdaq Regional Banking Index | ||||||||
| AML Act | The Anti-Money Laundering Act of 2020 | LCH | London Clearing House | ||||||||
| AOCI | Accumulated other comprehensive income (loss) | LGD | Loss given default | ||||||||
| ARRC | Alternative Reference Rates Committee | LIBOR | London Interbank Offered Rate | ||||||||
| ASC | Accounting Standards Codification | LTV | Loan-to-value | ||||||||
| ASU | Accounting Standards Update | MD&A | Management’s Discussion and Analysis of Financial Condition and Results of Operations | ||||||||
| BHC Act | Bank Holding Company Act of 1956, as amended | MMBTU | Million British thermal unit | ||||||||
| BSA | Bank Secrecy Act | MMLF | Money Market Mutual Fund Liquidity Facility | ||||||||
| C&I | Commercial and industrial | Moody's | Moody’s Investors Service | ||||||||
| CAA | Consolidated Appropriations Act, 2021 | MOU | Memorandum of Understanding | ||||||||
| CAP | Compliance Assurance Process | MSLP | Main Street Lending Program | ||||||||
| CARES Act | Coronavirus Aid, Relief, and Economic Security Act | NAV | Net asset value | ||||||||
| CCPA | California Consumer Privacy Act | OFAC | Office of Foreign Assets Control | ||||||||
| CECL | Current expected credit losses | OREO | Other real estate owned | ||||||||
| CET1 | Common Equity Tier 1 | OTTI | Other-than-temporary impairment | ||||||||
| CFPB | Consumer Financial Protection Bureau | PATRIOT ACT | USA PATRIOT Act of 2001 | ||||||||
| CLO | Collateralized loan obligation | PCA | Prompt Corrective Action | ||||||||
| CME | Chicago Mercantile Exchange | PCD | Purchased credit deteriorated | ||||||||
| COVID-19 | Coronavirus Disease 2019 | PCI | Purchased credit impaired | ||||||||
| CRA | Community Reinvestment Act | PD | Probability of default | ||||||||
| CRE | Commercial real estate | PPP | Paycheck Protection Program | ||||||||
| DFPI | California Department of Financial Protection and Innovation | PPPLF | Paycheck Protection Program Liquidity Facility | ||||||||
| DIF | Deposit Insurance Fund | RMB | Chinese Renminbi | ||||||||
| EGRRCPA | Economic Growth, Regulatory Relief, and Consumer Protection Act | ROA | Return on average assets | ||||||||
| EPS | Earnings per share | ROE | Return on average equity | ||||||||
| ERM | Enterprise risk management | RPA | Credit risk participation agreement | ||||||||
| EVE | Economic value of equity | RSU | Restricted stock unit | ||||||||
| FASB | Financial Accounting Standards Board | S&P | Standard & Poor's | ||||||||
| FCA | Financial Conduct Authority | SBA | Small Business Administration | ||||||||
| FDIA | Federal Deposit Insurance Act | SBLC | Standby letter of credit | ||||||||
| FDIC | Federal Deposit Insurance Corporation | SEC | U.S. Securities and Exchange Commission | ||||||||
| FFIEC | Federal Financial Institutions Examination Council | SERP | Supplemental Executive Retirement Plan | ||||||||
| FHLB | Federal Home Loan Bank | SOFR | Secured Overnight Financing Rate | ||||||||
| FRBSF | Federal Reserve Bank of San Francisco | TDR | Troubled debt restructuring | ||||||||
| FTP | Funds transfer pricing | U.K. | United Kingdom | ||||||||
| GAAP | United States Generally Accepted Accounting Principles | U.S. | United States | ||||||||
| GDP | Gross Domestic Product | USD | U.S. Dollar | ||||||||
| GLBA | Gramm-Leach-Bliley Act of 1999 | VIE | Variable interest entity | ||||||||
165
SIGNATURES
Pursuant to the requirements of Section 13 or 15(d) of the Securities Exchange Act of 1934, the registrant has duly caused this report to be signed on its behalf by the undersigned, thereunto duly authorized.
| Dated: February 28, 2022 | EAST WEST BANCORP, INC. (Registrant) | |||||||||||||
| By | /s/ DOMINIC NG | |||||||||||||
| Dominic Ng | ||||||||||||||
| Chairman and Chief Executive Officer | ||||||||||||||
Pursuant to the requirements of the Securities Exchange Act of 1934, this report has been signed below by the following persons on behalf of the registrant and in the capacities and on the dates indicated.
| Signature | Title | Date | ||||||||||||
| /s/ DOMINIC NG | Chairman, Chief Executive Officer and Director (Principal Executive Officer) | February 28, 2022 | ||||||||||||
| Dominic Ng | ||||||||||||||
| /s/ IRENE H. OH | Executive Vice President and Chief Financial Officer (Principal Financial and Accounting Officer) | February 28, 2022 | ||||||||||||
| Irene H. Oh | ||||||||||||||
| MANUEL P. ALVAREZ* | Director | February 28, 2022 | ||||||||||||
| Manuel P. Alvarez | ||||||||||||||
| MOLLY CAMPBELL* | Director | February 28, 2022 | ||||||||||||
| Molly Campbell | ||||||||||||||
| IRIS S. CHAN* | Director | February 28, 2022 | ||||||||||||
| Iris S. Chan | ||||||||||||||
| ARCHANA DESKUS* | Director | February 28, 2022 | ||||||||||||
| Archana Deskus | ||||||||||||||
| RUDOLPH I. ESTRADA* | Lead Director | February 28, 2022 | ||||||||||||
| Rudolph I. Estrada | ||||||||||||||
| PAUL H. IRVING* | Director | February 28, 2022 | ||||||||||||
| Paul H. Irving | ||||||||||||||
| JACK C. LIU* | Director | February 28, 2022 | ||||||||||||
| Jack C. Liu | ||||||||||||||
| LESTER M. SUSSMAN* | Director | February 28, 2022 | ||||||||||||
| Lester M. Sussman | ||||||||||||||
* Dominic Ng, by signing his name hereto, does hereby sign this document on behalf of each of the above named directors of the registrant pursuant to powers of attorney duly executed by such persons.
| By | /s/ DOMINIC NG | |||||||||||||
| Dominic Ng | ||||||||||||||
| Attorney-In-Fact | ||||||||||||||
| Chairman and Chief Executive Officer | ||||||||||||||
166
Serious News for Serious Traders! Try StreetInsider.com Premium Free!
You May Also Be Interested In
- East West Bancorp (EWBC) PT Raised to $85 at Keefe, Bruyette & Woods
- East West Bancorp Reports Net Income for First Quarter of 2024 of $285 Million and Diluted Earnings Per Share of $2.03
- Sisecam’s $1.1 Billion Eurobond Issues Receive Over $3.5 Billion in Demand
Create E-mail Alert Related Categories
SEC FilingsSign up for StreetInsider Free!
Receive full access to all new and archived articles, unlimited portfolio tracking, e-mail alerts, custom newswires and RSS feeds - and more!
