

Form 10-K BROWN FORMAN CORP For: Apr 30
 Tweet
Tweet Share
ShareUNITED STATES
SECURITIES AND EXCHANGE COMMISSION
Washington, D.C. 20549
Form 10-K
| (Mark One) | |||||
| ANNUAL REPORT PURSUANT TO SECTION 13 OR 15(d) OF THE SECURITIES EXCHANGE ACT OF 1934 | |||||
For the fiscal year ended April 30 , 2021
OR
| TRANSITION REPORT PURSUANT TO SECTION 13 OR 15(d) OF THE SECURITIES EXCHANGE ACT OF 1934 | |||||
For the transition period from to
Commission File Number 001-00123
(Exact name of registrant as specified in its charter)
| (State or other jurisdiction of incorporation or organization) | (IRS Employer Identification No.) | |||||||
| (Address of principal executive offices) | (Zip Code) | |||||||
Registrant’s telephone number, including area code (502 ) 585-1100
Securities registered pursuant to Section 12(b) of the Act:
| Title of each class | Trading Symbol(s) | Name of each exchange on which registered | ||||||
Securities registered pursuant to Section 12(g) of the Act: None
Indicate by check mark if the registrant is a well-known seasoned issuer, as defined in Rule 405 of the Securities Act. Yes ☑ No ☐
Indicate by check mark if the registrant is not required to file reports pursuant to Section 13 or Section 15(d) of the Act. Yes ☐ No ☑
Indicate by check mark whether the registrant (1) has filed all reports required to be filed by Section 13 or 15(d) of the Securities Exchange Act of 1934 during the preceding 12 months (or for such shorter period that the registrant was required to file such reports), and (2) has been subject to such filing requirements for the past 90 days. Yes ☑ No ☐
Indicate by check mark whether the registrant has submitted electronically every Interactive Data File required to be submitted pursuant to Rule 405 of Regulation S-T during the preceding 12 months (or for such shorter period that the registrant was required to submit such files). Yes ☑ No ☐
Indicate by check mark whether the registrant is a large accelerated filer, an accelerated filer, a non-accelerated filer, a smaller reporting company, or an emerging growth company. See the definitions of “large accelerated filer,” “accelerated filer,” “smaller reporting company,” and “emerging growth company” in Rule 12b-2 of the Exchange Act.
| ☑ | Accelerated filer | ☐ | ||||||||||||
| Non-accelerated filer | ☐ | Smaller reporting company | ||||||||||||
| Emerging growth company | ||||||||||||||
If an emerging growth company, indicate by check mark if the registrant has elected not to use the extended transition period for complying with any new or revised financial accounting standards provided pursuant to Section 13(a) of the Exchange Act. ☐
Indicate by check mark whether the registrant has filed a report on and attestation to its management’s assessment of the effectiveness of its internal control over financial reporting under Section 404(b) of the Sarbanes-Oxley Act by the registered public accounting firm that prepared or issued its audit report. ☑
Indicate by check mark whether the registrant is a shell company (as defined in Rule 12b-2 of the Act). Yes ☐ No ☑
The aggregate market value, as of the last business day of the most recently completed second fiscal quarter, of the voting and nonvoting equity held by nonaffiliates of the registrant was approximately $23,400,000,000 .
The number of shares outstanding for each of the registrant’s classes of Common Stock on May 31, 2021, was:
| Class A Common Stock (voting), $0.15 par value | |||||
| Class B Common Stock (nonvoting), $0.15 par value | |||||
DOCUMENTS INCORPORATED BY REFERENCE
| Table of Contents | ||||||||
| Page | ||||||||
| PART I | ||||||||
| Item 1. | ||||||||
| Item 1A. | ||||||||
| Item 1B. | ||||||||
| Item 2. | ||||||||
| Item 3. | ||||||||
| Item 4. | ||||||||
| PART II | ||||||||
| Item 5. | ||||||||
| Item 6. | ||||||||
| Item 7. | ||||||||
| Item 7A. | ||||||||
| Item 8. | ||||||||
| Item 9. | ||||||||
| Item 9A. | ||||||||
| Item 9B. | ||||||||
| Item 9C. | ||||||||
| PART III | ||||||||
| Item 10. | ||||||||
| Item 11. | ||||||||
| Item 12. | ||||||||
| Item 13. | ||||||||
| Item 14. | ||||||||
| PART IV | ||||||||
| Item 15. | ||||||||
| Item 16. | ||||||||
3
Forward-Looking Statement Information. Certain matters discussed in this report, including the information presented in Part II under “Item 7. Management’s Discussion and Analysis of Financial Condition and Results of Operations,” contain statements, estimates, and projections that are “forward-looking statements” as defined under U.S. federal securities laws. Words such as “aim,” “anticipate,” “aspire,” “believe,” “can,” “continue,” “could,” “envision,” “estimate,” “expect,” “expectation,” “intend,” “may,” “might,” “plan,” “potential,” “project,” “pursue,” “see,” “seek,” “should,” “will,” “would,” and similar words indicate forward-looking statements, which speak only as of the date we make them. Except as required by law, we do not intend to update or revise any forward-looking statements, whether as a result of new information, future events, or otherwise. By their nature, forward-looking statements involve risks, uncertainties, and other factors (many beyond our control) that could cause our actual results to differ materially from our historical experience or from our current expectations or projections. These risks and uncertainties include, but are not limited to, those described in Part I under “Item 1A. Risk Factors” and those described from time to time in our future reports filed with the Securities and Exchange Commission, including:
•Our substantial dependence upon the continued growth of the Jack Daniel's family of brands
•Substantial competition from new entrants, consolidations by competitors and retailers, and other competitive activities, such as pricing actions (including price reductions, promotions, discounting, couponing, or free goods), marketing, category expansion, product introductions, or entry or expansion in our geographic markets or distribution networks
•Route-to-consumer changes that affect the timing of our sales, temporarily disrupt the marketing or sale of our products, or result in higher fixed costs
•Disruption of our distribution network or inventory fluctuations in our products by distributors, wholesalers, or retailers
•Changes in consumer preferences, consumption, or purchase patterns – particularly away from larger producers in favor of small distilleries or local producers, or away from brown spirits, our premium products, or spirits generally, and our ability to anticipate or react to them; further legalization of marijuana; shifts in consumer purchase practices; bar, restaurant, travel, or other on-premise declines; shifts in demographic or health and wellness trends; or unfavorable consumer reaction to new products, line extensions, package changes, product reformulations, or other product innovation
•Production facility, aging warehouse, or supply chain disruption
•Imprecision in supply/demand forecasting
•Higher costs, lower quality, or unavailability of energy, water, raw materials, product ingredients, or labor
•Impact of health epidemics and pandemics, including the COVID-19 pandemic, and the risk of the resulting negative economic impact and related governmental actions
•Unfavorable global or regional economic conditions, particularly related to the COVID-19 pandemic, and related economic slowdowns or recessions, low consumer confidence, high unemployment, weak credit or capital markets, budget deficits, burdensome government debt, austerity measures, higher interest rates, higher taxes, political instability, higher inflation, deflation, lower returns on pension assets, or lower discount rates for pension obligations
•Product recalls or other product liability claims, product tampering, contamination, or quality issues
•Negative publicity related to our company, products, brands, marketing, executive leadership, employees, board of directors, family stockholders, operations, business performance, or prospects
•Failure to attract or retain key executive or employee talent
•Risks associated with acquisitions, dispositions, business partnerships, or investments – such as acquisition integration, termination difficulties or costs, or impairment in recorded value
•Risks associated with being a U.S.-based company with a global business, including commercial, political, and financial risks; local labor policies and conditions; protectionist trade policies, or economic or trade sanctions, including additional retaliatory tariffs on American whiskeys and the effectiveness of our actions to mitigate the negative impact on our margins, sales, and distributors; compliance with local trade practices and other regulations; terrorism; and health pandemics
•Failure to comply with anti-corruption laws, trade sanctions and restrictions, or similar laws or regulations
•Fluctuations in foreign currency exchange rates, particularly a stronger U.S. dollar
•Changes in laws, regulatory measures, or governmental policies – especially those that affect the production, importation, marketing, labeling, pricing, distribution, sale, or consumption of our beverage alcohol products
•Tax rate changes (including excise, corporate, sales or value-added taxes, property taxes, payroll taxes, import and export duties, and tariffs) or changes in related reserves, changes in tax rules or accounting standards, and the unpredictability and suddenness with which they can occur
•Decline in the social acceptability of beverage alcohol in significant markets
•Significant additional labeling or warning requirements or limitations on availability of our beverage alcohol products
•Counterfeiting and inadequate protection of our intellectual property rights
•Significant legal disputes and proceedings, or government investigations
•Cyber breach or failure or corruption of our key information technology systems or those of our suppliers, customers, or direct and indirect business partners, or failure to comply with personal data protection laws
•Our status as a family “controlled company” under New York Stock Exchange rules, and our dual-class share structure
4
Use of Non-GAAP Financial Information. Certain matters discussed in this report, including the information presented in Part II under “Item 7. Management's Discussion and Analysis of Financial Condition and Results of Operations,” include measures that are not measures of financial performance under U.S. generally accepted accounting principles (GAAP). These non-GAAP measures should not be considered in isolation or as a substitute for any measure derived in accordance with GAAP, and also may be inconsistent with similarly titled measures presented by other companies. In Part II under “Item 7. Management's Discussion and Analysis of Financial Condition and Results of Operations,” we present the reasons we use these measures under the heading “Non-GAAP Financial Measures,” and we reconcile these measures to the most closely comparable GAAP measures under the heading “Results of Operations – Year-Over-Year Comparisons.”
PART I
Item 1. Business
Overview
Brown-Forman Corporation (the “Company,” “Brown-Forman,” “we,” “us,” or “our” below) was incorporated under the laws of the State of Delaware in 1933, successor to a business founded in 1870 as a partnership and later incorporated under the laws of the Commonwealth of Kentucky in 1901. We primarily manufacture, distill, bottle, import, export, market, and sell a wide variety of beverage alcohol products under recognized brands. We employ approximately 4,700 people (excluding individuals that work on a part-time or temporary basis) on six continents, including approximately 2,600 people in the United States (approximately 14% of which are represented by a union) and 1,200 people in Louisville, Kentucky, USA, home of our world headquarters. According to International Wine & Spirit Research (IWSR), we are the largest American-owned spirits and wine company with global reach. We are a “controlled company” under New York Stock Exchange rules because the Brown family owns more than 50% of our voting stock. Taking into account ownership of shares of our non-voting stock, the Brown family also controls more than 50% of the economic ownership in Brown-Forman.
For a discussion of recent developments, see “Item 7. Management's Discussion and Analysis of Financial Condition and Results of Operations – Executive Summary.”
5
Brands
Beginning in 1870 with Old Forester Kentucky Straight Bourbon Whisky – our founding brand – and spanning the generations since, we have built a portfolio of more than 40 spirit, ready-to-drink (RTD) cocktail, and wine brands that includes some of the best-known and most loved trademarks in our industry. The most important brand in our portfolio is Jack Daniel's Tennessee Whiskey, which was ranked in the 2020 Interbrand “Best Global Brands” as the most valuable global spirits brand in the world and the third most valuable beverage alcohol brand. Jack Daniel's Tennessee Whiskey is the largest American whiskey brand in the world and the fourth-largest premium spirits brand of any kind, according to Impact Databank's “Top 100 Premium Spirits Brands Worldwide”1 list. Our other leading global brands on the Worldwide Impact list are Finlandia, which is the twelfth-largest-selling vodka; Jack Daniel's Tennessee Honey, which is the second-largest-selling flavored whiskey; and el Jimador, which is the seventh-largest-selling tequila. Woodford Reserve and Old Forester were once again selected for the Impact “Hot Brands”1 list, marking eight and three consecutive years on the list, respectively. Gentleman Jack, Herradura, and Jack Daniel's Tennessee Apple were also named to the “Hot Brands”1 list.
Principal Brands | ||||||||
| Jack Daniel's Tennessee Whiskey | Korbel California Champagnes5 | |||||||
Jack Daniel's RTD2 | Korbel California Brandy5 | |||||||
| Jack Daniel's Tennessee Honey | Herradura Tequilas6 | |||||||
| Gentleman Jack Rare Tennessee Whiskey | Finlandia Vodkas | |||||||
| Jack Daniel's Tennessee Fire | Sonoma-Cutrer California Wines | |||||||
| Jack Daniel's Tennessee Apple | Old Forester Kentucky Straight Bourbon Whisky | |||||||
Jack Daniel's Single Barrel Collection3 | Old Forester Whiskey Row Series | |||||||
| Jack Daniel's Tennessee Rye | Old Forester Kentucky Straight Rye Whisky | |||||||
| Jack Daniel's Winter Jack | GlenDronach Single Malt Scotch Whisky | |||||||
| Jack Daniel's No. 27 Gold Tennessee Whiskey | Benriach Single Malt Scotch Whisky | |||||||
| Jack Daniel's Sinatra Select | Glenglassaugh Single Malt Scotch Whisky | |||||||
| Jack Daniel's Bottled-in-Bond | Chambord Liqueur | |||||||
| Woodford Reserve Kentucky Bourbon | Pepe Lopez Tequila | |||||||
| Woodford Reserve Double Oaked | Antiguo Tequila | |||||||
| Woodford Reserve Kentucky Rye Whiskey | Slane Irish Whiskey | |||||||
| Woodford Reserve Kentucky Straight Malt Whiskey | Fords Gin | |||||||
| Woodford Reserve Kentucky Straight Wheat Whiskey | Coopers' Craft Kentucky Bourbon | |||||||
el Jimador Tequilas4 | Part Time Rangers RTDs7 | |||||||
| el Jimador New Mix RTDs | ||||||||
1Impact Databank, March 2021. | |||||
2Jack Daniel's RTD includes Jack Daniel's & Cola, Jack Daniel's Country Cocktails, Jack Daniel's & Diet Cola, Jack & Ginger, Jack Daniel's Double Jack, Gentleman Jack & Cola, Jack Daniel's American Serve, Jack Daniel's Tennessee Honey RTD, Jack Daniel's Berry, Jack Daniel's Lynchburg Lemonade, and Jack Daniel's Whiskey & Seltzer. | |||||
3The Jack Daniel's Single Barrel Collection includes Jack Daniel's Single Barrel Select, Jack Daniel's Single Barrel Barrel Proof, Jack Daniel's Single Barrel Rye, and Jack Daniel's Single Barrel 100 Proof. | |||||
4el Jimador Tequilas comprise all full-strength expressions of el Jimador. | |||||
5Korbel is not an owned brand. We sell Korbel products under contract in the United States and other select markets. | |||||
6Herradura Tequilas comprise all expressions of Herradura. | |||||
7Acquired in fiscal 2021. | |||||
See “Item 7. Management's Discussion and Analysis of Financial Condition and Results of Operations – Results of Operations – Fiscal 2021 Brand Highlights” for brand performance details.
Our vision in marketing is to be the best brand-builder in the industry. We build our brands by investing in platforms that we believe create enduring connections with our consumers. These platforms cover a wide spectrum of activities, including media advertising (TV, radio, print, outdoor, digital, and social), consumer and trade promotions, sponsorships, and visitors' center programs at our distilleries and our winery. We expect to grow our sales and profits by consistently delivering creative, responsible marketing programs that drive brand recognition, brand trial, brand loyalty, and ultimately, consumer demand around the world.
6
Markets
We sell our products in over 170 countries around the world. The United States, our most important market, accounted for 50% of our net sales in fiscal 2021 and the other 50% were outside of the United States. The table below shows the percentage of total net sales for our largest markets in our three most recent fiscal years:
Percentage of Total Net Sales by Geographic Area | |||||||||||
| Year ended April 30 | |||||||||||
| 2019 | 2020 | 2021 | |||||||||
| United States | 47 | % | 50 | % | 50 | % | |||||
| Australia | 5 | % | 5 | % | 6 | % | |||||
| Germany | 5 | % | 5 | % | 6 | % | |||||
| United Kingdom | 6 | % | 5 | % | 6 | % | |||||
| Mexico | 5 | % | 5 | % | 4 | % | |||||
| Other | 32 | % | 30 | % | 28 | % | |||||
| TOTAL | 100 | % | 100 | % | 100 | % | |||||
Note: Totals may differ due to rounding | |||||||||||
For details about net sales in our largest markets, see “Item 7. Management's Discussion and Analysis of Financial Condition and Results of Operations – Results of Operations – Fiscal 2021 Market Highlights.” For details about our reportable segment and for additional geographic information about net sales and long-lived assets, see Note 17 to the Consolidated Financial Statements in “Item 8. Financial Statements and Supplementary Data.” For details on risks related to our global operations, see “Item 1A. Risk Factors.”
Distribution Network and Customers
Our distribution network, or our “route to consumer” (RTC), varies depending on (a) the laws and regulatory framework for trade in beverage alcohol by market, (b) our assessment of a market's long-term attractiveness and competitive dynamics, (c) the relative profitability of distribution options available to us, (d) the structure of the retail and wholesale trade in a market, and (e) our portfolio's development stage in a market. As these factors change, we evaluate our RTC strategy and, from time to time, adapt our model.
In the United States, which generally prohibits spirits and wine manufacturers from selling their products directly to consumers, we sell our brands either to distributors or to state governments (in states that directly control alcohol sales) that then sell to retail customers and consumers.
Outside the United States, we use a variety of RTC models, which can be grouped into three categories: owned distribution, partner, and government-controlled markets. We own and operate distribution companies in Australia, Brazil, Czechia, France, Germany, Korea, Mexico, Poland, Spain, Thailand, Turkey, and the United Kingdom. In these owned-distribution markets, and in a large portion of the Travel Retail channel, we sell our products directly to retailers or wholesalers. In many other markets, including Italy, Japan, Russia, and South Africa, we rely on third parties to distribute our brands, generally under fixed-term distribution contracts. In Canada, we sell our products to provincial governments. We recently announced our plans to move Belgium and Taiwan to owned distribution in fiscal 2022 and Russia in fiscal 2023.
We believe that our customer relationships are good and our exposure to concentrations of credit risk is limited due to the diverse geographic areas covered by our operations and our thorough evaluation of each customer. In fiscal 2021, our two largest customers were Republic National Distributing Company and Breakthru Beverage Group, which accounted for approximately 19% and 13% of consolidated net sales, respectively. Collectively, these two customers distribute our brands across most of the United States. Although the loss of any large customer for an extended period would reduce our net sales and operating income, we do not anticipate this happening due to consumer demand for our products and our relationships with our customers. No other customer accounted for 10% or more of our consolidated net sales in fiscal 2021.
Seasonality
Holiday buying makes the fourth calendar quarter the peak season for our business. Approximately 30% of our net sales for fiscal 2019, fiscal 2020, and fiscal 2021 were in the fourth calendar quarter of each year.
7
Competition
Trade information indicates that we are one of the largest global suppliers of premium spirits. According to IWSR, for calendar year 2020, the ten largest global spirits companies controlled approximately 20% of the total spirits volume sold around the world. While we believe that the overall market environment offers considerable growth opportunities for us, our industry is, and will remain, highly competitive. We compete against many global, regional, and local brands in a variety of categories of beverage alcohol, but our brands compete primarily in the industry's premium-and-above price points. Our competitors include major global spirits and wine companies, such as Bacardi Limited, Beam Suntory Inc., Becle S.A.B. de C.V., Davide Campari-Milano N.V., Diageo PLC, LVMH Moët Hennessy Louis Vuitton SE, Pernod Ricard SA, and Rémy Cointreau. In addition, particularly in the United States, we compete with national companies and craft spirit brands, many of which entered the market in the last few years.
Brand recognition, brand provenance, quality of product and packaging, availability, flavor profile, and price affect consumers' choices among competing brands in our industry. Other factors also influence consumers, including advertising, promotions, merchandising at the point of sale, expert or celebrity endorsement, social media and word of mouth, and the timing and relevance of new product introductions. Although some competitors have substantially greater resources than we do, we believe that our competitive position is strong, particularly as it relates to brand awareness, quality, availability, and relevance of new product introductions.
Ingredients and Other Supplies
The principal raw materials used in manufacturing and packaging our distilled spirits, liqueurs, RTD products, and wines are shown in the table below.
Principal Raw Materials | ||||||||||||||||||||||||||
| Distilled Spirits | Liqueurs | RTD Products | Wines | Packaging | ||||||||||||||||||||||
| Agave | Flavorings | Flavorings | Grapes | Aluminum cans | ||||||||||||||||||||||
| Barley | Neutral spirits | Malt | Wood | Cartons | ||||||||||||||||||||||
| Corn | Sugar | Neutral spirits | Closures | |||||||||||||||||||||||
| Malted barley | Water | Sugar | Glass bottles | |||||||||||||||||||||||
| Rye | Whiskey | Tequila | Labels | |||||||||||||||||||||||
| Sugar | Wine | Water | PET1 bottles | |||||||||||||||||||||||
| Water | Whiskey | |||||||||||||||||||||||||
| Wood | ||||||||||||||||||||||||||
1Polyethylene terephthalate (PET) is a polymer used in non-glass containers. | |||||
Currently, we are managing through the impact of some global supply chain disruptions and are deploying a number of risk mitigation strategies to address the various constraints on our business. While we are experiencing some supply shortages at this time, we do not view them as significant or to have a material impact on our financial results. From time to time, our agricultural ingredients (agave, barley, corn, grapes, malted barley, rye, and wood) could be adversely affected by weather and other forces out of our control that might constrain supply or reduce our inventory below desired levels for optimum production.
Whiskeys and certain tequilas and other distilled spirits must be aged. Because we must schedule production years in advance to meet projected future demand, our inventories of these products may be larger in relation to sales and total assets than in many other businesses.
For details on risks related to the unavailability of raw materials and the inherent uncertainty in forecasting supply and demand, see “Item 1A. Risk Factors.”
Intellectual Property
Our intellectual property includes trademarks, copyrights, proprietary packaging and trade dress, proprietary manufacturing technologies, know-how, and patents. Our intellectual property, especially our trademarks, is essential to our business. We register our trademarks broadly around the world, focusing primarily on where we sell or expect to sell our products. We protect our intellectual property rights vigorously but fairly. We have licensed some of our trademarks to third parties for use with services or on products other than alcoholic beverages, which enhances the awareness and protection of our brands. Depending on the jurisdiction, trademarks are valid as long as they are in use and/or their registrations are properly maintained. We also have various licenses and distribution agreements for the production, sale, and marketing of our products, and products of others. These licenses and distribution agreements have varying terms and durations.
8
For details on risks related to the protection of our intellectual property, see “Item 1A. Risk Factors.” For details on our most important brands, see “Item 7. Management's Discussion and Analysis of Financial Condition and Results of Operations – Results of Operations – Fiscal 2021 Brand Highlights.”
Regulatory Environment
Federal, state, local, and foreign authorities regulate how we produce, store, transport, distribute, market, and sell our products. Some countries and local jurisdictions prohibit or restrict the marketing or sale of distilled spirits in whole or in part.
In the United States, at the federal level, the Alcohol and Tobacco Tax and Trade Bureau of the U.S. Department of the Treasury regulates the spirits and wine industry with respect to the production, blending, bottling, labeling, advertising, sales, and transportation of beverage alcohol. Similar regulatory regimes exist at the state level and in most non-U.S. jurisdictions where we sell our products. In addition, beverage alcohol products are subject to customs duties, excise taxes, and/or sales taxes in many countries, including taxation at the federal, state, and local level in the United States.
Many countries set their own distilling and maturation requirements; for example, under U.S. federal and state regulations, bourbon and Tennessee whiskeys must be aged in new, charred oak barrels; we typically age our whiskeys at least three years. Mexican authorities regulate the production and bottling of tequilas; they mandate minimum aging periods for extra anejo (three years), anejo (one year), and reposado (two months). Irish whiskey must be matured at least three years in a wood cask, such as oak, on the island of Ireland. Scotch whisky must be matured in oak casks for at least three years in Scotland. We comply with all of the above laws and regulations.
Our operations are subject to various environmental protection statutes and regulations, and our policy is to comply with them.
9
Integrated Strategy and Performance
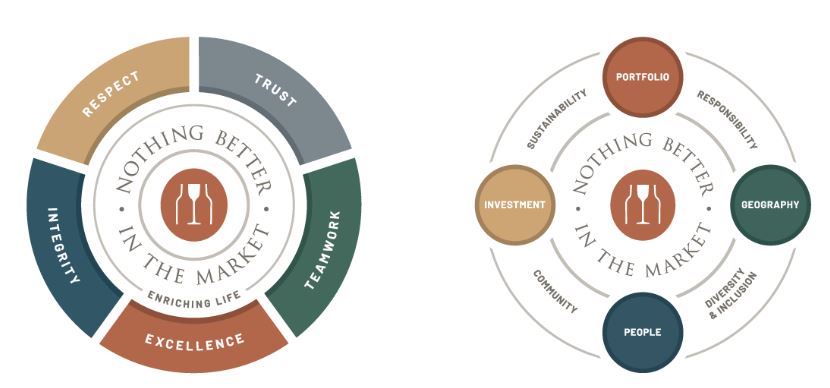
For more than 150 years, Brown-Forman and the Brown family have been committed to driving sustainable growth and preserving Brown-Forman as a thriving, family-controlled, independent company. The image on the left illustrates our core purpose, “Enriching Life,” and our highest ambition, “Nothing Better in the Market,” surrounded by the values that have guided us for decades: integrity, respect, trust, teamwork, and excellence. In addition to these guiding principles, our success is dependent on several strategic priorities, as illustrated in the image on the right: the quality of our brands within our portfolio, our geographic diversification, the caliber of our people, and the return on our investments. Moreover, taking an integrated approach means that many aspects of our company contribute to this value creation and are fundamental to our strategy, including our commitment to environmental sustainability; alcohol and marketing responsibility; diversity, equity and inclusion; and to building communities in which we live and work.
As we celebrated our 150th anniversary, we faced many unforgettable challenges, including a global pandemic and heightened social and racial unrest. Our employees' unique mix of agility, resilience, energy, and compassion enabled us to succeed despite these challenges, and will continue to strengthen us over time. Our values drove decisions throughout this year, and our core purpose of “Enriching Life” and our highest ambition of “Nothing Better in the Market” continue to guide us as we move forward to a reimagined future with a renewed sense of opportunity for what lies ahead. The way we work has changed, and our business has been affected. We continue to prioritize the health, safety, and well-being of our employees and communities while we advance the growth of our brands and business.
This Integrated Annual Report presents not only our financial performance but also our environmental, social, and governance strategies, commitments, and results. It provides a more holistic view of Brown-Forman, our culture, our strategic approach to our business, and how we achieve results.
Portfolio and Responsibility
We seek to build brands and create shareholder value responsibly by delivering strong and sustainable growth, solid margins, and high returns on invested capital. We focus on building brands that can be meaningful for our company and our consumers over the longer term. We aim to grow our premium spirits portfolio both organically and through innovation. Opportunistically and thoughtfully, we also consider acquisitions and partnerships that will enhance our capacity to deliver meaningful growth, improve margins, and increase shareholder returns.
We strive to grow our brands and enhance consumers' experience with them. Even as we do so, we remain committed to marketing our brands responsibly and promoting responsible drinking. Regulation of our industry is not new, and external interest from the World Health Organization and other health bodies has grown over time. We uphold high standards of self-regulation by adhering to industry guidelines on responsible marketing and advertising. We work both independently and with industry organizations to promote alcohol responsibility, such as the International Alliance for Responsible Drinking, the Foundation for Advancing Alcohol Responsibility (responsibility.org) in the United States, The Portman Group in the United Kingdom, DrinkWise in Australia, and FISAC in Mexico.
10
The Jack Daniel's family of brands, led by Jack Daniel's Tennessee Whiskey (JDTW), is our most valuable asset – the engine of our overall financial performance and the foundation of our leadership position in the American whiskey category.1 We strive to strengthen the brand's leadership, and will always work to keep JDTW relevant to consumers worldwide, while pursuing the opportunities to grow the Jack Daniel's family of brands across markets, premium-and-above price points, channels, and consumer groups. Product innovation continues to contribute meaningfully to our performance. Different Jack Daniel's expressions have brought new consumers to the franchise, including Honey (2011), Fire (2015), Rye (2017), and our most recent launch, Jack Daniel's Tennessee Apple (2019), which individually and collectively add great value to the company and to our consumers the world over.
In addition to the leadership of our Jack Daniel's family of brands, we expect strong worldwide growth from our other whiskey brands, particularly Woodford Reserve and Old Forester. Woodford Reserve is the leading super-premium American whiskey globally1, growing volumes at a strong double-digit compound annual growth rate since the brand was introduced 24 years ago, and is approaching 1.3 million nine-liter cases of annual volume as of April 30, 2021. We believe the brand is poised for continued growth as the bourbon category continues to grow around the world. Old Forester has continued its return to prominence in the United States and in select international markets through its unparalleled taste and quality. Innovation has played an important role in the premiumization of both of these brands, including the success of high-end expressions such as Woodford Double Oaked and the Old Forester Whiskey Row Series.
Outside of our American whiskey brands, we believe our portfolio remains well positioned in other high-growth categories with meaningful premium brands and a focus on accelerating our super-premium portfolio. Our tequila portfolio is led by two brands steeped in Mexican heritage, Herradura and el Jimador. Despite the cyclical cost pressures resulting from the unprecedented cost of agave, we remain pleased with the growth of our tequila business in the United States and the long-term growth prospects of this business globally. We believe that our Scotch whiskies GlenDronach, Benriach, and Glenglassaugh, and our Irish whiskey Slane, are well-positioned in their respective categories. We expect them all to become meaningful contributors over the longer term. Lastly, we believe our acquisition in the summer of 2019, Fords Gin, provides access to the premium gin category, particularly in the United States, and we look to grow this brand in key gin markets globally.
Fiscal 2021 was a year of significant growth for our RTD portfolio. Jack Daniel's RTDs sold over 12 million nine-liter cases globally, and in Mexico, our el Jimador tequila-based RTD, New Mix, crossed the 8 million nine-liter case milestone. In calendar 2020 we introduced Jack Daniel's Can Cocktails in the United States and also announced a new partnership with Pabst Brewing Company for the supply, sales, and distribution of Jack Daniel's Country Cocktails in this important market. In December 2020, we acquired Part Time Rangers, a line of low-calorie, spirit-based RTDs with natural fruit flavorings. Part Time Rangers is based in New Zealand, and we believe it will help us grow our RTD portfolio in that country, Australia, and potentially beyond.
Part of building all of our brands and engaging our employees is through education, including resources and training on alcohol responsibility – what it means, how to be a good host/hostess, respecting the choice not to drink, preventing drunk/drink driving, and providing support for those in recovery. Pause, our internal campaign launched in the summer of 2019, seeks to elevate responsibility, raise awareness, and empower mindful choices from our employees. Through a partnership with Alteristic, we have taken an additional step to offer training to bartenders and employees on bystander intervention to help prevent sexual assault.
Geography
The United States remains our largest market, and continued growth there is important to our long-term success. We expect to foster this growth by emphasizing fast-growing spirits categories, continued product and packaging innovation, and brand building within growing consumer segments. This includes increasing emphasis on inclusive, digital, and integrated marketing and the growth of our e-commerce capabilities to better connect and engage with consumers where they are.
Outside the United States, we continue to increase our competitiveness through improved routes to consumer. In May 2020, we established our owned-distribution organization in our fourth-largest market, the United Kingdom. In addition, we set up owned distribution in Thailand in 2020, and recently announced our plans to move Belgium and Taiwan to owned distribution in fiscal 2022 and Russia in fiscal 2023. More direct connection with customers and consumers enabled through owned distribution is an important part of our strategic growth.
1IWSR, 2020. | |||||
11
The COVID-19 pandemic has impacted our global markets differently. While recovery will also be varied, we expect increasing contributions to our long-term future growth from emerging markets, including Brazil, China, India, Mexico, Poland, Russia, and Southeast Asia.
People, Diversity & Inclusion, and Ethics & Compliance
As we work to increase our brands' relevance and appeal to diverse consumer groups around the world, we believe a diversity of experiences and mindsets within our own workforce is essential. In the summer of 2019, we unveiled Many Spirits, One Brown-Forman: Gender and Race Edition, our 2030 Diversity & Inclusion Strategy aimed at creating a foundation from which to build a more diverse workforce and inclusive culture. In the summer of 2020, we developed and published commitments to be better and do better1 – to live our value of respect, educate ourselves more fully on what it means to be anti-racist, identify and eliminate barriers to inclusion, create an environment where all employees can bring their best selves to work, and extend our commitment more deeply in our communities, especially our hometown of Louisville, Kentucky. We believe these actions will help us continue to build an equitable, inclusive culture at Brown-Forman. In recognition of our need to be better and do better as neighbors and as corporate citizens, the Brown-Forman Foundation focused more deeply on advancing educational opportunities in west Louisville. Support included donations to organizations focused on child development, college and career preparation, teacher education, technology training for students and parents, social services, and success coaching.
Our vision is to create an environment where leveraging diversity and inclusion occurs naturally, giving us a sustainable marketplace advantage. We have set race and gender ambitions to have at least 50% women in professional- and leader-level roles globally, 40% women in senior leadership positions globally, and 25% people of color in our United States workforce by 2030. We have also set a goal to reach 16% of our supplier spend in locations such as the United States, the United Kingdom, and Australia, with businesses that are woman- or minority-owned by 2030. For more than a decade, we have earned a perfect score in the Corporate Equality Index2, a national benchmarking survey and report on corporate policies and practices related to LGBTQ workplace equality administered by the Human Rights Campaign Foundation.
One of the main drivers of an inclusive culture is the continued growth and leadership of our ten Employee Resource Groups (ERGs). We believe ERGs are instrumental in enriching our company's culture, and our employees experience this by supporting development and engagement of our diverse workforce, driving cultural awareness and competency across the organization, and enabling authentic engagement with our consumers. Our ERGs also create safe spaces for our employees and their allies to connect with, support, and advocate for one another.
We know that this strong employee culture and our commitment to the communities where we live and work also helps foster a sense of engagement among our employees. During the COVID-19 pandemic, we conducted an employee survey to evaluate the company's response and better understand employee experiences navigating the challenging environment. The results highlighted our resilience and confirmed that together, we took many of the right steps in responding to this situation – communicating frequently and openly and supporting each other by caring and collaborating. This reaffirms that our values will always guide us along the right path, including the shift from crisis management into a new phase of recovery and reimagining the future.
Our core values of integrity, respect, trust, teamwork, and excellence form the foundation of our ethics and compliance program. “Values Drive Decisions” is the key theme of this program and we use it to teach our employees to rely on our values when faced with a difficult decision and to “speak up” if they believe they, a colleague, or a business partner may have violated the law, our Code of Conduct, or company policy. We offer a third-party service, accessible from an external website, to employees and others who wish to “speak up” anonymously.
We convey our compliance expectations to employees via our Code of Conduct, and all employees certify annually that they will comply with the Code of Conduct and report a potential violation. The Code of Conduct is a toolkit for employees, as it details expectations for 18 different risks, includes links to Q&A, policies, training and the ability to contact a subject-matter expert. Our Code of Conduct and certification is refreshed annually and translated into 12 languages.
1Brown-Forman Be Better, Do Better at www.brown-forman.com/be_better_do_better | |||||
2Human Rights Campaign 2021 Corporate Equality Index at www.hrc.org/cei | |||||
12
Investment and Sustainability
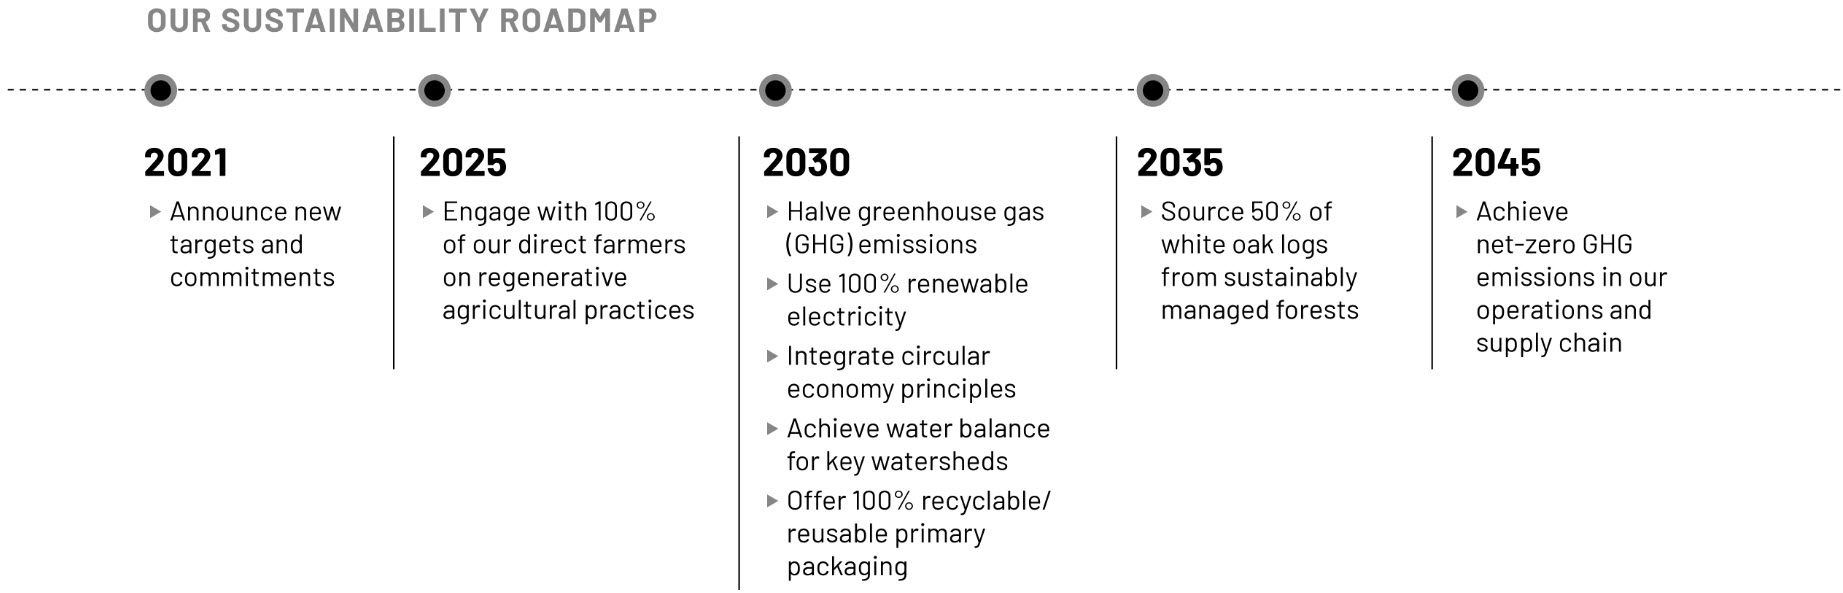
One thing we have learned over more than a century and a half is that long-term success requires investment and a mindset of sustainability. We understand the need to invest in our brands, production facilities, homeplace and visitor centers, and aging inventory. For example, this past year, our Board of Directors approved a $125 million capital investment to expand our bourbon-making capacity in Kentucky to meet anticipated future consumer demand. We also understand the importance of investing in our people, communities, and the environment. We recognize that climate change is a business issue with risks and opportunities. As such, we are committed to actions that will ensure the long-term health of the planet and our business. In fiscal 2021, we established a new 2030 Sustainability Strategy that is intended to align our efforts with industry best practices and the most current climate science. Our new goals broaden our focus beyond business operations to include our supply chain, where the majority of our environmental footprint resides. With this new strategy, we have a roadmap for continued progress over the next quarter-century.
Our recent investments in renewable energy and resource stewardship underscore our long-term focus:
• Wind: Our wind power project, which became operational in April 2020, provides a renewable energy source that offsets more than 90% of our electricity usage in the United States.
• Solar: Jack Daniel's recently announced a partnership to provide our Lynchburg distillery with 20 megawatts of solar energy. The agreement will provide nearly three-quarters of the distillery's electricity needs, and makes Jack Daniel's the first distillery to participate in Tennessee Valley Authority's Green Invest Program.
• Watersheds: To manage water risk, we have completed watershed risk assessments to evaluate watersheds we operate in that are considered at-risk or business critical. Following the assessments, we have begun to develop multi-year mitigation plans to address risk.
• Waste: In 2020, we were pleased to achieve our zero-waste-to-landfill (defined as sending less than 1% to landfill) goal across our production facilities. Our next priority is to integrate circular economy principles into our business that will allow us to go beyond zero-waste to a regenerative approach where resources are continually reused.
We believe we are better positioned than ever to deliver exceptional high-quality products to our consumers around the world. We have a highly capable and engaged workforce. We have developed brand-building capabilities by equipping our teams with the training and tools necessary for an increasingly data-driven digital global marketplace. Among other trends, the expansion of the digital economy accelerated significantly as consumers, businesses, and communities adapted to the challenges brought on by the COVID-19 pandemic. To continue our success in how we market and sell our brands, we announced in fiscal 2021 an investment in a new Integrated Marketing Communications organization that we believe will further enhance our ability to win in the digital economy.
Community
In addition to the investments we make in our employees, we believe it is vital that we give back to the communities that support both our employees and our company by thoughtfully deploying our time, talent, and resources. We have been a proud corporate citizen of our hometown of Louisville, Kentucky, since we were founded. Being a good neighbor is something we strive for wherever we operate, and our expanded focus and commitment to the neighborhood around our corporate campus
13
meets this call to be the best neighbor we can be in an area that has experienced the effects of underinvestment and systemic racism.
We also continue to expand our civic engagement into Brown-Forman global office locations, allowing those employees closest to the needs of their communities to decide how to invest their charitable-giving resources. We leverage our key community relations partners to stay informed of collaborative opportunities in the communities where we work and live, and to shape our charitable-giving strategy to meet the essential needs of the communities that sustain us. We provide charitable donations and our employees volunteer throughout our communities, including 115 serving on 201 nonprofit boards in the United States. The Brown-Forman Foundation (the Foundation) was created in fiscal 2018 with the goal of helping fund our ongoing philanthropic endeavors. The Foundation's earnings provide a consistent source of revenue for charitable giving independent of our annual earnings. We work to partner with organizations that support our key focus areas: empowering responsible and sustainable living, ensuring essential living standards, and enhancing arts and cultural living. In fiscal 2021, we committed to a $20 million investment in the Foundation, which will allow us to further support community-building in our hometown of Louisville, Kentucky.
We believe that having a long-term-focused, committed, and engaged shareholder base, anchored by the Brown Family, gives us a distinct strategic advantage, particularly in a business with multi-generational brands and products that must be aged. We are committed to continually improving our environmental, social, and governance performance and acting upon our deeply held values. Recognizing the strong cash-generating capacity and the capital efficiency of our business, we will continue to pursue top-tier shareholder return through shareholder-friendly capital allocation and socially and environmentally conscious investments to fuel long-term growth.
Human Capital Resources
Overview: Culture of Care
We put our values at the forefront of all our decisions and actions, ensuring our employees feel respected, safe, and supported so they can make, market, and sell our products with the finest craftsmanship, quality, and care. What enables our success are the 4,700 people (excluding individuals that work on a part-time or temporary basis) we employ in 43 countries around the world. This includes approximately 3,100 salaried employees and 1,600 hourly employees, with the largest percentage of our employees residing within the United States, Mexico, and the United Kingdom. We believe our employee relations are good and our turnover rate is low.
COVID-19 Response
Shortly after the global pandemic began, we shifted nearly all global salaried employees to a virtual working environment and safely maintained our essential production operations. In the first 90 days of this new way of working, we surveyed our salaried employees to ensure their virtual working conditions were enabling productivity and that they were receiving the appropriate amount of support during this challenging time. We also tracked the well-being of our essential workers, those who remained on-site to make, bottle, and ship our products. Site supervisors collected weekly qualitative data from their respective production teams from mid-March through June. This enabled production leaders to more quickly surface, address, monitor, and track any issues related to morale and the health and safety of our front-line employees.
Additionally, as the effects of the pandemic lingered, we hosted numerous Mental Health Huddles, sessions designed to encourage our employees to attend to their mental well-being with the same intentionality as their physical health. We also invested in, and expanded access to, mental well-being resources globally. Our commitment to providing mental health resources will continue in our post-pandemic workplace.
Diversity & Inclusion
In the summer of 2019, we launched Many Spirits, One Brown-Forman: Gender and Race Edition, our 2030 Diversity and Inclusion Strategy. This strategy highlights the critical importance of a diverse, inclusive workforce and provides a framework for us to build initiatives and programs that will support our gender and race ambitions. In fiscal 2021, we added several new policies to support a diverse workforce, including changes to our global talent acquisition and executive compensation processes. For example, in the United States, we will strive to have more diverse interview slates.
Additionally, in fiscal 2021, we introduced a new component in our short-term incentive compensation for our Executive Leadership Team whereby 10% of their short-term incentive compensation is based on progress towards achieving our diversity and inclusion priorities.
We have set gender and race ambitions to have at least 50% women in professional- and leader-level roles globally, 40% women in senior leadership positions globally, and 25% people of color in our United States salaried workforce by 2030.
14
Learning & Development
The professional growth and development of our people is critically important to our success. During fiscal 2021, most of our employees worked from home, limiting our ability to offer the in-person learning and development programs we relied on in the past.
To meet the development needs of our workforce, we introduced a range of virtual learning options. This included a new virtual learning catalog with more than 3,000 titles covering a range of business topics and weekly offerings about our brands, business, and values.
During the year, we launched “Getting Started @ B-F” as our new digital onboarding solution to guide new hires through the initial learning they need to succeed at Brown-Forman. This onboarding experience includes “Grain to Glass” – our virtual immersive orientation solution where employees learn more about our business strategy, portfolio, routes-to-market, and heritage.
Over the last several years, we have developed extensive leadership training programs covering all levels of management, including executives. During fiscal 2021, we converted our key leadership training programs, including our Business Leader Program, People Leader Program, and Leader Transition Experience, to virtual learning, continuing the momentum we established before the pandemic.
For our executives, we developed and launched a new program called the Inclusive Leadership Program, designed to inspire and equip leaders to support our commitment to build a more inclusive company and culture. This is a six-month blended learning program with a mix of e-learning, live virtual sessions, and small group discussions.
Engagement & Enablement
We regularly survey our employees regarding engagement and enablement. Our most recent survey, conducted in October 2019, indicated that our employees are highly engaged and enabled when compared to benchmark used by our third-party administrator. Throughout the year, we analyzed this data by functions, leaders, geographies, and demographics. We continually mine this survey, looking for opportunities for growth and improvement. In addition to this internal affirmation, we received numerous external workplace accolades in Brazil, France, Germany, India, Mexico, Spain, the United Kingdom, and the United States.
15
Executive Officers
Information about Our Executive Officers
The following persons served as executive officers as of June 21, 2021:
| Name | Age | Principal Occupation and Business Experience | ||||||
| Lawson E. Whiting | 52 | President and Chief Executive Officer since 2019. Executive Vice President and Chief Operating Officer from 2017 to 2018. Executive Vice President and Chief Brands and Strategy Officer from 2015 to 2017. Senior Vice President and Chief Brands Officer from 2013 to 2015. Senior Vice President and Managing Director for Western Europe from 2011 to 2013. Vice President and Finance Director for Western Europe from 2010 to 2011. Vice President and Finance Director for North America from 2009 to 2010. | ||||||
| Jane C. Morreau | 62 | Executive Vice President and Chief Financial Officer since 2014. Senior Vice President, Chief Production Officer and Head of Information Technology from 2013 to 2014. Senior Vice President and Director of Financial Management, Accounting, and Technology from 2008 to 2013. | ||||||
| Matthew E. Hamel | 61 | Executive Vice President, General Counsel and Secretary since 2007. | ||||||
| Alejandro A. Alvarez | 53 | Senior Vice President, Chief Production and Sustainability Officer since 2019. Senior Vice President, Chief Production Officer from 2014 to 2019. Vice President and General Manager for Brown-Forman Tequila Mexico Operations from 2008 to 2014. | ||||||
| Matias Bentel | 46 | Senior Vice President and Chief Brands Officer since 2020. Senior Vice President and Managing Director of Jack Daniel's Family of Brands from 2018 to 2019. Vice President and General Manager of Mexico from 2016 to 2018. Vice President Latin America Marketing and Chief of Staff from 2009 to 2016. | ||||||
| Kelli N. Brown | 51 | Senior Vice President and Chief Accounting Officer since 2018. Vice President and Director Finance (North America Region) from 2015 to 2018. Director NAR Division Finance (North America Region) from 2013 to 2015. Director Business Planning and Analytics (North America Region) from 2012 to 2013. | ||||||
| Ralph E. de Chabert | 74 | Senior Vice President, Chief Diversity Inclusion and Global Community Relations Officer since 2019. Senior Vice President and Chief Diversity Officer from 2007 to 2019. | ||||||
| Marshall B. Farrer | 50 | Senior Vice President, President, Europe since 2020. Senior Vice President, Managing Director, Global Travel Retail and Developed APAC Region from 2018 to 2020. Senior Vice President, Managing Director, Global Travel Retail from 2015 to 2018. Vice President, Managing Director, Jack Daniel's Tennessee Honey from 2014 to 2015. Vice President, Managing Director, Australia/New Zealand region from 2010 to 2014. Vice President, Director, Latin America & Caribbean region from 2006 to 2009. | ||||||
| Kirsten M. Hawley | 51 | Senior Vice President, Chief People, Places, and Communications Officer since May 2021. Senior Vice President, Chief Human Resources and Corporate Communications Officer from 2019 to 2021. Senior Vice President and Chief Human Resources Officer from 2015 to 2019. Senior Vice President and Director of Human Resources Business Partnerships from 2013 to 2015. Vice President and Director of Organization and Leader Development from 2011 to 2013. Assistant Vice President and Director of Employee Engagement from 2009 to 2011. | ||||||
| John V. Hayes | 61 | Senior Vice President, President, U.S.A. and Canada since 2018. Senior Vice President, Chief Marketing Officer of Brown-Forman Brands from 2015 to 2018. Senior Vice President, Managing Director Jack Daniel's from 2011 to 2015. Senior Vice President, Managing Director Herradura from 2007 to 2011. | ||||||
| Thomas W. Hinrichs | 59 | Senior Vice President, President, Emerging International since 2020. Senior Vice President, President, International Division from 2018 to 2020. Senior Vice President and President for Europe, North Asia, and ANZSEA from 2015 to 2018. Senior Vice President and Managing Director for Europe from 2013 to 2015. Senior Vice President and Managing Director for Greater Europe and Africa from 2006 to 2013 | ||||||
Available Information
Our website address is www.brown-forman.com. Our annual reports on Form 10-K, quarterly reports on Form 10-Q, current reports on Form 8-K, and any amendments to these reports are available free of charge on our website as soon as reasonably practicable after we electronically file those reports with the Securities and Exchange Commission (SEC). The information provided on our website, and any other website referenced herein, is not part of this report, and is therefore not incorporated by reference into this report or any other filing we make with the SEC, unless that information is otherwise specifically incorporated by reference.
On our website, we have posted our Code of Conduct that applies to all our directors and employees, and our Code of Ethics that applies specifically to our senior financial officers. If we amend or waive any of the provisions of our Code of
16
Conduct or our Code of Ethics applicable to our principal executive officer, principal financial officer, or principal accounting officer that relates to any element of the definition of “code of ethics” enumerated in Item 406(b) of Regulation S-K under the Securities Exchange Act of 1934 Act, as amended, we intend to disclose these actions on our website. We have also posted on our website our Corporate Governance Guidelines and the charters of our Audit Committee, Compensation Committee, Corporate Governance and Nominating Committee, and Executive Committee of our Board of Directors. Copies of these materials are also available free of charge by writing to our Secretary at 850 Dixie Highway, Louisville, Kentucky 40210 or emailing [email protected].
Item 1A. Risk Factors
We believe the following discussion identifies the material risks and uncertainties that could adversely affect our business. If any of the following risks were actually to occur, our business, results of operations, cash flows, or financial condition could be materially and adversely affected. Additional risks not currently known to us, or that we currently deem to be immaterial, could also materially and adversely affect our business, results of operations, cash flows, or financial condition.
Risks Related to Our Business and Operations
Our business performance is substantially dependent upon the continued health of the Jack Daniel's family of brands.
The Jack Daniel's family of brands is the primary driver of our revenue and growth. Jack Daniel's is an iconic global trademark with a loyal consumer fan base, and we invest much effort and many resources to protect and preserve the brand's reputation for authenticity, craftsmanship, and quality. A brand's reputational value is based in large part on consumer perceptions, and even an isolated incident that causes harm – particularly one resulting in widespread negative publicity – could adversely influence these perceptions and erode consumer trust and confidence in the brand. Significant damage to the brand equity of Jack Daniel's would adversely affect our business. Given the importance of Jack Daniel's to our overall success, a significant or sustained decline in volume or selling price of our Jack Daniel's products, as a result of negative publicity or otherwise, would have a negative effect on our financial results. Additionally, should we not be successful in our efforts to maintain or increase the relevance of the Jack Daniel's brand to current and future consumers, our business and operating results could suffer. For details on the importance of the Jack Daniel's family of brands to our business, see “Item 7. Management's Discussion and Analysis of Financial Condition and Results of Operations - Results of Operations - Fiscal 2021 Brand Highlights.”
We face substantial competition in our industry, including many new entrants into spirits; consolidation among beverage alcohol producers, distributors, wholesalers, suppliers, and retailers, or changes to our route-to-consumer models, could hinder the marketing, sale, or distribution of our products.
We use various business models to market and distribute our products in different countries around the world. In the United States, we sell our products either to distributors for resale to retail outlets or e-commerce retailers or, in those states that control alcohol sales, to state governments who then sell them to retail customers and consumers. In our non-U.S. markets, we use a variety of route-to-consumer models – including, in many markets, reliance on others to market and sell our products. Consolidation among spirits producers, distributors, wholesalers, suppliers, or retailers and the increased growth and popularity of the e-commerce environment across the consumer product goods market, which has accelerated during the COVID-19 pandemic and the resulting quarantines, “stay at home” orders, travel restrictions, retail store closures, social distancing requirements, and other government action, could create a more challenging competitive landscape for our products. Consolidation at any level could hinder the distribution and sale of our products as a result of reduced attention and resources allocated to our brands both during and after transition periods, because our brands might represent a smaller portion of the new business portfolio. Furthermore, consolidation of distributors may lead to the erosion of margins as newly consolidated distributors take down prices. Changes in distributors' strategies, including a reduction in the number of brands they carry, the allocation of shelf space for our competitors' brands, or private label products, may adversely affect our growth, business, financial results, and market share. Expansion into new product categories by other suppliers, or innovation by new entrants into the market, could increase competition in our product categories. For example, we have observed an increase in diversification by various consumer goods companies such as the entrance of both traditional beer and soft drink companies into the RTD market and the entrance of both beer and spirits companies into the cannabis market – expanding the potential for competition in the spirits market from various sectors of the consumer goods industry.
Changes to our route-to-consumer models or partners in important markets could result in temporary or longer-term sales disruption, could result in higher costs, and could negatively affect other business relationships we might have with that partner. Disruption of our distribution network or fluctuations in our product inventory levels at distributors, wholesalers, or retailers could negatively affect our results for a particular period. Further, while we believe we have sufficient scale to succeed relative to our major competitors, we nevertheless face a risk that continuing consolidation of large beverage alcohol companies could put us at a competitive disadvantage.
17
Our competitors may respond to industry and economic conditions and shifts in consumer behaviors more rapidly or effectively than we do. To remain competitive, we must be agile and efficient in the adoption of digital technologies, the building of analytical capabilities, and the scaling of brand expense investment levels, particularly following the COVID-19 pandemic, which our competitors may be able to achieve with more agility and resources. Other suppliers, as well as wholesalers and retailers of our brands, offer products that compete directly with ours for shelf space, promotional displays, and consumer purchases. Pricing (including price promotions, discounting, couponing, and free goods), marketing, new product introductions, entry into our distribution networks, and other competitive behavior by other suppliers, and by wholesalers and traditional and e-commerce retailers, could adversely affect our growth, business, and financial results. While we seek to take advantage of the efficiencies and opportunities that large retail customers can offer, they often seek lower pricing and purchase volume flexibility, offer competing private label products, and represent a large number of other competing products. If the buying power of these large retail customers continues to increase, it could negatively affect our financial results.
Changes in consumer preferences and purchases, any decline in the social acceptability of our products, or governmental adoption of policies disadvantageous to beverage alcohol could negatively affect our business results.
We are a branded consumer products company in a highly competitive market, and our success depends substantially on our continued ability to offer consumers appealing, high-quality products. Consumer preferences and purchases may shift, often in unpredictable ways, or rapidly as a result of the COVID-19 pandemic or other factors, including health and wellness trends; changes in economic conditions, demographic, and social trends; public health policies and initiatives; changes in government regulation of beverage alcohol products; concerns or regulations related to product safety; legalization of cannabis and its use on a more widespread basis within the United States, Canada, or elsewhere; and changes in trends related to travel, leisure, dining, gifting, entertaining, and beverage consumption trends. Consumers may begin to shift their consumption and purchases of our premium and super-premium products, more commonly found in on-premise establishments, in favor of off-premise purchases or away from alcoholic beverages entirely. This includes consumption at home as a result of various factors, including shifts in social trends as well as shifts to purchases of our products to e-commerce retailers. These shifts in consumption and purchasing channels, which could adversely impact our profitability, have accelerated during the COVID-19 pandemic and the resulting quarantines, “stay at home” orders, travel restrictions, retail, restaurant, bar, and hotel closures, social distancing requirements, and other government action. Consumers also may begin to prefer the products of competitors or may generally reduce their demand for brands produced by larger companies. Over the past several years, the number of small, local distilleries in the United States has grown significantly. This is being driven by a trend of consumers showing increasing interest in locally produced, regionally sourced products. As more brands enter the market, increased competition could negatively affect demand for our premium and super-premium American whiskey brands, including Jack Daniel's. In addition, we could experience unfavorable business results if we fail to attract consumers from diverse backgrounds and ethnicities in all markets where we sell our products. To continue to succeed, we must anticipate or react effectively to shifts in demographics, consumer behavior, consumer preferences, drinking tastes, and drinking occasions.
Our long-term plans call for the continued growth of the Jack Daniel's family of brands. In particular, we plan to continue to expand sales of Jack Daniel's Tennessee Apple. If these plans do not succeed, or if we otherwise fail to develop or implement effective business, portfolio, and brand strategies, our growth, business, or financial results could suffer. More broadly, if consumers shift away from spirits (particularly brown spirits such as American whiskey and bourbon), our premium-priced brands, or our ready-to-drink products, our financial results could be adversely affected.
We believe that new products, line extensions, label and bottle changes, product reformulations, and similar product innovations by both our competitors and us will compete increasingly for consumer drinking occasions. Product innovation, particularly for our core brands, is a significant element of our growth strategy; however, there can be no assurance that we will continue to develop and implement successful line extensions, packaging, formulation or flavor changes, or new products.
Unsuccessful implementation or short-lived popularity of our product innovations could result in inventory write-offs and other costs, reduction in profits from one year to the next, and also could damage consumers' perception of our brand family. Our inability to attract consumers to our product innovations relative to our competitors' products – especially over time – could negatively affect our growth, business, and financial results.
Production facility disruption could adversely affect our business.
Some of our largest brands, including Jack Daniel's and our tequilas, are distilled at single locations. A catastrophic event causing physical damage, disruption, or failure at any one of our major distillation or bottling facilities, including facilities that support the production of our premium brands such as Woodford Reserve and Old Forester, could adversely affect our business. Further, because whiskeys and some tequilas are aged for various periods, we maintain a substantial inventory of aged and maturing products in warehouses at a number of different sites. The loss of a substantial amount of aged inventory – through fire, other natural or man-made disaster, contamination, or otherwise – could significantly reduce the supply of the affected
18
product or products. A consequence of any of these or other supply or supply chain disruptions, including the temporary inability to produce our products due to the closure or lower production levels at one or more of our major distillation or bottling facilities, or at our suppliers as a result of COVID-19, could prevent us from meeting consumer demand for the affected products for a period of time in the near-term as well as in the long-term due to the nature of our aged products. Disaster recovery plans may not prevent business disruption, and reconstruction of any damaged facilities could require a significant amount of time.
The inherent uncertainty in supply/demand forecasting could adversely affect our business, particularly with respect to our aged products.
There is an inherent risk of forecasting imprecision in determining the quantity of aged and maturing products to produce and hold in inventory in a given year for future sale. The forecasting strategies we use to balance product supply with fluctuations in consumer demand may not be effective for particular years or products. For example, in addition to our American and Irish whiskeys and some tequilas, which are aged for various periods, our Scotch whisky brands, including GlenDronach, Benriach, and Glenglassaugh, require long-term maturation – on average of 12 years with limited releases of 30 years or more – making forecasts of demand for such products in future periods subject to significant uncertainty. Our tequila supply is also dependent on the growth cycle of our agave plants which take approximately seven years to reach maturity, requiring us to make forecasts of demand for our tequilas over a long-time horizon to determine in advance how much agave to plant. Factors that affect our ability to forecast accurately include changes in business strategy, market demand, consumer preferences, macroeconomic conditions, introductions of competing products, and other changes in market conditions. Any forecasting error could lead to our inability to meet the objectives of our business strategy, failure to meet future demand, or a future surplus of inventory and consequent write-down in value of raw materials. If we are unable to accurately forecast demand for our products or efficiently manage inventory, this may have a material adverse effect on our business and financial results. Further, we cannot be certain that we will be successful in using various levers, such as pricing changes, to create the desired balance of available supply and consumer demand for particular years or products. As a consequence, we may be unable to meet consumer demand for the affected products for a period of time. Furthermore, not having our products in the market on a consistent basis may adversely affect our brand equity and future sales.
Higher costs or unavailability of water, raw materials, product ingredients, or labor could adversely affect our financial results.
Our products use materials and ingredients that we purchase from suppliers. Our ability to make and sell our products depends upon the availability of the raw materials, product ingredients, finished products, wood, glass and PET bottles, cans, bottle closures, packaging, and other materials used to produce and package them. Without sufficient quantities of one or more key materials, our business and financial results could suffer. For instance, only a few glass producers make bottles on a scale sufficient for our requirements, and a single producer supplies most of our glass requirements. In addition, if we were to experience a disruption in the supply of American white oak logs or steel to produce the new charred oak barrels in which we age our whiskeys, our production capabilities would be compromised. If any of our key suppliers were no longer able to meet our timing, quality, or capacity requirements, ceased doing business with us, or significantly raised prices, and we could not promptly develop alternative cost-effective sources of supply or production, our operations and financial results could suffer. For example, in connection with the COVID-19 pandemic, we experienced disruptions in our manufacturing operations and supply chain related to raw material delays with respect to our neutral spirits supplier in France. We have also experienced supply chain disruptions in connection with the availability of both glass and timely modes of transportation to ship our products globally. The COVID-19 pandemic could continue to adversely affect our ability to manufacture our products, including due to illness, quarantines, “stay at home” orders, social distancing requirements, and other government actions.
Higher costs or insufficient availability of suitable grain, agave, water, grapes, wood, glass, closures, and other input materials, or higher associated labor costs or insufficient availability of labor, may adversely affect our financial results. Similarly, when energy costs rise, our transportation, freight, and other operating costs, such as distilling and bottling expenses, also may increase. Our freight cost and the timely delivery of our products could be adversely affected by a number of factors that could reduce the profitability of our operations, including driver or equipment shortages, higher fuel costs, weather conditions, traffic congestion, shipment container availability, rail shut down, increased government regulation, and other matters. Our financial results may be adversely affected if we are not able to pass along energy and freight cost increases through higher prices to our customers without reducing demand or sales.
International or domestic geopolitical or other events, including the imposition of any tariffs or quotas by governmental authorities on any raw materials that we use in the production of our products, could adversely affect the supply and cost of these raw materials to us. If we cannot offset higher raw material costs with higher selling prices, increased sales volume, or reductions in other costs, our profitability could be adversely affected.
19
Weather, the effects of climate change, fires, diseases, and other agricultural uncertainties that affect the mortality, health, yield, quality, or price of the various raw materials used in our products also present risks for our business, including in some cases potential impairment in the recorded value of our inventory. Climate change could also affect the maturation and yield of our aged inventory over time. Changes in weather patterns or intensity can disrupt our supply chain as well, which may affect production operations, insurance costs and coverage, and the timely delivery of our products.
Water is an essential component of our products, so the quality and quantity of available water is important to our ability to operate our business. If extended droughts become more common or severe, or if our water supply were interrupted for other reasons, high-quality water could become scarce in some key production regions for our products, including Tennessee, Kentucky, California, Finland, Mexico, Scotland, and Ireland, which in turn could adversely affect our business and financial results.
Our business faces various risks related to health epidemics and pandemics, including the COVID-19 pandemic and similar outbreaks, that could materially and adversely affect our business, our operations, our cash flows, and our financial results.
Our business, operations, cash flows, and financial results have been impacted and will likely continue to be impacted by health epidemics, pandemics, and similar outbreaks, such as the COVID-19 pandemic. The COVID-19 pandemic has had and could continue to have negative impacts, such as (a) a global or U.S. recession or other economic crisis; (b) credit and capital markets volatility (and access to these markets, including by our suppliers and customers); (c) volatility in demand for our products; (d) changes in accessibility to our products due to illness, quarantines, “stay at home” orders, travel restrictions, retail, restaurant, bar, and hotel closures, social distancing requirements, and other government action; (e) changes in consumer behavior and preferences; and (f) disruptions in raw material supply, our manufacturing operations, or in our distribution and supply chain. Furthermore, during the COVID-19 pandemic, we were affected in markets where, in connection with other government actions taken to slow the spread of the COVID-19 pandemic, liquor sales were temporarily restricted or banned outright such as in the Commonwealth of Pennsylvania in the United States, and in South Africa, India, and other Asian countries. In addition, we may incur increased costs and otherwise be negatively affected if a significant portion of our workforce (or the workforces within our distribution or supply chain) is unable to work or work effectively, including because of illness, quarantines, “stay at home” orders, social distancing requirements, other government action, facility closures, or other restrictions.
The full impact of the COVID-19 pandemic (and any related variations) depends on factors beyond our knowledge or control, including the duration, severity, and potential resurgence of the outbreak and actions taken to contain its spread and mitigate the public health effects, including vaccine efficacy, and its short- and long-term impacts on the economy, unemployment, consumer confidence, and the financial health of our suppliers, distributors, customers, and retailers. At this time, we cannot predict with certainty the full impact of the COVID-19 pandemic on our business or our future financial or operational results. For further discussion on the impact of the COVID-19 pandemic on our business and financial results, see “Item 7. Management's Discussion and Analysis of Financial Condition and Results of Operations - Significant Developments - COVID-19.”
Unfavorable economic conditions could negatively affect our operations and results.
Unfavorable global or regional economic conditions could adversely affect our business and financial results. In particular, a significant deterioration in economic conditions, including economic slowdowns or recessions, increased unemployment levels, inflationary pressures or disruptions to credit and capital markets, could lead to decreased consumer confidence in certain countries and consumer spending more generally, thus reducing consumer demand for our products. Unfavorable economic conditions could also cause governments to increase taxes on beverage alcohol to attempt to raise revenue, reducing consumers' willingness to make discretionary purchases of beverage alcohol products or pay for premium brands such as ours.
Unfavorable economic conditions could also adversely affect our suppliers, distributors, customers, and retailers, who in turn could experience cash flow challenges, more costly or unavailable financing, credit defaults, and other financial hardships. For example, due to the COVID-19 pandemic and its resulting economic impact, we received requests for credit extensions from some of our distributors. Such financial hardships could lead to distributor or retailer destocking, disruption in raw material supply, increase in bad debt expense, or increased levels of unsecured credit that we may need to provide to customers. Other potential negative consequences to our business from unfavorable economic conditions include higher interest rates, an increase in the rate of inflation, deflation, exchange rate fluctuations, credit or capital market instability, or lower returns on pension assets or lower discount rates for pension obligations (possibly requiring higher contributions to our pension plans). For additional details on the effects of COVID-19 on our operations and financial results, see “Item 7. Management’s Discussion and Analysis of Financial Condition and Results of Operations - Significant Developments - COVID-19.” For details on the
20
effects of changes in the value of our benefit plan obligations and assets on our financial results, see Note 9 to the Consolidated Financial Statements in “Item 8. Financial Statements and Supplementary Data.”
Product recalls or other product liability claims could materially and adversely affect our sales.
The success of our brands depends upon the positive image that consumers have of them. We could decide to or be required to recall products due to suspected or confirmed product contamination, product tampering, spoilage, or other quality issues. Any of these events could adversely affect our financial results. Actual contamination, whether deliberate or accidental, could lead to inferior product quality and even illness, injury, or death to consumers, potential liability claims, and material loss. Should a product recall become necessary, or we voluntarily recall a product in the event of contamination, damage, or other quality issue, sales of the affected product or our broader portfolio of brands could be adversely affected. A significant product liability judgment or widespread product recall may negatively impact sales and our business and financial results. Even if a product liability claim is unsuccessful or is not fully pursued, resulting negative publicity could adversely affect our reputation with existing and potential customers and our corporate and brand image.
Negative publicity could affect our business performance.
Unfavorable publicity, whether accurate or not, related to our industry or to us or our products, brands, marketing, executive leadership, employees, board of directors, family stockholders, operations, current or anticipated business performance, or environmental or social efforts could negatively affect our corporate reputation, stock price, ability to attract and retain high-quality talent, or the performance of our business. Adverse publicity or negative commentary on social media outlets, whether valid or not, particularly any that go “viral,” could cause consumers or other stakeholders to react by disparaging or avoiding our brands or company, which could materially negatively affect our financial results. Additionally, investor advocacy groups, institutional investors, other market participants, stockholders, employees, consumers, and customers have focused increasingly on the environmental, social, and governance (“ESG”) or “sustainability” practices of companies. These stakeholders have placed increased importance on ESG practices and their effect on companies as an investment or employer. If our ESG practices do not meet investor or other stakeholder expectations and standards, which continue to evolve, our brand, reputation, and employee retention may be negatively affected.
Our failure to attract or retain key talent could adversely affect our business.
Our success depends upon the efforts and abilities of our senior management team, other key employees, and our high-quality employee base, as well as our ability to attract, motivate, reward, and retain them. Difficulties in hiring or retaining key executive or other employee talent, or the unexpected loss of experienced employees resulting in the depletion of our institutional knowledge base, could have an adverse impact on our business performance, reputation, financial condition, or results of operations. Given changing demographics, changes in immigration laws and policies, the increasing normalization of remote working, and demand for talent globally, we may not be able to find the right people with the right skills, at the right time, and in the right location, to achieve our business objectives.
We might not succeed in our strategies for acquisitions and dispositions.
From time to time, we acquire or invest in additional brands or businesses. We expect to continue to seek acquisition and investment opportunities that we believe will increase long-term shareholder value, but we may not be able to find and purchase brands or businesses at acceptable prices and terms. Acquisitions involve risks and uncertainties, including potential difficulties integrating acquired brands and personnel; the possible loss of key customers or employees most knowledgeable about the acquired business; implementing and maintaining consistent U.S. public company standards, controls, procedures, policies, and information systems; exposure to unknown liabilities; business disruption; and management distraction or departure. Acquisitions, investments, or joint ventures could also lead us to incur additional debt and related interest expenses or issue additional shares, and result in a reduction in our earnings per share and a decrease on our return on invested capital. We could incur future restructuring charges or record impairment losses on the value of goodwill or other intangible assets resulting from previous acquisitions, which may also negatively affect our financial results.
We also evaluate from time to time the potential disposition of assets or businesses that may no longer meet our financial or strategic objectives. In selling assets or businesses, we may not get prices or terms as favorable as we anticipated. We could also encounter difficulty in finding buyers on acceptable terms in a timely manner, which could delay our accomplishment of strategic objectives. Expected cost savings from reduced overhead relating to the sold assets may not materialize, and the overhead reductions could temporarily disrupt our other business operations. Any of these outcomes could negatively affect our financial results.
21
Risks Related to Our Global Operations
Our global business is subject to commercial, political, and financial risks.
Our products are sold in more than 170 countries; accordingly, we are subject to risks associated with doing business globally, including commercial, political, and financial risks. In addition, we are subject to potential business disruption caused by military conflicts; potentially unstable governments or legal systems; social, racial, civil, or political upheaval or unrest; local labor policies and conditions; possible expropriation, nationalization, or confiscation of assets; problems with repatriation of foreign earnings; economic or trade sanctions; closure of markets to imports; anti-American sentiment; terrorism, kidnapping, extortion, or other types of violence in or outside the United States; and health pandemics (such as COVID-19). If shipments of our products – particularly Jack Daniel's Tennessee Whiskey – to our global markets were to experience significant disruption due to these risks or for other reasons, it could have a material adverse effect on our financial results.
For example, in 2018, the United States imposed tariffs on steel and aluminum. In response, a number of countries imposed retaliatory tariffs on U.S. imports, including on our American whiskey products. Such retaliatory tariffs, which remain in place, have negatively affected our results of operations through lower net sales and higher cost of sales. While the European Union's original plan to double its current retaliatory tariffs on June 1, 2021, has been postponed, if such tariffs were to double, our financial results would be further adversely affected. Any additional increases in tariffs, custom duties, or other restrictions or barriers on imports and exports, or the further deterioration of economic relations between the United States and other countries could result in an increase in the price of our products and to the extent that we absorb the costs of tariffs, result in higher cost of goods sold and lower gross profit and margins. Additionally, it could limit the availability of our products and prompt consumers to seek alternative products. Our success will depend, in part, on our ability to overcome the challenges we encounter with respect to these risks and other factors affecting U.S. export companies with a global business.
A failure to comply with anti-corruption laws, trade sanctions and restrictions, or similar laws or regulations may have a material adverse effect on our business and financial results.
As a global company, some of the countries where we do business have a higher risk of corruption than others. While we are committed to doing business in accordance with all applicable laws, including anti-corruption laws and global trade restrictions, we remain subject to the risk that an employee, or one of our many direct or indirect business partners, may take action determined to be in violation of international trade, money laundering, anti-corruption, or other laws, sanctions, or regulations, including the U.S. Foreign Corrupt Practices Act of 1977, the U.K. Bribery Act 2010, or equivalent local laws. Because the COVID-19 pandemic has negatively impacted numerous local economies, government intervention in local economies and businesses has increased, which has elevated risk and opportunity for corruption. Any determination that our operations or activities are not in compliance with applicable laws or regulations, particularly those related to anti-corruption and international trade, could result in investigations, interruption of business, loss of business partner relationships, suspension or termination of licenses and permits (our own or those of our partners), imposition of fines, legal or equitable sanctions, negative publicity, and management distraction or departure. Further, our continued compliance with applicable anti-corruption or other laws or regulations, our Code of Conduct, Code of Ethics for Senior Financial Officers, and our other policies could result in higher operating costs, delays, or even competitive disadvantages.
Fluctuations in foreign currency exchange rates relative to the U.S. dollar could have a material adverse effect on our financial results.
The global scope of our business means that foreign currency rate fluctuations relative to the U.S. dollar influence our financial results. In many markets outside the United States, we sell our products and pay for some goods, services, and talent primarily in local currencies. Because our foreign currency revenues exceed our foreign currency expense, we have a net exposure to changes in the value of the U.S. dollar relative to those currencies. Over time, our reported financial results will be hurt by a stronger U.S. dollar and will be benefited by a weaker one. We do not attempt to hedge all of our foreign currency exposure. We attempt to hedge a portion of our foreign currency exposure through the use of foreign currency derivatives or other means; however, even in those cases, we do not fully eliminate our foreign currency exposure. For details on how foreign exchange affects our business, see “Item 7A. Quantitative and Qualitative Disclosures about Market Risk - Foreign currency exchange rate risk.”
Legal and Regulatory Risks
National and local governments may adopt regulations or undertake investigations that could limit our business activities or increase our costs.
Our business is subject to extensive regulatory requirements regarding production, exportation, importation, marketing and promotion, labeling, distribution, pricing, and trade practices, among others. Changes in laws, regulatory measures, or
22
governmental policies, or the manner in which current ones are interpreted, could cause us to incur material additional costs or liabilities, and jeopardize the growth of our business in the affected market. Specifically, governments may prohibit, impose, or increase limitations on advertising and promotional activities, or times or locations where beverage alcohol may be sold or consumed, or adopt other measures that could limit our opportunities to reach consumers or sell our products. Certain countries historically have banned all television, newspaper, magazine, and digital commerce/advertising for beverage alcohol products. Increases in regulation of this nature could substantially reduce consumer awareness of our products in the affected markets and make the introduction of new products more challenging.
Additional regulation in the United States and other countries addressing climate change, use of water, and other environmental issues could increase our operating costs. Increasing regulation of fuel emissions could increase the cost of energy, including fuel, required to operate our facilities or transport and distribute our products, thereby substantially increasing the production, distribution, and supply chain costs associated with our products.
Tax increases and changes in tax rules could adversely affect our financial results.
Our business is sensitive to changes in both direct and indirect taxes. As a multinational company based in the United States, we are more exposed to the impact of U.S. tax changes than most of our major competitors, especially those that affect the effective corporate income tax rate.
New tax rules, accounting standards, or pronouncements, and changes in interpretation of existing rules, standards, or pronouncements could also have a material adverse effect on our business and financial results. This includes potential changes in tax rules or the interpretation of tax rules arising out of the Base Erosion & Profit Shifting project initiated by the Organization for Economic Co-operation and Development, as well as changes in the interpretation of tax rules arising out of the European Union State Aid investigations. Additionally, President Biden has proposed, among other changes to the tax code, an increase in the U.S. corporate income tax rate from 21% to 28%, an increase of the U.S. tax rate on foreign income from 10% to 21%, eliminating the Foreign Derived Intangible Income deduction, and imposing an alternative minimum tax (AMT) on book income. And recently, the U.S. Treasury department proposed the adoption of a global minimum corporate tax rate of at least 15%. While we are unable to predict whether any of these changes will ultimately be enacted, if these or similar proposals are enacted into law, they could negatively impact our effective tax rate.
Our business operations are also subject to numerous duties or taxes that are not based on income, sometimes referred to as “indirect taxes.” These indirect taxes include excise taxes, sales or value-added taxes, property taxes, payroll taxes, import and export duties, and tariffs. Increases in or the imposition of new indirect taxes on our operations or products would increase the cost of our products or materials used to produce our products or, to the extent levied directly on consumers, make our products less affordable, which could negatively affect our financial results by reducing purchases of our products and encouraging consumers to switch to lower-priced or lower-taxed product categories. As governmental entities look for increased sources of revenue, they may increase taxes on beverage alcohol products. In fiscal 2021, we have observed excise tax increases in Turkey, France, Finland, Romania, the Mexican state of Michoacan, and the annual Australian increase tied to the consumer price index. Additionally, during fiscal 2021, several countries including Australia, Poland, and Brazil began to seriously consider changes to their overall beverage alcohol tax policies.
Our ability to market and sell our products depends heavily on societal attitudes toward drinking and governmental policies that both flow from and affect those attitudes.
Increased social and political attention has been directed at the beverage alcohol industry. For example, there remains continued attention focused largely on public health concerns related to alcohol abuse, including drunk driving, underage drinking, and the negative health impacts of the abuse and misuse of beverage alcohol. While most people who drink enjoy alcoholic beverages in moderation, it is commonly known and well reported that excessive levels or inappropriate patterns of drinking can lead to increased risk of a range of health conditions and, for certain people, can result in alcohol dependence. Some academics, public health officials, and critics of the alcohol industry in the United States, Europe, and other parts of the world continue to seek governmental measures to make beverage alcohol more expensive, less available, or more difficult to advertise and promote. If future scientific research indicates more widespread serious health risks associated with alcohol consumption – particularly with moderate consumption – or if for any reason the social acceptability of beverage alcohol declines significantly, sales of our products could be adversely affected.
Significant additional labeling or warning requirements or limitations on the availability of our products could inhibit sales of affected products.
Various jurisdictions have adopted or may seek to adopt significant additional product labeling or warning requirements or limitations on the availability of our products relating to the content or perceived adverse health consequences of some of our products. Several such labeling regulations or laws require warnings on any product with substances that the jurisdiction lists as
23
potentially associated with cancer or birth defects. Our products already raise health and safety concerns for some regulators, and heightened requirements could be imposed. For example, in February 2021, the European Union published its Europe Beating Cancer Plan. As part of the plan, by the end of 2023, the European Union will issue a proposal for mandatory health warnings on beverage alcohol product labels. If additional or more severe requirements of this type are imposed on one or more of our major products under current or future health, environmental, or other laws or regulations, they could inhibit sales of such products. Further, we cannot predict whether our products will become subject to increased rules and regulations, which, if enacted, could increase our costs or adversely impact sales. For example, in 2020 in Australia and New Zealand, after concerted campaigning from advocacy groups, the government legislated mandatory pregnancy warning labels to be applied to alcohol beverages with a transition period of three years. Such campaigns could result in additional governmental regulations concerning the production, marketing, labeling, or availability of our products, any of which could damage our reputation, make our premium brands unrecognizable, or reduce demand for our products, which could adversely affect our profitability.
Counterfeiting or inadequate protection of our intellectual property rights could adversely affect our business prospects.
Our brand names, trademarks, and related intellectual property rights are critical assets, and our business depends on protecting them online and in the countries where we do business. We may not succeed in protecting our intellectual property rights in a given market or in challenging those who infringe our rights or imitate or counterfeit our products. Although we believe that our intellectual property rights are legally protected in the markets where we do business, the ability to register and enforce intellectual property rights varies from country to country. In some countries, for example, it may be more difficult to successfully stop counterfeiting or look-alike products, either because the law is inadequate or, even though satisfactory legal options may exist, it may be difficult to obtain and enforce sanctions against counterfeiters. We may not be able to register our trademarks in every country where we want to sell a particular product, and we may not obtain favorable decisions by courts or trademark offices.
Many global spirits brands, including some of our brands, experience problems with product counterfeiting and other forms of trademark infringement. We combat counterfeiting by working with other companies in the spirits industry through our membership in the Alliance Against Counterfeit Spirits (AACS) and with brand owners in other industries via our membership in React, an anti-counterfeiting network organization. While we believe AACS and React are effective organizations, they are not active in every market, and their efforts are subject to obtaining the cooperation of local authorities and courts in the markets where they are active. Despite the efforts of AACS, React, and our own teams, lower-quality and counterfeit products that could be harmful to consumers could reach the market and adversely affect our intellectual property rights, brand equity, corporate reputation, and financial results. In addition, the industry as a whole could suffer negative effects related to the manufacture, sale, and consumption of illegally produced beverage alcohol. In connection with the COVID-19 pandemic and its resulting economic impacts, government actions and interventions in local economies and businesses may create an elevated risk of, and opportunity for, counterfeiting.
Litigation and legal disputes could expose our business to financial and reputational risk.
Major private or governmental litigation challenging the production, marketing, promotion, distribution, or sale of beverage alcohol or specific brands could affect our ability to sell our products. Because litigation and other legal proceedings can be costly to defend, even actions that are ultimately decided in our favor could have a negative impact on our business reputation or financial results. Lawsuits have been brought against beverage alcohol companies alleging problems related to alcohol abuse, negative health consequences from drinking, problems from alleged marketing or sales practices, and underage drinking. While these lawsuits have been largely unsuccessful in the past, others may succeed in the future. We could also experience employment-related or cybersecurity-related class actions, environmental claims, commercial disputes, product liability actions stemming from a beverage or container production defect, a whistleblower suit, or other major litigation that could adversely affect our business results, particularly if there is negative publicity.
Governmental actions around the world to enforce trade practice, anti-money-laundering, anti-corruption, competition, tax, environmental, and other laws are also a continuing compliance risk for global companies such as ours. In addition, as a U.S. public company, we are exposed to the risk of securities-related class action suits, particularly following a precipitous drop in the share price of our stock. Adverse developments in major lawsuits concerning these or other matters could result in management distraction and have a material adverse effect on our business.
24
Risks Related to Cybersecurity and Data Privacy
A cyber breach, a failure or corruption of one or more of our key information technology systems, networks, processes, associated sites, or service providers, or a failure to comply with personal data protection laws could have a material adverse impact on our business.
We rely on information technology (IT) systems, networks, and services, including internet sites, data hosting and processing facilities and tools, hardware (including laptops and mobile devices), software, and technical applications and platforms, some of which are managed, hosted, provided, or used by third parties or their vendors, to help us manage our business. The various uses of these IT systems, networks, and services include: hosting our internal network and communication systems; ordering and managing materials from suppliers; billing and collecting cash from our customers; supply/demand planning; inventory planning; production; shipping products to customers; paying our employees; hosting corporate strategic plans and employee data; hosting our branded websites and marketing products to consumers; collecting and storing data on suppliers, customers, consumers, stockholders, employees, former employees, and beneficiaries of employees or former employees; processing transactions; summarizing and reporting results of operations; hosting, processing, and sharing confidential and proprietary research, business plans, and financial reporting and information; complying with regulatory, legal, or tax requirements; providing data security; and handling other processes necessary to manage our business.
Increased IT security threats and more sophisticated cybercrimes and cyberattacks, including computer viruses and other malicious codes, ransomware, unauthorized access attempts, denial of service attacks, phishing, social engineering, hacking, and other types of attacks, pose a risk to the security and availability of our IT systems, networks, and services, including those that are managed, hosted, provided, or used by third parties, as well as the confidentiality, availability, and integrity of our data and the data of our customers, partners, consumers, employees, stockholders, suppliers, and others. For example, in July 2020, we discovered a data breach incident involving malware and related behaviors that resulted in unauthorized access to our IT networks. We do not believe this incident had or will have any material impacts on our business operations, financial results, systems and processes, or the effectiveness of our internal control environment; however, any failure of our IT systems, networks, or service providers to function properly or the loss or disclosure of our business strategy or other sensitive information, due to any number of causes, ranging from catastrophic events to power outages to security breaches to usage errors by employees and other security issues, could cause us to suffer interruptions in our ability to manage operations and reputational, competitive, or business harm, which may adversely affect our business operations or financial results. In addition, such IT disruptions could result in unauthorized disclosure of material confidential information, and we may suffer financial and reputational damage because of lost or misappropriated confidential information belonging to us or to our partners, customers, consumers, employees or former employees and their beneficiaries, stockholders, suppliers, or others. As a result of any cyber breach or IT disruption, we could also be required to spend significant financial and other resources to remedy the damage caused by a security breach, including to repair or replace networks and IT systems, which could require a significant amount of time, or to respond to claims from employees, former employees, stockholders, suppliers, customers, consumers, or others or pay significant fines to regulatory agencies. As a result of the COVID-19 pandemic, a greater number of our employees are working remotely and accessing our technology infrastructure remotely, which may further increase our vulnerability to the cyber risks described above. Furthermore, a cyber breach at any one of our suppliers, customers, or other direct or indirect business partners could have a material adverse effect on our business.
In the ordinary course of our business, we receive, process, transmit, and store information relating to identifiable individuals (personal data), primarily employees and former employees, but also relating to beneficiaries of employees or former employees, customers, and consumers. As a result, we are subject to various U.S. federal and state and foreign laws and regulations relating to personal data. These laws have been subject to frequent changes, and new legislation in this area may be enacted in other jurisdictions at any time. Such laws and regulations, including the California Consumer Protection Act, which became effective on January 1, 2020, the California Privacy Rights Act, which will take effect on January 1, 2023, the Virginia Consumer Data Protection Act, which will take effect on January 1, 2023, and the General Data Protection Registration (GDPR), which became effective in May 2018 for all European Union member states and has extraterritorial effect, have subjected and may continue to subject us to, among other things, additional costs and expenses and have required and may in the future require costly changes to our business practices and security systems, policies, procedures, and practices. Improper disclosure of personal data in violation of personal data protection laws, including the GDPR, could harm our reputation, cause loss of consumer confidence, subject us to government enforcement actions (including fines), or result in private litigation against us, which could result in loss of revenue, increased costs, liability for monetary damages, fines, or criminal prosecution, all of which could negatively affect our business and operating results.
25
Risks Related to Our Ownership and Corporate Governance Structure
The Brown family has the ability to control the outcome of matters submitted for stockholder approval.
We are a “controlled company” under New York Stock Exchange rules. Controlled companies are exempt from New York Stock Exchange listing standards that require a board composed of a majority of independent directors, a fully independent nominating/corporate governance committee, and a fully independent compensation committee. We avail ourselves of the exemptions from having a board composed of a majority of independent directors and a fully independent nominating/corporate governance committee. Notwithstanding the available exemption, our Compensation Committee is composed exclusively of independent directors. As a result of our use of some “controlled company” exemptions, our corporate governance practices differ from those of non-controlled companies, which are subject to all of the New York Stock Exchange corporate governance requirements.
We have two classes of common stock. Our Class A common stock is entitled to full voting powers, including in the elections of directors, while our Class B common stock may not vote except as provided by the laws of Delaware. We have had two classes of common stock since 1959, when our stockholders approved the issuance of two shares of Class B non-voting common stock to every holder of our voting common stock. Such dual-class share structures have increasingly come under the scrutiny of major indices, institutional investors, and proxy advisory firms, with some calling for the reclassification of non-voting common stock.
A majority of our voting stock is controlled by members of the Brown family, and, collectively, they have the ability to control the outcome of stockholder votes, including the election of all of our directors and the approval or rejection of any merger, change of control, or other significant corporate transactions. We believe that having a long-term-focused, committed, and engaged stockholder base provides us with a distinct strategic advantage, particularly in a business with aged products and multi-generational brands. This advantage could be eroded or lost, however, should Brown family members cease, collectively, to be controlling stockholders of the Company.
We believe that it is in the interests of all stockholders that we remain independent and family-controlled, and we believe the Brown family stockholders share these interests. Thus, our common stock dual-class share structure, as it has existed since 1959, is perpetual, and we do not have a sunset provision in our Restated Certificate of Incorporation or By-laws that provides for the eventual reclassification of the non-voting common stock to voting common stock. However, the Brown family's interests may not always be aligned with other stockholders' interests. By exercising their control, the Brown family could cause the Company to take actions that are at odds with the investment goals or interests of institutional, short-term, non-voting, or other non-controlling investors, or that have a negative effect on our stock price. Further, because the Brown family controls the majority of our voting stock, Brown-Forman might be a less attractive takeover target, which could adversely affect the market price of both our voting and our non-voting common stock. And the difference in voting rights for our common stock could also adversely and disproportionately affect the value of our Class B non-voting common stock to the extent that investors view, or any potential future purchaser of our Company views, the superior voting rights and control represented by the Class A common stock to have value.
Item 1B. Unresolved Staff Comments
None.
26
Item 2. Properties
Our company-owned production facilities include distilleries, a winery, bottling plants, an RTD canning plant, warehousing operations, sawmills, cooperages, visitors' centers, and retail shops. We also have agreements with other parties for contract production in Australia, Belgium, China, Finland, Ireland, Latvia, Mexico, the Netherlands, New Zealand, South Africa, the United Kingdom, and the United States.
In addition to our company-owned production locations and our corporate offices in Louisville, Kentucky, we lease office space for use in our sales, marketing, and administrative operations in the United States and in over 50 other cities around the globe. The lease terms expire at various dates and are generally renewable. We believe that our facilities are in good condition and are adequate for our business.
Principal Properties | ||||||||
| Location | Principal Activities | Notes | ||||||
| United States: | ||||||||
| Louisville, Kentucky | Corporate offices | Includes several renovated historic structures | ||||||
| Distilling, bottling, warehousing | Home of Old Forester | |||||||
| Visitors' center | ||||||||
| Cooperage | Brown-Forman Cooperage | |||||||
| Lynchburg, Tennessee | Distilling, bottling, warehousing | Home of Jack Daniel's | ||||||
| Visitors' center | ||||||||
| Woodford County, Kentucky | Distilling, bottling, warehousing | Home of Woodford Reserve | ||||||
| Visitors' center | ||||||||
| Windsor, California | Vineyards, winery, bottling, warehousing | Home of Sonoma-Cutrer | ||||||
| Visitors' center | ||||||||
| Trinity, Alabama | Cooperage | Jack Daniel Cooperage | ||||||
| Clifton, Tennessee | Stave and heading mill | |||||||
| Stevenson, Alabama | Stave and heading mill | |||||||
| Spencer, Indiana | Stave and heading mill | |||||||
| Jackson, Ohio | Stave and heading mill | Land is leased from a third party | ||||||
| International: | ||||||||
| Cour-Cheverny, France | Distilling, bottling, warehousing | Home of Chambord | ||||||
| Amatitán, Mexico | Distilling, bottling, warehousing, RTD canning | Home of Herradura and el Jimador | ||||||
| Visitors' center | ||||||||
| Slane, Ireland | Distilling | Home of Slane Irish Whiskey | ||||||
| Visitors' center | ||||||||
| Aberdeenshire, Scotland | Distilling, warehousing | Home of Glendronach | ||||||
| Visitors' center | ||||||||
| Morayshire, Scotland | Distilling, warehousing | Home of Benriach | ||||||
| Visitors' center | ||||||||
| Newbridge, Scotland | Bottling | |||||||
| Portsoy, Scotland | Distilling, warehousing | Home of Glenglassaugh | ||||||
| Visitors' center | ||||||||
27
Item 3. Legal Proceedings
We operate in a litigious environment and we are sued in the normal course of business. We do not anticipate that any pending suits will have, individually or in the aggregate, a material adverse effect on our financial position, results of operations, or liquidity.
Item 4. Mine Safety Disclosures
Not applicable.
28
PART II
Item 5. Market for the Registrant's Common Equity, Related Stockholder Matters, and Issuer Purchases of Equity Securities
Our Class A and Class B common stock is traded on the New York Stock Exchange under the symbols “BFA” and “BFB,” respectively. As of May 31, 2021, there were 2,490 holders of record of Class A common stock and 4,940 holders of record of Class B common stock. Because of overlapping ownership between classes, as of May 31, 2021, we had only 5,130 distinct common stockholders of record.
Stock Performance Graph
The graph below compares the cumulative total shareholder return of our Class B common stock for the last five fiscal years with the Standard & Poor's (S&P) 500 Index, the Dow Jones U.S. Consumer Goods Index, and the Dow Jones U.S. Food & Beverage Index. The information presented assumes an initial investment of $100 on April 30, 2016, and that all dividends were reinvested. The graph shows the value that each of these investments would have had on April 30 in the years since 2016.

| 2016 | 2017 | 2018 | 2019 | 2020 | 2021 | |||||||||||||||
| Brown-Forman Corporation | $100 | $100 | $152 | $147 | $173 | $214 | ||||||||||||||
| S&P 500 Total Return Index | $100 | $118 | $134 | $152 | $153 | $223 | ||||||||||||||
| Dow Jones U.S. Consumer Goods Index | $100 | $109 | $107 | $120 | $119 | $185 | ||||||||||||||
| Dow Jones U.S Food & Beverage Index | $100 | $107 | $104 | $119 | $118 | $148 | ||||||||||||||
29
Item 6. Selected Financial Data
This selected financial data should be read in conjunction with “Item 7. Management's Discussion and Analysis of Financial Condition and Results of Operations” and our Consolidated Financial Statements and the accompanying Notes contained in “Item 8. Financial Statements and Supplementary Data.”
| (Dollars in millions, except per share amounts) | |||||||||||||||||
| 2017 | 2018 | 2019 | 2020 | 2021 | |||||||||||||
| For Year Ended April 30: | |||||||||||||||||
| Sales | $ | 3,857 | $ | 4,201 | $ | 4,276 | $ | 4,306 | $ | 4,526 | |||||||
| Excise taxes | $ | 863 | $ | 953 | $ | 952 | $ | 943 | $ | 1,065 | |||||||
| Net sales | $ | 2,994 | $ | 3,248 | $ | 3,324 | $ | 3,363 | $ | 3,461 | |||||||
| Gross profit | $ | 2,021 | $ | 2,202 | $ | 2,166 | $ | 2,127 | $ | 2,094 | |||||||
| Operating income | $ | 1,010 | $ | 1,048 | $ | 1,144 | $ | 1,091 | $ | 1,166 | |||||||
| Net income | $ | 669 | $ | 717 | $ | 835 | $ | 827 | $ | 903 | |||||||
| Weighted average shares (in millions) used to calculate earnings per share | |||||||||||||||||
| – Basic | 484.6 | 480.3 | 479.0 | 477.8 | 478.5 | ||||||||||||
| – Diluted | 488.1 | 484.2 | 482.1 | 480.4 | 480.7 | ||||||||||||
| Earnings per share from continuing operations | |||||||||||||||||
| – Basic | $ | 1.38 | $ | 1.49 | $ | 1.74 | $ | 1.73 | $ | 1.89 | |||||||
| – Diluted | $ | 1.37 | $ | 1.48 | $ | 1.73 | $ | 1.72 | $ | 1.88 | |||||||
| Gross margin | 67.5 | % | 67.8 | % | 65.2 | % | 63.2 | % | 60.5 | % | |||||||
| Operating margin | 33.8 | % | 32.3 | % | 34.4 | % | 32.4 | % | 33.7 | % | |||||||
| Effective tax rate | 28.3 | % | 26.6 | % | 19.8 | % | 18.0 | % | 16.5 | % | |||||||
| Average invested capital | $ | 3,591 | $ | 3,832 | $ | 4,125 | $ | 4,387 | $ | 4,966 | |||||||
| Return on average invested capital | 19.8 | % | 20.0 | % | 22.0 | % | 20.4 | % | 19.6 | % | |||||||
| Cash provided by operations | $ | 656 | $ | 653 | $ | 800 | $ | 724 | $ | 817 | |||||||
| Cash dividends declared per common share | $ | 0.5640 | $ | 1.6080 | $ | 0.6480 | $ | 0.6806 | $ | 0.7076 | |||||||
| Dividend payout ratio | 40.9 | % | 107.8 | % | 37.2 | % | 39.3 | % | 37.5 | % | |||||||
| As of April 30: | |||||||||||||||||
| Total assets | $ | 4,625 | $ | 4,976 | $ | 5,139 | $ | 5,766 | $ | 6,522 | |||||||
| Long-term debt | $ | 1,689 | $ | 2,341 | $ | 2,290 | $ | 2,269 | $ | 2,354 | |||||||
| Total debt | $ | 2,149 | $ | 2,556 | $ | 2,440 | $ | 2,602 | $ | 2,559 | |||||||
Notes:
| 1. | Results for fiscal 2021 include a pre-tax gain on sale of $127 million from the divestiture of Early Times, Canadian Mist, and Collingwood and related assets. | ||||
| 2. | Weighted average shares, earnings per share, and cash dividends declared per common share have been adjusted for a 2-for-1 stock split in August 2016 and a 5-for-4 stock split in February 2018. | ||||
| 3. | See “Item 7. Management’s Discussion and Analysis of Financial Condition and Results of Operations – Presentation Basis – Non-GAAP Financial Measures” for details on our use of “return on average invested capital,” including how we calculate this measure and why we think this information is useful to readers. | ||||
| 4. | Cash dividends declared per common share and the dividend payout ratio include a special cash dividend of $1.00 in fiscal 2018. | ||||
| 5. | We define dividend payout ratio as cash dividends divided by net income. | ||||
30
Item 7. Management's Discussion and Analysis of Financial Condition and Results of Operations
Introduction
This Management's Discussion and Analysis of Financial Condition and Results of Operations (MD&A) is intended to help the reader better understand Brown-Forman, our operations, our financial results, and our current business environment. Please read this MD&A in conjunction with our Consolidated Financial Statements and the accompanying Notes contained in “Item 8. Financial Statements and Supplementary Data” (the Consolidated Financial Statements).
Our MD&A is organized as follows:
| Table of Contents | |||||
| Page | |||||
Presentation basis. This MD&A reflects the basis of presentation described in Note 1 “Accounting Policies” to the Consolidated Financial Statements. In addition, we define statistical and non-GAAP financial measures that we believe help readers understand our results of operations and the trends affecting our business. | |||||
Significant developments. We discuss developments during the most recent two fiscal years. Please read this section in conjunction with “Item 1. Business,” which provides a general description of our business and strategy. | |||||
Executive summary. We discuss (a) fiscal 2021 highlights and (b) our outlook for fiscal 2022, including the trends, developments, and uncertainties that we expect to affect our business. | |||||
Results of operations. We discuss (a) fiscal 2021 results for our largest markets, (b) fiscal 2021 results for our largest brands, and (c) the causes of year-over-year changes in our statements of operations line items, including transactions and other items that affect the comparability of our results, for fiscal years 2021 and 2020. | |||||
Liquidity and capital resources. We discuss (a) the causes of year-over-year changes in cash flows from operating activities, investing activities, and financing activities; (b) recent and expected future capital expenditures; (c) dividends and share repurchases; and (d) our liquidity position, including capital resources available to us. | |||||
| Off-balance sheet arrangements. | |||||
| Long-term obligations. | |||||
Critical accounting policies and estimates. We discuss the critical accounting policies and estimates that require significant management judgment. | |||||
Presentation Basis
Non-GAAP Financial Measures
We use some financial measures in this report that are not measures of financial performance under U.S. generally accepted accounting principles (GAAP). These non-GAAP measures, defined below, should be viewed as supplements to (not substitutes for) our results of operations and other measures reported under GAAP. Other companies may not define or calculate these non-GAAP measures in the same way.
“Underlying change” in measures of statements of operations. We present changes in certain measures, or line items, of the statements of operations that are adjusted to an “underlying” basis. We use “underlying change” for the following measures of the statements of operations: (a) underlying net sales; (b) underlying cost of sales; (c) underlying gross profit; (d) underlying advertising expenses; (e) underlying selling, general, and administrative (SG&A) expenses; (f) underlying other expense (income) net; (g) underlying operating expenses1; and (h) underlying operating income. To calculate these measures, we adjust, as applicable, for (1) acquisitions and divestitures, (2) foreign exchange, (3) estimated net changes in distributor inventories, (4) a non-cash write-down of the Chambord brand name, and (5) a commitment to our charitable foundation. We explain these adjustments below.
•“Acquisitions and divestitures.” This adjustment removes (a) the gain or loss recognized on sale of divested brands, (b) any non-recurring effects related to our acquisitions and divestitures (e.g., transaction, transition, and integration costs), and (c) the effects of operating activity related to acquired and divested brands for periods not comparable year over year (non-comparable periods). Excluding non-comparable periods allows us to include the effects of acquired and divested brands only to the extent that results are comparable year over year.
In fiscal 2020, we acquired The 86 Company, which owns Fords Gin. During fiscal 2021, we sold our Early Times, Canadian Mist, and Collingwood brands and related assets, which resulted in a pre-tax gain of $127 million, and entered into a related transition services agreement (TSA) for these brands.
1Operating expenses include advertising expense, SG&A expense, and other expense (income), net.
31
Also, during fiscal 2021, we acquired Part Time Rangers Limited, which owns Part Time Rangers RTDs. See Note 12 to the Condensed Consolidated Financial Statements for details.
This adjustment removes (a) transaction and integration costs related to the acquisitions and divestitures, (b) operating activity for The 86 Company for the non-comparable period, which is activity in the first quarter of fiscal 2021, (c) the gain on sale of Early Times, Canadian Mist, and Collingwood and related assets, (d) operating activity for the non-comparable period for Early Times, Canadian Mist, and Collingwood, which is activity in the second, third, and fourth quarters for both fiscal 2020 and fiscal 2021, (e) the net sales and operating expenses recognized in fiscal 2021 pursuant to the TSA related to (i) contract bottling services and (ii) distribution services in certain markets, and (f) operating activity for Part Time Rangers Holdings Limited for the non-comparable period, which is activity in the third and fourth quarters of fiscal 2021. We believe that these adjustments allow for us to better understand our underlying results on a comparable basis.
•“Foreign exchange.” We calculate the percentage change in certain line items of the statements of operations in accordance with GAAP and adjust to exclude the cost or benefit of currency fluctuations. Adjusting for foreign exchange allows us to understand our business on a constant-dollar basis, as fluctuations in exchange rates can distort the underlying trend both positively and negatively. (In this report, “dollar” always means the U.S. dollar unless stated otherwise.) To eliminate the effect of foreign exchange fluctuations when comparing across periods, we translate current-year results at prior-year rates and remove transactional and hedging foreign exchange gains and losses from current- and prior-year periods.
•“Estimated net change in distributor inventories.” This adjustment refers to the estimated net effect of changes in distributor inventories on changes in certain line items of the statements of operations. For each period compared, we use volume information from our distributors to estimate the effect of distributor inventory changes in certain line items of the statements of operations. We believe that this adjustment reduces the effect of varying levels of distributor inventories on changes in certain line items of the statements of operations and allows us to understand better our underlying results and trends.
•“Chambord impairment.” During fiscal 2020, we recognized a non-cash impairment charge of $13 million for our Chambord brand name. See “Critical Accounting Policies and Estimates” below and Note 4 to the Consolidated Financial Statements for details.
•“Foundation.” In fiscal 2021, we committed $20 million to the Brown-Forman Foundation (the Foundation) to support the communities where our employees live and work. This adjustment removes the $20 million commitment to the Foundation from our underlying SG&A expenses and underlying operating income to present our underlying results on a comparable basis.
We use the non-GAAP measures “underlying change” to: (a) understand our performance from period to period on a consistent basis; (b) compare our performance to that of our competitors; (c) calculate components of management incentive compensation; (d) plan and forecast; and (e) communicate our financial performance to the board of directors, stockholders, and investment community. We provide reconciliations of the “underlying change” in certain line items of the statements of operations to their nearest GAAP measures in the tables under “Results of Operations - Year-Over-Year Comparisons.” We have consistently applied the adjustments within our reconciliations in arriving at each non-GAAP measure.
When we provide guidance for underlying change for certain measures of the statements of operations we do not provide guidance for the corresponding GAAP change because the GAAP measure will include items that are difficult to quantify or predict with reasonable certainty, including the estimated net change in distributor inventories and foreign exchange, each of which could have a significant impact to our GAAP income statement measures.
“Return on average invested capital.” This measure refers to the sum of net income and after-tax interest expense, divided by average invested capital. Average invested capital equals assets less liabilities, excluding interest-bearing debt, and is calculated using the average of the most recent 13 month-end balances. After-tax interest expense equals interest expense multiplied by one minus our effective tax rate. We use this non-GAAP measure because we consider it to be a meaningful indicator of how effectively and efficiently we invest capital in our business.
Definitions
Aggregations.
From time to time, to explain our results of operations or to highlight trends and uncertainties affecting our business, we aggregate markets according to stage of economic development as defined by the International Monetary Fund (IMF), and we aggregate brands by beverage alcohol category. Below, we define the geographic and brand aggregations used in this report.
32
Geographic Aggregations.
In “Results of Operations - Fiscal 2021 Market Highlights,” we provide supplemental information for our largest markets ranked by percentage of total fiscal 2021 net sales. In addition to markets listed by country name, we include the following aggregations:
•“Developed International” markets are “advanced economies” as defined by the IMF, excluding the United States. Our largest developed international markets are Australia, Germany, the United Kingdom, France, and Canada. This aggregation represents our net sales of branded products to these markets.
•“Emerging” markets are “emerging and developing economies” as defined by the IMF. Our largest emerging markets are Mexico, Poland, Brazil, and Russia. This aggregation represents our net sales of branded products to these markets.
•“Travel Retail” represents our net sales of branded products to global duty-free customers, other travel retail customers, and the U.S. military, regardless of customer location.
•“Non-branded and bulk” includes our net sales of used barrels, bulk whiskey and wine, and contract bottling, regardless of customer location.
Brand Aggregations.
In “Results of Operations - Fiscal 2021 Brand Highlights,” we provide supplemental information for our largest brands ranked by percentage of total fiscal 2021 net sales. In addition to brands listed by name, we include the following aggregations:
•“Whiskey” includes all whiskey spirits and whiskey-based flavored liqueurs, ready-to-drink (RTD), and ready-to-pour products (RTP). The brands included in this category are the Jack Daniel's family of brands, the Woodford Reserve family of brands (Woodford Reserve), the Old Forester family of brands (Old Forester), GlenDronach, Benriach, Glenglassaugh, Slane Irish Whiskey, and Coopers' Craft. Also includes the Early Times, Canadian Mist, and Collingwood brands, which we divested during the first quarter of fiscal 2021. See Note 12 to the Condensed Consolidated Financial Statements for details.
◦“American whiskey” includes the Jack Daniel's family of brands, premium bourbons (defined below), super-premium American whiskey (defined below), and Early Times, which we divested during the first quarter of fiscal 2021.
▪“Jack Daniel's family of brands” includes Jack Daniel's Tennessee Whiskey (JDTW), Jack Daniel's RTD and RTP products (JD RTD/RTP), Jack Daniel's Tennessee Honey (JDTH), Gentleman Jack, Jack Daniel's Tennessee Fire (JDTF), Jack Daniel's Tennessee Apple (JDTA), Jack Daniel's Single Barrel Collection (JDSB), Jack Daniel's Tennessee Rye Whiskey (JDTR), Jack Daniel's No. 27 Gold Tennessee Whiskey, Jack Daniel's Sinatra Select, and Jack Daniel's Bottled-in-Bond.
•“Jack Daniel's RTD and RTP” products include all RTD line extensions of Jack Daniel's, such as Jack Daniel's & Cola, Jack Daniel's Country Cocktails, Jack Daniel's & Diet Cola, Jack & Ginger, Jack Daniel's Double Jack, Gentleman Jack & Cola, Jack Daniel's American Serve, Jack Daniel's Tennessee Honey RTD, Jack Daniel's Berry, Jack Daniel's Lynchburg Lemonade, Jack Daniel's Whiskey & Seltzer, and the seasonal Jack Daniel's Winter Jack RTP.
▪“Premium bourbons” includes Woodford Reserve, Old Forester, and Coopers' Craft.
▪“Super-premium American whiskey” includes Woodford Reserve, Gentleman Jack, JDSB, JDTR, Jack Daniel's No. 27 Gold Tennessee Whiskey, and Jack Daniel's Sinatra Select.
•“Tequila” includes the Herradura family of brands (Herradura), el Jimador, New Mix, Pepe Lopez, and Antiguo.
•“Wine” includes Korbel Champagnes and Sonoma-Cutrer wines.
•“Vodka” includes Finlandia.
•“Non-branded and bulk” includes our net sales of used barrels, bulk whiskey and wine, and contract bottling, regardless of customer location.
Other Metrics.
•“Depletions.” We generally record revenues when we ship or deliver our products to our customers. “Depletions” is a term commonly used in the beverage alcohol industry to describe volume. Depending on the context, depletions usually means
33
either (a) our shipments directly to retail or wholesale customers for owned distribution markets or (b) shipments from our distributor customers to retailers and wholesalers in other markets. We believe that depletions measure volume in a way that more closely reflects consumer demand than our shipments to distributor customers do. In this document, unless otherwise specified, we refer to depletions when discussing volume.
•“Consumer takeaway.” When discussing trends in the market, we refer to consumer takeaway, a term commonly used in the beverage alcohol industry that refers to the purchase of product by consumers from retail outlets, including products purchased through e-premise channels, as measured by volume or retail sales value. This information is provided by third parties, such as Nielsen and the National Alcohol Beverage Control Association (NABCA). Our estimates of market share or changes in market share are derived from consumer takeaway data using the retail sales value metric. We believe consumer takeaway is a leading indicator of how consumer demand is trending.
34
Significant Developments
Below we discuss the significant developments in our business during fiscal 2020 and fiscal 2021. These developments relate to the COVID-19 pandemic (COVID-19), innovation, acquisitions and divestitures, and capital deployment.
COVID-19
The ongoing COVID-19 pandemic continues to impact the global economy and create economic uncertainty, even with multiple vaccines in various stages of deployment worldwide. Governments around the world imposed restrictions on travel and business operations and placed limitations on the size of public and private gatherings of their citizens. As a result of such restrictions, many businesses have either been closed or their operations have been modified. The bar, restaurant, airline, cruise, and related hospitality industries were particularly impacted as the ability to travel and gather was severely limited or restricted. However, during the fourth quarter of fiscal 2021, the operating environment in some markets began to improve, particularly as the on-premise channel began to recover and some degree of travel resumed through our Travel Retail channel.
While the financial impact of COVID-19 on our business is difficult to measure, it had an effect on our fiscal 2021 financial performance, both positive and negative. We experienced strong off-premise gains across many of our developed markets, reflecting an increase in at-home consumption and exceptional growth in the e-premise channel. Conversely, the negative impact was concentrated in (a) the on-premise (representing approximately 20% of our business globally prior to COVID-19) as a result of the restrictions in the channel, (b) our Travel Retail channel (representing approximately 4% of our business prior to COVID-19) as a result of travel bans and other restrictions, and (c) certain emerging markets where we have seen evidence of consumers trading down from premium spirit categories where our portfolio is focused. We further discuss the effect of COVID-19 on our results where relevant below.
We believe we remain in a strong financial position, and our capacity to generate solid operating cash flow remains sound. Additionally, we have no maturities of long-term debt until fiscal 2023. See “Liquidity and Capital Resources” below for details.
Innovation
•Jack Daniel's family of brands. Innovation within the Jack Daniel's family of brands has contributed to our growth in the last two years as described below.
◦In fiscal 2020, we launched Jack Daniel's Tennessee Apple in the United States and a few select international markets.
◦In fiscal 2021, we continued the international launch of Jack Daniel's Tennessee Apple, launching in certain developed international and emerging markets. We also introduced new spirit-based RTD products in the United States.
•Other American whiskeys. We continue to capitalize on consumers' interest in premium-plus whiskey with our wide range of brands, including Woodford Reserve and Old Forester.
◦We introduced Woodford Reserve Straight Wheat in fiscal 2020.
•Tequila brands. Tequila continues to be an attractive category, particularly in the United States, with both Herradura and el Jimador contributing significantly to our overall net sales growth.
◦In fiscal 2021, we introduced Herradura Legend in the United States.
Acquisitions and Divestitures
•In fiscal 2020, we acquired The 86 Company, which owns Fords Gin. During fiscal 2021, we sold our Early Times, Canadian Mist, and Collingwood brands and related assets. Also in fiscal 2021, we acquired Part Time Rangers Holdings Limited, which owns Part Time Rangers RTDs. See Note 12 to the Condensed Consolidated Financial Statements for details.
Capital Deployment
•Beyond the acquisitions described above, we have focused our capital deployment initiatives on (a) ensuring adequate liquidity and flexibility during the COVID-19 pandemic, while investing fully behind our existing business, and (b) returning cash to our stockholders through regular dividends.
35
•Investments. During fiscal 2020 and fiscal 2021, our capital expenditures totaled $175 million and focused on enabling the growth of our premium whiskey brands:
◦Woodford Reserve. We built two additional new warehouses to support the brand's anticipated future growth.
◦Brown-Forman Cooperage. We modernized our cooperage operations in Louisville, Kentucky.
◦During fiscal 2021, a $125 million capital investment was approved by our Board of Directors to expand our bourbon-making capacity in Kentucky to meet anticipated future consumer demand.
•Cash returned to stockholders. During fiscal 2020 and fiscal 2021, we returned $663 million to our stockholders through regular dividends.
36
Executive Summary
Fiscal 2021 Highlights
•We delivered reported net sales of $3.5 billion, an increase of 3% compared to fiscal 2020. Excluding an estimated net decrease in distributor inventories and the positive effect of foreign exchange, we grew underlying net sales 6%. Net sales for our markets and brands were affected both positively and negatively by COVID-19 throughout fiscal 2021.
◦From a brand perspective, underlying growth was driven by (a) JD RTDs; (b) our premium bourbon brands, led by Woodford Reserve and Old Forester; (c) our tequila brands; (d) the international launch of JDTA; and (e) broad-based growth of JDTH. These gains were partially offset by JDTW declines in (a) Travel Retail and certain emerging markets, largely reflecting the implementation of travel bans and other restrictions related to COVID-19, (b) lower volumes in the on-premise channel, and (c) unfavorable channel mix, most notably in the United States.
◦From a geographic perspective, the United States and developed international markets led the underlying net sales growth, with certain emerging markets also contributing. These gains were partially offset by a decline in underlying net sales in our Travel Retail channel, certain other emerging markets, and sales of used barrels.
•We delivered reported operating income of $1.2 billion, an increase of 7% compared to fiscal 2020. Underlying operating income grew 4% after adjusting for (a) the effect of acquisitions and divestitures, (b) an estimated net decrease in distributor inventories, (c) the positive effect of foreign exchange, (d) the $20 million commitment to the Foundation, and (e) the effect of the Chambord impairment. The increase in underlying operating income reflects underlying net sales growth and operating expense leverage, partially offset by higher input costs, lower fixed cost absorption, and an unfavorable shift in portfolio mix towards lower-margin brands.
•We delivered diluted earnings per share of $1.88, an increase of 9% compared to fiscal 2020, due to an increase in reported operating income and the benefit of a lower effective tax rate. This includes an estimated $0.20 per share benefit from the gain on sale of Early Times, Canadian Mist, and Collingwood and related assets.
•Our return on average invested capital decreased to 19.6% in fiscal 2021, compared to 20.4% in fiscal 2020. This decrease was driven by higher average invested capital.
37
Summary of Operating Performance Fiscal 2020 and Fiscal 2021
| 2020 vs. 2021 | |||||||||||||||||||||||
| Fiscal year ended April 30 | 2020 | 2021 | Reported Change | Underlying Change1 | |||||||||||||||||||
| Net sales | $ | 3,363 | $ | 3,461 | 3 | % | 6 | % | |||||||||||||||
| Cost of sales | 1,236 | 1,367 | 11 | % | 12 | % | |||||||||||||||||
| Gross profit | 2,127 | 2,094 | (2 | %) | 3 | % | |||||||||||||||||
| Advertising | 383 | 399 | 4 | % | 2 | % | |||||||||||||||||
| SG&A | 642 | 671 | 4 | % | — | % | |||||||||||||||||
| Gain on sale of business | $ | — | $ | (127) | NA | NA | |||||||||||||||||
| Other expense (income), net | $ | 11 | $ | (15) | (248 | %) | (33 | %) | |||||||||||||||
| Operating income | $ | 1,091 | $ | 1,166 | 7 | % | 4 | % | |||||||||||||||
Total operating expenses2 | $ | 1,036 | $ | 1,055 | 2 | % | 1 | % | |||||||||||||||
As a percentage of net sales3 | |||||||||||||||||||||||
| Gross profit | 63.2 | % | 60.5 | % | (2.7 | pp) | |||||||||||||||||
| Operating income | 32.4 | % | 33.7 | % | 1.3 | pp | |||||||||||||||||
| Interest expense, net | $ | 77 | $ | 79 | 2 | % | |||||||||||||||||
| Effective tax rate | 18.0 | % | 16.5 | % | (1.5 | pp) | |||||||||||||||||
| Diluted earnings per share | $ | 1.72 | $ | 1.88 | 9 | % | |||||||||||||||||
Return on average invested capital1 | 20.4 | % | 19.6 | % | (0.8 | pp) | |||||||||||||||||
1See “Non-GAAP Financial Measures” above for details on our use of “underlying change” and “return on average invested capital,” including how we calculate these measures and why we think this information is useful to readers.
2Operating expenses include advertising expense, SG&A expense, and other expense (income), net.
3Year-over-year changes in percentages are reported in percentage points (pp).
Fiscal 2022 Outlook
We expect the operating environment to continue to improve, particularly as the on-premise channel recovers and some degree of travel resumes through our Travel Retail channel. The pace of recovery is unknown and will vary depending on the state of the pandemic, vaccinations, and timing of re-openings.
We remain confident in the collective strength of our developed markets as they should benefit from the re-opening of the on-premise channel and increase in tourism. Additionally, we believe our portfolio remains well positioned to capitalize on the continuing spirits premiumization trend. In aggregate, we expect strong growth in our emerging markets, as well as Travel Retail, as we cycle against significant net sales declines in fiscal 2021 and begin to stabilize and recover. Further, we do not expect our non-branded and bulk activities, mainly used barrels sales, to have a material impact on our results.
There are a number of factors that we expect will help improve our gross margin, including lower agave costs, which will reflect a higher mix of internally-sourced agave along with historically high agave costs beginning to reverse. Additionally, the effect of a portfolio mix shift toward our higher-margin brands, a positive channel mix shift as the on-premise continues to recover, and the absence of both lower-margin sales and the TSA related to the Early Times, Canadian Mist, and Collingwood brands, which we sold during fiscal 2021, will also help improve our gross margin. Conversely, factors that we expect to negatively impact our gross margins are an increase in costs related to supply chain disruptions, including transportation costs, and the impact of higher inflation on commodity prices, such as grain and fuel. The European Union tariffs imposed on American whiskey, which began in June of 2019, continue to have a negative effect on our gross margin. The removal of these tariffs would have a positive impact on our gross margin, and business as a whole, while an increase of these tariffs would have a further negative impact on our margins and business. Ultimately, our full-year gross margin will depend not only on the volumes of our business, but the mix of our business by geography, portfolio, channel, and size.
As a result of these factors coupled with unusual comparisons to last year, we expect the seasonality of our results to be volatile during the year, particularly underlying advertising expense and underlying operating income.
38
Outlook for Key Measures:
•We expect both our underlying net sales and underlying operating income to grow in the mid-single digits.
•We expect our underlying operating expenses to grow in the mid-single digits as we continue to invest behind our brands to support our top-line growth and begin to activate a number of strategic initiatives.
•We expect our effective tax rate to be higher than the 16.5% registered in fiscal 2021, reflecting the absence of discrete items. We estimate the effective tax rate to more closely approximate our fiscal 2021 rate from operations of about 21-22%.
•We expect our capital expenditures to be between $130 and $150 million.
39
Results of Operations
Fiscal 2021 Market Highlights
The following table shows net sales results for our largest markets, summarized by geographic area, for fiscal 2021 compared to fiscal 2020. We discuss results of the markets most affecting our performance below the table.
Top Markets | |||||||||||||||||||||||||||||
Net Sales % Change vs. 2020 | |||||||||||||||||||||||||||||
Geographic area1 | % of Fiscal 2021 Net Sales | Reported | Acquisitions and Divestitures | Foreign Exchange | Estimated Net Chg in Distributor Inventories | Underlying2 | |||||||||||||||||||||||
| United States | 50 | % | 3 | % | 1 | % | — | % | 6 | % | 10 | % | |||||||||||||||||
| Developed International | 29 | % | 13 | % | — | % | (6 | %) | 3 | % | 10 | % | |||||||||||||||||
| Australia | 6 | % | 35 | % | — | % | (8 | %) | — | % | 27 | % | |||||||||||||||||
| Germany | 6 | % | 21 | % | — | % | (4 | %) | — | % | 17 | % | |||||||||||||||||
| United Kingdom | 6 | % | 14 | % | — | % | (10 | %) | 2 | % | 6 | % | |||||||||||||||||
| France | 4 | % | 17 | % | — | % | (5 | %) | — | % | 12 | % | |||||||||||||||||
| Canada | 1 | % | 2 | % | 1 | % | 2 | % | 3 | % | 8 | % | |||||||||||||||||
| Rest of Developed International | 6 | % | (10 | %) | — | % | (4 | %) | 8 | % | (6 | %) | |||||||||||||||||
| Emerging | 17 | % | 1 | % | — | % | 4 | % | 1 | % | 6 | % | |||||||||||||||||
| Mexico | 4 | % | (4 | %) | — | % | 9 | % | — | % | 5 | % | |||||||||||||||||
| Poland | 3 | % | 9 | % | — | % | (1 | %) | — | % | 7 | % | |||||||||||||||||
| Brazil | 2 | % | 37 | % | — | % | 28 | % | (1 | %) | 64 | % | |||||||||||||||||
| Russia | 1 | % | (11 | %) | 1 | % | 2 | % | 8 | % | — | % | |||||||||||||||||
| Rest of Emerging | 7 | % | (2 | %) | — | % | 1 | % | (1 | %) | (2 | %) | |||||||||||||||||
| Travel Retail | 2 | % | (50 | %) | — | % | — | % | 1 | % | (48 | %) | |||||||||||||||||
| Non-branded and bulk | 2 | % | (23 | %) | (6 | %) | (1 | %) | — | % | (31 | %) | |||||||||||||||||
| Total | 100 | % | 3 | % | — | % | (1 | %) | 4 | % | 6 | % | |||||||||||||||||
| Note: Results may differ due to rounding | |||||||||||||||||||||||||||||
1See “Definitions” above for definitions of market aggregations presented here.
2See “Non-GAAP Financial Measures” above for details on our use of “underlying change” in net sales, including how we calculate this measure and why we believe this information is useful to readers.
Net sales in all of the markets discussed below were affected either positively or negatively by COVID-19 during fiscal 2021. See “Significant Developments - COVID-19” above for more information on the impact of COVID-19 on our results.
•The United States, our most important market, represented 50% of our reported net sales, which grew 3% in fiscal 2021. Underlying net sales increased 10% after adjusting for an estimated net decrease in distributor inventories and the effect of acquisitions and divestitures. The net decrease in distributor inventories reflects the give back of the fiscal 2020 year-end distributor inventory build due to uncertainty related to COVID-19 as well as distributor inventories at the end of fiscal 2021 that were lower than their pre-COVID-19 levels due to supply chain disruptions, including availability of both glass and timely modes of transportation to ship our products.
Underlying net sales growth was driven by (a) our premium bourbons, led by Woodford Reserve and Old Forester, supported by strong consumer takeaway trends; (b) JD RTDs, fueled by strong consumer demand for Jack Daniel's Country Cocktails and the launch of new spirit-based RTD products; (c) our tequilas, due to higher volumes and prices of Herradura and el Jimador; (d) higher volumes and prices of Korbel Champagne; and (e) volumetric growth of JDTH and Gentleman Jack. This growth was partially offset by lower net sales of JDTW, reflecting volume declines in the on-premise channel along with unfavorable channel mix related to COVID-19 restrictions in the channel, which was partially offset by increased volumes in the off-premise channel.
40
•Developed International markets represented 29% of our reported net sales, which grew 13% in fiscal 2021. Underlying net sales increased 10% after adjusting for the positive effect of foreign exchange and an estimated net decrease in distributor inventories. Underlying net sales growth was led by Australia, Germany, France, and the United Kingdom, partially offset by declines in Spain and Czechia reflecting COVID-19 related closures in these heavy tourism and on-premise-focused markets.
◦Australia's underlying net sales growth was driven by higher volumes of JD RTDs, fueled by strong consumer demand, and volumetric growth of our American whiskey brands.
◦Germany's underlying net sales growth was fueled by the volumetric gains of JD RTDs due to strong consumer demand and the launch of JDTA.
◦France's underlying net sales growth was driven by the launch of JDTA and higher volumes of JDTH and JDTW.
◦The United Kingdom's underlying net sales growth was driven by the launch of JDTA and higher volumes of JDTH, partially offset by lower net sales of JDTW, reflecting volume declines in the on-premise channel related to COVID-19 restrictions.
◦Underlying net sales in the Rest of Developed International declined primarily due to lower volumes of JDTW in Spain and Czechia as noted above.
•Emerging markets represented 17% of our reported net sales, which grew 1% in fiscal 2021. Underlying net sales increased 6% after adjusting for the negative effect of foreign exchange and an estimated net decrease in distributor inventories. Underlying net sales growth was driven by (a) higher volumes of JDTW in Brazil, Poland, and China; (b) higher volumes of New Mix in Mexico; (c) the continued launch of JDTA, most notably in Brazil; and (d) growth of JDTH, most notably in Brazil. This growth was partially offset by (a) JDTW declines in certain markets, reflecting declines in tourism and consumers trading down to lower-priced brands, (b) lower volumes of Herradura in Mexico, and (c) broad-based declines of Finlandia led by Russia and Poland.
◦Mexico's underlying net sales growth reflects higher volumes of New Mix supported by increased demand and shelf space as a result of the temporary supply disruption of the beer industry early in fiscal 2021 due to COVID-19 production-related shutdowns and expanding consumer takeaway. This growth was partially offset by lower volumes of Herradura and JDTW largely due to consumers trading down to lower-priced brands.
◦Poland's underlying net sales growth was fueled by higher volumes of JDTW, partially offset by lower volumes of Finlandia, including the adverse effect of COVID-19.
◦Brazil's underlying net sales growth was driven by higher volumes of JDTW, the launch of JDTA, and volumetric growth of JDTH.
◦Underlying net sales in the Rest of Emerging decreased as declines of JDTW in a number of markets, primarily Southeast Asia and India, were partially offset by growth for the brand in China, Ukraine, and Turkey.
•Travel Retail represented 2% of our reported net sales and declined 50% in fiscal 2021. Underlying net sales decreased 48% after adjusting for an estimated net decrease in distributor inventories. The underlying net sales decline was driven by lower volumes across much of our portfolio due to travel bans and other restrictions related to COVID-19.
•Non-branded and bulk represented 2% of our reported net sales and declined 23% in fiscal 2021. Underlying net sales decreased 31% after adjusting for the effect of acquisitions and divestitures and the positive effect of foreign exchange. Lower prices and volumes for used barrels drove the reduction compared to the same period last year.
41
Fiscal 2021 Brand Highlights
The following table highlights the global results of our largest brands for fiscal 2021 compared to fiscal 2020. We discuss results of the brands most affecting our performance below the table.
Major Brands | ||||||||||||||||||||||||||
| Volumes | Net Sales % Change vs. 2020 | |||||||||||||||||||||||||
Product category / brand family / brand1 | 9L Depletions1 | Reported | Acquisitions & Divestitures | Foreign Exchange | Estimated Net Chg in Distributor Inventories | Underlying2 | ||||||||||||||||||||
| Whiskey | 12 | % | 3 | % | 1 | % | (1 | %) | 4 | % | 7 | % | ||||||||||||||
| Jack Daniel’s family of brands | 12 | % | 1 | % | — | % | (1 | %) | 4 | % | 4% | |||||||||||||||
| JDTW | (4 | %) | (8 | %) | — | % | (1 | %) | 4 | % | (4%) | |||||||||||||||
| JD RTD/RTP | 32 | % | 39 | % | — | % | (2 | %) | (3 | %) | 34% | |||||||||||||||
| JDTH | 10 | % | 14 | % | — | % | (1 | %) | (2 | %) | 11% | |||||||||||||||
| Gentleman Jack | 15 | % | 11 | % | — | % | (1 | %) | 2 | % | 13 | % | ||||||||||||||
| JDTF | 4 | % | (3 | %) | — | % | — | % | 7 | % | 3 | % | ||||||||||||||
| JDTA | 120 | % | 24 | % | — | % | (2 | %) | 76 | % | 98 | % | ||||||||||||||
| Other Jack Daniel’s whiskey brands | — | % | 1 | % | — | % | (2 | %) | 6 | % | 6 | % | ||||||||||||||
| Woodford Reserve | 18 | % | 16 | % | — | % | — | % | 5 | % | 20 | % | ||||||||||||||
| Tequila | 20 | % | 9 | % | — | % | 4 | % | 1 | % | 14 | % | ||||||||||||||
| Herradura | (2 | %) | 15 | % | — | % | 2 | % | (1 | %) | 15 | % | ||||||||||||||
| el Jimador | (5 | %) | 2 | % | — | % | 1 | % | 4 | % | 7 | % | ||||||||||||||
| Wine | 10 | % | 10 | % | — | % | — | % | 3 | % | 14 | % | ||||||||||||||
| Vodka (Finlandia) | (14 | %) | (18 | %) | — | % | — | % | 2 | % | (16 | %) | ||||||||||||||
| Rest of Portfolio | 1 | % | 37 | % | (4 | %) | (26 | %) | (1 | %) | 6 | % | ||||||||||||||
| Non-branded and bulk | NA | (23 | %) | (6 | %) | (1 | %) | — | % | (31 | %) | |||||||||||||||
| Note: Results may differ due to rounding | ||||||||||||||||||||||||||
1See “Definitions” above for definitions of brand aggregations and volume measures presented here.
2See “Non-GAAP Financial Measures” above for details on our use of “underlying change” in net sales, including how we calculate this measure and why we believe this information is useful to readers.
Net sales for all of the brands discussed below were affected either positively or negatively by COVID-19 during fiscal 2021. See “Significant Developments - COVID-19” above for more information on the impact of COVID-19 on our results.
•Whiskey brands grew volumes 12% in fiscal 2021. Reported net sales grew 3%, while underlying net sales increased 7% after adjusting for an estimated net decrease in distributor inventories, the positive effect of foreign exchange, and the effect of acquisitions and divestitures. Underlying net sales growth was driven by (a) the growth of JD RTDs; (b) our premium bourbons, led by Woodford Reserve and Old Forester, supported by strong consumer takeaway trends; (c) the launch of JDTA in certain international developed and emerging markets; and (d) volumetric growth of JDTH and Gentleman Jack. This growth was partially offset by JDTW declines.
◦The Jack Daniel's family of brands grew underlying net sales driven by JD RTDs, the launch of JDTA in certain international developed and emerging markets, and higher volumes of JDTH and Gentleman Jack, partially offset by declines of JDTW.
•JDTW generates a significant percentage of our total net sales and is our top priority. The brand is the largest spirit brand in the world priced over $25 per 750 ml per bottle1 and the world's fourth-largest premium spirits brand measured by volume.2 The underlying net sales declines for JDTW were driven by (a) lower volumes in
1IWSR, 2020. | |||||
2Based on industry statistics published by Impact Databank, a well-known U.S. trade publication, in March 2021 | |||||
42
Travel Retail and certain emerging markets, largely reflecting the travel bans and other restrictions related to COVID-19; (b) lower volumes in the on-premise channel in the United States and many developed international markets; and (c) unfavorable channel mix, notably in the United States, related to COVID-19 restrictions in the on-premise channel, which was partially offset by increased volumes in the off-premise channel in those markets.
•The increase in underlying net sales growth for Jack Daniel's RTD/RTP was driven by volumetric gains in the United States (fueled by Jack Daniel's Country Cocktails, along with the launch of new spirit-based RTD products), Australia, and Germany, which was supported by strong consumer takeaway trends.
•Since its introduction in late fiscal 2011, JDTH has contributed significantly to our net sales growth. JDTH is the second-largest selling flavored whiskey1 and remains one of the top 25 largest brands in the world priced over $25 per 750 ml bottle.2 Underlying net sales growth was fueled by broad-based volumetric gains, primarily in the United States, various European markets, and Brazil, partially offset by declines in Travel Retail due to the implementation of travel bans and other restrictions related to COVID-19.
•The underlying net sales growth of Gentleman Jack, which was selected as an Impact “Hot Brand”1, was driven by broad-based growth led by increased volumes in the United States reflecting the brand's high exposure to the off-premise channel. These gains were partially offset by declines in Travel Retail reflecting travel bans and other restrictions related to COVID-19.
•The underlying net sales growth of JDTA was fueled by the brand's launch in certain international developed and emerging markets, notably in the United Kingdom, France, Germany, and Brazil.
◦Woodford Reserve is the leading super-premium American whiskey globally2, and is poised for continued growth as the bourbon category continues to grow around the world. The brand was once again selected as an Impact “Hot Brand.”1 The United States is by far the brand's most important market and was responsible for most of its growth during fiscal 2021. This growth was partially offset by declines in Travel Retail reflecting travel bans and other restrictions related to COVID-19. We plan to continue to devote substantial resources to Woodford Reserve to support its growth potential with sustained advertising, including our Kentucky Derby sponsorship, along with the fiscal 2021 approval of a $125 million capital investment to expand our bourbon-making capacity in Kentucky.
•Tequila volumes grew 20% in fiscal 2021. Reported net sales increased 9%, while underlying net sales grew 14% after adjusting for the negative effect of foreign exchange and an estimated net decrease in distributor inventories. The increase in underlying net sales was driven by (a) Herradura and el Jimador growth in the United States; and (b) higher volumes of New Mix in Mexico supported by increased demand and shelf space as a result of the temporary supply disruption of the beer industry in the first quarter due to COVID-19 related production shutdowns, and expanding consumer takeaway. This growth was partially offset by Herradura and el Jimador declines in Mexico.
◦Herradura's underlying net sales growth was driven by increased volumes and higher prices in the United States, partially offset by lower volumes in Mexico. We remain focused on developing Herradura in the important United States market (which we believe has considerable potential for growth) and strengthening our position in Mexico.
◦el Jimador remains one of the top ten largest selling tequilas measured by volume.2 Underlying net sales growth was driven by increased volumes and higher prices in the United States, partially offset by lower volumes in Mexico.
•Wine grew volumes 10% in fiscal 2021. Reported net sales also grew 10%, while underlying net sales increased 14% after adjusting for an estimated net decrease in distributor inventories. Underlying net sales growth was driven by volumetric growth and higher prices of Korbel Champagne in the United States, where this brand is focused.
•Finlandia volumes fell 14% in fiscal 2021. Reported net sales decreased 18%, while underlying net sales declined 16% after adjusting for an estimated net decrease in distributor inventories. The decrease in underlying net sales was driven by volume declines, primarily in Travel Retail and Russia.
•Non-branded and bulk. See discussion for this aggregation in “Results of Operations - Fiscal 2021 Market Highlights” above.
1Impact Databank published the Impact's “Hot Brands - Spirits” list in March 2021. | |||||
2IWSR, 2020. | |||||
43
Year-Over-Year Comparisons
Commentary below compares fiscal 2021 to fiscal 2020 results. A comparison of fiscal 2020 to fiscal 2019 results may be found in “Part II, Item 7, Management's Discussion and Analysis of Financial Condition and Results of Operations” of our Annual Report on Form 10-K for the fiscal year ended April 30, 2020, as amended (2020 Form 10-K).
COVID-19 affected our results both positively and negatively during fiscal 2021. See “Significant Developments - COVID-19” above for more information on the impact of COVID-19 on our business.
Net Sales | |||||
| Percentage change versus the prior fiscal year ended April 30 | 2021 | ||||
| Change in reported net sales | 3 | % | |||
| Acquisitions and divestitures | — | % | |||
| Foreign exchange | (1 | %) | |||
| Estimated net change in distributor inventories | 4 | % | |||
| Change in underlying net sales | 6 | % | |||
| Change in underlying net sales attributed to: | |||||
| Volume | 12 | % | |||
| Price/mix | (6 | %) | |||
| Note: Results may differ due to rounding | |||||
Net sales of $3.5 billion increased 3%, or $98 million, in fiscal 2021 compared to fiscal 2020. After adjusting reported results for an estimated net decrease in distributor inventories and the positive effect of foreign exchange, underlying net sales grew 6%. The net decrease in distributor inventories reflects the give back of the fiscal 2020 year-end distributor inventory build due to uncertainty related to COVID-19 as well as distributor inventories at the end of fiscal 2021 that were lower than their pre-COVID-19 levels due to supply chain disruptions, including availability of both glass and timely modes of transportation to ship our products globally. The increase in underlying net sales was driven by higher volumes, partially offset by unfavorable price/mix. Volume growth was led by JD RTDs, New Mix, JDTA, and JDTH, partially offset by declines of JDTW and Finlandia. Unfavorable price/mix was driven by faster growth from our lower-priced brands (JD RTDs and New Mix) and a channel mix shift from the on-premise (primarily for JDTW in the United States) related to COVID-19 restrictions. See “Results of Operations - Fiscal 2021 Market Highlights” and “Results of Operations - Fiscal 2021 Brand Highlights” above for details on the factors contributing to the change in underlying net sales for fiscal 2021.
Cost of Sales | |||||
| Percentage change versus the prior fiscal year ended April 30 | 2021 | ||||
| Change in reported cost of sales | 11 | % | |||
| Foreign exchange | (1 | %) | |||
| Estimated net change in distributor inventories | 2 | % | |||
| Change in underlying cost of sales | 12 | % | |||
| Change in underlying cost of sales attributed to: | |||||
| Volume | 12 | % | |||
| Cost/mix | — | % | |||
| Note: Results may differ due to rounding | |||||
Cost of sales of $1.4 billion increased $131 million, or 11%, in fiscal 2021 compared to fiscal 2020. Underlying cost of sales grew 12% after adjusting for an estimated net decrease in distributor inventories and the negative effect of foreign exchange. The increase in underlying cost of sales was driven by higher volumes. Volume growth was led by JD RTDs, New Mix, JDTA, and JDTH, partially offset by declines of JDTW and Finlandia. A shift in portfolio mix toward our lower-cost brands (New Mix and JD RTDs) was offset by higher input costs related to wood and agave along with lower fixed cost absorption for JDTW.
44
Gross Profit | |||||
| Percentage change versus the prior fiscal year ended April 30 | 2021 | ||||
| Change in reported gross profit | (2 | %) | |||
| Acquisitions and divestitures | 1 | % | |||
| Foreign exchange | (1 | %) | |||
| Estimated net change in distributor inventories | 4 | % | |||
| Change in underlying gross profit | 3 | % | |||
| Note: Results may differ due to rounding | |||||
Gross Margin | |||||
| Fiscal year ended April 30 | 2021 | ||||
| Prior year gross margin | 63.2 | % | |||
| Price/mix | (0.5 | %) | |||
| Cost | (2.0 | %) | |||
| Acquisitions and divestitures | (0.2 | %) | |||
| Change in gross margin | (2.7 | %) | |||
| Current year gross margin | 60.5 | % | |||
| Note: Results may differ due to rounding | |||||
Gross profit of $2.1 billion decreased $33 million, or 2%, in fiscal 2021 compared to fiscal 2020. Underlying gross profit increased 3% after adjusting for (a) an estimated net decrease in distributor inventories, (b) the positive effect of foreign exchange, and (c) the effect of acquisitions and divestitures. Gross margin decreased to 60.5% in fiscal 2021, down 2.7 percentage points from 63.2% in fiscal 2020. The decrease in gross margin was driven primarily by higher input costs related to wood and agave, lower fixed cost absorption for JDTW, an unfavorable shift in portfolio mix toward our lower-margin brands (New Mix and JD RTDs), and an unfavorable channel mix shift from the on-premise (primarily for JDTW in the United States) related to COVID-19 restrictions.
Operating Expenses | |||||||||||||||||
| Percentage change versus the prior year period ended April 30 | |||||||||||||||||
| 2021 | Reported | Foundation | Chambord Impairment | Foreign Exchange | Underlying | ||||||||||||
| Advertising | 4 | % | — | % | — | % | (2 | %) | 2 | % | |||||||
| SG&A | 4 | % | (3 | %) | — | % | (1 | %) | — | % | |||||||
Total operating expenses1 | 2 | % | (2 | %) | 1 | % | — | % | 1 | % | |||||||
| Note: Results may differ due to rounding | |||||||||||||||||
1Operating expenses include advertising expense, SG&A expense, and other expense (income), net.
Operating expenses totaled $1.1 billion and increased $19 million, or 2%, in fiscal 2021 compared to fiscal 2020. Underlying operating expenses increased 1% after adjusting for the $20 million commitment to the Foundation and the effect of the Chambord impairment.
•Reported advertising expenses increased 4% in fiscal 2021 compared to fiscal 2020, while underlying advertising expenses increased 2% after adjusting for the negative effect of foreign exchange. The increase in underlying advertising expense was driven primarily by higher spend in support of the international launch of JDTA in certain international developed and emerging markets along with increased spend for Woodford Reserve compared to the same period last year, partially due to the timing of the Kentucky Derby.
•Reported SG&A expenses increased 4% in fiscal 2021 compared to fiscal 2020, while underlying SG&A was flat after adjusting for the $20 million commitment to the Foundation and the negative effect of foreign exchange. Underlying SG&A was flat as higher compensation-related costs were offset by the tight management of discretionary spend (including hiring and travel freezes) as a result of the COVID-19 environment.
45
Operating Income | |||||
| Percentage change versus the prior fiscal year ended April 30 | 2021 | ||||
| Change in reported operating income | 7 | % | |||
| Acquisitions and divestitures | (10 | %) | |||
| Foundation | 2 | % | |||
| Chambord impairment | (1 | %) | |||
| Foreign exchange | (2 | %) | |||
| Estimated net change in distributor inventories | 9 | % | |||
| Change in underlying operating income | 4 | % | |||
| Note: Results may differ due to rounding | |||||
Operating income was $1.2 billion in fiscal 2021, an increase of $75 million, or 7%, compared to fiscal 2020. Underlying operating income increased 4% after adjusting for (a) the effect of acquisitions and divestitures, (b) an estimated net decrease in distributor inventories, (c) the positive effect of foreign exchange, (d) the $20 million commitment to the Foundation, and (e) the effect of the Chambord impairment. Operating margin increased 1.3 percentage points to 33.7% in fiscal 2021 from 32.4% in fiscal 2020. The increase in operating margin was driven by the effect of acquisitions and divestitures (primarily the sale of Early Times, Canadian Mist, and Collingwood), partially offset by higher input costs (related to wood and agave along with lower fixed cost absorption for JDTW) and an unfavorable shift in portfolio mix toward our lower-margin brands (New Mix and JD RTDs).
Interest expense (net) increased $2 million, or 2%, in fiscal 2021 compared to fiscal 2020, due to lower interest income driven by lower interest rates on our interest-bearing investments.
Our effective tax rate for fiscal 2021 was 16.5% compared to 18.0% in fiscal 2020. The decrease in our effective tax rate was driven primarily by a deferred tax benefit related to an intercompany transfer of assets, partially offset by a smaller stock-based compensation deduction and a lower prior-year true-up benefit. See Note 11 to the Consolidated Financial Statements for details.
Diluted earnings per share were $1.88 in fiscal 2021, an increase of 9% from $1.72 in fiscal 2020 due to an increase in reported operating income and the benefit of a lower effective tax rate. This includes an estimated $0.20 per share benefit from the gain on sale of Early Times, Canadian Mist, and Collingwood and related assets.
46
Liquidity and Capital Resources
Our ability to generate cash from operations consistently is one of our most significant financial strengths. Our strong cash flows enable us to invest in our people, invest in our brands, invest in our assets, pay regular dividends, make strategic acquisitions that we believe will enhance shareholder value, repurchase shares of common stock, and, from time to time, pay special dividends.
Cash Flow Summary | ||||||||||||||
| (Dollars in millions) | 2020 | 2021 | ||||||||||||
| Operating activities | $ | 724 | $ | 817 | ||||||||||
| Investing activities: | ||||||||||||||
| Proceeds from sale of business | — | 177 | ||||||||||||
| Acquisition of business | (22) | (14) | ||||||||||||
| Additions to property, plant, and equipment | (113) | (62) | ||||||||||||
| Computer software expenditures | (6) | (3) | ||||||||||||
| (141) | 98 | |||||||||||||
| Financing activities: | ||||||||||||||
| Net change in short-term borrowings | 178 | (126) | ||||||||||||
| Dividends paid | (325) | (338) | ||||||||||||
| Other | (44) | (21) | ||||||||||||
| (191) | (485) | |||||||||||||
| Foreign exchange effect on cash and cash equivalents | (24) | 45 | ||||||||||||
| Net increase in cash and cash equivalents | $ | 368 | $ | 475 | ||||||||||
Cash and cash equivalents increased $475 million in fiscal 2021, compared to an increase of $368 million in fiscal 2020. Cash provided by operations of $817 million was up $93 million from fiscal 2020, primarily reflecting lower working capital requirements.
Cash provided by investing activities was $98 million during fiscal 2021, an increase of $239 million compared to the prior year. The increase primarily reflects (a) the proceeds of $177 million from our divestiture of the Early Times, Canadian Mist, and Collingwood brands and related assets and (b) a $54 million decline in capital expenditures for fixed assets and computer software.
Cash used for financing activities was $485 million during fiscal 2021, compared to $191 million for fiscal 2020. The $294 million change was largely attributable to a $304 million increase in net repayments of short-term borrowings.
The impact on cash and cash equivalents as a result of exchange rate changes was an increase of $45 million for fiscal 2021, compared to a decrease of $24 million in the prior fiscal year.
A discussion of our cash flows for fiscal 2020 compared to fiscal 2019 may be found in “Part II, Item 7, Management's Discussion and Analysis of Financial Condition and Results of Operations,” of our Annual Report on Form 10-K for the year ended April 30, 2020.
Sources of Liquidity
We generate strong cash flow from operations, which enables us to meet current obligations, fund capital expenditures, pay growing regular dividends, and return cash to our shareholders from time to time through share repurchases and special dividends. Our investment-grade credit ratings (A1 by Moody's and A- by Standard & Poor's) provide us with financial flexibility when accessing global credit markets and allow us to reserve adequate debt capacity for investment opportunities and unforeseen events.
To ensure uninterrupted business operations during the ongoing COVID-19 pandemic, and to preserve adequate liquidity during these uncertain times, we have (a) managed our operating expenses closely and limited discretionary spending, (b) re-prioritized capital projects where prudent, and (c) actively managed our working capital.
Our cash flow from operations is supplemented by our cash and cash equivalent balances, as well as access to other liquidity sources. Cash and cash equivalents were $675 million at April 30, 2020, and $1,150 million at April 30, 2021. As of April 30, 2021, approximately 55% of our cash and cash equivalents were held by our foreign subsidiaries whose earnings we
47
expect to reinvest indefinitely outside of the United States. We continue to evaluate our future cash deployment and may decide to repatriate additional cash held by our foreign subsidiaries, which may require us to provide for and pay additional taxes.
We have an $800 million commercial paper program that we regularly use to fund our short-term operational needs. Please see Note 6 to the Consolidated Financial Statements for outstanding commercial paper balances, interest rates, and days to maturity at April 30, 2020 and April 30, 2021. The average balances, interest rates, and original maturities during the periods ended April 30, 2020 and 2021, are presented below.
| (Amounts in millions) | Three Months Average | Fiscal Year Average | |||||||||||||||||||||
| April 30, | April 30, | ||||||||||||||||||||||
| 2020 | 2021 | 2020 | 2021 | ||||||||||||||||||||
| Average commercial paper | $ | 196 | $ | 259 | $ | 251 | $ | 321 | |||||||||||||||
| Average interest rate | 1.64 | % | 0.23 | % | 2.14 | % | 0.49 | % | |||||||||||||||
| Average days to maturity at issuance | 46 | 72 | 35 | 116 | |||||||||||||||||||
Our commercial paper program is supported by available commitments under our undrawn $800 million bank credit facility that expires in November 2023. Although unlikely, under extreme market conditions, one or more participating banks may not be able to fund its commitments under our credit facility. To manage this counterparty credit risk, we partner with banks that have investment grade credit ratings, limit the amount of exposure we have with each bank, and monitor the financial conditions of each bank.
While we expect to meet our short-term liquidity needs largely through cash generated from operations and borrowings under our commercial paper program, a sustained market deterioration resulting in declines in net sales and profit could require us to evaluate alternative sources of liquidity. Should we have additional liquidity needs, we believe that we could access long-term financing in the debt capital markets.
We believe our current liquidity position, supplemented by our ability to generate positive cash flows from operations in the future, and our ample debt capacity enabled by our strong short-term and long-term credit ratings, will be sufficient to meet all of our future financial commitments.
As announced on May 27, 2021, our Board of Directors declared a regular quarterly cash dividend of $0.1795 per share on our Class A and Class B common stock. Stockholders of record on June 8, 2021, will receive the dividend on July 1, 2021.
Off-Balance Sheet Arrangements
As of April 30, 2021, we were not involved in any off-balance sheet arrangements that have or are reasonably likely to have a material effect on our financial condition, results of operations, or liquidity.
48
Long-Term Obligations
We have long-term obligations related to contracts, leases, borrowing arrangements, and employee benefit plans that we enter into in the normal course of business (see Notes 5, 6, 9 and 15 to the Consolidated Financial Statements). The following table summarizes the amounts of those obligations as of April 30, 2021, and the years when they are expected to be paid.1 We expect to meet these obligations with internally generated funds.
| (Dollars in millions) | Total | 2022 | 2023-2024 | 2025-2026 | After 2026 | |||||||||||||||||||||||||||
| Long-term debt | $ | 2,382 | $ | — | $ | 250 | $ | 300 | $ | 1,832 | ||||||||||||||||||||||
| Interest on long-term debt | 1,104 | 75 | 144 | 128 | 757 | |||||||||||||||||||||||||||
| Tax Act repatriation tax | 57 | 6 | 17 | 34 | — | |||||||||||||||||||||||||||
| Grape purchases | 17 | 10 | 7 | — | — | |||||||||||||||||||||||||||
| Leases | 73 | 21 | 28 | 12 | 12 | |||||||||||||||||||||||||||
Postretirement benefits2 | 20 | 20 | n/a | n/a | n/a | |||||||||||||||||||||||||||
Agave purchases3 | 38 | n/a | n/a | n/a | n/a | |||||||||||||||||||||||||||
| Total | $ | 3,691 | $ | 132 | $ | 446 | $ | 474 | $ | 2,601 | ||||||||||||||||||||||
1Excludes liabilities for tax uncertainties, as we cannot reasonably predict their ultimate amount or timing of settlement.
2As of April 30, 2021, we have unfunded pension and other postretirement benefit obligations of $225 million. Because we cannot determine the specific periods in which those obligations will be funded, the table above reflects no amounts related to those obligations other than the $20 million of expected contributions in fiscal 2022.
3As discussed in Note 5 to the Consolidated Financial Statements, we have obligations to purchase agave, a plant whose sap forms the raw material for tequila. As of April 30, 2021, based on current market prices, obligations under these contracts totaled $38 million. Because we cannot determine the specific periods in which those obligations will be paid, the above table reflects only the total related to those obligations.
Critical Accounting Policies and Estimates
Our financial statements reflect some estimates involved in applying the following critical accounting policies that entail uncertainties and subjectivity. Using different estimates or policies could have a material effect on our operating results and financial condition.
Goodwill and Other Intangible Assets
We have obtained most of our brands by acquiring other companies. When we acquire another company, we first allocate the purchase price to identifiable assets and liabilities, including intangible brand names and trademarks (“brand names”), based on estimated fair value. We then record any remaining purchase price as goodwill. We do not amortize goodwill or other intangible assets with indefinite lives. We consider all of our brand names to have indefinite lives.
We assess our goodwill and other indefinite-lived intangible assets for impairment at least annually, or more frequently if circumstances indicate the carrying amount may be impaired. Goodwill is impaired when the carrying amount of the related reporting unit exceeds its estimated fair value, in which case we write down the goodwill by the amount of the excess (limited to the carrying amount of the goodwill). We estimate the reporting unit's fair value using discounted estimated future cash flows or market information. Similarly, a brand name is impaired when its carrying amount exceeds its estimated fair value, in which case we write down the brand name to its estimated fair value. We typically estimate the fair value of a brand name using either the “relief from royalty” or “excess earnings” method. We also consider market values for similar assets when available. Considerable management judgment is necessary to estimate fair value, including making assumptions about future cash flows, net sales, discount rates, and royalty rates.
We have the option, before quantifying the fair value of a reporting unit or brand name, to evaluate qualitative factors to assess whether it is more likely than not that our goodwill or brand names are impaired. If we determine that is not the case, then we are not required to quantify the fair value. That assessment also takes considerable management judgment.
Based on our assumptions, we believe none of our goodwill or other intangibles are impaired. Further, we estimate the fair values of goodwill and other intangible assets substantially exceed their carrying amounts, with the exception of one of our brand name intangible assets. As of April 30, 2021, the carrying amount of this brand name was $264 million. Net sales attributable to this brand name currently represents approximately 3% of our consolidated net sales. Reasonably possible changes in the assumptions used to estimate the fair value of this brand name could result in a non-cash impairment charge in the future. For example, we estimate that all else equal (a) a 15% decline in projected future cash flows would result in an
49
impairment charge of approximately $3 million or (b) a 1 percentage point increase in the discount rate would result in an impairment charge of approximately $15 million.
Pension and Other Postretirement Benefits
We sponsor various defined benefit pension plans and postretirement plans providing retiree health care and retiree life insurance benefits. Benefits are based on factors such as years of service and compensation level during employment. We expense the benefits expected to be paid over employees' expected service. This requires us to make assumptions to determine the net benefit costs and obligations, such as discount rates, return on plan assets, the rate of salary increases, expected service, and health care cost trend rates. We review these assumptions annually and modify them based on current rates and trends when appropriate. The assumptions also reflect our historical experience and management's best judgment regarding future expectations. We believe the discount rates and expected return on plan assets are the most significant assumptions.
The discount rate used to measure the benefit obligations is determined at the beginning of each fiscal year using a yield curve based on the interest rates of high-quality debt securities with maturities corresponding to the expected timing of our benefit payments. The service cost and interest cost components are measured by applying the specific spot rates along that yield curve. The expected return on pension plan assets reflects expected capital market returns for each asset class that are based on historical returns, adjusted for the expected effects of diversification and active management (net of fees) of the assets.
The following table compares the assumed discount rates and expected return on assets used in determining net periodic benefit cost for fiscal 2021 to those to be used in determining that cost for fiscal 2022.
| Pension Benefits | Medical and Life Insurance Benefits | ||||||||||||||||||||||
| 2021 | 2022 | 2021 | 2022 | ||||||||||||||||||||
| Discount rate for service cost | 3.49 | % | 3.36 | % | 3.59 | % | 3.49 | % | |||||||||||||||
| Discount rate for interest cost | 2.56 | % | 2.24 | % | 2.47 | % | 2.27 | % | |||||||||||||||
| Expected return on plan assets | 6.50 | % | 6.25 | % | n/a | n/a | |||||||||||||||||
Using these assumptions, we estimate our pension and other postretirement benefit cost for fiscal 2022 will be approximately $29 million, compared to $33 million for fiscal 2021. Decreasing/increasing the assumed discount rates by 50 basis points would increase/decrease the total fiscal 2022 cost by approximately $5 million. Decreasing/increasing the assumed return on plan assets by 50 basis points would increase/decrease the total fiscal 2022 cost by approximately $4 million.
Income Taxes
Significant judgment is required in evaluating our tax positions. We establish liabilities when some positions are likely to be challenged and may not succeed, despite our belief that our tax return positions are fully supportable. We adjust these liabilities in light of changing circumstances, such as the progress of a tax audit. We believe current liabilities are appropriate for all known contingencies, but this situation could change.
Years can elapse before we can resolve a particular matter for which we may have established a tax liability. Although predicting the final outcome or the timing of resolution of any particular tax matter can be difficult, we believe our liabilities reflect the likely outcome of known tax contingencies. Unfavorable settlement of any particular issue could require use of our cash and increase our effective tax rate. Conversely, a favorable resolution could result in reduced cash tax payments, the reversal of previously established liabilities, or some combination of these results, which could reduce our effective tax rate.
Item 7A. Quantitative and Qualitative Disclosures about Market Risk
Market risks
Our enterprise risk management process is intended to ensure that we take risks knowingly and thoughtfully and that we balance potential risks and rewards. Our integrated enterprise risk management framework is designed to identify, evaluate, communicate, and appropriately mitigate risks across our operations.
We face market risks arising from changes in foreign currency exchange rates, commodity prices, and interest rates. We manage market risks through procurement strategies as well as the use of derivative and other financial instruments. Our risk management program is governed by policies that authorize and control the nature and scope of transactions that we use to mitigate market risks. Our policy permits the use of derivative financial instruments to mitigate market risks but prohibits their use for speculative purposes.
50
Foreign currency exchange rate risk. Foreign currency fluctuations affect our net investments in foreign subsidiaries and foreign currency-denominated cash flows. In general, we expect our cash flows to be negatively affected by a stronger dollar and positively affected by a weaker dollar. Our most significant foreign currency exposures include the euro, the British pound, the Australian dollar, and the Polish zloty. We manage our foreign currency exposures through derivative financial instruments, principally foreign currency forward contracts, and debt denominated in foreign currency. We had outstanding currency derivatives with notional amounts totaling $1,026 million and $1,218 million at April 30, 2020 and 2021, respectively.
We estimate that a hypothetical 10% weakening of the dollar compared to exchange rates of hedged currencies as of April 30, 2021, would decrease the fair value of our then-existing foreign currency derivative contracts by approximately $81 million. This hypothetical change in fair value does not consider the expected inverse change in the underlying foreign currency exposures.
Commodity price risk. Commodity price changes can affect our production and supply chain costs. Our most significant commodities exposures include wood, corn, agave, malted barley, rye, and natural gas. We manage certain exposures through forward purchase contracts.
Interest rate risk. Interest rate changes affect (a) the fair value of our fixed-rate debt, and (b) cash flows and earnings related to our variable-rate debt and interest-bearing investments. In addition to currently outstanding debt, any potential future debt offerings are subject to interest rate risk.
As of April 30, 2021, our cash and cash equivalents ($1,150 million) and short-term commercial paper borrowings ($195 million) were exposed to interest rate changes. Based on the then-existing balances of our variable-rate debt and interest-bearing investments, a hypothetical one percentage point increase in interest rates would result in a negligible decrease in net interest expense.
See Notes 13 and 14 to the Consolidated Financial Statements for details on our foreign currency exchange rate risk. See Note 5 to the Consolidated Financial Statements for details on our grape and agave purchase obligations, which are exposed to commodity price risk, and “Critical Accounting Policies and Estimates” in “Item 7. Management's Discussion and Analysis of Financial Condition and Results of Operations” for a discussion of our pension and other postretirement plans' exposure to interest rate risks. Also see “Item 1A. Risk Factors” for details on how economic conditions affecting market risks also affect the demand for and pricing of our products and how we are affected by exchange rate fluctuations.
51
Item 8. Financial Statements and Supplementary Data
| Table of Contents | |||||
| Page | |||||
52
Reports of Management
Management’s Responsibility for Financial Statements
Our management is responsible for preparing, presenting, and ensuring the integrity of the financial information presented in this report. The consolidated financial statements were prepared in conformity with accounting principles generally accepted in the United States, including amounts based on management’s best estimates and judgments. In management’s opinion, the consolidated financial statements fairly present the Company’s financial position, results of operations, and cash flows.
The Audit Committee of the Board of Directors, comprising only independent directors, meets regularly with our external auditors, the independent registered public accounting firm Ernst & Young LLP (EY); with our internal auditors; and with representatives of management to review accounting, internal control structure, and financial reporting matters. Our internal auditors and EY have full, free access to the Audit Committee. As set forth in our Code of Conduct and Corporate Governance Guidelines, we are firmly committed to adhering to the highest standards of moral and ethical behavior in our business activities.
Management’s Report on Internal Control over Financial Reporting
Management is also responsible for establishing and maintaining effective internal control over financial reporting, as defined in Rules 13a-15(f) and 15d-15(f) under the Securities Exchange Act of 1934, as amended. Our internal control over financial reporting is designed to provide reasonable assurance regarding the reliability of financial reporting and the preparation of financial statements for external purposes in accordance with accounting principles generally accepted in the United States. Because of its inherent limitations, internal control over financial reporting may not prevent or detect misstatements.
As of the end of our fiscal year, management conducted an assessment of the effectiveness of our internal control over financial reporting based on the framework and criteria in Internal Control – Integrated Framework (2013) issued by the Committee of Sponsoring Organizations of the Treadway Commission. Based on this assessment, management concluded that our internal control over financial reporting was effective as of April 30, 2021. EY, which audited and reported on the Company’s consolidated financial statements, has audited the effectiveness of our internal control over financial reporting as of April 30, 2021, as stated in their report.
| Dated: | June 21, 2021 | ||||||||||
| By: | /s/ Lawson E. Whiting | ||||||||||
| Lawson E. Whiting | |||||||||||
President and Chief Executive Officer | |||||||||||
| By: | /s/ Jane C. Morreau | ||||||||||
| Jane C. Morreau | |||||||||||
Executive Vice President and Chief Financial Officer | |||||||||||
53
Report of Independent Registered Public Accounting Firm
To the Board of Directors and Stockholders of Brown-Forman Corporation
Opinion on the Financial Statements
We have audited the consolidated balance sheet of Brown-Forman Corporation and its subsidiaries (the “Company”) as of April 30, 2020 and the related consolidated statements of operations, comprehensive income, stockholders’ equity and cash flows for each of the two years in the period ended April 30, 2020, including the related notes and schedule of valuation and qualifying accounts for each of the two years in the period ended April 30, 2020 appearing under Item 15(a)(2) (collectively referred to as the “consolidated financial statements”). In our opinion, the consolidated financial statements present fairly, in all material respects, the financial position of the Company as of April 30, 2020, and the results of its operations and its cash flows for each of the two years in the period ended April 30, 2020 in conformity with accounting principles generally accepted in the United States of America.
Change in Accounting Principle
As discussed in Note 15 to the consolidated financial statements, the Company changed the manner in which it accounts for leases on May 1, 2019.
Basis for Opinion
These consolidated financial statements are the responsibility of the Company's management. Our responsibility is to express an opinion on the Company’s consolidated financial statements based on our audits. We are a public accounting firm registered with the Public Company Accounting Oversight Board (United States) (PCAOB) and are required to be independent with respect to the Company in accordance with the U.S. federal securities laws and the applicable rules and regulations of the Securities and Exchange Commission and the PCAOB.
We conducted our audits of these consolidated financial statements in accordance with the standards of the PCAOB. Those standards require that we plan and perform the audit to obtain reasonable assurance about whether the consolidated financial statements are free of material misstatement, whether due to error or fraud.
Our audits included performing procedures to assess the risks of material misstatement of the consolidated financial statements, whether due to error or fraud, and performing procedures that respond to those risks. Such procedures included examining, on a test basis, evidence regarding the amounts and disclosures in the consolidated financial statements. Our audits also included evaluating the accounting principles used and significant estimates made by management, as well as evaluating the overall presentation of the consolidated financial statements. We believe that our audits provide a reasonable basis for our opinion.
/s/ PricewaterhouseCoopers LLP
Louisville, Kentucky
June 19, 2020
We served as the Company’s auditor from 1933 to 2020.
54
Report of Independent Registered Public Accounting Firm
To the Stockholders and the Board of Directors of Brown-Forman Corporation
Opinion on the Financial Statements
We have audited the accompanying consolidated balance sheet of Brown-Forman Corporation and Subsidiaries (the Company) as of April 30, 2021, the related consolidated statement of operations, comprehensive income, stockholders’ equity and cash flows for the period ended April 30, 2021, and the related notes and financial statement schedule listed in the Index at Item 15(a)(2) (collectively referred to as the “consolidated financial statements”). In our opinion, the consolidated financial statements present fairly, in all material respects, the financial position of the Company at April 30, 2021, and the results of its operations and its cash flows for the year ended April 30, 2021, in conformity with U.S. generally accepted accounting principles.
We also have audited, in accordance with the standards of the Public Company Accounting Oversight Board (United States) (PCAOB), the Company's internal control over financial reporting as of April 30, 2021, based on criteria established in Internal Control-Integrated Framework issued by the Committee of Sponsoring Organizations of the Treadway Commission (2013 framework), and our report dated June 21, 2021 expressed an unqualified opinion thereon.
Basis for Opinion
These financial statements are the responsibility of the Company's management. Our responsibility is to express an opinion on the Company’s financial statements based on our audit. We are a public accounting firm registered with the PCAOB and are required to be independent with respect to the Company in accordance with the U.S. federal securities laws and the applicable rules and regulations of the Securities and Exchange Commission and the PCAOB.
We conducted our audit in accordance with the standards of the PCAOB. Those standards require that we plan and perform the audit to obtain reasonable assurance about whether the financial statements are free of material misstatement, whether due to error or fraud. Our audit included performing procedures to assess the risks of material misstatement of the financial statements, whether due to error or fraud, and performing procedures that respond to those risks. Such procedures included examining, on a test basis, evidence regarding the amounts and disclosures in the financial statements. Our audit also included evaluating the accounting principles used and significant estimates made by management, as well as evaluating the overall presentation of the financial statements. We believe that our audit provides a reasonable basis for our opinion.
Critical Audit Matter
The critical audit matter communicated below is a matter arising from the current period audit of the financial statements that was communicated or required to be communicated to the audit committee and that: (1) relates to accounts or disclosures that are material to the financial statements and (2) involved our especially challenging, subjective or complex judgments. The communication of the critical audit matter does not alter in any way our opinion on the consolidated financial statements, taken as a whole, and we are not, by communicating the critical audit matter below, providing a separate opinion on the critical audit matter or on the account or disclosures to which it relates.
55
| Valuation of Other Intangible Assets with Indefinite Lives | ||||||||
| Description of the Matter | At April 30, 2021, the balance of the Company’s other intangible assets with indefinite lives was $676 million. As discussed in Notes 1 and 4 to the consolidated financial statements, other intangible assets with indefinite lives include intangible brand names and trademarks (“brand names”) and are assessed for impairment at least annually, or more frequently, if circumstances indicate the carrying amount may be impaired. Auditing management’s estimate of the fair value of brand names was complex due to the significant judgment required to determine the fair value of the brand names. The fair value estimates were sensitive to significant assumptions used in the valuation process, such as future net sales. The estimate also includes assumptions such as discount rates and royalty rates. | |||||||
| How We Addressed the Matter in Our Audit | We obtained an understanding, evaluated the design and tested the operating effectiveness of controls that address the risks of material misstatement over the Company’s process to estimate the fair value of other intangible assets with indefinite lives, including controls over management’s review of the selection of assumptions, described above, used in the valuation model. To test the estimated fair value of the Company’s brand names, we performed audit procedures that included, among others, assessing methodologies used in the valuation model and testing the significant assumptions discussed above. This included comparing the significant assumptions used by management to observable market data, current industry and economic trends, changes in the Company’s business model and customer base, historical operating results and other relevant factors that would affect the significant assumptions. We assessed management’s historical estimates and performed sensitivity analyses of assumptions to evaluate the changes in the fair value of the brand names that would result from changes in the assumptions. We also involved valuation specialists to assist in evaluating valuation methodologies and certain assumptions used in the models. | |||||||
/s/ Ernst & Young LLP
We have served as the Company’s auditor since 2020.
Louisville, Kentucky
June 21, 2021
56
Report of Independent Registered Public Accounting Firm
To the Stockholders and the Board of Directors of Brown-Forman Corporation
Opinion on Internal Control Over Financial Reporting
We have audited Brown-Forman Corporation and Subsidiaries’ internal control over financial reporting as of April 30, 2021, based on criteria established in Internal Control—Integrated Framework issued by the Committee of Sponsoring Organizations of the Treadway Commission (2013 framework), (the COSO criteria). In our opinion, Brown-Forman Corporation and Subsidiaries (the Company) maintained, in all material respects, effective internal control over financial reporting as of April 30, 2021, based on the COSO criteria.
We also have audited, in accordance with the standards of the Public Company Accounting Oversight Board (United States) (PCAOB), the consolidated balance sheet of the Company as of April 30, 2021, the related consolidated statement of operations, comprehensive income, stockholders’ equity and cash flows for the period ended April 30, 2021, and the related notes and financial statement schedule listed in the Index at Item 15(a)(2) and our report dated June 21, 2021 expressed an unqualified opinion thereon.
Basis for Opinion
The Company’s management is responsible for maintaining effective internal control over financial reporting and for its assessment of the effectiveness of internal control over financial reporting included in the accompanying Management’s Report on Internal Control over Financial Reporting. Our responsibility is to express an opinion on the Company’s internal control over financial reporting based on our audit. We are a public accounting firm registered with the PCAOB and are required to be independent with respect to the Company in accordance with the U.S. federal securities laws and the applicable rules and regulations of the Securities and Exchange Commission and the PCAOB.
We conducted our audit in accordance with the standards of the PCAOB. Those standards require that we plan and perform the audit to obtain reasonable assurance about whether effective internal control over financial reporting was maintained in all material respects.
Our audit included obtaining an understanding of internal control over financial reporting, assessing the risk that a material weakness exists, testing and evaluating the design and operating effectiveness of internal control based on the assessed risk, and performing such other procedures as we considered necessary in the circumstances. We believe that our audit provides a reasonable basis for our opinion.
Definition and Limitations of Internal Control Over Financial Reporting
A company’s internal control over financial reporting is a process designed to provide reasonable assurance regarding the reliability of financial reporting and the preparation of financial statements for external purposes in accordance with generally accepted accounting principles. A company’s internal control over financial reporting includes those policies and procedures that (1) pertain to the maintenance of records that, in reasonable detail, accurately and fairly reflect the transactions and dispositions of the assets of the company; (2) provide reasonable assurance that transactions are recorded as necessary to permit preparation of financial statements in accordance with generally accepted accounting principles, and that receipts and expenditures of the company are being made only in accordance with authorizations of management and directors of the company; and (3) provide reasonable assurance regarding prevention or timely detection of unauthorized acquisition, use, or disposition of the company’s assets that could have a material effect on the financial statements.
Because of its inherent limitations, internal control over financial reporting may not prevent or detect misstatements. Also, projections of any evaluation of effectiveness to future periods are subject to the risk that controls may become inadequate because of changes in conditions, or that the degree of compliance with the policies or procedures may deteriorate.
/s/ Ernst & Young LLP
Louisville, Kentucky
June 21, 2021
57
Brown-Forman Corporation and Subsidiaries
Consolidated Statements of Operations
(Dollars in millions, except per share amounts)
| Year Ended April 30, | 2019 | 2020 | 2021 | ||||||||||||||
| Sales | $ | $ | $ | ||||||||||||||
| Excise taxes | |||||||||||||||||
| Net sales | |||||||||||||||||
| Cost of sales | |||||||||||||||||
| Gross profit | |||||||||||||||||
| Advertising expenses | |||||||||||||||||
| Selling, general, and administrative expenses | |||||||||||||||||
| Gain on sale of business | ( | ||||||||||||||||
| Other expense (income), net | ( | ( | |||||||||||||||
| Operating income | |||||||||||||||||
| Non-operating postretirement expense | |||||||||||||||||
| Interest income | ( | ( | ( | ||||||||||||||
| Interest expense | |||||||||||||||||
| Income before income taxes | |||||||||||||||||
| Income taxes | |||||||||||||||||
| Net income | $ | $ | $ | ||||||||||||||
| Earnings per share: | |||||||||||||||||
| Basic | $ | $ | $ | ||||||||||||||
| Diluted | $ | $ | $ | ||||||||||||||
The accompanying notes are an integral part of the consolidated financial statements.
58
Brown-Forman Corporation and Subsidiaries
Consolidated Statements of Comprehensive Income
(Dollars in millions)
| Year Ended April 30, | 2019 | 2020 | 2021 | ||||||||||||||
| Net income | $ | $ | $ | ||||||||||||||
| Other comprehensive income (loss), net of tax: | |||||||||||||||||
| Currency translation adjustments | ( | ( | |||||||||||||||
| Cash flow hedge adjustments | ( | ||||||||||||||||
| Postretirement benefits adjustments | ( | ( | |||||||||||||||
| Net other comprehensive income (loss) | ( | ||||||||||||||||
| Comprehensive income | $ | $ | $ | ||||||||||||||
The accompanying notes are an integral part of the consolidated financial statements.
59
Brown-Forman Corporation and Subsidiaries
Consolidated Balance Sheets
(Dollars in millions)
| April 30, | 2020 | 2021 | |||||||||
| Assets | |||||||||||
| Cash and cash equivalents | $ | $ | |||||||||
| Accounts receivable, net | |||||||||||
| Inventories: | |||||||||||
| Barreled whiskey | |||||||||||
| Finished goods | |||||||||||
| Work in process | |||||||||||
| Raw materials and supplies | |||||||||||
| Total inventories | |||||||||||
| Other current assets | |||||||||||
| Total current assets | |||||||||||
| Property, plant, and equipment, net | |||||||||||
| Goodwill | |||||||||||
| Other intangible assets | |||||||||||
| Deferred tax assets | |||||||||||
| Other assets | |||||||||||
| Total assets | $ | $ | |||||||||
| Liabilities | |||||||||||
| Accounts payable and accrued expenses | $ | $ | |||||||||
| Accrued income taxes | |||||||||||
| Short-term borrowings | |||||||||||
| Total current liabilities | |||||||||||
| Long-term debt | |||||||||||
| Deferred tax liabilities | |||||||||||
| Accrued pension and other postretirement benefits | |||||||||||
| Other liabilities | |||||||||||
| Total liabilities | |||||||||||
| Commitments and contingencies | |||||||||||
| Stockholders’ Equity | |||||||||||
| Common stock: | |||||||||||
Class A, voting, $ | |||||||||||
Class B, nonvoting, $ | |||||||||||
| Retained earnings | |||||||||||
| Accumulated other comprehensive income (loss), net of tax | ( | ( | |||||||||
Treasury stock, at cost ( | ( | ( | |||||||||
| Total stockholders' equity | |||||||||||
| Total liabilities and stockholders' equity | $ | $ | |||||||||
The accompanying notes are an integral part of the consolidated financial statements.
60
Brown-Forman Corporation and Subsidiaries
Consolidated Statements of Cash Flows
(Dollars in millions)
| Year Ended April 30, | 2019 | 2020 | 2021 | ||||||||||||||
| Cash flows from operating activities: | |||||||||||||||||
| Net income | $ | $ | $ | ||||||||||||||
| Adjustments to reconcile net income to net cash provided by operations: | |||||||||||||||||
| Gain on sale of business | ( | ||||||||||||||||
| Non-cash intangible asset write-down | |||||||||||||||||
| Depreciation and amortization | |||||||||||||||||
| Stock-based compensation expense | |||||||||||||||||
| Deferred income tax provision (benefit) | ( | ||||||||||||||||
| U.S. Tax Act repatriation tax provision (benefit) | ( | ||||||||||||||||
| Other, net | ( | ||||||||||||||||
| Changes in assets and liabilities, net of business acquisitions and dispositions: | |||||||||||||||||
| Accounts receivable | ( | ||||||||||||||||
| Inventories | ( | ( | ( | ||||||||||||||
| Other current assets | ( | ||||||||||||||||
| Accounts payable and accrued expenses | ( | ( | |||||||||||||||
| Accrued income taxes | ( | ||||||||||||||||
| Other operating assets and liabilities | ( | ||||||||||||||||
| Cash provided by operating activities | |||||||||||||||||
| Cash flows from investing activities: | |||||||||||||||||
| Proceeds from sale of business | |||||||||||||||||
| Acquisition of business, net of cash acquired | ( | ( | |||||||||||||||
| Additions to property, plant, and equipment | ( | ( | ( | ||||||||||||||
| Payments for corporate-owned life insurance | ( | ||||||||||||||||
| Proceeds from corporate-owned life insurance | |||||||||||||||||
| Computer software expenditures | ( | ( | ( | ||||||||||||||
| Cash provided by (used for) investing activities | ( | ( | |||||||||||||||
| Cash flows from financing activities: | |||||||||||||||||
| Proceeds from short-term borrowings, maturities greater than 90 days | |||||||||||||||||
| Repayments of short-term borrowings, maturities greater than 90 days | ( | ||||||||||||||||
| Net change in short-term borrowings | ( | ||||||||||||||||
| Payments of withholding taxes related to stock-based awards | ( | ( | ( | ||||||||||||||
| Acquisition of treasury stock | ( | ( | |||||||||||||||
| Dividends paid | ( | ( | ( | ||||||||||||||
| Cash used for financing activities | ( | ( | ( | ||||||||||||||
| Effect of exchange rate changes on cash and cash equivalents | ( | ( | |||||||||||||||
| Net increase in cash and cash equivalents | |||||||||||||||||
| Cash and cash equivalents, beginning of period | |||||||||||||||||
| Cash and cash equivalents, end of period | $ | $ | $ | ||||||||||||||
| Supplemental disclosure of cash paid for: | |||||||||||||||||
| Interest | $ | $ | $ | ||||||||||||||
| Income taxes | $ | $ | $ | ||||||||||||||
The accompanying notes are an integral part of the consolidated financial statements.
61
Brown-Forman Corporation and Subsidiaries
Consolidated Statements of Stockholders' Equity
(Dollars in millions, except per share amounts)
| Class A Common Stock | Class B Common Stock | Additional Paid-in Capital | Retained Earnings | AOCI | Treasury Stock | Total | |||||||||||||||||||||||||||||||||||
| Balance at April 30, 2018 | $ | $ | $ | $ | $ | ( | $ | ( | $ | ||||||||||||||||||||||||||||||||
| Net income | |||||||||||||||||||||||||||||||||||||||||
| Net other comprehensive income (loss) | |||||||||||||||||||||||||||||||||||||||||
Cash dividends ($ | ( | ( | |||||||||||||||||||||||||||||||||||||||
| Acquisition of treasury stock | ( | ( | |||||||||||||||||||||||||||||||||||||||
| Stock-based compensation expense | |||||||||||||||||||||||||||||||||||||||||
| Stock issued under compensation plans | |||||||||||||||||||||||||||||||||||||||||
| Loss on issuance of treasury stock issued under compensation plans | ( | ( | ( | ||||||||||||||||||||||||||||||||||||||
| Other | ( | ( | |||||||||||||||||||||||||||||||||||||||
Balance at April 30, 2019 | ( | ( | |||||||||||||||||||||||||||||||||||||||
Reclassification of tax effects1 | ( | — | |||||||||||||||||||||||||||||||||||||||
| Net income | |||||||||||||||||||||||||||||||||||||||||
| Net other comprehensive income (loss) | ( | ( | |||||||||||||||||||||||||||||||||||||||
Cash dividends ($ | ( | ( | |||||||||||||||||||||||||||||||||||||||
| Acquisition of treasury stock | ( | ( | |||||||||||||||||||||||||||||||||||||||
| Stock-based compensation expense | |||||||||||||||||||||||||||||||||||||||||
| Stock issued under compensation plans | |||||||||||||||||||||||||||||||||||||||||
| Loss on issuance of treasury stock issued under compensation plans | ( | ( | ( | ||||||||||||||||||||||||||||||||||||||
Balance at April 30, 2020 | ( | ( | |||||||||||||||||||||||||||||||||||||||
| Net income | |||||||||||||||||||||||||||||||||||||||||
| Net other comprehensive income (loss) | |||||||||||||||||||||||||||||||||||||||||
Cash dividends ($ | ( | ( | |||||||||||||||||||||||||||||||||||||||
| Acquisition of treasury stock | |||||||||||||||||||||||||||||||||||||||||
| Stock-based compensation expense | |||||||||||||||||||||||||||||||||||||||||
| Stock issued under compensation plans | |||||||||||||||||||||||||||||||||||||||||
Loss on issuance of treasury stock issued under compensation plans | ( | ( | ( | ||||||||||||||||||||||||||||||||||||||
Balance at April 30, 2021 | $ | $ | $ | $ | $ | ( | $ | ( | $ | ||||||||||||||||||||||||||||||||
1Reflects adoption of Accounting Standards Update No. 2018-02, Reclassification of Certain Tax Effects from Accumulated Other Comprehensive Income (AOCI), effective May 1, 2019.
The accompanying notes are an integral part of the consolidated financial statements.
62
Brown-Forman Corporation and Subsidiaries
Notes to Consolidated Financial Statements
(Dollars and other currency amounts in millions, except per share data)
1. Accounting Policies
We prepare our consolidated financial statements in conformity with accounting principles generally accepted in the United States (GAAP). We also apply the following accounting policies when preparing our consolidated financial statements:
Inventories. Inventories are valued at the lower of cost or net realizable value. Approximately 51 % of our consolidated inventories are valued using the last-in, first-out (LIFO) cost method, which we use for the majority of our U.S. inventories. We value the remainder of our inventories primarily using the first-in, first-out (FIFO) cost method. FIFO cost approximates current replacement cost. If we had used the FIFO method for all inventories, they would have been $311 and $353 higher than reported at April 30, 2020 and 2021, respectively.
Because we age most of our whiskeys in barrels for three years or more, we bottle and sell only a portion of our whiskey inventory each year. Following industry practice, we classify all barreled whiskey as a current asset. We include warehousing, insurance, ad valorem taxes, and other carrying charges applicable to barreled whiskey in inventory costs.
We classify agave inventories, bulk tequila, bulk wine, and liquid in bottling tanks as work in process.
Property, plant, and equipment. We state property, plant, and equipment at cost less accumulated depreciation. We calculate depreciation on a straight-line basis using our estimates of useful life, which are 20 –40 years for buildings and improvements; 3 –10 years for machinery, equipment, vehicles, furniture, and fixtures; and 3 –7 years for capitalized software.
We assess our property, plant, and equipment for impairment whenever events or changes in circumstances indicate that the carrying value of those assets may not be recoverable. When we do not expect to recover the carrying value of an asset (or asset group) through undiscounted future cash flows, we write it down to its estimated fair value. We determine fair value using discounted estimated future cash flows, considering market values for similar assets when available.
When we retire or dispose of property, plant, and equipment, we remove its cost and accumulated depreciation from our balance sheet and reflect any gain or loss in operating income. We expense the costs of repairing and maintaining our property, plant, and equipment as we incur them.
Goodwill and other intangible assets. We have obtained most of our brands by acquiring other companies. When we acquire another company, we first allocate the purchase price to identifiable assets and liabilities, including intangible brand names and trademarks (“brand names”), based on estimated fair value. We then record any remaining purchase price as goodwill. We do not amortize goodwill or other intangible assets with indefinite lives. We consider all of our brand names to have indefinite lives.
We assess our goodwill and other indefinite-lived intangible assets for impairment at least annually, or more frequently if circumstances indicate the carrying amount may be impaired. Goodwill is impaired when the carrying amount of the related reporting unit exceeds its estimated fair value, in which case we write down the goodwill by the amount of the excess (limited to the carrying amount of the goodwill). We estimate the reporting unit's fair value using discounted estimated future cash flows or market information. Similarly, a brand name is impaired when its carrying amount exceeds its estimated fair value, in which case we write down the brand name to its estimated fair value. We typically estimate the fair value of a brand name using either the “relief from royalty” or “excess earnings” method. We also consider market values for similar assets when available.
63
Considerable management judgment is necessary to estimate fair value, including the selection of assumptions about future cash flows, net sales, discount rates, and royalty rates.
We have the option, before quantifying the fair value of a reporting unit or brand name, to evaluate qualitative factors to assess whether it is more likely than not that our goodwill or brand names are impaired. If we determine that is not the case, then we are not required to quantify the fair value. That assessment also takes considerable management judgment.
Revenue recognition. Our net sales predominantly reflect global sales of beverage alcohol consumer products. We sell these products under contracts with different types of customers, depending on the market. The customer is most often a distributor, wholesaler, or retailer.
Each contract typically includes a single performance obligation to transfer control of the products to the customer. Depending on the contract, control is transferred when the products are either shipped or delivered to the customer, at which point we recognize the transaction price for those products as net sales. The transaction price recognized at that point reflects our estimate of the consideration to be received in exchange for the products. The actual amount may ultimately differ due to the effect of various customer incentives and trade promotion activities. In making our estimates, we consider our historical experience and current expectations, as applicable. Subsequent adjustments recognized for changes in estimated transaction prices are typically not material.
Net sales exclude taxes we collect from customers that are imposed by various governments on our sales, and are reduced by payments to customers unless made in exchange for distinct goods or services with fair values approximating the payments. Net sales include any amounts we bill customers for shipping and handling activities related to the products. We recognize the cost of those activities in cost of sales during the same period in which we recognize the related net sales. Sales returns, which are permitted only in limited situations, are not material. Customer payment terms generally range from 30 to 90 days. There are no significant amounts of contract assets or liabilities.
Stock-based compensation. We use stock-based awards as part of our incentive compensation for eligible employees and directors. We recognize the grant-date fair value of an award as compensation expense on a straight-line basis over the requisite service period, which typically corresponds to the vesting period for the award. Upon forfeiture of an award prior to vesting, we reverse any previously-recognized compensation expense related to that award. We classify stock-based compensation expense within selling, general, and administrative expenses.
As we recognize compensation expense for a stock-based award, we concurrently recognize a related deferred tax asset. The subsequent vesting or exercise of the award will generally result in an actual tax benefit that differs from the deferred tax asset that had been recorded. The excess (deficiency) of the actual tax benefit over (under) the previously-recorded tax asset is recognized as income tax benefit (expense) on the date of vesting or exercise.
Income taxes. We base our annual provision for income taxes on the pre-tax income reflected in our consolidated statement of operations. We establish deferred tax liabilities or assets for temporary differences between GAAP and tax reporting bases and later adjust them to reflect changes in tax rates expected to be in effect when the temporary differences reverse. We record a valuation allowance as necessary to reduce a deferred tax asset to the amount that we believe is more likely than not to be realized. We do not provide deferred income taxes on undistributed earnings of foreign subsidiaries that we expect to indefinitely reinvest. We record a deferred tax charge in prepaid taxes for the difference between GAAP and tax reporting bases with respect to the elimination of intercompany profit in ending inventory.
We assess our uncertain income tax positions in two steps. First, we evaluate whether the tax position will more likely than not, based on its technical merits, be sustained upon examination, including resolution of any related appeals or litigation. For a tax position that does not meet this first criterion, we recognize no tax benefit. For a tax position that does meet the first criterion, we recognize a tax benefit in an amount equal to the largest amount of benefit that we believe has more than a 50% likelihood of being realized upon ultimate resolution. We record interest and penalties on uncertain tax positions as income tax expense.
64
2. Balance Sheet Information
Supplemental information on our year-end balance sheets is as follows:
| April 30, | 2020 | 2021 | |||||||||
| Other current assets: | |||||||||||
| Prepaid taxes | $ | $ | |||||||||
| Other | |||||||||||
| $ | $ | ||||||||||
| Property, plant, and equipment: | |||||||||||
| Land | $ | $ | |||||||||
| Buildings | |||||||||||
| Equipment | |||||||||||
| Construction in process | |||||||||||
| Less accumulated depreciation | |||||||||||
| $ | $ | ||||||||||
| Accounts payable and accrued expenses: | |||||||||||
| Accounts payable, trade | $ | $ | |||||||||
| Accrued expenses: | |||||||||||
| Advertising, promotion, and discounts | |||||||||||
| Compensation and commissions | |||||||||||
| Excise and other non-income taxes | |||||||||||
| Other | |||||||||||
| $ | $ | ||||||||||
| Accumulated other comprehensive income (loss), net of tax: | |||||||||||
| Currency translation adjustments | $ | ( | $ | ( | |||||||
| Cash flow hedge adjustments | ( | ||||||||||
| Postretirement benefits adjustments | ( | ( | |||||||||
| $ | ( | $ | ( | ||||||||
65
3. Earnings per Share
We calculate basic earnings per share by dividing net income available to common stockholders by the weighted average number of common shares outstanding during the period. Diluted earnings per share further includes the dilutive effect of stock-based compensation awards. We calculate that dilutive effect using the “treasury stock method” (as defined by GAAP).
The following table presents information concerning basic and diluted earnings per share:
| 2019 | 2020 | 2021 | |||||||||||||||
| Net income available to common stockholders | $ | $ | $ | ||||||||||||||
| Share data (in thousands): | |||||||||||||||||
| Basic average common shares outstanding | |||||||||||||||||
| Dilutive effect of stock-based awards | |||||||||||||||||
| Diluted average common shares outstanding | |||||||||||||||||
| Basic earnings per share | $ | $ | $ | ||||||||||||||
| Diluted earnings per share | $ | $ | $ | ||||||||||||||
We excluded common stock-based awards for approximately 447,000 shares, 301,000 shares, and 234,000 shares from the calculation of diluted earnings per share for 2019, 2020, and 2021, respectively, because they were not dilutive for those periods under the treasury stock method.
4. Goodwill and Other Intangible Assets
The following table shows the changes in goodwill (which include no accumulated impairment losses) and other intangible assets over the past two years:
| Goodwill | Other Intangible Assets | ||||||||||
Balance as of April 30, 2019 | $ | $ | |||||||||
| Acquisition of business (Note 12) | |||||||||||
| Foreign currency translation adjustment | ( | ( | |||||||||
| Impairment | ( | ||||||||||
Balance as of April 30, 2020 | |||||||||||
| Sale of business (Note 12) | ( | ( | |||||||||
| Acquisition of business (Note 12) | |||||||||||
| Foreign currency translation adjustment | |||||||||||
Balance as of April 30, 2021 | $ | $ | |||||||||
Our other intangible assets consist of trademarks and brand names, all with indefinite useful lives.
During fiscal 2020, we recognized a non-cash impairment charge for our Chambord brand name. The impairment reflects a decline in our long-term outlook for Chambord, which has a significant on-premise presence and was expected to be considerably affected by the closures and restrictions in this channel in response to the COVID-19 pandemic. The impairment charge of $13 is included in “other expense (income), net” in the accompanying consolidated statement of operations. As of April 30, 2020 and 2021, the remaining carrying amount of the Chambord brand name was $104
66
5. Commitments and Contingencies
Commitments. We have contracted with various growers and wineries to supply some of our future grape and bulk wine requirements. Many of these contracts call for prices to be adjusted annually up or down, according to market conditions. Some contracts set a fixed purchase price that might be higher or lower than prevailing market prices. We have total purchase obligations related to both types of contracts of $10 in 2022, $4 in 2023, and $3 in 2024.
We also have contracts for the purchase of agave, which is used to produce tequila. These contracts provide for prices to be determined based on market conditions at the time of harvest, which, although not specified, is expected to occur over the next 10 years. As of April 30, 2021, based on current market prices, obligations under these contracts total $38 .
Contingencies. We operate in a litigious environment, and we are sued in the normal course of business. Sometimes plaintiffs seek substantial damages. Significant judgment is required in predicting the outcome of these suits and claims, many of which take years to adjudicate. We accrue estimated costs for a contingency when we believe that a loss is probable and we can make a reasonable estimate of the loss, and then adjust the accrual as appropriate to reflect changes in facts and circumstances. We do not believe it is reasonably possible that these existing loss contingencies, individually or in the aggregate, would have a material adverse effect on our financial position, results of operations, or liquidity. No material accrued loss contingencies are recorded as of April 30, 2021.
On May 30, 2019, we notified Bacardi Martini Ltd. (Bacardi) of our intention not to renew the terms of our United Kingdom (U.K.) Cost Sharing Agreement (the Agreement) whereby Bacardi provided certain services (e.g., warehousing and logistics, sales, reporting, treasury, tax and other services) and Brown-Forman and Bacardi split the associated overhead for those services. For purposes of conducting business, Brown-Forman and Bacardi established a U.K. trade name, “Bacardi Brown-Forman Brands,” through which our products and Bacardi's products were sold in the U.K. On a monthly basis, Bacardi would remit to us the cash representing revenues from sales of our products, net of our agreed contributions for overhead costs under the Agreement. On April 30, 2020, the Agreement expired according to its terms.
Following delivery of our notice and upon expiration of the Agreement, Bacardi alleged that it was entitled to approximately £49 under the principle of commercial agency in the U.K., as well as additional compensation for the winding up of business conducted under the Agreement and for remitting the associated funds owed to us. From monthly settlements following the expiration of the Agreement, Bacardi withheld over £50 owed to us, effectively bypassing the dispute resolution process under the Agreement. This withheld amount is included in accounts receivable in the accompanying consolidated balance sheet as of April 30, 2021.
In response to Bacardi's actions, we initiated a lawsuit on August 20, 2020, in the Commercial Court in the U.K. seeking reimbursement of the amounts wrongfully withheld (the Commercial Court Action). Shortly thereafter, Bacardi filed a demand for arbitration seeking a determination that it was entitled to compensation as a commercial agent and for additional compensation for the work completed following the expiration of the Agreement (the Arbitration).
Since it was raised, we have disputed Bacardi's claim of commercial agency compensation and issued a demand that Bacardi adhere to the dispute resolution process mandated by the Agreement. The ruling for the Commercial Court Action was issued on May 19, 2021, in which the Court declined to order Bacardi to return the amounts withheld pending the outcome of the Arbitration. The Arbitration is scheduled to take place the week of July 12, 2021. Given the current stage of the Arbitration process, we are unable to estimate the range of reasonably possible loss, if any.
Guaranty. We have guaranteed the repayment by a third-party importer of its obligation under a bank credit facility that it uses in connection with its importation of our products in Russia. If the importer were to default on that obligation, which we believe is unlikely, our maximum possible exposure under the existing terms of the guaranty would be approximately $9 (subject to changes in foreign currency exchange rates). Both the fair value and carrying amount of the guaranty are insignificant.
As of April 30, 2021, our actual exposure under the guaranty of the importer's obligation is approximately $5 . We also have accounts receivable from that importer of approximately $7 at April 30, 2021, which we expect to collect in full.
Based on the financial support we provide to the importer, we believe it meets the definition of a variable interest entity. However, because we do not control this entity, it is not included in our consolidated financial statements.
67
6. Debt and Credit Facilities
Our long-term debt (net of unamortized discounts and issuance costs) consisted of:
| April 30, | 2020 | 2021 | |||||||||
| $ | $ | ||||||||||
| $ | $ | ||||||||||
Debt payments required over the next five fiscal years consist of $0 in 2022, $250 in 2023, $0 in 2024, $300 in 2025, $0 in 2026, and $1,832 after 2026.
The senior notes contain terms, events of default, and covenants customary of these types of unsecured securities, including limitations on the amount of secured debt we can issue.
Our short-term borrowings of $333 as of April 30, 2020, and $205 as of April 30, 2021, consisted primarily of borrowings under our commercial paper program:
| April 30, | 2020 | 2021 | |||||||||
| Commercial paper | $ | $ | |||||||||
| Average interest rate | |||||||||||
| Average remaining days to maturity | |||||||||||
We have a committed revolving credit agreement with various U.S. and international banks for $800 that expires in November 2023. At April 30, 2021, there were no borrowings outstanding under this facility.
7. Common Stock
The following table shows the change in outstanding common shares during each of the last three years:
| (Shares in thousands) | Class A | Class B | Total | ||||||||||||||
| Balance at April 30, 2018 | |||||||||||||||||
| Acquisition of treasury stock | ( | ( | ( | ||||||||||||||
| Stock issued under compensation plans | |||||||||||||||||
Balance at April 30, 2019 | |||||||||||||||||
| Acquisition of treasury stock | ( | ( | ( | ||||||||||||||
| Stock issued under compensation plans | |||||||||||||||||
Balance at April 30, 2020 | |||||||||||||||||
| Acquisition of treasury stock | |||||||||||||||||
| Stock issued under compensation plans | |||||||||||||||||
Balance at April 30, 2021 | |||||||||||||||||
68
8. Net Sales
The following table shows our net sales by geography:
| 2019 | 2020 | 2021 | |||||||||||||||
| United States | $ | $ | $ | ||||||||||||||
Developed International1 | |||||||||||||||||
Emerging2 | |||||||||||||||||
Travel Retail3 | |||||||||||||||||
Non-branded and bulk4 | |||||||||||||||||
| $ | $ | $ | |||||||||||||||
1Represents net sales of branded products to “advanced economies” as defined by the International Monetary Fund (IMF), excluding the United States. Our largest developed international markets are Australia, Germany, the United Kingdom, France, and Canada.
2Represents net sales of branded products to “emerging and developing economies” as defined by the IMF. Our largest emerging markets are Mexico, Poland, Brazil, and Russia.
3Represents net sales of branded products to global duty-free customers, other travel retail customers, and the U.S. military regardless of customer location.
4Includes net sales of used barrels, bulk whiskey and wine, and contract bottling regardless of customer location.
The following table shows our net sales by product category:
| 2019 | 2020 | 2021 | |||||||||||||||
Whiskey1 | $ | $ | $ | ||||||||||||||
Tequila2 | |||||||||||||||||
Wine3 | |||||||||||||||||
Vodka4 | |||||||||||||||||
| Rest of portfolio | |||||||||||||||||
Non-branded and bulk5 | |||||||||||||||||
| $ | $ | $ | |||||||||||||||
2Includes el Jimador, the Herradura family of brands, New Mix, Pepe Lopez, and Antiguo.
3Includes Korbel Champagne and Sonoma-Cutrer wines.
4Includes Finlandia.
5Includes net sales of used barrels, bulk whiskey and wine, and contract bottling regardless of customer location.
69
9. Pension and Other Postretirement Benefits
We sponsor various defined benefit pension plans as well as postretirement plans providing retiree health care and retiree life insurance benefits. Below, we discuss our obligations related to these plans, the assets dedicated to meeting the obligations, and the amounts we recognized in our financial statements as a result of sponsoring these plans.
Obligations. We provide eligible employees with pension and other postretirement benefits based on factors such as years of service and compensation level during employment. The pension obligation shown below (“projected benefit obligation”) consists of: (a) benefits earned by employees to date based on current salary levels (“accumulated benefit obligation”); and (b) benefits to be received by employees as a result of expected future salary increases. (The obligation for medical and life insurance benefits is not affected by future salary increases.) The following table shows how the present value of our projected benefit obligations changed during each of the last two years.
| Pension Benefits | Medical and Life Insurance Benefits | ||||||||||||||||||||||
| 2020 | 2021 | 2020 | 2021 | ||||||||||||||||||||
| Obligation at beginning of year | $ | $ | $ | $ | |||||||||||||||||||
| Service cost | |||||||||||||||||||||||
| Interest cost | |||||||||||||||||||||||
| Net actuarial loss (gain) | ( | ||||||||||||||||||||||
| Retiree contributions | |||||||||||||||||||||||
| Benefits paid | ( | ( | ( | ( | |||||||||||||||||||
| Obligation at end of year | $ | $ | $ | $ | |||||||||||||||||||
Service cost represents the present value of the benefits attributed to service rendered by employees during the year. Interest cost is the increase in the present value of the obligation due to the passage of time. Net actuarial loss (gain) is the change in value of the obligation resulting from experience different from that assumed or from a change in an actuarial assumption. (We discuss actuarial assumptions used at the end of this note.) Plan amendments may also change the value of the obligation.
As shown in the previous table, the change in the value of our pension and other postretirement benefit obligations also includes the effect of benefit payments and retiree contributions. Expected benefit payments (net of retiree contributions) over the next 10 years are as follows:
| Pension Benefits | Medical and Life Insurance Benefits | ||||||||||
| 2022 | $ | $ | |||||||||
| 2023 | |||||||||||
| 2024 | |||||||||||
| 2025 | |||||||||||
| 2026 | |||||||||||
| 2027 – 2031 | |||||||||||
Assets. We invest in specific assets to fund our pension benefit obligations. Our investment goal is to earn a total return that, over time, will grow assets sufficiently to fund our plans' liabilities, after providing appropriate levels of contributions and accepting prudent levels of investment risk. To achieve this goal, plan assets are invested primarily in funds or portfolios of funds managed by outside managers. Investment risk is managed by company policies that require diversification of asset classes, manager styles, and individual holdings. We measure and monitor investment risk through quarterly and annual performance reviews, and through periodic asset/liability studies.
Asset allocation is the most important method for achieving our investment goals and is based on our assessment of the plans' long-term return objectives and the appropriate balances needed for liquidity, stability, and diversification. As of April 30, 2021, our target asset allocation is a mix of 40 % public equity investments, 47 % fixed income investments, and 13 % alternative investments.
70
The following table shows the fair value of pension plan assets by category as of the end of the last two years. (Fair value levels are defined in Note 14.)
| Level 1 | Level 2 | Level 3 | Total | ||||||||||||||||||||
| April 30, 2020 | |||||||||||||||||||||||
| Equity securities | $ | $ | $ | $ | |||||||||||||||||||
Limited partnership interest1 | |||||||||||||||||||||||
| $ | $ | $ | |||||||||||||||||||||
| Investments measured at net asset value: | |||||||||||||||||||||||
Commingled trust funds2: | |||||||||||||||||||||||
| Equity funds | |||||||||||||||||||||||
| Fixed income funds | |||||||||||||||||||||||
| Real estate funds | |||||||||||||||||||||||
| Short-term investments | |||||||||||||||||||||||
Limited partnership interests3 | |||||||||||||||||||||||
| Total | $ | ||||||||||||||||||||||
| April 30, 2021 | |||||||||||||||||||||||
| Equity securities | $ | $ | $ | $ | |||||||||||||||||||
Limited partnership interest1 | |||||||||||||||||||||||
| $ | $ | $ | |||||||||||||||||||||
| Investments measured at net asset value: | |||||||||||||||||||||||
Commingled trust funds2: | |||||||||||||||||||||||
| Equity funds | |||||||||||||||||||||||
| Fixed income funds | |||||||||||||||||||||||
| Real estate funds | |||||||||||||||||||||||
| Short-term investments | |||||||||||||||||||||||
Limited partnership interests3 | |||||||||||||||||||||||
| Total | $ | ||||||||||||||||||||||
1 This limited partnership interest was initially valued at cost and has been adjusted to fair value as determined in good faith by management of the partnership using various factors, and does not meet the requirements for reporting at the net asset value (NAV). The valuation requires significant judgment due to the absence of quoted market prices and the inherent lack of liquidity. This limited partnership has a term expiring in September 2021, although this period may be extended.
2 Commingled trust fund valuations are based on the NAV of the funds as determined by the fund administrators and reviewed by us. NAV represents the underlying assets owned by the fund, minus liabilities and divided by the number of shares or units outstanding. Generally, for commingled trust funds other than real estate, redemptions are permitted daily with no notice period. The real estate fund is redeemable quarterly with 110 days' notice.
3 These limited partnership interests were initially valued at cost and have been adjusted using NAV per audited financial statements. Investments are generally not eligible for immediate redemption and have original terms averaging 10 to 13 years, although those periods may be extended.
71
| Level 3 | |||||
Balance as of April 30, 2019 | $ | ||||
| Sales and settlements | ( | ||||
Balance as of April 30, 2020 | |||||
| Return on assets held at end of year | |||||
| Sales and settlements | ( | ||||
Balance as of April 30, 2021 | $ | ||||
The following table shows how the total fair value of all pension plan assets changed during each of the last two years. (We do not have assets set aside for postretirement medical or life insurance benefits.)
| Pension Benefits | Medical and Life Insurance Benefits | ||||||||||||||||||||||
| 2020 | 2021 | 2020 | 2021 | ||||||||||||||||||||
| Assets at beginning of year | $ | $ | $ | $ | |||||||||||||||||||
| Actual return on assets | |||||||||||||||||||||||
| Retiree contributions | |||||||||||||||||||||||
| Company contributions | |||||||||||||||||||||||
| Benefits paid | ( | ( | ( | ( | |||||||||||||||||||
| Assets at end of year | $ | $ | $ | $ | |||||||||||||||||||
We currently expect to contribute $17 to our pension plans and $3 to our postretirement medical and life insurance benefit plans during 2022.
Funded status. The funded status of a plan refers to the difference between its assets and its obligations. The following table shows the funded status of our plans.
| Pension Benefits | Medical and Life Insurance Benefits | ||||||||||||||||||||||
| April 30, | 2020 | 2021 | 2020 | 2021 | |||||||||||||||||||
| Assets | $ | $ | $ | $ | |||||||||||||||||||
| Obligations | ( | ( | ( | ( | |||||||||||||||||||
| Funded status | $ | ( | $ | ( | $ | ( | $ | ( | |||||||||||||||
The funded status is recorded on the accompanying consolidated balance sheets as follows:
Pension Benefits | Medical and Life Insurance Benefits | |||||||||||||||||||||||||
| April 30, | 2020 | 2021 | 2020 | 2021 | ||||||||||||||||||||||
| Other assets | $ | $ | $ | $ | ||||||||||||||||||||||
| Accounts payable and accrued expenses | ( | ( | ( | ( | ||||||||||||||||||||||
| Accrued postretirement benefits | ( | ( | ( | ( | ||||||||||||||||||||||
| Net liability | $ | ( | $ | ( | $ | ( | $ | ( | ||||||||||||||||||
| Accumulated other comprehensive income (loss), before tax: | ||||||||||||||||||||||||||
| Net actuarial gain (loss) | $ | ( | $ | ( | $ | ( | $ | ( | ||||||||||||||||||
| Prior service credit (cost) | ( | ( | ||||||||||||||||||||||||
| $ | ( | $ | ( | $ | ( | $ | ( | |||||||||||||||||||
72
The following table compares our pension plans whose accumulated benefit obligations exceed their assets with our pension plans whose assets exceed their accumulated benefit obligations.
| Accumulated Benefit Obligation | Plan Assets | ||||||||||||||||||||||
| April 30, | 2020 | 2021 | 2020 | 2021 | |||||||||||||||||||
| Plans with accumulated benefit obligation in excess of assets | $ | ( | $ | ( | $ | $ | |||||||||||||||||
| Plans with assets in excess of accumulated benefit obligation | ( | ( | |||||||||||||||||||||
| Total | $ | ( | $ | ( | $ | $ | |||||||||||||||||
The following table compares our pension plans whose projected benefit obligations exceed their assets with our pension plans whose assets exceed their projected benefit obligations.
| Projected Benefit Obligation | Plan Assets | ||||||||||||||||||||||
| April 30, | 2020 | 2021 | 2020 | 2021 | |||||||||||||||||||
| Plans with projected benefit obligation in excess of assets | $ | ( | $ | ( | $ | $ | |||||||||||||||||
| Plans with assets in excess of projected benefit obligation | ( | ||||||||||||||||||||||
| Total | $ | ( | $ | ( | $ | $ | |||||||||||||||||
As noted above, we have no assets set aside for the postretirement medical or life insurance benefit plans.
Pension cost. The following table shows the components of the pension cost recognized during each of the last three years. The amount for each year includes amortization of the prior service cost/credit and net actuarial loss/gain included in accumulated other comprehensive loss as of the beginning of the year.
| Pension Benefits | |||||||||||||||||
| 2019 | 2020 | 2021 | |||||||||||||||
| Service cost | $ | $ | $ | ||||||||||||||
| Interest cost | |||||||||||||||||
| Expected return on assets | ( | ( | ( | ||||||||||||||
| Amortization of: | |||||||||||||||||
| Prior service cost (credit) | |||||||||||||||||
| Net actuarial loss (gain) | |||||||||||||||||
| Settlement charge | |||||||||||||||||
| Net cost | $ | $ | $ | ||||||||||||||
The prior service cost/credit, which represents the effect of plan amendments on benefit obligations, is amortized on a straight-line basis over the average remaining service period of the employees expected to receive the benefits. The net actuarial loss/gain results from experience different from that assumed or from a change in actuarial assumptions (including the difference between actual and expected return on plan assets), and is amortized over at least that same period.
73
Other postretirement benefits cost. The following table shows the components of the postretirement medical and life insurance benefits cost that we recognized during each of the last three years.
| Medical and Life Insurance Benefits | |||||||||||||||||
| 2019 | 2020 | 2021 | |||||||||||||||
| Service cost | $ | $ | $ | ||||||||||||||
| Interest cost | |||||||||||||||||
| Amortization of: | |||||||||||||||||
| Prior service cost (credit) | ( | ( | ( | ||||||||||||||
| Net actuarial loss (gain) | |||||||||||||||||
| Net cost | $ | $ | $ | ||||||||||||||
Other comprehensive income (loss). Prior service cost/credit and net actuarial loss/gain are recognized in other comprehensive income or loss (OCI) during the period in which they arise. These amounts are later amortized from accumulated OCI into pension and other postretirement benefit cost over future periods as described above. The following table shows the pre-tax effect of these amounts on OCI during each of the last three years.
| Pension Benefits | Medical and Life Insurance Benefits | ||||||||||||||||||||||||||||||||||
| 2019 | 2020 | 2021 | 2019 | 2020 | 2021 | ||||||||||||||||||||||||||||||
| Net actuarial gain (loss) | $ | ( | $ | ( | $ | $ | $ | ( | $ | ||||||||||||||||||||||||||
| Amortization reclassified to earnings: | |||||||||||||||||||||||||||||||||||
| Prior service cost (credit) | ( | ( | ( | ||||||||||||||||||||||||||||||||
| Net actuarial loss (gain) | |||||||||||||||||||||||||||||||||||
| Net amount recognized in OCI | $ | ( | $ | ( | $ | $ | ( | $ | ( | $ | ( | ||||||||||||||||||||||||
Assumptions and sensitivity. We use various assumptions to determine the obligations and cost related to our pension and other postretirement benefit plans. The weighted-average assumptions used in computing benefit plan obligations as of the end of the last two years were as follows:
Pension Benefits | Medical and Life Insurance Benefits | ||||||||||||||||||||||
| 2020 | 2021 | 2020 | 2021 | ||||||||||||||||||||
| Discount rate | % | % | |||||||||||||||||||||
| Rate of salary increase | % | n/a | n/a | ||||||||||||||||||||
| Interest crediting rate | % | % | n/a | n/a | |||||||||||||||||||
The weighted-average assumptions used in computing benefit plan cost during each of the last three years were as follows:
| Pension Benefits | Medical and Life Insurance Benefits | ||||||||||||||||||||||||||||||||||
| 2019 | 2020 | 2021 | 2019 | 2020 | 2021 | ||||||||||||||||||||||||||||||
| Discount rate for service cost | % | % | % | % | |||||||||||||||||||||||||||||||
| Discount rate for interest cost | % | % | % | % | |||||||||||||||||||||||||||||||
| Rate of salary increase | % | % | n/a | n/a | n/a | ||||||||||||||||||||||||||||||
| Interest crediting rate | % | % | % | n/a | n/a | n/a | |||||||||||||||||||||||||||||
| Expected return on plan assets | % | % | n/a | n/a | n/a | ||||||||||||||||||||||||||||||
The assumed discount rates are determined using a yield curve based on the interest rates of high-quality debt securities with maturities corresponding to the expected timing of our benefit payments. The service cost and interest cost components are measured by applying the specific spot rates along the yield curve used to measure the benefit obligation at the beginning of the period.
The assumed rate of salary increase reflects the expected average annual increase in salaries as a result of inflation, merit increases, and promotions over the service period of the plan participants.
74
The assumed interest crediting is based on the greater of the average yield on 30-year Treasury bonds or the minimum rate specified in the applicable pension plan.
The expected return on plan assets represents the long-term rate of return that we assume will be earned over the life of the pension assets. The assumption reflects expected capital market returns for each asset class, which are based on historical returns, adjusted for the expected effects of diversification and active management (net of fees).
The assumed health care cost trend rates as of the end of the last two years were as follows:
| Medical and Life Insurance Benefits | |||||||||||
| 2020 | 2021 | ||||||||||
| Health care cost trend rate assumed for next year | % | ||||||||||
| Rate to which the cost trend rate is assumed to decline (the ultimate trend rate) | % | ||||||||||
| Year that the rate reaches the ultimate trend rate | 2025 | 2030 | |||||||||
Savings plans. We also sponsor various defined contribution benefit plans that together cover substantially all U.S. employees. Employees can make voluntary contributions in accordance with their respective plans, which include a 401(k) tax deferral option. We match a percentage of each employee's contributions in accordance with plan terms. We expensed $12 , $12 , and $12 for matching contributions during 2019, 2020, and 2021, respectively.
International plans. The information presented above for defined benefit plans and defined contribution benefit plans reflects amounts for U.S. plans only. Information about similar international plans is not presented due to immateriality.
10. Stock-Based Compensation
The Brown-Forman 2013 Omnibus Compensation Plan is our incentive compensation plan, designed to reward participants (including eligible officers, employees, and non-employee directors) for company performance. Under the Plan, we can grant stock-based incentive awards for up to 20,750,000 shares of common stock to eligible participants until July 28, 2023. As of April 30, 2021, awards for approximately 12,961,000 shares remain available for issuance under the Plan. We try to limit the source of shares delivered to participants under the Plan to treasury shares that we purchase from time to time on the open market (in connection with a publicly announced share repurchase program), in private transactions, or otherwise.
Awards granted under the Plan include stock-settled stock appreciation rights (SSARs), performance-based restricted stock units (PBRSUs), and deferred stock units (DSUs).
SSARs. We grant SSARs at an exercise price equal to the closing market price of the underlying stock on the grant date. SSARs become exercisable after three years from the first day of the fiscal year of grant and generally are exercisable for seven years after that date. The following table presents information about SSARs outstanding as of April 30, 2021, and for the year then ended.
| Number of SSARs (in thousands) | Weighted- Average Exercise Price per SSAR | Weighted- Average Remaining Contractual Term (years) | Aggregate Intrinsic Value | ||||||||||||||||||||
Outstanding at April 30, 2020 | $ | ||||||||||||||||||||||
| Granted | |||||||||||||||||||||||
| Exercised | ( | ||||||||||||||||||||||
| Forfeited or expired | ( | ||||||||||||||||||||||
Outstanding at April 30, 2021 | $ | $ | |||||||||||||||||||||
Exercisable at April 30, 2021 | $ | $ | |||||||||||||||||||||
75
We use the Black-Scholes pricing model to calculate the grant-date fair value of a SSAR. The weighted-average grant-date fair values and related valuation assumptions for the SSARS granted during each of the last three years were as follows:
| 2019 | 2020 | 2021 | |||||||||||||||
| Grant-date fair value | $ | $ | $ | ||||||||||||||
| Valuation assumptions: | |||||||||||||||||
| Expected term (years) | |||||||||||||||||
| Risk-free interest rate | % | % | |||||||||||||||
| Expected volatility | % | % | |||||||||||||||
| Expected dividend yield | % | % | |||||||||||||||
The expected term is based on past exercise experience for similar awards. The risk-free interest rate is based on zero-coupon U.S. Treasury rates as of the date of grant. Expected volatility and dividend yield are based on historical data, with consideration of other factors when applicable.
PBRSUs. The PBRSUs vest at the end of a three-year performance period that begins on the first day of the fiscal year of grant. Performance is measured based on the relative ranking of the total cumulative shareholder return of our Class B common stock during the three-year performance period compared to that of the companies within the Standard & Poor's Consumer Staples Index at the end of the performance period, with specific payout levels ranging from 50% to 150%. At the end of the performance period, the PBRSUs are converted to common shares. The number of shares is determined by adjusting the PBRSUs by the performance multiplier and adjusting upward to account for dividends paid on our common stock during the second and third years of the performance period.
The following table presents information about PBRSUs outstanding as of April 30, 2021, and for the year then ended.
| Number of PBRSUs (in thousands) | Weighted- Average Fair Value at Grant Date | ||||||||||
Outstanding at April 30, 2020 | $ | ||||||||||
| Granted | $ | ||||||||||
| Converted to common shares | ( | $ | |||||||||
| Forfeited | ( | $ | |||||||||
Outstanding at April 30, 2021 | $ | ||||||||||
We calculate the grant-date fair value of a PBRSU using a Monte Carlo simulation technique. The weighted average grant-date fair values and related valuation assumptions for these awards granted during each of the last three years were as follows:
| 2019 | 2020 | 2021 | |||||||||||||||
| Grant-date fair value | $ | $ | $ | ||||||||||||||
| Valuation assumptions: | |||||||||||||||||
| Risk-free interest rate | % | % | % | ||||||||||||||
| Expected volatility | % | % | % | ||||||||||||||
| Expected dividend yield | % | % | % | ||||||||||||||
| Remaining performance period (years) as of grant date | |||||||||||||||||
DSUs. DSUs are granted to our non-employee directors. Each DSU represents the right to receive one share of common stock based on the closing price of the shares on the date of grant. Outstanding DSUs are credited with dividend-equivalent DSUs when dividends are paid on our common stock. Each annual grant vests after one year. DSUs are paid out in shares after the completion of a director's tenure on the board plus a six-month waiting period. The director may elect to receive the distribution either in a single lump sum or in ten equal annual installments. As of April 30, 2021, there were approximately 241,000 outstanding DSUs, of which approximately 215,000 were vested.
The grant-date fair value of a DSU is the closing market price of the underlying stock on the grant date. The weighted average grant-date fair values for these awards granted during each of the last three years were as follows:
| 2019 | 2020 | 2021 | |||||||||||||||
| Grant-date fair value | $ | $ | $ | ||||||||||||||
76
Additional information. The pre-tax stock-based compensation expense and related deferred income tax benefits recognized during the last three fiscal years were as follows:
| 2019 | 2020 | 2021 | |||||||||||||||
| Pre-tax compensation expense | $ | $ | $ | ||||||||||||||
| Deferred tax benefit | |||||||||||||||||
As of April 30, 2021, there was $8 of total unrecognized compensation cost related to non-vested stock-based awards. That cost is expected to be recognized over a weighted-average period of 1.6 years. Further information related to our stock-based awards for the last three years is as follows:
| 2019 | 2020 | 2021 | |||||||||||||||
| Intrinsic value of SSARs exercised | $ | $ | $ | ||||||||||||||
Fair value of shares vested1 | |||||||||||||||||
| Excess tax benefit from exercise / vesting of awards | |||||||||||||||||
1The fair value of shares vested in fiscal 2019 includes $10 related to a one-time performance-based special grant of restricted stock issued in fiscal 2014 to our Chief Executive Officer (who retired in fiscal 2019). During the performance period, dividends accrued and the award was adjusted for all applicable stock splits during the vesting period, subject to the same performance measures as the initial grant. The resulting shares vested on June 1, 2018.
11. Income Taxes
We incur income taxes on the earnings of our U.S. and foreign operations. The following table, based on the locations of the taxable entities from which sales were derived (rather than the location of customers), presents the U.S. and foreign components of our income before income taxes:
| 2019 | 2020 | 2021 | |||||||||||||||
| United States | $ | $ | $ | ||||||||||||||
| Foreign | |||||||||||||||||
| $ | $ | $ | |||||||||||||||
The income shown above was determined according to GAAP. Because those standards sometimes differ from the tax rules used to calculate taxable income, there are differences between: (a) the amount of taxable income and pretax financial income for a year and (b) the tax bases of assets or liabilities and their amounts as recorded in our financial statements. As a result, we recognize a current tax liability for the estimated income tax payable on the current tax return, and deferred tax liabilities (tax on income that will be recognized on future tax returns) and deferred tax assets (tax from deductions that will be recognized on future tax returns) for the estimated effects of the differences mentioned above.
Total income tax expense for a year includes the tax associated with the current tax return (current tax expense) and the change in the net deferred tax asset or liability (deferred tax expense). Our total income tax expense for each of the last three years was as follows:
| 2019 | 2020 | 2021 | |||||||||||||||
| Current: | |||||||||||||||||
| U.S. federal | $ | $ | $ | ||||||||||||||
| Foreign | |||||||||||||||||
| State and local | |||||||||||||||||
| Deferred: | |||||||||||||||||
| U.S. federal | ( | ||||||||||||||||
| Foreign | ( | ||||||||||||||||
| State and local | ( | ( | ( | ||||||||||||||
| ( | |||||||||||||||||
| $ | $ | $ | |||||||||||||||
We recognized a deferred tax benefit of $43 related to an intercompany transfer of assets during fiscal 2021.
77
On December 22, 2017, the U.S. government enacted comprehensive tax legislation commonly referred to as the Tax Cuts and Jobs Act (Tax Act). The Tax Act significantly revised the future, ongoing U.S. corporate income tax by, among other things, lowering U.S. corporate income tax rates and implementing a territorial tax system. For the year ended April 30, 2019, the reduction of the U.S. statutory federal rate from 35 % (the pre-Tax Act rate) to 21 % resulted in a tax benefit of $115 .
There were also certain transitional impacts of the Tax Act. As part of the transition to the new territorial tax system, the Tax Act imposed a one-time repatriation tax on deemed repatriation of historical earnings of foreign subsidiaries. In addition, we adjusted our U.S. deferred tax assets and liabilities to the lower federal base rate of 21 %. In the fiscal year ended April 30, 2019, we recorded a benefit of $4 as an adjustment to the provisional repatriation tax.
The changes included in the Tax Act are broad and complex. The U.S. Securities and Exchange Commission issued rules that allowed for a measurement period of up to one year after the enactment date of the Tax Act to finalize the recording of the related tax impacts. As of April 30, 2019, the amounts recorded for the Tax Act for the one-time repatriation tax and the adjustment to our U.S. deferred tax assets and liabilities were finalized and no longer deemed to be provisional.
The Tax Act also established new tax provisions that impact our financial statements beginning in fiscal 2019. These new provisions include (a) Global Intangible Low-Tax Income (GILTI), a new inclusion rule affecting non-routine income earned by foreign subsidiaries; (b) Base Erosion Anti-Abuse Tax (BEAT), a new minimum tax; (c) Foreign-Derived Intangible Income (FDII), a new preferential tax rate for domestic income earned from serving foreign markets; (d) repeal of the domestic production activity deduction; and (e) limitations on the deductibility of certain executive compensation. For the fiscal year ended April 30, 2020 and April 30, 2021, the net impact of these provisions was approximately $11 and $9 of additional tax, respectively.
As of April 30, 2021, we had approximately $1,542 of undistributed earnings from our foreign subsidiaries. Most of these earnings have been previously subject to tax, primarily as a result of the one-time repatriation tax on foreign earnings required by the Tax Act. We have not changed the indefinite reinvestment assertion on the undistributed earnings or other outside basis differences of any of our foreign subsidiaries, and no deferred taxes have been provided. A determination of the unrecognized deferred tax liabilities on the other outside basis differences and earnings reinvested indefinitely at April 30, 2021, is not practicable due to the complexities in the calculations. The other outside basis differences are primarily related to differences between U.S. GAAP and tax basis that arose through purchase accounting. These basis differences could reverse through sales of foreign subsidiaries or other transactions, none of which are considered probable as of April 30, 2021.
As of April 30, 2020, we had approximately $1,279 of undistributed earnings from our foreign subsidiaries. During fiscal 2020, we changed our indefinite reinvestment assertion with respect to current year earnings and prior year undistributed earnings for one of our foreign subsidiaries (but not for its other outside basis differences) and repatriated $15 of cash to the United States. No incremental taxes were due on this distribution of cash beyond the repatriation tax recorded in fiscal year 2018. However, we incurred withholding tax of $1 related to the distribution.
Our consolidated effective tax rate usually differs from current statutory rates due to the recognition of amounts for events or transactions with no tax consequences. The following table reconciles our effective tax rate to the federal statutory tax rate in the United States:
| Percent of Income Before Taxes | |||||||||||||||||
| 2019 | 2020 | 2021 | |||||||||||||||
| U.S. federal statutory rate | % | % | % | ||||||||||||||
| State taxes, net of U.S. federal tax benefit | % | % | % | ||||||||||||||
| Income taxed at other than U.S. federal statutory rate | ( | %) | % | % | |||||||||||||
| Tax benefit from foreign-derived sales | ( | %) | ( | %) | ( | %) | |||||||||||
| Adjustments related to prior years | ( | %) | ( | %) | ( | %) | |||||||||||
| Excess tax benefits from stock-based awards | ( | %) | ( | %) | ( | %) | |||||||||||
| Impact of Tax Act | ( | %) | % | % | |||||||||||||
| Intercompany transfer of assets | % | % | ( | %) | |||||||||||||
| Other, net | % | % | ( | %) | |||||||||||||
| Effective rate | % | % | % | ||||||||||||||
78
Deferred tax assets and liabilities as of the end of each of the last two years were as follows:
| April 30, | 2020 | 2021 | |||||||||
| Deferred tax assets: | |||||||||||
| Postretirement and other benefits | $ | $ | |||||||||
| Accrued liabilities and other | |||||||||||
| Inventories | |||||||||||
| Lease liabilities | |||||||||||
| Derivative instruments | |||||||||||
| Loss and credit carryforwards | |||||||||||
| Valuation allowance | ( | ( | |||||||||
| Total deferred tax assets, net | |||||||||||
| Deferred tax liabilities: | |||||||||||
| Intangible assets | ( | ( | |||||||||
| Property, plant, and equipment | ( | ( | |||||||||
| Right-of-use assets | ( | ( | |||||||||
| Derivative instruments | ( | ||||||||||
| Other | ( | ( | |||||||||
| Total deferred tax liabilities | ( | ( | |||||||||
| Net deferred tax liability | $ | ( | $ | ( | |||||||
Details of the loss and credit carryforwards and related valuation allowances as of the end of each of the last two years are as follows:
| April 30, 2020 | April 30, 2021 | |||||||||||||||||||||||||||||||||||||||||||
| Gross Amount | Deferred Tax Asset | Valuation Allowance | Gross Amount | Deferred Tax Asset | Valuation Allowance | Expiration (as of April 30, 2021) | ||||||||||||||||||||||||||||||||||||||
| Finland net operating losses | $ | $ | $ | $ | $ | $ | 2024-2030 | |||||||||||||||||||||||||||||||||||||
| Brazil net operating losses | ( | None | ||||||||||||||||||||||||||||||||||||||||||
| United Kingdom non-trading losses | ( | ( | None | |||||||||||||||||||||||||||||||||||||||||
| State net operating losses and credits | ( | Various1 | ||||||||||||||||||||||||||||||||||||||||||
| Other | ( | ( | Various2 | |||||||||||||||||||||||||||||||||||||||||
| $ | $ | $ | ( | $ | $ | $ | ( | |||||||||||||||||||||||||||||||||||||
1As of April 30, 2021, the net deferred tax asset amount includes credit carryforwards of $5 that do not expire and loss and credit carryforwards of $8 that expire in varying amounts from 2023 to 2041.
2As of April 30, 2021, the gross amount includes loss carryforwards of $29 that do not expire and $35 that expire in varying amounts over the next 18 years.
At April 30, 2021, we had $12 of gross unrecognized tax benefits, $9 of which would reduce our effective income tax rate if recognized. A reconciliation of the beginning and ending unrecognized tax benefits follows:
| 2019 | 2020 | 2021 | |||||||||||||||
| Unrecognized tax benefits at beginning of year | $ | $ | $ | ||||||||||||||
| Additions for tax positions provided in prior periods | |||||||||||||||||
| Additions for tax positions provided in current period | |||||||||||||||||
| Decreases for tax positions provided in prior years | ( | ( | |||||||||||||||
| Settlements of tax positions in the current period | ( | ( | |||||||||||||||
| Lapse of statutes of limitations | ( | ||||||||||||||||
| Unrecognized tax benefits at end of year | $ | $ | $ | ||||||||||||||
We file income tax returns in the United States, including several state and local jurisdictions, as well as in several other countries in which we conduct business. The major jurisdictions and their earliest fiscal years that are currently open for tax examinations are 2016 for one state in the United States; 2019 in the United Kingdom; 2017 in Australia; 2016 in Finland,
79
Germany, and Poland; 2015 in the Netherlands and Brazil; and 2013 in Mexico. We expect the audits of our fiscal 2018, fiscal 2019, and fiscal 2020 U.S. federal tax returns to be concluded in the first half of fiscal 2022. In addition, we are participating in the Internal Revenue Service's Compliance Assurance Program - Bridge Phase for our fiscal 2021 tax year.
We believe there will be no material change in our gross unrecognized tax benefits in the next 12 months.
Cash taxes for the year ended April 30, 2021 is $204 compared to $143 for the year ended April 30, 2020. The increase of $61 is primarily due to estimated taxes related to the gain on sale of the Early Times, Canadian Mist, and Collingwood brands and related assets, the absence of an overpayment of taxes for fiscal 2019 credited to fiscal 2020, additional transition tax payments made in fiscal 2021 and the deferral of U.S. tax payments from our fourth quarter of fiscal 2020 to our first quarter of fiscal 2021.
12. Acquisitions and Divestitures
Acquisitions. On July 3, 2019, we acquired 100 % of the voting interests in The 86 Company, which owns Fords Gin, for $22 in cash. The purchase price was allocated largely to the intangible assets that were acquired, including goodwill of $11 and other indefinite-lived intangibles of $12 , net of deferred tax liabilities of $1 . The goodwill is primarily attributable to the value of leveraging our distribution network and brand-building expertise to grow global sales of the Fords Gin brand and to the knowledge and expertise of the organized workforce employed by the acquired business. We do not expect the goodwill to be deductible for tax purposes.
On December 1, 2020, we acquired 100 % of the voting interests in Part Time Rangers Holdings Limited (Part Time Rangers) for $14 in cash (including repayment of debt). Part Time Rangers, which is based in New Zealand, produces spirits-based ready-to-drink products with all-natural fruit flavoring. The purchase price has been preliminarily allocated largely to the intangible assets of the acquired business, including goodwill of $8 and other intangible assets of $8 , net of deferred tax liabilities of $2 . The goodwill is primarily attributable to the value of leveraging our distribution network and brand-building expertise to grow sales of the Part Time Rangers brand. We do not expect the goodwill to be deductible for tax purposes.
The 86 Company and Part Time Rangers have been included in our consolidated financial statements since the respective acquisition dates. Actual and pro forma results are not presented due to immateriality.
Divestiture. On July 31, 2020, we sold the Early Times, Canadian Mist, and Collingwood brands for $177 in cash. The sale reflects the continued evolution of our portfolio strategy to focus on premium spirits brands. The total book value of the related business assets included in the sale was $50 , consisting largely of inventories, the Canadian Mist production assets, and intellectual property. As a result of the sale, we recognized a pre-tax gain of $127 during fiscal 2021.
13. Derivative Financial Instruments and Hedging Activities
We are subject to market risks, including the effect of fluctuations in foreign currency exchange rates, commodity prices, and interest rates. We use derivatives to help manage financial exposures that occur in the normal course of business. We formally document the purpose of each derivative contract, which includes linking the contract to the financial exposure it is designed to mitigate. We do not hold or issue derivatives for trading or speculative purposes.
We use currency derivative contracts to limit our exposure to the foreign currency exchange risk that we cannot mitigate internally by using netting strategies. We designate most of these contracts as cash flow hedges of forecasted transactions (expected to occur within three years). We record all changes in the fair value of cash flow hedges in accumulated other comprehensive income (AOCI) until the underlying hedged transaction occurs, at which time we reclassify that amount into earnings.
We do not designate some of our currency derivatives as hedges because we use them to partially offset the immediate earnings impact of changes in foreign currency exchange rates on existing assets or liabilities. We immediately recognize the change in fair value of these contracts in earnings.
We had outstanding currency derivatives, related primarily to our euro, British pound, and Australian dollar exposures, with notional amounts for all hedged currencies totaling $1,026 and $1,218 at April 30, 2020 and 2021, respectively. The maximum term of outstanding derivative contracts was approximately 36
We also use foreign currency-denominated debt to help manage our foreign currency exchange risk. The amount of foreign currency-denominated debt designated as net investment hedges was $613 and $680 as of April 30, 2020 and 2021, respectively. These net investment hedges are intended to mitigate foreign currency exchange exposure related to non-U.S. dollar net investments in certain foreign subsidiaries. Any change in value of the designated portion of the hedging instruments
80
is recorded in AOCI, offsetting the foreign currency translation adjustment of the related net investments that is also recorded in AOCI.
At inception, we expect each financial instrument designated as a hedge to be highly effective in offsetting the financial exposure it is designed to mitigate. We also assess the effectiveness on an ongoing basis. If determined to no longer be highly effective, designation and accounting for the instrument as a hedge would be discontinued.
We use forward purchase contracts with suppliers to protect against corn price volatility. We expect to take physical delivery of the corn underlying each contract and use it for production over a reasonable period of time. Accordingly, we account for these contracts as normal purchases rather than as derivative instruments.
| Classification in Statement of Operations | 2019 | 2020 | 2021 | ||||||||||||||||||||
| Currency derivatives designated as cash flow hedges: | |||||||||||||||||||||||
| Net gain (loss) recognized in AOCI | n/a | $ | $ | $ | ( | ||||||||||||||||||
| Net gain (loss) reclassified from AOCI into earnings | Sales | ||||||||||||||||||||||
| Currency derivatives not designated as hedging instruments: | |||||||||||||||||||||||
| Net gain (loss) recognized in earnings | Sales | ( | |||||||||||||||||||||
| Net gain (loss) recognized in earnings | Other income (expense), net | ( | |||||||||||||||||||||
Foreign currency-denominated debt designated as net investment hedge: | |||||||||||||||||||||||
| Net gain (loss) recognized in AOCI | n/a | ( | |||||||||||||||||||||
Total amounts presented in the accompanying consolidated statements of operations for line items affected by the net gains (losses) shown above: | |||||||||||||||||||||||
| Sales | |||||||||||||||||||||||
| Other income (expense), net | ( | ||||||||||||||||||||||
We expect to reclassify $12 of deferred net losses on cash flow hedges recorded in AOCI as of April 30, 2021, to earnings during fiscal 2022. This reclassification would offset the anticipated earnings impact of the underlying hedged exposures. The actual amounts that we ultimately reclassify to earnings will depend on the exchange rates in effect when the underlying hedged transactions occur.
81
The following table presents the fair values of our derivative instruments as of April 30, 2020 and 2021:
| Balance Sheet Classification | Derivative Assets | Derivative Liabilities | |||||||||||||||
| April 30, 2020 | |||||||||||||||||
| Designated as cash flow hedges: | |||||||||||||||||
| Currency derivatives | Other current assets | $ | $ | ( | |||||||||||||
| Currency derivatives | Other assets | ||||||||||||||||
| Currency derivatives | Accrued expenses | ||||||||||||||||
| Currency derivatives | Other liabilities | ||||||||||||||||
| Not designated as hedges: | |||||||||||||||||
| Currency derivatives | Accrued expenses | ( | |||||||||||||||
| April 30, 2021 | |||||||||||||||||
| Designated as cash flow hedges: | |||||||||||||||||
| Currency derivatives | Other current assets | ( | |||||||||||||||
| Currency derivatives | Other assets | ||||||||||||||||
| Currency derivatives | Accrued expenses | ( | |||||||||||||||
| Currency derivatives | Other liabilities | ( | |||||||||||||||
| Not designated as hedges: | |||||||||||||||||
| Currency derivatives | Other current assets | ||||||||||||||||
The fair values reflected in the above table are presented on a gross basis. However, as discussed further below, the fair values of those instruments subject to net settlement agreements are presented on a net basis in our balance sheets.
Credit risk. We are exposed to credit-related losses if the counterparties to our derivative contracts default. This credit risk is limited to the fair value of the contracts. To manage this risk, we contract only with major financial institutions that have earned investment-grade credit ratings and with whom we have standard International Swaps and Derivatives Association (ISDA) agreements that allow for net settlement of the derivative contracts. Also, we have established counterparty credit guidelines that we monitor regularly, and we monetize contracts when we believe it is warranted. Because of these safeguards, we believe we have no derivative positions that warrant credit valuation adjustments.
Some of our derivative instruments require us to maintain a specific level of creditworthiness, which we have maintained. If our creditworthiness were to fall below that level, then the counterparties to our derivative instruments could request immediate payment or collateralization for derivative instruments in net liability positions. The aggregate fair value of all derivatives with creditworthiness requirements that were in a net liability position was $2 and $30 at April 30, 2020 and 2021, respectively.
82
The following table summarizes the gross and net amounts of our derivative contracts:
Gross Amounts of Recognized Assets (Liabilities) | Gross Amounts Offset in Balance Sheet | Net Amounts Presented in Balance Sheet | Gross Amounts Not Offset in Balance Sheet | Net Amounts | |||||||||||||||||||||||||
| April 30, 2020 | |||||||||||||||||||||||||||||
| Derivative assets | $ | $ | ( | $ | $ | $ | |||||||||||||||||||||||
| Derivative liabilities | ( | ( | ( | ||||||||||||||||||||||||||
| April 30, 2021 | |||||||||||||||||||||||||||||
| Derivative assets | ( | ( | |||||||||||||||||||||||||||
| Derivative liabilities | ( | ( | ( | ||||||||||||||||||||||||||
No cash collateral was received or pledged related to our derivative contracts as of April 30, 2020 or 2021.
14. Fair Value Measurements
The following table summarizes the assets and liabilities measured or disclosed at fair value on a recurring basis:
| 2020 | 2021 | ||||||||||||||||||||||
| April 30, | Carrying Amount | Fair Value | Carrying Amount | Fair Value | |||||||||||||||||||
| Assets: | |||||||||||||||||||||||
| Cash and cash equivalents | $ | $ | $ | $ | |||||||||||||||||||
| Currency derivatives | |||||||||||||||||||||||
| Liabilities: | |||||||||||||||||||||||
| Currency derivatives | |||||||||||||||||||||||
| Short-term borrowings | |||||||||||||||||||||||
| Long-term debt | |||||||||||||||||||||||
Fair value is defined as the exchange price that would be received for an asset or paid to transfer a liability in the principal or most advantageous market for the asset or liability in an orderly transaction between market participants at the measurement date. We categorize the fair values of assets and liabilities into three levels based on the assumptions (inputs) used to determine those values. Level 1 provides the most reliable measure of fair value, while Level 3 generally requires significant management judgment. The three levels are:
•Level 1 – Quoted prices (unadjusted) in active markets for identical assets or liabilities.
•Level 2 – Observable inputs other than those included in Level 1, such as quoted prices for similar assets and liabilities in active markets, quoted prices for identical or similar assets and liabilities in inactive markets, or other inputs that are observable or can be derived from or corroborated by observable market data.
•Level 3 – Unobservable inputs supported by little or no market activity.
We determine the fair values of our currency derivatives (forward contracts) using standard valuation models. The significant inputs used in these models, which are readily available in public markets or can be derived from observable market transactions, include the applicable spot exchange rates, forward exchange rates, and interest rates. These fair value measurements are categorized as Level 2 within the valuation hierarchy.
We determine the fair value of long-term debt primarily based on the prices at which identical or similar debt has recently traded in the market and also considering the overall market conditions on the date of valuation. These fair value measurements are categorized as Level 2 within the valuation hierarchy.
The fair values of cash, cash equivalents, and short-term borrowings approximate the carrying amounts due to the short maturities of these instruments.
83
15. Leases
We enter into lease arrangements, which we use primarily for office space, vehicles, and land. Substantially all of our leases are operating leases. Our finance leases are not material.
Effective May 1, 2019, we updated our accounting policy for leases to reflect the adoption of Accounting Standards Codification Topic 842 (ASC 842). Under the updated policy, we record lease liabilities and right-of-use (ROU) assets on our balance sheet for leases with terms exceeding 12 months. We do not record lease liabilities or ROU assets for short-term leases.
The amounts recorded for lease liabilities and ROU assets are based on the estimated present value, as of the lease commencement date, of the future payments to be made over the lease term. We calculate the present value using our incremental borrowing rate that corresponds to the term of the lease. We include the effect of an option to renew or terminate a lease in the lease term when it is reasonably certain that we will exercise the option.
Some of our leases contain non-lease components (e.g., maintenance or other services) in addition to lease components. We have elected the practical expedient not to separate the non-lease components from the lease components.
The following table shows information about our leases as of the end of the last two years:
| Balance Sheet Classification | April 30, 2020 | April 30, 2021 | ||||||||||||
| Right-of-use assets | Other assets | $ | $ | |||||||||||
| Lease liabilities: | ||||||||||||||
| Current | Accounts payable and accrued expenses | $ | $ | |||||||||||
| Non-current | Other liabilities | |||||||||||||
| Total | $ | $ | ||||||||||||
| Weighted-average discount rate | ||||||||||||||
| Weighted-average remaining term | ||||||||||||||
The following table shows information about the effects of leases during 2020 and 2021:
| 2020 | 2021 | ||||||||||
Total lease cost1 | $ | $ | |||||||||
Cash paid for amounts included in the measurement of lease liabilities2 | |||||||||||
| Right-of-use assets obtained in exchange for new lease liabilities | |||||||||||
1Consists primarily of operating lease cost. Other components of lease cost were not material.
2Classified within operating activities in the accompanying consolidated statement of cash flows.
84
Rent expense for operating leases in 2019 (under the lease accounting guidance in effect before we adopted ASC 842) was $28 .
The following table includes a maturity analysis of future (undiscounted) operating lease payments and a reconciliation of those payments to the lease liabilities recorded on our balance sheet as of April 30, 2021:
| April 30, 2021 | |||||
| 2022 | $ | ||||
| 2023 | |||||
| 2024 | |||||
| 2025 | |||||
| 2026 | |||||
| Thereafter | |||||
| Total lease payments | |||||
| Less: Present value discount | ( | ||||
| Lease liabilities | $ | ||||
.
85
16. Other Comprehensive Income
The following table presents the components of net other comprehensive income (loss) during each of the last three years:
| Pre-Tax | Tax | Net | |||||||||||||||
Year Ended April 30, 2019 | |||||||||||||||||
| Currency translation adjustments: | |||||||||||||||||
| Net gain (loss) on currency translation | $ | ( | $ | ( | $ | ( | |||||||||||
| Reclassification to earnings | |||||||||||||||||
| Other comprehensive income (loss), net | ( | ( | ( | ||||||||||||||
| Cash flow hedge adjustments: | |||||||||||||||||
| Net gain (loss) on hedging instruments | ( | ||||||||||||||||
Reclassification to earnings1 | ( | ( | |||||||||||||||
| Other comprehensive income (loss), net | ( | ||||||||||||||||
| Postretirement benefits adjustments: | |||||||||||||||||
| Net actuarial gain (loss) and prior service cost | ( | ( | |||||||||||||||
Reclassification to earnings2 | ( | ||||||||||||||||
| Other comprehensive income (loss), net | ( | ( | |||||||||||||||
| Total other comprehensive income (loss), net | $ | $ | ( | $ | |||||||||||||
Year Ended April 30, 2020 | |||||||||||||||||
| Currency translation adjustments: | |||||||||||||||||
| Net gain (loss) on currency translation | $ | ( | $ | ( | $ | ( | |||||||||||
| Reclassification to earnings | |||||||||||||||||
| Other comprehensive income (loss), net | ( | ( | ( | ||||||||||||||
| Cash flow hedge adjustments: | |||||||||||||||||
| Net gain (loss) on hedging instruments | ( | ||||||||||||||||
Reclassification to earnings1 | ( | ( | |||||||||||||||
| Other comprehensive income (loss), net | ( | ||||||||||||||||
| Postretirement benefits adjustments: | |||||||||||||||||
| Net actuarial gain (loss) and prior service cost | ( | ( | |||||||||||||||
Reclassification to earnings2 | ( | ||||||||||||||||
| Other comprehensive income (loss), net | ( | ( | |||||||||||||||
| Total other comprehensive income (loss), net | $ | ( | $ | $ | ( | ||||||||||||
Year Ended April 30, 2021 | |||||||||||||||||
| Currency translation adjustments: | |||||||||||||||||
| Net gain (loss) on currency translation | $ | $ | $ | ||||||||||||||
| Reclassification to earnings | |||||||||||||||||
| Other comprehensive income (loss), net | |||||||||||||||||
| Cash flow hedge adjustments: | |||||||||||||||||
| Net gain (loss) on hedging instruments | ( | ( | |||||||||||||||
Reclassification to earnings1 | ( | ( | |||||||||||||||
| Other comprehensive income (loss), net | ( | ( | |||||||||||||||
| Postretirement benefits adjustments: | |||||||||||||||||
| Net actuarial gain (loss) and prior service cost | ( | ||||||||||||||||
Reclassification to earnings2 | ( | ||||||||||||||||
| Other comprehensive income (loss), net | ( | ||||||||||||||||
| Total other comprehensive income (loss), net | $ | $ | $ | ||||||||||||||
1Pre-tax amount is classified as sales in the accompanying consolidated statements of operations.
2For the year ended April 30, 2021, $4 of the pre-tax amount of $30 is classified in gain on sale of business in the accompanying consolidated statements of operations. Otherwise, the pre-tax amount for each year is classified as non-operating postretirement expense.
86
17. Supplemental Information
The following table presents net sales by geography:
| 2019 | 2020 | 2021 | |||||||||||||||
| Net sales: | |||||||||||||||||
| United States | $ | $ | $ | ||||||||||||||
| Australia | |||||||||||||||||
| Germany | |||||||||||||||||
| United Kingdom | |||||||||||||||||
| Mexico | |||||||||||||||||
| Other | |||||||||||||||||
| $ | $ | $ | |||||||||||||||
Net sales are attributed to countries based on where customers are located. See Note 8 for additional information about net sales, including net sales by product category.
Our two largest customers accounted for approximately 18 % and 13 % of consolidated net sales in 2020, and approximately 19 % and 13 % of consolidated net sales in 2021.
The net book value of property, plant, and equipment located outside the United States was $105 and $107 as of April 30, 2020 and 2021, respectively. Other long-lived assets located outside the United States are not significant.
We have concluded that our business constitutes a single operating segment.
87
Quarterly Financial Information (Unaudited)
(Expressed in millions, except per share amounts)
| Fiscal 2020 | Fiscal 2021 | |||||||||||||||||||||||||||||||||||||||||||||||||||||||||||||
| First Quarter | Second Quarter | Third Quarter | Fourth Quarter | Year | First Quarter | Second Quarter | Third Quarter | Fourth Quarter | Year | |||||||||||||||||||||||||||||||||||||||||||||||||||||
| Net sales | $ | 766 | $ | 989 | $ | 899 | $ | 709 | $ | 3,363 | $ | 753 | $ | 985 | $ | 911 | $ | 812 | $ | 3,461 | ||||||||||||||||||||||||||||||||||||||||||
| Gross profit | 498 | 619 | 557 | 453 | 2,127 | 465 | 581 | 550 | 498 | 2,094 | ||||||||||||||||||||||||||||||||||||||||||||||||||||
| Net income | 186 | 282 | 231 | 128 | 827 | 324 | 240 | 219 | 120 | 903 | ||||||||||||||||||||||||||||||||||||||||||||||||||||
| Basic EPS | 0.39 | 0.59 | 0.48 | 0.27 | 1.73 | 0.68 | 0.50 | 0.46 | 0.25 | 1.89 | ||||||||||||||||||||||||||||||||||||||||||||||||||||
| Diluted EPS | 0.39 | 0.59 | 0.48 | 0.27 | 1.72 | 0.67 | 0.50 | 0.45 | 0.25 | 1.88 | ||||||||||||||||||||||||||||||||||||||||||||||||||||
| Cash dividends per share: | ||||||||||||||||||||||||||||||||||||||||||||||||||||||||||||||
| Declared | 0.3320 | — | 0.3486 | — | 0.6806 | 0.3486 | — | 0.3590 | — | 0.7076 | ||||||||||||||||||||||||||||||||||||||||||||||||||||
| Paid | 0.1660 | 0.1660 | 0.1743 | 0.1743 | 0.6806 | 0.1743 | 0.1743 | 0.1795 | 0.1795 | 0.7076 | ||||||||||||||||||||||||||||||||||||||||||||||||||||
Note: Quarterly amounts may not add to amounts for the year due to rounding. Further, quarterly earnings per share (EPS) amounts may not add to amounts for the year because quarterly and annual EPS calculations are performed separately.
88
Item 9. Changes in and Disagreements with Accountants on Accounting and Financial Disclosure
None.
Item 9A. Controls and Procedures
Evaluation of Disclosure Controls and Procedures. Our management, with the participation of our Chief Executive Officer (CEO) and Chief Financial Officer (CFO) (our principal executive and principal financial officers), has evaluated the effectiveness of our disclosure controls and procedures (as defined in Rule 13a-15(e) under the Securities Exchange Act of 1934, as amended (the “Exchange Act”)) as of the end of fiscal 2021. Based on that evaluation, our CEO and CFO concluded that our disclosure controls and procedures: (a) are effective to ensure that information required to be disclosed by the Company in our reports filed or submitted under the Exchange Act is recorded, processed, summarized, and reported within the time periods specified in the SEC's rules and forms; and (b) include controls and procedures designed to ensure that information required to be disclosed by the Company in such reports is accumulated and communicated to the Company's management, including the CEO and the CFO, as appropriate, to allow timely decisions regarding required disclosure.
Changes in Internal Control over Financial Reporting. There has been no change in our internal control over financial reporting during the quarter ended April 30, 2021, that has materially affected, or is reasonably likely to materially affect, our internal control over financial reporting.
Management's Report on Internal Control over Financial Reporting and Report of Independent Registered Public Accounting Firm. Management's report on our internal control over financial reporting as of April 30, 2021, and our independent registered public accounting firm's report on our internal control over financial reporting are set forth in “Item 8. Financial Statements and Supplementary Data.”
Item 9B. Other Information
None.
Item 9C. Disclosure Regarding Foreign Jurisdictions that Prevent Inspections
Not applicable.
PART III
Item 10. Directors, Executive Officers, and Corporate Governance
Information on our Executive Officers is included under the caption “Employees and Executive Officers” in Part I of this report. For the other information required by this item, see the following sections of our definitive proxy statement for the Annual Meeting of Stockholders to be held July 22, 2021, which information is incorporated into this report by reference: (a) Election of Directors” (for biographical information on directors and family relationships); (b) “Code of Conduct and Code of Ethics for Senior Financial Officers” (for information on our code of ethics); (c) “Delinquent Section 16(a) Reports” (for information on compliance with Section 16 of the Exchange Act); (d) “Selection of Directors” (for information on the procedures by which security holders may recommend nominees to the Company's Board of Directors); and (e) “Corporate Governance” (for information on our Audit Committee).
Item 11. Executive Compensation
For the information required by this item, refer to the following sections of our definitive proxy statement for the Annual Meeting of Stockholders to be held July 22, 2021, which information is incorporated into this report by reference: (a) “Compensation Discussion and Analysis”; (b) “Compensation Tables”; (c) “Director Compensation”; (d) “Compensation Committee Interlocks and Insider Participation”; (e) “Compensation Committee Report”; and (f) “Pay Ratio Disclosure.”
Item 12. Security Ownership of Certain Beneficial Owners and Management and Related Stockholder Matters
The following table summarizes information as of April 30, 2021, about our equity compensation plans under which we have made grants of stock options, stock appreciation rights, restricted stock, market value units, performance units, or other equity awards.
89
| Plan Category | Number of Securities to Be Issued Upon Exercise of Outstanding Options, Warrants and Rights1 | Weighted-Average Exercise Price of Outstanding Options, Warrants and Rights2 | Number of Securities Remaining Available for Future Issuance Under Equity Compensation Plans | ||||||||||||||||||||
| Equity compensation plans approved by Class A common stockholders | 2,346,094 | $43.54 | 12,960,782 | ||||||||||||||||||||
1Includes 1,850,550 Class B common shares to be issued upon exercise of stock-settled stock appreciation rights (SSARs); 108,223 Class B performance-based restricted stock units (PBRSUs); 145,971 Class A PBRSUs; 179,246 Class A common deferred stock units (DSUs); and 62,104 Class B common DSUs issued under the Brown-Forman 2004 or 2013 Omnibus Compensation Plans. SSARs are exercisable for an amount of our common stock with a value equal to the increase in the fair market value of the common stock from the date the SSARs were granted. The fair market value of our common stock at fiscal year-end has been used for the purposes of reporting the number of shares to be issued upon exercise of the 4,311,179 SSARs outstanding at fiscal year-end.
2PBRSUs and DSUs have no exercise price because their value depends on continued employment or service over time, and are to be settled for shares of Class B common stock. Accordingly, these have been disregarded for purposes of computing the weighted-average exercise price.
For the other information required by this item, refer to the section entitled “Stock Ownership” of our definitive proxy statement for the Annual Meeting of Stockholders to be held July 22, 2021, which information is incorporated into this report by reference.
Item 13. Certain Relationships and Related Transactions, and Director Independence
For the information required by this item, refer to the following sections of our definitive proxy statement for the Annual Meeting of Stockholders to be held July 22, 2021, which information is incorporated into this report by reference: (a) “Certain Relationships and Related Transactions”; and (b) “Our Independent Directors.”
Item 14. Principal Accounting Fees and Services
For the information required by this item, refer to the following sections of our definitive proxy statement for the Annual Meeting of Stockholders to be held July 22, 2021, which information is incorporated into this report by reference: (a) “Fees Paid to Independent Registered Public Accounting Firm”; and (b) “Audit Committee Policy for Pre-approval of Independent Auditor Services.”
PART IV
Item 15. Exhibits and Financial Statement Schedules
| Page | ||||||||
| (a)(1) | Financial Statements | |||||||
| The following documents are included in Item 8 of this report: | ||||||||
Consolidated Statements of Stockholders’ Equity | ||||||||
| (a)(2) | Financial Statement Schedule: | |||||||
We have omitted all other schedules for which provision is made in the applicable accounting regulations of the Securities and Exchange Commission either because they are not required under the related instructions, because the information required is included in the consolidated financial statements and notes thereto, or because they do not apply.
90
(a)(3) Exhibits:
The following documents are filed with this report:
| Exhibit Index | |||||
| 21 | |||||
| 23.1 | |||||
| 23.2 | |||||
| 31.1 | |||||
| 31.2 | |||||
| 32 | |||||
| 101 | The following materials from Brown-Forman Corporation's Annual Report on Form 10-K for the fiscal year ended April 30, 2021, in Inline XBRL (eXtensible Business Reporting Language) format: (a) Consolidated Statements of Operations, (b) Consolidated Statements of Comprehensive Income, (c) Consolidated Balance Sheets, (d) Consolidated Statements of Cash Flows, (e) Consolidated Statements of Stockholders’ Equity, and (f) Notes to Consolidated Financial Statements. | ||||
| 104 | Cover Page Interactive Data File in Inline XBRL format (included in Exhibit 101). | ||||
The following documents have been previously filed:
| Exhibit Index | |||||
| 3.1 | |||||
| 3.2 | |||||
| 3.3 | |||||
| 4.1 | |||||
| 4.2 | |||||
| 4.3 | |||||
| 4.4 | |||||
| 4.5 | |||||
| 4.6 | |||||
| 4.7 | |||||
| 4.8 | |||||
| 4.9 | |||||
| 4.10 | |||||
| 4.11 | |||||
| 4.12 | |||||
| 4.13 | |||||
91
| Exhibit Index | |||||
| 4.14 | |||||
| 4.15 | |||||
| 4.16 | |||||
| 4.17 | |||||
| 10.1 | |||||
| 10.2 | |||||
| 10.3 | |||||
| 10.4 | |||||
| 10.5 | |||||
| 10.6 | |||||
| 10.7 | |||||
| 10.8 | |||||
| 10.9 | |||||
| 10.10 | |||||
| 10.11 | |||||
| 10.12 | |||||
| 10.13 | |||||
| 10.14 | |||||
| 10.15 | |||||
92
| Exhibit Index | |||||
| 10.16 | |||||
| 10.17 | |||||
| 10.18 | |||||
| 10.19 | |||||
| 10.20 | |||||
| 10.21 | |||||
| 16.1 | |||||
| 16.2 | |||||
| * | Indicates management contract, compensatory plan, or arrangement. | ||||
Item 16. Form 10-K Summary
None.
93
SIGNATURES
Pursuant to the requirements of Section 13 or 15(d) of the Securities Exchange Act of 1934, the registrant has duly caused this report to be signed on its behalf by the undersigned, thereunto duly authorized.
BROWN-FORMAN CORPORATION (Registrant) | ||||||||
| /s/ Lawson E. Whiting | ||||||||
| By: | Lawson E. Whiting | |||||||
| President and Chief Executive Officer | ||||||||
Date: June 21, 2021
| /s/ George Garvin Brown IV | ||||||||
| By: | George Garvin Brown IV | |||||||
| Director, Chair of the Board | ||||||||
| /s/ Lawson E. Whiting | ||||||||
| By: | Lawson E. Whiting | |||||||
| Director, President and Chief Executive Officer of the Company (Principal Executive Officer) | ||||||||
| /s/ Patrick Bousquet-Chavanne | ||||||||
| By: | Patrick Bousquet-Chavanne | |||||||
| Director | ||||||||
| /s/ Campbell P. Brown | ||||||||
| By: | Campbell P. Brown | |||||||
| Director | ||||||||
94
| /s/ Stuart R. Brown | ||||||||
| By: | Stuart R. Brown | |||||||
| Director | ||||||||
| /s/ John D. Cook | ||||||||
| By: | John D. Cook | |||||||
| Director | ||||||||
| /s/ Marshall B. Farrer | ||||||||
| By: | Marshall B. Farrer | |||||||
| Director | ||||||||
| /s/ Laura L. Frazier | ||||||||
| By: | Laura L. Frazier | |||||||
| Director | ||||||||
| /s/ Kathleen M. Gutmann | ||||||||
| By: | Kathleen M. Gutmann | |||||||
| Director | ||||||||
| /s/ Augusta Brown Holland | ||||||||
| By: | Augusta Brown Holland | |||||||
| Director | ||||||||
| /s/ Michael J. Roney | ||||||||
| By: | Michael J. Roney | |||||||
| Director | ||||||||
| /s/ Tracy L. Skeans | ||||||||
| By: | Tracy L. Skeans | |||||||
| Director | ||||||||
95
| /s/ Michael A. Todman | ||||||||
| By: | Michael A. Todman | |||||||
| Director | ||||||||
| /s/ Jane C. Morreau | ||||||||
| By: | Jane C. Morreau | |||||||
| Executive Vice President and Chief Financial Officer (Principal Financial Officer) | ||||||||
| /s/ Kelli N. Brown | ||||||||
| By: | Kelli N. Brown | |||||||
| Senior Vice President and Chief Accounting Officer (Principal Accounting Officer) | ||||||||
96
Brown-Forman Corporation and Subsidiaries
Schedule II – Valuation and Qualifying Accounts
For the Years Ended April 30, 2019, 2020, and 2021
(Expressed in millions)
| Col. A | Col. B | Col. C(1) | Col. C(2) | Col. D | Col. E | ||||||||||||||||||||||||
| Description | Balance at Beginning of Period | Additions Charged to Costs and Expenses | Additions Charged to Other Accounts | Deductions | Balance at End of Period | ||||||||||||||||||||||||
| 2019 | |||||||||||||||||||||||||||||
| Allowance for doubtful accounts | $ | $ | $ | $ | (1) | $ | |||||||||||||||||||||||
| Deferred tax valuation allowance | $ | $ | $ | $ | $ | ||||||||||||||||||||||||
| 2020 | |||||||||||||||||||||||||||||
| Allowance for doubtful accounts | $ | $ | $ | $ | $ | ||||||||||||||||||||||||
| Deferred tax valuation allowance | $ | $ | $ | $ | $ | ||||||||||||||||||||||||
| 2021 | |||||||||||||||||||||||||||||
| Allowance for doubtful accounts | $ | $ | $ | $ | (1) | $ | |||||||||||||||||||||||
| Deferred tax valuation allowance | $ | $ | $ | $ | $ | ||||||||||||||||||||||||
(1)Doubtful accounts written off, net of recoveries.
97
Serious News for Serious Traders! Try StreetInsider.com Premium Free!
You May Also Be Interested In
- Mortgage Rates Continue to Increase
- La Roche-Posay Unveils Breakthrough Dark Spot Innovation: MelaB3 Serum & UV with Multi-Patented Ingredient Melasyl™ Born from 18 Years of Research
- Minutes of IMPLANET’s Ordinary General Meeting held on April 25, 2024
Create E-mail Alert Related Categories
SEC FilingsSign up for StreetInsider Free!
Receive full access to all new and archived articles, unlimited portfolio tracking, e-mail alerts, custom newswires and RSS feeds - and more!
